UNITED STATES
SECURITIES AND EXCHANGE COMMISSION
Washington, D.C. 20549
FORM N-CSR
CERTIFIED SHAREHOLDER REPORT OF REGISTERED MANAGEMENT INVESTMENT COMPANIES
| | |
| Investment Company Act file number: | | 811-07343 |
| |
| Exact name of registrant as specified in charter: | | The Prudential Investment Portfolios, Inc. |
| |
| Address of principal executive offices: | | 655 Broad Street, 17th Floor |
| | Newark, New Jersey 07102 |
| |
| Name and address of agent for service: | | Andrew R. French |
| | 655 Broad Street, 17th Floor |
| | Newark, New Jersey 07102 |
| |
| Registrant’s telephone number, including area code: | | 800-225-1852 |
| |
| Date of fiscal year end: | | 9/30/2019 |
| |
| Date of reporting period: | | 3/31/2019 |
| Item 1 – | Reports to Stockholders |

PGIM BALANCED FUND
(Formerly known as Prudential Balanced Fund)
SEMIANNUAL REPORT
MARCH 31, 2019
COMING SOON: PAPERLESS SHAREHOLDER REPORTS
Beginning on January 1, 2021, as permitted by regulations adopted by the Securities and Exchange Commission, paper copies of the Fund’s annual and semiannual shareholder reports will no longer be sent by mail, unless you specifically request paper copies of the reports. Instead, the reports will be made available on the Fund’s website (pgiminvestments.com), and you will be notified by mail each time a report is posted and provided with a website link to access the report.
If you already elected to receive shareholder reports electronically, you will not be affected by this change and you need not take any action. You may elect to receive shareholder reports and other communications from the Fund electronically anytime by contacting your financial intermediary (such as a broker-dealer or bank) or, if you are a direct investor, by calling 1-800-225-1852 or by sending an email request to PGIM Investments at shareholderreports@pgim.com.
You may elect to receive all future reports in paper free of charge. If you invest through a financial intermediary, you can contact your financial intermediary or follow instructions included with this notice to elect to continue to receive paper copies of your shareholder reports. If you invest directly with the Fund, you can call 1-800-225-1852 or send an email request to shareholderreports@pgim.com to let the Fund know you wish to continue receiving paper copies of your shareholder reports. Your election to receive reports in paper will apply to all funds held in your account if you invest through your financial intermediary or all funds held with the fund complex if you invest directly with the Fund.

To enroll in e-delivery, go to pgiminvestments.com/edelivery
|
| Objective:Income and long-term growth of capital |
This report is not authorized for distribution to prospective investors unless preceded or accompanied by a current prospectus.
The information about the Fund’s portfolio holdings is for the period covered by this report and is subject to change thereafter.
The accompanying financial statements as of March 31, 2019 were not audited and, accordingly, no auditor’s opinion is expressed on them.
Mutual funds are distributed by Prudential Investment Management Services LLC, a Prudential Financial company and member SIPC. PGIM Fixed Income is a unit of PGIM, Inc. (PGIM), a registered investment adviser and Prudential Financial company. QMA is the primary business name of QMA LLC, a wholly owned subsidiary of PGIM.© 2019 Prudential Financial, Inc. and its related entities. PGIM and the PGIM logo are service marks of Prudential Financial, Inc. and its related entities, registered in many jurisdictions worldwide.
| | |
| 2 | | Visit our website at pgiminvestments.com |
Table of Contents
This Page Intentionally Left Blank
Letter from the President

Dear Shareholder:
We hope you find the semiannual report for PGIM Balanced Fund informative and useful. The report covers performance for the six-month period ended March 31, 2019.
We have important information to share with you. Effective June 11, 2018, Prudential Mutual Funds were renamed PGIM Funds. This renaming is part of our ongoing effort to further build our reputation and establish our global brand, which began when our firm adopted PGIM Investments as its name in April 2017. Please note that only the Fund’s name has changed. Your Fund’s management and operation, along with its symbols, remained the same.*
Regarding your investments with PGIM, we believe it is important to maintain a diversified portfolio of funds consistent with your tolerance for risk, time horizon, and financial goals.
Your financial advisor can help you create a diversified investment plan that may include funds covering all the basic asset classes and that reflects your personal investor profile and risk tolerance. However, diversification and asset allocation strategies do not assure a profit or protect against loss in declining markets.
At PGIM Investments, we consider it a great privilege and responsibility to help investors participate in opportunities across global markets while meeting their toughest investment challenges. PGIM is a top-10 global investment manager with more than $1 trillion in assets under management. This investment expertise allows us to deliver actively managed funds and strategies to meet the needs of investors around the globe.
Thank you for choosing our family of funds.
Sincerely,

Stuart S. Parker, President
PGIM Balanced Fund
May 15, 2019
*The Prudential Day One Funds did not change their names.
Your Fund’s Performance(unaudited)
Performance data quoted represent past performance. Past performance does not guarantee future results. The investment return and principal value of an investment will fluctuate, so that an investor’s shares, when redeemed, may be worth more or less than their original cost. Current performance may be lower or higher than the past performance data quoted. An investor may obtain performance data as of the most recent month-end by visiting our website atpgiminvestments.com or by calling (800) 225-1852.
| | | | | | | | | | |
| | |
| | | Total Returns as of 3/31/19
(without sales charges) | | Average Annual Total Returns as of 3/31/19 (with sales charges) |
| | | Six Months* (%) | | One Year (%) | | Five Years (%) | | Ten Years (%) | | Since Inception (%) |
| Class A | | –1.54 | | –1.55 | | 5.20 | | 10.06 | | — |
| Class B | | –2.02 | | –1.75 | | 5.41 | | 9.88 | | — |
| Class C | | –1.84 | | 2.44 | | 5.65 | | 9.91 | | — |
| Class R | | –1.80 | | 3.58 | | 6.08 | | 10.38 | | — |
| Class Z | | –1.34 | | 4.43 | | 6.71 | | 11.02 | | — |
| Class R6** | | –1.36 | | 4.51 | | N/A | | N/A | | 3.45 (11/28/17) |
| Customized Blend Index |
| | 0.60 | | 6.77 | | 7.16 | | 10.81 | | — |
| Bloomberg Barclays US Aggregate Bond Index |
| | 4.63 | | 4.48 | | 2.74 | | 3.77 | | — |
| S&P 500 Index |
| | –1.72 | | 9.49 | | 10.90 | | 15.91 | | — |
| Lipper Mixed-Asset Target Allocation Growth Funds Average |
| | | –1.17 | | 3.25 | | 5.56 | | 10.54 | | — |
Source: PGIM Investments LLC and Lipper Inc.
*Not annualized
**Formerly known as Class Q shares.
Since Inception returns are provided for any share class with less than 10 fiscal years of returns. Since Inception returns for the Indexes and the Lipper Average are measured from the closest month-end to the class’ inception date.
| | |
| 6 | | Visit our website at pgiminvestments.com |
The returns in the tables do not reflect the deduction of taxes that a shareholder would pay on Fund distributions or following the redemption of Fund shares. The average annual total returns take into account applicable sales charges, which are described for each share class in the table below.
| | | | | | | | | | | | |
| | | | | | | |
| | | Class A | | Class B* | | Class C | | Class R | | Class Z | | Class R6** |
| Maximum initial sales charge | | 5.50% of the public offering price | | None | | None | | None | | None | | None |
Contingent deferred sales charge (CDSC) (as a percentage of the lower of original purchase price or net asset value at redemption) | | 1.00% on sales of $1 million or more made within 12 months of purchase | | 5.00% (Yr. 1) 4.00% (Yr. 2) 3.00% (Yr. 3) 2.00% (Yr. 4) 1.00% (Yr. 5) 1.00% (Yr. 6) 0.00% (Yr. 7) | | 1.00% on sales made within 12 months of purchase | | None | | None | | None |
| Annual distribution and service (12b-1) fees (shown as a percentage of average daily net assets) | | 0.30% | | 1.00% | | 1.00% | | 0.75% (0.50% currently) | | None | | None |
*Class B shares are closed to all purchase activity and no additional Class B shares may be purchased or acquired except by exchange from Class B shares of another Fund or through dividend or capital gains reinvestment.
**Formerly known as Class Q shares.
Benchmark Definitions
Customized Blend Index—The Customized Blend Index is made up of the S&P 500 Index (50%), the Bloomberg Barclays US Aggregate Bond Index (40%), the Russell 2000 Index (5%), and the Morgan Stanley Capital International Europe, Australasia, and Far East Net Dividend (MSCI EAFE ND) Index (5%). The Net Dividend (ND) version of the MSCI EAFE Index reflects the impact of the maximum withholding taxes on reinvested dividends. Each component of the Customized Blend Index is an unmanaged index generally considered to represent the performance of its asset class. The Customized Blend Index is intended to provide a theoretical comparison to the Fund’s performance based on the amounts allocated to each class under the Fund’s investment strategies. The average annual total return for the Index measured from the month-end closest to the inception date of the Fund’s Class R6 shares is 4.89%.
Bloomberg Barclays US Aggregate Bond Index—The Bloomberg Barclays US Aggregate Bond Index is an unmanaged index of investment-grade securities issued by the US government and its agencies and by corporations with between one and 10 years remaining to maturity on the securities. It gives a broad look at how US investment-grade bonds have performed. The average annual total return for the Index measured from the month-end closest to the inception date of the Fund’s Class R6 shares is 2.56%.
Your Fund’s Performance(continued)
S&P 500 Index—The S&P 500 Index is an unmanaged index of over 500 stocks of large US public companies. It gives a broad look at how stock prices in the United States have performed. The average annual total return for the Index measured from the month-end closest to the inception date of the Fund’s Class R6 shares is 7.31%.
Lipper Mixed-Asset Target Allocation Growth Funds Average—The Lipper Mixed-Asset Target Allocation Growth Funds Average (Lipper Average) is based on the average return of all funds in the Lipper Mixed-Asset Target Allocation Growth Funds universe for the periods noted. Funds in the Lipper Average are funds whose primary objective is to conserve principal by maintaining at all times a balanced portfolio of both stocks and bonds. Typically, the stock:bond ratio ranges around 60%:40%. The average annual total return for the Lipper Average measured from the month-end closest to the inception date of the Fund’s Class R6 shares is 2.53%.
Investors cannot invest directly in an index or average. The returns for the Indexes would be lower if they included the effects of sales charges, operating expenses of a mutual fund, or taxes. Returns for the Lipper Average reflect the deduction of operating expenses, but not sales charges or taxes.
Presentation of Fund Holdings
| | | | |
|
Five Largest Equity Holdings expressed as a
percentage of net assets as of 3/31/19 (%) | |
| Microsoft Corp.,Software | | | 2.1 | |
| Apple, Inc.,Technology Hardware, Storage, & Peripherals | | | 1.4 | |
| Facebook, Inc. (Class A Stock),Interactive Media & Services | | | 1.1 | |
| Alphabet, Inc. (Class C Stock),Interactive Media & Services | | | 1.1 | |
| Amazon.com, Inc.,Internet & Direct Marketing Retail | | | 1.0 | |
Holdings reflect only long-term equity investments and are subject to change.
| | | | |
|
Five Largest Equity Industries expressed as a
percentage of net assets as of 3/31/19 (%) | |
| Software | | | 4.0 | |
| Banks | | | 3.8 | |
| Oil, Gas, & Consumable Fuels | | | 3.2 | |
| Interactive Media & Services | | | 2.9 | |
| Pharmaceuticals | | | 2.5 | |
Industry weightings reflect only long-term equity
investments and are subject to change.
| | |
| 8 | | Visit our website at pgiminvestments.com |
Fees and Expenses(unaudited)
As a shareholder of the Fund, you incur two types of costs: (1) transaction costs, including sales charges (loads) on purchase payments and redemptions, as applicable, and (2) ongoing costs, including management fees, distribution and/or service (12b-1) fees, and other Fund expenses, as applicable. This example is intended to help you understand your ongoing costs (in dollars) of investing in the Fund and to compare these costs with the ongoing costs of investing in other mutual funds.
The example is based on an investment of $1,000 held through the six-month period ended March 31, 2019. The example is for illustrative purposes only; you should consult the Prospectus for information on initial and subsequent minimum investment requirements.
Actual Expenses
The first line for each share class in the table on the following page provides information about actual account values and actual expenses. You may use the information on this line, together with the amount you invested, to estimate the expenses that you paid over the period. Simply divide your account value by $1,000 (for example, an $8,600 account value ÷ $1,000 = 8.6), then multiply the result by the number on the first line under the heading “Expenses Paid During the Six-Month Period” to estimate the expenses you paid on your account during this period.
Hypothetical Example for Comparison Purposes
The second line for each share class in the table on the following page provides information about hypothetical account values and hypothetical expenses based on the Fund’s actual expense ratio and an assumed rate of return of 5% per year before expenses, which is not the Fund’s actual return. The hypothetical account values and expenses may not be used to estimate the actual ending account balance or expenses you paid for the period. You may use this information to compare the ongoing costs of investing in the Fund and other funds. To do so, compare this 5% hypothetical example with the 5% hypothetical examples that appear in the shareholder reports of the other funds.
The Fund’s transfer agent may charge additional fees to holders of certain accounts that are not included in the expenses shown in the table on the following page. These fees apply to individual retirement accounts (IRAs) and Section 403(b) accounts. As of the close of the six-month period covered by the table, IRA fees included an annual maintenance fee of $15 per account (subject to a maximum annual maintenance fee of $25 for all accounts held by the same shareholder). Section 403(b) accounts are charged an annual $25 fiduciary maintenance fee. Some of the fees may vary in amount, or may be waived, based on your total account balance or the number of PGIM funds, including the Fund, that you own. You should consider the additional fees that were charged to your Fund account over the six-month period when you estimate the total ongoing expenses paid over the period
Fees and Expenses(continued)
and the impact of these fees on your ending account value, as these additional expenses are not reflected in the information provided in the expense table. Additional fees have the effect of reducing investment returns.
Please note that the expenses shown in the table are meant to highlight your ongoing costs only and do not reflect any transactional costs such as sales charges (loads). Therefore, the second line for each share class in the table is useful in comparing ongoing costs only and will not help you determine the relative total costs of owning different funds. In addition, if these transactional costs were included, your costs would have been higher.
| | | | | | | | | | | | | | | | | | |
| | | | |
PGIM
Balanced Fund | | Beginning Account
Value
October 1, 2018 | | | Ending Account
Value
March 31, 2019 | | | Annualized
Expense Ratio
Based on the
Six-Month Period | | | Expenses Paid
During the
Six-Month Period* | |
| Class A | | Actual | | $ | 1,000.00 | | | $ | 984.60 | | | | 1.00 | % | | $ | 4.95 | |
| | Hypothetical | | $ | 1,000.00 | | | $ | 1,019.95 | | | | 1.00 | % | | $ | 5.04 | |
| Class B | | Actual | | $ | 1,000.00 | | | $ | 979.80 | | | | 2.10 | % | | $ | 10.37 | |
| | Hypothetical | | $ | 1,000.00 | | | $ | 1,014.46 | | | | 2.10 | % | | $ | 10.55 | |
| Class C | | Actual | | $ | 1,000.00 | | | $ | 981.60 | | | | 1.75 | % | | $ | 8.65 | |
| | Hypothetical | | $ | 1,000.00 | | | $ | 1,016.21 | | | | 1.75 | % | | $ | 8.80 | |
| Class R | | Actual | | $ | 1,000.00 | | | $ | 982.00 | | | | 1.63 | % | | $ | 8.05 | |
| | Hypothetical | | $ | 1,000.00 | | | $ | 1,016.80 | | | | 1.63 | % | | $ | 8.20 | |
| Class Z | | Actual | | $ | 1,000.00 | | | $ | 986.60 | | | | 0.77 | % | | $ | 3.81 | |
| | Hypothetical | | $ | 1,000.00 | | | $ | 1,021.09 | | | | 0.77 | % | | $ | 3.88 | |
| Class R6** | | Actual | | $ | 1,000.00 | | | $ | 986.40 | | | | 0.65 | % | | $ | 3.22 | |
| | | Hypothetical | | $ | 1,000.00 | | | $ | 1,021.69 | | | | 0.65 | % | | $ | 3.28 | |
*Fund expenses (net of fee waivers or subsidies, if any) for each share class are equal to the annualized expense ratio for each share class (provided in the table), multiplied by the average account value over the period, multiplied by the 182 days in the six-month period ended March 31, 2019, and divided by the 365 days in the Fund’s fiscal year ending September 30, 2019 (to reflect the six-month period). Expenses presented in the table include the expenses of any underlying portfolios in which the Fund may invest.
**Formerly known as Class Q shares.
| | |
| 10 | | Visit our website at pgiminvestments.com |
Schedule of Investments(unaudited)
as of March 31, 2019
| | | | | | | | |
| Description | | Shares | | | Value | |
LONG-TERM INVESTMENTS 96.9% | | | | | | | | |
| | |
COMMON STOCKS 60.5% | | | | | | | | |
| | |
Aerospace & Defense 1.5% | | | | | | | | |
AAR Corp. | | | 5,100 | | | $ | 165,801 | |
Airbus SE (France) | | | 1,285 | | | | 170,464 | |
Arconic, Inc. | | | 39,200 | | | | 749,112 | |
BAE Systems PLC (United Kingdom) | | | 7,092 | | | | 44,630 | |
Dassault Aviation SA (France) | | | 6 | | | | 8,873 | |
Elbit Systems Ltd. (Israel) | | | 61 | | | | 7,871 | |
General Dynamics Corp. | | | 7,100 | | | | 1,201,888 | |
Leonardo SpA (Italy) | | | 960 | | | | 11,191 | |
Lockheed Martin Corp. | | | 6,500 | | | | 1,951,040 | |
Meggitt PLC (United Kingdom) | | | 1,812 | | | | 11,891 | |
Moog, Inc. (Class A Stock) | | | 1,400 | | | | 121,730 | |
MTU Aero Engines AG (Germany) | | | 121 | | | | 27,459 | |
Raytheon Co. | | | 5,500 | | | | 1,001,440 | |
Rolls-Royce Holdings PLC (United Kingdom)* | | | 3,746 | | | | 44,126 | |
Safran SA (France) | | | 736 | | | | 101,105 | |
Singapore Technologies Engineering Ltd. (Singapore) | | | 3,100 | | | | 8,563 | |
Spirit AeroSystems Holdings, Inc. (Class A Stock) | | | 16,700 | | | | 1,528,551 | |
Thales SA (France) | | | 231 | | | | 27,711 | |
United Technologies Corp. | | | 16,700 | | | | 2,152,463 | |
Vectrus, Inc.* | | | 5,400 | | | | 143,586 | |
Wesco Aircraft Holdings, Inc.* | | | 4,000 | | | | 35,160 | |
| | | | | | | | |
| | | | | | | 9,514,655 | |
| | |
Air Freight & Logistics 0.1% | | | | | | | | |
Bollore SA (France) | | | 1,864 | | | | 8,429 | |
Deutsche Post AG (Germany) | | | 2,184 | | | | 71,128 | |
Hub Group, Inc. (Class A Stock)* | | | 3,300 | | | | 134,805 | |
Radiant Logistics, Inc.* | | | 16,100 | | | | 101,430 | |
Royal Mail PLC (United Kingdom) | | | 1,955 | | | | 6,071 | |
SG Holdings Co. Ltd. (Japan) | | | 200 | | | | 5,825 | |
United Parcel Service, Inc. (Class B Stock) | | | 5,100 | | | | 569,874 | |
Yamato Holdings Co. Ltd. (Japan) | | | 700 | | | | 18,100 | |
| | | | | | | | |
| | | | | | | 915,662 | |
| | |
Airlines 0.3% | | | | | | | | |
ANA Holdings, Inc. (Japan) | | | 230 | | | | 8,434 | |
Deutsche Lufthansa AG (Germany) | | | 502 | | | | 11,047 | |
easyJet PLC (United Kingdom) | | | 338 | | | | 4,926 | |
Japan Airlines Co. Ltd. (Japan) | | | 300 | | | | 10,564 | |
See Notes to Financial Statements.
Schedule of Investments(unaudited) (continued)
as of March 31, 2019
| | | | | | | | |
| Description | | Shares | | | Value | |
COMMON STOCKS (Continued) | | | | | | | | |
| | |
Airlines (cont’d.) | | | | | | | | |
Singapore Airlines Ltd. (Singapore) | | | 1,200 | | | $ | 8,569 | |
Southwest Airlines Co. | | | 36,800 | | | | 1,910,288 | |
| | | | | | | | |
| | | | | | | 1,953,828 | |
| | |
Auto Components 0.1% | | | | | | | | |
Aisin Seiki Co. Ltd. (Japan) | | | 350 | | | | 12,497 | |
American Axle & Manufacturing Holdings, Inc.* | | | 10,700 | | | | 153,117 | |
Bridgestone Corp. (Japan) | | | 1,360 | | | | 52,434 | |
Cie Generale des Etablissements Michelin SCA (France) | | | 377 | | | | 44,659 | |
Continental AG (Germany) | | | 243 | | | | 36,592 | |
Dana, Inc. | | | 10,600 | | | | 188,044 | |
Denso Corp. (Japan) | | | 950 | | | | 37,040 | |
Faurecia SA (France) | | | 189 | | | | 7,967 | |
Koito Manufacturing Co. Ltd. (Japan) | | | 200 | | | | 11,338 | |
Minth Group Ltd. (China) | | | 2,000 | | | | 6,330 | |
NGK Spark Plug Co. Ltd. (Japan) | | | 400 | | | | 7,425 | |
Nokian Renkaat OYJ (Finland) | | | 253 | | | | 8,478 | |
Pirelli & C SpA (Italy), 144A* | | | 811 | | | | 5,228 | |
Stanley Electric Co. Ltd. (Japan) | | | 300 | | | | 8,071 | |
Sumitomo Electric Industries Ltd. (Japan) | | | 1,700 | | | | 22,555 | |
Sumitomo Rubber Industries Ltd. (Japan) | | | 400 | | | | 4,792 | |
Superior Industries International, Inc. | | | 1,800 | | | | 8,568 | |
Tenneco, Inc. (Class A Stock) | | | 5,200 | | | | 115,232 | |
Tower International, Inc. | | | 300 | | | | 6,309 | |
Toyoda Gosei Co. Ltd. (Japan) | | | 150 | | | | 3,179 | |
Toyota Industries Corp. (Japan) | | | 350 | | | | 17,561 | |
Valeo SA (France) | | | 510 | | | | 14,825 | |
Yokohama Rubber Co. Ltd. (The) (Japan) | | | 300 | | | | 5,570 | |
| | | | | | | | |
| | | | | | | 777,811 | |
| | |
Automobiles 0.5% | | | | | | | | |
Bayerische Motoren Werke AG (Germany) | | | 735 | | | | 56,759 | |
Daimler AG (Germany) | | | 2,007 | | | | 117,879 | |
Ferrari NV (Italy) | | | 271 | | | | 36,445 | |
Fiat Chrysler Automobiles NV (United Kingdom)* | | | 2,396 | | | | 35,742 | |
General Motors Co. | | | 60,500 | | | | 2,244,550 | |
Honda Motor Co. Ltd. (Japan) | | | 3,600 | | | | 97,403 | |
Isuzu Motors Ltd. (Japan) | | | 1,250 | | | | 16,446 | |
Mazda Motor Corp. (Japan) | | | 1,360 | | | | 15,208 | |
Mitsubishi Motors Corp. (Japan) | | | 1,470 | | | | 7,817 | |
Nissan Motor Co. Ltd. (Japan) | | | 5,100 | | | | 41,823 | |
Peugeot SA (France) | | | 1,279 | | | | 31,278 | |
Renault SA (France) | | | 440 | | | | 29,170 | |
See Notes to Financial Statements.
| | | | | | | | |
| Description | | Shares | | | Value | |
COMMON STOCKS (Continued) | | | | | | | | |
| | |
Automobiles (cont’d.) | | | | | | | | |
Subaru Corp. (Japan) | | | 1,400 | | | $ | 31,902 | |
Suzuki Motor Corp. (Japan) | | | 800 | | | | 35,359 | |
Toyota Motor Corp. (Japan) | | | 5,054 | | | | 296,283 | |
Volkswagen AG (Germany) | | | 72 | | | | 11,736 | |
Yamaha Motor Co. Ltd. (Japan) | | | 600 | | | | 11,770 | |
| | | | | | | | |
| | | | | | | 3,117,570 | |
| | |
Banks 3.8% | | | | | | | | |
ABN AMRO Group NV (Netherlands), CVA, 144A | | | 901 | | | | 20,341 | |
AIB Group PLC (Ireland) | | | 1,970 | | | | 8,853 | |
Aozora Bank Ltd. (Japan) | | | 260 | | | | 6,414 | |
Australia & New Zealand Banking Group Ltd. (Australia) | | | 6,362 | | | | 117,623 | |
BancFirst Corp. | | | 500 | | | | 26,075 | |
Banco Bilbao Vizcaya Argentaria SA (Spain) | | | 14,720 | | | | 84,331 | |
Banco de Sabadell SA (Spain) | | | 12,767 | | | | 12,735 | |
Banco Santander SA (Spain) | | | 35,843 | | | | 167,289 | |
Bancorp, Inc. (The)* | | | 7,600 | | | | 61,408 | |
Bank Hapoalim BM (Israel) | | | 2,274 | | | | 15,064 | |
Bank LeumiLe-Israel BM (Israel) | | | 3,396 | | | | 22,161 | |
Bank of America Corp. | | | 192,200 | | | | 5,302,798 | |
Bank of East Asia Ltd. (The) (Hong Kong) | | | 3,200 | | | | 10,403 | |
Bank of Ireland Group PLC (Ireland) | | | 2,128 | | | | 12,683 | |
Bank of Kyoto Ltd. (The) (Japan) | | | 120 | | | | 5,018 | |
Bank of NT Butterfield & Son Ltd. (The) (Bermuda) | | | 3,300 | | | | 118,404 | |
Bank of Queensland Ltd. (Australia) | | | 843 | | | | 5,450 | |
Bankia SA (Spain) | | | 3,007 | | | | 7,801 | |
Bankinter SA (Spain) | | | 1,436 | | | | 10,951 | |
Barclays PLC (United Kingdom) | | | 37,818 | | | | 76,243 | |
Bendigo & Adelaide Bank Ltd. (Australia) | | | 1,072 | | | | 7,365 | |
BNP Paribas SA (France) | | | 2,483 | | | | 118,977 | |
BOC Hong Kong Holdings Ltd. (China) | | | 8,500 | | | | 35,215 | |
CaixaBank SA (Spain) | | | 8,246 | | | | 25,837 | |
Chemical Financial Corp. | | | 2,900 | | | | 119,364 | |
Chiba Bank Ltd. (The) (Japan) | | | 1,500 | | | | 8,145 | |
Citigroup, Inc. | | | 61,470 | | | | 3,824,663 | |
Civista Bancshares, Inc. | | | 1,600 | | | | 34,928 | |
Commerzbank AG (Germany)* | | | 2,137 | | | | 16,601 | |
Commonwealth Bank of Australia (Australia) | | | 3,908 | | | | 196,041 | |
Community Trust Bancorp, Inc. | | | 300 | | | | 12,318 | |
Concordia Financial Group Ltd. (Japan) | | | 2,400 | | | | 9,257 | |
ConnectOne Bancorp, Inc. | | | 1,400 | | | | 27,580 | |
Credit Agricole SA (France) | | | 2,531 | | | | 30,615 | |
Customers Bancorp, Inc.* | | | 2,800 | | | | 51,268 | |
Danske Bank A/S (Denmark) | | | 1,559 | | | | 27,407 | |
See Notes to Financial Statements.
Schedule of Investments(unaudited) (continued)
as of March 31, 2019
| | | | | | | | |
| Description | | Shares | | | Value | |
COMMON STOCKS (Continued) | | | | | | | | |
| | |
Banks (cont’d.) | | | | | | | | |
DBS Group Holdings Ltd. (Singapore) | | | 4,013 | | | $ | 74,920 | |
DNB ASA (Norway) | | | 2,181 | | | | 40,230 | |
Enterprise Financial Services Corp. | | | 600 | | | | 24,462 | |
Erste Group Bank AG (Austria) | | | 654 | | | | 24,074 | |
Farmers National Banc Corp. | | | 2,400 | | | | 33,096 | |
Fifth Third Bancorp | | | 11,500 | | | | 290,030 | |
Financial Institutions, Inc. | | | 5,500 | | | | 149,490 | |
First BanCorp. (Puerto Rico) | | | 24,300 | | | | 278,478 | |
First Bancorp/Southern Pines NC | | | 700 | | | | 24,332 | |
First Financial Corp. | | | 1,000 | | | | 42,000 | |
First Midwest Bancorp, Inc. | | | 5,600 | | | | 114,576 | |
Flushing Financial Corp. | | | 1,300 | | | | 28,509 | |
Fukuoka Financial Group, Inc. (Japan) | | | 340 | | | | 7,551 | |
Great Western Bancorp, Inc. | | | 1,600 | | | | 50,544 | |
Hancock Whitney Corp. | | | 5,200 | | | | 210,080 | |
Hang Seng Bank Ltd. (Hong Kong) | | | 1,700 | | | | 42,035 | |
Hilltop Holdings, Inc. | | | 7,600 | | | | 138,700 | |
HSBC Holdings PLC (United Kingdom) | | | 44,445 | | | | 360,767 | |
IBERIABANK Corp. | | | 2,900 | | | | 207,959 | |
Independent Bank Group, Inc. | | | 400 | | | | 20,516 | |
ING Groep NV (Netherlands) | | | 8,591 | | | | 104,141 | |
International Bancshares Corp. | | | 1,900 | | | | 72,257 | |
Intesa Sanpaolo SpA (Italy) | | | 32,855 | | | | 80,129 | |
Japan Post Bank Co. Ltd. (Japan) | | | 1,000 | | | | 10,913 | |
JPMorgan Chase & Co. | | | 57,530 | | | | 5,823,762 | |
KBC Group NV (Belgium) | | | 546 | | | | 38,227 | |
KeyCorp | | | 47,000 | | | | 740,250 | |
Lloyds Banking Group PLC (United Kingdom) | | | 157,080 | | | | 127,390 | |
Mebuki Financial Group, Inc. (Japan) | | | 1,804 | | | | 4,610 | |
Mediobanca Banca di Credito Finanziario SpA (Italy) | | | 1,374 | | | | 14,310 | |
Metropolitan Bank Holding Corp.* | | | 1,700 | | | | 59,143 | |
MidWestOne Financial Group, Inc. | | | 3,200 | | | | 87,200 | |
Mitsubishi UFJ Financial Group, Inc. (Japan) | | | 25,900 | | | | 128,299 | |
Mizrahi Tefahot Bank Ltd. (Israel) | | | 326 | | | | 6,703 | |
Mizuho Financial Group, Inc. (Japan) | | | 53,260 | | | | 82,397 | |
National Australia Bank Ltd. (Australia) | | | 6,036 | | | | 108,341 | |
Nordea Bank Abp (Finland) | | | 6,738 | | | | 51,364 | |
OFG Bancorp (Puerto Rico) | | | 6,400 | | | | 126,656 | |
Old Second Bancorp, Inc. | | | 2,700 | | | | 33,993 | |
Oversea-Chinese Banking Corp. Ltd. (Singapore) | | | 7,053 | | | | 57,503 | |
Pacific City Financial Corp. | | | 800 | | | | 13,960 | |
Peapack Gladstone Financial Corp. | | | 1,500 | | | | 39,330 | |
Peoples Bancorp, Inc. | | | 1,200 | | | | 37,164 | |
Popular, Inc. (Puerto Rico) | | | 7,300 | | | | 380,549 | |
See Notes to Financial Statements.
| | | | | | | | |
| Description | | Shares | | | Value | |
COMMON STOCKS (Continued) | | | | | | | | |
| | |
Banks (cont’d.) | | | | | | | | |
QCR Holdings, Inc. | | | 1,700 | | | $ | 57,664 | |
Raiffeisen Bank International AG (Austria) | | | 356 | | | | 8,010 | |
RBB Bancorp | | | 1,000 | | | | 18,800 | |
Renasant Corp. | | | 500 | | | | 16,925 | |
Republic Bancorp, Inc. (Class A Stock) | | | 500 | | | | 22,360 | |
Resona Holdings, Inc. (Japan) | | | 4,500 | | | | 19,471 | |
Royal Bank of Scotland Group PLC (United Kingdom) | | | 10,639 | | | | 34,295 | |
Seven Bank Ltd. (Japan) | | | 1,200 | | | | 3,544 | |
Shinsei Bank Ltd. (Japan)* | | | 320 | | | | 4,545 | |
Shizuoka Bank Ltd. (The) (Japan) | | | 900 | | | | 6,847 | |
Simmons First National Corp. (Class A Stock) | | | 4,600 | | | | 112,608 | |
Skandinaviska Enskilda Banken AB (Sweden) (Class A Stock) | | | 3,593 | | | | 31,139 | |
Societe Generale SA (France) | | | 1,739 | | | | 50,364 | |
Southern National Bancorp of Virginia, Inc. | | | 4,100 | | | | 60,065 | |
Standard Chartered PLC (United Kingdom) | | | 6,206 | | | | 47,814 | |
Sumitomo Mitsui Financial Group, Inc. (Japan) | | | 3,017 | | | | 105,483 | |
Sumitomo Mitsui Trust Holdings, Inc. (Japan) | | | 718 | | | | 25,798 | |
Svenska Handelsbanken AB (Sweden) (Class A Stock) | | | 3,322 | | | | 35,068 | |
Swedbank AB (Sweden) (Class A Stock) | | | 1,999 | | | | 28,264 | |
UniCredit SpA (Italy) | | | 4,452 | | | | 57,169 | |
United Community Banks, Inc. | | | 4,000 | | | | 99,720 | |
United Overseas Bank Ltd. (Singapore) | | | 2,986 | | | | 55,484 | |
Univest Financial Corp. | | | 2,200 | | | | 53,812 | |
Wells Fargo & Co. | | | 52,300 | | | | 2,527,136 | |
WesBanco, Inc. | | | 300 | | | | 11,925 | |
Westpac Banking Corp. (Australia) | | | 7,583 | | | | 139,448 | |
Yamaguchi Financial Group, Inc. (Japan) | | | 400 | | | | 3,381 | |
| | | | | | | | |
| | | | | | | 24,665,705 | |
| | |
Beverages 1.4% | | | | | | | | |
Anheuser-Busch InBev SA/NV (Belgium) | | | 1,682 | | | | 141,491 | |
Asahi Group Holdings Ltd. (Japan) | | | 800 | | | | 35,640 | |
Carlsberg A/S (Denmark) (Class B Stock) | | | 245 | | | | 30,648 | |
Coca-Cola Amatil Ltd. (Australia) | | | 1,132 | | | | 6,953 | |
Coca-Cola Bottlers Japan Holdings, Inc. (Japan) | | | 300 | | | | 7,593 | |
Coca-Cola Co. (The) | | | 54,100 | | | | 2,535,126 | |
Coca-Cola Consolidated, Inc. | | | 50 | | | | 14,392 | |
Coca-Cola European Partners PLC (United Kingdom) | | | 465 | | | | 24,059 | |
Coca-Cola HBC AG (Switzerland)* | | | 465 | | | | 15,833 | |
Davide Campari-Milano SpA (Italy) | | | 1,374 | | | | 13,499 | |
Diageo PLC (United Kingdom) | | | 5,377 | | | | 219,883 | |
Heineken Holding NV (Netherlands) | | | 267 | | | | 26,779 | |
Heineken NV (Netherlands) | | | 575 | | | | 60,724 | |
Keurig Dr. Pepper, Inc. | | | 47,700 | | | | 1,334,169 | |
See Notes to Financial Statements.
Schedule of Investments(unaudited) (continued)
as of March 31, 2019
| | | | | | | | |
| Description | | Shares | | | Value | |
COMMON STOCKS (Continued) | | | | | | | | |
| | |
Beverages (cont’d.) | | | | | | | | |
Kirin Holdings Co. Ltd. (Japan) | | | 1,800 | | | $ | 42,920 | |
Monster Beverage Corp.* | | | 4,500 | | | | 245,610 | |
National Beverage Corp. | | | 3,100 | | | | 178,963 | |
PepsiCo, Inc. | | | 34,300 | | | | 4,203,465 | |
Pernod Ricard SA (France) | | | 469 | | | | 84,270 | |
Remy Cointreau SA (France) | | | 48 | | | | 6,403 | |
Suntory Beverage & Food Ltd. (Japan) | | | 300 | | | | 14,074 | |
Treasury Wine Estates Ltd. (Australia) | | | 1,530 | | | | 16,232 | |
| | | | | | | | |
| | | | | | | 9,258,726 | |
| | |
Biotechnology 1.9% | | | | | | | | |
AbbVie, Inc. | | | 1,500 | | | | 120,885 | |
ACADIA Pharmaceuticals, Inc.* | | | 3,000 | | | | 80,550 | |
Acorda Therapeutics, Inc.* | | | 9,600 | | | | 127,584 | |
Albireo Pharma, Inc.* | | | 1,200 | | | | 38,652 | |
Alexion Pharmaceuticals, Inc.* | | | 5,300 | | | | 716,454 | |
AMAG Pharmaceuticals, Inc.* | | | 1,600 | | | | 20,608 | |
Arena Pharmaceuticals, Inc.* | | | 400 | | | | 17,932 | |
Audentes Therapeutics, Inc.* | | | 500 | | | | 19,510 | |
BeiGene Ltd. (China), ADR* | | | 71 | | | | 9,372 | |
Biogen, Inc.* | | | 7,700 | | | | 1,820,126 | |
BioSpecifics Technologies Corp.* | | | 1,900 | | | | 118,427 | |
Blueprint Medicines Corp.* | | | 700 | | | | 56,035 | |
Celgene Corp.* | | | 32,800 | | | | 3,094,352 | |
Concert Pharmaceuticals, Inc.* | | | 3,600 | | | | 43,452 | |
CSL Ltd. (Australia) | | | 1,000 | | | | 138,875 | |
Emergent BioSolutions, Inc.* | | | 3,500 | | | | 176,820 | |
Genmab A/S (Denmark)* | | | 143 | | | | 24,842 | |
Genomic Health, Inc.* | | | 3,300 | | | | 231,165 | |
Gilead Sciences, Inc. | | | 40,100 | | | | 2,606,901 | |
Grifols SA (Spain) | | | 635 | | | | 17,818 | |
Jounce Therapeutics, Inc.* | | | 13,900 | | | | 86,180 | |
Karyopharm Therapeutics, Inc.* | | | 1,600 | | | | 9,344 | |
MacroGenics, Inc.* | | | 1,700 | | | | 30,566 | |
Myriad Genetics, Inc.* | | | 5,500 | | | | 182,600 | |
OPKO Health, Inc.* | | | 21,800 | | | | 56,898 | |
PDL BioPharma, Inc.* | | | 13,500 | | | | 50,220 | |
PTC Therapeutics, Inc.* | | | 800 | | | | 30,112 | |
Repligen Corp.* | | | 3,300 | | | | 194,964 | |
Retrophin, Inc.* | | | 6,400 | | | | 144,832 | |
Vanda Pharmaceuticals, Inc.* | | | 7,300 | | | | 134,320 | |
See Notes to Financial Statements.
| | | | | | | | |
| Description | | Shares | | | Value | |
COMMON STOCKS (Continued) | | | | | | | | |
| | |
Biotechnology (cont’d.) | | | | | | | | |
Veracyte, Inc.* | | | 5,300 | | | $ | 132,606 | |
Vertex Pharmaceuticals, Inc.* | | | 7,900 | | | | 1,453,205 | |
| | | | | | | | |
| | | | | | | 11,986,207 | |
| | |
Building Products 0.2% | | | | | | | | |
AGC, Inc. (Japan) | | | 440 | | | | 15,406 | |
Apogee Enterprises, Inc. | | | 2,000 | | | | 74,980 | |
Armstrong World Industries, Inc. | | | 2,400 | | | | 190,608 | |
Assa Abloy AB (Sweden) (Class B Stock) | | | 2,213 | | | | 47,830 | |
Builders FirstSource, Inc.* | | | 2,400 | | | | 32,016 | |
Cie de Saint-Gobain (France) | | | 1,098 | | | | 39,911 | |
Continental Building Products, Inc.* | | | 5,000 | | | | 123,950 | |
Daikin Industries Ltd. (Japan) | | | 530 | | | | 62,224 | |
Geberit AG (Switzerland) | | | 81 | | | | 33,168 | |
Griffon Corp. | | | 1,400 | | | | 25,872 | |
Kingspan Group PLC (Ireland) | | | 331 | | | | 15,329 | |
LIXIL Group Corp. (Japan) | | | 600 | | | | 8,001 | |
NCI Building Systems, Inc.* | | | 16,500 | | | | 101,640 | |
Resideo Technologies, Inc.* | | | 30,683 | | | | 591,875 | |
TOTO Ltd. (Japan) | | | 350 | | | | 14,844 | |
Universal Forest Products, Inc. | | | 5,400 | | | | 161,406 | |
| | | | | | | | |
| | | | | | | 1,539,060 | |
| | |
Capital Markets 1.3% | | | | | | | | |
3i Group PLC (United Kingdom) | | | 2,238 | | | | 28,725 | |
Ameriprise Financial, Inc. | | | 15,400 | | | | 1,972,740 | |
Amundi SA (France), 144A | | | 134 | | | | 8,448 | |
ASX Ltd. (Australia) | | | 416 | | | | 20,643 | |
BrightSphere Investment Group PLC | | | 8,500 | | | | 115,260 | |
Credit Suisse Group AG (Switzerland)* | | | 5,733 | | | | 66,932 | |
Daiwa Securities Group, Inc. (Japan) | | | 3,500 | | | | 17,050 | |
Deutsche Bank AG (Germany) | | | 4,334 | | | | 35,386 | |
Deutsche Boerse AG (Germany) | | | 420 | | | | 53,953 | |
Donnelley Financial Solutions, Inc.* | | | 3,900 | | | | 58,032 | |
GAMCO Investors, Inc. (Class A Stock) | | | 300 | | | | 6,150 | |
Goldman Sachs Group, Inc. (The) | | | 11,300 | | | | 2,169,487 | |
Greenhill & Co., Inc. | | | 1,100 | | | | 23,661 | |
Hargreaves Lansdown PLC (United Kingdom) | | | 653 | | | | 15,860 | |
Hong Kong Exchanges & Clearing Ltd. (Hong Kong) | | | 2,700 | | | | 94,368 | |
Houlihan Lokey, Inc. | | | 2,400 | | | | 110,040 | |
INTL. FCStone, Inc.* | | | 900 | | | | 34,884 | |
Investec PLC (South Africa) | | | 1,426 | | | | 8,230 | |
Japan Exchange Group, Inc. (Japan) | | | 1,100 | | | | 19,620 | |
See Notes to Financial Statements.
Schedule of Investments(unaudited) (continued)
as of March 31, 2019
| | | | | | | | |
| Description | | Shares | | | Value | |
COMMON STOCKS (Continued) | | | | | | | | |
| | |
Capital Markets (cont’d.) | | | | | | | | |
Julius Baer Group Ltd. (Switzerland)* | | | 523 | | | $ | 21,147 | |
London Stock Exchange Group PLC (United Kingdom) | | | 692 | | | | 42,884 | |
LPL Financial Holdings, Inc. | | | 5,100 | | | | 355,215 | |
Macquarie Group Ltd. (Australia) | | | 726 | | | | 66,695 | |
Morgan Stanley | | | 56,800 | | | | 2,396,960 | |
Natixis SA (France) | | | 2,197 | | | | 11,778 | |
Nomura Holdings, Inc. (Japan) | | | 7,900 | | | | 28,453 | |
Partners Group Holding AG (Switzerland) | | | 40 | | | | 29,092 | |
SBI Holdings, Inc. (Japan) | | | 580 | | | | 12,942 | |
Schroders PLC (United Kingdom) | | | 293 | | | | 10,327 | |
Singapore Exchange Ltd. (Singapore) | | | 2,000 | | | | 10,802 | |
St. James’s Place PLC (United Kingdom) | | | 1,252 | | | | 16,789 | |
Stifel Financial Corp. | | | 1,900 | | | | 100,244 | |
UBS Group AG (Switzerland)* | | | 8,482 | | | | 103,007 | |
| | | | | | | | |
| | | | | | | 8,065,804 | |
| | |
Chemicals 1.0% | | | | | | | | |
Air Liquide SA (France) | | | 946 | | | | 120,424 | |
Air Water, Inc. (Japan) | | | 300 | | | | 4,350 | |
Akzo Nobel NV (Netherlands) | | | 488 | | | | 43,317 | |
Arkema SA (France) | | | 162 | | | | 15,449 | |
Asahi Kasei Corp. (Japan) | | | 2,900 | | | | 29,948 | |
BASF SE (Germany) | | | 2,028 | | | | 149,499 | |
Chr Hansen Holding A/S (Denmark) | | | 211 | | | | 21,349 | |
Clariant AG (Switzerland)* | | | 461 | | | | 9,690 | |
Covestro AG (Germany), 144A | | | 448 | | | | 24,714 | |
Croda International PLC (United Kingdom) | | | 304 | | | | 19,986 | |
Daicel Corp. (Japan) | | | 600 | | | | 6,515 | |
EMS-Chemie Holding AG (Switzerland) | | | 19 | | | | 10,332 | |
Evonik Industries AG (Germany) | | | 357 | | | | 9,772 | |
Givaudan SA (Switzerland) | | | 21 | | | | 53,864 | |
Hitachi Chemical Co. Ltd. (Japan) | | | 200 | | | | 4,418 | |
Huntsman Corp. | | | 41,900 | | | | 942,331 | |
Incitec Pivot Ltd. (Australia) | | | 3,496 | | | | 7,737 | |
Ingevity Corp.* | | | 900 | | | | 95,049 | |
Innospec, Inc. | | | 200 | | | | 16,670 | |
Israel Chemicals Ltd. (Israel) | | | 1,407 | | | | 7,321 | |
Johnson Matthey PLC (United Kingdom) | | | 451 | | | | 18,477 | |
JSR Corp. (Japan) | | | 450 | | | | 6,976 | |
Kaneka Corp. (Japan) | | | 100 | | | | 3,747 | |
Kansai Paint Co. Ltd. (Japan) | | | 400 | | | | 7,616 | |
Koninklijke DSM NV (Netherlands) | | | 395 | | | | 43,143 | |
Kraton Corp.* | | | 800 | | | | 25,744 | |
Kuraray Co. Ltd. (Japan) | | | 700 | | | | 8,909 | |
See Notes to Financial Statements.
| | | | | | | | |
| Description | | Shares | | | Value | |
COMMON STOCKS (Continued) | | | | | | | | |
| | |
Chemicals (cont’d.) | | | | | | | | |
LANXESS AG (Germany) | | | 207 | | | $ | 11,087 | |
LyondellBasell Industries NV (Class A Stock) | | | 22,200 | | | | 1,866,576 | |
Mitsubishi Chemical Holdings Corp. (Japan) | | | 2,800 | | | | 19,723 | |
Mitsubishi Gas Chemical Co., Inc. (Japan) | | | 350 | | | | 4,998 | |
Mitsui Chemicals, Inc. (Japan) | | | 400 | | | | 9,658 | |
Mosaic Co. (The) | | | 48,100 | | | | 1,313,611 | |
Nippon Paint Holdings Co. Ltd. (Japan) | | | 350 | | | | 13,777 | |
Nissan Chemical Corp. (Japan) | | | 300 | | | | 13,744 | |
Nitto Denko Corp. (Japan) | | | 330 | | | | 17,356 | |
Novozymes A/S (Denmark) (Class B Stock) | | | 476 | | | | 21,945 | |
Olin Corp. | | | 23,500 | | | | 543,790 | |
OMNOVA Solutions, Inc.* | | | 2,100 | | | | 14,742 | |
Orica Ltd. (Australia) | | | 805 | | | | 10,077 | |
PolyOne Corp. | | | 1,800 | | | | 52,758 | |
Rayonier Advanced Materials, Inc. | | | 4,300 | | | | 58,308 | |
Shin-Etsu Chemical Co. Ltd. (Japan) | | | 790 | | | | 66,317 | |
Showa Denko KK (Japan) | | | 300 | | | | 10,590 | |
Sika AG (Switzerland) | | | 292 | | | | 41,000 | |
Solvay SA (Belgium) | | | 158 | | | | 17,134 | |
Stepan Co. | | | 1,500 | | | | 131,280 | |
Sumitomo Chemical Co. Ltd. (Japan) | | | 3,500 | | | | 16,289 | |
Symrise AG (Germany) | | | 275 | | | | 24,872 | |
Taiyo Nippon Sanso Corp. (Japan) | | | 300 | | | | 4,567 | |
Teijin Ltd. (Japan) | | | 380 | | | | 6,269 | |
Toray Industries, Inc. (Japan) | | | 3,000 | | | | 19,153 | |
Tosoh Corp. (Japan) | | | 600 | | | | 9,323 | |
Trinseo SA | | | 4,300 | | | | 194,790 | |
Umicore SA (Belgium) | | | 446 | | | | 19,862 | |
Yara International ASA (Norway) | | | 378 | | | | 15,503 | |
| | | | | | | | |
| | | | | | | 6,256,446 | |
| | |
Commercial Services & Supplies 0.1% | | | | | | | | |
ACCO Brands Corp. | | | 2,000 | | | | 17,120 | |
Babcock International Group PLC (United Kingdom) | | | 674 | | | | 4,338 | |
Brambles Ltd. (Australia) | | | 3,518 | | | | 29,394 | |
CECO Environmental Corp.* | | | 6,000 | | | | 43,200 | |
Dai Nippon Printing Co. Ltd. (Japan) | | | 550 | | | | 13,162 | |
Deluxe Corp. | | | 3,600 | | | | 157,392 | |
Edenred (France) | | | 531 | | | | 24,214 | |
G4S PLC (United Kingdom) | | | 3,243 | | | | 7,757 | |
Herman Miller, Inc. | | | 3,800 | | | | 133,684 | |
ISS A/S (Denmark) | | | 342 | | | | 10,424 | |
Knoll, Inc. | | | 2,700 | | | | 51,057 | |
Park24 Co. Ltd. (Japan) | | | 300 | | | | 6,513 | |
See Notes to Financial Statements.
Schedule of Investments(unaudited) (continued)
as of March 31, 2019
| | | | | | | | |
| Description | | Shares | | | Value | |
COMMON STOCKS (Continued) | | | | | | | | |
| | |
Commercial Services & Supplies (cont’d.) | | | | | | | | |
Pitney Bowes, Inc. | | | 7,000 | | | $ | 48,090 | |
Quad/Graphics, Inc. | | | 4,800 | | | | 57,120 | |
RR Donnelley & Sons Co. | | | 8,700 | | | | 41,064 | |
Secom Co. Ltd. (Japan) | | | 450 | | | | 38,544 | |
Securitas AB (Sweden) (Class B Stock) | | | 701 | | | | 11,334 | |
Societe BIC SA (France) | | | 55 | | | | 4,902 | |
Sohgo Security Services Co. Ltd. (Japan) | | | 150 | | | | 6,530 | |
SP Plus Corp.* | | | 1,300 | | | | 44,356 | |
Steelcase, Inc. (Class A Stock) | | | 4,100 | | | | 59,655 | |
Toppan Printing Co. Ltd. (Japan) | | | 550 | | | | 8,309 | |
| | | | | | | | |
| | | | | | | 818,159 | |
| | |
Communications Equipment 1.1% | | | | | | | | |
Acacia Communications, Inc.* | | | 2,900 | | | | 166,315 | |
Arista Networks, Inc.* | | | 1,800 | | | | 566,028 | |
Ciena Corp.* | | | 1,500 | | | | 56,010 | |
Cisco Systems, Inc. | | | 102,000 | | | | 5,506,980 | |
CommScope Holding Co., Inc.* | | | 24,300 | | | | 528,039 | |
NetScout Systems, Inc.* | | | 4,500 | | | | 126,315 | |
Nokia OYJ (Finland) | | | 12,442 | | | | 70,836 | |
Telefonaktiebolaget LM Ericsson (Sweden) (Class B Stock) | | | 6,816 | | | | 62,778 | |
Viavi Solutions, Inc.* | | | 1,200 | | | | 14,856 | |
| | | | | | | | |
| | | | | | | 7,098,157 | |
| | |
Construction & Engineering 0.3% | | | | | | | | |
ACS Actividades de Construccion y Servicios SA (Spain) | | | 548 | | | | 24,097 | |
Arcosa, Inc. | | | 133 | | | | 4,063 | |
Bouygues SA (France) | | | 467 | | | | 16,728 | |
CIMIC Group Ltd. (Australia) | | | 227 | | | | 7,779 | |
Comfort Systems USA, Inc. | | | 700 | | | | 36,673 | |
Eiffage SA (France) | | | 170 | | | | 16,350 | |
EMCOR Group, Inc. | | | 3,300 | | | | 241,164 | |
Ferrovial SA (Spain) | | | 1,109 | | | | 26,004 | |
Fluor Corp. | | | 12,900 | | | | 474,720 | |
HOCHTIEF AG (Germany) | | | 46 | | | | 6,677 | |
JGC Corp. (Japan) | | | 500 | | | | 6,647 | |
Kajima Corp. (Japan) | | | 1,000 | | | | 14,774 | |
KBR, Inc. | | | 1,800 | | | | 34,362 | |
Obayashi Corp. (Japan) | | | 1,500 | | | | 15,106 | |
Quanta Services, Inc. | | | 18,900 | | | | 713,286 | |
Shimizu Corp. (Japan) | | | 1,200 | | | | 10,432 | |
Skanska AB (Sweden) (Class B Stock) | | | 798 | | | | 14,486 | |
See Notes to Financial Statements.
| | | | | | | | |
| Description | | Shares | | | Value | |
COMMON STOCKS (Continued) | | | | | | | | |
| | |
Construction & Engineering (cont’d.) | | | | | | | | |
Taisei Corp. (Japan) | | | 430 | | | $ | 19,975 | |
Vinci SA (France) | | | 1,121 | | | | 109,214 | |
| | | | | | | | |
| | | | | | | 1,792,537 | |
| | |
Construction Materials 0.1% | | | | | | | | |
Boral Ltd. (Australia) | | | 2,497 | | | | 8,152 | |
CRH PLC (Ireland) | | | 1,828 | | | | 56,790 | |
Fletcher Building Ltd. (New Zealand) | | | 1,717 | | | | 5,784 | |
HeidelbergCement AG (Germany) | | | 330 | | | | 23,812 | |
Imerys SA (France) | | | 75 | | | | 3,751 | |
James Hardie Industries PLC (Ireland) | | | 964 | | | | 12,414 | |
LafargeHolcim Ltd. (Switzerland)* | | | 1,081 | | | | 53,536 | |
Taiheiyo Cement Corp. (Japan) | | | 250 | | | | 8,338 | |
United States Lime & Minerals, Inc. | | | 300 | | | | 23,136 | |
Vulcan Materials Co. | | | 2,300 | | | | 272,320 | |
| | | | | | | | |
| | | | | | | 468,033 | |
| | |
Consumer Finance 0.5% | | | | | | | | |
Acom Co. Ltd. (Japan) | | | 700 | | | | 2,499 | |
AEON Financial Service Co. Ltd. (Japan) | | | 300 | | | | 6,108 | |
Capital One Financial Corp. | | | 26,100 | | | | 2,132,109 | |
Credit Saison Co. Ltd. (Japan) | | | 300 | | | | 3,959 | |
Navient Corp. | | | 22,600 | | | | 261,482 | |
OneMain Holdings, Inc. | | | 17,200 | | | | 546,100 | |
| | | | | | | | |
| | | | | | | 2,952,257 | |
| | |
Containers & Packaging 0.1% | | | | | | | | |
Amcor Ltd. (Australia) | | | 2,578 | | | | 28,177 | |
Greif, Inc. (Class A Stock) | | | 4,200 | | | | 173,250 | |
Packaging Corp. of America | | | 1,800 | | | | 178,884 | |
Smurfit Kappa Group PLC (Ireland) | | | 508 | | | | 14,217 | |
Toyo Seikan Group Holdings Ltd. (Japan) | | | 300 | | | | 6,146 | |
| | | | | | | | |
| | | | | | | 400,674 | |
| | |
Distributors 0.5% | | | | | | | | |
Core-Mark Holding Co., Inc. | | | 5,100 | | | | 189,363 | |
Genuine Parts Co. | | | 17,800 | | | | 1,994,134 | |
Jardine Cycle & Carriage Ltd. (Singapore) | | | 200 | | | | 4,803 | |
LKQ Corp.* | | | 27,300 | | | | 774,774 | |
| | | | | | | | |
| | | | | | | 2,963,074 | |
See Notes to Financial Statements.
Schedule of Investments(unaudited) (continued)
as of March 31, 2019
| | | | | | | | |
| Description | | Shares | | | Value | |
COMMON STOCKS (Continued) | | | | | | | | |
| | |
Diversified Consumer Services 0.1% | | | | | | | | |
Adtalem Global Education, Inc.* | | | 3,900 | | | $ | 180,648 | |
American Public Education, Inc.* | | | 200 | | | | 6,024 | |
Benesse Holdings, Inc. (Japan) | | | 150 | | | | 3,892 | |
Career Education Corp.* | | | 1,000 | | | | 16,520 | |
Carriage Services, Inc. | | | 4,800 | | | | 92,400 | |
Laureate Education, Inc. (Class A Stock)* | | | 10,900 | | | | 163,173 | |
| | | | | | | | |
| | | | | | | 462,657 | |
| | |
Diversified Financial Services 0.7% | | | | | | | | |
AMP Ltd. (Australia) | | | 6,215 | | | | 9,266 | |
AXA Equitable Holdings, Inc. | | | 8,900 | | | | 179,246 | |
Berkshire Hathaway, Inc. (Class B Stock)* | | | 18,900 | | | | 3,796,821 | |
Challenger Ltd. (Australia) | | | 1,432 | | | | 8,423 | |
Eurazeo SE (France) | | | 119 | | | | 8,953 | |
EXOR NV (Netherlands) | | | 227 | | | | 14,781 | |
FGL Holdings | | | 3,300 | | | | 25,971 | |
Groupe Bruxelles Lambert SA (Belgium) | | | 172 | | | | 16,740 | |
Industrivarden AB (Sweden) (Class C Stock) | | | 418 | | | | 8,772 | |
Investor AB (Sweden) (Class B Stock) | | | 1,006 | | | | 45,345 | |
Kinnevik AB (Sweden) (Class B Stock) | | | 551 | | | | 14,287 | |
L E Lundbergforetagen AB (Sweden) (Class B Stock) | | | 146 | | | | 4,624 | |
Mitsubishi UFJ Lease & Finance Co. Ltd. (Japan) | | | 900 | | | | 4,591 | |
ORIX Corp. (Japan) | | | 2,940 | | | | 42,196 | |
Pargesa Holding SA (Switzerland) | | | 80 | | | | 6,274 | |
Standard Life Aberdeen PLC (United Kingdom) | | | 5,524 | | | | 19,017 | |
Tokyo Century Corp. (Japan) | | | 100 | | | | 4,350 | |
Wendel SA (France) | | | 68 | | | | 8,574 | |
| | | | | | | | |
| | | | | | | 4,218,231 | |
| | |
Diversified Telecommunication Services 1.5% | | | | | | | | |
AT&T, Inc. | | | 121,100 | | | | 3,797,696 | |
ATN International, Inc. | | | 2,100 | | | | 118,419 | |
Bezeq The Israeli Telecommunication Corp. Ltd. (Israel) | | | 3,777 | | | | 2,710 | |
BT Group PLC (United Kingdom) | | | 19,059 | | | | 55,431 | |
CenturyLink, Inc. | | | 26,700 | | | | 320,133 | |
Deutsche Telekom AG (Germany) | | | 7,358 | | | | 122,324 | |
Elisa OYJ (Finland) | | | 302 | | | | 13,631 | |
HKT Trust & HKT Ltd. (Hong Kong) (Class SS Stock) | | | 8,720 | | | | 14,026 | |
Iliad SA (France) | | | 54 | | | | 5,435 | |
Koninklijke KPN NV (Netherlands) | | | 7,679 | | | | 24,360 | |
Nippon Telegraph & Telephone Corp. (Japan) | | | 1,400 | | | | 59,460 | |
Orange SA (France) | | | 4,479 | | | | 72,991 | |
PCCW Ltd. (Hong Kong) | | | 11,400 | | | | 7,097 | |
See Notes to Financial Statements.
| | | | | | | | |
| Description | | Shares | | | Value | |
COMMON STOCKS (Continued) | | | | | | | | |
| | |
Diversified Telecommunication Services (cont’d.) | | | | | | | | |
Proximus SADP (Belgium) | | | 386 | | | $ | 11,155 | |
Singapore Telecommunications Ltd. (Singapore) | | | 18,300 | | | | 40,824 | |
Spark New Zealand Ltd. (New Zealand) | | | 4,381 | | | | 11,341 | |
Swisscom AG (Switzerland) | | | 58 | | | | 28,420 | |
Telecom Italia SpA (Italy)* | | | 26,019 | | | | 16,218 | |
Telecom Italia SpA (Italy), RSP | | | 12,084 | | | | 6,883 | |
Telefonica Deutschland Holding AG (Germany) | | | 1,630 | | | | 5,127 | |
Telefonica SA (Spain) | | | 10,316 | | | | 86,555 | |
Telenor ASA (Norway) | | | 1,590 | | | | 31,868 | |
Telia Co. AB (Sweden) | | | 6,479 | | | | 29,255 | |
Telstra Corp. Ltd. (Australia) | | | 9,013 | | | | 21,237 | |
TPG Telecom Ltd. (Australia) | | | 988 | | | | 4,865 | |
United Internet AG (Germany) | | | 254 | | | | 9,292 | |
Verizon Communications, Inc. | | | 84,950 | | | | 5,023,094 | |
| | | | | | | | |
| | | | | | | 9,939,847 | |
| | |
Electric Utilities 0.9% | | | | | | | | |
AusNet Services (Australia) | | | 3,660 | | | | 4,610 | |
Chubu Electric Power Co., Inc. (Japan) | | | 1,300 | | | | 20,293 | |
Chugoku Electric Power Co., Inc. (The) (Japan) | | | 600 | | | | 7,480 | |
CK Infrastructure Holdings Ltd. (Hong Kong) | | | 1,300 | | | | 10,684 | |
CLP Holdings Ltd. (Hong Kong) | | | 3,500 | | | | 40,572 | |
EDP - Energias de Portugal SA (Portugal) | | | 5,736 | | | | 22,536 | |
Electricite de France SA (France) | | | 1,410 | | | | 19,280 | |
Endesa SA (Spain) | | | 691 | | | | 17,636 | |
Enel SpA (Italy) | | | 17,955 | | | | 115,167 | |
Eversource Energy | | | 13,200 | | | | 936,540 | |
Exelon Corp. | | | 50,800 | | | | 2,546,604 | |
Fortum OYJ (Finland) | | | 1,044 | | | | 21,371 | |
HK Electric Investments & HK Electric Investments Ltd. (Hong Kong) | | | 5,500 | | | | 5,627 | |
Iberdrola SA (Spain) | | | 13,715 | | | | 120,386 | |
Kansai Electric Power Co., Inc. (The) (Japan) | | | 1,600 | | | | 23,593 | |
Kyushu Electric Power Co., Inc. (Japan) | | | 800 | | | | 9,441 | |
MGE Energy, Inc. | | | 1,000 | | | | 67,970 | |
Orsted A/S (Denmark), 144A | | | 418 | | | | 31,724 | |
Portland General Electric Co. | | | 4,800 | | | | 248,832 | |
Power Assets Holdings Ltd. (Hong Kong) | | | 3,000 | | | | 20,827 | |
Red Electrica Corp. SA (Spain) | | | 956 | | | | 20,372 | |
Southern Co. (The) | | | 28,600 | | | | 1,478,048 | |
SSE PLC (United Kingdom) | | | 2,266 | | | | 35,043 | |
Terna Rete Elettrica Nazionale SpA (Italy) | | | 3,106 | | | | 19,719 | |
Tohoku Electric Power Co., Inc. (Japan) | | | 900 | | | | 11,472 | |
See Notes to Financial Statements.
Schedule of Investments(unaudited) (continued)
as of March 31, 2019
| | | | | | | | |
| Description | | Shares | | | Value | |
COMMON STOCKS (Continued) | | | | | | | | |
| |
Electric Utilities (cont’d.) | | | | | |
Tokyo Electric Power Co. Holdings, Inc. (Japan)* | | | 3,100 | | | $ | 19,600 | |
Verbund AG (Austria) | | | 147 | | | | 7,044 | |
| | | | | | | | |
| | | | | | | 5,882,471 | |
| |
Electrical Equipment 0.1% | | | | | |
ABB Ltd. (Switzerland) | | | 4,068 | | | | 76,630 | |
Atkore International Group, Inc.* | | | 7,200 | | | | 155,016 | |
Encore Wire Corp. | | | 2,200 | | | | 125,884 | |
Fuji Electric Co. Ltd. (Japan) | | | 300 | | | | 8,514 | |
Legrand SA (France) | | | 589 | | | | 39,486 | |
Melrose Industries PLC (United Kingdom) | | | 10,778 | | | | 25,761 | |
Mitsubishi Electric Corp. (Japan) | | | 4,000 | | | | 51,415 | |
Nidec Corp. (Japan) | | | 500 | | | | 63,409 | |
OSRAM Licht AG (Germany) | | | 239 | | | | 8,261 | |
Prysmian SpA (Italy) | | | 529 | | | | 10,023 | |
Schneider Electric SE (France) | | | 1,214 | | | | 95,348 | |
Siemens Gamesa Renewable Energy SA (Spain)* | | | 466 | | | | 7,435 | |
Vestas Wind Systems A/S (Denmark) | | | 437 | | | | 36,809 | |
| | | | | | | | |
| | | | | | | 703,991 | |
| |
Electronic Equipment, Instruments & Components 0.6% | | | | | |
Alps Alpine Co. Ltd. (Japan) | | | 500 | | | | 10,441 | |
Anixter International, Inc.* | | | 3,500 | | | | 196,385 | |
AVX Corp. | | | 4,000 | | | | 69,360 | |
CDW Corp. | | | 18,800 | | | | 1,811,756 | |
Hamamatsu Photonics KK (Japan) | | | 300 | | | | 11,614 | |
Hexagon AB (Sweden) (Class B Stock) | | | 575 | | | | 30,073 | |
Hirose Electric Co. Ltd. (Japan) | | | 73 | | | | 7,661 | |
Hitachi High-Technologies Corp. (Japan) | | | 150 | | | | 6,135 | |
Hitachi Ltd. (Japan) | | | 2,140 | | | | 69,300 | |
Ingenico Group SA (France) | | | 144 | | | | 10,294 | |
Insight Enterprises, Inc.* | | | 1,700 | | | | 93,602 | |
Keyence Corp. (Japan) | | | 215 | | | | 134,247 | |
Keysight Technologies, Inc.* | | | 5,200 | | | | 453,440 | |
Kyocera Corp. (Japan) | | | 740 | | | | 43,456 | |
Murata Manufacturing Co. Ltd. (Japan) | | | 1,140 | | | | 56,863 | |
Nippon Electric Glass Co. Ltd. (Japan) | | | 180 | | | | 4,780 | |
Omron Corp. (Japan) | | | 400 | | | | 18,718 | |
Sanmina Corp.* | | | 4,700 | | | | 135,595 | |
ScanSource, Inc.* | | | 4,300 | | | | 154,026 | |
Shimadzu Corp. (Japan) | | | 500 | | | | 14,492 | |
SYNNEX Corp. | | | 2,500 | | | | 238,475 | |
TDK Corp. (Japan) | | | 280 | | | | 21,988 | |
See Notes to Financial Statements.
| | | | | | | | |
| Description | | Shares | | | Value | |
COMMON STOCKS (Continued) | | | | | | | | |
| |
Electronic Equipment, Instruments & Components (cont’d.) | | | | | |
Tech Data Corp.* | | | 2,000 | | | $ | 204,820 | |
Venture Corp. Ltd. (Singapore) | | | 600 | | | | 7,961 | |
Yaskawa Electric Corp. (Japan) | | | 600 | | | | 18,866 | |
Yokogawa Electric Corp. (Japan) | | | 500 | | | | 10,349 | |
| | | | | | | | |
| | | | | | | 3,834,697 | |
| |
Energy Equipment & Services 0.1% | | | | | |
Archrock, Inc. | | | 15,800 | | | | 154,524 | |
C&J Energy Services, Inc.* | | | 3,600 | | | | 55,872 | |
Exterran Corp.* | | | 800 | | | | 13,480 | |
John Wood Group PLC (United Kingdom) | | | 1,443 | | | | 9,549 | |
Mammoth Energy Services, Inc. | | | 5,000 | | | | 83,250 | |
Matrix Service Co.* | | | 7,700 | | | | 150,766 | |
Superior Energy Services, Inc.* | | | 22,200 | | | | 103,674 | |
TechnipFMC PLC (United Kingdom) | | | 6,700 | | | | 157,584 | |
Tenaris SA (Luxembourg) | | | 1,094 | | | | 15,432 | |
Unit Corp.* | | | 6,300 | | | | 89,712 | |
WorleyParsons Ltd. (Australia) | | | 694 | | | | 6,967 | |
| | | | | | | | |
| | | | | | | 840,810 | |
| |
Entertainment 0.9% | | | | | |
DeNA Co. Ltd. (Japan) | | | 200 | | | | 3,006 | |
Konami Holdings Corp. (Japan) | | | 200 | | | | 8,678 | |
Marcus Corp. (The) | | | 4,300 | | | | 172,215 | |
Nexon Co. Ltd. (Japan)* | | | 1,100 | | | | 17,237 | |
Nintendo Co. Ltd. (Japan) | | | 250 | | | | 71,281 | |
Toho Co. Ltd. (Japan) | | | 300 | | | | 12,042 | |
Ubisoft Entertainment SA (France)* | | | 177 | | | | 15,791 | |
Viacom, Inc. (Class B Stock) | | | 45,100 | | | | 1,265,957 | |
Vivendi SA (France) | | | 2,305 | | | | 66,837 | |
Walt Disney Co. (The) | | | 34,800 | | | | 3,863,844 | |
| | | | | | | | |
| | | | | | | 5,496,888 | |
| |
Equity Real Estate Investment Trusts (REITs) 1.6% | | | | | |
American Assets Trust, Inc. | | | 3,300 | | | | 151,338 | |
American Tower Corp. | | | 14,500 | | | | 2,857,370 | |
Apple Hospitality REIT, Inc. | | | 77,200 | | | | 1,258,360 | |
Armada Hoffler Properties, Inc. | | | 5,800 | | | | 90,422 | |
Ascendas Real Estate Investment Trust (Singapore) | | | 5,700 | | | | 12,242 | |
Ashford Hospitality Trust, Inc. | | | 5,000 | | | | 23,750 | |
British Land Co. PLC (The) (United Kingdom) | | | 1,998 | | | | 15,338 | |
CapitaLand Commercial Trust (Singapore) | | | 5,464 | | | | 7,826 | |
See Notes to Financial Statements.
Schedule of Investments(unaudited) (continued)
as of March 31, 2019
| | | | | | | | |
| Description | | Shares | | | Value | |
COMMON STOCKS (Continued) | | | | | | | | |
| |
Equity Real Estate Investment Trusts (REITs) (cont’d.) | | | | | |
CapitaLand Mall Trust (Singapore) | | | 5,400 | | | $ | 9,483 | |
Chatham Lodging Trust | | | 800 | | | | 15,392 | |
Chesapeake Lodging Trust | | | 4,400 | | | | 122,364 | |
CoreCivic, Inc. | | | 28,500 | | | | 554,325 | |
Cousins Properties, Inc. | | | 4,700 | | | | 45,402 | |
Covivio (France) | | | 112 | | | | 11,895 | |
Daiwa House REIT Investment Corp. (Japan) | | | 4 | | | | 8,870 | |
Dexus (Australia) | | | 2,223 | | | | 20,113 | |
DiamondRock Hospitality Co. | | | 18,700 | | | | 202,521 | |
Empire State Realty Trust, Inc. (Class A Stock) | | | 5,500 | | | | 86,900 | |
Franklin Street Properties Corp. | | | 17,900 | | | | 128,701 | |
Gecina SA (France) | | | 97 | | | | 14,360 | |
GEO Group, Inc. (The) | | | 10,900 | | | | 209,280 | |
Gladstone Commercial Corp. | | | 2,300 | | | | 47,771 | |
Goodman Group (Australia) | | | 3,604 | | | | 34,165 | |
GPT Group (The) (Australia) | | | 4,157 | | | | 18,326 | |
Hammerson PLC (United Kingdom) | | | 1,610 | | | | 7,048 | |
Host Hotels & Resorts, Inc. | | | 90,700 | | | | 1,714,230 | |
ICADE (France) | | | 67 | | | | 5,679 | |
InfraREIT, Inc.* | | | 1,300 | | | | 27,261 | |
Japan Prime Realty Investment Corp. (Japan) | | | 2 | | | | 8,236 | |
Japan Real Estate Investment Corp. (Japan) | | | 3 | | | | 17,681 | |
Japan Retail Fund Investment Corp. (Japan) | | | 6 | | | | 12,058 | |
Klepierre SA (France) | | | 445 | | | | 15,588 | |
Land Securities Group PLC (United Kingdom) | | | 1,579 | | | | 18,795 | |
Lexington Realty Trust | | | 5,900 | | | | 53,454 | |
Link REIT (Hong Kong) | | | 4,500 | | | | 52,663 | |
Mirvac Group (Australia) | | | 8,115 | | | | 15,836 | |
Nippon Building Fund, Inc. (Japan) | | | 3 | | | | 20,306 | |
Nippon Prologis REIT, Inc. (Japan) | | | 4 | | | | 8,514 | |
Nomura Real Estate Master Fund, Inc. (Japan) | | | 8 | | | | 11,775 | |
Outfront Media, Inc. | | | 6,000 | | | | 140,400 | |
Park Hotels & Resorts, Inc. | | | 3,000 | | | | 93,240 | |
Pebblebrook Hotel Trust | | | 2,900 | | | | 90,074 | |
RLJ Lodging Trust | | | 10,900 | | | | 191,513 | |
Ryman Hospitality Properties, Inc. | | | 2,700 | | | | 222,048 | |
Scentre Group (Australia) | | | 12,135 | | | | 35,397 | |
Segro PLC (United Kingdom) | | | 2,394 | | | | 21,008 | |
Spirit MTA REIT | | | 5,230 | | | | 33,943 | |
Spirit Realty Capital, Inc. | | | 24,480 | | | | 972,590 | |
Stockland (Australia) | | | 5,291 | | | | 14,464 | |
Suntec Real Estate Investment Trust (Singapore) | | | 5,100 | | | | 7,348 | |
Unibail-Rodamco-Westfield (France) | | | 301 | | | | 49,331 | |
United Urban Investment Corp. (Japan) | | | 6 | | | | 9,473 | |
See Notes to Financial Statements.
| | | | | | | | |
| Description | | Shares | | | Value | |
COMMON STOCKS (Continued) | | | | | | | | |
| | |
Equity Real Estate Investment Trusts (REITs) (cont’d.) | | | | | | | | |
Vicinity Centres (Australia) | | | 6,933 | | | $ | 12,804 | |
Xenia Hotels & Resorts, Inc. | | | 10,000 | | | | 219,100 | |
| | | | | | | | |
| | | | | | | 10,048,371 | |
| | |
Food & Staples Retailing 0.6% | | | | | | | | |
Aeon Co. Ltd. (Japan) | | | 1,400 | | | | 29,344 | |
Carrefour SA (France) | | | 1,307 | | | | 24,469 | |
Casino Guichard Perrachon SA (France) | | | 107 | | | | 4,647 | |
Coles Group Ltd. (Australia)* | | | 2,466 | | | | 20,643 | |
Colruyt SA (Belgium) | | | 134 | | | | 9,895 | |
Dairy Farm International Holdings Ltd. (Hong Kong) | | | 800 | | | | 6,714 | |
FamilyMart UNY Holdings Co. Ltd. (Japan) | | | 540 | | | | 13,765 | |
ICA Gruppen AB (Sweden) | | | 166 | | | | 6,659 | |
J Sainsbury PLC (United Kingdom) | | | 3,636 | | | | 11,173 | |
Jeronimo Martins SGPS SA (Portugal) | | | 636 | | | | 9,386 | |
Koninklijke Ahold Delhaize NV (Netherlands) | | | 2,613 | | | | 69,530 | |
Lawson, Inc. (Japan) | | | 100 | | | | 5,541 | |
METRO AG (Germany) | | | 461 | | | | 7,661 | |
Seven & i Holdings Co. Ltd. (Japan) | | | 1,700 | | | | 64,146 | |
Sundrug Co. Ltd. (Japan) | | | 150 | | | | 4,131 | |
Tesco PLC (United Kingdom) | | | 21,981 | | | | 66,507 | |
Tsuruha Holdings, Inc. (Japan) | | | 80 | | | | 6,502 | |
Village Super Market, Inc. (Class A Stock) | | | 900 | | | | 24,597 | |
Walgreens Boots Alliance, Inc. | | | 32,300 | | | | 2,043,621 | |
Walmart, Inc. | | | 10,900 | | | | 1,063,077 | |
Welcia Holdings Co. Ltd. (Japan) | | | 100 | | | | 3,392 | |
Wm Morrison Supermarkets PLC (United Kingdom) | | | 4,764 | | | | 14,146 | |
Woolworths Group Ltd. (Australia) | | | 2,960 | | | | 63,928 | |
| | | | | | | | |
| | | | | | | 3,573,474 | |
| | |
Food Products 1.1% | | | | | | | | |
a2 Milk Co. Ltd. (New Zealand)* | | | 1,619 | | | | 15,808 | |
Ajinomoto Co., Inc. (Japan) | | | 1,000 | | | | 15,988 | |
Archer-Daniels-Midland Co. | | | 42,800 | | | | 1,845,964 | |
Associated British Foods PLC (United Kingdom) | | | 759 | | | | 24,134 | |
Barry Callebaut AG (Switzerland) | | | 5 | | | | 9,042 | |
Calbee, Inc. (Japan) | | | 150 | | | | 4,041 | |
Campbell Soup Co. | | | 22,000 | | | | 838,860 | |
Chocoladefabriken Lindt & Spruengli AG (Switzerland) | | | 3 | | | | 20,381 | |
Conagra Brands, Inc. | | | 21,000 | | | | 582,540 | |
Danone SA (France) | | | 1,361 | | | | 104,950 | |
Fresh Del Monte Produce, Inc. | | | 1,400 | | | | 37,842 | |
Golden Agri-Resources Ltd. (Singapore) | | | 13,000 | | | | 2,686 | |
See Notes to Financial Statements.
Schedule of Investments(unaudited) (continued)
as of March 31, 2019
| | | | | | | | |
| Description | | Shares | | | Value | |
COMMON STOCKS (Continued) | | | | | | | | |
| | |
Food Products (cont’d.) | | | | | | | | |
Kerry Group PLC (Ireland) (Class A Stock) | | | 351 | | | $ | 39,233 | |
Kikkoman Corp. (Japan) | | | 350 | | | | 17,194 | |
Lancaster Colony Corp. | | | 220 | | | | 34,472 | |
MEIJI Holdings Co. Ltd. (Japan) | | | 250 | | | | 20,294 | |
Mondelez International, Inc. (Class A Stock) | | | 7,400 | | | | 369,408 | |
Mowi ASA (Norway) | | | 968 | | | | 21,657 | |
Nestle SA (Switzerland) | | | 6,795 | | | | 647,948 | |
NH Foods Ltd. (Japan) | | | 250 | | | | 8,996 | |
Nisshin Seifun Group, Inc. (Japan) | | | 405 | | | | 9,301 | |
Nissin Foods Holdings Co. Ltd. (Japan) | | | 100 | | | | 6,869 | |
Orkla ASA (Norway) | | | 1,720 | | | | 13,215 | |
Pilgrim’s Pride Corp.* | | | 22,700 | | | | 505,983 | |
Simply Good Foods Co. (The)* | | | 2,600 | | | | 53,534 | |
Toyo Suisan Kaisha Ltd. (Japan) | | | 200 | | | | 7,614 | |
Tyson Foods, Inc. (Class A Stock) | | | 29,500 | | | | 2,048,185 | |
WH Group Ltd. (Hong Kong), 144A | | | 20,500 | | | | 21,981 | |
Wilmar International Ltd. (Singapore) | | | 4,500 | | | | 10,989 | |
Yakult Honsha Co. Ltd. (Japan) | | | 300 | | | | 20,983 | |
Yamazaki Baking Co. Ltd. (Japan) | | | 300 | | | | 4,866 | |
| | | | | | | | |
| | | | | | | 7,364,958 | |
| | |
Gas Utilities 0.2% | | | | | | | | |
APA Group (Australia) | | | 2,699 | | | | 19,127 | |
Chesapeake Utilities Corp. | | | 1,300 | | | | 118,573 | |
Hong Kong & China Gas Co. Ltd. (Hong Kong) | | | 20,237 | | | | 48,552 | |
Naturgy Energy Group SA (Spain) | | | 813 | | | | 22,740 | |
New Jersey Resources Corp. | | | 2,800 | | | | 139,412 | |
Osaka Gas Co. Ltd. (Japan) | | | 800 | | | | 15,791 | |
Southwest Gas Holdings, Inc. | | | 200 | | | | 16,452 | |
Spire, Inc. | | | 2,800 | | | | 230,412 | |
Toho Gas Co. Ltd. (Japan) | | | 160 | | | | 7,188 | |
Tokyo Gas Co. Ltd. (Japan) | | | 800 | | | | 21,623 | |
UGI Corp. | | | 14,800 | | | | 820,216 | |
| | | | | | | | |
| | | | | | | 1,460,086 | |
| | |
Health Care Equipment & Supplies 2.4% | | | | | | | | |
Abbott Laboratories | | | 32,800 | | | | 2,622,032 | |
AngioDynamics, Inc.* | | | 4,500 | | | | 102,870 | |
Asahi Intecc Co. Ltd. (Japan) | | | 200 | | | | 9,403 | |
Atrion Corp. | | | 40 | | | | 35,147 | |
Baxter International, Inc. | | | 10,300 | | | | 837,493 | |
Becton, Dickinson & Co. | | | 6,900 | | | | 1,723,137 | |
BioMerieux (France) | | | 82 | | | | 6,786 | |
See Notes to Financial Statements.
| | | | | | | | |
| Description | | Shares | | | Value | |
COMMON STOCKS (Continued) | | | | | | | | |
| | |
Health Care Equipment & Supplies (cont’d.) | | | | | | | | |
Boston Scientific Corp.* | | | 8,900 | | | $ | 341,582 | |
Cardiovascular Systems, Inc.* | | | 3,800 | | | | 146,908 | |
Cochlear Ltd. (Australia) | | | 132 | | | | 16,277 | |
Coloplast A/S (Denmark) (Class B Stock) | | | 275 | | | | 30,205 | |
CONMED Corp. | | | 1,900 | | | | 158,042 | |
ConvaTec Group PLC (United Kingdom), 144A | | | 2,704 | | | | 4,991 | |
Danaher Corp. | | | 17,500 | | | | 2,310,350 | |
Demant A/S (Denmark)* | | | 207 | | | | 6,131 | |
Fisher & Paykel Healthcare Corp. Ltd. (New Zealand) | | | 1,324 | | | | 14,134 | |
Haemonetics Corp.* | | | 2,300 | | | | 201,204 | |
Hoya Corp. (Japan) | | | 850 | | | | 56,259 | |
IDEXX Laboratories, Inc.* | | | 2,700 | | | | 603,720 | |
Integer Holdings Corp.* | | | 3,000 | | | | 226,260 | |
Koninklijke Philips NV (Netherlands) | | | 2,047 | | | | 83,619 | |
Lantheus Holdings, Inc.* | | | 7,300 | | | | 178,704 | |
LivaNova PLC* | | | 2,500 | | | | 243,125 | |
Masimo Corp.* | | | 2,100 | | | | 290,388 | |
Medtronic PLC | | | 36,700 | | | | 3,342,636 | |
Olympus Corp. (Japan) | | | 2,720 | | | | 29,529 | |
RTI Surgical Holdings, Inc.* | | | 3,600 | | | | 21,636 | |
Siemens Healthineers AG (Germany), 144A | | | 349 | | | | 14,572 | |
Smith & Nephew PLC (United Kingdom) | | | 1,931 | | | | 38,330 | |
Sonova Holding AG (Switzerland) | | | 130 | | | | 25,749 | |
Straumann Holding AG (Switzerland) | | | 24 | | | | 19,649 | |
Stryker Corp. | | | 5,400 | | | | 1,066,608 | |
Sysmex Corp. (Japan) | | | 330 | | | | 19,979 | |
Terumo Corp. (Japan) | | | 1,300 | | | | 39,726 | |
Varex Imaging Corp.* | | | 800 | | | | 27,104 | |
Zimmer Biomet Holdings, Inc. | | | 6,900 | | | | 881,130 | |
| | | | | | | | |
| | | | | | | 15,775,415 | |
| | |
Health Care Providers & Services 1.2% | | | | | | | | |
Alfresa Holdings Corp. (Japan) | | | 400 | | | | 11,396 | |
CVS Health Corp. | | | 43,500 | | | | 2,345,955 | |
DaVita, Inc.* | | | 400 | | | | 21,716 | |
Ensign Group, Inc. (The) | | | 1,700 | | | | 87,023 | |
Fresenius Medical Care AG & Co. KGaA (Germany) | | | 477 | | | | 38,601 | |
Fresenius SE & Co. KGaA (Germany) | | | 925 | | | | 51,755 | |
HCA Healthcare, Inc. | | | 11,000 | | | | 1,434,180 | |
Medipal Holdings Corp. (Japan) | | | 400 | | | | 9,507 | |
National HealthCare Corp. | | | 900 | | | | 68,292 | |
NMC Health PLC (United Arab Emirates) | | | 211 | | | | 6,288 | |
Providence Service Corp. (The)* | | | 1,400 | | | | 93,268 | |
Ramsay Health Care Ltd. (Australia) | | | 300 | | | | 13,720 | |
See Notes to Financial Statements.
Schedule of Investments(unaudited) (continued)
as of March 31, 2019
| | | | | | | | |
| Description | | Shares | | | Value | |
COMMON STOCKS (Continued) | | | | | | | | |
| | |
Health Care Providers & Services (cont’d.) | | | | | | | | |
Ryman Healthcare Ltd. (New Zealand) | | | 852 | | | $ | 7,124 | |
Select Medical Holdings Corp.* | | | 4,100 | | | | 57,769 | |
Sonic Healthcare Ltd. (Australia) | | | 938 | | | | 16,358 | |
Suzuken Co. Ltd. (Japan) | | | 165 | | | | 9,570 | |
Tenet Healthcare Corp.* | | | 6,700 | | | | 193,228 | |
UnitedHealth Group, Inc. | | | 14,500 | | | | 3,585,270 | |
| | | | | | | | |
| | | | | | | 8,051,020 | |
| | |
Health Care Technology 0.0% | | | | | | | | |
Computer Programs & Systems, Inc. | | | 700 | | | | 20,783 | |
HealthStream, Inc.* | | | 2,100 | | | | 58,926 | |
M3, Inc. (Japan) | | | 900 | | | | 15,142 | |
Omnicell, Inc.* | | | 2,500 | | | | 202,100 | |
| | | | | | | | |
| | | | | | | 296,951 | |
| | |
Hotels, Restaurants & Leisure 0.8% | | | | | | | | |
Accor SA (France) | | | 397 | | | | 16,096 | |
Aristocrat Leisure Ltd. (Australia) | | | 1,224 | | | | 21,304 | |
Biglari Holdings, Inc. (Class B Stock)* | | | 470 | | | | 66,439 | |
Bloomin’ Brands, Inc. | | | 9,900 | | | | 202,455 | |
Brinker International, Inc. | | | 500 | | | | 22,190 | |
Carnival PLC | | | 392 | | | | 19,257 | |
Churchill Downs, Inc. | | | 1,300 | | | | 117,338 | |
Compass Group PLC (United Kingdom) | | | 3,501 | | | | 82,296 | |
Crown Resorts Ltd. (Australia) | | | 727 | | | | 5,944 | |
Del Taco Restaurants, Inc.* | | | 900 | | | | 9,054 | |
Dine Brands Global, Inc. | | | 800 | | | | 73,032 | |
Domino’s Pizza Enterprises Ltd. (Australia) | | | 160 | | | | 4,922 | |
Extended Stay America, Inc., UTS | | | 26,200 | | | | 470,290 | |
Flight Centre Travel Group Ltd. (Australia) | | | 111 | | | | 3,312 | |
Galaxy Entertainment Group Ltd. (Macau) | | | 5,400 | | | | 36,863 | |
Genting Singapore Ltd. (Singapore) | | | 14,700 | | | | 11,312 | |
GVC Holdings PLC (United Kingdom) | | | 1,169 | | | | 8,520 | |
Hilton Grand Vacations, Inc.* | | | 7,600 | | | | 234,460 | |
Hilton Worldwide Holdings, Inc. | | | 7,500 | | | | 623,325 | |
InterContinental Hotels Group PLC (United Kingdom) | | | 380 | | | | 22,865 | |
J Alexander’s Holdings, Inc.* | | | 2,500 | | | | 24,550 | |
Marriott Vacations Worldwide Corp. | | | 2,400 | | | | 224,400 | |
McDonald’s Holdings Co. Japan Ltd. (Japan) | | | 100 | | | | 4,624 | |
Melco Resorts & Entertainment Ltd. (Hong Kong), ADR | | | 538 | | | | 12,153 | |
Merlin Entertainments PLC (United Kingdom), 144A | | | 1,793 | | | | 8,022 | |
MGM China Holdings Ltd. (Macau) | | | 2,400 | | | | 5,043 | |
Norwegian Cruise Line Holdings Ltd.* | | | 5,400 | | | | 296,784 | |
See Notes to Financial Statements.
| | | | | | | | |
| Description | | Shares | | | Value | |
COMMON STOCKS (Continued) | | | | | | | | |
| | |
Hotels, Restaurants & Leisure (cont’d.) | | | | | | | | |
Oriental Land Co. Ltd. (Japan) | | | 440 | | | $ | 50,014 | |
Paddy Power Betfair PLC (Ireland) | | | 194 | | | | 14,979 | |
Penn National Gaming, Inc.* | | | 9,100 | | | | 182,910 | |
RCI Hospitality Holdings, Inc. | | | 3,100 | | | | 71,207 | |
Royal Caribbean Cruises Ltd. | | | 10,300 | | | | 1,180,586 | |
Sands China Ltd. (Macau) | | | 5,600 | | | | 28,222 | |
Shangri-La Asia Ltd. (Hong Kong) | | | 4,000 | | | | 5,700 | |
SJM Holdings Ltd. (Macau) | | | 4,000 | | | | 4,571 | |
Sodexo SA (France) | | | 193 | | | | 21,266 | |
Speedway Motorsports, Inc. | | | 1,800 | | | | 26,046 | |
Starbucks Corp. | | | 10,400 | | | | 773,136 | |
Tabcorp Holdings Ltd. (Australia) | | | 4,066 | | | | 13,339 | |
TUI AG (Germany) | | | 938 | | | | 9,011 | |
Whitbread PLC (United Kingdom) | | | 424 | | | | 28,058 | |
Wynn Macau Ltd. (Macau) | | | 3,300 | | | | 7,806 | |
| | | | | | | | |
| | | | | | | 5,043,701 | |
| | |
Household Durables 0.1% | | | | | | | | |
Barratt Developments PLC (United Kingdom) | | | 2,131 | | | | 16,656 | |
Berkeley Group Holdings PLC (United Kingdom) | | | 257 | | | | 12,352 | |
Casio Computer Co. Ltd. (Japan) | | | 400 | | | | 5,217 | |
Cavco Industries, Inc.* | | | 110 | | | | 12,928 | |
Electrolux AB (Sweden) (Class B Stock) | | | 571 | | | | 14,694 | |
Hooker Furniture Corp. | | | 1,300 | | | | 37,479 | |
Husqvarna AB (Sweden) (Class B Stock) | | | 847 | | | | 6,931 | |
Iida Group Holdings Co. Ltd. (Japan) | | | 300 | | | | 5,435 | |
La-Z-Boy, Inc. | | | 1,500 | | | | 49,485 | |
Meritage Homes Corp.* | | | 600 | | | | 26,826 | |
Nikon Corp. (Japan) | | | 700 | | | | 9,885 | |
Panasonic Corp. (Japan) | | | 4,800 | | | | 41,378 | |
Persimmon PLC (United Kingdom) | | | 698 | | | | 19,761 | |
Rinnai Corp. (Japan) | | | 70 | | | | 4,950 | |
SEB SA (France) | | | 55 | | | | 9,266 | |
Sekisui Chemical Co. Ltd. (Japan) | | | 800 | | | | 12,864 | |
Sekisui House Ltd. (Japan) | | | 1,400 | | | | 23,164 | |
Sharp Corp. (Japan) | | | 480 | | | | 5,295 | |
Sony Corp. (Japan) | | | 2,850 | | | | 119,739 | |
Taylor Wimpey PLC (United Kingdom) | | | 6,977 | | | | 15,962 | |
Techtronic Industries Co. Ltd. (Hong Kong) | | | 3,000 | | | | 20,259 | |
Tupperware Brands Corp. | | | 6,500 | | | | 166,270 | |
| | | | | | | | |
| | | | | | | 636,796 | |
See Notes to Financial Statements.
Schedule of Investments(unaudited) (continued)
as of March 31, 2019
| | | | | | | | |
| Description | | Shares | | | Value | |
COMMON STOCKS (Continued) | | | | | | | | |
| | |
Household Products 0.7% | | | | | | | | |
Essity AB (Sweden) (Class B Stock) | | | 1,339 | | | $ | 38,661 | |
Henkel AG & Co. KGaA (Germany) | | | 222 | | | | 21,136 | |
Lion Corp. (Japan) | | | 500 | | | | 10,515 | |
Pigeon Corp. (Japan) | | | 300 | | | | 12,304 | |
Procter & Gamble Co. (The) | | | 40,275 | | | | 4,190,613 | |
Reckitt Benckiser Group PLC (United Kingdom) | | | 1,483 | | | | 123,429 | |
Unicharm Corp. (Japan) | | | 900 | | | | 29,829 | |
| | | | | | | | |
| | | | | | | 4,426,487 | |
| | |
Independent Power & Renewable Electricity Producers 0.4% | | | | | | | | |
AES Corp. | | | 73,900 | | | | 1,336,112 | |
Clearway Energy, Inc. (Class A Stock) | | | 2,900 | | | | 42,166 | |
Clearway Energy, Inc. (Class C Stock) | | | 1,000 | | | | 15,110 | |
Electric Power Development Co. Ltd. (Japan) | | | 300 | | | | 7,306 | |
Meridian Energy Ltd. (New Zealand) | | | 2,829 | | | | 8,064 | |
NRG Energy, Inc. | | | 33,100 | | | | 1,406,088 | |
Uniper SE (Germany) | | | 467 | | | | 14,087 | |
| | | | | | | | |
| | | | | | | 2,828,933 | |
| | |
Industrial Conglomerates 1.0% | | | | | | | | |
CK Hutchison Holdings Ltd. (Hong Kong) | | | 5,857 | | | | 61,616 | |
DCC PLC (United Kingdom) | | | 210 | | | | 18,167 | |
General Electric Co. | | | 290,700 | | | | 2,904,093 | |
Honeywell International, Inc. | | | 18,900 | | | | 3,003,588 | |
Jardine Matheson Holdings Ltd. (Hong Kong) | | | 500 | | | | 31,157 | |
Jardine Strategic Holdings Ltd. (Hong Kong) | | | 500 | | | | 18,747 | |
Keihan Holdings Co. Ltd. (Japan) | | | 200 | | | | 8,409 | |
Keppel Corp. Ltd. (Singapore) | | | 3,300 | | | | 15,178 | |
NWS Holdings Ltd. (Hong Kong) | | | 3,900 | | | | 8,557 | |
Sembcorp Industries Ltd. (Singapore) | | | 2,300 | | | | 4,336 | |
Siemens AG (Germany) | | | 1,689 | | | | 181,997 | |
Smiths Group PLC (United Kingdom) | | | 843 | | | | 15,777 | |
Toshiba Corp. (Japan) | | | 1,470 | | | | 46,777 | |
| | | | | | | | |
| | | | | | | 6,318,399 | |
| | |
Insurance 1.3% | | | | | | | | |
Admiral Group PLC (United Kingdom) | | | 447 | | | | 12,648 | |
Aegon NV (Netherlands) | | | 4,136 | | | | 19,972 | |
Aflac, Inc. | | | 5,700 | | | | 285,000 | |
Ageas (Belgium) | | | 416 | | | | 20,068 | |
AIA Group Ltd. (Hong Kong) | | | 26,700 | | | | 267,206 | |
Allianz SE (Germany) | | | 939 | | | | 209,429 | |
See Notes to Financial Statements.
| | | | | | | | |
| Description | | Shares | | | Value | |
COMMON STOCKS (Continued) | | | | | | | | |
| | |
Insurance (cont’d.) | | | | | | | | |
Allstate Corp. (The) | | | 15,500 | | | $ | 1,459,790 | |
American Equity Investment Life Holding Co. | | | 6,400 | | | | 172,928 | |
Assicurazioni Generali SpA (Italy) | | | 2,591 | | | | 48,025 | |
Aviva PLC (United Kingdom) | | | 8,655 | | | | 46,550 | |
AXA SA (France) | | | 4,282 | | | | 107,933 | |
Baloise Holding AG (Switzerland) | | | 105 | | | | 17,379 | |
CNO Financial Group, Inc. | | | 10,800 | | | | 174,744 | |
CNP Assurances (France) | | | 354 | | | | 7,791 | |
Dai-ichi Life Holdings, Inc. (Japan) | | | 2,427 | | | | 33,731 | |
Direct Line Insurance Group PLC (United Kingdom) | | | 2,971 | | | | 13,676 | |
FBL Financial Group, Inc. (Class A Stock) | | | 1,500 | | | | 94,080 | |
FedNat Holding Co. | | | 600 | | | | 9,624 | |
Genworth Financial, Inc. (Class A Stock)* | | | 35,700 | | | | 136,731 | |
Gjensidige Forsikring ASA (Norway) | | | 423 | | | | 7,313 | |
Hannover Rueck SE (Germany) | | | 137 | | | | 19,709 | |
Insurance Australia Group Ltd. (Australia) | | | 5,323 | | | | 28,985 | |
Japan Post Holdings Co. Ltd. (Japan) | | | 3,600 | | | | 42,129 | |
Legal & General Group PLC (United Kingdom) | | | 13,158 | | | | 47,266 | |
Lincoln National Corp. | | | 7,200 | | | | 422,640 | |
Mapfre SA (Spain) | | | 2,259 | | | | 6,230 | |
Medibank Private Ltd. (Australia) | | | 5,681 | | | | 11,124 | |
MetLife, Inc. | | | 52,300 | | | | 2,226,411 | |
MS&AD Insurance Group Holdings, Inc. (Japan) | | | 1,090 | | | | 33,129 | |
Muenchener Rueckversicherungs-Gesellschaft AG in Muenchen (Germany) | | | 330 | | | | 78,184 | |
National General Holdings Corp. | | | 7,900 | | | | 187,467 | |
National Western Life Group, Inc. (Class A Stock) | | | 110 | | | | 28,872 | |
NN Group NV (Netherlands) | | | 678 | | | | 28,209 | |
Poste Italiane SpA (Italy), 144A | | | 1,294 | | | | 12,602 | |
Protective Insurance Corp. (Class B Stock) | | | 700 | | | | 12,964 | |
Prudential PLC (United Kingdom) | | | 5,722 | | | | 114,656 | |
QBE Insurance Group Ltd. (Australia) | | | 2,888 | | | | 25,231 | |
RSA Insurance Group PLC (United Kingdom) | | | 2,222 | | | | 14,714 | |
Sampo OYJ (Finland) (Class A Stock) | | | 989 | | | | 44,900 | |
SCOR SE (France) | | | 362 | | | | 15,434 | |
Sompo Holdings, Inc. (Japan) | | | 695 | | | | 25,685 | |
Sony Financial Holdings, Inc. (Japan) | | | 400 | | | | 7,527 | |
Suncorp Group Ltd. (Australia) | | | 2,988 | | | | 29,218 | |
Swiss Life Holding AG (Switzerland)* | | | 79 | | | | 34,889 | |
Swiss Re AG (Switzerland) | | | 673 | | | | 65,829 | |
T&D Holdings, Inc. (Japan) | | | 1,200 | | | | 12,593 | |
Tokio Marine Holdings, Inc. (Japan) | | | 1,470 | | | | 71,139 | |
Tryg A/S (Denmark) | | | 242 | | | | 6,644 | |
See Notes to Financial Statements.
Schedule of Investments(unaudited) (continued)
as of March 31, 2019
| | | | | | | | |
| Description | | Shares | | | Value | |
COMMON STOCKS (Continued) | | | | | | | | |
| | |
Insurance (cont’d.) | | | | | | | | |
Unum Group | | | 52,300 | | | $ | 1,769,309 | |
Zurich Insurance Group AG (Switzerland) | | | 334 | | | | 110,758 | |
| | | | | | | | |
| | | | | | | 8,679,065 | |
| | |
Interactive Media & Services 2.9% | | | | | | | | |
Alphabet, Inc. (Class A Stock)* | | | 3,900 | | | | 4,589,871 | |
Alphabet, Inc. (Class C Stock)* | | | 5,815 | | | | 6,822,798 | |
Auto Trader Group PLC (United Kingdom), 144A | | | 1,940 | | | | 13,188 | |
Facebook, Inc. (Class A Stock)* | | | 41,000 | | | | 6,834,290 | |
Kakaku.com, Inc. (Japan) | | | 300 | | | | 5,762 | |
LINE Corp. (Japan)* | | | 200 | | | | 7,056 | |
REA Group Ltd. (Australia) | | | 112 | | | | 5,935 | |
Yahoo Japan Corp. (Japan) | | | 6,056 | | | | 14,843 | |
Yelp, Inc.* | | | 5,700 | | | | 196,650 | |
| | | | | | | | |
| | | | | | | 18,490,393 | |
| | |
Internet & Direct Marketing Retail 2.3% | | | | | | | | |
1-800-Flowers.com, Inc. (Class A Stock)* | | | 7,100 | | | | 129,433 | |
Amazon.com, Inc.* | | | 3,700 | | | | 6,588,775 | |
Booking Holdings, Inc.* | | | 1,490 | | | | 2,599,916 | |
Delivery Hero SE (Germany), 144A* | | | 186 | | | | 6,729 | |
eBay, Inc. | | | 67,400 | | | | 2,503,236 | |
Expedia Group, Inc. | | | 13,800 | | | | 1,642,200 | |
Liberty Expedia Holdings, Inc. (Class A Stock)* | | | 1,000 | | | | 42,800 | |
Qurate Retail, Inc.* | | | 60,600 | | | | 968,388 | |
Rakuten, Inc. (Japan) | | | 1,910 | | | | 18,104 | |
Zalando SE (Germany), 144A* | | | 238 | | | | 9,296 | |
ZOZO, Inc. (Japan) | | | 500 | | | | 9,415 | |
| | | | | | | | |
| | | | | | | 14,518,292 | |
| | |
IT Services 2.4% | | | | | | | | |
Accenture PLC (Class A Stock) | | | 15,800 | | | | 2,781,116 | |
Adyen NV (Netherlands), 144A* | | | 23 | | | | 18,079 | |
Amadeus IT Group SA (Spain) | | | 969 | | | | 77,723 | |
Atos SE (France) | | | 217 | | | | 20,956 | |
Automatic Data Processing, Inc. | | | 4,300 | | | | 686,882 | |
Booz Allen Hamilton Holding Corp. | | | 19,800 | | | | 1,151,172 | |
CACI International, Inc. (Class A Stock)* | | | 1,500 | | | | 273,030 | |
Capgemini SE (France) | | | 350 | | | | 42,493 | |
Cognizant Technology Solutions Corp. (Class A Stock) | | | 32,000 | | | | 2,318,400 | |
Computershare Ltd. (Australia) | | | 1,108 | | | | 13,416 | |
DXC Technology Co. | | | 28,800 | | | | 1,852,128 | |
See Notes to Financial Statements.
| | | | | | | | |
| Description | | Shares | | | Value | |
COMMON STOCKS (Continued) | | | | | | | | |
| | |
IT Services (cont’d.) | | | | | | | | |
Endurance International Group Holdings, Inc.* | | | 7,100 | | | $ | 51,475 | |
Fidelity National Information Services, Inc. | | | 14,200 | | | | 1,606,020 | |
Fujitsu Ltd. (Japan) | | | 430 | | | | 31,019 | |
International Business Machines Corp. | | | 24,600 | | | | 3,471,060 | |
MAXIMUS, Inc. | | | 2,200 | | | | 156,156 | |
Nomura Research Institute Ltd. (Japan) | | | 202 | | | | 9,185 | |
NTT Data Corp. (Japan) | | | 1,345 | | | | 14,839 | |
Obic Co. Ltd. (Japan) | | | 140 | | | | 14,108 | |
Otsuka Corp. (Japan) | | | 220 | | | | 8,211 | |
Perspecta, Inc. | | | 800 | | | | 16,176 | |
Presidio, Inc. | | | 9,800 | | | | 145,040 | |
Science Applications International Corp. | | | 1,400 | | | | 107,730 | |
Sykes Enterprises, Inc.* | | | 2,200 | | | | 62,216 | |
Virtusa Corp.* | | | 2,600 | | | | 138,970 | |
Visa, Inc. (Class A Stock)(a) | | | 3,200 | | | | 499,808 | |
Wirecard AG (Germany) | | | 255 | | | | 32,202 | |
Wix.com Ltd. (Israel)* | | | 94 | | | | 11,358 | |
| | | | | | | | |
| | | | | | | 15,610,968 | |
| | |
Leisure Products 0.0% | | | | | | | | |
Bandai Namco Holdings, Inc. (Japan) | | | 400 | | | | 18,754 | |
Johnson Outdoors, Inc. (Class A Stock) | | | 1,000 | | | | 71,360 | |
Malibu Boats, Inc. (Class A Stock)* | | | 1,500 | | | | 59,370 | |
MasterCraft Boat Holdings, Inc.* | | | 1,100 | | | | 24,827 | |
Sankyo Co. Ltd. (Japan) | | | 50 | | | | 1,907 | |
Sega Sammy Holdings, Inc. (Japan) | | | 400 | | | | 4,712 | |
Shimano, Inc. (Japan) | | | 150 | | | | 24,403 | |
Yamaha Corp. (Japan) | | | 300 | | | | 14,991 | |
| | | | | | | | |
| | | | | | | 220,324 | |
| | |
Life Sciences Tools & Services 1.0% | | | | | | | | |
Charles River Laboratories International, Inc.* | | | 4,600 | | | | 668,150 | |
Eurofins Scientific SE (Luxembourg) | | | 27 | | | | 11,197 | |
IQVIA Holdings, Inc.* | | | 13,600 | | | | 1,956,360 | |
Lonza Group AG (Switzerland)* | | | 165 | | | | 51,365 | |
Medpace Holdings, Inc.* | | | 3,900 | | | | 229,983 | |
PRA Health Sciences, Inc.* | | | 11,000 | | | | 1,213,190 | |
QIAGEN NV* | | | 493 | | | | 20,016 | |
Sartorius Stedim Biotech (France) | | | 60 | | | | 7,613 | |
Syneos Health, Inc.* | | | 3,200 | | | | 165,632 | |
Thermo Fisher Scientific, Inc. | | | 7,600 | | | | 2,080,272 | |
| | | | | | | | |
| | | | | | | 6,403,778 | |
See Notes to Financial Statements.
Schedule of Investments(unaudited) (continued)
as of March 31, 2019
| | | | | | | | |
| Description | | Shares | | | Value | |
COMMON STOCKS (Continued) | | | | | | | | |
| |
Machinery 0.7% | | | | | |
Alfa Laval AB (Sweden) | | | 631 | | | $ | 14,510 | |
Alstom SA (France) | | | 373 | | | | 16,198 | |
Altra Industrial Motion Corp. | | | 1,800 | | | | 55,890 | |
Amada Holdings Co. Ltd. (Japan) | | | 700 | | | | 6,929 | |
ANDRITZ AG (Austria) | | | 159 | | | | 6,828 | |
Atlas Copco AB (Sweden) (Class A Stock) | | | 1,482 | | | | 39,857 | |
Atlas Copco AB (Sweden) (Class B Stock) | | | 831 | | | | 20,606 | |
Caterpillar, Inc. | | | 2,500 | | | | 338,725 | |
CNH Industrial NV (United Kingdom) | | | 2,168 | | | | 22,081 | |
Commercial Vehicle Group, Inc.* | | | 7,000 | | | | 53,690 | |
Cummins, Inc. | | | 4,700 | | | | 741,989 | |
Daifuku Co. Ltd. (Japan) | | | 220 | | | | 11,483 | |
Epiroc AB (Sweden) (Class A Stock)* | | | 1,556 | | | | 15,707 | |
Epiroc AB (Sweden) (Class B Stock)* | | | 789 | | | | 7,556 | |
FANUC Corp. (Japan) | | | 430 | | | | 73,393 | |
Federal Signal Corp. | | | 3,400 | | | | 88,366 | |
GEA Group AG (Germany) | | | 369 | | | | 9,684 | |
Global Brass & Copper Holdings, Inc. | | | 5,700 | | | | 196,308 | |
Harsco Corp.* | | | 3,200 | | | | 64,512 | |
Hillenbrand, Inc. | | | 900 | | | | 37,377 | |
Hino Motors Ltd. (Japan) | | | 500 | | | | 4,209 | |
Hitachi Construction Machinery Co. Ltd. (Japan) | | | 300 | | | | 7,976 | |
Hoshizaki Corp. (Japan) | | | 120 | | | | 7,440 | |
IHI Corp. (Japan) | | | 320 | | | | 7,693 | |
JTEKT Corp. (Japan) | | | 400 | | | | 4,924 | |
Kawasaki Heavy Industries Ltd. (Japan) | | | 360 | | | | 8,879 | |
Kennametal, Inc. | | | 1,800 | | | | 66,150 | |
KION Group AG (Germany) | | | 175 | | | | 9,165 | |
Komatsu Ltd. (Japan) | | | 2,100 | | | | 48,850 | |
Kone OYJ (Finland) (Class B Stock) | | | 748 | | | | 37,750 | |
Kubota Corp. (Japan) | | | 2,200 | | | | 31,888 | |
Kurita Water Industries Ltd. (Japan) | | | 200 | | | | 5,108 | |
LB Foster Co. (Class A Stock)* | | | 2,000 | | | | 37,640 | |
Makita Corp. (Japan) | | | 450 | | | | 15,687 | |
Meritor, Inc.* | | | 9,500 | | | | 193,325 | |
Metso OYJ (Finland) | | | 227 | | | | 7,819 | |
Milacron Holdings Corp.* | | | 9,100 | | | | 103,012 | |
MINEBEA MITSUMI, Inc. (Japan) | | | 800 | | | | 12,040 | |
MISUMI Group, Inc. (Japan) | | | 600 | | | | 14,956 | |
Mitsubishi Heavy Industries Ltd. (Japan) | | | 700 | | | | 29,070 | |
Mueller Industries, Inc. | | | 6,100 | | | | 191,174 | |
Nabtesco Corp. (Japan) | | | 300 | | | | 8,746 | |
Navistar International Corp.* | | | 3,400 | | | | 109,820 | |
NGK Insulators Ltd. (Japan) | | | 600 | | | | 8,725 | |
See Notes to Financial Statements.
| | | | | | | | |
| Description | | Shares | | | Value | |
COMMON STOCKS (Continued) | | | | | | | | |
| |
Machinery (cont’d.) | | | | | |
NSK Ltd. (Japan) | | | 800 | | | $ | 7,492 | |
Oshkosh Corp. | | | 5,900 | | | | 443,267 | |
PACCAR, Inc. | | | 12,500 | | | | 851,750 | |
Park-Ohio Holdings Corp. | | | 1,300 | | | | 42,094 | |
Pentair PLC | | | 6,400 | | | | 284,864 | |
Rexnord Corp.* | | | 900 | | | | 22,626 | |
Sandvik AB (Sweden) | | | 2,471 | | | | 40,259 | |
Schindler Holding AG (Switzerland) | | | 49 | | | | 10,159 | |
Schindler Holding AG (Switzerland), (Part. Cert.) | | | 96 | | | | 19,945 | |
SKF AB (Sweden) (Class B Stock) | | | 905 | | | | 15,050 | |
SMC Corp. (Japan) | | | 120 | | | | 45,130 | |
SPX FLOW, Inc.* | | | 200 | | | | 6,380 | |
Sumitomo Heavy Industries Ltd. (Japan) | | | 240 | | | | 7,778 | |
THK Co. Ltd. (Japan) | | | 250 | | | | 6,193 | |
TriMas Corp.* | | | 800 | | | | 24,184 | |
Volvo AB (Sweden) (Class B Stock) | | | 3,407 | | | | 52,863 | |
Wabash National Corp. | | | 4,600 | | | | 62,330 | |
Wartsila OYJ Abp (Finland) | | | 945 | | | | 15,266 | |
Weir Group PLC (The) (United Kingdom) | | | 598 | | | | 12,146 | |
Yangzijiang Shipbuilding Holdings Ltd. (China) | | | 4,800 | | | | 5,325 | |
| | | | | | | | |
| | | | | | | 4,768,836 | |
| |
Marine 0.0% | | | | | |
AP Moller - Maersk A/S (Denmark) (Class A Stock) | | | 8 | | | | 9,683 | |
AP Moller - Maersk A/S (Denmark) (Class B Stock) | | | 14 | | | | 17,769 | |
Kuehne + Nagel International AG (Switzerland) | | | 125 | | | | 17,147 | |
Mitsui OSK Lines Ltd. (Japan) | | | 220 | | | | 4,731 | |
Nippon Yusen KK (Japan) | | | 290 | | | | 4,248 | |
| | | | | | | | |
| | | | | | | 53,578 | |
| |
Media 0.4% | | | | | |
Axel Springer SE (Germany) | | | 94 | | | | 4,860 | |
Comcast Corp. (Class A Stock) | | | 49,400 | | | | 1,975,012 | |
CyberAgent, Inc. (Japan) | | | 250 | | | | 10,184 | |
Dentsu, Inc. (Japan) | | | 500 | | | | 21,126 | |
Eutelsat Communications SA (France) | | | 377 | | | | 6,604 | |
Hakuhodo DY Holdings, Inc. (Japan) | | | 560 | | | | 9,004 | |
Informa PLC (United Kingdom) | | | 2,884 | | | | 27,973 | |
ITV PLC (United Kingdom) | | | 7,715 | | | | 12,790 | |
JCDecaux SA (France) | | | 176 | | | | 5,372 | |
Liberty Latin America Ltd. (Chile) (Class A Stock)* | | | 700 | | | | 13,538 | |
Liberty Latin America Ltd. (Chile) (Class C Stock)* | | | 1,800 | | | | 35,010 | |
Nexstar Media Group, Inc. (Class A Stock) | | | 500 | | | | 54,185 | |
See Notes to Financial Statements.
Schedule of Investments(unaudited) (continued)
as of March 31, 2019
| | | | | | | | |
| Description | | Shares | | | Value | |
COMMON STOCKS (Continued) | | | | | | | | |
| |
Media (cont’d.) | | | | | |
Pearson PLC (United Kingdom) | | | 1,784 | | | $ | 19,431 | |
ProSiebenSat.1 Media SE (Germany) | | | 540 | | | | 7,721 | |
Publicis Groupe SA (France) | | | 476 | | | | 25,513 | |
RTL Group SA (Luxembourg) | | | 99 | | | | 5,411 | |
Schibsted ASA (Norway) (Class B Stock) | | | 259 | | | | 9,285 | |
SES SA (Luxembourg) | | | 847 | | | | 13,187 | |
Singapore Press Holdings Ltd. (Singapore) | | | 4,100 | | | | 7,299 | |
TEGNA, Inc. | | | 29,800 | | | | 420,180 | |
Telenet Group Holding NV (Belgium) | | | 110 | | | | 5,294 | |
WideOpenWest, Inc.* | | | 10,600 | | | | 96,460 | |
WPP PLC (United Kingdom) | | | 2,834 | | | | 29,975 | |
| | | | | | | | |
| | | | | | | 2,815,414 | |
| |
Metals & Mining 0.4% | | | | | |
Alcoa Corp.* | | | 200 | | | | 5,632 | |
Alumina Ltd. (Australia) | | | 5,441 | | | | 9,369 | |
Anglo American PLC (South Africa) | | | 2,328 | | | | 62,446 | |
Antofagasta PLC (Chile) | | | 866 | | | | 10,917 | |
ArcelorMittal (Luxembourg) | | | 1,466 | | | | 29,843 | |
BHP Group Ltd. (Australia) | | | 6,503 | | | | 177,771 | |
BHP Group PLC (Australia) | | | 4,663 | | | | 112,381 | |
BlueScope Steel Ltd. (Australia) | | | 1,295 | | | | 12,864 | |
Boliden AB (Sweden) | | | 582 | | | | 16,597 | |
Fortescue Metals Group Ltd. (Australia) | | | 3,315 | | | | 16,771 | |
Fresnillo PLC (Mexico) | | | 581 | | | | 6,585 | |
Glencore PLC (Switzerland)* | | | 25,089 | | | | 104,159 | |
Hitachi Metals Ltd. (Japan) | | | 600 | | | | 6,974 | |
JFE Holdings, Inc. (Japan) | | | 1,100 | | | | 18,672 | |
Kobe Steel Ltd. (Japan) | | | 610 | | | | 4,580 | |
Maruichi Steel Tube Ltd. (Japan) | | | 100 | | | | 2,912 | |
Materion Corp. | | | 1,300 | | | | 74,178 | |
Mitsubishi Materials Corp. (Japan) | | | 210 | | | | 5,535 | |
Newcrest Mining Ltd. (Australia) | | | 1,739 | | | | 31,413 | |
Nippon Steel Corp. (Japan) | | | 1,817 | | | | 32,092 | |
Norsk Hydro ASA (Norway) | | | 2,864 | | | | 11,623 | |
Olympic Steel, Inc. | | | 1,700 | | | | 26,979 | |
Rio Tinto Ltd. (Australia) | | | 819 | | | | 56,995 | |
Rio Tinto PLC (Australia) | | | 2,564 | | | | 149,404 | |
Ryerson Holding Corp.* | | | 3,200 | | | | 27,392 | |
South32 Ltd. (Australia) | | | 11,699 | | | | 30,895 | |
Steel Dynamics, Inc. | | | 40,200 | | | | 1,417,854 | |
Sumitomo Metal Mining Co. Ltd. (Japan) | | | 500 | | | | 14,761 | |
SunCoke Energy, Inc.* | | | 10,500 | | | | 89,145 | |
See Notes to Financial Statements.
| | | | | | | | |
| Description | | Shares | | | Value | |
COMMON STOCKS (Continued) | | | | | | | | |
| | |
Metals & Mining (cont’d.) | | | | | | | | |
thyssenkrupp AG (Germany) | | | 928 | | | $ | 12,795 | |
voestalpine AG (Austria) | | | 244 | | | | 7,443 | |
| | | | | | | | |
| | | | | | | 2,586,977 | |
| | |
Mortgage Real Estate Investment Trusts (REITs) 0.1% | | | | | | | | |
AG Mortgage Investment Trust, Inc. | | | 4,000 | | | | 67,360 | |
Exantas Capital Corp. | | | 5,450 | | | | 57,934 | |
Great Ajax Corp. | | | 1,000 | | | | 13,740 | |
Ladder Capital Corp. | | | 12,511 | | | | 212,937 | |
Two Harbors Investment Corp. | | | 23,900 | | | | 323,367 | |
Western Asset Mortgage Capital Corp. | | | 17,200 | | | | 175,956 | |
| | | | | | | | |
| | | | | | | 851,294 | |
| | |
Multiline Retail 0.3% | | | | | | | | |
Big Lots, Inc. | | | 6,100 | | | | 231,922 | |
Harvey Norman Holdings Ltd. (Australia) | | | 1,203 | | | | 3,436 | |
Isetan Mitsukoshi Holdings Ltd. (Japan) | | | 700 | | | | 7,075 | |
J Front Retailing Co. Ltd. (Japan) | | | 450 | | | | 5,358 | |
Kohl’s Corp. | | | 7,100 | | | | 488,267 | |
Macy’s, Inc. | | | 44,900 | | | | 1,078,947 | |
Marks & Spencer Group PLC (United Kingdom) | | | 3,589 | | | | 13,024 | |
Marui Group Co. Ltd. (Japan) | | | 400 | | | | 8,085 | |
Next PLC (United Kingdom) | | | 316 | | | | 22,969 | |
Pan Pacific International Holdings Corp. (Japan) | | | 300 | | | | 19,915 | |
Ryohin Keikaku Co. Ltd. (Japan) | | | 50 | | | | 12,667 | |
Takashimaya Co. Ltd. (Japan) | | | 300 | | | | 3,997 | |
Wesfarmers Ltd. (Australia) | | | 2,556 | | | | 62,915 | |
| | | | | | | | |
| | | | | | | 1,958,577 | |
| | |
Multi-Utilities 0.5% | | | | | | | | |
AGL Energy Ltd. (Australia) | | | 1,436 | | | | 22,189 | |
CenterPoint Energy, Inc. | | | 11,100 | | | | 340,770 | |
Centrica PLC (United Kingdom) | | | 13,213 | | | | 19,662 | |
Dominion Energy, Inc. | | | 24,300 | | | | 1,862,838 | |
E.ON SE (Germany) | | | 4,859 | | | | 54,036 | |
Engie SA (France) | | | 4,104 | | | | 61,189 | |
Innogy SE (Germany), 144A | | | 330 | | | | 15,252 | |
MDU Resources Group, Inc. | | | 23,200 | | | | 599,256 | |
National Grid PLC (United Kingdom) | | | 7,503 | | | | 83,178 | |
RWE AG (Germany) | | | 1,144 | | | | 30,684 | |
See Notes to Financial Statements.
Schedule of Investments(unaudited) (continued)
as of March 31, 2019
| | | | | | | | |
| Description | | Shares | | | Value | |
COMMON STOCKS (Continued) | | | | | | | | |
| | |
Multi-Utilities (cont’d.) | | | | | | | | |
Suez (France) | | | 794 | | | $ | 10,521 | |
Veolia Environnement SA (France) | | | 1,233 | | | | 27,590 | |
| | | | | | | | |
| | | | | | | 3,127,165 | |
| | |
Oil, Gas & Consumable Fuels 3.2% | | | | | | | | |
Adams Resources & Energy, Inc. | | | 300 | | | | 11,718 | |
Aker BP ASA (Norway) | | | 219 | | | | 7,829 | |
Arch Coal, Inc. (Class A Stock) | | | 1,200 | | | | 109,524 | |
BP PLC (United Kingdom) | | | 45,132 | | | | 328,625 | |
Caltex Australia Ltd. (Australia) | | | 578 | | | | 10,762 | |
Carrizo Oil & Gas, Inc.* | | | 1,500 | | | | 18,705 | |
Chevron Corp. | | | 39,500 | | | | 4,865,610 | |
ConocoPhillips | | | 4,300 | | | | 286,982 | |
CONSOL Energy, Inc.* | | | 5,400 | | | | 184,788 | |
CVR Energy, Inc. | | | 2,200 | | | | 90,640 | |
Delek US Holdings, Inc. | | | 1,300 | | | | 47,346 | |
Earthstone Energy, Inc. (Class A Stock)* | | | 8,800 | | | | 62,304 | |
Enagas SA (Spain) | | | 479 | | | | 13,946 | |
Eni SpA (Italy) | | | 5,616 | | | | 99,411 | |
Equinor ASA (Norway) | | | 2,636 | | | | 57,798 | |
Evolution Petroleum Corp. | | | 3,100 | | | | 20,925 | |
Exxon Mobil Corp. | | | 71,254 | | | | 5,757,323 | |
Galp Energia SGPS SA (Portugal) | | | 1,079 | | | | 17,310 | |
Idemitsu Kosan Co. Ltd. (Japan) | | | 464 | | | | 15,470 | |
Inpex Corp. (Japan) | | | 2,281 | | | | 21,600 | |
JXTG Holdings, Inc. (Japan) | | | 7,085 | | | | 32,311 | |
Kinder Morgan, Inc. | | | 113,100 | | | | 2,263,131 | |
Koninklijke Vopak NV (Netherlands) | | | 181 | | | | 8,669 | |
Lundin Petroleum AB (Sweden) | | | 399 | | | | 13,545 | |
Marathon Petroleum Corp. | | | 32,300 | | | | 1,933,155 | |
Neste OYJ (Finland) | | | 294 | | | | 31,373 | |
Oil Search Ltd. (Australia) | | | 2,929 | | | | 16,270 | |
OMV AG (Austria) | | | 354 | | | | 19,225 | |
Origin Energy Ltd. (Australia) | | | 3,746 | | | | 19,075 | |
Phillips 66 | | | 21,700 | | | | 2,065,189 | |
Repsol SA (Spain) | | | 3,095 | | | | 53,039 | |
Royal Dutch Shell PLC (Netherlands) (Class A Stock) | | | 9,981 | | | | 313,827 | |
Royal Dutch Shell PLC (Netherlands) (Class B Stock) | | | 8,309 | | | | 262,879 | |
Santos Ltd. (Australia) | | | 3,771 | | | | 18,217 | |
Snam SpA (Italy) | | | 4,905 | | | | 25,225 | |
Talos Energy, Inc.* | | | 600 | | | | 15,936 | |
TOTAL SA (France) | | | 5,357 | | | | 297,908 | |
Valero Energy Corp. | | | 14,300 | | | | 1,213,069 | |
Washington H Soul Pattinson & Co. Ltd. (Australia) | | | 233 | | | | 4,357 | |
See Notes to Financial Statements.
| | | | | | | | |
| Description | | Shares | | | Value | |
COMMON STOCKS (Continued) | | | | | | | | |
| | |
Oil, Gas & Consumable Fuels (cont’d.) | | | | | | | | |
Woodside Petroleum Ltd. (Australia) | | | 2,119 | | | $ | 52,001 | |
World Fuel Services Corp. | | | 8,100 | | | | 234,009 | |
| | | | | | | | |
| | | | | | | 20,921,026 | |
| | |
Paper & Forest Products 0.0% | | | | | | | | |
Mondi PLC (United Kingdom) | | | 822 | | | | 18,204 | |
Oji Holdings Corp. (Japan) | | | 1,900 | | | | 11,801 | |
Stora Enso OYJ (Finland) (Class R Stock) | | | 1,173 | | | | 14,361 | |
UPM-Kymmene OYJ (Finland) | | | 1,196 | | | | 34,963 | |
| | | | | | | | |
| | | | | | | 79,329 | |
| | |
Personal Products 0.2% | | | | | | | | |
Beiersdorf AG (Germany) | | | 237 | | | | 24,662 | |
Edgewell Personal Care Co.* | | | 3,300 | | | | 144,837 | |
Kao Corp. (Japan) | | | 1,100 | | | | 86,806 | |
Kobayashi Pharmaceutical Co. Ltd. (Japan) | | | 100 | | | | 8,447 | |
Kose Corp. (Japan) | | | 80 | | | | 14,710 | |
L’Oreal SA (France) | | | 557 | | | | 150,062 | |
Pola Orbis Holdings, Inc. (Japan) | | | 200 | | | | 6,382 | |
Shiseido Co. Ltd. (Japan) | | | 800 | | | | 57,773 | |
Unilever NV (United Kingdom), CVA | | | 3,407 | | | | 198,312 | |
Unilever PLC (United Kingdom) | | | 2,444 | | | | 140,185 | |
USANA Health Sciences, Inc.* | | | 1,700 | | | | 142,579 | |
| | | | | | | | |
| | | | | | | 974,755 | |
| | |
Pharmaceuticals 2.5% | | | | | | | | |
Allergan PLC | | | 9,600 | | | | 1,405,536 | |
Astellas Pharma, Inc. (Japan) | | | 4,200 | | | | 63,062 | |
AstraZeneca PLC (United Kingdom) | | | 2,811 | | | | 223,957 | |
Bayer AG (Germany) | | | 2,059 | | | | 133,229 | |
Bristol-Myers Squibb Co. | | | 19,300 | | | | 920,803 | |
Chugai Pharmaceutical Co. Ltd. (Japan) | | | 500 | | | | 34,608 | |
Daiichi Sankyo Co. Ltd. (Japan) | | | 1,300 | | | | 61,405 | |
Eisai Co. Ltd. (Japan) | | | 550 | | | | 30,939 | |
GlaxoSmithKline PLC (United Kingdom) | | | 11,006 | | | | 228,744 | |
H. Lundbeck A/S (Denmark) | | | 170 | | | | 7,357 | |
Hisamitsu Pharmaceutical Co., Inc. (Japan) | | | 100 | | | | 4,601 | |
Horizon Pharma PLC* | | | 11,300 | | | | 298,659 | |
Ipsen SA (France) | | | 80 | | | | 10,979 | |
Johnson & Johnson | | | 42,600 | | | | 5,955,054 | |
Kyowa Hakko Kirin Co. Ltd. (Japan) | | | 600 | | | | 13,106 | |
Mallinckrodt PLC* | | | 8,900 | | | | 193,486 | |
See Notes to Financial Statements.
Schedule of Investments(unaudited) (continued)
as of March 31, 2019
| | | | | | | | |
| Description | | Shares | | | Value | |
COMMON STOCKS (Continued) | | | | | | | | |
| | |
Pharmaceuticals (cont’d.) | | | | | | | | |
Merck & Co., Inc. | | | 55,500 | | | $ | 4,615,935 | |
Merck KGaA (Germany) | | | 285 | | | | 32,540 | |
Mitsubishi Tanabe Pharma Corp. (Japan) | | | 500 | | | | 6,687 | |
Novartis AG (Switzerland) | | | 4,810 | | | | 463,416 | |
Novo Nordisk A/S (Denmark) (Class B Stock) | | | 4,011 | | | | 210,552 | |
Ono Pharmaceutical Co. Ltd. (Japan) | | | 900 | | | | 17,652 | |
Orion OYJ (Finland) (Class B Stock) | | | 214 | | | | 8,027 | |
Otsuka Holdings Co. Ltd. (Japan) | | | 880 | | | | 34,583 | |
Pfizer, Inc. | | | 8,919 | | | | 378,790 | |
Prestige Consumer Healthcare, Inc.* | | | 4,300 | | | | 128,613 | |
Recordati SpA (Italy) | | | 231 | | | | 9,002 | |
Roche Holding AG (Switzerland) | | | 1,559 | | | | 430,714 | |
Sanofi (France) | | | 2,500 | | | | 221,164 | |
Santen Pharmaceutical Co. Ltd. (Japan) | | | 850 | | | | 12,673 | |
Shionogi & Co. Ltd. (Japan) | | | 600 | | | | 37,224 | |
Sumitomo Dainippon Pharma Co. Ltd. (Japan) | | | 400 | | | | 9,908 | |
Taisho Pharmaceutical Holdings Co. Ltd. (Japan) | | | 60 | | | | 5,721 | |
Takeda Pharmaceutical Co. Ltd. (Japan) | | | 3,267 | | | | 132,831 | |
Teva Pharmaceutical Industries Ltd. (Israel), ADR* | | | 2,156 | | | | 33,806 | |
UCB SA (Belgium) | | | 293 | | | | 25,177 | |
Vifor Pharma AG (Switzerland) | | | 104 | | | | 14,067 | |
| | | | | | | | |
| | | | | | | 16,414,607 | |
| | |
Professional Services 0.2% | | | | | | | | |
Adecco Group AG (Switzerland) | | | 367 | | | | 19,588 | |
ASGN, Inc.* | | | 500 | | | | 31,745 | |
Bureau Veritas SA (France) | | | 573 | | | | 13,461 | |
Experian PLC (United Kingdom) | | | 2,009 | | | | 54,459 | |
Heidrick & Struggles International, Inc. | | | 1,500 | | | | 57,495 | |
Insperity, Inc. | | | 2,500 | | | | 309,150 | |
Intertek Group PLC (United Kingdom) | | | 361 | | | | 22,864 | |
Kforce, Inc. | | | 1,200 | | | | 42,144 | |
Korn Ferry | | | 4,600 | | | | 205,988 | |
Persol Holdings Co. Ltd. (Japan) | | | 400 | | | | 6,488 | |
Randstad NV (Netherlands) | | | 272 | | | | 13,291 | |
Recruit Holdings Co. Ltd. (Japan) | | | 2,500 | | | | 71,496 | |
RELX PLC (United Kingdom) | | | 4,347 | | | | 93,005 | |
Robert Half International, Inc. | | | 3,600 | | | | 234,576 | |
SEEK Ltd. (Australia) | | | 710 | | | | 8,834 | |
SGS SA (Switzerland) | | | 12 | | | | 29,876 | |
Teleperformance (France) | | | 123 | | | | 22,145 | |
See Notes to Financial Statements.
| | | | | | | | |
| Description | | Shares | | | Value | |
COMMON STOCKS (Continued) | | | | | | | | |
| | |
Professional Services (cont’d.) | | | | | | | | |
TriNet Group, Inc.* | | | 1,100 | | | $ | 65,714 | |
Wolters Kluwer NV (Netherlands) | | | 621 | | | | 42,336 | |
| | | | | | | | |
| | | | | | | 1,344,655 | |
| | |
Real Estate Management & Development 0.5% | | | | | | | | |
Aeon Mall Co. Ltd. (Japan) | | | 220 | | | | 3,616 | |
Aroundtown SA (Germany) | | | 1,671 | | | | 13,807 | |
Azrieli Group Ltd. (Israel) | | | 117 | | | | 6,930 | |
CapitaLand Ltd. (Singapore) | | | 5,600 | | | | 15,107 | |
CBRE Group, Inc. (Class A Stock)* | | | 42,100 | | | | 2,081,845 | |
City Developments Ltd. (Singapore) | | | 800 | | | | 5,351 | |
CK Asset Holdings Ltd. (Hong Kong) | | | 5,857 | | | | 52,090 | |
Daito Trust Construction Co. Ltd. (Japan) | | | 150 | | | | 20,887 | |
Daiwa House Industry Co. Ltd. (Japan) | | | 1,300 | | | | 41,316 | |
Deutsche Wohnen SE (Germany) | | | 798 | | | | 38,758 | |
Hang Lung Group Ltd. (Hong Kong) | | | 2,000 | | | | 6,435 | |
Hang Lung Properties Ltd. (Hong Kong) | | | 4,000 | | | | 9,780 | |
Henderson Land Development Co. Ltd. (Hong Kong) | | | 3,029 | | | | 19,304 | |
HFF, Inc. (Class A Stock) | | | 3,800 | | | | 181,450 | |
Hongkong Land Holdings Ltd. (Hong Kong) | | | 2,500 | | | | 17,800 | |
Hulic Co. Ltd. (Japan) | | | 700 | | | | 6,862 | |
Hysan Development Co. Ltd. (Hong Kong) | | | 1,400 | | | | 7,511 | |
Kerry Properties Ltd. (Hong Kong) | | | 1,500 | | | | 6,730 | |
Lendlease Group (Australia) | | | 1,350 | | | | 11,867 | |
Marcus & Millichap, Inc.* | | | 1,800 | | | | 73,314 | |
Mitsubishi Estate Co. Ltd. (Japan) | | | 2,600 | | | | 47,136 | |
Mitsui Fudosan Co. Ltd. (Japan) | | | 2,000 | | | | 50,396 | |
New World Development Co. Ltd. (Hong Kong) | | | 13,800 | | | | 22,910 | |
Newmark Group, Inc. (Class A Stock) | | | 14,900 | | | | 124,266 | |
Nomura Real Estate Holdings, Inc. (Japan) | | | 300 | | | | 5,761 | |
RMR Group, Inc. (The) (Class A Stock) | | | 1,200 | | | | 73,176 | |
Sino Land Co. Ltd. (Hong Kong) | | | 7,300 | | | | 14,152 | |
Sumitomo Realty & Development Co. Ltd. (Japan) | | | 790 | | | | 32,736 | |
Sun Hung Kai Properties Ltd. (Hong Kong) | | | 3,400 | | | | 58,424 | |
Swire Pacific Ltd. (Hong Kong) (Class A Stock) | | | 1,000 | | | | 12,908 | |
Swire Properties Ltd. (Hong Kong) | | | 2,600 | | | | 11,182 | |
Swiss Prime Site AG (Switzerland)* | | | 177 | | | | 15,527 | |
Tokyu Fudosan Holdings Corp. (Japan) | | | 1,300 | | | | 7,779 | |
UOL Group Ltd. (Singapore) | | | 1,054 | | | | 5,416 | |
Vonovia SE (Germany) | | | 1,087 | | | | 56,449 | |
Wharf Holdings Ltd. (The) (Hong Kong) | | | 3,400 | | | | 10,282 | |
See Notes to Financial Statements.
Schedule of Investments(unaudited) (continued)
as of March 31, 2019
| | | | | | | | |
| Description | | Shares | | | Value | |
COMMON STOCKS (Continued) | | | | | | | | |
| | |
Real Estate Management & Development (cont’d.) | | | | | | | | |
Wharf Real Estate Investment Co. Ltd. (Hong Kong) | | | 2,400 | | | $ | 17,900 | |
Wheelock & Co. Ltd. (Hong Kong) | | | 1,400 | | | | 10,268 | |
| | | | | | | | |
| | | | | | | 3,197,428 | |
| | |
Road & Rail 0.9% | | | | | | | | |
Aurizon Holdings Ltd. (Australia) | | | 4,640 | | | | 14,992 | |
Avis Budget Group, Inc.* | | | 1,300 | | | | 45,318 | |
Central Japan Railway Co. (Japan) | | | 310 | | | | 71,992 | |
ComfortDelGro Corp. Ltd. (Singapore) | | | 4,300 | | | | 8,166 | |
Covenant Transportation Group, Inc. (Class A Stock)* | | | 4,100 | | | | 77,818 | |
CSX Corp. | | | 34,800 | | | | 2,603,736 | |
DSV A/S (Denmark) | | | 423 | | | | 35,052 | |
East Japan Railway Co. (Japan) | | | 670 | | | | 64,633 | |
Hankyu Hanshin Holdings, Inc. (Japan) | | | 550 | | | | 20,613 | |
Keikyu Corp. (Japan) | | | 500 | | | | 8,482 | |
Keio Corp. (Japan) | | | 220 | | | | 14,208 | |
Keisei Electric Railway Co. Ltd. (Japan) | | | 300 | | | | 10,895 | |
Kintetsu Group Holdings Co. Ltd. (Japan) | | | 410 | | | | 19,094 | |
Kyushu Railway Co. (Japan) | | | 400 | | | | 13,155 | |
MTR Corp. Ltd. (Hong Kong) | | | 3,500 | | | | 21,681 | |
Nagoya Railroad Co. Ltd. (Japan) | | | 400 | | | | 11,069 | |
Nippon Express Co. Ltd. (Japan) | | | 160 | | | | 8,910 | |
Norfolk Southern Corp. | | | 15,000 | | | | 2,803,350 | |
Odakyu Electric Railway Co. Ltd. (Japan) | | | 650 | | | | 15,748 | |
Seibu Holdings, Inc. (Japan) | | | 500 | | | | 8,752 | |
Tobu Railway Co. Ltd. (Japan) | | | 380 | | | | 10,969 | |
Tokyu Corp. (Japan) | | | 1,150 | | | | 20,085 | |
USA Truck, Inc.* | | | 1,500 | | | | 21,660 | |
West Japan Railway Co. (Japan) | | | 400 | | | | 30,115 | |
| | | | | | | | |
| | | | | | | 5,960,493 | |
| | |
Semiconductors & Semiconductor Equipment 1.8% | | | | | | | | |
Amkor Technology, Inc.* | | | 11,100 | | | | 94,794 | |
ASM Pacific Technology Ltd. (Hong Kong) | | | 600 | | | | 6,734 | |
ASML Holding NV (Netherlands) | | | 905 | | | | 170,443 | |
Broadcom, Inc. | | | 1,700 | | | | 511,207 | |
Cabot Microelectronics Corp. | | | 900 | | | | 100,764 | |
Cirrus Logic, Inc.* | | | 2,700 | | | | 113,589 | |
Diodes, Inc.* | | | 5,300 | | | | 183,910 | |
Disco Corp. (Japan) | | | 60 | | | | 8,551 | |
Infineon Technologies AG (Germany) | | | 2,522 | | | | 50,205 | |
Intel Corp. | | | 99,300 | | | | 5,332,410 | |
NXP Semiconductors NV (Netherlands) | | | 5,560 | | | | 491,449 | |
See Notes to Financial Statements.
| | | | | | | | |
| Description | | Shares | | | Value | |
COMMON STOCKS (Continued) | | | | | | | | |
| | |
Semiconductors & Semiconductor Equipment (cont’d.) | | | | | | | | |
Qorvo, Inc.* | | | 14,000 | | | $ | 1,004,220 | |
Renesas Electronics Corp. (Japan)* | | | 1,700 | | | | 7,863 | |
Rohm Co. Ltd. (Japan) | | | 200 | | | | 12,478 | |
SMART Global Holdings, Inc.* | | | 5,500 | | | | 105,600 | |
STMicroelectronics NV (Switzerland) | | | 1,578 | | | | 23,438 | |
SUMCO Corp. (Japan) | | | 500 | | | | 5,567 | |
Synaptics, Inc.* | | | 1,600 | | | | 63,600 | |
Tokyo Electron Ltd. (Japan) | | | 345 | | | | 49,897 | |
Versum Materials, Inc. | | | 36,400 | | | | 1,831,284 | |
Xilinx, Inc. | | | 10,000 | | | | 1,267,900 | |
| | | | | | | | |
| | | | | | | 11,435,903 | |
| | |
Software 4.0% | | | | | | | | |
Adobe, Inc.* | | | 8,500 | | | | 2,265,165 | |
Altair Engineering, Inc. (Class A Stock)* | | | 2,600 | | | | 95,706 | |
Check Point Software Technologies Ltd. (Israel)* | | | 270 | | | | 34,152 | |
Cision Ltd.* | | | 13,100 | | | | 180,387 | |
CommVault Systems, Inc.* | | | 3,300 | | | | 213,642 | |
Dassault Systemes SE (France) | | | 292 | | | | 43,619 | |
Envestnet, Inc.* | | | 3,200 | | | | 209,248 | |
Intuit, Inc. | | | 8,100 | | | | 2,117,421 | |
j2 Global, Inc. | | | 2,800 | | | | 242,480 | |
Micro Focus International PLC (United Kingdom) | | | 994 | | | | 25,902 | |
Microsoft Corp. | | | 116,213 | | | | 13,706,161 | |
Monotype Imaging Holdings, Inc. | | | 6,300 | | | | 125,307 | |
Nice Ltd. (Israel)* | | | 136 | | | | 16,116 | |
Nuance Communications, Inc.* | | | 31,200 | | | | 528,216 | |
Oracle Corp. | | | 70,700 | | | | 3,797,297 | |
Oracle Corp. (Japan) | | | 90 | | | | 6,040 | |
Paylocity Holding Corp.* | | | 2,300 | | | | 205,137 | |
Progress Software Corp. | | | 5,500 | | | | 244,035 | |
QAD, Inc. (Class A Stock) | | | 400 | | | | 17,228 | |
Sage Group PLC (The) (United Kingdom) | | | 2,328 | | | | 21,276 | |
SAP SE (Germany) | | | 2,181 | | | | 252,493 | |
SPS Commerce, Inc.* | | | 2,500 | | | | 265,150 | |
SS&C Technologies Holdings, Inc. | | | 4,900 | | | | 312,081 | |
Synopsys, Inc.* | | | 7,400 | | | | 852,110 | |
Temenos AG (Switzerland)* | | | 129 | | | | 19,089 | |
Trend Micro, Inc. (Japan) | | | 230 | | | | 11,184 | |
Verint Systems, Inc.* | | | 4,500 | | | | 269,370 | |
| | | | | | | | |
| | | | | | | 26,076,012 | |
See Notes to Financial Statements.
Schedule of Investments(unaudited) (continued)
as of March 31, 2019
| | | | | | | | |
| Description | | Shares | | | Value | |
COMMON STOCKS (Continued) | | | | | | | | |
| | |
Specialty Retail 1.0% | | | | | | | | |
ABC-Mart, Inc. (Japan) | | | 60 | | | $ | 3,568 | |
Asbury Automotive Group, Inc.* | | | 2,800 | | | | 194,208 | |
AutoNation, Inc.*(a) | | | 15,600 | | | | 557,232 | |
Dick’s Sporting Goods, Inc. | | | 3,800 | | | | 139,878 | |
DSW, Inc. (Class A Stock) | | | 7,300 | | | | 162,206 | |
Dufry AG (Switzerland)* | | | 68 | | | | 7,147 | |
Fast Retailing Co. Ltd. (Japan) | | | 125 | | | | 58,805 | |
Foot Locker, Inc. | | | 22,400 | | | | 1,357,440 | |
Gap, Inc. (The) | | | 2,500 | | | | 65,450 | |
Genesco, Inc.* | | | 500 | | | | 22,775 | |
Group 1 Automotive, Inc. | | | 1,200 | | | | 77,640 | |
Hennes & Mauritz AB (Sweden) (Class B Stock) | | | 2,007 | | | | 33,450 | |
Hikari Tsushin, Inc. (Japan) | | | 50 | | | | 9,477 | |
Industria de Diseno Textil SA (Spain) | | | 2,444 | | | | 71,931 | |
J. Jill, Inc. | | | 9,200 | | | | 50,508 | |
Kingfisher PLC (United Kingdom) | | | 4,568 | | | | 13,996 | |
Lithia Motors, Inc. (Class A Stock) | | | 900 | | | | 83,475 | |
Lowe’s Cos., Inc. | | | 8,300 | | | | 908,601 | |
Michaels Cos., Inc. (The)* | | | 50,800 | | | | 580,136 | |
Murphy USA, Inc.* | | | 400 | | | | 34,248 | |
Nitori Holdings Co. Ltd. (Japan) | | | 180 | | | | 23,249 | |
Office Depot, Inc. | | | 19,300 | | | | 70,059 | |
Sally Beauty Holdings, Inc.* | | | 6,800 | | | | 125,188 | |
Shimamura Co. Ltd. (Japan) | | | 50 | | | | 4,222 | |
Sonic Automotive, Inc. (Class A Stock) | | | 3,800 | | | | 56,278 | |
TJX Cos., Inc. (The) | | | 21,700 | | | | 1,154,657 | |
Urban Outfitters, Inc.* | | | 21,600 | | | | 640,224 | |
USS Co. Ltd. (Japan) | | | 500 | | | | 9,276 | |
Yamada Denki Co. Ltd. (Japan) | | | 1,360 | | | | 6,701 | |
| | | | | | | | |
| | | | | | | 6,522,025 | |
| | |
Technology Hardware, Storage & Peripherals 2.0% | | | | | | | | |
Apple, Inc. | | | 48,000 | | | | 9,117,600 | |
Brother Industries Ltd. (Japan) | | | 500 | | | | 9,253 | |
Canon, Inc. (Japan) | | | 2,250 | | | | 65,239 | |
Dell Technologies, Inc. (Class C Stock)* | | | 5,814 | | | | 341,224 | |
Diebold Nixdorf, Inc. | | | 14,400 | | | | 159,408 | |
FUJIFILM Holdings Corp. (Japan) | | | 850 | | | | 38,666 | |
Hewlett Packard Enterprise Co. | | | 88,500 | | | | 1,365,555 | |
HP, Inc. | | | 100,300 | | | | 1,948,829 | |
Konica Minolta, Inc. (Japan) | | | 1,100 | | | | 10,839 | |
NEC Corp. (Japan) | | | 610 | | | | 20,658 | |
See Notes to Financial Statements.
| | | | | | | | |
| Description | | Shares | | | Value | |
COMMON STOCKS (Continued) | | | | | | | | |
| | |
Technology Hardware, Storage & Peripherals (cont’d.) | | | | | | | | |
Ricoh Co. Ltd. (Japan) | | | 1,600 | | | $ | 16,727 | |
Seiko Epson Corp. (Japan) | | | 600 | | | | 9,179 | |
| | | | | | | | |
| | | | | | | 13,103,177 | |
| | |
Textiles, Apparel & Luxury Goods 0.4% | | | | | | | | |
adidas AG (Germany) | | | 398 | | | | 96,922 | |
Asics Corp. (Japan) | | | 300 | | | | 4,019 | |
Burberry Group PLC (United Kingdom) | | | 891 | | | | 22,692 | |
Cie Financiere Richemont SA (Switzerland) | | | 1,152 | | | | 83,969 | |
Deckers Outdoor Corp.* | | | 1,500 | | | | 220,485 | |
EssilorLuxottica SA (France) | | | 636 | | | | 69,489 | |
Hermes International (France) | | | 69 | | | | 45,608 | |
HUGO BOSS AG (Germany) | | | 142 | | | | 9,711 | |
Kering SA (France) | | | 167 | | | | 95,965 | |
LVMH Moet Hennessy Louis Vuitton SE (France) | | | 617 | | | | 227,143 | |
Moncler SpA (Italy) | | | 409 | | | | 16,516 | |
Movado Group, Inc. | | | 3,100 | | | | 112,778 | |
NIKE, Inc. (Class B Stock) | | | 4,100 | | | | 345,261 | |
Pandora A/S (Denmark) | | | 256 | | | | 11,977 | |
Puma SE (Germany) | | | 17 | | | | 9,873 | |
Swatch Group AG (The) (Switzerland) | | | 66 | | | | 18,903 | |
Swatch Group AG (The) (Switzerland) | | | 123 | | | | 6,820 | |
Tapestry, Inc. | | | 31,000 | | | | 1,007,190 | |
Yue Yuen Industrial Holdings Ltd. (Hong Kong) | | | 1,500 | | | | 5,168 | |
| | | | | | | | |
| | | | | | | 2,410,489 | |
| | |
Thrifts & Mortgage Finance 0.1% | | | | | | | | |
Essent Group Ltd.* | | | 5,600 | | | | 243,320 | |
Federal Agricultural Mortgage Corp. (Class C Stock) | | | 700 | | | | 50,701 | |
MGIC Investment Corp.* | | | 19,200 | | | | 253,248 | |
Radian Group, Inc. | | | 12,400 | | | | 257,176 | |
Sterling Bancorp, Inc. | | | 3,400 | | | | 34,476 | |
Walker & Dunlop, Inc. | | | 900 | | | | 45,819 | |
| | | | | | | | |
| | | | | | | 884,740 | |
| | |
Tobacco 0.8% | | | | | | | | |
Altria Group, Inc. | | | 45,000 | | | | 2,584,350 | |
British American Tobacco PLC (United Kingdom) | | | 5,064 | | | | 211,041 | |
Imperial Brands PLC (United Kingdom) | | | 2,137 | | | | 73,104 | |
Japan Tobacco, Inc. (Japan) | | | 2,473 | | | | 61,296 | |
Philip Morris International, Inc. | | | 24,200 | | | | 2,139,038 | |
See Notes to Financial Statements.
Schedule of Investments(unaudited) (continued)
as of March 31, 2019
| | | | | | | | |
| Description | | Shares | | | Value | |
COMMON STOCKS (Continued) | | | | | | | | |
| | |
Tobacco (cont’d.) | | | | | | | | |
Swedish Match AB (Sweden) | | | 412 | | | $ | 21,015 | |
Universal Corp. | | | 800 | | | | 46,104 | |
| | | | | | | | |
| | | | | | | 5,135,948 | |
| | |
Trading Companies & Distributors 0.4% | | | | | | | | |
AerCap Holdings NV (Ireland)* | | | 261 | | | | 12,147 | |
Ashtead Group PLC (United Kingdom) | | | 1,042 | | | | 25,172 | |
BMC Stock Holdings, Inc.* | | | 9,400 | | | | 166,098 | |
Brenntag AG (Germany) | | | 347 | | | | 17,909 | |
Bunzl PLC (United Kingdom) | | | 780 | | | | 25,735 | |
Ferguson PLC | | | 512 | | | | 32,633 | |
Foundation Building Materials, Inc.* | | | 1,500 | | | | 14,760 | |
GMS, Inc.* | | | 4,200 | | | | 63,504 | |
ITOCHU Corp. (Japan) | | | 3,000 | | | | 54,306 | |
Marubeni Corp. (Japan) | | | 3,500 | | | | 24,209 | |
Mitsubishi Corp. (Japan) | | | 3,000 | | | | 83,360 | |
Mitsui & Co. Ltd. (Japan) | | | 3,700 | | | | 57,495 | |
MonotaRO Co. Ltd. (Japan) | | | 300 | | | | 6,678 | |
Rexel SA (France) | | | 666 | | | | 7,515 | |
Rush Enterprises, Inc. (Class A Stock) | | | 400 | | | | 16,724 | |
Sumitomo Corp. (Japan) | | | 2,500 | | | | 34,593 | |
Toyota Tsusho Corp. (Japan) | | | 450 | | | | 14,667 | |
United Rentals, Inc.* | | | 1,400 | | | | 159,950 | |
Veritiv Corp.* | | | 3,100 | | | | 81,592 | |
WESCO International, Inc.* | | | 27,600 | | | | 1,463,076 | |
| | | | | | | | |
| | | | | | | 2,362,123 | |
| | |
Transportation Infrastructure 0.1% | | | | | | | | |
Aena SME SA (Spain), 144A | | | 156 | | | | 28,128 | |
Aeroports de Paris (France) | | | 63 | | | | 12,205 | |
Atlantia SpA (Italy) | | | 1,143 | | | | 29,671 | |
Auckland International Airport Ltd. (New Zealand) | | | 2,225 | | | | 12,316 | |
Fraport AG Frankfurt Airport Services Worldwide (Germany) | | | 98 | | | | 7,522 | |
Getlink SE (France) | | | 987 | | | | 14,974 | |
Japan Airport Terminal Co. Ltd. (Japan) | | | 100 | | | | 4,230 | |
Kamigumi Co. Ltd. (Japan) | | | 300 | | | | 6,951 | |
Macquarie Infrastructure Corp. | | | 12,000 | | | | 494,640 | |
SATS Ltd. (Singapore) | | | 1,300 | | | | 4,911 | |
Sydney Airport (Australia) | | | 2,351 | | | | 12,400 | |
Transurban Group (Australia) | | | 5,898 | | | | 55,320 | |
| | | | | | | | |
| | | | | | | 683,268 | |
See Notes to Financial Statements.
| | | | | | | | |
| Description | | Shares | | | Value | |
COMMON STOCKS (Continued) | | | | | | | | |
| | |
Water Utilities 0.0% | | | | | | | | |
Middlesex Water Co. | | | 200 | | | $ | 11,198 | |
Severn Trent PLC (United Kingdom) | | | 504 | | | | 12,973 | |
SJW Group | | | 3,000 | | | | 185,220 | |
United Utilities Group PLC (United Kingdom) | | | 1,505 | | | | 15,973 | |
| | | | | | | | |
| | | | | | | 225,364 | |
| | |
Wireless Telecommunication Services 0.3% | | | | | | | | |
1&1 Drillisch AG (Germany) | | | 105 | | | | 3,748 | |
KDDI Corp. (Japan) | | | 3,900 | | | | 83,939 | |
Millicom International Cellular SA (Colombia), SDR | | | 146 | | | | 8,891 | |
NTT DOCOMO, Inc. (Japan) | | | 3,004 | | | | 66,571 | |
Shenandoah Telecommunications Co. | | | 4,800 | | | | 212,928 | |
Softbank Corp. (Japan) | | | 3,700 | | | | 41,630 | |
SoftBank Group Corp. (Japan) | | | 1,830 | | | | 177,927 | |
Tele2 AB (Sweden) (Class B Stock) | | | 1,091 | | | | 14,566 | |
T-Mobile US, Inc.* | | | 14,400 | | | | 995,040 | |
Vodafone Group PLC (United Kingdom) | | | 58,985 | | | | 107,609 | |
| | | | | | | | |
| | | | | | | 1,712,849 | |
| | | | | | | | |
TOTAL COMMON STOCKS
(cost $324,506,438) | | | | | | | 391,277,400 | |
| | | | | | | | |
| | |
EXCHANGE-TRADED FUND 0.1% | | | | | | | | |
iShares MSCI EAFE ETF(a)
(cost $830,929) | | | 15,000 | | | | 972,900 | |
| | | | | | | | |
| | |
PREFERRED STOCKS 0.1% | | | | | | | | |
| | |
Automobiles 0.0% | | | | | | | | |
Bayerische Motoren Werke AG (Germany) (PRFC) | | | 122 | | | | 8,038 | |
Porsche Automobil Holding SE (Germany) (PRFC) | | | 343 | | | | 21,581 | |
Volkswagen AG (Germany) (PRFC) | | | 416 | | | | 65,594 | |
| | | | | | | | |
| | | | | | | 95,213 | |
| | |
Banks 0.0% | | | | | | | | |
Citigroup Capital XIII 9.121% | | | 3,000 | | | | 82,050 | |
| | |
Capital Markets 0.1% | | | | | | | | |
State Street Corp. 5.350% | | | 5,000 | | | | 127,400 | |
| | |
Chemicals 0.0% | | | | | | | | |
FUCHS PETROLUB SE (Germany) (PRFC) | | | 151 | | | | 6,224 | |
See Notes to Financial Statements.
Schedule of Investments(unaudited) (continued)
as of March 31, 2019
| | | | | | | | | | | | | | | | |
| | | | |
| Description | | | | | | | | Shares | | | Value | |
| | | | |
PREFERRED STOCKS (Continued) | | | | | | | | | | | | | | | | |
| | | | |
Health Care Equipment & Supplies 0.0% | | | | | | | | | | | | | | | | |
Sartorius AG (Germany) (PRFC) | | | | | | | | | | | 79 | | | $ | 13,588 | |
| | | | |
Household Products 0.0% | | | | | | | | | | | | | | | | |
Henkel AG & Co. KGaA (Germany) (PRFC) | | | | | | | | | | | 393 | | | | 40,140 | |
| | | | | | | | | | | | | | | | |
TOTAL PREFERRED STOCKS
(cost $324,670) | | | | | | | | | | | | | | | 364,615 | |
| | | | | | | | | | | | | | | | |
| | | | |
| | | Interest
Rate | | | Maturity
Date | | | Principal
Amount (000)# | | | | |
| | | | |
ASSET-BACKED SECURITIES 6.1% | | | | | | | | | | | | | | | | |
| | | | |
Automobiles 2.0% | | | | | | | | | | | | | | | | |
AmeriCredit Automobile Receivables Trust,
Series2017-03, Class C | | | 2.690 | % | | | 06/19/23 | | | | 170 | | | | 169,543 | |
Series2017-04, Class C | | | 2.600 | | | | 09/18/23 | | | | 300 | | | | 298,375 | |
Series2018-01, Class C | | | 3.500 | | | | 01/18/24 | | | | 300 | | | | 304,000 | |
Series2019-01, Class B | | | 3.130 | | | | 02/18/25 | | | | 100 | | | | 100,774 | |
Series2019-01, Class C | | | 3.360 | | | | 02/18/25 | | | | 200 | | | | 201,836 | |
Avis Budget Rental Car Funding AESOP LLC,
Series2015-01A, Class A, 144A | | | 2.500 | | | | 07/20/21 | | | | 800 | | | | 796,247 | |
Series2015-02A, Class A, 144A | | | 2.630 | | | | 12/20/21 | | | | 400 | | | | 397,872 | |
Series2018-01A, Class A, 144A | | | 3.700 | | | | 09/20/24 | | | | 400 | | | | 408,071 | |
Series2018-02A, Class A, 144A | | | 4.000 | | | | 03/20/25 | | | | 300 | | | | 307,092 | |
Drive Auto Receivables Trust,
Series2018-01, Class B | | | 2.880 | | | | 02/15/22 | | | | 236 | | | | 235,944 | |
Enterprise Fleet Financing LLC,
Series2016-02, Class A2, 144A | | | 1.740 | | | | 02/22/22 | | | | 51 | | | | 50,925 | |
Series2017-01, Class A2, 144A | | | 2.130 | | | | 07/20/22 | | | | 213 | | | | 212,209 | |
Ford Credit Auto Owner Trust,
Series2017-01, Class A, 144A | | | 2.620 | | | | 08/15/28 | | | | 1,100 | | | | 1,092,967 | |
Series2017-02, Class A, 144A | | | 2.360 | | | | 03/15/29 | | | | 500 | | | | 491,765 | |
Series2018-02, Class A, 144A | | | 3.470 | | | | 01/15/30 | | | | 500 | | | | 508,734 | |
Ford Credit Floorplan Master Owner Trust,
Series2017-03, Class A | | | 2.480 | | | | 09/15/24 | | | | 700 | | | | 695,093 | |
Series2018-02, Class A | | | 3.170 | | | | 03/15/25 | | | | 2,100 | | | | 2,130,776 | |
GM Financial Consumer Automobile Receivables Trust,
Series2018-04, Class C | | | 3.620 | | | | 06/17/24 | | | | 100 | | | | 101,573 | |
OneMain Direct Auto Receivables Trust,
Series2017-01A, Class A, 144A | | | 2.160 | | | | 10/15/20 | | | | 154 | | | | 154,265 | |
Series2017-02A, Class B, 144A | | | 2.550 | | | | 11/14/23 | | | | 900 | | | | 894,492 | |
Series2017-02A, Class C, 144A | | | 2.820 | | | | 07/15/24 | | | | 200 | | | | 198,890 | |
See Notes to Financial Statements.
| | | | | | | | | | | | | | | | |
| | | | |
| Description | | Interest
Rate | | | Maturity
Date | | | Principal
Amount (000)# | | | Value | |
| | | | |
ASSET-BACKED SECURITIES (Continued) | | | | | | | | | | | | | | | | |
| | | | |
Automobiles (cont’d.) | | | | | | | | | | | | | | | | |
OneMain Direct Auto Receivables Trust, (cont’d.) | | | | | | | | | |
Series2018-01A, Class A, 144A | | | 3.430 | % | | | 12/16/24 | | | | 900 | | | $ | 909,556 | |
Series2019-01A, Class A, 144A | | | 3.630 | | | | 09/14/27 | | | | 900 | | | | 909,549 | |
Santander Drive Auto Receivables Trust,
Series2018-01, Class C | | | 2.960 | | | | 03/15/24 | | | | 200 | | | | 200,133 | |
Series2018-02, Class C | | | 3.350 | | | | 07/17/23 | | | | 170 | | | | 170,820 | |
Series2018-05, Class C | | | 3.810 | | | | 12/16/24 | | | | 400 | | | | 405,969 | |
World Omni Select Auto Trust,
Series2018-01A, Class B, 144A | | | 3.680 | | | | 07/15/23 | | | | 370 | | | | 376,145 | |
Series2018-01A, Class C, 144A | | | 3.860 | | | | 01/15/25 | | | | 440 | | | | 448,933 | |
| | | | | | | | | | | | | | | | |
| | | | | | | | | | | | | | | 13,172,548 | |
| | | | | | | | | | | | | | | | |
| | | | |
Collateralized Loan Obligations 1.6% | | | | | | | | | | | | | | | | |
ALM Ltd. (Cayman Islands),
Series2013-08A, Class A1R, 144A, 3 Month LIBOR + 1.490% | | | 4.277 | (c) | | | 10/15/28 | | | | 250 | | | | 250,187 | |
Atlas Senior Loan Fund Ltd. (Cayman Islands),
Series2014-01A, Class AR2, 144A, 3 Month LIBOR + 1.260% | | | 4.039 | (c) | | | 07/16/29 | | | | 250 | | | | 248,775 | |
Battalion CLO Ltd.,
Series2018-12A, Class A1, 144A, 3 Month LIBOR + 1.070% | | | 3.753 | (c) | | | 05/17/31 | | | | 1,000 | | | | 981,507 | |
Burnham Park CLO Ltd. (Cayman Islands),
Series2016-01A, Class A, 144A, 3 Month LIBOR + 1.430% | | | 4.191 | (c) | | | 10/20/29 | | | | 250 | | | | 250,052 | |
Carlyle Global Market Strategies CLO Ltd.,
Series2012-04A, Class AR, 144A, 3 Month LIBOR + 1.450% | | | 4.211 | (c) | | | 01/20/29 | | | | 250 | | | | 250,143 | |
Series2015-05A, Class A1R, 144A, 3 Month LIBOR + 1.320% | | | 3.876 | (c) | | | 01/20/32 | | | | 750 | | | | 749,909 | |
Carlyle US CLO Ltd. (Cayman Islands),
Series2017-01A, Class A1B, 144A, 3 Month LIBOR + 1.230% | | | 3.991 | (c) | | | 04/20/31 | | | | 250 | | | | 248,998 | |
Cent CLO Ltd. (Cayman Islands),
Series C17A, Class A1AR, 144A, 3 Month LIBOR + 1.030% | | | 3.781 | (c) | | | 04/30/31 | | | | 1,000 | | | | 986,160 | |
OZLM Ltd. (Cayman Islands),
Series2016-15A, Class A1, 144A, 3 Month LIBOR + 1.490% | | | 4.251 | (c) | | | 01/20/29 | | | | 750 | | | | 750,602 | |
See Notes to Financial Statements.
Schedule of Investments(unaudited) (continued)
as of March 31, 2019
| | | | | | | | | | | | | | | | |
| | | | |
| Description | | Interest
Rate | | | Maturity
Date | | | Principal
Amount (000)# | | | Value | |
| | | | |
ASSET-BACKED SECURITIES (Continued) | | | | | | | | | | | | | | | | |
| | | | |
Collateralized Loan Obligations (cont’d.) | | | | | | | | | | | | | | | | |
OZLM Ltd. (Cayman Islands), (cont’d.) | | | | | | | | | | | | | | | | |
Series2018-20A, Class A1, 144A, 3 Month LIBOR + 1.050% | | | 3.811 | %(c) | | | 04/20/31 | | | | 1,500 | | | $ | 1,479,484 | |
Shackleton CLO Ltd. (Cayman Islands),
Series 2015-07RA, Class A1, 144A, 3 Month LIBOR + 1.170% | | | 3.957 | (c) | | | 07/15/31 | | | | 500 | | | | 494,197 | |
Sound Point CLO Ltd. (Cayman Islands),
Series 2014-03RA, Class A1, 144A, 3 Month LIBOR + 1.250% | | | 3.532 | (c) | | | 10/23/31 | | | | 750 | | | | 746,529 | |
TIAA CLO Ltd. (Cayman Islands),
Series2016-01A, Class AR, 144A, 3 Month LIBOR + 1.200% | | | 3.961 | (c) | | | 07/20/31 | | | | 250 | | | | 247,625 | |
TICP CLO Ltd. (Cayman Islands),
Series2016-06A, Class A, 144A, 3 Month LIBOR + 1.550% | | | 4.337 | (c) | | | 01/15/29 | | | | 500 | | | | 500,273 | |
Trinitas CLO Ltd. (Cayman Islands),
Series2016-04A, Class A1LR, 144A, 3 Month LIBOR + 1.180% | | | 3.960 | (c) | | | 10/18/31 | | | | 1,000 | | | | 990,476 | |
Series2016-05A, Class A, 144A, 3 Month LIBOR + 1.700% | | | 4.471 | (c) | | | 10/25/28 | | | | 500 | | | | 500,339 | |
Wellfleet CLO Ltd. (Cayman Islands),
Series2018-02A, Class A1, 144A, 3 Month LIBOR + 1.200% | | | 3.638 | (c) | | | 10/20/31 | | | | 500 | | | | 495,545 | |
| | | | | | | | | | | | | | | | |
| | | | | | | | | | | | | | | 10,170,801 | |
| | | | | | | | | | | | | | | | |
| | | | |
Consumer Loans 0.3% | | | | | | | | | | | | | | | | |
OneMain Financial Issuance Trust,
Series2017-01A, Class A2, 144A, 1 Month LIBOR + 0.800% | | | 3.289 | (c) | | | 09/14/32 | | | | 600 | | | | 601,973 | |
Series2018-01A, Class A, 144A | | | 3.300 | | | | 03/14/29 | | | | 190 | | | | 190,883 | |
Oportun Funding X LLC,
Series2018-C, Class A, 144A | | | 4.100 | | | | 10/08/24 | | | | 300 | | | | 304,193 | |
Oportun Funding XII LLC,
Series2018-D, Class A, 144A | | | 4.150 | | | | 12/09/24 | | | | 200 | | | | 203,295 | |
SpringCastle America Funding LLC,
Series2016-AA, Class A, 144A | | | 3.050 | | | | 04/25/29 | | | | 173 | | | | 172,761 | |
Springleaf Funding Trust,
Series2017-AA, Class A, 144A | | | 2.680 | | | | 07/15/30 | | | | 500 | | | | 496,016 | |
| | | | | | | | | | | | | | | | |
| | | | | | | | | | | | | | | 1,969,121 | |
| | | | | | | | | | | | | | | | |
See Notes to Financial Statements.
| | | | | | | | | | | | | | | | |
| | | | |
| Description | | Interest
Rate | | | Maturity
Date | | | Principal
Amount (000)# | | | Value | |
| | | | |
ASSET-BACKED SECURITIES (Continued) | | | | | | | | | | | | | | | | |
| | | | |
Credit Cards 0.3% | | | | | | | | | | | | | | | | |
Citibank Credit Card Issuance Trust,
Series2017-A05, Class A5, 1 Month LIBOR + 0.620% | | | 3.111 | %(c) | | | 04/22/26 | | | | 400 | | | $ | 401,878 | |
Series2018-A07, Class A7 | | | 3.960 | | | | 10/13/30 | | | | 1,200 | | | | 1,285,961 | |
Discover Card Execution Note Trust,
Series2017-A05, Class A5, 1 Month LIBOR + 0.600% | | | 3.084 | (c) | | | 12/15/26 | | | | 300 | | | | 300,420 | |
| | | | | | | | | | | | | | | | |
| | | | | | | | | | | | | | | 1,988,259 | |
| | | | | | | | | | | | | | | | |
| | | | |
Equipment 0.3% | | | | | | | | | | | | | | | | |
MMAF Equipment Finance LLC,
Series2017-AA, Class A4, 144A | | | 2.410 | | | | 08/16/24 | | | | 500 | | | | 496,064 | |
Series2017-B, Class A4, 144A | | | 2.410 | | | | 11/15/24 | | | | 300 | | | | 297,400 | |
Series2017-B, Class A5, 144A | | | 2.720 | | | | 06/15/40 | | | | 400 | | | | 396,962 | |
Series2018-A, Class A4, 144A | | | 3.390 | | | | 01/10/25 | | | | 300 | | | | 304,687 | |
Series2018-A, Class A5, 144A | | | 3.610 | | | | 03/10/42 | | | | 100 | | | | 102,153 | |
Series2019-A, Class A5, 144A | | | 3.080 | | | | 11/12/41 | | | | 400 | | | | 403,483 | |
| | | | | | | | | | | | | | | | |
| | | | | | | | | | | | | | | 2,000,749 | |
| | | | | | | | | | | | | | | | |
| | | | |
Home Equity Loans 0.1% | | | | | | | | | | | | | | | | |
CDC Mortgage Capital Trust,
Series 2002-HE03, Class M1, 1 Month LIBOR + 1.650% | | | 4.136 | (c) | | | 03/25/33 | | | | 16 | | | | 16,126 | |
Morgan Stanley Dean Witter Capital I, Inc. Trust,
Series 2002-HE01, Class M1, 1 Month LIBOR + 0.900% | | | 3.386 | (c) | | | 07/25/32 | | | | 15 | | | | 15,433 | |
Series 2002-NC04, Class M1, 1 Month LIBOR + 1.275% | | | 3.761 | (c) | | | 09/25/32 | | | | 44 | | | | 43,879 | |
New Residential Mortgage Loan Trust,
Series2018-01A, Class A1A, 144A | | | 4.000 | (cc) | | | 12/25/57 | | | | 297 | | | | 302,897 | |
RASC Series Trust,
Series 2004-KS02, Class MI1 | | | 4.710 | (cc) | | | 03/25/34 | | | | 22 | | | | 21,384 | |
| | | | | | | | | | | | | | | | |
| | | | | | | | | | | | | | | 399,719 | |
| | | | | | | | | | | | | | | | |
| | | | |
Other 0.0% | | | | | | | | | | | | | | | | |
Sierra Timeshare Receivables Funding LLC,
Series2018-02A, Class A, 144A | | | 3.500 | | | | 06/20/35 | | | | 341 | | | | 345,145 | |
| | | | | | | | | | | | | | | | |
See Notes to Financial Statements.
Schedule of Investments(unaudited) (continued)
as of March 31, 2019
| | | | | | | | | | | | | | | | |
| | | | |
| Description | | Interest
Rate | | | Maturity
Date | | | Principal
Amount (000)# | | | Value | |
| | | | |
ASSET-BACKED SECURITIES (Continued) | | | | | | | | | | | | | | | | |
| | | | |
Residential Mortgage-Backed Securities 0.7% | | | | | | | | | | | | | | | | |
CIT Mortgage Loan Trust,
Series2007-01, Class 1A, 144A, 1 Month LIBOR + 1.350% | | | 3.840 | %(c) | | | 10/25/37 | | | | 296 | | | $ | 298,774 | |
Credit-Based Asset Servicing & Securitization LLC,
Series 2005-CB06, Class A3 | | | 3.663 | (cc) | | | 07/25/35 | | | | 36 | | | | 35,874 | |
CSMC Trust,
Series 2016-RPL01, Class A1, 144A, 1 Month LIBOR + 3.150% | | | 5.639 | (c) | | | 12/26/46 | | | | 521 | | | | 526,211 | |
Series2018-11R, 144A, 1 Month LIBOR + 1.400% | | | 3.902 | (c) | | | 08/25/37 | | | | 191 | | | | 190,267 | |
Series 2018-RPL08, Class A1, 144A | | | 4.125 | (cc) | | | 07/25/58 | | | | 380 | | | | 381,311 | |
CWABS, Inc., Asset-Backed Certificates,
Series2004-01, Class M1, 1 Month LIBOR + 0.750% | | | 3.236 | (c) | | | 03/25/34 | | | | 136 | | | | 136,283 | |
Equity One Mortgage Pass-Through Trust,
Series2004-03, Class M1 | | | 4.535 | (cc) | | | 07/25/34 | | | | 40 | | | | 40,139 | |
Legacy Mortgage Asset Trust,
Series 2019-GS02, Class A1, 144A | | | 3.750 | (cc) | | | 01/25/59 | | | | 200 | | | | 200,131 | |
Series 2019-SL01, Class A, 144A | | | 4.000 | (cc) | | | 12/28/54 | | | | 100 | | | | 99,909 | |
Mill City Mortgage Loan Trust,
Series2017-03, Class A1, 144A | | | 2.750 | (cc) | | | 01/25/61 | | | | 333 | | | | 327,808 | |
Series2018-01, Class A1, 144A | | | 3.250 | (cc) | | | 05/25/62 | | | | 180 | | | | 179,220 | |
Towd Point Mortgage Trust,
Series2017-04, Class A1, 144A | | | 2.750 | (cc) | | | 06/25/57 | | | | 725 | | | | 713,486 | |
Series2017-05, Class A1, 144A, 1 Month LIBOR + 0.600% | | | 3.086 | (c) | | | 02/25/57 | | | | 630 | | | | 624,944 | |
Series2017-06, Class A1, 144A | | | 2.750 | (cc) | | | 10/25/57 | | | | 490 | | | | 481,149 | |
Series2018-05, Class A1, 144A | | | 3.250 | (cc) | | | 07/25/58 | | | | 189 | | | | 188,503 | |
Series2018-06, Class A1A, 144A | | | 3.750 | (cc) | | | 03/25/58 | | | | 367 | | | | 370,974 | |
| | | | | | | | | | | | | | | | |
| | | | | | | | | | | | | | | 4,794,983 | |
| | | | | | | | | | | | | | | | |
| | | | |
Student Loans 0.8% | | | | | | | | | | | | | | | | |
Commonbond Student Loan Trust,
Series2017-BGS, Class A1, 144A | | | 2.680 | | | | 09/25/42 | | | | 418 | | | | 412,109 | |
Series2018-AGS, Class A1, 144A | | | 3.210 | | | | 02/25/44 | | | | 317 | | | | 315,868 | |
Series2018-CGS, Class A1, 144A | | | 3.870 | | | | 02/25/46 | | | | 192 | | | | 194,956 | |
Series2018-CGS, Class A2, 144A, 1 Month LIBOR + 0.800% (Cap N/A, Floor 0.800%) | | | 3.286 | (c) | | | 02/25/46 | | | | 186 | | | | 184,971 | |
Laurel Road Prime Student Loan Trust,
Series2017-C, Class A2B, 144A | | | 2.810 | | | | 11/25/42 | | | | 300 | | | | 297,126 | |
Series2018-B, Class A2FX, 144A | | | 3.540 | | | | 05/26/43 | | | | 500 | | | | 508,167 | |
Navient Private Education Refi Loan Trust,
Series2018-A, Class A2, 144A | | | 3.190 | | | | 02/18/42 | | | | 700 | | | | 701,561 | |
See Notes to Financial Statements.
| | | | | | | | | | | | | | | | |
| | | | |
| Description | | Interest
Rate | | | Maturity
Date | | | Principal
Amount (000)# | | | Value | |
| | | | |
ASSET-BACKED SECURITIES (Continued) | | | | | | | | | | | | | | | | |
| | | | |
Student Loans (cont’d.) | | | | | | | | | | | | | | | | |
Navient Private Education Refi Loan Trust, (cont’d.) | | | | | | | | | | | | | | | | |
Series2018-CA, Class A2, 144A | | | 3.520 | % | | | 06/16/42 | | | | 300 | | | $ | 303,913 | |
Navient Student Loan Trust,
Series2018-EA, Class A2, 144A | | | 4.000 | | | | 12/15/59 | | | | 300 | | | | 312,124 | |
SLM Student Loan Trust,
Series2004-02X, Class A6, 3 Month EURIBOR + 0.550% | | | 0.242 | (c) | | | 07/25/39 | | | EUR | 400 | | | | 433,289 | |
SoFi Professional Loan Program LLC,
Series2019-B, Class A2FX, 144A | | | 3.090 | | | | 08/17/48 | | | | 400 | | | | 399,423 | |
SoFi Professional Loan Program Trust,
Series2018-B, Class A1FX, 144A | | | 2.640 | | | | 08/25/47 | | | | 333 | | | | 332,770 | |
Series2018-B, Class A2FX, 144A | | | 3.340 | | | | 08/25/47 | | | | 500 | | | | 505,371 | |
| | | | | | | | | | | | | | | | |
| | | | | | | | | | | | | | | 4,901,648 | |
| | | | | | | | | | | | | | | | |
TOTAL ASSET-BACKED SECURITIES
(cost $39,629,491) | | | | | | | | | | | | | | | 39,742,973 | |
| | | | | | | | | | | | | | | | |
| | | | |
COMMERCIAL MORTGAGE-BACKED SECURITIES 7.9% | | | | | | | | | | | | | | | | |
BANK,
Series 2017-BNK04, Class A3 | | | 3.362 | | | | 05/15/50 | | | | 1,000 | | | | 1,012,015 | |
BBCMS Mortgage Trust,
Series2018-C02, Class A4 | | | 4.047 | | | | 12/15/51 | | | | 950 | | | | 1,009,083 | |
Benchmark Mortgage Trust,
Series2018-B03, Class A4 | | | 3.761 | | | | 04/10/51 | | | | 800 | | | | 834,467 | |
Citigroup Commercial Mortgage Trust,
Series 2013-GC11, Class A3 | | | 2.815 | | | | 04/10/46 | | | | 99 | | | | 98,836 | |
Series 2014-GC21, Class A4 | | | 3.575 | | | | 05/10/47 | | | | 227 | | | | 233,861 | |
Series 2015-GC29, Class A3 | | | 2.935 | | | | 04/10/48 | | | | 410 | | | | 408,070 | |
Series2015-P01, Class A4 | | | 3.462 | | | | 09/15/48 | | | | 600 | | | | 614,361 | |
Series2017-P08, Class A3 | | | 3.203 | | | | 09/15/50 | | | | 1,000 | | | | 1,004,311 | |
Commercial Mortgage Trust,
Series 2013-CR08, Class A4 | | | 3.334 | | | | 06/10/46 | | | | 382 | | | | 388,768 | |
Series 2014-CR15, Class A2 | | | 2.928 | | | | 02/10/47 | | | | 118 | | | | 117,856 | |
Series 2014-CR18, Class A4 | | | 3.550 | | | | 07/15/47 | | | | 400 | | | | 409,867 | |
Series 2014-UBS03, Class A2 | | | 2.844 | | | | 06/10/47 | | | | 291 | | | | 290,860 | |
Series 2014-UBS04, Class A4 | | | 3.420 | | | | 08/10/47 | | | | 700 | | | | 715,791 | |
Series 2015-LC21, Class A3 | | | 3.445 | | | | 07/10/48 | | | | 700 | | | | 714,891 | |
CSAIL Commercial Mortgage Trust,
Series2015-C02, Class A3 | | | 3.231 | | | | 06/15/57 | | | | 800 | | | | 807,101 | |
Series2017-C08, Class A3 | | | 3.127 | | | | 06/15/50 | | | | 800 | | | | 794,575 | |
DBJPM Mortgage Trust,
Series2016-C01, Class A3A | | | 3.015 | | | | 05/10/49 | | | | 800 | | | | 797,644 | |
See Notes to Financial Statements.
Schedule of Investments(unaudited) (continued)
as of March 31, 2019
| | | | | | | | | | | | | | | | |
| | | | |
| Description | | Interest
Rate | | | Maturity
Date | | | Principal
Amount (000)# | | | Value | |
| | | | |
COMMERCIAL MORTGAGE-BACKED SECURITIES (Continued) | | | | | | | | | | | | | | | | |
FannieMae-Aces,
Series2015-M10, Class A2 | | | 3.092 | %(cc) | | | 04/25/27 | | | | 800 | | | $ | 805,823 | |
Series2015-M17, Class A2 | | | 2.939 | (cc) | | | 11/25/25 | | | | 500 | | | | 505,731 | |
Series2017-M01, Class A2 | | | 2.416 | (cc) | | | 10/25/26 | | | | 300 | | | | 291,166 | |
Series2017-M04, Class A2 | | | 2.597 | (cc) | | | 12/25/26 | | | | 1,750 | | | | 1,714,797 | |
Series2017-M08, Class A2 | | | 3.061 | (cc) | | | 05/25/27 | | | | 1,250 | | | | 1,259,602 | |
Series2018-M04, Class A2 | | | 3.043 | (cc) | | | 03/25/28 | | | | 700 | | | | 704,582 | |
Series2018-M10, Class A1 | | | 3.385 | (cc) | | | 07/25/28 | | | | 341 | | | | 354,826 | |
Series2018-M10, Class A2 | | | 3.385 | (cc) | | | 07/25/28 | | | | 1,325 | | | | 1,366,173 | |
FHLMC Multifamily Structured Pass-Through Certificates,
Series K020, Class X1, IO | | | 1.405 | (cc) | | | 05/25/22 | | | | 2,679 | | | | 98,655 | |
Series K021, Class X1, IO | | | 1.440 | (cc) | | | 06/25/22 | | | | 809 | | | | 31,741 | |
Series K025, Class X1, IO | | | 0.839 | (cc) | | | 10/25/22 | | | | 1,354 | | | | 34,484 | |
Series K055, Class X1, IO | | | 1.366 | (cc) | | | 03/25/26 | | | | 2,304 | | | | 184,440 | |
Series K064, Class AM | | | 3.327 | (cc) | | | 03/25/27 | | | | 900 | | | | 919,290 | |
Series K068, Class AM | | | 3.315 | | | | 08/25/27 | | | | 900 | | | | 923,352 | |
Series K069, Class A2 | | | 3.187 | (cc) | | | 09/25/27 | | | | 750 | | | | 765,226 | |
Series K069, Class AM | | | 3.248 | (cc) | | | 09/25/27 | | | | 150 | | | | 153,049 | |
Series K070, Class A2 | | | 3.303 | (cc) | | | 11/25/27 | | | | 1,225 | | | | 1,260,523 | |
Series K070, Class AM | | | 3.364 | (cc) | | | 12/25/27 | | | | 225 | | | | 231,530 | |
Series K072, Class A2 | | | 3.444 | | | | 12/25/27 | | | | 300 | | | | 311,946 | |
Series K074, Class A2 | | | 3.600 | | | | 01/25/28 | | | | 1,950 | | | | 2,051,557 | |
Series K075, Class AM | | | 3.650 | (cc) | | | 02/25/28 | | | | 575 | | | | 602,783 | |
Series K076, Class A2 | | | 3.900 | | | | 04/25/28 | | | | 1,400 | | | | 1,504,279 | |
Series K076, Class AM | | | 3.900 | | | | 04/25/28 | | | | 425 | | | | 453,744 | |
Series K077, Class A2 | | | 3.850 | (cc) | | | 05/25/28 | | | | 830 | | | | 888,932 | |
Series K077, Class AM | | | 3.850 | (cc) | | | 05/25/28 | | | | 160 | | | | 170,510 | |
Series K079, Class AM | | | 3.930 | | | | 06/25/28 | | | | 700 | | | | 751,266 | |
Series K080, Class AM | | | 3.986 | (cc) | | | 07/25/28 | | | | 1,250 | | | | 1,347,658 | |
Series K083, Class A2 | | | 4.050 | (cc) | | | 09/25/28 | | | | 675 | | | | 734,040 | |
Series K083, Class AM | | | 4.030 | (cc) | | | 10/25/28 | | | | 275 | | | | 297,276 | |
Series K086, Class A2 | | | 3.859 | (cc) | | | 11/25/28 | | | | 1,000 | | | | 1,072,428 | |
Series K086, Class AM | | | 3.919 | (cc) | | | 11/25/28 | | | | 200 | | | | 214,495 | |
Series K087, Class AM | | | 3.832 | (cc) | | | 12/25/28 | | | | 250 | | | | 265,739 | |
Series K157, Class A2 | | | 3.990 | (cc) | | | 05/25/33 | | | | 700 | | | | 748,392 | |
Series K710, Class X1, IO | | | 1.850 | (cc) | | | 05/25/19 | | | | 931 | | | | 95 | |
Series K711, Class X1, IO | | | 1.629 | (cc) | | | 07/25/19 | | | | 1,294 | | | | 1,515 | |
Series W5FX, Class AFX | | | 2.970 | (cc) | | | 04/25/28 | | | | 380 | | | | 384,476 | |
GS Mortgage Securities Trust,
Series 2015-GC28, Class A4 | | | 3.136 | | | | 02/10/48 | | | | 400 | | | | 402,163 | |
Series 2018-GS10, Class A3 | | | 4.261 | | | | 07/10/51 | | | | 1,325 | | | | 1,399,712 | |
JPMorgan Chase Commercial Mortgage Securities Trust,
Series2012-CBX, Class A3 | | | 3.139 | | | | 06/15/45 | | | | 11 | | | | 10,921 | |
See Notes to Financial Statements.
| | | | | | | | | | | | | | | | |
| | | | |
| Description | | Interest
Rate | | | Maturity
Date | | | Principal
Amount (000)# | | | Value | |
| | | | |
COMMERCIAL MORTGAGE-BACKED SECURITIES (Continued) | | | | | | | | | | | | | | | | |
JPMorgan Chase Commercial Mortgage Securities Trust, (cont’d.) | | | | | | | | | | | | | | | | |
Series 2012-LC09, Class A4 | | | 2.611 | % | | | 12/15/47 | | | | 95 | | | $ | 95,374 | |
Series2013-C10, Class A4 | | | 2.875 | | | | 12/15/47 | | | | 40 | | | | 40,339 | |
Series 2013-LC11, Class A4 | | | 2.694 | | | | 04/15/46 | | | | 91 | | | | 90,279 | |
Series 2017-JP07, Class ASB | | | 3.241 | | | | 09/15/50 | | | | 400 | | | | 405,626 | |
Morgan Stanley Bank of America Merrill Lynch Trust,
Series2013-C08, Class A3 | | | 2.863 | | | | 12/15/48 | | | | 180 | | | | 180,537 | |
Series2015-C23, Class A3 | | | 3.451 | | | | 07/15/50 | | | | 600 | | | | 616,314 | |
Series2015-C25, Class A4 | | | 3.372 | | | | 10/15/48 | | | | 700 | | | | 712,371 | |
Series2016-C29, Class A3 | | | 3.058 | | | | 05/15/49 | | | | 800 | | | | 799,031 | |
Morgan Stanley Capital I Trust,
Series 2016-UB11, Class A3 | | | 2.531 | | | | 08/15/49 | | | | 1,300 | | | | 1,249,472 | |
UBS Commercial Mortgage Trust,
Series2017-C02, Class ASB | | | 3.264 | | | | 08/15/50 | | | | 500 | | | | 507,033 | |
Series2017-C05, Class A4 | | | 3.212 | | | | 11/15/50 | | | | 1,000 | | | | 998,301 | |
Series2018-C09, Class A3 | | | 3.854 | | | | 03/15/51 | | | | 400 | | | | 417,524 | |
Series2018-C14, Class A3 | | | 4.180 | | | | 12/15/51 | | | | 700 | | | | 748,513 | |
UBS-Barclays Commercial Mortgage Trust,
Series2012-C04, Class A4 | | | 2.792 | | | | 12/10/45 | | | | 200 | | | | 200,412 | |
Series2013-C05, Class A3 | | | 2.920 | | | | 03/10/46 | | | | 418 | | | | 420,142 | |
Series2013-C06, Class A3 | | | 2.971 | | | | 04/10/46 | | | | 200 | | | | 201,169 | |
Wells Fargo Commercial Mortgage Trust,
Series 2015-NXS02, Class A4 | | | 3.498 | | | | 07/15/58 | | | | 800 | | | | 818,903 | |
Series2016-C33, Class A3 | | | 3.162 | | | | 03/15/59 | | | | 900 | | | | 901,231 | |
Series2016-C34, Class A3 | | | 2.834 | | | | 06/15/49 | | | | 800 | | | | 784,164 | |
Series2016-C35, Class A3 | | | 2.674 | | | | 07/15/48 | | | | 1,200 | | | | 1,163,393 | |
Series 2016-NXS06, Class A3 | | | 2.642 | | | | 11/15/49 | | | | 1,500 | | | | 1,451,771 | |
Series2017-C38, Class A4 | | | 3.190 | | | | 07/15/50 | | | | 700 | | | | 697,349 | |
Series2018-C46, Class A3 | | | 3.888 | | | | 08/15/51 | | | | 1,050 | | | | 1,096,670 | |
Series2018-C48, Class A4 | | | 4.037 | | | | 01/15/52 | | | | 1,200 | | | | 1,268,019 | |
| | | | | | | | | | | | | | | | |
TOTAL COMMERCIAL MORTGAGE-BACKED SECURITIES
(cost $50,644,414) | | | | | | | | | | | | | | | 51,335,211 | |
| | | | | | | | | | | | | | | | |
| | | | |
CORPORATE BONDS 10.9% | | | | | | | | | | | | | | | | |
| | | | |
Aerospace & Defense 0.1% | | | | | | | | | | | | | | | | |
Embraer Netherlands Finance BV (Brazil),
Gtd. Notes | | | 5.050 | | | | 06/15/25 | | | | 114 | | | | 120,270 | |
Embraer Overseas Ltd. (Brazil),
Gtd. Notes, 144A | | | 5.696 | | | | 09/16/23 | | | | 210 | | | | 224,440 | |
United Technologies Corp.,
Sr. Unsec’d. Notes | | | 4.125 | | | | 11/16/28 | | | | 235 | | | | 244,145 | |
| | | | | | | | | | | | | | | | |
| | | | | | | | | | | | | | | 588,855 | |
See Notes to Financial Statements.
Schedule of Investments(unaudited) (continued)
as of March 31, 2019
| | | | | | | | | | | | | | | | |
| | | | |
| Description | | Interest
Rate | | | Maturity
Date | | | Principal
Amount (000)# | | | Value | |
| | | | |
CORPORATE BONDS (Continued) | | | | | | | | | | | | | | | | |
| | | | |
Agriculture 0.1% | | | | | | | | | | | | | | | | |
BAT Capital Corp. (United Kingdom),
Gtd. Notes | | | 3.222 | % | | | 08/15/24 | | | | 570 | | | $ | 557,323 | |
Reynolds American, Inc. (United Kingdom),
Gtd. Notes | | | 8.125 | | | | 06/23/19 | | | | 50 | | | | 50,565 | |
| | | | | | | | | | | | | | | | |
| | | | | | | | | | | | | | | 607,888 | |
| | | | |
Airlines 0.2% | | | | | | | | | | | | | | | | |
American Airlines2016-1 Class AA Pass-Through Trust,
Pass-Through Certificates | | | 3.575 | | | | 07/15/29 | | | | 185 | | | | 185,742 | |
Continental Airlines2001-1Class A-1 Pass-Through Trust,
Pass-Through Certificates | | | 6.703 | | | | 12/15/22 | | | | 3 | | | | 3,448 | |
Continental Airlines2009-2 Class A Pass-Through Trust,
Pass-Through Certificates | | | 7.250 | | | | 05/10/21 | | | | 77 | | | | 78,133 | |
Continental Airlines2012-2 Class A Pass-Through Trust,
Pass-Through Certificates | | | 4.000 | | | | 04/29/26 | | | | 86 | | | | 87,508 | |
Delta Air Lines2007-1 Class A Pass-Through Trust,
Pass-Through Certificates | | | 6.821 | | | | 02/10/24 | | | | 47 | | | | 51,439 | |
Delta Air Lines2011-1 Class A Pass-Through Trust,
Pass-Through Certificates | | | 5.300 | | | | 10/15/20 | | | | 87 | | | | 86,997 | |
Delta Air Lines, Inc.,
Sr. Unsec’d. Notes | | | 2.875 | | | | 03/13/20 | | | | 205 | | | | 204,625 | |
Sr. Unsec’d. Notes | | | 3.400 | | | | 04/19/21 | | | | 200 | | | | 200,817 | |
United Airlines2014-1 Class A Pass-Through Trust,
Pass-Through Certificates | | | 4.000 | | | | 10/11/27 | | | | 72 | | | | 73,827 | |
| | | | | | | | | | | | | | | | |
| | | | | | | | | | | | | | | 972,536 | |
| | | | |
Auto Manufacturers 0.5% | | | | | | | | | | | | | | | | |
BMW US Capital LLC (Germany),
Gtd. Notes, 144A | | | 3.100 | | | | 04/12/21 | | | | 105 | | | | 105,655 | |
Gtd. Notes, 144A, 3 Month LIBOR + 0.410% | | | 3.207 | (c) | | | 04/12/21 | | | | 80 | | | | 79,949 | |
Daimler Finance North America LLC (Germany),
Gtd. Notes, 144A | | | 3.100 | | | | 05/04/20 | | | | 200 | | | | 200,360 | |
Gtd. Notes, 144A | | | 3.350 | | | | 05/04/21 | | | | 330 | | | | 332,030 | |
Ford Motor Co.,
Sr. Unsec’d. Notes | | | 5.291 | | | | 12/08/46 | | | | 190 | | | | 159,195 | |
Ford Motor Credit Co. LLC,
Sr. Unsec’d. Notes | | | 3.336 | | | | 03/18/21 | | | | 206 | | | | 202,862 | |
See Notes to Financial Statements.
| | | | | | | | | | | | | | | | |
| | | | |
| Description | | Interest
Rate | | | Maturity
Date | | | Principal
Amount (000)# | | | Value | |
| | | | |
CORPORATE BONDS (Continued) | | | | | | | | | | | | | | | | |
| | | | |
Auto Manufacturers (cont’d.) | | | | | | | | | | | | | | | | |
Ford Motor Credit Co. LLC, (cont’d.) | | | | | | | | | | | | | | | | |
Sr. Unsec’d. Notes | | | 5.875 | % | | | 08/02/21 | | | | 200 | | | $ | 207,086 | |
General Motors Co.,
Sr. Unsec’d. Notes | | | 4.875 | | | | 10/02/23 | | | | 155 | | | | 161,193 | |
Sr. Unsec’d. Notes | | | 6.250 | | | | 10/02/43 | | | | 135 | | | | 134,333 | |
Sr. Unsec’d. Notes | | | 6.600 | | | | 04/01/36 | | | | 80 | | | | 83,693 | |
General Motors Financial Co., Inc.,
Gtd. Notes | | | 3.550 | | | | 04/09/21 | | | | 120 | | | | 120,657 | |
Gtd. Notes, 3 Month LIBOR + 0.850% | | | 3.647 | (c) | | | 04/09/21 | | | | 160 | | | | 158,773 | |
Gtd. Notes | | | 3.950 | | | | 04/13/24 | | | | 500 | | | | 494,841 | |
Harley-Davidson Financial Services, Inc.,
Gtd. Notes, 144A, MTN | | | 2.850 | | | | 01/15/21 | | | | 565 | | | | 558,566 | |
Volkswagen Group of America Finance LLC (Germany),
Gtd. Notes, 144A | | | 3.875 | | | | 11/13/20 | | | | 215 | | | | 217,761 | |
Gtd. Notes, 144A | | | 4.000 | | | | 11/12/21 | | | | 245 | | | | 249,943 | |
| | | | | | | | | | | | | | | | |
| | | | | | | | | | | | | | | 3,466,897 | |
| | | | |
Banks 3.4% | | | | | | | | | | | | | | | | |
Banco Santander SA (Spain),
Sr. Unsec’d. Notes | | | 3.848 | | | | 04/12/23 | | | | 200 | | | | 201,703 | |
Bank of America Corp.,
Sr. Unsec’d. Notes | | | 3.004 | (ff) | | | 12/20/23 | | | | 286 | | | | 284,861 | |
Sr. Unsec’d. Notes, GMTN | | | 3.300 | | | | 01/11/23 | | | | 390 | | | | 394,951 | |
Sr. Unsec’d. Notes, GMTN | | | 3.593 | (ff) | | | 07/21/28 | | | | 160 | | | | 159,531 | |
Sr. Unsec’d. Notes, MTN | | | 3.499 | (ff) | | | 05/17/22 | | | | 490 | | | | 495,737 | |
Sr. Unsec’d. Notes, MTN | | | 3.824 | (ff) | | | 01/20/28 | | | | 675 | | | | 684,137 | |
Sr. Unsec’d. Notes, MTN | | | 3.974 | (ff) | | | 02/07/30 | | | | 310 | | | | 315,964 | |
Sr. Unsec’d. Notes, MTN | | | 4.125 | | | | 01/22/24 | | | | 620 | | | | 649,657 | |
Sr. Unsec’d. Notes, MTN | | | 4.271 | (ff) | | | 07/23/29 | | | | 350 | | | | 364,429 | |
Sub. Notes, MTN | | | 4.450 | | | | 03/03/26 | | | | 365 | | | | 380,387 | |
Bank of Montreal (Canada),
Sr. Unsec’d. Notes, MTN | | | 2.900 | | | | 03/26/22 | | | | 300 | | | | 300,294 | |
Bank of New York Mellon Corp. (The),
Sr. Unsec’d. Notes, MTN | | | 2.200 | | | | 08/16/23 | | | | 550 | | | | 534,905 | |
Sr. Unsec’d. Notes, MTN | | | 2.950 | | | | 01/29/23 | | | | 170 | | | | 170,895 | |
Barclays PLC (United Kingdom),
Sr. Unsec’d. Notes | | | 4.375 | | | | 01/12/26 | | | | 200 | | | | 200,858 | |
Sr. Unsec’d. Notes, MTN | | | 4.972 | (ff) | | | 05/16/29 | | | | 400 | | | | 413,507 | |
BNP Paribas SA (France),
Sr. Unsec’d. Notes, 144A, MTN | | | 2.950 | | | | 05/23/22 | | | | 275 | | | | 273,176 | |
See Notes to Financial Statements.
Schedule of Investments(unaudited) (continued)
as of March 31, 2019
| | | | | | | | | | | | | | | | |
| | | | |
| Description | | Interest
Rate | | | Maturity
Date | | | Principal
Amount (000)# | | | Value | |
| | | | |
CORPORATE BONDS (Continued) | | | | | | | | | | | | | | | | |
| | | | |
Banks (cont’d.) | | | | | | | | | | | | | | | | |
Capital One NA,
Sr. Unsec’d. Notes | | | 2.250 | % | | | 09/13/21 | | | | 750 | | | $ | 738,041 | |
Citibank NA,
Sr. Unsec’d. Notes | | | 3.050 | | | | 05/01/20 | | | | 690 | | | | 692,290 | |
Citigroup, Inc.,
Jr. Sub. Notes, Series Q | | | 5.950 | (ff) | | | — | (rr) | | | 280 | | | | 282,800 | |
Jr. Sub. Notes, Series R | | | 6.125 | (ff) | | | — | (rr) | | | 150 | | | | 153,000 | |
Jr. Sub. Notes, Series T | | | 6.250 | (ff) | | | — | (rr) | | | 105 | | | | 110,513 | |
Sr. Unsec’d. Notes | | | 3.200 | | | | 10/21/26 | | | | 525 | | | | 514,203 | |
Sr. Unsec’d. Notes | | | 3.668 | (ff) | | | 07/24/28 | | | | 290 | | | | 289,252 | |
Sr. Unsec’d. Notes | | | 3.700 | | | | 01/12/26 | | | | 200 | | | | 203,164 | |
Sub. Notes | | | 4.400 | | | | 06/10/25 | | | | 540 | | | | 559,055 | |
Sub. Notes | | | 4.450 | | | | 09/29/27 | | | | 195 | | | | 200,350 | |
Sub. Notes | | | 4.750 | | | | 05/18/46 | | | | 55 | | | | 56,987 | |
Deutsche Bank AG (Germany),
Sr. Unsec’d. Notes, 3 Month LIBOR + 1.290% | | | 4.028 | (c) | | | 02/04/21 | | | | 200 | | | | 198,334 | |
Sr. Unsec’d. Notes | | | 4.250 | | | | 02/04/21 | | | | 175 | | | | 175,671 | |
Sr. Unsec’d. Notes, GMTN | | | 3.375 | | | | 05/12/21 | | | | 220 | | | | 218,671 | |
Dexia Credit Local SA (France),
Gov’t. Liquid Gtd. Notes, 144A, MTN | | | 3.250 | | | | 09/26/23 | | | | 250 | | | | 256,972 | |
Discover Bank,
Sr. Unsec’d. Notes | | | 4.250 | | | | 03/13/26 | | | | 315 | | | | 319,830 | |
Goldman Sachs Group, Inc. (The),
Jr. Sub. Notes, Series M | | | 5.375 | (ff) | | | — | (rr) | | | 265 | | | | 267,319 | |
Sr. Unsec’d. Notes | | | 3.750 | | | | 02/25/26 | | | | 50 | | | | 50,169 | |
Sr. Unsec’d. Notes | | | 3.814 | (ff) | | | 04/23/29 | | | | 165 | | | | 163,464 | |
Sr. Unsec’d. Notes | | | 3.850 | | | | 01/26/27 | | | | 410 | | | | 411,600 | |
Sr. Unsec’d. Notes | | | 4.223 | (ff) | | | 05/01/29 | | | | 120 | | | | 122,640 | |
Sr. Unsec’d. Notes | | | 5.750 | | | | 01/24/22 | | | | 250 | | | | 268,119 | |
Sr. Unsec’d. Notes, Series D, MTN | | | 6.000 | | | | 06/15/20 | | | | 220 | | | | 228,166 | |
Sub. Notes | | | 6.750 | | | | 10/01/37 | | | | 275 | | | | 335,246 | |
HSBC Holdings PLC (United Kingdom),
Sr. Unsec’d. Notes, 3 Month LIBOR + 0.600% | | | 3.283 | (c) | | | 05/18/21 | | | | 345 | | | | 344,815 | |
JPMorgan Chase & Co.,
Jr. Sub. Notes, Series I, 3 Month LIBOR + 3.470% | | | 6.221 | (c) | | | — | (rr) | | | 215 | | | | 216,075 | |
Sr. Unsec’d. Notes | | | 2.950 | | | | 10/01/26 | | | | 210 | | | | 205,132 | |
Sr. Unsec’d. Notes | | | 3.200 | | | | 06/15/26 | | | | 750 | | | | 745,138 | |
Sr. Unsec’d. Notes | | | 3.509 | (ff) | | | 01/23/29 | | | | 265 | | | | 263,195 | |
Sr. Unsec’d. Notes(a) | | | 3.782 | (ff) | | | 02/01/28 | | | | 480 | | | | 488,979 | |
Sr. Unsec’d. Notes | | | 4.005 | (ff) | | | 04/23/29 | | | | 560 | | | | 575,188 | |
Sr. Unsec’d. Notes | | | 4.452 | (ff) | | | 12/05/29 | | | | 250 | | | | 266,098 | |
See Notes to Financial Statements.
| | | | | | | | | | | | | | | | |
| | | | |
| Description | | Interest
Rate | | | Maturity
Date | | | Principal
Amount (000)# | | | Value | |
| | | | |
CORPORATE BONDS (Continued) | | | | | | | | | | | | | | | | |
| | | | |
Banks (cont’d.) | | | | | | | | | | | | | | | | |
JPMorgan Chase & Co., (cont’d.) | | | | | | | | | | | | | | | | |
Sub. Notes | | | 3.875 | % | | | 09/10/24 | | | | 90 | | | $ | 92,271 | |
JPMorgan Chase Bank NA,
Sr. Unsec’d. Notes | | | 3.086 | (ff) | | | 04/26/21 | | | | 750 | | | | 751,439 | |
Lloyds Bank PLC (United Kingdom),
Gtd. Notes | | | 3.300 | | | | 05/07/21 | | | | 200 | | | | 201,561 | |
Gtd. Notes, 144A, MTN | | | 5.800 | | | | 01/13/20 | | | | 195 | | | | 199,490 | |
Lloyds Banking Group PLC (United Kingdom),
Sr. Unsec’d. Notes | | | 4.375 | | | | 03/22/28 | | | | 275 | | | | 281,593 | |
Morgan Stanley,
Jr. Sub. Notes, Series H | | | 5.450 | (ff) | | | – | (rr) | | | 125 | | | | 125,313 | |
Sr. Unsec’d. Notes, GMTN | | | 3.750 | | | | 02/25/23 | | | | 45 | | | | 46,156 | |
Sr. Unsec’d. Notes, GMTN | | | 3.772 | (ff) | | | 01/24/29 | | | | 825 | | | | 828,001 | |
Sr. Unsec’d. Notes, GMTN | | | 3.875 | | | | 01/27/26 | | | | 370 | | | | 378,307 | |
Sr. Unsec’d. Notes, GMTN | | | 4.431 | (ff) | | | 01/23/30 | | | | 240 | | | | 252,775 | |
Sr. Unsec’d. Notes, GMTN | | | 5.500 | | | | 07/28/21 | | | | 60 | | | | 63,487 | |
Sr. Unsec’d. Notes, MTN | | | 3.591 | (ff) | | | 07/22/28 | | | | 1,080 | | | | 1,071,836 | |
Royal Bank of Canada (Canada),
Sr. Unsec’d. Notes, GMTN, 3 Month LIBOR + 0.390% | | | 3.141 | (c) | | | 04/30/21 | | | | 370 | | | | 370,798 | |
Sr. Unsec’d. Notes, GMTN | | | 3.200 | | | | 04/30/21 | | | | 980 | | | | 990,950 | |
State Bank of India (India),
Sr. Unsec’d. Notes, 144A | | | 4.375 | | | | 01/24/24 | | | | 310 | | | | 317,911 | |
State Street Corp.,
Jr. Sub. Notes, Series F | | | 5.250 | (ff) | | | – | (rr) | | | 190 | | | | 194,038 | |
Sumitomo Mitsui Banking Corp. (Japan), Bank
Gtd. Notes, 3 Month LIBOR + 0.350% | | | 3.123 | (c) | | | 01/17/20 | | | | 290 | | | | 290,528 | |
| | | | | | | | | | | | | | | | |
| | | | 22,201,922 | |
|
Beverages 0.1% | |
Anheuser-Busch Cos. LLC/Anheuser-Busch InBev Worldwide, Inc. (Belgium),
Gtd. Notes, 144A | | | 4.700 | | | | 02/01/36 | | | | 150 | | | | 149,848 | |
Anheuser-Busch InBev Finance, Inc. (Belgium),
Gtd. Notes | | | 4.000 | | | | 01/17/43 | | | | 120 | | | | 107,134 | |
Keurig Dr. Pepper, Inc.,
Gtd. Notes, 144A | | | 3.551 | | | | 05/25/21 | | | | 190 | | | | 192,045 | |
| | | | | | | | | | | | | | | | |
| | | | 449,027 | |
See Notes to Financial Statements.
Schedule of Investments(unaudited) (continued)
as of March 31, 2019
| | | | | | | | | | | | | | | | |
| | | | |
| Description | | Interest
Rate | | | Maturity
Date | | | Principal
Amount (000)# | | | Value | |
| | | | |
CORPORATE BONDS (Continued) | | | | | | | | | | | | | | | | |
|
Building Materials 0.1% | |
Griffon Corp.,
Gtd. Notes | | | 5.250 | % | | | 03/01/22 | | | | 65 | | | $ | 63,944 | |
Owens Corning,
Sr. Unsec’d. Notes | | | 4.200 | | | | 12/15/22 | | | | 90 | | | | 92,319 | |
Standard Industries, Inc.,
Sr. Unsec’d. Notes, 144A | | | 5.375 | | | | 11/15/24 | | | | 245 | | | | 251,125 | |
| | | | | | | | | | | | | | | | |
| | | | 407,388 | |
|
Chemicals 0.2% | |
CF Industries, Inc.,
Gtd. Notes | | | 5.375 | | | | 03/15/44 | | | | 90 | | | | 81,112 | |
CNAC HK Finbridge Co. Ltd. (China),
Gtd. Notes | | | 3.500 | | | | 07/19/22 | | | | 640 | | | | 639,774 | |
Dow Chemical Co. (The),
Sr. Unsec’d. Notes | | | 9.400 | | | | 05/15/39 | | | | 67 | | | | 101,881 | |
Mosaic Co. (The),
Sr. Unsec’d. Notes | | | 5.450 | | | | 11/15/33 | | | | 55 | | | | 59,132 | |
Sr. Unsec’d. Notes | | | 5.625 | | | | 11/15/43 | | | | 60 | | | | 63,653 | |
SASOL Financing USA LLC (South Africa),
Gtd. Notes | | | 5.875 | | | | 03/27/24 | | | | 200 | | | | 212,103 | |
Gtd. Notes | | | 6.500 | | | | 09/27/28 | | | | 200 | | | | 218,251 | |
Union Carbide Corp.,
Sr. Unsec’d. Notes | | | 7.500 | | | | 06/01/25 | | | | 100 | | | | 117,516 | |
| | | | | | | | | | | | | | | | |
| | | | 1,493,422 | |
|
Commercial Services 0.2% | |
ERAC USA Finance LLC,
Gtd. Notes, 144A | | | 2.700 | | | | 11/01/23 | | | | 820 | | | | 794,601 | |
Gtd. Notes, 144A | | | 7.000 | | | | 10/15/37 | | | | 20 | | | | 25,657 | |
President & Fellows of Harvard College,
Unsec’d. Notes | | | 3.300 | | | | 07/15/56 | | | | 270 | | | | 253,307 | |
United Rentals North America, Inc.,
Gtd. Notes | | | 4.875 | | | | 01/15/28 | | | | 200 | | | | 194,540 | |
Gtd. Notes | | | 5.875 | | | | 09/15/26 | | | | 65 | | | | 67,194 | |
| | | | | | | | | | | | | | | | |
| | | | 1,335,299 | |
See Notes to Financial Statements.
| | | | | | | | | | | | | | | | |
| | | | |
| Description | | Interest
Rate | | | Maturity
Date | | | Principal
Amount (000)# | | | Value | |
| | | | |
CORPORATE BONDS (Continued) | | | | | | | | | | | | | | | | |
| | | | |
Computers 0.1% | | | | | | | | | | | | | | | | |
Apple, Inc.,
Sr. Unsec’d. Notes | | | 3.250 | % | | | 02/23/26 | | | | 330 | | | $ | 336,257 | |
Hewlett Packard Enterprise Co.,
Sr. Unsec’d. Notes, 144A | | | 2.100 | | | | 10/04/19 | | | | 70 | | | | 69,704 | |
| | | | | | | | | | | | | | | | |
| | | | 405,961 | |
|
Diversified Financial Services 0.4% | |
AerCap Ireland Capital DAC/AerCap Global Aviation Trust (Ireland),
Gtd. Notes | | | 3.750 | | | | 05/15/19 | | | | 150 | | | | 150,123 | |
American Express Co.,
Sr. Unsec’d. Notes | | | 3.375 | | | | 05/17/21 | | | | 720 | | | | 729,232 | |
Capital One Financial Corp.,
Sr. Unsec’d. Notes | | | 2.500 | | | | 05/12/20 | | | | 375 | | | | 373,939 | |
GE Capital International Funding Co. Unlimited Co.,
Gtd. Notes | | | 2.342 | | | | 11/15/20 | | | | 500 | | | | 493,805 | |
Jefferies Group LLC,
Sr. Unsec’d. Notes | | | 6.500 | | | | 01/20/43 | | | | 65 | | | | 67,752 | |
Lehman Brothers Holdings, Inc.,
Sr. Unsec’d. Notes, MTN(d) | | | 5.250 | | | | 02/06/12 | | | | 345 | | | | 6,555 | |
Sr. Unsec’d. Notes, MTN(d) | | | 6.875 | | | | 05/02/18 | | | | 100 | | | | 1,950 | |
Private Export Funding Corp.,
Sr. Unsec’d. Notes, 144A | | | 2.650 | | | | 02/16/21 | | | | 385 | | | | 386,541 | |
U.S. Gov’t. Gtd. Notes, Series GG | | | 2.450 | | | | 07/15/24 | | | | 65 | | | | 65,326 | |
Synchrony Financial,
Sr. Unsec’d. Notes | | | 2.700 | | | | 02/03/20 | | | | 125 | | | | 124,834 | |
| | | | | | | | | | | | | | | | |
| | | | 2,400,057 | |
|
Electric 0.9% | |
Baltimore Gas & Electric Co.,
Sr. Unsec’d. Notes | | | 6.350 | | | | 10/01/36 | | | | 115 | | | | 148,505 | |
Berkshire Hathaway Energy Co.,
Sr. Unsec’d. Notes | | | 5.950 | | | | 05/15/37 | | | | 120 | | | | 148,805 | |
CenterPoint Energy Houston Electric LLC,
General Ref. Mtge. | | | 6.950 | | | | 03/15/33 | | | | 120 | | | | 162,829 | |
General Ref. Mtge., Series Z | | | 2.400 | | | | 09/01/26 | | | | 170 | | | | 161,141 | |
Commonwealth Edison Co.,
First Mortgage | | | 3.750 | | | | 08/15/47 | | | | 530 | | | | 521,228 | |
Dominion Energy, Inc.,
Jr. Sub. Notes | | | 4.104 | | | | 04/01/21 | | | | 400 | | | | 406,094 | |
See Notes to Financial Statements.
Schedule of Investments(unaudited) (continued)
as of March 31, 2019
| | | | | | | | | | | | | | | | |
| | | | |
| Description | | Interest
Rate | | | Maturity
Date | | | Principal
Amount (000)# | | | Value | |
| | | | |
CORPORATE BONDS (Continued) | | | | | | | | | | | | | | | | |
| | | | |
Electric (cont’d.) | | | | | | | | | | | | | | | | |
DTE Electric Co.,
General Ref. Mtge. | | | 3.750 | % | | | 08/15/47 | | | | 505 | | | $ | 502,322 | |
Duke Energy Carolinas LLC,
First Mortgage | | | 6.050 | | | | 04/15/38 | | | | 55 | | | | 70,106 | |
Duke Energy Corp.,
Sr. Unsec’d. Notes(a) | | | 2.650 | | | | 09/01/26 | | | | 210 | | | | 200,042 | |
El Paso Electric Co.,
Sr. Unsec’d. Notes | | | 6.000 | | | | 05/15/35 | | | | 135 | | | | 156,223 | |
Enel Finance International NV (Italy),
Gtd. Notes, 144A | | | 2.875 | | | | 05/25/22 | | | | 500 | | | | 491,485 | |
Eversource Energy,
Sr. Unsec’d. Notes | | | 4.500 | | | | 11/15/19 | | | | 90 | | | | 90,833 | |
Sr. Unsec’d. Notes, Series O | | | 4.250 | | | | 04/01/29 | | | | 315 | | | | 334,579 | |
Exelon Generation Co. LLC,
Sr. Unsec’d. Notes | | | 5.200 | | | | 10/01/19 | | | | 225 | | | | 227,499 | |
FirstEnergy Transmission LLC,
Sr. Unsec’d. Notes, 144A | | | 5.450 | | | | 07/15/44 | | | | 50 | | | | 56,480 | |
Florida Power & Light Co.,
First Mortgage | | | 5.950 | | | | 10/01/33 | | | | 60 | | | | 75,021 | |
Iberdrola International BV (Spain),
Gtd. Notes | | | 6.750 | | | | 09/15/33 | | | | 30 | | | | 35,857 | |
Israel Electric Corp. Ltd. (Israel),
Sr. Sec’d. Notes, 144A | | | 9.375 | | | | 01/28/20 | | | | 230 | | | | 241,709 | |
Sr. Sec’d. Notes, 144A, GMTN | | | 4.250 | | | | 08/14/28 | | | | 235 | | | | 236,184 | |
Monongahela Power Co.,
First Mortgage, 144A | | | 4.100 | | | | 04/15/24 | | | | 280 | | | | 290,902 | |
Niagara Mohawk Power Corp.,
Sr. Unsec’d. Notes, 144A | | | 4.881 | | | | 08/15/19 | | | | 100 | | | | 100,815 | |
Ohio Power Co.,
Sr. Unsec’d. Notes | | | 4.150 | | | | 04/01/48 | | | | 175 | | | | 182,472 | |
Public Service Co. of Colorado,
First Mortgage | | | 4.300 | | | | 03/15/44 | | | | 35 | | | | 37,591 | |
Public Service Electric & Gas Co.,
Sr. Sec’d. Notes, MTN | | | 5.800 | | | | 05/01/37 | | | | 125 | | | | 155,034 | |
San Diego Gas & Electric Co.,
First Mortgage | | | 4.150 | | | | 05/15/48 | | | | 230 | | | | 230,350 | |
Southwestern Public Service Co.,
First Mortgage | | | 3.700 | | | | 08/15/47 | | | | 250 | | | | 241,361 | |
See Notes to Financial Statements.
| | | | | | | | | | | | | | | | |
| | | | |
| Description | | Interest
Rate | | | Maturity
Date | | | Principal
Amount (000)# | | | Value | |
| | | | |
CORPORATE BONDS (Continued) | | | | | | | | | | | | | | | | |
| | | | |
Electric (cont’d.) | | | | | | | | | | | | | | | | |
State Grid Overseas Investment 2014 Ltd. (China),
Gtd. Notes, 144A | | | 2.750 | % | | | 05/07/19 | | | | 200 | | | $ | 200,036 | |
Xcel Energy, Inc.,
Sr. Unsec’d. Notes | | | 4.800 | | | | 09/15/41 | | | | 105 | | | | 111,724 | |
| | | | | | | | | | | | | | | | |
| | | | 5,817,227 | |
|
Electronics 0.0% | |
FLIR Systems, Inc.,
Sr. Unsec’d. Notes | | | 3.125 | | | | 06/15/21 | | | | 150 | | | | 149,511 | |
|
Engineering & Construction 0.0% | |
Mexico City Airport Trust (Mexico),
Sr. Sec’d. Notes, 144A | | | 4.250 | | | | 10/31/26 | | | | 200 | | | | 192,300 | |
|
Foods 0.3% | |
Conagra Brands, Inc.,
Sr. Unsec’d. Notes | | | 3.800 | | | | 10/22/21 | | | | 635 | | | | 646,899 | |
General Mills, Inc.,
Sr. Unsec’d. Notes, 3 Month LIBOR + 0.540% | | | 3.319 | (c) | | | 04/16/21 | | | | 920 | | | | 918,279 | |
Kraft Heinz Foods Co.,
Gtd. Notes | | | 4.375 | | | | 06/01/46 | | | | 60 | | | | 51,902 | |
Gtd. Notes | | | 5.000 | | | | 07/15/35 | | | | 100 | | | | 98,551 | |
Mars, Inc.,
Gtd. Notes, 144A | | | 3.950 | | | | 04/01/49 | | | | 275 | | | | 277,936 | |
| | | | | | | | | | | | | | | | |
| | | | 1,993,567 | |
|
Forest Products & Paper 0.0% | |
Georgia-Pacific LLC,
Gtd. Notes, 144A | | | 5.400 | | | | 11/01/20 | | | | 40 | | | | 41,580 | |
International Paper Co.,
Sr. Unsec’d. Notes | | | 6.000 | | | | 11/15/41 | | | | 30 | | | | 33,475 | |
Sr. Unsec’d. Notes | | | 7.300 | | | | 11/15/39 | | | | 175 | | | | 221,368 | |
| | | | | | | | | | | | | | | | |
| | | | 296,423 | |
|
Gas 0.1% | |
CenterPoint Energy Resources Corp.,
Sr. Unsec’d. Notes | | | 4.100 | | | | 09/01/47 | | | | 200 | | | | 196,836 | |
Dominion Energy Gas Holdings LLC,
Sr. Unsec’d. Notes | | | 4.800 | | | | 11/01/43 | | | | 10 | | | | 10,700 | |
See Notes to Financial Statements.
Schedule of Investments(unaudited) (continued)
as of March 31, 2019
| | | | | | | | | | | | | | | | |
| | | | |
| Description | | Interest
Rate | | | Maturity
Date | | | Principal
Amount (000)# | | | Value | |
| | | | |
CORPORATE BONDS (Continued) | | | | | | | | | | | | | | | | |
| | | | |
Gas (cont’d.) | | | | | | | | | | | | | | | | |
NiSource, Inc.,
Sr. Unsec’d. Notes | | | 3.490 | % | | | 05/15/27 | | | | 445 | | | $ | 443,493 | |
Sr. Unsec’d. Notes | | | 4.800 | | | | 02/15/44 | | | | 40 | | | | 42,083 | |
| | | | | | | | | | | | | | | | |
| | | | 693,112 | |
|
Healthcare-Products 0.1% | |
Abbott Laboratories,
Sr. Unsec’d. Notes | | | 2.900 | | | | 11/30/21 | | | | 465 | | | | 466,946 | |
Becton, Dickinson & Co.,
Sr. Unsec’d. Notes | | | 3.734 | | | | 12/15/24 | | | | 65 | | | | 65,995 | |
Medtronic Global Holdings SCA,
Gtd. Notes | | | 2.250 | | | | 03/07/39 | | | EUR | 100 | | | | 121,899 | |
| | | | | | | | | | | | | | | | |
| | | | 654,840 | |
|
Healthcare-Services 0.2% | |
Anthem, Inc.,
Sr. Unsec’d. Notes | | | 4.625 | | | | 05/15/42 | | | | 45 | | | | 46,443 | |
Sr. Unsec’d. Notes | | | 4.650 | | | | 01/15/43 | | | | 30 | | | | 30,951 | |
Ascension Health,
Sr. Unsec’d. Notes | | | 3.945 | | | | 11/15/46 | | | | 245 | | | | 251,921 | |
Duke University Health System, Inc.,
Sr. Unsec’d. Notes | | | 3.920 | | | | 06/01/47 | | | | 95 | | | | 98,102 | |
Fresenius Medical Care U.S. Finance II, Inc. (Germany),
Gtd. Notes, 144A | | | 4.125 | | | | 10/15/20 | | | | 75 | | | | 75,647 | |
HCA, Inc.,
Gtd. Notes | | | 5.375 | | | | 02/01/25 | | | | 255 | | | | 270,300 | |
Kaiser Foundation Hospitals,
Gtd. Notes | | | 4.150 | | | | 05/01/47 | | | | 140 | | | | 148,402 | |
Laboratory Corp. of America Holdings,
Sr. Unsec’d. Notes | | | 3.200 | | | | 02/01/22 | | | | 20 | | | | 20,145 | |
Providence St Joseph Health Obligated Group,
Unsec’d. Notes, Series H | | | 2.746 | | | | 10/01/26 | | | | 50 | | | | 47,485 | |
UnitedHealth Group, Inc.,
Sr. Unsec’d. Notes | | | 3.500 | | | | 02/15/24 | | | | 355 | | | | 365,427 | |
| | | | | | | | | | | | | | | | |
| | | | 1,354,823 | |
|
Home Builders 0.0% | |
Taylor Morrison Communities, Inc./Taylor Morrison Holdings II, Inc.,
Gtd. Notes, 144A | | | 5.250 | | | | 04/15/21 | | | | 225 | | | | 224,786 | |
See Notes to Financial Statements.
| | | | | | | | | | | | | | | | |
| | | | |
| Description | | Interest
Rate | | | Maturity
Date | | | Principal
Amount (000)# | | | Value | |
|
CORPORATE BONDS (Continued) | |
|
Insurance 0.2% | |
AXIS Specialty Finance LLC,
Gtd. Notes | | | 5.875 | % | | | 06/01/20 | | | | 160 | | | $ | 164,828 | |
Liberty Mutual Group, Inc.,
Gtd. Notes, 144A | | | 7.000 | | | | 03/15/34 | | | | 180 | | | | 222,969 | |
Lincoln National Corp.,
Sr. Unsec’d. Notes | | | 6.300 | | | | 10/09/37 | | | | 110 | | | | 134,269 | |
Markel Corp.,
Sr. Unsec’d. Notes | | | 5.000 | | | | 03/30/43 | | | | 25 | | | | 24,827 | |
New York Life Insurance Co.,
Sub. Notes, 144A | | | 6.750 | | | | 11/15/39 | | | | 110 | | | | 150,779 | |
Ohio National Financial Services, Inc.,
Sr. Unsec’d. Notes, 144A | | | 6.375 | | | | 04/30/20 | | | | 105 | | | | 108,505 | |
Principal Financial Group, Inc.,
Gtd. Notes | | | 4.625 | | | | 09/15/42 | | | | 15 | | | | 15,505 | |
Teachers Insurance & Annuity Association of America,
Sub. Notes, 144A | | | 4.270 | | | | 05/15/47 | | | | 240 | | | | 246,262 | |
Sub. Notes, 144A | | | 6.850 | | | | 12/16/39 | | | | 22 | | | | 30,239 | |
Unum Group,
Sr. Unsec’d. Notes | | | 5.625 | | | | 09/15/20 | | | | 50 | | | | 51,833 | |
W.R. Berkley Corp.,
Sr. Unsec’d. Notes | | | 6.150 | | | | 08/15/19 | | | | 90 | | | | 91,055 | |
| | | | | | | | | | | | | | | | |
| | | | | | | | | | | | | | | 1,241,071 | |
|
Lodging 0.1% | |
Marriott International, Inc.,
Sr. Unsec’d. Notes | | | 3.250 | | | | 09/15/22 | | | | 130 | | | | 130,510 | |
Sr. Unsec’d. Notes, Series R | | | 3.125 | | | | 06/15/26 | | | | 455 | | | | 438,928 | |
| | | | | | | | | | | | | | | | |
| | | | | | | | | | | | | | | 569,438 | |
|
Machinery-Diversified 0.0% | |
Xylem, Inc.,
Sr. Unsec’d. Notes | | | 4.875 | | | | 10/01/21 | | | | 160 | | | | 167,419 | |
|
Media 0.4% | |
AMC Networks, Inc.,
Gtd. Notes | | | 5.000 | | | | 04/01/24 | | | | 215 | | | | 216,054 | |
Charter Communications Operating LLC/Charter Communications Operating Capital,
Sr. Sec’d. Notes | | | 5.375 | | | | 05/01/47 | | | | 20 | | | | 19,928 | |
Sr. Sec’d. Notes | | | 6.384 | | | | 10/23/35 | | | | 110 | | | | 122,651 | |
See Notes to Financial Statements.
Schedule of Investments(unaudited) (continued)
as of March 31, 2019
| | | | | | | | | | | | | | | | |
| | | | |
| Description | | Interest
Rate | | | Maturity
Date | | | Principal
Amount (000)# | | | Value | |
|
CORPORATE BONDS (Continued) | |
|
Media (cont’d.) | |
Charter Communications Operating LLC/Charter Communications Operating Capital, (cont’d.)
Sr. Sec’d. Notes | | | 6.484 | % | | | 10/23/45 | | | | 172 | | | $ | 192,813 | |
Comcast Corp.,
Gtd. Notes | | | 3.969 | | | | 11/01/47 | | | | 19 | | | | 18,330 | |
Cox Communications, Inc.,
Sr. Unsec’d. Notes, 144A | | | 3.150 | | | | 08/15/24 | | | | 520 | | | | 517,639 | |
CSC Holdings LLC,
Gtd. Notes, 144A | | | 5.375 | | | | 07/15/23 | | | | 300 | | | | 305,625 | |
Discovery Communications LLC,
Gtd. Notes, 144A | | | 2.800 | | | | 06/15/20 | | | | 440 | | | | 438,069 | |
Time Warner Cable LLC,
Sr. Sec’d. Notes | | | 5.500 | | | | 09/01/41 | | | | 140 | | | | 137,665 | |
Viacom, Inc.,
Sr. Unsec’d. Notes | | | 5.250 | | | | 04/01/44 | | | | 65 | | | | 65,531 | |
Videotron Ltd. (Canada),
Gtd. Notes | | | 5.000 | | | | 07/15/22 | | | | 150 | | | | 154,688 | |
Walt Disney Co. (The),
Gtd. Notes, 144A | | | 7.625 | | | | 11/30/28 | | | | 125 | | | | 167,396 | |
Warner Media LLC,
Gtd. Notes | | | 3.600 | | | | 07/15/25 | | | | 25 | | | | 24,937 | |
Gtd. Notes | | | 3.800 | | | | 02/15/27 | | | | 240 | | | | 239,024 | |
| | | | | | | | | | | | | | | | |
| | | | | | | | | | | | | | | 2,620,350 | |
|
Mining 0.1% | |
Barrick North America Finance LLC (Canada),
Gtd. Notes | | | 5.750 | | | | 05/01/43 | | | | 280 | | | | 324,722 | |
BHP Billiton Finance USA Ltd. (Australia),
Gtd. Notes, 144A | | | 6.250 | (ff) | | | 10/19/75 | | | | 65 | | | | 67,733 | |
Goldcorp, Inc. (Canada),
Sr. Unsec’d. Notes | | | 3.625 | | | | 06/09/21 | | | | 110 | | | | 110,972 | |
Southern Copper Corp. (Peru),
Sr. Unsec’d. Notes | | | 7.500 | | | | 07/27/35 | | | | 95 | | | | 119,434 | |
| | | | | | | | | | | | | | | | |
| | | | | | | | | | | | | | | 622,861 | |
|
Miscellaneous Manufacturing 0.1% | |
Actuant Corp.,
Gtd. Notes | | | 5.625 | | | | 06/15/22 | | | | 160 | | | | 161,400 | |
General Electric Co.,
Sr. Unsec’d. Notes, GMTN | | | 6.000 | | | | 08/07/19 | | | | 172 | | | | 173,638 | |
| | | | | | | | | | | | | | | | |
| | | | | | | | | | | | | | | 335,038 | |
See Notes to Financial Statements.
| | | | | | | | | | | | | | | | |
| | | | |
| Description | | Interest
Rate | | | Maturity
Date | | | Principal
Amount (000)# | | | Value | |
|
CORPORATE BONDS (Continued) | |
|
Multi-National 0.1% | |
Corp. Andina de Fomento (Supranational Bank),
Sr. Unsec’d. Notes | | | 2.125 | % | | | 09/27/21 | | | | 255 | | | $ | 249,456 | |
Sr. Unsec’d. Notes | | | 2.750 | | | | 01/06/23 | | | | 70 | | | | 69,124 | |
Sr. Unsec’d. Notes | | | 3.250 | | | | 02/11/22 | | | | 65 | | | | 65,212 | |
North American Development Bank (Supranational Bank),
Sr. Unsec’d. Notes | | | 2.400 | | | | 10/26/22 | | | | 150 | | | | 148,070 | |
Sr. Unsec’d. Notes | | | 4.375 | | | | 02/11/20 | | | | 100 | | | | 101,400 | |
| | | | | | | | | | | | | | | | |
| | | | | | | | | | | | | | | 633,262 | |
|
Oil & Gas 0.6% | |
Anadarko Petroleum Corp.,
Sr. Unsec’d. Notes | | | 4.850 | | | | 03/15/21 | | | | 259 | | | | 268,486 | |
Sr. Unsec’d. Notes | | | 6.450 | | | | 09/15/36 | | | | 200 | | | | 230,113 | |
BP Capital Markets America, Inc.,
Gtd. Notes | | | 3.790 | | | | 02/06/24 | | | | 420 | | | | 435,865 | |
Cenovus Energy, Inc. (Canada),
Sr. Unsec’d. Notes | | | 5.400 | | | | 06/15/47 | | | | 368 | | | | 364,383 | |
Concho Resources, Inc.,
Gtd. Notes | | | 4.875 | | | | 10/01/47 | | | | 35 | | | | 36,943 | |
ConocoPhillips Holding Co.,
Sr. Unsec’d. Notes | | | 6.950 | | | | 04/15/29 | | | | 150 | | | | 194,163 | |
Devon Energy Corp.,
Sr. Unsec’d. Notes | | | 5.600 | | | | 07/15/41 | | | | 35 | | | | 38,570 | |
Encana Corp. (Canada),
Gtd. Notes | | | 6.500 | | | | 08/15/34 | | | | 340 | | | | 406,228 | |
Gtd. Notes | | | 6.500 | | | | 02/01/38 | | | | 50 | | | | 58,667 | |
EOG Resources, Inc.,
Sr. Unsec’d. Notes | | | 3.900 | | | | 04/01/35 | | | | 120 | | | | 122,374 | |
Helmerich & Payne, Inc.,
Gtd. Notes | | | 4.650 | | | | 03/15/25 | | | | 240 | | | | 250,499 | |
Petroleos Mexicanos (Mexico),
Gtd. Notes | | | 5.375 | | | | 03/13/22 | | | | 70 | | | | 71,453 | |
Gtd. Notes | | | 5.500 | | | | 01/21/21 | | | | 310 | | | | 315,270 | |
Gtd. Notes | | | 6.350 | | | | 02/12/48 | | | | 136 | | | | 119,904 | |
Gtd. Notes | | | 6.500 | | | | 06/02/41 | | | | 170 | | | | 153,882 | |
Gtd. Notes, MTN | | | 6.750 | | | | 09/21/47 | | | | 520 | | | | 477,360 | |
See Notes to Financial Statements.
Schedule of Investments(unaudited) (continued)
as of March 31, 2019
| | | | | | | | | | | | | | | | |
| | | | |
| Description | | Interest
Rate | | | Maturity
Date | | | Principal
Amount (000)# | | | Value | |
| | | |
CORPORATE BONDS (Continued) | | | | | | | | | | | | | |
|
Oil & Gas (cont’d.) | |
Petroleos Mexicanos (Mexico), (cont’d.)
Gtd. Notes, MTN | | | 6.875 | % | | | 08/04/26 | | | | 230 | | | $ | 239,729 | |
Sinopec Group Overseas Development 2015 Ltd. (China),
Gtd. Notes, 144A | | | 2.500 | | | | 04/28/20 | | | | 200 | | | | 199,046 | |
| | | | | | | | | | | | | | | | |
| | | | | | | | | | | | | | | 3,982,935 | |
|
Oil & Gas Services 0.1% | |
Schlumberger Holdings Corp.,
Sr. Unsec’d. Notes, 144A | | | 3.000 | | | | 12/21/20 | | | | 220 | | | | 220,927 | |
Sr. Unsec’d. Notes, 144A | | | 4.000 | | | | 12/21/25 | | | | 345 | | | | 355,680 | |
Schlumberger Investment SA,
Gtd. Notes, 144A | | | 3.300 | | | | 09/14/21 | | | | 75 | | | | 75,849 | |
| | | | | | | | | | | | | | | | |
| | | | | | | | | | | | | | | 652,456 | |
|
Packaging & Containers 0.1% | |
WestRock RKT LLC,
Gtd. Notes | | | 4.000 | | | | 03/01/23 | | | | 550 | | | | 560,730 | |
Gtd. Notes | | | 4.900 | | | | 03/01/22 | | | | 95 | | | | 99,271 | |
| | | | | | | | | | | | | | | | |
| | | | | | | | | | | | | | | 660,001 | |
|
Pharmaceuticals 0.8% | |
AbbVie, Inc.,
Sr. Unsec’d. Notes | | | 3.600 | | | | 05/14/25 | | | | 315 | | | | 315,706 | |
Sr. Unsec’d. Notes | | | 4.500 | | | | 05/14/35 | | | | 235 | | | | 229,873 | |
Allergan Funding SCS,
Gtd. Notes | | | 4.550 | | | | 03/15/35 | | | | 430 | | | | 421,125 | |
Bayer US Finance II LLC (Germany),
Gtd. Notes, 144A | | | 3.500 | | | | 06/25/21 | | | | 200 | | | | 200,802 | |
Cigna Corp.,
Gtd. Notes, 144A | | | 4.375 | | | | 10/15/28 | | | | 1,000 | | | | 1,037,270 | |
CVS Health Corp.,
Sr. Unsec’d. Notes | | | 4.300 | | | | 03/25/28 | | | | 1,150 | | | | 1,165,239 | |
Sr. Unsec’d. Notes | | | 4.780 | | | | 03/25/38 | | | | 100 | | | | 99,029 | |
Sr. Unsec’d. Notes | | | 5.050 | | | | 03/25/48 | | | | 32 | | | | 32,237 | |
Sr. Unsec’d. Notes | | | 5.125 | | | | 07/20/45 | | | | 105 | | | | 106,710 | |
Sr. Unsec’d. Notes | | | 5.300 | | | | 12/05/43 | | | | 35 | | | | 36,433 | |
Express Scripts Holding Co.,
Gtd. Notes | | | 4.500 | | | | 02/25/26 | | | | 680 | | | | 711,852 | |
See Notes to Financial Statements.
| | | | | | | | | | | | | | | | |
| | | | |
| Description | | Interest
Rate | | | Maturity
Date | | | Principal
Amount (000)# | | | Value | |
| | | | |
CORPORATE BONDS (Continued) | | | | | | | | | | | | | | | | |
| | | | |
Pharmaceuticals (cont’d.) | | | | | | | | | | | | | | | | |
Mylan NV,
Gtd. Notes | | | 5.250 | % | | | 06/15/46 | | | | 230 | | | $ | 206,967 | |
Shire Acquisitions Investments Ireland DAC,
Gtd. Notes | | | 2.400 | | | | 09/23/21 | | | | 585 | | | | 577,781 | |
| | | | | | | | | | | | | | | | |
| | | | | | | | | | | | | | | 5,141,024 | |
| | | | |
Pipelines 0.4% | | | | | | | | | | | | | | | | |
Energy Transfer Operating LP,
Gtd. Notes | | | 4.950 | | | | 06/15/28 | | | | 210 | | | | 220,257 | |
Enterprise Products Operating LLC,
Gtd. Notes | | | 4.850 | | | | 03/15/44 | | | | 185 | | | | 195,901 | |
MPLX LP,
Sr. Unsec’d. Notes | | | 4.500 | | | | 04/15/38 | | | | 175 | | | | 166,225 | |
Sr. Unsec’d. Notes | | | 4.875 | | | | 06/01/25 | | | | 375 | | | | 399,157 | |
Sr. Unsec’d. Notes | | | 5.200 | | | | 03/01/47 | | | | 20 | | | | 20,294 | |
Sr. Unsec’d. Notes | | | 5.500 | | | | 02/15/49 | | | | 90 | | | | 95,999 | |
ONEOK Partners LP,
Gtd. Notes | | | 6.200 | | | | 09/15/43 | | | | 205 | | | | 233,450 | |
ONEOK, Inc.,
Gtd. Notes | | | 4.950 | | | | 07/13/47 | | | | 50 | | | | 49,289 | |
Phillips 66 Partners LP,
Sr. Unsec’d. Notes | | | 3.550 | | | | 10/01/26 | | | | 360 | | | | 353,730 | |
Spectra Energy Partners LP,
Gtd. Notes | | | 3.375 | | | | 10/15/26 | | | | 165 | | | | 162,277 | |
Western Midstream Operating LP,
Sr. Unsec’d. Notes | | | 5.300 | | | | 03/01/48 | | | | 20 | | | | 18,949 | |
Williams Cos., Inc. (The),
Sr. Unsec’d. Notes | | | 4.850 | | | | 03/01/48 | | | | 20 | | | | 19,925 | |
Sr. Unsec’d. Notes | | | 4.900 | | | | 01/15/45 | | | | 220 | | | | 219,664 | |
Sr. Unsec’d. Notes | | | 5.400 | | | | 03/04/44 | | | | 175 | | | | 186,490 | |
| | | | | | | | | | | | | | | | |
| | | | | | | | | | | | | | | 2,341,607 | |
|
Real Estate Investment Trusts (REITs) 0.1% | |
GLP Capital LP/GLP Financing II, Inc.,
Gtd. Notes | | | 5.375 | | | | 04/15/26 | | | | 175 | | | | 182,857 | |
Simon Property Group LP,
Sr. Unsec’d. Notes | | | 3.375 | | | | 03/15/22 | | | | 30 | | | | 30,518 | |
Welltower, Inc.,
Sr. Unsec’d. Notes | | | 4.250 | | | | 04/01/26 | | | | 160 | | | | 165,167 | |
| | | | | | | | | | | | | | | | |
| | | | | | | | | | | | | | | 378,542 | |
See Notes to Financial Statements.
Schedule of Investments(unaudited) (continued)
as of March 31, 2019
| | | | | | | | | | | | | | | | |
| | | | |
| Description | | Interest
Rate | | | Maturity
Date | | | Principal
Amount (000)# | | | Value | |
|
CORPORATE BONDS (Continued) | |
| | | | |
Retail 0.1% | | | | | | | | | | | | | | | | |
Dollar Tree, Inc.,
Sr. Unsec’d. Notes, 3 Month LIBOR + 0.700% | | | 3.473 | %(c) | | | 04/17/20 | | | | 180 | | | $ | 180,040 | |
L Brands, Inc.,
Gtd. Notes | | | 6.625 | | | | 04/01/21 | | | | 225 | | | | 236,250 | |
Macy’s Retail Holdings, Inc.,
Gtd. Notes | | | 3.875 | | | | 01/15/22 | | | | 45 | | | | 45,439 | |
Sally Holdings LLC/Sally Capital, Inc.,
Gtd. Notes | | | 5.625 | | | | 12/01/25 | | | | 170 | | | | 169,150 | |
| | | | | | | | | | | | | | | | |
| | | | | | | | | | | | | | | 630,879 | |
| | | | |
Semiconductors 0.1% | | | | | | | | | | | | | | | | |
Broadcom Corp./Broadcom Cayman Finance Ltd.,
Gtd. Notes | | | 3.875 | | | | 01/15/27 | | | | 115 | | | | 109,862 | |
Broadcom, Inc.,
Sr. Unsec’d. Notes, 144A | | | 3.125 | | | | 04/15/21 | | | | 210 | | | | 209,752 | |
Sr. Unsec’d. Notes, 144A | | | 3.125 | | | | 10/15/22 | | | | 160 | | | | 159,269 | |
| | | | | | | | | | | | | | | | |
| | | | | | | | | | | | | | | 478,883 | |
| | | | |
Software 0.1% | | | | | | | | | | | | | | | | |
Fidelity National Information Services, Inc.,
Sr. Unsec’d. Notes | | | 3.625 | | | | 10/15/20 | | | | 151 | | | | 152,587 | |
Microsoft Corp.,
Sr. Unsec’d. Notes | | | 4.000 | | | | 02/12/55 | | | | 295 | | | | 308,866 | |
Sr. Unsec’d. Notes | | | 4.450 | | | | 11/03/45 | | | | 48 | | | | 54,409 | |
Oracle Corp.,
Sr. Unsec’d. Notes | | | 4.300 | | | | 07/08/34 | | | | 145 | | | | 155,456 | |
| | | | | | | | | | | | | | | | |
| | | | | | | | | | | | | | | 671,318 | |
| | | | |
Telecommunications 0.4% | | | | | | | | | | | | | | | | |
AT&T, Inc.,
Sr. Unsec’d. Notes | | | 3.400 | | | | 05/15/25 | | | | 220 | | | | 217,694 | |
Sr. Unsec’d. Notes, 3 Month LIBOR + 1.180% | | | 3.777 | (c) | | | 06/12/24 | | | | 440 | | | | 436,473 | |
Sr. Unsec’d. Notes | | | 4.300 | | | | 02/15/30 | | | | 50 | | | | 50,574 | |
Sr. Unsec’d. Notes | | | 4.850 | | | | 03/01/39 | | | | 830 | | | | 835,054 | |
Sr. Unsec’d. Notes | | | 5.150 | | | | 03/15/42 | | | | 95 | | | | 97,178 | |
Sr. Unsec’d. Notes | | | 5.250 | | | | 03/01/37 | | | | 60 | | | | 62,863 | |
Sr. Unsec’d. Notes | | | 5.350 | | | | 09/01/40 | | | | 4 | | | | 4,202 | |
British Telecommunications PLC (United Kingdom),
Sr. Unsec’d. Notes | | | 9.625 | | | | 12/15/30 | | | | 50 | | | | 71,740 | |
Sprint Communications, Inc.,
Gtd. Notes, 144A | | | 7.000 | | | | 03/01/20 | | | | 150 | | | | 153,938 | |
See Notes to Financial Statements.
| | | | | | | | | | | | | | | | |
| | | | |
| Description | | Interest
Rate | | | Maturity
Date | | | Principal
Amount (000)# | | | Value | |
| | | | |
CORPORATE BONDS (Continued) | | | | | | | | | | | | | | | | |
| | | | |
Telecommunications (cont’d.) | | | | | | | | | | | | | | | | |
Sprint Spectrum Co. LLC/Sprint Spectrum Co. II LLC/Sprint Spectrum Co. III LLC, Sr. Sec’d. Notes, 144A | | | 3.360 | % | | | 03/20/23 | | | | 172 | | | $ | 171,823 | |
Telefonos de Mexico SAB de CV (Mexico), Gtd. Notes | | | 5.500 | | | | 11/15/19 | | | | 40 | | | | 40,592 | |
Verizon Communications, Inc.,
Sr. Unsec’d. Notes | | | 4.500 | | | | 08/10/33 | | | | 185 | | | | 195,544 | |
Sr. Unsec’d. Notes | | | 4.862 | | | | 08/21/46 | | | | 500 | | | | 532,720 | |
| | | | | | | | | | | | | | | | |
| | | | | | | | | | | | | | | 2,870,395 | |
| | | | |
Transportation 0.1% | | | | | | | | | | | | | | | | |
Burlington Northern Santa Fe LLC,
Sr. Unsec’d. Notes | | | 6.700 | | | | 08/01/28 | | | | 135 | | | | 169,519 | |
CSX Corp.,
Sr. Unsec’d. Notes | | | 6.150 | | | | 05/01/37 | | | | 170 | | | | 208,002 | |
Norfolk Southern Corp.,
Sr. Unsec’d. Notes | | | 2.903 | | | | 02/15/23 | | | | 97 | | | | 97,070 | |
Sr. Unsec’d. Notes | | | 5.590 | | | | 05/17/25 | | | | 20 | | | | 22,512 | |
| | | | | | | | | | | | | | | | |
| | | | | | | | | | | | | | | 497,103 | |
| | | | | | | | | | | | | | | | |
TOTAL CORPORATE BONDS
(cost $69,366,573) | | | | | | | | | | | | | | | 70,200,423 | |
| | | | | | | | | | | | | | | | |
| | | | |
MUNICIPAL BONDS 0.4% | | | | | | | | | | | | | | | | |
| | | | |
Alabama 0.0% | | | | | | | | | | | | | | | | |
Alabama Economic Settlement Authority, Rev., Taxable BP Settlement, Series B | | | 4.263 | | | | 09/15/32 | | | | 35 | | | | 36,792 | |
| | | | | | | | | | | | | | | | |
| | | | |
California 0.1% | | | | | | | | | | | | | | | | |
Bay Area Toll Authority, Revenue Bonds, BABs, Series F | | | 6.263 | | | | 04/01/49 | | | | 220 | | | | 313,744 | |
State of California,
GO, BABs | | | 7.300 | | | | 10/01/39 | | | | 210 | | | | 303,876 | |
GO, Taxable, BABs | | | 7.500 | | | | 04/01/34 | | | | 15 | | | | 21,655 | |
| | | | | | | | | | | | | | | | |
| | | | | | | | | | | | | | | 639,275 | |
| | | | | | | | | | | | | | | | |
| | | | |
Illinois 0.1% | | | | | | | | | | | | | | | | |
Chicago O’Hare International Airport, Revenue Bonds, BABs, Series B | | | 6.395 | | | | 01/01/40 | | | | 160 | | | | 213,360 | |
See Notes to Financial Statements.
Schedule of Investments(unaudited) (continued)
as of March 31, 2019
| | | | | | | | | | | | | | | | |
| | | | |
| Description | | Interest
Rate | | | Maturity
Date | | | Principal
Amount (000)# | | | Value | |
| | | | |
MUNICIPAL BONDS (Continued) | | | | | | | | | | | | | | | | |
| | | | |
Illinois (cont’d.) | | | | | | | | | | | | | | | | |
State of Illinois,
GO, Series D | | | 5.000 | % | | | 11/01/22 | | | | 500 | | | $ | 539,065 | |
GO Unlimited, Series A | | | 5.000 | | | | 10/01/22 | | | | 35 | | | | 37,677 | |
| | | | | | | | | | | | | | | | |
| | | | | | | | | | | | | | | 790,102 | |
| | | | | | | | | | | | | | | | |
| | | | |
New Jersey 0.1% | | | | | | | | | | | | | | | | |
New Jersey Turnpike Authority, Revenue Bonds, Taxable, BABs, Series F | | | 7.414 | | | | 01/01/40 | | | | 165 | | | | 247,833 | |
| | | | | | | | | | | | | | | | |
| | | | |
New York 0.1% | | | | | | | | | | | | | | | | |
New York City Transitional Finance Authority Future Tax Secured Revenue, Tax. Future, Revenue Bonds, BABs | | | 5.767 | | | | 08/01/36 | | | | 190 | | | | 227,527 | |
| | | | | | | | | | | | | | | | |
| | | | |
Ohio 0.0% | | | | | | | | | | | | | | | | |
Ohio State University (The), Revenue Bonds, Taxable, BABs, Series C | | | 4.910 | | | | 06/01/40 | | | | 65 | | | | 78,396 | |
Ohio State Water Development Auth. Wtr. Poll. Ctl. Rev., Revenue Bonds, Taxable, BABs, Series B2 | | | 4.879 | | | | 12/01/34 | | | | 45 | | | | 51,157 | |
| | | | | | | | | | | | | | | | |
| | | | | | | | | | | | | | | 129,553 | |
| | | | | | | | | | | | | | | | |
| | | | |
Oregon 0.0% | | | | | | | | | | | | | | | | |
State of Oregon Department of Transportation, Revenue Bonds, Taxable, BABs, Series A | | | 5.834 | | | | 11/15/34 | | | | 70 | | | | 90,286 | |
| | | | | | | | | | | | | | | | |
| | | | |
Pennsylvania 0.0% | | | | | | | | | | | | | | | | |
Pennsylvania Turnpike Commission, Revenue Bonds, BABs, Series B | | | 5.511 | | | | 12/01/45 | | | | 80 | | | | 101,359 | |
| | | | | | | | | | | | | | | | |
| | | | |
Virginia 0.0% | | | | | | | | | | | | | | | | |
University of Virginia, Revenue Bonds, Taxable, Series C | | | 4.179 | | | | 09/01/2117 | | | | 80 | | | | 82,723 | |
| | | | | | | | | | | | | | | | |
TOTAL MUNICIPAL BONDS
(cost $1,922,158) | | | | | | | | | | | | | | | 2,345,450 | |
| | | | | | | | | | | | | | | | |
| | | |
RESIDENTIAL MORTGAGE-BACKED SECURITIES 1.1% | | | | | | | | | | | | | |
Alternative Loan Trust,
Series 2004-18CB, Class 3A1 | | | 5.250 | | | | 09/25/19 | | | | 6 | | | | 6,361 | |
See Notes to Financial Statements.
| | | | | | | | | | | | | | | | |
| | | | |
| Description | | Interest
Rate | | | Maturity
Date | | | Principal
Amount (000)# | | | Value | |
| | | |
RESIDENTIAL MORTGAGE-BACKED SECURITIES (Continued) | | | | | | | | | | | | | |
Banc of America Mortgage Trust,
Series2005-A, Class 2A1 | | | 4.504 | %(cc) | | | 02/25/35 | | | | 21 | | | $ | 20,612 | |
Series2005-B, Class 2A1 | | | 4.693 | (cc) | | | 03/25/35 | | | | 24 | | | | 23,150 | |
Bellemeade Re Ltd.,
Series2017-01, Class M1, 144A, 1 Month LIBOR + 1.700% | | | 4.186 | (c) | | | 10/25/27 | | | | 114 | | | | 115,209 | |
Series2018-01A, Class M1B, 144A, 1 Month LIBOR + 1.600% | | | 4.086 | (c) | | | 04/25/28 | | | | 213 | | | | 213,863 | |
Series2018-02A, Class M1A, 144A, 1 Month LIBOR + 0.950% | | | 3.436 | (c) | | | 08/25/28 | | | | 132 | | | | 132,499 | |
Series2018-03A, Class M1B, 144A, 1 Month LIBOR + 1.850% | | | 4.336 | (c) | | | 10/25/27 | | | | 170 | | | | 170,738 | |
Chase Mortgage Finance Trust,
Series2007-A01, Class 1A5 | | | 4.621 | (cc) | | | 02/25/37 | | | | 55 | | | | 55,371 | |
CIM Trust,
Series2017-02, Class A1, 144A, 1 Month LIBOR + 2.000% | | | 4.489 | (c) | | | 12/25/57 | | | | 421 | | | | 424,166 | |
Series2017-03, Class A1, 144A, 1 Month LIBOR + 2.000% | | | 4.489 | (c) | | | 01/25/57 | | | | 519 | | | | 526,653 | |
Series2017-06, Class A1, 144A | | | 3.015 | (cc) | | | 06/25/57 | | | | 253 | | | | 247,299 | |
Series2017-08, Class A1, 144A | | | 3.000 | (cc) | | | 12/25/65 | | | | 497 | | | | 491,578 | |
CSMC Trust,
Series 2018-RPL09, Class A, 144A | | | 3.850 | (cc) | | | 09/25/57 | | | | 757 | | | | 768,172 | |
EagleRe Ltd.,
Series2018-01, Class M1, 144A, 1 Month LIBOR + 1.700% | | | 4.186 | (c) | | | 11/25/28 | | | | 200 | | | | 200,734 | |
Fannie Mae Connecticut Avenue Securities,
Series2016-C04, Class 1M11 Month LIBOR + 1.450% | | | 3.936 | (c) | | | 01/25/29 | | | | 63 | | | | 63,361 | |
Freddie Mac Structured Agency Credit Risk Debt Notes,
Series 2016-HQA04, Class M21 Month LIBOR + 1.300% | | | 3.786 | (c) | | | 04/25/29 | | | | 290 | | | | 291,514 | |
Series 2017-DNA01, Class M11 Month LIBOR + 1.200% | | | 3.686 | (c) | | | 07/25/29 | | | | 326 | | | | 327,580 | |
Series 2017-DNA03, Class M11 Month LIBOR + 0.750% | | | 3.236 | (c) | | | 03/25/30 | | | | 900 | | | | 899,839 | |
Gosforth Funding PLC,
Series2018-01A, Class A1, 144A, 3 Month LIBOR + 0.450% | | | 3.101 | (c) | | | 08/25/60 | | | | 356 | | | | 354,515 | |
Holmes Master Issuer PLC,
Series2018-01A, Class A2, 144A, 3 Month LIBOR + 0.360% | | | 3.147 | (c) | | | 10/15/54 | | | | 400 | | | | 398,707 | |
JPMorgan Mortgage Trust,
Series2007-A01, Class 4A1 | | | 4.562 | (cc) | | | 07/25/35 | | | | 28 | | | | 28,923 | |
See Notes to Financial Statements.
Schedule of Investments(unaudited) (continued)
as of March 31, 2019
| | | | | | | | | | | | | | | | |
| | | | |
| Description | | Interest
Rate | | | Maturity
Date | | | Principal
Amount (000)# | | | Value | |
| | | |
RESIDENTIAL MORTGAGE-BACKED SECURITIES (Continued) | | | | | | | | | | | | | |
Lanark Master Issuer PLC,
Series2018-01A, Class 1A, 144A, 3 Month LIBOR + 0.420% | | | 3.083 | %(c) | | | 12/22/69 | | | | 228 | | | $ | 226,946 | |
LSTAR Securities Investment Ltd.,
Series2017-06, Class A, 144A, 1 Month LIBOR + 1.750% | | | 4.252 | (c) | | | 09/01/22 | | | | 133 | | | | 133,616 | |
Series2017-08, Class A, 144A, 1 Month LIBOR + 1.650% | | | 4.152 | (c) | | | 11/01/22 | | | | 134 | | | | 133,771 | |
LSTAR Securities Investment Trust,
Series2018-02, Class A1, 144A, 1 Month LIBOR + 1.500% | | | 4.002 | (c) | | | 04/01/23 | | | | 85 | | | | 85,399 | |
MASTR Alternative Loan Trust,
Series2004-04, Class 4A1 | | | 5.000 | | | | 04/25/19 | | | | — | (r) | | | 21 | |
MetLife Securitization Trust,
Series2018-01A, Class A, 144A | | | 3.750 | (cc) | | | 03/25/57 | | | | 187 | | | | 189,443 | |
New Residential Mortgage Loan Trust,
Series2018-04A, Class A1S, 144A, 1 Month LIBOR + 0.750% (Cap N/A, Floor 0.750%) | | | 3.236 | (c) | | | 01/25/48 | | | | 254 | | | | 252,255 | |
OBX Trust,
Series2018-01, Class A2, 144A, 1 Month LIBOR + 0.650% | | | 3.136 | (c) | | | 06/25/57 | | | | 267 | | | | 265,270 | |
STACR Trust,
Series 2018-DNA03, Class M1, 144A, 1 Month LIBOR + 0.750% | | | 3.236 | (c) | | | 09/25/48 | | | | 250 | | | | 249,742 | |
Structured Adjustable Rate Mortgage Loan Trust,
Series2004-01, Class 4A3 | | | 4.570 | (cc) | | | 02/25/34 | | | | 36 | | | | 36,433 | |
Washington Mutual Mortgage Pass-Through Certificates,
Series2005-01, Class 3A | | | 5.000 | | | | 03/25/20 | | | | 4 | | | | 3,613 | |
| | | | | | | | | | | | | | | | |
TOTAL RESIDENTIAL MORTGAGE-BACKED SECURITIES
(cost $7,319,236) | | | | | | | | | | | | 7,337,353 | |
| | | | | | | | | | | | | | | | |
| | | | |
SOVEREIGN BONDS 1.1% | | | | | | | | | | | | | | | | |
Abu Dhabi Government International Bond (United Arab Emirates),
Sr. Unsec’d. Notes, 144A | | | 3.125 | | | | 10/11/27 | | | | 485 | | | | 481,362 | |
Colombia Government International Bond (Colombia),
Sr. Unsec’d. Notes | | | 4.375 | | | | 07/12/21 | | | | 200 | | | | 205,500 | |
Sr. Unsec’d. Notes | | | 7.375 | | | | 09/18/37 | | | | 100 | | | | 130,750 | |
Export-Import Bank of India (India),
Sr. Unsec’d. Notes, 144A | | | 3.875 | | | | 02/01/28 | | | | 200 | | | | 197,511 | |
Sr. Unsec’d. Notes, EMTN | | | 2.750 | | | | 04/01/20 | | | | 250 | | | | 248,935 | |
Export-Import Bank of Korea (South Korea),
Sr. Unsec’d. Notes | | | 5.125 | | | | 06/29/20 | | | | 100 | | | | 102,946 | |
See Notes to Financial Statements.
| | | | | | | | | | | | | | | | |
| | | | |
| Description | | Interest
Rate | | | Maturity
Date | | | Principal
Amount (000)# | | | Value | |
| | | | |
SOVEREIGN BONDS (Continued) | | | | | | | | | | | | | | | | |
Hungary Government International Bond (Hungary),
Sr. Unsec’d. Notes | | | 6.375 | % | | | 03/29/21 | | | | 280 | | | $ | 298,180 | |
Indonesia Government International Bond (Indonesia),
Sr. Unsec’d. Notes | | | 3.375 | | | | 07/30/25 | | | EUR | 350 | | | | 438,907 | |
Sr. Unsec’d. Notes | | | 4.450 | | | | 02/11/24 | | | | 200 | | | | 208,415 | |
Sr. Unsec’d. Notes, EMTN | | | 2.150 | | | | 07/18/24 | | | EUR | 315 | | | | 370,552 | |
Sr. Unsec’d. Notes, EMTN | | | 4.750 | | | | 01/08/26 | | | | 200 | | | | 211,245 | |
Japan Bank for International Cooperation (Japan), Gov’t. Gtd. Notes | | | 2.250 | | | | 02/24/20 | | | | 200 | | | | 199,504 | |
Japan Finance Organization for Municipalities (Japan),
Sr. Unsec’d. Notes, 144A, MTN | | | 2.125 | | | | 10/25/23 | | | | 200 | | | | 194,740 | |
Sr. Unsec’d. Notes, 144A, MTN | | | 2.625 | | | | 04/20/22 | | | | 400 | | | | 399,248 | |
Panama Government International Bond (Panama),
Sr. Unsec’d. Notes | | | 6.700 | | | | 01/26/36 | | | | 200 | | | | 261,000 | |
Province of Manitoba (Canada),
Sr. Unsec’d. Notes | | | 2.125 | | | | 06/22/26 | | | | 100 | | | | 95,672 | |
Province of Quebec (Canada), Unsec’d. Notes, MTN | | | 7.140 | | | | 02/27/26 | | | | 135 | | | | 167,507 | |
Qatar Government International Bond (Qatar),
Sr. Unsec’d. Notes, 144A | | | 3.875 | | | | 04/23/23 | | | | 200 | | | | 205,694 | |
Sr. Unsec’d. Notes, 144A | | | 4.817 | | | | 03/14/49 | | | | 205 | | | | 215,545 | |
Sr. Unsec’d. Notes, 144A | | | 5.103 | | | | 04/23/48 | | | | 200 | | | | 219,000 | |
Republic of Poland Government International Bond (Poland),
Sr. Unsec’d. Notes | | | 3.000 | | | | 03/17/23 | | | | 160 | | | | 160,986 | |
Romanian Government International Bond (Romania),
Sr. Unsec’d. Notes, EMTN | | | 4.125 | | | | 03/11/39 | | | EUR | 300 | | | | 348,739 | |
Saudi Government International Bond (Saudi Arabia),
Sr. Unsec’d. Notes, 144A | | | 5.250 | | | | 01/16/50 | | | | 275 | | | | 293,282 | |
Sr. Unsec’d. Notes, 144A, MTN | | | 2.375 | | | | 10/26/21 | | | | 205 | | | | 201,430 | |
Sr. Unsec’d. Notes, 144A, MTN | | | 2.875 | | | | 03/04/23 | | | | 285 | | | | 282,250 | |
Sr. Unsec’d. Notes, 144A, MTN | | | 4.000 | | | | 04/17/25 | | | | 200 | | | | 204,758 | |
Tokyo Metropolitan Government (Japan),
Sr. Unsec’d. Notes, 144A | | | 2.500 | | | | 06/08/22 | | | | 200 | | | | 198,480 | |
Turkey Government International Bond (Turkey),
Sr. Unsec’d. Notes | | | 7.000 | | | | 06/05/20 | | | | 190 | | | | 191,672 | |
Uruguay Government International Bond (Uruguay),
Sr. Unsec’d. Notes | | | 5.100 | | | | 06/18/50 | | | | 100 | | | | 106,750 | |
| | | | | | | | | | | | | | | | |
TOTAL SOVEREIGN BONDS
(cost $6,746,503) | | | | | | | | | | | | | | | 6,840,560 | |
| | | | | | | | | | | | | | | | |
See Notes to Financial Statements.
Schedule of Investments(unaudited) (continued)
as of March 31, 2019
| | | | | | | | | | | | | | | | |
| | | | |
| Description | | Interest
Rate | | | Maturity
Date | | | Principal
Amount (000)# | | | Value | |
| | | | |
U.S. GOVERNMENT AGENCY OBLIGATIONS 7.6% | | | | | | | | | | | | | | | | |
Federal Home Loan Bank | | | 5.500 | % | | | 07/15/36 | | | | 135 | | | $ | 180,038 | |
Federal Home Loan Mortgage Corp. | | | 2.000 | | | | 01/01/32 | | | | 149 | | | | 145,257 | |
Federal Home Loan Mortgage Corp. | | | 3.000 | | | | 06/01/29 | | | | 208 | | | | 210,907 | |
Federal Home Loan Mortgage Corp. | | | 3.000 | | | | 02/01/32 | | | | 231 | | | | 233,521 | |
Federal Home Loan Mortgage Corp. | | | 3.000 | | | | 01/01/37 | | | | 180 | | | | 181,575 | |
Federal Home Loan Mortgage Corp. | | | 3.000 | | | | 01/01/47 | | | | 485 | | | | 483,368 | |
Federal Home Loan Mortgage Corp. | | | 3.500 | | | | 12/01/45 | | | | 1,488 | | | | 1,515,210 | |
Federal Home Loan Mortgage Corp. | | | 3.500 | | | | 12/01/47 | | | | 2,016 | | | | 2,050,026 | |
Federal Home Loan Mortgage Corp. | | | 4.000 | | | | 06/01/26 | | | | 58 | | | | 60,225 | |
Federal Home Loan Mortgage Corp. | | | 4.000 | | | | 09/01/26 | | | | 54 | | | | 55,345 | |
Federal Home Loan Mortgage Corp. | | | 4.000 | | | | 11/01/39 | | | | 233 | | | | 241,547 | |
Federal Home Loan Mortgage Corp. | | | 4.000 | | | | 02/01/41 | | | | 371 | | | | 385,277 | |
Federal Home Loan Mortgage Corp. | | | 4.000 | | | | 04/01/42 | | | | 298 | | | | 309,674 | |
Federal Home Loan Mortgage Corp. | | | 4.000 | | | | 09/01/44 | | | | 850 | | | | 879,362 | |
Federal Home Loan Mortgage Corp. | | | 4.000 | | | | 12/01/45 | | | | 486 | | | | 501,643 | |
Federal Home Loan Mortgage Corp. | | | 4.000 | | | | 07/01/48 | | | | 2,943 | | | | 3,037,363 | |
Federal Home Loan Mortgage Corp. | | | 4.500 | | | | 10/01/39 | | | | 201 | | | | 213,288 | |
Federal Home Loan Mortgage Corp. | | | 4.500 | | | | 10/01/46 | | | | 393 | | | | 411,830 | |
Federal Home Loan Mortgage Corp. | | | 5.000 | | | | 04/01/34 | | | | 15 | | | | 16,440 | |
Federal Home Loan Mortgage Corp. | | | 5.000 | | | | 05/01/34 | | | | 32 | | | | 34,611 | |
Federal Home Loan Mortgage Corp. | | | 5.000 | | | | 10/01/35 | | | | 41 | | | | 44,756 | |
Federal Home Loan Mortgage Corp. | | | 5.500 | | | | 12/01/33 | | | | 32 | | | | 35,802 | |
Federal Home Loan Mortgage Corp. | | | 5.500 | | | | 05/01/34 | | | | 12 | | | | 13,072 | |
Federal Home Loan Mortgage Corp. | | | 5.500 | | | | 07/01/34 | | | | 68 | | | | 74,557 | |
Federal Home Loan Mortgage Corp. | | | 5.500 | | | | 05/01/37 | | | | 11 | | | | 11,885 | |
Federal Home Loan Mortgage Corp. | | | 5.500 | | | | 10/01/37 | | | | 23 | | | | 25,592 | |
Federal Home Loan Mortgage Corp. | | | 6.000 | | | | 01/01/34 | | | | 29 | | | | 31,091 | |
Federal Home Loan Mortgage Corp. | | | 7.000 | | | | 10/01/31 | | | | 1 | | | | 820 | |
Federal Home Loan Mortgage Corp. | | | 7.000 | | | | 05/01/32 | | | | 19 | | | | 21,158 | |
Federal National Mortgage Assoc. | | | 2.000 | | | | 08/01/31 | | | | 297 | | | | 289,310 | |
Federal National Mortgage Assoc. | | | 2.500 | | | | 04/01/28 | | | | 690 | | | | 689,720 | |
Federal National Mortgage Assoc. | | | 2.500 | | | | 10/01/46 | | | | 450 | | | | 437,397 | |
Federal National Mortgage Assoc. | | | 3.000 | | | | 08/01/30 | | | | 866 | | | | 874,066 | |
Federal National Mortgage Assoc. | | | 3.000 | | | | 11/01/36 | | | | 389 | | | | 393,352 | |
Federal National Mortgage Assoc. | | | 3.000 | | | | 10/01/42 | | | | 224 | | | | 224,548 | |
Federal National Mortgage Assoc. | | | 3.000 | | | | 01/01/43 | | | | 404 | | | | 404,157 | |
Federal National Mortgage Assoc. | | | 3.000 | | | | 12/01/46 | | | | 1,263 | | | | 1,258,714 | |
Federal National Mortgage Assoc. | | | 3.500 | | | | 02/01/33 | | | | 471 | | | | 482,390 | |
Federal National Mortgage Assoc. | | | 3.500 | | | | 06/01/39 | | | | 145 | | | | 147,901 | |
Federal National Mortgage Assoc. | | | 3.500 | | | | 05/01/42 | | | | 1,509 | | | | 1,541,278 | |
Federal National Mortgage Assoc. | | | 3.500 | | | | 08/01/42 | | | | 317 | | | | 323,323 | |
Federal National Mortgage Assoc. | | | 3.500 | | | | 08/01/42 | | | | 373 | | | | 380,725 | |
Federal National Mortgage Assoc. | | | 3.500 | | | | 04/01/43 | | | | 339 | | | | 345,803 | |
Federal National Mortgage Assoc. | | | 3.500 | | | | 04/01/43 | | | | 632 | | | | 645,559 | |
Federal National Mortgage Assoc. | | | 3.500 | | | | 06/01/43 | | | | 403 | | | | 411,113 | |
See Notes to Financial Statements.
| | | | | | | | | | | | | | | | |
| | | | |
| Description | | Interest
Rate | | | Maturity
Date | | | Principal
Amount (000)# | | | Value | |
| | |
U.S. GOVERNMENT AGENCY OBLIGATIONS (Continued) | | | | | | | | | |
Federal National Mortgage Assoc. | | | 3.500 | % | | | 06/01/45 | | | | 1,218 | | | $ | 1,239,169 | |
Federal National Mortgage Assoc. | | | 4.000 | | | | 09/01/40 | | | | 620 | | | | 642,948 | |
Federal National Mortgage Assoc. | | | 4.000 | | | | 04/01/42 | | | | 781 | | | | 809,661 | |
Federal National Mortgage Assoc. | | | 4.000 | | | | 12/01/46 | | | | 409 | | | | 422,298 | |
Federal National Mortgage Assoc. | | | 4.000 | | | | 09/01/47 | | | | 350 | | | | 361,296 | |
Federal National Mortgage Assoc. | | | 4.000 | | | | 11/01/47 | | | | 179 | | | | 186,834 | |
Federal National Mortgage Assoc. | | | 4.000 | | | | 04/01/48 | | | | 1,425 | | | | 1,471,388 | |
Federal National Mortgage Assoc. | | | 4.500 | | | | 10/01/33 | | | | 36 | | | | 37,851 | |
Federal National Mortgage Assoc. | | | 4.500 | | | | 03/01/34 | | | | 23 | | | | 24,129 | |
Federal National Mortgage Assoc. | | | 4.500 | | | | 09/01/39 | | | | 167 | | | | 176,132 | |
Federal National Mortgage Assoc. | | | 4.500 | | | | 08/01/40 | | | | 135 | | | | 143,049 | |
Federal National Mortgage Assoc. | | | 4.500 | | | | 02/01/44 | | | | 203 | | | | 214,578 | |
Federal National Mortgage Assoc. | | | 4.500 | | | | 08/01/44 | | | | 358 | | | | 376,914 | |
Federal National Mortgage Assoc. | | | 4.500 | | | | 01/01/45 | | | | 360 | | | | 379,232 | |
Federal National Mortgage Assoc. | | | 4.500 | | | | 07/01/48 | | | | 23 | | | | 24,218 | |
Federal National Mortgage Assoc. | | | 4.500 | | | | 08/01/48 | | | | 1,174 | | | | 1,227,327 | |
Federal National Mortgage Assoc.(tt) | | | 5.000 | | | | TBA | | | | 2,250 | | | | 2,375,719 | |
Federal National Mortgage Assoc. | | | 5.000 | | | | 07/01/35 | | | | 29 | | | | 30,941 | |
Federal National Mortgage Assoc. | | | 5.000 | | | | 02/01/36 | | | | 66 | | | | 71,646 | |
Federal National Mortgage Assoc. | | | 5.500 | | | | 06/01/33 | | | | 12 | | | | 13,193 | |
Federal National Mortgage Assoc. | | | 5.500 | | | | 08/01/33 | | | | 17 | | | | 19,151 | |
Federal National Mortgage Assoc. | | | 5.500 | | | | 09/01/33 | | | | 37 | | | | 41,246 | |
Federal National Mortgage Assoc. | | | 5.500 | | | | 09/01/33 | | | | 71 | | | | 77,959 | |
Federal National Mortgage Assoc. | | | 5.500 | | | | 01/01/34 | | | | 28 | | | | 30,570 | |
Federal National Mortgage Assoc. | | | 5.500 | | | | 01/01/34 | | | | 38 | | | | 41,348 | |
Federal National Mortgage Assoc. | | | 5.500 | | | | 07/01/34 | | | | 47 | | | | 51,631 | |
Federal National Mortgage Assoc. | | | 6.000 | | | | 09/01/21 | | | | 1 | | | | 580 | |
Federal National Mortgage Assoc. | | | 6.000 | | | | 11/01/33 | | | | 45 | | | | 48,565 | |
Federal National Mortgage Assoc. | | | 6.000 | | | | 01/01/34 | | | | 10 | | | | 10,808 | |
Federal National Mortgage Assoc. | | | 6.000 | | | | 01/01/34 | | | | 116 | | | | 127,840 | |
Federal National Mortgage Assoc. | | | 6.000 | | | | 02/01/34 | | | | 13 | | | | 14,700 | |
Federal National Mortgage Assoc. | | | 6.000 | | | | 10/01/34 | | | | 5 | | | | 5,357 | |
Federal National Mortgage Assoc. | | | 6.000 | | | | 10/01/34 | | | | 6 | | | | 6,157 | |
Federal National Mortgage Assoc. | | | 6.000 | | | | 11/01/34 | | | | 11 | | | | 11,880 | |
Federal National Mortgage Assoc. | | | 6.000 | | | | 11/01/34 | | | | 27 | | | | 29,339 | |
Federal National Mortgage Assoc. | | | 6.000 | | | | 11/01/34 | | | | 77 | | | | 84,512 | |
Federal National Mortgage Assoc. | | | 6.000 | | | | 01/01/35 | | | | 12 | | | | 13,222 | |
Federal National Mortgage Assoc. | | | 6.000 | | | | 01/01/35 | | | | 63 | | | | 67,484 | |
Federal National Mortgage Assoc. | | | 6.000 | | | | 02/01/35 | | | | 59 | | | | 66,524 | |
Federal National Mortgage Assoc. | | | 6.000 | | | | 08/01/36 | | | | 31 | | | | 34,012 | |
Federal National Mortgage Assoc. | | | 6.000 | | | | 08/01/38 | | | | 7 | | | | 7,682 | |
Federal National Mortgage Assoc. | | | 6.250 | | | | 05/15/29 | | | | 70 | | | | 92,046 | |
Federal National Mortgage Assoc. | | | 6.500 | | | | 05/01/24 | | | | 12 | | | | 13,443 | |
Federal National Mortgage Assoc. | | | 6.500 | | | | 07/01/29 | | | | 16 | | | | 17,761 | |
Federal National Mortgage Assoc. | | | 6.500 | | | | 07/01/32 | | | | 15 | | | | 16,320 | |
See Notes to Financial Statements.
Schedule of Investments(unaudited) (continued)
as of March 31, 2019
| | | | | | | | | | | | | | | | |
| | | | |
| Description | | Interest
Rate | | | Maturity
Date | | | Principal
Amount (000)# | | | Value | |
| |
U.S. GOVERNMENT AGENCY OBLIGATIONS (Continued) | | | | | |
Federal National Mortgage Assoc. | | | 6.500 | % | | | 09/01/32 | | | | 5 | | | $ | 5,144 | |
Federal National Mortgage Assoc. | | | 6.500 | | | | 04/01/33 | | | | 14 | | | | 16,213 | |
Federal National Mortgage Assoc. | | | 6.500 | | | | 01/01/34 | | | | 13 | | | | 13,990 | |
Federal National Mortgage Assoc. | | | 6.500 | | | | 01/01/34 | | | | 22 | | | | 24,387 | |
Federal National Mortgage Assoc. | | | 6.500 | | | | 10/01/36 | | | | 29 | | | | 32,430 | |
Federal National Mortgage Assoc. | | | 6.500 | | | | 09/01/37 | | | | 74 | | | | 83,884 | |
Federal National Mortgage Assoc. | | | 6.500 | | | | 10/01/37 | | | | 75 | | | | 83,439 | |
Federal National Mortgage Assoc.(k) | | | 6.625 | | | | 11/15/30 | | | | 145 | | | | 199,674 | |
Federal National Mortgage Assoc. | | | 7.000 | | | | 06/01/32 | | | | 15 | | | | 16,938 | |
Federal National Mortgage Assoc.(k) | | | 7.125 | | | | 01/15/30 | | | | 380 | | | | 533,197 | |
Federal National Mortgage Assoc. | | | 7.500 | | | | 09/01/30 | | | | 1 | | | | 1,176 | |
Federal National Mortgage Assoc. | | | 8.000 | | | | 12/01/23 | | | | 1 | | | | 1,182 | |
Federal National Mortgage Assoc. | | | 8.500 | | | | 02/01/28 | | | | 2 | | | | 2,887 | |
Government National Mortgage Assoc. | | | 2.500 | | | | 03/20/43 | | | | 218 | | | | 215,443 | |
Government National Mortgage Assoc. | | | 2.500 | | | | 12/20/46 | | | | 124 | | | | 121,131 | |
Government National Mortgage Assoc. | | | 3.000 | | | | 09/20/43 | | | | 267 | | | | 268,989 | |
Government National Mortgage Assoc. | | | 3.000 | | | | 01/20/44 | | | | 82 | | | | 82,359 | |
Government National Mortgage Assoc. | | | 3.000 | | | | 03/15/45 | | | | 269 | | | | 270,534 | |
Government National Mortgage Assoc. | | | 3.000 | | | | 05/20/45 | | | | 380 | | | | 382,076 | |
Government National Mortgage Assoc. | | | 3.000 | | | | 06/20/46 | | | | 559 | | | | 561,952 | |
Government National Mortgage Assoc. | | | 3.000 | | | | 12/20/46 | | | | 876 | | | | 881,613 | |
Government National Mortgage Assoc. | | | 3.000 | | | | 01/20/47 | | | | 800 | | | | 805,071 | |
Government National Mortgage Assoc. | | | 3.000 | | | | 03/20/47 | | | | 395 | | | | 397,634 | |
Government National Mortgage Assoc. | | | 3.500 | | | | 11/20/41 | | | | 352 | | | | 361,148 | |
Government National Mortgage Assoc. | | | 3.500 | | | | 12/20/42 | | | | 356 | | | | 365,470 | |
Government National Mortgage Assoc. | | | 3.500 | | | | 09/20/43 | | | | 1,253 | | | | 1,284,747 | |
Government National Mortgage Assoc. | | | 3.500 | | | | 03/20/45 | | | | 245 | | | | 250,675 | |
Government National Mortgage Assoc. | | | 3.500 | | | | 04/20/45 | | | | 276 | | | | 282,696 | |
Government National Mortgage Assoc. | | | 3.500 | | | | 04/20/46 | | | | 912 | | | | 933,284 | |
Government National Mortgage Assoc. | | | 3.500 | | | | 07/20/46 | | | | 1,767 | | | | 1,808,312 | |
Government National Mortgage Assoc.(tt) | | | 4.000 | | | | TBA | | | | 500 | | | | 515,791 | |
Government National Mortgage Assoc. | | | 4.000 | | | | 12/20/42 | | | | 715 | | | | 744,326 | |
Government National Mortgage Assoc. | | | 4.000 | | | | 11/20/45 | | | | 394 | | | | 409,310 | |
Government National Mortgage Assoc. | | | 4.000 | | | | 10/20/46 | | | | 107 | | | | 111,107 | |
Government National Mortgage Assoc. | | | 4.000 | | | | 11/20/46 | | | | 145 | | | | 151,003 | |
Government National Mortgage Assoc. | | | 4.000 | | | | 09/20/47 | | | | 413 | | | | 426,281 | |
Government National Mortgage Assoc. | | | 4.500 | | | | 06/20/41 | | | | 300 | | | | 315,778 | |
Government National Mortgage Assoc. | | | 4.500 | | | | 06/20/45 | | | | 212 | | | | 221,881 | |
Government National Mortgage Assoc. | | | 4.500 | | | | 11/20/46 | | | | 637 | | | | 672,850 | |
Government National Mortgage Assoc. | | | 4.500 | | | | 08/20/47 | | | | 466 | | | | 483,885 | |
Government National Mortgage Assoc. | | | 4.500 | | | | 05/20/48 | | | | 1,614 | | | | 1,676,993 | |
Government National Mortgage Assoc. | | | 4.500 | | | | 08/20/48 | | | | 500 | | | | 519,422 | |
Government National Mortgage Assoc. | | | 5.000 | | | | 10/20/37 | | | | 17 | | | | 17,739 | |
Government National Mortgage Assoc. | | | 5.000 | | | | 04/20/45 | | | | 125 | | | | 133,326 | |
Government National Mortgage Assoc. | | | 5.500 | | | | 07/15/33 | | | | 29 | | | | 31,125 | |
See Notes to Financial Statements.
| | | | | | | | | | | | | | | | |
| | | | |
| Description | | Interest
Rate | | | Maturity
Date | | | Principal
Amount (000)# | | | Value | |
| |
U.S. GOVERNMENT AGENCY OBLIGATIONS (Continued) | | | | | |
Government National Mortgage Assoc. | | | 5.500 | % | | | 12/15/33 | | | | 17 | | | $ | 17,812 | |
Government National Mortgage Assoc. | | | 5.500 | | | | 09/15/34 | | | | 107 | | | | 114,354 | |
Government National Mortgage Assoc. | | | 5.500 | | | | 01/15/36 | | | | 64 | | | | 70,611 | |
Government National Mortgage Assoc. | | | 5.500 | | | | 02/15/36 | | | | 129 | | | | 138,386 | |
Government National Mortgage Assoc. | | | 6.500 | | | | 09/15/23 | | | | 8 | | | | 8,500 | |
Government National Mortgage Assoc. | | | 6.500 | | | | 10/15/23 | | | | 3 | | | | 3,395 | |
Government National Mortgage Assoc. | | | 6.500 | | | | 11/15/23 | | | | 1 | | | | 1,257 | |
Government National Mortgage Assoc. | | | 6.500 | | | | 12/15/23 | | | | 1 | | | | 1,076 | |
Government National Mortgage Assoc. | | | 6.500 | | | | 12/15/23 | | | | 4 | | | | 3,954 | |
Government National Mortgage Assoc. | | | 6.500 | | | | 12/15/23 | | | | 6 | | | | 6,202 | |
Government National Mortgage Assoc. | | | 6.500 | | | | 04/15/24 | | | | 41 | | | | 44,921 | |
Government National Mortgage Assoc. | | | 6.500 | | | | 07/15/32 | | | | 2 | | | | 2,672 | |
Government National Mortgage Assoc. | | | 6.500 | | | | 08/15/32 | | | | — | (r) | | | 375 | |
Government National Mortgage Assoc. | | | 6.500 | | | | 08/15/32 | | | | 1 | | | | 804 | |
Government National Mortgage Assoc. | | | 6.500 | | | | 08/15/32 | | | | 2 | | | | 1,821 | |
Government National Mortgage Assoc. | | | 6.500 | | | | 08/15/32 | | | | 12 | | | | 14,077 | |
Government National Mortgage Assoc. | | | 7.000 | | | | 06/15/24 | | | | 11 | | | | 12,266 | |
Government National Mortgage Assoc. | | | 7.000 | | | | 05/15/31 | | | | 7 | | | | 7,735 | |
Government National Mortgage Assoc. | | | 7.500 | | | | 04/15/29 | | | | 1 | | | | 658 | |
Government National Mortgage Assoc. | | | 7.500 | | | | 12/15/29 | | | | 3 | | | | 3,050 | |
Government National Mortgage Assoc. | | | 8.000 | | | | 08/15/22 | | | | 1 | | | | 828 | |
Government National Mortgage Assoc. | | | 8.000 | | | | 12/15/22 | | | | 2 | | | | 2,498 | |
Government National Mortgage Assoc. | | | 8.000 | | | | 12/15/22 | | | | 5 | | | | 4,999 | |
Government National Mortgage Assoc. | | | 8.000 | | | | 06/15/25 | | | | 20 | | | | 21,141 | |
Hashemite Kingdom of Jordan, USAID Bond, U.S. Gov’t. Gtd. Notes | | | 3.000 | | | | 06/30/25 | | | | 315 | | | | 323,644 | |
Tennessee Valley Authority, Sr. Unsec’d. Notes | | | 7.125 | | | | 05/01/30 | | | | 90 | | | | 126,397 | |
| | | | | | | | | | | | | | | | |
TOTAL U.S. GOVERNMENT AGENCY OBLIGATIONS
(cost $48,818,420) | | | | 49,065,181 | |
| | | | | | | | | | | | | | | | |
| | | | |
U.S. TREASURY OBLIGATIONS 1.1% | | | | | | | | | | | | | | | | |
U.S. Treasury Notes | | | 1.125 | | | | 02/28/21 | | | | 245 | | | | 239,612 | |
U.S. Treasury Notes | | | 2.375 | | | | 02/29/24 | | | | 1,505 | | | | 1,514,818 | |
U.S. Treasury Notes | | | 2.375 | | | | 08/15/24 | | | | 280 | | | | 281,411 | |
U.S. Treasury Notes | | | 2.500 | | | | 12/31/20 | | | | 1,000 | | | | 1,003,008 | |
U.S. Treasury Notes | | | 2.625 | | | | 11/15/20 | | | | 830 | | | | 833,631 | |
U.S. Treasury Notes | | | 2.625 | | | | 02/15/29 | | | | 55 | | | | 56,010 | |
U.S. Treasury Notes | | | 2.750 | | | | 04/30/23 | | | | 1,580 | | | | 1,611,168 | |
U.S. Treasury Strips Coupon(k) | | | 2.502 | (s) | | | 11/15/30 | | | | 640 | | | | 474,827 | |
U.S. Treasury Strips Coupon | | | 2.752 | (s) | | | 08/15/30 | | | | 605 | | | | 452,506 | |
U.S. Treasury Strips Coupon | | | 2.783 | (s) | | | 08/15/29 | | | | 200 | | | | 153,909 | |
U.S. Treasury Strips Coupon | | | 2.878 | (s) | | | 05/15/31 | | | | 200 | | | | 146,284 | |
See Notes to Financial Statements.
Schedule of Investments(unaudited) (continued)
as of March 31, 2019
| | | | | | | | | | | | | | | | |
| | | | |
| Description | | Interest
Rate | | | Maturity
Date | | | Principal
Amount (000)# | | | Value | |
| | |
U.S. TREASURY OBLIGATIONS (Continued) | | | | | | | | | |
U.S. Treasury Strips Coupon | | | 3.042 | %(s) | | | 11/15/35 | | | | 400 | | | $ | 254,937 | |
| | | | | | | | | | | | | | | | |
TOTAL U.S. TREASURY OBLIGATIONS
(cost $6,955,209) | | | | 7,022,121 | |
| | | | | | | | | | | | | | | | |
TOTAL LONG-TERM INVESTMENTS
(cost $557,064,041) | | | | 626,504,187 | |
| | | | | | | | | | | | | | | | |
| | | | |
| | | | | | | | | Shares | | | | |
| | | |
SHORT-TERM INVESTMENTS 2.6% | | | | | | | | | | | | | |
| | | |
AFFILIATED MUTUAL FUNDS 2.5% | | | | | | | | | | | | | |
PGIM Core Short-Term Bond Fund(w) | | | | 154,043 | | | | 1,421,813 | |
PGIM Core Ultra Short Bond Fund(w) | | | | 11,407,396 | | | | 11,407,396 | |
PGIM Institutional Money Market Fund
(cost $3,274,522; includes $3,266,548 of cash collateral for securities on loan)(b)(w) | | | | | | | | | | | 3,273,880 | | | | 3,274,535 | |
| | | | | | | | | | | | | | | | |
TOTAL AFFILIATED MUTUAL FUNDS
(cost $15,906,897) | | | | 16,103,744 | |
| | | | | | | | | | | | | | | | |
| | | |
OPTIONS PURCHASED*~ 0.0%
(cost $31,535) | | | | | | | | | | | | 111,742 | |
| | | | | | | | | | | | | | | | |
| | | | |
| | | Interest Rate | | | Maturity Date | | | Principal Amount (000)# | | | | |
| | | |
U.S. TREASURY OBLIGATION(k)(n) 0.1% | | | | | | | | | | | | | |
U.S. Treasury Bills
(cost $288,444) | | | 2.461 | % | | | 06/20/19 | | | | 290 | | | | 288,477 | |
| | | | | | | | | | | | | | | | |
TOTAL SHORT-TERM INVESTMENTS
(cost $16,226,876) | | | | 16,503,963 | |
| | | | | | | | | | | | | | | | |
| |
TOTAL INVESTMENTS, BEFORE OPTIONS WRITTEN
(cost $573,290,917) | | | | 643,008,150 | |
| | | | | | | | | | | | | | | | |
| | |
OPTION WRITTEN*~ (0.0)%
(premiums received $6,954) | | | | | | | | (7,125 | ) |
| | | | | | | | | | | | | | | | |
| | | |
TOTAL INVESTMENTS, NET OF OPTIONS WRITTEN 99.5%
(cost $573,283,963) | | | | | | | | | | | | 643,001,025 | |
Other assets in excess of liabilities(z) 0.5% | | | | | | | | | | | | | | | 3,371,873 | |
| | | | | | | | | | | | | | | | |
| | |
NET ASSETS 100.0% | | | | | | | $ | 646,372,898 | |
| | | | | | | | | | | | | | | | |
See Notes to Financial Statements.
Below is a list of the abbreviation(s) used in the semiannual report:
EUR—Euro
USD—US Dollar
144A—Security was purchased pursuant to Rule 144A under the Securities Act of 1933 and, pursuant to the requirements of Rule 144A, may not be resold except to qualified institutional buyers.
A—Annual payment frequency for swaps
Aces—Alternative Credit Enhancements Securities
ADR—American Depositary Receipt
BABs—Build America Bonds
CLO—Collateralized Loan Obligation
CMS—Constant Maturity Swap
CVA—Certificate Van Aandelen (Bearer)
EAFE—Europe, Australasia, Far East
EMTN—Euro Medium Term Note
EONIA—Euro Overnight Index Average
ETF—Exchange-Traded Fund
EURIBOR—Euro Interbank Offered Rate
FHLMC—Federal Home Loan Mortgage Corporation
FTSE—Financial Times Stock Exchange
GMTN—Global Medium Term Note
GO—General Obligation
IO—Interest Only (Principal amount represents notional)
LIBOR—London Interbank Offered Rate
MSCI—Morgan Stanley Capital International
MTN—Medium Term Note
OTC—Over-the-counter
PRFC—Preference Shares
Q—Quarterly payment frequency for swaps
REIT(s)—Real Estate Investment Trust(s)
RSP—Savings Shares
S—Semiannual payment frequency for swaps
S&P—Standard & Poor’s
SDR—Sweden Depositary Receipt
SLM—Student Loan Mortgage
STACR—Structured Agency Credit Risk
STOXX—Stock Index of the Eurozone
Strips—Separate Trading of Registered Interest and Principal of Securities
TBA—To Be Announced
TOPIX—Tokyo Stock Price Index
USAID—United States Agency for International Development
USOIS—United States Overnight Index Swap
UTS—Unit Trust Security
| * | Non-income producing security. |
| # | Principal or notional amount is shown in U.S. dollars unless otherwise stated. |
| ~ | See tables subsequent to the Schedule of Investments for options detail. |
| ^ | Indicates a Level 3 security. The aggregate value of Level 3 securities is $(4,273) and (0.0)% of net assets. |
| (a) | All or a portion of security is on loan. The aggregate market value of such securities, including those sold and pending settlement, is $3,225,360; cash collateral of $3,266,548 (included in liabilities) was received with which the Series purchased highly liquid short-term investments. |
| (b) | Represents security purchased with cash collateral received for securities on loan and includes dividend reinvestment. |
| (c) | Variable rate instrument. The interest rate shown reflects the rate in effect at March 31, 2019. |
See Notes to Financial Statements.
Schedule of Investments(unaudited) (continued)
as of March 31, 2019
| (cc) | Variable rate instrument. The rate shown is based on the latest available information as of March 31, 2019. Certain variable rate securities are not based on a published reference rate and spread but are determined by the issuer or agent and are based on current market conditions. These securities do not indicate a reference rate and spread in their description. |
| (d) | Represents issuer in default on interest payments and/or principal repayment.Non-income producing security. Such securities may be post-maturity. |
| (ff) | Variable rate security. Security may be issued at a fixed coupon rate, which converts to a variable rate at a specified date. Rate shown is the rate in effect as of period end. |
| (k) | Represents security, or a portion thereof, segregated as collateral for centrally cleared/exchange-traded derivatives. (n) Rate shown reflects yield to maturity at purchased date. |
| (rr) | Perpetual security with no stated maturity date. |
| (s) | Represents zero coupon bond or principal only security. Rate represents yield to maturity at purchase date. |
| (tt) | All or partial principal amount represents “TBA” mortgage dollar rolls. The aggregate mortgage dollar roll principal amount of 2,750,000 is 0.4% of net assets. |
| (w) | PGIM Investments LLC, the manager of the Fund, also serves as manager of the PGIM Core Short-Term Bond Fund, PGIM Core Ultra Short Bond Fund and PGIM Institutional Money Market Fund. |
| (z) | Includes net unrealized appreciation/(depreciation) and/or market value of the below holdings which are excluded from the Schedule of Investments: |
Options Purchased:
Exchange Traded
| | | | | | | | | | | | | | | | | | | | | | | | |
Description | | Call/
Put | | | Expiration
Date | | | Strike | | | Contracts | | | Notional
Amount
(000)# | | | Value | |
| 2 Year U.S Treasury Notes Futures | | | Put | | | | 04/26/19 | | | | $106.00 | | | | 57 | | | | 114 | | | $ | 891 | |
| 2 Year U.S Treasury Notes Futures | | | Put | | | | 04/26/19 | | | | $106.63 | | | | 57 | | | | 114 | | | | 22,266 | |
| 5 Year U.S Treasury Notes Futures | | | Put | | | | 04/26/19 | | | | $115.00 | | | | 96 | | | | 96 | | | | 6,000 | |
| | | | | | | | | | | | | | | | | | | | | | | | |
Total Exchange Traded(cost $27,409) | | | | | | | | | | | | | | | | | | | | | | $ | 29,157 | |
| | | | | | | | | | | | | | | | | | | | | | | | |
OTC Traded
| | | | | | | | | | | | | | | | | | | | | | | | | | | | |
Description | | Call/
Put | | | Counterparty | | | Expiration
Date | | | Strike | | | Contracts | | | Notional
Amount
(000)# | | | Value | |
| | | | | | | Morgan Stanley & Co. | | | | | | | | | | | | | | | | | | | | | |
| 2- Year 10 CMS Curve CAP | | | Call | | | | International PLC | | | | 11/21/19 | | | | 0.13% | | | | — | | | | 100 | | | $ | 518 | |
| 2- Year 10 CMS Curve CAP | | | Call | | | | Barclays Bank PLC | | | | 11/21/19 | | | | 0.12% | | | | — | | | | 200 | | | | 1,111 | |
| 2- Year 10 CMS Curve CAP | | | Call | | | | Barclays Bank PLC | | | | 07/12/21 | | | | 0.11% | | | | — | | | | 577 | | | | 5,238 | |
| 2- Year 10 CMS Curve CAP | | | Call | | | | Barclays Bank PLC | | | | 07/13/21 | | | | 0.11% | | | | — | | | | 561 | | | | 5,094 | |
| 2- Year 10 CMS Curve CAP | | | Call | | | | Bank of America, N.A. | | | | 08/16/21 | | | | 0.15% | | | | — | | | | 1,402 | | | | 11,997 | |
| 2- Year 10 CMS Curve CAP | | | Call | | | | Bank of America, N.A. | | | | 08/20/21 | | | | 0.15% | | | | — | | | | 2,784 | | | | 25,969 | |
| 2- Year 10 CMS Curve CAP | | | Call | | | | Bank of America, N.A. | | | | 09/13/21 | | | | 0.14% | | | | — | | | | 2,820 | | | | 27,127 | |
| 2- Year 10 CMS Curve CAP | | | Call | | | | Barclays Bank PLC | | | | 11/09/21 | | | | 0.21% | | | | — | | | | 561 | | | | 5,531 | |
| | | | | | | | | | | | | | | | | | | | | | | | | | | | |
Total OTC Traded(cost $4,126) | | | | | | | | | | | | | | | | | | | | | | | | | | $ | 82,585 | |
| | | | | | | | | | | | | | | | | | | | | | | | | | | | |
Total Options Purchased(cost $31,535) | | | | | | | | | | | | | | | | | | | | | | | | | | $ | 111,742 | |
| | | | | | | | | | | | | | | | | | | | | | | | | | | | |
See Notes to Financial Statements.
Options Written:
Exchange Traded
| | | | | | | | | | | | | | | | | | | | | | | | |
Description | | Call/
Put | | | Expiration
Date | | | Strike | | | Contracts | | | Notional
Amount
(000)# | | | Value | |
2 Year U.S Treasury Notes Futures | | | Put | | | | 04/26/19 | | | $ | 106.25 | | | | 114 | | | | 228 | | | $ | (7,125 | ) |
| | | | | | | | | | | | | | | | | | | | | | | | |
(premiums received $6,954) | | | | | | | | | | | | | | | | | | | | | | | | |
Futures contracts outstanding at March 31, 2019:
| | | | | | | | | | | | | | | | |
Number of
Contracts | | | Type | | Expiration
Date | | | Current
Notional
Amount | | | Value /
Unrealized
Appreciation
(Depreciation) | |
| | | | Long Positions: | | | | | | | | | | | | |
| | 86 | | | 2 Year U.S. Treasury Notes | | | Jun. 2019 | | | $ | 18,326,062 | | | $ | 65,409 | |
| | 360 | | | 5 Year U.S. Treasury Notes | | | Jun. 2019 | | | | 41,698,125 | | | | 360,172 | |
| | 41 | | | 10 Year U.S. Ultra Treasury Notes | | | Jun. 2019 | | | | 5,444,031 | | | | 82,254 | |
| | 165 | | | 30 Year U.S. Ultra Treasury Bonds | | | Jun. 2019 | | | | 27,720,000 | | | | 983,976 | |
| | 5 | | | Euro STOXX 50 Index | | | Jun. 2019 | | | | 183,519 | | | | 2,736 | |
| | 1 | | | FTSE 100 Index | | | Jun. 2019 | | | | 93,927 | | | | 2,192 | |
| | 4 | | | Mini MSCI EAFE Index | | | Jun. 2019 | | | | 373,280 | | | | 2,861 | |
| | 11 | | | S&P 500E-Mini Index | | | Jun. 2019 | | | | 1,560,790 | | | | 47,104 | |
| | 1 | | | TOPIX Index | | | Jun. 2019 | | | | 143,643 | | | | (1,105 | ) |
| | | | | | | | | | | | | | | | |
| | | | | | | | | | | | | | | 1,545,599 | |
| | | | | | | | | | | | | | | | |
| | | | Short Positions: | | | | | | | | | | | | |
| | 1 | | | 10 Year Euro-Bund | | | Jun. 2019 | | | | 186,593 | | | | (3,711 | ) |
| | 119 | | | 10 Year U.S. Treasury Notes | | | Jun. 2019 | | | | 14,782,031 | | | | (166,140 | ) |
| | 102 | | | 20 Year U.S. Treasury Bonds | | | Jun. 2019 | | | | 15,264,938 | | | | (366,191 | ) |
| | | | | | | | | | | | | | | | |
| | | | | | | | | | | | | | | (536,042 | ) |
| | | | | | | | | | | | | | | | |
| | | | | | | | | | | | | | $ | 1,009,557 | |
| | | | | | | | | | | | | | | | |
Forward foreign currency exchange contracts outstanding at March 31, 2019:
| | | | | | | | | | | | | | | | | | | | | | | | | | |
Sale Contracts | | Counterparty | | Notional
Amount
(000) | | | Value at
Settlement
Date | | | Current
Value | | | Unrealized
Appreciation | | | Unrealized
Depreciation | |
OTC Forward Foreign Currency Exchange Contracts: | |
Euro, | | | | | | | | | | | | | | | | | | | | | | | | | | |
Expiring 04/17/19 | | BNP Paribas S.A. | | | EUR | | | | 1,113 | | | $ | 1,271,367 | | | $ | 1,249,828 | | | $ | 21,539 | | | $ | — | |
Expiring 04/17/19 | | BNP Paribas S.A. | | | EUR | | | | 310 | | | | 351,269 | | | | 347,701 | | | | 3,568 | | | | — | |
Expiring 04/17/19 | | JPMorgan Chase Bank, N.A. | | | EUR | | | | 55 | | | | 62,084 | | | | 61,469 | | | | 615 | | | | — | |
| | | | | | | | | | | | | | | | | | | | | | | | | | |
| | | | | | | | | | | | $ | 1,684,720 | | | $ | 1,658,998 | | | $ | 25,722 | | | $ | — | |
| | | | | | | | | | | | | | | | | | | | | | | | | | |
See Notes to Financial Statements.
Schedule of Investments(unaudited) (continued)
as of March 31, 2019
Forward rate agreements outstanding at March 31, 2019:
| | | | | | | | | | | | | | | | | | | | | | | | | | |
Notional
Amount
(000)# | | | Termination
Date(5) | | | Fixed
Rate | | | Floating
Rate | | Fair
Value | | | Upfront
Premiums
Paid
(Received) | | | Unrealized
Appreciation
(Depreciation) | | | Counterparty |
| | OTC Forward Rate Agreements^: |
| | 16,000 | | | | 04/15/19 | | | | —(3) | | | —(3) | | $ | 1,274 | | | $ | — | | | $ | 1,274 | | | Citigroup Global Markets Inc. |
| | 44,100 | | | | 04/23/19 | | | | —(4) | | | —(4) | | | (5,547 | ) | | | — | | | | (5,547 | ) | | Citigroup Global Markets Inc. |
| | | | | | | | | | | | | | | | | | | | | | | | | | |
| | | | | | | | | | | | | | $ | (4,273 | ) | | $ | — | | | $ | (4,273 | ) | | |
| | | | | | | | | | | | | | | | | | | | | | | | | | |
| (1) | The Series pays the fixed rate and receives the floating rate. |
| (2) | The Series pays the floating rate and receives the fixed rate. |
| (3) | The Series pays or receives payments based on CMM102 minus 7 Year CMS minus 1.3705% upon termination. |
| (4) | The Series pays or receives payments based on CMM102 minus 7 Year CMS minus 1.3526% upon termination. |
| (5) | The Series may choose to terminate these agreements at any time prior to the stated termination date. |
Interest rate swap agreements outstanding at March 31, 2019:
| | | | | | | | | | | | | | | | | | | | | | | | |
Notional
Amount
(000)# | | | Termination
Date | | | Fixed
Rate | | | Floating Rate | | Value at
Trade
Date | | | Value at
March 31,
2019 | | | Unrealized
Appreciaton
(Depreciation) | |
| | Centrally Cleared Interest Rate Swap Agreements: | |
| | EUR 715 | | | | 05/11/24 | | | | 0.396%(A) | | | 6 Month EURIBOR(1)(S) | | $ | 4,843 | | | $ | (19,122 | ) | | $ | (23,965 | ) |
| | EUR 230 | | | | 05/11/39 | | | | 1.100%(A) | | | 1 Day EONIA(1)(A) | | | (2,089 | ) | | | (13,067 | ) | | | (10,978 | ) |
| | 4,030 | | | | 03/23/21 | | | | 2.370%(A) | | | 1 Day USOIS(1)(A) | | | — | | | | (19,196 | ) | | | (19,196 | ) |
| | 235 | | | | 09/27/21 | | | | 2.330%(A) | | | 1 Day USOIS(1)(A) | | | (66 | ) | | | (1,455 | ) | | | (1,389 | ) |
| | 115 | | | | 05/31/22 | | | | 2.353%(A) | | | 1 Day USOIS(1)(A) | | | — | | | | (1,296 | ) | | | (1,296 | ) |
| | 610 | | | | 02/15/24 | | | | 2.115%(S) | | | 3 Month LIBOR(1)(Q) | | | 1,557 | | | | 5,494 | | | | 3,937 | |
| | 1,469 | | | | 02/15/24 | | | | 2.151%(S) | | | 3 Month LIBOR(1)(Q) | | | (1,708 | ) | | | 10,734 | | | | 12,442 | |
| | 375 | | | | 02/15/24 | | | | 2.167%(S) | | | 3 Month LIBOR(1)(Q) | | | (3,436 | ) | | | 2,456 | | | | 5,892 | |
| | 850 | | | | 02/15/24 | | | | 2.183%(S) | | | 3 Month LIBOR(1)(Q) | | | (1,674 | ) | | | 4,782 | | | | 6,456 | |
| | 5,400 | | | | 03/29/24 | | | | 1.949%(A) | | | 1 Day USOIS(1)(A) | | | — | | | | 19,172 | | | | 19,172 | |
| | 500 | | | | 08/15/24 | | | | 2.168%(S) | | | 3 Month LIBOR(1)(Q) | | | — | | | | 3,629 | | | | 3,629 | |
| | 4,805 | | | | 08/15/24 | | | | 2.170%(S) | | | 3 Month LIBOR(1)(Q) | | | 14,820 | | | | 34,463 | | | | 19,643 | |
| | 3,435 | | | | 08/15/24 | | | | 2.176%(S) | | | 3 Month LIBOR(1)(Q) | | | 6,488 | | | | 23,643 | | | | 17,155 | |
| | 2,215 | | | | 11/15/24 | | | | 2.334%(S) | | | 3 Month LIBOR(1)(Q) | | | 6,716 | | | | (15,713 | ) | | | (22,429 | ) |
| | 1,605 | | | | 02/12/25 | | | | 2.408%(A) | | | 1 Day USOIS(1)(A) | | | — | | | | (33,261 | ) | | | (33,261 | ) |
| | 1,309 | | | | 05/31/25 | | | | 2.998%(S) | | | 3 Month LIBOR(1)(Q) | | | (922 | ) | | | (62,049 | ) | | | (61,127 | ) |
| | 1,545 | | | | 07/31/25 | | | | 3.105%(S) | | | 3 Month LIBOR(1)(Q) | | | 1,219 | | | | (72,895 | ) | | | (74,114 | ) |
| | 2,589 | | | | 07/31/25 | | | | 3.109%(S) | | | 3 Month LIBOR(1)(Q) | | | 63 | | | | (122,848 | ) | | | (122,911 | ) |
| | 4,325 | | | | 01/08/26 | | | | 2.210%(S) | | | 3 Month LIBOR(1)(Q) | | | 35,345 | | | | 37,861 | | | | 2,516 | |
| | 125 | | | | 01/31/26 | | | | 2.236%(S) | | | 3 Month LIBOR(1)(Q) | | | — | | | | 578 | | | | 578 | |
| | 120 | | | | 01/31/26 | | | | 2.269%(A) | | | 1 Day USOIS(1)(A) | | | — | | | | (1,685 | ) | | | (1,685 | ) |
| | 921 | | | | 02/15/27 | | | | 1.824%(A) | | | 1 Day USOIS(1)(A) | | | 12,290 | | | | 17,606 | | | | 5,316 | |
| | 390 | | | | 02/15/27 | | | | 1.899%(A) | | | 1 Day USOIS(1)(A) | | | 495 | | | | 5,281 | | | | 4,786 | |
See Notes to Financial Statements.
Interest rate swap agreements outstanding at March 31, 2019 (continued):
| | | | | | | | | | | | | | | | | | | | | | | | |
Notional
Amount
(000)# | | | Termination
Date | | | Fixed
Rate | | | Floating Rate | | Value at
Trade
Date | | | Value at
March 31,
2019 | | | Unrealized
Appreciaton
(Depreciation) | |
| | Centrally Cleared Interest Rate Swap Agreements (cont’d.): | |
| | 265 | | | | 02/15/27 | | | | 1.965%(A) | | | 1 Day USOIS(1)(A) | | $ | — | | | $ | 2,292 | | | $ | 2,292 | |
| | 655 | | | | 02/15/27 | | | | 2.067%(A) | | | 1 Day USOIS(1)(A) | | | (362 | ) | | | 657 | | | | 1,019 | |
| | 130 | | | | 05/15/27 | | | | 2.295%(S) | | | 3 Month LIBOR(1)(Q) | | | — | | | | (70 | ) | | | (70 | ) |
| | 2,638 | | | | 08/15/28 | | | | 2.579%(A) | | | 1 Day USOIS(1)(A) | | | (54,088 | ) | | | (103,010 | ) | | | (48,922 | ) |
| | 892 | | | | 08/15/28 | | | | 2.835%(S) | | | 3 Month LIBOR(1)(Q) | | | (1,704 | ) | | | (33,269 | ) | | | (31,565 | ) |
| | | | | | | | | | | | | | | | | | | | | | | | |
| | | | | | | | | | | | | | $ | 17,787 | | | $ | (330,288 | ) | | $ | (348,075 | ) |
| | | | | | | | | | | | | | | | | | | | | | | | |
| (1) | The Series pays the fixed rate and receives the floating rate. |
| (2) | The Series pays the floating rate and receives the fixed rate. |
Balances Reported in the Statement of Assets and Liabilities for OTC Forward Rate Agreements:
| | | | | | | | | | | | | | | | |
| | | Premiums Paid | | | Premiums Received | | | Unrealized
Appreciation | | | Unrealized
Depreciation | |
OTC Forward Rate Agreements | | $ | — | | | $ | — | | | $ | 1,274 | | | $ | (5,547 | ) |
| | | | | | | | | | | | | | | | |
Summary of Collateral for Centrally Cleared/Exchange-traded Derivatives:
Cash and securities segregated as collateral to cover requirements for open centrally cleared/exchange-traded derivatives are listed by broker as follows:
| | | | | | | | |
Broker | | Cash and/or Foreign Currency | | | Securities Market Value | |
Citigroup Global Markets Inc. | | $ | 895,000 | | | $ | 1,021,206 | |
Goldman Sachs & Co. LLC | | | — | | | | 288,477 | |
| | | | | | | | |
Total | | $ | 895,000 | | | $ | 1,309,683 | |
| | | | | | | | |
Fair Value Measurements:
Various inputs are used in determining the value of the Series’ investments. These inputs are summarized in the three broad levels listed below.
Level 1—unadjusted quoted prices generally in active markets for identical securities.
Level 2—quoted prices for similar securities, interest rates and yield curves, prepayment speeds, foreign currency exchange rates and other observable inputs.
Level 3—unobservable inputs for securities valued in accordance with Board approved fair valuation procedures.
The following is a summary of the inputs used as of March 31, 2019 in valuing such portfolio securities:
| | | | | | | | | | | | |
| | | Level 1 | | | Level 2 | | | Level 3 | |
Investments in Securities | | | | | | | | | | | | |
Common Stocks | | $ | 361,423,032 | | | $ | 29,854,368 | | | $ | — | |
See Notes to Financial Statements.
Schedule of Investments(unaudited) (continued)
as of March 31, 2019
| | | | | | | | | | | | |
| | | Level 1 | | | Level 2 | | | Level 3 | |
Investments in Securities (continued) | |
Exchange-Traded Fund | | $ | 972,900 | | | $ | — | | | $ | — | |
Preferred Stocks | | | 209,450 | | | | 155,165 | | | | — | |
Asset-Backed Securities | | | | | | | | | | | | |
Automobiles | | | — | | | | 13,172,548 | | | | — | |
Collateralized Loan Obligations | | | — | | | | 10,170,801 | | | | — | |
Consumer Loans | | | — | | | | 1,969,121 | | | | — | |
Credit Cards | | | — | | | | 1,988,259 | | | | — | |
Equipment | | | — | | | | 2,000,749 | | | | — | |
Home Equity Loans | | | — | | | | 399,719 | | | | — | |
Other | | | — | | | | 345,145 | | | | — | |
Residential Mortgage-Backed Securities | | | — | | | | 4,794,983 | | | | — | |
Student Loans | | | — | | | | 4,901,648 | | | | — | |
Commercial Mortgage-Backed Securities | | | — | | | | 51,335,211 | | | | — | |
Corporate Bonds | | | — | | | | 70,200,423 | | | | — | |
Municipal Bonds | | | — | | | | 2,345,450 | | | | — | |
Residential Mortgage-Backed Securities | | | — | | | | 7,337,353 | | | | — | |
Sovereign Bonds | | | — | | | | 6,840,560 | | | | — | |
U.S. Government Agency Obligations | | | — | | | | 49,065,181 | | | | — | |
U.S. Treasury Obligations | | | — | | | | 7,310,598 | | | | — | |
Affiliated Mutual Funds | | | 16,103,744 | | | | — | | | | — | |
Options Purchased | | | 29,157 | | | | 82,585 | | | | — | |
Option Written | | | (7,125 | ) | | | — | | | | — | |
Other Financial Instruments* | | | | | | | | | | | | |
Futures Contracts | | | 1,009,557 | | | | — | | | | — | |
OTC Forward Foreign Currency Exchange Contracts | | | — | | | | 25,722 | | | | — | |
OTC Forward Rate Agreements | | | — | | | | — | | | | (4,273 | ) |
Centrally Cleared Interest Rate Swap Agreements | | | — | | | | (348,075 | ) | | | — | |
| | | | | | | | | | | | |
Total | | $ | 379,740,715 | | | $ | 263,947,514 | | | $ | (4,273 | ) |
| | | | | | | | | | | | |
| * | Other financial instruments are derivative instruments not reflected in the Schedule of Investments, such as futures, forwards and centrally cleared swap contracts, which are recorded at the unrealized appreciation (depreciation) on the instrument, and OTC swap contracts which are recorded at fair value. |
Industry Classification:
The industry classification of investments and other assets in excess of liabilities shown as a percentage of net assets as of March 31, 2019 were as follows:
| | | | |
Commercial Mortgage-Backed Securities | | | 7.9 | % |
U.S. Government Agency Obligations | | | 7.6 | |
Banks | | | 7.2 | |
Software | | | 4.1 | |
Pharmaceuticals | | | 3.3 | |
Oil, Gas & Consumable Fuels | | | 3.2 | |
Interactive Media & Services | | | 2.9 | |
Automobiles | | | 2.5 | |
| | | | |
Affiliated Mutual Funds (0.5% represents investments purchased with collateral from securities on loan) | | | 2.5 | % |
Health Care Equipment & Supplies | | | 2.4 | |
IT Services | | | 2.4 | |
Internet & Direct Marketing Retail | | | 2.3 | |
Technology Hardware, Storage & Peripherals | | | 2.0 | |
Biotechnology | | | 1.9 | |
See Notes to Financial Statements.
Industry Classification (continued):
| | | | |
Residential Mortgage-Backed Securities | | | 1.8 | % |
Semiconductors & Semiconductor Equipment | | | 1.8 | |
Collateralized Loan Obligations | | | 1.6 | |
Aerospace & Defense | | | 1.6 | |
Equity Real Estate Investment Trusts (REITs) | | | 1.6 | |
Diversified Telecommunication Services | | | 1.5 | |
Insurance | | | 1.5 | |
Beverages | | | 1.5 | |
Capital Markets | | | 1.4 | |
Health Care Providers & Services | | | 1.2 | |
Chemicals | | | 1.2 | |
U.S. Treasury Obligations | | | 1.2 | |
Food Products | | | 1.1 | |
Communications Equipment | | | 1.1 | |
Sovereign Bonds | | | 1.1 | |
Diversified Financial Services | | | 1.1 | |
Specialty Retail | | | 1.0 | |
Life Sciences Tools & Services | | | 1.0 | |
Industrial Conglomerates | | | 1.0 | |
Road & Rail | | | 0.9 | |
Electric Utilities | | | 0.9 | |
Electric | | | 0.9 | |
Entertainment | | | 0.9 | |
Media | | | 0.8 | |
Tobacco | | | 0.8 | |
Hotels, Restaurants & Leisure | | | 0.8 | |
Student Loans | | | 0.8 | |
Machinery | | | 0.7 | |
Household Products | | | 0.7 | |
Oil & Gas | | | 0.6 | |
Electronic Equipment, Instruments & Components | | | 0.6 | |
Food & Staples Retailing | | | 0.6 | |
Auto Manufacturers | | | 0.5 | |
Real Estate Management & Development | | | 0.5 | |
Multi-Utilities | | | 0.5 | |
Distributors | | | 0.5 | |
Consumer Finance | | | 0.5 | |
Airlines | | | 0.5 | |
Telecommunications | | | 0.4 | |
Independent Power & Renewable Electricity Producers | | | 0.4 | |
Metals & Mining | | | 0.4 | |
Textiles, Apparel & Luxury Goods | | | 0.4 | |
Trading Companies & Distributors | | | 0.4 | |
Municipal Bonds | | | 0.4 | |
Pipelines | | | 0.4 | |
| | | | |
Equipment | | | 0.3 | % |
Foods | | | 0.3 | |
Credit Cards | | | 0.3 | |
Consumer Loans | | | 0.3 | |
Multiline Retail | | | 0.3 | |
Construction & Engineering | | | 0.3 | |
Wireless Telecommunication Services | | | 0.3 | |
Building Products | | | 0.2 | |
Gas Utilities | | | 0.2 | |
Healthcare-Services | | | 0.2 | |
Professional Services | | | 0.2 | |
Commercial Services | | | 0.2 | |
Personal Products | | | 0.2 | |
Exchange-Traded Fund | | | 0.1 | |
Air Freight & Logistics | | | 0.1 | |
Thrifts & Mortgage Finance | | | 0.1 | |
Mortgage Real Estate Investment Trusts (REITs) | | | 0.1 | |
Energy Equipment & Services | | | 0.1 | |
Commercial Services & Supplies | | | 0.1 | |
Auto Components | | | 0.1 | |
Electrical Equipment | | | 0.1 | |
Gas | | | 0.1 | |
Transportation Infrastructure | | | 0.1 | |
Packaging & Containers | | | 0.1 | |
Healthcare-Products | | | 0.1 | |
Oil & Gas Services | | | 0.1 | |
Household Durables | | | 0.1 | |
Multi-National | | | 0.1 | |
Retail | | | 0.1 | |
Mining | | | 0.1 | |
Agriculture | | | 0.1 | |
Lodging | | | 0.1 | |
Transportation | | | 0.1 | |
Semiconductors | | | 0.1 | |
Construction Materials | | | 0.1 | |
Diversified Consumer Services | | | 0.1 | |
Building Materials | | | 0.1 | |
Computers | | | 0.1 | |
Containers & Packaging | | | 0.1 | |
Home Equity Loans | | | 0.1 | |
Real Estate Investment Trusts (REITs) | | | 0.1 | |
Miscellaneous Manufacturing | | | 0.1 | |
Other | | | 0.0 | * |
Health Care Technology | | | 0.0 | * |
Forest Products & Paper | | | 0.0 | * |
Water Utilities | | | 0.0 | * |
See Notes to Financial Statements.
Schedule of Investments(unaudited) (continued)
as of March 31, 2019
Industry Classification (continued):
| | | | |
Home Builders | | | 0.0 | *% |
Leisure Products | | | 0.0 | * |
Engineering & Construction | | | 0.0 | * |
Machinery-Diversified | | | 0.0 | * |
Electronics | | | 0.0 | * |
Options Purchased | | | 0.0 | * |
Paper & Forest Products | | | 0.0 | * |
Marine | | | 0.0 | * |
| | | | |
| | | 99.5 | |
Option Written | | | (0.0 | )* |
Other assets in excess of liabilities | | | 0.5 | |
| | | | |
| | | 100.0 | % |
| | | | |
Effects of Derivative Instruments on the Financial Statements and Primary Underlying Risk Exposure:
The Series invested in derivative instruments during the reporting period. The primary types of risk associated with these derivative instruments are equity contracts risk, foreign exchange contracts risk, and interest rate contracts risk. The effect of such derivative instruments on the Series’ financial position and financial performance as reflected in the Statement of Assets and Liabilities and Statement of Operations is presented in the summary below.
Fair values of derivative instruments as of March 31, 2019 as presented in the Statement of Assets and Liabilities:
| | | | | | | | | | | | |
Derivatives not accounted for as hedging instruments, carried at fair value | | Asset Derivatives | | | Liability Derivatives | |
| | Statement of
Assets and
Liabilities Location | | Fair
Value | | | Statement of
Assets and
Liabilities Location | | Fair
Value | |
| Equity contracts | | Due from/to broker—variation margin futures | | $ | 54,893 | * | | Due from/to broker—variation margin futures | | $ | 1,105 | * |
| Foreign exchange contracts | | Unrealized appreciation on OTC forward foreign currency exchange contracts | | | 25,722 | | | — | | | — | |
| Interest rate contracts | | Due from/to broker—variation margin futures | | | 1,491,811 | * | | Due from/to broker—variation margin futures | | | 536,042 | * |
| Interest rate contracts | | Due from/to broker—variation margin swaps | | | 104,833 | * | | Due from/to broker—variation margin swaps | | | 452,908 | * |
| Interest rate contracts | | Unaffiliated investments | | | 111,742 | | | Options written outstanding, at value | | | 7,125 | |
See Notes to Financial Statements.
| | | | | | | | | | | | |
| | | Asset Derivatives | | | Liability Derivatives | |
Derivatives not accounted
for as hedging instruments,
carried at fair value | | Statement of
Assets and
Liabilities Location | | Fair
Value | | | Statement of
Assets and
Liabilities Location | | Fair
Value | |
| Interest rate contracts | | Unrealized appreciation on OTC forward rate agreements | | $ | 1,274 | | | Unrealized depreciation on OTC forward rate agreements | | $ | 5,547 | |
| | | | | | | | | | | | |
| | | | $ | 1,790,275 | | | | | $ | 1,002,727 | |
| | | | | | | | | | | | |
| * | Includes cumulative appreciation (depreciation) as reported in the schedule of open futures and centrally cleared swap contracts. Only unsettled variation margin receivable (payable) is reported within the Statement of Assets and Liabilities. |
The effects of derivative instruments on the Statement of Operations for the six months ended March 31, 2019 are as follows:
| | | | | | | | | | | | | | | | | | | | | | | | |
Amount of Realized Gain (Loss) on Derivatives Recognized in Income | |
Derivatives not accounted
for as hedging instruments,
carried at fair value | | Rights(1) | | | Options
Purchased(1) | | | Futures | | | Forward
Currency
Exchange
Contracts | | | Forward
Rate
Agreements | | | Swaps | |
Equity contracts | | $ | 35 | | | $ | — | | | $ | (115,121 | ) | | $ | — | | | $ | — | | | $ | — | |
Foreign exchange contracts | | | — | | | | — | | | | — | | | | 33,055 | | | | — | | | | — | |
Interest rate contracts | | | — | | | | (37,873 | ) | | | 436,458 | | | | — | | | | (13,421 | ) | | | 209,201 | |
| | | | | | | | | | | | | | | | | | | | | | | | |
Total | | $ | 35 | | | $ | (37,873 | ) | | $ | 321,337 | | | $ | 33,055 | | | $ | (13,421 | ) | | $ | 209,201 | |
| | | | | | | | | | | | | | | | | | | | | | | | |
| (1) | Included in net realized gain (loss) on investment transactions in the Statement of Operations. |
| | | | | | | | | | | | | | | | | | | | | | | | | | | | |
Change in Unrealized Appreciation (Depreciation) on Derivatives Recognized in Income | |
Derivatives not
accounted for as
hedging instruments,
carried at fair value | | Rights(2) | | | Options
Purchased(2) | | | Options
Written | | | Futures | | | Forward
Currency
Exchange
Contracts
Agreements | | | Forward
Rate | | | Swaps | |
Equity contracts | | $ | (40 | ) | | $ | — | | | $ | — | | | $ | 22,323 | | | $ | — | | | $ | — | | | $ | — | |
Foreign exchange contracts | | | — | | | | — | | | | — | | | | — | | | | 16,929 | | | | — | | | | — | |
Interest rate contracts | | | — | | | | 70,091 | | | | (171 | ) | | | 1,657,213 | | | | — | | | | (1,259 | ) | | | (1,609,772 | ) |
| | | | | | | | | | | | | | | | | | | | | | | | | | | | |
Total | | $ | (40 | ) | | $ | 70,091 | | | $ | (171 | ) | | $ | 1,679,536 | | | $ | 16,929 | | | $ | (1,259 | ) | | $ | (1,609,772 | ) |
| | | | | | | | | | | | | | | | | | | | | | | | | | | | |
| (2) | Included in net change in unrealized appreciation (depreciation) on investments in the Statement of Operations. |
See Notes to Financial Statements.
Schedule of Investments(unaudited) (continued)
as of March 31, 2019
For the six months ended March 31, 2019, the Series’ average volume of derivative activities is as follows:
| | | | | | | | | | | | | | |
Options
Purchased(1) | | | Options
Written(2) | | | Futures
Contracts—
Long
Positions(2) | | | Futures
Contracts—
Short
Positions(2) | |
| $ | 25,809 | | | $ | 76,000 | | | $ | 94,925,509 | | | $ | 25,470,332 | |
| | | | | | | | | | | | | | |
Forward Foreign
Currency Exchange
Contracts —
Sold(3) | | | Forward Rate
Agreements(2) | | | Inflation Swap
Agreements(2) | | | Interest Rate
Swap
Agreements(2) | |
| $ | 1,262,943 | | | $ | 33,166,667 | | | $ | 690,000 | | | $ | 110,058,140 | |
| (2) | Notional Amount in USD. |
| (3) | Value at Settlement Date. |
Financial Instruments/Transactions—Summary of Offsetting and Netting Arrangements:
The Series invested in OTC derivatives and entered into financial instruments/transactions during the reporting period that are either offset in accordance with current requirements or are subject to enforceable master netting arrangements or similar agreements that permit offsetting. The information about offsetting and related netting arrangements for OTC derivatives and financial instruments/transactions, where the legal right toset-off exists, is presented in the summary below.
Offsetting of financial instrument/transaction assets and liabilities:
| | | | | | | | | | | | |
Description | | Gross Market
Value of
Recognized
Assets/(Liabilities) | | | Collateral
Pledged/(Received) | | | Net
Amount | |
Securities on Loan | | $ | 3,225,360 | | | $ | (3,225,360 | ) | | $ | — | |
| | | | | | | | | | | | |
Offsetting of OTC derivative assets and liabilities:
| | | | | | | | | | | | | | | | | | | | |
Counterparty | | Gross Amounts of
Recognized
Assets(1) | | | Gross Amounts of
Recognized
Liabilities(1) | | | Net Amounts of
Recognized
Assets/(Liabilities) | | | Collateral
Pledged/(Received)(2) | | | Net Amount | |
Bank of America, N.A. | | $ | 65,093 | | | $ | — | | | $ | 65,093 | | | $ | — | | | $ | 65,093 | |
Barclays Bank PLC | | | 16,974 | | | | — | | | | 16,974 | | | | — | | | | 16,974 | |
BNP Paribas S.A. | | | 25,107 | | | | — | | | | 25,107 | | | | — | | | | 25,107 | |
Citigroup Global Markets Inc. | | | 1,274 | | | | (5,547 | ) | | | (4,273 | ) | | | — | | | | (4,273 | ) |
See Notes to Financial Statements.
| | | | | | | | | | | | | | | | | | | | |
Counterparty | | Gross Amounts of
Recognized
Assets(1) | | | Gross Amounts of
Recognized
Liabilities(1) | | | Net Amounts of
Recognized
Assets/(Liabilities) | | | Collateral
Pledged/(Received)(2) | | | Net Amount | |
JPMorgan Chase Bank, N.A. | | $ | 615 | | | $ | — | | | $ | 615 | | | $ | — | | | $ | 615 | |
Morgan Stanley & Co. International PLC | | | 518 | | | | — | | | | 518 | | | | — | | | | 518 | |
| | | | | | | | | | | | | | | | | | | | |
| | $ | 109,581 | | | $ | (5,547 | ) | | $ | 104,034 | | | $ | — | | | $ | 104,034 | |
| | | | | | | | | | | | | | | | | | | | |
| (1) | Includes unrealized appreciation/(depreciation) on swaps and forwards, premiums paid/(received) on swap agreements and market value of purchased and written options, as represented on the Statement of Assets and Liabilities. |
| (2) | Collateral amount disclosed by the Portfolio is limited to the market value of financial instruments/transactions and the Portfolio’s OTC derivative exposure by counterparty. |
See Notes to Financial Statements.
Statement of Assets & Liabilities(unaudited)
as of March 31, 2019
| | | | |
Assets | | | | |
Investments at value, including securities on loan of $3,225,360: | | | | |
Unaffiliated investments (cost $557,384,020) | | $ | 626,904,406 | |
Affiliated investments (cost $15,906,897) | | | 16,103,744 | |
Foreign currency, at value (cost $346,850) | | | 346,881 | |
Receivable for Series shares sold | | | 8,992,340 | |
Receivable for investments sold | | | 5,567,572 | |
Dividends and interest receivable | | | 1,876,542 | |
Deposit with broker for centrally cleared/exchange-traded derivatives | | | 895,000 | |
Due from broker—variation margin swaps | | | 111,579 | |
Tax reclaim receivable | | | 86,226 | |
Unrealized appreciation on OTC forward foreign currency exchange contracts | | | 25,722 | |
Due from broker—variation margin futures | | | 13,268 | |
Unrealized appreciation on OTC forward rate agreements | | | 1,274 | |
Prepaid expenses | | | 2,162 | |
| | | | |
Total Assets | | | 660,926,716 | |
| | | | |
| |
Liabilities | | | | |
Payable for investments purchased | | | 9,550,299 | |
Payable to broker for collateral for securities on loan | | | 3,266,548 | |
Payable for Series shares reacquired | | | 883,828 | |
Management fee payable | | | 261,176 | |
Accrued expenses and other liabilities | | | 223,149 | |
Distribution fee payable | | | 172,324 | |
Due to broker—variation margin futures | | | 102,008 | |
Affiliated transfer agent fee payable | | | 81,814 | |
Options written outstanding, at value (proceeds received $6,954) | | | 7,125 | |
Unrealized depreciation on OTC forward rate agreements | | | 5,547 | |
| | | | |
Total Liabilities | | | 14,553,818 | |
| | | | |
| |
Net Assets | | $ | 646,372,898 | |
| | | | |
| | | | | |
Net assets were comprised of: | | | | |
Common stock, at par | | $ | 42,522 | |
Paid-in capital in excess of par | | | 575,172,895 | |
Total distributable earnings (loss) | | | 71,157,481 | |
| | | | |
Net assets, March 31, 2019 | | $ | 646,372,898 | |
| | | | |
See Notes to Financial Statements.
| | | | |
Class A | | | | |
Net asset value and redemption price per share,
($357,841,940 ÷ 23,615,881 shares of common stock issued and outstanding) | | $ | 15.15 | |
Maximum sales charge (5.50% of offering price) | | | 0.88 | |
| | | | |
Maximum offering price to public | | $ | 16.03 | |
| | | | |
| |
Class B | | | | |
Net asset value, offering price and redemption price per share, | | | | |
($7,651,210 ÷ 501,789 shares of common stock issued and outstanding) | | $ | 15.25 | |
| | | | |
| |
Class C | | | | |
Net asset value, offering price and redemption price per share, | | | | |
($87,469,866 ÷ 5,735,676 shares of common stock issued and outstanding) | | $ | 15.25 | |
| | | | |
| |
Class R | | | | |
Net asset value, offering price and redemption price per share, | | | | |
($1,637,009 ÷ 107,994 shares of common stock issued and outstanding) | | $ | 15.16 | |
| | | | |
| |
Class Z | | | | |
Net asset value, offering price and redemption price per share, | | | | |
($171,049,731 ÷ 11,203,874 shares of common stock issued and outstanding) | | $ | 15.27 | |
| | | | |
| |
Class R6 | | | | |
Net asset value, offering price and redemption price per share, | | | | |
($20,723,142 ÷ 1,356,851 shares of common stock issued and outstanding) | | $ | 15.27 | |
| | | | |
See Notes to Financial Statements.
Statement of Operations(unaudited)
Six Months Ended March 31, 2019
| | | | |
Net Investment Income (Loss) | | | | |
Income | | | | |
Unaffiliated dividend income (net of $33,236 foreign withholding tax) | | $ | 4,018,150 | |
Interest income (net of $452 foreign withholding tax) | | | 3,763,014 | |
Affiliated dividend income | | | 353,462 | |
Income from securities lending, net (including affiliated income of $2,101) | | | 2,265 | |
| | | | |
Total income | | | 8,136,891 | |
| | | | |
| |
Expenses | | | | |
Management fee | | | 2,003,852 | |
Distribution fee(a) | | | 994,440 | |
Transfer agent’s fees and expenses (including affiliated expense of $183,344)(a) | | | 381,045 | |
Custodian and accounting fees | | | 150,813 | |
Registration fees(a) | | | 50,040 | |
Shareholders’ reports | | | 37,534 | |
Audit fee | | | 22,723 | |
Directors’ fees | | | 12,012 | |
Legal fees and expenses | | | 9,828 | |
Miscellaneous | | | 36,678 | |
| | | | |
Total expenses | | | 3,698,965 | |
Less: Fee waiver and/or expense reimbursement(a) | | | (445,614 | ) |
Distribution fee waiver(a) | | | (2,539 | ) |
| | | | |
Net expenses | | | 3,250,812 | |
| | | | |
Net investment income (loss) | | | 4,886,079 | |
| | | | |
| |
Realized And Unrealized Gain (Loss) On Investment And Foreign Currency Transactions | | | | |
Net realized gain (loss) on: | | | | |
Investment transactions (including affiliated of $(1,006,600)) | | | 837,101 | |
Futures transactions | | | 321,337 | |
Forward rate agreement transactions | | | (13,421 | ) |
Forward currency contract transactions | | | 33,055 | |
Swap agreement transactions | | | 209,201 | |
Foreign currency transactions | | | (55,989 | ) |
| | | | |
| | | 1,331,284 | |
| | | | |
Net change in unrealized appreciation (depreciation) on: | | | | |
Investments (including affiliated of $926,428) | | | (16,703,280 | ) |
Futures | | | 1,679,536 | |
Forward rate agreements | | | (1,259 | ) |
Forward currency contracts | | | 16,929 | |
Options written | | | (171 | ) |
Swap agreements | | | (1,609,772 | ) |
Foreign currencies | | | 1,320 | |
| | | | |
| | | (16,616,697 | ) |
| | | | |
Net gain (loss) on investment and foreign currency transactions | | | (15,285,413 | ) |
| | | | |
Net Increase (Decrease) In Net Assets Resulting From Operations | | $ | (10,399,334 | ) |
| | | | |
See Notes to Financial Statements.
| (a) | Class specific expenses and waivers were as follows: |
| | | | | | | | | | | | | | | | | | | | | | | | |
| | | Class A | | | Class B | | | Class C | | | Class R | | | Class Z | | | Class R6 | |
Distribution fee | | | 514,835 | | | | 41,857 | | | | 430,132 | | | | 7,616 | | | | — | | | | — | |
Transfer agent’s fees and expenses | | | 217,867 | | | | 12,190 | | | | 41,911 | | | | 2,759 | | | | 106,277 | | | | 41 | |
Registration fees | | | 10,076 | | | | 7,382 | | | | 8,880 | | | | 7,300 | | | | 8,266 | | | | 8,136 | |
Fee waiver and/or expense reimbursement | | | (287,301 | ) | | | (4,446 | ) | | | (45,686 | ) | | | (6,044 | ) | | | (89,895 | ) | | | (12,242 | ) |
Distribution fee waiver | | | — | | | | — | | | | — | | | | (2,539 | ) | | | — | | | | — | |
See Notes to Financial Statements.
Statements of Changes in Net Assets (unaudited)
| | | | | | | | |
| | |
| | | Six Months
Ended
March 31, 2019 | | | Year
Ended
September 30, 2018 | |
Increase (Decrease) in Net Assets | | | | | | | | |
Operations | | | | | | | | |
Net investment income (loss) | | $ | 4,886,079 | | | $ | 7,140,712 | |
Net realized gain (loss) on investment and foreign currency transactions | | | 1,331,284 | | | | 35,930,166 | |
Net change in unrealized appreciation (depreciation) on investments and foreign currencies | | | (16,616,697 | ) | | | 6,435,322 | |
| | | | | | | | |
Net increase (decrease) in net assets resulting from operations | | | (10,399,334 | ) | | | 49,506,200 | |
| | | | | | | | |
| | |
Dividends and Distributions | | | | | | | | |
Distributions from distributable earnings* | | | | | | | | |
Class A | | | (20,492,778 | ) | | | — | |
Class B | | | (474,259 | ) | | | — | |
Class C | | | (4,851,586 | ) | | | — | |
Class R | | | (117,772 | ) | | | — | |
Class Z | | | (10,538,342 | ) | | | — | |
Class R6 | | | (419,154 | ) | | | — | |
| | | | | | | | |
| | | (36,893,891 | ) | | | — | |
| | | | | | | | |
Dividends from net investment income | | | | | | | | |
Class A | | | | | | | (4,273,229 | ) |
Class B | | | | | | | (30,440 | ) |
Class C | | | | | | | (426,577 | ) |
Class R | | | | | | | (13,806 | ) |
Class Z | | | | | | | (2,360,421 | ) |
Class R6 | | | | | | | (5,451 | ) |
| | | | | | | | |
| | | * | | | | (7,109,924 | ) |
| | | | | | | | |
Distributions from net realized gains | | | | | | | | |
Class A | | | | | | | (14,743,277 | ) |
Class B | | | | | | | (465,067 | ) |
Class C | | | | | | | (3,313,753 | ) |
Class R | | | | | | | (68,936 | ) |
Class Z | | | | | | | (6,197,978 | ) |
Class R6 | | | | | | | (420 | ) |
| | | | | | | | |
| | | * | | | | (24,789,431 | ) |
| | | | | | | | |
See Notes to Financial Statements.
| | | | | | | | |
| | |
| | | Six Months
Ended
March 31, 2019 | | | Year
Ended
September 30, 2018 | |
Series share transactions (Net of share conversions) | | | | | | | | |
Net proceeds from shares sold | | $ | 85,937,299 | | | $ | 126,810,987 | |
Net asset value of shares issued in reinvestment of dividends and distributions | | | 35,249,400 | | | | 30,267,050 | |
Cost of shares reacquired | | | (75,573,114 | ) | | | (96,702,428 | ) |
| | | | | | | | |
Net increase (decrease) in net assets from Series share transactions | | | 45,613,585 | | | | 60,375,609 | |
| | | | | | | | |
Total increase (decrease) | | | (1,679,640 | ) | | | 77,982,454 | |
Net Assets: | | | | | | | | |
Beginning of period | | | 648,052,538 | | | | 570,070,084 | |
| | | | | | | | |
End of period(a) | | $ | 646,372,898 | | | $ | 648,052,538 | |
| | | | | | | | |
(a) Includes undistributed/(distributions in excess of) net investment income of: | | $ | * | | | $ | 742,847 | |
| | | | | | | | |
| * | For the period ended March 31, 2019, the disclosures have been revised to reflect revisions to RegulationS-X adopted by the SEC in 2018 (refer to Note 9). |
See Notes to Financial Statements.
Notes to Financial Statements(unaudited)
The Prudential Investment Portfolios, Inc. (the “Company”) is registered under the Investment Company Act of 1940, as amended (“1940 Act”), as anopen-end management investment company. The Company was incorporated in Maryland on August 10, 1995 and consists of six series: PGIM Balanced Fund, PGIM Jennison Equity Opportunity Fund and PGIM Jennison Growth Fund, PGIM Allocation Fund, PGIM Moderate Allocation Fund and PGIM Allocation Fund, each of which arenon-diversified funds for purposes of the 1940 Act and may invest a greater percentage of their assets in the securities of a single company or other issuer than a diversified fund. Investing in anon-diversified fund involves greater risk than investing in a diversified fund because a loss resulting from the decline in value of any one security may represent a greater portion of the total assets of anon-diversified fund. These financial statements relate only to the PGIM Balanced Fund (the “Series”).
The investment objective of the Series is to seek income and long-term growth of capital.
1. Accounting Policies
The Series follows the investment company accounting and reporting guidance of the Financial Accounting Standards Board (“FASB”) Accounting Standard Codification (“ASC”) Topic 946 Financial Services —Investment Companies. The following accounting policies conform to U.S. generally accepted accounting principles. The Series consistently follows such policies in the preparation of its financial statements.
Securities Valuation:The Series holds securities and other assets and liabilities that are fair valued at the close of each day (generally, 4:00 PM Eastern time) the New York Stock Exchange (“NYSE”) is open for trading. Fair value is the price that would be received to sell an asset or paid to transfer a liability in an orderly transaction between market participants on the measurement date. The Company’s Board of Directors (the “Board”) has adopted valuation procedures for security valuation under which fair valuation responsibilities have been delegated to PGIM Investments LLC (“PGIM Investments” or the “Manager”). Pursuant to the Board’s delegation, the Manager has established a Valuation Committee responsible for supervising the fair valuation of portfolio securities and other assets and liabilities. The valuation procedures permit the Series to utilize independent pricing vendor services, quotations from market makers, and alternative valuation methods when market quotations are either not readily available or not deemed representative of fair value. A record of the Valuation Committee’s actions is subject to the Board’s review, approval, and ratification at its next regularly scheduled quarterly meeting.
For the fiscal reportingperiod-end, securities and other assets and liabilities were fair valued at the close of the last U.S. business day. Trading in certain foreign securities may occur when the NYSE is closed (including weekends and holidays). Because such foreign securities trade in markets that are open on weekends and U.S. holidays, the values of some
of the Series’ foreign investments may change on days when investors cannot purchase or redeem Series shares.
Various inputs determine how the Series’ investments are valued, all of which are categorized according to the three broad levels (Level 1, 2, or 3) detailed in the Schedule of Investments and referred to herein as the “fair value hierarchy” in accordance with FASB ASC Topic 820 - Fair Value Measurements and Disclosures.
Common and preferred stocks, exchange-traded funds, and derivative instruments, such as futures or options, that are traded on a national securities exchange are valued at the last sale price as of the close of trading on the applicable exchange where the security principally trades. Securities traded via NASDAQ are valued at the NASDAQ official closing price. To the extent these securities are valued at the last sale price or NASDAQ official closing price, they are classified as Level 1 in the fair value hierarchy. In the event that no sale or official closing price on valuation date exists, these securities are generally valued at the mean between the last reported bid and ask prices, or at the last bid price in the absence of an ask price. These securities are classified as Level 2 in the fair value hierarchy.
Foreign equities traded on foreign securities exchanges are generally valued using pricing vendor services that provide model prices derived using adjustment factors based on information such as local closing price, relevant general and sector indices, currency fluctuations, depositary receipts, and futures, as applicable. Securities valued using such model prices are classified as Level 2 in the fair value hierarchy. The models generate an evaluated adjustment factor for each security, which is applied to the local closing price to adjust it for post closing market movements up to the time the Series is valued. Utilizing that evaluated adjustment factor, the vendor provides an evaluated price for each security. If the vendor does not provide an evaluated price, securities are valued in accordance with exchange-traded common and preferred stock valuation policies discussed above.
Investments inopen-end,non-exchange-traded mutual funds are valued at their net asset values as of the close of the NYSE on the date of valuation. These securities are classified as Level 1 in the fair value hierarchy since they may be purchased or sold at their net asset values on the date of valuation.
Fixed income securities traded in the OTC market are generally classified as Level 2 in the fair value hierarchy. Such fixed income securities are typically valued using the market approach which generally involves obtaining data from an approved independent third-party vendor source. The Series utilizes the market approach as the primary method to value securities when market prices of identical or comparable instruments are available. The third-party vendors’ valuation techniques used to derive the evaluated bid price are based on evaluating observable inputs, including but not limited to, yield curves, yield spreads, credit ratings, deal terms, tranche level attributes, default rates, cash flows, prepayment speeds, broker/dealer quotations and reported trades. Certain Level 3 securities are also valued using the market approach when obtaining a single broker quote or when utilizing transaction prices for identical securities that have been used in excess of five business
Notes to Financial Statements(unaudited) (continued)
days. During the reporting period, there were no changes to report with respect to the valuation approach and/or valuation techniques discussed above.
OTC derivative instruments are generally classified as Level 2 in the fair value hierarchy. Such derivative instruments are typically valued using the market approach and/or income approach which generally involves obtaining data from an approved independent third-party vendor source. The Series utilizes the market approach when quoted prices in broker-dealer markets are available but also includes consideration of alternative valuation approaches, including the income approach. In the absence of reliable market quotations, the income approach is typically utilized for purposes of valuing OTC derivatives such as interest rate swaps based on a discounted cash flow analysis whereby the value of the instrument is equal to the present value of its future cash inflows or outflows. Such analysis includes projecting future cash flows and determining the discount rate (including the present value factors that affect the discount rate) used to discount the future cash flows. In addition, the third-party vendors’ valuation techniques used to derive the evaluated OTC derivative price is based on evaluating observable inputs, including but not limited to, underlying asset prices, indices, spreads, interest rates and exchange rates. Certain OTC derivatives may be classified as Level 3 when valued using the market approach by obtaining a single broker quote or when utilizing unobservable inputs in the income approach. During the reporting period, there were no changes to report with respect to the valuation approach and/or valuation techniques discussed above.
Centrally cleared swaps listed or traded on a multilateral or trade facility platform, such as a registered exchange, are generally valued at the daily settlement price determined by the respective exchange. These securities are classified as Level 2 in the fair value hierarchy, as the daily settlement price is not public.
Securities and other assets that cannot be priced according to the methods described above are valued based on pricing methodologies approved by the Board. In the event that unobservable inputs are used when determining such valuations, the securities will be classified as Level 3 in the fair value hierarchy.
When determining the fair value of securities, some of the factors influencing the valuation include: the nature of any restrictions on disposition of the securities; assessment of the general liquidity of the securities; the issuer’s financial condition and the markets in which it does business; the cost of the investment; the size of the holding and the capitalization of the issuer; the prices of any recent transactions or bids/offers for such securities or any comparable securities; any available analyst media or other reports or information deemed reliable by the Manager regarding the issuer or the markets or industry in which it operates. Using fair value to price securities may result in a value that is different from a security’s
most recent closing price and from the price used by other unaffiliated mutual funds to calculate their net asset values.
Illiquid Securities:Pursuant to Rule22e-4 under the 1940 Act, the Series has adopted a Board approved Liquidity Risk Management Program (“LRMP”) that requires, among other things, that the Series limit its illiquid investments that are assets to no more than 15% of net assets. Illiquid securities are those that, because of the absence of a readily available market or due to legal or contractual restrictions on resale, may not reasonably be expected to be sold or disposed of in current market conditions in seven calendar days or less without the sale or disposition significantly changing the market value of the investment. The Series may find it difficult to sell illiquid securities at the time considered most advantageous by its Subadviser and may incur transaction costs that would not be incurred in the sale of securities that were freely marketable.
Restricted Securities:Securities acquired in unregistered, private sales from the issuing company or from an affiliate of the issuer are considered restricted as to disposition under federal securities law (“restricted securities”). Such restricted securities are valued pursuant to the valuation procedures noted above. Restricted securities that would otherwise be considered illiquid investments pursuant to the Series’ LRMP because of legal restrictions on resale to the general public may be traded among qualified institutional buyers under Rule 144A of the Securities Act of 1933. Therefore, these Rule 144A securities, as well as commercial paper that is sold in private placements under Section 4(2) of the Securities Act of 1933, may be classified higher than “illiquid” under the LRMP (i.e. “moderately liquid” or “less liquid” investments). However, the liquidity of the Series’ investments in restricted securities could be impaired if trading does not develop or declines.
Connecticut Avenue Securities (CAS) and Structured Agency Credit Risk (STACR):The Series purchased government controlled Fannie Mae and Freddie Mac securities that transfer most of the cost of defaults to private investors including the Series. These are insurance-like products that are called CAS by Fannie Mae and STACR securities by Freddie Mac. Payments on the securities are based primarily on the performance of a reference pool of underlying mortgages. With such securities, the Series could lose some or all of its principal if the underlying mortgages experience credit defaults.
Foreign Currency Translation:The books and records of the Series are maintained in U.S. dollars. Foreign currency amounts are translated into U.S. dollars on the following basis:
(i) market value of investment securities, other assets and liabilities — at the current rates of exchange;
(ii) purchases and sales of investment securities, income and expenses — at the rates of exchange prevailing on the respective dates of such transactions.
Although the net assets of the Series are presented at the foreign exchange rates and market values at the close of the period, the Series does not generally isolate that portion of
Notes to Financial Statements(unaudited) (continued)
the results of operations arising as a result of changes in the foreign exchange rates from the fluctuations arising from changes in the market prices of long-term portfolio securities held at the end of the period. Similarly, the Series does not isolate the effect of changes in foreign exchange rates from the fluctuations arising from changes in the market prices of long-term portfolio securities sold during the period. Accordingly, holding period realized foreign currency gains (losses) are included in the reported net realized gains (losses) on investment transactions. Notwithstanding the above, the Series does isolate the effect of fluctuations in foreign currency exchange rates when determining the gain (loss) upon the sale or maturity of foreign currency denominated debt obligations; such amounts are included in net realized gains (losses) on foreign currency transactions.
Additionally, net realized gains (losses) on foreign currency transactions represent net foreign exchange gains (losses) from the disposition of holdings of foreign currencies, currency gains (losses) realized between the trade and settlement dates on securities transactions, and the difference between the amounts of interest, dividends and foreign withholding taxes recorded on the Series’ books and the U.S. dollar equivalent amounts actually received or paid. Net unrealized currency gains (losses) arise from valuing foreign currency denominated assets and liabilities (other than investments) at period end exchange rates.
Forward and Cross Currency Contracts:A forward currency contract is a commitment to purchase or sell a foreign currency at a future date at a negotiated forward rate. The Series enters into forward currency contracts, as defined in the prospectus, in order to hedge its exposure to changes in foreign currency exchange rates on its foreign portfolio holdings or on specific receivables and payables denominated in a foreign currency and to gain exposure to certain currencies. The contracts are valued daily at current forward exchange rates and any unrealized gain (loss) is included in net unrealized appreciation (depreciation) on forward and cross currency contracts. Gain (loss) is realized on the settlement date of the contract equal to the difference between the settlement value of the original and negotiated forward contracts. This gain (loss), if any, is included in net realized gain (loss) on forward and cross currency contract transactions. Risks may arise upon entering into these contracts from the potential inability of the counterparties to meet the terms of their contracts. Forward currency contracts involve risks from currency exchange rate and credit risk in excess of the amounts reflected on the Statement of Assets and Liabilities. The Series’ maximum risk of loss from counterparty credit risk is the net value of the cash flows to be received from the counterparty at the end of the contract’s life. A cross currency contract is a forward contract where a specified amount of one foreign currency will be exchanged for a specified amount of another foreign currency.
Options:The Series purchased or wrote options in order to hedge against adverse market movements or fluctuations in value caused by changes in prevailing interest rates, value of
equities or foreign currency exchange rates with respect to securities or financial instruments which the Series currently owns or intends to purchase. The Series may also use options to gain additional market exposure. The Series’ principal reason for writing options is to realize, through receipt of premiums, a greater current return than would be realized on the underlying security alone. When the Series purchases an option, it pays a premium and an amount equal to that premium is recorded as an asset. When the Series writes an option, it receives a premium and an amount equal to that premium is recorded as a liability. The asset or liability is adjusted daily to reflect the current market value of the option. If an option expires unexercised, the Series realizes a gain (loss) to the extent of the premium received or paid. If an option is exercised, the premium received or paid is recorded as an adjustment to the proceeds from the sale or the cost of the purchase in determining whether the Series has realized a gain (loss). The difference between the premium and the amount received or paid at the closing of a purchase or sale transaction is also treated as a realized gain (loss). Gain (loss) on purchased options is included in net realized gain (loss) on investment transactions. Gain (loss) on written options is presented separately as net realized gain (loss) on options written transactions.
The Series, as writer of an option, may have no control over whether the underlying securities or financial instruments may be sold (called) or purchased (put). As a result, the Series bears the market risk of an unfavorable change in the price of the security or financial instrument underlying the written option. The Series, as purchaser of an OTC option, bears the risk of the potential inability of the counterparties to meet the terms of their contracts. With exchange-traded options contracts, there is minimal counterparty credit risk to the Series since the exchanges’ clearinghouse acts as counterparty to all exchange-traded options and guarantees the options contracts against default.
When the Series writes an option on a swap, an amount equal to any premium received by the Series is recorded as a liability and is subsequently adjusted to the current market value of the written option on the swap. If a call option on a swap is exercised, the Series becomes obligated to pay a fixed interest rate (noted as the strike price) and receive a variable interest rate on a notional amount. If a put option on a swap is exercised, the Series becomes obligated to pay a variable interest rate and receive a fixed interest rate (noted as the strike price) on a notional amount. Premiums received from writing options on swaps that expire or are exercised are treated as realized gains upon the expiration or exercise of such options on swaps. The risk associated with writing put and call options on swaps is that the Series will be obligated to be party to a swap agreement if an option on a swap is exercised.
Financial Futures Contracts:A financial futures contract is an agreement to purchase (long) or sell (short) an agreed amount of securities at a set price for delivery on a future date. Upon entering into a financial futures contract, the Series is required to pledge to the broker an amount of cash and/or other assets equal to a certain percentage of the contract amount. This amount is known as the “initial margin.” Subsequent payments, known as “variation margin,” are made or received by the Series each day, depending on the daily fluctuations in the value of the underlying security. Such variation margin is recorded for financial statement purposes on a daily basis as unrealized gain (loss). When the contract expires or
Notes to Financial Statements(unaudited) (continued)
is closed, the gain (loss) is realized and is presented in the Statement of Operations as net realized gain (loss) on futures transactions.
The Series invested in financial futures contracts in order to hedge its existing portfolio securities, or securities the Series intends to purchase, against fluctuations in value caused by changes in prevailing interest rates. Should interest rates move unexpectedly, the Series may not achieve the anticipated benefits of the financial futures contracts and may realize a loss. The use of futures transactions involves the risk of imperfect correlation in movements in the price of futures contracts, interest rates and the underlying hedged assets. Since futures contracts are exchange-traded, there is minimal counterparty credit risk to the Series since the exchanges’ clearinghouse acts as counterparty to all exchange-traded futures and guarantees the futures contracts against default.
Forward Rate Agreements:Forward rate agreements represent an agreement between counterparties to exchange cash flows based on the difference between two interest rates, applied to a notional principal amount on a fixed future date. The Series entered into forward rate agreements to gain yield exposure based on anticipated market conditions at the specified termination date of the agreement.
Swap Agreements:The Series entered into certain types of swap agreements detailed in the disclosures below. A swap agreement is an agreement to exchange the return generated by one instrument for the return generated by another instrument. Swap agreements are negotiated in the OTC market and may be executed either directly with a counterparty(“OTC-traded”) or through a central clearing facility, such as a registered exchange. Swap agreements are valued daily at current market value and any change in value is included in the net unrealized appreciation (depreciation) on swap agreements. Centrally cleared swaps pay or receive an amount known as “variation margin”, based on daily changes in the valuation of the swap contract. Any upfront premiums paid and received are shown as swap premiums paid and swap premiums received in the Statement of Assets and Liabilities. Risk of loss may exceed amounts recognized on the Statement of Assets and Liabilities. Swap agreements outstanding at period end, if any, are listed on the Schedule of Investments.
Interest Rate Swaps:Interest rate swaps represent an agreement between counterparties to exchange cash flows based on the difference between two interest rates, applied to a notional principal amount for a specified period. The Series is subject to interest rate risk exposure in the normal course of pursuing its investment objective. The Series used interest rate swaps to maintain its ability to generate steady cash flow by receiving a stream of fixed rate payments or to increase exposure to prevailing market rates by receiving floating rate payments. The Series’ maximum risk of loss from counterparty credit risk is the discounted net present value of the cash flows to be received from the counterparty over the contract’s remaining life.
Master Netting Arrangements:The Company, on behalf of the Series, is subject to various Master Agreements, or netting arrangements, with select counterparties. These are agreements which a Subadviser may have negotiated and entered into on behalf of the Series. A master netting arrangement between the Series and the counterparty permits the Series to offset amounts payable by the Series to the same counterparty against amounts to be received; and by the receipt of collateral from the counterparty by the Series to cover the Series’ exposure to the counterparty. However, there is no assurance that such mitigating factors are easily enforceable. In addition to master netting arrangements, the right toset-off exists when all the conditions are met such that each of the parties owes the other determinable amounts, the reporting party has the right toset-off the amount owed with the amount owed by the other party, the reporting party intends toset-off and the right ofset-off is enforceable by law. During the reporting period, there was no intention to settle on a net basis and all amounts are presented on a gross basis on the Statement of Assets and Liabilities.
The Company, on behalf of the Series, is a party to International Swaps and Derivatives Association, Inc. (“ISDA”) Master Agreements with certain counterparties that govern OTC derivative and foreign exchange contracts entered into from time to time. The Master Agreements may contain provisions regarding, among other things, the parties’ general obligations, representations, agreements, collateral requirements, events of default and early termination. With respect to certain counterparties, in accordance with the terms of the Master Agreements, collateral posted to the Series is held in a segregated account by the Series’ custodian and with respect to those amounts which can be sold orre-pledged, is presented in the Schedule of Investments. Collateral pledged by the Series is segregated by the Series’ custodian and identified in the Schedule of Investments. Collateral can be in the form of cash or debt securities issued by the U.S. Government or related agencies or other securities as agreed to by the Series and the applicable counterparty. Collateral requirements are determined based on the Series’ net position with each counterparty. Termination events applicable to the Series may occur upon a decline in the Series’ net assets below a specified threshold over a certain period of time. Termination events applicable to counterparties may occur upon a decline in the counterparty’s long-term and short-term credit ratings below a specified level. In each case, upon occurrence, the other party may elect to terminate early and cause settlement of all derivative and foreign exchange contracts outstanding, including the payment of any losses and costs resulting from such early termination, as reasonably determined by the terminating party. Any decision by one or more of the Series’ counterparties to elect early termination could impact the Series’ future derivative activity.
In addition to each instrument’s primary underlying risk exposure (e.g. interest rate, credit, equity or foreign exchange, etc.), swap agreements involve, to varying degrees, elements of credit, market and documentation risk. Such risks involve the possibility that no liquid market for these agreements will exist, the counterparty to the agreement may default on its obligation to perform or disagree on the contractual terms of the agreement, and changes in net interest rates will be unfavorable. In connection with these agreements, securities in the portfolio may be identified or received as collateral from the counterparty in accordance with
Notes to Financial Statements(unaudited) (continued)
the terms of the respective swap agreements to provide or receive assets of value and to serve as recourse in the event of default or bankruptcy/insolvency of either party. Such OTC derivative agreements include conditions which, when materialized, give the counterparty the right to cause an early termination of the transactions under those agreements. Any election by the counterparty for early termination of the contract(s) may impact the amounts reported on financial statements.
As of March 31, 2019, the Series has not met conditions under such agreements which give the counterparty the right to call for an early termination.
Forward currency contracts, forward rate agreements, written options, short sales, swaps and financial futures contracts involve elements of both market and credit risk in excess of the amounts reflected on the Statement of Assets and Liabilities. Such risks may be mitigated by engaging in master netting arrangements.
Warrants and Rights:The Series holds warrants and rights acquired either through a direct purchase or pursuant to corporate actions. Warrants and rights entitle the holder to buy a proportionate amount of common stock, or such other security that the issuer may specify, at a specific price and time through the expiration dates. Such warrants and rights are held as long positions by the Series until exercised, sold or expired. Warrants and rights are valued at fair value in accordance with the Board approved fair valuation procedures.
Securities Lending:The Series lends its portfolio securities to banks and broker-dealers. The loans are secured by collateral at least equal to the market value of the securities loaned. Collateral pledged by each borrower is invested in an affiliated money market fund and is marked to market daily, based on the previous day’s market value, such that the value of the collateral exceeds the value of the loaned securities. In the event of significant appreciation in value of securities on loan on the last business day of the reporting period, the financial statements may reflect a collateral value that is less than the market value of the loaned securities. Such shortfall is remedied as described above. Loans are subject to termination at the option of the borrower or the Series. Upon termination of the loan, the borrower will return to the Series securities identical to the loaned securities. Should the borrower of the securities fail financially, the Series has the right to repurchase the securities in the open market using the collateral.
The Series recognizes income, net of any rebate and securities lending agent fees, for lending its securities in the form of fees or interest on the investment of any cash received as collateral. The borrower receives all interest and dividends from the securities loaned and such payments are passed back to the lender in amounts equivalent thereto. The Series also continues to recognize any unrealized gain (loss) in the market price of the securities loaned and on the change in the value of the collateral invested that may occur during the term of
the loan. In addition, realized gain (loss) is recognized on changes in the value of the collateral invested upon liquidation of the collateral. Net earnings from securities lending are disclosed on the Statement of Operations as “Income from securities lending, net”.
Equity and Mortgage Real Estate Investment Trusts (collectively equity REITs):The Series invests in equity REITs, which report information on the source of their distributions annually. Based on current and historical information, a portion of distributions received from equity REITs during the period is estimated to be dividend income, capital gain or return of capital and recorded accordingly. When material, these estimates are adjusted periodically when the actual source of distributions is disclosed by the equity REITs.
Securities Transactions and Net Investment Income:Securities transactions are recorded on the trade date. Realized gains (losses) from investment and currency transactions are calculated on the specific identification method. Dividend income is recorded on theex-date, or for certain foreign securities, when the Series becomes aware of such dividends. Expenses are recorded on an accrual basis, which may require the use of certain estimates by management that may differ from actual. Net investment income or loss (other than class specific expenses and waivers, which are allocated as noted below) and unrealized and realized gains (losses) are allocated daily to each class of shares based upon the relative proportion of adjusted net assets of each class at the beginning of the day. Class specific expenses and waivers, where applicable, are charged to the respective share classes. Class specific expenses include distribution fees and distribution fee waivers, shareholder servicing fees, transfer agent’s fees and expenses, registration fees and fee waivers and/or expense reimbursements, as applicable.
Taxes:It is the Series’ policy to continue to meet the requirements of the Internal Revenue Code applicable to regulated investment companies and to distribute all of its taxable net investment income and capital gains, if any, to its shareholders. Therefore, no federal income tax provision is required. Withholding taxes on foreign dividends, interest and capital gains, if any, are recorded, net of reclaimable amounts, at the time the related income is earned.
Dividends and Distributions:The Series expects to pay dividends from net investment income quarterly. Distributions from net realized capital and currency gains, if any, are declared and paid annually. Dividends and distributions to shareholders, which are determined in accordance with federal income tax regulations and which may differ from generally accepted accounting principles, are recorded on theex-date. Permanent book/tax differences relating to income and gain (loss) are reclassified amongst total distributable earnings (loss) andpaid-in capital in excess of par, as appropriate.
Estimates:The preparation of financial statements requires management to make estimates and assumptions that affect the reported amounts and disclosures in the financial statements. Actual results could differ from those estimates.
Notes to Financial Statements(unaudited) (continued)
2. Agreements
The Company, on behalf of the Series, has a management agreement with PGIM Investments. Pursuant to this agreement, PGIM Investments has responsibility for all investment advisory services and supervises the Subadvisers’ performance of such services. In addition, under the management agreement, PGIM Investments provides all of the administrative functions necessary for the organization, operation and management of the Series. PGIM Investments administers the corporate affairs of the Series and, in connection therewith, furnishes the Series with office facilities, together with those ordinary clerical and bookkeeping services which are not being furnished by the Series’ custodian and the Series’ transfer agent. PGIM Investments is also responsible for the staffing and management of dedicated groups of legal, marketing, compliance and related personnel necessary for the operation of the Series. The legal, marketing, compliance and related personnel are also responsible for the management and oversight of the various service providers to the Series, including, but not limited to, the custodian, transfer agent, and accounting agent.
PGIM Investments has entered into subadvisory agreements with each of PGIM, Inc., which provides subadvisory services to the Series through its PGIM Fixed Income unit, and QMA LLC (formerly known as Quantitative Management Associates LLC) (“QMA”). The subadvisory agreements provide that the PGIM, Inc. and QMA will furnish investment advisory services in connection with the management of the Series. In connection therewith, are obligated to keep certain books and records of the Series. PGIM Investments pays for the services of , the cost of compensation of officers of the Series, occupancy and certain clerical and bookkeeping costs of the Series. The Series bears all other costs and expenses.
The management fee paid to the Manager is accrued daily and payable monthly at an annual rate of 0.65% of the Series’ average daily net assets up to and including $1 billion and 0.60% of such average daily net assets in excess of $1 billion. The effective management fee rate before any waivers and/or expense reimbursements was 0.65% for the six months ended March 31, 2019.
The Manager has contractually agreed, through January 31, 2020, to limit total annual operating expenses after fee waivers and/or expense reimbursements to 1.00% of average daily net assets for Class A shares, 1.63% of average daily net assets for Class R shares. and 0.65% of average daily net assets for Class R6 shares. This contractual expense limitation excludes interest, brokerage, taxes (such as income and foreign withholding taxes, stamp duty and deferred tax expenses), acquired fund fees and expenses, extraordinary expenses, and certain other Fund expenses such as dividend and interest expense and broker charges on short sales. Expenses waived/reimbursed by the Manager in accordance with this agreement may be recouped by the Manager within the same fiscal year during which such waiver/reimbursement is made if such recoupment can be realized without exceeding the expense limit in effect at the time of the recoupment for that fiscal year.
Where applicable, the Manager agrees to waive management fees or shared operating expenses on any share class to the same extent that it waives similar expenses on any other share class. In addition, total annual operating expenses for Class R6 shares will not exceed total annual operating expenses for Class Z shares. Fees and/or expenses waived and/or reimbursed by PGIM Investments may be recouped by PGIM Investments within the same fiscal year during which such waiver and/or reimbursement is made if such recoupment can be realized without exceeding the expense limit in effect at the time of the recoupment for the fiscal year.
The Company, on behalf of the Series, has a distribution agreement with Prudential Investment Management Services LLC (“PIMS”), which acts as the distributor of the Class A, Class B, Class C, Class R, Class Z and Class R6 shares of the Series. The Series compensates PIMS for distributing and servicing the Series’ Class A, Class B, Class C and Class R shares, pursuant to the plans of distribution (the “Distribution Plans”), regardless of expenses actually incurred by PIMS. The distribution fees are accrued daily and payable monthly. No distribution or service fees are paid to PIMS as distributor of the Class Z and Class R6 shares of the Series.
Pursuant to the Distribution Plans, the Series compensates PIMS for distribution related activities at an annual rate of up to 0.30%, 1%, 1% and 0.75% of the average daily net assets of the Class A, Class B, Class C and Class R shares, respectively. PIMS has contractually agreed through January 31, 2020 to limit such fees to 0.50% of the average daily net assets of Class R shares.
For the reporting period ended March 31, 2019, PIMS received $507,703 infront-end sales charges resulting from sales of Class A shares. Additionally, for the reporting period ended March 31, 2019, PIMS received $10,528, $2,247 and $6,362 in contingent deferred sales charges imposed upon redemptions by certain Class A, Class B and Class C shareholders, respectively. From these fees, PIMS paid such sales charges to broker-dealers, who in turn paid commissions to salespersons and incurred other distribution costs.
PGIM Investments, PGIM, Inc., PIMS and QMA are indirect, wholly-owned subsidiaries of Prudential Financial, Inc. (“Prudential”).
3. Other Transactions with Affiliates
Prudential Mutual Fund Services LLC (“PMFS”), an affiliate of PGIM Investments and an indirect, wholly-owned subsidiary of Prudential, serves as the Series’ transfer agent. Transfer agent’s fees and expenses in the Statement of Operations include certainout-of-pocket expenses paid tonon-affiliates, where applicable.
The Series may enter into certain securities purchase or sale transactions under Board approved Rule17a-7 procedures. Rule17a-7 is an exemptive rule under the 1940 Act, that subject to certain conditions, permits purchase and sale transactions among affiliated investment companies, or between an investment company and a person that is affiliated
Notes to Financial Statements(unaudited) (continued)
solely by reason of having a common (or affiliated) investment adviser, common directors, and/or common officers. Pursuant to the Rule17a-7 procedures and consistent with guidance issued by the SEC, the Series’ Chief Compliance Officer (“CCO”) prepares a quarterly summary of all such transactions for submission to the Board, together with the CCO’s written representation that all such17a-7 transactions were effected in accordance with the Series’ Rule17a-7 procedures. Any17a-7 transactions for the reporting period are disclosed in the “Portfolio Securities” note, below.
The Series may invest its overnight sweep cash in the PGIM Core Ultra Short Bond Fund (the “Core Fund”), and its securities lending cash collateral in the PGIM Institutional Money Market Fund (the “Money Market Fund”), each a series of Prudential Investment Portfolios 2, registered under the 1940 Act and managed by PGIM Investments. The Series also invests in the PGIM Core Short-Term Bond Fund, pursuant to an exemptive order received from the Securities and Exchange Commission (“SEC”), a series of Prudential Investment Portfolios 2 (together with PGIM Core Ultra Short Bond Fund, the “Core Funds”), registered under the 1940 Act and managed by PGIM Investments. Earnings from the Core Fund and Money Market Fund are disclosed on the Statement of Operations as “Affiliated dividend income” and “Income from securities lending, net”, respectively.
4. Portfolio Securities
The aggregate cost of purchases and proceeds from sales of portfolio securities (excluding short-term investments and U.S. Government securities) for the reporting period ended March 31, 2019, were $393,011,905 and $392,568,664, respectively.
A summary of the cost of purchases and proceeds from sales of shares of affiliated investments for the reporting period ended March 31, 2019, is presented as follows:
| | | | | | | | | | | | | | | | | | | | | | | | | | | | | | |
Value,
Beginning
of Period | | | Cost of
Purchases | | | Proceeds
from Sales | | | Change in
Unrealized
Gain
(Loss) | | | Realized
Gain
(Loss) | | | Value,
End of
Period | | | Shares,
End
of
Period | | | Income | |
| | PGIM Core Short-Term Bond Fund* | | | | | | | | | | | | | |
| $ | 19,347,175 | | | $ | 153,935 | | | $ | 18,000,000 | | | $ | 926,415 | | | $ | (1,005,712 | ) | | $ | 1,421,813 | | | | 154,043 | | | $ | 153,935 | |
| | PGIM Core Ultra Short Bond Fund* | | | | | | | | | | | | | |
| | 14,790,038 | | | | 89,764,426 | | | | 93,147,068 | | | | — | | | | — | | | | 11,407,396 | | | | 11,407,396 | | | | 199,527 | |
| | PGIM Institutional Money Market Fund* | | | | | | | | | | | | | |
| | — | | | | 40,511,522 | | | | 37,236,112 | | | | 13 | | | | (888 | ) | | | 3,274,535 | | | | 3,273,880 | | | | 2,101 | ** |
| | | | | | | | | | | | | | | | | | | | | | | | | | | | | | |
| $ | 34,137,213 | | | $ | 130,429,883 | | | $ | 148,383,180 | | | $ | 926,428 | | | $ | (1,006,600 | ) | | $ | 16,103,744 | | | | | | | $ | 355,563 | |
| | | | | | | | | | | | | | | | | | | | | | | | | | | | | | |
| * | The Fund did not have any capital gain distributions during the reporting period. |
| ** | This amount is included in “Income from securities lending, net” on the Statement of Operations. |
For the reporting period ended March 31, 2019, no17a-7 transactions were entered into by the Series.
5. Tax Information
The United States federal income tax basis of the Series’ investments and the net unrealized appreciation as of March 31, 2019 were as follows:
| | | | |
Tax Basis | | $ | 573,975,222 | |
| | | | |
Gross Unrealized Appreciation | | | 209,318,956 | |
Gross Unrealized Depreciation | | | (139,610,222 | ) |
| | | | |
Net Unrealized Appreciation | | $ | 69,708,734 | |
| | | | |
The book basis may differ from tax basis due to certaintax-related adjustments.
The Manager has analyzed the Series’ tax positions taken on federal, state and local income tax returns for all open tax years and has concluded that no provision for income tax is required in the Series’ financial statements for the current reporting period. The Series’ federal, state and local income and federal excise tax returns for tax years for which the applicable statutes of limitations have not expired are subject to examination by the Internal Revenue Service and state departments of revenue.
6. Capital and Ownership
The Series offers Class A, Class B, Class C, Class R, Class Z and Class R6 shares. Class A shares are sold with a maximumfront-end sales charge of 5.50%. Investors who purchase $1 million or more of Class A shares and sell these shares within 12 months of purchase are subject to a contingent deferred sales charge (“CDSC”) of 1%, although they are not subject to an initial sales charge. The Class A CDSC is waived for certain retirement and/or benefit plans. A special exchange privilege is also available for shareholders who qualified to
Notes to Financial Statements(unaudited) (continued)
purchase Class A shares at net asset value. Class B shares are sold with a CDSC which declines from 5% to zero depending on the period of time the shares are held. Class B shares will automatically convert to Class A shares on a quarterly basis approximately seven years after purchase. Class B shares are closed to new purchases. Class C shares are sold with a CDSC of 1% on sales made within 12 months of purchase. Class C shares will automatically convert to Class A shares on a monthly basis approximately 10 years after purchase. Class R, Class Z and Class R6 shares are not subject to any sales or redemption charge and are available exclusively for sale to a limited group of investors.
Under certain circumstances, an exchange may be made from specified share classes of the Series to one or more other share classes of the Series as presented in the table of transactions in shares of common stock.
The Company is authorized to issue 6.25 billion shares of common stock at $0.001 par value. There are 923 million shares authorized for the Series, divided into seven classes, designated Class A, Class B, Class C, Class R, Class Z, Class T and Class R6 common stock, each of which consists of 125 million, 3 million, 25 million, 125 million, 280 million, 75 million and 290 million authorized shares, respectively. The Series currently does not have any Class T shares outstanding.
As of March 31, 2019, Prudential, through its affiliated entities, including affiliated funds (if applicable), owned and 685 Class R6 shares of the Series. At reporting period end, four shareholders of record, each holding greater than 5% of the Series, held 36% of the Series’ outstanding shares.
Transactions in shares of common stock were as follows:
| | | | | | | | |
Class A | | Shares | | | Amount | |
Six months ended March 31, 2019: | | | | | | | | |
Shares sold | | | 1,891,752 | | | $ | 27,932,046 | |
Shares issued in reinvestment of dividends and distributions | | | 1,395,165 | | | | 20,146,233 | |
Shares reacquired | | | (1,740,843 | ) | | | (25,908,923 | ) |
| | | | | | | | |
Net increase (decrease) in shares outstanding before conversion | | | 1,546,074 | | | | 22,169,356 | |
Shares issued upon conversion from other share class(es) | | | 94,485 | | | | 1,385,408 | |
Shares reacquired upon conversion into other share class(es) | | | (55,886 | ) | | | (830,451 | ) |
| | | | | | | | |
Net increase (decrease) in shares outstanding | | | 1,584,673 | | | $ | 22,724,313 | |
| | | | | | | | |
Year ended September 30, 2018: | | | | | | | | |
Shares sold | | | 2,114,633 | | | $ | 33,859,226 | |
Shares issued in reinvestment of dividends and distributions | | | 1,183,723 | | | | 18,679,243 | |
Shares reacquired | | | (2,881,571 | ) | | | (46,190,036 | ) |
| | | | | | | | |
Net increase (decrease) in shares outstanding before conversion | | | 416,785 | | | | 6,348,433 | |
Shares issued upon conversion from other share class(es) | | | 146,588 | | | | 2,364,669 | |
Shares reacquired upon conversion into other share class(es) | | | (98,898 | ) | | | (1,578,382 | ) |
| | | | | | | | |
Net increase (decrease) in shares outstanding | | | 464,475 | | | $ | 7,134,720 | |
| | | | | | | | |
| | | | | | | | |
Class B | | Shares | | | Amount | |
Six months ended March 31, 2019: | | | | | | | | |
Shares sold | | | 17,473 | | | $ | 257,742 | |
Shares issued in reinvestment of dividends and distributions | | | 31,249 | | | | 454,248 | |
Shares reacquired | | | (54,261 | ) | | | (818,984 | ) |
| | | | | | | | |
Net increase (decrease) in shares outstanding before conversion | | | (5,539 | ) | | | (106,994 | ) |
Shares reacquired upon conversion into other share class(es) | | | (61,724 | ) | | | (905,426 | ) |
| | | | | | | | |
Net increase (decrease) in shares outstanding | | | (67,263 | ) | | $ | (1,012,420 | ) |
| | | | | | | | |
Year ended September 30, 2018: | | | | | | | | |
Shares sold | | | 52,625 | | | $ | 856,463 | |
Shares issued in reinvestment of dividends and distributions | | | 29,949 | | | | 474,518 | |
Shares reacquired | | | (99,677 | ) | | | (1,594,591 | ) |
| | | | | | | | |
Net increase (decrease) in shares outstanding before conversion | | | (17,103 | ) | | | (263,610 | ) |
Shares reacquired upon conversion into other share class(es) | | | (102,780 | ) | | | (1,673,559 | ) |
| | | | | | | | |
Net increase (decrease) in shares outstanding | | | (119,883 | ) | | $ | (1,937,169 | ) |
| | | | | | | | |
Class C | | | | | | |
Six months ended March 31, 2019: | | | | | | | | |
Shares sold | | | 801,844 | | | $ | 12,069,079 | |
Shares issued in reinvestment of dividends and distributions | | | 319,934 | | | | 4,652,224 | |
Shares reacquired | | | (734,363 | ) | | | (10,931,827 | ) |
| | | | | | | | |
Net increase (decrease) in shares outstanding before conversion | | | 387,415 | | | | 5,789,476 | |
Shares reacquired upon conversion into other share class(es) | | | (111,180 | ) | | | (1,661,697 | ) |
| | | | | | | | |
Net increase (decrease) in shares outstanding | | | 276,235 | | | $ | 4,127,779 | |
| | | | | | | | |
Year ended September 30, 2018: | | | | | | | | |
Shares sold | | | 1,574,301 | | | $ | 25,358,883 | |
Shares issued in reinvestment of dividends and distributions | | | 223,893 | | | | 3,550,964 | |
Shares reacquired | | | (895,301 | ) | | | (14,375,739 | ) |
| | | | | | | | |
Net increase (decrease) in shares outstanding before conversion | | | 902,893 | | | | 14,534,108 | |
Shares reacquired upon conversion into other share class(es) | | | (95,177 | ) | | | (1,541,254 | ) |
| | | | | | | | |
Net increase (decrease) in shares outstanding | | | 807,716 | | | $ | 12,992,854 | |
| | | | | | | | |
Class R | | | | | | |
Six months ended March 31, 2019: | | | | | | | | |
Shares sold | | | 21,571 | | | $ | 317,342 | |
Shares issued in reinvestment of dividends and distributions | | | 6,143 | | | | 88,780 | |
Shares reacquired | | | (55,591 | ) | | | (835,172 | ) |
| | | | | | | | |
Net increase (decrease) in shares outstanding | | | (27,877 | ) | | $ | (429,050 | ) |
| | | | | | | | |
Year ended September 30, 2018: | | | | | | | | |
Shares sold | | | 60,737 | | | $ | 980,875 | |
Shares issued in reinvestment of dividends and distributions | | | 3,582 | | | | 56,555 | |
Shares reacquired | | | (19,869 | ) | | | (320,405 | ) |
| | | | | | | | |
Net increase (decrease) in shares outstanding | | | 44,450 | | | $ | 717,025 | |
| | | | | | | | |
Notes to Financial Statements(unaudited) (continued)
| | | | | | | | |
Class Z | | Shares | | | Amount | |
Six months ended March 31, 2019: | | | | | | | | |
Shares sold | | | 1,752,645 | | | $ | 26,577,798 | |
Shares issued in reinvestment of dividends and distributions | | | 652,565 | | | | 9,488,765 | |
Shares reacquired | | | (2,438,188 | ) | | | (36,137,479 | ) |
| | | | | | | | |
Net increase (decrease) in shares outstanding before conversion | | | (32,978 | ) | | | (70,916 | ) |
Shares issued upon conversion from other share class(es) | | | 135,491 | | | | 2,034,061 | |
Shares reacquired upon conversion into other share class(es) | | | (5,492 | ) | | | (84,572 | ) |
| | | | | | | | |
Net increase (decrease) in shares outstanding | | | 97,021 | | | $ | 1,878,573 | |
| | | | | | | | |
Year ended September 30, 2018: | | | | | | | | |
Shares sold | | | 3,912,312 | | | $ | 63,303,416 | |
Shares issued in reinvestment of dividends and distributions | | | 471,527 | | | | 7,499,899 | |
Shares reacquired | | | (2,121,228 | ) | | | (34,174,419 | ) |
| | | | | | | | |
Net increase (decrease) in shares outstanding before conversion | | | 2,262,611 | | | | 36,628,896 | |
Shares issued upon conversion from other share class(es) | | | 176,101 | | | | 2,840,247 | |
Shares reacquired upon conversion into other share class(es) | | | (30,366 | ) | | | (485,580 | ) |
| | | | | | | | |
Net increase (decrease) in shares outstanding | | | 2,408,346 | | | $ | 38,983,563 | |
| | | | | | | | |
Class R6 | | | | | | |
Six months ended March 31, 2019: | | | | | | | | |
Shares sold | | | 1,234,743 | | | $ | 18,783,292 | |
Shares issued in reinvestment of dividends and distributions | | | 28,773 | | | | 419,150 | |
Shares reacquired | | | (62,802 | ) | | | (940,729 | ) |
| | | | | | | | |
Net increase (decrease) in shares outstanding before conversion | | | 1,200,714 | | | | 18,261,713 | |
Shares issued upon conversion from other share class(es) | | | 4,465 | | | | 62,677 | |
| | | | | | | | |
Net increase (decrease) in shares outstanding | | | 1,205,179 | | | $ | 18,324,390 | |
| | | | | | | | |
Period ended September 30, 2018*: | | | | | | | | |
Shares sold | | | 149,589 | | | $ | 2,452,124 | |
Shares issued in reinvestment of dividends and distributions | | | 360 | | | | 5,871 | |
Shares reacquired | | | (2,881 | ) | | | (47,238 | ) |
| | | | | | | | |
Net increase (decrease) in shares outstanding before conversion | | | 147,068 | | | | 2,410,757 | |
Shares issued upon conversion from other share class(es) | | | 4,604 | | | | 73,859 | |
| | | | | | | | |
Net increase (decrease) in shares outstanding | | | 151,672 | | | $ | 2,484,616 | |
| | | | | | | | |
| * | Commencement of offering was November 28, 2017. |
7. Borrowings
The Company, on behalf of the Series, along with other affiliated registered investment companies (the “Funds”), is a party to a Syndicated Credit Agreement (“SCA”) with a group of banks. The purpose of the SCA is to provide an alternative source of temporary funding for capital share redemptions. The SCA provides for a commitment of $900 million for the period October 4, 2018 through October 3, 2019. The Funds pay an annualized commitment fee of 0.15% of the unused portion of the SCA. The Series’ portion of the commitment fee for the unused amount, allocated based upon a method approved by the Board, is accrued daily and paid quarterly. Prior to October 4, 2018, the Funds had another
SCA that provided a commitment of $900 million and the Funds paid an annualized commitment fee of 0.15% of the unused portion of the SCA. The interest on borrowings under the SCAs is paid monthly and at a per annum interest rate based upon a contractual spread plus the higher of (1) the effective federal funds rate, (2) the1-month LIBOR rate or (3) zero percent.
Certain affiliated registered investment companies that are parties to the SCA include portfolios that are subject to a predetermined mathematical formula used to manage certain benefit guarantees offered under variable annuity contracts. The formula may result in large scale asset flows into and out of these portfolios. Consequently, these portfolios may be more likely to utilize the SCA for purposes of funding redemptions. It may be possible for those portfolios to fully exhaust the committed amount of the SCA, thereby requiring the Manager to allocate available funding per a Board-approved methodology designed to treat the Funds in the SCA equitably.
The Series utilized the SCA during the reporting period ended March 31, 2019. The average daily balance for the 8 days that the Series had loans outstanding during the period was approximately $5,606,625, borrowed at a weighted average interest rate of 3.70%. The maximum loan outstanding amount during the period was $8,135,000. At March 31, 2019, the Series did not have an outstanding loan amount.
8. Risks of Investing in the Series
The Series’ risks include, but are not limited to, some or all of the risks discussed below:
Bond Obligations Risk:The Series’ holdings, share price, yield and total return may fluctuate in response to bond market movements. The value of bonds may decline for issuer-related reasons, including management performance, financial leverage and reduced demand for the issuer’s goods and services. Certain types of fixed-income obligations also may be subject to “call and redemption risk,” which is the risk that the issuer may call a bond held by the Series for redemption before it matures and the Series may not be able to reinvest at the same level and therefore would earn less income.
Derivatives Risk:Derivatives involve special risks and costs and may result in losses to the Series. The successful use of derivatives requires sophisticated management, and, to the extent that derivatives are used, the Series will depend on the Subadviser’s ability to analyze and manage derivative transactions. The prices of derivatives may move in unexpected ways, especially in abnormal market conditions. Some derivatives are “leveraged” and therefore may magnify or otherwise increase investment losses to the Series. Other risks arise from the potential inability to terminate or sell derivatives positions. A liquid secondary market may not always exist for the Series’ derivatives positions. In fact, many OTC derivative instruments will not have liquidity beyond the counterparty to the instrument. OTC derivative instruments also involve the risk that the other party will not meet its obligations to the Series.
Notes to Financial Statements(unaudited) (continued)
Equity and Equity-Related Securities Risks:The value of a particular security could go down and you could lose money. In addition to an individual security losing value, the value of the equity markets or a sector in which the Series invests could go down. The Series’ holdings can vary significantly from broad market indexes and the performance of the Series can deviate from the performance of these indexes. Different parts of a market can react differently to adverse issuer, market, regulatory, political and economic developments.
Interest Rate Risk:The value of an investment may go down when interest rates rise. A rise in rates tends to have a greater impact on the prices of longer term or duration securities. When interest rates fall, the issuers of debt obligations may prepay principal more quickly than expected, and the Series may be required to reinvest the proceeds at a lower interest rate. This is referred to as “prepayment risk.” When interest rates rise, debt obligations may be repaid more slowly than expected, and the value of the Series’ holdings may fall sharply. This is referred to as “extension risk. The Series may face a heightened level of interest rate risk as a result of the U.S. Federal Reserve Board’s policies. The Series’ investments may lose value if short-term or long-term interest rates rise sharply or in a manner not anticipated by the Subadviser.
Liquidity Risk:The Series may invest in instruments that trade in lower volumes and are less liquid than other investments. Liquidity risk exists when particular investments made by the Series are difficult to purchase or sell. Liquidity risk includes the risk that the Series may make investments that may become less liquid in response to market developments or adverse investor perceptions. Investments that are illiquid or that trade in lower volumes may be more difficult to value. If the Series is forced to sell these investments to pay redemption proceeds or for other reasons, the Series may lose money. In addition, when there is no willing buyer and investments may not reasonably be expected to be sold or disposed of in current market conditions in seven calendar days or less without the sale or disposition significantly changing the market value of the investment, the Series may incur higher transaction costs when executing trade orders of a given size. The reduction in dealer market-making capacity in the fixed-income markets that has occurred in recent years also has the potential to reduce liquidity. An inability to sell a portfolio position can adversely affect the Series’ value or prevent the Series from being able to take advantage of other investment opportunities.
Market and Credit Risk:Securities markets may be volatile and the market prices of the Series’ securities may decline. Securities fluctuate in price based on changes in an issuer’s financial condition and overall market and economic conditions. If the market prices of the securities owned by the Series fall, the value of an investment in the Series will decline. Additionally, the Series may also be exposed to credit risk in the event that an issuer or guarantor fails to perform or that an institution or entity with which the Series has unsettled or open transactions defaults.
U.S. Government and Agency Securities Risk:U.S. Government and agency securities are subject to market risk, interest rate risk and credit risk. Not all U.S. Government securities are insured or guaranteed by the full faith and credit of the U.S. Government; some are only insured or guaranteed by the issuing agency, which must rely on its own resources to repay the debt. In addition, the value of U.S. Government securities may be affected by changes in the credit rating of the U.S. Government.
9. Recent Accounting Pronouncements and Reporting Updates
In August 2018, the Securities and Exchange Commission (the “SEC”) adopted amendments to RegulationS-X to update and simplify the disclosure requirements for registered investment companies by eliminating requirements that are redundant or duplicative of US GAAP requirements or other SEC disclosure requirements. The new amendments require the presentation of the total, rather than the components, of distributable earnings on the Statement of Assets and Liabilities and the total, rather than the components, of dividends from net investment income and distributions from net realized gains on the Statements of Changes in Net Assets. The amendments also removed the requirement for the parenthetical disclosure of undistributed net investment income on the Statements of Changes in Net Assets and certain tax adjustments that were reflected in the Notes to Financial Statements. The Manager has adopted the amendments and reflected them in the Series’ financial statements.
In August 2018, the FASB issued Accounting Standards Update (“ASU”)No. 2018-13, which changes certain fair value measurement disclosure requirements. The new ASU, in addition to other modifications and additions, removes the requirement to disclose the amount and reasons for transfers between Level 1 and Level 2 of the fair value hierarchy, and the Series’ policy for the timing of transfers between levels. The amendments are effective for financial statements issued for fiscal years beginning after December 15, 2019, and interim periods within those fiscal years. The Manager has evaluated the implications of certain provisions of the ASU and has determined to early adopt aspects related to the removal and modification of certain fair value measurement disclosures under the ASU effective immediately. At this time, the Manager is evaluating the implications of certain other provisions of the ASU related to new disclosure requirements and any impact on the financial statement disclosures has not yet been determined.
10. Subsequent Event
At a meeting held on December 6, 2018, the Board of Directors of the Series approved a plan of reorganization whereby the PGIM Balanced Fund would acquire the PGIM Conservative Allocation Fund and the PGIM Moderate Allocation Fund. This reorganization was approved by the shareholders of the PGIM Conservative Allocation Fund and the PGIM Moderate Allocation Fund on May 7, 2019 and is scheduled to be completed on or about June 21, 2019.
Financial Highlights (unaudited)
| | | | | | | | | | | | | | | | | | | | | | | | | | | | |
| Class A Shares | | | | | | | | | | | | | | | | | | | | | |
| | | Six Months
Ended
March 31, | | | | | | Year Ended September 30, | |
| | | 2019 | | | | | | 2018 | | | 2017 | | | 2016 | | | 2015 | | | 2014 | |
| Per Share Operating Performance(a): | | | | | | | | | | | | | | | | | | | | | | | | | | | | |
| Net Asset Value, Beginning of Period | | | $16.38 | | | | | | | | $15.93 | | | | $14.99 | | | | $14.67 | | | | $16.45 | | | | $14.70 | |
| Income (loss) from investment operations: | | | | | | | | | | | | | | | | | | | | | | | | | | | | |
| Net investment income (loss) | | | 0.12 | | | | | | | | 0.19 | | | | 0.17 | | | | 0.18 | | | | 0.18 | | | | 0.20 | |
| Net realized and unrealized gain (loss) on investment and foreign currency transactions | | | (0.42 | ) | | | | | | | 1.15 | | | | 1.43 | | | | 1.25 | | | | (0.09 | ) | | | 1.76 | |
| Total from investment operations | | | (0.30 | ) | | | | | | | 1.34 | | | | 1.60 | | | | 1.43 | | | | 0.09 | | | | 1.96 | |
| Less Dividends and Distributions: | | | | | | | | | | | | | | | | | | | | | | | | | | | | |
| Dividends from net investment income | | | (0.13 | ) | | | | | | | (0.20 | ) | | | (0.18 | ) | | | (0.19 | ) | | | (0.33 | ) | | | (0.21 | ) |
| Distributions from net realized gains | | | (0.80 | ) | | | | | | | (0.69 | ) | | | (0.48 | ) | | | (0.92 | ) | | | (1.54 | ) | | | - | |
| Total dividends and distributions | | | (0.93 | ) | | | | | | | (0.89 | ) | | | (0.66 | ) | | | (1.11 | ) | | | (1.87 | ) | | | (0.21 | ) |
| Net asset value, end of period | | | $15.15 | | | | | | | | $16.38 | | | | $15.93 | | | | $14.99 | | | | $14.67 | | | | $16.45 | |
| Total Return(b): | | | (1.54)% | | | | | | | | 8.66% | | | | 10.99% | | | | 10.15% | | | | 0.17% | | | | 13.43% | |
| |
| Ratios/Supplemental Data: | | | | | | | | | | | | | | | | | | | | | |
| Net assets, end of period (000) | | | $357,842 | | | | | | | | $360,798 | | | | $343,550 | | | | $324,422 | | | | $295,456 | | | | $303,153 | |
| Average net assets (000) | | | $344,156 | | | | | | | | $352,124 | | | | $332,088 | | | | $308,458 | | | | $309,664 | | | | $295,552 | |
| Ratios to average net assets(c)(d): | | | | | | | | | | | | | | | | | | | | | | | | | | | | |
| Expenses after waivers and/or expense reimbursement | | | 1.00% | (e) | | | | | | | 1.12% | | | | 1.18% | | | | 1.23% | | | | 1.23% | | | | 1.22% | |
| Expenses before waivers and/or expense reimbursement | | | 1.17% | (e) | | | | | | | 1.17% | | | | 1.20% | | | | 1.25% | | | | 1.25% | | | | 1.24% | |
| Net investment income (loss) | | | 1.64% | (e) | | | | | | | 1.22% | | | | 1.11% | | | | 1.23% | | | | 1.16% | | | | 1.27% | |
| Portfolio turnover rate(f)(g) | | | 68% | | | | | | | | 145% | | | | 180% | | | | 230% | | | | 216% | | | | 215% | |
| (a) | Calculated based on average shares outstanding during the period. |
| (b) | Total return does not consider the effects of sales loads. Total return is calculated assuming a purchase of a share on the first day and a sale on the last day of each period reported and includes reinvestment of dividends and distributions, if any. Total returns may reflect adjustments to conform to generally accepted accounting principles. Total returns for periods less than one full year are not annualized. |
| (c) | Does not include expenses of the underlying funds in which the Series invests. |
| (d) | Effective October 1, 2017, class specific expenses include transfer agent fees and expenses and registration fees, which are charged to their respective share class. |
| (f) | The Series accounts for mortgage dollar roll transactions, when applicable, as purchases and sales which, as a result, can increase its portfolio turnover rate. |
| (g) | The Series’ portfolio turnover rate is calculated in accordance with regulatory requirements, without regard to transactions involving short term investments and certain derivatives. If such transactions were included, the Series’ portfolio turnover rate may be higher. |
See Notes to Financial Statements.
| | | | | | | | | | | | | | | | | | | | | | | | | | | | |
| Class B Shares | | | | | | | | | | | | | | | | | | | | | |
| | | Six Months
Ended
March 31, | | | | | | Year Ended September 30, | |
| | | 2019 | | | | | | 2018 | | | 2017 | | | 2016 | | | 2015 | | | 2014 | |
| Per Share Operating Performance(a): | | | | | | | | | | | | | | | | | | | | | | | | | | | | |
| Net Asset Value, Beginning of Period | | | $16.47 | | | | | | | | $16.02 | | | | $15.08 | | | | $14.75 | | | | $16.45 | | | | $14.71 | |
| Income (loss) from investment operations: | | | | | | | | | | | | | | | | | | | | | | | | | | | | |
| Net investment income (loss) | | | 0.04 | | | | | | | | 0.04 | | | | 0.06 | | | | 0.08 | | | | 0.07 | | | | 0.09 | |
| Net realized and unrealized gain (loss) on investment and foreign currency transactions | | | (0.41 | ) | | | | | | | 1.15 | | | | 1.43 | | | | 1.25 | | | | (0.09 | ) | | | 1.75 | |
| Total from investment operations | | | (0.37 | ) | | | | | | | 1.19 | | | | 1.49 | | | | 1.33 | | | | (0.02 | ) | | | 1.84 | |
| Less Dividends and Distributions: | | | | | | | | | | | | | | | | | | | | | | | | | | | | |
| Dividends from net investment income | | | (0.05 | ) | | | | | | | (0.05 | ) | | | (0.07 | ) | | | (0.08 | ) | | | (0.14 | ) | | | (0.10 | ) |
| Distributions from net realized gains | | | (0.80 | ) | | | | | | | (0.69 | ) | | | (0.48 | ) | | | (0.92 | ) | | | (1.54 | ) | | | - | |
| Total dividends and distributions | | | (0.85 | ) | | | | | | | (0.74 | ) | | | (0.55 | ) | | | (1.00 | ) | | | (1.68 | ) | | | (0.10 | ) |
| Net asset value, end of period | | | $15.25 | | | | | | | | $16.47 | | | | $16.02 | | | | $15.08 | | | | $14.75 | | | | $16.45 | |
| Total Return(b): | | | (2.02)% | | | | | | | | 7.62% | | | | 10.16% | | | | 9.41% | | | | (0.49)% | | | | 12.60% | |
| |
| Ratios/Supplemental Data: | | | | | | | | | | | | | | | | | | | | | |
| Net assets, end of period (000) | | | $7,651 | | | | | | | | $9,374 | | | | $11,040 | | | | $12,101 | | | | $12,376 | | | | $14,899 | |
| Average net assets (000) | | | $8,394 | | | | | | | | $10,376 | | | | $11,624 | | | | $12,405 | | | | $14,068 | | | | $14,806 | |
| Ratios to average net assets(c)(d): | | | | | | | | | | | | | | | | | | | | | | | | | | | | |
| Expenses after waivers and/or expense reimbursement | | | 2.10% | (e) | | | | | | | 2.07% | | | | 1.88% | | | | 1.93% | | | | 1.93% | | | | 1.92% | |
| Expenses before waivers and/or expense reimbursement | | | 2.20% | (e) | | | | | | | 2.13% | | | | 1.90% | | | | 1.95% | | | | 1.95% | | | | 1.94% | |
| Net investment income (loss) | | | 0.53% | (e) | | | | | | | 0.26% | | | | 0.41% | | | | 0.54% | | | | 0.46% | | | | 0.57% | |
| Portfolio turnover rate(f)(g) | | | 68% | | | | | | | | 145% | | | | 180% | | | | 230% | | | | 216% | | | | 215% | |
| (a) | Calculated based on average shares outstanding during the period. |
| (b) | Total return does not consider the effects of sales loads. Total return is calculated assuming a purchase of a share on the first day and a sale on the last day of each period reported and includes reinvestment of dividends and distributions, if any. Total returns may reflect adjustments to conform to generally accepted accounting principles. Total returns for periods less than one full year are not annualized. |
| (c) | Does not include expenses of the underlying funds in which the Series invests. |
| (d) | Effective October 1, 2017, class specific expenses include transfer agent fees and expenses and registration fees, which are charged to their respective share class. |
| (f) | The Series accounts for mortgage dollar roll transactions, when applicable, as purchases and sales which, as a result, can increase its portfolio turnover rate. |
| (g) | The Series’ portfolio turnover rate is calculated in accordance with regulatory requirements, without regard to transactions involving short term investments and certain derivatives. If such transactions were included, the Series’ portfolio turnover rate may be higher. |
See Notes to Financial Statements.
Financial Highlights(unaudited) (continued)
| | | | | | | | | | | | | | | | | | | | | | | | | | | | |
| Class C Shares | | | | |
| | | Six Months Ended March 31, | | | | | | Year Ended September 30, | |
| | | 2019 | | | | | | 2018 | | | 2017 | | | 2016 | | | 2015 | | | 2014 | |
| Per Share Operating Performance(a): | | | | | | | | | | | | | | | | | | | | | | | | | | | | |
| Net Asset Value, Beginning of Period | | | $16.48 | | | | | | | | $16.02 | | | | $15.08 | | | | $14.74 | | | | $16.45 | | | | $14.71 | |
| Income (loss) from investment operations: | | | | | | | | | | | | | | | | | | | | | | | | | | | | |
| Net investment income (loss) | | | 0.07 | | | | | | | | 0.08 | | | | 0.06 | | | | 0.08 | | | | 0.07 | | | | 0.09 | |
| Net realized and unrealized gain (loss) on investment and foreign currency transactions | | | (0.43 | ) | | | | | | | 1.16 | | | | 1.43 | | | | 1.26 | | | | (0.10 | ) | | | 1.75 | |
| Total from investment operations | | | (0.36 | ) | | | | | | | 1.24 | | | | 1.49 | | | | 1.34 | | | | (0.03 | ) | | | 1.84 | |
| Less Dividends and Distributions: | | | | | | | | | | | | | | | | | | | | | | | | | | | | |
| Dividends from net investment income | | | (0.07 | ) | | | | | | | (0.09 | ) | | | (0.07 | ) | | | (0.08 | ) | | | (0.14 | ) | | | (0.10 | ) |
| Distributions from net realized gains | | | (0.80 | ) | | | | | | | (0.69 | ) | | | (0.48 | ) | | | (0.92 | ) | | | (1.54 | ) | | | - | |
| Total dividends and distributions | | | (0.87 | ) | | | | | | | (0.78 | ) | | | (0.55 | ) | | | (1.00 | ) | | | (1.68 | ) | | | (0.10 | ) |
| Net asset value, end of period | | | $15.25 | | | | | | | | $16.48 | | | | $16.02 | | | | $15.08 | | | | $14.74 | | | | $16.45 | |
| Total Return(b): | | | (1.90)% | | | | | | | | 7.92% | | | | 10.16% | | | | 9.49% | | | | (0.56)% | | | | 12.60% | |
| |
| Ratios/Supplemental Data: | | | | | | | | | | | | | | | | | | | | | |
| Net assets, end of period (000) | | | $87,470 | | | | | | | | $89,949 | | | | $74,527 | | | | $57,448 | | | | $30,093 | | | | $20,838 | |
| Average net assets (000) | | | $86,258 | | | | | | | | $82,930 | | | | $66,532 | | | | $43,525 | | | | $26,353 | | | | $17,899 | |
| Ratios to average net assets(c)(d): | | | | | | | | | | | | | | | | | | | | | | | | | | | | |
| Expenses after waivers and/or expense reimbursement | | | 1.75% | (e) | | | | | | | 1.81% | | | | 1.88% | | | | 1.93% | | | | 1.93% | | | | 1.92% | |
| Expenses before waivers and/or expense reimbursement | | | 1.86% | (e) | | | | | | | 1.87% | | | | 1.90% | | | | 1.95% | | | | 1.95% | | | | 1.94% | |
| Net investment income (loss) | | | 0.89% | (e) | | | | | | | 0.52% | | | | 0.41% | | | | 0.53% | | | | 0.47% | | | | 0.58% | |
| Portfolio turnover rate(f)(g) | | | 68% | | | | | | | | 145% | | | | 180% | | | | 230% | | | | 216% | | | | 215% | |
| (a) | Calculated based on average shares outstanding during the period. |
| (b) | Total return does not consider the effects of sales loads. Total return is calculated assuming a purchase of a share on the first day and a sale on the last day of each period reported and includes reinvestment of dividends and distributions, if any. Total returns may reflect adjustments to conform to generally accepted accounting principles. Total returns for periods less than one full year are not annualized. |
| (c) | Does not include expenses of the underlying funds in which the Series invests. |
| (d) | Effective October 1, 2017, class specific expenses include transfer agent fees and expenses and registration fees, which are charged to their respective share class. |
| (f) | The Series accounts for mortgage dollar roll transactions, when applicable, as purchases and sales which, as a result, can increase its portfolio turnover rate. |
| (g) | The Series’ portfolio turnover rate is calculated in accordance with regulatory requirements, without regard to transactions involving short term investments and certain derivatives. If such transactions were included, the Series’ portfolio turnover rate may be higher. |
See Notes to Financial Statements.
| | | | | | | | | | | | | | | | | | | | | | | | | | | | |
| Class R Shares | | | | | | | | | | | | | | | | | | | | | |
| | | Six Months
Ended March 31, | | | | | | Year Ended September 30, | |
| | | 2019 | | | | | | 2018 | | | 2017 | | | 2016 | | | 2015 | | | 2014 | |
| Per Share Operating Performance(a): | | | | | | | | | | | | | | | | | | | | | | | | | | | | |
| Net Asset Value, Beginning of Period | | | $16.38 | | | | | | | | $15.94 | | | | $15.00 | | | | $14.68 | | | | $16.43 | | | | $14.69 | |
| Income (loss) from investment operations: | | | | | | | | | | | | | | | | | | | | | | | | | | | | |
| Net investment income (loss) | | | 0.07 | | | | | | | | 0.11 | | | | 0.14 | | | | 0.15 | | | | 0.15 | | | | 0.17 | |
| Net realized and unrealized gain (loss) on investment and foreign currency transactions | | | (0.41 | ) | | | | | | | 1.14 | | | | 1.43 | | | | 1.25 | | | | (0.09 | ) | | | 1.75 | |
| Total from investment operations | | | (0.34 | ) | | | | | | | 1.25 | | | | 1.57 | | | | 1.40 | | | | 0.06 | | | | 1.92 | |
| Less Dividends and Distributions: | | | | | | | | | | | | | | | | | | | | | | | | | | | | |
| Dividends from net investment income | | | (0.08 | ) | | | | | | | (0.12 | ) | | | (0.15 | ) | | | (0.16 | ) | | | (0.27 | ) | | | (0.18 | ) |
| Distributions from net realized gains | | | (0.80 | ) | | | | | | | (0.69 | ) | | | (0.48 | ) | | | (0.92 | ) | | | (1.54 | ) | | | - | |
| Total dividends and distributions | | | (0.88 | ) | | | | | | | (0.81 | ) | | | (0.63 | ) | | | (1.08 | ) | | | (1.81 | ) | | | (0.18 | ) |
| Net asset value, end of period | | | $15.16 | | | | | | | | $16.38 | | | | $15.94 | | | | $15.00 | | | | $14.68 | | | | $16.43 | |
| Total Return(b): | | | (1.80)% | | | | | | | | 8.07% | | | | 10.77% | | | | 9.93% | | | | 0.02% | | | | 13.16% | |
| |
| Ratios/Supplemental Data: | | | | | | | | | | | | | | | | | | | | | |
| Net assets, end of period (000) | | | $1,637 | | | | | | | | $2,226 | | | | $1,457 | | | | $723 | | | | $553 | | | | $482 | |
| Average net assets (000) | | | $2,037 | | | | | | | | $1,837 | | | | $947 | | | | $739 | | | | $528 | | | | $395 | |
| Ratios to average net assets(c)(d): | | | | | | | | | | | | | | | | | | | | | | | | | | | | |
| Expenses after waivers and/or expense reimbursement | | | 1.63% | (e) | | | | | | | 1.63% | | | | 1.38% | | | | 1.43% | | | | 1.43% | | | | 1.42% | |
| Expenses before waivers and/or expense reimbursement | | | 2.48% | (e) | | | | | | | 2.88% | | | | 1.65% | | | | 1.70% | | | | 1.70% | | | | 1.69% | |
| Net investment income (loss) | | | 0.99% | (e) | | | | | | | 0.71% | | | | 0.92% | | | | 1.04% | | | | 0.96% | | | | 1.08% | |
| Portfolio turnover rate(f)(g) | | | 68% | | | | | | | | 145% | | | | 180% | | | | 230% | | | | 216% | | | | 215% | |
| (a) | Calculated based on average shares outstanding during the period. |
| (b) | Total return is calculated assuming a purchase of a share on the first day and a sale on the last day of each period reported and includes reinvestment of dividends and distributions, if any. Total returns may reflect adjustments to conform to generally accepted accounting principles. Total returns for periods less than one full year are not annualized. |
| (c) | Does not include expenses of the underlying funds in which the Series invests. |
| (d) | Effective October 1, 2017, class specific expenses include transfer agent fees and expenses and registration fees, which are charged to their respective share class. |
| (f) | The Series accounts for mortgage dollar roll transactions, when applicable, as purchases and sales which, as a result, can increase its portfolio turnover rate. |
| (g) | The Series’ portfolio turnover rate is calculated in accordance with regulatory requirements, without regard to transactions involving short term investments and certain derivatives. If such transactions were included, the Series’ portfolio turnover rate may be higher. |
See Notes to Financial Statements.
Financial Highlights(unaudited) (continued)
| | | | | | | | | | | | | | | | | | | | | | | | | | | | |
| Class Z Shares | | | | | | | | | | | | | | | | | | | | | |
| | | Six Months
Ended
March 31, | | | | | | Year Ended September 30, | |
| | | 2019 | | | | | | 2018 | | | 2017 | | | 2016 | | | 2015 | | | 2014 | |
| Per Share Operating Performance(a): | | | | | | | | | | | | | | | | | | | | | | | | | | | | |
| Net Asset Value, Beginning of Period | | | $16.49 | | | | | | | | $16.04 | | | | $15.09 | | | | $14.75 | | | | $16.57 | | | | $14.80 | |
| Income (loss) from investment operations: | | | | | | | | | | | | | | | | | | | | | | | | | | | | |
| Net investment income (loss) | | | 0.14 | | | | | | | | 0.24 | | | | 0.22 | | | | 0.22 | | | | 0.23 | | | | 0.25 | |
| Net realized and unrealized gain (loss) on investment and foreign currency transactions | | | (0.41 | ) | | | | | | | 1.15 | | | | 1.43 | | | | 1.27 | | | | (0.10 | ) | | | 1.77 | |
| Total from investment operations | | | (0.27 | ) | | | | | | | 1.39 | | | | 1.65 | | | | 1.49 | | | | 0.13 | | | | 2.02 | |
| Less Dividends and Distributions: | | | | | | | | | | | | | | | | | | | | | | | | | | | | |
| Dividends from net investment income | | | (0.15 | ) | | | | | | | (0.25 | ) | | | (0.22 | ) | | | (0.23 | ) | | | (0.41 | ) | | | (0.25 | ) |
| Distributions from net realized gains | | | (0.80 | ) | | | | | | | (0.69 | ) | | | (0.48 | ) | | | (0.92 | ) | | | (1.54 | ) | | | - | |
| Total dividends and distributions | | | (0.95 | ) | | | | | | | (0.94 | ) | | | (0.70 | ) | | | (1.15 | ) | | | (1.95 | ) | | | (0.25 | ) |
| Net asset value, end of period | | | $15.27 | | | | | | | | $16.49 | | | | $16.04 | | | | $15.09 | | | | $14.75 | | | | $16.57 | |
| Total Return(b): | | | (1.34)% | | | | | | | | 8.91% | | | | 11.32% | | | | 10.57% | | | | 0.41% | | | | 13.80% | |
| |
| Ratios/Supplemental Data: | | | | | | | | | | | | | | | | | | | | | |
| Net assets, end of period (000) | | | $171,050 | | | | | | | | $183,204 | | | | $139,497 | | | | $92,562 | | | | $63,516 | | | | $98,321 | |
| Average net assets (000) | | | $169,727 | | | | | | | | $156,026 | | | | $118,555 | | | | $79,518 | | | | $59,423 | | | | $89,928 | |
| Ratios to average net assets(c)(d): | | | | | | | | | | | | | | | | | | | | | | | | | | | | |
| Expenses after waivers and/or expense reimbursement | | | 0.77% | (e) | | | | | | | 0.82% | | | | 0.88% | | | | 0.93% | | | | 0.93% | | | | 0.92% | |
| Expenses before waivers and/or expense reimbursement | | | 0.87% | (e) | | | | | | | 0.88% | | | | 0.90% | | | | 0.95% | | | | 0.95% | | | | 0.94% | |
| Net investment income (loss) | | | 1.87% | (e) | | | | | | | 1.52% | | | | 1.41% | | | | 1.53% | | | | 1.45% | | | | 1.57% | |
| Portfolio turnover rate(f)(g) | | | 68% | | | | | | | | 145% | | | | 180% | | | | 230% | | | | 216% | | | | 215% | |
| (a) | Calculated based on average shares outstanding during the period. |
| (b) | Total return is calculated assuming a purchase of a share on the first day and a sale on the last day of each period reported and includes reinvestment of dividends and distributions, if any. Total returns may reflect adjustments to conform to generally accepted accounting principles. Total returns for periods less than one full year are not annualized. |
| (c) | Does not include expenses of the underlying funds in which the Series invests. |
| (d) | Effective October 1, 2017, class specific expenses include transfer agent fees and expenses and registration fees, which are charged to their respective share class. |
| (f) | The Series accounts for mortgage dollar roll transactions, when applicable, as purchases and sales which, as a result, can increase its portfolio turnover rate. |
| (g) | The Series’ portfolio turnover rate is calculated in accordance with regulatory requirements, without regard to transactions involving short term investments and certain derivatives. If such transactions were included, the Series’ portfolio turnover rate may be higher. |
See Notes to Financial Statements.
| | | | | | | | | | | | |
| Class R6 Shares | |
| | | Six Months
Ended
March 31,
2019 | | | | | | November 28, 2017(a)
through September 30,
2018 | |
| Per Share Operating Performance(b): | | | | | | | | | | | | |
| Net Asset Value, Beginning of Period | | | $16.50 | | | | | | | | $16.48 | |
| Income (loss) from investment operations: | | | | | | | | | | | | |
| Net investment income (loss) | | | 0.15 | | | | | | | | 0.23 | |
| Net realized and unrealized gain (loss) on investment and foreign currency transactions | | | (0.43 | ) | | | | | | | 0.73 | |
| Total from investment operations | | | (0.28 | ) | | | | | | | 0.96 | |
| Less Dividends and Distributions: | | | | | | | | | | | | |
| Dividends from net investment income | | | (0.15 | ) | | | | | | | (0.25 | ) |
| Distributions from net realized gains | | | (0.80 | ) | | | | | | | (0.69 | ) |
| Total dividends and distributions | | | (0.95 | ) | | | | | | | (0.94 | ) |
| Net asset value, end of period | | | $15.27 | | | | | | | | $16.50 | |
| Total Return(c): | | | (1.36)% | | | | | | | | 6.10% | |
| | | | | | | | | | | | |
| Ratios/Supplemental Data: | | | | | | | | | |
| Net assets, end of period (000) | | | $20,723 | | | | | | | | $2,502 | |
| Average net assets (000) | | | $7,675 | | | | | | | | $295 | |
| Ratios to average net assets(d): | | | | | | | | | | | | |
| Expenses after waivers and/or expense reimbursement | | | 0.65% | (e) | | | | | | | 0.67% | (e) |
| Expenses before waivers and/or expense reimbursement | | | 0.97% | (e) | | | | | | | 11.39% | (e) |
| Net investment income (loss) | | | 2.09% | (e) | | | | | | | 1.73% | (e) |
| Portfolio turnover rate(f)(g) | | | 68% | | | | | | | | 145% | |
| (a) | Commencement of offering. |
| (b) | Calculated based on average shares outstanding during the period. |
| (c) | Total return is calculated assuming a purchase of a share on the first day and a sale on the last day of each period reported and includes reinvestment of dividends and distributions, if any. Total returns may reflect adjustments to conform to generally accepted accounting principles. Total returns for periods less than one full year are not annualized. |
| (d) | Does not include expenses of the underlying funds in which the Series invests. |
| (f) | The Series accounts for mortgage dollar roll transactions, when applicable, as purchases and sales which, as a result, can increase its portfolio turnover rate. |
| (g) | The Series’ portfolio turnover rate is calculated in accordance with regulatory requirements, without regard to transactions involving short term investments and certain derivatives. If such transactions were included, the Series’ portfolio turnover rate may be higher. |
See Notes to Financial Statements.
| | | | |
| | |
| ∎ MAIL | | ∎ TELEPHONE | | ∎ WEBSITE |
655 Broad Street Newark, NJ 07102 | | (800) 225-1852 | | pgiminvestments.com |
|
| PROXY VOTING |
| The Board of Directors of the Fund has delegated to the Fund’s subadvisers the responsibility for voting any proxies and maintaining proxy recordkeeping with respect to the Fund. A description of these proxy voting policies and procedures is available without charge, upon request, by calling (800) 225-1852. Information regarding how the Fund voted proxies relating to portfolio securities during the most recent 12-month period ended June 30 is available on the Fund’s websiteand on the Securities and Exchange Commission’s website. |
|
| DIRECTORS |
| Ellen S. Alberding• Kevin J. Bannon• Scott E. Benjamin• Linda W. Bynoe• Barry H. Evans• Keith F. Hartstein• Laurie Simon Hodrick• Michael S. Hyland• Stuart S. Parker• Brian K. Reid• Grace C. Torres |
|
| OFFICERS |
| Stuart S. Parker,President• Scott E. Benjamin,Vice President• Christian J. Kelly,Treasurer and Principal Financialand Accounting Officer• Raymond A. O’Hara,Chief Legal Officer• Chad A. Earnst,Chief Compliance Officer• Dino Capasso,Deputy Chief Compliance Officer• Andrew R. French, Secretary• Jonathan D. Shain, Assistant Secretary• Claudia DiGiacomo,Assistant Secretary• Diana N. Huffman,Assistant Secretary• Peter Parrella,Assistant Treasurer• Lana Lomuti,Assistant Treasurer• Linda McMullin,Assistant Treasurer• Kelly A. Coyne,Assistant Treasurer• Charles H. Smith,Anti-Money Laundering Compliance Officer |
| | | | |
| MANAGER | | PGIM Investments LLC | | 655 Broad Street
Newark, NJ 07102 |
|
| SUBADVISERS | | PGIM Fixed Income | | 655 Broad Street
Newark, NJ 07102 |
|
| | QMA LLC | | Gateway Center Two
100 Mulberry Street
Newark, NJ 07102 |
|
| DISTRIBUTOR | | Prudential Investment
Management Services LLC | | 655 Broad Street
Newark, NJ 07102 |
|
| CUSTODIAN | | The Bank of New York Mellon | | 240 Greenwich Street
New York, NY 10286 |
|
| TRANSFER AGENT | | Prudential Mutual Fund
Services LLC | | PO Box 9658
Providence, RI 02940 |
|
INDEPENDENT REGISTERED
PUBLIC ACCOUNTING FIRM | | KPMG LLP | | 345 Park Avenue
New York, NY 10154 |
|
| FUND COUNSEL | | Willkie Farr & Gallagher LLP | | 787 Seventh Avenue
New York, NY 10019 |
|
|
| An investor should consider the investment objectives, risks, charges, and expenses of the Fund carefully before investing. The prospectus and summary prospectus contain this and other information about the Fund. An investor may obtain the prospectus and summary prospectus by visiting our website atpgiminvestments.com or by calling(800) 225-1852. The prospectus and summary prospectus should be read carefully before investing. |
|
| E-DELIVERY |
| To receive your mutual fund documents online, go topgiminvestments.com/edelivery and enroll. Instead of receiving printed documents by mail, you will receive notification via email when new materials are available. You can cancel your enrollment or change your email address at any time by visiting the website address above. |
|
| SHAREHOLDER COMMUNICATIONS WITH DIRECTORS |
| Shareholders can communicate directly with the Board of Directors by writing to the Chair of the Board, PGIM Balanced Fund, PGIM Investments, Attn: Board of Directors, 655 Broad Street, Newark, NJ 07102. Shareholders can communicate directly with an individual Director by writing to the same address. Communications are not screened before being delivered to the addressee. |
|
| AVAILABILITY OF PORTFOLIO SCHEDULE |
| The Fund files its complete schedule of portfolio holdings with the Securities and Exchange Commission for the first and third quarters of each fiscal year on Form N-Q. The Fund’s Forms N-Q are available on the Commission’s website atsec.gov.Beginning with reporting periods on or after March 31, 2019, Form N-PORT will replace Form N-Q. Form N-PORT will be filed with the Securities and Exchange Commission quarterly, and each Fund’s full portfolio holdings as of its first and third quarters of each fiscal year will be made publicly available 60 days after the end of each quarter. The Fund’s schedule of portfolio holdings is also available on the Fund’s website as of the end of each month no sooner than 15 days after the end of the month. |
Mutual Funds:
| | | | |
| ARE NOT INSURED BY THE FDIC OR ANY FEDERAL GOVERNMENT AGENCY | | MAY LOSE VALUE | | ARE NOT A DEPOSIT OF OR GUARANTEED BY ANY BANK OR ANY BANK AFFILIATE |
PGIM BALANCED FUND
| | | | | | | | | | | | |
| SHARE CLASS | | A | | B | | C | | R | | Z | | R6* |
| NASDAQ | | PIBAX | | PBFBX | | PABCX | | PALRX | | PABFX | | PIBQX |
| CUSIP | | 74437E883 | | 74437E875 | | 74437E867 | | 74437E636 | | 74437E859 | | 74437E461 |
* Formerly known as Class Q shares.
MF185E2

PGIM JENNISON EQUITY OPPORTUNITY FUND
(Formerly known as Prudential Jennison Equity Opportunity Fund)
SEMIANNUAL REPORT
MARCH 31, 2019
COMING SOON: PAPERLESS SHAREHOLDER REPORTS
Beginning on January 1, 2021, as permitted by regulations adopted by the Securities and Exchange Commission, paper copies of the Fund’s annual and semiannual shareholder reports will no longer be sent by mail, unless you specifically request paper copies of the reports. Instead, the reports will be made available on the Fund’s website (pgiminvestments.com), and you will be notified by mail each time a report is posted and provided with a website link to access the report.
If you already elected to receive shareholder reports electronically, you will not be affected by this change and you need not take any action. You may elect to receive shareholder reports and other communications from the Fund electronically anytime by contacting your financial intermediary (such as a broker-dealer or bank) or, if you are a direct investor, by calling 1-800-225-1852 or by sending an email request to PGIM Investments at shareholderreports@pgim.com.
You may elect to receive all future reports in paper free of charge. If you invest through a financial intermediary, you can contact your financial intermediary or follow instructions included with this notice to elect to continue to receive paper copies of your shareholder reports. If you invest directly with the Fund, you can call 1-800-225-1852 or send an email request to shareholderreports@pgim.com to let the Fund know you wish to continue receiving paper copies of your shareholder reports. Your election to receive reports in paper will apply to all funds held in your account if you invest through your financial intermediary or all funds held with the fund complex if you invest directly with the Fund.

To enroll in e-delivery, go to pgiminvestments.com/edelivery
|
| Objective:Long-term growth of capital |
This report is not authorized for distribution to prospective investors unless preceded or accompanied by a current prospectus.
The information about the Fund’s portfolio holdings is for the period covered by this report and is subject to change thereafter.
The accompanying financial statements as of March 31, 2019 were not audited and, accordingly, no auditor’s opinion is expressed on them.
Mutual funds are distributed by Prudential Investment Management Services LLC, member SIPC. Jennison Associates is a registered investment adviser. Both are Prudential Financial companies.© 2019 Prudential Financial, Inc. and its related entities. Jennison Associates, Jennison, PGIM, and the PGIM logo are service marks of Prudential Financial, Inc. and its related entities, registered in many jurisdictions worldwide.
| | |
| 2 | | Visit our website at pgiminvestments.com |
Table of Contents
| | | | |
| PGIM Jennison Equity Opportunity Fund | | | 3 | |
This Page Intentionally Left Blank
Letter from the President

Dear Shareholder:
We hope you find the semiannual report for PGIM Jennison Equity Opportunity Fund informative and useful. The report covers performance for the six-month period ended March 31, 2019.
We have important information to share with you. Effective June 11, 2018, Prudential Mutual Funds were renamed PGIM Funds. This renaming is
part of our ongoing effort to further build our reputation and establish our global brand, which began when our firm adopted PGIM Investments as its name in April 2017. Please note that only the Fund’s name has changed. Your Fund’s management and operation, along with its symbols, remained the same.*
Regarding your investments with PGIM, we believe it is important to maintain a diversified portfolio of funds consistent with your tolerance for risk, time horizon, and financial goals.
Your financial advisor can help you create a diversified investment plan that may include funds covering all the basic asset classes and that reflects your personal investor profile and risk tolerance. However, diversification and asset allocation strategies do not assure a profit or protect against loss in declining markets.
At PGIM Investments, we consider it a great privilege and responsibility to help investors participate in opportunities across global markets while meeting their toughest investment challenges. PGIM is a top-10 global investment manager with more than $1 trillion in assets under management. This investment expertise allows us to deliver actively managed funds and strategies to meet the needs of investors around the globe.
Thank you for choosing our family of funds.
Sincerely,

Stuart S. Parker, President
PGIM Jennison Equity Opportunity Fund
May 15, 2019
*The Prudential Day One Funds did not change their names.
| | | | |
| PGIM Jennison Equity Opportunity Fund | | | 5 | |
Your Fund’s Performance(unaudited)
Performance data quoted represent past performance. Past performance does not guarantee future results. The investment return and principal value of an investment will fluctuate, so that an investor’s shares, when redeemed, may be worth more or less than their original cost. Current performance may be lower or higher than the past performance data quoted. An investor may obtain performance data as of the most recent month-end by visiting our website atpgiminvestments.com or by calling (800) 225-1852.
| | | | | | | | | | |
| | |
| | | Total Returns as of 3/31/19
(without sales charges) Six Months* (%) | | Average Annual Total Returns as of 3/31/19
(with sales charges) |
| | | One Year (%) | | Five Years (%) | | Ten Years (%) | | Since Inception (%) |
| Class A | | –8.81 | | –8.83 | | 4.26 | | 13.17 | | — |
| Class B | | –9.23 | | –8.31 | | 4.52 | | 12.98 | | — |
| Class C | | –9.16 | | –5.02 | | 4.68 | | 13.02 | | — |
| Class R | | –9.05 | | –4.04 | | 5.14 | | 13.54 | | — |
| Class Z | | –8.70 | | –3.27 | | 5.75 | | 14.16 | | — |
| Class R6** | | –8.65 | | –3.21 | | N/A | | N/A | | 5.84 (11/25/14) |
| S&P 500 Index |
| | –1.72 | | 9.49 | | 10.90 | | 15.91 | | — |
| Lipper Customized Blend Funds Average*** |
| | –3.55 | | 3.90 | | 7.27 | | 13.95 | | — |
| Lipper Multi-Cap Value Funds Average*** |
| | | –4.16 | | 1.78 | | 6.20 | | 13.57 | | — |
*Not annualized.
**Formerly known as Class Q shares.
***The Lipper Customized Blend Funds Average is a blend of the Lipper Multi-Cap Core Funds and Lipper Multi-Cap Value Funds Averages. The Lipper Customized Blend Funds Average was utilized because the Fund’s manager believes that a blend of the Lipper Multi-Cap Core Funds and Lipper Multi-Cap Value Funds Averages provides a more appropriate basis for Fund performance comparisons, although Lipper classifies the Fund in its Multi-Cap Value Funds universe.
Source: PGIM Investments LLC and Lipper Inc.
Since Inception returns are provided for any share class with less than 10 fiscal years of returns. Since Inception returns for the Index and the Lipper Averages are measured from the closest month-end to the class’ inception date.
| | |
| 6 | | Visit our website at pgiminvestments.com |
The returns in the tables do not reflect the deduction of taxes that a shareholder would pay on Fund distributions or following the redemption of Fund shares. The average annual total returns take into account applicable sales charges, which are described for each share class in the table below.
| | | | | | | | | | | | |
| | | | | | | |
| | | Class A | | Class B* | | Class C | | Class R | | Class Z | | Class R6** |
| Maximum initial sales charge | | 5.50% of the public offering price | | None | | None | | None | | None | | None |
| Contingent deferred sales charge (CDSC) (as a percentage of the lower of original purchase price or net asset value at redemption) | | 1.00% on sales of $1 million or more made within 12 months of purchase | | 5.00% (Yr.1) 4.00% (Yr.2) 3.00% (Yr.3) 2.00% (Yr.4) 1.00% (Yr.5) 1.00% (Yr.6) 0.00% (Yr.7) | | 1.00% on sales made within 12 months of purchase | | None | | None | | None |
| Annual distribution and service(12b-1) fees (shown as a percentage of average daily net assets) | | 0.30% | | 1.00% | | 1.00% | | 0.75% (0.50% currently) | | None | | None |
*Class B shares are closed to all purchase activity and no additional Class B shares may be purchased or acquired except by exchange from Class B shares of another Fund or through dividend or capital gains reinvestment.
**Formerly known as Class Q shares.
Benchmark Definitions
S&P 500 Index—The S&P 500 Index is an unmanaged index of over 500 stocks of large US public companies. It gives a broad look at how stock prices in the United States have performed. The average annual total return for the Index measured from the month-end closest to the inception date of the Fund’s Class R6 shares is 9.78%.
Lipper Customized Blend Funds Average—The Lipper Customized Blend Funds Average (Lipper Average) is a 50/50 blend of the Lipper Multi-Cap Value Funds and Lipper Multi-Cap Core Funds Averages. The average annual total return for the Lipper Average measured from the month-end closest to the inception date of the Fund’s Class R6 shares is 6.58%.
Lipper Multi-Cap Value Funds Average—The Lipper Multi-Cap Value Funds Average (Lipper Average) is based on the average return of all funds in the Lipper Multi-Cap Value Funds universe for the periods noted. Funds in the Lipper Average invest in a variety of market capitalization ranges without concentrating 75% of their equity assets in any one market capitalization range over an extended period of time. Multi-Cap Value Funds in the Lipper Average typically have a below-average price-to-earnings ratio, price-to-book ratio, and three-year sales-per-share growth value compared to the S&P SuperComposite 1500 Index. The average
| | | | |
| PGIM Jennison Equity Opportunity Fund | | | 7 | |
Your Fund’s Performance(continued)
annual total return for the Lipper Average measured from the month-end closest to the inception date of the Fund’s Class R6 shares is 5.59%.
Investors cannot invest directly in an index or average. The returns for the Index would be lower if they included the effects of sales charges, operating expenses of a mutual fund, or taxes. Returns for the Lipper Averages reflect the deduction of operating expenses, but not sales charges or taxes.
Presentation of Fund Holdings
| | | | |
|
Five Largest Holdings expressed as a
percentage of net assets as of 3/31/19 (%) | |
| Alphabet, Inc. (Class C Stock),InteractiveMedia&Services | | | 2.6 | |
| Microsoft Corp.,Software | | | 2.4 | |
| Verint Systems, Inc.,Software | | | 1.9 | |
| Mondelez International, Inc. (Class A Stock),FoodProducts | | | 1.9 | |
| Union Pacific Corp.,Road& Rail | | | 1.8 | |
Holdings reflect only long-term investments and are subject to change.
| | | | |
|
Five Largest Industries expressed as a
percentage of net assets as of 3/31/19 (%) | |
| Software | | | 8.7 | |
| Hotels, Restaurants, & Leisure | | | 6.2 | |
| Oil, Gas, & Consumable Fuels | | | 6.0 | |
| Pharmaceuticals | | | 5.8 | |
| Capital Markets | | | 4.6 | |
Industry weightings reflect only long-term investments and are subject to change.
| | |
| 8 | | Visit our website at pgiminvestments.com |
Fees and Expenses(unaudited)
As a shareholder of the Fund, you incur two types of costs: (1) transaction costs, including sales charges (loads) on purchase payments and redemptions, as applicable, and (2) ongoing costs, including management fees, distribution and/or service (12b-1) fees, and other Fund expenses, as applicable. This example is intended to help you understand your ongoing costs (in dollars) of investing in the Fund and to compare these costs with the ongoing costs of investing in other mutual funds.
The example is based on an investment of $1,000 held through the six-month period ended March 31, 2019. The example is for illustrative purposes only; you should consult the Prospectus for information on initial and subsequent minimum investment requirements.
Actual Expenses
The first line for each share class in the table on the following page provides information about actual account values and actual expenses. You may use the information on this line, together with the amount you invested, to estimate the expenses that you paid over the period. Simply divide your account value by $1,000 (for example, an $8,600 account value ÷ $1,000 = 8.6), then multiply the result by the number on the first line under the heading “Expenses Paid During the Six-Month Period” to estimate the expenses you paid on your account during this period.
Hypothetical Example for Comparison Purposes
The second line for each share class in the table on the following page provides information about hypothetical account values and hypothetical expenses based on the Fund’s actual expense ratio and an assumed rate of return of 5% per year before expenses, which is not the Fund’s actual return. The hypothetical account values and expenses may not be used to estimate the actual ending account balance or expenses you paid for the period. You may use this information to compare the ongoing costs of investing in the Fund and other funds. To do so, compare this 5% hypothetical example with the 5% hypothetical examples that appear in the shareholder reports of the other funds.
The Fund’s transfer agent may charge additional fees to holders of certain accounts that are not included in the expenses shown in the table on the following page. These fees apply to individual retirement accounts (IRAs) and Section 403(b) accounts. As of the close of the six-month period covered by the table, IRA fees included an annual maintenance fee of $15 per account (subject to a maximum annual maintenance fee of $25 for all accounts held by the same shareholder). Section 403(b) accounts are charged an annual $25 fiduciary maintenance fee. Some of the fees may vary in amount, or may be waived, based on your total account balance or the number of PGIM funds, including the Fund, that you own. You should consider the additional fees that were charged to your Fund account over the six-month period when you estimate the total ongoing expenses paid over the period
| | | | |
| PGIM Jennison Equity Opportunity Fund | | | 9 | |
Fees and Expenses(continued)
and the impact of these fees on your ending account value, as these additional expenses are not reflected in the information provided in the expense table. Additional fees have the effect of reducing investment returns.
Please note that the expenses shown in the table are meant to highlight your ongoing costs only and do not reflect any transactional costs such as sales charges (loads). Therefore, the second line for each share class in the table is useful in comparing ongoing costs only and will not help you determine the relative total costs of owning different funds. In addition, if these transactional costs were included, your costs would have been higher.
| | | | | | | | | | | | | | | | | | |
| | | | |
PGIM
Jennison Equity
Opportunity Fund | | Beginning Account
Value
October 1, 2018 | | | Ending Account
Value
March 31, 2019 | | | Annualized
Expense Ratio
Based on the
Six-Month Period | | | Expenses Paid
During the
Six-Month Period* | |
| Class A | | Actual | | $ | 1,000.00 | | | $ | 911.90 | | | | 1.10 | % | | $ | 5.24 | |
| | Hypothetical | | $ | 1,000.00 | | | $ | 1,019.45 | | | | 1.10 | % | | $ | 5.54 | |
| Class B | | Actual | | $ | 1,000.00 | | | $ | 907.70 | | | | 2.03 | % | | $ | 9.66 | |
| | Hypothetical | | $ | 1,000.00 | | | $ | 1,014.81 | | | | 2.03 | % | | $ | 10.20 | |
| Class C | | Actual | | $ | 1,000.00 | | | $ | 908.40 | | | | 1.83 | % | | $ | 8.71 | |
| | Hypothetical | | $ | 1,000.00 | | | $ | 1,015.81 | | | | 1.83 | % | | $ | 9.20 | |
| Class R | | Actual | | $ | 1,000.00 | | | $ | 909.50 | | | | 1.53 | % | | $ | 7.28 | |
| | Hypothetical | | $ | 1,000.00 | | | $ | 1,017.30 | | | | 1.53 | % | | $ | 7.70 | |
| Class Z | | Actual | | $ | 1,000.00 | | | $ | 913.00 | | | | 0.78 | % | | $ | 3.72 | |
| | Hypothetical | | $ | 1,000.00 | | | $ | 1,021.04 | | | | 0.78 | % | | $ | 3.93 | |
| Class R6** | | Actual | | $ | 1,000.00 | | | $ | 913.50 | | | | 0.74 | % | | $ | 3.53 | |
| | | Hypothetical | | $ | 1,000.00 | | | $ | 1,021.24 | | | | 0.74 | % | | $ | 3.73 | |
* Fund expenses (net of fee waivers or subsidies, if any) for each share class are equal to the annualized expense ratio for each share class (provided in the table), multiplied by the average account value over the period, multiplied by the 182 days in the six-month period ended March 31, 2019, and divided by the 365 days in the Fund’s fiscal year ending September 30, 2019 (to reflect the six-month period). Expenses presented in the table include the expenses of any underlying portfolios in which the Fund may invest.
**Formerly known as Class Q shares.
| | |
| 10 | | Visit our website at pgiminvestments.com |
Schedule of Investments (unaudited)
as of March 31, 2019
| | | | | | | | |
| Description | | Shares | | | Value | |
LONG-TERM INVESTMENTS 96.2% | | | | | | | | |
| | |
COMMON STOCKS | | | | | | | | |
| | |
Aerospace & Defense 3.8% | | | | | | | | |
Airbus SE (France) | | | 26,453 | | | $ | 3,509,171 | |
Boeing Co. (The) | | | 11,261 | | | | 4,295,170 | |
United Technologies Corp. | | | 44,039 | | | | 5,676,187 | |
| | | | | | | | |
| | | | | | | 13,480,528 | |
| | |
Airlines 1.4% | | | | | | | | |
Delta Air Lines, Inc. | | | 98,331 | | | | 5,078,796 | |
| | |
Banks 4.4% | | | | | | | | |
Citigroup, Inc. | | | 100,982 | | | | 6,283,100 | |
Pinnacle Financial Partners, Inc. | | | 78,327 | | | | 4,284,487 | |
Wells Fargo & Co. | | | 107,645 | | | | 5,201,406 | |
| | | | | | | | |
| | | | | | | 15,768,993 | |
| | |
Biotechnology 4.1% | | | | | | | | |
Alexion Pharmaceuticals, Inc.* | | | 45,395 | | | | 6,136,496 | |
BioMarin Pharmaceutical, Inc.* | | | 52,131 | | | | 4,630,797 | |
Celgene Corp.* | | | 40,671 | | | | 3,836,902 | |
| | | | | | | | |
| | | | | | | 14,604,195 | |
| | |
Capital Markets 4.6% | | | | | | | | |
Goldman Sachs Group, Inc. (The) | | | 31,762 | | | | 6,097,987 | |
Moelis & Co. (Class A Stock) | | | 128,448 | | | | 5,344,721 | |
Morgan Stanley | | | 111,219 | | | | 4,693,442 | |
| | | | | | | | |
| | | | | | | 16,136,150 | |
| | |
Chemicals 1.4% | | | | | | | | |
DowDuPont, Inc. | | | 94,772 | | | | 5,052,295 | |
| | |
Communications Equipment 1.0% | | | | | | | | |
Nokia OYJ (Finland), ADR(a) | | | 595,089 | | | | 3,403,909 | |
| | |
Construction & Engineering 0.4% | | | | | | | | |
Arcosa, Inc. | | | 47,283 | | | | 1,444,496 | |
| | |
Construction Materials 1.2% | | | | | | | | |
Summit Materials, Inc. (Class A Stock)* | | | 271,735 | | | | 4,312,435 | |
See Notes to Financial Statements.
| | | | |
| PGIM Jennison Equity Opportunity Fund | | | 11 | |
Schedule of Investments(unaudited) (continued)
as of March 31, 2019
| | | | | | | | |
| Description | | Shares | | | Value | |
COMMON STOCKS (Continued) | | | | | | | | |
| | |
Containers & Packaging 1.4% | | | | | | | | |
Graphic Packaging Holding Co. | | | 392,934 | | | $ | 4,962,756 | |
| | |
Diversified Consumer Services 2.5% | | | | | | | | |
Houghton Mifflin Harcourt Co.* | | | 468,398 | | | | 3,405,254 | |
Laureate Education, Inc. (Class A Stock)* | | | 360,600 | | | | 5,398,182 | |
| | | | | | | | |
| | | | | | | 8,803,436 | |
| | |
Diversified Telecommunication Services 1.0% | | | | | | | | |
Inmarsat PLC (United Kingdom) | | | 463,634 | | | | 3,364,722 | |
| | |
Electrical Equipment 2.1% | | | | | | | | |
Emerson Electric Co. | | | 77,844 | | | | 5,329,979 | |
GrafTech International Ltd. | | | 162,456 | | | | 2,077,812 | |
| | | | | | | | |
| | | | | | | 7,407,791 | |
| | |
Electronic Equipment, Instruments & Components 1.0% | | | | | | | | |
FLIR Systems, Inc. | | | 76,092 | | | | 3,620,457 | |
| | |
Energy Equipment & Services 1.2% | | | | | | | | |
TechnipFMC PLC (United Kingdom) | | | 183,468 | | | | 4,315,167 | |
| | |
Entertainment 2.3% | | | | | | | | |
Spotify Technology SA*(a) | | | 25,720 | | | | 3,569,936 | |
Viacom, Inc. (Class B Stock) | | | 166,388 | | | | 4,670,511 | |
| | | | | | | | |
| | | | | | | 8,240,447 | |
| | |
Equity Real Estate Investment Trusts (REITs) 1.3% | | | | | | | | |
CoreCivic, Inc. | | | 240,795 | | | | 4,683,463 | |
| | |
Food & Staples Retailing 1.8% | | | | | | | | |
Walmart, Inc. | | | 63,545 | | | | 6,197,544 | |
| | |
Food Products 1.9% | | | | | | | | |
Mondelez International, Inc. (Class A Stock) | | | 138,070 | | | | 6,892,454 | |
| | |
Health Care Providers & Services 2.1% | | | | | | | | |
Cigna Corp. | | | 29,211 | | | | 4,697,713 | |
UnitedHealth Group, Inc. | | | 10,453 | | | | 2,584,609 | |
| | | | | | | | |
| | | | | | | 7,282,322 | |
See Notes to Financial Statements.
| | | | | | | | |
| Description | | Shares | | | Value | |
COMMON STOCKS (Continued) | | | | | | | | |
| | |
Hotels, Restaurants & Leisure 6.2% | | | | | | | | |
Extended Stay America, Inc., UTS | | | 256,694 | | | $ | 4,607,657 | |
International Game Technology PLC | | | 378,373 | | | | 4,915,065 | |
MGM Resorts International | | | 193,580 | | | | 4,967,263 | |
Playa Hotels & Resorts NV* | | | 490,360 | | | | 3,741,447 | |
SeaWorld Entertainment, Inc.*(a) | | | 150,109 | | | | 3,866,808 | |
| | | | | | | | |
| | | | | | | 22,098,240 | |
| | |
Insurance 3.5% | | | | | | | | |
Brighthouse Financial, Inc.* | | | 72,885 | | | | 2,644,997 | |
Chubb Ltd. | | | 32,209 | | | | 4,511,837 | |
MetLife, Inc. | | | 125,792 | | | | 5,354,965 | |
| | | | | | | | |
| | | | | | | 12,511,799 | |
| | |
Interactive Media & Services 2.6% | | | | | | | | |
Alphabet, Inc. (Class C Stock)* | | | 7,717 | | | | 9,054,433 | |
| | |
Internet & Direct Marketing Retail 0.8% | | | | | | | | |
Qurate Retail, Inc.* | | | 181,761 | | | | 2,904,541 | |
| | |
IT Services 1.1% | | | | | | | | |
Verra Mobility Corp.* | | | 335,925 | | | | 3,997,508 | |
| | |
Machinery 1.6% | | | | | | | | |
Trinity Industries, Inc. | | | 253,151 | | | | 5,500,971 | |
| | |
Media 3.1% | | | | | | | | |
Comcast Corp. (Class A Stock) | | | 127,085 | | | | 5,080,858 | |
Liberty Global PLC (United Kingdom) (Class C Stock)* | | | 241,824 | | | | 5,854,559 | |
| | | | | | | | |
| | | | | | | 10,935,417 | |
| | |
Metals & Mining 2.5% | | | | | | | | |
Lundin Mining Corp. (Chile) | | | 801,896 | | | | 3,720,399 | |
Teck Resources Ltd. (Canada) (Class B Stock) | | | 223,059 | | | | 5,170,508 | |
| | | | | | | | |
| | | | | | | 8,890,907 | |
| | |
Oil, Gas & Consumable Fuels 6.0% | | | | | | | | |
Anadarko Petroleum Corp. | | | 80,586 | | | | 3,665,051 | |
Concho Resources, Inc. | | | 55,242 | | | | 6,129,653 | |
Noble Energy, Inc. | | | 209,546 | | | | 5,182,073 | |
See Notes to Financial Statements.
| | | | |
| PGIM Jennison Equity Opportunity Fund | | | 13 | |
Schedule of Investments(unaudited) (continued)
as of March 31, 2019
| | | | | | | | |
| Description | | Shares | | | Value | |
COMMON STOCKS (Continued) | | | | | | | | |
| | |
Oil, Gas & Consumable Fuels (cont’d.) | | | | | | | | |
Royal Dutch Shell PLC (Netherlands) (Class A Stock), ADR | | | 45,775 | | | $ | 2,865,057 | |
Valero Energy Corp. | | | 41,599 | | | | 3,528,843 | |
| | | | | | | | |
| | | | | | | 21,370,677 | |
| | |
Pharmaceuticals 5.8% | | | | | | | | |
Allergan PLC | | | 40,464 | | | | 5,924,334 | |
AstraZeneca PLC (United Kingdom), ADR | | | 127,001 | | | | 5,134,650 | |
Bristol-Myers Squibb Co. | | | 96,567 | | | | 4,607,212 | |
Merck & Co., Inc. | | | 58,250 | | | | 4,844,653 | |
| | | | | | | | |
| | | | | | | 20,510,849 | |
| | |
Professional Services 1.5% | | | | | | | | |
Nielsen Holdings PLC | | | 229,986 | | | | 5,443,769 | |
| | |
Road & Rail 1.8% | | | | | | | | |
Union Pacific Corp. | | | 38,991 | | | | 6,519,295 | |
| | |
Semiconductors & Semiconductor Equipment 4.4% | | | | | | | | |
Lam Research Corp. | | | 14,699 | | | | 2,631,268 | |
NVIDIA Corp. | | | 21,611 | | | | 3,880,471 | |
QUALCOMM, Inc. | | | 110,823 | | | | 6,320,236 | |
Silicon Laboratories, Inc.* | | | 33,619 | | | | 2,718,432 | |
| | | | | | | | |
| | | | | | | 15,550,407 | |
| | |
Software 8.7% | | | | | | | | |
BlackBerry Ltd. (Canada)*(a) | | | 493,378 | | | | 4,978,184 | |
FireEye, Inc.*(a) | | | 158,903 | | | | 2,667,981 | |
Microsoft Corp. | | | 71,044 | | | | 8,378,929 | |
PTC, Inc.* | | | 24,560 | | | | 2,263,941 | |
Teradata Corp.*(a) | | | 130,530 | | | | 5,697,635 | |
Verint Systems, Inc.* | | | 115,646 | | | | 6,922,570 | |
| | | | | | | | |
| | | | | | | 30,909,240 | |
| | |
Technology Hardware, Storage & Peripherals 1.9% | | | | | | | | |
Apple, Inc. | | | 16,736 | | | | 3,179,003 | |
Pure Storage, Inc. (Class A Stock)* | | | 156,691 | | | | 3,414,297 | |
| | | | | | | | |
| | | | | | | 6,593,300 | |
| | |
Textiles, Apparel & Luxury Goods 1.3% | | | | | | | | |
Tapestry, Inc. | | | 146,513 | | | | 4,760,207 | |
See Notes to Financial Statements.
| | | | | | | | |
| Description | | Shares | | | Value | |
COMMON STOCKS (Continued) | | | | | | | | |
| | |
Tobacco 1.5% | | | | | | | | |
Philip Morris International, Inc. | | | 59,375 | | | $ | 5,248,156 | |
| | |
Trading Companies & Distributors 1.0% | | | | | | | | |
Beacon Roofing Supply, Inc.* | | | 113,267 | | | | 3,642,667 | |
| | | | | | | | |
TOTAL LONG-TERM INVESTMENTS
(cost $321,598,173) | | | | | | | 341,494,739 | |
| | | | | | | | |
| | |
SHORT-TERM INVESTMENTS 8.7% | | | | | | | | |
| | |
AFFILIATED MUTUAL FUNDS | | | | | | | | |
PGIM Core Ultra Short Bond Fund(w) | | | 17,276,895 | | | | 17,276,895 | |
PGIM Institutional Money Market Fund
(cost $13,487,277; includes $13,450,094 of cash collateral for securities on loan)(b)(w) | | | 13,487,041 | | | | 13,489,738 | |
| | | | | | | | |
TOTAL SHORT-TERM INVESTMENTS
(cost $30,764,172) | | | | | | | 30,766,633 | |
| | | | | | | | |
TOTAL INVESTMENTS 104.9%
(cost $352,362,345) | | | | | | | 372,261,372 | |
Liabilities in excess of other assets (4.9)% | | | | | | | (17,545,263 | ) |
| | | | | | | | |
NET ASSETS 100.0% | | | | | | $ | 354,716,109 | |
| | | | | | | | |
Below is a list of the abbreviation(s) used in the semiannual report:
ADR—American Depositary Receipt
LIBOR—London Interbank Offered Rate
REIT(s)—Real Estate Investment Trust(s)
UTS—Unit Trust Security
| * | Non-income producing security. |
| (a) | All or a portion of security is on loan. The aggregate market value of such securities, including those sold and pending settlement, is $13,365,124; cash collateral of $13,450,094 (included in liabilities) was received with which the Series purchased highly liquid short-term investments. |
| (b) | Represents security purchased with cash collateral received for securities on loan and includes dividend reinvestment. |
| (w) | PGIM Investments LLC, the manager of the Series, also serves as manager of the PGIM Core Ultra Short Bond Fund and PGIM Institutional Money Market Fund. |
Fair Value Measurements:
Various inputs are used in determining the value of the Series’ investments. These inputs are summarized in the three broad levels listed below.
Level 1—unadjusted quoted prices generally in active markets for identical securities.
See Notes to Financial Statements.
| | | | |
| PGIM Jennison Equity Opportunity Fund | | | 15 | |
Schedule of Investments(unaudited) (continued)
as of March 31, 2019
Level 2—quoted prices for similar securities, interest rates and yield curves, prepayment speeds, foreign currency exchange rates and other observable inputs.
Level 3—unobservable inputs for securities valued in accordance with Board approved fair valuation procedures.
The following is a summary of the inputs used as of March 31, 2019 in valuing such portfolio securities:
| | | | | | | | | | | | |
| | | Level 1 | | | Level 2 | | | Level 3 | |
Investments in Securities | | | | | | | | | | | | |
Common Stocks | | | | | | | | | | | | |
Aerospace & Defense | | $ | 9,971,357 | | | $ | 3,509,171 | | | $ | — | |
Airlines | | | 5,078,796 | | | | — | | | | — | |
Banks | | | 15,768,993 | | | | — | | | | — | |
Biotechnology | | | 14,604,195 | | | | — | | | | — | |
Capital Markets | | | 16,136,150 | | | | — | | | | — | |
Chemicals | | | 5,052,295 | | | | — | | | | — | |
Communications Equipment | | | 3,403,909 | | | | — | | | | — | |
Construction & Engineering | | | 1,444,496 | | | | — | | | | — | |
Construction Materials | | | 4,312,435 | | | | — | | | | — | |
Containers & Packaging | | | 4,962,756 | | | | — | | | | — | |
Diversified Consumer Services | | | 8,803,436 | | | | — | | | | — | |
Diversified Telecommunication Services | | | — | | | | 3,364,722 | | | | — | |
Electrical Equipment | | | 7,407,791 | | | | — | | | | — | |
Electronic Equipment, Instruments & Components | | | 3,620,457 | | | | — | | | | — | |
Energy Equipment & Services | | | 4,315,167 | | | | — | | | | — | |
Entertainment | | | 8,240,447 | | | | — | | | | — | |
Equity Real Estate Investment Trusts (REITs) | | | 4,683,463 | | | | — | | | | — | |
Food & Staples Retailing | | | 6,197,544 | | | | — | | | | — | |
Food Products | | | 6,892,454 | | | | — | | | | — | |
Health Care Providers & Services | | | 7,282,322 | | | | — | | | | — | |
Hotels, Restaurants & Leisure | | | 22,098,240 | | | | — | | | | — | |
Insurance | | | 12,511,799 | | | | — | | | | — | |
Interactive Media & Services | | | 9,054,433 | | | | — | | | | — | |
Internet & Direct Marketing Retail | | | 2,904,541 | | | | — | | | | — | |
IT Services | | | 3,997,508 | | | | — | | | | — | |
Machinery | | | 5,500,971 | | | | — | | | | — | |
Media | | | 10,935,417 | | | | — | | | | — | |
Metals & Mining | | | 8,890,907 | | | | — | | | | — | |
Oil, Gas & Consumable Fuels | | | 21,370,677 | | | | — | | | | — | |
Pharmaceuticals | | | 20,510,849 | | | | — | | | | — | |
Professional Services | | | 5,443,769 | | | | — | | | | — | |
Road & Rail | | | 6,519,295 | | | | — | | | | — | |
Semiconductors & Semiconductor Equipment | | | 15,550,407 | | | | — | | | | — | |
Software | | | 30,909,240 | | | | — | | | | — | |
Technology Hardware, Storage & Peripherals | | | 6,593,300 | | | | — | | | | — | |
Textiles, Apparel & Luxury Goods | | | 4,760,207 | | | | — | | | | — | |
Tobacco | | | 5,248,156 | | | | — | | | | — | |
Trading Companies & Distributors | | | 3,642,667 | | | | — | | | | — | |
Affiliated Mutual Funds | | | 30,766,633 | | | | — | | | | — | |
| | | | | | | | | | | | |
Total | | $ | 365,387,479 | | | $ | 6,873,893 | | | $ | — | |
| | | | | | | | | | | | |
See Notes to Financial Statements.
Industry Classification:
The industry classification of investments and liabilities in excess of other assets shown as a percentage of net assets as of March 31, 2019 were as follows:
| | | | |
Software | | | 8.7 | % |
Affiliated Mutual Funds (3.8% represents investments purchased with collateral from securities on loan) | | | 8.7 | |
Hotels, Restaurants & Leisure | | | 6.2 | |
Oil, Gas & Consumable Fuels | | | 6.0 | |
Pharmaceuticals | | | 5.8 | |
Capital Markets | | | 4.6 | |
Banks | | | 4.4 | |
Semiconductors & Semiconductor Equipment | | | 4.4 | |
Biotechnology | | | 4.1 | |
Aerospace & Defense | | | 3.8 | |
Insurance | | | 3.5 | |
Media | | | 3.1 | |
Interactive Media & Services | | | 2.6 | |
Metals & Mining | | | 2.5 | |
Diversified Consumer Services | | | 2.5 | |
Entertainment | | | 2.3 | |
Electrical Equipment | | | 2.1 | |
Health Care Providers & Services | | | 2.1 | |
Food Products | | | 1.9 | |
Technology Hardware, Storage & Peripherals | | | 1.9 | |
Road & Rail | | | 1.8 | |
Food & Staples Retailing | | | 1.8 | |
Machinery | | | 1.6 | % |
Professional Services | | | 1.5 | |
Tobacco | | | 1.5 | |
Airlines | | | 1.4 | |
Chemicals | | | 1.4 | |
Containers & Packaging | | | 1.4 | |
Textiles, Apparel & Luxury Goods | | | 1.3 | |
Equity Real Estate Investment Trusts (REITs) | | | 1.3 | |
Energy Equipment & Services | | | 1.2 | |
Construction Materials | | | 1.2 | |
IT Services | | | 1.1 | |
Trading Companies & Distributors | | | 1.0 | |
Electronic Equipment, Instruments & Components | | | 1.0 | |
Communications Equipment | | | 1.0 | |
Diversified Telecommunication Services | | | 1.0 | |
Internet & Direct Marketing Retail | | | 0.8 | |
Construction & Engineering | | | 0.4 | |
| | | | |
| | | 104.9 | |
Liabilities in excess of other assets | | | (4.9 | ) |
| | | | |
| | | 100.0 | % |
| | | | |
Financial Instruments/Transactions—Summary of Offsetting and Netting Arrangements:
The Series entered into financial instruments/transactions during the reporting period that are either offset in accordance with current requirements or are subject to enforceable master netting arrangements or similar agreements that permit offsetting. The information about offsetting and related netting arrangements for financial instruments/transactions, where the legal right toset-off exists, is presented in the summary below.
Offsetting of financial instrument/transaction assets and liabilities:
| | | | | | | | | | | | |
Description | | Gross
Market
Value of
Recognized
Assets/(Liabilities) | | | Collateral
Pledged/
(Received)(1) | | | Net Amount | |
Securities on Loan | | $ | 13,365,124 | | | $ | (13,365,124 | ) | | $ | — | |
| | | | | | | | | | | | |
| (1) | Collateral amount disclosed by the Series is limited to the market value of financial instruments/transactions. |
See Notes to Financial Statements.
| | | | |
| PGIM Jennison Equity Opportunity Fund | | | 17 | |
Statement of Assets & Liabilities(unaudited)
as of March 31, 2019
| | | | |
Assets | | | | |
Investments at value, including securities on loan of $13,365,124: | | | | |
Unaffiliated investments (cost $321,598,173) | | $ | 341,494,739 | |
Affiliated investments (cost $30,764,172) | | | 30,766,633 | |
Cash | | | 7,087 | |
Dividends receivable | | | 558,794 | |
Tax reclaim receivable | | | 207,256 | |
Receivable for Series shares sold | | | 178,090 | |
Prepaid expenses | | | 1,499 | |
| | | | |
Total Assets | | | 373,214,098 | |
| | | | |
| |
Liabilities | | | | |
Payable to broker for collateral for securities on loan | | | 13,450,094 | |
Payable for investments purchased | | | 4,188,423 | |
Payable for Series shares reacquired | | | 425,644 | |
Management fee payable | | | 178,085 | |
Accrued expenses and other liabilities | | | 147,172 | |
Distribution fee payable | | | 73,685 | |
Affiliated transfer agent fee payable | | | 34,886 | |
| | | | |
Total Liabilities | | | 18,497,989 | |
| | | | |
| |
Net Assets | | $ | 354,716,109 | |
| | | | |
| | | | | |
Net assets were comprised of: | | | | |
Common stock, at par | | $ | 22,497 | |
Paid-in capital in excess of par | | | 313,791,227 | |
Total distributable earnings (loss) | | | 40,902,385 | |
| | | | |
Net assets, March 31, 2019 | | $ | 354,716,109 | |
| | | | |
See Notes to Financial Statements.
| | | | |
Class A | | | | |
Net asset value and redemption price per share,
($187,525,688 ÷ 11,827,629 shares of common stock issued and outstanding) | | $ | 15.85 | |
Maximum sales charge (5.50% of offering price) | | | 0.92 | |
| | | | |
Maximum offering price to public | | $ | 16.77 | |
| | | | |
| |
Class B | | | | |
Net asset value, offering price and redemption price per share, | | | | |
($3,592,222 ÷ 291,452 shares of common stock issued and outstanding) | | $ | 12.33 | |
| | | | |
| |
Class C | | | | |
Net asset value, offering price and redemption price per share, | | | | |
($24,864,633 ÷ 2,010,490 shares of common stock issued and outstanding) | | $ | 12.37 | |
| | | | |
| |
Class R | | | | |
Net asset value, offering price and redemption price per share, | | | | |
($2,312,530 ÷ 171,006 shares of common stock issued and outstanding) | | $ | 13.52 | |
| | | | |
| |
Class Z | | | | |
Net asset value, offering price and redemption price per share, | | | | |
($118,803,383 ÷ 7,138,736 shares of common stock issued and outstanding) | | $ | 16.64 | |
| | | | |
| |
Class R6 | | | | |
Net asset value, offering price and redemption price per share, | | | | |
($17,617,653 ÷ 1,057,994 shares of common stock issued and outstanding) | | $ | 16.65 | |
| | | | |
See Notes to Financial Statements.
| | | | |
| PGIM Jennison Equity Opportunity Fund | | | 19 | |
Statement of Operations(unaudited)
Six Months Ended March 31, 2019
| | | | |
Net Investment Income (Loss) | | | | |
Income | | | | |
Unaffiliated dividend income (net of $8,546 foreign withholding tax) | | $ | 3,717,398 | |
Affiliated dividend income | | | 64,475 | |
Income from securities lending, net (including affiliated income of $11,102) | | | 36,165 | |
| | | | |
Total income | | | 3,818,038 | |
| | | | |
| |
Expenses | | | | |
Management fee | | | 1,086,495 | |
Distribution fee(a) | | | 455,190 | |
Transfer agent’s fees and expenses (including affiliated expense of $83,140)(a) | | | 228,536 | |
Registration fees(a) | | | 44,806 | |
Custodian and accounting fees | | | 41,637 | |
Shareholders’ reports | | | 20,758 | |
Audit fee | | | 11,992 | |
Directors’ fees | | | 9,943 | |
Legal fees and expenses | | | 9,318 | |
Miscellaneous | | | 10,161 | |
| | | | |
Total expenses | | | 1,918,836 | |
Less: Fee waiver and/or expense reimbursement(a) | | | (12,344 | ) |
Distribution fee waiver(a) | | | (3,423 | ) |
| | | | |
Net expenses | | | 1,903,069 | |
| | | | |
Net investment income (loss) | | | 1,914,969 | |
| | | | |
| |
Realized And Unrealized Gain (Loss) On Investment And Foreign Currency Transactions | | | | |
Net realized gain (loss) on: | | | | |
Investment transactions (including affiliated of $(2,040)) | | | 21,929,552 | |
Foreign currency transactions | | | (11,618 | ) |
| | | | |
| | | 21,917,934 | |
| | | | |
Net change in unrealized appreciation (depreciation) on: | | | | |
Investments (including affiliated of $2,461) | | | (62,384,353 | ) |
Foreign currencies | | | (4,831 | ) |
| | | | |
| | | (62,389,184 | ) |
| | | | |
Net gain (loss) on investment and foreign currency transactions | | | (40,471,250 | ) |
| | | | |
Net Increase (Decrease) In Net Assets Resulting From Operations | | $ | (38,556,281 | ) |
| | | | |
| (a) | Class specific expenses and waivers were as follows: |
| | | | | | | | | | | | | | | | | | | | | | | | |
| | | Class A | | | Class B | | | Class C | | | Class R | | | Class Z | | | Class R6 | |
Distribution fee | | | 290,951 | | | | 20,071 | | | | 133,901 | | | | 10,267 | | | | — | | | | — | |
Transfer agent’s fees and expenses | | | 130,326 | | | | 8,304 | | | | 16,818 | | | | 2,622 | | | | 70,370 | | | | 96 | |
Registration fees | | | 8,070 | | | | 7,080 | | | | 7,083 | | | | 7,128 | | | | 8,317 | | | | 7,128 | |
Fee waiver and/or expense reimbursement | | | — | | | | (7,792 | ) | | | — | | | | (4,552 | ) | | | — | | | | — | |
Distribution fee waiver | | | — | | | | — | | | | — | | | | (3,423 | ) | | | — | | | | — | |
See Notes to Financial Statements.
Statements of Changes in Net Assets (unaudited)
| | | | | | | | |
| | |
| | | Six Months Ended March 31, 2019 | | | Year Ended September 30, 2018 | |
Increase (Decrease) in Net Assets | | | | | | | | |
Operations | | | | | | | | |
Net investment income (loss) | | $ | 1,914,969 | | | $ | 3,162,409 | |
Net realized gain (loss) on investment and foreign currency transactions | | | 21,917,934 | | | | 59,356,391 | |
Net change in unrealized appreciation (depreciation) on investments and foreign currencies | | | (62,389,184 | ) | | | (8,587,554 | ) |
| | | | | | | | |
Net increase (decrease) in net assets resulting from operations | | | (38,556,281 | ) | | | 53,931,246 | |
| | | | | | | | |
| | |
Dividends and Distributions | | | | | | | | |
Distributions from distributable earnings* | | | | | | | | |
Class A | | | (28,829,973 | ) | | | — | |
Class B | | | (720,916 | ) | | | — | |
Class C | | | (4,758,944 | ) | | | — | |
Class R | | | (496,144 | ) | | | — | |
Class Z | | | (17,077,466 | ) | | | — | |
Class R6 | | | (2,483,158 | ) | | | — | |
| | | | | | | | |
| | | (54,366,601 | ) | | | — | |
| | | | | | | | |
Dividends from net investment income* | | | | | | | | |
Class A | | | | | | | (2,088,750 | ) |
Class B | | | | | | | (25,855 | ) |
Class C | | | | | | | (172,299 | ) |
Class R | | | | | | | (36,612 | ) |
Class Z | | | | | | | (1,460,530 | ) |
Class R6 | | | | | | | (219,570 | ) |
| | | | | | | | |
| | | * | | | | (4,003,616 | ) |
| | | | | | | | |
Distributions from net realized gains* | | | | | | | | |
Class A | | | | | | | (28,302,850 | ) |
Class B | | | | | | | (865,699 | ) |
Class C | | | | | | | (5,171,433 | ) |
Class R | | | | | | | (614,183 | ) |
Class Z | | | | | | | (15,099,851 | ) |
Class R6 | | | | | | | (2,089,917 | ) |
| | | | | | | | |
| | | * | | | | (52,143,933 | ) |
| | | | | | | | |
See Notes to Financial Statements.
| | | | |
| PGIM Jennison Equity Opportunity Fund | | | 21 | |
Statements of Changes in Net Assets (unaudited)(continued)
| | | | | | | | |
| | |
| | | Six Months Ended March 31, 2019 | | | Year Ended September 30, 2018 | |
Series share transactions (Net of share conversions) | | | | | | | | |
Net proceeds from shares sold | | $ | 21,683,251 | | | $ | 36,627,233 | |
Net asset value of shares issued in reinvestment of dividends and distributions | | | 53,306,093 | | | | 54,563,324 | |
Cost of shares reacquired | | | (54,046,850 | ) | | | (80,122,188 | ) |
| | | | | | | | |
Net increase (decrease) in net assets from Series share transactions | | | 20,942,494 | | | | 11,068,369 | |
| | | | | | | | |
Total increase (decrease) | | | (71,980,388 | ) | | | 8,852,066 | |
| | |
Net Assets: | | | | | | | | |
Beginning of period | | | 426,696,497 | | | | 417,844,431 | |
| | | | | | | | |
End of period(a) | | $ | 354,716,109 | | | $ | 426,696,497 | |
| | | | | | | | |
(a) Includes undistributed/(distributions in excess of) net investment income of: | | $ | * | | | $ | 920,229 | |
| | | | | | | | |
| * | For the period ended March 31, 2019, the disclosures have been revised to reflect revisions to RegulationS-X adopted by the SEC in 2018 (refer to Note 9). |
See Notes to Financial Statements.
Notes to Financial Statements(unaudited)
The Prudential Investment Portfolios, Inc. (the “Company”) is registered under the Investment Company Act of 1940, as amended (“1940 Act”), as anopen-end management investment company. The Company consists of six series: PGIM Balanced Fund, PGIM Jennison Equity Opportunity Fund and PGIM Jennison Growth Fund, each of which are diversified funds and PGIM Growth Allocation Fund, PGIM Moderate Allocation Fund and PGIM Conservative Allocation Fund, each of which arenon-diversified funds for purposes of the 1940 Act and may invest a greater percentage of their assets in the securities of a single company or other issuer than a diversified fund. Investing in anon-diversified fund involves greater risk than investing in a diversified fund because a loss resulting from the decline in value of any one security may represent a greater portion of the total assets of anon-diversified fund. These financial statements relate only to the PGIM Jennison Equity Opportunity Fund (the “Series”).
The investment objective of the Series is to achieve long-term growth of capital.
1. Accounting Policies
The Series follows the investment company accounting and reporting guidance of the Financial Accounting Standards Board (“FASB”) Accounting Standard Codification (“ASC”) Topic 946 Financial Services—Investment Companies. The following accounting policies conform to U.S. generally accepted accounting principles. The Series consistently follows such policies in the preparation of its financial statements.
Securities Valuation:The Series holds securities and other assets and liabilities that are fair valued at the close of each day (generally, 4:00 PM Eastern time) the New York Stock Exchange (“NYSE”) is open for trading. Fair value is the price that would be received to sell an asset or paid to transfer a liability in an orderly transaction between market participants on the measurement date. The Company’s Board of Directors (the “Board”) has adopted valuation procedures for security valuation under which fair valuation responsibilities have been delegated to PGIM Investments LLC (“PGIM Investments” or the “Manager”). Pursuant to the Board’s delegation, the Manager has established a Valuation Committee responsible for supervising the fair valuation of portfolio securities and other assets and liabilities. The valuation procedures permit the Series to utilize independent pricing vendor services, quotations from market makers, and alternative valuation methods when market quotations are either not readily available or not deemed representative of fair value. A record of the Valuation Committee’s actions is subject to the Board’s review, approval, and ratification at its next regularly scheduled quarterly meeting.
For the fiscal reportingperiod-end, securities and other assets and liabilities were fair valued at the close of the last U.S. business day. Trading in certain foreign securities may occur when the NYSE is closed (including weekends and holidays). Because such foreign
| | | | |
| PGIM Jennison Equity Opportunity Fund | | | 23 | |
Notes to Financial Statements (unaudited) (continued)
securities trade in markets that are open on weekends and U.S. holidays, the values of some of the Series’ foreign investments may change on days when investors cannot purchase or redeem Series shares.
Various inputs determine how the Series’ investments are valued, all of which are categorized according to the three broad levels (Level 1, 2, or 3) detailed in the Schedule of Investments and referred to herein as the “fair value hierarchy” in accordance with FASB ASC Topic 820—Fair Value Measurements and Disclosures.
Common and preferred stocks, exchange-traded funds, and derivative instruments, such as futures or options, that are traded on a national securities exchange are valued at the last sale price as of the close of trading on the applicable exchange where the security principally trades. Securities traded via NASDAQ are valued at the NASDAQ official closing price. To the extent these securities are valued at the last sale price or NASDAQ official closing price, they are classified as Level 1 in the fair value hierarchy. In the event that no sale or official closing price on valuation date exists, these securities are generally valued at the mean between the last reported bid and ask prices, or at the last bid price in the absence of an ask price. These securities are classified as Level 2 in the fair value hierarchy.
Foreign equities traded on foreign securities exchanges are generally valued using pricing vendor services that provide model prices derived using adjustment factors based on information such as local closing price, relevant general and sector indices, currency fluctuations, depositary receipts, and futures, as applicable. Securities valued using such model prices are classified as Level 2 in the fair value hierarchy. The models generate an evaluated adjustment factor for each security, which is applied to the local closing price to adjust it for post closing market movements up to the time the Series is valued. Utilizing that evaluated adjustment factor, the vendor provides an evaluated price for each security. If the vendor does not provide an evaluated price, securities are valued in accordance with exchange-traded common and preferred stock valuation policies discussed above.
Investments inopen-end,non-exchange-traded mutual funds are valued at their net asset values as of the close of the NYSE on the date of valuation. These securities are classified as Level 1 in the fair value hierarchy since they may be purchased or sold at their net asset values on the date of valuation.
Securities and other assets that cannot be priced according to the methods described above are valued based on pricing methodologies approved by the Board. In the event that unobservable inputs are used when determining such valuations, the securities will be classified as Level 3 in the fair value hierarchy.
When determining the fair value of securities, some of the factors influencing the valuation include: the nature of any restrictions on disposition of the securities; assessment of the general liquidity of the securities; the issuer’s financial condition and the markets in which it does business; the cost of the investment; the size of the holding and the capitalization of the issuer; the prices of any recent transactions or bids/offers for such securities or any comparable securities; any available analyst media or other reports or information deemed reliable by the Manager regarding the issuer or the markets or industry in which it operates. Using fair value to price securities may result in a value that is different from a security’s most recent closing price and from the price used by other unaffiliated mutual funds to calculate their net asset values.
Illiquid Securities:Pursuant to Rule22e-4 under the 1940 Act, the Series has adopted a Board approved Liquidity Risk Management Program (“LRMP”) that requires, among other things, that the Series limit its illiquid investments that are assets to no more than 15% of net assets. Illiquid securities are those that, because of the absence of a readily available market or due to legal or contractual restrictions on resale, may not reasonably be expected to be sold or disposed of in current market conditions in seven calendar days or less without the sale or disposition significantly changing the market value of the investment. The Series may find it difficult to sell illiquid securities at the time considered most advantageous by its Subadviser and may incur transaction costs that would not be incurred in the sale of securities that were freely marketable.
Restricted Securities:Securities acquired in unregistered, private sales from the issuing company or from an affiliate of the issuer are considered restricted as to disposition under federal securities law (“restricted securities”). Such restricted securities are valued pursuant to the valuation procedures noted above. Restricted securities that would otherwise be considered illiquid investments pursuant to the Series’ LRMP because of legal restrictions on resale to the general public may be traded among qualified institutional buyers under Rule 144A of the Securities Act of 1933. Therefore, these Rule 144A securities, as well as commercial paper that is sold in private placements under Section 4(2) of the Securities Act of 1933, may be classified higher than “illiquid” under the LRMP (i.e. “moderately liquid” or “less liquid” investments). However, the liquidity of the Series’ investments in restricted securities could be impaired if trading does not develop or declines.
Foreign Currency Translation:The books and records of the Series are maintained in U.S. dollars. Foreign currency amounts are translated into U.S. dollars on the following basis:
(i) market value of investment securities, other assets and liabilities—at the current rates of exchange;
(ii) purchases and sales of investment securities, income and expenses—at the rates of exchange prevailing on the respective dates of such transactions.
Although the net assets of the Series are presented at the foreign exchange rates and market values at the close of the period, the Series does not generally isolate that portion of
| | | | |
| PGIM Jennison Equity Opportunity Fund | | | 25 | |
Notes to Financial Statements(unaudited) (continued)
the results of operations arising as a result of changes in the foreign exchange rates from the fluctuations arising from changes in the market prices of long-term portfolio securities held at the end of the period. Similarly, the Series does not isolate the effect of changes in foreign exchange rates from the fluctuations arising from changes in the market prices of long-term portfolio securities sold during the period. Accordingly, holding period realized foreign currency gains (losses) are included in the reported net realized gains (losses) on investment transactions.
Net realized gains (losses) on foreign currency transactions represent net foreign exchange gains (losses) from the disposition of holdings of foreign currencies, currency gains (losses) realized between the trade and settlement dates on securities transactions, and the difference between the amounts of interest, dividends and foreign withholding taxes recorded on the Series’ books and the U.S. dollar equivalent amounts actually received or paid. Net unrealized currency gains (losses) arise from valuing foreign currency denominated assets and liabilities (other than investments) at period end exchange rates.
Master Netting Arrangements:The Company, on behalf of the Series, is subject to various Master Agreements, or netting arrangements, with select counterparties. These are agreements which a Subadviser may have negotiated and entered into on behalf of the Series. A master netting arrangement between the Series and the counterparty permits the Series to offset amounts payable by the Series to the same counterparty against amounts to be received; and by the receipt of collateral from the counterparty by the Series to cover the Series’ exposure to the counterparty. However, there is no assurance that such mitigating factors are easily enforceable. In addition to master netting arrangements, the right toset-off exists when all the conditions are met such that each of the parties owes the other determinable amounts, the reporting party has the right toset-off the amount owed with the amount owed by the other party, the reporting party intends toset-off and the right ofset-off is enforceable by law. During the reporting period, there was no intention to settle on a net basis and all amounts are presented on a gross basis on the Statement of Assets and Liabilities.
Securities Lending:The Series lends its portfolio securities to banks and broker-dealers. The loans are secured by collateral at least equal to the market value of the securities loaned. Collateral pledged by each borrower is invested in an affiliated money market fund and is marked to market daily, based on the previous day’s market value, such that the value of the collateral exceeds the value of the loaned securities. In the event of significant appreciation in value of securities on loan on the last business day of the reporting period, the financial statements may reflect a collateral value that is less than the market value of the loaned securities. Such shortfall is remedied as described above. Loans are subject to termination at the option of the borrower or the Series. Upon termination of the loan, the borrower will return to the Series securities identical to the loaned securities. Should the borrower of the
securities fail financially, the Series has the right to repurchase the securities in the open market using the collateral.
The Series recognizes income, net of any rebate and securities lending agent fees, for lending its securities in the form of fees or interest on the investment of any cash received as collateral. The borrower receives all interest and dividends from the securities loaned and such payments are passed back to the lender in amounts equivalent thereto. The Series also continues to recognize any unrealized gain (loss) in the market price of the securities loaned and on the change in the value of the collateral invested that may occur during the term of the loan. In addition, realized gain (loss) is recognized on changes in the value of the collateral invested upon liquidation of the collateral. Net earnings from securities lending are disclosed on the Statement of Operations as “Income from securities lending, net”.
Equity and Mortgage Real Estate Investment Trusts (collectively equity REITs):The Series invests in equity REITs, which report information on the source of their distributions annually. Based on current and historical information, a portion of distributions received from equity REITs during the period is estimated to be dividend income, capital gain or return of capital and recorded accordingly. When material, these estimates are adjusted periodically when the actual source of distributions is disclosed by the equity REITs.
Securities Transactions and Net Investment Income:Securities transactions are recorded on the trade date. Realized gains (losses) from investment and currency transactions are calculated on the specific identification method. Dividend income is recorded on theex-date, or for certain foreign securities, when the Series becomes aware of such dividends. Expenses are recorded on an accrual basis, which may require the use of certain estimates by management that may differ from actual. Net investment income or loss (other than class specific expenses and waivers, which are allocated as noted below) and unrealized and realized gains (losses) are allocated daily to each class of shares based upon the relative proportion of adjusted net assets of each class at the beginning of the day. Class specific expenses and waivers, where applicable, are charged to the respective share classes. Class specific expenses include distribution fees and distribution fee waivers, shareholder servicing fees, transfer agent’s fees and expenses, registration fees and fee waivers and/or expense reimbursements, as applicable.
Taxes:It is the Series’ policy to continue to meet the requirements of the Internal Revenue Code applicable to regulated investment companies and to distribute all of its taxable net investment income and capital gains, if any, to its shareholders. Therefore, no federal income tax provision is required. Withholding taxes on foreign dividends, interest and capital gains, if any, are recorded, net of reclaimable amounts, at the time the related income is earned.
Dividends and Distributions:The Series expects to pay dividends from net investment income and distributions from net realized capital and currency gains, if any, annually. Dividends and distributions to shareholders, which are determined in accordance with federal income tax regulations and which may differ from generally accepted accounting
| | | | |
| PGIM Jennison Equity Opportunity Fund | | | 27 | |
Notes to Financial Statements(unaudited) (continued)
principles, are recorded on theex-date. Permanent book/tax differences relating to income and gain (loss) are reclassified amongst total distributable earnings (loss) andpaid-in capital in excess of par, as appropriate.
Estimates:The preparation of financial statements requires management to make estimates and assumptions that affect the reported amounts and disclosures in the financial statements. Actual results could differ from those estimates.
2. Agreements
The Company, on behalf of the Series, has a management agreement with PGIM Investments. Pursuant to this agreement, PGIM Investments has responsibility for all investment advisory services and supervises the Subadviser’s performance of such services. In addition, under the management agreement, PGIM Investments provides all of the administrative functions necessary for the organization, operation and management of the Series. PGIM Investments administers the corporate affairs of the Series and, in connection therewith, furnishes the Series with office facilities, together with those ordinary clerical and bookkeeping services which are not being furnished by the Series’ custodian and the Series’ transfer agent. PGIM Investments is also responsible for the staffing and management of dedicated groups of legal, marketing, compliance and related personnel necessary for the operation of the Series. The legal, marketing, compliance and related personnel are also responsible for the management and oversight of the various service providers to the Series, including, but not limited to, the custodian, transfer agent, and accounting agent.
PGIM Investments has entered into a subadvisory agreement with Jennison Associates LLC (“Jennison”). The subadvisory agreement provides that Jennison will furnish investment advisory services in connection with the management of the Series. In connection therewith, Jennison is obligated to keep certain books and records of the Series. PGIM Investments pays for the services of Jennison, the cost of compensation of officers of the Series, occupancy and certain clerical and bookkeeping costs of the Series. The Series bears all other costs and expenses.
The management fee paid to the Manager is accrued daily and payable monthly at an annual rate of 0.60% of the Series average daily net assets up to $300 million and 0.575% of the average daily net assets of the Series over $300 billion. The effective management fee rate before any waivers and/or expense reimbursements was 0.60% for the six months ended March 31, 2019.
The Manager has contractually agreed, through January 31, 2020, to limit , to limit transfer agency, shareholder servicing,sub-transfer agency, and blue sky fees, as applicable, to the extent that such fees cause the total annual operating expenses to exceed 2.03% of average
daily net assets for Class B shares or 1.53% of average daily net assets for Class R shares. This contractual waiver excludes interest, brokerage, taxes (such as income and foreign withholding taxes, stamp duty and deferred tax expenses), acquired fund fees and expenses, extraordinary expenses, and certain other Series expenses such as dividend and interest expense and broker charges on short sales. Expenses waived/reimbursed by the Manager in accordance with this agreement may be recouped by the Manager within the same fiscal year during which such waiver/reimbursement is made if such recoupment can be realized without exceeding the expense limit in effect at the time of the recoupment for that fiscal year.
Where applicable, the Manager agrees to waive management fees or shared operating expenses on any share class to the same extent that it waives similar expenses on any other share class. In addition, total annual operating expenses for Class R6 shares will not exceed total annual operating expenses for Class Z shares. Fees and/or expenses waived and/or reimbursed by PGIM Investments may be recouped by PGIM Investments within the same fiscal year during which such waiver and/or reimbursement is made if such recoupment can be realized without exceeding the expense limit in effect at the time of the recoupment for that fiscal year.
The Company, on behalf of the Series, has a distribution agreement with Prudential Investment Management Services LLC (“PIMS”), which acts as the distributor of the Class A, Class B, Class C, Class R, Class Z and Class R6 shares of the Series. The Series compensates PIMS for distributing and servicing the Series’ Class A, Class B, Class C and Class R shares, pursuant to the plans of distribution (the “Distribution Plans”), regardless of expenses actually incurred by PIMS. The distribution fees are accrued daily and payable monthly. No distribution or service fees are paid to PIMS as distributor of the Class Z and Class R6 shares of the Series.
Pursuant to the Distribution Plans, the Series compensates PIMS for distribution related activities at an annual rate of up to 0.30%, 1%, 1% and 0.75% of the average daily net assets of the Class A, Class B, Class C and Class R shares, respectively. PIMS has contractually agreed through January 31, 2020 to limit such fees to 0.50% of the average daily net assets of Class R shares.
For the reporting period ended March 31, 2019, PIMS received $59,554 infront-end sales charges resulting from sales of Class A shares. Additionally, for the reporting period ended March 31, 2019, PIMS received $1,193 and $155 in contingent deferred sales charges imposed upon redemptions by certain Class B and Class C shareholders, respectively. From these fees, PIMS paid such sales charges to broker-dealers, who in turn paid commissions to salespersons and incurred other distribution costs.
PGIM Investments, PIMS and Jennison are indirect, wholly-owned subsidiaries of Prudential Financial, Inc. (“Prudential”).
| | | | |
| PGIM Jennison Equity Opportunity Fund | | | 29 | |
Notes to Financial Statements(unaudited) (continued)
3. Other Transactions with Affiliates
Prudential Mutual Fund Services LLC (“PMFS”), an affiliate of PGIM Investments and an indirect, wholly-owned subsidiary of Prudential, serves as the Series’ transfer agent. Transfer agent’s fees and expenses in the Statement of Operations include certainout-of-pocket expenses paid tonon-affiliates, where applicable.
The Series may enter into certain securities purchase or sale transactions under Board approved Rule17a-7 procedures. Rule17a-7 is an exemptive rule under the 1940 Act, that subject to certain conditions, permits purchase and sale transactions among affiliated investment companies, or between an investment company and a person that is affiliated solely by reason of having a common (or affiliated) investment adviser, common directors, and/or common officers. Pursuant to the Rule17a-7 procedures and consistent with guidance issued by the SEC, the Series’ Chief Compliance Officer (“CCO”) prepares a quarterly summary of all such transactions for submission to the Board, together with the CCO’s written representation that all such17a-7 transactions were effected in accordance with the Series’ Rule17a-7 procedures. Any17a-7 transactions for the reporting period are disclosed in the “Portfolio Securities” note, below.
The Series may invest its overnight sweep cash in the PGIM Core Ultra Short Bond Fund (the “Core Fund”), and its securities lending cash collateral in the PGIM Institutional Money Market Fund (the “Money Market Fund”), each a series of Prudential Investment Portfolios 2, registered under the 1940 Act and managed by PGIM Investments. Through the Series’ investments in the mentioned underlying funds, PGIM Investments and/or its affiliates are paid fees or reimbursed for providing their services. Earnings from the Core Fund and Money Market Fund are disclosed on the Statement of Operations as “Affiliated dividend income” and “Income from securities lending, net”, respectively.
4. Portfolio Securities
The aggregate cost of purchases and proceeds from sales of portfolio securities (excluding short-term investments and U.S. Government securities) for the reporting period ended March 31, 2019, were $78,008,728 and $120,681,986, respectively.
A summary of the cost of purchases and proceeds from sales of shares of affiliated investments for the reporting period ended March 31, 2019, is presented as follows:
| | | | | | | | | | | | | | | | | | | | | | | | | | | | | | |
Value,
Beginning
of
Period | | | Cost of
Purchases | | | Proceeds
from Sales | | | Change in
Unrealized
Gain
(Loss) | | | Realized
Gain
(Loss) | | | Value,
End of
Period | | | Shares,
End of
Period | | | Income | |
| | PGIM Core Ultra Short Bond Fund* | | | | | |
| $ | 2,825,593 | | | $ | 72,170,327 | | | $ | 57,719,025 | | | $ | — | | | $ | — | | | $ | 17,276,895 | | | | 17,276,895 | | | $ | 64,475 | |
| | PGIM Institutional Money Market Fund* | | | | | |
| | 8,057,687 | | | | 68,131,288 | | | | 62,699,658 | | | | 2,461 | | | | (2,040 | ) | | | 13,489,738 | | | | 13,487,041 | | | | 11,102 | ** |
| | | | | | | | | | | | | | | | | | | | | | | | | | | | | | |
| $ | 10,883,280 | | | $ | 140,301,615 | | | $ | 120,418,683 | | | $ | 2,461 | | | $ | (2,040 | ) | | $ | 30,766,633 | | | | | | | $ | 75,577 | |
| | | | | | | | | | | | | | | | | | | | | | | | | | | | | | |
| * | The Fund did not have any capital gain distributions during the reporting period. |
| ** | This amount is included in “Income from securities lending, net” on the Statement of Operations. |
For the reporting period ended March 31, 2019, no17a-7 transactions were entered into by the Series.
5. Tax Information
The United States federal income tax basis of the Series’ investments and the net unrealized appreciation as of March 31, 2019 were as follows:
| | | | |
Tax Basis | | $ | 353,189,535 | |
| | | | |
Gross Unrealized Appreciation | | | 51,848,063 | |
Gross Unrealized Depreciation | | | (32,776,226 | ) |
| | | | |
Net Unrealized Appreciation | | $ | 19,071,837 | |
| | | | |
The book basis may differ from tax basis due to certaintax-related adjustments.
The Manager has analyzed the Series’ tax positions taken on federal, state and local income tax returns for all open tax years and has concluded that no provision for income tax is required in the Series’ financial statements for the current reporting period. The Series’ federal, state and local income and federal excise tax returns for tax years for which the applicable statutes of limitations have not expired are subject to examination by the Internal Revenue Service and state departments of revenue.
6. Capital and Ownership
The Series offers Class A, Class B, Class C, Class R, Class Z and Class R6 shares. Class A shares are sold with a maximumfront-end sales charge of 5.50%. Investors who purchase $1 million or more of Class A shares and sell these shares within 12 months of purchase are subject to a contingent deferred sales charge (“CDSC”) of 1%, although they are not subject to an initial sales charge. The Class A CDSC is waived for certain retirement and/or benefit plans. A special exchange privilege is also available for shareholders who qualified to purchase Class A shares at net asset value. Class B shares are sold with a CDSC which declines from 5% to zero depending on the period of time the shares are held. Class B
| | | | |
| PGIM Jennison Equity Opportunity Fund | | | 31 | |
Notes to Financial Statements(unaudited) (continued)
shares will automatically convert to Class A shares on a quarterly basis approximately seven years after purchase. Class B shares are closed to new purchases. Class C shares are sold with a CDSC of 1% on sales made within 12 months of purchase. Class C shares will automatically convert to Class A shares on a monthly basis approximately 10 years after purchase. Class R, Class Z and Class R6 shares are not subject to any sales or redemption charge and are available exclusively for sale to a limited group of investors.
Under certain circumstances, an exchange may be made from specified share classes of the Series to one or more other share classes of the Series as presented in the table of transactions in shares of common stock.
The Company is authorized to issue 6.625 billion shares of common stock at $0.001 par value per shares. There are 1.02 billion shares authorized for the Series equally divided into seven classes, designated Class A, Class B, Class C, Class R, Class Z, Class T and Class R6 common stock, each of which consists of 100 million, 2 million, 25 million, 200 million, 325 million, 50 million and 320 million authorized shares, respectively. The Series currently does not have any Class T shares outstanding.
As of March 31, 2019, Prudential, through its affiliated entities, including affiliated funds (if applicable), owned 955,481 Class R6 shares of the Series. At reporting period end, four shareholders of record, each holding greater than 5% of the Series, held 48% of the Series’ outstanding shares.
Transactions in shares of common stock were as follows:
| | | | | | | | |
Class A | | Shares | | | Amount | |
Six months ended March 31, 2019: | | | | | | | | |
Shares sold | | | 280,326 | | | $ | 4,472,791 | |
Shares issued in reinvestment of dividends and distributions | | | 1,931,988 | | | | 28,187,707 | |
Shares reacquired | | | (1,551,289 | ) | | | (25,474,384 | ) |
| | | | | | | | |
Net increase (decrease) in shares outstanding before conversion | | | 661,025 | | | | 7,186,114 | |
Shares issued upon conversion from other share class(es) | | | 42,962 | | | | 683,204 | |
Shares reacquired upon conversion into other share class(es) | | | (19,271 | ) | | | (308,895 | ) |
| | | | | | | | |
Net increase (decrease) in shares outstanding | | | 684,716 | | | $ | 7,560,423 | |
| | | | | | | | |
Year ended September 30, 2018: | | | | | | | | |
Shares sold | | | 422,464 | | | $ | 8,471,647 | |
Shares issued in reinvestment of dividends and distributions | | | 1,559,881 | | | | 29,684,519 | |
Shares reacquired | | | (1,643,376 | ) | | | (33,193,106 | ) |
| | | | | | | | |
Net increase (decrease) in shares outstanding before conversion | | | 338,969 | | | | 4,963,060 | |
Shares issued upon conversion from other share class(es) | | | 100,128 | | | | 2,057,133 | |
Shares reacquired upon conversion into other share class(es) | | | (262,675 | ) | | | (5,235,053 | ) |
| | | | | | | | |
Net increase (decrease) in shares outstanding | | | 176,422 | | | $ | 1,785,140 | |
| | | | | | | | |
| | | | | | | | |
Class B | | Shares | | | Amount | |
Six months ended March 31, 2019: | | | | | | | | |
Shares sold | | | 1,877 | | | $ | 24,504 | |
Shares issued in reinvestment of dividends and distributions | | | 62,151 | | | | 706,659 | |
Shares reacquired | | | (43,587 | ) | | | (544,472 | ) |
| | | | | | | | |
Net increase (decrease) in shares outstanding before conversion | | | 20,441 | | | | 186,691 | |
Shares reacquired upon conversion into other share class(es) | | | (20,774 | ) | | | (267,112 | ) |
| | | | | | | | |
Net increase (decrease) in shares outstanding | | | (333 | ) | | $ | (80,421 | ) |
| | | | | | | | |
Year ended September 30, 2018: | | | | | | | | |
Shares sold | | | 13,417 | | | $ | 221,871 | |
Shares issued in reinvestment of dividends and distributions | | | 55,276 | | | | 859,544 | |
Shares reacquired | | | (59,021 | ) | | | (973,807 | ) |
| | | | | | | | |
Net increase (decrease) in shares outstanding before conversion | | | 9,672 | | | | 107,608 | |
Shares reacquired upon conversion into other share class(es) | | | (73,261 | ) | | | (1,241,332 | ) |
| | | | | | | | |
Net increase (decrease) in shares outstanding | | | (63,589 | ) | | $ | (1,133,724 | ) |
| | | | | | | | |
Class C | | | | | | |
Six months ended March 31, 2019: | | | | | | | | |
Shares sold | | | 145,126 | | | $ | 1,741,652 | |
Shares issued in reinvestment of dividends and distributions | | | 404,351 | | | | 4,613,643 | |
Shares reacquired | | | (422,640 | ) | | | (5,470,080 | ) |
| | | | | | | | |
Net increase (decrease) in shares outstanding before conversion | | | 126,837 | | | | 885,215 | |
Shares reacquired upon conversion into other share class(es) | | | (72,910 | ) | | | (873,142 | ) |
| | | | | | | | |
Net increase (decrease) in shares outstanding | | | 53,927 | | | $ | 12,073 | |
| | | | | | | | |
Year ended September 30, 2018: | | | | | | | | |
Shares sold | | | 89,194 | | | $ | 1,470,527 | |
Shares issued in reinvestment of dividends and distributions | | | 332,205 | | | | 5,165,783 | |
Shares reacquired | | | (450,469 | ) | | | (7,412,940 | ) |
| | | | | | | | |
Net increase (decrease) in shares outstanding before conversion | | | (29,070 | ) | | | (776,630 | ) |
Shares reacquired upon conversion into other share class(es) | | | (33,000 | ) | | | (544,663 | ) |
| | | | | | | | |
Net increase (decrease) in shares outstanding | | | (62,070 | ) | | $ | (1,321,293 | ) |
| | | | | | | | |
Class R | | | | | | |
Six months ended March 31, 2019: | | | | | | | | |
Shares sold | | | 23,812 | | | $ | 310,016 | |
Shares issued in reinvestment of dividends and distributions | | | 24,004 | | | | 299,086 | |
Shares reacquired | | | (66,961 | ) | | | (871,666 | ) |
| | | | | | | | |
Net increase (decrease) in shares outstanding | | | (19,145 | ) | | $ | (262,564 | ) |
| | | | | | | | |
Year ended September 30, 2018: | | | | | | | | |
Shares sold | | | 31,539 | | | $ | 547,862 | |
Shares issued in reinvestment of dividends and distributions | | | 27,100 | | | | 452,296 | |
Shares reacquired | | | (157,294 | ) | | | (2,860,424 | ) |
| | | | | | | | |
Net increase (decrease) in shares outstanding before conversion | | | (98,655 | ) | | | (1,860,266 | ) |
Shares reacquired upon conversion into other share class(es) | | | (81 | ) | | | (1,430 | ) |
| | | | | | | | |
Net increase (decrease) in shares outstanding | | | (98,736 | ) | | $ | (1,861,696 | ) |
| | | | | | | | |
| | | | |
| PGIM Jennison Equity Opportunity Fund | | | 33 | |
Notes to Financial Statements(unaudited) (continued)
| | | | | | | | |
Class Z | | Shares | | | Amount | |
Six months ended March 31, 2019: | | | | | | | | |
Shares sold | | | 789,994 | | | $ | 13,482,087 | |
Shares issued in reinvestment of dividends and distributions | | | 1,112,147 | | | | 17,015,840 | |
Shares reacquired | | | (1,178,105 | ) | | | (20,331,053 | ) |
| | | | | | | | |
Net increase (decrease) in shares outstanding before conversion | | | 724,036 | | | | 10,166,874 | |
Shares issued upon conversion from other share class(es) | | | 49,562 | | | | 797,427 | |
Shares reacquired upon conversion into other share class(es) | | | (3,112 | ) | | | (49,986 | ) |
| | | | | | | | |
Net increase (decrease) in shares outstanding | | | 770,486 | | | $ | 10,914,315 | |
| | | | | | | | |
Year ended September 30, 2018: | | | | | | | | |
Shares sold | | | 1,142,316 | | | $ | 24,101,133 | |
Shares issued in reinvestment of dividends and distributions | | | 811,892 | | | | 16,091,695 | |
Shares reacquired | | | (1,543,556 | ) | | | (32,430,378 | ) |
| | | | | | | | |
Net increase (decrease) in shares outstanding before conversion | | | 410,652 | | | | 7,762,450 | |
Shares issued upon conversion from other share class(es) | | | 256,812 | | | | 5,337,693 | |
Shares reacquired upon conversion into other share class(es) | | | (41,095 | ) | | | (870,845 | ) |
| | | | | | | | |
Net increase (decrease) in shares outstanding | | | 626,369 | | | $ | 12,229,298 | |
| | | | | | | | |
Class R6 | | | | | | |
Six months ended March 31, 2019: | | | | | | | | |
Shares sold | | | 98,618 | | | $ | 1,652,201 | |
Shares issued in reinvestment of dividends and distributions | | | 162,192 | | | | 2,483,158 | |
Shares reacquired | | | (80,179 | ) | | | (1,355,195 | ) |
| | | | | | | | |
Net increase (decrease) in shares outstanding before conversion | | | 180,631 | | | | 2,780,164 | |
Shares issued upon conversion from other share class(es) | | | 1,048 | | | | 18,504 | |
| | | | | | | | |
Net increase (decrease) in shares outstanding | | | 181,679 | | | $ | 2,798,668 | |
| | | | | | | | |
Year ended September 30, 2018: | | | | | | | | |
Shares sold | | | 86,566 | | | $ | 1,814,193 | |
Shares issued in reinvestment of dividends and distributions | | | 116,523 | | | | 2,309,487 | |
Shares reacquired | | | (153,832 | ) | | | (3,251,533 | ) |
| | | | | | | | |
Net increase (decrease) in shares outstanding before conversion | | | 49,257 | | | | 872,147 | |
Shares issued upon conversion from other share class(es) | | | 23,630 | | | | 498,497 | |
| | | | | | | | |
Net increase (decrease) in shares outstanding | | | 72,887 | | | $ | 1,370,644 | |
| | | | | | | | |
7. Borrowings
The Company, on behalf of the Series, along with other affiliated registered investment companies (the “Funds”), is a party to a Syndicated Credit Agreement (“SCA”) with a group of banks. The purpose of the SCA is to provide an alternative source of temporary funding for capital share redemptions. The SCA provides for a commitment of $900 million for the period October 4, 2018 through October 3, 2019. The Funds pay an annualized commitment fee of 0.15% of the unused portion of the SCA. The Series’ portion of the commitment fee for the unused amount, allocated based upon a method approved by the Board, is accrued daily and paid quarterly. Prior to October 4, 2018, the Funds had another SCA that provided a commitment of $900 million and the Funds paid an annualized commitment fee of 0.15% of the unused portion of the SCA. The interest on borrowings
under the SCAs is paid monthly and at a per annum interest rate based upon a contractual spread plus the higher of (1) the effective federal funds rate, (2) the1-month LIBOR rate or (3) zero percent.
Certain affiliated registered investment companies that are parties to the SCA include portfolios that are subject to a predetermined mathematical formula used to manage certain benefit guarantees offered under variable annuity contracts. The formula may result in large scale asset flows into and out of these portfolios. Consequently, these portfolios may be more likely to utilize the SCA for purposes of funding redemptions. It may be possible for those portfolios to fully exhaust the committed amount of the SCA, thereby requiring the Manager to allocate available funding per a Board-approved methodology designed to treat the Funds in the SCA equitably.
The Series utilized the SCA during the reporting period ended March 31, 2019. The average daily balance for the 2 days that the Series had loans outstanding during the period was approximately $461,500, borrowed at a weighted average interest rate of 3.69%. The maximum loan outstanding amount during the period was $739,000. At March 31, 2019, the Series did not have an outstanding loan amount.
8. Risks of Investing in the Series
The Series’ risks include, but are not limited to, some or all of the risks discussed below:
Equity and Equity-Related Securities Risks:The value of a particular security could go down and you could lose money. In addition to an individual security losing value, the value of the equity markets or a sector in which the Series invests could go down. The Series’ holdings can vary significantly from broad market indexes and the performance of the Series can deviate from the performance of these indexes. Different parts of a market can react differently to adverse issuer, market, regulatory, political and economic developments.
Foreign Securities Risk:The Series’ investments in securities of foreign issuers or issuers with significant exposure to foreign markets involve additional risk. Foreign countries in which the Series may invest may have markets that are less liquid, less regulated and more volatile than US markets. The value of the Series’ investments may decline because of factors affecting the particular issuer as well as foreign markets and issuers generally, such as unfavorable government actions, and political or financial instability.
Market and Credit Risk:Securities markets may be volatile and the market prices of the Series’ securities may decline. Securities fluctuate in price based on changes in an issuer’s financial condition and overall market and economic conditions. If the market prices of the securities owned by the Series fall, the value of an investment in the Series will decline. Additionally, the Series may also be exposed to credit risk in the event that an issuer or guarantor fails to perform or that an institution or entity with which the Series has unsettled or open transactions defaults.
| | | | |
| PGIM Jennison Equity Opportunity Fund | | | 35 | |
Notes to Financial Statements(unaudited) (continued)
9. Recent Accounting Pronouncements and Reporting Updates
In August 2018, the Securities and Exchange Commission (the “SEC”) adopted amendments to RegulationS-X to update and simplify the disclosure requirements for registered investment companies by eliminating requirements that are redundant or duplicative of US GAAP requirements or other SEC disclosure requirements. The new amendments require the presentation of the total, rather than the components, of distributable earnings on the Statement of Assets and Liabilities and the total, rather than the components, of dividends from net investment income and distributions from net realized gains on the Statements of Changes in Net Assets. The amendments also removed the requirement for the parenthetical disclosure of undistributed net investment income on the Statements of Changes in Net Assets and certain tax adjustments that were reflected in the Notes to Financial Statements. The Manager has adopted the amendments and reflected them in the Series’ financial statements.
In August 2018, the FASB issued Accounting Standards Update (“ASU”)No. 2018-13, which changes certain fair value measurement disclosure requirements. The new ASU, in addition to other modifications and additions, removes the requirement to disclose the amount and reasons for transfers between Level 1 and Level 2 of the fair value hierarchy, and the Series’ policy for the timing of transfers between levels. The amendments are effective for financial statements issued for fiscal years beginning after December 15, 2019, and interim periods within those fiscal years. The Manager has evaluated the implications of certain provisions of the ASU and has determined to early adopt aspects related to the removal and modification of certain fair value measurement disclosures under the ASU effective immediately. At this time, the Manager is evaluating the implications of certain other provisions of the ASU related to new disclosure requirements and any impact on the financial statement disclosures has not yet been determined.
Financial Highlights(unaudited)
| | | | | | | | | | | | | | | | | | | | | | | | | | | | |
| Class A Shares | | | | | | | | | | | | | | | | | | | | | |
| | | Six Months
Ended
March 31, | | | | | | Year Ended September 30, | |
| | | 2019 | | | | | | 2018 | | | 2017 | | | 2016 | | | 2015 | | | 2014 | |
| Per Share Operating Performance(a): | | | | | | | | | | | | | | | | | | | | | | | | | | | | |
| Net Asset Value, Beginning of Period | | | $20.62 | | | | | | | | $20.89 | | | | $19.11 | | | | $18.46 | | | | $21.48 | | | | $19.56 | |
| Income (loss) from investment operations: | | | | | | | | | | | | | | | | | | | | | | | | | | | | |
| Net investment income (loss) | | | 0.08 | | | | | | | | 0.14 | | | | 0.08 | | | | 0.14 | | | | 0.12 | | | | 0.05 | |
| Net realized and unrealized gain (loss) on investment and foreign currency transactions | | | (2.14 | ) | | | | | | | 2.42 | | | | 3.21 | | | | 1.97 | | | | (1.20 | ) | | | 2.63 | |
| Total from investment operations | | | (2.06 | ) | | | | | | | 2.56 | | | | 3.29 | | | | 2.11 | | | | (1.08 | ) | | | 2.68 | |
| Less Dividends and Distributions: | | | | | | | | | | | | | | | | | | | | | | | | | | | | |
| Dividends from net investment income | | | (0.09 | ) | | | | | | | (0.19 | ) | | | (0.16 | ) | | | (0.13 | ) | | | (0.04 | ) | | | (0.04 | ) |
| Distributions from net realized gains | | | (2.62 | ) | | | | | | | (2.64 | ) | | | (1.35 | ) | | | (1.33 | ) | | | (1.90 | ) | | | (0.72 | ) |
| Total dividends and distributions | | | (2.71 | ) | | | | | | | (2.83 | ) | | | (1.51 | ) | | | (1.46 | ) | | | (1.94 | ) | | | (0.76 | ) |
| Net asset value, end of period | | | $15.85 | | | | | | | | $20.62 | | | | $20.89 | | | | $19.11 | | | | $18.46 | | | | $21.48 | |
| Total Return(b): | | | (8.86)% | | | | | | | | 13.39% | | | | 17.80% | | | | 12.14% | | | | (5.38)% | | | | 14.00% | |
| |
| Ratios/Supplemental Data: | | | | | | | | | | | | | | | | | | | | | |
| Net assets, end of period (000) | | | $187,526 | | | | | | | | $229,733 | | | | $229,043 | | | | $226,889 | | | | $245,320 | | | | $303,859 | |
| Average net assets (000) | | | $194,496 | | | | | | | | $233,106 | | | | $231,082 | | | | $235,287 | | | | $290,318 | | | | $291,978 | |
| Ratios to average net assets(c)(d): | | | | | | | | | | | | | | | | | | | | | | | | | | | | |
| Expenses after waivers and/or expense reimbursement | | | 1.10% | (e) | | | | | | | 1.06% | | | | 1.09% | | | | 1.07% | | | | 1.10% | | | | 1.07% | |
| Expenses before waivers and/or expense reimbursement | | | 1.10% | (e) | | | | | | | 1.06% | | | | 1.09% | | | | 1.07% | | | | 1.10% | | | | 1.07% | |
| Net investment income (loss) | | | 0.99% | (e) | | | | | | | 0.72% | | | | 0.39% | | | | 0.78% | | | | 0.59% | | | | 0.26% | |
| Portfolio turnover rate(f) | | | 21% | | | | | | | | 59% | | | | 49% | | | | 59% | | | | 69% | | | | 47% | |
| (a) | Calculated based on average shares outstanding during the period. |
| (b) | Total return does not consider the effects of sales loads. Total return is calculated assuming a purchase of a share on the first day and a sale on the last day of each period reported and includes reinvestment of dividends and distributions, if any. Total returns may reflect adjustments to conform to generally accepted accounting principles. Total returns for periods less than one full year are not annualized. |
| (c) | Effective October 1, 2017, class specific expenses include transfer agent fees and expenses and registration fees, which are charged to their respective share class. |
| (d) | Does not include expenses of the underlying funds in which the Series invests. |
| (f) | The Series’ portfolio turnover rate is calculated in accordance with regulatory requirements, without regard to transactions involving short term investments and certain derivatives. If such transactions were included, the Series’ portfolio turnover rate may be higher. |
See Notes to Financial Statements.
| | | | |
| PGIM Jennison Equity Opportunity Fund | | | 37 | |
Financial Highlights(unaudited) (continued)
| | | | | | | | | | | | | | | | | | | | | | | | | | | | |
| Class B Shares | | | | | | | | | | | | | | | | | | | | | |
| | | Six Months
Ended
March 31, | | | | | | Year Ended September 30, | |
| | | 2019 | | | | | | 2018 | | | 2017 | | | 2016 | | | 2015 | | | 2014 | |
| Per Share Operating Performance(a): | | | | | | | | | | | | | | | | | | | | | | | | | | | | |
| Net Asset Value, Beginning of Period | | | $16.72 | | | | | | | | $17.48 | | | | $16.24 | | | | $15.90 | | | | $18.86 | | | | $17.33 | |
| Income (loss) from investment operations: | | | | | | | | | | | | | | | | | | | | | | | | | | | | |
| Net investment income (loss) | | | - | (b) | | | | | | | (0.03 | ) | | | (0.05 | ) | | | 0.01 | | | | (0.02 | ) | | | (0.08 | ) |
| Net realized and unrealized gain (loss) on investment and foreign currency transactions | | | (1.77 | ) | | | | | | | 1.99 | | | | 2.70 | | | | 1.68 | | | | (1.04 | ) | | | 2.33 | |
| Total from investment operations | | | (1.77 | ) | | | | | | | 1.96 | | | | 2.65 | | | | 1.69 | | | | (1.06 | ) | | | 2.25 | |
| Less Dividends and Distributions: | | | | | | | | | | | | | | | | | | | | | | | | | | | | |
| Dividends from net investment income | | | - | | | | | | | | (0.08 | ) | | | (0.06 | ) | | | (0.02 | ) | | | - | | | | - | |
| Distributions from net realized gains | | | (2.62 | ) | | | | | | | (2.64 | ) | | | (1.35 | ) | | | (1.33 | ) | | | (1.90 | ) | | | (0.72 | ) |
| Total dividends and distributions | | | (2.62 | ) | | | | | | | (2.72 | ) | | | (1.41 | ) | | | (1.35 | ) | | | (1.90 | ) | | | (0.72 | ) |
| Net asset value, end of period | | | $12.33 | | | | | | | | $16.72 | | | | $17.48 | | | | $16.24 | | | | $15.90 | | | | $18.86 | |
| Total Return(c): | | | (9.23)% | | | | | | | | 12.35% | | | | 16.91% | | | | 11.34% | | | | (6.04)% | | | | 13.30% | |
| |
| Ratios/Supplemental Data: | | | | | | | | | | | | | | | | | | | | | |
| Net assets, end of period (000) | | | $3,592 | | | | | | | | $4,877 | | | | $6,213 | | | | $7,429 | | | | $8,997 | | | | $13,049 | |
| Average net assets (000) | | | $4,025 | | | | | | | | $5,673 | | | | $7,088 | | | | $8,184 | | | | $11,632 | | | | $13,038 | |
| Ratios to average net assets(d)(e): | | | | | | | | | | | | | | | | | | | | | | | | | | | | |
| Expenses after waivers and/or expense reimbursement | | | 2.03% | (f) | | | | | | | 2.03% | | | | 1.79% | | | | 1.77% | | | | 1.80% | | | | 1.77% | |
| Expenses before waivers and/or expense reimbursement | | | 2.42% | (f) | | | | | | | 2.19% | | | | 1.79% | | | | 1.77% | | | | 1.80% | | | | 1.77% | |
| Net investment income (loss) | | | 0.06% | (f) | | | | | | | (0.18)% | | | | (0.30)% | | | | 0.08% | | | | (0.10)% | | | | (0.43)% | |
| Portfolio turnover rate(g) | | | 21% | | | | | | | | 59% | | | | 49% | | | | 59% | | | | 69% | | | | 47% | |
| (a) | Calculated based on average shares outstanding during the period. |
| (b) | Less than $0.005 per share. |
| (c) | Total return does not consider the effects of sales loads. Total return is calculated assuming a purchase of a share on the first day and a sale on the last day of each period reported and includes reinvestment of dividends and distributions, if any. Total returns may reflect adjustments to conform to generally accepted accounting principles. Total returns for periods less than one full year are not annualized. |
| (d) | Effective October 1, 2017, class specific expenses include transfer agent fees and expenses and registration fees, which are charged to their respective share class. |
| (e) | Does not include expenses of the underlying funds in which the Series invests. |
| (g) | The Series’ portfolio turnover rate is calculated in accordance with regulatory requirements, without regard to transactions involving short term investments and certain derivatives. If such transactions were included, the Series’ portfolio turnover rate may be higher. |
See Notes to Financial Statements.
| | | | | | | | | | | | | | | | | | | | | | | | | | | | |
| Class C Shares | | | | | | | | | | | | | | | | | | | | | |
| | | Six Months
Ended
March 31, | | | | | | Year Ended September 30, | |
| | | 2019 | | | | | | 2018 | | | 2017 | | | 2016 | | | 2015 | | | 2014 | |
| Per Share Operating Performance(a): | | | | | | | | | | | | | | | | | | | | | | | | | | | | |
| Net Asset Value, Beginning of Period | | | $16.75 | | | | | | | | $17.48 | | | | $16.24 | | | | $15.89 | | | | $18.86 | | | | $17.33 | |
| Income (loss) from investment operations: | | | | | | | | | | | | | | | | | | | | | | | | | | | | |
| Net investment income (loss) | | | 0.02 | | | | | | | | - | (b) | | | (0.05 | ) | | | 0.01 | | | | (0.02 | ) | | | (0.08 | ) |
| Net realized and unrealized gain (loss) on investment and foreign currency transactions | | | (1.78 | ) | | | | | | | 1.99 | | | | 2.70 | | | | 1.69 | | | | (1.05 | ) | | | 2.33 | |
| Total from investment operations | | | (1.76 | ) | | | | | | | 1.99 | | | | 2.65 | | | | 1.70 | | | | (1.07 | ) | | | 2.25 | |
| Less Dividends and Distributions: | | | | | | | | | | | | | | | | | | | | | | | | | | | | |
| Dividends from net investment income | | | - | | | | | | | | (0.08 | ) | | | (0.06 | ) | | | (0.02 | ) | | | - | | | | - | |
| Distributions from net realized gains | | | (2.62 | ) | | | | | | | (2.64 | ) | | | (1.35 | ) | | | (1.33 | ) | | | (1.90 | ) | | | (0.72 | ) |
| Total dividends and distributions | | | (2.62 | ) | | | | | | | (2.72 | ) | | | (1.41 | ) | | | (1.35 | ) | | | (1.90 | ) | | | (0.72 | ) |
| Net asset value, end of period | | | $12.37 | | | | | | | | $16.75 | | | | $17.48 | | | | $16.24 | | | | $15.89 | | | | $18.86 | |
| Total Return(c): | | | (9.16)% | | | | | | | | 12.61% | | | | 16.91% | | | | 11.41% | | | | (6.10)% | | | | 13.30% | |
| |
| Ratios/Supplemental Data: | | | | | | | | | | | | | | | | | | | | | |
| Net assets, end of period (000) | | | $24,865 | | | | | | | | $32,765 | | | | $35,289 | | | | $37,229 | | | | $42,644 | | | | $48,927 | |
| Average net assets (000) | | | $26,853 | | | | | | | | $34,589 | | | | $37,497 | | | | $40,176 | | | | $49,176 | | | | $42,781 | |
| Ratios to average net assets(d)(e): | | | | | | | | | | | | | | | | | | | | | | | | | | | | |
| Expenses after waivers and/or expense reimbursement | | | 1.83% | (f) | | | | | | | 1.78% | | | | 1.79% | | | | 1.77% | | | | 1.80% | | | | 1.77% | |
| Expenses before waivers and/or expense reimbursement | | | 1.83% | (f) | | | | | | | 1.78% | | | | 1.79% | | | | 1.77% | | | | 1.80% | | | | 1.77% | |
| Net investment income (loss) | | | 0.26% | (f) | | | | | | | 0.01% | | | | (0.31)% | | | | 0.08% | | | | (0.10)% | | | | (0.44)% | |
| Portfolio turnover rate(g) | | | 21% | | | | | | | | 59% | | | | 49% | | | | 59% | | | | 69% | | | | 47% | |
| (a) | Calculated based on average shares outstanding during the period. |
| (b) | Less than $0.005 per share. |
| (c) | Total return does not consider the effects of sales loads. Total return is calculated assuming a purchase of a share on the first day and a sale on the last day of each period reported and includes reinvestment of dividends and distributions, if any. Total returns may reflect adjustments to conform to generally accepted accounting principles. Total returns for periods less than one full year are not annualized. |
| (d) | Effective October 1, 2017, class specific expenses include transfer agent fees and expenses and registration fees, which are charged to their respective share class. |
| (e) | Does not include expenses of the underlying funds in which the Series invests. |
| (g) | The Series’ portfolio turnover rate is calculated in accordance with regulatory requirements, without regard to transactions involving short term investments and certain derivatives. If such transactions were included, the Series’ portfolio turnover rate may be higher. |
See Notes to Financial Statements.
| | | | |
| PGIM Jennison Equity Opportunity Fund | | | 39 | |
Financial Highlights(unaudited) (continued)
| | | | | | | | | | | | | | | | | | | | | | | | | | | | |
| Class R Shares | | | | | | | | | | | | | | | | | | | | | |
| | | Six Months
Ended
March 31, | | | | | | Year Ended September 30, | |
| | | 2019 | | | | | | 2018 | | | 2017 | | | 2016 | | | 2015 | | | 2014 | |
| Per Share Operating Performance(a): | | | | | | | | | | | | | | | | | | | | | | | | | | | | |
| Net Asset Value, Beginning of Period | | | $18.01 | | | | | | | | $18.63 | | | | $17.21 | | | | $16.76 | | | | $19.69 | | | | $17.99 | |
| Income (loss) from investment operations: | | | | | | | | | | | | | | | | | | | | | | | | | | | | |
| Net investment income (loss) | | | 0.04 | | | | | | | | 0.05 | | | | 0.03 | | | | 0.09 | | | | 0.07 | | | | 0.01 | |
| Net realized and unrealized gain (loss) on investment and foreign currency transactions | | | (1.89 | ) | | | | | | | 2.12 | | | | 2.87 | | | | 1.79 | | | | (1.10 | ) | | | 2.42 | |
| Total from investment operations | | | (1.85 | ) | | | | | | | 2.17 | | | | 2.90 | | | | 1.88 | | | | (1.03 | ) | | | 2.43 | |
| Less Dividends and Distributions: | | | | | | | | | | | | | | | | | | | | | | | | | | | | |
| Dividends from net investment income | | | (0.02 | ) | | | | | | | (0.15 | ) | | | (0.13 | ) | | | (0.10 | ) | | | - | (b) | | | (0.01 | ) |
| Distributions from net realized gains | | | (2.62 | ) | | | | | | | (2.64 | ) | | | (1.35 | ) | | | (1.33 | ) | | | (1.90 | ) | | | (0.72 | ) |
| Total dividends and distributions | | | (2.64 | ) | | | | | | | (2.79 | ) | | | (1.48 | ) | | | (1.43 | ) | | | (1.90 | ) | | | (0.73 | ) |
| Net asset value, end of period | | | $13.52 | | | | | | | | $18.01 | | | | $18.63 | | | | $17.21 | | | | $16.76 | | | | $19.69 | |
| Total Return(c): | | | (9.05)% | | | | | | | | 12.85% | | | | 17.49% | | | | 11.98% | | | | (5.59)% | | | | 13.81% | |
| |
| Ratios/Supplemental Data: | | | | | | | | | | | | | | | | | | | | | |
| Net assets, end of period (000) | | | $2,313 | | | | | | | | $3,424 | | | | $5,382 | | | | $5,880 | | | | $6,430 | | | | $8,188 | |
| Average net assets (000) | | | $2,745 | | | | | | | | $4,542 | | | | $5,859 | | | | $6,281 | | | | $7,693 | | | | $6,569 | |
| Ratios to average net assets(d)(e): | | | | | | | | | | | | | | | | | | | | | | | | | | | | |
| Expenses after waivers and/or expense reimbursement | | | 1.53% | (f) | | | | | | | 1.53% | | | | 1.29% | | | | 1.27% | | | | 1.30% | | | | 1.27% | |
| Expenses before waivers and/or expense reimbursement | | | 2.11% | (f) | | | | | | | 1.84% | | | | 1.54% | | | | 1.52% | | | | 1.55% | | | | 1.52% | |
| Net investment income (loss) | | | 0.53% | (f) | | | | | | | 0.26% | | | | 0.19% | | | | 0.57% | | | | 0.39% | | | | 0.07% | |
| Portfolio turnover rate(g) | | | 21% | | | | | | | | 59% | | | | 49% | | | | 59% | | | | 69% | | | | 47% | |
| (a) | Calculated based on average shares outstanding during the period. |
| (b) | Less than $(0.005) per share. |
| (c) | Total return is calculated assuming a purchase of a share on the first day and a sale on the last day of each period reported and includes reinvestment of dividends and distributions, if any. Total returns may reflect adjustments to conform to generally accepted accounting principles. Total returns for periods less than one full year are not annualized. |
| (d) | Effective October 1, 2017, class specific expenses include transfer agent fees and expenses and registration fees, which are charged to their respective share class. |
| (e) | Does not include expenses of the underlying funds in which the Series invests. |
| (g) | The Series’ portfolio turnover rate is calculated in accordance with regulatory requirements, without regard to transactions involving short term investments and certain derivatives. If such transactions were included, the Series’ portfolio turnover rate may be higher. |
See Notes to Financial Statements.
| | | | | | | | | | | | | | | | | | | | | | | | | | | | |
| Class Z Shares | | | | | | | | | | | | | | | | | | | | | |
| | | Six Months
Ended
March 31, | | | | | | Year Ended September 30, | |
| | | 2019 | | | | | | 2018 | | | 2017 | | | 2016 | | | 2015 | | | 2014 | |
| Per Share Operating Performance(a): | | | | | | | | | | | | | | | | | | | | | | | | | | | | |
| Net Asset Value, Beginning of Period | | | $21.52 | | | | | | | | $21.68 | | | | $19.78 | | | | $19.06 | | | | $22.12 | | | | $20.11 | |
| Income (loss) from investment operations: | | | | | | | | | | | | | | | | | | | | | | | | | | | | |
| Net investment income (loss) | | | 0.12 | | | | | | | | 0.21 | | | | 0.14 | | | | 0.20 | | | | 0.19 | | | | 0.12 | |
| Net realized and unrealized gain (loss) on investment and foreign currency transactions | | | (2.24 | ) | | | | | | | 2.52 | | | | 3.32 | | | | 2.04 | | | | (1.25 | ) | | | 2.70 | |
| Total from investment operations | | | (2.12 | ) | | | | | | | 2.73 | | | | 3.46 | | | | 2.24 | | | | (1.06 | ) | | | 2.82 | |
| Less Dividends and Distributions: | | | | | | | | | | | | | | | | | | | | | | | | | | | | |
| Dividends from net investment income | | | (0.14 | ) | | | | | | | (0.25 | ) | | | (0.21 | ) | | | (0.19 | ) | | | (0.10 | ) | | | (0.09 | ) |
| Distributions from net realized gains | | | (2.62 | ) | | | | | | | (2.64 | ) | | | (1.35 | ) | | | (1.33 | ) | | | (1.90 | ) | | | (0.72 | ) |
| Total dividends and distributions | | | (2.76 | ) | | | | | | | (2.89 | ) | | | (1.56 | ) | | | (1.52 | ) | | | (2.00 | ) | | | (0.81 | ) |
| Net asset value, end of period | | | $16.64 | | | | | | | | $21.52 | | | | $21.68 | | | | $19.78 | | | | $19.06 | | | | $22.12 | |
| Total Return(b): | | | (8.70)% | | | | | | | | 13.74% | | | | 18.11% | | | | 12.49% | | | | (5.10)% | | | | 14.38% | |
| |
| Ratios/Supplemental Data: | | | | | | | | | | | | | | | | | | | | | |
| Net assets, end of period (000) | | | $118,803 | | | | | | | | $137,027 | | | | $124,480 | | | | $102,564 | | | | $147,716 | | | | $194,498 | |
| Average net assets (000) | | | $120,447 | | | | | | | | $131,155 | | | | $115,507 | | | | $123,372 | | | | $177,458 | | | | $161,815 | |
| Ratios to average net assets(c)(d): | | | | | | | | | | | | | | | | | | | | | | | | | | | | |
| Expenses after waivers and/or expense reimbursement | | | 0.78% | (e) | | | | | | | 0.76% | | | | 0.79% | | | | 0.77% | | | | 0.80% | | | | 0.77% | |
| Expenses before waivers and/or expense reimbursement | | | 0.78% | (e) | | | | | | | 0.76% | | | | 0.79% | | | | 0.77% | | | | 0.80% | | | | 0.77% | |
| Net investment income (loss) | | | 1.32% | (e) | | | | | | | 0.99% | | | | 0.70% | | | | 1.06% | | | | 0.90% | | | | 0.57% | |
| Portfolio turnover rate(f) | | | 21% | | | | | | | | 59% | | | | 49% | | | | 59% | | | | 69% | | | | 47% | |
| (a) | Calculated based on average shares outstanding during the period. |
| (b) | Total return is calculated assuming a purchase of a share on the first day and a sale on the last day of each period reported and includes reinvestment of dividends and distributions, if any. Total returns may reflect adjustments to conform to generally accepted accounting principles. Total returns for periods less than one full year are not annualized. |
| (c) | Effective October 1, 2017, class specific expenses include transfer agent fees and expenses and registration fees, which are charged to their respective share class. |
| (d) | Does not include expenses of the underlying funds in which the Series invests. |
| (f) | The Series’ portfolio turnover rate is calculated in accordance with regulatory requirements, without regard to transactions involving short term investments and certain derivatives. If such transactions were included, the Series’ portfolio turnover rate may be higher. |
See Notes to Financial Statements.
| | | | |
| PGIM Jennison Equity Opportunity Fund | | | 41 | |
Financial Highlights(unaudited) (continued)
| | | | | | | | | | | | | | | | | | | | | | | | | | | | |
| Class R6 Shares | | | | | | | | | | | | | | | | | | | | | |
| | | Six Months
Ended
March 31, | | | | | | Year Ended September 30, | | | | | | November 25, 2014(a)
through September 30, | |
| | | 2019 | | | | | | 2018 | | | 2017 | | | 2016 | | | | | | 2015 | |
| Per Share Operating Performance(b): | | | | | | | | | | | | | | | | | | | | | | | | | | | | |
| Net Asset Value, Beginning of Period | | | $21.53 | | | | | | | | $21.70 | | | | $19.80 | | | | $19.09 | | | | | | | | $22.73 | |
| Income (loss) from investment operations: | | | | | | | | | | | | | | | | | | | | | | | | | | | | |
| Net investment income (loss) | | | 0.12 | | | | | | | | 0.22 | | | | 0.17 | | | | 0.23 | | | | | | | | 0.18 | |
| Net realized and unrealized gain (loss) on investment and foreign currency transactions | | | (2.23 | ) | | | | | | | 2.52 | | | | 3.31 | | | | 2.03 | | | | | | | | (1.82 | ) |
| Total from investment operations | | | (2.11 | ) | | | | | | | 2.74 | | | | 3.48 | | | | 2.26 | | | | | | | | (1.64 | ) |
| Less Dividends and Distributions: | | | | | | | | | | | | | | | | | | | | | | | | | | | | |
| Dividends from net investment income | | | (0.15 | ) | | | | | | | (0.27 | ) | | | (0.23 | ) | | | (0.22 | ) | | | | | | | (0.10 | ) |
| Distributions from net realized gains | | | (2.62 | ) | | | | | | | (2.64 | ) | | | (1.35 | ) | | | (1.33 | ) | | | | | | | (1.90 | ) |
| Total dividends and distributions | | | (2.77 | ) | | | | | | | (2.91 | ) | | | (1.58 | ) | | | (1.55 | ) | | | | | | | (2.00 | ) |
| Net asset value, end of period | | | $16.65 | | | | | | | | $21.53 | | | | $21.70 | | | | $19.80 | | | | | | | | $19.09 | |
| Total Return(c): | | | (8.65)% | | | | | | | | 13.80% | | | | 18.21% | | | | 12.61% | | | | | | | | (7.49)% | |
| |
| Ratios/Supplemental Data: | | | | | | | | | | | | | | | | | | | | | |
| Net assets, end of period (000) | | | $17,618 | | | | | | | | $18,870 | | | | $17,438 | | | | $16,766 | | | | | | | | $16,611 | |
| Average net assets (000) | | | $17,330 | | | | | | | | $18,366 | | | | $16,981 | | | | $16,698 | | | | | | | | $17,054 | |
| Ratios to average net assets(d)(e): | | | | | | | | | | | | | | | | | | | | | | | | | | | | |
| Expenses after waivers and/or expense reimbursement | | | 0.74% | (f) | | | | | | | 0.72% | | | | 0.66% | | | | 0.66% | | | | | | | | 0.66% | (f) |
| Expenses before waivers and/or expense reimbursement | | | 0.74% | (f) | | | | | | | 0.72% | | | | 0.66% | | | | 0.66% | | | | | | | | 0.66% | (f) |
| Net investment income (loss) | | | 1.37% | (f) | | | | | | | 1.04% | | | | 0.81% | | | | 1.20% | | | | | | | | 1.01% | (f) |
| Portfolio turnover rate(g) | | | 21% | | | | | | | | 59% | | | | 49% | | | | 59% | | | | | | | | 69% | |
| (a) | Commencement of offering. |
| (b) | Calculated based on average shares outstanding during the period. |
| (c) | Total return is calculated assuming a purchase of a share on the first day and a sale on the last day of each period reported and includes reinvestment of dividends and distributions, if any. Total returns may reflect adjustments to conform to generally accepted accounting principles. Total returns for periods less than one full year are not annualized. |
| (d) | Effective October 1, 2017, class specific expenses include transfer agent fees and expenses and registration fees, which are charged to their respective share class. |
| (e) | Does not include expenses of the underlying funds in which the Series invests. |
| (g) | The Series’ portfolio turnover rate is calculated in accordance with regulatory requirements, without regard to transactions involving short term investments and certain derivatives. If such transactions were included, the Series’ portfolio turnover rate may be higher. |
See Notes to Financial Statements.
| | | | |
| | |
| ∎ MAIL | | ∎ TELEPHONE | | ∎ WEBSITE |
655 Broad Street Newark, NJ 07102 | | (800) 225-1852 | | pgiminvestments.com |
|
| PROXY VOTING |
| The Board of Directors of the Fund has delegated to the Fund’s subadviser the responsibility for voting any proxies and maintaining proxy recordkeeping with respect to the Fund. A description of these proxy voting policies and procedures is available without charge, upon request, by calling(800) 225-1852. Information regarding how the Fund voted proxies relating to portfolio securities during the most recent 12-month period ended June 30 is available on the Fund’s website and on the Securities and Exchange Commission’s website. |
|
| DIRECTORS |
| Ellen S. Alberding• Kevin J. Bannon• Scott E. Benjamin• Linda W. Bynoe• Barry H. Evans• Keith F. Hartstein• Laurie Simon Hodrick• Michael S. Hyland • Stuart S. Parker• Brian K. Reid • Grace C. Torres |
|
| OFFICERS |
| Stuart S. Parker,President• Scott E. Benjamin,Vice President• Christian J. Kelly,Treasurer and Principal Financial and Accounting Officer• Raymond A. O’Hara,Chief Legal Officer• Chad A. Earnst,Chief Compliance Officer • Dino Capasso,Deputy Chief Compliance Officer • Andrew R. French,Secretary•Jonathan D. Shain,Assistant Secretary• Claudia DiGiacomo,Assistant Secretary•Diana N. Huffman,Assistant Secretary• Peter Parrella,Assistant Treasurer• Lana Lomuti,Assistant Treasurer• Linda McMullin,Assistant Treasurer• Kelly A. Coyne,Assistant Treasurer• Charles H. Smith,Anti-Money Laundering Compliance Officer |
| | | | |
| MANAGER | | PGIM Investments LLC | | 655 Broad Street Newark, NJ 07102 |
|
| SUBADVISER | | Jennison Associates LLC | | 466 Lexington Avenue New York, NY 10017 |
|
| DISTRIBUTOR | | Prudential Investment Management Services LLC | | 655 Broad Street Newark, NJ 07102 |
|
| CUSTODIAN | | The Bank of New York Mellon | | 240 Greenwich Street New York, NY 10286 |
|
| TRANSFER AGENT | | Prudential Mutual Fund Services LLC | | PO Box 9658 Providence, RI 02940 |
|
INDEPENDENT REGISTERED
PUBLIC ACCOUNTING FIRM | | KPMG LLP | | 345 Park Avenue New York, NY 10154 |
|
| FUND COUNSEL | | Willkie Farr & Gallagher LLP | | 787 Seventh Avenue New York, NY 10019 |
|
|
| An investor should consider the investment objectives, risks, charges, and expenses of the Fund carefully before investing. The prospectus and summary prospectus contain this and other information about the Fund. An investor may obtain the prospectus and summary prospectus by visiting our website atpgiminvestments.com or by calling (800) 225-1852. The prospectus and summary prospectus should be read carefully before investing. |
|
| E-DELIVERY |
| To receive your mutual fund documents online, go topgiminvestments.com/edelivery and enroll. Instead of receiving printed documents by mail, you will receive notification via email when new materials are available. You can cancel your enrollment or change your email address at any time by visitingthe website address above. |
|
| SHAREHOLDER COMMUNICATIONS WITH DIRECTORS |
| Shareholders can communicate directly with the Board of Directors by writing to the Chair of the Board, PGIM Jennison Equity Opportunity Fund, PGIM Investments, Attn: Board of Directors, 655 Broad Street, Newark, NJ 07102. Shareholders can communicate directly with an individual Director by writing to the same address. Communications are not screened before being delivered to the addressee. |
|
| AVAILABILITY OF PORTFOLIO SCHEDULE |
| The Fund files its complete schedule of portfolio holdings with the Securities and Exchange Commission for the first and third quarters of each fiscal year on Form N-Q. The Fund’s FormsN-Q are available on the Commission’s website atsec.gov. Beginning with reporting periods on or after March 31, 2019, Form N-PORT will replace Form N-Q. Form N-PORT will be filed with the Securities and Exchange Commission quarterly, and each Fund’s full portfolio holdings as of its first and third quarters of each fiscal year will be made publicly available 60 days after the end of each quarter. The Fund’s schedule of portfolio holdings is also available on the Fund’s website as of the end of each month no sooner than 15 days after the end of the month. |
Mutual Funds:
| | | | |
| ARE NOT INSURED BY THE FDIC OR ANY FEDERAL GOVERNMENT AGENCY | | MAY LOSE VALUE | | ARE NOT A DEPOSIT OF OR GUARANTEED BY ANY BANK OR ANY BANK AFFILIATE |
PGIM JENNISON EQUITY OPPORTUNITY FUND
| | | | | | | | | | | | |
| SHARE CLASS | | A | | B | | C | | R | | Z | | R6* |
| NASDAQ | | PJIAX | | PJIBX | | PJGCX | | PJORX | | PJGZX | | PJOQX |
| CUSIP | | 74437E503 | | 74437E602 | | 74437E701 | | 74437E644 | | 74437E800 | | 74437E552 |
* Formerly known as Class Q shares.
MF172E2

PGIM JENNISON GROWTH FUND
(Formerly known as Prudential Jennison Growth Fund)
SEMIANNUAL REPORT
MARCH 31, 2019
COMING SOON: PAPERLESS SHAREHOLDER REPORTS
Beginning on January 1, 2021, as permitted by regulations adopted by the Securities and Exchange Commission, paper copies of the Fund’s annual and semiannual shareholder reports will no longer be sent by mail, unless you specifically request paper copies of the reports. Instead, the reports will be made available on the Fund’s website (pgiminvestments.com), and you will be notified by mail each time a report is posted and provided with a website link to access the report.
If you already elected to receive shareholder reports electronically, you will not be affected by this change and you need not take any action. You may elect to receive shareholder reports and other communications from the Fund electronically anytime by contacting your financial intermediary (such as a broker-dealer or bank) or, if you are a direct investor, by calling 1-800-225-1852 or by sending an email request to PGIM Investments at shareholderreports@pgim.com.
You may elect to receive all future reports in paper free of charge. If you invest through a financial intermediary, you can contact your financial intermediary or follow instructions included with this notice to elect to continue to receive paper copies of your shareholder reports. If you invest directly with the Fund, you can call 1-800-225-1852 or send an email request to shareholderreports@pgim.com to let the Fund know you wish to continue receiving paper copies of your shareholder reports. Your election to receive reports in paper will apply to all funds held in your account if you invest through your financial intermediary or all funds held with the fund complex if you invest directly with the Fund.

To enroll in e-delivery, go to pgiminvestments.com/edelivery
|
| Objective: Long-term growth of capital |
This report is not authorized for distribution to prospective investors unless preceded or accompanied by a current prospectus.
The information about the Fund’s portfolio holdings is for the period covered by this report and is subject to change thereafter.
The accompanying financial statements as of March 31, 2019 were not audited and, accordingly, no auditor’s opinion is expressed on them.
Mutual funds are distributed by Prudential Investment Management Services LLC, member SIPC. Jennison Associates is a registered investment adviser. Both are Prudential Financial companies.© 2019 Prudential Financial, Inc. and its related entities. Jennison Associates LLC, Jennison, PGIM, and the PGIM logo are service marks of Prudential Financial, Inc. and its related entities, registered in many jurisdictions worldwide.
| | |
| 2 | | Visit our website at pgiminvestments.com |
Table of Contents
| | | | |
| PGIM Jennison Growth Fund | | | 3 | |
This Page Intentionally Left Blank
Letter from the President

Dear Shareholder:
We hope you find the semiannual report for PGIM Jennison Growth Fund informative and useful. The report covers performance for the six-month period ended March 31, 2019.
We have important information to share with you. Effective June 11, 2018, Prudential Mutual Funds were renamed PGIM Funds. This renaming is
part of our ongoing effort to further build our reputation and establish our global brand, which began when our firm adopted PGIM Investments as its name in April 2017. Please note that only the Fund’s name has changed. Your Fund’s management and operation, along with its symbols, remained the same.*
Regarding your investments with PGIM, we believe it is important to maintain a diversified portfolio of funds consistent with your tolerance for risk, time horizon, and financial goals.
Your financial advisor can help you create a diversified investment plan that may include funds covering all the basic asset classes and that reflects your personal investor profile and risk tolerance. However, diversification and asset allocation strategies do not assure a profit or protect against loss in declining markets.
At PGIM Investments, we consider it a great privilege and responsibility to help investors participate in opportunities across global markets while meeting their toughest investment challenges. PGIM is a top-10 global investment manager with more than $1 trillion in assets under management. This investment expertise allows us to deliver actively managed funds and strategies to meet the needs of investors around the globe.
Thank you for choosing our family of funds.
Sincerely,

Stuart S. Parker, President
PGIM Jennison Growth Fund
May 15, 2019
*The Prudential Day One Funds did not change their names.
| | | | |
| PGIM Jennison Growth Fund | | | 5 | |
Your Fund’s Performance(unaudited)
Performance data quoted represent past performance. Past performance does not guarantee future results. The investment return and principal value of an investment will fluctuate, so that an investor’s shares, when redeemed, may be worth more or less than their original cost. Current performance may be lower or higher than the past performance data quoted. An investor may obtain performance data as of the most recent month-end by visiting our website atpgiminvestments.com or by calling (800) 225-1852.
| | | | | | | | | | |
| | |
| | | Total Returns as of 3/31/19
(without sales charges) Six Months* (%) | | Average Annual Total Returns as of 3/31/19 (with sales charges) |
| | | One Year (%) | | Five Years (%) | | Ten Years (%) | | Since Inception (%) |
| Class A | | –1.85 | | 5.14 | | 12.35 | | 16.29 | | — |
| Class B | | –2.33 | | 5.21 | | 12.63 | | 16.09 | | — |
| Class C | | –2.20 | | 9.51 | | 12.84 | | 16.15 | | — |
| Class R | | –1.98 | | 11.03 | | 13.40 | | 16.72 | | — |
| Class Z | | –1.71 | | 11.60 | | 13.97 | | 17.30 | | — |
| Class R2 | | –1.92 | | 11.19 | | N/A | | N/A | | 11.25 (11/28/17) |
| Class R4 | | –1.78 | | 11.45 | | N/A | | N/A | | 11.53 (11/28/17) |
| Class R6** | | –1.66 | | 11.78 | | N/A | | N/A | | 16.76 (9/27/17) |
| Russell 1000 Growth Index |
| | –2.34 | | 12.75 | | 13.50 | | 17.52 | | — |
| S&P 500 Index |
| | –1.72 | | 9.49 | | 10.90 | | 15.91 | | — |
| Lipper Large-Cap Growth Funds Average |
| | | –1.73 | | 11.79 | | 12.27 | | 16.20 | | — |
Source: PGIM Investments LLC and Lipper Inc.
*Not annualized.
**Formerly known as Class Q shares.
Since Inception returns are provided for any share class with less than 10 fiscal years of returns. Since Inception returns for the Indexes and the Lipper Average are measured from the closest month-end to the class’ inception date.
| | |
| 6 | | Visit our website at pgiminvestments.com |
The returns in the tables do not reflect the deduction of taxes that a shareholder would pay on Fund distributions or following the redemption of Fund shares. The average annual total returns take into account applicable sales charges, which are described for each share class in the table below.
| | | | | | | | | | | | | | | | |
| | | | | | | | | |
| | | Class A | | Class B* | | Class C | | Class R | | Class Z | | Class R2 | | Class R4 | | Class R6** |
| Maximum initial sales charge | | 5.50% of the public offering price | | None | | None | | None | | None | | None | | None | | None |
| Contingent deferred sales charge (CDSC) (as a percentage of the lower of original purchase price or net asset value at redemption) | | 1.00% on sales of $1 million or more made within 12 months of purchase | | 5.00% (Yr. 1) 4.00% (Yr. 2) 3.00% (Yr. 3) 2.00% (Yr. 4) 1.00% (Yr. 5) 1.00% (Yr. 6) 0.00% (Yr. 7) | | 1.00% on sales made within 12 months of purchase | | None | | None | | None | | None | | None |
| Annual distribution or distribution and service(12b-1) fees (shown as a percentage of average daily net assets) | | 0.30% | | 1.00% | | 1.00% | | 0.75% (0.50% currently) | | None | | 0.25% | | None | | None |
| Shareholder service fees | | None | | None | | None | | None | | None | | 0.10% | | 0.10% | | None |
*Class B shares are closed to all purchase activity and no additional Class B shares may be purchased or acquired except by exchange from Class B shares of another Fund or through dividend or capital gains reinvestment.
**Formerly known as Class Q shares.
Benchmark Definitions
Russell 1000 Growth Index—The Russell 1000 Growth Index is an unmanaged index which contains those securities in the Russell 1000 Growth Index with an above-average growth orientation. Companies in this index tend to exhibit higher price-to-book ratios and price-to-earnings ratios, lower dividend yields, and higher forecasted growth rates. The average annual total return for the Index measured from the month-end closest to the inception date of the Fund’s Class R2 and R4 shares is 11.22%, and 15.01% for Class R6 shares.
S&P 500 Index—The S&P 500 Index is an unmanaged index of over 500 stocks of large US public companies. It gives a broad look at how stock prices in the United States have performed. The average annual total return for the Index measured from the month-end closest to the inception date of the Fund’s Class R2 and R4 shares is 7.31%, and 10.32% for Class R6 shares.
| | | | |
| PGIM Jennison Growth Fund | | | 7 | |
Your Fund’s Performance(continued)
Lipper Large-Cap Growth Funds Average—The Lipper Large-Cap Growth Funds Average (Lipper Average) is based on the average return of all funds in the Lipper Large-Cap Growth Funds universe for the periods noted. Funds in the Lipper Average invest at least 75% of their equity assets in companies with market capitalizations (on a three-year weighted basis) greater than 300% of the dollar-weighted median market capitalization of the middle 1,000 securities of the S&P SuperComposite 1500 Index. The average annual total return for the Lipper Average measured from the month-end closest to the inception date of the Fund’s Class R2 and R4 shares is 11.66%, and 14.61% for Class R6 shares.
Investors cannot invest directly in an index or average. The returns for the Indexes would be lower if they included the effects of sales charges, operating expenses of a mutual fund, or taxes. Returns for the Lipper Average reflect the deduction of operating expenses, but not sales charges or taxes.
Presentation of Fund Holdings
| | | | |
|
Five Largest Holdings expressed as a
percentage of net assets as of 3/31/19 (%) | |
Amazon.com, Inc.Internet & Direct Marketing Retail | | | 6.3 | |
| Microsoft Corp.,Software | | | 4.7 | |
| Mastercard, Inc. (Class A Stock),IT Services | | | 4.0 | |
| salesforce.com, Inc.Software | | | 3.8 | |
| Netflix, Inc.Entertainment | | | 3.7 | |
Holdings reflect only long-term investments and are subject to change.
| | | | |
|
Five Largest Industries expressed as a
percentage of net assets as of 3/31/19 (%) | |
Software | | | 15.9 | |
| IT Services | | | 13.1 | |
| Interactive Media & Services | | | 12.3 | |
| Internet & Direct Marketing Retail | | | 9.1 | |
| Aerospace & Defense | | | 5.1 | |
Industry weightings reflect only long-term investments and are subject to change.
| | |
| 8 | | Visit our website at pgiminvestments.com |
Fees and Expenses(unaudited)
As a shareholder of the Fund, you incur two types of costs: (1) transaction costs, including sales charges (loads) on purchase payments and redemptions, as applicable, and (2) ongoing costs, including management fees, distribution and/or service (12b-1) fees, and other Fund expenses, as applicable. This example is intended to help you understand your ongoing costs (in dollars) of investing in the Fund and to compare these costs with the ongoing costs of investing in other mutual funds.
The example is based on an investment of $1,000 held through the six-month period ended March 31, 2019. The example is for illustrative purposes only; you should consult the Prospectus for information on initial and subsequent minimum investment requirements.
Actual Expenses
The first line for each share class in the table on the following page provides information about actual account values and actual expenses. You may use the information on this line, together with the amount you invested, to estimate the expenses that you paid over the period. Simply divide your account value by $1,000 (for example, an $8,600 account value ÷ $1,000 = 8.6), then multiply the result by the number on the first line under the heading “Expenses Paid During the Six-Month Period” to estimate the expenses you paid on your account during this period.
Hypothetical Example for Comparison Purposes
The second line for each share class in the table on the following page provides information about hypothetical account values and hypothetical expenses based on the Fund’s actual expense ratio and an assumed rate of return of 5% per year before expenses, which is not the Fund’s actual return. The hypothetical account values and expenses may not be used to estimate the actual ending account balance or expenses you paid for the period. You may use this information to compare the ongoing costs of investing in the Fund and other funds. To do so, compare this 5% hypothetical example with the 5% hypothetical examples that appear in the shareholder reports of the other funds.
The Fund’s transfer agent may charge additional fees to holders of certain accounts that are not included in the expenses shown in the table on the following page. These fees apply to individual retirement accounts (IRAs) and Section 403(b) accounts. As of the close of the six-month period covered by the table, IRA fees included an annual maintenance fee of $15 per account (subject to a maximum annual maintenance fee of $25 for all accounts held by the same shareholder). Section 403(b) accounts are charged an annual $25 fiduciary maintenance fee. Some of the fees may vary in amount, or may be waived, based on your total account balance or the number of PGIM funds, including the Fund, that you own. You should consider the additional fees that were charged to your Fund account over the six-month period when you estimate the total ongoing expenses paid over the period
| | | | |
| PGIM Jennison Growth Fund | | | 9 | |
Fees and Expenses(continued)
and the impact of these fees on your ending account value, as these additional expenses are not reflected in the information provided in the expense table. Additional fees have the effect of reducing investment returns.
Please note that the expenses shown in the table are meant to highlight your ongoing costs only and do not reflect any transactional costs such as sales charges (loads). Therefore, the second line for each share class in the table is useful in comparing ongoing costs only and will not help you determine the relative total costs of owning different funds. In addition, if these transactional costs were included, your costs would have been higher.
| | | | | | | | | | | | | | | | | | |
| | | | |
PGIM Jennison
Growth Fund | | Beginning Account
Value
October 1, 2018 | | | Ending Account
Value
March 31, 2019 | | | Annualized
Expense Ratio
Based on the
Six-Month Period | | | Expenses Paid
During the
Six-Month Period* | |
| Class A | | Actual | | $ | 1,000.00 | | | $ | 981.50 | | | | 1.02 | % | | $ | 5.04 | |
| | Hypothetical | | $ | 1,000.00 | | | $ | 1,019.85 | | | | 1.02 | % | | $ | 5.14 | |
| Class B | | Actual | | $ | 1,000.00 | | | $ | 976.70 | | | | 1.95 | % | | $ | 9.61 | |
| | Hypothetical | | $ | 1,000.00 | | | $ | 1,015.21 | | | | 1.95 | % | | $ | 9.80 | |
| Class C | | Actual | | $ | 1,000.00 | | | $ | 978.00 | | | | 1.69 | % | | $ | 8.33 | |
| | Hypothetical | | $ | 1,000.00 | | | $ | 1,016.50 | | | | 1.69 | % | | $ | 8.50 | |
| Class R | | Actual | | $ | 1,000.00 | | | $ | 980.20 | | | | 1.25 | % | | $ | 6.17 | |
| | Hypothetical | | $ | 1,000.00 | | | $ | 1,018.70 | | | | 1.25 | % | | $ | 6.29 | |
| Class Z | | Actual | | $ | 1,000.00 | | | $ | 982.90 | | | | 0.71 | % | | $ | 3.51 | |
| | Hypothetical | | $ | 1,000.00 | | | $ | 1,021.39 | | | | 0.71 | % | | $ | 3.58 | |
| Class R2 | | Actual | | $ | 1,000.00 | | | $ | 980.80 | | | | 1.10 | % | | $ | 5.43 | |
| | Hypothetical | | $ | 1,000.00 | | | $ | 1,019.45 | | | | 1.10 | % | | $ | 5.54 | |
| Class R4 | | Actual | | $ | 1,000.00 | | | $ | 982.20 | | | | 0.85 | % | | $ | 4.20 | |
| | Hypothetical | | $ | 1,000.00 | | | $ | 1,020.69 | | | | 0.85 | % | | $ | 4.28 | |
| Class R6** | | Actual | | $ | 1,000.00 | | | $ | 983.40 | | | | 0.60 | % | | $ | 2.97 | |
| | | Hypothetical | | $ | 1,000.00 | | | $ | 1,021.94 | | | | 0.60 | % | | $ | 3.02 | |
* Fund expenses (net of fee waivers or subsidies, if any) for each share class are equal to the annualized expense ratio for each share class (provided in the table), multiplied by the average account value over the period, multiplied by the 182 days in the six-month period ended March 31, 2019, and divided by the 365 days in the Fund’s fiscal year ending September 30, 2019 (to reflect the six-month period). Expenses presented in the table include the expenses of any underlying portfolios in which the Fund may invest.
**Formerly known as Class Q shares.
| | |
| 10 | | Visit our website at pgiminvestments.com |
Schedule of Investments(unaudited)
as of March 31, 2019
| | | | | | | | |
| Description | | Shares | | | Value | |
LONG-TERM INVESTMENTS 99.8% | | | | | | | | |
| | |
COMMON STOCKS | | | | | | | | |
| | |
Aerospace & Defense 5.1% | | | | | | | | |
Airbus SE (France) | | | 246,437 | | | $ | 32,691,549 | |
Boeing Co. (The) | | | 452,858 | | | | 172,729,098 | |
Safran SA (France) | | | 473,528 | | | | 65,048,790 | |
| | | | | | | | |
| | | | | | | 270,469,437 | |
| | |
Automobiles 1.7% | | | | | | | | |
Tesla, Inc.*(a) | | | 326,691 | | | | 91,427,743 | |
| | |
Banks 1.0% | | | | | | | | |
JPMorgan Chase & Co. | | | 505,095 | | | | 51,130,767 | |
| | |
Beverages 0.3% | | | | | | | | |
Constellation Brands, Inc. (Class A Stock) | | | 93,514 | | | | 16,395,810 | |
| | |
Biotechnology 4.5% | | | | | | | | |
Alexion Pharmaceuticals, Inc.* | | | 629,778 | | | | 85,133,390 | |
BioMarin Pharmaceutical, Inc.* | | | 688,016 | | | | 61,116,461 | |
Sage Therapeutics, Inc.* | | | 134,809 | | | | 21,441,371 | |
Vertex Pharmaceuticals, Inc.* | | | 389,931 | | | | 71,727,808 | |
| | | | | | | | |
| | | | | | | 239,419,030 | |
| | |
Capital Markets 1.2% | | | | | | | | |
S&P Global, Inc. | | | 298,665 | | | | 62,883,916 | |
| | |
Entertainment 3.7% | | | | | | | | |
Netflix, Inc.* | | | 548,920 | | | | 195,722,915 | |
| | |
Equity Real Estate Investment Trusts (REITs) 1.8% | | | | | | | | |
American Tower Corp. | | | 207,174 | | | | 40,825,708 | |
Crown Castle International Corp. | | | 416,047 | | | | 53,254,016 | |
| | | | | | | | |
| | | | | | | 94,079,724 | |
| | |
Food & Staples Retailing 1.9% | | | | | | | | |
Costco Wholesale Corp. | | | 429,041 | | | | 103,887,988 | |
| | |
Health Care Equipment & Supplies 3.3% | | | | | | | | |
Danaher Corp. | | | 287,119 | | | | 37,905,450 | |
See Notes to Financial Statements.
| | | | |
| PGIM Jennison Growth Fund | | | 11 | |
Schedule of Investments(unaudited) (continued)
as of March 31, 2019
| | | | | | | | |
| Description | | Shares | | | Value | |
COMMON STOCKS (Continued) | | | | | | | | |
| | |
Health Care Equipment & Supplies (cont’d.) | | | | | | | | |
Edwards Lifesciences Corp.* | | | 294,378 | | | $ | 56,323,343 | |
Intuitive Surgical, Inc.* | | | 142,572 | | | | 81,348,732 | |
| | | | | | | | |
| | | | | | | 175,577,525 | |
| | |
Health Care Providers & Services 1.0% | | | | | | | | |
UnitedHealth Group, Inc. | | | 218,220 | | | | 53,957,077 | |
| | |
Hotels, Restaurants & Leisure 2.1% | | | | | | | | |
Chipotle Mexican Grill, Inc.*(a) | | | 74,252 | | | | 52,741,938 | |
Marriott International, Inc. (Class A Stock) | | | 486,696 | | | | 60,880,803 | |
| | | | | | | | |
| | | | | | | 113,622,741 | |
| | |
Interactive Media & Services 12.3% | | | | | | | | |
Alphabet, Inc. (Class A Stock)* | | | 137,985 | | | | 162,393,167 | |
Alphabet, Inc. (Class C Stock)* | | | 138,885 | | | | 162,955,160 | |
Facebook, Inc. (Class A Stock)* | | | 895,812 | | | | 149,322,902 | |
Tencent Holdings Ltd. (China) | | | 3,895,579 | | | | 179,874,824 | |
| | | | | | | | |
| | | | | | | 654,546,053 | |
| | |
Internet & Direct Marketing Retail 9.1% | | | | | | | | |
Alibaba Group Holding Ltd. (China), ADR*(a) | | | 826,213 | | | | 150,742,562 | |
Amazon.com, Inc.* | | | 189,574 | | | | 337,583,900 | |
| | | | | | | | |
| | | | | | | 488,326,462 | |
| | |
IT Services 13.1% | | | | | | | | |
Adyen NV (Netherlands), 144A* | | | 87,759 | | | | 68,982,129 | |
FleetCor Technologies, Inc.* | | | 279,009 | | | | 68,800,829 | |
Mastercard, Inc. (Class A Stock) | | | 914,920 | | | | 215,417,914 | |
PayPal Holdings, Inc.* | | | 852,651 | | | | 88,539,280 | |
Square, Inc. (Class A Stock)*(a) | | | 842,526 | | | | 63,122,048 | |
Visa, Inc. (Class A Stock)(a) | | | 1,239,260 | | | | 193,560,019 | |
| | | | | | | | |
| | | | | | | 698,422,219 | |
| | |
Life Sciences Tools & Services 1.8% | | | | | | | | |
Illumina, Inc.*(a) | | | 311,891 | | | | 96,901,415 | |
| | |
Personal Products 1.7% | | | | | | | | |
Estee Lauder Cos., Inc. (The) (Class A Stock) | | | 557,740 | | | | 92,333,857 | |
See Notes to Financial Statements.
| | | | | | | | |
| Description | | Shares | | | Value | |
COMMON STOCKS (Continued) | | | | | | | | |
| | |
Pharmaceuticals 3.6% | | | | | | | | |
AstraZeneca PLC (United Kingdom), ADR | | | 2,490,617 | | | $ | 100,695,645 | |
Bristol-Myers Squibb Co. | | | 785,644 | | | | 37,483,075 | |
Merck & Co., Inc. | | | 670,361 | | | | 55,753,925 | |
| | | | | | | | |
| | | | | | | 193,932,645 | |
| | |
Road & Rail 1.6% | | | | | | | | |
Lyft, Inc. (Class A Stock)* | | | 30,581 | | | | 2,394,186 | |
Union Pacific Corp. | | | 495,058 | | | | 82,773,698 | |
| | | | | | | | |
| | | | | | | 85,167,884 | |
| | |
Semiconductors & Semiconductor Equipment 3.4% | | | | | | | | |
Broadcom, Inc. | | | 271,177 | | | | 81,545,636 | |
NVIDIA Corp. | | | 553,505 | | | | 99,387,358 | |
| | | | | | | | |
| | | | | | | 180,932,994 | |
| | |
Software 15.9% | | | | | | | | |
Adobe, Inc.* | | | 568,191 | | | | 151,417,219 | |
Microsoft Corp. | | | 2,118,289 | | | | 249,831,005 | |
Red Hat, Inc.* | | | 282,480 | | | | 51,609,096 | |
salesforce.com, Inc.* | | | 1,283,900 | | | | 203,331,243 | |
ServiceNow, Inc.*(a) | | | 177,205 | | | | 43,679,260 | |
Splunk, Inc.* | | | 481,331 | | | | 59,973,843 | |
Workday, Inc. (Class A Stock)* | | | 461,736 | | | | 89,045,788 | |
| | | | | | | | |
| | | | | | | 848,887,454 | |
| | |
Specialty Retail 2.0% | | | | | | | | |
Home Depot, Inc. (The) | | | 342,916 | | | | 65,802,151 | |
Lowe’s Cos., Inc. | | | 390,909 | | | | 42,792,808 | |
| | | | | | | | |
| | | | | | | 108,594,959 | |
| | |
Technology Hardware, Storage & Peripherals 2.8% | | | | | | | | |
Apple, Inc. | | | 791,333 | | | | 150,313,703 | |
| | |
Textiles, Apparel & Luxury Goods 4.9% | | | | | | | | |
Kering SA (France) | | | 136,475 | | | | 78,423,669 | |
See Notes to Financial Statements.
| | | | |
| PGIM Jennison Growth Fund | | | 13 | |
Schedule of Investments(unaudited) (continued)
as of March 31, 2019
| | | | | | | | |
| Description | | Shares | | | Value | |
COMMON STOCKS (Continued) | | | | | | | | |
| | |
Textiles, Apparel & Luxury Goods (cont’d.) | | | | | | | | |
Lululemon Athletica, Inc.* | | | 447,123 | | | $ | 73,270,046 | |
NIKE, Inc. (Class B Stock) | | | 1,289,433 | | | | 108,583,153 | |
| | | | | | | | |
| | | | | | | 260,276,868 | |
| | | | | | | | |
TOTAL LONG-TERM INVESTMENTS
(cost $2,691,757,068) | | | | | | | 5,327,211,186 | |
| | | | | | | | |
|
SHORT-TERM INVESTMENTS 8.5% | |
| | |
AFFILIATED MUTUAL FUNDS | | | | | | | | |
PGIM Core Ultra Short Bond Fund(w) | | | 29,404,297 | | | | 29,404,297 | |
PGIM Institutional Money Market Fund
(cost $426,283,187; includes $425,203,348 of cash collateral for securities on loan)(b)(w) | | | 426,289,438 | | | | 426,374,696 | |
| | | | | | | | |
TOTAL SHORT-TERM INVESTMENTS
(cost $455,687,484) | | | | | | | 455,778,993 | |
| | | | | | | | |
TOTAL INVESTMENTS 108.3%
(cost $3,147,444,552) | | | | | | | 5,782,990,179 | |
Liabilities in excess of other assets (8.3)% | | | | | | | (443,445,707 | ) |
| | | | | | | | |
NET ASSETS 100.0% | | | | | | $ | 5,339,544,472 | |
| | | | | | | | |
Below is a list of the abbreviation(s) used in the semiannual report:
144A—Security was purchased pursuant to Rule 144A under the Securities Act of 1933 and, pursuant to the requirements of Rule 144A, may not be resold except to qualified institutional buyers.
ADR—American Depositary Receipt
LIBOR—London Interbank Offered Rate
REIT(s)—Real Estate Investment Trust(s)
| * | Non-income producing security. |
| (a) | All or a portion of security is on loan. The aggregate market value of such securities, including those sold and pending settlement, is $422,649,742; cash collateral of $425,203,348 (included in liabilities) was received with which the Series purchased highly liquid short-term investments. |
| (b) | Represents security purchased with cash collateral received for securities on loan and includes dividend reinvestment. |
| (w) | PGIM Investments LLC, the manager of the Series, also serves as manager of the PGIM Core Ultra Short Bond Fund and PGIM Institutional Money Market Fund. |
Fair Value Measurements:
Various inputs are used in determining the value of the Series’ investments. These inputs are summarized in the three broad levels listed below.
Level 1—unadjusted quoted prices generally in active markets for identical securities.
See Notes to Financial Statements.
Level 2—quoted prices for similar securities, interest rates and yield curves, prepayment speeds, foreign currency exchange rates and other observable inputs.
Level 3—unobservable inputs for securities valued in accordance with Board approved fair valuation procedures.
The following is a summary of the inputs used as of March 31, 2019 in valuing such portfolio securities:
| | | | | | | | | | | | |
| | | Level 1 | | | Level 2 | | | Level 3 | |
Investments in Securities | | | | | | | | | | | | |
Common Stocks | | | | | | | | | | | | |
Aerospace & Defense | | $ | 172,729,098 | | | $ | 97,740,339 | | | $ | — | |
Automobiles | | | 91,427,743 | | | | — | | | | — | |
Banks | | | 51,130,767 | | | | — | | | | — | |
Beverages | | | 16,395,810 | | | | — | | | | — | |
Biotechnology | | | 239,419,030 | | | | — | | | | — | |
Capital Markets | | | 62,883,916 | | | | — | | | | — | |
Entertainment | | | 195,722,915 | | | | — | | | | — | |
Equity Real Estate Investment Trusts (REITs) | | | 94,079,724 | | | | — | | | | — | |
Food & Staples Retailing | | | 103,887,988 | | | | — | | | | — | |
Health Care Equipment & Supplies | | | 175,577,525 | | | | — | | | | — | |
Health Care Providers & Services | | | 53,957,077 | | | | — | | | | — | |
Hotels, Restaurants & Leisure | | | 113,622,741 | | | | — | | | | — | |
Interactive Media & Services | | | 474,671,229 | | | | 179,874,824 | | | | — | |
Internet & Direct Marketing Retail | | | 488,326,462 | | | | — | | | | — | |
IT Services | | | 629,440,090 | | | | 68,982,129 | | | | — | |
Life Sciences Tools & Services | | | 96,901,415 | | | | — | | | | — | |
Personal Products | | | 92,333,857 | | | | — | | | | — | |
Pharmaceuticals | | | 193,932,645 | | | | — | | | | — | |
Road & Rail | | | 85,167,884 | | | | — | | | | — | |
Semiconductors & Semiconductor Equipment | | | 180,932,994 | | | | — | | | | — | |
Software | | | 848,887,454 | | | | — | | | | — | |
Specialty Retail | | | 108,594,959 | | | | — | | | | — | |
Technology Hardware, Storage & Peripherals | | | 150,313,703 | | | | — | | | | — | |
Textiles, Apparel & Luxury Goods | | | 181,853,199 | | | | 78,423,669 | | | | — | |
Affiliated Mutual Funds | | | 455,778,993 | | | | — | | | | — | |
| | | | | | | | | | | | |
Total | | $ | 5,357,969,218 | | | $ | 425,020,961 | | | $ | — | |
| | | | | | | | | | | | |
Industry Classification:
The industry classification of investments and liabilities in excess of other assets shown as a percentage of net assets as of March 31, 2019 were as follows:
| | | | |
Software | | | 15.9 | % |
IT Services | | | 13.1 | |
Interactive Media & Services | | | 12.3 | |
Internet & Direct Marketing Retail | | | 9.1 | |
Affiliated Mutual Funds (8.0% represents investments purchased with collateral from securities on loan) | | | 8.5 | |
Aerospace & Defense | | | 5.1 | |
Textiles, Apparel & Luxury Goods | | | 4.9 | % |
Biotechnology | | | 4.5 | |
Entertainment | | | 3.7 | |
Pharmaceuticals | | | 3.6 | |
Semiconductors & Semiconductor Equipment | | | 3.4 | |
Health Care Equipment & Supplies | | | 3.3 | |
Technology Hardware, Storage & Peripherals | | | 2.8 | |
Hotels, Restaurants & Leisure | | | 2.1 | |
See Notes to Financial Statements.
| | | | |
| PGIM Jennison Growth Fund | | | 15 | |
Schedule of Investments(unaudited) (continued)
as of March 31, 2019
| | | | |
| Industry Classification (continued): | | | |
Specialty Retail | | | 2.0 | % |
Food & Staples Retailing | | | 1.9 | |
Life Sciences Tools & Services | | | 1.8 | |
Equity Real Estate Investment Trusts (REITs) | | | 1.8 | |
Personal Products | | | 1.7 | |
Automobiles | | | 1.7 | |
Road & Rail | | | 1.6 | |
Capital Markets | | | 1.2 | |
| | | | |
Health Care Providers & Services | | | 1.0 | % |
Banks | | | 1.0 | |
Beverages | | | 0.3 | |
| | | | |
| | | 108.3 | |
Liabilities in excess of other assets | | | (8.3 | ) |
| | | | |
| | | 100.0 | % |
| | | | |
Financial Instruments/Transactions—Summary of Offsetting and Netting Arrangements:
The Series entered into financial instruments/transactions during the reporting period that are either offset in accordance with current requirements or are subject to enforceable master netting arrangements or similar agreements that permit offsetting. The information about offsetting and related netting arrangements for financial instruments/transactions, where the legal right toset-off exists, is presented in the summary below.
Offsetting of financial instrument/transaction assets and liabilities:
| | | | | | | | | | | | |
Description | | Gross Market
Value of
Recognized
Assets/(Liabilities) | | | Collateral
Pledged/(Received)(1) | | | Net Amount | |
Securities on Loan | | $ | 422,649,742 | | | $ | (422,649,742 | ) | | $ | — | |
| | | | | | | | | | | | |
| (1) | Collateral amount disclosed by the Series is limited to the market value of financial instruments/transactions. |
See Notes to Financial Statements.
Statement of Assets & Liabilities(unaudited)
as of March 31, 2019
| | | | |
Assets | | | | |
Investments at value, including securities on loan of $422,649,742: | | | | |
Unaffiliated investments (cost $2,691,757,068) | | $ | 5,327,211,186 | |
Affiliated investments (cost $455,687,484) | | | 455,778,993 | |
Receivable for Series shares sold | | | 5,386,895 | |
Receivable for investments sold | | | 4,442,344 | |
Dividends receivable | | | 690,259 | |
Tax reclaim receivable | | | 525,659 | |
Prepaid expenses | | | 27,521 | |
| | | | |
Total Assets | | | 5,794,062,857 | |
| | | | |
| |
Liabilities | | | | |
Payable to broker for collateral for securities on loan | | | 425,203,348 | |
Payable for investments purchased | | | 16,378,783 | |
Payable for Series shares reacquired | | | 7,598,838 | |
Management fee payable | | | 2,531,243 | |
Accrued expenses and other liabilities | | | 1,820,755 | |
Distribution fee payable | | | 598,274 | |
Affiliated transfer agent fee payable | | | 387,144 | |
| | | | |
Total Liabilities | | | 454,518,385 | |
| | | | |
| |
Net Assets | | $ | 5,339,544,472 | |
| | | | |
| | | | | |
Net assets were comprised of: | | | | |
Common stock, at par | | $ | 129,815 | |
Paid-in capital in excess of par | | | 2,603,670,646 | |
Total distributable earnings (loss) | | | 2,735,744,011 | |
| | | | |
Net assets, March 31, 2019 | | $ | 5,339,544,472 | |
| | | | |
See Notes to Financial Statements.
| | | | |
| PGIM Jennison Growth Fund | | | 17 | |
Statement of Assets & Liabilities(unaudited)
as of March 31, 2019
| | | | |
Class A | | | | |
Net asset value and redemption price per share,
($1,279,645,971 ÷ 32,233,053 shares of common stock issued and outstanding) | | $ | 39.70 | |
Maximum sales charge (5.50% of offering price) | | | 2.31 | |
| | | | |
Maximum offering price to public | | $ | 42.01 | |
| | | | |
| |
Class B | | | | |
Net asset value, offering price and redemption price per share, | | | | |
($11,779,191 ÷ 378,808 shares of common stock issued and outstanding) | | $ | 31.10 | |
| | | | |
| |
Class C | | | | |
Net asset value, offering price and redemption price per share, | | | | |
($168,580,842 ÷ 5,386,671 shares of common stock issued and outstanding) | | $ | 31.30 | |
| | | | |
| |
Class R | | | | |
Net asset value, offering price and redemption price per share, | | | | |
($284,379,925 ÷ 8,235,757 shares of common stock issued and outstanding) | | $ | 34.53 | |
| | | | |
| |
Class Z | | | | |
Net asset value, offering price and redemption price per share, | | | | |
($3,423,076,316 ÷ 79,582,697 shares of common stock issued and outstanding) | | $ | 43.01 | |
| | | | |
| |
Class R2 | | | | |
Net asset value, offering price and redemption price per share, | | | | |
($3,080,569 ÷ 71,961 shares of common stock issued and outstanding) | | $ | 42.81 | |
| | | | |
| |
Class R4 | | | | |
Net asset value, offering price and redemption price per share, | | | | |
($5,144,063 ÷ 119,725 shares of common stock issued and outstanding) | | $ | 42.97 | |
| | | | |
| |
Class R6 | | | | |
Net asset value, offering price and redemption price per share, | | | | |
($163,857,595 ÷ 3,806,074 shares of common stock issued and outstanding) | | $ | 43.05 | |
| | | | |
See Notes to Financial Statements.
Statement of Operations(unaudited)
Six Months Ended March 31, 2019
| | | | |
Net Investment Income (Loss) | | | | |
Income | | | | |
Unaffiliated dividend income (net of $76,304 foreign withholding tax) | | $ | 20,249,972 | |
Income from securities lending, net (including affiliated income of $359,267) | | | 423,637 | |
Affiliated dividend income | | | 360,275 | |
| | | | |
Total income | | | 21,033,884 | |
| | | | |
| |
Expenses | | | | |
Management fee | | | 14,076,544 | |
Distribution fee(a) | | | 3,741,469 | |
Shareholder servicing fees(a) | | | 5,168 | |
Transfer agent’s fees and expenses (including affiliated expense of $1,006,209)(a) | | | 3,171,756 | |
Custodian and accounting fees | | | 193,161 | |
Registration fees(a) | | | 116,777 | |
Shareholders’ reports | | | 90,994 | |
Directors’ fees | | | 54,189 | |
Legal fees and expenses | | | 21,129 | |
Audit fee | | | 12,516 | |
Miscellaneous | | | 47,007 | |
| | | | |
Total expenses | | | 21,530,710 | |
Less: Fee waiver and/or expense reimbursement(a) | | | (30,454 | ) |
Distribution fee waiver(a) | | | (358,762 | ) |
| | | | |
Net expenses | | | 21,141,494 | |
| | | | |
Net investment income (loss) | | | (107,610 | ) |
| | | | |
| |
Realized And Unrealized Gain (Loss) On Investment And Foreign Currency Transactions | | | | |
Net realized gain (loss) on: | | | | |
Investment transactions (including affiliated of $(9,303)) | | | 128,551,893 | |
Foreign currency transactions | | | (11,477 | ) |
| | | | |
| | | 128,540,416 | |
| | | | |
Net change in unrealized appreciation (depreciation) on: | | | | |
Investments (including affiliated of $56,015) | | | (228,521,374 | ) |
Foreign currencies | | | (16,744 | ) |
| | | | |
| | | (228,538,118 | ) |
| | | | |
Net gain (loss) on investment and foreign currency transactions | | | (99,997,702 | ) |
| | | | |
Net Increase (Decrease) In Net Assets Resulting From Operations | | $ | (100,105,312 | ) |
| | | | |
See Notes to Financial Statements.
| | | | |
| PGIM Jennison Growth Fund | | | 19 | |
Statement of Operations(unaudited)
Six Months Ended March 31, 2019
| (a) | Class specific expenses and waivers were as follows: |
| | | | | | | | | | | | | | | | | | | | | | | | | | | | | | | | |
| | | Class A | | | Class B | | | Class C | | | Class R | | | Class Z | | | Class R2 | | | Class R4 | | | Class R6 | |
Distribution fee | | | 1,802,108 | | | | 61,504 | | | | 792,859 | | | | 1,076,286 | | | | — | | | | 8,712 | | | | — | | | | — | |
Shareholder servicing fees | | | — | | | | — | | | | — | | | | — | | | | — | | | | 3,485 | | | | 1,683 | | | | — | |
Transfer agent’s fees and expenses | | | 827,779 | | | | 34,331 | | | | 73,011 | | | | 226,722 | | | | 2,005,836 | | | | 2,698 | | | | 741 | | | | 638 | |
Registration fees | | | 14,894 | | | | 7,640 | | | | 9,492 | | | | 8,281 | | | | 53,029 | | | | 7,978 | | | | 7,978 | | | | 7,485 | |
Fee waiver and/or expense reimbursement | | | — | | | | (19,389 | ) | | | — | | | | — | | | | — | | | | (4,801 | ) | | | (6,004 | ) | | | (260 | ) |
Distribution fee waiver | | | — | | | | — | | | | — | | | | (358,762 | ) | | | — | | | | — | | | | — | | | | — | |
See Notes to Financial Statements.
Statements of Changes in Net Assets(unaudited)
| | | | | | | | |
| | |
| | | Six Months Ended March 31, 2019 | | | Year
Ended
September 30, 2018 | |
Increase (Decrease) in Net Assets | | | | | | | | |
Operations | | | | | | | | |
Net investment income (loss) | | $ | (107,610 | ) | | $ | (5,009,087 | ) |
Net realized gain (loss) on investment and foreign currency transactions | | | 128,540,416 | | | | 285,138,939 | |
Net change in unrealized appreciation (depreciation) on investments and foreign currencies | | | (228,538,118 | ) | | | 867,670,610 | |
| | | | | | | | |
Net increase (decrease) in net assets resulting from operations | | | (100,105,312 | ) | | | 1,147,800,462 | |
| | | | | | | | |
| | |
Dividends and Distributions | | | | | | | | |
Distributions from distributable earnings* | | | | | | | | |
Class A | | | (63,605,883 | ) | | | — | |
Class B | | | (870,716 | ) | | | — | |
Class C | | | (10,461,165 | ) | | | — | |
Class R | | | (17,477,511 | ) | | | — | |
Class Z | | | (156,200,557 | ) | | | — | |
Class R2 | | | (345,321 | ) | | | — | |
Class R4 | | | (225,237 | ) | | | — | |
Class R6 | | | (5,871,697 | ) | | | — | |
| | | | | | | | |
| | | (255,058,087 | ) | | | — | |
| | | | | | | | |
Distributions from net realized gains | | | | | | | | |
Class A | | | | | | | (66,625,885 | ) |
Class B | | | | | | | (1,079,287 | ) |
Class C | | | | | | | (8,851,870 | ) |
Class R | | | | | | | (20,922,621 | ) |
Class Z | | | | | | | (149,280,992 | ) |
Class R2 | | | | | | | (513 | ) |
Class R4 | | | | | | | (513 | ) |
Class R6 | | | | | | | (1,587,854 | ) |
| | | | | | | | |
| | | * | | | | (248,349,535 | ) |
| | | | | | | | |
See Notes to Financial Statements.
| | | | |
| PGIM Jennison Growth Fund | | | 21 | |
Statements of Changes in Net Assets(unaudited) (continued)
| | | | | | | | |
| | |
| | | Six Months
Ended March 31, 2019 | | | Year
Ended
September 30, 2018 | |
Series share transactions (Net of share conversions) | | | | | | | | |
Net proceeds from shares sold | | $ | 611,969,732 | | | $ | 1,268,939,950 | |
Net asset value of shares issued in reinvestment of dividends and distributions | | | 237,544,907 | | | | 227,094,847 | |
Cost of shares reacquired | | | (660,611,646 | ) | | | (1,269,258,668 | ) |
| | | | | | | | |
Net increase (decrease) in net assets from Series share transactions | | | 188,902,993 | | | | 226,776,129 | |
| | | | | | | | |
Total increase (decrease) | | | (166,260,406 | ) | | | 1,126,227,056 | |
| | |
Net Assets: | | | | | | | | |
Beginning of period | | | 5,505,804,878 | | | | 4,379,577,822 | |
| | | | | | | | |
End of period(a) | | $ | 5,339,544,472 | | | $ | 5,505,804,878 | |
| | | | | | | | |
(a) Includes undistributed/(distributions in excess of) net investment income of: | | $ | * | | | $ | 1,625,164 | |
| | | | | | | | |
| * | For the period ended March 31, 2019, the disclosures have been revised to reflect revisions to RegulationS-X adopted by the SEC in 2018 (refer to Note 9). |
See Notes to Financial Statements.
Notes to Financial Statements(unaudited)
The Prudential Investment Portfolios, Inc. (the “Company”) is registered under the Investment Company Act of 1940, as amended (“1940 Act”), as anopen-end management investment company. The Company consists of six series: PGIM Balanced Fund, PGIM Jennison Equity Opportunity Fund and PGIM Jennison Growth Fund, each of which are diversified funds and PGIM Conservative Allocation Fund, PGIM Moderate Allocation Fund and PGIM Growth Allocation Fund, each of which arenon-diversified funds for purposes of the 1940 Act and may invest a greater percentage of their assets in the securities of a single company or other issuer than a diversified fund. Investing in anon-diversified fund involves greater risk than investing in a diversified fund because a loss resulting from the decline in value of any one security may represent a greater portion of the total assets of anon-diversified fund. These financial statements relate only to the PGIM Jennison Growth Fund (the “Series”).
The investment objective of the Series is to achieve long-term growth of capital.
1. Accounting Policies
The Series follows the investment company accounting and reporting guidance of the Financial Accounting Standards Board (“FASB”) Accounting Standard Codification (“ASC”) Topic 946 Financial Services—Investment Companies.The following accounting policies conform to U.S. generally accepted accounting principles. The Series consistently follows such policies in the preparation of its financial statements.
Securities Valuation:The Series holds securities and other assets and liabilities that are fair valued at the close of each day (generally, 4:00 PM Eastern time) the New York Stock Exchange (“NYSE”) is open for trading. Fair value is the price that would be received to sell an asset or paid to transfer a liability in an orderly transaction between market participants on the measurement date. The Company’s Board of Directors (the “Board”) has adopted valuation procedures for security valuation under which fair valuation responsibilities have been delegated to PGIM Investments LLC (“PGIM Investments” or the “Manager”). Pursuant to the Board’s delegation, the Manager has established a Valuation Committee responsible for supervising the fair valuation of portfolio securities and other assets and liabilities. The valuation procedures permit the Series to utilize independent pricing vendor services, quotations from market makers, and alternative valuation methods when market quotations are either not readily available or not deemed representative of fair value. A record of the Valuation Committee’s actions is subject to the Board’s review, approval, and ratification at its next regularly scheduled quarterly meeting.
For the fiscal reportingperiod-end, securities and other assets and liabilities were fair valued at the close of the last U.S. business day. Trading in certain foreign securities may occur when the NYSE is closed (including weekends and holidays). Because such foreign
| | | | |
| PGIM Jennison Growth Fund | | | 23 | |
Notes to Financial Statements(unaudited) (continued)
securities trade in markets that are open on weekends and U.S. holidays, the values of some of the Series’ foreign investments may change on days when investors cannot purchase or redeem Series shares.
Various inputs determine how the Series’ investments are valued, all of which are categorized according to the three broad levels (Level 1, 2, or 3) detailed in the Schedule of Investments and referred to herein as the “fair value hierarchy” in accordance with FASB ASC Topic 820—Fair Value Measurements and Disclosures.
Common and preferred stocks, exchange-traded funds, and derivative instruments, such as futures or options, that are traded on a national securities exchange are valued at the last sale price as of the close of trading on the applicable exchange where the security principally trades. Securities traded via NASDAQ are valued at the NASDAQ official closing price. To the extent these securities are valued at the last sale price or NASDAQ official closing price, they are classified as Level 1 in the fair value hierarchy. In the event that no sale or official closing price on valuation date exists, these securities are generally valued at the mean between the last reported bid and ask prices, or at the last bid price in the absence of an ask price. These securities are classified as Level 2 in the fair value hierarchy.
Foreign equities traded on foreign securities exchanges are generally valued using pricing vendor services that provide model prices derived using adjustment factors based on information such as local closing price, relevant general and sector indices, currency fluctuations, depositary receipts, and futures, as applicable. Securities valued using such model prices are classified as Level 2 in the fair value hierarchy. The models generate an evaluated adjustment factor for each security, which is applied to the local closing price to adjust it for post closing market movements up to the time the Series is valued. Utilizing that evaluated adjustment factor, the vendor provides an evaluated price for each security. If the vendor does not provide an evaluated price, securities are valued in accordance with exchange-traded common and preferred stock valuation policies discussed above.
Investments inopen-end,non-exchange-traded mutual funds are valued at their net asset values as of the close of the NYSE on the date of valuation. These securities are classified as Level 1 in the fair value hierarchy since they may be purchased or sold at their net asset values on the date of valuation.
Securities and other assets that cannot be priced according to the methods described above are valued based on pricing methodologies approved by the Board. In the event that unobservable inputs are used when determining such valuations, the securities will be classified as Level 3 in the fair value hierarchy.
When determining the fair value of securities, some of the factors influencing the valuation include: the nature of any restrictions on disposition of the securities; assessment of the general liquidity of the securities; the issuer’s financial condition and the markets in which it does business; the cost of the investment; the size of the holding and the capitalization of the issuer; the prices of any recent transactions or bids/offers for such securities or any comparable securities; any available analyst media or other reports or information deemed reliable by the Manager regarding the issuer or the markets or industry in which it operates. Using fair value to price securities may result in a value that is different from a security’s most recent closing price and from the price used by other unaffiliated mutual funds to calculate their net asset values.
Illiquid Securities:Pursuant to Rule22e-4 under the 1940 Act, the Series has adopted a Board approved Liquidity Risk Management Program (“LRMP”) that requires, among other things, that the Series limit its illiquid investments that are assets to no more than 15% of net assets. Illiquid securities are those that, because of the absence of a readily available market or due to legal or contractual restrictions on resale, may not reasonably be expected to be sold or disposed of in current market conditions in seven calendar days or less without the sale or disposition significantly changing the market value of the investment. The Series may find it difficult to sell illiquid securities at the time considered most advantageous by its Subadviser and may incur transaction costs that would not be incurred in the sale of securities that were freely marketable.
Restricted Securities:Securities acquired in unregistered, private sales from the issuing company or from an affiliate of the issuer are considered restricted as to disposition under federal securities law (“restricted securities”). Such restricted securities are valued pursuant to the valuation procedures noted above. Restricted securities that would otherwise be considered illiquid investments pursuant to the Series’ LRMP because of legal restrictions on resale to the general public may be traded among qualified institutional buyers under Rule 144A of the Securities Act of 1933. Therefore, these Rule 144A securities, as well as commercial paper that is sold in private placements under Section 4(2) of the Securities Act of 1933, may be classified higher than “illiquid” under the LRMP (i.e. “moderately liquid” or “less liquid” investments). However, the liquidity of the Series’ investments in restricted securities could be impaired if trading does not develop or declines.
Foreign Currency Translation:The books and records of the Series are maintained in U.S. dollars. Foreign currency amounts are translated into U.S. dollars on the following basis:
(i) market value of investment securities, other assets and liabilities—at the current rates of exchange;
(ii) purchases and sales of investment securities, income and expenses—at the rates of exchange prevailing on the respective dates of such transactions.
Although the net assets of the Series are presented at the foreign exchange rates and market values at the close of the period, the Series does not generally isolate that portion of
| | | | |
| PGIM Jennison Growth Fund | | | 25 | |
Notes to Financial Statements(unaudited) (continued)
the results of operations arising as a result of changes in the foreign exchange rates from the fluctuations arising from changes in the market prices of long-term portfolio securities held at the end of the period. Similarly, the Series does not isolate the effect of changes in foreign exchange rates from the fluctuations arising from changes in the market prices of long-term portfolio securities sold during the period. Accordingly, holding period realized foreign currency gains (losses) are included in the reported net realized gains (losses) on investment transactions.
Net realized gains (losses) on foreign currency transactions represent net foreign exchange gains (losses) from the disposition of holdings of foreign currencies, currency gains (losses) realized between the trade and settlement dates on securities transactions, and the difference between the amounts of interest, dividends and foreign withholding taxes recorded on the Series’ books and the U.S. dollar equivalent amounts actually received or paid. Net unrealized currency gains (losses) arise from valuing foreign currency denominated assets and liabilities (other than investments) at period end exchange rates.
Master Netting Arrangements:The Company, on behalf of the Series,is subject to various Master Agreements, or netting arrangements, with select counterparties. These are agreements which a Subadviser may have negotiated and entered into on behalf of the Series. A master netting arrangement between the Series and the counterparty permits the Series to offset amounts payable by the Series to the same counterparty against amounts to be received; and by the receipt of collateral from the counterparty by the Series to cover the Series’ exposure to the counterparty. However, there is no assurance that such mitigating factors are easily enforceable. In addition to master netting arrangements, the right toset-off exists when all the conditions are met such that each of the parties owes the other determinable amounts, the reporting party has the right toset-off the amount owed with the amount owed by the other party, the reporting party intends toset-off and the right ofset-off is enforceable by law. During the reporting period, there was no intention to settle on a net basis and all amounts are presented on a gross basis on the Statement of Assets and Liabilities.
Securities Lending:The Series lends its portfolio securities to banks and broker-dealers. The loans are secured by collateral at least equal to the market value of the securities loaned. Collateral pledged by each borrower is invested in an affiliated money market fund and is marked to market daily, based on the previous day’s market value, such that the value of the collateral exceeds the value of the loaned securities. In the event of significant appreciation in value of securities on loan on the last business day of the reporting period, the financial statements may reflect a collateral value that is less than the market value of the loaned securities. Such shortfall is remedied as described above. Loans are subject to termination at the option of the borrower or the Series. Upon termination of the loan, the borrower will return to the Series securities identical to the loaned securities. Should the borrower of the
securities fail financially, the Series has the right to repurchase the securities in the open market using the collateral.
The Series recognizes income, net of any rebate and securities lending agent fees, for lending its securities in the form of fees or interest on the investment of any cash received as collateral. The borrower receives all interest and dividends from the securities loaned and such payments are passed back to the lender in amounts equivalent thereto. The Series also continues to recognize any unrealized gain (loss) in the market price of the securities loaned and on the change in the value of the collateral invested that may occur during the term of the loan. In addition, realized gain (loss) is recognized on changes in the value of the collateral invested upon liquidation of the collateral. Net earnings from securities lending are disclosed on the Statement of Operations as “Income from securities lending, net”.
Equity and Mortgage Real Estate Investment Trusts (collectively equity REITs):The Series invests in equity REITs, which report information on the source of their distributions annually. Based on current and historical information, a portion of distributions received from equity REITs during the period is estimated to be dividend income, capital gain or return of capital and recorded accordingly. When material, these estimates are adjusted periodically when the actual source of distributions is disclosed by the equity REITs.
Securities Transactions and Net Investment Income:Securities transactions are recorded on the trade date. Realized gains (losses) from investment and currency transactions are calculated on the specific identification method. Dividend income is recorded on theex-date, or for certain foreign securities, when the Series becomes aware of such dividends. Expenses are recorded on an accrual basis, which may require the use of certain estimates by management that may differ from actual. Net investment income or loss (other than class specific expenses and waivers, which are allocated as noted below) and unrealized and realized gains (losses) are allocated daily to each class of shares based upon the relative proportion of adjusted net assets of each class at the beginning of the day. Class specific expenses and waivers, where applicable, are charged to the respective share classes. Class specific expenses include distribution fees and distribution fee waivers, shareholder servicing fees, transfer agent’s fees and expenses, registration fees and fee waivers and/or expense reimbursements, as applicable.
Taxes:It is the Series’ policy to continue to meet the requirements of the Internal Revenue Code applicable to regulated investment companies and to distribute all of its taxable net investment income and capital gains, if any, to its shareholders. Therefore, no federal income tax provision is required. Withholding taxes on foreign dividends, interest and capital gains, if any, are recorded, net of reclaimable amounts, at the time the related income is earned.
Dividends and Distributions:The Series expects to pay dividends from net investment income and distributions from net realized capital and currency gains, if any, annually. Dividends and distributions to shareholders, which are determined in accordance with federal income tax regulations and which may differ from generally accepted accounting
| | | | |
| PGIM Jennison Growth Fund | | | 27 | |
Notes to Financial Statements(unaudited) (continued)
principles, are recorded on theex-date. Permanent book/tax differences relating to income and gain (loss) are reclassified amongst total distributable earnings (loss) andpaid-in capital in excess of par, as appropriate.
Estimates:The preparation of financial statements requires management to make estimates and assumptions that affect the reported amounts and disclosures in the financial statements. Actual results could differ from those estimates.
2. Agreements
The Company, on behalf of the Series, has a management agreement with PGIM Investments. Pursuant to this agreement, PGIM Investments has responsibility for all investment advisory services and supervises the Subadviser’s performance of such services. In addition, under the management agreement, PGIM Investments provides all of the administrative functions necessary for the organization, operation and management of the Series. PGIM Investments administers the corporate affairs of the Series and, in connection therewith, furnishes the Series with office facilities, together with those ordinary clerical and bookkeeping services which are not being furnished by the Series’ custodian and the Series’ transfer agent. PGIM Investments is also responsible for the staffing and management of dedicated groups of legal, marketing, compliance and related personnel necessary for the operation of the Series. The legal, marketing, compliance and related personnel are also responsible for the management and oversight of the various service providers to the Series, including, but not limited to, the custodian, transfer agent, and accounting agent.
PGIM Investments has entered into a subadvisory agreement with Jennison Associates LLC (“Jennison”). The subadvisory agreement provides that Jennison will furnish investment advisory services in connection with the management of the Series. In connection therewith, Jennison is obligated to keep certain books and records of the Series. PGIM Investments pays for the services of Jennison, the cost of compensation of officers of the Series, occupancy and certain clerical and bookkeeping costs of the Series. The Series bears all other costs and expenses.
The management fee paid to the Manager is accrued daily and payable monthly at an annual rate of 0.60% of the Series’ average daily net assets up to $300 million, 0.575% of the average daily net assets on the next $2.7 billion and 0.55% of the average daily net assets in excess of $3 billion. The effective management fee rate before any waivers and/or expense reimbursements was 0.57% for the six months ended March 31, 2019.
The Manager has contractually agreed, through January 31, 2020, to limit total annual operating expenses after fee waivers and/or expense reimbursements to 1.95% of average daily net assets for Class B shares and 0.60% of average daily net assets for Class R6
shares. Separately, the Manager has contractually agreed, through January 31, 2020, to limit transfer agency, shareholder servicing,sub-transfer agency, and blue sky fees, as applicable, to the extent that such fees cause the total annual operating expenses to exceed 1.10% of average daily net assets for Class R2 shares or 0.85% of average daily net assets for Class R4 shares. The contractual waiver and expense limitation excludes interest, brokerage, taxes (such as income and foreign withholding taxes, stamp duty and deferred tax expenses), acquired fund fees and expenses, and certain other Series expenses such as dividend and interest expense and broker charges on short sales. Expenses waived/reimbursed by the Manager in accordance with this agreement may be recouped by the Manager within the same fiscal year during which such wavier/reimbursement is made if such recoupment can be realized without exceeding the expense limit in effect at the time of the recoupment for that fiscal year.
Where applicable, the Manager agrees to waive management fees or shared operating expenses on any share class to the same extent that it waives similar expenses on any other share class. In addition, total annual operating expenses for Class R6 shares will not exceed total annual operating expenses for Class Z shares. Fees and/or expenses waived and/or reimbursed by PGIM Investments may be recouped by PGIM Investments within the same fiscal year during which such waiver and/or reimbursement is made if such recoupment can be realized without exceeding the expense limit in effect at the time of the recoupment for that fiscal year.
The Company, on behalf of the Series, has a distribution agreement with Prudential Investment Management Services LLC (“PIMS”), which acts as the distributor of the Class A, Class B, Class C, Class R, Class Z, Class R2, Class R4 and Class R6 shares of the Series. The Series compensates PIMS for distributing and servicing the Series’ Class A, Class B, Class C, Class R and Class R2 shares, pursuant to the plans of distribution (the “Distribution Plans”), regardless of expenses actually incurred by PIMS. The distribution fees are accrued daily and payable monthly. No distribution or service fees are paid to PIMS as distributor of the Class Z, Class R4 and Class R6 shares of the Series.
Pursuant to the Distribution Plans, the Series compensates PIMS for distribution related activities at an annual rate of up to 0.30%, 1%, 1%, 0.75% and 0.25% of the average daily net assets of the Class A, Class B, Class C, Class R and Class R2 shares, respectively. PIMS has contractually agreed through January 31, 2020 to limit such fees to 0.50% of the average daily net assets of the Class R shares.
The Fund has adopted a Shareholder Services Plan with respect to Class R2 and Class R4 shares. Under the terms of the Shareholder Services Plan, Class R2 and Class R4 shares are authorized to pay to Prudential Mutual Fund Services LLC (“PMFS”), its affiliates or third-party service providers, as compensation for services rendered to the shareholders of such Class R2 or Class R4 shares, a shareholder service fee at an annual rate of 0.10% of the average daily net assets attributable to Class R2 and Class R4 shares. The shareholder service fee is accrued daily and paid monthly.
| | | | |
| PGIM Jennison Growth Fund | | | 29 | |
Notes to Financial Statements(unaudited) (continued)
For the reporting period ended March 31, 2019, PIMS received $638,827 infront-end sales charges resulting from sales of Class A shares. Additionally, for the reporting period ended March 31, 2019, PIMS received $321, $2,009 and $10,657 in contingent deferred sales charges imposed upon redemptions by certain Class A, Class B and Class C shareholders, respectively. From these fees, PIMS paid such sales charges to broker-dealers, who in turn paid commissions to salespersons and incurred other distribution costs.
PGIM Investments, PIMS and Jennison are indirect, wholly-owned subsidiaries of Prudential Financial, Inc. (“Prudential”).
3. Other Transactions with Affiliates
PMFS serves as the Series’ transfer agent. Transfer agent’s fees and expenses in the Statement of Operations include certainout-of-pocket expenses paid tonon-affiliates, where applicable.
The Series may enter into certain securities purchase or sale transactions under Board approved Rule17a-7 procedures. Rule17a-7 is an exemptive rule under the 1940 Act, that subject to certain conditions, permits purchase and sale transactions among affiliated investment companies, or between an investment company and a person that is affiliated solely by reason of having a common (or affiliated) investment adviser, common directors, and/or common officers. Pursuant to the Rule17a-7 procedures and consistent with guidance issued by the SEC, the Series’ Chief Compliance Officer (“CCO”) prepares a quarterly summary of all such transactions for submission to the Board, together with the CCO’s written representation that all such17a-7 transactions were effected in accordance with the Series’ Rule17a-7 procedures. Any17a-7 transactions for the reporting period are disclosed in the “Portfolio Securities” note, below.
The Series may invest its overnight sweep cash in the PGIM Core Ultra Short Bond Fund (the “Core Fund”), and its securities lending cash collateral in the PGIM Institutional Money Market Fund (the “Money Market Fund”), each a series of Prudential Investment Portfolios 2, registered under the 1940 Act and managed by PGIM Investments. Through the Series’ investments in the mentioned underlying funds, PGIM Investments and/or its affiliates are paid fees or reimbursed for providing their services. Earnings from the Core Fund and Money Market Fund are disclosed on the Statement of Operations as “Affiliated dividend income” and “Income from securities lending, net”, respectively.
4. Portfolio Securities
The aggregate cost of purchases and proceeds from sales of portfolio securities (excluding short-term investments and U.S. Government securities) for the reporting period ended March 31, 2019, were $1,110,717,990 and $1,180,152,878, respectively.
A summary of the cost of purchases and proceeds from sales of shares of affiliated investments for the reporting period ended March 31, 2019, is presented as follows:
| | | | | | | | | | | | | | | | | | | | | | | | | | | | | | |
Value,
Beginning
of Period | | | Cost of
Purchases | | | Proceeds
from Sales | | | Change in
Unrealized
Gain
(Loss) | | | Realized
Gain
(Loss) | | | Value, End
of Period | | | Shares,
End of
Period | | | Income | |
| | PGIM Core Ultra Short Bond Fund* | | | | | | | | | | | | | |
| $ | 5,045,251 | | | $ | 511,121,719 | | | $ | 486,762,673 | | | $ | — | | | $ | — | | | $ | 29,404,297 | | | | 29,404,297 | | | $ | 360,275 | |
| | PGIM Institutional Money Market Fund* | | | | | | | | | | | | | |
| | 181,854,068 | | | | 1,876,179,515 | | | | 1,631,705,599 | | | | 56,015 | | | | (9,303 | ) | | | 426,374,696 | | | | 426,289,438 | | | | 359,267 | ** |
| | | | | | | | | | | | | | | | | | | | | | | | | | | | | | |
| $ | 186,899,319 | | | $ | 2,387,301,234 | | | $ | 2,118,468,272 | | | $ | 56,015 | | | $ | (9,303 | ) | | $ | 455,778,993 | | | | | | | $ | 719,542 | |
| | | | | | | | | | | | | | | | | | | | | | | | | | | | | | |
| * | The Fund did not have any capital gain distributions during the reporting period. |
| ** | This amount is included in “Income from securities lending, net” on the Statement of Operations. |
For the reporting period ended March 31, 2019, no17a-7 transactions were entered into by the Series.
5. Tax Information
The United States federal income tax basis of the Series’ investments and the net unrealized appreciation as of March 31, 2019 were as follows:
| | | | |
Tax Basis | | $ | 3,164,932,279 | |
| | | | |
Gross Unrealized Appreciation | | | 2,632,845,894 | |
Gross Unrealized Depreciation | | | (14,787,994 | ) |
| | | | |
Net Unrealized Appreciation | | $ | 2,618,057,900 | |
| | | | |
The book basis may differ from tax basis due to certaintax-related adjustments.
The Manager has analyzed the Series’ tax positions taken on federal, state and local income tax returns for all open tax years and has concluded that no provision for income tax is required in the Series’ financial statements for the current reporting period. The Series’ federal, state and local income and federal excise tax returns for tax years for which the applicable statutes of limitations have not expired are subject to examination by the Internal Revenue Service and state departments of revenue.
| | | | |
| PGIM Jennison Growth Fund | | | 31 | |
Notes to Financial Statements(unaudited) (continued)
6. Capital and Ownership
The Series offers Class A, Class B, Class C, Class R, Class Z, Class R2, Class R4 and Class R6 shares. Class A shares are sold with a maximumfront-end sales charge of 5.50%. Investors who purchase $1 million or more of Class A shares and sell these shares within 12 months of purchase are subject to a contingent deferred sales charge (“CDSC”) of 1%, although they are not subject to an initial sales charge. The Class A CDSC is waived for certain retirement and/or benefit plans. A special exchange privilege is also available for shareholders who qualified to purchase Class A shares at net asset value. Class B shares are sold with a CDSC which declines from 5% to zero depending on the period of time the shares are held. Class B shares will automatically convert to Class A shares on a quarterly basis approximately seven years after purchase. Class B shares are closed to new purchases. Class C shares are sold with a CDSC of 1% on sales made within 12 months of purchase. Class C shares will automatically convert to Class A shares on a monthly basis approximately 10 years after purchase. Class R, Class Z, Class R2, Class R4 and Class R6 shares are not subject to any sales or redemption charge and are available exclusively for sale to a limited group of investors.
Under certain circumstances, an exchange may be made from specified share classes of the Series to one or more other share classes of the Series as presented in the table of transactions in shares of common stock.
The Company is authorized to issue 6.625 billion shares of common stock at $0.001 par value per shares. There are 1.897 billion shares authorized for the Series equally divided into nine classes, designated Class A, Class B, Class C, Class R, Class Z, Class T, Class R2, Class R4 and Class R6 common stock, each of which consists of 125 million, 2 million, 25 million, 220 million, 825 million, 50 million, 125 million, 250 million and 275 million authorized shares, respectively. The Series currently does not have any Class T shares outstanding.
At reporting period end, four shareholders of record, each holding greater than 5% of the Series, held 39% of the Series’ outstanding shares.
Transactions in shares of common stock were as follows:
| | | | | | | | |
Class A | | Shares | | | Amount | |
Six months ended March 31, 2019: | | | | | | | | |
Shares sold | | | 1,763,183 | | | $ | 65,213,825 | |
Shares issued in reinvestment of dividends and distributions | | | 1,708,729 | | | | 60,420,650 | |
Shares reacquired | | | (2,800,019 | ) | | | (104,398,243 | ) |
| | | | | | | | |
Net increase (decrease) in shares outstanding before conversion | | | 671,893 | | | | 21,236,232 | |
Shares issued upon conversion from other share class(es) | | | 152,675 | | | | 5,621,567 | |
Shares reacquired upon conversion into other share class(es) | | | (136,492 | ) | | | (5,233,782 | ) |
| | | | | | | | |
Net increase (decrease) in shares outstanding | | | 688,076 | | | $ | 21,624,017 | |
| | | | | | | | |
Year ended September 30, 2018: | | | | | | | | |
Shares sold | | | 3,668,460 | | | $ | 143,790,471 | |
Shares issued in reinvestment of dividends and distributions | | | 1,741,872 | | | | 62,880,435 | |
Shares reacquired | | | (5,696,257 | ) | | | (221,418,042 | ) |
| | | | | | | | |
Net increase (decrease) in shares outstanding before conversion | | | (285,925 | ) | | | (14,747,136 | ) |
Shares issued upon conversion from other share class(es) | | | 242,026 | | | | 9,786,909 | |
Shares reacquired upon conversion into other share class(es) | | | (492,672 | ) | | | (19,589,924 | ) |
| | | | | | | | |
Net increase (decrease) in shares outstanding | | | (536,571 | ) | | $ | (24,550,151 | ) |
| | | | | | | | |
Class B | | | | | | |
Six months ended March 31, 2019: | | | | | | | | |
Shares sold | | | 19,155 | | | $ | 577,439 | |
Shares issued in reinvestment of dividends and distributions | | | 30,394 | | | | 844,045 | |
Shares reacquired | | | (28,850 | ) | | | (840,375 | ) |
| | | | | | | | |
Net increase (decrease) in shares outstanding before conversion | | | 20,699 | | | | 581,109 | |
Shares reacquired upon conversion into other share class(es) | | | (69,586 | ) | | | (1,991,837 | ) |
| | | | | | | | |
Net increase (decrease) in shares outstanding | | | (48,887 | ) | | $ | (1,410,728 | ) |
| | | | | | | | |
Year ended September 30, 2018: | | | | | | | | |
Shares sold | | | 49,713 | | | $ | 1,556,708 | |
Shares issued in reinvestment of dividends and distributions | | | 35,853 | | | | 1,041,541 | |
Shares reacquired | | | (63,054 | ) | | | (1,986,108 | ) |
| | | | | | | | |
Net increase (decrease) in shares outstanding before conversion | | | 22,512 | | | | 612,141 | |
Shares reacquired upon conversion into other share class(es) | | | (133,019 | ) | | | (4,344,180 | ) |
| | | | | | | | |
Net increase (decrease) in shares outstanding | | | (110,507 | ) | | $ | (3,732,039 | ) |
| | | | | | | | |
Class C | | | | | | |
Six months ended March 31, 2019: | | | | | | | | |
Shares sold | | | 629,669 | | | $ | 18,357,866 | |
Shares issued in reinvestment of dividends and distributions | | | 352,083 | | | | 9,833,672 | |
Shares reacquired | | | (500,489 | ) | | | (14,594,768 | ) |
| | | | | | | | |
Net increase (decrease) in shares outstanding before conversion | | | 481,263 | | | | 13,596,770 | |
Shares reacquired upon conversion into other share class(es) | | | (194,859 | ) | | | (5,818,093 | ) |
| | | | | | | | |
Net increase (decrease) in shares outstanding | | | 286,404 | | | $ | 7,778,677 | |
| | | | | | | | |
Year ended September 30, 2018: | | | | | | | | |
Shares sold | | | 1,553,750 | | | $ | 49,219,158 | |
Shares issued in reinvestment of dividends and distributions | | | 282,277 | | | | 8,222,731 | |
Shares reacquired | | | (623,980 | ) | | | (19,713,437 | ) |
| | | | | | | | |
Net increase (decrease) in shares outstanding before conversion | | | 1,212,047 | | | | 37,728,452 | |
Shares reacquired upon conversion into other share class(es) | | | (245,724 | ) | | | (7,710,612 | ) |
| | | | | | | | |
Net increase (decrease) in shares outstanding | | | 966,323 | | | $ | 30,017,840 | |
| | | | | | | | |
| | | | |
| PGIM Jennison Growth Fund | | | 33 | |
Notes to Financial Statements(unaudited) (continued)
| | | | | | | | |
Class R | | Shares | | | Amount | |
Six months ended March 31, 2019: | | | | | | | | |
Shares sold | | | 555,195 | | | $ | 16,871,032 | |
Shares issued in reinvestment of dividends and distributions | | | 550,773 | | | | 16,952,805 | |
Shares reacquired | | | (1,718,634 | ) | | | (55,228,536 | ) |
| | | | | | | | |
Net increase (decrease) in shares outstanding | | | (612,666 | ) | | $ | (21,404,699 | ) |
| | | | | | | | |
Year ended September 30, 2018: | | | | | | | | |
Shares sold | | | 694,045 | | | $ | 23,994,461 | |
Shares issued in reinvestment of dividends and distributions | | | 643,869 | | | | 20,442,842 | |
Shares reacquired | | | (2,520,685 | ) | | | (86,684,817 | ) |
| | | | | | | | |
Net increase (decrease) in shares outstanding before conversion | | | (1,182,771 | ) | | | (42,247,514 | ) |
Shares reacquired upon conversion into other share class(es) | | | (1,450 | ) | | | (47,025 | ) |
| | | | | | | | |
Net increase (decrease) in shares outstanding | | | (1,184,221 | ) | | $ | (42,294,539 | ) |
| | | | | | | | |
Class Z | | | | | | |
Six months ended March 31, 2019: | | | | | | | | |
Shares sold | | | 10,587,335 | | | $ | 420,518,250 | |
Shares issued in reinvestment of dividends and distributions | | | 3,740,799 | | | | 143,197,782 | |
Shares reacquired | | | (11,543,958 | ) | | | (464,333,473 | ) |
| | | | | | | | |
Net increase (decrease) in shares outstanding before conversion | | | 2,784,176 | | | | 99,382,559 | |
Shares issued upon conversion from other share class(es) | | | 235,629 | | | | 9,678,799 | |
Shares reacquired upon conversion into other share class(es) | | | (57,352 | ) | | | (2,256,654 | ) |
| | | | | | | | |
Net increase (decrease) in shares outstanding | | | 2,962,453 | | | $ | 106,804,704 | |
| | | | | | | | |
Year ended September 30, 2018: | | | | | | | | |
Shares sold | | | 23,173,947 | | | $ | 978,752,187 | |
Shares issued in reinvestment of dividends and distributions | | | 3,424,850 | | | | 132,918,418 | |
Shares reacquired | | | (21,994,892 | ) | | | (915,932,337 | ) |
| | | | | | | | |
Net increase (decrease) in shares outstanding before conversion | | | 4,603,905 | | | | 195,738,268 | |
Shares issued upon conversion from other share class(es) | | | 631,829 | | | | 26,873,076 | |
Shares reacquired upon conversion into other share class(es) | | | (764,769 | ) | | | (31,321,660 | ) |
| | | | | | | | |
Net increase (decrease) in shares outstanding | | | 4,470,965 | | | $ | 191,289,684 | |
| | | | | | | | |
Class R2 | | | | | | |
Six months ended March 31, 2019: | | | | | | | | |
Shares sold | | | 81,641 | | | $ | 3,109,762 | |
Shares issued in reinvestment of dividends and distributions | | | 9,052 | | | | 345,321 | |
Shares reacquired | | | (188,675 | ) | | | (7,849,079 | ) |
| | | | | | | | |
Net increase (decrease) in shares outstanding | | | (97,982 | ) | | $ | (4,393,996 | ) |
| | | | | | | | |
Period ended September 30, 2018*: | | | | | | | | |
Shares sold | | | 171,297 | | | $ | 7,549,884 | |
Shares issued in reinvestment of dividends and distributions | | | 13 | | | | 513 | |
Shares reacquired | | | (1,367 | ) | | | (62,285 | ) |
| | | | | | | | |
Net increase (decrease) in shares outstanding | | | 169,943 | | | $ | 7,488,112 | |
| | | | | | | | |
| | | | | | | | |
Class R4 | | Shares | | | Amount | |
Six months ended March 31, 2019: | | | | | | | | |
Shares sold | | | 116,012 | | | $ | 4,813,845 | |
Shares issued in reinvestment of dividends and distributions | | | 2,064 | | | | 78,935 | |
Shares reacquired | | | (6,425 | ) | | | (253,620 | ) |
| | | | | | | | |
Net increase (decrease) in shares outstanding | | | 111,651 | | | $ | 4,639,160 | |
| | | | | | | | |
Period ended September 30, 2018*: | | | | | | | | |
Shares sold | | | 8,482 | | | $ | 380,930 | |
Shares issued in reinvestment of dividends and distributions | | | 13 | | | | 513 | |
Shares reacquired | | | (421 | ) | | | (19,313 | ) |
| | | | | | | | |
Net increase (decrease) in shares outstanding | | | 8,074 | | | $ | 362,130 | |
| | | | | | | | |
Class R6 | | | | | | |
Six months ended March 31, 2019: | | | | | | | | |
Shares sold | | | 1,995,709 | | | $ | 82,507,713 | |
Shares issued in reinvestment of dividends and distributions | | | 153,308 | | | | 5,871,697 | |
Shares reacquired | | | (326,712 | ) | | | (13,113,552 | ) |
| | | | | | | | |
Net increase (decrease) in shares outstanding | | | 1,822,305 | | | $ | 75,265,858 | |
| | | | | | | | |
Year ended September 30, 2018: | | | | | | | | |
Shares sold | | | 1,495,867 | | | $ | 63,696,151 | |
Shares issued in reinvestment of dividends and distributions | | | 40,903 | | | | 1,587,854 | |
Shares reacquired | | | (557,398 | ) | | | (23,442,329 | ) |
| | | | | | | | |
Net increase (decrease) in shares outstanding before conversion | | | 979,372 | | | | 41,841,676 | |
Shares issued upon conversion from other share class(es) | | | 650,862 | | | | 26,353,416 | |
| | | | | | | | |
Net increase (decrease) in shares outstanding | | | 1,630,234 | | | $ | 68,195,092 | |
| | | | | | | | |
| * | Commencement of offering was November 28, 2017. |
7. Borrowings
The Company, on behalf of the Series, along with other affiliated registered investment companies (the “Funds”), is a party to a Syndicated Credit Agreement (“SCA”) with a group of banks. The purpose of the SCA is to provide an alternative source of temporary funding for capital share redemptions. The SCA provides for a commitment of $900 million for the period October 4, 2018 through October 3, 2019. The Funds pay an annualized commitment fee of 0.15% of the unused portion of the SCA. The Series’ portion of the commitment fee for the unused amount, allocated based upon a method approved by the Board, is accrued daily and paid quarterly. Prior to October 4, 2018, the Funds had another SCA that provided a commitment of $900 million and the Funds paid an annualized commitment fee of 0.15% of the unused portion of the SCA. The interest on borrowings under the SCAs is paid monthly and at a per annum interest rate based upon a contractual spread plus the higher of (1) the effective federal funds rate, (2) the1-month LIBOR rate or (3) zero percent.
Certain affiliated registered investment companies that are parties to the SCA include portfolios that are subject to a predetermined mathematical formula used to manage certain benefit guarantees offered under variable annuity contracts. The formula may result in large scale asset flows into and out of these portfolios. Consequently, these portfolios may be more likely to utilize the SCA for purposes of funding redemptions. It may be possible for those
| | | | |
| PGIM Jennison Growth Fund | | | 35 | |
Notes to Financial Statements(unaudited) (continued)
portfolios to fully exhaust the committed amount of the SCA, thereby requiring the Manager to allocate available funding per a Board-approved methodology designed to treat the Funds in the SCA equitably.
The Series utilized the SCA during the reporting period ended March 31, 2019. The average daily balance for the 8 days that the Series had loans outstanding during the period was approximately $2,274,250, borrowed at a weighted average interest rate of 3.55%. The maximum loan outstanding amount during the period was $4,551,000. At March 31, 2019, the Series did not have an outstanding loan amount.
8. Risks of Investing in the Series
The Series’ risks include, but are not limited to, some or all of the risks discussed below:
Equity and Equity-Related Securities Risks:The value of a particular security could go down and you could lose money. In addition to an individual security losing value, the value of the equity markets or a sector in which the Series invests could go down. The Series’ holdings can vary significantly from broad market indexes and the performance of the Series can deviate from the performance of these indexes. Different parts of a market can react differently to adverse issuer, market, regulatory, political and economic developments.
Foreign Securities Risk:The Series’ investments in securities of foreign issuers or issuers with significant exposure to foreign markets involve additional risk. Foreign countries in which the Series may invest may have markets that are less liquid, less regulated and more volatile than US markets. The value of the Series’ investments may decline because of factors affecting the particular issuer as well as foreign markets and issuers generally, such as unfavorable government actions, and political or financial instability.
Market and Credit Risk:Securities markets may be volatile and the market prices of the Series’ securities may decline. Securities fluctuate in price based on changes in an issuer’s financial condition and overall market and economic conditions. If the market prices of the securities owned by the Series fall, the value of an investment in the Series will decline. Additionally, the Series may also be exposed to credit risk in the event that an issuer or guarantor fails to perform or that an institution or entity with which the Series has unsettled or open transactions defaults.
9. Recent Accounting Pronouncements and Reporting Updates
In August 2018, the Securities and Exchange Commission (the “SEC”) adopted amendments to RegulationS-X to update and simplify the disclosure requirements for registered investment companies by eliminating requirements that are redundant or
duplicative of US GAAP requirements or other SEC disclosure requirements. The new amendments require the presentation of the total, rather than the components, of distributable earnings on the Statement of Assets and Liabilities and the total, rather than the components, of dividends from net investment income and distributions from net realized gains on the Statements of Changes in Net Assets. The amendments also removed the requirement for the parenthetical disclosure of undistributed net investment income on the Statements of Changes in Net Assets and certain tax adjustments that were reflected in the Notes to Financial Statements. The Manager has adopted the amendments and reflected them in the Series’ financial statements.
In August 2018, the FASB issued Accounting Standards Update (“ASU”)No. 2018-13, which changes certain fair value measurement disclosure requirements. The new ASU, in addition to other modifications and additions, removes the requirement to disclose the amount and reasons for transfers between Level 1 and Level 2 of the fair value hierarchy, and the Series’ policy for the timing of transfers between levels. The amendments are effective for financial statements issued for fiscal years beginning after December 15, 2019, and interim periods within those fiscal years. The Manager has evaluated the implications of certain provisions of the ASU and has determined to early adopt aspects related to the removal and modification of certain fair value measurement disclosures under the ASU effective immediately. At this time, the Manager is evaluating the implications of certain other provisions of the ASU related to new disclosure requirements and any impact on the financial statement disclosures has not yet been determined.
| | | | |
| PGIM Jennison Growth Fund | | | 37 | |
Financial Highlights(unaudited)
| | | | | | | | | | | | | | | | | | | | | | | | | | | | | | | | |
| Class A Shares | | | | | | | |
| | | Six Months
Ended
March 31, | | | | | | Year Ended September 30, | |
| | | 2019 | | | | | | 2018 | | | 2017 | | | 2016 | | | 2015 | | | | | | 2014 | |
| Per Share Operating Performance(a): | | | | | | | | | | | | | | | | | | | | | | | | | | | | | | | | |
| Net Asset Value, Beginning of Period | | | $42.79 | | | | | | | | $ 35.78 | | | | $29.86 | | | | $ 29.37 | | | | $29.31 | | | | | | | | $25.59 | |
| Income (loss) from investment operations: | | | | | | | | | | | | | | | | | | | | | | | | | | | | | | | | |
| Net investment income (loss) | | | (0.03 | ) | | | | | | | (0.10 | ) | | | (0.05 | ) | | | (0.06 | ) | | | (0.08 | ) | | | | | | | (0.08 | ) |
| Net realized and unrealized gain (loss) on investment and foreign currency transactions | | | (1.01 | ) | | | | | | | 9.23 | | | | 7.13 | | | | 2.60 | | | | 1.70 | | | | | | | | 4.79 | |
| Total from investment operations | | | (1.04 | ) | | | | | | | 9.13 | | | | 7.08 | | | | 2.54 | | | | 1.62 | | | | | | | | 4.71 | |
| Less Dividends and Distributions: | | | | | | | | | | | | | | | | | | | | | | | | | | | | | | | | |
| Distributions from net realized gains | | | (2.05 | ) | | | | | | | (2.12 | ) | | | (1.16 | ) | | | (2.05 | ) | | | (1.56 | ) | | | | | | | (0.99 | ) |
| Net asset value, end of period | | | $39.70 | | | | | | | | $ 42.79 | | | | $35.78 | | | | $ 29.86 | | | | $29.37 | | | | | | | | $29.31 | |
| Total Return(b): | | | (1.85)% | | | | | | | | 26.60% | | | | 24.70% | | | | 8.63% | | | | 5.89% | | | | | | | | 18.72% | |
| |
| Ratios/Supplemental Data: | | | | | | | |
| Net assets, end of period (000) | | | $1,279,646 | | | | | | | | $1,349,940 | | | | $1,147,941 | | | | $1,044,317 | | | | $1,026,140 | | | | | | | | $1,086,552 | |
| Average net assets (000) | | | $1,204,643 | | | | | | | | $1,258,241 | | | | $1,055,913 | | | | $1,061,391 | | | | $1,079,867 | | | | | | | | $1,079,657 | |
| Ratios to average net assets(c)(d): | | | | | | | | | | | | | | | | | | | | | | | | | | | | | | | | |
| Expenses after waivers and/or expense reimbursement | | | 1.02% | (e) | | | | | | | 1.02% | | | | 1.02% | | | | 1.03% | | | | 1.05% | | | | | | | | 1.05% | |
| Expenses before waivers and/or expense reimbursement | | | 1.02% | (e) | | | | | | | 1.02% | | | | 1.02% | | | | 1.03% | | | | 1.05% | | | | | | | | 1.05% | |
| Net investment income (loss) | | | (0.18)% | (e) | | | | | | | (0.26)% | | | | (0.16)% | | | | (0.19)% | | | | (0.26)% | | | | | | | | (0.27)% | |
| Portfolio turnover rate(f) | | | 22% | | | | | | | | 40% | | | | 54% | (g) | | | 36% | | | | 41% | | | | | | | | 38% | |
| (a) | Calculated based on average shares outstanding during the period. |
| (b) | Total return does not consider the effects of sales loads. Total return is calculated assuming a purchase of a share on the first day and a sale on the last day of each period reported and includes reinvestment of dividends and distributions, if any. Total returns may reflect adjustments to conform to generally accepted accounting principles. Total returns for periods less than one full year are not annualized. |
| (c) | Does not include expenses of the underlying funds in which the Series invests. |
| (d) | Effective October 1, 2017, class specific expenses include transfer agent fees and expenses and registration fees, which are charged to their respective share class. |
| (f) | The Series’ portfolio turnover rate is calculated in accordance with regulatory requirements, without regard to transactions involving short term investments and certain derivatives. If such transactions were included, the Series’ portfolio turnover rate may be higher. |
| (g) | The Portfolio turnover rate is calculated in accordance with regulatory requirements and excludes portfolio securities transferred as a result ofin-kind transactions. If such transactions were included, the portfolio turnover rate may be higher. |
See Notes to Financial Statements.
| | | | | | | | | | | | | | | | | | | | | | | | | | | | | | | | |
| Class B Shares | | | | | | | |
| | | Six Months
Ended
March 31, | | | | | | Year Ended September 30, | |
| | | 2019 | | | | | | 2018 | | | 2017 | | | 2016 | | | 2015 | | | | | | 2014 | |
| Per Share Operating Performance(a): | | | | | | | | | | | | | | | | | | | | | | | | | | | | | | | | |
| Net Asset Value, Beginning of Period | �� | | $34.18 | | | | | | | | $29.23 | | | | $24.78 | | | | $24.85 | | | | $25.21 | | | | | | | | $22.29 | |
| Income (loss) from investment operations: | | | | | | | | | | | | | | | | | | | | | | | | | | | | | | | | |
| Net investment income (loss) | | | (0.16 | ) | | | | | | | (0.37 | ) | | | (0.22 | ) | | | (0.21 | ) | | | (0.25 | ) | | | | | | | (0.23 | ) |
| Net realized and unrealized gain (loss) on investment and foreign currency transactions | | | (0.87 | ) | | | | | | | 7.44 | | | | 5.83 | | | | 2.19 | | | | 1.45 | | | | | | | | 4.14 | |
| Total from investment operations | | | (1.03 | ) | | | | | | | 7.07 | | | | 5.61 | | | | 1.98 | | | | 1.20 | | | | | | | | 3.91 | |
| Less Dividends and Distributions: | | | | | | | | | | | | | | | | | | | | | | | | | | | | | | | | |
| Distributions from net realized gains | | | (2.05 | ) | | | | | | | (2.12 | ) | | | (1.16 | ) | | | (2.05 | ) | | | (1.56 | ) | | | | | | | (0.99 | ) |
| Net asset value, end of period | | | $31.10 | | | | | | | | $34.18 | | | | $29.23 | | | | $24.78 | | | | $24.85 | | | | | | | | $25.21 | |
| Total Return(b): | | | (2.30)% | | | | | | | | 25.46% | | | | 23.80% | | | | 7.90% | | | | 5.14% | | | | | | | | 17.87% | |
| |
| Ratios/Supplemental Data: | | | | | | | |
| Net assets, end of period (000) | | | $11,779 | | | | | | | | $14,618 | | | | $15,734 | | | | $17,421 | | | | $21,843 | | | | | | | | $26,222 | |
| Average net assets (000) | | | $12,334 | | | | | | | | $15,991 | | | | $16,248 | | | | $20,138 | | | | $25,070 | | | | | | | | $28,811 | |
| Ratios to average net assets(c)(d): | | | | | | | | | | | | | | | | | | | | | | | | | | | | | | | | |
| Expenses after waivers and/or expense reimbursement | | | 1.95% | (e) | | | | | | | 1.95% | | | | 1.72% | | | | 1.73% | | | | 1.75% | | | | | | | | 1.75% | |
| Expenses before waivers and/or expense reimbursement | | | 2.27% | (e) | | | | | | | 2.13% | | | | 1.72% | | | | 1.73% | | | | 1.75% | | | | | | | | 1.75% | |
| Net investment income (loss) | | | (1.10)% | (e) | | | | | | | (1.19)% | | | | (0.86)% | | | | (0.89)% | | | | (0.96)% | | | | | | | | (0.97)% | |
| Portfolio turnover rate(f) | | | 22% | | | | | | | | 40% | | | | 54% | (g) | | | 36% | | | | 41% | | | | | | | | 38% | |
| (a) | Calculated based on average shares outstanding during the period. |
| (b) | Total return does not consider the effects of sales loads. Total return is calculated assuming a purchase of a share on the first day and a sale on the last day of each period reported and includes reinvestment of dividends and distributions, if any. Total returns may reflect adjustments to conform to generally accepted accounting principles. Total returns for periods less than one full year are not annualized. |
| (c) | Does not include expenses of the underlying funds in which the Series invests. |
| (d) | Effective October 1, 2017, class specific expenses include transfer agent fees and expenses and registration fees, which are charged to their respective share class. |
| (f) | The Series’ portfolio turnover rate is calculated in accordance with regulatory requirements, without regard to transactions involving short term investments and certain derivatives. If such transactions were included, the Series’ portfolio turnover rate may be higher. |
| (g) | The Portfolio turnover rate is calculated in accordance with regulatory requirements and excludes portfolio securities transferred as a result ofin-kind transactions. If such transactions were included, the portfolio turnover rate may be higher. |
See Notes to Financial Statements.
| | | | |
| PGIM Jennison Growth Fund | | | 39 | |
Financial Highlights(unaudited) (continued)
| | | | | | | | | | | | | | | | | | | | | | | | | | | | | | | | |
| Class C Shares | | | | | | | |
| | | Six Months
Ended
March 31, | | | | | | Year Ended September 30, | |
| | | 2019 | | | | | | 2018 | | | 2017 | | | 2016 | | | 2015 | | | | | | 2014 | |
| Per Share Operating Performance(a): | | | | | | | | | | | | | | | | | | | | | | | | | | | | | | | | |
| Net Asset Value, Beginning of Period | | | $34.34 | | | | | | | | $29.29 | | | | $24.82 | | | | $24.89 | | | | $25.25 | | | | | | | | $22.32 | |
| Income (loss) from investment operations: | | | | | | | | | | | | | | | | | | | | | | | | | | | | | | | | |
| Net investment income (loss) | | | (0.13 | ) | | | | | | | (0.30 | ) | | | (0.22 | ) | | | (0.21 | ) | | | (0.25 | ) | | | | | | | (0.24 | ) |
| Net realized and unrealized gain (loss) on investment and foreign currency transactions | | | (0.86 | ) | | | | | | | 7.47 | | | | 5.85 | | | | 2.19 | | | | 1.45 | | | | | | | | 4.16 | |
| Total from investment operations | | | (0.99 | ) | | | | | | | 7.17 | | | | 5.63 | | | | 1.98 | | | | 1.20 | | | | | | | | 3.92 | |
| Less Dividends and Distributions: | | | | | | | | | | | | | | | | | | | | | | | | | | | | | | | | |
| Distributions from net realized gains | | | (2.05 | ) | | | | | | | (2.12 | ) | | | (1.16 | ) | | | (2.05 | ) | | | (1.56 | ) | | | | | | | (0.99 | ) |
| Net asset value, end of period | | | $31.30 | | | | | | | | $34.34 | | | | $29.29 | | | | $24.82 | | | | $24.89 | | | | | | | | $25.25 | |
| Total Return(b): | | | (2.17)% | | | | | | | | 25.76% | | | | 23.84% | | | | 7.89% | | | | 5.13% | | | | | | | | 17.89% | |
| |
| Ratios/Supplemental Data: | | | | | | | |
| Net assets, end of period (000) | | | $168,581 | | | | | | | | $175,142 | | | | $121,092 | | | | $115,018 | | | | $91,552 | | | | | | | | $75,620 | |
| Average net assets (000) | | | $158,993 | | | | | | | | $148,000 | | | | $113,836 | | | | $110,677 | | | | $83,892 | | | | | | | | $71,867 | |
| Ratios to average net assets(c)(d): | | | | | | | | | | | | | | | | | | | | | | | | | | | | | | | | |
| Expenses after waivers and/or expense reimbursement | | | 1.69% | (e) | | | | | | | 1.69% | | | | 1.72% | | | | 1.73% | | | | 1.75% | | | | | | | | 1.75% | |
| Expenses before waivers and/or expense reimbursement | | | 1.69% | (e) | | | | | | | 1.69% | | | | 1.72% | | | | 1.73% | | | | 1.75% | | | | | | | | 1.75% | |
| Net investment income (loss) | | | (0.84)% | (e) | | | | | | | (0.94)% | | | | (0.86)% | | | | (0.88)% | | | | (0.96)% | | | | | | | | (0.97)% | |
| Portfolio turnover rate(f) | | | 22% | | | | | | | | 40% | | | | 54% | (g) | | | 36% | | | | 41% | | | | | | | | 38% | |
| (a) | Calculated based on average shares outstanding during the period. |
| (b) | Total return does not consider the effects of sales loads. Total return is calculated assuming a purchase of a share on the first day and a sale on the last day of each period reported and includes reinvestment of dividends and distributions, if any. Total returns may reflect adjustments to conform to generally accepted accounting principles. Total returns for periods less than one full year are not annualized. |
| (c) | Does not include expenses of the underlying funds in which the Series invests. |
| (d) | Effective October 1, 2017, class specific expenses include transfer agent fees and expenses and registration fees, which are charged to their respective share class. |
| (f) | The Series’ portfolio turnover rate is calculated in accordance with regulatory requirements, without regard to transactions involving short term investments and certain derivatives. If such transactions were included, the Series’ portfolio turnover rate may be higher. |
| (g) | The Portfolio turnover rate is calculated in accordance with regulatory requirements and excludes portfolio securities transferred as a result ofin-kind transactions. If such transactions were included, the portfolio turnover rate may be higher. |
See Notes to Financial Statements.
| | | | | | | | | | | | | | | | | | | | | | | | | | | | | | | | |
| Class R Shares | | | | | | | |
| | | Six Months
Ended
March 31, | | | | | | Year Ended September 30, | |
| | | 2019 | | | | | | 2018 | | | 2017 | | | 2016 | | | 2015 | | | | | | 2014 | |
| Per Share Operating Performance(a): | | | | | | | | | | | | | | | | | | | | | | | | | | | | | | | | |
| Net Asset Value, Beginning of Period | | | $37.57 | | | | | | | | $31.72 | | | | $26.65 | | | | $26.47 | | | | $26.62 | | | | | | | | $23.37 | |
| Income (loss) from investment operations: | | | | | | | | | | | | | | | | | | | | | | | | | | | | | | | | |
| Net investment income (loss) | | | (0.07 | ) | | | | | | | (0.16 | ) | | | (0.10 | ) | | | (0.10 | ) | | | (0.16 | ) | | | | | | | (0.12 | ) |
| Net realized and unrealized gain (loss) on investment and foreign currency transactions | | | (0.92 | ) | | | | | | | 8.13 | | | | 6.33 | | | | 2.33 | | | | 1.57 | | | | | | | | 4.36 | |
| Total from investment operations | | | (0.99 | ) | | | | | | | 7.97 | | | | 6.23 | | | | 2.23 | | | | 1.41 | | | | | | | | 4.24 | |
| Less Dividends and Distributions: | | | | | | | | | | | | | | | | | | | | | | | | | | | | | | | | |
| Distributions from net realized gains | | | (2.05 | ) | | | | | | | (2.12 | ) | | | (1.16 | ) | | | (2.05 | ) | | | (1.56 | ) | | | | | | | (0.99 | ) |
| Net asset value, end of period | | | $34.53 | | | | | | | | $37.57 | | | | $31.72 | | | | $26.65 | | | | $26.47 | | | | | | | | $26.62 | |
| Total Return(b): | | | (1.98)% | | | | | | | | 26.34% | | | | 24.48% | | | | 8.39% | | | | 5.68% | | | | | | | | 18.48% | |
| |
| Ratios/Supplemental Data: | | | | | | | |
| Net assets, end of period (000) | | | $284,380 | | | | | | | | $332,402 | | | | $318,202 | | | | $290,328 | | | | $261,304 | | | | | | | | $47,957 | |
| Average net assets (000) | | | $287,783 | | | | | | | | $334,713 | | | | $306,004 | | | | $277,093 | | | | $122,239 | | | | | | | | $43,736 | |
| Ratios to average net assets(c)(d): | | | | | | | | | | | | | | | | | | | | | | | | | | | | | | | | |
| Expenses after waivers and/or expense reimbursement | | | 1.25% | (e) | | | | | | | 1.23% | | | | 1.22% | | | | 1.23% | | | | 1.25% | | | | | | | | 1.25% | |
| Expenses before waivers and/or expense reimbursement | | | 1.50% | (e) | | | | | | | 1.48% | | | | 1.47% | | | | 1.48% | | | | 1.50% | | | | | | | | 1.50% | |
| Net investment income (loss) | | | (0.40)% | (e) | | | | | | | (0.47)% | | | | (0.36)% | | | | (0.39)% | | | | (0.57)% | | | | | | | | (0.48)% | |
| Portfolio turnover rate(f) | | | 22% | | | | | | | | 40% | | | | 54% | (g) | | | 36% | | | | 41% | | | | | | | | 38% | |
| (a) | Calculated based on average shares outstanding during the period. |
| (b) | Total return is calculated assuming a purchase of a share on the first day and a sale on the last day of each period reported and includes reinvestment of dividends and distributions, if any. Total returns may reflect adjustments to conform to generally accepted accounting principles. Total returns for periods less than one full year are not annualized. |
| (c) | Does not include expenses of the underlying funds in which the Series invests. |
| (d) | Effective October 1, 2017, class specific expenses include transfer agent fees and expenses and registration fees, which are charged to their respective share class. |
| (f) | The Series’ portfolio turnover rate is calculated in accordance with regulatory requirements, without regard to transactions involving short term investments and certain derivatives. If such transactions were included, the Series’ portfolio turnover rate may be higher. |
| (g) | The Portfolio turnover rate is calculated in accordance with regulatory requirements and excludes portfolio securities transferred as a result ofin-kind transactions. If such transactions were included, the portfolio turnover rate may be higher. |
See Notes to Financial Statements.
| | | | |
| PGIM Jennison Growth Fund | | | 41 | |
Financial Highlights(unaudited) (continued)
| | | | | | | | | | | | | | | | | | | | | | | | | | | | | | | | |
| Class Z Shares | | | | | | | |
| | | Six Months
Ended
March 31, | | | | | | Year Ended September 30, | |
| | | 2019 | | | | | | 2018 | | | 2017 | | | 2016 | | | 2015 | | | | | | 2014 | |
| Per Share Operating Performance(a): | | | | | | | | | | | | | | | | | | | | | | | | | | | | | | | | |
| Net Asset Value, Beginning of Period | | | $46.12 | | | | | | | | $38.30 | | | | $31.79 | | | | $31.05 | | | | $30.81 | | | | | | | | $26.78 | |
| Income (loss) from investment operations: | | | | | | | | | | | | | | | | | | | | | | | | | | | | | | | | |
| Net investment income (loss) | | | 0.03 | | | | | | | | 0.02 | | | | 0.04 | | | | 0.03 | | | | 0.01 | | | | | | | | 0.01 | |
| Net realized and unrealized gain (loss) on investment and foreign currency transactions | | | (1.07 | ) | | | | | | | 9.92 | | | | 7.63 | | | | 2.76 | | | | 1.79 | | | | | | | | 5.01 | |
| Total from investment operations | | | (1.04 | ) | | | | | | | 9.94 | | | | 7.67 | | | | 2.79 | | | | 1.80 | | | | | | | | 5.02 | |
| Less Dividends and Distributions: | | | | | | | | | | | | | | | | | | | | | | | | | | | | | | | | |
| Dividends from net investment income | | | (0.02 | ) | | | | | | | - | | | | - | | | | - | | | | - | | | | | | | | - | (b) |
| Distributions from net realized gains | | | (2.05 | ) | | | | | | | (2.12 | ) | | | (1.16 | ) | | | (2.05 | ) | | | (1.56 | ) | | | | | | | (0.99 | ) |
| Total dividends and distributions | | | (2.07 | ) | | | | | | | (2.12 | ) | | | (1.16 | ) | | | (2.05 | ) | | | (1.56 | ) | | | | | | | (0.99 | ) |
| Net asset value, end of period | | | $43.01 | | | | | | | | $46.12 | | | | $38.30 | | | | $31.79 | | | | $31.05 | | | | | | | | $30.81 | |
| Total Return(c): | | | (1.71)% | | | | | | | | 26.99% | | | | 25.07% | | | | 8.99% | | | | 6.20% | | | | | | | | 19.07% | |
| |
| Ratios/Supplemental Data: | | | | | | | |
| Net assets, end of period (000) | | | $3,423,076 | | | | | | | | $3,533,891 | | | | $2,763,070 | | | | $2,015,895 | | | | $1,801,158 | | | | | | | | $1,465,227 | |
| Average net assets (000) | | | $3,187,276 | | | | | | | | $3,107,412 | | | | $2,264,779 | | | | $1,944,589 | | | | $1,701,486 | | | | | | | | $1,398,654 | |
| Ratios to average net assets(d)(e): | | | | | | | | | | | | | | | | | | | | | | | | | | | | | | | | |
| Expenses after waivers and/or expense reimbursement | | | 0.71% | (f) | | | | | | | 0.71% | | | | 0.72% | | | | 0.73% | | | | 0.75% | | | | | | | | 0.75% | |
| Expenses before waivers and/or expense reimbursement | | | 0.71% | (f) | | | | | | | 0.71% | | | | 0.72% | | | | 0.73% | | | | 0.75% | | | | | | | | 0.75% | |
| Net investment income (loss) | | | 0.13% | (f) | | | | | | | 0.04% | | | | 0.13% | | | | 0.11% | | | | 0.03% | | | | | | | | 0.03% | |
| Portfolio turnover rate(g) | | | 22% | | | | | | | | 40% | | | | 54% | (h) | | | 36% | | | | 41% | | | | | | | | 38% | |
| (a) | Calculated based on average shares outstanding during the period. |
| (b) | Less than $(0.005) per share. |
| (c) | Total return is calculated assuming a purchase of a share on the first day and a sale on the last day of each period reported and includes reinvestment of dividends and distributions, if any. Total returns may reflect adjustments to conform to generally accepted accounting principles. Total returns for periods less than one full year are not annualized. |
| (d) | Does not include expenses of the underlying funds in which the Series invests. |
| (e) | Effective October 1, 2017, class specific expenses include transfer agent fees and expenses and registration fees, which are charged to their respective share class. |
| (g) | The Series’ portfolio turnover rate is calculated in accordance with regulatory requirements, without regard to transactions involving short term investments and certain derivatives. If such transactions were included, the Series’ portfolio turnover rate may be higher. |
See Notes to Financial Statements.
| (h) | The Portfolio turnover rate is calculated in accordance with regulatory requirements and excludes portfolio securities transferred as a result ofin-kind transactions. If such transactions were included, the portfolio turnover rate may be higher. |
See Notes to Financial Statements.
| | | | |
| PGIM Jennison Growth Fund | | | 43 | |
Financial Highlights(unaudited) (continued)
| | | | | | | | | | | | |
| Class R2 Shares | | | | | | | | | |
| | | Six Months Ended March 31, 2019 | | | | | | November 28, 2017(a) through September 30, 2018 | |
| Per Share Operating Performance(b): | | | | | | | | | | | | |
| Net Asset Value, Beginning of Period | | | $45.99 | | | | | | | | $41.24 | |
| Income (loss) from investment operations: | | | | | | | | | | | | |
| Net investment income (loss) | | | (0.06 | ) | | | | | | | (0.32 | ) |
| Net realized and unrealized gain (loss) on investment and foreign currency transactions | | | (1.07 | ) | | | | | | | 7.19 | |
| Total from investment operations | | | (1.13 | ) | | | | | | | 6.87 | |
| Less Dividends and Distributions: | | | | | | | | | | | | |
| Distributions from net realized gains | | | (2.05 | ) | | | | | | | (2.12 | ) |
| Net asset value, end of period | | | $42.81 | | | | | | | | $45.99 | |
| Total Return(c): | | | (1.92)% | | | | | | | | 17.60% | |
| |
| Ratios/Supplemental Data: | | | | | | | | | |
| Net assets, end of period (000) | | | $3,081 | | | | | | | | $7,815 | |
| Average net assets (000) | | | $6,989 | | | | | | | | $1,011 | |
| Ratios to average net assets(d): | | | | | | | | | | | | |
| Expenses after waivers and/or expense reimbursement | | | 1.10% | (e) | | | | | | | 1.10% | (e) |
| Expenses before waivers and/or expense reimbursement | | | 1.24% | (e) | | | | | | | 3.11% | (e) |
| Net investment income (loss) | | | (0.32)% | (e) | | | | | | | (0.86)% | (e) |
| Portfolio turnover rate(f) | | | 22% | | | | | | | | 40% | |
| (a) | Commencement of offering. |
| (b) | Calculated based on average shares outstanding during the period. |
| (c) | Total return is calculated assuming a purchase of a share on the first day and a sale on the last day of each period reported and includes reinvestment of dividends and distributions, if any. Total returns may reflect adjustments to conform to generally accepted accounting principles. Total returns for periods less than one full year are not annualized. |
| (d) | Does not include expenses of the underlying funds in which the Series invests. |
| (f) | The Series’ portfolio turnover rate is calculated in accordance with regulatory requirements, without regard to transactions involving short term investments and certain derivatives. If such transactions were included, the Series’ portfolio turnover rate may be higher. |
See Notes to Financial Statements.
| | | | | | | | | | | | |
| Class R4 Shares | | | | | | | | | |
| | | Six Months Ended March 31, 2019 | | | | | | November 28, 2017(a) through September 30, 2018 | |
| Per Share Operating Performance(b): | | | | | | | | | | | | |
| Net Asset Value, Beginning of Period | | | $46.08 | | | | | | | | $41.24 | |
| Income (loss) from investment operations: | | | | | | | | | | | | |
| Net investment income (loss) | | | - | (c) | | | | | | | (0.22 | ) |
| Net realized and unrealized gain (loss) on investment and foreign currency transactions | | | (1.06 | ) | | | | | | | 7.18 | |
| Total from investment operations | | | (1.06 | ) | | | | | | | 6.96 | |
| Less Dividends and Distributions: | | | | | | | | | | | | |
| Distributions from net realized gains | | | (2.05 | ) | | | | | | | (2.12 | ) |
| Net asset value, end of period | | | $42.97 | | | | | | | | $46.08 | |
| Total Return(d): | | | (1.76)% | | | | | | | | 17.83% | |
| |
| Ratios/Supplemental Data: | | | | | | | | | |
| Net assets, end of period (000) | | | $5,144 | | | | | | | | $372 | |
| Average net assets (000) | | | $3,375 | | | | | | | | $38 | |
| Ratios to average net assets(e): | | | | | | | | | | | | |
| Expenses after waivers and/or expense reimbursement | | | 0.85% | (f) | | | | | | | 0.85% | (f) |
| Expenses before waivers and/or expense reimbursement | | | 1.21% | (f) | | | | | | | 57.88% | (f) |
| Net investment income (loss) | | | (0.01)% | (f) | | | | | | | (0.62)% | (f) |
| Portfolio turnover rate(g) | | | 22% | | | | | | | | 40% | |
| (a) | Commencement of offering. |
| (b) | Calculated based on average shares outstanding during the period. |
| (c) | Less than $(0.005) per share. |
| (d) | Total return is calculated assuming a purchase of a share on the first day and a sale on the last day of each period reported and includes reinvestment of dividends and distributions, if any. Total returns may reflect adjustments to conform to generally accepted accounting principles. Total returns for periods less than one full year are not annualized. |
| (e) | Does not include expenses of the underlying funds in which the Series invests. |
| (g) | The Series’ portfolio turnover rate is calculated in accordance with regulatory requirements, without regard to transactions involving short term investments and certain derivatives. If such transactions were included, the Series’ portfolio turnover rate may be higher. |
See Notes to Financial Statements.
| | | | |
| PGIM Jennison Growth Fund | | | 45 | |
Financial Highlights(unaudited) (continued)
| | | | | | | | | | | | | | | | | | | | |
| Class R6 Shares | | | | | | | | | | | | | | | |
| | | Six Months
Ended
March 31,
2019 | | | | | | Year Ended September 30,
2018 | | | | | | September 27,
2017(a)
through
September 30,
2017 | |
| Per Share Operating Performance(b): | | | | | | | | | | | | | | | | | | | | |
| Net Asset Value, Beginning of Period | | | $46.19 | | | | | | | | $38.30 | | | | | | | | $37.92 | |
| Income (loss) from investment operations: | | | | | | | | | | | | | | | | | | | | |
| Net investment income (loss) | | | 0.05 | | | | | | | | 0.08 | | | | | | | | - | (c) |
| Net realized and unrealized gain (loss) on investment and foreign currency transactions | | | (1.08 | ) | | | | | | | 9.93 | | | | | | | | 0.38 | |
| Total from investment operations | | | (1.03 | ) | | | | | | | 10.01 | | | | | | | | 0.38 | |
| Less Dividends and Distributions: | | | | | | | | | | | | | | | | | | | | |
| Dividends from net investment income | | | (0.06 | ) | | | | | | | - | | | | | | | | - | |
| Distributions from net realized gains | | | (2.05 | ) | | | | | | | (2.12 | ) | | | | | | | - | |
| Total dividends and distributions | | | (2.11 | ) | | | | | | | (2.12 | ) | | | | | | | - | |
| Net asset value, end of period | | | $43.05 | | | | | | | | $46.19 | | | | | | | | $38.30 | |
| Total Return(d): | | | (1.66)% | | | | | | | | 27.18% | | | | | | | | 1.00% | |
| Ratios/Supplemental Data: | | | | | | | | | | | | | | | |
| Net assets, end of period (000) | | | $163,858 | | | | | | | | $91,625 | | | | | | | | $13,539 | |
| Average net assets (000) | | | $121,224 | | | | | | | | $50,011 | | | | | | | | $13,296 | |
| Ratios to average net assets(e)(f): | | | | | | | | | | | | | | | | | | | | |
| Expenses after waivers and/or expense reimbursement | | | 0.60% | (g) | | | | | | | 0.60% | | | | | | | | 0.58% | (g) |
| Expenses before waivers and/or expense reimbursement | | | 0.60% | (g) | | | | | | | 0.62% | | | | | | | | 0.58% | (g) |
| Net investment income (loss) | | | 0.25% | (g) | | | | | | | 0.18% | | | | | | | | (0.43)% | (g) |
| Portfolio turnover rate(h) | | | 22% | | | | | | | | 40% | | | | | | | | 54% | (i) |
| (a) | Commencement of offering. |
| (b) | Calculated based on average shares outstanding during the period. |
| (c) | Less than $0.005 per share. |
| (d) | Total return is calculated assuming a purchase of a share on the first day and a sale on the last day of each period reported and includes reinvestment of dividends and distributions, if any. Total returns may reflect adjustments to conform to generally accepted accounting principles. Total returns for periods less than one full year are not annualized. |
| (e) | Does not include expenses of the underlying funds in which the Series invests. |
| (f) | Effective October 1, 2017, class specific expenses include transfer agent fees and expenses and registration fees, which are charged to their respective share class. |
| (h) | The Series’ portfolio turnover rate is calculated in accordance with regulatory requirements, without regard to transactions involving short term investments and certain derivatives. If such transactions were included, the Series’ portfolio turnover rate may be higher. |
| (i) | The Portfolio turnover rate is calculated in accordance with regulatory requirements and excludes portfolio securities transferred as a result ofin-kind transactions. If such transactions were included, the portfolio turnover rate may be higher. |
See Notes to Financial Statements.
| | | | |
| | |
| ∎ MAIL | | ∎ TELEPHONE | | ∎ WEBSITE |
655 Broad Street Newark, NJ 07102 | | (800) 225-1852 | | pgiminvestments.com |
|
| PROXY VOTING |
| The Board of Directors of the Fund has delegated to the Fund’s subadviser the responsibility for voting any proxies and maintaining proxy recordkeeping with respect to the Fund. A description of these proxy voting policies and procedures is available without charge, upon request, by calling (800) 225-1852. Information regarding how the Fund voted proxies relating to portfolio securities during the most recent 12-month period ended June 30 is available on the Fund’s websiteand on the Securities and Exchange Commission’s website. |
|
| DIRECTORS |
| Ellen S. Alberding• Kevin J. Bannon• Scott E. Benjamin• Linda W. Bynoe• Barry H. Evans• Keith F. Hartstein • Laurie Simon Hodrick• Michael S. Hyland• Stuart S. Parker• Brian K. Reid• Grace C. Torres |
|
| OFFICERS |
| Stuart S. Parker,President• Scott E. Benjamin,Vice President• Christian J. Kelly,Treasurer and Principal Financial and Accounting Officer• Raymond A. O’Hara,Chief Legal Officer• Chad A. Earnst,Chief Compliance Officer• Dino Capasso,Deputy Chief Compliance Officer• Andrew R. French,Secretary• Jonathan D. Shain,Assistant Secretary• Claudia DiGiacomo,Assistant Secretary• Diana N. Huffman,Assistant Secretary• Peter Parrella,Assistant Treasurer• Lana Lomuti,Assistant Treasurer• Linda McMullin,Assistant Treasurer• Kelly A. Coyne,Assistant Treasurer• Charles H. Smith,Anti-Money Laundering Compliance Officer |
| | | | |
| MANAGER | | PGIM Investments LLC | | 655 Broad Street Newark, NJ 07102 |
|
| SUBADVISER | | Jennison Associates LLC | | 466 Lexington Avenue New York, NY 10017 |
|
| DISTRIBUTOR | | Prudential Investment
Management Services LLC | | 655 Broad Street Newark, NJ 07102 |
|
| CUSTODIAN | | The Bank of New York Mellon | | 240 Greenwich Street New York, NY 10286 |
|
| TRANSFER AGENT | | Prudential Mutual Fund Services LLC | | PO Box 9658 Providence, RI 02940 |
|
INDEPENDENT REGISTERED
PUBLIC ACCOUNTING FIRM | | KPMG LLP | | 345 Park Avenue New York, NY 10154 |
|
| FUND COUNSEL | | Willkie Farr & Gallagher LLP | | 787 Seventh Avenue New York, NY 10019 |
|
|
| An investor should consider the investment objectives, risks, charges, and expenses of the Fund carefully before investing. The prospectus and summary prospectus contain this and other information about the Fund. An investor may obtain the prospectus and summary prospectus by visiting our website atpgiminvestments.com or by calling(800) 225-1852. The prospectus and summary prospectus should be read carefully before investing. |
|
| E-DELIVERY |
| To receive your mutual fund documents online, go topgiminvestments.com/edeliveryand enroll. Instead of receiving printed documents by mail, you will receive notification via email when new materials are available. You can cancel your enrollment or change your email address at any time by visiting the website address above. |
|
| SHAREHOLDER COMMUNICATIONS WITH DIRECTORS |
| Shareholders can communicate directly with the Board of Directors by writing to the Chair of the Board, PGIM Jennison Growth Fund, PGIM Investments, Attn: Board of Directors, 655 Broad Street, Newark, NJ 07102. Shareholders can communicate directly with an individual Director by writing to the same address. Communications are not screened before being delivered to the addressee. |
|
| AVAILABILITY OF PORTFOLIO SCHEDULE |
| The Fund files its complete schedule of portfolio holdings with the Securities and Exchange Commission for the first and third quarters of each fiscal year on Form N-Q. The Fund’s Forms N-Q are available on the Commission’s website atsec.gov. Beginning with reporting periods on or after March 31, 2019, Form N-PORT will replace Form N-Q. Form N-PORT will be filed with the Securities and Exchange Commission quarterly, and each Fund’s full portfolio holdings as of its first and third quarters of each fiscal year will be made publicly available 60 days after the end of each quarter. The Fund’s schedule of portfolio holdings is also available on the Fund’s website as of the end of each month no sooner than 15 days after the end of the month. |
Mutual Funds:
| | | | |
ARE NOT INSURED BY THE FDIC OR ANY
FEDERAL GOVERNMENT AGENCY | | MAY LOSE VALUE | | ARE NOT A DEPOSIT OF OR GUARANTEED
BY ANY BANK OR ANY BANK AFFILIATE |
PGIM JENNISON GROWTH FUND
| | | | | | | | | | | | | | | | |
| SHARE CLASS | | A | | B | | C | | R | | Z | | R2 | | R4 | | R6* |
| NASDAQ | | PJFAX | | PJFBX | | PJFCX | | PJGRX | | PJFZX | | PJFOX | | PJFPX | | PJFQX |
| CUSIP | | 74437E107 | | 74437E206 | | 74437E305 | | 74437E651 | | 74437E404 | | 74437E420 | | 74437E412 | | 74437E479 |
* Formerly known as Class Q shares.
MF168E2

PGIM ASSET ALLOCATION FUNDS
(Formerly known as Prudential Asset Allocation Funds)
SEMIANNUAL REPORT
MARCH 31, 2019
COMING SOON: PAPERLESS SHAREHOLDER REPORTS
Beginning on January 1, 2021, as permitted by regulations adopted by the Securities and Exchange Commission, paper copies of the Fund’s annual and semiannual shareholder reports will no longer be sent by mail, unless you specifically request paper copies of the reports. Instead, the reports will be made available on the Fund’s website (pgiminvestments.com), and you will be notified by mail each time a report is posted and provided with a website link to access the report.
If you already elected to receive shareholder reports electronically, you will not be affected by this change and you need not take any action. You may elect to receive shareholder reports and other communications from the Fund electronically anytime by contacting your financial intermediary (such as a broker-dealer or bank) or, if you are a direct investor, by calling 1-800-225-1852 or by sending an email request to PGIM Investments at shareholderreports@pgim.com.
You may elect to receive all future reports in paper free of charge. If you invest through a financial intermediary, you can contact your financial intermediary or follow instructions included with this notice to elect to continue to receive paper copies of your shareholder reports. If you invest directly with the Fund, you can call 1-800-225-1852 or send an email request to shareholderreports@pgim.com to let the Fund know you wish to continue receiving paper copies of your shareholder reports. Your election to receive reports in paper will apply to all funds held in your account if you invest through your financial intermediary or all funds held with the fund complex if you invest directly with the Fund.

To enroll in e-delivery, go to pgiminvestments.com/edelivery
|
| Objective:Balanced / Allocation |
This report is not authorized for distribution to prospective investors unless preceded or accompanied by a current prospectus.
The information about the Fund’s portfolio holdings is for the period covered by this report and is subject to change thereafter.
The accompanying financial statements as of March 31, 2019 were not audited and, accordingly, no auditor’s opinion is expressed on them.
Mutual funds are distributed by Prudential Investment Management Services LLC, a Prudential Financial company and member SIPC. QMA is the primary business name of QMA LLC, a registered investment adviser and a wholly owned subsidiary of PGIM, Inc. (PGIM), a Prudential Financial company.© 2019 Prudential Financial, Inc. and its related entities. PGIM and the PGIM logo are service marks of Prudential Financial, Inc. and its related entities, registered in many jurisdictions worldwide.
| | |
| 2 | | Visit our website at pgiminvestments.com |
THE PRUDENTIAL INVESTMENT PORTFOLIOS, INC.
PGIM Conservative Allocation Fund
Supplement dated May 7, 2019 to the Currently Effective
Prospectus, Summary Prospectus and Statement of Additional Information
At the special meeting of shareholders of the PGIM Conservative Allocation Fund (“Conservative Allocation Fund”) held on May 7, 2019, shareholders approved the Conservative Allocation Fund’s reorganization into PGIM Balanced Fund (“Balanced Fund”), a series of The Prudential Investment Portfolios, Inc. Pursuant to the reorganization, the assets and liabilities of the Conservative Allocation Fund will be exchanged for shares of the Balanced Fund, and shareholders of the Conservative Allocation Fund will become shareholders of the Balanced Fund. Shares of the Balanced Fund to be received by the Conservative Allocation Fund shareholders in the reorganization will be equal in value and of the same share class, and each share class will be subject to the same distribution fees, account maintenance fees, and sales charges, including contingent deferred sales charges, if any, as the Conservative Allocation Fund shares held by such shareholders immediately prior to the reorganization.
The reorganization transaction is expected to be completed as of the close of business on the New York Stock Exchange on or about Friday, June 21, 2019. In anticipation of the upcoming reorganization, generally the last day for purchases and exchanges into the Conservative Allocation Fund will be trade date Thursday, June 20, 2019.
The Conservative Allocation Fund is expected to distribute its realized capital gains, if any, to its shareholders prior to the closing date. Conservative Allocation Fund shareholders who do not hold their shares in a tax-advantaged account may receive a taxable capital gain distribution. In addition, it is currently anticipated that all or a substantial portion of the Conservative Allocation Fund’s portfolio securities will be sold and/or redeemed in-kind prior to the closing of the reorganization, and the Conservative Allocation Fund is expected to realize capital gain or loss in connection with those sales. If the Conservative Allocation Fund realizes capital gains, those gains may increase the capital gain distribution paid to shareholders.
LR1202
| | | | |
| PGIM Asset Allocation Funds | | | 3 | |
THE PRUDENTIAL INVESTMENT PORTFOLIOS, INC.
PGIM Moderate Allocation Fund
Supplement dated May 7, 2019 to the Currently Effective
Prospectus, Summary Prospectus and Statement of Additional Information
At the special meeting of shareholders of the PGIM Moderate Allocation Fund (“Moderate Allocation Fund”) held on May 7, 2019, shareholders approved the Moderate Allocation Fund’s reorganization into PGIM Balanced Fund (“Balanced Fund”), a series of The Prudential Investment Portfolios, Inc. Pursuant to the reorganization, the assets and liabilities of the Moderate Allocation Fund will be exchanged for shares of the Balanced Fund, and shareholders of the Moderate Allocation Fund will become shareholders of the Balanced Fund. Shares of the Balanced Fund to be received by the Moderate Allocation Fund shareholders in the reorganization will be equal in value and of the same share class, and each share class will be subject to the same distribution fees, account maintenance fees, and sales charges, including contingent deferred sales charges, if any, as the Moderate Allocation Fund shares held by such shareholders immediately prior to the reorganization.
The reorganization transaction is expected to be completed as of the close of business on the New York Stock Exchange on or about Friday, June 21, 2019. In anticipation of the upcoming reorganization, generally the last day for purchases and exchanges into the Moderate Allocation Fund will be trade date Thursday, June 20, 2019.
The Moderate Allocation Fund is expected to distribute its realized capital gains, if any, to its shareholders prior to the closing date. Moderate Allocation Fund shareholders who do not hold their shares in a tax-advantaged account may receive a taxable capital gain distribution. In addition, it is currently anticipated that all or a substantial portion of the Moderate Allocation Fund’s portfolio securities will be sold and/or redeemed in-kind prior to the closing of the reorganization, and the Moderate Allocation Fund is expected to realize capital gain or loss in connection with those sales. If the Moderate Allocation Fund realizes capital gains, those gains may increase the capital gain distribution paid to shareholders.
LR1203
| | |
| 4 | | Visit our website at pgiminvestments.com |
THE PRUDENTIAL INVESTMENT PORTFOLIOS, INC.
PGIM Growth Allocation Fund
Supplement dated May 7, 2019 to the Currently Effective
Prospectus, Summary Prospectus and Statement of Additional Information
At the special meeting of shareholders of the PGIM Growth Allocation Fund (“Growth Allocation Fund”) held on May 7, 2019, shareholders approved the Growth Allocation Fund’s reorganization into PGIM QMA Large-Cap Core Equity Fund (the “Large-Cap Core Fund”), a series of Prudential Investment Portfolios 9. Pursuant to the reorganization, the assets and liabilities of the Growth Allocation Fund will be exchanged for shares of the Large-Cap Core Fund, and shareholders of the Growth Allocation Fund will become shareholders of the Large-Cap Core Fund. Shares of the Large-Cap Core Fund to be received by the Growth Allocation Fund shareholders in the reorganization will be equal in value and of the same share class, except that Class R shareholders of the Growth Allocation Fund will receive Class A shares of the Large-Cap Core Fund, and each share class will be subject to the same distribution fees, account maintenance fees, and sales charges, including contingent deferred sales charges, if any, as the Growth Allocation Fund shares held by such shareholders immediately prior to the reorganization.
The reorganization transaction is expected to be completed as of the close of business on the New York Stock Exchange on or about Friday, June 21, 2019. In anticipation of the upcoming reorganization generally the last day for purchases and exchanges into the Growth Allocation Fund will be trade date Thursday, June 20, 2019.
The Growth Allocation Fund is expected to distribute its realized capital gains, if any, to its shareholders prior to the closing date. Growth Allocation Fund shareholders who do not hold their shares in a tax-advantaged account may receive a taxable capital gain distribution. In addition, it is currently anticipated that all or a substantial portion of the Growth Allocation Fund’s portfolio securities will be sold and/or redeemed in-kind prior to the closing of the reorganization, and the Growth Allocation Fund is expected to realize capital gain or loss in connection with those sales. If the Growth Allocation Fund realizes capital gains, those gains may increase the capital gain distribution paid to shareholders.
LR1204
| | | | |
| PGIM Asset Allocation Funds | | | 5 | |
Table of Contents
| | |
| 6 | | Visit our website at pgiminvestments.com |
Letter from the President

Dear Shareholder:
We hope you find the semiannual report for PGIM Asset Allocation Funds informative and useful. The report covers performance for the six-month period ended March 31, 2019.
We have important information to share with you. Effective June 11, 2018, Prudential Mutual Funds were renamed PGIM Funds. This renaming is part of our ongoing effort to further build our reputation and establish our global brand, which began when our firm adopted PGIM Investments as its name in April 2017. Please note that only the Fund’s name has changed. Your Fund’s management and operation, along with its symbols, remained the same.*
Regarding your investments with PGIM, we believe it is important to maintain a diversified portfolio of funds consistent with your tolerance for risk, time horizon, and financial goals.
Your financial advisor can help you create a diversified investment plan that may include funds covering all the basic asset classes and that reflects your personal investor profile and risk tolerance. However, diversification and asset allocation strategies do not assure a profit or protect against loss in declining markets.
At PGIM Investments, we consider it a great privilege and responsibility to help investors participate in opportunities across global markets while meeting their toughest investment challenges. PGIM is a top-10 global investment manager with more than $1 trillion in assets under management. This investment expertise allows us to deliver actively managed funds and strategies to meet the needs of investors around the globe.
Thank you for choosing our family of funds.
Sincerely,

Stuart S. Parker, President
PGIM Asset Allocation Funds
May 15, 2019
*The Prudential Day One Funds did not change their names.
| | | | |
| PGIM Asset Allocation Funds | | | 7 | |
PGIM Conservative Allocation Fund
Your Fund’s Performance(unaudited)
Performance data quoted represent past performance. Past performance does not guarantee future results. The investment return and principal value of an investment will fluctuate, so that an investor’s shares, when redeemed, may be worth more or less than their original cost. Current performance may be lower or higher than the past performance data quoted. An investor may obtain performance data as of the most recent month-end by visiting our website atpgiminvestments.com or by calling (800) 225-1852.
| | | | | | | | | | |
| | | Total Returns as of 3/31/19
(without sales charges)
Six Months* (%) | | Average Annual Total Returns as of 3/31/19
(with sales charges) |
| | | One Year (%) | | Five Years (%) | | Ten Years (%) | | Since Inception (%) |
| Class A | | 0.85 | | –3.12 | | 2.62 | | 6.79 | | — |
| Class B | | 0.48 | | –3.04 | | 2.84 | | 6.59 | | — |
| Class C | | 0.56 | | 0.79 | | 3.02 | | 6.60 | | — |
| Class R | | 0.72 | | 2.24 | | 3.53 | | 7.13 | | — |
| Class Z | | 0.97 | | 2.69 | | 4.04 | | 7.66 | | — |
| Class R6** | | 1.05 | | 2.77 | | N/A | | N/A | | 2.36 (11/28/17) |
| Conservative Customized Blend Index |
| | 1.87 | | 4.95 | | 4.51 | | 7.36 | | — |
| Russell 1000 Index |
| | –1.76 | | 9.30 | | 10.63 | | 16.05 | | — |
| S&P 500 Index |
| | –1.72 | | 9.49 | | 10.90 | | 15.91 | | — |
| Lipper Mixed-Asset Target Allocation Conservative Funds Average |
| | | 1.18 | | 2.87 | | 3.39 | | 6.99 | | — |
Source: PGIM Investments LLC and Lipper Inc.
*Not annualized.
**Formerly known as Class Q shares.
Since Inception returns are provided for any share class with less than 10 fiscal years of returns. Since Inception returns for the Indexes and the Lipper Average are measured from the closest month-end to the class’ inception date.
| | |
| 8 | | Visit our website at pgiminvestments.com |
The returns in the tables do not reflect the deduction of taxes that a shareholder would pay on Fund distributions or following the redemption of Fund shares. The average annual total returns take into account applicable sales charges, which are described for each share class in the table below.
| | | | | | | | | | | | |
| | | | | | | |
| | | Class A | | Class B* | | Class C | | Class R | | Class Z | | Class R6** |
| Maximum initial sales charge | | 5.50% of the public offering price | | None | | None | | None | | None | | None |
| Contingent deferred sales charge (CDSC) (as a percentage of the lower of original purchase price or net asset value at redemption) | | 1.00% on sales of $1 million or more made within 12 months of purchase | | 5.00% (Yr.1) 4.00% (Yr.2) 3.00% (Yr.3) 2.00% (Yr.4) 1.00% (Yr.5) 1.00% (Yr.6) 0.00% (Yr.7) | | 1.00% on sales made within 12 months of purchase | | None | | None | | None |
| Annual distribution and service(12b-1) fees (shown as a percentage of average daily net assets) | | 0.30% (0.25% currently) | | 1.00% | | 1.00% | | 0.75% (0.50% currently) | | None | | None |
*Class B shares are closed to all purchase activity and no additional Class B shares may be purchased or acquired except by exchange from Class B shares of another Fund or through dividend or capital gains reinvestment.
**Formerly known as Class Q shares.
Benchmark Definitions
Conservative Customized Blend Index—The Conservative Customized Blend Index is a model portfolio consisting of the Russell 3000 Index (25.5%), the MSCI ACWI ex-US ND Index (10%), the Bloomberg Barclays US Aggregate Bond Index (29%), the Bloomberg Barclays 1-3 Year Government/Credit Index (29%), the FTSE EPRA/NAREIT Developed Net Index (5%), and the FTSE 3-Month T-Bill Index*** (1.5%). The average annual total return for the Index measured from the month-end closest to the inception date of the Fund’s Class R6 shares is 3.49%.
Russell 1000 Index—The Russell 1000 Index is an unmanaged index that consists of the stocks of the 1,000 largest firms in the Russell 3000 Index, an index that represents approximately 98% of the US market. The average annual total return for the Index measured from the month-end closest to the inception date of the Fund’s Class R6 shares is 7.23%.
S&P 500 Index—The S&P 500 Index is an unmanaged index of over 500 stocks of large US public companies. It gives a broad look at how stock prices in the United States have performed. The average annual total return for the Index measured from the month-end closest to the inception date of the Fund’s Class R6 shares is 7.31%.
| | | | |
| PGIM Asset Allocation Funds | | | 9 | |
PGIM Conservative Allocation Fund
Your Fund’s Performance(continued)
Lipper Mixed-Asset Target Allocation Conservative Funds Average—The Lipper Mixed-Asset Target Allocation Conservative Funds Average (Lipper Average) is based on the average return of all funds in the Lipper Mixed-Asset Target Allocation Conservative Funds universe for the periods noted. Funds in the Lipper Average maintain a mix of between 20% and 40% in equity securities with the remainder in bonds, cash, and cash equivalents. The average annual total return for the Lipper Average measured from the month-end closest to the inception date of the Fund’s Class R6 shares is 1.85%.
Investors cannot invest directly in an index or average. The returns for the Indexes would be lower if they included the effects of sales charges, operating expenses of a mutual fund, or taxes. Returns for the Lipper Average reflect the deduction of operating expenses, but not sales charges or taxes.
***Source: London Stock Exchange Group plc and its group undertakings (collectively, the “LSE Group”).© LSE Group 2019. FTSE Russell is a trading name of certain of the LSE Group companies. “FTSE®” and “FTSE Russell®” are trademark(s) of the relevant LSE Group companies and is/are used by any other LSE Group company under license. “TMX®” is a trademark of TSX, Inc. and used by the LSE Group under license. All rights in the FTSE Russell indexes or data vest in the relevant LSE Group company which owns the index or the data. Neither LSE Group nor its licensors accept any liability for any errors or omissions in the indexes or data and no party may rely on any indexes or data contained in this communication. No further distribution of data from the LSE Group is permitted without the relevant LSE Group company’s express written consent. The LSE Group does not promote, sponsor, or endorse the content of this communication.
| | |
| 10 | | Visit our website at pgiminvestments.com |
PGIM Conservative Allocation Fund
Performance Target
The PGIM Conservative Allocation Fund seeks to exceed a performance target—the Conservative Customized Blend Index—consisting of a weighted average return of six securities indexes that are generally considered representative of the asset classes in which the Fund may invest. The chart below shows both the total returns of these indexes for the six-month period ended March 31, 2019, and their weightings in the Conservative Customized Blend Index. The Fund seeks to exceed this target by holding positions in specific PGIM mutual funds. In response to market developments, the Fund’s subadviser may vary its holdings in those funds (within specified ranges).
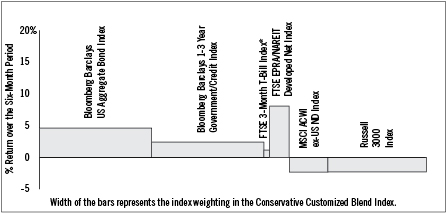
Source: Lipper Inc.
TheBloomberg Barclays US Aggregate Bond Index is an unmanaged index of investment-grade securities issued by the US government and its agencies and by corporations with between one and 10 years remaining to maturity. It gives a broad look at how prices of short- and intermediate-term bonds have performed.
TheBloomberg Barclays 1-3 Year Government/Credit Index is considered representative of the performance of short-term US corporate bonds and US government bonds with maturities from one to three years.
TheFTSE3-MonthT-Bill Index* is an unmanaged index representing monthly return equivalents of yield averages of the last3-month Treasury Bill issues.
TheFTSE EPRA/NAREIT Developed Net Indexis designed to track the performance of listed real estate companies and REITs worldwide.
TheMSCI ACWI ex-US ND Index is a free float-adjusted market capitalization-weighted index that is designed to measure the equity market performance of developed and emerging markets, excluding the US. It comprises approximately 22 developed and 24 emerging market country indexes. The Net Dividend (ND) version of the MSCI ACWI ex-US ND Index reflects the impact of the maximum withholding taxes on reinvested dividends.
TheRussell 3000 Index is an unmanaged index that represents the US equity market—it covers about 98% of all investable stocks in the US.
*Source: London Stock Exchange Group plc and its group undertakings (collectively, the “LSE Group”).© LSE Group 2019. FTSE Russell is a trading name of certain of the LSE Group companies. “FTSE®” and “FTSE Russell®” are trademark(s) of the relevant LSE Group companies and is/are used by any other LSE Group company under license. “TMX®” is a trademark of TSX, Inc. and used by the LSE Group under license. All rights in the FTSE Russell indexes or data vest in the relevant LSE Group company which owns the index or the data. Neither LSE Group nor its licensors accept any liability for any errors or omissions in the indexes or data and no party may rely on any indexes or data contained in this communication. No further distribution of data from the LSE Group is permitted without the relevant LSE Group company’s express written consent. The LSE Group does not promote, sponsor, or endorse the content of this communication.
| | | | |
| PGIM Asset Allocation Funds | | | 11 | |
PGIM Moderate Allocation Fund
Your Fund’s Performance(unaudited)
Performance data quoted represent past performance. Past performance does not guarantee future results. The investment return and principal value of an investment will fluctuate, so that an investor’s shares, when redeemed, may be worth more or less than their original cost. Current performance may be lower or higher than the past performance data quoted. An investor may obtain performance data as of the most recent month-end by visiting our website atpgiminvestments.com or by calling (800) 225-1852.
| | | | | | | | | | |
| | |
| | | Total Returns as of 3/31/19
(without sales charges) | | Average Annual Total Returns as of 3/31/19
(with sales charges) |
| | | Six Months* (%) | | One Year (%) | | Five Years (%) | | Ten Years (%) | | Since Inception (%) |
| Class A | | –1.10 | | –3.94 | | 3.60 | | 8.95 | | — |
| Class B | | –1.51 | | –3.67 | | 3.83 | | 8.74 | | — |
| Class C | | –1.44 | | 0.02 | | 3.99 | | 8.74 | | — |
| Class R | | –1.20 | | 1.44 | | 4.49 | | 9.27 | | — |
| Class Z | | –0.95 | | 1.95 | | 5.04 | | 9.84 | | — |
| Class R6** | | –0.95 | | 1.95 | | N/A | | N/A | | 2.11 (11/28/17) |
| Moderate Customized Blend Index |
| | 0.49 | | 5.55 | | 6.21 | | 10.31 | | — |
| Russell 1000 Index |
| | –1.76 | | 9.30 | | 10.63 | | 16.05 | | — |
| S&P 500 Index |
| | –1.72 | | 9.49 | | 10.90 | | 15.91 | | — |
| Lipper Mixed-Asset Target Allocation Moderate Funds Average*** |
| | –0.03 | | 3.17 | | 4.51 | | 9.04 | | — |
| Lipper Mixed-Asset Target Allocation Growth Funds Average*** |
| | | –1.17 | | 3.25 | | 5.56 | | 10.54 | | — |
Source: PGIM Investments LLC and Lipper Inc.
*Not annualized.
**Formerly known as Class Q shares.
***The Fund is compared to the Lipper Mixed-Asset Target Allocation Moderate Funds Performance Universe, although Lipper classifies the Fund in the Lipper Mixed-Asset Target Allocation Growth Funds Performance Universe. The Lipper Mixed-Asset Target Allocation Moderate Funds Performance Universe is utilized because the Fund’s manager believes that the funds included in this Universe provide a more appropriate basis for Fund performance comparisons.
Since Inception returns are provided for any share class with less than 10 fiscal years of returns. Since Inception returns for the Indexes and the Lipper Averages are measured from the closest month-end to the class’ inception date.
| | |
| 12 | | Visit our website at pgiminvestments.com |
The returns in the tables do not reflect the deduction of taxes that a shareholder would pay on Fund distributions or following the redemption of Fund shares. The average annual total returns take into account applicable sales charges, which are described for each share class in the table below.
| | | | | | | | | | | | |
| | | | | | | |
| | | Class A | | Class B* | | Class C | | Class R | | Class Z | | Class R6** |
| Maximum initial sales charge | | 5.50% of the public offering price | | None | | None | | None | | None | | None |
| Contingent deferred sales charge (CDSC) (as a percentage of the lower of original purchase price or net asset value at redemption) | | 1.00% on sales of $1 million or more made within 12 months of purchase | | 5.00% (Yr.1) 4.00% (Yr.2) 3.00% (Yr.3) 2.00% (Yr.4) 1.00% (Yr.5) 1.00% (Yr.6) 0.00% (Yr.7) | | 1.00% on sales made within 12 months of purchase | | None | | None | | None |
| Annual distribution and service(12b-1) fees (shown as a percentage of average daily net assets) | | 0.30% (0.25% currently) | | 1.00% | | 1.00% | | 0.75% (0.50% currently) | | None | | None |
*Class B shares are closed to all purchase activity and no additional Class B shares may be purchased or acquired except by exchange from Class B shares of another Fund or through dividend or capital gains reinvestment.
**Formerly known as Class Q shares.
Benchmark Definitions
Moderate Customized Blend Index—The Moderate Customized Blend Index is a model portfolio consisting of the Russell 3000 Index (45%), the MSCI ACWI ex-US ND Index (15%), the Bloomberg Barclays US Aggregate Bond Index (19%), the Bloomberg Barclays 1-3 Year Government/Credit Index (14%), the FTSE EPRA/NAREIT Developed Net Index (5%), and the FTSE 3-Month T-Bill Index*** (2%). The average annual total return for the Index measured from the month-end closest to the inception date of the Fund’s Class R6 shares is 4.12%.
Russell 1000 Index—The Russell 1000 Index is an unmanaged index that consists of the stocks of the 1,000 largest firms in the Russell 3000 Index, an index that represents approximately 98% of the US market. The average annual total return for the Index measured from the month-end closest to the inception date of the Fund’s Class R6 shares is 7.23%.
S&P 500 Index—The S&P 500 Index is an unmanaged index of over 500 stocks of large US public companies. It gives a broad look at how stock prices in the United States have performed. The average annual total return for the Index measured from the month-end closest to the inception date of the Fund’s Class R6 shares is 7.31%.
| | | | |
| PGIM Asset Allocation Funds | | | 13 | |
PGIM Moderate Allocation Fund
Your Fund’s Performance(continued)
Lipper Mixed-Asset Target Allocation Moderate Funds Average—The Lipper Mixed-Asset Target Allocation Moderate Funds Average (Lipper Average) is based on an average return of all funds in the Lipper Mixed-Asset Target Allocation Moderate Funds universe for the periods noted. These are funds that, by portfolio practice, maintain a mix of between 40%-60% in equity securities, with the remainder invested in bonds, cash, and cash equivalents. The average annual total return for the Lipper Average measured from the month-end closest to the inception date of the Fund’s Class R6 shares is 2.15%.
Lipper Mixed-Asset Target Allocation Growth Funds Average—The Lipper Mixed-Asset Target Allocation Growth Funds Average (Lipper Average) is based on the average return of all funds in the Lipper Mixed-Asset Target Allocation Growth Funds universe for the periods noted. These are funds that, by portfolio practice, maintain a mix of between 60%-80% in equity securities, with the remainder invested in bonds, cash, and cash equivalents. The average annual total return for the Lipper Average measured from the month-end closest to the inception date of the Fund’s Class R6 shares is 2.53%.
Investors cannot invest directly in an index or average. The returns for the Indexes would be lower if they included the effects of sales charges, operating expenses of a mutual fund, or taxes. Returns for the Lipper Averages reflect the deduction of operating expenses, but not sales charges or taxes.
***Source: London Stock Exchange Group plc and its group undertakings (collectively, the “LSE Group”).© LSE Group 2019. FTSE Russell is a trading name of certain of the LSE Group companies. “FTSE®” and “FTSE Russell®” are trademark(s) of the relevant LSE Group companies and is/are used by any other LSE Group company under license. “TMX®” is a trademark of TSX, Inc. and used by the LSE Group under license. All rights in the FTSE Russell indexes or data vest in the relevant LSE Group company which owns the index or the data. Neither LSE Group nor its licensors accept any liability for any errors or omissions in the indexes or data and no party may rely on any indexes or data contained in this communication. No further distribution of data from the LSE Group is permitted without the relevant LSE Group company’s express written consent. The LSE Group does not promote, sponsor, or endorse the content of this communication.
| | |
| 14 | | Visit our website at pgiminvestments.com |
PGIM Moderate Allocation Fund
Performance Target
The PGIM Moderate Allocation Fund seeks to exceed a performance target—the Moderate Customized Blend Index—consisting of a weighted average return of six securities indexes that are generally considered representative of the asset classes in which the Fund may invest. The chart below shows both the total returns of these indexes for the six-month period ended March 31, 2019, and their weightings in the Moderate Customized Blend Index. The Fund seeks to exceed this target by holding positions in specific PGIM mutual funds. In response to market developments, the Fund’s subadviser may vary its holdings in those funds (within specified ranges).
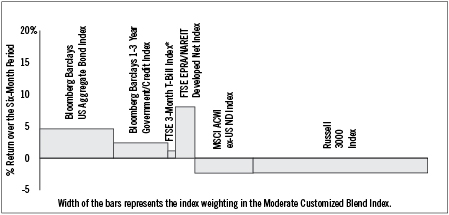
Source: Lipper Inc.
TheBloomberg Barclays US Aggregate Bond Index is an unmanaged index of investment-grade securities issued by the US Government and its agencies and by corporations with between one and 10 years remaining to maturity. It gives a broad look at how prices of short- and intermediate-term bonds have performed.
TheBloomberg Barclays 1-3 Year Government/Credit Index is considered representative of the performance of short-term US corporate bonds and US government bonds with maturities from one to three years.
TheFTSE3-MonthT-Bill Index* is an unmanaged index representing monthly return equivalents of yield averages of the last3-month Treasury Bill issues.
TheFTSE EPRA/NAREIT Developed Net Index is designed to track the performance of listed real estate companies and REITs worldwide.
TheMSCI ACWI ex-US ND Indexis a free float-adjusted market capitalization-weighted index that is designed to measure the equity market performance of developed and emerging markets, excluding the US. It comprises approximately 22 developed and 24 emerging market country indexes. The Net Dividend (ND) version of the MSCI ACWI ex-US ND Index reflects the impact of the maximum withholding taxes on reinvested dividends.
TheRussell 3000 Index is an unmanaged index that represents the US equity market—it covers about 98% of all investable stocks in the US.
*Source: London Stock Exchange Group plc and its group undertakings (collectively, the “LSE Group”).© LSE Group 2019. FTSE Russell is a trading name of certain of the LSE Group companies. “FTSE®” and “FTSE Russell®” are trademark(s) of the relevant LSE Group companies and is/are used by any other LSE Group company under license. “TMX®” is a trademark of TSX, Inc. and used by the LSE Group under license. All rights in the FTSE Russell indexes or data vest in the relevant LSE
Group company which owns the index or the data. Neither LSE Group nor its licensors accept any liability for any errors or omissions in the indexes or data and no party may rely on any indexes or data contained in this communication. No further distribution of data from the LSE Group is permitted without the relevant LSE Group company’s express written consent. The LSE Group does not promote, sponsor, or endorse the content of this communication.
| | | | |
| PGIM Asset Allocation Funds | | | 15 | |
PGIM Growth Allocation Fund
Your Fund’s Performance(unaudited)
Performance data quoted represent past performance. Past performance does not guarantee future results. The investment return and principal value of an investment will fluctuate, so that an investor’s shares, when redeemed, may be worth more or less than their original cost. Current performance may be lower or higher than the past performance data quoted. An investor may obtain performance data as of the most recent month-end by visiting our website atpgiminvestments.com or by calling (800) 225-1852.
| | | | | | | | | | |
| | |
| | | Total Returns as of 3/31/19
(without sales charges) | | Average Annual Total Returns as of 3/31/19
(with sales charges) |
| | | Six Months* (%) | | One Year (%) | | Five Years (%) | | Ten Years (%) | | Since Inception (%) |
| Class A | | –3.18 | | –5.24 | | 4.26 | | 10.88 | | — |
| Class B | | –3.55 | | –5.01 | | 4.50 | | 10.68 | | — |
| Class C | | –3.55 | | –1.42 | | 4.65 | | 10.67 | | — |
| Class R | | –3.34 | | –0.08 | | 5.17 | | 11.23 | | — |
| Class Z | | –3.06 | | 0.51 | | 5.69 | | 11.79 | | — |
| Class R6** | | –3.12 | | 0.45 | | N/A
| | N/A
| | 1.36 (11/28/17) |
| Growth Customized Blend Index |
| | –1.03 | | 5.46 | | 7.52 | | 12.91 | | — |
| Russell 1000 Index |
| | –1.76 | | 9.30 | | 10.63 | | 16.05 | | — |
| S&P 500 Index |
| | –1.72 | | 9.49 | | 10.90 | | 15.91 | | — |
| Lipper Mixed-Asset Target Allocation Aggressive Growth Funds Average |
| | | –3.01 | | 1.28 | | 5.77 | | 11.82 | | — |
Source: PGIM Investments LLC and Lipper Inc.
*Not annualized.
**Formerly known as Class Q shares.
Since Inception returns are provided for any share class with less than 10 fiscal years of returns. Since Inception returns for the Indexes and the Lipper Average are measured from the closest month-end to the class’ inception date.
| | |
| 16 | | Visit our website at pgiminvestments.com |
The returns in the tables do not reflect the deduction of taxes that a shareholder would pay on Fund distributions or following the redemption of Fund shares. The average annual total returns take into account applicable sales charges, which are described for each share class in the table below.
| | | | | | | | | | | | |
| | | | | | | |
| | | Class A | | Class B* | | Class C | | Class R | | Class Z | | Class R6** |
| Maximum initial sales charge | | 5.50% of the public offering price | | None | | None | | None | | None | | None |
| Contingent deferred sales charge (CDSC) (as a percentage of the lower of original purchase price or net asset value at redemption) | | 1.00% on sales of $1 million or more made within 12 months of purchase | | 5.00% (Yr.1) 4.00% (Yr.2) 3.00% (Yr.3) 2.00% (Yr.4) 1.00% (Yr.5) 1.00% (Yr.6) 0.00% (Yr.7) | | 1.00% on sales made within 12 months of purchase | | None | | None | | None |
| Annual distribution and service(12b-1) fees (shown as a percentage of average daily net assets) | | 0.30%
(0.25% currently) | | 1.00% | | 1.00% | | 0.75% (0.50% currently) | | None | | None |
*Class B shares are closed to all purchase activity and no additional Class B shares may be purchased or acquired except by exchange from Class B shares of another Fund or through dividend or capital gains reinvestment.
**Formerly known as Class Q shares.
Benchmark Definitions
Growth Customized Blend Index—The Growth Customized Blend Index is a model portfolio consisting of the Russell 3000 Index (60.5%), the MSCI ACWI ex-US ND Index (24%), the Bloomberg Barclays US Aggregate Bond Index (8%), the FTSE EPRA/NAREIT Developed Net Index (5%), and the FTSE 3-Month T-Bill Index*** (2.5%). The average annual total return for the Index measured from the month-end closest to the inception date of the Fund’s Class R6 shares is 4.24%.
Russell 1000 Index—The Russell 1000 Index is an unmanaged index that consists of the stocks of the 1,000 largest firms in the Russell 3000 Index, an index that represents approximately 98% of the US market. The average annual total return for the Index measured from the month-end closest to the inception date of the Fund’s Class R6 shares is 7.23%.
S&P 500 Index—The S&P 500 Index is an unmanaged index of over 500 stocks of large US public companies. It gives a broad look at how stock prices in the United States have performed. The average annual total return for the Index measured from the month-end closest to the inception date of the Fund’s Class R6 shares is 7.31%.
| | | | |
| PGIM Asset Allocation Funds | | | 17 | |
PGIM Growth Allocation Fund
Your Fund’s Performance(continued)
Lipper Mixed-Asset Target Allocation Aggressive Growth Funds Average—The Lipper Mixed-Asset Target Allocation Aggressive Growth Funds Average (Lipper Average) is based on the average return of all funds in the LipperMixed-Asset Target Allocation Aggressive Growth Funds universe for the periods noted. Funds in the Lipper Average are funds of funds that, by portfolio practice, maintain at least 80% of assets in equity securities, with the remainder invested in bonds, cash, and cash equivalents. The average annual total return for the Lipper Average measured from the month-end closest to the inception date of the Fund’s Class R6 shares is 1.56%.
Investors cannot invest directly in an index or average. The returns for the Indexes would be lower if they included the effects of sales charges, operating expenses of a mutual fund, or taxes. Returns for the Lipper Average reflect the deduction of operating expenses, but not sales charges or taxes.
***Source: London Stock Exchange Group plc and its group undertakings (collectively, the “LSE Group”).© LSE Group 2019. FTSE Russell is a trading name of certain of the LSE Group companies. “FTSE®” and “FTSE Russell®” are trademark(s) of the relevant LSE Group companies and is/are used by any other LSE Group company under license. “TMX®” is a trademark of TSX, Inc. and used by the LSE Group under license. All rights in the FTSE Russell indexes or data vest in the relevant LSE Group company which owns the index or the data. Neither LSE Group nor its licensors accept any liability for any errors or omissions in the indexes or data and no party may rely on any indexes or data contained in this communication. No further distribution of data from the LSE Group is permitted without the relevant LSE Group company’s express written consent. The LSE Group does not promote, sponsor, or endorse the content of this communication.
| | |
| 18 | | Visit our website at pgiminvestments.com |
PGIM Growth Allocation Fund
Performance Target
The PGIM Growth Allocation Fund seeks to exceed a performance target—the Growth Customized Blend Index—consisting of a weighted average return of five securities indexes that are generally considered representative of the asset classes in which the Fund may invest. The chart below shows both the total returns of these indexes for thesix-month period ended March 31, 2019, and their weightings in the Growth Customized Blend Index. The Fund seeks to exceed this target by holding positions in specific PGIM mutual funds. In response to market developments, the Fund’s subadviser may vary its holdings in those funds (within specified ranges).
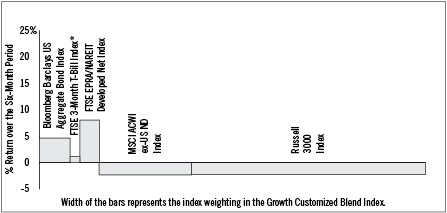
Source: Lipper Inc.
TheBloomberg Barclays US Aggregate Bond Index is an unmanaged index of investment-grade securities issued by the US government and its agencies and by corporations with between one and 10 years remaining to maturity. It gives a broad look at how prices of short- and intermediate-term bonds have performed.
TheFTSE3-MonthT-Bill Index* is an unmanaged index representing monthly return equivalents of yield averages of the last3-month Treasury Bill issues.
TheFTSE EPRA/NAREIT Developed Net Index is designed to track the performance of listed real estate companies and REITs worldwide.
TheMSCI ACWI ex-US ND Indexis a free float-adjusted market capitalization-weighted index that is designed to measure the equity market performance of developed and emerging markets, excluding the US. It comprises approximately 22 developed and 24 emerging market country indexes. The Net Dividend (ND) version of the MSCI ACWI ex-US ND Index reflects the impact of the maximum withholding taxes on reinvested dividends.
TheRussell 3000 Index is an unmanaged index that represents the US equity market—it covers about 98% of all investable stocks in the US.
*Source: London Stock Exchange Group plc and its group undertakings (collectively, the “LSE Group”).© LSE Group 2019. FTSE Russell is a trading name of certain of the LSE Group companies. “FTSE®” and “FTSE Russell®” are trademark(s) of the relevant LSE Group companies and is/are used by any other LSE Group company under license. “TMX®” is a trademark of TSX, Inc. and used by the LSE Group under license. All rights in the FTSE Russell indexes or data vest in the relevant LSE Group company which owns the index or the data. Neither LSE Group nor its licensors accept any liability for any errors or omissions in the indexes or data and no party may rely on any indexes or data contained in this communication. No further distribution of data from the LSE Group is permitted without the relevant LSE Group company’s express written consent. The LSE Group does not promote, sponsor, or endorse the content of this communication.
| | | | |
| PGIM Asset Allocation Funds | | | 19 | |
Fees and Expenses(unaudited)
As a shareholder of a Fund, you incur two types of costs: (1) transaction costs, including sales charges (loads) on purchase payments and redemptions, as applicable, and (2) ongoing costs, including management fees, distribution and/or service (12b-1) fees, and other Fund expenses, as applicable. These examples are intended to help you understand your ongoing costs (in dollars) of investing in the Funds and to compare these costs with the ongoing costs of investing in other mutual funds.
These examples are based on an investment of $1,000 held through the six-month period ended March 31, 2019. These examples are for illustrative purposes only; you should consult the Prospectus for information on initial and subsequent minimum investment requirements.
Actual Expenses
The first line for each share class in the tables on the following pages provides information about actual account values and actual expenses. You may use the information on this line, together with the amount you invested, to estimate the expenses that you paid over the period. Simply divide your account value by $1,000 (for example, an $8,600 account value ÷ $1,000 = 8.6), then multiply the result by the number on the first line under the heading “Expenses Paid During the Six-Month Period” to estimate the expenses you paid on your account during this period.
Hypothetical Example for Comparison Purposes
The second line for each share class in the tables below provides information about hypothetical account values and hypothetical expenses based on the Fund’s actual expense ratio and an assumed rate of return of 5% per year before expenses, which is not the Fund’s actual return. The hypothetical account values and expenses may not be used to estimate the actual ending account balance or expenses you paid for the period. You may use this information to compare the ongoing costs of investing in the Fund and other funds. To do so, compare this 5% hypothetical example with the 5% hypothetical examples that appear in the shareholder reports of the other funds.
The Fund’s transfer agent may charge additional fees to holders of certain accounts that are not included in the expenses shown in the tables on the following pages. These fees apply to individual retirement accounts (IRAs) and Section 403(b) accounts. As of the close of the six-month period covered by the tables, IRA fees included an annual maintenance fee of $15 per account (subject to a maximum annual maintenance fee of $25 for all accounts held by the same shareholder). Section 403(b) accounts are charged an annual $25 fiduciary maintenance fee. Some of the fees may vary in amount, or may be waived, based on your total account balance or the number of PGIM funds, including the Fund, that you own. You should consider the additional fees that were charged to your Fund account over the six-month period when you estimate the total ongoing expenses
| | |
| 20 | | Visit our website at pgiminvestments.com |
paid over the period and the impact of these fees on your ending account value, as these additional expenses are not reflected in the information provided in the expense tables. Additional fees have the effect of reducing investment returns.
Please note that the expenses shown in the tables are meant to highlight your ongoing costs only and do not reflect any transactional costs such as sales charges (loads). Therefore, the second line for each share class in the tables is useful in comparing ongoing costs only and will not help you determine the relative total costs of owning different funds. In addition, if these transactional costs were included, your costs would have been higher.
| | | | | | | | | | | | | | | | | | |
| | | | |
PGIM Conservative
Allocation Fund | | Beginning Account
Value
October 1, 2018 | | | Ending Account
Value March 31, 2019 | | | Annualized
Expense Ratio
Based on the
Six-Month Period | | | Expenses Paid
During the
Six-Month Period* | |
| Class A | | Actual | | $ | 1,000.00 | | | $ | 1,008.50 | | | | 1.20 | % | | $ | 6.01 | |
| | Hypothetical | | $ | 1,000.00 | | | $ | 1,018.95 | | | | 1.20 | % | | $ | 6.04 | |
| Class B | | Actual | | $ | 1,000.00 | | | $ | 1,004.80 | | | | 1.95 | % | | $ | 9.75 | |
| | Hypothetical | | $ | 1,000.00 | | | $ | 1,015.21 | | | | 1.95 | % | | $ | 9.80 | |
| Class C | | Actual | | $ | 1,000.00 | | | $ | 1,005.60 | | | | 1.95 | % | | $ | 9.75 | |
| | Hypothetical | | $ | 1,000.00 | | | $ | 1,015.21 | | | | 1.95 | % | | $ | 9.80 | |
| Class R | | Actual | | $ | 1,000.00 | | | $ | 1,007.20 | | | | 1.45 | % | | $ | 7.26 | |
| | Hypothetical | | $ | 1,000.00 | | | $ | 1,017.70 | | | | 1.45 | % | | $ | 7.29 | |
| Class Z | | Actual | | $ | 1,000.00 | | | $ | 1,009.70 | | | | 0.95 | % | | $ | 4.76 | |
| | Hypothetical | | $ | 1,000.00 | | | $ | 1,020.19 | | | | 0.95 | % | | $ | 4.78 | |
| Class R6** | | Actual | | $ | 1,000.00 | | | $ | 1,010.50 | | | | 0.95 | % | | $ | 4.76 | |
| | | Hypothetical | | $ | 1,000.00 | | | $ | 1,020.19 | | | | 0.95 | % | | $ | 4.78 | |
*Fund expenses (net of fee waivers or subsidies, if any) for each share class are equal to the annualized expense ratio for each share class (provided in the table), multiplied by the average account value over the period, multiplied by the 182 days in the six-month period ended March 31, 2019, and divided by the 365 days in the Fund’s fiscal year ending September 30, 2019 (to reflect the six-month period). Expenses presented in the table include the expenses of any underlying portfolios in which the Fund may invest.
**Formerly known as Class Q shares.
| | | | |
| PGIM Asset Allocation Funds | | | 21 | |
Fees and Expenses(continued)
| | | | | | | | | | | | | | | | | | |
| | | | |
PGIM Moderate
Allocation Fund | | Beginning Account
Value
October 1, 2018 | | | Ending Account
Value March 31, 2019 | | | Annualized
Expense Ratio
Based on the
Six-Month Period | | | Expenses Paid
During the
Six-Month Period* | |
| Class A | | Actual | | $ | 1,000.00 | | | $ | 989.00 | | | | 1.27 | % | | $ | 6.30 | |
| | Hypothetical | | $ | 1,000.00 | | | $ | 1,018.60 | | | | 1.27 | % | | $ | 6.39 | |
| Class B | | Actual | | $ | 1,000.00 | | | $ | 984.90 | | | | 2.02 | % | | $ | 10.00 | |
| | Hypothetical | | $ | 1,000.00 | | | $ | 1,014.86 | | | | 2.02 | % | | $ | 10.15 | |
| Class C | | Actual | | $ | 1,000.00 | | | $ | 985.60 | | | | 2.02 | % | | $ | 10.00 | |
| | Hypothetical | | $ | 1,000.00 | | | $ | 1,014.86 | | | | 2.02 | % | | $ | 10.15 | |
| Class R | | Actual | | $ | 1,000.00 | | | $ | 988.00 | | | | 1.52 | % | | $ | 7.53 | |
| | Hypothetical | | $ | 1,000.00 | | | $ | 1,017.35 | | | | 1.52 | % | | $ | 7.64 | |
| Class Z | | Actual | | $ | 1,000.00 | | | $ | 990.50 | | | | 1.02 | % | | $ | 5.06 | |
| | Hypothetical | | $ | 1,000.00 | | | $ | 1,019.85 | | | | 1.02 | % | | $ | 5.14 | |
| Class R6** | | Actual | | $ | 1,000.00 | | | $ | 990.50 | | | | 1.02 | % | | $ | 5.06 | |
| | | Hypothetical | | $ | 1,000.00 | | | $ | 1,019.85 | | | | 1.02 | % | | $ | 5.14 | |
*Fund expenses (net of fee waivers or subsidies, if any) for each share class are equal to the annualized expense ratio for each share class (provided in the table), multiplied by the average account value over the period, multiplied by the 182 days in the six-month period ended March 31, 2019, and divided by the 365 days in the Fund’s fiscal year ending September 30, 2019 (to reflect the six-month period). Expenses presented in the table include the expenses of any underlying portfolios in which the Fund may invest.
**Formerly known as Class Q shares.
| | | | | | | | | | | | | | | | | | |
| | | | |
PGIM Growth
Allocation Fund | | Beginning Account
Value
October 1, 2018 | | | Ending Account
Value March 31, 2019 | | | Annualized
Expense Ratio
Based on the
Six-Month Period | | | Expenses Paid
During the
Six-Month Period* | |
| Class A | | Actual | | $ | 1,000.00 | | | $ | 968.20 | | | | 1.35 | % | | $ | 6.62 | |
| | Hypothetical | | $ | 1,000.00 | | | $ | 1,018.20 | | | | 1.35 | % | | $ | 6.79 | |
| Class B | | Actual | | $ | 1,000.00 | | | $ | 964.50 | | | | 2.10 | % | | $ | 10.29 | |
| | Hypothetical | | $ | 1,000.00 | | | $ | 1,014.46 | | | | 2.10 | % | | $ | 10.55 | |
| Class C | | Actual | | $ | 1,000.00 | | | $ | 964.50 | | | | 2.10 | % | | $ | 10.29 | |
| | Hypothetical | | $ | 1,000.00 | | | $ | 1,014.46 | | | | 2.10 | % | | $ | 10.55 | |
| Class R | | Actual | | $ | 1,000.00 | | | $ | 966.60 | | | | 1.60 | % | | $ | 7.84 | |
| | Hypothetical | | $ | 1,000.00 | | | $ | 1,016.95 | | | | 1.60 | % | | $ | 8.05 | |
| Class Z | | Actual | | $ | 1,000.00 | | | $ | 969.40 | | | | 1.10 | % | | $ | 5.40 | |
| | Hypothetical | | $ | 1,000.00 | | | $ | 1,019.45 | | | | 1.10 | % | | $ | 5.54 | |
| Class R6** | | Actual | | $ | 1,000.00 | | | $ | 968.80 | | | | 1.10 | % | | $ | 5.40 | |
| | | Hypothetical | | $ | 1,000.00 | | | $ | 1,019.45 | | | | 1.10 | % | | $ | 5.54 | |
*Fund expenses (net of fee waivers or subsidies, if any) for each share class are equal to the annualized expense ratio for each share class (provided in the table), multiplied by the average account value over the period, multiplied by the 182 days in the six-month period ended March 31, 2019, and divided by the 365 days in the Fund’s fiscal year ending September 30, 2019 (to reflect the six-month period). Expenses presented in the table include the expenses of any underlying portfolios in which the Fund may invest.
**Formerly known as Class Q shares.
| | |
| 22 | | Visit our website at pgiminvestments.com |
PGIM Conservative Allocation Fund
Schedule of Investments(unaudited)
as of March 31, 2019
| | | | | | | | |
| Description | | Shares | | | Value | |
LONG-TERM INVESTMENTS 99.1% | | | | | | | | |
| | |
AFFILIATED MUTUAL FUNDS | | | | | | | | |
PGIM Absolute Return Bond Fund (Class R6) | | | 433,826 | | | $ | 4,199,437 | |
PGIM Global Real Estate Fund (Class R6) | | | 232,770 | | | | 5,961,252 | |
PGIM Government Income Fund (Class R6) | | | 746,647 | | | | 7,055,815 | |
PGIM High Yield Fund (Class R6) | | | 112,307 | | | | 606,456 | |
PGIM Jennison 20/20 Focus Fund (Class R6) | | | 74,049 | | | | 1,195,889 | |
PGIM Jennison Equity Opportunity Fund (Class R6) | | | 144,764 | | | | 2,410,318 | |
PGIM Jennison Growth Fund (Class R6) | | | 53,442 | | | | 2,300,696 | |
PGIM Jennison International Opportunities Fund (Class R6) | | | 257,982 | | | | 4,708,177 | |
PGIM JennisonMid-Cap Growth Fund (Class R6)* | | | 60,966 | | | | 1,876,527 | |
PGIM Jennison Natural Resources Fund (Class R6) | | | 3,581 | | | | 121,517 | |
PGIM Jennison Small Company Fund (Class R6) | | | 201,466 | | | | 4,508,811 | |
PGIM Jennison Value Fund (Class R6) | | | 258,534 | | | | 4,798,388 | |
PGIM QMA International Equity Fund (Class R6) | | | 995,670 | | | | 7,069,253 | |
PGIM QMALarge-Cap Core Equity Fund (Class R6) | | | 197,344 | | | | 2,891,087 | |
PGIM QMALarge-Cap Value Fund (Class R6) | | | 463,507 | | | | 5,715,043 | |
PGIM QMA Long-Short Equity Fund (Class R6)* | | | 287,765 | | | | 3,599,937 | |
PGIM QMAMid-Cap Value Fund (Class R6) | | | 106,223 | | | | 1,920,504 | |
PGIM QMASmall-Cap Value Fund (Class R6) | | | 82,609 | | | | 1,371,309 | |
PGIM Short Duration Multi-Sector Bond Fund (Class R6) | | | 4,108,884 | | | | 39,445,289 | |
PGIM Short-Term Corporate Bond Fund (Class R6) | | | 55,733 | | | | 609,161 | |
PGIM Total Return Bond Fund (Class R6) | | | 1,143,602 | | | | 16,422,128 | |
| | | | | | | | |
TOTAL LONG-TERM INVESTMENTS
(cost $103,852,028) | | | | | | | 118,786,994 | |
| | | | | | | | |
| | |
SHORT-TERM INVESTMENT 1.0% | | | | | | | | |
| | |
AFFILIATED MUTUAL FUND | | | | | | | | |
PGIM Core Ultra Short Bond Fund
(cost $1,231,294) | | | 1,231,294 | | | | 1,231,294 | |
| | | | | | | | |
TOTAL INVESTMENTS 100.1%
(cost $105,083,322)(w) | | | | | | | 120,018,288 | |
Liabilities in excess of other assets (0.1)% | | | | | | | (92,664 | ) |
| | | | | | | | |
NET ASSETS 100.0% | | | | | | $ | 119,925,624 | |
| | | | | | | | |
| * | Non-income producing security. |
| (w) | PGIM Investments LLC, the manager of the Fund, also serves as the manager of the underlying funds in which the Fund invests. |
See Notes to Financial Statements.
| | | | |
| PGIM Asset Allocation Funds | | | 23 | |
PGIM Conservative Allocation Fund
Schedule of Investments (unaudited) (continued)
as of March 31, 2019
Fair Value Measurements:
Various inputs are used in determining the value of the Fund’s investments. These inputs are summarized in the three broad levels listed below.
Level 1—unadjusted quoted prices generally in active markets for identical securities.
Level 2—quoted prices for similar securities, interest rates and yield curves, prepayment speeds, foreign currency exchange rates and other observable inputs.
Level 3—unobservable inputs for securities valued in accordance with Board approved fair valuation procedures.
The following is a summary of the inputs used as of March 31, 2019 in valuing such portfolio securities:
| | | | | | | | | | | | |
| | | Level 1 | | | Level 2 | | | Level 3 | |
Investments in Securities | | | | | | | | | | | | |
Affiliated Mutual Funds | | $ | 120,018,288 | | | $ | — | | | $ | — | |
| | | | | | | | | | | | |
Investment Allocation:
The investment allocation of portfolio holdings and liabilities in excess of other assets shown as a percentage of net assets as of March 31, 2019 were as follows:
| | | | |
Multi-Sector Debt | | | 50.1 | % |
International | | | 9.8 | |
Large-Cap Value | | | 8.8 | |
U.S. Government Debt | | | 5.9 | |
Large/Mid-Cap Growth | | | 5.5 | |
Global Real Estate | | | 5.0 | |
Small-Cap Core | | | 3.8 | |
Large-Cap Core | | | 3.4 | |
Long-Short Cap | | | 3.0 | |
Small/Mid-Cap Value | | | 2.7 | |
Short-Term Investment | | | 1.0 | % |
Short-Term Debt | | | 0.5 | |
High Yield | | | 0.5 | |
Natural Resources | | | 0.1 | |
| | | | |
| | | 100.1 | |
Liabilities in excess of other assets | | | (0.1 | ) |
| | | | |
| | | 100.0 | % |
| | | | |
See Notes to Financial Statements.
PGIM Conservative Allocation Fund
Statement of Assets & Liabilities(unaudited)
as of March 31, 2019
| | | | |
Assets | | | | |
Affiliated investments (cost $105,083,322) | | $ | 120,018,288 | |
Receivable for investments sold | | | 370,000 | |
Due from Manager | | | 11,520 | |
Receivable for Fund shares sold | | | 9,781 | |
Prepaid expenses | | | 20,159 | |
| | | | |
Total Assets | | | 120,429,748 | |
| | | | |
| |
Liabilities | | | | |
Payable for investments purchased | | | 370,000 | |
Distribution fee payable | | | 40,409 | |
Custodian and accounting fees payable | | | 31,475 | |
Accrued expenses and other liabilities | | | 25,869 | |
Payable for Fund shares reacquired | | | 20,046 | |
Affiliated transfer agent fee payable | | | 16,325 | |
| | | | |
Total Liabilities | | | 504,124 | |
| | | | |
| |
Net Assets | | $ | 119,925,624 | |
| | | | |
| | | | | |
Net assets were comprised of: | | | | |
Common stock, at par | | $ | 9,742 | |
Paid-in capital in excess of par | | | 102,944,416 | |
Total distributable earnings (loss) | | | 16,971,466 | |
| | | | |
Net assets, March 31, 2019 | | $ | 119,925,624 | |
| | | | |
See Notes to Financial Statements.
| | | | |
| PGIM Asset Allocation Funds | | | 25 | |
PGIM Conservative Allocation Fund
Statement of Assets & Liabilities(unaudited) (continued)
as of March 31, 2019
| | | | |
Class A | | | | |
Net asset value and redemption price per share,
($85,424,052 ÷ 6,933,926 shares of common stock issued and outstanding) | | $ | 12.32 | |
Maximum sales charge (5.50% of offering price) | | | 0.72 | |
| | | | |
Maximum offering price to public | | $ | 13.04 | |
| | | | |
| |
Class B | | | | |
Net asset value, offering price and redemption price per share, | | | | |
($3,731,332 ÷ 304,568 shares of common stock issued and outstanding) | | $ | 12.25 | |
| | | | |
| |
Class C | | | | |
Net asset value, offering price and redemption price per share, | | | | |
($22,589,588 ÷ 1,843,083 shares of common stock issued and outstanding) | | $ | 12.26 | |
| | | | |
| |
Class R | | | | |
Net asset value, offering price and redemption price per share, | | | | |
($184,172 ÷ 14,890 shares of common stock issued and outstanding) | | $ | 12.37 | |
| | | | |
| |
Class Z | | | | |
Net asset value, offering price and redemption price per share, | | | | |
($7,933,409 ÷ 640,657 shares of common stock issued and outstanding) | | $ | 12.38 | |
| | | | |
| |
Class R6 | | | | |
Net asset value, offering price and redemption price per share, | | | | |
($63,071 ÷ 5,096 shares of common stock issued and outstanding) | | $ | 12.38 | |
| | | | |
See Notes to Financial Statements.
PGIM Conservative Allocation Fund
Statement of Operations(unaudited)
Six Months Ended March 31, 2019
| | | | |
Net Investment Income (Loss) | | | | |
Affiliated dividend income | | $ | 2,248,081 | |
| | | | |
| |
Expenses | | | | |
Management fee | | | 59,681 | |
Distribution fee(a) | | | 261,525 | |
Transfer agent’s fees and expenses (including affiliated expense of $37,587)(a) | | | 70,793 | |
Custodian and accounting fees | | | 49,905 | |
Registration fees(a) | | | 42,667 | |
Shareholders’ reports | | | 19,550 | |
Audit fee | | | 11,531 | |
Legal fees and expenses | | | 10,970 | |
Directors’ fees | | | 7,144 | |
Miscellaneous | | | 6,190 | |
| | | | |
Total expenses | | | 539,956 | |
Less: Fee waiver and/or expense reimbursement(a) | | | (69,449 | ) |
Distribution fee waiver(a) | | | (21,008 | ) |
| | | | |
Net expenses | | | 449,499 | |
| | | | |
Net investment income (loss) | | | 1,798,582 | |
| | | | |
| |
Realized And Unrealized Gain (Loss) On Affiliated Investments | | | | |
Net realized gain (loss) on investment transactions | | | 495,555 | |
Affiliated net capital gain distributions received | | | 3,274,647 | |
| | | | |
| | | 3,770,202 | |
| | | | |
Net change in unrealized appreciation (depreciation) on investments | | | (4,943,857 | ) |
| | | | |
Net gain (loss) on investment transactions | | | (1,173,655 | ) |
| | | | |
Net Increase (Decrease) In Net Assets Resulting From Operations | | $ | 624,927 | |
| | | | |
| (a) | Class specific expenses and waivers were as follows: |
| | | | | | | | | | | | | | | | | | | | | | | | |
| | | Class A | | | Class B | | | Class C | | | Class R | | | Class Z | | | Class R6 | |
Distribution fee | | | 124,724 | | | | 20,991 | | | | 115,151 | | | | 659 | | | | — | | | | — | |
Transfer agent’s fees and expenses | | | 46,197 | | | | 7,720 | | | | 12,767 | | | | 131 | | | | 3,935 | | | | 43 | |
Registration fees | | | 7,276 | | | | 7,003 | | | | 7,235 | | | | 6,369 | | | | 7,059 | | | | 7,725 | |
Fee waiver and/or expense reimbursement | | | (23,033 | ) | | | (13,119 | ) | | | (11,444 | ) | | | (6,436 | ) | | | (7,670 | ) | | | (7,747 | ) |
Distribution fee waiver | | | (20,788 | ) | | | — | | | | — | | | | (220 | ) | | | — | | | | — | |
See Notes to Financial Statements.
| | | | |
| PGIM Asset Allocation Funds | | | 27 | |
PGIM Conservative Allocation Fund
Statements of Changes in Net Assets(unaudited)
| | | | | | | | |
| | |
| | | Six Months Ended
March 31, 2019 | | | Year Ended
September 30, 2018 | |
Increase (Decrease) in Net Assets | | | | | | | | |
Operations | | | | | | | | |
Net investment income (loss) | | $ | 1,798,582 | | | $ | 2,036,603 | |
Net realized gain (loss) on investment transactions | | | 495,555 | | | | 1,789,881 | |
Affiliated net capital gain distributions received | | | 3,274,647 | | | | 2,815,364 | |
Net change in unrealized appreciation (depreciation) on investments | | | (4,943,857 | ) | | | (2,223,209 | ) |
| | | | | | | | |
Net increase (decrease) in net assets resulting from operations | | | 624,927 | | | | 4,418,639 | |
| | | | | | | | |
| | |
Dividends and Distributions | | | | | | | | |
Distributions from distributable earnings* | | | | | | | | |
Class A | | | (4,946,926 | ) | | | — | |
Class B | | | (231,044 | ) | | | — | |
Class C | | | (1,304,924 | ) | | | — | |
Class R | | | (10,111 | ) | | | — | |
Class Z | | | (594,377 | ) | | | — | |
Class R6 | | | (3,652 | ) | | | — | |
| | | | | | | | |
| | | (7,091,034 | ) | | | — | |
| | | | | | | | |
Dividends from net investment income* | | | | | | | | |
Class A | | | | | | | (2,083,637 | ) |
Class B | | | | | | | (104,648 | ) |
Class C | | | | | | | (424,935 | ) |
Class R | | | | | | | (3,521 | ) |
Class Z | | | | | | | (210,838 | ) |
Class R6 | | | | | | | (463 | ) |
| | | | | | | | |
| | | * | | | | (2,828,042 | ) |
| | | | | | | | |
Distributions from net realized gains and capital gain distributions received* | | | | | | | | |
Class A | | | | | | | (1,645,904 | ) |
Class B | | | | | | | (122,528 | ) |
Class C | | | | | | | (490,474 | ) |
Class R | | | | | | | (3,060 | ) |
Class Z | | | | | | | (141,291 | ) |
Class R6 | | | | | | | (184 | ) |
| | | | | | | | |
| | | * | | | | (2,403,441 | ) |
| | | | | | | | |
See Notes to Financial Statements.
PGIM Conservative Allocation Fund
Statements of Changes in Net Assets(unaudited) (continued)
| | | | | | | | |
| | |
| | | Six Months Ended
March 31, 2019 | | | Year Ended
September 30, 2018 | |
Fund share transactions (Net of share conversions) | | | | | | | | |
Net proceeds from shares sold | | $ | 5,771,309 | | | $ | 16,191,190 | |
Net asset value of shares issued in reinvestment of dividends and distributions | | | 6,939,821 | | | | 5,097,809 | |
Cost of shares reacquired | | | (14,079,543 | ) | | | (22,184,420 | ) |
| | | | | | | | |
Net increase (decrease) in net assets from Fund share transactions | | | (1,368,413 | ) | | | (895,421 | ) |
| | | | | | | | |
Total increase (decrease) | | | (7,834,520 | ) | | | (1,708,265 | ) |
| | |
Net Assets: | | | | | | | | |
Beginning of period | | | 127,760,144 | | | | 129,468,409 | |
| | | | | | | | |
End of period(a) | | $ | 119,925,624 | | | $ | 127,760,144 | |
| | | | | | | | |
(a) Includes undistributed/(distributions in excess of) net investment income of: | | $ | * | | | $ | 415,680 | |
| | | | | | | | |
| * | For the period ended March 31, 2019, the disclosures have been revised to reflect revisions to RegulationS-X adopted by the SEC in 2018 (refer to Note 9). |
See Notes to Financial Statements.
| | | | |
| PGIM Asset Allocation Funds | | | 29 | |
PGIM Moderate Allocation Fund
Schedule of Investments (unaudited)
as of March 31, 2019
| | | | | | | | |
| Description | | Shares | | | Value | |
LONG-TERM INVESTMENTS 99.1% | | | | | | | | |
| | |
AFFILIATED MUTUAL FUNDS | | | | | | | | |
PGIM Absolute Return Bond Fund (Class R6) | | | 308,100 | | | $ | 2,982,412 | |
PGIM Global Real Estate Fund (Class R6) | | | 288,561 | | | | 7,390,039 | |
PGIM Government Income Fund (Class R6) | | | 439,399 | | | | 4,152,318 | |
PGIM High Yield Fund (Class R6) | | | 109,927 | | | | 593,604 | |
PGIM Jennison 20/20 Focus Fund (Class R6) | | | 184,353 | | | | 2,977,302 | |
PGIM Jennison Equity Opportunity Fund (Class R6) | | | 358,195 | | | | 5,963,949 | |
PGIM Jennison Growth Fund (Class R6) | | | 79,901 | | | | 3,439,744 | |
PGIM Jennison International Opportunities Fund (Class R6) | | | 480,310 | | | | 8,765,659 | |
PGIM JennisonMid-Cap Growth Fund (Class R6)* | | | 157,796 | | | | 4,856,961 | |
PGIM Jennison Natural Resources Fund (Class R6) | | | 4,321 | | | | 146,622 | |
PGIM Jennison Small Company Fund (Class R6) | | | 415,758 | | | | 9,304,659 | |
PGIM Jennison Value Fund (Class R6) | | | 560,445 | | | | 10,401,863 | |
PGIM QMA International Equity Fund (Class R6) | | | 1,820,676 | | | | 12,926,797 | |
PGIM QMALarge-Cap Core Equity Fund (Class R6) | | | 667,232 | | | | 9,774,945 | |
PGIM QMALarge-Cap Value Fund (Class R6) | | | 815,062 | | | | 10,049,716 | |
PGIM QMA Long-Short Equity Fund (Class R6)* | | | 474,735 | | | | 5,938,936 | |
PGIM QMAMid-Cap Value Fund (Class R6) | | | 266,924 | | | | 4,825,993 | |
PGIM QMASmall-Cap Value Fund (Class R6) | | | 178,075 | | | | 2,956,046 | |
PGIM Short Duration Multi-Sector Bond Fund (Class R6) | | | 2,597,915 | | | | 24,939,980 | |
PGIM Total Return Bond Fund (Class R6) | | | 1,034,218 | | | | 14,851,364 | |
| | | | | | | | |
TOTAL LONG-TERM INVESTMENTS
(cost $119,448,864) | | | | | | | 147,238,909 | |
| | | | | | | | |
| | |
SHORT-TERM INVESTMENT 0.8% | | | | | | | | |
| | |
AFFILIATED MUTUAL FUND | | | | | | | | |
PGIM Core Ultra Short Bond Fund
(cost $1,172,691) | | | 1,172,691 | | | | 1,172,691 | |
| | | | | | | | |
TOTAL INVESTMENTS 99.9%
(cost $120,621,555)(w) | | | | | | | 148,411,600 | |
Other assets in excess of liabilities 0.1% | | | | | | | 169,405 | |
| | | | | | | | |
NET ASSETS 100.0% | | | | | | $ | 148,581,005 | |
| | | | | | | | |
| * | Non-income producing security. |
| (w) | PGIM Investments LLC, the manager of the Fund, also serves as the manager of the underlying funds in which the Fund invests. |
Fair Value Measurements:
Various inputs are used in determining the value of the Fund’s investments. These inputs are summarized in the three broad levels listed below.
See Notes to Financial Statements.
PGIM Moderate Allocation Fund
Schedule of Investments(unaudited) (continued)
as of March 31, 2019
Level 1—unadjusted quoted prices generally in active markets for identical securities.
Level 2—quoted prices for similar securities, interest rates and yield curves, prepayment speeds, foreign currency exchange rates and other observable inputs.
Level 3—unobservable inputs for securities valued in accordance with Board approved fair valuation procedures.
The following is a summary of the inputs used as of March 31, 2019 in valuing such portfolio securities:
| | | | | | | | | | | | |
| | | Level 1 | | | Level 2 | | | Level 3 | |
Investments in Securities | | | | | | | | | | | | |
Affiliated Mutual Funds | | $ | 148,411,600 | | | $ | — | | | $ | — | |
| | | | | | | | | | | | |
Investment Allocation:
The investment allocation of portfolio holdings and other assets in excess of liabilities shown as a percentage of net assets as of March 31, 2019 were as follows:
| | | | |
Multi-Sector Debt | | | 28.8 | % |
International | | | 14.6 | |
Large-Cap Value | | | 13.8 | |
Large/Mid-Cap Growth | | | 9.6 | |
Large-Cap Core | | | 8.6 | |
Small-Cap Core | | | 6.2 | |
Small/Mid-Cap Value | | | 5.2 | |
Global Real Estate | | | 5.0 | |
Long-Short Cap | | | 4.0 | |
U.S. Government Debt | | | 2.8 | |
Short-Term Investment | | | 0.8 | % |
High Yield | | | 0.4 | |
Natural Resources | | | 0.1 | |
| | | | |
| | | 99.9 | |
Other assets in excess of liabilities | | | 0.1 | |
| | | | |
| | | 100.0 | % |
| | | | |
See Notes to Financial Statements.
| | | | |
| PGIM Asset Allocation Funds | | | 31 | |
PGIM Moderate Allocation Fund
Statement of Assets & Liabilities(unaudited)
as of March 31, 2019
| | | | |
Assets | | | | |
Affiliated investments (cost $120,621,555) | | $ | 148,411,600 | |
Receivable for investments sold | | | 640,000 | |
Receivable for Fund shares sold | | | 79,402 | |
Due from Manager | | | 11,898 | |
Prepaid expenses | | | 19,042 | |
| | | | |
Total Assets | | | 149,161,942 | |
| | | | |
| |
Liabilities | | | | |
Payable for investments purchased | | | 300,000 | |
Payable for Fund shares reacquired | | | 143,659 | |
Distribution fee payable | | | 50,432 | |
Custodian and accounting fees payable | | | 31,995 | |
Accrued expenses and other liabilities | | | 27,693 | |
Affiliated transfer agent fee payable | | | 27,158 | |
| | | | |
Total Liabilities | | | 580,937 | |
| | | | |
| |
Net Assets | | $ | 148,581,005 | |
| | | | |
| | | | | |
Net assets were comprised of: | | | | |
Common stock, at par | | $ | 10,750 | |
Paid-in capital in excess of par | | | 115,176,089 | |
Total distributable earnings (loss) | | | 33,394,166 | |
| | | | |
Net assets, March 31, 2019 | | $ | 148,581,005 | |
| | | | |
See Notes to Financial Statements.
PGIM Moderate Allocation Fund
Statement of Assets & Liabilities(unaudited) (continued)
as of March 31, 2019
| | | | |
Class A | | | | |
Net asset value and redemption price per share,
($116,092,503 ÷ 8,386,789 shares of common stock issued and outstanding) | | $ | 13.84 | |
Maximum sales charge (5.50% of offering price) | | | 0.81 | |
| | | | |
Maximum offering price to public | | $ | 14.65 | |
| | | | |
| |
Class B | | | | |
Net asset value, offering price and redemption price per share, | | | | |
($7,323,812 ÷ 532,954 shares of common stock issued and outstanding) | | $ | 13.74 | |
| | | | |
| |
Class C | | | | |
Net asset value, offering price and redemption price per share, | | | | |
($21,971,940 ÷ 1,599,440 shares of common stock issued and outstanding) | | $ | 13.74 | |
| | | | |
| |
Class R | | | | |
Net asset value, offering price and redemption price per share, | | | | |
($194,989 ÷ 14,170 shares of common stock issued and outstanding) | | $ | 13.76 | |
| | | | |
| |
Class Z | | | | |
Net asset value, offering price and redemption price per share, | | | | |
($2,987,479 ÷ 215,746 shares of common stock issued and outstanding) | | $ | 13.85 | |
| | | | |
| |
Class R6 | | | | |
Net asset value, offering price and redemption price per share, | | | | |
($10,282 ÷ 742 shares of common stock issued and outstanding) | | $ | 13.85 | |
| | | | |
See Notes to Financial Statements.
| | | | |
| PGIM Asset Allocation Funds | | | 33 | |
PGIM Moderate Allocation Fund
Statement of Operations(unaudited)
Six Months Ended March 31, 2019
| | | | |
Net Investment Income (Loss) | | | | |
Affiliated dividend income | | $ | 2,498,682 | |
| | | | |
| |
Expenses | | | | |
Management fee | | | 74,288 | |
Distribution fee(a) | | | 324,068 | |
Transfer agent’s fees and expenses (including affiliated expense of $61,634)(a) | | | 103,971 | |
Custodian and accounting fees | | | 49,505 | |
Registration fees(a) | | | 43,656 | |
Shareholders’ reports | | | 23,268 | |
Audit fee | | | 11,495 | |
Legal fees and expenses | | | 11,417 | |
Directors’ fees | | | 7,711 | |
Miscellaneous | | | 6,377 | |
| | | | |
Total expenses | | | 655,756 | |
Less: Fee waiver and/or expense reimbursement(a) | | | (71,692 | ) |
Distribution fee waiver(a) | | | (29,098 | ) |
| | | | |
Net expenses | | | 554,966 | |
| | | | |
Net investment income (loss) | | | 1,943,716 | |
| | | | |
| |
Realized And Unrealized Gain (Loss) On Affiliated Investments | | | | |
Net realized gain (loss) on investment transactions | | | 524,453 | |
Affiliated net capital gain distributions received | | | 7,716,198 | |
| | | | |
| | | 8,240,651 | |
| | | | |
Net change in unrealized appreciation (depreciation) on investments | | | (12,593,093 | ) |
| | | | |
Net gain (loss) on investment transactions | | | (4,352,442 | ) |
| | | | |
Net Increase (Decrease) In Net Assets Resulting From Operations | | $ | (2,408,726 | ) |
| | | | |
| (a) | Class specific expenses and waivers were as follows: |
| | | | | | | | | | | | | | | | | | | | | | | | |
| | | Class A | | | Class B | | | Class C | | | Class R | | | Class Z | | | Class R6 | |
Distribution fee | | | 173,246 | | | | 39,852 | | | | 110,300 | | | | 670 | | | | — | | | | — | |
Transfer agent’s fees and expenses | | | 74,466 | | | | 13,903 | | | | 13,426 | | | | 121 | | | | 2,032 | | | | 23 | |
Registration fees | | | 7,835 | | | | 7,007 | | | | 7,435 | | | | 6,687 | | | | 7,054 | | | | 7,638 | |
Fee waiver and/or expense reimbursement | | | (23,346 | ) | | | (16,766 | ) | | | (9,568 | ) | | | (6,718 | ) | | | (7,638 | ) | | | (7,656 | ) |
Distribution fee waiver | | | (28,875 | ) | | | — | | | | — | | | | (223 | ) | | | — | | | | — | |
See Notes to Financial Statements.
PGIM Moderate Allocation Fund
Statements of Changes in Net Assets(unaudited)
| | | | | | | | |
| | |
| | | Six Months Ended
March 31, 2019 | | | Year Ended
September 30, 2018 | |
Increase (Decrease) in Net Assets | | | | | | | | |
Operations | | | | | | | | |
Net investment income (loss) | | $ | 1,943,716 | | | $ | 1,861,739 | |
Net realized gain (loss) on investment transactions | | | 524,453 | | | | 3,127,396 | |
Affiliated net capital gain distributions received | | | 7,716,198 | | | | 6,795,956 | |
Net change in unrealized appreciation (depreciation) on investments | | | (12,593,093 | ) | | | (1,884,685 | ) |
| | | | | | | | |
Net increase (decrease) in net assets resulting from operations | | | (2,408,726 | ) | | | 9,900,406 | |
| | | | | | | | |
| | |
Dividends and Distributions | | | | | | | | |
Distributions from distributable earnings* | | | | | | | | |
Class A | | | (10,273,510 | ) | | | — | |
Class B | | | (640,589 | ) | | | — | |
Class C | | | (1,792,745 | ) | | | — | |
Class R | | | (15,270 | ) | | | — | |
Class Z | | | (251,752 | ) | | | — | |
Class R6 | | | (887 | ) | | | — | |
| | | | | | | | |
| | | (12,974,753 | ) | | | — | |
| | | | | | | | |
Dividends from net investment income* | | | | | | | | |
Class A | | | | | | | (2,679,512 | ) |
Class B | | | | | | | (162,867 | ) |
Class C | | | | | | | (371,059 | ) |
Class R | | | | | | | (1,876 | ) |
Class Z | | | | | | | (77,331 | ) |
Class R6 | | | | | | | (232 | ) |
| | | | | | | | |
| | | * | | | | (3,292,877 | ) |
| | | | | | | | |
Distributions from net realized gains and capital gain distributions received* | | | | | | | | |
Class A | | | | | | | (2,840,983 | ) |
Class B | | | | | | | (258,639 | ) |
Class C | | | | | | | (589,254 | ) |
Class R | | | | | | | (2,252 | ) |
Class Z | | | | | | | (73,692 | ) |
Class R6 | | | | | | | (222 | ) |
| | | | | | | | |
| | | * | | | | (3,765,042 | ) |
| | | | | | | | |
See Notes to Financial Statements.
| | | | |
| PGIM Asset Allocation Funds | | | 35 | |
PGIM Moderate Allocation Fund
Statements of Changes in Net Assets(unaudited) (continued)
| | | | | | | | |
| | |
| | | Six Months Ended
March 31, 2019 | | | Year Ended
September 30, 2018 | |
Fund share transactions (Net of share conversions) | | | | | | | | |
Net proceeds from shares sold | | $ | 4,647,589 | | | $ | 10,007,462 | |
Net asset value of shares issued in reinvestment of dividends and distributions | | | 12,752,197 | | | | 6,875,226 | |
Cost of shares reacquired | | | (15,416,074 | ) | | | (25,345,332 | ) |
| | | | | | | | |
Net increase (decrease) in net assets from Fund share transactions | | | 1,983,712 | | | | (8,462,644 | ) |
| | | | | | | | |
Total increase (decrease) | | | (13,399,767 | ) | | | (5,620,157 | ) |
| | |
Net Assets: | | | | | | | | |
Beginning of period | | | 161,980,772 | | | | 167,600,929 | |
| | | | | | | | |
End of period(a) | | $ | 148,581,005 | | | $ | 161,980,772 | |
| | | | | | | | |
(a) Includes undistributed/(distributions in excess of) net investment income of: | | $ | * | | | $ | 642,742 | |
| | | | | | | | |
| * | For the period ended March 31, 2019, the disclosures have been revised to reflect revisions to RegulationS-X adopted by the SEC in 2018 (refer to Note 9). |
See Notes to Financial Statements.
PGIM Growth Allocation Fund
Schedule of Investments(unaudited)
as of March 31, 2019
| | | | | | | | |
| Description | | Shares | | | Value | |
LONG-TERM INVESTMENTS 99.1% | | | | | | | | |
| | |
AFFILIATED MUTUAL FUNDS | | | | | | | | |
PGIM Absolute Return Bond Fund (Class R6) | | | 54,284 | | | $ | 525,468 | |
PGIM Global Real Estate Fund (Class R6) | | | 200,314 | | | | 5,130,046 | |
PGIM High Yield Fund (Class R6) | | | 48,914 | | | | 264,137 | |
PGIM Jennison 20/20 Focus Fund (Class R6) | | | 192,269 | | | | 3,105,137 | |
PGIM Jennison Equity Opportunity Fund (Class R6) | | | 452,522 | | | | 7,534,491 | |
PGIM Jennison Growth Fund (Class R6) | | | 85,613 | | | | 3,685,628 | |
PGIM Jennison International Opportunities Fund (Class R6) | | | 536,492 | | | | 9,790,973 | |
PGIM JennisonMid-Cap Growth Fund (Class R6)* | | | 118,477 | | | | 3,646,729 | |
PGIM Jennison Natural Resources Fund (Class R6) | | | 3,080 | | | | 104,500 | |
PGIM Jennison Small Company Fund (Class R6) | | | 404,689 | | | | 9,056,932 | |
PGIM Jennison Value Fund (Class R6) | | | 473,617 | | | | 8,790,329 | |
PGIM QMA International Equity Fund (Class R6) | | | 2,059,840 | | | | 14,624,867 | |
PGIM QMALarge-Cap Core Equity Fund (Class R6) | | | 531,939 | | | | 7,792,905 | |
PGIM QMALarge-Cap Value Fund (Class R6) | | | 840,265 | | | | 10,360,469 | |
PGIM QMA Long-Short Equity Fund (Class R6)* | | | 413,263 | | | | 5,169,926 | |
PGIM QMAMid-Cap Value Fund (Class R6) | | | 217,272 | | | | 3,928,285 | |
PGIM QMASmall-Cap Value Fund (Class R6) | | | 155,046 | | | | 2,573,762 | |
PGIM Short Duration Multi-Sector Bond Fund (Class R6) | | | 80,538 | | | | 773,168 | |
PGIM Total Return Bond Fund (Class R6) | | | 395,720 | | | | 5,682,540 | |
| | | | | | | | |
TOTAL LONG-TERM INVESTMENTS
(cost $83,292,529) | | | | | | | 102,540,292 | |
| | | | | | | | |
| | |
SHORT-TERM INVESTMENT 0.7% | | | | | | | | |
| | |
AFFILIATED MUTUAL FUND | | | | | | | | |
PGIM Core Ultra Short Bond Fund
(cost $751,562) | | | 751,562 | | | | 751,562 | |
| | | | | | | | |
TOTAL INVESTMENTS 99.8%
(cost $84,044,091)(w) | | | | | | | 103,291,854 | |
Other assets in excess of liabilities 0.2% | | | | | | | 196,069 | |
| | | | | | | | |
NET ASSETS 100.0% | | | | | | $ | 103,487,923 | |
| | | | | | | | |
| * | Non-income producing security. |
| (w) | PGIM Investments LLC, the manager of the Fund, also serves as the manager of the underlying funds in which the Fund invests. |
Fair Value Measurements:
Various inputs are used in determining the value of the Fund’s investments. These inputs are summarized in the three broad levels listed below.
Level 1—unadjusted quoted prices generally in active markets for identical securities.
See Notes to Financial Statements.
| | | | |
| PGIM Asset Allocation Funds | | | 37 | |
PGIM Growth Allocation Fund
Schedule of Investments (unaudited) (continued)
as of March 31, 2019
Level 2—quoted prices for similar securities, interest rates and yield curves, prepayment speeds, foreign currency exchange rates and other observable inputs.
Level 3—unobservable inputs for securities valued in accordance with Board approved fair valuation procedures.
The following is a summary of the inputs used as of March 31, 2019 in valuing such portfolio securities:
| | | | | | | | | | | | |
| | | Level 1 | | | Level 2 | | | Level 3 | |
Investments in Securities | | | | | | | | | | | | |
Affiliated Mutual Funds | | $ | 103,291,854 | | | $ | — | | | $ | — | |
| | | | | | | | | | | | |
Investment Allocation:
The investment allocation of portfolio holdings and other assets in excess of liabilities shown as a percentage of net assets as of March 31, 2019 were as follows:
| | | | |
International | | | 23.6 | % |
Large-Cap Value | | | 18.5 | |
Large/Mid-Cap Growth | | | 14.4 | |
Large-Cap Core | | | 10.5 | |
Small-Cap Core | | | 8.7 | |
Multi-Sector Debt | | | 6.7 | |
Small/Mid-Cap Value | | | 6.3 | |
Long-Short Cap | | | 5.0 | |
Global Real Estate | | | 5.0 | |
Short-Term Investment | | | 0.7 | % |
High Yield | | | 0.3 | |
Natural Resources | | | 0.1 | |
| | | | |
| | | 99.8 | |
Other assets in excess of liabilities | | | 0.2 | |
| | | | |
| | | 100.0 | % |
| | | | |
See Notes to Financial Statements.
PGIM Growth Allocation Fund
Statement of Assets & Liabilities(unaudited)
as of March 31, 2019
| | | | |
Assets | | | | |
Affiliated investments (cost $84,044,091) | | $ | 103,291,854 | |
Receivable for investments sold | | | 560,000 | |
Receivable for Fund shares sold | | | 15,807 | |
Due from Manager | | | 11,743 | |
Prepaid expenses | | | 53,373 | |
| | | | |
Total Assets | | | 103,932,777 | |
| | | | |
| |
Liabilities | | | | |
Payable for investments purchased | | | 200,000 | |
Payable for Fund shares reacquired | | | 125,088 | |
Distribution fee payable | | | 34,139 | |
Custodian and accounting fees payable | | | 31,510 | |
Accrued expenses and other liabilities | | | 27,895 | |
Affiliated transfer agent fee payable | | | 26,222 | |
| | | | |
Total Liabilities | | | 444,854 | |
| | | | |
| |
Net Assets | | $ | 103,487,923 | |
| | | | |
| | | | | |
Net assets were comprised of: | | | | |
Common stock, at par | | $ | 6,304 | |
Paid-in capital in excess of par | | | 79,516,290 | |
Total distributable earnings (loss) | | | 23,965,329 | |
| | | | |
Net assets, March 31, 2019 | | $ | 103,487,923 | |
| | | | |
See Notes to Financial Statements.
| | | | |
| PGIM Asset Allocation Funds | | | 39 | |
PGIM Growth Allocation Fund
Statement of Assets & Liabilities(unaudited) (continued)
as of March 31, 2019
| | | | |
Class A | | | | |
Net asset value and redemption price per share,
($80,988,135 ÷ 4,885,295 shares of common stock issued and outstanding) | | $ | 16.58 | |
Maximum sales charge (5.50% of offering price) | | | 0.96 | |
| | | | |
Maximum offering price to public | | $ | 17.54 | |
| | | | |
| |
Class B | | | | |
Net asset value, offering price and redemption price per share, | | | | |
($4,856,185 ÷ 309,056 shares of common stock issued and outstanding) | | $ | 15.71 | |
| | | | |
| |
Class C | | | | |
Net asset value, offering price and redemption price per share, | | | | |
($14,936,117 ÷ 949,271 shares of common stock issued and outstanding) | | $ | 15.73 | |
| | | | |
| |
Class R | | | | |
Net asset value, offering price and redemption price per share, | | | | |
($42,023 ÷ 2,564 shares of common stock issued and outstanding) | | $ | 16.39 | |
| | | | |
| |
Class Z | | | | |
Net asset value, offering price and redemption price per share, | | | | |
($2,211,768 ÷ 131,332 shares of common stock issued and outstanding) | | $ | 16.84 | |
| | | | |
| |
Class R6 | | | | |
Net asset value, offering price and redemption price per share, | | | | |
($453,695 ÷ 26,951 shares of common stock issued and outstanding) | | $ | 16.83 | |
| | | | |
See Notes to Financial Statements.
PGIM Growth Allocation Fund
Statement of Operations(unaudited)
Six Months Ended March 31, 2019
| | | | |
Net Investment Income (Loss) | | | | |
Affiliated dividend income | | $ | 1,506,922 | |
| | | | |
| |
Expenses | | | | |
Management fee | | | 51,042 | |
Distribution fee(a) | | | 218,021 | |
Transfer agent’s fees and expenses (including affiliated expense of $59,911)(a) | | | 93,877 | |
Custodian and accounting fees | | | 49,933 | |
Registration fees(a) | | | 43,819 | |
Shareholders’ reports | | | 13,101 | |
Audit fee | | | 12,058 | |
Legal fees and expenses | | | 8,679 | |
Directors’ fees | | | 7,035 | |
Miscellaneous | | | 6,201 | |
| | | | |
Total expenses | | | 503,766 | |
Less: Fee waiver and/or expense reimbursement(a) | | | (107,002 | ) |
Distribution fee waiver(a) | | | (19,623 | ) |
| | | | |
Net expenses | | | 377,141 | |
| | | | |
Net investment income (loss) | | | 1,129,781 | |
| | | | |
| |
Realized And Unrealized Gain (Loss) On Affiliated Investments | | | | |
Net realized gain (loss) on investment transactions | | | (139,260 | ) |
Affiliated net capital gain distributions received | | | 6,920,630 | |
| | | | |
| | | 6,781,370 | |
| | | | |
Net change in unrealized appreciation (depreciation) on investments | | | (11,959,189 | ) |
| | | | |
Net gain (loss) on investment transactions | | | (5,177,819 | ) |
| | | | |
Net Increase (Decrease) In Net Assets Resulting From Operations | | $ | (4,048,038 | ) |
| | | | |
| (a) | Class specific expenses and waivers were as follows: |
| | | | | | | | | | | | | | | | | | | | | | | | |
| | | Class A | | | Class B | | | Class C | | | Class R | | | Class Z | | | Class R6 | |
Distribution fee | | | 117,442 | | | | 26,925 | | | | 73,507 | | | | 147 | | | | — | | | | — | |
Transfer agent’s fees and expenses | | | 66,639 | | | | 12,784 | | | | 10,211 | | | | 39 | | | | 4,165 | | | | 39 | |
Registration fees | | | 7,323 | | | | 6,989 | | | | 7,317 | | | | 6,454 | | | | 7,993 | | | | 7,743 | |
Fee waiver and/or expense reimbursement | | | (50,495 | ) | | | (18,130 | ) | | | (13,116 | ) | | | (6,480 | ) | | | (11,129 | ) | | | (7,652 | ) |
Distribution fee waiver | | | (19,574 | ) | | | — | | | | — | | | | (49 | ) | | | — | | | | — | |
See Notes to Financial Statements.
| | | | |
| PGIM Asset Allocation Funds | | | 41 | |
PGIM Growth Allocation Fund
Statements of Changes in Net Assets(unaudited)
| | | | | | | | |
| | |
| | | Six Months Ended
March 31, 2019 | | | Year Ended
September 30, 2018 | |
Increase (Decrease) in Net Assets | | | | | | | | |
Operations | | | | | | | | |
Net investment income (loss) | | $ | 1,129,781 | | | $ | 669,840 | |
Net realized gain (loss) on investment transactions | | | (139,260 | ) | | | 1,300,252 | |
Affiliated net capital gain distributions received | | | 6,920,630 | | | | 5,925,386 | |
Net change in unrealized appreciation (depreciation) on investments | | | (11,959,189 | ) | | | 738,463 | |
| | | | | | | | |
Net increase (decrease) in net assets resulting from operations | | | (4,048,038 | ) | | | 8,633,941 | |
| | | | | | | | |
| | |
Dividends and Distributions | | | | | | | | |
Distributions from distributable earnings* | | | | | | | | |
Class A | | | (6,549,057 | ) | | | — | |
Class B | | | (451,141 | ) | | | — | |
Class C | | | (1,266,810 | ) | | | — | |
Class R | | | (3,252 | ) | | | — | |
Class Z | | | (347,957 | ) | | | — | |
Class R6 | | | (36,114 | ) | | | — | |
| | | | | | | | |
| | | (8,654,331 | ) | | | — | |
| | | | | | | | |
Dividends from net investment income* | | | | | | | | |
Class A | | | | | | | (1,771,051 | ) |
Class B | | | | | | | (129,341 | ) |
Class C | | | | | | | (240,693 | ) |
Class R | | | | | | | (3,963 | ) |
Class Z | | | | | | | (67,459 | ) |
Class R6 | | | | | | | (235 | ) |
| | | | | | | | |
| | | * | | | | (2,212,742 | ) |
| | | | | | | | |
Distributions from net realized gains and capital gain distributions received* | | | | | | | | |
Class A | | | | | | | (1,144,763 | ) |
Class B | | | | | | | (120,159 | ) |
Class C | | | | | | | (223,606 | ) |
Class R | | | | | | | (2,885 | ) |
Class Z | | | | | | | (39,367 | ) |
Class R6 | | | | | | | (137 | ) |
| | | | | | | | |
| | | * | | | | (1,530,917 | ) |
| | | | | | | | |
See Notes to Financial Statements.
PGIM Growth Allocation Fund
Statements of Changes in Net Assets(unaudited) (continued)
| | | | | | | | |
| | |
| | | Six Months Ended
March 31, 2019 | | | Year Ended
September 30, 2018 | |
Fund share transactions (Net of share conversions) | | | | | | | | |
Net proceeds from shares sold | | $ | 3,851,365 | | | $ | 12,647,403 | |
Net asset value of shares issued in reinvestment of dividends and distributions | | | 8,525,478 | | | | 3,675,942 | |
Cost of shares reacquired | | | (8,741,540 | ) | | | (13,539,734 | ) |
| | | | | | | | |
Net increase (decrease) in net assets from Fund share transactions | | | 3,635,303 | | | | 2,783,611 | |
| | | | | | | | |
Total increase (decrease) | | | (9,067,066 | ) | | | 7,673,893 | |
| | |
Net Assets: | | | | | | | | |
Beginning of period | | | 112,554,989 | | | | 104,881,096 | |
| | | | | | | | |
End of period(a) | | $ | 103,487,923 | | | $ | 112,554,989 | |
| | | | | | | | |
(a) Includes undistributed/(distributions in excess of) net investment income of: | | $ | * | | | $ | — | |
| | | | | | | | |
| * | For the period ended March 31, 2019, the disclosures have been revised to reflect revisions to RegulationS-X adopted by the SEC in 2018 (refer to Note 9). |
See Notes to Financial Statements.
| | | | |
| PGIM Asset Allocation Funds | | | 43 | |
Notes to Financial Statements
The Prudential Investment Portfolios, Inc. (the “Company”) is registered under the Investment Company Act of 1940, as amended (“1940 Act”), as anopen-end management investment company. The Company was incorporated in Maryland on August 10, 1995 and consists of six series (“Fund” or “Funds”): PGIM Balanced Fund, PGIM Jennison Equity Opportunity Fund and PGIM Jennison Growth Fund, each of which are diversified funds and PGIM Allocation Fund (“Conservative Allocation Fund”), PGIM Moderate Allocation Fund (“Moderate Allocation Fund”) and PGIM Allocation Fund (“Growth Allocation Fund”), each of which arenon-diversified funds for purposes of the 1940 Act. These financial statements relate only to the Conservative Allocation Fund, Moderate Allocation Fund and Growth Allocation Fund (collectively referred to as the “Allocation Funds”).
The investment objective of Conservative Allocation Fund is current income and a reasonable level of capital appreciation. The investment objective of the Moderate Allocation Fund is capital appreciation and a reasonable level of current income. The investment objective of the Growth Allocation Fund is long-term capital appreciation. Each of the three Allocation Funds is typically referred to as a “Fund of Funds” because it invests in other mutual funds. The Allocation Funds may also invest directly in U.S. Government securities and money market instruments for cash management purposes or when assuming a defensive position.
1. Accounting Policies
The Allocation Funds follow the investment company accounting and reporting guidance of the Financial Accounting Standards Board (“FASB”) Accounting Standard Codification (“ASC”) Topic 946 Financial Services—Investment Companies.The following accounting policies conform to U.S. generally accepted accounting principles. The Company and the Allocation Funds consistently follow such policies in the preparation of their financial statements.
Securities Valuation:Each Allocation Fund holds securities and other assets and liabilities that are fair valued at the close of each day (generally, 4:00 PM Eastern time) the New York Stock Exchange (“NYSE”) is open for trading. Fair value is the price that would be received to sell an asset or paid to transfer a liability in an orderly transaction between market participants on the measurement date. The Company’s Board of Directors (the “Board”) has adopted valuation procedures for security valuation under which fair valuation responsibilities have been delegated to PGIM Investments LLC (“PGIM Investments” or the “Manager”). Pursuant to the Board’s delegation, the Manager has established a Valuation Committee responsible for supervising the fair valuation of portfolio securities and other assets and liabilities. The valuation procedures permit the Allocation Funds to utilize independent pricing vendor services, quotations from market makers, and alternative valuation methods when market quotations are either not readily available or not deemed
representative of fair value. A record of the Valuation Committee’s actions is subject to the Board’s review, approval, and ratification at its next regularly scheduled quarterly meeting.
For the fiscal reportingperiod-end, securities and other assets and liabilities were fair valued at the close of the last U.S. business day. Trading in certain foreign securities may occur when the NYSE is closed (including weekends and holidays). Because such foreign securities trade in markets that are open on weekends and U.S. holidays, the values of some of the Funds’ foreign investments may change on days when investors cannot purchase or redeem Fund shares.
Various inputs determine how each Allocation Fund’s investments are valued, all of which are categorized according to the three broad levels (Level 1, 2, or 3) detailed in the Schedule of Investments and referred to herein as the “fair value hierarchy” in accordance with FASB ASC Topic 820 - Fair Value Measurements and Disclosures.
Investments inopen-end,non-exchange-traded mutual funds are valued at their net asset values as of the close of the NYSE on the date of valuation. These securities are classified as Level 1 in the fair value hierarchy since they may be purchased or sold at their net asset values on the date of valuation.
Securities and other assets that cannot be priced according to the methods described above are valued based on pricing methodologies approved by the Board. In the event that unobservable inputs are used when determining such valuations, the securities will be classified as Level 3 in the fair value hierarchy.
When determining the fair value of securities, some of the factors influencing the valuation include: the nature of any restrictions on disposition of the securities; assessment of the general liquidity of the securities; the issuer’s financial condition and the markets in which it does business; the cost of the investment; the size of the holding and the capitalization of the issuer; the prices of any recent transactions or bids/offers for such securities or any comparable securities; any available analyst media or other reports or information deemed reliable by the Manager regarding the issuer or the markets or industry in which it operates. Using fair value to price securities may result in a value that is different from a security’s most recent closing price and from the price used by other unaffiliated mutual funds to calculate their net asset values.
Securities Transactions and Net Investment Income:Securities transactions are recorded on the trade date. Realized gains (losses) from investment and currency transactions are calculated on the specific identification method. Dividend income is recorded on theex-date, or for certain foreign securities, when the Fund becomes aware of such dividends. Expenses are recorded on an accrual basis, which may require the use of certain estimates by management that may differ from actual. Net investment income or loss (other than class specific expenses and waivers, which are allocated as noted below) and unrealized and realized gains (losses) are allocated daily to each class of shares based upon the relative proportion of adjusted net assets of each class at the beginning of the day. Class specific
| | | | |
| PGIM Asset Allocation Funds | | | 45 | |
Notes to Financial Statements(continued)
expenses and waivers, where applicable, are charged to the respective share classes. Class specific expenses include distribution fees and distribution fee waivers, shareholder servicing fees, transfer agent’s fees and expenses, registration fees and fee waivers and/or expense reimbursements, as applicable.
Taxes:It is the Allocation Funds’ policy of each of the Allocation Funds to continue to meet the requirements of the Internal Revenue Code applicable to regulated investment companies and to distribute all of its taxable net investment income and capital gains, if any, to its shareholders. Therefore, no federal income tax provision is required. Withholding taxes on foreign dividends, interest and capital gains, if any, are recorded, net of reclaimable amounts, at the time the related income is earned.
Dividends and Distributions:The Conservative Allocation Fund expects to pay dividends from net investment income quarterly and distributions from net realized gains, if any, annually. The Moderate Allocation Fund and the Growth Allocation Fund expect to pay dividends from net investment income and distributions from net realized gains, if any, annually. Dividends and distributions to shareholders, which are determined in accordance with federal income tax regulations and which may differ from generally accepted accounting principles, are recorded on theex-date. Permanent book/tax differences relating to income and gain (loss) are reclassified amongst total distributable earnings (loss) andpaid-in capital in excess of par, as appropriate.
Estimates: The preparation of financial statements requires management to make estimates and assumptions that affect the reported amounts and disclosures in the financial statements. Actual results could differ from those estimates.
2. Agreements
The Company, on behalf of the Allocation Funds, has a management agreement with PGIM Investments. Pursuant to this agreement, PGIM Investments has responsibility for all investment advisory services and supervises the subadviser’s performance of such services. In addition, under the management agreement, PGIM Investments provides all of the administrative functions necessary for the organization, operation and management of the Allocation Funds. PGIM Investments administers the corporate affairs of the Allocation Funds and, in connection therewith, furnishes the Allocation Funds with office facilities, together with those ordinary clerical and bookkeeping services which are not being furnished by, the Allocation Funds’ custodian, and the Allocation Funds’ transfer agent. PGIM Investments is also responsible for the staffing and management of dedicated groups of legal, marketing, compliance and related personnel necessary for the operation of the Allocation Funds. The legal, marketing, compliance and related personnel are also
responsible for the management and oversight of the various service providers to the Allocation Funds, including, but not limited to, the custodian, transfer agent, and accounting agent.
PGIM Investments has entered into a subadvisory agreement with QMA LLC (formerly known as Quantitative Management Associates LLC) (“QMA”). The subadvisory agreement provides that QMA will furnish investment advisory services in connection with the management of the Allocation Funds. In connection therewith, QMA is obligated to keep certain books and records of the Allocation Funds. PGIM Investments pays for the services of QMA, the cost of compensation of officers of the Allocation Funds, occupancy and certain clerical and bookkeeping costs of the Allocation Funds. The Allocation Funds bear all other costs and expenses.
The management fee paid to the Manager is accrued daily and payable monthly at an annual rate of 0.10% of each of the Allocation Funds’ average daily net assets up to $5 billion and 0.08% of average daily net assets in excess of $5 billion. The effective management fee rates before any waivers and/or expense reimbursements were 0.10%, 0.10% and 0.10% for the Conservative Allocation Fund, Moderate Allocation Fund and Growth Allocation Fund, respectively, for the reporting period ended March 31, 2019.
The Manager has contractually agreed, through January 31, 2020, to limit total annual operating expenses after fee waivers and/or expense reimbursements to 0.60% of average daily net assets for Class A shares, 1.35% of average daily net assets for Class B shares, 1.35% of average daily net assets for Class C shares, 0.85% of average daily net assets for Class R shares, 0.35% of average daily net assets for Class Z shares, and 0.35% of average daily net assets for Class R6 shares. This contractual waiver excludes interest, brokerage, taxes (such as income and foreign withholding taxes, stamp duty and deferred tax expenses), acquired fund fees and expenses, extraordinary expenses, and certain other Fund expenses such as dividend and interest expense and broker charges on short sales. Where applicable, the Manager agrees to waive management fees or shared operating expenses on any share class to the same extent that it waives similar expenses on any other share class. In addition, total annual operating expenses for Class R6 shares will not exceed total annual operating expenses for Class Z shares. Fees and/or expenses waived and /or reimbursed by PGIM Investments may be recouped by PGIN Investments within the same fiscal year during which such waiver and/or reimbursement is made if such recoupment can be realized without exceeding the expense limit in effect at the time of the recoupment for that fiscal year.
The Company, on behalf of the Allocation Funds, has a distribution agreement with Prudential Investment Management Services LLC (“PIMS”), which acts as the distributor of the Class A, Class B, Class C, Class R, Class Z and Class R6 shares of the Allocation Funds. The Allocation Funds compensate PIMS for distributing and servicing the Allocation Funds’ Class A, Class B, Class C and Class R shares, pursuant to plans of distribution (the “Distribution Plans”), regardless of expenses actually incurred by PIMS. The distribution
| | | | |
| PGIM Asset Allocation Funds | | | 47 | |
Notes to Financial Statements(continued)
fees are accrued daily and payable monthly. No distribution or service fees are paid to PIMS as distributor of the Class Z or Class R6 shares of the Allocation Funds.
Pursuant to the Distribution Plans, the Allocation Funds compensate PIMS for distribution related activities at an annual rate of up to 0.30%, 1%, 1% and 0.75% of the average daily net assets of the Class A, Class B, Class C and Class R shares, respectively. PIMS has contractually agreed through January 31, 2020 to limit such expenses to 0.25% and 0.50% of the average daily net assets of the Class A and Class R shares, respectively.
PIMS has advised the Allocation Funds of its receipt offront-end sales charges resulting from sales of Class A shares during the reporting period ended March 31, 2019. These amounts were as follows:
| | | | |
Fund | | Class A | |
Conservative Allocation Fund | | $ | 65,517 | |
Moderate Allocation Fund | | | 80,682 | |
Growth Allocation Fund | | | 81,782 | |
From these fees, PIMS paid such sales charges to broker-dealers, who in turn paid commissions to salespersons and incurred other distribution costs.
PIMS has advised the Allocation Funds of its receipt of contingent deferred sales charges imposed upon redemptions by certain Class B and Class C shareholders for the reporting period ended March 31, 2019. These amounts were as follows:
| | | | | | | | |
Fund | | Class B | | | Class C | |
Conservative Allocation Fund | | $ | 790 | | | $ | 2,640 | |
Moderate Allocation Fund | | | 1,490 | | | | 1,366 | |
Growth Allocation Fund | | | 1,212 | | | | 540 | |
From these fees, PIMS paid such sales charges to broker-dealers, who in turn paid commissions to salespersons and incurred other distribution costs.
PGIM Investments, PIMS and QMA are indirect, wholly-owned subsidiaries of Prudential Financial, Inc. (“Prudential”).
3. Other Transactions with Affiliates
Prudential Mutual Fund Services LLC (“PMFS”), an affiliate of PGIM Investments and an indirect, wholly-owned subsidiary of Prudential, serves as each Company’s transfer agent. Transfer agent’s fees and expenses in the Statement of Operations include certainout-of-pocket expenses paid tonon-affiliates, where applicable.
The Allocation Funds may enter into certain securities purchase or sale transactions under Board approved Rule17a-7 procedures. Rule17a-7 is an exemptive rule under the 1940 Act, that subject to certain conditions, permits purchase and sale transactions among affiliated investment companies, or between an investment company and a person that is affiliated solely by reason of having a common (or affiliated) investment adviser, common directors, and/or common officers. Pursuant to the Rule17a-7 procedures and consistent with guidance issued by the SEC, the Fund’s Chief Compliance Officer (“CCO”) prepares a quarterly summary of all such transactions for submission to the Board, together with the CCO’s written representation that all such17a-7 transactions were effected in accordance with the Fund’s Rule17a-7 procedures. Any17a-7 transactions for the reporting period are disclosed in the “Portfolio Securities” note, below.
The Allocation Funds may invest their overnight sweep cash in the PGIM Core Ultra Short Bond Fund (the “Core Fund”), a series of Prudential Investment Portfolios 2, registered under the 1940 Act and managed by PGIM Investments. Through the Allocation Funds’ investments in the mentioned underlying fund, PGIM Investments and/or its affiliates are paid fees or reimbursed for providing their services. Earnings from the Core Fund and other affiliated mutual funds are disclosed on the Statement of Operations as “Affiliated dividend income”.
4. Portfolio Securities
The aggregate cost of purchases and proceeds from sales of portfolio securities (excluding short-term investments and U.S. Government securities) for the reporting period ended March 31, 2019, were as follows:
| | | | | | | | |
Fund | | Cost of
Purchases | | | Proceeds
from Sales | |
Conservative Allocation Fund | | $ | 16,570,884 | | | $ | 19,950,823 | |
Moderate Allocation Fund | | | 25,420,230 | | | | 26,673,224 | |
Growth Allocation Fund | | | 17,686,800 | | | | 14,596,831 | |
A summary of the cost of purchases and proceeds from sales of shares of affiliated investments for the reporting period ended March 31, 2019, is presented as follows:
Conservative Allocation Fund:
| | | | | | | | | | | | | | | | | | | | | | | | | | | | | | | | |
Value,
Beginning
of Period | | Cost of
Purchases | | | Proceeds
from
Sales | | | Change in
Unrealized
Gain
(Loss) | | | Realized
Gain
(Loss) | | | Value,
End of
Period | | | Shares,
End of
Period | | | Dividend
Income | | | Capital Gain
Distributions | |
PGIM Absolute Return Bond Fund (Class R6) | |
$4,475,314 | | $ | 250,968 | | | $ | 455,000 | | | $ | (77,145 | ) | | $ | 5,300 | | | $ | 4,199,437 | | | | 433,826 | | | $ | 150,968 | | | $ | — | |
PGIM Core Ultra Short Bond Fund | |
1,039,490 | | | 6,904,459 | | | | 6,712,655 | | | | — | | | | — | | | | 1,231,294 | | | | 1,231,294 | | | | 12,134 | | | | — | |
PGIM Floating Rate Income Fund (Class R6) | |
— | | | 625,024 | | | | 600,823 | | | | — | | | | (24,201 | ) | | | — | | | | — | | | | 4,976 | | | | — | |
| | | | |
| PGIM Asset Allocation Funds | | | 49 | |
Notes to Financial Statements(continued)
Conservative Allocation Fund (cont’d.):
| | | | | | | | | | | | | | | | | | | | | | | | | | | | | | | | | | |
Value,
Beginning
of Period | | | Cost of
Purchases | | | Proceeds
from
Sales | | | Change in
Unrealized
Gain
(Loss) | | | Realized
Gain
(Loss) | | | Value,
End of
Period | | | Shares,
End of
Period | | | Dividend
Income | | | Capital Gain
Distributions | |
| | PGIM Global Real Estate Fund (Class R6) | |
| $ | 6,424,744 | | | $ | 365,662 | | | $ | 1,185,000 | | | $ | 81,962 | | | $ | 273,884 | | | $ | 5,961,252 | | | | 232,770 | | | $ | 104,279 | | | $ | 96,383 | |
| | PGIM Government Income Fund (Class R6) | |
| | 7,546,441 | | | | 355,615 | | | | 1,050,000 | | | | 171,896 | | | | 31,863 | | | | 7,055,815 | | | | 746,647 | | | | 95,606 | | | | — | |
| | PGIM High Yield Fund (Class R6) | |
| | 1,277,989 | | | | 20,780 | | | | 685,000 | | | | (165,900 | ) | | | 158,587 | | | | 606,456 | | | | 112,307 | | | | 20,780 | | | | — | |
| | PGIM Jennison 20/20 Focus Fund (Class R6) | |
| | 1,273,368 | | | | 219,233 | | | | 165,000 | | | | (135,404 | ) | | | 3,692 | | | | 1,195,889 | | | | 74,049 | | | | 7,416 | | | | 86,817 | |
| | PGIM Jennison Equity Opportunity Fund (Class R6) | |
| | 2,557,960 | | | | 731,275 | | | | 335,000 | | | | (523,967 | ) | | | (19,950 | ) | | | 2,410,318 | | | | 144,764 | | | | 18,293 | | | | 322,934 | |
| | PGIM Jennison Growth Fund (Class R6) | |
| | 2,540,246 | | | | 832,246 | | | | 850,000 | | | | (190,159 | ) | | | (31,637 | ) | | | 2,300,696 | | | | 53,442 | | | | 4,382 | | | | 137,865 | |
| | PGIM Jennison International Opportunities Fund (Class R6) | |
| | 4,969,006 | | | | 626,093 | | | | 865,000 | | | | (53,367 | ) | | | 31,445 | | | | 4,708,177 | | | | 257,982 | | | | 6,093 | | | | — | |
| | PGIM JennisonMid-Cap Growth Fund (Class R6) | |
| | 1,602,210 | | | | 1,062,798 | | | | 355,000 | | | | (324,653 | ) | | | (108,828 | ) | | | 1,876,527 | | | | 60,966 | | | | — | | | | 492,799 | |
| | PGIM Jennison Natural Resources Fund (Class R6) | |
| | 134,086 | | | | 27,224 | | | | 20,000 | | | | (17,819 | ) | | | (1,974 | ) | | | 121,517 | | | | 3,581 | | | | 2,224 | | | | — | |
| | PGIM Jennison Small Company Fund (Class R6) | |
| | 5,565,576 | | | | 1,416,248 | | | | 1,470,000 | | | | (844,579 | ) | | | (158,434 | ) | | | 4,508,811 | | | | 201,466 | | | | 30,075 | | | | 661,124 | |
| | PGIM Jennison Value Fund (Class R6) | |
| | 3,189,582 | | | | 2,726,557 | | | | 570,000 | | | | (454,910 | ) | | | (92,841 | ) | | | 4,798,388 | | | | 258,534 | | | | 72,825 | | | | 358,684 | |
| | PGIM QMA International Equity Fund (Class R6) | |
| | 7,491,343 | | | | 745,492 | | | | 670,000 | | | | (466,014 | ) | | | (31,568 | ) | | | 7,069,253 | | | | 995,670 | | | | 223,694 | | | | 26,799 | |
| | PGIM QMALarge-Cap Core Equity Fund (Class R6) | |
| | 4,864,104 | | | | 815,696 | | | | 2,150,000 | | | | (1,438,018 | ) | | | 799,305 | | | | 2,891,087 | | | | 197,344 | | | | 47,045 | | | | 458,651 | |
| | PGIM QMALarge-Cap Value Fund (Class R6) | |
| | 6,187,627 | | | | 1,221,877 | | | | 890,000 | | | | (815,078 | ) | | | 10,617 | | | | 5,715,043 | | | | 463,507 | | | | 116,811 | | | | 325,018 | |
| | PGIM QMA Long-Short Equity Fund (Class R6) | |
| | 3,845,838 | | | | 192,471 | | | | 270,000 | | | | (186,871 | ) | | | 18,499 | | | | 3,599,937 | | | | 287,765 | | | | — | | | | 62,471 | |
| | PGIM QMAMid-Cap Value Fund (Class R6) | |
| | 2,047,871 | | | | 502,452 | | | | 285,000 | | | | (276,149 | ) | | | (68,670 | ) | | | 1,920,504 | | | | 106,223 | | | | 46,886 | | | | 150,566 | |
| | PGIM QMASmall-Cap Value Fund (Class R6) | |
| | 1,468,932 | | | | 366,203 | | | | 200,000 | | | | (212,025 | ) | | | (51,801 | ) | | | 1,371,309 | | | | 82,609 | | | | 26,666 | | | | 94,536 | |
Conservative Allocation Fund (cont’d.):
| | | | | | | | | | | | | | | | | | | | | | | | | | | | | | | | | | |
Value,
Beginning
of Period | | | Cost of
Purchases | | | Proceeds
from
Sales | | | Change in
Unrealized
Gain
(Loss) | | | Realized
Gain
(Loss) | | | Value,
End of
Period | | | Shares,
End of
Period | | | Dividend
Income | | | Capital Gain
Distributions | |
| | PGIM Short Duration Multi-Sector Bond Fund (Class R6) | |
| $ | 40,962,461 | | | $ | 2,437,866 | | | $ | 4,230,000 | | | $ | 491,960 | | | $ | (216,998 | ) | | $ | 39,445,289 | | | | 4,108,884 | | | $ | 837,862 | | | $ | — | |
| | PGIM Short-Term Corporate Bond Fund (Class R6) | |
| | 650,696 | | | | 89,151 | | | | 140,000 | | | | 5,317 | | | | 3,997 | | | | 609,161 | | | | 55,733 | | | | 9,150 | | | | — | |
| | PGIM Total Return Bond Fund (Class R6) | |
| | 17,539,841 | | | | 939,953 | | | | 2,510,000 | | | | 487,066 | | | | (34,732 | ) | | | 16,422,128 | | | | 1,143,602 | | | | 409,916 | | | | — | |
| | | | | | | | | | | | | | | | | | | | | | | | | | | | | | | | | | |
| $ | 127,654,725 | | | $ | 23,475,343 | | | $ | 26,663,478 | | | $ | (4,943,857 | ) | | $ | 495,555 | | | $ | 120,018,288 | | | | | | | $ | 2,248,081 | | | $ | 3,274,647 | |
| | | | | | | | | | | | | | | | | | | | | | | | | | | | | | | | | | |
Moderate Allocation Fund:
| | | | | | | | | | | | | | | | | | | | | | | | | | | | | | | | | | |
Value,
Beginning
of Period | | | Cost of
Purchases | | | Proceeds
from
Sales | | | Change in
Unrealized
Gain
(Loss) | | | Realized
Gain
(Loss) | | | Value,
End of
Period | | | Shares,
End of
Period | | | Dividend
Income | | | Capital Gain
Distributions | |
| | PGIM Absolute Return Bond Fund (Class R6) | |
| $ | 3,246,081 | | | $ | 237,889 | | | $ | 450,000 | | | $ | (56,963 | ) | | $ | 5,405 | | | $ | 2,982,412 | | | | 308,100 | | | $ | 107,894 | | | $ | — | |
| | PGIM Core Ultra Short Bond Fund | |
| | 1,108,800 | | | | 7,354,158 | | | | 7,290,267 | | | | — | | | | — | | | | 1,172,691 | | | | 1,172,691 | | | | 14,830 | | | | — | |
| | PGIM Floating Rate Income Fund (Class R6) | |
| | — | | | | 544,436 | | | | 523,224 | | | | — | | | | (21,212 | ) | | | — | | | | — | | | | 4,398 | | | | — | |
| | PGIM Global Real Estate Fund (Class R6) | |
| | 8,150,053 | | | | 351,267 | | | | 1,535,000 | | | | 89,170 | | | | 334,549 | | | | 7,390,039 | | | | 288,561 | | | | 130,731 | | | | 120,536 | |
| | PGIM Government Income Fund (Class R6) | |
| | 4,554,794 | | | | 256,856 | | | | 780,000 | | | | 143,436 | | | | (22,768 | ) | | | 4,152,318 | | | | 439,399 | | | | 56,858 | | | | — | |
| | PGIM High Yield Fund (Class R6) | |
| | 1,215,686 | | | | 30,799 | | | | 645,000 | | | | (144,155 | ) | | | 136,274 | | | | 593,604 | | | | 109,927 | | | | 20,813 | | | | — | |
| | PGIM Jennison 20/20 Focus Fund (Class R6) | |
| | 3,239,442 | | | | 400,477 | | | | 320,000 | | | | (356,166 | ) | | | 13,549 | | | | 2,977,302 | | | | 184,353 | | | | 18,531 | | | | 216,946 | |
| | PGIM Jennison Equity Opportunity Fund (Class R6) | |
| | 6,495,685 | | | | 1,455,446 | | | | 590,000 | | | | (1,379,421 | ) | | | (17,761 | ) | | | 5,963,949 | | | | 358,195 | | | | 46,201 | | | | 814,203 | |
| | PGIM Jennison Growth Fund (Class R6) | |
| | 4,123,028 | | | | 1,241,726 | | | | 1,525,000 | | | | (392,211 | ) | | | (7,799 | ) | | | 3,439,744 | | | | 79,901 | | | | 7,138 | | | | 224,587 | |
| | PGIM Jennison International Opportunities Fund (Class R6) | |
| | 9,440,982 | | | | 831,445 | | | | 1,430,000 | | | | (121,357 | ) | | | 44,589 | | | | 8,765,659 | | | | 480,310 | | | | 11,447 | | | | — | |
| | PGIM JennisonMid-Cap Growth Fund (Class R6) | |
| | 4,474,016 | | | | 2,375,524 | | | | 830,000 | | | | (901,083 | ) | | | (261,496 | ) | | | 4,856,961 | | | | 157,796 | | | | — | | | | 1,290,524 | |
| | PGIM Jennison Natural Resources Fund (Class R6) | |
| | 169,909 | | | | 22,772 | | | | 20,000 | | | | (24,446 | ) | | | (1,613 | ) | | | 146,622 | | | | 4,321 | | | | 2,772 | | | | — | |
| | | | |
| PGIM Asset Allocation Funds | | | 51 | |
Notes to Financial Statements(continued)
Moderate Allocation Fund (cont’d.):
| | | | | | | | | | | | | | | | | | | | | | | | | | | | | | | | | | |
Value,
Beginning
of Period | | | Cost of
Purchases | | | Proceeds
from
Sales | | | Change in
Unrealized
Gain
(Loss) | | | Realized
Gain
(Loss) | | | Value,
End of
Period | | | Shares,
End of
Period | | | Dividend
Income | | | Capital Gain
Distributions | |
| | PGIM Jennison Small Company Fund (Class R6) | |
| $ | 11,698,709 | | | $ | 2,385,938 | | | $ | 2,650,000 | | | $ | (1,887,731 | ) | | $ | (242,257 | ) | | $ | 9,304,659 | | | | 415,758 | | | $ | 62,933 | | | $ | 1,382,961 | |
| | PGIM Jennison Value Fund (Class R6) | |
| | 7,544,277 | | | | 4,990,065 | | | | 905,000 | | | | (1,087,043 | ) | | | (140,436 | ) | | | 10,401,863 | | | | 560,445 | | | | 159,543 | | | | 785,479 | |
| | PGIM QMA International Equity Fund (Class R6) | |
| | 13,999,549 | | | | 831,302 | | | | 955,000 | | | | (910,615 | ) | | | (38,439 | ) | | | 12,926,797 | | | | 1,820,676 | | | | 411,949 | | | | 49,352 | |
| | PGIM QMALarge-Cap Core Equity Fund (Class R6) | |
| | 13,629,987 | | | | 2,242,210 | | | | 3,920,000 | | | | (3,153,869 | ) | | | 976,617 | | | | 9,774,945 | | | | 667,232 | | | | 160,683 | | | | 1,566,527 | |
| | PGIM QMALarge-Cap Value Fund (Class R6) | |
| | 11,734,046 | | | | 1,626,472 | | | | 1,860,000 | | | | (1,595,324 | ) | | | 144,522 | | | | 10,049,716 | | | | 815,062 | | | | 206,642 | | | | 574,788 | |
| | PGIM QMA Long-Short Equity Fund (Class R6) | |
| | 6,503,551 | | | | 324,088 | | | | 600,000 | | | | (328,951 | ) | | | 40,248 | | | | 5,938,936 | | | | 474,735 | | | | — | | | | 104,088 | |
| | PGIM QMAMid-Cap Value Fund (Class R6) | |
| | 5,285,140 | | | | 914,606 | | | | 475,000 | | | | (778,806 | ) | | | (119,947 | ) | | | 4,825,993 | | | | 266,924 | | | | 118,634 | | | | 380,974 | |
| | PGIM QMASmall-Cap Value Fund (Class R6) | |
| | 3,233,779 | | | | 648,123 | | | | 340,000 | | | | (499,009 | ) | | | (86,847 | ) | | | 2,956,046 | | | | 178,075 | | | | 57,891 | | | | 205,233 | |
| | PGIM Short Duration Multi-Sector Bond Fund (Class R6) | |
| | 25,578,528 | | | | 2,514,614 | | | | 3,330,000 | | | | 343,354 | | | | (166,516 | ) | | | 24,939,980 | | | | 2,597,915 | | | | 524,623 | | | | — | |
| | PGIM Total Return Bond Fund (Class R6) | |
| | 16,243,301 | | | | 1,194,175 | | | | 2,990,000 | | | | 448,097 | | | | (44,209 | ) | | | 14,851,364 | | | | 1,034,218 | | | | 374,171 | | | | — | |
| | | | | | | | | | | | | | | | | | | | | | | | | | | | | | | | | | |
| $ | 161,669,343 | | | $ | 32,774,388 | | | $ | 33,963,491 | | | $ | (12,593,093 | ) | | $ | 524,453 | | | $ | 148,411,600 | | | | | | | $ | 2,498,682 | | | $ | 7,716,198 | |
| | | | | | | | | | | | | | | | | | | | | | | | | | | | | | | | | | |
Growth Allocation Fund:
| | | | | | | | | | | | | | | | | | | | | | | | | | | | | | | | | | |
Value,
Beginning
of Period | | | Cost of
Purchases | | | Proceeds
from
Sales | | | Change in
Unrealized
Gain
(Loss) | | | Realized
Gain
(Loss) | | | Value,
End of
Period | | | Shares,
End of
Period | | | Dividend
Income | | | Capital Gain
Distributions | |
| | PGIM Absolute Return Bond Fund (Class R6) | |
| $ | 565,882 | | | $ | 58,425 | | | $ | 90,000 | | | $ | (7,610 | ) | | $ | (1,229 | ) | | $ | 525,468 | | | | 54,284 | | | $ | 18,424 | | | $ | — | |
| | PGIM Core Ultra Short Bond Fund | |
| | 1,073,499 | | | | 4,078,440 | | | | 4,400,377 | | | | — | | | | — | | | | 751,562 | | | | 751,562 | | | | 11,020 | | | | — | |
| | PGIM Floating Rate Income Fund (Class R6) | |
| | — | | | | 282,230 | | | | 271,831 | | | | — | | | | (10,399 | ) | | | — | | | | — | | | | 2,210 | | | | — | |
Growth Allocation Fund (cont’d.):
| | | | | | | | | | | | | | | | | | | | | | | | | | | | | | | | | | |
Value,
Beginning
of Period | | | Cost of
Purchases | | | Proceeds
from
Sales | | | Change in
Unrealized
Gain
(Loss) | | | Realized
Gain
(Loss) | | | Value,
End of
Period | | | Shares,
End of
Period | | | Dividend
Income | | | Capital Gain
Distributions | |
| | PGIM Global Real Estate Fund (Class R6) | |
| $ | 5,669,326 | | | $ | 283,200 | | | $ | 1,100,000 | | | $ | 274,479 | | | $ | 3,041 | | | $ | 5,130,046 | | | | 200,314 | | | $ | 90,224 | | | $ | 82,975 | |
| | PGIM High Yield Fund (Class R6) | |
| | 574,318 | | | | 18,996 | | | | 325,000 | | | | 3,954 | | | | (8,131 | ) | | | 264,137 | | | | 48,914 | | | | 8,996 | | | | — | |
| | PGIM Jennison 20/20 Focus Fund (Class R6) | |
| | 3,376,596 | | | | 302,815 | | | | 210,000 | | | | (354,307 | ) | | | (9,967 | ) | | | 3,105,137 | | | | 192,269 | | | | 19,109 | | | | 223,706 | |
| | PGIM Jennison Equity Opportunity Fund (Class R6) | |
| | 8,184,021 | | | | 1,416,372 | | | | 305,000 | | | | (1,701,592 | ) | | | (59,310 | ) | | | 7,534,491 | | | | 452,522 | | | | 57,290 | | | | 1,009,062 | |
| | PGIM Jennison Growth Fund (Class R6) | |
| | 4,276,150 | | | | 1,199,384 | | | | 1,375,000 | | | | (366,880 | ) | | | (48,026 | ) | | | 3,685,628 | | | | 85,613 | | | | 7,374 | | | | 232,010 | |
| | PGIM Jennison International Opportunities Fund (Class R6) | |
| | 10,546,190 | | | | 742,636 | | | | 1,385,000 | | | | (93,813 | ) | | | (19,040 | ) | | | 9,790,973 | | | | 536,492 | | | | 12,635 | | | | — | |
| | PGIM JennisonMid-Cap Growth Fund (Class R6) | |
| | 3,330,498 | | | | 1,616,145 | | | | 430,000 | | | | (743,724 | ) | | | (126,190 | ) | | | 3,646,729 | | | | 118,477 | | | | — | | | | 956,146 | |
| | PGIM Jennison Natural Resources Fund (Class R6) | |
| | 114,700 | | | | 15,752 | | | | 10,000 | | | | (15,292 | ) | | | (660 | ) | | | 104,500 | | | | 3,080 | | | | 1,752 | | | | — | |
| | PGIM Jennison Small Company Fund (Class R6) | |
| | 11,016,216 | | | | 1,867,170 | | | | 1,770,000 | | | | (1,804,113 | ) | | | (252,341 | ) | | | 9,056,932 | | | | 404,689 | | | | 60,161 | | | | 1,321,989 | |
| | PGIM Jennison Value Fund (Class R6) | |
| | 7,043,787 | | | | 3,221,196 | | | | 440,000 | | | | (962,606 | ) | | | (72,048 | ) | | | 8,790,329 | | | | 473,617 | | | | 132,061 | | | | 650,115 | |
| | PGIM QMA International Equity Fund (Class R6) | |
| | 15,838,279 | | | | 723,652 | | | | 830,000 | | | | (949,199 | ) | | | (157,865 | ) | | | 14,624,867 | | | | 2,059,840 | | | | 458,461 | | | | 54,953 | |
| | PGIM QMALarge-Cap Core Equity Fund (Class R6) | |
| | 11,000,904 | | | | 1,450,560 | | | | 2,920,000 | | | | (2,503,855 | ) | | | 765,296 | | | | 7,792,905 | | | | 531,939 | | | | 126,573 | | | | 1,233,987 | |
| | PGIM QMALarge-Cap Value Fund (Class R6) | |
| | 11,255,543 | | | | 1,181,788 | | | | 565,000 | | | | (1,475,787 | ) | | | (36,075 | ) | | | 10,360,469 | | | | 840,265 | | | | 209,390 | | | | 582,378 | |
| | PGIM QMA Long-Short Equity Fund (Class R6) | |
| | 5,653,328 | | | | 509,487 | | | | 735,000 | | | | (264,484 | ) | | | 6,595 | | | | 5,169,926 | | | | 413,263 | | | | — | | | | 89,487 | |
| | PGIM QMAMid-Cap Value Fund (Class R6) | |
| | 4,294,642 | | | | 568,184 | | | | 195,000 | | | | (694,563 | ) | | | (44,978 | ) | | | 3,928,285 | | | | 217,272 | | | | 95,737 | | | | 307,446 | |
| | PGIM QMASmall-Cap Value Fund (Class R6) | |
| | 3,102,012 | | | | 411,127 | | | | 410,000 | | | | (476,140 | ) | | | (53,237 | ) | | | 2,573,762 | | | | 155,046 | | | | 49,751 | | | | 176,376 | |
| | PGIM Short Duration Multi-Sector Bond Fund (Class R6) | |
| | 570,692 | | | | 366,430 | | | | 170,000 | | | | 8,074 | | | | (2,028 | ) | | | 773,168 | | | | 80,538 | | | | 14,508 | | | | — | |
| | PGIM Total Return Bond Fund (Class R6) | |
| | 5,135,688 | | | | 1,451,251 | | | | 1,060,000 | | | | 168,269 | | | | (12,668 | ) | | | 5,682,540 | | | | 395,720 | | | | 131,246 | | | | — | |
| | | | | | | | | | | | | | | | | | | | | | | | | | | | | | | | | | |
| $ | 112,622,271 | | | $ | 21,765,240 | | | $ | 18,997,208 | | | $ | (11,959,189 | ) | | $ | (139,260 | ) | | $ | 103,291,854 | | | | | | | $ | 1,506,922 | | | $ | 6,920,630 | |
| | | | | | | | | | | | | | | | | | | | | | | | | | | | | | | | | | |
| | | | |
| PGIM Asset Allocation Funds | | | 53 | |
Notes to Financial Statements(continued)
Growth Allocation Fund (cont’d.):
For the reporting period ended March 31, 2019, no17a-7 transactions were entered into by the Allocation Funds.
5. Tax Information
The United States federal income tax basis of the Allocation Funds’ investments and the net unrealized appreciation as of March 31, 2019 were as follows:
| | | | | | | | | | | | | | | | |
Fund | | Tax Basis | | | Gross Unrealized
Appreciation | | | Gross Unrealized
Depreciation | | | Net Unrealized
Appreciation | |
Conservative Allocation Fund | | $ | 105,885,794 | | | $ | 15,488,441 | | | $ | (1,355,947) | | | $ | 14,132,494 | |
Moderate Allocation Fund | | | 121,373,807 | | | | 28,811,224 | | | | (1,773,431) | | | | 27,037,793 | |
Growth Allocation Fund | | | 84,310,310 | | | | 20,898,477 | | | | (1,916,933) | | | | 18,981,544 | |
The book basis may differ from tax basis due to certaintax-related adjustments.
The Manager has analyzed the Allocation Funds’ tax positions taken on federal, state and local income tax returns for all open tax years and has concluded that no provision for income tax is required in the Allocation Funds’ financial statements for the current reporting period. The Allocation Funds’ federal, state and local income and federal excise tax returns for tax years for which the applicable statutes of limitations have not expired are subject to examination by the Internal Revenue Service and state departments of revenue.
6. Capital and Ownership
The Allocation Funds offer Class A, Class B, Class C, Class R, Class Z and Class R6 shares. Class A shares are sold with a maximumfront-end sales charge of 5.50%. Investors who purchase $1 million or more of Class A shares and sell these shares within 12 months of purchase are subject to a contingent deferred sales charge (“CDSC”) of 1%, although they are not subject to an initial sales charge. The Class A CDSC is waived for certain retirement and/or benefit plans. A special exchange privilege is also available for shareholders who qualified to purchase Class A shares at net asset value. Class B shares are sold with a CDSC which declines from 5% to zero depending on the period of time the shares are held. Class B shares will automatically convert to Class A shares on a quarterly basis approximately seven years after purchase. Class B shares are closed to new purchases. Class C shares are sold with a CDSC of 1% on sales made within 12 months of purchase. Class C shares will automatically convert to Class A shares on a monthly basis approximately
10 years after purchase. Class R, Class Z and Class R6 shares are not subject to any sales or redemption charge and are available exclusively for sale to a limited group of investors.
Under certain circumstances, an exchange may be made from specified share classes of the Allocation Funds to one or more other share classes of the Allocation Funds as presented in the table of transactions in shares of common stock.
The Company is authorized to issue 6.25 billion shares of common stock, with a par value of $0.001 per share, which are divided into six series. Of the Company’s authorized capital stock, 938 million authorized shares have been allocated to the Conservative Allocation Fund and divided into seven classes, designated Class A, Class B, Class C, Class R, Class Z, Class T and Class R6 common stock, each of which consists of 125 million, 3 million, 25 million, 165 million, 285 million, 50 million and 285 million authorized shares, respectively. Of the Company’s authorized capital stock, 943 million authorized shares have been allocated to the Moderate Allocation Fund and divided into seven classes, designated Class A, Class B, Class C, Class R, Class Z, Class T and Class R6 common stock, each of which consists of 125 million, 3 million, 25 million, 135 million, 305 million, 50 million and 300 million authorized shares, respectively. Of the Company’s authorized capital stock, 902 million authorized shares have been allocated to the Growth Allocation Fund and divided into seven classes, designated Class A, Class B, Class C, Class R, Class Z, Class T and Class R6 common stock, each of which consists of 125 million, 2 million, 25 million, 100 million, 300 million, 50 million and 300 million authorized shares, respectively.
None of the Allocation Funds have any Class T shares outstanding.
As of March 31, 2019, Prudential, through its affiliated entities, including affiliated funds, owned the following number of shares of the Allocation Funds:
| | | | | | | | |
Fund | | Class R | | | Class R6 | |
Conservative Allocation Fund | | | 323 | | | | 833 | |
Moderate Allocation Fund | | | 302 | | | | 743 | |
Growth Allocation Fund | | | 256 | | | | 605 | |
At reporting period end, the following number of shareholders of record held the following percentage of the Allocation Funds’ outstanding shares:
| | | | | | |
| | | Number of
Shareholders | | % of Outstanding
Shares | |
Conservative Allocation Fund | | 2 | | | 41 | |
Moderate Allocation Fund | | 2 | | | 43 | |
Growth Allocation Fund | | 2 | | | 34 | |
| | | | |
| PGIM Asset Allocation Funds | | | 55 | |
Notes to Financial Statements(continued)
Transactions in shares of common stock were as follows:
Conservative Allocation Fund:
| | | | | | | | |
Class A | | Shares | | | Amount | |
Six months ended March 31, 2019: | | | | | | | | |
Shares sold | | | 306,085 | | | $ | 3,729,292 | |
Shares issued in reinvestment of dividends and distributions | | | 427,563 | | | | 4,855,625 | |
Shares reacquired | | | (604,935 | ) | | | (7,385,521 | ) |
| | | | | | | | |
Net increase (decrease) in shares outstanding before conversion | | | 128,713 | | | | 1,199,396 | |
Shares issued upon conversion from other share class(es) | | | 91,043 | | | | 1,121,197 | |
Shares reacquired upon conversion into other share class(es) | | | (2,675 | ) | | | (32,096 | ) |
| | | | | | | | |
Net increase (decrease) in shares outstanding | | | 217,081 | | | $ | 2,288,497 | |
| | | | | | | | |
Year ended September 30, 2018: | | | | | | | | |
Shares sold | | | 783,696 | | | $ | 10,219,360 | |
Shares issued in reinvestment of dividends and distributions | | | 283,122 | | | | 3,670,124 | |
Shares reacquired | | | (1,172,675 | ) | | | (15,289,256 | ) |
| | | | | | | | |
Net increase (decrease) in shares outstanding before conversion | | | (105,857 | ) | | | (1,399,772 | ) |
Shares issued upon conversion from other share class(es) | | | 205,224 | | | | 2,698,805 | |
Shares reacquired upon conversion into other share class(es) | | | (13,610 | ) | | | (176,733 | ) |
| | | | | | | | |
Net increase (decrease) in shares outstanding | | | 85,757 | | | $ | 1,122,300 | |
| | | | | | | | |
Class B | | | | | | |
Six months ended March 31, 2019: | | | | | | | | |
Shares sold | | | 13,978 | | | $ | 170,891 | |
Shares issued in reinvestment of dividends and distributions | | | 19,075 | | | | 215,178 | |
Shares reacquired | | | (38,854 | ) | | | (475,813 | ) |
| | | | | | | | |
Net increase (decrease) in shares outstanding before conversion | | | (5,801 | ) | | | (89,744 | ) |
Shares reacquired upon conversion into other share class(es) | | | (51,056 | ) | | | (621,019 | ) |
| | | | | | | | |
Net increase (decrease) in shares outstanding | | | (56,857 | ) | | $ | (710,763 | ) |
| | | | | | | | |
Year ended September 30, 2018: | | | | | | | | |
Shares sold | | | 23,702 | | | $ | 305,112 | |
Shares issued in reinvestment of dividends and distributions | | | 16,176 | | | | 208,929 | |
Shares reacquired | | | (85,123 | ) | | | (1,104,017 | ) |
| | | | | | | | |
Net increase (decrease) in shares outstanding before conversion | | | (45,245 | ) | | | (589,976 | ) |
Shares reacquired upon conversion into other share class(es) | | | (198,713 | ) | | | (2,601,985 | ) |
| | | | | | | | |
Net increase (decrease) in shares outstanding | | | (243,958 | ) | | $ | (3,191,961 | ) |
| | | | | | | | |
Conservative Allocation Fund (cont’d.):
| | | | | | | | |
Class C | | Shares | | | Amount | |
Six months ended March 31, 2019: | | | | | | | | |
Shares sold | | | 108,235 | | | $ | 1,315,533 | |
Shares issued in reinvestment of dividends and distributions | | | 112,267 | | | | 1,266,230 | |
Shares reacquired | | | (283,249 | ) | | | (3,438,577 | ) |
| | | | | | | | |
Net increase (decrease) in shares outstanding before conversion | | | (62,747 | ) | | | (856,814 | ) |
Shares reacquired upon conversion into other share class(es) | | | (47,738 | ) | | | (586,833 | ) |
| | | | | | | | |
Net increase (decrease) in shares outstanding | | | (110,485 | ) | | $ | (1,443,647 | ) |
| | | | | | | | |
Year ended September 30, 2018: | | | | | | | | |
Shares sold | | | 216,088 | | | $ | 2,806,810 | |
Shares issued in reinvestment of dividends and distributions | | | 67,280 | | | | 868,969 | |
Shares reacquired | | | (352,601 | ) | | | (4,576,068 | ) |
| | | | | | | | |
Net increase (decrease) in shares outstanding before conversion | | | (69,233 | ) | | | (900,289 | ) |
Shares reacquired upon conversion into other share class(es) | | | (4,933 | ) | | | (63,423 | ) |
| | | | | | | | |
Net increase (decrease) in shares outstanding | | | (74,166 | ) | | $ | (963,712 | ) |
| | | | | | | | |
Class R | | | | | | |
Six months ended March 31, 2019: | | | | | | | | |
Shares sold | | | 435 | | | $ | 5,403 | |
Shares issued in reinvestment of dividends and distributions | | | 887 | | | | 10,111 | |
Shares reacquired | | | (77 | ) | | | (968 | ) |
| | | | | | | | |
Net increase (decrease) in shares outstanding | | | 1,245 | | | $ | 14,546 | |
| | | | | | | | |
Year ended September 30, 2018: | | | | | | | | |
Shares sold | | | 1,983 | | | $ | 26,064 | |
Shares issued in reinvestment of dividends and distributions | | | 505 | | | | 6,581 | |
Shares reacquired | | | (481 | ) | | | (6,298 | ) |
| | | | | | | | |
Net increase (decrease) in shares outstanding | | | 2,007 | | | $ | 26,347 | |
| | | | | | | | |
Class Z | | | | | | |
Six months ended March 31, 2019: | | | | | | | | |
Shares sold | | | 44,141 | | | $ | 550,190 | |
Shares issued in reinvestment of dividends and distributions | | | 51,588 | | | | 589,024 | |
Shares reacquired | | | (236,966 | ) | | | (2,778,347 | ) |
| | | | | | | | |
Net increase (decrease) in shares outstanding before conversion | | | (141,237 | ) | | | (1,639,133 | ) |
Shares issued upon conversion from other share class(es) | | | 9,936 | | | | 118,751 | |
| | | | | | | | |
Net increase (decrease) in shares outstanding | | | (131,301 | ) | | $ | (1,520,382 | ) |
| | | | | | | | |
Year ended September 30, 2018: | | | | | | | | |
Shares sold | | | 212,147 | | | $ | 2,770,641 | |
Shares issued in reinvestment of dividends and distributions | | | 26,297 | | | | 342,559 | |
Shares reacquired | | | (91,614 | ) | | | (1,207,677 | ) |
| | | | | | | | |
Net increase (decrease) in shares outstanding before conversion | | | 146,830 | | | | 1,905,523 | |
Shares issued upon conversion from other share class(es) | | | 14,352 | | | | 187,251 | |
Shares reacquired upon conversion into other share class(es) | | | (3,347 | ) | | | (43,915 | ) |
| | | | | | | | |
Net increase (decrease) in shares outstanding | | | 157,835 | | | $ | 2,048,859 | |
| | | | | | | | |
| | | | |
| PGIM Asset Allocation Funds | | | 57 | |
Notes to Financial Statements(continued)
Conservative Allocation Fund (cont’d.):
| | | | | | | | |
Class R6 | | Shares | | | Amount | |
Six months ended March 31, 2019: | | | | | | | | |
Shares issued in reinvestment of dividends and distributions | | | 320 | | | $ | 3,653 | |
Shares reacquired | | | (25 | ) | | | (317 | ) |
| | | | | | | | |
Net increase (decrease) in shares outstanding | | | 295 | | | $ | 3,336 | |
| | | | | | | | |
Period ended September 30, 2018*: | | | | | | | | |
Shares sold | | | 4,835 | | | $ | 63,203 | |
Shares issued in reinvestment of dividends and distributions | | | 50 | | | | 647 | |
Shares reacquired | | | (84 | ) | | | (1,104 | ) |
| | | | | | | | |
Net increase (decrease) in shares outstanding | | | 4,801 | | | $ | 62,746 | |
| | | | | | | | |
| * | Commencement of offering was November 28, 2017. |
Moderate Allocation Fund:
| | | | | | | | |
Class A | | Shares | | | Amount | |
Six months ended March 31, 2019: | | | | | | | | |
Shares sold | | | 226,633 | | | $ | 3,201,616 | |
Shares issued in reinvestment of dividends and distributions | | | 832,664 | | | | 10,158,499 | |
Shares reacquired | | | (861,077 | ) | | | (11,788,265 | ) |
| | | | | | | | |
Net increase (decrease) in shares outstanding before conversion | | | 198,220 | | | | 1,571,850 | |
Shares issued upon conversion from other share class(es) | | | 90,847 | | | | 1,251,799 | |
Shares reacquired upon conversion into other share class(es) | | | (18,328 | ) | | | (266,702 | ) |
| | | | | | | | |
Net increase (decrease) in shares outstanding | | | 270,739 | | | $ | 2,556,947 | |
| | | | | | | | |
Year ended September 30, 2018: | | | | | | | | |
Shares sold | | | 395,549 | | | $ | 6,063,512 | |
Shares issued in reinvestment of dividends and distributions | | | 360,290 | | | | 5,451,181 | |
Shares reacquired | | | (1,103,929 | ) | | | (16,921,351 | ) |
| | | | | | | | |
Net increase (decrease) in shares outstanding before conversion | | | (348,090 | ) | | | (5,406,658 | ) |
Shares issued upon conversion from other share class(es) | | | 281,566 | | | | 4,372,619 | |
Shares reacquired upon conversion into other share class(es) | | | (22,077 | ) | | | (338,212 | ) |
| | | | | | | | |
Net increase (decrease) in shares outstanding | | | (88,601 | ) | | $ | (1,372,251 | ) |
| | | | | | | | |
Moderate Allocation Fund (cont’d.):
| | | | | | | | |
Class B | | Shares | | | Amount | |
Six months ended March 31, 2019: | | | | | | | | |
Shares sold | | | 1,605 | | | $ | 19,487 | |
Shares issued in reinvestment of dividends and distributions | | | 51,763 | | | | 628,402 | |
Shares reacquired | | | (31,870 | ) | | | (431,376 | ) |
| | | | | | | | |
Net increase (decrease) in shares outstanding before conversion | | | 21,498 | | | | 216,513 | |
Shares reacquired upon conversion into other share class(es) | | | (74,542 | ) | | | (1,021,655 | ) |
| | | | | | | | |
Net increase (decrease) in shares outstanding | | | (53,044 | ) | | $ | (805,142 | ) |
| | | | | | | | |
Year ended September 30, 2018: | | | | | | | | |
Shares sold | | | 5,364 | | | $ | 81,822 | |
Shares issued in reinvestment of dividends and distributions | | | 27,490 | | | | 413,453 | |
Shares reacquired | | | (68,967 | ) | | | (1,047,633 | ) |
| | | | | | | | |
Net increase (decrease) in shares outstanding before conversion | | | (36,113 | ) | | | (552,358 | ) |
Shares reacquired upon conversion into other share class(es) | | | (274,505 | ) | | | (4,221,708 | ) |
| | | | | | | | |
Net increase (decrease) in shares outstanding | | | (310,618 | ) | | $ | (4,774,066 | ) |
| | | | | | | | |
Class C | | | | | | |
Six months ended March 31, 2019: | | | | | | | | |
Shares sold | | | 80,148 | | | $ | 1,089,615 | |
Shares issued in reinvestment of dividends and distributions | | | 140,368 | | | | 1,702,660 | |
Shares reacquired | | | (192,287 | ) | | | (2,651,962 | ) |
| | | | | | | | |
Net increase (decrease) in shares outstanding before conversion | | | 28,229 | | | | 140,313 | |
Shares reacquired upon conversion into other share class(es) | | | (19,370 | ) | | | (259,973 | ) |
| | | | | | | | |
Net increase (decrease) in shares outstanding | | | 8,859 | | | $ | (119,660 | ) |
| | | | | | | | |
Year ended September 30, 2018: | | | | | | | | |
Shares sold | | | 213,390 | | | $ | 3,244,135 | |
Shares issued in reinvestment of dividends and distributions | | | 59,242 | | | | 891,011 | |
Shares reacquired | | | (351,192 | ) | | | (5,341,527 | ) |
| | | | | | | | |
Net increase (decrease) in shares outstanding before conversion | | | (78,560 | ) | | | (1,206,381 | ) |
Shares reacquired upon conversion into other share class(es) | | | (42,995 | ) | | | (657,144 | ) |
| | | | | | | | |
Net increase (decrease) in shares outstanding | | | (121,555 | ) | | $ | (1,863,525 | ) |
| | | | | | | | |
Class R | | | | | | |
Six months ended March 31, 2019: | | | | | | | | |
Shares sold | | | 1,277 | | | $ | 17,769 | |
Shares issued in reinvestment of dividends and distributions | | | 1,258 | | | | 15,270 | |
Shares reacquired | | | (51 | ) | | | (741 | ) |
| | | | | | | | |
Net increase (decrease) in shares outstanding | | | 2,484 | | | $ | 32,298 | |
| | | | | | | | |
Year ended September 30, 2018: | | | | | | | | |
Shares sold | | | 8,761 | | | $ | 134,500 | |
Shares issued in reinvestment of dividends and distributions | | | 274 | | | | 4,129 | |
Shares reacquired | | | (721 | ) | | | (10,949 | ) |
| | | | | | | | |
Net increase (decrease) in shares outstanding | | | 8,314 | | | $ | 127,680 | |
| | | | | | | | |
| | | | |
| PGIM Asset Allocation Funds | | | 59 | |
Notes to Financial Statements(continued)
Moderate Allocation Fund (cont’d.):
| | | | | | | | |
Class Z | | Shares | | | Amount | |
Six months ended March 31, 2019: | | | | | | | | |
Shares sold | | | 24,854 | | | $ | 319,102 | |
Shares issued in reinvestment of dividends and distributions | | | 20,203 | | | | 246,479 | |
Shares reacquired | | | (39,284 | ) | | | (543,730 | ) |
| | | | | | | | |
Net increase (decrease) in shares outstanding before conversion | | | 5,773 | | | | 21,851 | |
Shares issued upon conversion from other share class(es) | | | 20,542 | | | | 296,531 | |
| | | | | | | | |
Net increase (decrease) in shares outstanding | | | 26,315 | | | $ | 318,382 | |
| | | | | | | | |
Year ended September 30, 2018: | | | | | | | | |
Shares sold | | | 30,829 | | | $ | 473,493 | |
Shares issued in reinvestment of dividends and distributions | | | 7,601 | | | | 114,998 | |
Shares reacquired | | | (132,128 | ) | | | (2,023,872 | ) |
| | | | | | | | |
Net increase (decrease) in shares outstanding before conversion | | | (93,698 | ) | | | (1,435,381 | ) |
Shares issued upon conversion from other share class(es) | | | 57,928 | | | | 894,738 | |
Shares reacquired upon conversion into other share class(es) | | | (3,253 | ) | | | (50,293 | ) |
| | | | | | | | |
Net increase (decrease) in shares outstanding | | | (39,023 | ) | | $ | (590,936 | ) |
| | | | | | | | |
Class R6 | | | | | | |
Six months ended March 31, 2019: | | | | | | | | |
Shares issued in reinvestment of dividends and distributions | | | 72 | | | $ | 887 | |
| | | | | | | | |
Net increase (decrease) in shares outstanding | | | 72 | | | $ | 887 | |
| | | | | | | | |
Period ended September 30, 2018*: | | | | | | | | |
Shares sold | | | 640 | | | $ | 10,000 | |
Shares issued in reinvestment of dividends and distributions | | | 30 | | | | 454 | |
| | | | | | | | |
Net increase (decrease) in shares outstanding | | | 670 | | | $ | 10,454 | |
| | | | | | | | |
| * | Commencement of offering was November 28, 2017. |
Growth Allocation Fund:
| | | | | | | | |
Class A | | Shares | | | Amount | |
Six months ended March 31, 2019: | | | | | | | | |
Shares sold | | | 162,177 | | | $ | 2,672,250 | |
Shares issued in reinvestment of dividends and distributions | | | 456,710 | | | | 6,439,607 | |
Shares reacquired | | | (288,885 | ) | | | (4,792,668 | ) |
| | | | | | | | |
Net increase (decrease) in shares outstanding before conversion | | | 330,002 | | | | 4,319,189 | |
Shares issued upon conversion from other share class(es) | | | 57,990 | | | | 956,108 | |
Shares reacquired upon conversion into other share class(es) | | | (543 | ) | | | (9,112 | ) |
| | | | | | | | |
Net increase (decrease) in shares outstanding | | | 387,449 | | | $ | 5,266,185 | |
| | | | | | | | |
Year ended September 30, 2018: | | | | | | | | |
Shares sold | | | 351,505 | | | $ | 6,540,949 | |
Shares issued in reinvestment of dividends and distributions | | | 156,094 | | | | 2,864,318 | |
Shares reacquired | | | (524,099 | ) | | | (9,766,442 | ) |
| | | | | | | | |
Net increase (decrease) in shares outstanding before conversion | | | (16,500 | ) | | | (361,175 | ) |
Shares issued upon conversion from other share class(es) | | | 148,190 | | | | 2,794,188 | |
Shares reacquired upon conversion into other share class(es) | | | (1,715 | ) | | | (31,796 | ) |
| | | | | | | | |
Net increase (decrease) in shares outstanding | | | 129,975 | | | $ | 2,401,217 | |
| | | | | | | | |
Class B | | | | | | |
Six months ended March 31, 2019: | | | | | | | | |
Shares sold | | | 928 | | | $ | 15,407 | |
Shares issued in reinvestment of dividends and distributions | | | 33,654 | | | | 450,627 | |
Shares reacquired | | | (19,694 | ) | | | (310,245 | ) |
| | | | | | | | |
Net increase (decrease) in shares outstanding before conversion | | | 14,888 | | | | 155,789 | |
Shares reacquired upon conversion into other share class(es) | | | (52,503 | ) | | | (821,157 | ) |
| | | | | | | | |
Net increase (decrease) in shares outstanding | | | (37,615 | ) | | $ | (665,368 | ) |
| | | | | | | | |
Year ended September 30, 2018: | | | | | | | | |
Shares sold | | | 7,215 | | | $ | 128,843 | |
Shares issued in reinvestment of dividends and distributions | | | 14,068 | | | | 247,735 | |
Shares reacquired | | | (52,376 | ) | | | (932,712 | ) |
| | | | | | | | |
Net increase (decrease) in shares outstanding before conversion | | | (31,093 | ) | | | (556,134 | ) |
Shares reacquired upon conversion into other share class(es) | | | (155,023 | ) | | | (2,793,587 | ) |
| | | | | | | | |
Net increase (decrease) in shares outstanding | | | (186,116 | ) | | $ | (3,349,721 | ) |
| | | | | | | | |
Class C | | | | | | |
Six months ended March 31, 2019: | | | | | | | | |
Shares sold | | | 64,375 | | | $ | 1,015,572 | |
Shares issued in reinvestment of dividends and distributions | | | 93,637 | | | | 1,255,671 | |
Shares reacquired | | | (88,585 | ) | | | (1,380,529 | ) |
| | | | | | | | |
Net increase (decrease) in shares outstanding before conversion | | | 69,427 | | | | 890,714 | |
Shares reacquired upon conversion into other share class(es) | | | (9,197 | ) | | | (144,741 | ) |
| | | | | | | | |
Net increase (decrease) in shares outstanding | | | 60,230 | | | $ | 745,973 | |
| | | | | | | | |
Year ended September 30, 2018: | | | | | | | | |
Shares sold | | | 145,913 | | | $ | 2,596,208 | |
Shares issued in reinvestment of dividends and distributions | | | 25,763 | | | | 454,206 | |
Shares reacquired | | | (111,710 | ) | | | (1,994,127 | ) |
| | | | | | | | |
Net increase (decrease) in shares outstanding before conversion | | | 59,966 | | | | 1,056,287 | |
Shares reacquired upon conversion into other share class(es) | | | (10,117 | ) | | | (181,640 | ) |
| | | | | | | | |
Net increase (decrease) in shares outstanding | | | 49,849 | | | $ | 874,647 | |
| | | | | | | | |
| | | | |
| PGIM Asset Allocation Funds | | | 61 | |
Notes to Financial Statements(continued)
Growth Allocation Fund (cont’d.):
| | | | | | | | |
Class R | | Shares | | | Amount | |
Six months ended March 31, 2019: | | | | | | | | |
Shares sold | | | 176 | | | $ | 2,904 | |
Shares issued in reinvestment of dividends and distributions | | | 233 | | | | 3,252 | |
Shares reacquired | | | (509 | ) | | | (9,416 | ) |
| | | | | | | | |
Net increase (decrease) in shares outstanding | | | (100 | ) | | $ | (3,260 | ) |
| | | | | | | | |
Year ended September 30, 2018: | | | | | | | | |
Shares sold | | | 10,475 | | | $ | 190,219 | |
Shares issued in reinvestment of dividends and distributions | | | 376 | | | | 6,849 | |
Shares reacquired | | | (9,545 | ) | | | (177,064 | ) |
| | | | | | | | |
Net increase (decrease) in shares outstanding before conversion | | | 1,306 | | | | 20,004 | |
Shares reacquired upon conversion into other share class(es) | | | (281 | ) | | | (5,208 | ) |
| | | | | | | | |
Net increase (decrease) in shares outstanding | | | 1,025 | | | $ | 14,796 | |
| | | | | | | | |
Class Z | | | | | | |
Six months ended March 31, 2019: | | | | | | | | |
Shares sold | | | 8,518 | | | $ | 145,232 | |
Shares issued in reinvestment of dividends and distributions | | | 23,774 | | | | 340,207 | |
Shares reacquired | | | (148,567 | ) | | | (2,246,023 | ) |
| | | | | | | | |
Net increase (decrease) in shares outstanding before conversion | | | (116,275 | ) | | | (1,760,584 | ) |
Shares issued upon conversion from other share class(es) | | | 1,166 | | | | 18,902 | |
| | | | | | | | |
Net increase (decrease) in shares outstanding | | | (115,109 | ) | | $ | (1,741,682 | ) |
| | | | | | | | |
Year ended September 30, 2018: | | | | | | | | |
Shares sold | | | 143,903 | | | $ | 2,718,842 | |
Shares issued in reinvestment of dividends and distributions | | | 5,518 | | | | 102,463 | |
Shares reacquired | | | (35,280 | ) | | | (664,198 | ) |
| | | | | | | | |
Net increase (decrease) in shares outstanding before conversion | | | 114,141 | | | | 2,157,107 | |
Shares issued upon conversion from other share class(es) | | | 12,035 | | | | 227,603 | |
Shares reacquired upon conversion into other share class(es) | | | (500 | ) | | | (9,560 | ) |
| | | | | | | | |
Net increase (decrease) in shares outstanding | | | 125,676 | | | $ | 2,375,150 | |
| | | | | | | | |
Class R6 | | | | | | |
Six months ended March 31, 2019: | | | | | | | | |
Shares issued in reinvestment of dividends and distributions | | | 2,524 | | | $ | 36,114 | |
Shares reacquired | | | (157 | ) | | | (2,659 | ) |
| | | | | | | | |
Net increase (decrease) in shares outstanding | | | 2,367 | | | $ | 33,455 | |
| | | | | | | | |
Period ended September 30, 2018*: | | | | | | | | |
Shares sold | | | 24,837 | | | $ | 472,342 | |
Shares issued in reinvestment of dividends and distributions | | | 20 | | | | 371 | |
Shares reacquired | | | (273 | ) | | | (5,191 | ) |
| | | | | | | | |
Net increase (decrease) in shares outstanding | | | 24,584 | | | $ | 467,522 | |
| | | | | | | | |
| * | Commencement of offering was November 28, 2017. |
7. Borrowings
The Company, on behalf of the Allocation Funds, along with other affiliated registered investment companies (the “Funds”), is a party to a Syndicated Credit Agreement (“SCA”) with a group of banks. The purpose of the SCA is to provide an alternative source of temporary funding for capital share redemptions. The SCA provides for a commitment of $900 million for the period October 4, 2018 through October 3, 2019. The Funds pay an annualized commitment fee of 0.15% of the unused portion of the SCA. Each Allocation Fund’s portion of the commitment fee for the unused amount, allocated based upon a method approved by the Board, is accrued daily and paid quarterly. Prior to October 4, 2018, the Funds had another SCA that provided a commitment of $900 million and the Funds paid an annualized commitment fee of 0.15% of the unused portion of the SCA. The interest on borrowings under the SCAs is paid monthly and at a per annum interest rate based upon a contractual spread plus the higher of (1) the effective federal funds rate, (2) the1-month LIBOR rate or (3) zero percent.
Certain affiliated registered investment companies that are parties to the SCA include portfolios that are subject to a predetermined mathematical formula used to manage certain benefit guarantees offered under variable annuity contracts. The formula may result in large scale asset flows into and out of these portfolios. Consequently, these portfolios may be more likely to utilize the SCA for purposes of funding redemptions. It may be possible for those portfolios to fully exhaust the committed amount of the SCA, thereby requiring the Manager to allocate available funding per a Board-approved methodology designed to treat the Funds in the SCA equitably.
The Allocation Funds utilized the SCA during the reporting period ended March 31, 2019. The average balance outstanding is for the number of days the Funds utilized the credit facility.
| | | | | | | | | | | | | | | | | | | | |
Fund | | Average Balance
Outstanding | | | Weighted
Average
Interest Rates | | | Number of
Days
Outstanding | | | Maximum Balance
Outstanding | | | Balance
Outstanding at
March 31, 2019 | |
PGIM Conservative Allocation Fund | | $ | 964,000 | | | | 3.76 | % | | | 1 | | | $ | 964,000 | | | $ | — | |
PGIM Growth Allocation Fund | | | 490,000 | | | | 3.75 | | | | 2 | | | | 490,000 | | | | — | |
8. Risks of Investing in the Funds
The Allocation Funds’ risks include, but are not limited to, some or all of the risks discussed below:
Fund of Funds Risk:The value of an investment in the Allocation Funds will be related, to a substantial degree, to the investment performance of the Underlying Funds in which it invests. Therefore, the principal risks of investing in the Allocation Funds are closely related to the principal risks associated with these Underlying Funds and their investments. Because the Allocation Funds’ allocation among different Underlying Funds and direct
| | | | |
| PGIM Asset Allocation Funds | | | 63 | |
Notes to Financial Statements(continued)
investments in securities and derivatives will vary, an investment in the Allocation Funds may be subject to any and all of these risks at different times and to different degrees. Investing in an Underlying Fund will also expose the Allocation Funds to a pro rata portion of the Underlying Fund’s fees and expenses. In addition, one Underlying Fund may buy the same securities that another Underlying Fund sells. Therefore, the Series would indirectly bear the costs of these trades without accomplishing the investment purpose.
Liquidity Risk:Certain Underlying Funds may invest in instruments that trade in lower volumes and are less liquid than other investments. Liquidity risk exists when particular investments made by an Underlying Fund are difficult to purchase or sell. Liquidity risk also includes the risk that the Underlying Fund may make investments that may become less liquid in response to market developments or adverse investor perceptions. If the Underlying Fund is forced to sell these investments to pay redemption proceeds or for other reasons, the Fund may lose money. In addition, when there is no willing buyer and investments cannot be readily sold at the desired time or price, the Underlying Fund may have to accept a lower price or may not be able to sell the instrument at all. An inability to sell a portfolio position can adversely affect the Fund’s value or prevent the Fund from being able to take advantage of other investment opportunities.
Market and Credit Risk:Securities markets may be volatile and the market prices of the Allocation Funds’ securities may decline. Securities fluctuate in price based on changes in an issuer’s financial condition and overall market and economic conditions. If the market prices of the securities owned by the Allocation Funds fall, the value of an investment in the Allocation Funds will decline. Additionally, the Allocation Funds may also be exposed to credit risk in the event that an issuer or guarantor fails to perform or that an institution or entity with which the Allocation Funds have unsettled or open transactions defaults.
Non-diversification Risk:Anon-diversified Fund may invest a greater percentage of its assets in the securities of a single company or industry than a diversified fund. Investing in anon-diversified fund involves greater risk than investing in a diversified fund because a loss resulting from the decline in value of any one security may represent a greater portion of the total assets of anon-diversified fund.
9. Recent Accounting Pronouncements and Reporting Updates
In August 2018, the Securities and Exchange Commission (the “SEC”) adopted amendments to RegulationS-X to update and simplify the disclosure requirements for registered investment companies by eliminating requirements that are redundant or duplicative of US GAAP requirements or other SEC disclosure requirements. The new amendments require the presentation of the total, rather than the components, of distributable earnings on the Statement of Assets and Liabilities and the total, rather than
the components, of dividends from net investment income and distributions from net realized gains on the Statements of Changes in Net Assets. The amendments also removed the requirement for the parenthetical disclosure of undistributed net investment income on the Statements of Changes in Net Assets and certain tax adjustments that were reflected in the Notes to Financial Statements. The Manager has adopted the amendments and reflected them in the Allocation Funds’ financial statements.
In August 2018, the FASB issued Accounting Standards Update (“ASU”)No. 2018-13, which changes certain fair value measurement disclosure requirements. The new ASU, in addition to other modifications and additions, removes the requirement to disclose the amount and reasons for transfers between Level 1 and Level 2 of the fair value hierarchy, and the Allocation Funds’ policy for the timing of transfers between levels. The amendments are effective for financial statements issued for fiscal years beginning after December 15, 2019, and interim periods within those fiscal years. The Manager has evaluated the implications of certain provisions of the ASU and has determined to early adopt aspects related to the removal and modification of certain fair value measurement disclosures under the ASU effective immediately. At this time, the Manager is evaluating the implications of certain other provisions of the ASU related to new disclosure requirements and any impact on the financial statement disclosures has not yet been determined.
10. Subsequent Event
At a meeting held on December 6, 2018, the Board of Directors of the Allocation Funds approved a plan of reorganization whereby the PGIM QMALarge-Cap Core Equity Fund would acquire the PGIM Growth Allocation Fund and PGIM Balanced Fund would acquire the PGIM Conservative Allocation Fund and the PGIM Moderate Allocation Fund, respectively. These reorganizations were approved by the shareholders of the Allocation Funds on May 7, 2019 and are scheduled to be completed on or about June 21, 2019.
| | | | |
| PGIM Asset Allocation Funds | | | 65 | |
PGIM Conservative Allocation Fund
Financial Highlights(unaudited)
| | | | | | | | | | | | | | | | | | | | | | | | | | | | |
| Class A Shares | | | | | | | | | | | | | | | | | | | | | |
| | | Six Months
Ended
March 31, 2019(a) | | | | | | Year Ended September 30, | |
| | | 2018(a) | | | 2017(a) | | | 2016(a) | | | 2015(a) | | | 2014 | |
| Per Share Operating Performance: | | | | | | | | | | | | | | | | | | | | | | | | | | | | |
| Net Asset Value, Beginning of Period | | | $13.02 | | | | | | | | $13.10 | | | | $12.43 | | | | $12.49 | | | | $13.30 | | | | $13.03 | |
| Income (loss) from investment operations: | | | | | | | | | | | | | | | | | | | | | | | | | | | | |
| Net investment income (loss) | | | 0.19 | | | | | | | | 0.23 | | | | 0.18 | | | | 0.16 | | | | 0.24 | | | | 0.20 | |
| Net realized and unrealized gain (loss) on investment transactions | | | (0.15 | ) | | | | | | | 0.25 | | | | 0.83 | | | | 0.62 | | | | (0.41 | ) | | | 0.53 | |
| Total from investment operations | | | 0.04 | | | | | | | | 0.48 | | | | 1.01 | | | | 0.78 | | | | (0.17 | ) | | | 0.73 | |
| Less Dividends and Distributions: | | | | | | | | | | | | | | | | | | | | | | | | | | | | |
| Dividends from net investment income | | | (0.24 | ) | | | | | | | (0.31 | ) | | | (0.20 | ) | | | (0.21 | ) | | | (0.29 | ) | | | (0.22 | ) |
| Distributions from net realized gains | | | (0.50 | ) | | | | | | | (0.25 | ) | | | (0.14 | ) | | | (0.63 | ) | | | (0.35 | ) | | | (0.24 | ) |
| Total dividends and distributions | | | (0.74 | ) | | | | | | | (0.56 | ) | | | (0.34 | ) | | | (0.84 | ) | | | (0.64 | ) | | | (0.46 | ) |
| Net asset value, end of period | | | $12.32 | | | | | | | | $13.02 | | | | $13.10 | | | | $12.43 | | | | $12.49 | | | | $13.30 | |
| Total Return(b): | | | 0.85% | | | | | | | | 3.69% | | | | 8.33% | | | | 6.61% | | | | (1.42)% | | | | 5.67% | |
| |
| Ratios/Supplemental Data: | |
| Net assets, end of period (000) | | | $85,424 | | | | | | | | $87,433 | | | | $86,890 | | | | $85,173 | | | | $73,273 | | | | $72,292 | |
| Average net assets (000) | | | $83,376 | | | | | | | | $88,432 | | | | $82,763 | | | | $81,813 | | | | $75,170 | | | | $66,510 | |
| Ratios to average net assets(c)(d): | | | | | | | | | | | | | | | | | | | | | | | | | | | | |
| Expenses after waivers and/or expense reimbursement | | | 0.60% | (e) | | | | | | | 0.60% | | | | 0.71% | | | | 0.73% | | | | 0.72% | | | | 0.71% | |
| Expenses before waivers and/or expense reimbursement | | | 0.71% | (e) | | | | | | | 0.66% | | | | 0.77% | | | | 0.78% | | | | 0.77% | | | | 0.76% | |
| Net investment income (loss) | | | 3.16% | (e) | | | | | | | 1.74% | | | | 1.43% | | | | 1.36% | | | | 1.86% | | | | 1.48% | |
| Portfolio turnover rate(f) | | | 14% | | | | | | | | 20% | | | | 17% | | | | 25% | | | | 42% | | | | 46% | |
| (a) | Calculated based on average shares outstanding during the period. |
| (b) | Total return does not consider the effects of sales loads. Total return is calculated assuming a purchase of a share on the first day and a sale on the last day of each period reported and includes reinvestment of dividends and distributions, if any. Total returns may reflect adjustments to conform to generally accepted accounting principles. Total returns for periods less than one full year are not annualized. |
| (c) | Effective October 1, 2017, class specific expenses include transfer agent fees and expenses and registration fees, which are charged to their respective share class. |
| (d) | Does not include expenses of the underlying funds in which the Fund invests. |
| (f) | The Fund’s portfolio turnover rate is calculated in accordance with regulatory requirements, without regard to transactions involving short term investments and certain derivatives. If such transactions were included, the Fund’s portfolio turnover rate may be higher. |
See Notes to Financial Statements.
| | | | | | | | | | | | | | | | | | | | | | | | | | | | |
| Class B Shares | | | | | | | | | | | | | | | | | | | | | |
| | | Six Months
Ended
March 31, 2019(a) | | | | | | Year Ended September 30, | |
| | | 2018(a) | | | 2017(a) | | | 2016(a) | | | 2015(a) | | | 2014 | |
| Per Share Operating Performance: | | | | | | | | | | | | | | | | | | | | | | | | | | | | |
| Net Asset Value, Beginning of Period | | | $12.95 | | | | | | | | $13.04 | | | | $12.37 | | | | $12.43 | | | | $13.24 | | | | $12.98 | |
| Income (loss) from investment operations: | | | | | | | | | | | | | | | | | | | | | | | | | | | | |
| Net investment income (loss) | | | 0.15 | | | | | | | | 0.13 | | | | 0.10 | | | | 0.08 | | | | 0.15 | | | | 0.10 | |
| Net realized and unrealized gain (loss) on investment transactions | | | (0.15 | ) | | | | | | | 0.24 | | | | 0.81 | | | | 0.61 | | | | (0.42 | ) | | | 0.52 | |
| Total from investment operations | | | - | (b) | | | | | | | 0.37 | | | | 0.91 | | | | 0.69 | | | | (0.27 | ) | | | 0.62 | |
| Less Dividends and Distributions: | | | | | | | | | | | | | | | | | | | | | | | | | | | | |
| Dividends from net investment income | | | (0.20 | ) | | | | | | | (0.21 | ) | | | (0.10 | ) | | | (0.12 | ) | | | (0.19 | ) | | | (0.12 | ) |
| Distributions from net realized gains | | | (0.50 | ) | | | | | | | (0.25 | ) | | | (0.14 | ) | | | (0.63 | ) | | | (0.35 | ) | | | (0.24 | ) |
| Total dividends and distributions | | | (0.70 | ) | | | | | | | (0.46 | ) | | | (0.24 | ) | | | (0.75 | ) | | | (0.54 | ) | | | (0.36 | ) |
| Net asset value, end of period | | | $12.25 | | | | | | | | $12.95 | | | | $13.04 | | | | $12.37 | | | | $12.43 | | | | $13.24 | |
| Total Return(c): | | | 0.48% | | | | | | | | 2.85% | | | | 7.54% | | | | 5.84% | | | | (2.17)% | | | | 4.82% | |
| |
| Ratios/Supplemental Data: | |
| Net assets, end of period (000) | | | $3,731 | | | | | | | | $4,680 | | | | $7,892 | | | | $16,107 | | | | $30,118 | | | | $40,863 | |
| Average net assets (000) | | | $4,210 | | | | | | | | $6,242 | | | | $12,187 | | | | $23,560 | | | | $37,344 | | | | $43,801 | |
| Ratios to average net assets(d)(e): | | | | | | | | | | | | | | | | | | | | | | | | | | | | |
| Expenses after waivers and/or expense reimbursement | | | 1.35% | (f) | | | | | | | 1.35% | | | | 1.47% | | | | 1.48% | | | | 1.47% | | | | 1.46% | |
| Expenses before waivers and/or expense reimbursement | | | 1.98% | (f) | | | | | | | 1.71% | | | | 1.48% | | | | 1.48% | | | | 1.47% | | | | 1.46% | |
| Net investment income (loss) | | | 2.41% | (f) | | | | | | | 1.03% | | | | 0.77% | | | | 0.67% | | | | 1.17% | | | | 0.73% | |
| Portfolio turnover rate(g) | | | 14% | | | | | | | | 20% | | | | 17% | | | | 25% | | | | 42% | | | | 46% | |
| (a) | Calculated based on average shares outstanding during the period. |
| (b) | Less than $0.005 per share. |
| (c) | Total return does not consider the effects of sales loads. Total return is calculated assuming a purchase of a share on the first day and a sale on the last day of each period reported and includes reinvestment of dividends and distributions, if any. Total returns may reflect adjustments to conform to generally accepted accounting principles. Total returns for periods less than one full year are not annualized. |
| (d) | Effective October 1, 2017, class specific expenses include transfer agent fees and expenses and registration fees, which are charged to their respective share class. |
| (e) | Does not include expenses of the underlying funds in which the Fund invests. |
| (g) | The Fund’s portfolio turnover rate is calculated in accordance with regulatory requirements, without regard to transactions involving short term investments and certain derivatives. If such transactions were included, the Fund’s portfolio turnover rate may be higher. |
See Notes to Financial Statements.
| | | | |
| PGIM Asset Allocation Funds | | | 67 | |
PGIM Conservative Allocation Fund
Financial Highlights(unaudited) (continued)
| | | | | | | | | | | | | | | | | | | | | | | | | | | | |
| Class C Shares | | | | | | | | | | | | | | | | | | | | | |
| | | Six Months
Ended
March 31, 2019(a) | | | | | | Year Ended September 30, | |
| | | 2018(a) | | | 2017(a) | | | 2016(a) | | | 2015(a) | | | 2014 | |
| Per Share Operating Performance: | | | | | | | | | | | | | | | | | | | | | | | | | | | | |
| Net Asset Value, Beginning of Period | | | $12.95 | | | | | | | | $13.04 | | | | $12.37 | | | | $12.44 | | | | $13.24 | | | | $12.98 | |
| Income (loss) from investment operations: | | | | | | | | | | | | | | | | | | | | | | | | | | | | |
| Net investment income (loss) | | | 0.15 | | | | | | | | 0.13 | | | | 0.09 | | | | 0.08 | | | | 0.14 | | | | 0.10 | |
| Net realized and unrealized gain (loss) on investment transactions | | | (0.14 | ) | | | | | | | 0.24 | | | | 0.82 | | | | 0.60 | | | | (0.40 | ) | | | 0.52 | |
| Total from investment operations | | | 0.01 | | | | | | | | 0.37 | | | | 0.91 | | | | 0.68 | | | | (0.26 | ) | | | 0.62 | |
| Less Dividends and Distributions: | | | | | | | | | | | | | | | | | | | | | | | | | | | | |
| Dividends from net investment income | | | (0.20 | ) | | | | | | | (0.21 | ) | | | (0.10 | ) | | | (0.12 | ) | | | (0.19 | ) | | | (0.12 | ) |
| Distributions from net realized gains | | | (0.50 | ) | | | | | | | (0.25 | ) | | | (0.14 | ) | | | (0.63 | ) | | | (0.35 | ) | | | (0.24 | ) |
| Total dividends and distributions | | | (0.70 | ) | | | | | | | (0.46 | ) | | | (0.24 | ) | | | (0.75 | ) | | | (0.54 | ) | | | (0.36 | ) |
| Net asset value, end of period | | | $12.26 | | | | | | | | $12.95 | | | | $13.04 | | | | $12.37 | | | | $12.44 | | | | $13.24 | |
| Total Return(b): | | | 0.56% | | | | | | | | 2.85% | | | | 7.54% | | | | 5.75% | | | | (2.09)% | | | | 4.82% | |
| |
| Ratios/Supplemental Data: | |
| Net assets, end of period (000) | | | $22,590 | | | | | | | | $25,307 | | | | $26,447 | | | | $28,325 | | | | $31,091 | | | | $28,724 | |
| Average net assets (000) | | | $23,093 | | | | | | | | $26,104 | | | | $27,069 | | | | $30,257 | | | | $30,647 | | | | $26,250 | |
| Ratios to average net assets(c)(d): | | | | | | | | | | | | | | | | | | | | | | | | | | | | |
| Expenses after waivers and/or expense reimbursement | | | 1.35% | (e) | | | | | | | 1.35% | | | | 1.46% | | | | 1.48% | | | | 1.47% | | | | 1.46% | |
| Expenses before waivers and/or expense reimbursement | | | 1.45% | (e) | | | | | | | 1.39% | | | | 1.47% | | | | 1.48% | | | | 1.47% | | | | 1.46% | |
| Net investment income (loss) | | | 2.41% | (e) | | | | | | | 1.00% | | | | 0.70% | | | | 0.63% | | | | 1.09% | | | | 0.69% | |
| Portfolio turnover rate(f) | | | 14% | | | | | | | | 20% | | | | 17% | | | | 25% | | | | 42% | | | | 46% | |
| (a) | Calculated based on average shares outstanding during the period. |
| (b) | Total return does not consider the effects of sales loads. Total return is calculated assuming a purchase of a share on the first day and a sale on the last day of each period reported and includes reinvestment of dividends and distributions, if any. Total returns may reflect adjustments to conform to generally accepted accounting principles. Total returns for periods less than one full year are not annualized. |
| (c) | Effective October 1, 2017, class specific expenses include transfer agent fees and expenses and registration fees, which are charged to their respective share class. |
| (d) | Does not include expenses of the underlying funds in which the Fund invests. |
| (f) | The Fund’s portfolio turnover rate is calculated in accordance with regulatory requirements, without regard to transactions involving short term investments and certain derivatives. If such transactions were included, the Fund’s portfolio turnover rate may be higher. |
See Notes to Financial Statements.
| | | | | | | | | | | | | | | | | | | | | | | | | | | | |
| Class R Shares | | | | | | | | | | | | | | | | | | | | | |
| | | Six Months
Ended
March 31, 2019(a) | | | | | | Year Ended September 30, | |
| | | 2018(a) | | | 2017(a) | | | 2016(a) | | | 2015(a) | | | 2014 | |
| Per Share Operating Performance: | | | | | | | | | | | | | | | | | | | | | | | | | | | | |
| Net Asset Value, Beginning of Period | | | $13.07 | | | | | | | | $13.15 | | | | $12.47 | | | | $12.53 | | | | $13.34 | | | | $13.07 | |
| Income (loss) from investment operations: | | | | | | | | | | | | | | | | | | | | | | | | | | | | |
| Net investment income (loss) | | | 0.18 | | | | | | | | 0.19 | | | | 0.15 | | | | 0.13 | | | | 0.21 | | | | 0.17 | |
| Net realized and unrealized gain (loss) on investment transactions | | | (0.15 | ) | | | | | | | 0.25 | | | | 0.84 | | | | 0.62 | | | | (0.41 | ) | | | 0.53 | |
| Total from investment operations | | | 0.03 | | | | | | | | 0.44 | | | | 0.99 | | | | 0.75 | | | | (0.20 | ) | | | 0.70 | |
| Less Dividends and Distributions: | | | | | | | | | | | | | | | | | | | | | | | | | | | | |
| Dividends from net investment income | | | (0.23 | ) | | | | | | | (0.27 | ) | | | (0.17 | ) | | | (0.18 | ) | | | (0.26 | ) | | | (0.19 | ) |
| Distributions from net realized gains | | | (0.50 | ) | | | | | | | (0.25 | ) | | | (0.14 | ) | | | (0.63 | ) | | | (0.35 | ) | | | (0.24 | ) |
| Total dividends and distributions | | | (0.73 | ) | | | | | | | (0.52 | ) | | | (0.31 | ) | | | (0.81 | ) | | | (0.61 | ) | | | (0.43 | ) |
| Net asset value, end of period | | | $12.37 | | | | | | | | $13.07 | | | | $13.15 | | | | $12.47 | | | | $12.53 | | | | $13.34 | |
| Total Return(b): | | | 0.72% | | | | | | | | 3.42% | | | | 8.11% | | | | 6.32% | | | | (1.66)% | | | | 5.38% | |
| |
| Ratios/Supplemental Data: | |
| Net assets, end of period (000) | | | $184 | | | | | | | | $178 | | | | $153 | | | | $115 | | | | $107 | | | | $95 | |
| Average net assets (000) | | | $176 | | | | | | | | $170 | | | | $136 | | | | $101 | | | | $101 | | | | $76 | |
| Ratios to average net assets(c)(d): | | | | | | | | | | | | | | | | | | | | | | | | | | | | |
| Expenses after waivers and/or expense reimbursement | | | 0.85% | (e) | | | | | | | 0.85% | | | | 0.96% | | | | 0.98% | | | | 0.97% | | | | 0.96% | |
| Expenses before waivers and/or expense reimbursement | | | 8.42% | (e) | | | | | | | 9.44% | | | | 1.22% | | | | 1.23% | | | | 1.22% | | | | 1.21% | |
| Net investment income (loss) | | | 2.89% | (e) | | | | | | | 1.49% | | | | 1.18% | | | | 1.10% | | | | 1.59% | | | | 1.18% | |
| Portfolio turnover rate(f) | | | 14% | | | | | | | | 20% | | | | 17% | | | | 25% | | | | 42% | | | | 46% | |
| (a) | Calculated based on average shares outstanding during the period. |
| (b) | Total return is calculated assuming a purchase of a share on the first day and a sale on the last day of each period reported and includes reinvestment of dividends and distributions, if any. Total returns may reflect adjustments to conform to generally accepted accounting principles. Total returns for periods less than one full year are not annualized. |
| (c) | Effective October 1, 2017, class specific expenses include transfer agent fees and expenses and registration fees, which are charged to their respective share class. |
| (d) | Does not include expenses of the underlying funds in which the Fund invests. |
| (f) | The Fund’s portfolio turnover rate is calculated in accordance with regulatory requirements, without regard to transactions involving short term investments and certain derivatives. If such transactions were included, the Fund’s portfolio turnover rate may be higher. |
See Notes to Financial Statements.
| | | | |
| PGIM Asset Allocation Funds | | | 69 | |
PGIM Conservative Allocation Fund
Financial Highlights(unaudited) (continued)
| | | | | | | | | | | | | | | | | | | | | | | | | | | | |
| Class Z Shares | | | | | | | | | | | | | | | | | | | | | |
| | | Six Months
Ended March 31, 2019(a) | | | | | | Year Ended September 30, | |
| | | 2018(a) | | | 2017(a) | | | 2016(a) | | | 2015(a) | | | 2014 | |
| Per Share Operating Performance: | | | | | | | | | | | | | | | | | | | | | | | | | | | | |
| Net Asset Value, Beginning of Period | | | $13.08 | | | | | | | | $13.17 | | | | $12.49 | | | | $12.55 | | | | $13.36 | | | | $13.09 | |
| Income (loss) from investment operations: | | | | | | | | | | | | | | | | | | | | | | | | | | | | |
| Net investment income (loss) | | | 0.22 | | | | | | | | 0.26 | | | | 0.21 | | | | 0.19 | | | | 0.27 | | | | 0.22 | |
| Net realized and unrealized gain (loss) on investment transactions | | | (0.16 | ) | | | | | | | 0.24 | | | | 0.84 | | | | 0.63 | | | | (0.40 | ) | | | 0.54 | |
| Total from investment operations | | | 0.06 | | | | | | | | 0.50 | | | | 1.05 | | | | 0.82 | | | | (0.13 | ) | | | 0.76 | |
| Less Dividends and Distributions: | | | | | | | | | | | | | | | | | | | | | | | | | | | | |
| Dividends from net investment income | | | (0.26 | ) | | | | | | | (0.34 | ) | | | (0.23 | ) | | | (0.25 | ) | | | (0.33 | ) | | | (0.25 | ) |
| Distributions from net realized gains | | | (0.50 | ) | | | | | | | (0.25 | ) | | | (0.14 | ) | | | (0.63 | ) | | | (0.35 | ) | | | (0.24 | ) |
| Total dividends and distributions | | | (0.76 | ) | | | | | | | (0.59 | ) | | | (0.37 | ) | | | (0.88 | ) | | | (0.68 | ) | | | (0.49 | ) |
| Net asset value, end of period | | | $12.38 | | | | | | | | $13.08 | | | | $13.17 | | | | $12.49 | | | | $12.55 | | | | $13.36 | |
| Total Return(b): | | | 0.97% | | | | | | | | 3.85% | | | | 8.65% | | | | 6.85% | | | | (1.16)% | | | | 5.90% | |
| |
| Ratios/Supplemental Data: | |
| Net assets, end of period (000) | | | $7,933 | | | | | | | | $10,099 | | | | $8,086 | | | | $7,637 | | | | $6,404 | | | | $5,572 | |
| Average net assets (000) | | | $8,772 | | | | | | | | $8,516 | | | | $7,804 | | | | $6,800 | | | | $6,058 | | | | $5,941 | |
| Ratios to average net assets(c)(d): | | | | | | | | | | | | | | | | | | | | | | | | | | | | |
| Expenses after waivers and/or expense reimbursement | | | 0.35% | (e) | | | | | | | 0.35% | | | | 0.46% | | | | 0.48% | | | | 0.47% | | | | 0.46% | |
| Expenses before waivers and/or expense reimbursement | | | 0.53% | (e) | | | | | | | 0.47% | | | | 0.47% | | | | 0.48% | | | | 0.47% | | | | 0.46% | |
| Net investment income (loss) | | | 3.54% | (e) | | | | | | | 1.96% | | | | 1.67% | | | | 1.59% | | | | 2.09% | | | | 1.75% | |
| Portfolio turnover rate(f) | | | 14% | | | | | | | | 20% | | | | 17% | | | | 25% | | | | 42% | | | | 46% | |
| (a) | Calculated based on average shares outstanding during the period. |
| (b) | Total return is calculated assuming a purchase of a share on the first day and a sale on the last day of each period reported and includes reinvestment of dividends and distributions, if any. Total returns may reflect adjustments to conform to generally accepted accounting principles. Total returns for periods less than one full year are not annualized. |
| (c) | Effective October 1, 2017, class specific expenses include transfer agent fees and expenses and registration fees, which are charged to their respective share class. |
| (d) | Does not include expenses of the underlying funds in which the Fund invests. |
| (f) | The Fund’s portfolio turnover rate is calculated in accordance with regulatory requirements, without regard to transactions involving short term investments and certain derivatives. If such transactions were included, the Fund’s portfolio turnover rate may be higher. |
See Notes to Financial Statements.
| | | | | | | | | | | | |
| Class R6 Shares | | | | | | | | | |
| | | Six Months
Ended
March 31,
2019 | | | | | | November 28,
2017(a)
through
September 30,
2018 | |
| Per Share Operating Performance(b): | | | | | | | | | | | | |
| Net Asset Value, Beginning of Period | | | $13.07 | | | | | | | | $13.34 | |
| Income (loss) from investment operations: | | | | | | | | | | | | |
| Net investment income (loss) | | | 0.21 | | | | | | | | 0.19 | |
| Net realized and unrealized gain (loss) on investment transactions | | | (0.14 | ) | | | | | | | 0.08 | |
| Total from investment operations | | | 0.07 | | | | | | | | 0.27 | |
| Less Dividends and Distributions: | | | | | | | | | | | | |
| Dividends from net investment income | | | (0.26 | ) | | | | | | | (0.29 | ) |
| Distributions from net realized gains | | | (0.50 | ) | | | | | | | (0.25 | ) |
| Total dividends and distributions | | | (0.76 | ) | | | | | | | (0.54 | ) |
| Net asset value, end of period | | | $12.38 | | | | | | | | $13.07 | |
| Total Return(c): | | | 1.05% | | | | | | | | 2.09% | |
| |
| Ratios/Supplemental Data: | |
| Net assets, end of period (000) | | | $63 | | | | | | | | $63 | |
| Average net assets (000) | | | $61 | | | | | | | | $33 | |
| Ratios to average net assets(d): | | | | | | | | | | | | |
| Expenses after waivers and/or expense reimbursement | | | 0.35% | (e) | | | | | | | 0.35% | (e) |
| Expenses before waivers and/or expense reimbursement | | | 25.81% | (e) | | | | | | | 94.93% | (e) |
| Net investment income (loss) | | | 3.40% | (e) | | | | | | | 1.78% | (e) |
| Portfolio turnover rate(f) | | | 14% | | | | | | | | 20% | |
| (a) | Commencement of offering. |
| (b) | Calculated based on average shares outstanding during the period. |
| (c) | Total return is calculated assuming a purchase of a share on the first day and a sale on the last day of each period reported and includes reinvestment of dividends and distributions, if any. Total returns may reflect adjustments to conform to generally accepted accounting principles. Total returns for periods less than one full year are not annualized. |
| (d) | Does not include expenses of the underlying funds in which the Fund invests. |
| (f) | The Fund’s portfolio turnover rate is calculated in accordance with regulatory requirements, without regard to transactions involving short term investments and certain derivatives. If such transactions were included, the Fund’s portfolio turnover rate may be higher. |
See Notes to Financial Statements.
| | | | |
| PGIM Asset Allocation Funds | | | 71 | |
PGIM Moderate Allocation Fund
Financial Highlights(unaudited)
| | | | | | | | | | | | | | | | | | | | | | | | | | | | |
| Class A Shares | | | | | | | | | | | | | | | | | | | | | |
| | | Six Months
Ended
March 31, 2019(a) | | | | | | Year Ended September 30, | |
| | | 2018(a) | | | 2017(a) | | | 2016(a) | | | 2015(a) | | | 2014 | |
| Per Share Operating Performance: | | | | | | | | | | | | | | | | | | | | | | | | | | | | |
| Net Asset Value, Beginning of Period | | | $15.47 | | | | | | | | $15.21 | | | | $13.93 | | | | $13.96 | | | | $15.17 | | | | $14.21 | |
| Income (loss) from investment operations: | | | | | | | | | | | | | | | | | | | | | | | | | | | | |
| Net investment income (loss) | | | 0.19 | | | | | | | | 0.20 | | | | 0.14 | | | | 0.12 | | | | 0.18 | | | | 0.15 | |
| Net realized and unrealized gain (loss) on investment transactions | | | (0.53 | ) | | | | | | | 0.73 | | | | 1.62 | | | | 0.94 | | | | (0.55 | ) | | | 0.97 | |
| Total from investment operations | | | (0.34 | ) | | | | | | | 0.93 | | | | 1.76 | | | | 1.06 | | | | (0.37 | ) | | | 1.12 | |
| Less Dividends and Distributions: | | | | | | | | | | | | | | | | | | | | | | | | | | | | |
| Dividends from net investment income | | | (0.35 | ) | | | | | | | (0.32 | ) | | | (0.17 | ) | | | (0.21 | ) | | | (0.31 | ) | | | (0.16 | ) |
| Distributions from net realized gains | | | (0.94 | ) | | | | | | | (0.35 | ) | | | (0.31 | ) | | | (0.88 | ) | | | (0.53 | ) | | | - | |
| Total dividends and distributions | | | (1.29 | ) | | | | | | | (0.67 | ) | | | (0.48 | ) | | | (1.09 | ) | | | (0.84 | ) | | | (0.16 | ) |
| Net asset value, end of period | | | $13.84 | | | | | | | | $ 15.47 | | | | $15.21 | | | | $13.93 | | | | $13.96 | | | | $15.17 | |
| Total Return(b): | | | (1.10)% | | | | | | | | 6.23% | | | | 12.99% | | | | 8.00% | | | | (2.79)% | | | | 7.91% | |
| |
| Ratios/Supplemental Data: | |
| Net assets, end of period (000) | | | $116,093 | | | | | | | | $125,569 | | | | $124,808 | | | | $106,173 | | | | $96,846 | | | | $93,752 | |
| Average net assets (000) | | | $115,811 | | | | | | | | $127,258 | | | | $114,527 | | | | $100,247 | | | | $98,271 | | | | $89,611 | |
| Ratios to average net assets(c)(d): | | | | | | | | | | | | | | | | | | | | | | | | | | | | |
| Expenses after waivers and/or expense reimbursement | | | 0.60% | (e) | | | | | | | 0.58% | | | | 0.70% | | | | 0.75% | | | | 0.71% | | | | 0.70% | |
| Expenses before waivers and/or expense reimbursement | | | 0.69% | (e) | | | | | | | 0.63% | | | | 0.76% | | | | 0.80% | | | | 0.76% | | | | 0.75% | |
| Net investment income (loss) | | | 2.77% | (e) | | | | | | | 1.27% | | | | 1.00% | | | | 0.90% | | | | 1.17% | | | | 1.00% | |
| Portfolio turnover rate(f) | | | 17% | | | | | | | | 24% | | | | 19% | | | | 20% | | | | 45% | | | | 35% | |
| (a) | Calculated based on average shares outstanding during the period. |
| (b) | Total return does not consider the effects of sales loads. Total return is calculated assuming a purchase of a share on the first day and a sale on the last day of each period reported and includes reinvestment of dividends and distributions, if any. Total returns may reflect adjustments to conform to generally accepted accounting principles. Total returns for periods less than one full year are not annualized. |
| (c) | Does not include expenses of the underlying funds in which the Fund invests. |
| (d) | Effective October 1, 2017, class specific expenses include transfer agent fees and expenses and registration fees, which are charged to their respective share class. |
| (f) | The Fund’s portfolio turnover rate is calculated in accordance with regulatory requirements, without regard to transactions involving short term investments and certain derivatives. If such transactions were included, the Fund’s portfolio turnover rate may be higher. |
See Notes to Financial Statements.
| | | | | | | | | | | | | | | | | | | | | | | | | | | | |
| Class B Shares | | | | | | | | | | | | | | | | | | | | | |
| | | Six Months
Ended
March 31, 2019(a) | | | | | | Year Ended September 30, | |
| | | 2018(a) | | | 2017(a) | | | 2016(a) | | | 2015(a) | | | 2014 | |
| Per Share Operating Performance: | | | | | | | | | | | | | | | | | | | | | | | | | | | | |
| Net Asset Value, Beginning of Period | | | $15.30 | | | | | | | | $15.05 | | | | $13.79 | | | | $13.83 | | | | $15.04 | | | | $14.09 | |
| Income (loss) from investment operations: | | | | | | | | | | | | | | | | | | | | | | | | | | | | |
| Net investment income (loss) | | | 0.14 | | | | | | | | 0.09 | | | | 0.06 | | | | 0.03 | | | | 0.07 | | | | 0.04 | |
| Net realized and unrealized gain (loss) on investment transactions | | | (0.53 | ) | | | | | | | 0.72 | | | | 1.58 | | | | 0.91 | | | | (0.56 | ) | | | 0.97 | |
| Total from investment operations | | | (0.39 | ) | | | | | | | 0.81 | | | | 1.64 | | | | 0.94 | | | | (0.49 | ) | | | 1.01 | |
| Less Dividends and Distributions: | | | | | | | | | | | | | | | | | | | | | | | | | | | | |
| Dividends from net investment income | | | (0.23 | ) | | | | | | | (0.21 | ) | | | (0.07 | ) | | | (0.10 | ) | | | (0.19 | ) | | | (0.06 | ) |
| Distributions from net realized gains | | | (0.94 | ) | | | | | | | (0.35 | ) | | | (0.31 | ) | | | (0.88 | ) | | | (0.53 | ) | | | - | |
| Total dividends and distributions | | | (1.17 | ) | | | | | | | (0.56 | ) | | | (0.38 | ) | | | (0.98 | ) | | | (0.72 | ) | | | (0.06 | ) |
| Net asset value, end of period | | | $13.74 | | | | | | | | $15.30 | | | | $15.05 | | | | $13.79 | | | | $13.83 | | | | $15.04 | |
| Total Return(b): | | | (1.51)% | | | | | | | | 5.47% | | | | 12.16% | | | | 7.13% | | | | (3.55)% | | | | 7.15% | |
| |
| Ratios/Supplemental Data: | |
| Net assets, end of period (000) | | | $7,324 | | | | | | | | $8,963 | | | | $13,496 | | | | $25,407 | | | | $38,084 | | | | $53,127 | |
| Average net assets (000) | | | $7,992 | | | | | | | | $11,082 | | | | $19,480 | | | | $32,651 | | | | $48,273 | | | | $56,302 | |
| Ratios to average net assets(c)(d): | | | | | | | | | | | | | | | | | | | | | | | | | | | | |
| Expenses after waivers and/or expense reimbursement | | | 1.35% | (e) | | | | | | | 1.35% | | | | 1.46% | | | | 1.50% | | | | 1.46% | | | | 1.45% | |
| Expenses before waivers and/or expense reimbursement | | | 1.77% | (e) | | | | | | | 1.59% | | | | 1.47% | | | | 1.50% | | | | 1.46% | | | | 1.45% | |
| Net investment income (loss) | | | 2.02% | (e) | | | | | | | 0.56% | | | | 0.40% | | | | 0.22% | | | | 0.49% | | | | 0.28% | |
| Portfolio turnover rate(f) | | | 17% | | | | | | | | 24% | | | | 19% | | | | 20% | | | | 45% | | | | 35% | |
| (a) | Calculated based on average shares outstanding during the period. |
| (b) | Total return does not consider the effects of sales loads. Total return is calculated assuming a purchase of a share on the first day and a sale on the last day of each period reported and includes reinvestment of dividends and distributions, if any. Total returns may reflect adjustments to conform to generally accepted accounting principles. Total returns for periods less than one full year are not annualized. |
| (c) | Does not include expenses of the underlying funds in which the Fund invests. |
| (d) | Effective October 1, 2017, class specific expenses include transfer agent fees and expenses and registration fees, which are charged to their respective share class. |
| (f) | The Fund’s portfolio turnover rate is calculated in accordance with regulatory requirements, without regard to transactions involving short term investments and certain derivatives. If such transactions were included, the Fund’s portfolio turnover rate may be higher. |
See Notes to Financial Statements.
| | | | |
| PGIM Asset Allocation Funds | | | 73 | |
PGIM Moderate Allocation Fund
Financial Highlights(unaudited) (continued)
| | | | | | | | | | | | | | | | | | | | | | | | | | | | |
| Class C Shares | | | | | | | | | | | | | | | | | | | | | |
| | | Six Months
Ended
March 31, 2019(a) | | | | | | Year Ended September 30, | |
| | | 2018(a) | | | 2017(a) | | | 2016(a) | | | 2015(a) | | | 2014 | |
| Per Share Operating Performance: | | | | | | | | | | | | | | | | | | | | | | | | | | | | |
| Net Asset Value, Beginning of Period | | | $15.29 | | | | | | | | $15.05 | | | | $13.78 | | | | $13.83 | | | | $15.03 | | | | $14.08 | |
| Income (loss) from investment operations: | | | | | | | | | | | | | | | | | | | | | | | | | | | | |
| Net investment income (loss) | | | 0.14 | | | | | | | | 0.08 | | | | 0.04 | | | | 0.03 | | | | 0.06 | | | | 0.04 | |
| Net realized and unrealized gain (loss) on investment transactions | | | (0.52 | ) | | | | | | | 0.72 | | | | 1.61 | | | | 0.90 | | | | (0.54 | ) | | | 0.97 | |
| Total from investment operations | | | (0.38 | ) | | | | | | | 0.80 | | | | 1.65 | | | | 0.93 | | | | (0.48 | ) | | | 1.01 | |
| Less Dividends and Distributions: | | | | | | | | | | | | | | | | | | | | | | | | | | | | |
| Dividends from net investment income | | | (0.23 | ) | | | | | | | (0.21 | ) | | | (0.07 | ) | | | (0.10 | ) | | | (0.19 | ) | | | (0.06 | ) |
| Distributions from net realized gains | | | (0.94 | ) | | | | | | | (0.35 | ) | | | (0.31 | ) | | | (0.88 | ) | | | (0.53 | ) | | | - | |
| Total dividends and distributions | | | (1.17 | ) | | | | | | | (0.56 | ) | | | (0.38 | ) | | | (0.98 | ) | | | (0.72 | ) | | | (0.06 | ) |
| Net asset value, end of period | | | $13.74 | | | | | | | | $15.29 | | | | $15.05 | | | | $13.78 | | | | $13.83 | | | | $15.03 | |
| Total Return(b): | | | (1.44)% | | | | | | | | 5.40% | | | | 12.24% | | | | 7.06% | | | | (3.48)% | | | | 7.15% | |
| |
| Ratios/Supplemental Data: | |
| Net assets, end of period (000) | | | $21,972 | | | | | | | | $24,322 | | | | $25,765 | | | | $28,306 | | | | $30,872 | | | | $29,564 | |
| Average net assets (000) | | | $22,120 | | | | | | | | $25,729 | | | | $26,925 | | | | $29,628 | | | | $31,776 | | | | $28,118 | |
| Ratios to average net assets(c)(d): | | | | | | | | | | | | | | | | | | | | | | | | | | | | |
| Expenses after waivers and/or expense reimbursement | | | 1.35% | (e) | | | | | | | 1.35% | | | | 1.45% | | | | 1.50% | | | | 1.46% | | | | 1.45% | |
| Expenses before waivers and/or expense reimbursement | | | 1.44% | (e) | | | | | | | 1.37% | | | | 1.46% | | | | 1.50% | | | | 1.46% | | | | 1.45% | |
| Net investment income (loss) | | | 2.00% | (e) | | | | | | | 0.51% | | | | 0.31% | | | | 0.19% | | | | 0.40% | | | | 0.24% | |
| Portfolio turnover rate(f) | | | 17% | | | | | | | | 24% | | | | 19% | | | | 20% | | | | 45% | | | | 35% | |
| (a) | Calculated based on average shares outstanding during the period. |
| (b) | Total return does not consider the effects of sales loads. Total return is calculated assuming a purchase of a share on the first day and a sale on the last day of each period reported and includes reinvestment of dividends and distributions, if any. Total returns may reflect adjustments to conform to generally accepted accounting principles. Total returns for periods less than one full year are not annualized. |
| (c) | Does not include expenses of the underlying funds in which the Fund invests. |
| (d) | Effective October 1, 2017, class specific expenses include transfer agent fees and expenses and registration fees, which are charged to their respective share class. |
| (f) | The Fund’s portfolio turnover rate is calculated in accordance with regulatory requirements, without regard to transactions involving short term investments and certain derivatives. If such transactions were included, the Fund’s portfolio turnover rate may be higher. |
See Notes to Financial Statements.
| | | | | | | | | | | | | | | | | | | | | | | | | | | | |
| Class R Shares | | | | | | | | | | | | | | | | | | | | | |
| | | Six Months
Ended
March 31, 2019(a) | | | | | | Year Ended September 30, | |
| | | 2018(a) | | | 2017(a) | | | 2016(a) | | | 2015(a) | | | 2014 | |
| Per Share Operating Performance: | | | | | | | | | | | | | | | | | | | | | | | | | | | | |
| Net Asset Value, Beginning of Period | | | $15.36 | | | | | | | | $15.11 | | | | $13.83 | | | | $13.87 | | | | $15.11 | | | | $14.15 | |
| Income (loss) from investment operations: | | | | | | | | | | | | | | | | | | | | | | | | | | | | |
| Net investment income (loss) | | | 0.17 | | | | | | | | 0.13 | | | | 0.07 | | | | 0.09 | | | | 0.18 | | | | 0.11 | |
| Net realized and unrealized gain (loss) on investment transactions | | | (0.52 | ) | | | | | | | 0.75 | | | | 1.65 | | | | 0.93 | | | | (0.62 | ) | | | 0.97 | |
| Total from investment operations | | | (0.35 | ) | | | | | | | 0.88 | | | | 1.72 | | | | 1.02 | | | | (0.44 | ) | | | 1.08 | |
| Less Dividends and Distributions: | | | | | | | | | | | | | | | | | | | | | | | | | | | | |
| Dividends from net investment income | | | (0.31 | ) | | | | | | | (0.28 | ) | | | (0.13 | ) | | | (0.18 | ) | | | (0.27 | ) | | | (0.12 | ) |
| Distributions from net realized gains | | | (0.94 | ) | | | | | | | (0.35 | ) | | | (0.31 | ) | | | (0.88 | ) | | | (0.53 | ) | | | - | |
| Total dividends and distributions | | | (1.25 | ) | | | | | | | (0.63 | ) | | | (0.44 | ) | | | (1.06 | ) | | | (0.80 | ) | | | (0.12 | ) |
| Net asset value, end of period | | | $13.76 | | | | | | | | $15.36 | | | | $15.11 | | | | $13.83 | | | | $13.87 | | | | $15.11 | |
| Total Return(b): | | | (1.20)% | | | | | | | | 5.94% | | | | 12.80% | | | | 7.68% | | | | (3.26)% | | | | 7.67% | |
| |
| Ratios/Supplemental Data: | |
| Net assets, end of period (000) | | | $195 | | | | | | | | $180 | | | | $51 | | | | $4 | | | | $4 | | | | $177 | |
| Average net assets (000) | | | $179 | | | | | | | | $135 | | | | $15 | | | | $4 | | | | $140 | | | | $167 | |
| Ratios to average net assets(c)(d): | | | | | | | | | | | | | | | | | | | | | | | | | | | | |
| Expenses after waivers and/or expense reimbursement | | | 0.85% | (e) | | | | | | | 0.85% | | | | 0.88% | | | | 1.00% | | | | 0.96% | | | | 0.95% | |
| Expenses before waivers and/or expense reimbursement | | | 8.62% | (e) | | | | | | | 11.64% | | | | 1.16% | | | | 1.25% | | | | 1.21% | | | | 1.20% | |
| Net investment income (loss) | | | 2.46% | (e) | | | | | | | 0.83% | | | | 0.51% | | | | 0.64% | | | | 1.18% | | | | 0.76% | |
| Portfolio turnover rate(f) | | | 17% | | | | | | | | 24% | | | | 19% | | | | 20% | | | | 45% | | | | 35% | |
| (a) | Calculated based on average shares outstanding during the period. |
| (b) | Total return is calculated assuming a purchase of a share on the first day and a sale on the last day of each period reported and includes reinvestment of dividends and distributions, if any. Total returns may reflect adjustments to conform to generally accepted accounting principles. Total returns for periods less than one full year are not annualized. |
| (c) | Does not include expenses of the underlying funds in which the Fund invests. |
| (d) | Effective October 1, 2017, class specific expenses include transfer agent fees and expenses and registration fees, which are charged to their respective share class. |
| (f) | The Fund’s portfolio turnover rate is calculated in accordance with regulatory requirements, without regard to transactions involving short term investments and certain derivatives. If such transactions were included, the Fund’s portfolio turnover rate may be higher. |
See Notes to Financial Statements.
| | | | |
| PGIM Asset Allocation Funds | | | 75 | |
PGIM Moderate Allocation Fund
Financial Highlights(unaudited) (continued)
| | | | | | | | | | | | | | | | | | | | | | | | | | | | |
| Class Z Shares | | | | | | | | | | | | | | | | | | | | | |
| | | Six Months
Ended
March 31, 2019(a) | | | | | | Year Ended September 30, | |
| | | 2018(a) | | | 2017(a) | | | 2016(a) | | | 2015(a) | | | 2014 | |
| Per Share Operating Performance: | | | | | | | | | | | | | | | | | | | | | | | | | | | | |
| Net Asset Value, Beginning of Period | | | $ 15.50 | | | | | | | | $ 15.24 | | | | $ 13.95 | | | | $ 13.99 | | | | $ 15.20 | | | | $14.23 | |
| Income (loss) from investment operations: | | | | | | | | | | | | | | | | | | | | | | | | | | | | |
| Net investment income (loss) | | | 0.21 | | | | | | | | 0.24 | | | | 0.18 | | | | 0.17 | | | | 0.21 | | | | 0.17 | |
| Net realized and unrealized gain (loss) on investment transactions | | | (0.54 | ) | | | | | | | 0.73 | | | | 1.62 | | | | 0.92 | | | | (0.54 | ) | | | 0.99 | |
| Total from investment operations | | | (0.33 | ) | | | | | | | 0.97 | | | | 1.80 | | | | 1.09 | | | | (0.33 | ) | | | 1.16 | |
| Less Dividends and Distributions: | | | | | | | | | | | | | | | | | | | | | | | | | | | | |
| Dividends from net investment income | | | (0.38 | ) | | | | | | | (0.36 | ) | | | (0.20 | ) | | | (0.25 | ) | | | (0.35 | ) | | | (0.19 | ) |
| Distributions from net realized gains | | | (0.94 | ) | | | | | | | (0.35 | ) | | | (0.31 | ) | | | (0.88 | ) | | | (0.53 | ) | | | - | |
| Total dividends and distributions | | | (1.32 | ) | | | | | | | (0.71 | ) | | | (0.51 | ) | | | (1.13 | ) | | | (0.88 | ) | | | (0.19 | ) |
| Net asset value, end of period | | | $ 13.85 | | | | | | | | $ 15.50 | | | | $ 15.24 | | | | $ 13.95 | | | | $ 13.99 | | | | $ 15.20 | |
| Total Return(b): | | | (0.95)% | | | | | | | | 6.47% | | | | 13.32% | | | | 8.21% | | | | (2.54)% | | | | 8.22% | |
| |
| Ratios/Supplemental Data: | |
| Net assets, end of period (000) | | | $ 2,987 | | | | | | | | $ 2,936 | | | | $ 3,481 | | | | $ 3,283 | | | | $ 3,601 | | | | $ 3,767 | |
| Average net assets (000) | | | $ 2,870 | | | | | | | | $ 3,103 | | | | $ 2,928 | | | | $ 3,319 | | | | $ 3,537 | | | | $ 3,190 | |
| Ratios to average net assets(c)(d): | | | | | | | | | | | | | | | | | | | | | | | | | | | | |
| Expenses after waivers and/or expense reimbursement | | | 0.35% | (e) | | | | | | | 0.35% | | | | 0.45% | | | | 0.50% | | | | 0.46% | | | | 0.45% | |
| Expenses before waivers and/or expense reimbursement | | | 0.88% | (e) | | | | | | | 0.81% | | | | 0.45% | | | | 0.50% | | | | 0.46% | | | | 0.45% | |
| Net investment income (loss) | | | 2.95% | (e) | | | | | | | 1.57% | | | | 1.27% | | | | 1.24% | | | | 1.43% | | | | 1.20% | |
| Portfolio turnover rate(f) | | | 17% | | | | | | | | 24% | | | | 19% | | | | 20% | | | | 45% | | | | 35% | |
| (a) | Calculated based on average shares outstanding during the period. |
| (b) | Total return is calculated assuming a purchase of a share on the first day and a sale on the last day of each period reported and includes reinvestment of dividends and distributions, if any. Total returns may reflect adjustments to conform to generally accepted accounting principles. Total returns for periods less than one full year are not annualized. |
| (c) | Does not include expenses of the underlying funds in which the Fund invests. |
| (d) | Effective October 1, 2017, class specific expenses include transfer agent fees and expenses and registration fees, which are charged to their respective share class. |
| (f) | The Fund’s portfolio turnover rate is calculated in accordance with regulatory requirements, without regard to transactions involving short term investments and certain derivatives. If such transactions were included, the Fund’s portfolio turnover rate may be higher. |
See Notes to Financial Statements.
| | | | | | | | | | | | |
| Class R6 Shares | | | | | | | | | |
| | | Six Months
Ended
March 31,
2019 | | | | | | November 28,
2017(a)
through
September 30,
2018 | |
| Per Share Operating Performance(b): | | | | | | | | | | | | |
| Net Asset Value, Beginning of Period | | | $15.50 | | | | | | | | $15.63 | |
| Income (loss) from investment operations: | | | | | | | | | | | | |
| Net investment income (loss) | | | 0.21 | | | | | | | | 0.21 | |
| Net realized and unrealized gain (loss) on investment transactions | | | (0.54 | ) | | | | | | | 0.37 | |
| Total from investment operations | | | (0.33 | ) | | | | | | | 0.58 | |
| Less Dividends and Distributions: | | | | | | | | | | | | |
| Dividends from net investment income | | | (0.38 | ) | | | | | | | (0.36 | ) |
| Distributions from net realized gains | | | (0.94 | ) | | | | | | | (0.35 | ) |
| Total dividends and distributions | | | (1.32 | ) | | | | | | | (0.71 | ) |
| Net asset value, end of period | | | $13.85 | | | | | | | | $15.50 | |
| Total Return(c): | | | (0.95)% | | | | | | | | 3.82% | |
| |
| Ratios/Supplemental Data: | |
| Net assets, end of period (000) | | | $10 | | | | | | | | $10 | |
| Average net assets (000) | | | $10 | | | | | | | | $10 | |
| Ratios to average net assets(d): | | | | | | | | | | | | |
| Expenses after waivers and/or expense reimbursement | | | 0.35% | (e) | | | | | | | 0.35% | (e) |
| Expenses before waivers and/or expense reimbursement | | | 155.54% | (e) | | | | | | | 304.68% | (e) |
| Net investment income (loss) | | | 2.98% | (e) | | | | | | | 1.64% | (e) |
| Portfolio turnover rate(f) | | | 17% | | | | | | | | 24% | |
| (a) | Commencement of offering. |
| (b) | Calculated based on average shares outstanding during the period. |
| (c) | Total return is calculated assuming a purchase of a share on the first day and a sale on the last day of each period reported and includes reinvestment of dividends and distributions, if any. Total returns may reflect adjustments to conform to generally accepted accounting principles. Total returns for periods less than one full year are not annualized. |
| (d) | Does not include expenses of the underlying funds in which the Fund invests. |
| (f) | The Fund’s portfolio turnover rate is calculated in accordance with regulatory requirements, without regard to transactions involving short term investments and certain derivatives. If such transactions were included, the Fund’s portfolio turnover rate may be higher. |
See Notes to Financial Statements.
| | | | |
| PGIM Asset Allocation Funds | | | 77 | |
PGIM Growth Allocation Fund
Financial Highlights(unaudited)
| | | | | | | | | | | | | | | | | | | | | | | | | | | | |
| Class A Shares | | | | | | | | | | | | | | | | | | | | | |
| | | Six Months
Ended
March 31, 2019 | | | | | | Year Ended September 30, | |
| | | 2018 | | | 2017 | | | 2016 | | | 2015 | | | 2014 | |
| Per Share Operating Performance(a): | | | | | | | | | | | | | | | | | | | | | | | | | | | | |
| Net Asset Value, Beginning of Period | | | $18.90 | | | | | | | | $ 18.07 | | | | $15.94 | | | | $16.15 | | | | $17.41 | | | | $16.02 | |
| Income (loss) from investment operations: | | | | | | | | | | | | | | | | | | | | | | | | | | | | |
| Net investment income (loss) | | | 0.19 | | | | | | | | 0.14 | | | | 0.10 | | | | 0.07 | | | | 0.08 | | | | 0.08 | |
| Net realized and unrealized gain (loss) on investment transactions | | | (1.05 | ) | | | | | | | 1.35 | | | | 2.67 | | | | 1.33 | | | | (0.84 | ) | | | 1.42 | |
| Total from investment operations | | | (0.86 | ) | | | | | | | 1.49 | | | | 2.77 | | | | 1.40 | | | | (0.76 | ) | | | 1.50 | |
| Less Dividends and Distributions: | | | | | | | | | | | | | | | | | | | | | | | | | | | | |
| Dividends from net investment income | | | (0.38 | ) | | | | | | | (0.40 | ) | | | (0.18 | ) | | | (0.16 | ) | | | (0.35 | ) | | | (0.11 | ) |
| Distributions from net realized gains | | | (1.08 | ) | | | | | | | (0.26 | ) | | | (0.46 | ) | | | (1.45 | ) | | | (0.15 | ) | | | - | |
| Total dividends and distributions | | | (1.46 | ) | | | | | | | (0.66 | ) | | | (0.64 | ) | | | (1.61 | ) | | | (0.50 | ) | | | (0.11 | ) |
| Net asset value, end of period | | | $16.58 | | | | | | | | $ 18.90 | | | | $18.07 | | | | $15.94 | | | | $16.15 | | | | $17.41 | |
| Total Return(b): | | | (3.18)% | | | | | | | | 8.35% | | | | 17.95% | | | | 9.13% | | | | (4.58)% | | | | 9.37% | |
| |
| Ratios/Supplemental Data: | |
| Net assets, end of period (000) | | | $80,988 | | | | | | | | $85,010 | | | | $78,919 | | | | $65,038 | | | | $57,536 | | | | $56,293 | |
| Average net assets (000) | | | $78,506 | | | | | | | | $83,930 | | | | $70,830 | | | | $60,610 | | | | $59,770 | | | | $52,609 | |
| Ratios to average net assets(c)(d): | | | | | | | | | | | | | | | | | | | | | | | | | | | | |
| Expenses after waivers and/or expense reimbursement | | | 0.60% | (e) | | | | | | | 0.60% | | | | 0.71% | | | | 0.75% | | | | 0.75% | | | | 0.75% | |
| Expenses before waivers and/or expense reimbursement | | | 0.78% | (e) | | | | | | | 0.73% | | | | 0.90% | | | | 0.97% | | | | 0.93% | | | | 0.90% | |
| Net investment income (loss) | | | 2.32% | (e) | | | | | | | 0.75% | | | | 0.58% | | | | 0.47% | | | | 0.48% | | | | 0.46% | |
| Portfolio turnover rate(f) | | | 14% | | | | | | | | 23% | | | | 23% | | | | 24% | | | | 44% | | | | 24% | |
| (a) | Calculated based on average shares outstanding during the period. |
| (b) | Total return does not consider the effects of sales loads. Total return is calculated assuming a purchase of a share on the first day and a sale on the last day of each period reported and includes reinvestment of dividends and distributions, if any. Total returns may reflect adjustments to conform to generally accepted accounting principles. Total returns for periods less than one full year are not annualized. |
| (c) | Effective October 1, 2017, class specific expenses include transfer agent fees and expenses and registration fees, which are charged to their respective share class. |
| (d) | Does not include expenses of the underlying funds in which the Fund invests. |
| (f) | The Fund’s portfolio turnover rate is calculated in accordance with regulatory requirements, without regard to transactions involving short term investments and certain derivatives. If such transactions were included, the Fund’s portfolio turnover rate may be higher. |
See Notes to Financial Statements.
| | | | | | | | | | | | | | | | | | | | | | | | | | | | |
| Class B Shares | | | | | | | | | | | | | | | | | | | | | |
| | | Six Months
Ended
March 31, 2019 | | | | | | Year Ended September 30, | |
| | | 2018 | | | 2017 | | | 2016 | | | 2015 | | | 2014 | |
| Per Share Operating Performance(a): | | | | | | | | | | | | | | | | | | | | | | | | | | | | |
| Net Asset Value, Beginning of Period | | | $18.03 | | | | | | | | $ 17.28 | | | | $15.28 | | | | $15.53 | | | | $16.76 | | | | $15.44 | |
| Income (loss) from investment operations: | | | | | | | | | | | | | | | | | | | | | | | | | | | | |
| Net investment income (loss) | | | 0.13 | | | | | | | | 0.02 | | | | - | (b) | | | (0.03 | ) | | | (0.03 | ) | | | (0.04 | ) |
| Net realized and unrealized gain (loss) on investment transactions | | | (1.02 | ) | | | | | | | 1.27 | | | | 2.53 | | | | 1.27 | | | | (0.82 | ) | | | 1.36 | |
| Total from investment operations | | | (0.89 | ) | | | | | | | 1.29 | | | | 2.53 | | | | 1.24 | | | | (0.85 | ) | | | 1.32 | |
| Less Dividends and Distributions: | | | | | | | | | | | | | | | | | | | | | | | | | | | | |
| Dividends from net investment income | | | (0.35 | ) | | | | | | | (0.28 | ) | | | (0.07 | ) | | | (0.04 | ) | | | (0.23 | ) | | | - | |
| Distributions from net realized gains | | | (1.08 | ) | | | | | | | (0.26 | ) | | | (0.46 | ) | | | (1.45 | ) | | | (0.15 | ) | | | - | |
| Total dividends and distributions | | | (1.43 | ) | | | | | | | (0.54 | ) | | | (0.53 | ) | | | (1.49 | ) | | | (0.38 | ) | | | - | |
| Net asset value, end of period | | | $15.71 | | | | | | | | $ 18.03 | | | | $17.28 | | | | $15.28 | | | | $15.53 | | | | $16.76 | |
| Total Return(c): | | | (3.55)% | | | | | | | | 7.53% | | | | 17.04% | | | | 8.35% | | | | (5.28)% | | | | 8.55% | |
| |
| Ratios/Supplemental Data: | |
| Net assets, end of period (000) | | | $4,856 | | | | | | | | $ 6,251 | | | | $9,205 | | | | $13,335 | | | | $18,670 | | | | $27,929 | |
| Average net assets (000) | | | $5,400 | | | | | | | | $ 7,824 | | | | $11,120 | | | | $16,171 | | | | $24,591 | | | | $30,822 | |
| Ratios to average net assets(d)(e): | | | | | | | | | | | | | | | | | | | | | | | | | | | | |
| Expenses after waivers and/or expense reimbursement | | | 1.35% | (f) | | | | | | | 1.35% | | | | 1.47% | | | | 1.50% | | | | 1.50% | | | | 1.50% | |
| Expenses before waivers and/or expense reimbursement | | | 2.02% | (f) | | | | | | | 1.75% | | | | 1.61% | | | | 1.67% | | | | 1.63% | | | | 1.60% | |
| Net investment income (loss) | | | 1.60% | (f) | | | | | | | 0.13% | | | | 0.01% | | | | (0.18)% | | | | (0.16)% | | | | (0.22)% | |
| Portfolio turnover rate(g) | | | 14% | | | | | | | | 23% | | | | 23% | | | | 24% | | | | 44% | | | | 24% | |
| (a) | Calculated based on average shares outstanding during the period. |
| (b) | Less than $0.005 per share. |
| (c) | Total return does not consider the effects of sales loads. Total return is calculated assuming a purchase of a share on the first day and a sale on the last day of each period reported and includes reinvestment of dividends and distributions, if any. Total returns may reflect adjustments to conform to generally accepted accounting principles. Total returns for periods less than one full year are not annualized. |
| (d) | Effective October 1, 2017, class specific expenses include transfer agent fees and expenses and registration fees, which are charged to their respective share class. |
| (e) | Does not include expenses of the underlying funds in which the Fund invests. |
| (g) | The Fund’s portfolio turnover rate is calculated in accordance with regulatory requirements, without regard to transactions involving short term investments and certain derivatives. If such transactions were included, the Fund’s portfolio turnover rate may be higher. |
See Notes to Financial Statements.
| | | | |
| PGIM Asset Allocation Funds | | | 79 | |
PGIM Growth Allocation Fund
Financial Highlights(unaudited) (continued)
| | | | | | | | | | | | | | | | | | | | | | | | | | | | |
| Class C Shares | | | | | | | | | | | | | | | | | | | | | |
| | | Six Months
Ended
March 31, 2019 | | | | | | Year Ended September 30, | |
| | | 2018 | | | 2017 | | | 2016 | | | 2015 | | | 2014 | |
| Per Share Operating Performance(a): | | | | | | | | | | | | | | | | | | | | | | | | | | | | |
| Net Asset Value, Beginning of Period | | | $18.05 | | | | | | | | $17.30 | | | | $15.30 | | | | $15.54 | | | | $16.78 | | | | $15.45 | |
| Income (loss) from investment operations: | | | | | | | | | | | | | | | | | | | | | | | | | | | | |
| Net investment income (loss) | | | 0.13 | | | | | | | | - | (b) | | | (0.02 | ) | | | (0.04 | ) | | | (0.05 | ) | | | (0.05 | ) |
| Net realized and unrealized gain (loss) on investment transactions | | | (1.02 | ) | | | | | | | 1.29 | | | | 2.55 | | | | 1.29 | | | | (0.81 | ) | | | 1.38 | |
| Total from investment operations | | | (0.89 | ) | | | | | | | 1.29 | | | | 2.53 | | | | 1.25 | | | | (0.86 | ) | | | 1.33 | |
| Less Dividends and Distributions: | | | | | | | | | | | | | | | | | | | | | | | | | | | | |
| Dividends from net investment income | | | (0.35 | ) | | | | | | | (0.28 | ) | | | (0.07 | ) | | | (0.04 | ) | | | (0.23 | ) | | | - | |
| Distributions from net realized gains | | | (1.08 | ) | | | | | | | (0.26 | ) | | | (0.46 | ) | | | (1.45 | ) | | | (0.15 | ) | | | - | |
| Total dividends and distributions | | | (1.43 | ) | | | | | | | (0.54 | ) | | | (0.53 | ) | | | (1.49 | ) | | | (0.38 | ) | | | - | |
| Net asset value, end of period | | | $15.73 | | | | | | | | $18.05 | | | | $17.30 | | | | $15.30 | | | | $15.54 | | | | $16.78 | |
| Total Return(c): | | | (3.55)% | | | | | | | | 7.52% | | | | 17.01% | | | | 8.41% | | | | (5.33)% | | | | 8.61% | |
| |
| Ratios/Supplemental Data: | |
| Net assets, end of period (000) | | | $14,936 | | | | | | | | $16,051 | | | | $14,517 | | | | $12,473 | | | | $12,025 | | | | $11,858 | |
| Average net assets (000) | | | $14,741 | | | | | | | | $15,714 | | | | $13,311 | | | | $12,092 | | | | $12,540 | | | | $11,625 | |
| Ratios to average net assets(d)(e): | | | | | | | | | | | | | | | | | | | | | | | | | | | | |
| Expenses after waivers and/or expense reimbursement | | | 1.35% | (f) | | | | | | | 1.35% | | | | 1.46% | | | | 1.50% | | | | 1.50% | | | | 1.50% | |
| Expenses before waivers and/or expense reimbursement | | | 1.53% | (f) | | | | | | | 1.48% | | | | 1.60% | | | | 1.67% | | | | 1.63% | | | | 1.60% | |
| Net investment income (loss) | | | 1.59% | (f) | | | | | | | -% | (g) | | | (0.14)% | | | | (0.26)% | | | | (0.28)% | | | | (0.29)% | |
| Portfolio turnover rate(h) | | | 14% | | | | | | | | 23% | | | | 23% | | | | 24% | | | | 44% | | | | 24% | |
| (a) | Calculated based on average shares outstanding during the period. |
| (b) | Less than $(0.005) per share. |
| (c) | Total return does not consider the effects of sales loads. Total return is calculated assuming a purchase of a share on the first day and a sale on the last day of each period reported and includes reinvestment of dividends and distributions, if any. Total returns may reflect adjustments to conform to generally accepted accounting principles. Total returns for periods less than one full year are not annualized. |
| (d) | Effective October 1, 2017, class specific expenses include transfer agent fees and expenses and registration fees, which are charged to their respective share class. |
| (e) | Does not include expenses of the underlying funds in which the Fund invests. |
| (h) | The Fund’s portfolio turnover rate is calculated in accordance with regulatory requirements, without regard to transactions involving short term investments and certain derivatives. If such transactions were included, the Fund’s portfolio turnover rate may be higher. |
See Notes to Financial Statements.
| | | | | | | | | | | | | | | | | | | | | | | | | | | | |
| Class R Shares | | | | | | | | | | | | | | | | | | | | | |
| | | Six Months
Ended
March 31, 2019 | | | | | | Year Ended September 30, | |
| | | 2018 | | | 2017 | | | 2016 | | | 2015 | | | 2014 | |
| Per Share Operating Performance(a): | | | | | | | | | | | | | | | | | | | | | | | | | | | | |
| Net Asset Value, Beginning of Period | | | $18.72 | | | | | | | | $17.91 | | | | $15.80 | | | | $16.01 | | | | $17.27 | | | | $15.90 | |
| Income (loss) from investment operations: | | | | | | | | | | | | | | | | | | | | | | | | | | | | |
| Net investment income (loss) | | | 0.17 | | | | | | | | 0.18 | | | | 0.06 | | | | (0.04 | ) | | | 0.04 | | | | 0.04 | |
| Net realized and unrealized gain (loss) on investment transactions | | | (1.05 | ) | | | | | | | 1.24 | | | | 2.65 | | | | 1.40 | | | | (0.84 | ) | | | 1.40 | |
| Total from investment operations | | | (0.88 | ) | | | | | | | 1.42 | | | | 2.71 | | | | 1.36 | | | | (0.80 | ) | | | 1.44 | |
| Less Dividends and Distributions: | | | | | | | | | | | | | | | | | | | | | | | | | | | | |
| Dividends from net investment income | | | (0.37 | ) | | | | | | | (0.35 | ) | | | (0.14 | ) | | | (0.12 | ) | | | (0.31 | ) | | | (0.07 | ) |
| Distributions from net realized gains | | | (1.08 | ) | | | | | | | (0.26 | ) | | | (0.46 | ) | | | (1.45 | ) | | | (0.15 | ) | | | - | |
| Total dividends and distributions | | | (1.45 | ) | | | | | | | (0.61 | ) | | | (0.60 | ) | | | (1.57 | ) | | | (0.46 | ) | | | (0.07 | ) |
| Net asset value, end of period | | | $16.39 | | | | | | | | $18.72 | | | | $17.91 | | | | $15.80 | | | | $16.01 | | | | $17.27 | |
| Total Return(b): | | | (3.34)% | | | | | | | | 8.05% | | | | 17.69% | | | | 8.91% | | | | (4.85)% | | | | 9.07% | |
| |
| Ratios/Supplemental Data: | |
| Net assets, end of period (000) | | | $42 | | | | | | | | $50 | | | | $29 | | | | $14 | | | | $3 | | | | $3 | |
| Average net assets (000) | | | $39 | | | | | | | | $139 | | | | $26 | | | | $8 | | | | $3 | | | | $3 | |
| Ratios to average net assets(c)(d): | | | | | | | | | | | | | | | | | | | | | | | | | | | | |
| Expenses after waivers and/or expense reimbursement | | | 0.85% | (e) | | | | | | | 0.85% | | | | 0.96% | | | | 1.00% | | | | 1.00% | | | | 0.97% | |
| Expenses before waivers and/or expense reimbursement | | | 34.10% | (e) | | | | | | | 11.20% | | | | 1.34% | | | | 1.42% | | | | 1.36% | | | | 1.31% | |
| Net investment income (loss) | | | 2.03% | (e) | | | | | | | 1.00% | | | | 0.35% | | | | (0.24)% | | | | 0.21% | | | | 0.25% | |
| Portfolio turnover rate(f) | | | 14% | | | | | | | | 23% | | | | 23% | | | | 24% | | | | 44% | | | | 24% | |
| (a) | Calculated based on average shares outstanding during the period. |
| (b) | Total return is calculated assuming a purchase of a share on the first day and a sale on the last day of each period reported and includes reinvestment of dividends and distributions, if any. Total returns may reflect adjustments to conform to generally accepted accounting principles. Total returns for periods less than one full year are not annualized. |
| (c) | Effective October 1, 2017, class specific expenses include transfer agent fees and expenses and registration fees, which are charged to their respective share class. |
| (d) | Does not include expenses of the underlying funds in which the Fund invests. |
| (f) | The Fund’s portfolio turnover rate is calculated in accordance with regulatory requirements, without regard to transactions involving short term investments and certain derivatives. If such transactions were included, the Fund’s portfolio turnover rate may be higher. |
See Notes to Financial Statements.
| | | | |
| PGIM Asset Allocation Funds | | | 81 | |
PGIM Growth Allocation Fund
Financial Highlights(unaudited) (continued)
| | | | | | | | | | | | | | | | | | | | | | | | | | | | |
| Class Z Shares | | | | | | | | | | | | | | | | | | | | | |
| | | Six Months
Ended
March 31, 2019 | | | | | | Year Ended September 30, | |
| | | 2018 | | | 2017 | | | 2016 | | | 2015 | | | 2014 | |
| Per Share Operating Performance(a): | | | | | | | | | | | | | | | | | | | | | | | | | | | | |
| Net Asset Value, Beginning of Period | | | $19.16 | | | | | | | | $ 18.30 | | | | $ 16.14 | | | | $ 16.34 | | | | $ 17.61 | | | | $ 16.20 | |
| Income (loss) from investment operations: | | | | | | | | | | | | | | | | | | | | | | | | | | | | |
| Net investment income (loss) | | | 0.30 | | | | | | | | 0.16 | | | | 0.14 | | | | 0.13 | | | | 0.15 | | | | 0.11 | |
| Net realized and unrealized gain (loss) on investment transactions | | | (1.15 | ) | | | | | | | 1.40 | | | | 2.70 | | | | 1.33 | | | | (0.87 | ) | | | 1.45 | |
| Total from investment operations | | | (0.85 | ) | | | | | | | 1.56 | | | | 2.84 | | | | 1.46 | | | | (0.72 | ) | | | 1.56 | |
| Less Dividends and Distributions: | | | | | | | | | | | | | | | | | | | | | | | | | | | | |
| Dividends from net investment income | | | (0.39 | ) | | | | | | | (0.44 | ) | | | (0.22 | ) | | | (0.21 | ) | | | (0.40 | ) | | | (0.15 | ) |
| Distributions from net realized gains | | | (1.08 | ) | | | | | | | (0.26 | ) | | | (0.46 | ) | | | (1.45 | ) | | | (0.15 | ) | | | - | |
| Total dividends and distributions | | | (1.47 | ) | | | | | | | (0.70 | ) | | | (0.68 | ) | | | (1.66 | ) | | | (0.55 | ) | | | (0.15 | ) |
| Net asset value, end of period | | | $16.84 | | | | | | | | $ 19.16 | | | | $ 18.30 | | | | $ 16.14 | | | | $ 16.34 | | | | $ 17.61 | |
| Total Return(b): | | | (3.06)% | | | | | | | | 8.66% | | | | 18.19% | | | | 9.39% | | | | (4.36)% | | | | 9.64% | |
| |
| Ratios/Supplemental Data: | |
| Net assets, end of period (000) | | | $2,212 | | | | | | | | $ 4,722 | | | | $ 2,211 | | | | $ 1,845 | | | | $ 1,573 | | | | $ 1,477 | |
| Average net assets (000) | | | $3,246 | | | | | | | | $ 3,582 | | | | $ 1,974 | | | | $ 1,794 | | | | $ 1,352 | | | | $ 1,278 | |
| Ratios to average net assets(c)(d): | | | | | | | | | | | | | | | | | | | | | | | | | | | | |
| Expenses after waivers and/or expense reimbursement | | | 0.35% | (e) | | | | | | | 0.35% | | | | 0.46% | | | | 0.50% | | | | 0.50% | | | | 0.50% | |
| Expenses before waivers and/or expense reimbursement | | | 1.04% | (e) | | | | | | | 0.90% | | | | 0.60% | | | | 0.67% | | | | 0.63% | | | | 0.60% | |
| Net investment income (loss) | | | 3.46% | (e) | | | | | | | 0.83% | | | | 0.86% | | | | 0.81% | | | | 0.82% | | | | 0.62% | |
| Portfolio turnover rate(f) | | | 14% | | | | | | | | 23% | | | | 23% | | | | 24% | | | | 44% | | | | 24% | |
| (a) | Calculated based on average shares outstanding during the period. |
| (b) | Total return is calculated assuming a purchase of a share on the first day and a sale on the last day of each period reported and includes reinvestment of dividends and distributions, if any. Total returns may reflect adjustments to conform to generally accepted accounting principles. Total returns for periods less than one full year are not annualized. |
| (c) | Effective October 1, 2017, class specific expenses include transfer agent fees and expenses and registration fees, which are charged to their respective share class. |
| (d) | Does not include expenses of the underlying funds in which the Fund invests. |
| (f) | The Fund’s portfolio turnover rate is calculated in accordance with regulatory requirements, without regard to transactions involving short term investments and certain derivatives. If such transactions were included, the Fund’s portfolio turnover rate may be higher. |
See Notes to Financial Statements.
| | | | | | | | | | | | |
| Class R6 Shares | | | | | | | | | |
| | | Six Months
Ended
March 31,
2019 | | | | | | November 28,
2017(a)
through
September 30,
2018 | |
| Per Share Operating Performance(b): | | | | | | | | | | | | |
| Net Asset Value, Beginning of Period | | | $19.15 | | | | | | | | $18.92 | |
| Income (loss) from investment operations: | | | | | | | | | | | | |
| Net investment income (loss) | | | 0.22 | | | | | | | | 0.01 | |
| Net realized and unrealized gain (loss) on investment transactions | | | (1.07 | ) | | | | | | | 0.92 | |
| Total from investment operations | | | (0.85 | ) | | | | | | | 0.93 | |
| Less Dividends and Distributions: | | | | | | | | | | | | |
| Dividends from net investment income | | | (0.39 | ) | | | | | | | (0.44 | ) |
| Distributions from net realized gains | | | (1.08 | ) | | | | | | | (0.26 | ) |
| Total dividends and distributions | | | (1.47 | ) | | | | | | | (0.70 | ) |
| Net asset value, end of period | | | $16.83 | | | | | | | | $19.15 | |
| Total Return(c): | | | (3.07)% | | | | | | | | 5.05% | |
| |
| Ratios/Supplemental Data: | |
| Net assets, end of period (000) | | | $454 | | | | | | | | $471 | |
| Average net assets (000) | | | $436 | | | | | | | | $208 | |
| Ratios to average net assets(d): | | | | | | | | | | | | |
| Expenses after waivers and/or expense reimbursement | | | 0.35% | (e) | | | | | | | 0.35% | (e) |
| Expenses before waivers and/or expense reimbursement | | | 3.87% | (e) | | | | | | | 15.30% | (e) |
| Net investment income (loss) | | | 2.57% | (e) | | | | | | | 0.05% | (e) |
| Portfolio turnover rate(f) | | | 14% | | | | | | | | 23% | |
| (a) | Commencement of offering. |
| (b) | Calculated based on average shares outstanding during the period. |
| (c) | Total return is calculated assuming a purchase of a share on the first day and a sale on the last day of each period reported and includes reinvestment of dividends and distributions, if any. Total returns may reflect adjustments to conform to generally accepted accounting principles. Total returns for periods less than one full year are not annualized. |
| (d) | Does not include expenses of the underlying funds in which the Fund invests. |
| (f) | The Fund’s portfolio turnover rate is calculated in accordance with regulatory requirements, without regard to transactions involving short term investments and certain derivatives. If such transactions were included, the Fund’s portfolio turnover rate may be higher. |
See Notes to Financial Statements.
| | | | |
| PGIM Asset Allocation Funds | | | 83 | |
| | | | |
| | |
| ∎ MAIL | | ∎ TELEPHONE | | ∎ WEBSITE |
655 Broad Street Newark, NJ 07102 | | (800) 225-1852 | | pgiminvestments.com |
|
| PROXY VOTING |
| The Board of Directors of the Funds has delegated to the Funds’ subadviser the responsibility for voting any proxies and maintaining proxy recordkeeping with respect to the Funds. A description of these proxy voting policies and procedures is available without charge, upon request, by calling (800) 225-1852. Information regarding how the Funds voted proxies relating to portfolio securities during the most recent 12-month period ended June 30 is available on the Funds’ websiteand on the Securities and Exchange Commission’s website. |
|
| DIRECTORS |
| Ellen S. Alberding• Kevin J. Bannon• Scott E. Benjamin• Linda W. Bynoe• Barry H. Evans• Keith F. Hartstein• Laurie Simon Hodrick• Michael S. Hyland• Stuart S. Parker• Brian K. Reid• Grace C. Torres |
|
| OFFICERS |
| Stuart S. Parker,President• Scott E. Benjamin,Vice President• Christian J. Kelly,Treasurer and Principal Financial and Accounting Officer• Raymond A. O’Hara,Chief Legal Officer• Chad A. Earnst,Chief Compliance Officer • Dino Capasso,Deputy Chief Compliance Officer • Andrew R. French,Secretary • Jonathan D. Shain,Assistant Secretary• Claudia DiGiacomo,Assistant Secretary• Diana N. Huffman,Assistant Secretary•Peter Parrella,Assistant Treasurer • Lana Lomuti,Assistant Treasurer • Linda McMullin,Assistant Treasurer• Kelly A. Coyne,Assistant Treasurer• Charles H. Smith,Anti-Money Laundering Compliance Officer |
| | | | |
| MANAGER | | PGIM Investments LLC | | 655 Broad Street Newark, NJ 07102 |
|
| SUBADVISER | | QMA LLC | | Gateway Center Two 100 Mulberry Street Newark, NJ 07102 |
|
| DISTRIBUTOR | | Prudential Investment Management Services LLC | | 655 Broad Street Newark, NJ 07102 |
|
| CUSTODIAN | | The Bank of New York Mellon | | 240 Greenwich Street New York, NY 10286 |
|
| TRANSFER AGENT | | Prudential Mutual Fund Services LLC | | PO Box 9658 Providence, RI 02940 |
|
INDEPENDENT REGISTERED
PUBLIC ACCOUNTING FIRM | | KPMG LLP | | 345 Park Avenue New York, NY 10154 |
|
| FUND COUNSEL | | Willkie Farr & Gallagher LLP | | 787 Seventh Avenue New York, NY 10019 |
|
|
| An investor should consider the investment objectives, risks, charges, and expenses of the Funds carefully before investing. The prospectus and summary prospectus for each Fund contain this and other information about the Funds. An investor may obtain the prospectus and summary prospectus by visiting our website atpgiminvestments.com or by calling (800) 225-1852. The prospectus and summary prospectus should be read carefully before investing. |
|
| E-DELIVERY |
| To receive your mutual fund documents online, go topgiminvestments.com/edeliveryand enroll. Instead of receiving printed documents by mail, you will receive notification via email when new materials are available. You can cancel your enrollment or change your email address at any time by visiting the website address above. |
|
| SHAREHOLDER COMMUNICATIONS WITH DIRECTORS |
| Shareholders can communicate directly with the Board of Directors by writing to the Chair of the Board, PGIM Asset Allocation Funds, PGIM Investments, Attn: Board of Directors, 655 Broad Street, Newark, NJ 07102. Shareholders can communicate directly with an individual Director by writing to the same address. Communications are not screened before being delivered to the addressee. |
|
| AVAILABILITY OF PORTFOLIO SCHEDULE |
| Each Fund files its complete schedule of portfolio holdings with the Securities and Exchange Commission for the first and third quarters of each fiscal year on Form N-Q. Each Fund’s Forms N-Q are available on the Commission’s website atsec.gov. Beginning with reporting periods on or after March 31, 2019, Form N-PORT will replace Form N-Q. Form N-PORT will be filed with the Securities and Exchange Commission quarterly, and each Fund’s full portfolio holdings as of its first and third quarters of each fiscal year will be made publicly available 60 days after the end of each quarter. Each Fund’s schedule of portfolio holdings is also available on the Funds’ website as of the end of each month no sooner than 15 days after the end of the month. |
Mutual Funds:
| | | | |
ARE NOT INSURED BY THE FDIC OR ANY
FEDERAL GOVERNMENT AGENCY | | MAY LOSE VALUE | | ARE NOT A DEPOSIT OF OR GUARANTEED
BY ANY BANK OR ANY BANK AFFILIATE |
| | | | | | | | | | |
| PGIM ASSET ALLOCATION FUNDS | | NASDAQ | | CUSIP | | | | NASDAQ | | CUSIP |
| PGIM Conservative Allocation (Class A) | | JDUAX | | 74437E750 | | PGIM Moderate Allocation (Class R) | | JMARX | | 74437E610 |
| PGIM Conservative Allocation (Class B) | | JDABX | | 74437E743 | | PGIM Moderate Allocation (Class Z) | | JDMZX | | 74437E776 |
| PGIM Conservative Allocation (Class C) | | JDACX | | 74437E735 | | PGIM Moderate Allocation (Class R6*) | | JDTQX | | 74437E438 |
| PGIM Conservative Allocation (Class R) | | JDARX | | 74437E628 | | PGIM Growth Allocation (Class A) | | JDAAX | | 74437E685 |
| PGIM Conservative Allocation (Class Z) | | JDAZX | | 74437E784 | | PGIM Growth Allocation (Class B) | | JDGBX | | 74437E677 |
| PGIM Conservative Allocation (Class R6*) | | JDAQX | | 74437E453 | | PGIM Growth Allocation (Class C) | | JDGCX | | 74437E669 |
| PGIM Moderate Allocation (Class A) | | JDTAX | | 74437E727 | | PGIM Growth Allocation (Class R) | | JGARX | | 74437E594 |
| PGIM Moderate Allocation (Class B) | | JDMBX | | 74437E719 | | PGIM Growth Allocation (Class Z) | | JDGZX | | 74437E768 |
| PGIM Moderate Allocation (Class C) | | JDMCX | | 74437E693 | | PGIM Growth Allocation (Class R6*) | | JDGQX | | 74437E446 |
* Formerly known as Class Q shares.
MF194E2
| Item 2 – | Code of Ethics – Not required, as this is not an annual filing. |
| Item 3 – | Audit Committee Financial Expert – Not required, as this is not an annual filing. |
| Item 4 – | Principal Accountant Fees and Services – Not required, as this is not an annual filing. |
| Item 5 – | Audit Committee of Listed Registrants – Not applicable. |
| Item 6 – | Schedule of Investments – The schedule is included as part of the report to shareholders filed under Item 1 of this Form. |
| Item 7 – | Disclosure of Proxy Voting Policies and Procedures for Closed-End Management Investment Companies – Not applicable. |
| Item 8 – | Portfolio Managers of Closed-End Management Investment Companies – Not applicable. |
| Item 9 – | Purchases of Equity Securities by Closed-End Management Investment Company and Affiliated Purchasers – Not applicable. |
| Item 10 – | Submission of Matters to a Vote of Security Holders – Not applicable. |
| Item 11 – | Controls and Procedures |
| | (a) | It is the conclusion of the registrant’s principal executive officer and principal financial officer that the effectiveness of the registrant’s current disclosure controls and procedures (such disclosure controls and procedures having been evaluated within 90 days of the date of this filing) provide reasonable assurance that the information required to be disclosed by the registrant has been recorded, processed, summarized and reported within the time period specified in the Commission’s rules and forms and that the information required to be disclosed by the registrant has been accumulated and communicated to the registrant’s principal executive officer and principal financial officer in order to allow timely decisions regarding required disclosure. |
| | (b) | There has been no significant change in the registrant’s internal control over financial reporting that occurred during the period covered by this report that has materially affected, or is likely to materially affect, the registrant’s internal control over financial reporting. |
| | (a) | (1) Code of Ethics – Not required, as this is not an annual filing. |
| | (2) | Certifications pursuant to Section 302 of the Sarbanes-Oxley Act – Attached hereto as ExhibitEX-99.CERT. |
| | (3) | Any written solicitation to purchase securities under Rule 23c-1. – Not applicable. |
| | (b) | Certifications pursuant to Section 906 of the Sarbanes-Oxley Act – Attached hereto as ExhibitEX-99.906CERT. |
SIGNATURES
Pursuant to the requirements of the Securities Exchange Act of 1934 and the Investment Company Act of 1940, the registrant has duly caused this report to be signed on its behalf by the undersigned, thereunto duly authorized.
| | |
Registrant: | | The Prudential Investment Portfolios, Inc. |
| |
By: | | /s/ Andrew R. French |
| | Andrew R. French |
| | Secretary |
| |
Date: | | May 14, 2019 |
Pursuant to the requirements of the Securities Exchange Act of 1934 and the Investment Company Act of 1940, this report has been signed below by the following persons on behalf of the registrant and in the capacities and on the dates indicated.
| | |
By: | | /s/ Stuart S. Parker |
| | Stuart S. Parker |
| | President and Principal Executive Officer |
| |
Date: | | May 14, 2019 |
| |
By: | | /s/ Christian J. Kelly |
| | Christian J. Kelly |
| | Treasurer and Principal Financial and Accounting Officer |
| |
Date: | | May 14, 2019 |