Item 1: Report to Shareholders| Corporate Income Fund | May 31, 2005 |
The views and opinions in this report were current as of May 31, 2005. They are not guarantees of performance or investment results and should not be taken as investment advice. Investment decisions reflect a variety of factors, and the managers reserve the right to change their views about individual stocks, sectors, and the markets at any time. As a result, the views expressed should not be relied upon as a forecast of the fund’s future investment intent. The report is certified under the Sarbanes-Oxley Act of 2002, which requires mutual funds and other public companies to affirm that, to the best of their knowledge, the information in their financial reports is fairly and accurately stated in all material respects.
REPORTS ON THE WEB
Sign up for our E-mail Program, and you can begin to receive updated fund reports and prospectuses online rather than through the mail. Log in to your account at troweprice.com for more information.
Fellow Shareholders
Investment-grade corporate bonds generated unexpectedly good returns during the 6- and 12-month periods ended May 31, 2005. Long-term securities were particularly strong as their yields declined even though the Federal Reserve has raised short-term interest rates eight times since June 2004. High-yield corporates were the weakest segment of the market over the past six months, although their performance was good for the 12-month period. Your fund posted robust returns over its fiscal year, surpassing its benchmarks.
MARKET ENVIRONMENT
Twelve months ago, strong U.S. economic growth and signs of rising inflation prompted the Federal Reserve to caution investors that it would begin raising short-term rates from the low levels that had prevailed for several years. From June 2004 through May 2005, the central bank gradually lifted the federal funds target rate—an overnight lending rate—from a 46-year low of 1.00% to 3.00% in eight quarter-point increments. Despite these rate increases and higher oil prices, the economy continued to expand steadily over the last year.
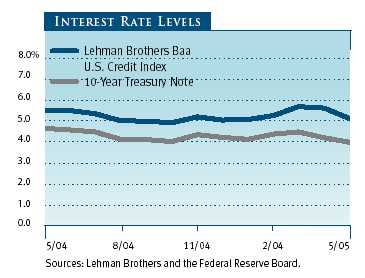
Money market yields, which closely track the fed funds rate, rose substantially over the last 12 months. In contrast, long-term interest rates declined, which was highly unexpected by most market observers. As a result, the difference between short- and long-term interest rates significantly narrowed during our fiscal year, resulting in a flattening of the Treasury yield curve (a graphic depiction of the relationship between short- and longer-term Treasury yields).
Long-term bond returns were generally favorable during the last six months, and Treasuries with long maturities fared best. Investment-grade corporate and mortgage-backed bonds lagged somewhat, while high-yield issues were barely in positive territory. For the 12-month period, bond returns were stronger. The Lehman Brothers U.S. Aggregate Index, which measures the performance of domestic investment-grade taxable bonds, returned 2.90% in the last six months and 6.82% for the full year.
PERFORMANCE
Your fund generated a moderate return for the six-month period ended May 31, 2005, surpassing its Lipper peer group average and roughly in line with the Lehman Brothers Baa U.S. Credit Index. For the year, the fund’s return was better and ahead of both benchmarks. The fund’s net asset value rose from $9.78 at the end of November to $9.80 at the end of May, while dividends added $0.23 per share to the total return. For the 12-month period, the fund’s net asset value rose $0.31 and dividends provided $0.46 per share.
| PERFORMANCE COMPARISON |
| Periods Ended 5/31/05 | 6 Months | 12 Months |
| Corporate Income Fund | 2.55% | 8.27% |
| Lehman Brothers Baa | | |
| U.S. Credit Index | 2.59 | 8.12 |
| Lipper Corporate Debt | | |
| Funds BBB-Rated Average | 2.40 | 7.37 |
| Please see the fund’s quarter-end returns following this letter. |
Over the course of the fund’s fiscal year, the yield curve flattened as the Fed lifted short-term rates against the backdrop of a strengthening economy while longer-term rates trended lower (see our comments about the yield curve in the previous section). The fund’s performance was constrained to some extent during the six-month period by our exposure to lower-rated bonds and the portfolio’s relatively short duration. (Duration is a measure of a bond fund’s sensitivity to interest rates; see the Glossary for a more detailed explanation.) As mentioned earlier, below investment-grade bonds posted only slight gains during the second half of our fiscal year, and the short duration trimmed results as long-term yields unexpectedly fell while short rates were rising. At the end of May, the fund’s weighted average effective duration was 6.2 years, shorter than that of the benchmark.
| PORTFOLIO CHARACTERISTICS |
| |
| Periods Ended | 11/30/04 | 5/31/05 |
| Price Per Share | $9.78 | $9.80 |
| |
| Dividends Per Share | | |
| | For 6 Months | 0.24 | 0.22 |
| |
| | For 12 Months | 0.50 | 0.46 |
| |
| 30-Day Dividend Yield * | 4.61% | 4.81% |
| |
| 30-Day Standardized | | |
| Yield to Maturity * | 4.43 | 5.06 |
| |
| Weighted Average | | |
| Maturity (years) | 10.7 | 11.2 |
| |
| Weighted Average Effective | | |
| Duration (years) ** | 6.0 | 6.2 |
| | | | |
| * | Dividends earned for the last 30 days of each period indi- |
| | cated are annualized and divided by the fund’s net asset |
| | value at the end of the period. | | |
| ** | As of 5/31/05, the fund’s modified duration was 6.2 years. |
| | This measure provides a more accurate estimate of the |
| | fund’s price sensitivity based solely on changes in real inter- |
| | est rates. Managers of the fund, however, rely on effective |
| | duration, an adjustment to modified duration reflecting an |
| | assumption that, over time, real interest rates change at |
| | roughly half the rate of the general level of interest rates, |
| | while changes to inflation expectations contribute to the |
| | other half. | | |
| Note: Yield will vary and is not guaranteed. | |
Fund performance benefited from our low exposure to bonds issued by auto makers, which turned out to be the most volatile segment of the high-yield market. We anticipate further volatility in so-called credit spreads (the difference between low- and high-rated bonds) over the next few months. Overall, however, we are comfortable with the longer-term credit risk of the bonds in our portfolio and will continue to allocate assets judiciously in the high-yield area.
At the end of May, 56% of the portfolio was invested in investment-grade bonds rated BBB, and 17% was allocated to bonds rated A and higher. The balance of the portfolio was diversified among BB, B, and unrated securities. Telecommunications constituted 11.6% of the portfolio (compared with 11.4% six months earlier), electric utilities fell to 10.7% from 11.4% in November, and automobiles and related bonds remained stable at a relatively low 10.5%.

| SECTOR DIVERSIFICATION |
| | Percent of | Percent of |
| Net Assets | Net Assets |
| | 11/30/04 | 5/31/05 |
| Telecommunications | 11.4% | 11.6% |
| Electric Utilities | 11.4 | 10.5 |
| Automobiles and Related | 10.5 | 10.5 |
| Petroleum | 3.2 | 5.3 |
| Banking | 3.6 | 5.0 |
| Foreign Government and Muni | 3.8 | 4.9 |
| Insurance | 2.3 | 3.6 |
| Gas and Gas Transmission | 3.8 | 3.2 |
| Investment Companies — Bonds | 4.1 | 3.0 |
| All Other | 45.9 | 42.4 |
| Total | 100.0% | 100.0% |
OUTLOOK
We expect the economy to grow about 4% in 2004, roughly the same rate as last year. We believe cost and price pressures will continue to build in coming months as the economy expands, but we expect any pickup in inflation to be moderate and well contained by the Federal Reserve’s monetary policy. Toward that end, the Fed is likely to continue its program of raising short-term interest rates at the measured pace it has adopted since June 2004. In this type of environment, with the economy growing moderately, longer-term yields increasing more slowly than short-term rates (or possibly declining further), and inflation under control, corporate bonds should perform reasonably well.
Corporate fixed-income securities offer portfolio diversification, are generally less volatile than equities, generate income that can help offset principal losses, and provide a relatively safer haven than stocks in periods of geopolitical instability. In addition, corporate bonds provide investors with a yield advantage over Treasuries, which can help offset any weakness in principal. We remain sanguine about the investment prospects for your fund as long as Fed policy continues as it has over the past 12 months.
As always, we will continue to monitor conditions closely and look for opportunities as they become available in a changing economic environment.
Thank you for investing with T. Rowe Price.
Respectfully submitted,

David A. Tiberii
Chairman of the fund’s Investment Advisory Committee
June 17, 2005
The committee chairman has day-to-day responsibility for managing the portfolio and works with committee members in developing and executing the fund’s investment program.
RISKS OF FIXED-INCOME INVESTING
Bonds are subject to interest rate risk (the decline in bond prices that usually accompanies a rise in interest rates) and credit risk (the chance that any fund holding could have its credit rating downgraded, or that a bond issuer will default by failing to make timely payments of interest or principal), potentially reducing the fund’s income level and share price. High-yield corporate bonds could have greater price declines than funds that invest primarily in high-quality bonds. Companies issuing high-yield bonds are not as strong financially as those with higher credit ratings, so the bonds are usually considered speculative investments.
GLOSSARY
Lipper averages: The averages of available mutual fund performance returns for specified time periods in defined categories as tracked by Lipper Inc.
Lehman Brothers Baa U.S. Credit Index: A measure of corporate and non-corporate fixed-income securities that are rated investment grade (Baa by Moody’s Investors Service and BBB by Standard & Poor’s) and have at least 10 years to final maturity.
Average maturity: The weighted average of the stated maturity dates of the portfolio’s securities. In general, the longer the average maturity, the greater the fund’s sensitivity to interest rate changes. A shorter average maturity usually means less interest rate sensitivity and, therefore, a less volatile portfolio.
Duration: A measure of a bond fund’s sensitivity to changes in interest rates. For example, a fund with a duration of 6.0 years would fall about 6% in price in response to a one-percentage-point rise in interest rates, and vice versa.
This chart shows the value of a hypothetical $10,000 investment in the fund over the past 10 fiscal year periods or since inception (for funds lacking 10-year records). The result is compared with benchmarks, which may include a broad-based market index and a peer group average or index. Market indexes do not include expenses, which are deducted from fund returns as well as mutual fund averages and indexes.

| AVERAGE ANNUAL COMPOUND TOTAL RETURN |
This table shows how the fund and its benchmarks would have performed if their actual (or cumulative) returns for the periods shown were earned at a constant rate.
| | | | Since |
| | | | Inception |
| Periods Ended 5/31/05 | 1 Year | 5 Years | 10/31/95 |
| Corporate Income Fund | 8.27% | 8.65% | 6.76% |
| Lehman Brothers Baa U.S. Credit Index | 8.12 | 9.25 | 7.26 |
| Lipper Corporate Debt Funds BBB-Rated Average | 7.37 | 7.92 | 6.49 |
| | | | |
| Returns do not reflect taxes that the shareholder may pay on fund distributions or the redemption of |
| fund shares. Past performance cannot guarantee future results. | | | |
As a mutual fund shareholder, you may incur two types of costs: (1) transaction costs such as redemption fees or sales loads and (2) ongoing costs, including management fees, distribution and service (12b-1) fees, and other fund expenses. The following example is intended to help you understand your ongoing costs (in dollars) of investing in the fund and to compare these costs with the ongoing costs of investing in other mutual funds. The example is based on an investment of $1,000 invested at the beginning of the most recent six-month period and held for the entire period.
Actual Expenses
The first line of the following table (“Actual”) provides information about actual account values and actual expenses. You may use the information in this line, together with your account balance, to estimate the expenses that you paid over the period. Simply divide your account value by $1,000 (for example, an $8,600 account value divided by $1,000 = 8.6), then multiply the result by the number in the first line under the heading “Expenses Paid During Period” to estimate the expenses you paid on your account during this period.
Hypothetical Example for Comparison Purposes
The information on the second line of the table (“Hypothetical”) is based on hypothetical account values and expenses derived from the fund’s actual expense ratio and an assumed 5% per year rate of return before expenses (not the fund’s actual return). You may compare the ongoing costs of investing in the fund with other funds by contrasting this 5% hypothetical example and the 5% hypothetical examples that appear in the shareholder reports of the other funds. The hypothetical account values and expenses may not be used to estimate the actual ending account balance or expenses you paid for the period.
Note: T. Rowe Price charges an annual small-account maintenance fee of $10, generally for accounts with less than $2,000 ($500 for UGMA/UTMA). The fee is waived for any investor whose T. Rowe Price mutual fund accounts total $25,000 or more, accounts employing automatic investing, and IRAs and other retirement plan accounts that utilize a prototype plan sponsored by T. Rowe Price (although a separate custodial or administrative fee may apply to such accounts). This fee is not included in the accompanying table. If you are subject to the fee, keep it in mind when you are estimating the ongoing expenses of investing in the fund and when comparing the expenses of this fund with other funds.
You should also be aware that the expenses shown in the table highlight only your ongoing costs and do not reflect any transaction costs, such as redemption fees or sales loads. Therefore, the second line of the table is useful in comparing ongoing costs only and will not help you determine the relative total costs of owning different funds. To the extent a fund charges transaction costs, however, the total cost of owning that fund is higher.
| T. ROWE PRICE CORPORATE INCOME FUND |
| |
| | Beginning | Ending | Expenses Paid |
| | Account Value | Account Value | During Period* |
| | 12/1/04 | 5/31/05 | 12/1/04 to 5/31/05 |
| Actual | $1,000.00 | $1,025.50 | $3.94 |
| Hypothetical (assumes 5% | | | |
| return before expenses) | 1,000.00 | 1,021.04 | 3.93 |
| | | | |
| * Expenses are equal to the fund’s annualized expense ratio for the six-month period (0.78%), multi- |
| plied by the average account value over the period, multiplied by the number of days in the most |
| recent fiscal half year (182) divided by the days in the year (365) to reflect the half-year period. |
| | | | Since |
| | | | Inception |
| Periods Ended 3/31/05 | 1 Year | 5 Years | 10/31/95 |
| Corporate Income Fund | 2.09% | 7.83% | 6.64% |
| Lehman Brothers Baa U.S. Credit Index | 1.13 | 8.22 | 7.10 |
| Lipper Corporate Debt Funds BBB-Rated Average | 1.57 | 6.97 | 6.34 |
| | | | |
| Current performance may be higher or lower than the quoted past performance, which cannot |
| guarantee future results. Share price, principal value, and return will vary, and you may have |
| a gain or loss when you sell your shares. For the most recent month-end performance infor- |
| mation, please visit our Web site (troweprice.com) or contact a T. Rowe Price representative |
| at 1-800-225-5132. | | | |
| | | | |
| This table provides returns through the most recent calendar quarter-end rather than through the end of |
| the fund’s fiscal period. Average annual total return figures include changes in principal value, reinvested |
| dividends, and capital gain distributions. Returns do not reflect taxes that the shareholder may pay on |
| fund distributions or the redemption of fund shares. When assessing performance, investors should con- |
| sider both short- and long-term returns. | | | |
| FINANCIAL HIGHLIGHTS | | | | For a share outstanding throughout each period |
| |
| | | Year | | | | | | | | |
| | | Ended | | | | | | | | |
| | | 5/31/05** | | 5/31/04 | | 5/31/03 | | 5/31/02 | | 5/31/01 |
| NET ASSET VALUE | | | | | | | | | | |
| Beginning of period | $ | 9.49 | $ | 9.80 | $ | 9.25 | $ | 9.31 | $ | 8.80 |
|
|
| |
| Investment activities | | | | | | | | | | |
| Net investment income (loss) | | 0.46‡ | | 0.52*‡ | | 0.57*‡ | | 0.65* | | 0.67* |
| Net realized and | | | | | | | | | | |
| unrealized gain (loss) | | 0.31 | | (0.31) | | 0.56 | | (0.06) | | 0.51 |
|
|
| Total from | | | | | | | | | | |
| investment activities | | 0.77 | | 0.21 | | 1.13 | | 0.59 | | 1.18 |
|
|
| |
| Distributions | | | | | | | | | | |
| Net investment income | | (0.46) | | (0.52) | | (0.58) | | (0.65) | | (0.67) |
|
|
| |
| NET ASSET VALUE | | | | | | | | | | |
| End of period | $ | 9.80 | $ | 9.49 | $ | 9.80 | $ | 9.25 | $ | 9.31 |
|
|
| |
| |
| Ratios/Supplemental Data | | | | | | | | | | |
| Total return ^ | | 8.27%‡ | | 2.18%*‡ | | 12.86%*‡ | | 6.49%* | | 13.86%* |
| Ratio of total expenses to | | | | | | | | | | |
| average net assets | | 0.78%‡ | | 0.75%*‡ | | 0.80%*‡ | | 0.80%* | | 0.80%* |
| Ratio of net investment | | | | | | | | | | |
| income (loss) to average | | | | | | | | | | |
| net assets | | 4.71%‡ | | 5.39%*‡ | | 6.21%*‡ | | 7.00%* | | 7.40%* |
| Portfolio turnover rate | | 61.3% | | 82.9% | | 92.9% | | 91.1% | | 98.1% |
| Net assets, end of period | | | | | | | | | | |
| (in thousands) | $ | 237,388 | $ 102,023 | $ 111,480 | $ | 78,341 | $ | 61,721 |
| ^ | Total return reflects the rate that an investor would have earned on an investment in the fund during each period, |
| | assuming reinvestment of all distributions. |
| * | See Note 4. Excludes expenses in excess of a 0.80% contractual expense limitation in effect through 9/30/05. |
| ‡ | See Note 4. Excludes expenses permanently waived of 0.02%, 0.05%, and 0.00% of average net assets for the |
| | years ended 5/31/05, 5/31/04, and 5/31/03, respectively, related to investments in T. Rowe Price Mutual Funds. |
| ** Per share amounts calculated using average shares outstanding method. |
The accompanying notes are an integral part of these financial statements.
| PORTFOLIO OF INVESTMENTS (1)+ | $ Par/Shares | Value |
| (Amounts in 000s) | | |
| | | |
| CORPORATE BONDS AND NOTES 85.5% | | |
| |
| Aerospace & Defense 1.2% | | |
| Boeing, 8.75%, 8/15/21 | 860 | 1,192 |
| Northrop Grumman | | |
| 7.125%, 2/15/11 | 800 | 901 |
| 7.75%, 3/1/16 | 500 | 621 |
| | | 2,714 |
| Airlines 0.2% | | |
| Southwest Airlines, 6.50%, 3/1/12 | 350 | 380 |
| | | 380 |
| Automobiles and Related 10.5% | | |
| DaimlerChrysler | | |
| 4.05%, 6/4/08 | 1,000 | 975 |
| 7.30%, 1/15/12 | 645 | 710 |
| 8.50%, 1/18/31 | 2,000 | 2,476 |
| VR, 3.45%, 9/10/07 | 1,000 | 995 |
| Ford Motor, 7.45%, 7/16/31 | 1,330 | 1,114 |
| Ford Motor Credit | | |
| 7.00%, 10/1/13 | 2,450 | 2,316 |
| 7.375%, 2/1/11 | 4,245 | 4,053 |
| VR, 4.711%, 1/15/10 | 1,660 | 1,441 |
| General Motors Acceptance Corp. | | |
| 6.875%, 8/28/12 | 2,000 | 1,726 |
| 8.00%, 11/1/31 | 4,025 | 3,411 |
| VR, 3.61%, 7/16/07 | 2,965 | 2,775 |
| VR, 5.11%, 12/1/14 | 1,450 | 1,165 |
| Hertz, VR, 4.419%, 8/5/08 | 600 | 583 |
| Lear, 8.11%, 5/15/09 | 975 | 1,004 |
| Navistar International, 144A, 6.25%, 3/1/12 | 100 | 95 |
| | | 24,839 |
| Banking 5.0% | | |
| Bank of America Capital Trust, 5.625%, 3/8/35 | 1,690 | 1,747 |
| Banknorth Capital Trust, Series B, 10.52%, 5/1/27 | 350 | 408 |
| Capital One Bank, 8.25%, 6/15/05 | 1,000 | 1,002 |
| First Tennessee Capital II, 6.30%, 4/15/34 | 1,015 | 1,043 |
| Frost National Bank of San Antonio, 6.875%, 8/1/11 | 375 | 415 |
| Hudson United Bancorp, 8.20%, 9/15/06 | 285 | 296 |
| Huntington National Bank, 4.65%, 6/30/09 | 315 | 320 |
| Independence Community Bank, VR, 3.75%, 4/1/14 | 235 | 226 |
| J.P. Morgan Chase Capital, 5.875%, 3/15/35 | 1,000 | 1,025 |
| KeyBank, 5.80%, 7/1/14 | 605 | 654 |
| MBNA, VR, 3.64%, 5/5/08 | 700 | 699 |
| MBNA America Bank, 7.125%, 11/15/12 | 2,925 | 3,330 |
| Popular North America, 4.25%, 4/1/08 | 225 | 226 |
| Suncorp-Metway, 144A, 4.625%, 6/15/13 | 475 | 472 |
| | | 11,863 |
| Beverages 1.0% | | |
| Cott Beverages, 8.00%, 12/15/11 | 200 | 212 |
| Miller Brewing, 144A, 5.50%, 8/15/13 | 670 | 695 |
| Panamerican Beverages, 7.25%, 7/1/09 | 500 | 544 |
| PepsiAmericas, 4.875%, 1/15/15 | 875 | 884 |
| | | 2,335 |
| Broadcasting 1.7% | | |
| AOL Time Warner, 7.625%, 4/15/31 | 1,000 | 1,246 |
| Chancellor Media, 8.00%, 11/1/08 | 415 | 447 |
| Hearst-Argyle TV, 7.50%, 11/15/27 | 1,125 | 1,250 |
| Time Warner, 6.875%, 6/15/18 | 900 | 1,029 |
| | | 3,972 |
| Building and Real Estate 2.0% | | |
| Centex, 4.55%, 11/1/10 | 650 | 640 |
| D. R. Horton, 5.625%, 9/15/14 | 1,000 | 984 |
| KB Home, 6.25%, 6/15/15 | 515 | 516 |
| Lennar, 144A, 5.60%, 5/31/15 | 515 | 523 |
| Mobile Mini, 9.50%, 7/1/13 | 200 | 218 |
| NVR, 5.00%, 6/15/10 | 370 | 369 |
| Pulte Homes, 7.875%, 8/1/11 | 810 | 921 |
| Ryland Group, 5.375%, 1/15/15 | 270 | 271 |
| Toll Brothers Finance, 144A, 5.15%, 5/15/15 | 290 | 286 |
| | | 4,728 |
| Building Products 0.9% | | |
| CRH America, 6.40%, 10/15/33 | 1,000 | 1,124 |
| MDC Holdings, 5.375%, 12/15/14 | 1,000 | 1,001 |
| | | 2,125 |
| Cable Operators 2.6% | | |
| Clear Channel Communications | | |
| 5.00%, 3/15/12 | 1,000 | 950 |
| 7.65%, 9/15/10 | 1,380 | 1,502 |
| Comcast, 7.05%, 3/15/33 | 1,040 | 1,242 |
| Comcast Cable Communications, 6.75%, 1/30/11 | 1,315 | 1,449 |
| Lenfest Communications, 10.50%, 6/15/06 | 250 | 266 |
| Shaw Communications, 7.40%, 10/17/07 (CAD) | 700 | 598 |
| Videotron, 6.875%, 1/15/14 | 200 | 200 |
| | | 6,207 |
| Conglomerates 0.3% | | |
| Tyco International, 5.80%, 8/1/06 | 800 | 816 |
| | | 816 |
| Container 0.2% | | |
| Sealed Air, 144A, 5.375%, 4/15/08 | 500 | 505 |
| | | 505 |
| Department Stores 0.1% | | |
| Federated Department Stores, 7.45%, 7/15/17 | 250 | 298 |
| | | 298 |
| Drugs 0.8% | | |
| Merck, 2.50%, 3/30/07 | 2,000 | 1,950 |
| | | 1,950 |
| Electric Utilities 10.5% | | |
| AES, 7.75%, 3/1/14 | 500 | 530 |
| ANR Pipeline, 8.875%, 3/15/10 | 500 | 542 |
| Arizona Public Service, 4.65%, 5/15/15 | 760 | 753 |
| Black Hills, 6.50%, 5/15/13 | 1,450 | 1,526 |
| Boston Edison Company, 4.875%, 10/15/12 | 480 | 491 |
| Centerpoint Energy, 7.25%, 9/1/10 | 1,000 | 1,109 |
| Cleco | | |
| 7.00%, 5/1/08 | 375 | 399 |
| 8.75%, 6/1/05 | 625 | 625 |
| Constellation Energy Group, 4.55%, 6/15/15 | 250 | 240 |
| Consumers Energy, 5.65%, 4/15/20 | 1,000 | 1,040 |
| El Paso Electric Company, 6.00%, 5/15/35 | 680 | 700 |
| El Paso Natural Gas, 7.625%, 8/1/10 | 250 | 263 |
| Exelon Generation, 5.35%, 1/15/14 | 500 | 517 |
| FirstEnergy, 5.50%, 11/15/06 | 1,000 | 1,019 |
| Monongahela Power, 5.00%, 10/1/06 | 990 | 1,000 |
| Nevada Power | | |
| 6.50%, 4/15/12 | 305 | 309 |
| 144A, 5.875%, 1/15/15 | 750 | 727 |
| PG&E | | |
| 6.05%, 3/1/34 | 1,200 | 1,323 |
| VR, 3.82%, 4/3/06 | 52 | 52 |
| Pinnacle West Capital, 6.40%, 4/1/06 | 490 | 500 |
| Public Service of New Mexico, 4.40%, 9/15/08 | 490 | 490 |
| San Diego Gas & Electric, 5.35%, 5/15/35 | 640 | 655 |
| Sempra Energy | | |
| 6.00%, 2/1/13 | 335 | 356 |
| VR, 3.317%, 5/21/08 | 970 | 973 |
| Southern California Edison, 4.65%, 4/1/15 | 845 | 841 |
| Southern Natural Gas, 8.875%, 3/15/10 | 500 | 543 |
| TXU, 144A | | |
| 4.80%, 11/15/09 | 1,000 | 973 |
| 6.50%, 11/15/24 | 2,450 | 2,372 |
| TXU Energy, 6.125%, 3/15/08 | 755 | 782 |
| Virginia Electric & Power, 4.50%, 12/15/10 | 500 | 503 |
| Westar Energy, 7.875%, 5/1/07 | 2,000 | 2,131 |
| XCEL Energy, 7.00%, 12/1/10 | 490 | 546 |
| | | 24,830 |
| Electronic Components 0.9% | | |
| Freescale Semiconductor, 6.875%, 7/15/11 | 500 | 525 |
| Motorola, 7.50%, 5/15/25 | 1,285 | 1,516 |
| | | 2,041 |
| Energy 1.2% | | |
| Chesapeake Energy, 7.00%, 8/15/14 | 500 | 520 |
| Newfield Exploration, 6.625%, 9/1/14 | 500 | 510 |
| XTO Energy, 5.30%, 6/30/15 | 1,000 | 1,011 |
| YPF Sociedad Anonima, 10.00%, 11/2/28 | 625 | 737 |
| | | 2,778 |
| Entertainment and Leisure 0.7% | | |
| Royal Caribbean Cruises | | |
| 7.25%, 8/15/06 | 310 | 319 |
| 8.00%, 5/15/10 | 800 | 878 |
| Speedway Motorsports, 6.75%, 6/1/13 | 500 | 512 |
| | | 1,709 |
| Exploration and Production 2.7% | | |
| Canadian Natural Resources, 6.45%, 6/30/33 | 1,200 | 1,326 |
| Diamond Offshore Drilling, 5.15%, 9/1/14 | 1,000 | 1,018 |
| Encana | | |
| 4.60%, 8/15/09 | 1,175 | 1,185 |
| 6.50%, 8/15/34 | 750 | 853 |
| Kaneb Pipe Line Operations | | |
| 5.875%, 6/1/13 | 1,700 | 1,766 |
| 7.75%, 2/15/12 | 250 | 284 |
| | | 6,432 |
| Finance and Credit 1.1% | | |
| Colonial Bank, 9.375%, 6/1/11 | 425 | 510 |
| FBOP Capital Trust II, 144A, 10.00%, 1/15/09 | 800 | 881 |
| SLM, 5.625%, 8/1/33 | 1,160 | 1,246 |
| | | 2,637 |
| Food Processing 0.9% | | |
| Bunge Limited Finance, 4.375%, 12/15/08 | 600 | 597 |
| Kraft Foods, 5.25%, 6/1/07 | 1,425 | 1,453 |
| | | 2,050 |
| Food/Tobacco 0.5% | | |
| Philip Morris, 7.20%, 2/1/07 | 1,010 | 1,055 |
| | | 1,055 |
| Gaming 1.7% | | |
| GTECH | | |
| 4.75%, 10/15/10 | 440 | 436 |
| 144A, 4.50%, 12/1/09 | 440 | 436 |
| Harrah's Operating | | |
| 5.50%, 7/1/10 | 745 | 761 |
| 144A, 5.625%, 6/1/15 | 1,000 | 1,010 |
| MGM Mirage | | |
| 6.00%, 10/1/09 | 500 | 500 |
| 6.75%, 9/1/12 | 250 | 256 |
| Station Casinos | | |
| 6.00%, 4/1/12 | 200 | 202 |
| 6.875%, 3/1/16 | 500 | 513 |
| | | 4,114 |
| Gas & Gas Transmission 3.2% | | |
| Atmos Energy, 5.95%, 10/15/34 | 640 | 682 |
| Duke Capital | | |
| 6.25%, 2/15/13 | 780 | 836 |
| 6.75%, 7/15/18 | 485 | 543 |
| Enterprise Products Operations | | |
| 4.00%, 10/15/07 | 555 | 549 |
| 5.60%, 10/15/14 | 2,000 | 2,046 |
| Panhandle Eastern Pipeline, 4.80%, 8/15/08 | 235 | 237 |
| Piedmont Natural Gas, 6.00%, 12/19/33 | 200 | 225 |
| TGT Pipeline, 144A, 5.50%, 2/1/17 | 645 | 651 |
| Valero Energy | | |
| 3.50%, 4/1/09 | 1,020 | 973 |
| 4.75%, 4/1/14 | 1,000 | 967 |
| | | 7,709 |
| Healthcare Services 1.5% | | |
| Highmark, 144A, 6.80%, 8/15/13 | 1,000 | 1,103 |
| Hospira, 4.95%, 6/15/09 | 1,330 | 1,351 |
| VWR International, 6.875%, 4/15/12 | 500 | 483 |
| Wellpoint, 4.25%, 12/15/09 | 625 | 620 |
| | | 3,557 |
| Insurance 3.6% | | |
| Allstate, 5.55%, 5/9/35 | 165 | 170 |
| Fund American Companies, 5.875%, 5/15/13 | 425 | 440 |
| Genworth Financial, 5.75%, 6/15/14 | 1,600 | 1,717 |
| Mangrove Bay Trust, 144A, 6.102%, 7/15/33 | 400 | 410 |
| MIC Financing Trust I, 144A, 8.375%, 2/1/27 | 830 | 865 |
| Nationwide Mutual Insurance, 144A, 6.60%, 4/15/34 | 375 | 396 |
| NLV Financial, 144A, 7.50%, 8/15/33 | 500 | 583 |
| Ohio National Financial Services, 144A, 6.35%, 4/1/13 | 225 | 238 |
| Principal Mutual Life Insurance, 144A, 8.00%, 3/1/44 | 405 | 496 |
| RLI Corporation, 5.95%, 1/15/14 | 535 | 548 |
| Security Benefit Life Insurance, 144A, 7.45%, 10/1/33 | 200 | 231 |
| Sun Life of Canada (U.S.) Capital Trust, 144A, 8.526%, 5/29/49 | 1,750 | 1,911 |
| Transamerica Capital, 144A, 7.65%, 12/1/26 | 500 | 592 |
| | | 8,597 |
| Investment Dealers 0.9% | | |
| Goldman Sachs Capital I, 6.345%, 2/15/34 | 2,000 | 2,167 |
| | | 2,167 |
| Lodging 0.1% | | |
| La Quinta Properties, 8.875%, 3/15/11 | 200 | 218 |
| | | 218 |
| Long Distance 3.1% | | |
| AT&T Broadband, 8.375%, 3/15/13 | 2,125 | 2,598 |
| Sprint Capital | | |
| 6.875%, 11/15/28 | 2,255 | 2,561 |
| 7.625%, 1/30/11 | 1,930 | 2,197 |
| | | 7,356 |
| Media and Communications 2.1% | | |
| Belo | | |
| 7.125%, 6/1/07 | 110 | 114 |
| 8.00%, 11/1/08 | 1,250 | 1,356 |
| Liberty Media, VR, 4.51%, 9/17/06 | 510 | 513 |
| News America | | |
| 6.20%, 12/15/34 | 2,000 | 2,070 |
| 6.75%, 1/9/38 (Tender 1/9/10) | 600 | 683 |
| 7.625%, 11/30/28 | 225 | 267 |
| | | 5,003 |
| Metals and Mining 1.3% | | |
| Barrick Gold Finance, 4.875%, 11/15/14 | 480 | 477 |
| Massey Energy, 6.625%, 11/15/10 | 800 | 812 |
| Newmont Mining, 5.875%, 4/1/35 | 1,000 | 1,011 |
| Placer Dome | | |
| 6.375%, 3/1/33 | 225 | 246 |
| 6.45%, 10/15/35 | 400 | 437 |
| | | 2,983 |
| Oil Field Services 0.4% | | |
| Halliburton, 5.50%, 10/15/10 | 1,000 | 1,045 |
| | | 1,045 |
| Paper and Paper Products 2.5% | | |
| Abitibi Consolidated Company of Canada, 6.95%, 12/15/06 | 100 | 101 |
| Boise Cascade, 144A, 7.125%, 10/15/14 | 500 | 474 |
| Celulosa Arauco y Constitucion, 5.125%, 7/9/13 | 2,600 | 2,565 |
| Georgia-Pacific, 9.375%, 2/1/13 | 500 | 569 |
| Weyerhaeuser, 7.375%, 3/15/32 | 1,900 | 2,196 |
| | | 5,905 |
| Petroleum 5.3% | | |
| Amerada Hess | | |
| 6.65%, 8/15/11 | 850 | 924 |
| 7.875%, 10/1/29 | 2,855 | 3,502 |
| Devon Financing | | |
| 6.875%, 9/30/11 | 500 | 555 |
| 7.875%, 9/30/31 | 2,135 | 2,723 |
| Kern River Funding, 144A, 4.893%, 4/30/18 | 343 | 346 |
| Pemex Finance, 8.02%, 5/15/07 | 267 | 278 |
| Pemex Project Funding Master Trust | | |
| 7.75%, 9/28/49 | 1,000 | 1,015 |
| 144A, VR, 4.31%, 6/15/10 | 1,000 | 1,025 |
| Petro Canada, 5.95%, 5/15/35 | 1,405 | 1,466 |
| PF Export Receivables Master Trust, 144A, 6.436%, 6/1/15 | 174 | 176 |
| Sunoco, 4.875%, 10/15/14 | 445 | 443 |
| | | 12,453 |
| Railroads 1.1% | | |
| Canadian National Railway, 6.25%, 8/1/34 | 1,355 | 1,563 |
| Norfolk Southern | | |
| 5.59%, 5/17/25 | 478 | 488 |
| 7.25%, 2/15/31 | 522 | 652 |
| | | 2,703 |
| Real Estate Investment Trust Securities 2.8% | | |
| Archstone Smith Operating Trust, 5.625%, 8/15/14 | 245 | 255 |
| Arden Realty | | |
| 5.20%, 9/1/11 | 1,000 | 1,005 |
| 5.25%, 3/1/15 | 380 | 383 |
| Avalonbay Communities, 4.95%, 3/15/13 | 1,000 | 1,008 |
| Camden Property Trust, 4.375%, 1/15/10 | 1,500 | 1,474 |
| Developers Diversified Realty, 3.875%, 1/30/09 | 480 | 466 |
| iStar Financial, 6.05%, 4/15/15 | 745 | 765 |
| Kimco Realty, 4.904%, 2/18/15 | 1,000 | 997 |
| Reckson Operating Partnership, 5.15%, 1/15/11 | 300 | 302 |
| | | 6,655 |
| Satellites 0.1% | | |
| EchoStar Communications, 5.75%, 10/1/08 | 250 | 247 |
| | | 247 |
| Savings and Loan 0.6% | | |
| Downey Financial, 6.50%, 7/1/14 | 345 | 361 |
| Greenpoint Capital Trust I, 9.10%, 6/1/27 | 375 | 419 |
| Webster Capital Trust II, Series B, 10.00%, 4/1/27 | 550 | 638 |
| | | 1,418 |
| Services 0.3% | | |
| Allied Waste, 7.875%, 4/15/13 | 175 | 176 |
| Oakmont Asset Trust, 144A, 4.514%, 12/22/08 | 335 | 335 |
| Waste Management, 7.375%, 5/15/29 | 250 | 300 |
| | | 811 |
| Specialty Chemicals 0.4% | | |
| Lubrizol, 4.625%, 10/1/09 | 1,000 | 997 |
| | | 997 |
| Supermarkets 0.7% | | |
| Delhaize America, 8.125%, 4/15/11 | 750 | 840 |
| Kroger, 8.05%, 2/1/10 | 800 | 901 |
| | | 1,741 |
| Telecommunications 1.1% | | |
| AT&T, STEP, 9.05%, 11/15/11 | 780 | 898 |
| Leucadia National, 7.00%, 8/15/13 | 200 | 197 |
| Telus, 7.50%, 6/1/07 | 1,500 | 1,589 |
| | | 2,684 |
| Telephones 4.5% | | |
| Deutsche Telekom International Finance | | |
| STEP, 8.25%, 6/15/05 | 325 | 325 |
| STEP, 8.50%, 6/15/10 | 2,350 | 2,717 |
| France Telecom, STEP, 8.00%, 3/1/11 | 1,960 | 2,304 |
| Telecom Italia Capital | | |
| 5.25%, 11/15/13 | 1,000 | 1,009 |
| 144A, 6.00%, 9/30/34 | 1,000 | 1,017 |
| Telefonos de Mexico, 144A, 4.75%, 1/27/10 | 2,560 | 2,532 |
| Verizon Global Funding, 6.875%, 6/15/12 | 710 | 804 |
| | | 10,708 |
| Transportation Services 0.4% | | |
| ERAC USA Finance Company, 144A, 5.60%, 5/1/15 | 990 | 1,012 |
| | | 1,012 |
| Wireless Communications 2.8% | | |
| America Movil, 6.375%, 3/1/35 | 1,610 | 1,558 |
| AT&T Wireless, 7.875%, 3/1/11 | 930 | 1,076 |
| Nextel Communications | | |
| 6.875%, 10/31/13 | 500 | 534 |
| 7.375%, 8/1/15 | 1,000 | 1,082 |
| Rogers Cantel, 9.75%, 6/1/16 | 1,000 | 1,200 |
| Rogers Wireless, 7.50%, 3/15/15 | 325 | 348 |
| U.S. Cellular, 6.70%, 12/15/33 | 795 | 834 |
| | | 6,632 |
| Total Corporate Bonds and Notes (Cost $199,981) | | 202,979 |
| | | |
| CONVERTIBLE BONDS 0.2% | | |
| |
| Insurance 0.2% | | |
| Fortis Insurance, 144A, 7.75%, 1/26/08 | 400 | 427 |
| Total Convertible Bonds (Cost $400) | | 427 |
| | | |
| FOREIGN GOVERNMENT AND MUNICIPALITIES | | |
| (EXCLUDING CANADIAN) 4.9% | | |
| | | |
| Aries Vermogensverwaltung, 9.60%, 10/25/14 | 1,000 | 1,285 |
| Republic of Brazil, Class C, VR, 8.00%, 4/15/14 | 633 | 647 |
| Republic of Philippines, 9.50%, 2/2/30 | 325 | 332 |
| Republic of South Africa, 6.50%, 6/2/14 | 1,250 | 1,383 |
| Republic of Turkey, 7.375%, 2/5/25 | 650 | 634 |
| United Mexican States | | |
| 4.625%, 10/8/08 | 5,000 | 5,025 |
| 7.50%, 4/8/33 | 1,000 | 1,144 |
| 8.125%, 12/30/19 | 1,000 | 1,225 |
| Total Foreign Government and Municipalities | | |
| (Excluding Canadian) (Cost $11,345) | | 11,675 |
| | | |
| COMMON STOCKS 2.7% | | |
| |
| Bank and Trust 1.0% | | |
| AmSouth | 7 | 173 |
| Bank of America | 6 | 280 |
| BB&T | 5 | 200 |
| Citizens Banking | 5 | 145 |
| Comerica | 3 | 168 |
| J.P. Morgan Chase | 6 | 197 |
| KeyCorp | 6 | 180 |
| National City | 5 | 156 |
| PNC Financial Services Group | 3 | 164 |
| Regions Financial | 11 | 368 |
| U.S. Bancorp | 7 | 198 |
| Washington Mutual | 4 | 165 |
| | | 2,394 |
| Building and Real Estate 0.2% | | |
| CarrAmerica Realty, REIT | 5 | 173 |
| Equity Residential, REIT | 5 | 179 |
| Weingarten Realty, REIT | 5 | 200 |
| | | 552 |
| Electric Utilities 0.8% | | |
| Duke Energy | 16 | 440 |
| FirstEnergy | 11 | 465 |
| NiSource | 19 | 458 |
| Teco Energy | 27 | 477 |
| | | 1,840 |
| Energy Services 0.0% | | |
| Williams Companies | 5 | 83 |
| | | 83 |
| Financial Services 0.1% | | |
| Citigroup | 4 | 188 |
| | | 188 |
| Integrated Petroleum - International 0.2% | | |
| Chevron | 6 | 323 |
| Royal Dutch Petroleum ADS | 4 | 234 |
| | | 557 |
| Miscellaneous Consumer Products 0.1% | | |
| UST | 2 | 89 |
| | | 89 |
| Telecommunications 0.3% | | |
| Telus (Non-voting shares) | 20 | 654 |
| | | 654 |
| Total Common Stocks (Cost $5,505) | | 6,357 |
| | | |
| PREFERRED STOCKS 0.1% | | |
| |
| Real Estate Investment Trust Securities 0.1% | | |
| Roslyn Real Estate Asset, VR, 4.81% | 0 | 305 |
| Total Preferred Stocks (Cost $307) | | 305 |
| DOMESTIC BOND MUTUAL FUNDS 3.0% | | | |
| |
| T. Rowe Price Institutional High Yield Fund, 7.63% p† | 681 | | 7,125 |
| Total Domestic Bond Mutual Funds (Cost $7,140) | | | 7,125 |
| | | | |
| SHORT-TERM INVESTMENTS 1.2% | | | |
| | | | |
| Money Market Funds 1.2% | | | |
| T. Rowe Price Reserve Investment Fund, 3.07% #† | 2,803 | | 2,803 |
| Total Short-Term Investments (Cost $2,803) | | | 2,803 |
| |
| Total Investments in Securities | | | |
| 97.6% of Net Assets (Cost $227,481) | | $ | 231,671 |
| (1) | Denominated in U.S. dollars unless other- |
| | wise noted |
| + | At May 31, 2005, some of the fund’s |
| | securities were valued by the T. Rowe Price |
| | Valuation Committee, established by the |
| | fund's Board of Directors – See Note 1 |
| # | Seven-day yield |
| * | Non-income producing |
| † | Affiliated company – See Note 4 |
| p | SEC yield |
| 144A | Security was purchased pursuant to Rule |
| | 144A under the Securities Act of 1933 and |
| | may be resold in transactions exempt from |
| | registration only to qualified institutional |
| | buyers—total value of such securities at |
| | period-end amounts to $23,795 and repre- |
| | sents 10.0% of net assets |
| ADS | American Depository Shares |
| CAD | Canadian dollar |
| REIT | Real Estate Investment Trust |
| STEP | Stepped coupon bond for which the coupon |
| | rate of interest will adjust on specified future |
| | date(s) |
| VR | Variable Rate; rate shown is effective rate at |
| | period-end |
The accompanying notes are an integral part of these financial statements.
| STATEMENT OF ASSETS AND LIABILITIES |
| (In thousands except shares and per share amounts) | | |
| Assets | | |
| Investments in securities, at value | | |
| Affiliated companies (cost $9,943) | $ | 9,928 |
| Non-affiliated companies (cost $217,538) | | 221,743 |
|
|
| Total investments in securities | | 231,671 |
| Cash | | 10 |
| Dividends and interest receivable | | 3,240 |
| Receivable for investment securities sold | | 3,505 |
| Receivable for shares sold | | 102 |
| Other assets | | 23 |
|
|
| Total assets | | 238,551 |
|
|
| |
| Liabilities | | |
| Investment management fees payable | | 99 |
| Payable for investment securities purchased | | 793 |
| Payable for shares redeemed | | 62 |
| Due to affiliates | | 34 |
| Other liabilities | | 175 |
|
|
| Total liabilities | | 1,163 |
|
|
| |
| NET ASSETS | $ | 237,388 |
|
|
| Net Assets Consist of: | | |
| Undistributed net investment income (loss) | $ | 45 |
| Undistributed net realized gain (loss) | | (4,154) |
| Net unrealized gain (loss) | | 4,190 |
| Paid-in-capital applicable to 24,220,300 shares of | | |
| $0.0001 par value capital stock outstanding; | | |
| 1,000,000,000 shares authorized | | 237,307 |
|
|
| |
| NET ASSETS | $ | 237,388 |
|
|
| |
| NET ASSET VALUE PER SHARE | $ | 9.80 |
|
|
The accompanying notes are an integral part of these financial statements.
| STATEMENT OF OPERATIONS |
| ($ 000s) | | |
| | | Year |
| | | Ended |
| | | 5/31/05 |
| Investment Income (Loss) | | |
| Income | | |
| Interest | $ | 9,263 |
| Dividend | | 1,087 |
| Other | | 9 |
|
|
| Total income | | 10,359 |
|
|
| Expenses | | |
| Investment management | | 872 |
| Shareholder servicing | | 319 |
| Custody and accounting | | 155 |
| Registration | | 54 |
| Prospectus and shareholder reports | | 33 |
| Legal and audit | | 13 |
| Directors | | 5 |
| Proxy and annual meeting | | 1 |
| Miscellaneous | | 7 |
| Reductions/repayments of fees and expenses | | |
| Investment management fees (waived) repaid | | 6 |
|
|
| Total expenses | | 1,465 |
| Expenses paid indirectly | | (4) |
|
|
| Net expenses | | 1,461 |
|
|
| Net investment income (loss) | | 8,898 |
|
|
| |
| Realized and Unrealized Gain (Loss) | | |
| Net realized gain (loss) | | |
| Affiliated securities | | 97 |
| Capital gain distributions from affiliated mutual funds | | 177 |
| Non-affiliated securities | | 1,203 |
| Futures | | (160) |
| Foreign currency transactions | | (66) |
|
|
| Net realized gain (loss) | | 1,251 |
|
|
| Change in net unrealized gain (loss) on securities | | 2,867 |
|
|
| Net realized and unrealized gain (loss) | | 4,118 |
|
|
| |
| INCREASE (DECREASE) IN NET | | |
| ASSETS FROM OPERATIONS | $ | 13,016 |
|
|
The accompanying notes are an integral part of these financial statements.
| STATEMENT OF CHANGES IN NET ASSETS |
| ($ 000s) | | | | |
| | | Year | | |
| | | Ended | | |
| | | 5/31/05 | | 5/31/04 |
| |
| Increase (Decrease) in Net Assets | | | | |
| Operations | | | | |
| Net investment income (loss) | $ | 8,898 | $ | 5,547 |
| Net realized gain (loss) | | 1,251 | | 3,485 |
| Change in net unrealized gain (loss) | | 2,867 | | (7,477) |
|
|
| Increase (decrease) in net assets from operations | | 13,016 | | 1,555 |
|
|
| |
| Distributions to shareholders | | | | |
| Net investment income | | (8,898) | | (5,545) |
|
|
| |
| Capital share transactions * | | | | |
| Shares sold | | 159,013 | | 51,827 |
| Distributions reinvested | | 7,483 | | 4,250 |
| Shares redeemed | | (35,249) | | (61,544) |
|
|
| Increase (decrease) in net assets from capital | | | | |
| share transactions | | 131,247 | | (5,467) |
|
|
| |
| Net Assets | | | | |
| Increase (decrease) during period | | 135,365 | | (9,457) |
| Beginning of period | | 102,023 | | 111,480 |
|
|
| |
| End of period | $ | 237,388 | $ | 102,023 |
|
|
| (Including undistributed net investment income | | | | |
| of $45 at 5/31/05 and $45 at 5/31/04) | | | | |
| | | | | |
| *Share information | | | | |
| Shares sold | | 16,331 | | 5,345 |
| Distributions reinvested | | 765 | | 441 |
| Shares redeemed | | (3,632) | | (6,401) |
|
|
| Increase (decrease) in shares outstanding | | 13,464 | | (615) |
The accompanying notes are an integral part of these financial statements.
| NOTES TO FINANCIAL STATEMENTS |
NOTE 1 - SIGNIFICANT ACCOUNTING POLICIES
T. Rowe Price Corporate Income Fund, Inc. (the fund) is registered under the Investment Company Act of 1940 (the 1940 Act) as a diversified, open-end management investment company. The fund commenced operations on October 31, 1995. The fund seeks to provide high income and some capital growth.
The accompanying financial statements were prepared in accordance with accounting principles generally accepted in the United States of America, which require the use of estimates made by fund management.
Valuation The fund values its investments and computes its net asset value per share at the close of the New York Stock Exchange (NYSE), normally 4 p.m. ET, each day that the NYSE is open for business. Debt securities are generally traded in the over-the-counter market. Securities with original maturities of one year or more are valued at prices furnished by dealers who make markets in such securities or by an independent pricing service, which considers yield or price of bonds of comparable quality, coupon, maturity, and type, as well as prices quoted by dealers who make markets in such securities. Securities with original maturities of less than one year are stated at fair value, which is determined by using a matrix system that establishes a value for each security based on bid-side money market yields.
Equity securities listed or regularly traded on a securities exchange or in the over-the-counter market are valued at the last quoted sale price or, for certain markets, the official closing price at the time the valuations are made, except for OTC Bulletin Board securities, which are valued at the mean of the latest bid and asked prices. A security that is listed or traded on more than one exchange is valued at the quotation on the exchange determined to be the primary market for such security. Listed securities not traded on a particular day are valued at the mean of the latest bid and asked prices for domestic securities and the last quoted sale price for international securities.
Investments in mutual funds are valued at the mutual fund’s closing net asset value per share on the day of valuation. Financial futures contracts are valued at closing settlement prices. Forward currency exchange contracts are valued using the prevailing forward exchange rate.
Other investments, including restricted securities, and those for which the above valuation procedures are inappropriate or are deemed not to reflect fair value are stated at fair value as determined in good faith by the T. Rowe Price Valuation Committee, established by the fund’s Board of Directors.
Most foreign markets close before the close of trading on the NYSE. If the fund determines that developments between the close of a foreign market and the close of the NYSE will, in its judgment, materially affect the value of some or all of its portfolio securities, which in turn will affect the fund’s share price, the fund will adjust the previous closing prices to reflect the fair value of the securities as of the close of the NYSE, as determined in good faith by the T. Rowe Price Valuation Committee, established by the fund’s Board of Directors. A fund may also fair value securities in other situations, such as when a particular foreign market is closed but the fund is open. In deciding whether to make fair value adjustments, the fund reviews a variety of factors, including developments in foreign markets, the performance of U.S. securities markets, and the performance of instruments trading in U. S. markets that represent foreign securities and baskets of foreign securities. The fund uses outside pricing services to provide it with closing market prices and information used for adjusting those prices. The fund cannot predict how often it will use closing prices and how often it will adjust those prices. As a means of evaluating its fair value process, the fund routinely compares closing market prices, the next day’s opening prices in the same markets, and adjusted prices.
Currency Translation Assets, including investments, and liabilities denominated in foreign currencies are translated into U.S. dollar values each day at the prevailing exchange rate, using the mean of the bid and asked prices of such currencies against U.S. dollars as quoted by a major bank. Purchases and sales of securities, income, and expenses are translated into U.S. dollars at the prevailing exchange rate on the date of the transaction. The effect of changes in foreign currency exchange rates on realized and unrealized security gains and losses is reflected as a component of security gains and losses.
Credits The fund earns credits on temporarily uninvested cash balances at the custodian that reduce the fund’s custody charges. Custody expense in the accompanying financial statements is presented before reduction for credits, which are reflected as expenses paid indirectly.
Investment Transactions, Investment Income, and Distributions Income and expenses are recorded on the accrual basis. Premiums and discounts on debt securities are amortized for financial reporting purposes. Dividends received from mutual fund investments are reflected as dividend income; capital gain distributions are reflected as realized gain/loss. Dividend income and capital gain distributions are recorded on the ex-dividend date. Investment transactions are accounted for on the trade date. Realized gains and losses are reported on the identified cost basis. Payments (“variation margin”) made or received to settle the daily fluctuations in the value of futures contracts are recorded as unrealized gains or losses until the contracts are closed. Distributions to shareholders are recorded on the ex-dividend date. Income distributions are declared on a daily basis and paid monthly. Capital gain distributions, if any, are declared and paid by the fund, typically on an annual basis.
NOTE 2 - INVESTMENT TRANSACTIONS
Consistent with its investment objective, the fund engages in the following practices to manage exposure to certain risks or enhance performance. The investment objective, policies, program, and risk factors of the fund are described more fully in the fund’s prospectus and Statement of Additional Information.
Noninvestment-Grade Debt Securities At May 31, 2005, approximately 15% of the fund’s net assets were invested, directly or through its investment in the T. Rowe Price Institutional High Yield Fund, in noninvestment-grade debt securities, commonly referred to as “high-yield” or “junk” bonds. A real or perceived economic downturn or higher interest rates could adversely affect the liquidity or value, or both, of such securities because such events could lessen the ability of issuers to make principal and interest payments.
Restricted Securities The fund may invest in securities that are subject to legal or contractual restrictions on resale. Although certain of these securities may be readily sold, for example, under Rule 144A, others may be illiquid, their sale may involve substantial delays and additional costs, and prompt sale at an acceptable price may be difficult.
Forward Currency Exchange Contracts During the year ended May 31, 2005, the fund was a party to forward currency exchange contracts under which it is obligated to exchange currencies at specified future dates and exchange rates. Risks arise from the possible inability of counterparties to meet the terms of their agreements and from movements in currency values.
Futures Contracts During the year ended May 31, 2005, the fund was a party to futures contracts, which provide for the future sale by one party and purchase by another of a specified amount of a specific financial instrument at an agreed upon price, date, time, and place. Risks arise from possible illiquidity of the futures market and from movements in security values and/or interest rates.
Other Purchases and sales of portfolio securities, other than short-term securities, aggregated $235,963,000 and $110,355,000, respectively, for the year ended May 31, 2005.
NOTE 3 - FEDERAL INCOME TAXES
No provision for federal income taxes is required since the fund intends to continue to qualify as a regulated investment company under Subchapter M of the Internal Revenue Code and distribute to shareholders all of its taxable income and gains. Federal income tax regulations differ from generally accepted accounting principles; therefore, distributions determined in accordance with tax regulations may differ significantly in amount or character from net investment income and realized gains for financial reporting purposes. Financial reporting records are adjusted for permanent book/tax differences to reflect tax character. Financial records are not adjusted for temporary differences.
Distributions during the year ended May 31, 2005 totaled $8,898,000 and were characterized as ordinary income for tax purposes. At May 31, 2005, the tax-basis components of net assets were as follows:
| Unrealized appreciation | $ | 6,296,000 |
| Unrealized depreciation | | (2,174,000) |
|
|
| Net unrealized appreciation (depreciation) | | 4,122,000 |
| Undistributed ordinary income | | 369,000 |
| Capital loss carryforwards | | (4,410,000) |
| Paid-in capital | | 237,307,000 |
|
|
| |
| Net assets | $ | 237,388,000 |
|
|
The fund intends to retain realized gains to the extent of available capital loss carryforwards for federal income tax purposes. During the fiscal year ended May 31, 2005, the fund utilized $1,122,000 of capital loss carryforwards. As of May 31, 2005, the fund had $1,744,000 of capital loss carryforwards that expire in fiscal 2009, and $2,666,000 that expire in fiscal 2011.
For the year ended May 31, 2005, the fund recorded the following permanent reclassifications to reflect tax character. Reclassifications to paid-in capital relate primarily to a tax practice that treats a portion of the proceeds from each redemption of capital shares as a distribution of taxable net investment income and/or realized capital gain. Results of operations and net assets were not affected by these reclassifications.
| Undistributed net realized gain | $ | (418,000) |
| Paid-in capital | | 418,000 |
At May 31, 2005, the cost of investments for federal income tax purposes was $227,549,000.
NOTE 4 - RELATED PARTY TRANSACTIONS
The fund is managed by T. Rowe Price Associates, Inc. (the manager or Price Associates), a wholly owned subsidiary of T. Rowe Price Group, Inc. The investment management agreement between the fund and the manager provides for an annual investment management fee, which is computed daily and paid monthly. The fee consists of an individual fund fee, equal to 0.15% of the fund’s average daily net assets, and a group fee. The group fee rate is calculated based on the combined net assets of certain mutual funds sponsored by Price Associates (the group) applied to a graduated fee schedule, with rates ranging from 0.48% for the first $1 billion of assets to 0.29% for assets in excess of $160 billion. Prior to May 1, 2005, the maximum group fee rate in the graduated fee schedule had been 0.295% for assets in excess of $120 billion. The fund’s group fee is determined by applying the group fee rate to the fund’s average daily net assets. At May 31, 2005, the effective annual group fee rat e was 0.31%.
The fund is also subject to a contractual expense limitation through September 30, 2005. During the limitation period, the manager is required to waive its management fee and reimburse the fund for any expenses, excluding interest, taxes, brokerage commissions, and extraordinary expenses, that would otherwise cause the fund’s ratio of total expenses to average net assets (expense ratio) to exceed its expense limitation of 0.80%. The fund is required to repay the manager for expenses previously reimbursed and management fees waived to the extent the fund’s net assets have grown or expenses have declined sufficiently to allow repayment without causing the fund’s expense ratio to exceed its expense limitation. However, no repayment will be made more than three years after the date of any reimbursement or waiver or later than September 30, 2007. Pursuant to this agreement, at May 31, 2005, management fees waived in the amount of $97,00 0 remain subject to repayment by the fund.
In addition, the fund has entered into service agreements with Price Associates and two wholly owned subsidiaries of Price Associates (collectively, Price). Price Associates computes the daily share price and maintains the financial records of the fund. T. Rowe Price Services, Inc., provides shareholder and administrative services in its capacity as the fund’s transfer and dividend disbursing agent.
T. Rowe Price Retirement Plan Services, Inc., provides subaccounting and recordkeeping services for certain retirement accounts invested in the fund. For the year ended May 31, 2005, expenses incurred pursuant to these service agreements were $104,000 for Price Associates, $118,000 for T. Rowe Price Services, Inc., and $5,000 for T. Rowe Price Retirement Plan Services, Inc. The total amount payable at period end pursuant to these service agreements is reflected as due to affiliates in the accompanying financial statements.
The fund is also one of several mutual funds sponsored by Price Associates (underlying Price funds) in which the T. Rowe Price Spectrum Funds (Spectrum Funds) may invest. The Spectrum Funds do not invest in the underlying Price funds for the purpose of exercising management or control. Pursuant to a special servicing agreement, expenses associated with the operation of the Spectrum Funds are borne by each underlying Price fund to the extent of estimated savings to it and in proportion to the average daily value of its shares owned by the Spectrum Funds. Expenses allocated under this agreement are reflected as shareholder servicing expense in the accompanying financial statements. For the year ended May 31, 2005, the fund was allocated $139,000 of Spectrum Funds’ expenses, of which $91,000 related to services provided by Price. The amount payable at period end pursuant to this agreement is reflected as a component of due to affiliates in the accompanying financial statements. At May 31, 2005, approximately 50.3% of the outstanding shares of the fund were held by the Spectrum Funds.
The fund may invest in the T. Rowe Price Reserve Investment Fund and the T. Rowe Price Government Reserve Investment Fund (collectively, the Reserve Funds), open-end management investment companies managed by Price Associates and affiliates of the fund. The Reserve Funds are offered as cash management options to mutual funds, trusts, and other accounts managed by Price Associates and/or its affiliates, and are not available for direct purchase by members of the public. The Reserve Funds pay no investment management fees. During the year ended May 31, 2005, dividend income from the Reserve Funds totaled $159,000, and the value of shares of the Reserve Funds held at May 31, 2005 and May 31, 2004 was $2,803,000 and $470,000, respectively.
The fund may invest in the T. Rowe Price Institutional High Yield Fund, Inc. (High Yield Fund) as a means of gaining efficient and cost-effective exposure to the high-yield bond markets. The High Yield Fund is an open-end management investment company managed by Price Associates, and an affiliate of the fund. The High Yield Fund pays an annual all-inclusive management and administrative fee to Price Associates equal to 0.50% of average daily net assets. To ensure that Corporate Income does not incur duplicate fees for its assets invested in High Yield Fund, Price Associates has agreed to reduce its management fee to the fund. Accordingly, the management fee waiver reflected on the accompanying Statement of Operations includes $45,000 of management fees permanently waived pursuant to this agreement. During the year ended May 31, 2005, purchases and sales of High Yield Fund were $5,490,000 and $6,402,000, respectively. Realized gains during the period were $274,000, and investment income during the period was $698,000. At May 31, 2005 and May 31, 2004, the value of shares of High Yield Fund held were $7,125,000 and $9,201,000, respectively.
| REPORT OF INDEPENDENT REGISTERED PUBLIC ACCOUNTING FIRM |
To the Board of Directors and Shareholders of T. Rowe Price Corporate Income Fund, Inc.
In our opinion, the accompanying statement of assets and liabilities, including the portfolio of investments, and the related statements of operations and of changes in net assets and the financial highlights present fairly, in all material respects, the financial position of T. Rowe Price Corporate Income Fund, Inc. at May 31, 2005, the results of its operations for the year then ended, the changes in its net assets for each of the two years in the period then ended and the financial highlights for each of the five years in the period then ended, in conformity with accounting principles generally accepted in the United States of America. These financial statements and financial highlights (hereafter referred to as “financial statements”) are the responsibility of the Fund’s management; our responsibility is to express an opinion on these financial statements based on our audits. We conducted our audits of these financial statements in accordance with the auditing standards of the Public Company Accounting Oversight Board (United States). Those standards require that we plan and perform the audit to obtain reasonable assurance about whether the financial statements are free of material misstatement. An audit includes examining, on a test basis, evidence supporting the amounts and disclosures in the financial statements, assessing the accounting principles used and significant estimates made by management, and evaluating the overall financial statement presentation. We believe that our audits, which included confirmation of securities at May 31, 2005 by correspondence with the custodian and brokers, provide a reasonable basis for our opinion.
PricewaterhouseCoopers LLP
Baltimore, Maryland
July 12, 2005
| TAX INFORMATION (UNAUDITED) FOR THE TAX YEAR ENDED 5/31/05 |
We are providing this information as required by the Internal Revenue Code. The amounts shown may differ from those elsewhere in this report because of differences between tax and financial reporting requirements.
The fund’s distributions to shareholders included $418,000 from short-term capital gains.
For taxable non-corporate shareholders, $187,000 of the fund’s income represents qualified dividend income subject to the 15% rate category.
For corporate shareholders, $169,000 of the fund’s income qualifies for the dividends-received deduction.
| INFORMATION ON PROXY VOTING POLICIES, PROCEDURES, AND RECORDS |
A description of the policies and procedures used by T. Rowe Price funds and portfolios to determine how to vote proxies relating to portfolio securities is available in each fund’s Statement of Additional Information, which you may request by calling 1-800-225-5132 or by accessing the SEC’s Web site, www.sec.gov. The description of our proxy voting policies and procedures is also available on our Web site, www.troweprice.com. To access it, click on the words “Company Info” at the top of our homepage for individual investors. Then, in the window that appears, click on the “Proxy Voting Policy” navigation button in the top left corner.
Each fund’s most recent annual proxy voting record is available on our Web site and through the SEC’s Web site. To access it through our Web site, follow the directions above, then click on the words “Proxy Voting Record” at the bottom of the Proxy Voting Policy page.
| HOW TO OBTAIN QUARTERLY PORTFOLIO HOLDINGS |
The fund files a complete schedule of portfolio holdings with the Securities and Exchange Commission for the first and third quarters of each fiscal year on Form N-Q. The fund’s Form N-Q is available electronically on the SEC’s Web site (www.sec.gov); hard copies may be reviewed and copied at the SEC’s Public Reference Room, 450 Fifth St. N.W., Washington, DC 20549. For more information on the Public Reference Room, call 1-800-SEC-0330.
| APPROVAL OF INVESTMENT MANAGEMENT AGREEMENT |
On March 2, 2005, the fund’s Board of Directors unanimously approved the investment advisory contract (“Contract”) between the fund and its investment manager, T. Rowe Price Associates, Inc. (“Manager”). The Board considered a variety of factors in connection with its review of the Contract, also taking into account information provided by the Manager during the course of the year, as discussed below:
Services Provided by the Manager
The Board considered the nature, quality, and extent of the services provided to the fund by the Manager. These services included, but were not limited to, management of the fund’s portfolio and a variety of activities related to portfolio management. The Board also reviewed the background and experience of the Manager’s senior management team and investment personnel involved in the management of the fund. The Board concluded that it was satisfied with the nature, quality, and extent of the services provided by the Manager.
Investment Performance of the Fund
The Board reviewed the fund’s average annual total return over the one-, three-, and five-year periods as well as the fund’s year-by-year returns and compared these returns to a wide variety of previously agreed upon comparable performance measures and market data, including those supplied by Lipper and Morningstar, which are independent providers of mutual fund data. On the basis of this evaluation and the Board’s ongoing review of investment results, the Board concluded that the fund’s performance was satisfactory.
Costs, Benefits, Profits, and Economies of Scale
The Board reviewed detailed information regarding the revenues received by the Manager under the Contract and other benefits that the Manager (and its affiliates) may have realized from its relationship with the fund, including research received under “soft dollar” agreements. The Board also received information on the estimated costs incurred and profits realized by the Manager and its affiliates from advising T. Rowe Price mutual funds, as well as estimates of the gross profits realized from managing the fund in particular. The Board concluded that the Manager’s profits were reasonable in light of the services provided to the fund. The Board also considered whether the fund or other funds benefit under the fee levels set forth in the Contract from any economies of scale realized by the Manager. Under the Contract, the fund pays a fee to the Manager composed of two components—a group fee rate based on the aggregate assets of certain T. Rowe Price mutual funds (including the fund) that declines at certain asset levels, and an individual fund fee rate that is assessed on the assets of the fund. The Board concluded that an additional breakpoint should be added to the group fee component of the fees paid by the fund under the Contract at a level of $160 billion. The Board further concluded that, with this change, the advisory fee structure for the fund continued to provide for a reasonable sharing of benefits from economies of scale with the fund’s investors.
Fees
The Board reviewed the fund’s management fee rate, operating expenses, and total expense ratio and compared them to fees and expenses of other comparable funds based on information and data supplied by Lipper. The information provided to the Board showed that the fund’s management fee rate was above the median for certain groups of comparable funds but below the median of other groups of comparable funds. The information also indicated that the fund’s expense ratio was generally below the median of comparable funds. The Board also reviewed the fee schedules for comparable privately managed accounts of the Manager and its affiliates. Management informed the Board that the Manager’s responsibilities for privately managed accounts are more limited than its responsibilities for the fund and other T. Rowe Price mutual funds that it or its affiliates advise. On the basis of the information provided, the Board concluded that the fees paid by the fund under the Contract were reasonable.
Approval of the Contract
As noted, the Board approved the continuation of the Contract as amended to add an additional breakpoint to the group fee rate. No single factor was considered in isolation or to be determinative to the decision. Rather, the Board concluded, in light of a weighting and balancing of all factors considered, that it was in the best interests of the fund to approve the continuation of the Contract, including the fees to be charged for services thereunder.
| ABOUT THE FUND’S DIRECTORS AND OFFICERS |
Your fund is governed by a Board of Directors that meets regularly to review investments, performance, expenses, and other business matters, and is responsible for protecting the interests of shareholders. The majority of the fund’s directors are independent of T. Rowe Price Associates, Inc. (T. Rowe Price); “inside” directors are officers of T. Rowe Price. The Board of Directors elects the fund’s officers, who are listed in the final table. The business address of each director and officer is 100 East Pratt Street, Baltimore, MD 21202. The Statement of Additional Information includes additional information about the fund directors and is available without charge by calling a T. Rowe Price representative at 1-800-225-5132.
| Independent Directors | |
| |
| Name | |
| (Year of Birth) | Principal Occupation(s) During Past 5 Years and Directorships of |
| Year Elected* | Other Public Companies |
| |
| Anthony W. Deering | Chairman, Exeter Capital, LLC, a private investment firm (2004 to |
| (1945) | present); Director, Chairman of the Board, and Chief Executive Officer, |
| 1995 | The Rouse Company, real estate developers (1997 to 2004); Director, |
| | Mercantile Bank (4/03 to present) |
| |
| Donald W. Dick, Jr. | Principal, EuroCapital Advisors, LLC, an acquisition and management |
| (1943) | advisory firm; Chairman, President, and Chief Executive Officer, The |
| 2001 | Haven Group, a custom manufacturer of modular homes (1/04 to |
| | present) |
| |
| David K. Fagin | Chairman and President, Nye Corporation (6/88 to present); Director, |
| (1938) | Canyon Resources Corporation and Golden Star Resources Ltd. (5/00 |
| 2001 | to present), and Pacific Rim Mining Corp. (2/02 to present) |
| |
| Karen N. Horn | Managing Director and President, Global Private Client Services, |
| (1943) | Marsh Inc. (1999 to 2003); Managing Director and Head of |
| 2003 | International Private Banking, Bankers Trust (1996 to 1999); Director, |
| | Eli Lilly and Company and Georgia Pacific |
| |
| F. Pierce Linaweaver | President, F. Pierce Linaweaver & Associates, Inc., consulting environ- |
| (1934) | mental and civil engineers |
| 1995 | |
| |
| Theo C. Rodgers** | President, A&R Development Corporation |
| (1941) | |
| 2005 | |
| |
| John G. Schreiber | Owner/President, Centaur Capital Partners, Inc., a real estate invest- |
| (1946) | ment company; Partner, Blackstone Real Estate Advisors, L.P.; |
| 1995 | Director, AMLI Residential Properties Trust |
| * | Each independent director oversees 112 T. Rowe Price portfolios and serves until retirement, resignation, or |
| | election of a successor. |
| ** | Elected effective April 1, 2005. |
| Inside Directors | |
| |
| Name | |
| (Year of Birth) | |
| Year Elected* | |
| [Number of T. Rowe Price | Principal Occupation(s) During Past 5 Years and Directorships of |
| Portfolios Overseen] | Other Public Companies |
| |
| Mary J. Miller, CFA | Director and Vice President, T. Rowe Price; Vice President, T. Rowe |
| (1955) | Price Group, Inc. |
| 2004 | |
| [37] | |
| |
| James S. Riepe | Director and Vice President, T. Rowe Price; Vice Chairman of the |
| (1943) | Board, Director, and Vice President, T. Rowe Price Group, Inc.; |
| 1995 | Chairman of the Board and Director, T. Rowe Price Global Asset |
| [112] | Management Limited, T. Rowe Price Global Investment Services |
| | Limited, T. Rowe Price Investment Services, Inc., T. Rowe Price |
| | Retirement Plan Services, Inc., and T. Rowe Price Services, Inc.; |
| | Chairman of the Board, Director, President, and Trust Officer, T. Rowe |
| | Price Trust Company; Director, T. Rowe Price International, Inc.; |
| | Director, The Nasdaq Stock Market, Inc. |
| |
| * Each inside director serves until retirement, resignation, or election of a successor. |
| Officers | |
| |
| Name (Year of Birth) | |
| Title and Fund(s) Served | Principal Occupation(s) |
| |
| Steven G. Brooks, CFA (1954) | Vice President, T. Rowe Price and T. Rowe Price |
| Vice President, Corporate Income Fund | Group, Inc. |
| |
| Jennifer A. Callaghan (1969) | Assistant Vice President, T. Rowe Price |
| Vice President, Corporate Income Fund | |
| |
| Joseph A. Carrier, CPA (1960) | Vice President, T. Rowe Price, T. Rowe Price |
| Treasurer, Corporate Income Fund | Group, Inc., T. Rowe Price Investment Services, |
| | Inc., and T. Rowe Price Trust Company |
| |
| Patrick S. Cassidy, CFA (1964) | Vice President, T. Rowe Price and T. Rowe Price |
| Vice President, Corporate Income Fund | Group, Inc. |
| |
| Roger L. Fiery III, CPA (1959) | Vice President, T. Rowe Price, T. Rowe Price |
| Vice President, Corporate Income Fund | Group, Inc., T. Rowe Price International, Inc., |
| | and T. Rowe Price Trust Company |
| John R. Gilner (1961) | Chief Compliance Officer and Vice President, |
| Chief Compliance Officer, Corporate | T. Rowe Price; Vice President, T. Rowe Price |
| Income Fund | Group, Inc., and T. Rowe Price Investment |
| | Services, Inc. |
| |
| Gregory S. Golczewski (1966) | Vice President, T. Rowe Price and T. Rowe Price |
| Vice President, Corporate Income Fund | Trust Company |
| |
| Henry H. Hopkins (1942) | Director and Vice President, T. Rowe Price |
| Vice President, Corporate Income Fund | Investment Services, Inc., T. Rowe Price |
| | Services, Inc., and T. Rowe Price Trust |
| | Company; Vice President, T. Rowe Price, |
| | T. Rowe Price Group, Inc., T. Rowe Price |
| | International, Inc., and T. Rowe Price |
| | Retirement Plan Services, Inc. |
| |
| Patricia B. Lippert (1953) | Assistant Vice President, T. Rowe Price and |
| Secretary, Corporate Income Fund | T. Rowe Price Investment Services, Inc. |
| |
| Vernon A. Reid, Jr. (1954) | Vice President, T. Rowe Price and T. Rowe Price |
| Vice President, Corporate Income Fund | Group, Inc. |
| |
| David A. Tiberii, CFA (1965) | Vice President, T. Rowe Price and T. Rowe Price |
| President, Corporate Income Fund | Group, Inc. |
| |
| Mark J. Vaselkiv (1958) | Vice President, T. Rowe Price and T. Rowe Price |
| Executive Vice President, Corporate | Group, Inc. |
| Income Fund | |
| |
| Julie L. Waples (1970) | Vice President, T. Rowe Price |
| Vice President, Corporate Income Fund | |
| |
| Thea N. Williams (1961) | Vice President, T. Rowe Price and T. Rowe Price |
| Vice President, Corporate Income Fund | Group, Inc. |
| |
| Unless otherwise noted, officers have been employees of T. Rowe Price or T. Rowe Price International for at least |
| five years. | |
Item 2. Code of Ethics.The registrant has adopted a code of ethics, as defined in Item 2 of Form N-CSR, applicable to its principal executive officer, principal financial officer, principal accounting officer or controller, or persons performing similar functions. A copy of this code of ethics is filed as an exhibit to this Form N-CSR. No substantive amendments were approved or waivers were granted to this code of ethics during the period covered by this report.
Item 3. Audit Committee Financial Expert.
The registrant’s Board of Directors/Trustees has determined that Mr. David K. Fagin qualifies as an audit committee financial expert, as defined in Item 3 of Form N-CSR. Mr. Fagin is considered independent for purposes of Item 3 of Form N-CSR.
Item 4. Principal Accountant Fees and Services.
(a) – (d) Aggregate fees billed to the registrant for the last two fiscal years for professional services rendered by the registrant’s principal accountant were as follows:
| | 2005 | 2004 |
| Audit Fees | $6,403 | $7,523 |
| Audit-Related Fees | 797 | 685 |
| Tax Fees | 1,957 | 2,079 |
| All Other Fees | 306 | 124 |
Audit fees include amounts related to the audit of the registrant’s annual financial statements and services normally provided by the accountant in connection with statutory and regulatory filings. Audit-related fees include amounts reasonably related to the performance of the audit of the registrant’s financial statements, specifically the issuance of a report on internal controls. Tax fees include amounts related to tax compliance, tax planning, and tax advice. Other fees include the registrant’s pro-rata share of amounts for agreed-upon procedures in conjunction with service contract approvals by the registrant’s Board of Directors/Trustees.
(e)(1) The registrant’s audit committee has adopted a policy whereby audit and non-audit services performed by the registrant’s principal accountant for the registrant, its investment adviser, and any entity controlling, controlled by, or under common control with the investment adviser that provides ongoing services to the registrant require pre-approval in advance at regularly scheduled audit committee meetings. If such a service is required between regularly scheduled audit committee meetings, pre-approval may be authorized by one audit committee member with ratification at the next scheduled audit committee meeting. Waiver of pre-approval for audit or non-audit services requiring fees of a de minimis amount is not permitted.
(2) No services included in (b) – (d) above were approved pursuant to paragraph (c)(7)(i)(C) of Rule 2-01 of Regulation S-X.
(f) Less than 50 percent of the hours expended on the principal accountant’s engagement to audit the registrant’s financial statements for the most recent fiscal year were attributed to work performed by persons other than the principal accountant’s full-time, permanent employees.
(g) The aggregate fees billed for the most recent fiscal year and the preceding fiscal year by the registrant’s principal accountant for non-audit services rendered to the registrant, its investment adviser, and any entity controlling, controlled by, or under common control with the investment adviser that provides ongoing services to the registrant were $903,000 and $821,000, respectively, and were less than the aggregate fees billed for those same periods by the registrant’s principal accountant for audit services rendered to the T. Rowe Price Funds.
(h) All non-audit services rendered in (g) above were pre-approved by the registrant’s audit committee. Accordingly, these services were considered by the registrant’s audit committee in maintaining the principal accountant’s independence.Item 5. Audit Committee of Listed Registrants.
Not applicable.
Item 6. Schedule of Investments.
Not applicable. The complete schedule of investments is included in Item 1 of this Form N-CSR.
Item 7. Disclosure of Proxy Voting Policies and Procedures for Closed-End Management Investment Companies.
Not applicable.
Item 8. Portfolio Managers of Closed-End Management Investment Companies.
Not applicable.
Item 9. Purchases of Equity Securities by Closed-End Management Investment Company and Affiliated Purchasers.
Not applicable.
Item 10. Submission of Matters to a Vote of Security Holders.
Not applicable.
Item 11. Controls and Procedures.
(a) The registrant’s principal executive officer and principal financial officer have evaluated the registrant’s disclosure controls and procedures within 90 days of this filing and have concluded that the registrant’s disclosure controls and procedures were effective, as of that date, in ensuring that information required to be disclosed by the registrant in this Form N-CSR was recorded, processed, summarized, and reported timely.
(b) The registrant’s principal executive officer and principal financial officer are aware of no change in the registrant’s internal control over financial reporting that occurred during the registrant’s second fiscal quarter covered by this report that has materially affected, or is reasonably likely to materially affect, the registrant’s internal control over financial reporting.
Item 12. Exhibits.
(a)(1) The registrant’s code of ethics pursuant to Item 2 of Form N-CSR is attached.
(2) Separate certifications by the registrant's principal executive officer and principal financial officer, pursuant to Section 302 of the Sarbanes-Oxley Act of 2002 and required by Rule 30a-2(a) under the Investment Company Act of 1940, are attached.
(3) Written solicitation to repurchase securities issued by closed-end companies: not applicable.
(b) A certification by the registrant's principal executive officer and principal financial officer, pursuant to Section 906 of the Sarbanes-Oxley Act of 2002 and required by Rule 30a-2(b) under the Investment Company Act of 1940, is attached.
SIGNATURES |
| |
| |
| | Pursuant to the requirements of the Securities Exchange Act of 1934 and the Investment |
| Company Act of 1940, the registrant has duly caused this report to be signed on its behalf by the |
| undersigned, thereunto duly authorized. |
| |
| T. Rowe Price Corporate Income Fund, Inc. |
| |
| |
| By | /s/ James S. Riepe |
| | James S. Riepe |
| | Principal Executive Officer |
| |
| Date | July 20, 2005 |
| |
| |
| | Pursuant to the requirements of the Securities Exchange Act of 1934 and the Investment |
| Company Act of 1940, this report has been signed below by the following persons on behalf of |
| the registrant and in the capacities and on the dates indicated. |
| |
| |
| By | /s/ James S. Riepe |
| | James S. Riepe |
| | Principal Executive Officer |
| |
| Date | July 20, 2005 |
| |
| |
| |
| By | /s/ Joseph A. Carrier |
| | Joseph A. Carrier |
| | Principal Financial Officer |
| |
| Date | July 20, 2005 |