Item 1: Report to Shareholders| Corporate Income Fund | May 31, 2007 |
The views and opinions in this report were current as of May 31, 2007. They are not guarantees of performance or investment results and should not be taken as investment advice. Investment decisions reflect a variety of factors, and the managers reserve the right to change their views about individual stocks, sectors, and the markets at any time. As a result, the views expressed should not be relied upon as a forecast of the fund’s future investment intent. The report is certified under the Sarbanes-Oxley Act, which requires mutual funds and other public companies to affirm that, to the best of their knowledge, the information in their financial reports is fairly and accurately stated in all material respects.
REPORTS ON THE WEB
Sign up for our E-mail Program, and you can begin to receive updated fund reports and prospectuses online rather than through the mail. Log in to your account at troweprice.com for more information.
Manager’s Letter
Fellow Shareholders
Bond markets were sluggish overall during the past six months as prices declined and yields pushed inexorably higher toward the end of the period. Investors took their lead from Federal Reserve Chairman Ben Bernanke, who warned about the continuing threat of inflation and dashed hopes of a quick cut in short-term rates. Long-term bond prices, which are the most sensitive to changes in interest rates, declined the most. Once again, high-yield corporate bonds outperformed their investment-grade counterparts.

HIGHLIGHTS
• High-yield corporate bonds outperformed investment-grade bonds during the past six months.
• Fund performance exceeded that of its key benchmarks during the 6- and 12-month periods ended May 31, 2007.
• The major driver of fund results was our selection of issues in the media and telecommunications industries.
• Ongoing leveraged buyout activity remains the major risk in coming months, and we will continue to supplement our bottom-up credit analysis with a focus on maintaining a broadly diversified portfolio.
MARKET ENVIRONMENT
Economic growth in the first quarter of the year was revised downward to an annualized rate of 0.6%, its lowest in more than four years. The sluggish pace was attributed to the bulging U.S. trade deficit and a cutback in inventories by corporations. At the same time, inflation has remained stubbornly high, posing a quandary for investors as they try to discern the Federal Reserve’s next move on interest rates. Federal Reserve Chairman Ben Bernanke said that the economy is likely to recover from its recent poor performance and inflation remains “elevated,” dashing hopes for lower interest rates anytime soon. The unemployment rate held steady at 4.5%, indicating that job growth has stabilized somewhere close to 150,000 new jobs a month.
Underscoring the inflation concerns, the Department of Labor reported that worker productivity slowed in the first quarter of the year while the cost of labor rose at an annual rate of 1.8% . At the moment, the economy remains in a precarious balance between weak economic growth on one hand and rising inflation on the other. Consumer spending, which has been driving the economy, is uncertain at best, with the nation’s retailers reporting mixed results for May. Lower consumer demand is helping to narrow our balance of trade deficit with other countries, which could prove beneficial for the economy in coming months.
PERFORMANCE
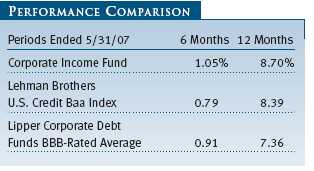
Your fund generated a modest gain for the six-month period ended May 31, 2007, in a difficult environment for bonds. Fund performance exceeded that of both the Lehman Brothers U.S. Credit Baa Index and the Lipper peer group average. For the past 12 months, fund performance was more robust and again surpassed both benchmarks. The fund’s net asset value fell from $9.76 at the end of November to $9.61 at the end of May, while dividends added $0.25 per share to the total return. For the 12-month period, the fund’s net asset value increased $0.30, and dividends provided $0.50 per share.
The negative impact of leveraged buyout (LBO) activity continued to overhang the corporate bond market during the past six months. This type of activity benefits shareholders but is detrimental to a corporation’s bondholders. As a result, the yields widened between corporate securities and Treasuries to compensate investors for taking on the extra risk created in these situations. The size of these deals has been growing, and we expect this trend to continue over the foreseeable future.
Fund performance during the past six months reflected a challenging fixed-income environment, with yields rising most notably in December, January, and May against the backdrop of the LBO activity just discussed. Nevertheless, we managed to provide a positive return thanks in large part to our selection of issues in the media and telecommunications industries. We raised our exposure to leading companies in the group, including Viacom, which boasts an attractive growth profile thanks to its highly rated cable networks. The combination of the company’s solid potential for growth, plus its stable balance sheet and credit characteristics, looked appealing to us, and our overweight position versus the benchmark index helped performance. (Please refer to our portfolio of investments for a complete listing of fund holdings and the amount each represents in the portfolio.)

Within the group, Canadian wireless carrier Rogers Wireless was upgraded to investment-grade status, which boosted the bond’s performance. We were overweight here as well, which added to our relative performance. AT&T was another strong performer; the company continues to find ways to expand profit margins in its stable wireline business, while its wireless operation has been adding subscribers and helping to boost profit margins as well.
In other sectors, we increased the portfolio’s allocation of financials, adding to J.P. Morgan and Capital One Financial. J.P. Morgan bonds are high-quality, low-risk securities, reflecting the firm’s strong management team focused on risk management. It is known to be a bondholder-friendly company. Capital One’s bonds have been upgraded by multiple rating agencies, and the company has successfully grown out of its focus on credit cards into a well-diversified commercial bank.
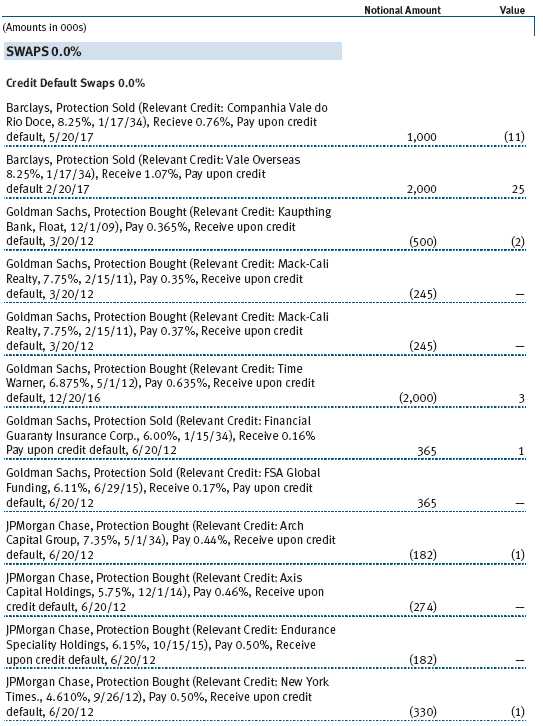
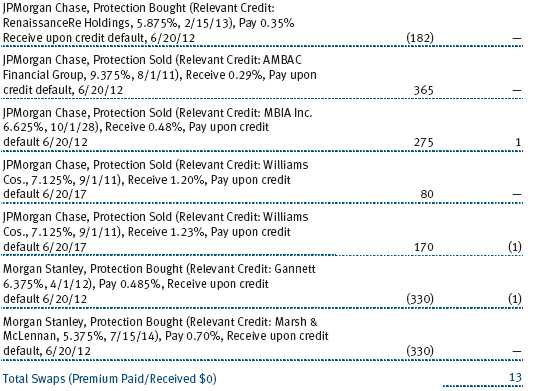
On a negative note, student loan provider Sallie Mae announced that it would be taken private via a well-publicized LBO transaction. While we had eliminated our positions in the company’s bonds before the announcement, they had already begun to underperform because of rumors that the transaction was in the works. To mitigate against these types of events, we have been using credit default swaps—a growing and highly liquid area of the credit market—which provide opportunities to exploit inefficiencies in the marketplace.
Our exposure to United Mexican States bonds also weighed on performance during the period. The central bank of Mexico raised interest rates during the period to address inflation pressures, which weighed on the performance of the bonds. However, we continue to hold a constructive view on the country because of its solid economic trends and relatively stable political environment.
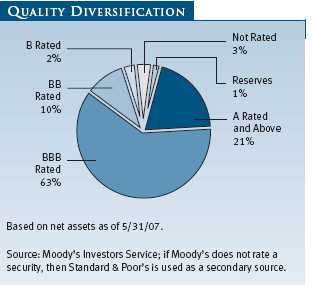
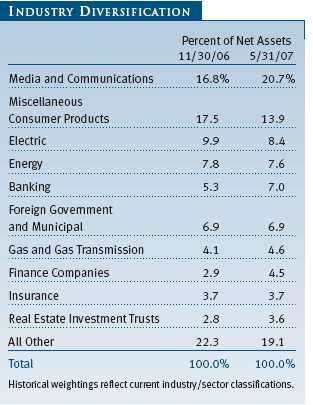
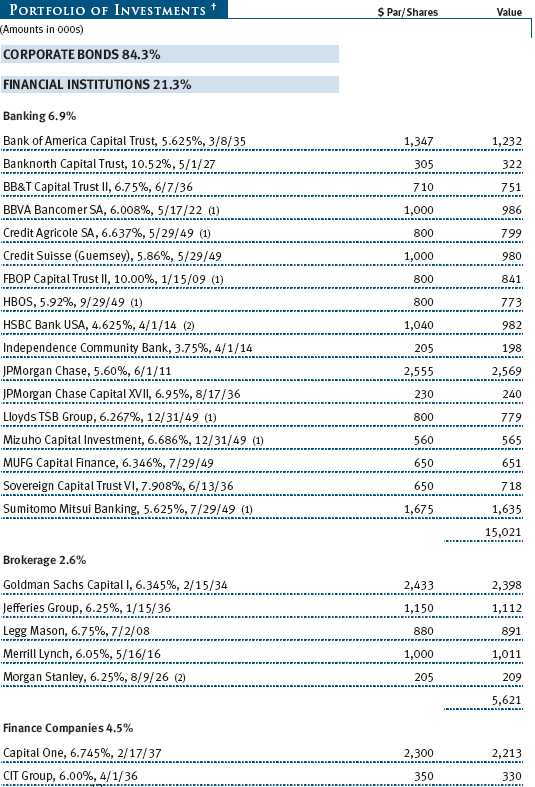
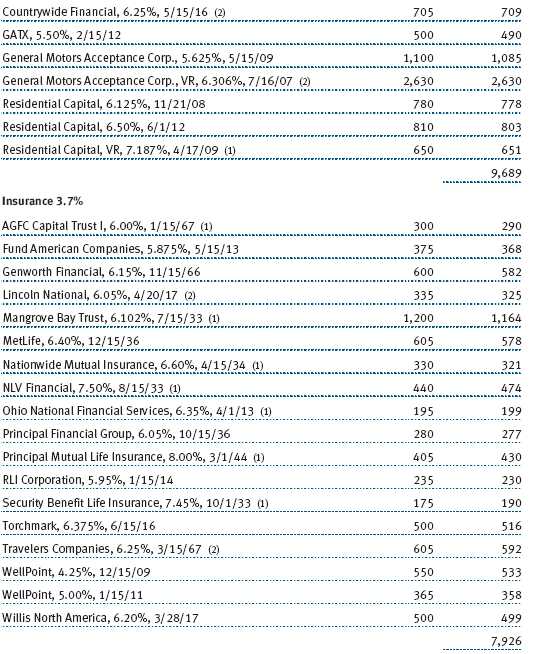
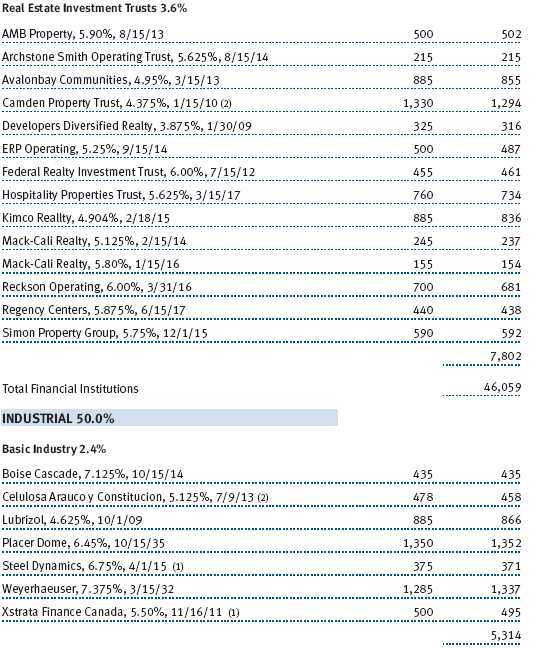
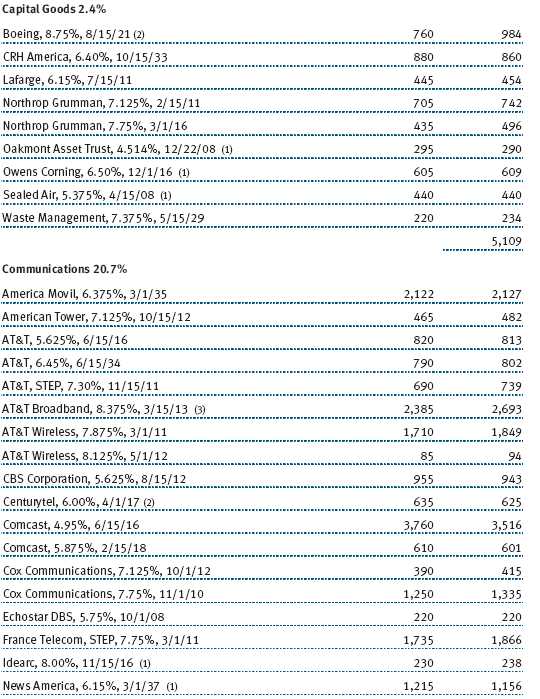
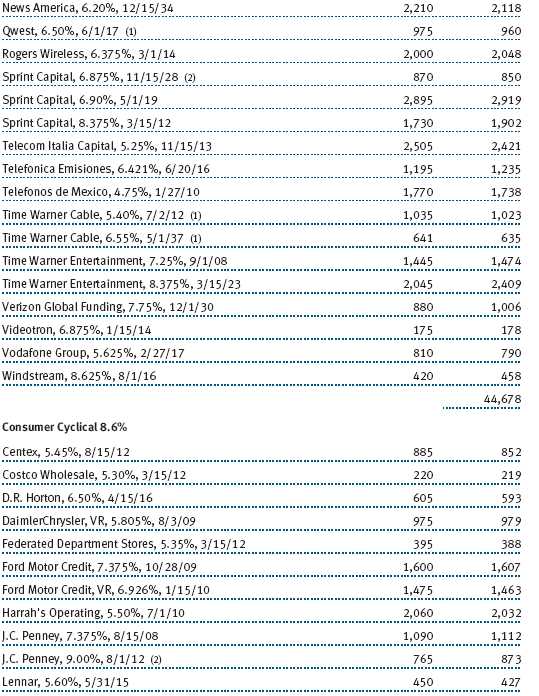
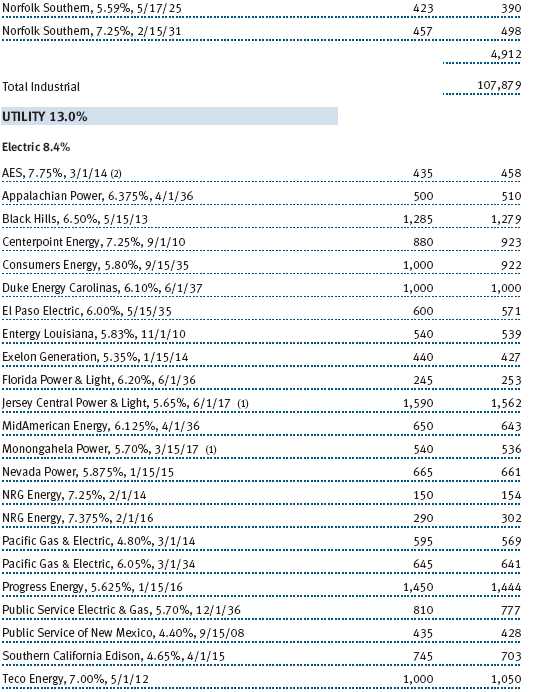
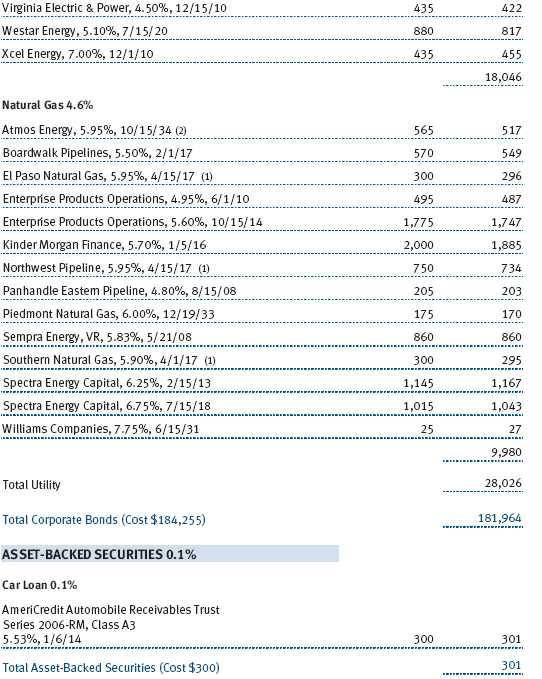
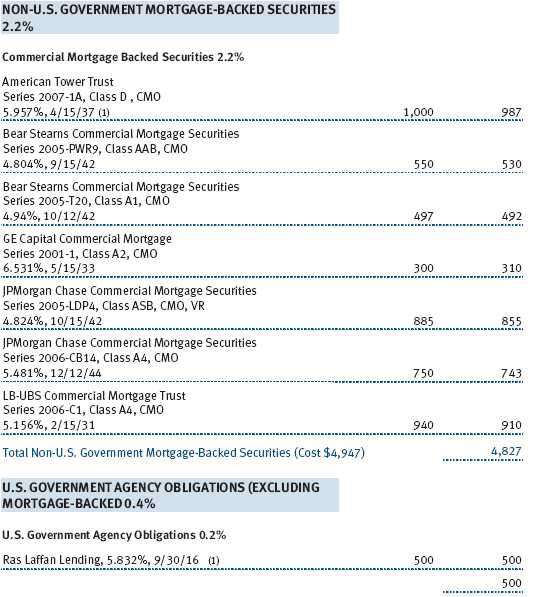
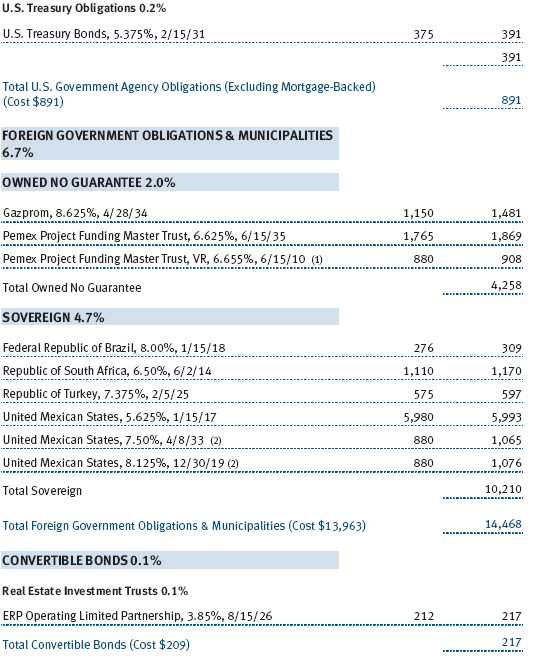
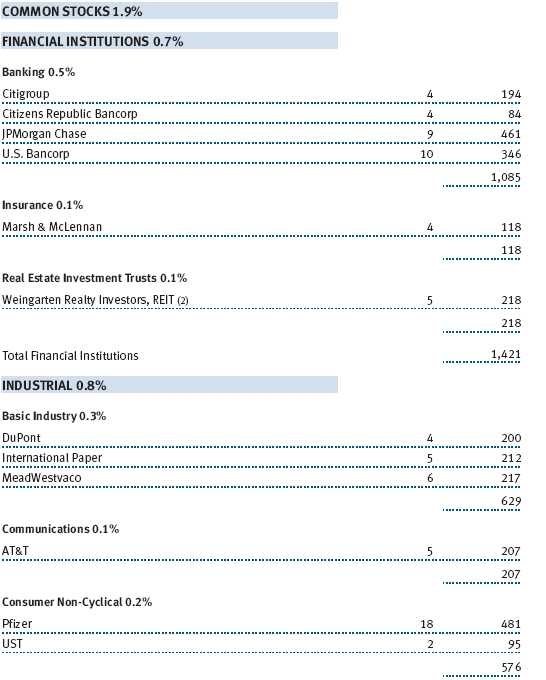
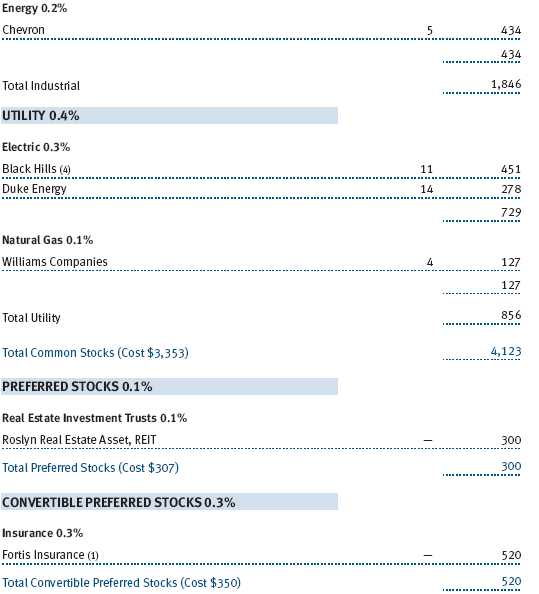
At the end of May, 63% of the portfolio was invested in bonds rated BBB, and 21% was allocated to bonds rated A and higher (a total of 84% in investment-grade credits). The balance of the portfolio was diversified among BB, B, and other securities. Media and communications composed 20.7% of the portfolio, miscellaneous consumer products 13.9%, electric and energy 8.4% and 7.6%, respectively, and the balance was allocated among a broad range of sectors including banking, foreign securities, gas and gas transmission, finance companies, and other groups.
OUTLOOK
As we mentioned in previous reports, shareholder-friendly activity remains the primary concern in our segment of the fixed-income market. Equity investors are showing signs of becoming more discriminating about the bids they will accept from private-equity buyers, driving up the price tags and, consequently, the amounts of leverage needed to finance new deals. Expectations of lower corporate earnings growth could also be acting as a catalyst for increased merger activity, dividend increases, and share repurchases—all of which are detrimental to bondholders.
In acknowledging the ongoing presence of this type of risk, our strategy will be to supplement our rigorous bottom-up credit analysis with a focus on maintaining a broadly diversified portfolio of credits in the sectors of the market we believe are most attractively valued. In this way, we hope to ensure that the portfolio has sufficient exposure to a broad market that continues to benefit from stable fundamentals, while limiting the portfolio’s exposure to any company-specific risks, which appear to be extremely high at present and are likely to remain so through the foreseeable future.
As always, our mission remains constant as we keep a vigilant eye on the economic environment and attempt to identify appealing investment opportunities within our segment of the bond market.
Thank you for investing with T. Rowe Price.
Respectfully submitted,

David A. Tiberii
Chairman of the fund’s Investment Advisory Committee
June 15, 2007
The committee chairman has day-to-day responsibility for managing the portfolio and works with committee members in developing and executing the fund’s investment program.
RISKS OF FIXED-INCOME INVESTING
Bonds are subject to interest rate risk (the decline in bond prices that usually accompanies a rise in interest rates) and credit risk (the chance that any fund holding could have its credit rating downgraded, or that a bond issuer will default by failing to make timely payments of interest or principal), potentially reducing the fund’s income level and share price. High-yield corporate bonds could have greater price declines than funds that invest primarily in high-quality bonds. Companies issuing high-yield bonds are not as strong financially as those with higher credit ratings, so the bonds are usually considered speculative investments.
GLOSSARY
Average maturity: The weighted average of the stated maturity dates of the portfolio’s securities. In general, the longer the average maturity, the greater the fund’s sensitivity to interest rate changes. A shorter average maturity usually means less interest rate sensitivity and, therefore, a less volatile portfolio.
Credit default swap agreement: A contract between two parties that also involves a third entity—the issuer of a bond held by one of the parties in the contract. In a credit default swap, the bondholder agrees to make regular payments (like insurance premiums) to the second party, which agrees to insure against a default by the bond issuer. If the bond issuer defaults (i.e., cannot make interest or principal payments to the bondholder), the second party must purchase the defaulted bond at par value, which would likely be higher than the bond’s market value. A bond fund, particularly one that invests in lower-quality securities, could enter into such an agreement to protect itself from losses that would result from a default.
Duration: A measure of a bond fund’s sensitivity to changes in interest rates. For example, a fund with a duration of six years would fall about 6% in price in response to a one-percentage-point rise in interest rates, and vice versa.
Lehman Brothers U.S. Credit Baa Index: A measure of corporate and noncorporate fixed-income securities that are rated investment grade (Baa by Moody’s Investors Service and BBB by Standard & Poor’s) and have at least 10 years to final maturity.
Lipper averages: The averages of available mutual fund performance returns for specified time periods in defined categories as tracked by Lipper Inc.
Performance and Expenses
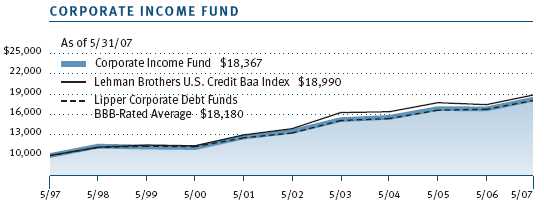
This chart shows the value of a hypothetical $10,000 investment in the fund over the past 10 fiscal year periods or since inception (for funds lacking 10-year records). The result is compared with benchmarks, which may include a broad-based market index and a peer group average or index. Market indexes do not include expenses, which are deducted from fund returns as well as mutual fund averages and indexes.
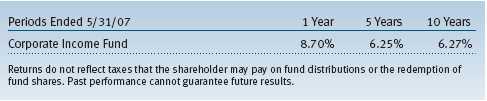
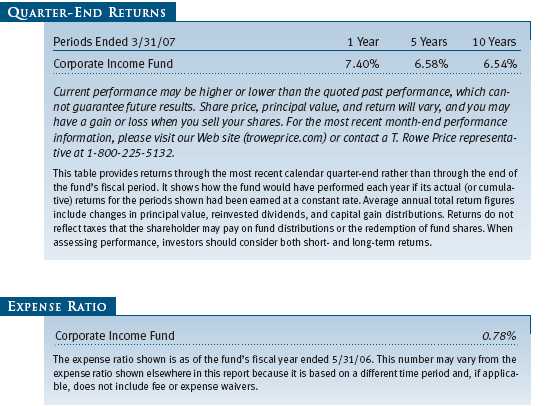
| AVERAGE ANNUAL COMPOUND TOTAL RETURN |
This table shows how the fund would have performed each year if its actual (or cumulative) returns for the periods shown had been earned at a constant rate.
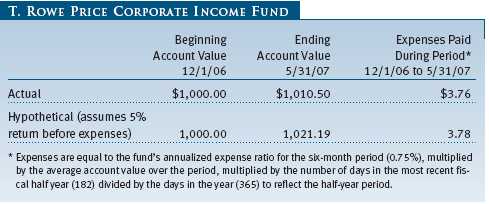
As a mutual fund shareholder, you may incur two types of costs: (1) transaction costs, such as redemption fees or sales loads, and (2) ongoing costs, including management fees, distribution and service (12b-1) fees, and other fund expenses. The following example is intended to help you understand your ongoing costs (in dollars) of investing in the fund and to compare these costs with the ongoing costs of investing in other mutual funds. The example is based on an investment of $1,000 invested at the beginning of the most recent six-month period and held for the entire period.
Actual Expenses
The first line of the following table (“Actual”) provides information about actual account values and expenses based on the fund’s actual returns. You may use the information in this line, together with your account balance, to estimate the expenses that you paid over the period. Simply divide your account value by $1,000 (for example, an $8,600 account value divided by $1,000 = 8.6), then multiply the result by the number in the first line under the heading “Expenses Paid During Period” to estimate the expenses you paid on your account during this period.
Hypothetical Example for Comparison Purposes
The information on the second line of the table (“Hypothetical”) is based on hypothetical account values and expenses derived from the fund’s actual expense ratio and an assumed 5% per year rate of return before expenses (not the fund’s actual return). You may compare the ongoing costs of investing in the fund with other funds by contrasting this 5% hypothetical example and the 5% hypothetical examples that appear in the shareholder reports of the other funds. The hypothetical account values and expenses may not be used to estimate the actual ending account balance or expenses you paid for the period.
Note: T. Rowe Price charges an annual small-account maintenance fee of $10, generally for accounts with less than $2,000 ($500 for UGMA/UTMA). The fee is waived for any investor whose T. Rowe Price mutual fund accounts total $25,000 or more, accounts employing automatic investing, and IRAs and other retirement plan accounts that utilize a prototype plan sponsored by T. Rowe Price (although a separate custodial or administrative fee may apply to such accounts). This fee is not included in the accompanying table. If you are subject to the fee, keep it in mind when you are estimating the ongoing expenses of investing in the fund and when comparing the expenses of this fund with other funds.
You should also be aware that the expenses shown in the table highlight only your ongoing costs and do not reflect any transaction costs, such as redemption fees or sales loads. Therefore, the second line of the table is useful in comparing ongoing costs only and will not help you determine the relative total costs of owning different funds. To the extent a fund charges transaction costs, however, the total cost of owning that fund is higher.
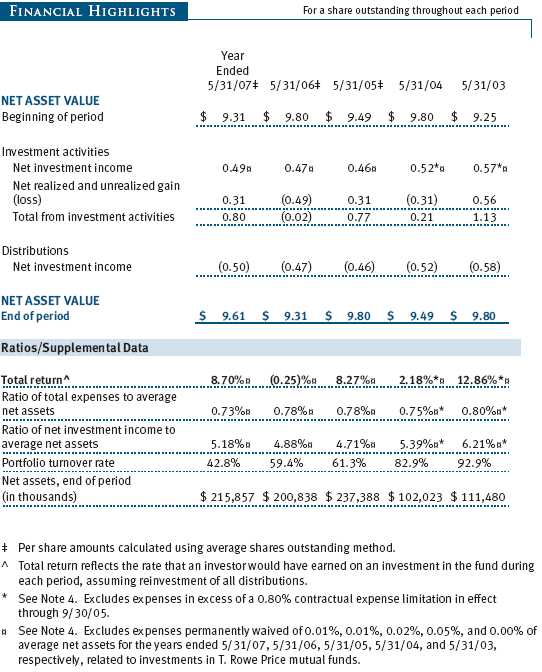
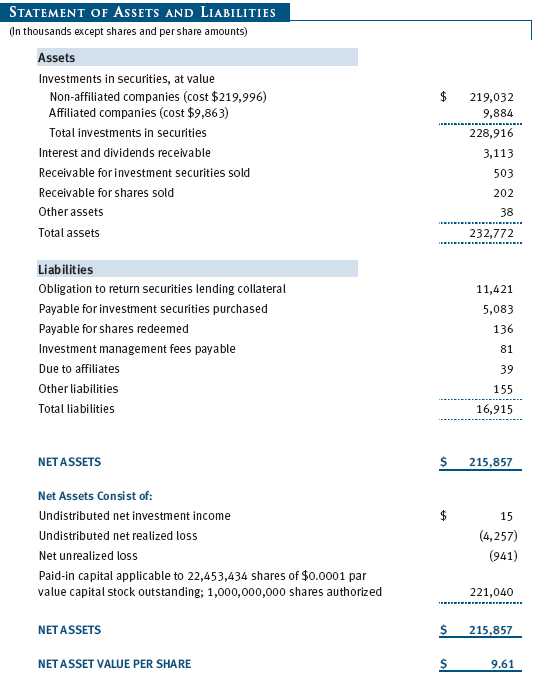
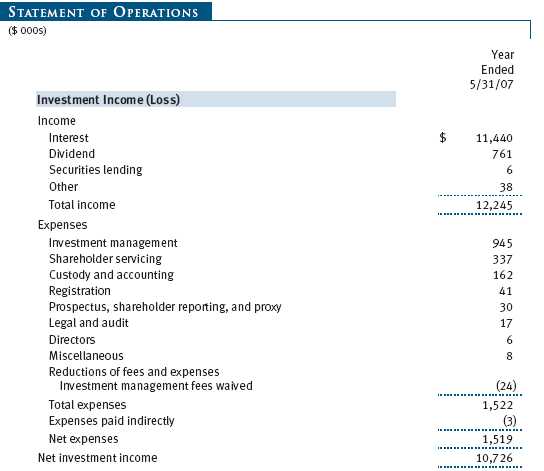
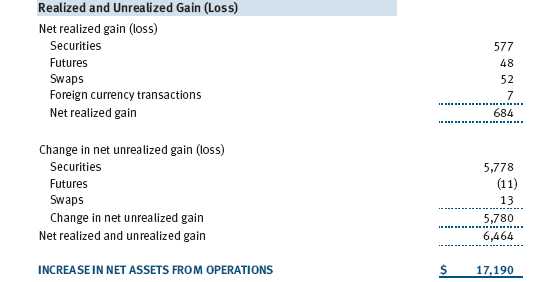
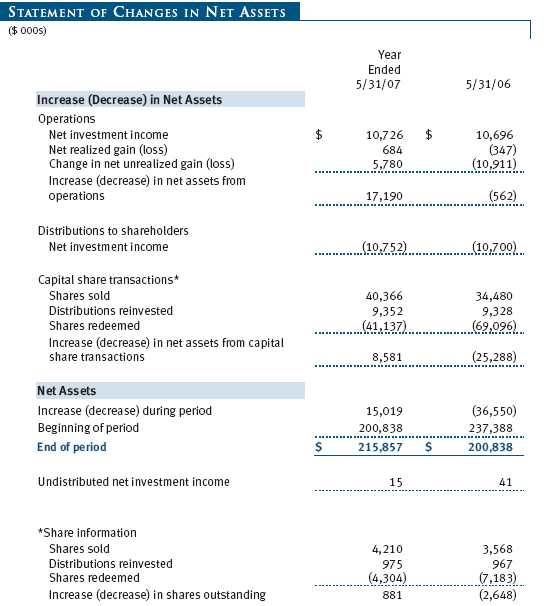
The accompanying notes are an integral part of these financial statements.


The accompanying notes are an integral part of these financial statements.
The accompanying notes are an integral part of these financial statements.
The accompanying notes are an integral part of these financial statements.
The accompanying notes are an integral part of these financial statements.
| NOTES TO FINANCIAL STATEMENTS |
NOTE 1 - SIGNIFICANT ACCOUNTING POLICIES
T. Rowe Price Corporate Income Fund, Inc. (the fund), is registered under the Investment Company Act of 1940 (the 1940 Act) as a diversified, open-end management investment company. The fund commenced operations on October 31, 1995. The fund seeks to provide high income and some capital growth.
The accompanying financial statements were prepared in accordance with accounting principles generally accepted in the United States of America, which require the use of estimates made by fund management. Fund management believes that estimates and security valuations are appropriate; however, actual results may differ from those estimates, and the security valuations reflected in the financial statements may differ from the value the fund ultimately realizes upon sale of the securities.
Valuation The fund values its investments and computes its net asset value per share at the close of the New York Stock Exchange (NYSE), normally 4 p.m. ET, each day that the NYSE is open for business. Debt securities are generally traded in the over-the-counter market. Securities with original maturities of one year or more are valued at prices furnished by dealers who make markets in such securities or by an independent pricing service, which considers yield or price of bonds of comparable quality, coupon, maturity, and type, as well as prices quoted by dealers who make markets in such securities. Securities with original maturities of less than one year are valued at amortized cost in local currency, which approximates fair value when combined with accrued interest.
Equity securities listed or regularly traded on a securities exchange or in the over-the-counter (OTC) market are valued at the last quoted sale price or, for certain markets, the official closing price at the time the valuations are made, except for OTC Bulletin Board securities, which are valued at the mean of the latest bid and asked prices. A security that is listed or traded on more than one exchange is valued at the quotation on the exchange determined to be the primary market for such security. Listed securities not traded on a particular day are valued at the mean of the latest bid and asked prices for domestic securities and the last quoted sale price for international securities.
Investments in mutual funds are valued at the mutual fund’s closing net asset value per share on the day of valuation. Financial futures contracts are valued at closing settlement prices. Swap agreements are valued at prices furnished by dealers who make markets in such securities or by an independent pricing service.
Other investments, including restricted securities, and those for which the above valuation procedures are inappropriate or are deemed not to reflect fair value are stated at fair value as determined in good faith by the T. Rowe Price Valuation Committee, established by the fund’s Board of Director.
Most foreign markets close before the close of trading on the NYSE. If the fund determines that developments between the close of a foreign market and the close of the NYSE will, in its judgment, materially affect the value of some or all of its portfolio securities, which in turn will affect the fund’s share price, the fund will adjust the previous closing prices to reflect the fair value of the securities as of the close of the NYSE, as determined in good faith by the T. Rowe Price Valuation Committee, established by the fund’s Board of Directors. A fund may also fair value securities in other situations, such as when a particular foreign market is closed but the fund is open. In deciding whether to make fair value adjustments, the fund reviews a variety of factors, including developments in foreign markets, the performance of U.S. securities markets, and the performance of instruments trading in U.S. markets that represent foreign securities and baskets of foreign securities. The fund uses outside pricing services to provide it with closing market prices and information used for adjusting those prices. The fund cannot predict when and how often it will use closing prices and when it will adjust those prices to reflect fair value. As a means of evaluating its fair value process, the fund routinely compares closing market prices, the next day’s opening prices in the same markets, and adjusted prices.
Currency Translation Assets, including investments, and liabilities denominated in foreign currencies are translated into U.S. dollar values each day at the prevailing exchange rate, using the mean of the bid and asked prices of such currencies against U.S. dollars as quoted by a major bank. Purchases and sales of securities, income, and expenses are translated into U.S. dollars at the prevailing exchange rate on the date of the transaction. The effect of changes in foreign currency exchange rates on realized and unrealized security gains and losses is reflected as a component of security gains and losses.
Credits The fund earns credits on temporarily uninvested cash balances at the custodian that reduce the fund’s custody charges. Custody expense in the accompanying financial statements is presented before reduction for credits, which are reflected as expenses paid indirectly.
Investment Transactions, Investment Income, and Distributions Income and expenses are recorded on the accrual basis. Premiums and discounts on debt securities are amortized for financial reporting purposes. Dividends received from mutual fund investments are reflected as dividend income; capital gain distributions are reflected as realized gain/loss. Dividend income and capital gain distributions are recorded on the ex-dividend date. Investment transactions are accounted for on the trade date. Realized gains and losses are reported on the identified cost basis. Payments (“variation margin”) made or received to settle the daily fluctuations in the value of futures contracts are recorded as unrealized gains or losses until the contracts are closed. Unsettled variation margin on futures contracts is reflected as other assets or liabilities, and unrealized gains and losses on futures contracts are reflected as the change in net unrealized gain or loss in the accompanying financial statements. Net periodic receipts or payments required by swaps are accrued daily and recorded as realized gain or loss in the accompanying financial statements. Fluctuations in the fair value of swaps are reflected in the change in net unrealized gain or loss and are reclassified to realized gain or loss upon termination prior to maturity. Paydown gains and losses are recorded as an adjustment to interest income. Distributions to shareholders are recorded on the ex-dividend date. Income distributions are declared on a daily basis and paid monthly. Capital gain distributions, if any, are declared and paid by the fund, typically on an annual basis.
New Accounting Pronouncements In June 2006, the Financial Accounting Standards Board (“FASB”) issued FASB Interpretation No. 48 (“FIN 48”), Accounting for Uncertainty in Income Taxes, a clarification of FASB Statement No. 109, Accounting for Income Taxes. FIN 48 establishes financial reporting rules regarding recognition and measurement of tax positions taken or expected to be taken on a tax return. Management is evaluating the anticipated impact, if any, that FIN 48 will have on the fund upon adoption, which, pursuant to a delay granted by the U.S. Securities and Exchange Commission, is expected to be on the last business day of the fund’s semiannual period, November 30, 2007.
In September 2006, the FASB released the Statement of Financial Accounting Standard No. 157 (“FAS 157”), Fair Value Measurements. FAS 157 clarifies the definition of fair value and establishes the framework for measuring fair value, as well as proper disclosure of this methodology in the financial statements. It will be effective for the fund’s fiscal year beginning June 1, 2008. Management is evaluating the effects of FAS 157; however, it is not expected to have a material impact on the fund’s net assets or results of operations.
NOTE 2 - INVESTMENT TRANSACTIONS
Consistent with its investment objective, the fund engages in the following practices to manage exposure to certain risks or to enhance performance. The investment objective, policies, program, and risk factors of the fund are described more fully in the fund’s prospectus and Statement of Additional Information.
Emerging Markets At May 31, 2007, approximately 10% of the fund’s net assets were invested in securities of companies located in emerging markets or issued by governments of emerging market countries or denominated in or linked to the currencies of emerging market countries. Future economic or political developments could adversely affect the liquidity or value, or both, of such securities.
Noninvestment-Grade Debt Securities At May 31, 2007, approximately 14% of the fund’s net assets were invested, directly or through its investment in the T. Rowe Price Institutional High Yield Fund, in noninvestment-grade debt securities, commonly referred to as “high-yield” or “junk” bonds. A real or perceived economic downturn or higher interest rates could adversely affect the liquidity or value, or both, of such securities because such events could lessen the ability of issuers to make principal and interest payments.
Restricted Securities The fund may invest in securities that are subject to legal or contractual restrictions on resale. Although certain of these securities may be readily sold, for example, under Rule 144A, others may be illiquid, their sale may involve substantial delays and additional costs, and prompt sale at an acceptable price may be difficult.
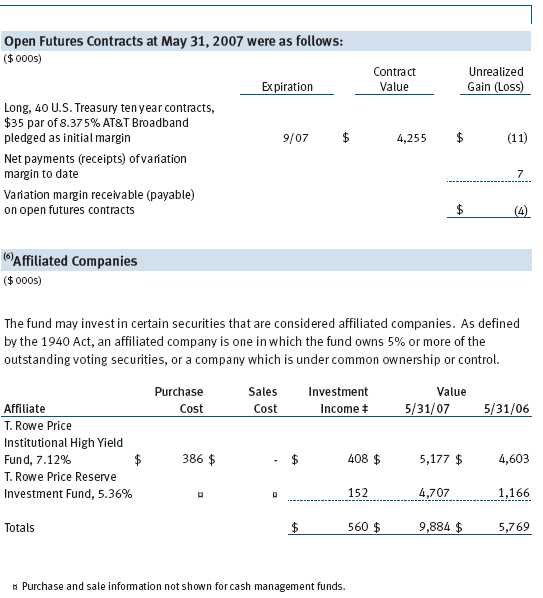
Futures Contracts During the year ended May 31, 2007, the fund was a party to futures contracts, which provide for the future sale by one party and purchase by another of a specified amount of a specific financial instrument at an agreed upon price, date, time, and place. Risks arise from possible illiquidity of the futures market and from movements in security values and/or interest rates.
Swaps During the year ended May 31, 2007, the fund was a party to credit default swaps under which it buys or sells credit protection against a defined-issuer credit event. Upon a defined-issuer credit event, the fund is required to either deliver the notional amount of the contract in cash and take delivery of the relevant credit or deliver cash approximately equal to the notional amount of the contract less market value of the relevant credit at the time of the credit event. Risks arise from the possible inability of counterparties to meet the terms of their agreements and from changes in creditworthiness of the relevant underlying issuer.
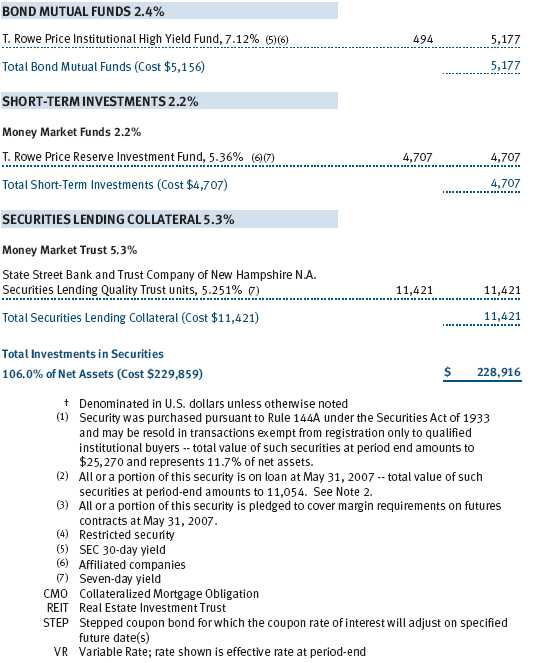
Securities Lending The fund lends its securities to approved brokers to earn additional income. It receives as collateral cash and U.S. government securities valued at 102% to 105% of the value of the securities on loan. Cash collateral is invested in a money market pooled trust managed by the fund’s lending agent in accordance with investment guidelines approved by fund management. Collateral is maintained over the life of the loan in an amount not less than the value of loaned securities, as determined at the close of fund business each day; any additional collateral required due to changes in security values is delivered to the fund the next business day. Although risk is mitigated by the collateral, the fund could experience a delay in recovering its securities and a possible loss of income or value if the borrower fails to return the securities. Securities lending revenue recognized by the fund consists of earnings on invested collateral and borrowing fees, net of any rebates to the borrower and compensation to the lending agent. At May 31, 2007, the value of loaned securities was $11,054,000; aggregate collateral consisted of $11,421,000 in the money market pooled trust.
Other Purchases and sales of portfolio securities, other than short-term and U.S. government securities, aggregated $94,912,000 and $85,941,000, respectively, for the year ended May 31, 2007. Purchases and sales of U.S. government securities aggregated $1,225,000 and $580,000, respectively, for the year ended May 31, 2007.
NOTE 3 - FEDERAL INCOME TAXES
No provision for federal income taxes is required since the fund intends to continue to qualify as a regulated investment company under Subchapter M of the Internal Revenue Code and distribute to shareholders all of its taxable income and gains. Federal income tax regulations differ from generally accepted accounting principles; therefore, distributions determined in accordance with tax regulations may differ significantly in amount or character from net investment income and realized gains for financial reporting purposes. Financial reporting records are adjusted for permanent book/tax differences to reflect tax character. Financial records are not adjusted for temporary differences.
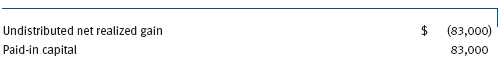
Distributions during the year ended May 31, 2007, totaled $10,752,000 and were characterized as ordinary income for tax purposes. At May 31, 2007, the tax-basis components of net assets were as follows:
The fund intends to retain realized gains to the extent of available capital loss carryforwards. As of May 31, 2007, the fund had $492,000 of capital loss carryforwards that expire in fiscal 2009, $2,666,000 that expire in fiscal 2011, and $1,017,000 that expire in fiscal 2015.
For the year ended May 31, 2007, the fund recorded the following permanent reclassifications to reflect tax character. Reclassifications to paid-in capital relate primarily to a tax practice that treats a portion of the proceeds from each redemption of capital shares as a distribution of taxable net investment income and/or realized capital gain. Results of operations and net assets were not affected by these reclassifications.
At May 31, 2007, the cost of investments for federal income tax purposes was $229,939,000.
NOTE 4 - RELATED PARTY TRANSACTIONS
The fund is managed by T. Rowe Price Associates, Inc. (the manager or Price Associates), a wholly owned subsidiary of T. Rowe Price Group, Inc. The investment management agreement between the fund and the manager provides for an annual investment management fee, which is computed daily and paid monthly. The fee consists of an individual fund fee, equal to 0.15% of the fund’s average daily net assets, and a group fee. The group fee rate is calculated based on the combined net assets of certain mutual funds sponsored by Price Associates (the group) applied to a graduated fee schedule, with rates ranging from 0.48% for the first $1 billion of assets to 0.285% for assets in excess of $220 billion. The fund’s group fee is determined by applying the group fee rate to the fund’s average daily net assets. At May 31, 2007, the effective annual group fee rate was 0.30%.
In addition, the fund has entered into service agreements with Price Associates and two wholly owned subsidiaries of Price Associates (collectively, Price). Price Associates computes the daily share price and provides certain other administrative services to the fund. T. Rowe Price Services, Inc., provides shareholder and administrative services in its capacity as the fund’s transfer and dividend disbursing agent. T. Rowe Price Retirement Plan Services, Inc., provides subaccounting and recordkeeping services for certain retirement accounts invested in the fund. For the year ended May 31, 2007, expenses incurred pursuant to these service agreements were $127,000 for Price Associates, $120,000 for T. Rowe Price Services, Inc., and $5,000 for T. Rowe Price Retirement Plan Services, Inc. The total amount payable at period-end pursuant to these service agreements is reflected as Due to Affiliates in the accompanying financial statements.
The fund is also one of several mutual funds sponsored by Price Associates (underlying Price funds) in which the T. Rowe Price Spectrum Funds (Spectrum Funds) may invest. The Spectrum Funds do not invest in the underlying Price funds for the purpose of exercising management or control. Pursuant to a special servicing agreement, expenses associated with the operation of the Spectrum Funds are borne by each underlying Price fund to the extent of estimated savings to it and in proportion to the average daily value of its shares owned by the Spectrum Funds. Expenses allocated under this agreement are reflected as shareholder servicing expense in the accompanying financial statements. For the year ended May 31, 2007, the fund was allocated $161,000 of Spectrum Funds’ expenses, of which $114,000 related to services provided by Price. The amount payable at period-end pursuant to this agreement is reflected as Due to Affiliates in the accompanying financial statements. At May 31, 2007, approximately 43% of the outstanding shares of the fund were held by the Spectrum Funds.
The fund may invest in the T. Rowe Price Reserve Investment Fund and the T. Rowe Price Government Reserve Investment Fund (collectively, the T. Rowe Price Reserve Investment Funds), open-end management investment companies managed by Price Associates and affiliates of the fund. The T. Rowe Price Reserve Investment Funds are offered as cash management options to mutual funds, trusts, and other accounts managed by Price Associates and/or its affiliates, and are not available for direct purchase by members of the public. The T. Rowe Price Reserve Investment Funds pay no investment management fees.
The fund may invest in the T. Rowe Price Institutional High Yield Fund, Inc. (High Yield Fund), as a means of gaining efficient and cost-effective exposure to the high-yield bond markets. The High Yield Fund is an open-end management investment company managed by Price Associates, and an affiliate of the fund. The High Yield Fund pays an annual all-inclusive management and administrative fee to Price Associates equal to 0.50% of average daily net assets. To ensure that Corporate Income Fund does not incur duplicate fees for its assets invested in the High Yield Fund, Price Associates has agreed to reduce its management fee to the fund. Accordingly, the management fee waiver reflected on the accompanying Statement of Operations includes $24,000 of management fees permanently waived pursuant to this agreement.
| REPORT OF INDEPENDENT REGISTERED PUBLIC ACCOUNTING FIRM |
To the Board of Directors and Shareholders of T. Rowe Price Corporate Income Fund, Inc.
In our opinion, the accompanying statement of assets and liabilities, including the portfolio of investments, and the related statements of operations and of changes in net assets and the financial highlights present fairly, in all material respects, the financial position of T. Rowe Price Corporate Income Fund, Inc. (the “Fund”) at May 31, 2007, the results of its operations for the year then ended, the changes in its net assets for each of the two years in the period then ended and the financial highlights for each of the five years in the period then ended, in conformity with accounting principles generally accepted in the United States of America. These financial statements and financial highlights (hereafter referred to as “financial statements”) are the responsibility of the Fund’s management; our responsibility is to express an opinion on these financial statements based on our audits. We conducted our audits of these financial statements in accordance with the auditing standards of the Public Company Accounting Oversight Board (United States). Those standards require that we plan and perform the audit to obtain reasonable assurance about whether the financial statements are free of material misstatement. An audit includes examining, on a test basis, evidence supporting the amounts and disclosures in the financial statements, assessing the accounting principles used and significant estimates made by management, and evaluating the overall financial statement presentation. We believe that our audits, which included confirmation of securities at May 31, 2007 by correspondence with the custodian and brokers, and by agreement to the underlying ownership records for T. Rowe Price Reserve Investment Fund and T. Rowe Price Institutional High Yield Fund, provide a reasonable basis for our opinion.
PricewaterhouseCoopers LLP
Baltimore, Maryland
July 12, 2007
| TAX INFORMATION (UNAUDITED) FOR THE TAX YEAR ENDED 5/31/07 |
We are providing this information as required by the Internal Revenue Code. The amounts shown may differ from those elsewhere in this report because of differences between tax and financial reporting requirements.
The fund’s distributions to shareholders included $83,000 from short-term capital gains.
For taxable non-corporate shareholders, $186,000 of the fund’s income represents qualified dividend income subject to the 15% rate category.
For corporate shareholders, $181,000 of the fund’s income qualifies for the dividends-received deduction.
| INFORMATION ON PROXY VOTING POLICIES, PROCEDURES, AND RECORDS |
A description of the policies and procedures used by T. Rowe Price funds and portfolios to determine how to vote proxies relating to portfolio securities is available in each fund’s Statement of Additional Information, which you may request by calling 1-800-225-5132 or by accessing the SEC’s Web site, www.sec.gov. The description of our proxy voting policies and procedures is also available on our Web site, www.troweprice.com. To access it, click on the words “Company Info” at the top of our homepage for individual investors. Then, in the window that appears, click on the “Proxy Voting Policy” navigation button in the top left corner.
Each fund’s most recent annual proxy voting record is available on our Web site and through the SEC’s Web site. To access it through our Web site, follow the directions above, then click on the words “Proxy Voting Record” at the bottom of the Proxy Voting Policy page.
| HOW TO OBTAIN QUARTERLY PORTFOLIO HOLDINGS |
The fund files a complete schedule of portfolio holdings with the Securities and Exchange Commission for the first and third quarters of each fiscal year on Form N-Q. The fund’s Form N-Q is available electronically on the SEC’s Web site (www.sec.gov); hard copies may be reviewed and copied at the SEC’s Public Reference Room, 450 Fifth St. N.W., Washington, DC 20549. For more information on the Public Reference Room, call 1-800-SEC-0330.
| APPROVAL OF INVESTMENT MANAGEMENT AGREEMENT |
On March 7, 2007, the fund’s Board of Directors (Board) unanimously approved the investment advisory contract (Contract) between the fund and its investment manager, T. Rowe Price Associates, Inc. (Manager). The Board considered a variety of factors in connection with its review of the Contract, also taking into account information provided by the Manager during the course of the year, as discussed below:
Services Provided by the Manager
The Board considered the nature, quality, and extent of the services provided to the fund by the Manager. These services included, but were not limited to, management of the fund’s portfolio and a variety of related activities, as well as financial and administrative services, reporting, and communications. The Board also reviewed the background and experience of the Manager’s senior management team and investment personnel involved in the management of the fund. The Board concluded that it was satisfied with the nature, quality, and extent of the services provided by the Manager.
Investment Performance of the Fund
The Board reviewed the fund’s average annual total return over the 1-, 3-, 5-, and 10-year periods as well as the fund’s year-by-year returns and compared these returns with a wide variety of previously agreed upon comparable performance measures and market data, including those supplied by Lipper and Morningstar, which are independent providers of mutual fund data. On the basis of this evaluation and the Board’s ongoing review of investment results, the Board concluded that the fund’s performance was satisfactory.
Costs, Benefits, Profits, and Economies of Scale
The Board reviewed detailed information regarding the revenues received by the Manager under the Contract and other benefits that the Manager (and its affiliates) may have realized from its relationship with the fund, including research received under “soft dollar” agreements. The Board noted that soft dollars were not used to pay for third-party, non-broker research. The Board also received information on the estimated costs incurred and profits realized by the Manager and its affiliates from advising T. Rowe Price mutual funds, as well as estimates of the gross profits realized from managing the fund in particular. The Board concluded that the Manager’s profits were reasonable in light of the services provided to the fund. The Board also considered whether the fund or other funds benefit under the fee levels set forth in the Contract from any economies of scale realized by the Manager. Under the Contract, the fund pays a fee to the Manager composed of two components—a group fee rate based on the aggregate assets of certain T. Rowe Price mutual funds (including the fund) that declines at certain asset levels and an individual fund fee rate that is assessed on the assets of the fund. The Board concluded that the advisory fee structure for the fund continued to provide for a reasonable sharing of benefits from economies of scale with the fund’s investors.
Fees
The Board reviewed the fund’s management fee rate, operating expenses, and total expense ratio and compared them with fees and expenses of other comparable funds based on information and data supplied by Lipper. The information provided to the Board showed that the fund’s management fee rate was above the median for certain groups of comparable funds but below the median of other groups of comparable funds. The information also indicated that the fund’s expense ratio was below the median of comparable funds. The Board also reviewed the fee schedules for comparable privately managed accounts of the Manager and its affiliates. Management informed the Board that the Manager’s responsibilities for privately managed accounts are more limited than its responsibilities for the fund and other T. Rowe Price mutual funds that it or its affiliates advise. On the basis of the information provided, the Board concluded that the fees paid by the fund under the Contract were reasonable.
Approval of the Contract
As noted, the Board approved the continuation of the Contract. No single factor was considered in isolation or to be determinative to the decision. Rather, the Board concluded, in light of a weighting and balancing of all factors considered, that it was in the best interests of the fund to approve the continuation of the Contract, including the fees to be charged for services thereunder.
| ABOUT THE FUND’S DIRECTORS AND OFFICERS |
Your fund is governed by a Board of Directors (Board) that meets regularly to review a wide variety of matters affecting the fund, including performance, investment programs, compliance matters, advisory fees and expenses, service providers, and other business affairs. The Board elects the fund’s officers, who are listed in the final table. At least 75% of Board members are independent of T. Rowe Price Associates, Inc. (T. Rowe Price), and T. Rowe Price International, Inc. (T. Rowe Price International); “inside” or “interested” directors are employees or officers of T. Rowe Price. The business address of each director and officer is 100 East Pratt Street, Baltimore, Maryland 21202. The Statement of Additional Information includes additional information about the fund directors and is available without charge by calling a T. Rowe Price representative at 1-800-225-5132.
| Independent Directors | |
| |
| Name | |
| (Year of Birth) | Principal Occupation(s) During Past 5 Years and Directorships of |
| Year Elected* | Other Public Companies |
| |
| Jeremiah E. Casey | Director, National Life Insurance (2001 to 2005); Director, The Rouse |
| (1940) | Company, real estate developers (1990 to 2004); Director, Allfirst |
| 2006 | Financial Inc. (previously First Maryland Bancorp) (1983 to 2002) |
| |
| Anthony W. Deering | Chairman, Exeter Capital, LLC, a private investment firm (2004 to |
| (1945) | present); Director, Vornado Real Estate Investment Trust (3/04 to pres- |
| 1995 | ent); Director, Mercantile Bankshares (4/03 to present); Member, |
| | Advisory Board, Deutsche Bank North America (2004 to present); |
| | Director, Chairman of the Board, and Chief Executive Officer, The |
| | Rouse Company, real estate developers (1997 to 2004) |
| |
| Donald W. Dick, Jr. | Principal, EuroCapital Advisors, LLC, an acquisition and management |
| (1943) | advisory firm; Chairman, The Haven Group, a custom manufacturer of |
| 2001 | modular homes (1/04 to present) |
| |
| David K. Fagin | Chairman and President, Nye Corporation (6/88 to present); Director, |
| (1938) | Canyon Resources Corp. (5/00 to present); Director, Golden Star |
| 2001 | Resources Ltd. (5/92 to present); Director, Pacific Rim Mining Corp. |
| | (2/02 to present) |
| |
| Karen N. Horn | Director, Federal National Mortgage Association (9/06 to present); |
| (1943) | Managing Director and President, Global Private Client Services, Marsh |
| 2003 | Inc. (1999 to 2003); Managing Director and Head of International |
| | Private Banking, Bankers Trust (1996 to 1999); Director, Georgia Pacific |
| | (5/04 to 12/05), Eli Lilly and Company, and Simon Property Group |
| |
| Theo C. Rodgers | President, A&R Development Corporation (1977 to present) |
| (1941) | |
| 2005 | |
| John G. Schreiber | Owner/President, Centaur Capital Partners, Inc., a real estate invest- |
| (1946) | ment company; Partner, Blackstone Real Estate Advisors, L.P. |
| 1995 | |
| *Each independent director oversees 119 T. Rowe Price portfolios and serves until retirement, resignation, or |
| election of a successor. |
| Inside Directors | |
| |
| Name | |
| (Year of Birth) | |
| Year Elected* | |
| [Number of T. Rowe Price | Principal Occupation(s) During Past 5 Years and Directorships of |
| Portfolios Overseen] | Other Public Companies |
| |
| Edward C. Bernard | Director and Vice President, T. Rowe Price; Vice Chairman of the Board, |
| (1956) | Director, and Vice President, T. Rowe Price Group, Inc.; Chairman of the |
| 2006 | Board, Director, and President, T. Rowe Price Investment Services, Inc., |
| [119] | and T. Rowe Price Retirement Plan Services, Inc.; Chairman of the |
| | Board and Director, T. Rowe Price Services, Inc., T. Rowe Price Savings |
| | Bank, T. Rowe Price Global Asset Management Limited, and T. Rowe |
| | Price Global Investment Services Limited; Director, T. Rowe Price |
| | International, Inc.; Chief Executive Officer, Chairman of the Board, |
| | Director, and President, T. Rowe Price Trust Company; Chairman of the |
| | Board, all funds |
| |
| Mary J. Miller, CFA | Director, T. Rowe Price Trust Company; Director and Vice President, |
| (1955) | T. Rowe Price; Vice President, T. Rowe Price Group, Inc.; Vice President, |
| 2004 | Corporate Income Fund |
| [37] | |
| |
| *Each inside director serves until retirement, resignation, or election of a successor. |
| Officers | |
| |
| Name (Year of Birth) | |
| Title and Fund(s) Served | Principal Occupation(s) |
| |
| Steven G. Brooks, CFA (1954) | Vice President, T. Rowe Price and T. Rowe Price |
| Vice President, Corporate Income Fund | Group, Inc. |
| |
| Joseph A. Carrier, CPA (1960) | Vice President, T. Rowe Price, T. Rowe Price |
| Treasurer, Corporate Income Fund | Group, Inc., T. Rowe Price Investment Services, |
| | Inc., and T. Rowe Price Trust Company |
| |
| Roger L. Fiery III, CPA (1959) | Vice President, T. Rowe Price, T. Rowe Price |
| Vice President, Corporate Income Fund | Group, Inc., T. Rowe Price International, Inc., |
| | and T. Rowe Price Trust Company |
| |
| John R. Gilner (1961) | Chief Compliance Officer and Vice President, |
| Chief Compliance Officer, | T. Rowe Price; Vice President, T. Rowe Price |
| Corporate Income Fund | Group, Inc., and T. Rowe Price Investment |
| | Services, Inc. |
| |
| Gregory S. Golczewski (1966) | Vice President, T. Rowe Price and T. Rowe Price |
| Vice President, Corporate Income Fund | Trust Company |
| |
| Michael J. Grogan, CFA (1971) | Assistant Vice President, T. Rowe Price |
| Assistant Vice President, | |
| Corporate Income Fund | |
| |
| Henry H. Hopkins (1942) | Director and Vice President, T. Rowe Price |
| Vice President, Corporate Income Fund | Investment Services, Inc., T. Rowe Price Services, |
| | Inc., and T. Rowe Price Trust Company; Vice |
| | President, T. Rowe Price, T. Rowe Price Group, |
| | Inc., T. Rowe Price International, Inc., and |
| | T. Rowe Price Retirement Plan Services, Inc. |
| |
| Alan D. Levenson, Ph.D. (1958) | Vice President, T. Rowe Price and T. Rowe Price |
| Vice President, Corporate Income Fund | Group, Inc. |
| |
| Patricia B. Lippert (1953) | Assistant Vice President, T. Rowe Price and |
| Secretary, Corporate Income Fund | T. Rowe Price Investment Services, Inc. |
| |
| Michael J. McGonigle (1966) | Vice President, T. Rowe Price and T. Rowe Price |
| Vice President, Corporate Income Fund | Group, Inc. |
| |
| Robert L. McWilliam (1970) | Employee, T. Rowe Price; formerly Portfolio |
| Assistant Vice President, | Manager, Sailfish Capital Partners (to 2006); |
| Corporate Income Fund | Vice President, Merrill Lynch (2002 to 2006) |
| Vernon A. Reid, Jr. (1954) | Vice President, T. Rowe Price and T. Rowe Price |
| Vice President, Corporate Income Fund | Group, Inc. |
| |
| Theodore E. Robson, CFA (1965) | Vice President, T. Rowe Price and T. Rowe Price |
| Vice President, Corporate Income Fund | Group, Inc. |
| |
| David A. Tiberii, CFA (1965) | Vice President, T. Rowe Price and T. Rowe Price |
| President, Corporate Income Fund | Group, Inc. |
| |
| Mark J. Vaselkiv (1958) | Vice President, T. Rowe Price and T. Rowe Price |
| Executive Vice President, | Group, Inc. |
| Corporate Income Fund | |
| |
| Julie L. Waples (1970) | Vice President, T. Rowe Price |
| Vice President, Corporate Income Fund | |
| |
| Edward A. Wiese, CFA (1959) | Vice President, T. Rowe Price, T. Rowe Price |
| Vice President, Corporate Income Fund | Group, Inc., and T. Rowe Price Trust Company; |
| | Chief Investment Officer, Director, and Vice |
| | President, T. Rowe Price Savings Bank |
| |
| Thea N. Williams (1961) | Vice President, T. Rowe Price and T. Rowe Price |
| Vice President, Corporate Income Fund | Group, Inc. |
| |
| Unless otherwise noted, officers have been employees of T. Rowe Price or T. Rowe Price International for at |
| least five years. | |
Item 2. Code of Ethics.
The registrant has adopted a code of ethics, as defined in Item 2 of Form N-CSR, applicable to its principal executive officer, principal financial officer, principal accounting officer or controller, or persons performing similar functions. A copy of this code of ethics is filed as an exhibit to this Form N-CSR. No substantive amendments were approved or waivers were granted to this code of ethics during the period covered by this report.
Item 3. Audit Committee Financial Expert.
The registrant’s Board of Directors/Trustees has determined that Mr. Donald W. Dick Jr. qualifies as an audit committee financial expert, as defined in Item 3 of Form N-CSR. Mr. Dick is considered independent for purposes of Item 3 of Form N-CSR.
Item 4. Principal Accountant Fees and Services.
(a) – (d) Aggregate fees billed to the registrant for the last two fiscal years for professional services rendered by the registrant’s principal accountant were as follows:
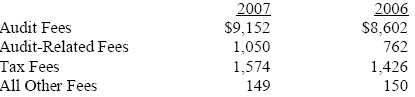
Audit fees include amounts related to the audit of the registrant’s annual financial statements and services normally provided by the accountant in connection with statutory and regulatory filings. Audit-related fees include amounts reasonably related to the performance of the audit of the registrant’s financial statements and specifically include the issuance of a report on internal controls and, if applicable, agreed-upon procedures related to fund acquisitions. Tax fees include amounts related to services for tax compliance, tax planning, and tax advice. The nature of these services specifically includes the review of distribution calculations and the preparation of Federal, state, and excise tax returns. All other fees include the registrant’s pro-rata share of amounts for agreed-upon procedures in conjunction with service contract approvals by the registrant’s Board of Directors/Trustees.
(e)(1) The registrant’s audit committee has adopted a policy whereby audit and non-audit services performed by the registrant’s principal accountant for the registrant, its investment adviser, and any entity controlling, controlled by, or under common control with the investment adviser that provides ongoing services to the registrant require pre-approval in advance at regularly scheduled audit committee meetings. If such a service is required between regularly scheduled audit committee meetings, pre-approval may be authorized by one audit committee member with ratification at the next scheduled audit committee meeting. Waiver of pre-approval for audit or non-audit services requiring fees of a de minimis amount is not permitted.
(2) No services included in (b) – (d) above were approved pursuant to paragraph (c)(7)(i)(C) of Rule 2-01 of Regulation S-X.
(f) Less than 50 percent of the hours expended on the principal accountant’s engagement to audit the registrant’s financial statements for the most recent fiscal year were attributed to work performed by persons other than the principal accountant’s full-time, permanent employees.
(g) The aggregate fees billed for the most recent fiscal year and the preceding fiscal year by the registrant’s principal accountant for non-audit services rendered to the registrant, its investment adviser, and any entity controlling, controlled by, or under common control with the investment adviser that provides ongoing services to the registrant were $1,201,000 and $883,000, respectively, and were less than the aggregate fees billed for those same periods by the registrant’s principal accountant for audit services rendered to the T. Rowe Price Funds.
(h) All non-audit services rendered in (g) above were pre-approved by the registrant’s audit committee. Accordingly, these services were considered by the registrant’s audit committee in maintaining the principal accountant’s independence.
Item 5. Audit Committee of Listed Registrants.Not applicable.
Item 6. Schedule of Investments.
Not applicable. The complete schedule of investments is included in Item 1 of this Form N-CSR.
Item 7. Disclosure of Proxy Voting Policies and Procedures for Closed-End Management Investment Companies.
Not applicable.
Item 8. Portfolio Managers of Closed-End Management Investment Companies.
Not applicable.
Item 9. Purchases of Equity Securities by Closed-End Management Investment Company and Affiliated Purchasers.
Not applicable.
Item 10. Submission of Matters to a Vote of Security Holders.
Not applicable.
Item 11. Controls and Procedures.
(a) The registrant’s principal executive officer and principal financial officer have evaluated the registrant’s disclosure controls and procedures within 90 days of this filing and have concluded that the registrant’s disclosure controls and procedures were effective, as of that date, in ensuring that information required to be disclosed by the registrant in this Form N-CSR was recorded, processed, summarized, and reported timely.
(b) The registrant’s principal executive officer and principal financial officer are aware of no change in the registrant’s internal control over financial reporting that occurred during the registrant’s second fiscal quarter covered by this report that has materially affected, or is reasonably likely to materially affect, the registrant’s internal control over financial reporting.
Item 12. Exhibits.
(a)(1) The registrant’s code of ethics pursuant to Item 2 of Form N-CSR is attached.
(2) Separate certifications by the registrant's principal executive officer and principal financial officer, pursuant to Section 302 of the Sarbanes-Oxley Act of 2002 and required by Rule 30a-2(a) under the Investment Company Act of 1940, are attached.
(3) Written solicitation to repurchase securities issued by closed-end companies: not applicable.
(b) A certification by the registrant's principal executive officer and principal financial officer, pursuant to Section 906 of the Sarbanes-Oxley Act of 2002 and required by Rule 30a-2(b) under the Investment Company Act of 1940, is attached.
| | |
SIGNATURES |
| |
| | Pursuant to the requirements of the Securities Exchange Act of 1934 and the Investment |
| Company Act of 1940, the registrant has duly caused this report to be signed on its behalf by the |
| undersigned, thereunto duly authorized. |
| |
| T. Rowe Price Corporate Income Fund, Inc. |
| |
| |
| By | /s/ Edward C. Bernard |
| | Edward C. Bernard |
| | Principal Executive Officer |
| |
| Date | July 23, 2007 |
| |
| |
| | Pursuant to the requirements of the Securities Exchange Act of 1934 and the Investment |
| Company Act of 1940, this report has been signed below by the following persons on behalf of |
| the registrant and in the capacities and on the dates indicated. |
| |
| |
| By | /s/ Edward C. Bernard |
| | Edward C. Bernard |
| | Principal Executive Officer |
| |
| Date | July 23, 2007 |
| |
| |
| |
| By | /s/ Joseph A. Carrier |
| | Joseph A. Carrier |
| | Principal Financial Officer |
| |
| Date | July 23, 2007 |