UNITED STATES
SECURITIES AND EXCHANGE COMMISSION
WASHINGTON, D. C. 20549
FORM N-CSR
Investment Company Act file number: 811-01236
DWS Market Trust
(Exact Name of Registrant as Specified in Charter)
345 Park Avenue
New York, NY 10154-0004
(Address of Principal Executive Offices) (Zip Code)
Registrant’s Telephone Number, including Area Code: (212) 250-3220
Paul Schubert
60 Wall Street
New York, NY 10005
(Name and Address of Agent for Service)
| Date of fiscal year end: | 10/31 |
| Date of reporting period: | 10/31/2012 |
| ITEM 1. | REPORT TO STOCKHOLDERS |
OCTOBER 31, 2012 Annual Report to Shareholders |
DWS Global Income Builder Fund (formerly DWS Balanced Fund) |
 |
Contents
4 Portfolio Management Review 11 Performance Summary 14 Investment Portfolio 43 Statement of Assets and Liabilities 45 Statement of Operations 46 Statement of Changes in Net Assets 47 Financial Highlights 52 Notes to Financial Statements 69 Report of Independent Registered Public Accounting Firm 70 Information About Your Fund's Expenses 72 Tax Information 73 Investment Management Agreement Approval 78 Summary of Management Fee Evaluation by Independent Fee Consultant 82 Board Members and Officers 87 Account Management Resources |
This report must be preceded or accompanied by a prospectus. To obtain a summary prospectus, if available, or prospectus for any of our funds, refer to the Account Management Resources information provided in the back of this booklet. We advise you to consider the fund's objectives, risks, charges and expenses carefully before investing. The summary prospectus and prospectus contain this and other important information about the fund. Please read the prospectus carefully before you invest.
Although allocation among different asset categories generally limits risk, portfolio management may favor an asset category that underperforms other assets or markets as a whole. Bond investments are subject to interest-rate and credit risks. When interest rates rise, bond prices generally fall. Credit risk refers to the ability of an issuer to make timely payments of principal and interest. Investing in derivatives entails special risks relating to liquidity, leverage and credit that may reduce returns and/or increased volatility. Dividends are not guaranteed. If the dividend-paying stocks held by the fund reduce or stop paying dividends, the fund's ability to generate income may be adversely affected. Because ETFs trade on a securities exchange, their shares may trade at a premium or discount to their net asset value. ETFs also incur fees and expenses so they may not fully match the performance of the indexes they are designed to track. Any fund that focuses in a particular segment of the market will generally be more volatile than a fund that invests more broadly. Investing in foreign securities, particularly those of emerging markets, presents certain risks, such as currency fluctuations, political and economic changes, and market risks. The fund may lend securities to approved institutions. Small company stocks tend to be more volatile than medium-sized or large company stocks. Stocks may decline in value. See the prospectus for details.
DWS Investments is part of Deutsche Bank's Asset Management division and, within the U.S., represents the retail asset management activities of Deutsche Bank AG, Deutsche Bank Trust Company Americas, Deutsche Investment Management Americas Inc. and DWS Trust Company.
NOT FDIC/NCUA INSURED NO BANK GUARANTEE MAY LOSE VALUE NOT A DEPOSIT NOT INSURED BY ANY FEDERAL GOVERNMENT AGENCY
Market Overview and Fund Performance
All performance information below is historical and does not guarantee future results. Returns shown are for Class A shares, unadjusted for sales charges. Investment return and principal fluctuate, so your shares may be worth more or less when redeemed. Current performance may differ from performance data shown. Please visit www.dws-investments.com for the most recent month-end performance of all share classes. Fund performance includes reinvestment of all distributions. Unadjusted returns do not reflect sales charges and would have been lower if they had. Please refer to pages 11 through 13 for more complete performance information.
DWS Global Income Builder Fund returned 9.67% during the annual period ended October 31, 2012. The fund outperformed the 6.78% return of its benchmark, the S&P® Target Risk Moderate Index, as well as the 6.25% average return of the funds in its Morningstar peer group, World Allocation Funds.
The global bond markets also delivered robust performance during the annual period. In the United States, the U.S. Federal Reserve Board (the Fed) maintained stimulative monetary policies and pledged to keep short-term rates near zero through 2015, which contributed to declining yields — and rising prices — for U.S. Treasuries. The 10-year Treasury note closed the annual period at 1.69%, vs. 2.17% a year earlier. The low yields on U.S. Treasuries provided a boost to other segments of the bond market as investors sought the higher income available in the non-Treasury "spread sectors." Mortgage-backed securities and investment-grade corporate bonds produced hearty gains, and both high-yield and emerging-market bonds rewarded investors with double-digit returns.
Global equities also performed very well during the past 12 months ended October 31, 2012. While the shifting outlook for global growth led to periodic volatility in market performance, the environment of healthy corporate earnings, an improving outlook for Europe and the extremely accommodative policies of the world's central banks boosted investor risk appetites and led to strong returns for stocks.
Fund Performance
The current management team took over the fund's management duties on March 1, 2012, so the fund's 12-month performance incorporates the results of two management teams. Since we took over the fund, the portfolio has held a target weighting of 50% stocks and 50% bonds. We will adjust these weightings as opportunities warrant, but we didn't think either asset class exhibited enough value relative to the other to prompt such a shift during the past seven months.
The fixed-income portion of the fund has performed very well since the March 1 changeover. Our ability to invest across the full breadth of the global fixed-income market enabled us to capitalize on the favorable market environment via an underweight position in Treasuries and corresponding overweights in the spread sectors.
The bond portfolio held a weighting of 39% in high-yield bonds as of October 31, 2012. While we hold a cautiously optimistic outlook for high yield given the open-ended nature of the Fed's low-rate policy, we don't see as much value as we did six months ago. We are therefore maintaining higher credit quality in our high-yield portfolio through an emphasis on higher-rated issues. Investment-grade corporate bonds made up 7% of the bond portfolio at the close of the period. While we like the underlying fundamentals and supply-and-demand dynamics in the asset class, yields have fallen so far that corporates are offering fewer value opportunities at this stage. As a result, we have been active in rotating within the asset class in order to take advantage of bonds that we believe offer the most attractive relative value. Our weightings in both investment-grade and high-yield corporates added value during the past six months.
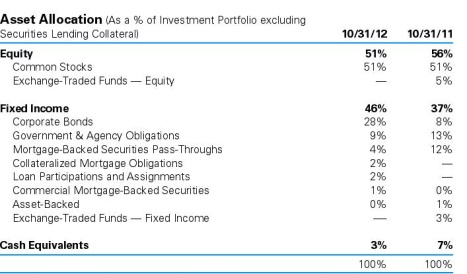
We have invested a portion of the fund in emerging-markets bonds (25% of the bond portfolio as of October 31, 2012). Yields have fallen quite a bit in the past year, but governments and corporations in this market segment both continue to feature strong underlying fundamentals. Most sovereign issuers are now rated investment grade, which indicates that country-specific risks are lower today than in the past. The rise of the corporate bond market in emerging nations has also added depth to the asset class by providing investors with a wider range of options. Overall, our positioning in the emerging markets in general, and emerging-markets corporate bonds in particular, has contributed positively to performance since we took over the fund.
We also hold a position in mortgage-backed securities, which make up 14% of the bond portfolio. We believe the asset class is supported by an improving housing market and the Fed's September announcement that it would be buying mortgage-backed securities as part of its quantitative easing program.
Our developed-market international holdings largely consisted of exposure to the government bonds of Great Britain, Germany and Canada, which reflects our preference for the bonds of larger, lower-risk countries rather than the higher yields of those in smaller, riskier economies. We also established a position in U.S. Treasuries in the latter part of the period as a "hedge" against potential financial-market disruptions stemming from U.S. political headlines or a revival of the European debt crisis.
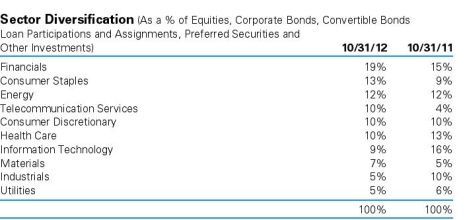
In the equity portion of the fund, our dividend-focused strategy slightly underperformed the broader universe of dividend-paying stocks since March 1, as measured by the 4.72% six-month return of the MSCI World High Dividend Yield Index. The largest factors in the portfolio's modest shortfall were its underweight in the health care sector, which performed very well, and its position in Intel Corp., which is suffering from slowing demand for computer chips as more consumers shift to tablets and smartphones. In addition, our overweight in the underperforming energy sector hurt our relative performance.
On the plus side, our stock selection process worked very well in the financial sector. Our top contributors were the Polish insurance company Powszechny Zaklad Ubezpieczen SA and the U.S.-domiciled insurance company PartnerRe Ltd., which benefited from its ability to push through premium increases. Both companies have delivered solid dividend growth for the past 10 years. In the industrials sector, we generated strong returns through our position in KoninKlijke Philips Electronics NV, which is seeing cost savings from its recent restructuring efforts. Consumer discretionary was also an area of strength for the fund thanks to the strong showing of VF Corp., a clothing designer/manufacturer that is generating strong sales results.
| "We continue to employ both top-down and bottom-up investment strategies to construct a broadly diversified portfolio of income-producing securities." |
Broadly speaking, we have responded to the increased risks in the macroeconomic outlook by running a concentrated portfolio or, in other words, holding a larger weighting in the holdings in which we have the highest level of confidence. We are focusing on companies that offer the most compelling combination of strong fundamentals, attractive valuations and rising dividends.
Prior to the change in the fund's management team (the period from November 1, 2011 through February 2012), the primary factors contributing to the fund's relative performance were the outperformance of its core fixed-income and large-cap growth strategies, while the largest detractors were the shortfalls in its global small-cap core and large-cap value strategies.
Outlook and Positioning
We have a positive view on the outlook for the broader equity market, based on our view that the stimulative policies of the Fed and other world central banks will help fuel continued demand for equities. If this scenario of favorable investor sentiment and rising global markets indeed comes to fruition, we would expect continued underperformance for dividend-paying stocks. However, we believe the longer-term case for dividend-paying stocks remains very compelling given that dividends make up such an important part of equities' total return over time. We believe our opportunistic approach — rather than one that passively seeks out the highest-yielding stocks in the market regardless of their underlying fundamentals — should enable the fund to capitalize on the full long-term benefits of high-dividend stocks.
With respect to the bond market, we expect that the investment backdrop will remain much the same in the months ahead as it has been in the past year. We believe the Fed's low-rate policy should continue to provide support for the non-Treasury spread sectors by fueling demand for higher-yielding investments. At the same time, shifting investor risk appetites — and news flow out of Europe — will inevitably influence short-term market performance. However, we welcome volatility, as it provides us with greater latitude to take advantage of market dislocations through our relative-value style. In addition, we believe our "go anywhere" approach is useful at a time in which global central banks are likely to keep short-term interest rates at ultra low levels.
Going forward, we will continue to employ both top-down and bottom-up investment strategies to construct a broadly diversified portfolio of income-producing securities.
Ten Largest Equity Holdings at October 31, 2012 (16.8% of Net Assets) | |
1. Procter & Gamble Co Manufacturer of diversified consumer products | 2.2% |
2. PepsiCo, Inc. Provider of soft drinks, snack foods and food services | 2.2% |
3. PartnerRe Ltd. Provides multi-line reinsurance to insurance companies | 1.9% |
4. Roche Holding AG Developer of pharmaceutical and chemical products | 1.6% |
5. Novartis AG Manufacturer of pharmaceutical and nutrition products | 1.6% |
6. Rhoen-Klinikum AG Operates general, rehabilitation and emergency health care facilities | 1.6% |
7. Intel Corp. Designer, manufacturer and seller of computer components and related products | 1.5% |
8. Franco-Nevada Corp. Resource royalty and investment company | 1.5% |
9. British American Tobacco PLC Manufactures, markets and sells cigarettes and other tobacco products | 1.4% |
10. Sanofi Manufactures prescription pharmaceuticals | 1.3% |
Portfolio holdings and characteristics are subject to change. | |
Portfolio Management Team
William Chepolis, CFA, Managing Director
Portfolio Manager of the fund. Joined the fund in 2005.
• Joined Deutsche Asset Management in 1998 after 13 years of experience as vice president and portfolio manager for Norwest Bank where he managed the bank's fixed income and foreign exchange portfolios.
• Portfolio Manager for Retail Fixed Income: New York.
• BIS, University of Minnesota.
Thomas Schuessler, PhD., Managing Director
Portfolio Manager of the fund. Joined the fund in 2008.
• Joined Deutsche Asset Management in 2001 after five years at Deutsche Bank where he managed various projects and worked in the office of the Chairman of the Management Board.
• US and Global Fund Management: Frankfurt.
• PhD, University of Heidelberg, studies in physics and economics at University of Heidelberg and University of Utah.
John D. Ryan, Director
Portfolio Manager of the fund. Joined the fund in 2012.
• Joined Deutsche Asset Management in 2010 from Northern Trust where he served as a senior portfolio manager. Previously, he served as a portfolio manager and head of credit trading for Deutsche Asset Management from 1998-2003.
• Over 19 years of investment industry experience.
• BA in Economics, University of Chicago; MBA, University of Chicago.
Fabian Degen, Assistant Vice President
Portfolio Manager of the fund. Joined the fund in 2012.
• Joined Deutsche Asset Management in 2007.
• Portfolio manager for Value Equity: Frankfurt.
• US and Global Fund Management: Frankfurt.
• Bachelor of International Business Administration in Investments & Finance from International University of Applied Sciences Bad Honnef, Bonn with educational exchanges at the University of Maine (USA).
The views expressed reflect those of the portfolio management team only through the end of the period of the report as stated on the cover. The management team's views are subject to change at any time based on market and other conditions and should not be construed as a recommendation. Past performance is no guarantee of future results. Current and future portfolio holdings are subject to risk.
Terms to Know
The S&P Target Risk Moderate Index provides significant exposure to fixed income, while also providing increased opportunity for capital growth through equities. Index returns do not reflect any fees or expenses and it is not possible to invest directly into an index.
The Morningstar World Allocation Funds category represents portfolios that seek to provide both capital appreciation and income by investing in three major areas: stocks, bonds and cash. While these portfolios do explore the whole world, most of them focus on the U.S., Canada, Japan and the larger markets in Europe. It is rare for such portfolios to invest more than 10% of their assets in emerging markets. These portfolios typically have at least 10% of assets in bonds, less than 70% of assets in stocks, and at least 40% of assets in non-U.S. stocks or bonds.
Mortgage-backed securities (MBS) are bonds that are secured by mortgage debt.
"Underweight" means the fund holds a lower weighting in a given sector or security than the benchmark. "Overweight" means the fund holds a higher weighting.
Spread sectors include all non-U.S. Treasury investment-grade sectors, including federal agency securities, corporate bonds, asset-backed securities, mortgage-backed securities and commercial mortgage-backed securities.
The MSCI World High Dividend Yield Index includes securities that offer a meaningfully higher-than-average dividend yields relative to the MSCI World Index and pass dividend sustainability and persistence screens. Index returns do not reflect any fees or expenses and it is not possible to invest directly into an index.
Average Annual Total Returns as of 10/31/12 | ||||||||||||||||||||
| Unadjusted for Sales Charge | 1-Year | 3-Year | 5-Year | 10-Year | ||||||||||||||||
| Class A | 9.67 | % | 7.99 | % | 0.93 | % | 4.65 | % | ||||||||||||
| Class B | 8.70 | % | 6.91 | % | 0.17 | % | 3.96 | % | ||||||||||||
| Class C | 8.90 | % | 7.09 | % | 0.12 | % | 3.78 | % | ||||||||||||
Russell 1000® Index† | 14.97 | % | 13.48 | % | 0.53 | % | 7.31 | % | ||||||||||||
Barclays U.S. Aggregate Bond Index†† | 5.25 | % | 6.08 | % | 6.38 | % | 5.39 | % | ||||||||||||
S&P® Target Risk Moderate Index††† | 6.78 | % | 6.90 | % | 1.61 | % | 5.88 | % | ||||||||||||
| Adjusted for the Maximum Sales Charge | ||||||||||||||||||||
Class A (max 5.75% load) | 3.37 | % | 5.88 | % | -0.26 | % | 4.03 | % | ||||||||||||
Class B (max 4.00% CDSC) | 5.70 | % | 6.33 | % | -0.01 | % | 3.96 | % | ||||||||||||
Class C (max 1.00% CDSC) | 8.90 | % | 7.09 | % | 0.12 | % | 3.78 | % | ||||||||||||
Russell 1000® Index† | 14.97 | % | 13.48 | % | 0.53 | % | 7.31 | % | ||||||||||||
Barclays U.S. Aggregate Bond Index†† | 5.25 | % | 6.08 | % | 6.38 | % | 5.39 | % | ||||||||||||
S&P® Target Risk Moderate Index††† | 6.78 | % | 6.90 | % | 1.61 | % | 5.88 | % | ||||||||||||
| No Sales Charges | Life of Class S* | |||||||||||||||||||
| Class S | 9.90 | % | 8.22 | % | 1.14 | % | N/A | 3.55 | % | |||||||||||
| Institutional Class | 10.02 | % | 8.32 | % | 1.24 | % | 4.98 | % | N/A | |||||||||||
Russell 1000® Index† | 14.97 | % | 13.48 | % | 0.53 | % | 7.31 | % | 4.81 | % | ||||||||||
Barclays U.S. Aggregate Bond Index†† | 5.25 | % | 6.08 | % | 6.38 | % | 5.39 | % | 5.80 | % | ||||||||||
S&P® Target Risk Moderate Index††† | 6.78 | % | 6.90 | % | 1.61 | % | 5.88 | % | 4.49 | % | ||||||||||
* Class S shares commenced operations on March 14, 2005. The performance shown for each index is for the time period of March 31, 2005 through October 31, 2012, which is based on the performance period of the life of Class S.
Prior to March 1, 2012, this Fund was known as DWS Balanced Fund. The Fund's investment objective, strategy, risks and management team also changed at that time.
Performance in the Average Annual Total Returns table(s) above and the Growth of an Assumed $10,000 Investment line graph that follows is historical and does not guarantee future results. Investment return and principal fluctuate, so your shares may be worth more or less when redeemed. Current performance may differ from performance data shown. Please visit www.dws-investments.com for the Fund's most recent month-end performance. Fund performance includes reinvestment of all distributions. Unadjusted returns do not reflect sales charges and would have been lower if they had.
The gross expense ratios of the Fund, as stated in the fee table of the prospectus dated March 1, 2012 are 0.96%, 1.92%, 1.78%, 0.76% and 0.64% for Class A, Class B, Class C, Class S and Institutional Class shares, respectively, and may differ from the expense ratios disclosed in the Financial Highlights tables in this report.
Index returns do not reflect any fees or expenses and it is not possible to invest directly into an index.
Performance figures do not reflect the deduction of taxes that a shareholder would pay on fund distributions or the redemption of fund shares.
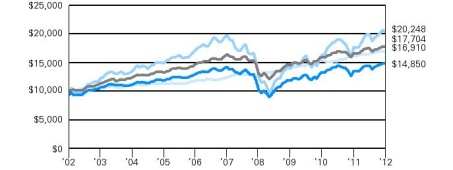
Growth of an Assumed $10,000 Investment (Adjusted for Maximum Sales Charge) |
 |
 |
| Yearly periods ended October 31 |
The Fund's growth of an assumed $10,000 investment is adjusted for the maximum sales charge of 5.75%. This results in a net initial investment of $9,425.
The growth of $10,000 is cumulative.
Performance of other share classes will vary based on the sales charges and the fee structure of those classes.
† The Russell 1000 Index is an unmanaged index that measures the performance of the 1,000 largest companies in the Russell 3000 Index, which represents approximately 92% of the total market capitalization of the Russell 3000 Index.
†† The Barclays U.S. Aggregate Bond Index is an unmanaged, market-value-weighted measure of Treasury issues, corporate bond issues and mortgage securities.
††† The S&P Target Risk Moderate Index is designed to measure the performance of S&P's proprietary moderate target risk allocation model. The S&P Target Risk Moderate Index seeks to provide significant exposure to fixed income, while also allocating a smaller portion of exposure to equities in order to seek current income, some capital preservation, and an opportunity for moderate to low capital appreciation.
| Net Asset Value and Distribution Information | ||||||||||||||||||||
| Class A | Class B | Class C | Class S | Institutional Class | ||||||||||||||||
Net Asset Value: 10/31/12 | $ | 9.56 | $ | 9.57 | $ | 9.55 | $ | 9.56 | $ | 9.56 | ||||||||||
| 10/31/11 | $ | 8.91 | $ | 8.91 | $ | 8.89 | $ | 8.91 | $ | 8.91 | ||||||||||
Distribution Information: Twelve Months as of 10/31/12: Income Dividends | $ | .20 | $ | .11 | $ | .13 | $ | .22 | $ | .23 | ||||||||||
Morningstar Rankings — World Allocation Funds Category as of 10/31/12 | ||||
| Period | Rank | Number of Fund Classes Tracked | Percentile Ranking (%) | |
Class A 1-Year | 93 | of | 465 | 20 |
| 3-Year | 91 | of | 259 | 35 |
| 5-Year | 80 | of | 175 | 45 |
| 10-Year | 80 | of | 83 | 96 |
Class B 1-Year | 149 | of | 465 | 32 |
| 3-Year | 158 | of | 259 | 61 |
| 5-Year | 96 | of | 175 | 55 |
| 10-Year | 82 | of | 83 | 98 |
Class C 1-Year | 132 | of | 465 | 29 |
| 3-Year | 148 | of | 259 | 57 |
| 5-Year | 101 | of | 175 | 57 |
| 10-Year | 83 | of | 83 | 100 |
Class S 1-Year | 74 | of | 465 | 16 |
| 3-Year | 80 | of | 259 | 31 |
| 5-Year | 77 | of | 175 | 44 |
Institutional Class 1-Year | 67 | of | 465 | 15 |
| 3-Year | 76 | of | 259 | 29 |
| 5-Year | 73 | of | 175 | 41 |
| 10-Year | 79 | of | 83 | 95 |
Source: Morningstar, Inc. Rankings are historical and do not guarantee future results. Rankings are based on total return unadjusted for sales charges with distributions reinvested. If sales charges had been included, rankings might have been less favorable.
| Shares | Value ($) | |||||||
| Common Stocks 53.3% | ||||||||
| Consumer Discretionary 3.9% | ||||||||
| Distributors 0.7% | ||||||||
| Genuine Parts Co. (a) | 104,560 | 6,543,365 | ||||||
| Hotels, Restaurants & Leisure 0.0% | ||||||||
| Trump Entertainment Resorts, Inc.* | 8 | 0 | ||||||
| Media 2.2% | ||||||||
| Pearson PLC | 548,076 | 11,011,492 | ||||||
| Postmedia Network Canada Corp.* | 1,872 | 3,748 | ||||||
| Vertis Holdings, Inc.* | 345 | 0 | ||||||
| Wolters Kluwer NV | 552,598 | 10,693,606 | ||||||
| 21,708,846 | ||||||||
| Specialty Retail 0.5% | ||||||||
| Staples, Inc. (a) | 478,274 | 5,507,325 | ||||||
| Textiles, Apparel & Luxury Goods 0.5% | ||||||||
| VF Corp. | 35,091 | 5,491,040 | ||||||
| Consumer Staples 9.8% | ||||||||
| Beverages 2.1% | ||||||||
| PepsiCo, Inc. | 314,671 | 21,787,820 | ||||||
| Food & Staples Retailing 0.3% | ||||||||
| Metcash Ltd. | 742,277 | 2,820,105 | ||||||
| Food Products 1.9% | ||||||||
| Nestle SA (Registered) | 144,271 | 9,155,392 | ||||||
| Unilever NV (CVA) | 263,653 | 9,681,315 | ||||||
| 18,836,707 | ||||||||
| Household Products 2.2% | ||||||||
| Procter & Gamble Co. | 320,401 | 22,184,565 | ||||||
| Tobacco 3.3% | ||||||||
| Altria Group, Inc. | 345,136 | 10,975,325 | ||||||
| British American Tobacco PLC | 280,892 | 13,913,713 | ||||||
| Imperial Tobacco Group PLC | 214,880 | 8,114,240 | ||||||
| 33,003,278 | ||||||||
| Energy 6.8% | ||||||||
| Energy Equipment & Services 1.8% | ||||||||
| Transocean Ltd. | 234,002 | 10,691,551 | ||||||
| WorleyParsons Ltd. | 280,207 | 7,175,733 | ||||||
| 17,867,284 | ||||||||
| Oil, Gas & Consumable Fuels 5.0% | ||||||||
| Canadian Natural Resources Ltd. (b) | 87,791 | 2,651,288 | ||||||
| Canadian Natural Resources Ltd. (b) | 222,000 | 6,690,563 | ||||||
| ConocoPhillips (a) | 213,992 | 12,379,438 | ||||||
| Enbridge, Inc. (a) | 235,072 | 9,353,453 | ||||||
| Phillips 66 | 181,645 | 8,566,378 | ||||||
| TransCanada Corp. (a) | 235,819 | 10,618,053 | ||||||
| 50,259,173 | ||||||||
| Financials 5.4% | ||||||||
| Commercial Banks 1.6% | ||||||||
| Bank of Nova Scotia (a) | 157,869 | 8,575,112 | ||||||
| Toronto-Dominion Bank (a) | 97,587 | 7,936,913 | ||||||
| 16,512,025 | ||||||||
| Insurance 3.8% | ||||||||
| PartnerRe Ltd. | 240,229 | 19,458,549 | ||||||
| Powszechny Zaklad Ubezpieczen SA | 63,872 | 7,462,220 | ||||||
| Sampo Oyj "A" | 365,752 | 11,462,994 | ||||||
| 38,383,763 | ||||||||
| Health Care 6.1% | ||||||||
| Health Care Providers & Services 1.6% | ||||||||
| Rhoen-Klinikum AG | 815,942 | 15,911,332 | ||||||
| Pharmaceuticals 4.5% | ||||||||
| Novartis AG (Registered) | 265,117 | 15,955,984 | ||||||
| Roche Holding AG (Genusschein) | 85,838 | 16,507,662 | ||||||
| Sanofi | 151,491 | 13,316,794 | ||||||
| 45,780,440 | ||||||||
| Industrials 4.2% | ||||||||
| Aerospace & Defense 0.6% | ||||||||
| BAE Systems PLC | 1,249,236 | 6,293,807 | ||||||
| Air Freight & Logistics 0.6% | ||||||||
| Singapore Post Ltd. | 6,172,000 | 5,768,224 | ||||||
| Building Products 0.0% | ||||||||
| Congoleum Corp.* | 11,440 | 0 | ||||||
| Commercial Services & Supplies 0.0% | ||||||||
| Quad Graphics, Inc. | 15 | 275 | ||||||
| Industrial Conglomerates 2.1% | ||||||||
| Koninklijke Philips Electronics NV | 497,883 | 12,448,430 | ||||||
| Smiths Group PLC | 497,057 | 8,470,444 | ||||||
| 20,918,874 | ||||||||
| Road & Rail 0.9% | ||||||||
| Canadian National Railway Co. (a) | 104,313 | 9,007,212 | ||||||
| Information Technology 5.0% | ||||||||
| Computers & Peripherals 1.7% | ||||||||
| Diebold, Inc. | 291,000 | 8,657,250 | ||||||
| Wincor Nixdorf AG (a) | 198,996 | 8,849,528 | ||||||
| 17,506,778 | ||||||||
| IT Services 0.6% | ||||||||
| Automatic Data Processing, Inc. (a) | 110,973 | 6,413,130 | ||||||
| Semiconductors & Semiconductor Equipment 2.7% | ||||||||
| Intel Corp. | 714,469 | 15,450,392 | ||||||
| Taiwan Semiconductor Manufacturing Co., Ltd. (ADR) (a) | 700,194 | 11,133,085 | ||||||
| 26,583,477 | ||||||||
| Software 0.0% | ||||||||
| Microsoft Corp. | 36 | 1,027 | ||||||
| Materials 4.5% | ||||||||
| Chemicals 1.9% | ||||||||
| Air Liquide SA | 75,306 | 8,882,312 | ||||||
| Air Products & Chemicals, Inc. | 128,141 | 9,934,772 | ||||||
| 18,817,084 | ||||||||
| Construction Materials 0.0% | ||||||||
| Wolverine Tube, Inc.* | 1,235 | 29,825 | ||||||
| Containers & Packaging 1.1% | ||||||||
| Sealed Air Corp. (a) | 390,544 | 6,334,624 | ||||||
| Sonoco Products Co. | 167,722 | 5,221,186 | ||||||
| 11,555,810 | ||||||||
| Metals & Mining 1.5% | ||||||||
| Franco-Nevada Corp. (a) | 262,133 | 15,094,136 | ||||||
| Telecommunication Services 4.5% | ||||||||
| Diversified Telecommunication Services 2.9% | ||||||||
| AT&T, Inc. | 175,503 | 6,070,649 | ||||||
| Belgacom SA | 262,123 | 7,661,375 | ||||||
| Chunghwa Telecom Co., Ltd. (ADR) (a) | 136,127 | 4,230,827 | ||||||
| Telus Corp. | 170,751 | 11,085,352 | ||||||
| 29,048,203 | ||||||||
| Wireless Telecommunication Services 1.6% | ||||||||
| NTT DoCoMo, Inc. | 6,424 | 9,439,248 | ||||||
| Vodafone Group PLC | 2,425,083 | 6,584,423 | ||||||
| 16,023,671 | ||||||||
| Utilities 3.1% | ||||||||
| Electric Utilities 1.1% | ||||||||
| Exelon Corp. | 146,786 | 5,252,003 | ||||||
| FirstEnergy Corp. | 143,898 | 6,579,017 | ||||||
| 11,831,020 | ||||||||
| Gas Utilities 1.1% | ||||||||
| UGI Corp. | 336,319 | 10,859,741 | ||||||
| Multi-Utilities 0.9% | ||||||||
| National Grid PLC | 774,483 | 8,829,987 | ||||||
Total Common Stocks (Cost $519,619,643) | 537,179,349 | |||||||
| Preferred Stock 0.0% | ||||||||
| Financials | ||||||||
| Ally Financial, Inc. 144A, 7.0% (Cost $182,781) | 195 | 187,919 | ||||||
| Warrants 0.0% | ||||||||
| Consumer Discretionary 0.0% | ||||||||
| Reader's Digest Association, Inc., Expiration Date 2/19/2014* | 207 | 35 | ||||||
| Materials 0.0% | ||||||||
| GEO Specialty Chemicals, Inc., Expiration Date 3/31/2015* | 57,540 | 21,060 | ||||||
| Hercules Trust II, Expiration Date 3/31/2029* | 506 | 5,586 | ||||||
| 26,646 | ||||||||
Total Warrants (Cost $90,210) | 26,681 | |||||||
| Principal Amount ($)(c) | Value ($) | ||||||||
| Corporate Bonds 29.5% | |||||||||
| Consumer Discretionary 3.4% | |||||||||
| AMC Entertainment, Inc., 8.75%, 6/1/2019 | 520,000 | 574,600 | |||||||
| Asbury Automotive Group, Inc., 7.625%, 3/15/2017 | 105,000 | 108,544 | |||||||
| Avis Budget Car Rental LLC, 8.25%, 1/15/2019 | 65,000 | 70,931 | |||||||
| Block Communications, Inc., 144A, 7.25%, 2/1/2020 | 70,000 | 74,375 | |||||||
| Cablevision Systems Corp., 8.625%, 9/15/2017 (a) | 1,000,000 | 1,167,500 | |||||||
| Caesar's Entertainment Operating Co., Inc.: | |||||||||
| 144A, 8.5%, 2/15/2020 | 2,630,000 | 2,583,975 | |||||||
| 10.0%, 12/15/2018 | 55,000 | 34,375 | |||||||
| 11.25%, 6/1/2017 | 230,000 | 248,975 | |||||||
| Carlson Wagonlit BV, 144A, 6.875%, 6/15/2019 | 250,000 | 261,250 | |||||||
| CCO Holdings LLC: | |||||||||
| 5.25%, 9/30/2022 | 1,330,000 | 1,336,650 | |||||||
| 6.5%, 4/30/2021 (a) | 780,000 | 828,750 | |||||||
| 6.625%, 1/31/2022 | 360,000 | 390,600 | |||||||
| 7.375%, 6/1/2020 | 3,610,000 | 4,043,200 | |||||||
| CDR DB Sub, Inc., 144A, 7.75%, 10/15/2020 | 225,000 | 221,906 | |||||||
| Cequel Communications Holdings I LLC, 144A, 8.625%, 11/15/2017 | 2,840,000 | 3,038,800 | |||||||
| Chester Downs & Marina LLC, 144A, 9.25%, 2/1/2020 | 25,000 | 24,875 | |||||||
| Clear Channel Worldwide Holdings, Inc.: | |||||||||
| Series A, 7.625%, 3/15/2020 | 20,000 | 18,850 | |||||||
| Series B, 7.625%, 3/15/2020 | 1,190,000 | 1,133,475 | |||||||
| Series A, 9.25%, 12/15/2017 | 15,000 | 16,088 | |||||||
| Series B, 9.25%, 12/15/2017 | 245,000 | 262,762 | |||||||
| Cumulus Media Holdings, Inc., 7.75%, 5/1/2019 (a) | 585,000 | 571,837 | |||||||
| DineEquity, Inc., 9.5%, 10/30/2018 | 30,000 | 33,788 | |||||||
| DISH DBS Corp.: | |||||||||
| 6.625%, 10/1/2014 | 130,000 | 141,050 | |||||||
| 7.125%, 2/1/2016 | 95,000 | 106,163 | |||||||
| 7.875%, 9/1/2019 | 1,120,000 | 1,313,200 | |||||||
| Fontainebleau Las Vegas Holdings LLC, 144A, 11.0%, 6/15/2015* | 100,000 | 63 | |||||||
| Globo Comunicacao e Participacoes SA, 144A, 4.875%, 4/11/2022 (a) | 2,000,000 | 2,195,000 | |||||||
| Griffey Intermediate, Inc., 144A, 7.0%, 10/15/2020 | 390,000 | 395,850 | |||||||
| Harron Communications LP, 144A, 9.125%, 4/1/2020 | 120,000 | 129,600 | |||||||
| Hertz Corp.: | |||||||||
| 6.75%, 4/15/2019 (a) | 1,230,000 | 1,305,337 | |||||||
| 144A, 6.75%, 4/15/2019 | 35,000 | 37,144 | |||||||
| Jo-Ann Stores Holdings, Inc., 144A, 9.75%, 10/15/2019 (PIK) | 220,000 | 216,425 | |||||||
| Libbey Glass, Inc., 144A, 6.875%, 5/15/2020 | 150,000 | 159,750 | |||||||
| Mediacom Broadband LLC, 144A, 6.375%, 4/1/2023 | 145,000 | 146,088 | |||||||
| Mediacom LLC: | |||||||||
| 7.25%, 2/15/2022 | 20,000 | 21,450 | |||||||
| 9.125%, 8/15/2019 | 1,475,000 | 1,633,562 | |||||||
| MGM Resorts International: | |||||||||
| 144A, 6.75%, 10/1/2020 | 160,000 | 158,800 | |||||||
| 7.625%, 1/15/2017 | 1,530,000 | 1,610,325 | |||||||
| 144A, 8.625%, 2/1/2019 | 145,000 | 156,781 | |||||||
| 10.375%, 5/15/2014 | 65,000 | 73,044 | |||||||
| 11.125%, 11/15/2017 | 85,000 | 93,713 | |||||||
| National CineMedia LLC, 144A, 6.0%, 4/15/2022 | 115,000 | 121,325 | |||||||
| Penske Automotive Group, Inc., 144A, 5.75%, 10/1/2022 | 290,000 | 295,437 | |||||||
| Petco Holdings, Inc., 144A, 8.5%, 10/15/2017 (PIK) | 110,000 | 110,413 | |||||||
| Quebecor Media, Inc., 144A, 5.75%, 1/15/2023 | 200,000 | 204,000 | |||||||
| Sabre Holdings Corp., 8.35%, 3/15/2016 | 20,000 | 20,450 | |||||||
| Servicios Corporativos Javer SAPI de CV, 144A, 9.875%, 4/6/2021 (a) | 900,000 | 918,000 | |||||||
| Sirius XM Radio, Inc., 144A, 5.25%, 8/15/2022 | 95,000 | 95,000 | |||||||
| Sonic Automotive, Inc., 144A, 7.0%, 7/15/2022 | 125,000 | 133,906 | |||||||
| Sotheby's, 144A, 5.25%, 10/1/2022 | 190,000 | 192,850 | |||||||
| Travelport LLC, 5.043%**, 9/1/2014 | 70,000 | 50,925 | |||||||
| Unitymedia Hessen GmbH & Co., KG, 144A, 8.125%, 12/1/2017 | 1,345,000 | 1,452,600 | |||||||
| Unitymedia KabelBW GmbH, 144A, 9.625%, 12/1/2019 | EUR | 530,000 | 765,959 | ||||||
| Univision Communications, Inc., 144A, 6.875%, 5/15/2019 | 100,000 | 102,250 | |||||||
| UPC Holding BV, 144A, 9.75%, 4/15/2018 | EUR | 1,145,000 | 1,580,557 | ||||||
| Viking Cruises Ltd., 144A, 8.5%, 10/15/2022 | 195,000 | 201,337 | |||||||
| Whirlpool Corp., 4.7%, 6/1/2022 | 675,000 | 720,780 | |||||||
| Wolverine World Wide, Inc., 144A, 6.125%, 10/15/2020 | 130,000 | 135,363 | |||||||
| 34,040,603 | |||||||||
| Consumer Staples 0.9% | |||||||||
| Anadolu Efes Biracilik Ve Malt Sanayii AS, 144A, 3.375%, 11/1/2022 | 2,000,000 | 1,940,000 | |||||||
| ConAgra Foods, Inc., 3.25%, 9/15/2022 | 580,000 | 592,981 | |||||||
| Constellation Brands, Inc., 6.0%, 5/1/2022 | 40,000 | 45,400 | |||||||
| Del Monte Corp., 7.625%, 2/15/2019 (a) | 455,000 | 467,512 | |||||||
| Delhaize Group SA, 4.125%, 4/10/2019 (a) | 715,000 | 727,477 | |||||||
| Dole Food Co., Inc., 144A, 8.0%, 10/1/2016 | 110,000 | 114,813 | |||||||
| JBS U.S.A. LLC, 144A, 8.25%, 2/1/2020 (a) | 2,040,000 | 2,106,300 | |||||||
| Minerva Luxembourg SA, 144A, 12.25%, 2/10/2022 | 500,000 | 595,000 | |||||||
| Pilgrim's Pride Corp., 7.875%, 12/15/2018 | 2,046,000 | 2,015,310 | |||||||
| Rite Aid Corp., 9.25%, 3/15/2020 | 110,000 | 112,475 | |||||||
| Smithfield Foods, Inc.: | |||||||||
| 6.625%, 8/15/2022 | 305,000 | 319,487 | |||||||
| 7.75%, 7/1/2017 | 95,000 | 107,350 | |||||||
| TreeHouse Foods, Inc., 7.75%, 3/1/2018 | 20,000 | 21,900 | |||||||
| 9,166,005 | |||||||||
| Energy 3.3% | |||||||||
| Access Midstream Partners LP, 6.125%, 7/15/2022 | 60,000 | 63,450 | |||||||
| BreitBurn Energy Partners LP: | |||||||||
| 144A, 7.875%, 4/15/2022 | 190,000 | 196,650 | |||||||
| 8.625%, 10/15/2020 | 15,000 | 16,238 | |||||||
| Cenovus Energy, Inc., 3.0%, 8/15/2022 | 840,000 | 869,856 | |||||||
| CONSOL Energy, Inc., 8.0%, 4/1/2017 | 385,000 | 407,137 | |||||||
| Continental Resources, Inc., 144A, 5.0%, 9/15/2022 | 165,000 | 174,075 | |||||||
| Crosstex Energy LP, 144A, 7.125%, 6/1/2022 | 120,000 | 120,600 | |||||||
| DCP Midstream LLC, 144A, 9.75%, 3/15/2019 | 850,000 | 1,111,651 | |||||||
| Eagle Rock Energy Partners LP, 8.375%, 6/1/2019 | 605,000 | 603,487 | |||||||
| Encana Corp., 5.15%, 11/15/2041 | 190,000 | 208,134 | |||||||
| Enterprise Products Operating LLC, 6.125%, 10/15/2039 | 860,000 | 1,087,338 | |||||||
| EP Energy LLC: | |||||||||
| 144A, 6.875%, 5/1/2019 | 145,000 | 156,600 | |||||||
| 144A, 7.75%, 9/1/2022 | 165,000 | 170,775 | |||||||
| 144A, 9.375%, 5/1/2020 | 65,000 | 71,825 | |||||||
| EV Energy Partners LP, 8.0%, 4/15/2019 | 910,000 | 957,775 | |||||||
| FMC Technologies, Inc., 3.45%, 10/1/2022 | 500,000 | 515,093 | |||||||
| Halcon Resources Corp., 144A, 9.75%, 7/15/2020 | 300,000 | 316,500 | |||||||
| Holly Energy Partners LP, 144A, 6.5%, 3/1/2020 | 20,000 | 21,000 | |||||||
| IPIC GMTN Ltd., 144A, 5.5%, 3/1/2022 | 2,000,000 | 2,305,000 | |||||||
| Linn Energy LLC: | |||||||||
| 144A, 6.25%, 11/1/2019 | 2,690,000 | 2,690,000 | |||||||
| 6.5%, 5/15/2019 | 155,000 | 156,163 | |||||||
| MarkWest Energy Partners LP, 5.5%, 2/15/2023 | 240,000 | 252,000 | |||||||
| MEG Energy Corp., 144A, 6.375%, 1/30/2023 | 490,000 | 524,300 | |||||||
| Midstates Petroleum Co., Inc., 144A, 10.75%, 10/1/2020 | 215,000 | 227,900 | |||||||
| Northern Oil & Gas, Inc., 8.0%, 6/1/2020 | 630,000 | 652,050 | |||||||
| Oasis Petroleum, Inc., 7.25%, 2/1/2019 | 315,000 | 337,050 | |||||||
| Offshore Group Investment Ltd., 144A, 7.5%, 11/1/2019 | 555,000 | 546,675 | |||||||
| Offshore Group Investments Ltd., 11.5%, 8/1/2015 | 10,000 | 10,988 | |||||||
| OGX Austria GmbH, 144A, 8.375%, 4/1/2022 | 1,700,000 | 1,428,000 | |||||||
| ONEOK Partners LP, 6.15%, 10/1/2016 | 804,000 | 948,140 | |||||||
| Pertamina Persero PT, 144A, 4.875%, 5/3/2022 | 3,000,000 | 3,262,500 | |||||||
| Petroleos de Venezuela SA: | |||||||||
| 144A, 8.5%, 11/2/2017 (a) | 1,500,000 | 1,346,250 | |||||||
| 144A, 9.75%, 5/17/2035 | 3,000,000 | 2,452,500 | |||||||
| Petroleos Mexicanos, 144A, 5.5%, 6/27/2044 | 2,500,000 | 2,725,000 | |||||||
| Plains Exploration & Production Co.: | |||||||||
| 6.125%, 6/15/2019 | 140,000 | 139,650 | |||||||
| 6.75%, 2/1/2022 | 170,000 | 170,850 | |||||||
| 6.875%, 2/15/2023 | 485,000 | 484,394 | |||||||
| Quicksilver Resources, Inc., 11.75%, 1/1/2016 | 1,360,000 | 1,400,800 | |||||||
| Reliance Holdings U.S.A., Inc., 144A, 5.4%, 2/14/2022 | 1,000,000 | 1,111,957 | |||||||
| SandRidge Energy, Inc., 7.5%, 3/15/2021 | 320,000 | 332,800 | |||||||
| SESI LLC, 7.125%, 12/15/2021 | 120,000 | 133,800 | |||||||
| Shelf Drilling Holdings Ltd., 144A, 8.625%, 11/1/2018 | 275,000 | 276,375 | |||||||
| Swift Energy Co.: | |||||||||
| 7.875%, 3/1/2022 | 75,000 | 78,000 | |||||||
| 144A, 7.875%, 3/1/2022 | 250,000 | 260,000 | |||||||
| Tesoro Corp.: | |||||||||
| 4.25%, 10/1/2017 | 205,000 | 212,687 | |||||||
| 5.375%, 10/1/2022 | 140,000 | 145,950 | |||||||
| Transocean, Inc., 3.8%, 10/15/2022 | 920,000 | 940,927 | |||||||
| Weatherford International Ltd., 4.5%, 4/15/2022 | 480,000 | 511,016 | |||||||
| 33,131,906 | |||||||||
| Financials 9.3% | |||||||||
| AerCap Aviation Solutions BV, 6.375%, 5/30/2017 (a) | 545,000 | 564,075 | |||||||
| Akbank TAS, 144A, 5.0%, 10/24/2022 | 1,000,000 | 1,016,950 | |||||||
| Ally Financial, Inc.: | |||||||||
| 5.5%, 2/15/2017 | 65,000 | 68,781 | |||||||
| 6.25%, 12/1/2017 | 2,450,000 | 2,690,698 | |||||||
| Alphabet Holding Co., Inc., 144A, 7.75%, 11/1/2017 (PIK) | 195,000 | 196,706 | |||||||
| American International Group, Inc., 3.8%, 3/22/2017 | 1,180,000 | 1,273,016 | |||||||
| AmeriGas Finance LLC: | |||||||||
| 6.75%, 5/20/2020 | 20,000 | 21,500 | |||||||
| 7.0%, 5/20/2022 | 20,000 | 21,725 | |||||||
| Anglo American Capital PLC, 144A, 4.125%, 9/27/2022 (a) | 1,000,000 | 1,019,445 | |||||||
| Antero Resources Finance Corp., 9.375%, 12/1/2017 | 20,000 | 22,050 | |||||||
| Banco do Brasil SA, 144A, 5.875%, 1/26/2022 | 1,000,000 | 1,085,000 | |||||||
| Banco Latinoamericano de Comercio Exterior SA, 144A, 3.75%, 4/4/2017 | 2,000,000 | 2,070,000 | |||||||
| Bancolombia SA, 5.125%, 9/11/2022 | 1,000,000 | 1,045,000 | |||||||
| Bangkok Bank PCL, 144A, 3.875%, 9/27/2022 | 1,000,000 | 1,015,522 | |||||||
| Bank of Ireland Mortgage Bank, 4.0%, 7/5/2013 | EUR | 3,300,000 | 4,308,303 | ||||||
| BBVA Bancomer SA, 144A, 6.75%, 9/30/2022 | 2,500,000 | 2,831,250 | |||||||
| BNP Paribas SA, 2.375%, 9/14/2017 | 985,000 | 992,220 | |||||||
| BOE Merger Corp., 144A, 9.5%, 11/1/2017 (PIK) | 385,000 | 385,000 | |||||||
| Braskem America Finance Co., 144A, 7.125%, 7/22/2041 (a) | 2,000,000 | 2,250,000 | |||||||
| Calpine Construction Finance Co., LP, 144A, 8.0%, 6/1/2016 | 105,000 | 112,088 | |||||||
| Cequel Communications Escrow 1 LLC, 144A, 6.375%, 9/15/2020 | 140,000 | 141,750 | |||||||
| CIT Group, Inc.: | |||||||||
| 5.0%, 5/15/2017 | 170,000 | 179,146 | |||||||
| 5.25%, 3/15/2018 | 4,528,000 | 4,811,000 | |||||||
| Development Bank of Kazakhstan JSC, 6.5%, 6/3/2020 | 1,000,000 | 1,100,000 | |||||||
DuPont Fabros Technology LP, (REIT), 8.5%, 12/15/2017 | 60,000 | 66,000 | |||||||
| E*TRADE Financial Corp., 6.75%, 6/1/2016 | 1,700,000 | 1,806,250 | |||||||
| European Investment Bank, 6.125%, 1/23/2017 | AUD | 4,500,000 | 5,085,407 | ||||||
| Export Credit Bank of Turkey: | |||||||||
| 144A, 5.375%, 11/4/2016 | 1,000,000 | 1,068,150 | |||||||
| 144A, 5.875%, 4/24/2019 (a) | 1,000,000 | 1,094,000 | |||||||
| Fibria Overseas Finance Ltd., 144A, 6.75%, 3/3/2021 (a) | 1,350,000 | 1,491,750 | |||||||
| Ford Motor Credit Co., LLC: | |||||||||
| 3.0%, 6/12/2017 | 645,000 | 659,636 | |||||||
| 4.25%, 9/20/2022 (a) | 410,000 | 424,856 | |||||||
| 5.875%, 8/2/2021 | 1,000,000 | 1,151,403 | |||||||
| 8.125%, 1/15/2020 | 2,415,000 | 3,069,339 | |||||||
| Fresenius Medical Care U.S. Finance II, Inc.: | |||||||||
| 144A, 5.625%, 7/31/2019 | 35,000 | 36,838 | |||||||
| 144A, 5.875%, 1/31/2022 | 30,000 | 31,913 | |||||||
| Fresenius Medical Care U.S. Finance, Inc., 144A, 6.5%, 9/15/2018 | 20,000 | 22,400 | |||||||
| General Electric Capital Corp., 2.9%, 1/9/2017 | 1,000,000 | 1,058,771 | |||||||
| Grupo Aval Ltd., 144A, 4.75%, 9/26/2022 | 1,500,000 | 1,500,000 | |||||||
| Hartford Financial Services Group, Inc., 6.0%, 1/15/2019 | 500,000 | 587,716 | |||||||
| Hexion U.S. Finance Corp., 8.875%, 2/1/2018 | 2,580,000 | 2,605,800 | |||||||
| ING Bank NV, 144A, 2.0%, 9/25/2015 | 1,000,000 | 1,008,133 | |||||||
| International Lease Finance Corp.: | |||||||||
| 6.25%, 5/15/2019 | 300,000 | 323,325 | |||||||
| 8.625%, 1/15/2022 | 50,000 | 60,438 | |||||||
| 8.75%, 3/15/2017 | 1,740,000 | 2,031,711 | |||||||
| Itau Unibanco Holding SA: | |||||||||
| 144A, 5.5%, 8/6/2022 | 500,000 | 525,000 | |||||||
| 144A, 5.65%, 3/19/2022 (a) | 1,000,000 | 1,057,500 | |||||||
| Kazakhstan Temir Zholy Finance BV, 144A, 6.95%, 7/10/2042 | 1,000,000 | 1,220,540 | |||||||
| Level 3 Financing, Inc.: | |||||||||
| 144A, 7.0%, 6/1/2020 | 725,000 | 737,687 | |||||||
| 8.625%, 7/15/2020 (a) | 2,480,000 | 2,703,200 | |||||||
| Lukoil International Finance BV, 144A, 7.25%, 11/5/2019 | 2,000,000 | 2,410,840 | |||||||
| Macquarie Bank Ltd., 144A, 3.45%, 7/27/2015 | 920,000 | 949,523 | |||||||
| Marfrig Holding Europe BV, 144A, 8.375%, 5/9/2018 (a) | 500,000 | 432,500 | |||||||
| Morgan Stanley, 4.875%, 11/1/2022 | 1,250,000 | 1,263,664 | |||||||
| MPM Escrow LLC, 144A, 8.875%, 10/15/2020 | 270,000 | 264,600 | |||||||
| MPT Operating Partnership LP, (REIT), 6.375%, 2/15/2022 | 30,000 | 31,275 | |||||||
| National Money Mart Co., 10.375%, 12/15/2016 | 115,000 | 128,369 | |||||||
| Neuberger Berman Group LLC: | |||||||||
| 144A, 5.625%, 3/15/2020 | 55,000 | 57,750 | |||||||
| 144A, 5.875%, 3/15/2022 | 95,000 | 101,175 | |||||||
| Nielsen Finance LLC, 144A, 4.5%, 10/1/2020 | 140,000 | 139,300 | |||||||
| NII Capital Corp., 7.625%, 4/1/2021 | 10,000 | 7,900 | |||||||
| Nordea Bank AB, 144A, 4.25%, 9/21/2022 | 940,000 | 947,896 | |||||||
| Odebrecht Finance Ltd.: | |||||||||
| 144A, 5.125%, 6/26/2022 | 2,000,000 | 2,175,000 | |||||||
| 144A, 7.125%, 6/26/2042 | 1,000,000 | 1,157,500 | |||||||
| Petrobras International Finance Co., 5.75%, 1/20/2020 | 1,000,000 | 1,153,481 | |||||||
| Pinnacle Foods Finance LLC: | |||||||||
| 8.25%, 9/1/2017 | 150,000 | 161,250 | |||||||
| 9.25%, 4/1/2015 | 49,000 | 50,041 | |||||||
| PNC Bank NA, 6.875%, 4/1/2018 | 1,300,000 | 1,647,173 | |||||||
| PPL Capital Funding, Inc., 3.5%, 12/1/2022 | 700,000 | 718,771 | |||||||
| Principal Financial Group, Inc., 3.3%, 9/15/2022 | 760,000 | 776,965 | |||||||
| RBS Citizens Financial Group, Inc., 144A, 4.15%, 9/28/2022 | 900,000 | 904,620 | |||||||
| Reynolds Group Issuer, Inc.: | |||||||||
| 144A, 5.75%, 10/15/2020 | 380,000 | 383,800 | |||||||
| 7.125%, 4/15/2019 (a) | 4,910,000 | 5,229,150 | |||||||
| Santander U.S. Debt SA Unipersonal, 144A, 2.991%, 10/7/2013 | 1,500,000 | 1,503,657 | |||||||
| Serta Simmons Holdings LLC, 144A, 8.125%, 10/1/2020 | 215,000 | 216,881 | |||||||
| Sky Growth Acquisition Corp., 144A, 7.375%, 10/15/2020 | 165,000 | 164,175 | |||||||
| Telemovil Finance Co., Ltd., 144A, 8.0%, 10/1/2017 | 1,000,000 | 1,055,000 | |||||||
| The Goldman Sachs Group, Inc., 6.15%, 4/1/2018 | 1,000,000 | 1,171,039 | |||||||
| Tronox Finance LLC, 144A, 6.375%, 8/15/2020 | 240,000 | 239,400 | |||||||
| Turkiye Garanti Bankasi AS, 144A, 5.25%, 9/13/2022 | 1,000,000 | 1,035,000 | |||||||
| UPCB Finance III Ltd., 144A, 6.625%, 7/1/2020 | 450,000 | 481,500 | |||||||
| UPCB Finance V Ltd., 144A, 7.25%, 11/15/2021 (a) | 260,000 | 286,000 | |||||||
| UR Merger Sub Corp.: | |||||||||
| 144A, 5.75%, 7/15/2018 | 390,000 | 419,250 | |||||||
| 144A, 7.375%, 5/15/2020 | 100,000 | 108,250 | |||||||
| 144A, 7.625%, 4/15/2022 | 1,260,000 | 1,379,700 | |||||||
| 10.875%, 6/15/2016 | 75,000 | 83,531 | |||||||
| Vale Overseas Ltd., 8.25%, 1/17/2034 | 2,000,000 | 2,709,810 | |||||||
| Virgin Media Finance PLC, 4.875%, 2/15/2022 | 245,000 | 247,450 | |||||||
| Wind Acquisition Finance SA, 144A, 7.25%, 2/15/2018 | 200,000 | 195,000 | |||||||
| WMG Acquisition Corp., 144A, 6.0%, 1/15/2021 | 95,000 | 95,238 | |||||||
| Xstrata Finance Canada Ltd., 144A, 4.0%, 10/25/2022 | 870,000 | 873,833 | |||||||
| 94,006,245 | |||||||||
| Health Care 1.2% | |||||||||
| Agilent Technologies, Inc., 3.2%, 10/1/2022 | 500,000 | 507,230 | |||||||
| Amgen, Inc., 5.15%, 11/15/2041 | 550,000 | 633,719 | |||||||
| Aviv Healthcare Properties LP, 7.75%, 2/15/2019 | 110,000 | 115,912 | |||||||
| Biomet, Inc.: | |||||||||
| 144A, 6.5%, 8/1/2020 | 330,000 | 340,725 | |||||||
| 144A, 6.5%, 10/1/2020 | 95,000 | 92,388 | |||||||
| CHS/Community Health Systems, Inc.: | |||||||||
| 5.125%, 8/15/2018 | 1,080,000 | 1,120,500 | |||||||
| 7.125%, 7/15/2020 | 735,000 | 777,262 | |||||||
| Gilead Sciences, Inc., 4.4%, 12/1/2021 | 390,000 | 450,817 | |||||||
| HCA Holdings, Inc., 7.75%, 5/15/2021 (a) | 790,000 | 851,225 | |||||||
| HCA, Inc.: | |||||||||
| 5.875%, 3/15/2022 | 40,000 | 42,900 | |||||||
| 6.5%, 2/15/2020 | 2,020,000 | 2,232,100 | |||||||
| 7.5%, 2/15/2022 | 2,220,000 | 2,480,850 | |||||||
| 8.5%, 4/15/2019 | 150,000 | 168,562 | |||||||
| Hologic, Inc., 144A, 6.25%, 8/1/2020 | 220,000 | 233,200 | |||||||
| IMS Health, Inc., 144A, 6.0%, 11/1/2020 | 240,000 | 244,200 | |||||||
| Laboratory Corp. of America Holdings, 3.75%, 8/23/2022 | 350,000 | 372,074 | |||||||
| Mylan, Inc., 144A, 7.875%, 7/15/2020 | 85,000 | 95,944 | |||||||
| Physio-Control International, Inc., 144A, 9.875%, 1/15/2019 | 55,000 | 60,225 | |||||||
| Tenet Healthcare Corp., 6.25%, 11/1/2018 (a) | 1,110,000 | 1,201,575 | |||||||
| 12,021,408 | |||||||||
| Industrials 1.6% | |||||||||
| Accuride Corp., 9.5%, 8/1/2018 (a) | 55,000 | 54,244 | |||||||
| ADT Corp., 144A, 3.5%, 7/15/2022 | 820,000 | 834,435 | |||||||
| Aguila 3 SA, 144A, 7.875%, 1/31/2018 | 190,000 | 200,925 | |||||||
| Air Lease Corp., 144A, 5.625%, 4/1/2017 | 490,000 | 502,250 | |||||||
| ARAMARK Corp., 8.5%, 2/1/2015 | 30,000 | 30,488 | |||||||
| BE Aerospace, Inc., 6.875%, 10/1/2020 (a) | 515,000 | 571,650 | |||||||
| Belden, Inc., 144A, 5.5%, 9/1/2022 | 330,000 | 335,775 | |||||||
| Bombardier, Inc.: | |||||||||
| 144A, 5.75%, 3/15/2022 (a) | 2,725,000 | 2,871,469 | |||||||
| 144A, 7.75%, 3/15/2020 | 25,000 | 29,219 | |||||||
| Georgian Railway JSC, 144A, 7.75%, 7/11/2022 | 1,000,000 | 1,119,200 | |||||||
| Huntington Ingalls Industries, Inc.: | |||||||||
| 6.875%, 3/15/2018 | 65,000 | 70,200 | |||||||
| 7.125%, 3/15/2021 | 255,000 | 274,125 | |||||||
| Iron Mountain, Inc., 5.75%, 8/15/2024 | 335,000 | 334,162 | |||||||
| Navios Maritime Holdings, Inc., 8.875%, 11/1/2017 | 290,000 | 297,250 | |||||||
| Nortek, Inc.: | |||||||||
| 8.5%, 4/15/2021 (a) | 1,445,000 | 1,553,375 | |||||||
| 144A, 8.5%, 4/15/2021 | 165,000 | 176,550 | |||||||
| Owens Corning, Inc., 4.2%, 12/15/2022 | 280,000 | 283,007 | |||||||
| Ply Gem Industries, Inc., 144A, 9.375%, 4/15/2017 | 160,000 | 168,000 | |||||||
| TransDigm, Inc., 7.75%, 12/15/2018 | 405,000 | 446,512 | |||||||
| Transnet SOC Ltd., 144A, 4.0%, 7/26/2022 | 2,000,000 | 2,000,000 | |||||||
| United Rentals North America, Inc., 6.125%, 6/15/2023 | 25,000 | 25,313 | |||||||
| Urbi, Desarrollos Urbanos SAB de CV, 144A, 9.75%, 2/3/2022 (a) | 2,000,000 | 1,860,000 | |||||||
| Votorantim Cimentos SA, 144A, 7.25%, 4/5/2041 | 2,000,000 | 2,260,000 | |||||||
| 16,298,149 | |||||||||
| Information Technology 1.8% | |||||||||
| Avaya, Inc., 144A, 7.0%, 4/1/2019 | 1,355,000 | 1,236,437 | |||||||
| CDW LLC, 8.5%, 4/1/2019 | 2,910,000 | 3,106,425 | |||||||
| Equinix, Inc., 7.0%, 7/15/2021 | 2,600,000 | 2,886,000 | |||||||
| Fidelity National Information Services, Inc., 7.625%, 7/15/2017 | 10,000 | 10,913 | |||||||
| First Data Corp.: | |||||||||
| 144A, 6.75%, 11/1/2020 | 665,000 | 665,000 | |||||||
| 144A, 7.375%, 6/15/2019 | 2,800,000 | 2,898,000 | |||||||
| 144A, 8.875%, 8/15/2020 | 745,000 | 812,050 | |||||||
| Fiserv, Inc., 3.5%, 10/1/2022 | 1,190,000 | 1,210,920 | |||||||
| Freescale Semiconductor, Inc., 144A, 9.25%, 4/15/2018 | 2,225,000 | 2,380,750 | |||||||
| Hewlett-Packard Co., 3.3%, 12/9/2016 | 725,000 | 739,059 | |||||||
| Hughes Satellite Systems Corp.: | |||||||||
| 6.5%, 6/15/2019 | 250,000 | 267,500 | |||||||
| 7.625%, 6/15/2021 | 915,000 | 1,017,938 | |||||||
| MasTec, Inc., 7.625%, 2/1/2017 | 100,000 | 103,500 | |||||||
| SunGard Data Systems, Inc., 144A, 6.625%, 11/1/2019 | 245,000 | 247,144 | |||||||
| ViaSat, Inc., 6.875%, 6/15/2020 | 10,000 | 10,450 | |||||||
| Xerox Corp., 2.95%, 3/15/2017 | 410,000 | 422,455 | |||||||
| 18,014,541 | |||||||||
| Materials 2.7% | |||||||||
| Appleton Papers, Inc., 11.25%, 12/15/2015 | 45,000 | 46,688 | |||||||
| China Oriental Group Co., Ltd., 144A, 7.0%, 11/17/2017 | 1,000,000 | 875,000 | |||||||
| Continental Rubber of America Corp., 144A, 4.5%, 9/15/2019 | 150,000 | 153,225 | |||||||
| Corporation Nacional del Cobre de Chile, 144A, 3.0%, 7/17/2022 | 3,000,000 | 3,028,677 | |||||||
| Crown Americas LLC, 7.625%, 5/15/2017 | 30,000 | 31,875 | |||||||
| CSN Resources SA, 144A, 6.5%, 7/21/2020 | 1,000,000 | 1,130,000 | |||||||
| Essar Steel Algoma, Inc., 144A, 9.875%, 6/15/2015 | 10,000 | 7,800 | |||||||
| Evraz Group SA, 144A, 7.4%, 4/24/2017 | 2,000,000 | 2,075,600 | |||||||
| FMG Resources (August 2006) Pty Ltd.: | |||||||||
| 144A, 6.0%, 4/1/2017 | 130,000 | 124,800 | |||||||
| 144A, 6.375%, 2/1/2016 | 1,000,000 | 1,000,000 | |||||||
| 144A, 6.875%, 4/1/2022 | 4,370,000 | 4,107,800 | |||||||
| Freeport-McMoRan Copper & Gold, Inc., 3.55%, 3/1/2022 | 800,000 | 814,558 | |||||||
| Graphic Packaging International, Inc., 9.5%, 6/15/2017 | 85,000 | 92,863 | |||||||
| Huntsman International LLC, 8.625%, 3/15/2021 (a) | 80,000 | 91,000 | |||||||
| IAMGOLD Corp., 144A, 6.75%, 10/1/2020 | 475,000 | 473,812 | |||||||
| Kaiser Aluminum Corp., 8.25%, 6/1/2020 | 225,000 | 243,563 | |||||||
| Kraton Polymers LLC, 6.75%, 3/1/2019 | 95,000 | 97,850 | |||||||
| LyondellBasell Industries NV, 5.0%, 4/15/2019 | 200,000 | 216,500 | |||||||
| Molycorp, Inc., 144A, 10.0%, 6/1/2020 | 485,000 | 466,812 | |||||||
| Novelis, Inc., 8.75%, 12/15/2020 | 4,725,000 | 5,209,312 | |||||||
| Old AII, Inc., 144A, 7.875%, 11/1/2020 | 55,000 | 54,725 | |||||||
| Owens-Brockway Glass Container, Inc., 7.375%, 5/15/2016 | 160,000 | 183,200 | |||||||
| Polymer Group, Inc., 7.75%, 2/1/2019 | 330,000 | 353,100 | |||||||
| PTT Global Chemical PCL, 144A, 4.25%, 9/19/2022 | 500,000 | 514,419 | |||||||
| Samarco Mineracao SA, 144A, 4.125%, 11/1/2022 | 1,400,000 | 1,398,572 | |||||||
| Sealed Air Corp.: | |||||||||
| 144A, 8.125%, 9/15/2019 | 30,000 | 32,775 | |||||||
| 144A, 8.375%, 9/15/2021 | 30,000 | 33,000 | |||||||
| Teck Resources Ltd., 3.75%, 2/1/2023 | 910,000 | 921,883 | |||||||
| Vale SA, 5.625%, 9/11/2042 | 750,000 | 803,477 | |||||||
| Viskase Companies, Inc., 144A, 9.875%, 1/15/2018 | 95,000 | 98,088 | |||||||
| Volcan Cia Minera SAA, 144A, 5.375%, 2/2/2022 | 2,000,000 | 2,155,000 | |||||||
| Wolverine Tube, Inc., 6.0%, 6/28/2014 | 27,865 | 27,280 | |||||||
| 26,863,254 | |||||||||
| Telecommunication Services 4.0% | |||||||||
| Cincinnati Bell, Inc.: | |||||||||
| 8.25%, 10/15/2017 | 370,000 | 395,900 | |||||||
| 8.375%, 10/15/2020 | 3,325,000 | 3,574,375 | |||||||
| 8.75%, 3/15/2018 (a) | 1,360,000 | 1,373,600 | |||||||
| Cricket Communications, Inc.: | |||||||||
| 7.75%, 10/15/2020 | 3,280,000 | 3,382,500 | |||||||
| 10.0%, 7/15/2015 | 155,000 | 162,944 | |||||||
| Crown Castle International Corp., 144A, 5.25%, 1/15/2023 | 125,000 | 129,375 | |||||||
| Digicel Group Ltd.: | |||||||||
| 144A, 8.25%, 9/30/2020 | 610,000 | 657,275 | |||||||
| 144A, 10.5%, 4/15/2018 | 1,125,000 | 1,243,125 | |||||||
| Digicel Ltd., 144A, 8.25%, 9/1/2017 | 3,450,000 | 3,708,750 | |||||||
| ERC Ireland Preferred Equity Ltd., 144A, 7.69%**, 2/15/2017 (PIK)* | EUR | 297,616 | 116 | ||||||
| Frontier Communications Corp.: | |||||||||
| 6.625%, 3/15/2015 | 1,000,000 | 1,082,500 | |||||||
| 8.5%, 4/15/2020 (a) | 3,745,000 | 4,325,475 | |||||||
| Intelsat Jackson Holdings SA: | |||||||||
| 144A, 7.25%, 10/15/2020 | 45,000 | 47,700 | |||||||
| 7.5%, 4/1/2021 | 4,315,000 | 4,627,837 | |||||||
| Intelsat Luxembourg SA, 11.25%, 2/4/2017 | 2,670,000 | 2,803,500 | |||||||
| Level 3 Communications, Inc., 144A, 8.875%, 6/1/2019 (a) | 70,000 | 73,500 | |||||||
| MetroPCS Wireless, Inc., 6.625%, 11/15/2020 | 740,000 | 795,500 | |||||||
| Nextel Communications, Inc., Series D, 7.375%, 8/1/2015 | 753,000 | 753,941 | |||||||
| SBA Communications Corp., 144A, 5.625%, 10/1/2019 | 190,000 | 193,088 | |||||||
| Sprint Nextel Corp.: | |||||||||
| 6.0%, 12/1/2016 | 3,605,000 | 3,875,375 | |||||||
| 8.375%, 8/15/2017 (a) | 460,000 | 533,600 | |||||||
| 9.125%, 3/1/2017 | 375,000 | 440,625 | |||||||
| Telesat Canada, 144A, 6.0%, 5/15/2017 | 160,000 | 166,800 | |||||||
| tw telecom holdings, Inc., 144A, 5.375%, 10/1/2022 | 275,000 | 282,562 | |||||||
| Windstream Corp.: | |||||||||
| 7.0%, 3/15/2019 | 90,000 | 92,138 | |||||||
| 7.5%, 6/1/2022 | 155,000 | 164,300 | |||||||
| 7.5%, 4/1/2023 | 80,000 | 84,200 | |||||||
| 7.75%, 10/15/2020 | 2,665,000 | 2,871,537 | |||||||
| 7.875%, 11/1/2017 | 2,595,000 | 2,890,181 | |||||||
| 40,732,319 | |||||||||
| Utilities 1.3% | |||||||||
| AES Corp.: | |||||||||
| 8.0%, 10/15/2017 | 110,000 | 125,813 | |||||||
| 8.0%, 6/1/2020 | 95,000 | 109,725 | |||||||
| Calpine Corp.: | |||||||||
| 144A, 7.5%, 2/15/2021 | 3,096,000 | 3,366,900 | |||||||
| 144A, 7.875%, 7/31/2020 | 360,000 | 394,200 | |||||||
| Comision Federal de Electricidad, 144A, 5.75%, 2/14/2042 | 400,000 | 454,000 | |||||||
| DTE Energy Co., 7.625%, 5/15/2014 | 305,000 | 336,372 | |||||||
| Dubai Electricity & Water Authority: | |||||||||
| 144A, 7.375%, 10/21/2020 | 1,000,000 | 1,185,000 | |||||||
| 144A, 8.5%, 4/22/2015 | 1,000,000 | 1,133,750 | |||||||
| FirstEnergy Solutions Corp., 6.8%, 8/15/2039 | 838,000 | 978,631 | |||||||
| GDF Suez, 144A, 2.875%, 10/10/2022 | 1,500,000 | 1,506,240 | |||||||
| NRG Energy, Inc., 8.25%, 9/1/2020 | 755,000 | 832,388 | |||||||
| Oncor Electric Delivery Co., LLC, 4.1%, 6/1/2022 (a) | 970,000 | 1,039,318 | |||||||
| Perusahaan Listrik Negara PT, 144A, 5.5%, 11/22/2021 | 2,000,000 | 2,255,000 | |||||||
| 13,717,337 | |||||||||
Total Corporate Bonds (Cost $289,144,383) | 297,991,767 | ||||||||
| Asset-Backed 0.5% | |||||||||
| Credit Card Receivables 0.2% | |||||||||
| Citibank Omni Master Trust, "A14", Series 2009-A14A, 144A, 2.964%**, 8/15/2018 | 2,020,000 | 2,109,365 | |||||||
| Miscellaneous 0.3% | |||||||||
| CIFC Funding Ltd., "B1L", Series 2012-2A, 5.7%, 12/16/2024 | 2,700,000 | 2,517,256 | |||||||
Total Asset-Backed (Cost $4,643,464) | 4,626,621 | ||||||||
| Mortgage-Backed Securities Pass-Throughs 3.9% | |||||||||
| Federal Home Loan Mortgage Corp., 6.0%, 11/1/2021 | 185,915 | 206,360 | |||||||
| Federal National Mortgage Association: | |||||||||
| 2.601%**, 8/1/2037 | 466,840 | 501,853 | |||||||
| 6.0%, 2/1/2037 | 475,709 | 528,297 | |||||||
| 6.5%, with various maturities from 4/1/2017 until 6/1/2017 | 267,600 | 290,981 | |||||||
| 8.0%, 9/1/2015 | 100,598 | 106,526 | |||||||
| Government National Mortgage Association: | |||||||||
| 3.0%, with various maturities from 5/1/2042 until 6/1/2042 (e) | 14,000,000 | 14,899,843 | |||||||
| 3.5%, 10/20/2042 (e) | 11,100,000 | 11,826,045 | |||||||
| 4.0%, 3/1/2041 (e) | 10,000,000 | 10,917,969 | |||||||
| 6.5%, 8/20/2034 | 157,371 | 179,028 | |||||||
Total Mortgage-Backed Securities Pass-Throughs (Cost $39,304,173) | 39,456,902 | ||||||||
| Commercial Mortgage-Backed Securities 1.2% | |||||||||
| Bear Stearns Commercial Mortgage Securities, Inc., "A4", Series 2007- PW16, 5.716%**, 6/11/2040 | 240,000 | 285,690 | |||||||
| Citigroup/Deutsche Bank Commercial Mortgage Trust, "AM", Series 2007-CD5, 6.122%**, 11/15/2044 | 1,770,000 | 2,024,519 | |||||||
| Commercial Mortgage Trust, "AM", Series 2007-C9, 5.65%, 12/10/2049 | 810,000 | 905,064 | |||||||
| First Union National Bank Commercial Mortgage, "M", Series 2001-C4, 144A, 6.0%, 12/12/2033 | 3,839,000 | 3,843,987 | |||||||
| JPMorgan Chase Commercial Mortgage Securities Corp.: | |||||||||
| "C", Series 2012-HSBC, 144A, 4.021%, 7/5/2032 | 1,180,000 | 1,273,551 | |||||||
| "A4", Series 2007-C1, 5.716%, 2/15/2051 | 825,000 | 980,041 | |||||||
| LB-UBS Commercial Mortgage Trust, "A4", Series 2007-C6, 5.858%, 7/15/2040 | 1,100,000 | 1,307,031 | |||||||
| PNC Mortgage Acceptance Corp., "J", Series 2000-C2, 144A, 6.22%, 10/12/2033 | 1,450,000 | 1,376,447 | |||||||
Total Commercial Mortgage-Backed Securities (Cost $11,683,017) | 11,996,330 | ||||||||
| Collateralized Mortgage Obligations 2.3% | |||||||||
| Federal Home Loan Mortgage Corp.: | |||||||||
| "HI", Series 3979, Interest Only, 3.0%, 12/15/2026 | 4,261,536 | 396,210 | |||||||
| "IC", Series 3971, Interest Only, 3.0%, 3/15/2026 | 1,565,127 | 162,033 | |||||||
| "IK", Series 4048, Interest Only, 3.0%, 5/15/2027 | 4,796,546 | 482,634 | |||||||
| "NI", Series 4020, Interest Only, 3.0%, 3/15/2027 | 4,811,795 | 481,071 | |||||||
| "PI", Series 3987, Interest Only, 3.0%, 1/15/2027 | 6,212,885 | 639,042 | |||||||
| "PI", Series 4017, Interest Only, 3.0%, 3/15/2027 | 1,902,492 | 173,128 | |||||||
| "P", Series 3808, 4.0%, 11/15/2038 | 4,000,000 | 4,397,640 | |||||||
| "LI", Series 3720, Interest Only, 4.5%, 9/15/2025 | 6,362,071 | 890,298 | |||||||
| "PI", Series 3843, Interest Only, 4.5%, 5/15/2038 | 6,227,479 | 910,444 | |||||||
| Federal National Mortgage Association: | |||||||||
| "JZ", Series 2012-4, 4.0%, 9/25/2041 | 1,591,380 | 1,749,882 | |||||||
| "I", Series 2003-84, Interest Only, 6.0%, 9/25/2033 | 1,172,626 | 245,088 | |||||||
| "PI", Series 2006-20, Interest Only, 6.469%***, 11/25/2030 | 4,419,526 | 909,869 | |||||||
| Government National Mortgage Association: | |||||||||
| "QI", Series 2011-112, Interest Only, 4.0%, 5/16/2026 | 4,897,135 | 433,578 | |||||||
| "AI", Series 2010-25, Interest Only, 4.5%, 3/16/2023 | 2,261,832 | 161,731 | |||||||
| "BI", Series 2010-30, Interest Only, 4.5%, 7/20/2039 | 1,029,071 | 159,668 | |||||||
| "GP", Series 2010-67, 4.5%, 3/20/2039 | 1,000,000 | 1,143,001 | |||||||
| "ND", Series 2010-130, 4.5%, 8/16/2039 | 3,400,000 | 3,893,267 | |||||||
| "NI", Series 2011-80, Interest Only, 4.5%, 5/16/2038 | 4,851,839 | 588,829 | |||||||
| "MI", Series 2009-76, Interest Only, 5.0%, 3/20/2035 | 3,309,300 | 185,765 | |||||||
| "IN", Series 2009-69, Interest Only, 5.5%, 8/20/2039 | 4,984,621 | 663,370 | |||||||
| "IQ", Series 2011-18, Interest Only, 5.5%, 1/16/2039 | 1,852,040 | 132,128 | |||||||
| "IV", Series 2009-69, Interest Only, 5.5%, 8/20/2039 | 5,006,928 | 671,817 | |||||||
| "IJ", Series 2009-75, Interest Only, 6.0%, 8/16/2039 | 3,268,819 | 494,041 | |||||||
| Residential Funding Mortgage Securities I, Inc., "M1", Series 2003-S17, 5.5%, 9/25/2033 | 2,138,504 | 2,056,291 | |||||||
| Vericrest Opportunity Loan Transferee, "A2", Series 2012-NL1A, 144A, 8.112%**, 3/25/2049 | 1,350,000 | 1,371,367 | |||||||
Total Collateralized Mortgage Obligations (Cost $22,565,140) | 23,392,192 | ||||||||
| Government & Agency Obligations 9.9% | |||||||||
| Sovereign Bonds 3.1% | |||||||||
| Canadian Government Bond, 0.75%, 5/1/2014 | CAD | 10,000,000 | 9,965,457 | ||||||
| Republic of Argentina, 7.0%, 10/3/2015 | 1,250,000 | 1,030,695 | |||||||
| Republic of Croatia, 144A, 6.25%, 4/27/2017 | 2,300,000 | 2,527,700 | |||||||
| Republic of Hungary, 4.75%, 2/3/2015 | 2,000,000 | 2,047,500 | |||||||
| Republic of Indonesia, 144A, 4.875%, 5/5/2021 | 2,000,000 | 2,280,000 | |||||||
| Republic of Lithuania, 144A, 6.125%, 3/9/2021 | 1,000,000 | 1,202,500 | |||||||
| Republic of Poland, 3.0%, 3/17/2023 | 2,000,000 | 1,971,160 | |||||||
| Republic of Serbia, REG S, 6.75%, 11/1/2024 | 1,666,667 | 1,650,000 | |||||||
| Republic of Turkey, 6.0%, 1/14/2041 | 500,000 | 587,500 | |||||||
| Russian Federation, 144A, 3.25%, 4/4/2017 | 2,000,000 | 2,122,380 | |||||||
| Ukraine Government International Bond, 144A, 6.58%, 11/21/2016 | 2,000,000 | 1,979,120 | |||||||
| United Mexican States, 4.75%, 3/8/2044 | 2,500,000 | 2,775,000 | |||||||
| Vnesheconombank, 144A, 6.025%, 7/5/2022 | 550,000 | 613,965 | |||||||
| 30,752,977 | |||||||||
| U.S. Government Sponsored Agency 0.4% | |||||||||
| Federal National Mortgage Association, 3.0%, 11/15/2027 | 4,500,000 | 4,503,073 | |||||||
| U.S. Treasury Obligations 6.4% | |||||||||
| U.S. Treasury Bills: | |||||||||
| 0.125%****, 3/7/2013 (f) | 60,000 | 59,973 | |||||||
| 0.13%****, 3/7/2013 (f) | 600,000 | 599,727 | |||||||
| 0.13%****, 3/7/2013 (f) | 2,218,000 | 2,216,991 | |||||||
| U.S. Treasury Bond, 5.375%, 2/15/2031 | 1,000,000 | 1,441,250 | |||||||
| U.S. Treasury Notes: | |||||||||
| 0.75%, 6/15/2014 (g) | 8,000,000 | 8,062,184 | |||||||
| 0.875%, 12/31/2016 | 3,000,000 | 3,036,327 | |||||||
| 1.0%, 8/31/2016 | 4,430,000 | 4,509,948 | |||||||
| 1.625%, 8/15/2022 | 45,000,000 | 44,753,895 | |||||||
| 64,680,295 | |||||||||
Total Government & Agency Obligations (Cost $99,144,921) | 99,936,345 | ||||||||
| Shares | Value ($) | |||||||
| Convertible Bond 0.1% | ||||||||
| Materials | ||||||||
| GEO Specialty Chemicals, Inc. 144A, 7.5%, 3/31/2015 (PIK) (Cost $615,355) | 622,934 | 608,420 | ||||||
| Principal Amount ($) | Value ($) | |||||||
| Loan Participations and Assignments 1.7% | ||||||||
| Senior Loan** 0.0% | ||||||||
| Alliance Mortgage Cycle Loan, Term Loan A, 9.5%, 6/15/2010* | 233,333 | 0 | ||||||
| Sovereign Loans 1.7% | ||||||||
| Bank of Moscow, 144A, 6.699%, 3/11/2015 | 1,000,000 | 1,069,000 | ||||||
| Gazprom Neft OAO, 144A, 4.375%, 9/19/2022 (a) | 1,750,000 | 1,754,375 | ||||||
| Gazprom OAO, 144A, 4.95%, 7/19/2022 (a) | 2,000,000 | 2,121,232 | ||||||
| Novatek OAO, 144A, 5.326%, 2/3/2016 | 1,000,000 | 1,073,920 | ||||||
| RZD Capital Ltd., 5.739%, 4/3/2017 | 1,500,000 | 1,665,000 | ||||||
| Sberbank of Russia, 144A, 6.125%, 2/7/2022 | 2,000,000 | 2,238,060 | ||||||
| Vimpel Communications, 144A, 7.748%, 2/2/2021 | 2,000,000 | 2,200,000 | ||||||
| VTB Bank OJSC: | ||||||||
| 144A, 6.0%, 4/12/2017 | 2,000,000 | 2,087,500 | ||||||
| 144A, 6.95%, 10/17/2022 | 3,000,000 | 3,098,850 | ||||||
Total Loan Participations and Assignments (Cost $17,142,533) | 17,307,937 | |||||||
| Preferred Securities 0.2% | ||||||||
| Financials 0.2% | ||||||||
| Citigroup, Inc., 5.95%, 1/30/2023 (d) | 480,000 | 494,700 | ||||||
| Farm Credit Bank of Texas, Series 1, 7.561%, 12/15/2013 (d) | 889,000 | 902,406 | ||||||
| 1,397,106 | ||||||||
| Materials 0.0% | ||||||||
| Hercules, Inc., 6.5%, 6/30/2029 | 141,000 | 130,425 | ||||||
Total Preferred Securities (Cost $1,510,010) | 1,527,531 | |||||||
| Units | Value ($) | |||||||
| Other Investments 0.0% | ||||||||
| Consumer Discretionary | ||||||||
| AOT Bedding Super Holdings LLC* (h) (Cost $6,000) | 6 | 20,865 | ||||||
| Contracts | Value ($) | |||||||
| Call Options Purchased 0.1% | ||||||||
| Options on Exchange-Traded Futures Contracts 0.0% | ||||||||
| 10 Year U.S. Treasury Note Future, Expiration Date 11/23/2012, Strike Price $134.0 | 42 | 11,813 | ||||||
| Contract Amount | Value ($) | |||||||
| Options on Interest Rate Swap Contracts 0.1% | ||||||||
| Fixed Rate — 3.583% - Floating — LIBOR, Swap Expiration Date 5/11/2026, Option Expiration Date 5/9/2016 | 3,100,000 | 96,020 | ||||||
| Fixed Rate — 3.635% - Floating — LIBOR, Swap Expiration Date 4/27/2026, Option Expiration Date 4/25/2016 | 9,400,000 | 276,469 | ||||||
| Fixed Rate — 3.72% - Floating — LIBOR, Swap Expiration Date 4/22/2026, Option Expiration Date 4/20/2016 | 9,400,000 | 259,228 | ||||||
| 631,717 | ||||||||
Total Call Options Purchased (Cost $1,090,759) | 643,530 | |||||||
| Shares | Value ($) | |||||||
| Securities Lending Collateral 13.0% | ||||||||
| Daily Assets Fund Institutional, 0.21% (i) (j) (Cost $131,131,782) | 131,131,782 | 131,131,782 | ||||||
| Cash Equivalents 2.9% | ||||||||
| Central Cash Management Fund, 0.18% (i) (Cost $28,845,442) | 28,845,442 | 28,845,442 | ||||||
| % of Net Assets | Value ($) | |||||||
Total Investment Portfolio (Cost $1,166,719,613)† | 118.6 | 1,194,879,613 | ||||||
| Other Assets and Liabilities, Net | (18.6 | ) | (187,286,226 | ) | ||||
| Net Assets | 100.0 | 1,007,593,387 | ||||||
The following table represents bonds and senior loans that are in default:
| Security | Coupon | Maturity Date | Principal Amount ($) | Cost ($) | Value ($) | ||||||||||||
| Alliance Mortgage Cycle Loan* | 9.5 | % | 6/15/2010 | 233,333 | 233,333 | 0 | |||||||||||
| ERC Ireland Preferred Equity Ltd.* | 7.69 | % | 2/15/2017 | 297,616 | 403,824 | 116 | |||||||||||
| Fontainebleau Las Vegas Holdings LLC* | 11.0 | % | 6/15/2015 | 100,000 | 100,000 | 63 | |||||||||||
| 737,157 | 179 | ||||||||||||||||
* Non-income producing security.
** Floating rate securities' yields vary with a designated market index or market rate, such as the coupon-equivalent of the U.S. Treasury Bill rate. These securities are shown at their current rate as of October 31, 2012.
*** Current yield; not a coupon rate.
****Annualized yield at time of purchase; not a coupon rate.
† The cost for federal income tax purposes was $1,169,477,402. At October 31, 2012, net unrealized appreciation for all securities based on tax cost was $25,402,211. This consisted of aggregate gross unrealized appreciation for all securities in which there was an excess of value over tax cost of $49,485,432 and aggregate gross unrealized depreciation for all securities in which there was an excess of tax cost over value of $24,083,221.
(a) All or a portion of these securities were on loan (see Notes to Financial Statements). The value of all securities loaned at October 31, 2012 amounted to $126,613,012, which is 12.6% of net assets.
(b) Securities with the same description are the same corporate entity but trade on different stock exchanges.
(c) Principal amount stated in U.S. dollars unless otherwise noted.
(d) Date shown is call date; not a maturity date for the perpetual preferred securities.
(e) When-issued or delayed delivery security included.
(f) At October 31, 2012, this security has been pledged, in whole or in part, to cover initial margin requirements for open futures contracts.
(g) At October 31, 2012, this security has been pledged, in whole or in part, as collateral for open credit default swap contracts.
(h) The Fund may purchase securities that are subject to legal or contractual restrictions on resale ("restricted securities"). Restricted securities are securities which have not been registered with the Securities and Exchange Commission under the Securities Act of 1933. The Fund may be unable to sell a restricted security and it may be more difficult to determine a market value for a restricted security. Moreover, if adverse market conditions were to develop during the period between the Fund's decision to sell a restricted security and the point at which the Fund is permitted or able to sell such security, the Fund might obtain a price less favorable than the price that prevailed when it decided to sell. This investment practice, therefore, could have the effect of increasing the level of illiquidity of the Fund. The future value of these securities is uncertain and there may be changes in the estimated value of these securities.
| Schedule of Restricted Securities | Acquisition Date | Cost ($) | Value ($) | Value as % of Net Assets | |||||||||
| AOT Bedding Super Holdings LLC* | June 2010 | 6,000 | 20,865 | 0.002 | |||||||||
(i) Affiliated fund managed by Deutsche Investment Management Americas Inc. The rate shown is the annualized seven-day yield at period end.
(j) Represents collateral held in connection with securities lending. Income earned by the Fund is net of borrower rebates.
144A: Security exempt from registration under Rule 144A of the Securities Act of 1933. These securities may be resold in transactions exempt from registration, normally to qualified institutional buyers.
ADR: American Depositary Receipt
CVA: Certificaten Van Aandelen
Interest Only: Interest Only (IO) bonds represent the "interest only" portion of payments on a pool of underlying mortgages or mortgage-backed securities. IO securities are subject to prepayment risk of the pool of underlying mortgages.
LIBOR: London Interbank Offered Rate
PIK: Denotes that all or a portion of the income is paid in-kind in the form of additional principal.
REG S: Securities sold under Regulation S may not be offered, sold or delivered within the United States or to, or for the account or benefit of, U.S. persons, except pursuant to an exemption from, or in a transaction not subject to, the registration requirements of the Securities Act of 1933.
REIT: Real Estate Investment Trust
Included in the portfolio are investments in mortgage- or asset-backed securities which are interests in separate pools of mortgages or assets. Effective maturities of these investments may be shorter than stated maturities due to prepayments. Some separate investments in the Federal National Mortgage Association and Government National Mortgage Association issues which have similar coupon rates have been aggregated for presentation purposes in this investment portfolio.
At October 31, 2012, open futures contracts purchased were as follows:
| Futures | Currency | Expiration Date | Contracts | Notional Value ($) | Unrealized Appreciation ($) | |||||||||
| 10 Year Canadian Government Bond | CAD | 12/18/2012 | 87 | 11,940,015 | 84,043 | |||||||||
| 10 Year U.S. Treasury Note | USD | 12/19/2012 | 238 | 31,661,438 | 140,169 | |||||||||
| Ultra Long U.S. Treasury Bond | USD | 12/19/2012 | 7 | 1,155,656 | 23,391 | |||||||||
| United Kingdom Long Gilt Bond | GBP | 12/27/2012 | 66 | 12,689,297 | 89,344 | |||||||||
| Total unrealized appreciation | 336,947 | |||||||||||||
At October 31, 2012, open futures contracts sold were as follows:
| Futures | Currency | Expiration Date | Contracts | Notional Value ($) | Unrealized Depreciation ($) | |||||||||
| 5 Year U.S. Treasury Note | USD | 12/31/2012 | 90 | 11,182,500 | (16,370 | ) | ||||||||
At October 31, 2012, open credit default swap contracts purchased were as follows:
| Effective/ Expiration Date | Notional Amount ($) | Fixed Cash Flows Paid | Underling Debt Obligation/ Quality Rating (l) | Value ($) | Upfront Payments Paid ($) | Unrealized Depreciation ($) | |||||||||||||||
9/20/2012 12/20/2017 | 4,800,000 | 1 | 1.0 | % | Republic of Italy, 6.875%, 9/27/2023, BBB | 371,490 | 556,961 | (185,471 | ) | ||||||||||||
9/20/2012 12/20/2017 | 2,400,000 | 2 | 1.0 | % | Republic of Italy, 6.875%, 9/27/2023, BBB | 185,745 | 236,628 | (50,883 | ) | ||||||||||||
| Total unrealized depreciation | (236,354 | ) | |||||||||||||||||||
At October 31, 2012, open credit default swap contracts sold were as follows:
| Effective/ Expiration Date | Notional Amount ($) (k) | Fixed Cash Flows Received | Underling Debt Obligation/ Quality Rating (l) | Value ($) | Upfront Payments Paid/ (Received) ($) | Unrealized Appreciation ($) | |||||||||||||||
12/20/2011 3/20/2017 | 150,000 | 3 | 5.0 | % | CIT Group, Inc., 5.5%, 2/15/2019, BB- | 17,511 | 5,543 | 11,968 | |||||||||||||
9/20/2012 12/20/2017 | 2,400,000 | 2 | 1.0 | % | Kingdom of Spain, 5.5%, 7/30/2017, BBB- | (213,917 | ) | (278,831 | ) | 64,914 | |||||||||||
9/20/2012 12/20/2017 | 4,800,000 | 1 | 1.0 | % | Kingdom of Spain, 5.5%, 7/30/2017, BBB- | (427,835 | ) | (616,255 | ) | 188,420 | |||||||||||
| Total unrealized appreciation | 265,302 | ||||||||||||||||||||
(k) The maximum potential amount of future undiscounted payments that the Fund could be required to make under a credit default swap contract would be the notional amount of the contract. These potential amounts would be partially offset by any recovery values of the referenced debt obligation or net amounts received from the settlement of buy protection credit default swap contracts entered into by the Fund for the same referenced debt obligation, if any.
(l) The quality ratings represent the higher of Moody's Investors Service, Inc. ("Moody's") or Standard & Poor's Corporation ("S&P") credit ratings.
At October 31, 2012, open interest rate swap contracts were as follows:
| Effective/ Expiration Date | Notional Amount ($) | Cash Flows Paid by the Fund | Cash Flows Received by the Fund | Value ($) | Upfront Payments Paid ($) | Unrealized Appreciation/ (Depreciation) ($) | ||||||||||||
7/16/2013 7/16/2014 | 21,400,000 | 2 | Floating — LIBOR | Fixed — 0.515% | 26,692 | — | 26,692 | |||||||||||
9/17/2013 9/17/2022 | 400,000 | 2 | Fixed — 1.858% | Floating — LIBOR | 2,873 | — | 2,873 | |||||||||||
7/16/2013 7/16/2023 | 3,000,000 | 2 | Fixed — 2.0% | Floating — LIBOR | (37,157 | ) | 593 | (37,750 | ) | |||||||||
7/16/2013 7/16/2018 | 18,000,000 | 2 | Floating — LIBOR | Fixed — 1.148% | 78,458 | — | 78,458 | |||||||||||
7/16/2013 7/16/2033 | 1,300,000 | 2 | Floating — LIBOR | Fixed — 2.322% | (46,534 | ) | — | (46,534 | ) | |||||||||
7/16/2013 7/16/2043 | 2,200,000 | 2 | Floating — LIBOR | Fixed — 2.424% | (116,408 | ) | — | (116,408 | ) | |||||||||
| Total net unrealized depreciation | (92,669 | ) | ||||||||||||||||
Counterparty:
1 BNP Paribas
2 Citigroup, Inc.
3 Credit Suisse
At October 31, 2012, open written options contracts were as follows:
| Options on Exchange-Traded Futures Contracts | |||||||||||||||||
| Contracts | Expiration Date | Strike Price ($) | Premiums Received ($) | Value ($) (m) | |||||||||||||
Call Options 10 Year U.S. Treasury Note Future | 43 | 11/23/2012 | 135.0 | 16,702 | (3,359 | ) | |||||||||||
(m) Unrealized appreciation on written options on exchange-traded futures contracts at October 31, 2012 was $13,343.
| Options on Interest Rate Swap Contracts | ||||||||||||||
| Swap Effective/ Expiration Date | Contract Amount | Option Expiration Date | Premiums Received ($) | Value ($) (n) | ||||||||||
Call Options Fixed — 4.083% - Floating — LIBOR | 5/11/2016 5/11/2026 | 3,100,000 | 5/9/2016 | 105,400 | (68,083 | ) | ||||||||
| Fixed — 4.135% - Floating — LIBOR | 4/27/2016 4/27/2026 | 9,400,000 | 4/25/2016 | 347,800 | (195,738 | ) | ||||||||
| Fixed — 4.22% - Floating — LIBOR | 4/22/2016 4/22/2026 | 9,400,000 | 4/20/2016 | 335,110 | (183,710 | ) | ||||||||
| Total Call Options | 788,310 | (447,531 | ) | |||||||||||
Put Options Fixed — 1.9% - Floating — LIBOR | 4/24/2013 4/24/2023 | 9,400,000 | 4/22/2013 | 128,780 | (204,395 | ) | ||||||||
| Fixed — 2.07% - Floating — LIBOR | 5/10/2013 5/10/2043 | 3,100,000 | 5/8/2013 | 49,600 | (35,199 | ) | ||||||||
| Fixed — 2.09% - Floating — LIBOR | 4/25/2013 4/25/2043 | 9,400,000 | 5/8/2013 | 176,720 | (102,504 | ) | ||||||||
| Total Put Options | 355,100 | (342,098 | ) | |||||||||||
| Total | 1,143,410 | (789,629 | ) | |||||||||||
(n) Unrealized appreciation on written options on interest rate swap contracts at October 31, 2012 was $353,781.
As of October 31, 2012, the Fund had the following open forward foreign currency exchange contracts:
| Contracts to Deliver | In Exchange For | Settlement Date | Unrealized Appreciation ($) | Counterparty | |||||||||||
| USD | 4,650,203 | NZD | 5,700,000 | 11/2/2012 | 37,479 | Barclays Bank PLC | |||||||||
| NZD | 5,700,000 | USD | 4,716,459 | 11/2/2012 | 28,778 | BNP Paribas | |||||||||
| USD | 2,271,824 | ZAR | 20,000,000 | 11/9/2012 | 32,489 | Barclays Bank PLC | |||||||||
| JPY | 380,000,000 | USD | 4,799,616 | 11/20/2012 | 38,826 | Barclays Bank PLC | |||||||||
| EUR | 2,900,000 | TRY | 6,820,800 | 11/30/2012 | 31,140 | Barclays Bank PLC | |||||||||
| CAD | 10,000,000 | USD | 10,220,194 | 1/9/2013 | 222,357 | Barclays Bank PLC | |||||||||
| EUR | 3,300,000 | USD | 4,305,131 | 1/9/2013 | 24,826 | JPMorgan Chase Securities, Inc. | |||||||||
| Total unrealized appreciation | 415,895 | ||||||||||||||
| Contracts to Deliver | In Exchange For | Settlement Date | Unrealized Depreciation ($) | Counterparty | |||||||||||
| ZAR | 20,000,000 | USD | 2,293,052 | 11/9/2012 | (11,261 | ) | Barclays Bank PLC | ||||||||
| EUR | 1,807,700 | USD | 2,338,585 | 11/16/2012 | (4,750 | ) | JPMorgan Chase Securities, Inc. | ||||||||
| USD | 4,800,762 | JPY | 380,000,000 | 11/20/2012 | (39,972 | ) | Barclays Bank PLC | ||||||||
| JPY | 380,000,000 | USD | 4,760,724 | 11/26/2012 | (292 | ) | Nomura International PLC | ||||||||
| JPY | 190,000,000 | USD | 2,367,955 | 11/26/2012 | (12,552 | ) | JPMorgan Chase Securities, Inc. | ||||||||
| CAD | 4,700,000 | USD | 4,692,080 | 11/26/2012 | (11,448 | ) | JPMorgan Chase Securities, Inc. | ||||||||
| USD | 4,733,780 | CAD | 4,700,000 | 11/26/2012 | (30,253 | ) | BNP Paribas | ||||||||
| USD | 7,165,458 | JPY | 570,000,000 | 11/26/2012 | (23,934 | ) | JPMorgan Chase Securities, Inc. | ||||||||
| AUD | 4,950,000 | USD | 5,008,262 | 1/9/2013 | (102,044 | ) | Barclays Bank PLC | ||||||||
| Total unrealized depreciation | (236,506 | ) | |||||||||||||
| Currency Abbreviations |
AUD Australian Dollar CAD Canadian Dollar EUR Euro GBP British Pound JPY Japanese Yen NZD New Zealand Dollar TRY Turkish Lira USD United States Dollar ZAR South African Rand |
For information on the Fund's policy and additional disclosures regarding options purchased, futures contracts, credit default swap contracts, interest rate swap contracts, written option contracts and forward foreign currency exchange contracts, please refer to Note B in the accompanying Notes to Financial Statements.
Fair Value Measurements
Various inputs are used in determining the value of the Fund's investments. These inputs are summarized in three broad levels. Level 1 includes quoted prices in active markets for identical securities. Level 2 includes other significant observable inputs (including quoted prices for similar securities, interest rates, prepayment speeds and credit risk). Level 3 includes significant unobservable inputs (including the Fund's own assumptions in determining the fair value of investments). The inputs or methodology used for valuing securities are not necessarily an indication of the risk associated with investing in those securities.
The following is a summary of the inputs used as of October 31, 2012 in valuing the Fund's investments. For information on the Fund's policy regarding the valuation of investments, please refer to the Security Valuation section of Note A in the accompanying Notes to Financial Statements.
| Assets | Level 1 | Level 2 | Level 3 | Total | ||||||||||||
| Common Stocks and/or Other Equity Investments (o) | ||||||||||||||||
| Consumer Discretionary | $ | 17,545,478 | $ | 21,705,098 | $ | 0 | $ | 39,250,576 | ||||||||
| Consumer Staples | 54,947,710 | 43,684,765 | — | 98,632,475 | ||||||||||||
| Energy | 60,950,724 | 7,175,733 | — | 68,126,457 | ||||||||||||
| Financials | 35,970,574 | 19,113,133 | — | 55,083,707 | ||||||||||||
| Health Care | — | 61,691,772 | — | 61,691,772 | ||||||||||||
| Industrials | 9,007,487 | 32,980,905 | 0 | 41,988,392 | ||||||||||||
| Information Technology | 41,654,884 | 8,849,528 | — | 50,504,412 | ||||||||||||
| Materials | 36,584,718 | 8,882,312 | 29,825 | 45,496,855 | ||||||||||||
| Telecommunication Services | 21,386,828 | 23,685,046 | — | 45,071,874 | ||||||||||||
| Utilities | 22,690,761 | 8,829,987 | — | 31,520,748 | ||||||||||||
| Fixed Income Investments (o) | ||||||||||||||||
| Corporate Bonds | — | 297,964,487 | 27,280 | 297,991,767 | ||||||||||||
| Asset Backed | — | 4,626,621 | — | 4,626,621 | ||||||||||||
| Mortgage-Backed Securities Pass-Throughs | — | 39,456,902 | — | 39,456,902 | ||||||||||||
| Commercial Mortgage- Backed Securities | — | 11,996,330 | — | 11,996,330 | ||||||||||||
| Collateralized Mortgage Obligations | — | 23,392,192 | — | 23,392,192 | ||||||||||||
| Government & Agency Obligations | — | 99,936,345 | — | 99,936,345 | ||||||||||||
| Convertible Bond | — | — | 608,420 | 608,420 | ||||||||||||
| Loan Participations and Assignments | — | 17,307,937 | 0 | 17,307,937 | ||||||||||||
| Preferred Securities | — | 1,397,106 | 130,425 | 1,527,531 | ||||||||||||
| Other Investments | — | — | 20,865 | 20,865 | ||||||||||||
| Warrants (o) | — | — | 26,681 | 26,681 | ||||||||||||
| Short-Term Investments (o) | 159,977,224 | — | — | 159,977,224 | ||||||||||||
| Derivatives (p) | ||||||||||||||||
| Futures Contracts | 336,947 | — | — | 336,947 | ||||||||||||
| Options on Exchange- Traded Futures Contracts | 11,813 | — | — | 11,813 | ||||||||||||
| Options on Interest Rate Swap Contracts | — | 631,717 | — | 631,717 | ||||||||||||
| Credit Default Swap Contracts | — | 265,302 | — | 265,302 | ||||||||||||
| Interest Rate Swap Contracts | — | 108,023 | — | 108,023 | ||||||||||||
| Forward Foreign Currency Exchange Contracts | —- | 415,895 | — | 415,895 | ||||||||||||
| Total | $ | 461,065,148 | $ | 734,097,136 | $ | 843,496 | $ | 1,196,005,780 | ||||||||
| Liabilities | ||||||||||||||||
| Derivatives (p) | ||||||||||||||||
| Futures Contracts | $ | (16,370 | ) | $ | — | $ | — | $ | (16,370 | ) | ||||||
| Options on Exchange- Traded Futures Contracts | (3,359 | ) | — | — | (3,359 | ) | ||||||||||
| Options on Interest Rate Swap Contracts | — | (789,629 | ) | — | (789,629 | ) | ||||||||||
| Credit Default Swap Contracts | — | (236,354 | ) | — | (236,354 | ) | ||||||||||
| Interest Rate Swap Contracts | — | (200,692 | ) | — | (200,692 | ) | ||||||||||
| Forward Foreign Currency Exchange Contracts | — | (236,506 | ) | — | (236,506 | ) | ||||||||||
| Total | $ | (19,729 | ) | $ | (1,463,181 | ) | $ | — | $ | (1,482,910 | ) | |||||
There have been no transfers between fair value measurement levels during the year ended October 31, 2012.
(o) See Investment Portfolio for additional detailed categorizations.
(p) Derivatives include value of options purchased, written options, at value, and unrealized appreciation (depreciation) on futures contracts, credit default swap contracts, interest rate swap contracts and forward foreign currency exchange contracts.
The accompanying notes are an integral part of the financial statements.
| as of October 31, 2012 | ||||
| Assets | ||||
Investments: Investments in non-affiliated securities, at value (cost $1,006,742,389) — including $126,613,012 of securities loaned | $ | 1,034,902,389 | ||
| Investment in Daily Assets Fund Institutional (cost $131,131,782)* | 131,131,782 | |||
| Investment in Central Cash Management Fund (cost $28,845,442) | 28,845,442 | |||
| Total investments in securities, at value (cost $1,166,719,613) | 1,194,879,613 | |||
| Cash | 2,555,683 | |||
| Foreign currency, at value (cost $1,533,511) | 1,539,547 | |||
| Receivable for investments sold | 15,245,942 | |||
| Receivable for investments sold — when-issued securities | 9,779,516 | |||
| Receivable for Fund shares sold | 107,927 | |||
| Dividends receivable | 1,068,281 | |||
| Interest receivable | 5,365,723 | |||
| Receivable for variation margin on futures contracts | 189,994 | |||
| Unrealized appreciation on swap contracts | 373,325 | |||
| Unrealized appreciation on forward foreign currency exchange contracts | 415,895 | |||
| Upfront payments paid on swap contracts | 799,725 | |||
| Foreign taxes recoverable | 183,288 | |||
| Other assets | 28,418 | |||
| Total assets | 1,232,532,877 | |||
| Liabilities | ||||
| Payable upon return of securities loaned | 131,131,782 | |||
| Payable for investments purchased | 55,241,782 | |||
| Payable for investments purchased — when-issued securities | 33,536,423 | |||
| Payable for Fund shares redeemed | 1,520,575 | |||
| Options written, at value (premium received $1,160,112) | 792,988 | |||
| Unrealized depreciation on swap contracts | 437,046 | |||
| Unrealized depreciation on forward foreign currency exchange contracts | 236,506 | |||
| Upfront payments received on swap contracts | 895,086 | |||
| Accrued management fee | 318,341 | |||
| Accrued Trustees' fee | 6,002 | |||
| Other accrued expenses and payables | 822,959 | |||
| Total liabilities | 224,939,490 | |||
| Net assets, at value | $ | 1,007,593,387 | ||
* Represents collateral of securities loaned.
The accompanying notes are an integral part of the financial statements.
Statement of Assets and Liabilities as of October 31, 2012 (continued) | ||||
| Net Assets Consist of | ||||
| Undistributed net investment income | 12,278,647 | |||
Net unrealized appreciation (depreciation) on: Investments | 28,160,000 | |||
| Swap contracts | (63,721 | ) | ||
| Futures | 320,577 | |||
| Foreign currency | 187,686 | |||
| Written options | 367,124 | |||
| Accumulated net realized gain (loss) | 24,283,605 | |||
| Paid-in capital | 942,059,469 | |||
| Net assets, at value | $ | 1,007,593,387 | ||
| Net Asset Value | ||||
Class A Net Asset Value and redemption price per share ($747,916,908 ÷ 78,243,649 outstanding shares of beneficial interest, no par value, unlimited number of shares authorized) | $ | 9.56 | ||
| Maximum offering price per share (100 ÷ 94.25 of $9.56) | $ | 10.14 | ||
Class B Net Asset Value, offering and redemption price (subject to contingent deferred sales charge) per share ($4,578,773 ÷ 478,649 outstanding shares of beneficial interest, no par value, unlimited number of shares authorized) | $ | 9.57 | ||
Class C Net Asset Value, offering and redemption price (subject to contingent deferred sales charge) per share ($17,248,872 ÷ 1,806,960 outstanding shares of beneficial interest, no par value, unlimited number of shares authorized) | $ | 9.55 | ||
Class S Net Asset Value, offering and redemption price per share ($236,175,887 ÷ 24,702,818 outstanding shares of beneficial interest, no par value, unlimited number of shares authorized) | $ | 9.56 | ||
Institutional Class Net Asset Value, offering and redemption price per share ($1,672,947 ÷ 175,063 outstanding shares of beneficial interest, no par value, unlimited number of shares authorized) | $ | 9.56 | ||
The accompanying notes are an integral part of the financial statements.
| for the year ended October 31, 2012 | ||||
| Investment Income | ||||
Income: Dividends (net of foreign taxes withheld of $1,153,232) | $ | 19,362,443 | ||
| Interest | 16,566,098 | |||
| Income distributions — Central Cash Management Fund | 90,416 | |||
| Securities lending income, including income from Daily Assets Fund Institutional, net of borrower rebates | 605,246 | |||
| Total income | 36,624,203 | |||
Expenses: Management fee | 3,782,066 | |||
| Administration fee | 1,022,180 | |||
| Services to shareholders | 1,587,103 | |||
| Distribution and service fees | 2,041,018 | |||
| Custodian fee | 112,870 | |||
| Professional fees | 128,742 | |||
| Reports to shareholders | 126,078 | |||
| Registration fees | 78,794 | |||
| Trustees' fees and expenses | 40,730 | |||
| Other | 121,568 | |||
| Total expenses | 9,041,149 | |||
| Net investment income | 27,583,054 | |||
| Realized and Unrealized Gain (Loss) | ||||
Net realized gain (loss) from: Investments | 142,890,666 | |||
| Swap contracts | 3,938 | |||
| Futures | 1,869,495 | |||
| Written options | 74,394 | |||
| Foreign currency | (1,739,855 | ) | ||
| Payment by affiliate (see Note G) | 5,469 | |||
| 143,104,107 | ||||
Change in net unrealized appreciation (depreciation) on: Investments | (77,053,698 | ) | ||
| Swap contracts | (63,721 | ) | ||
| Futures | 240,479 | |||
| Written options | 367,124 | |||
| Foreign currency | 664,008 | |||
| (75,845,808 | ) | |||
| Net gain (loss) | 67,258,299 | |||
| Net increase (decrease) in net assets resulting from operations | $ | 94,841,353 | ||
The accompanying notes are an integral part of the financial statements.
| Years Ended October 31, | ||||||||
| Increase (Decrease) in Net Assets | 2012 | 2011 | ||||||
Operations: Net investment income | $ | 27,583,054 | $ | 18,164,883 | ||||
| Net realized gain (loss) | 143,104,107 | 50,699,536 | ||||||
| Change in net unrealized appreciation (depreciation) | (75,845,808 | ) | (42,514,685 | ) | ||||
| Net increase (decrease) in net assets resulting from operations | 94,841,353 | 26,349,734 | ||||||
Distributions to shareholders from: Net investment income: Class A | (16,516,361 | ) | (11,686,055 | ) | ||||
| Class B | (60,821 | ) | (28,500 | ) | ||||
| Class C | (238,537 | ) | (117,761 | ) | ||||
| Class S | (5,649,081 | ) | (4,053,702 | ) | ||||
| Institutional Class | (36,483 | ) | (47,820 | ) | ||||
| Total distributions | (22,501,283 | ) | (15,933,838 | ) | ||||
Fund share transactions: Proceeds from shares sold | 26,808,247 | 38,994,151 | ||||||
| Reinvestment of distributions | 21,195,014 | 14,953,040 | ||||||
| Payments for shares redeemed | (159,469,833 | ) | (183,483,913 | ) | ||||
| Net increase (decrease) in net assets from Fund share transactions | (111,466,572 | ) | (129,536,722 | ) | ||||
| Increase (decrease) in net assets | (39,126,502 | ) | (119,120,826 | ) | ||||
| Net assets at beginning of period | 1,046,719,889 | 1,165,840,715 | ||||||
| Net assets at end of period (including undistributed net investment income of $12,278,647 and $4,797,317, respectively) | $ | 1,007,593,387 | $ | 1,046,719,889 | ||||
The accompanying notes are an integral part of the financial statements.
| Years Ended October 31, | |||||||||||||||||||||
| Class A | 2012 | 2011 | 2010 | 2009 | 2008 | ||||||||||||||||
| Selected Per Share Data | |||||||||||||||||||||
| Net asset value, beginning of period | $ | 8.91 | $ | 8.85 | $ | 8.10 | $ | 7.11 | $ | 10.25 | |||||||||||
Income (loss) from investment operations: Net investment incomea | .25 | .14 | .13 | .16 | .23 | ||||||||||||||||
| Net realized and unrealized gain (loss) | .60 | .05 | .86 | .96 | (3.05 | ) | |||||||||||||||
| Total from investment operations | .85 | .19 | .99 | 1.12 | (2.82 | ) | |||||||||||||||
Less distributions from: Net investment income | (.20 | ) | (.13 | ) | (.17 | ) | (.13 | ) | (.23 | ) | |||||||||||
| Net realized gains | — | — | (.07 | ) | — | (.05 | ) | ||||||||||||||
| Tax return of capital | — | — | — | — | (.04 | ) | |||||||||||||||
| Total distributions | (.20 | ) | (.13 | ) | (.24 | ) | (.13 | ) | (.32 | ) | |||||||||||
| Net asset value, end of period | $ | 9.56 | $ | 8.91 | $ | 8.85 | $ | 8.10 | $ | 7.11 | |||||||||||
Total Return (%)b | 9.67 | 2.11 | 12.44 | 15.93 | c | (28.25 | )c | ||||||||||||||
| Ratios to Average Net Assets and Supplemental Data | |||||||||||||||||||||
| Net assets, end of period ($ millions) | 748 | 780 | 874 | 885 | 815 | ||||||||||||||||
| Ratio of expenses before expense reductions (%) | .91 | .93 | .97 | .98 | .99 | ||||||||||||||||
| Ratio of expenses after expense reductions (%) | .91 | .93 | .97 | .97 | .96 | ||||||||||||||||
| Ratio of net investment income (%) | 2.67 | 1.58 | 1.51 | 2.24 | 2.51 | ||||||||||||||||
| Portfolio turnover rate (%) | 204 | 137 | 251 | 204 | 276 | ||||||||||||||||
a Based on average shares outstanding during the period. b Total return does not reflect the effect of any sales charges. c Total return would have been lower had certain expenses not been reduced. | |||||||||||||||||||||
| Years Ended October 31, | |||||||||||||||||||||
| Class B | 2012 | 2011 | 2010 | 2009 | 2008 | ||||||||||||||||
| Selected Per Share Data | |||||||||||||||||||||
| Net asset value, beginning of period | $ | 8.91 | $ | 8.85 | $ | 8.11 | $ | 7.15 | $ | 10.30 | |||||||||||
Income (loss) from investment operations: Net investment incomea | .15 | .06 | .04 | .11 | .22 | ||||||||||||||||
| Net realized and unrealized gain (loss) | .62 | .03 | .87 | .95 | (3.07 | ) | |||||||||||||||
| Total from investment operations | .77 | .09 | .91 | 1.06 | (2.85 | ) | |||||||||||||||
Less distributions from: Net investment income | (.11 | ) | (.03 | ) | (.10 | ) | (.10 | ) | (.21 | ) | |||||||||||
| Net realized gains | — | — | (.07 | ) | — | (.05 | ) | ||||||||||||||
| Tax return of capital | — | — | — | — | (.04 | ) | |||||||||||||||
| Total distributions | (.11 | ) | (.03 | ) | (.17 | ) | (.10 | ) | (.30 | ) | |||||||||||
| Net asset value, end of period | $ | 9.57 | $ | 8.91 | $ | 8.85 | $ | 8.11 | $ | 7.15 | |||||||||||
Total Return (%)b | 8.70 | 1.06 | 11.25 | 15.19 | c | (28.34 | )c | ||||||||||||||
| Ratios to Average Net Assets and Supplemental Data | |||||||||||||||||||||
| Net assets, end of period ($ millions) | 5 | 6 | 10 | 17 | 22 | ||||||||||||||||
| Ratio of expenses before expense reductions (%) | 1.89 | 1.89 | 2.00 | 1.90 | 1.90 | ||||||||||||||||
| Ratio of expenses after expense reductions (%) | 1.89 | 1.89 | 2.00 | 1.69 | 1.13 | ||||||||||||||||
| Ratio of net investment income (%) | 1.66 | .62 | .48 | 1.51 | 2.34 | ||||||||||||||||
| Portfolio turnover rate (%) | 204 | 137 | 251 | 204 | 276 | ||||||||||||||||
a Based on average shares outstanding during the period. b Total return does not reflect the effect of any sales charges. c Total return would have been lower had certain expenses not been reduced. | |||||||||||||||||||||
| Years Ended October 31, | |||||||||||||||||||||
| Class C | 2012 | 2011 | 2010 | 2009 | 2008 | ||||||||||||||||
| Selected Per Share Data | |||||||||||||||||||||
| Net asset value, beginning of period | $ | 8.89 | $ | 8.84 | $ | 8.08 | $ | 7.10 | $ | 10.22 | |||||||||||
Income (loss) from investment operations: Net investment incomea | .17 | .07 | .06 | .10 | .15 | ||||||||||||||||
| Net realized and unrealized gain (loss) | .62 | .03 | .87 | .94 | (3.03 | ) | |||||||||||||||
| Total from investment operations | .79 | .10 | .93 | 1.04 | (2.88 | ) | |||||||||||||||
Less distributions from: Net investment income | (.13 | ) | (.05 | ) | (.10 | ) | (.06 | ) | (.15 | ) | |||||||||||
| Net realized gains | — | — | (.07 | ) | — | (.05 | ) | ||||||||||||||
| Tax return of capital | — | — | — | — | (.04 | ) | |||||||||||||||
| Total distributions | (.13 | ) | (.05 | ) | (.17 | ) | (.06 | ) | (.24 | ) | |||||||||||
| Net asset value, end of period | $ | 9.55 | $ | 8.89 | $ | 8.84 | $ | 8.08 | $ | 7.10 | |||||||||||
Total Return (%)b | 8.90 | 1.16 | 11.49 | 15.11 | (28.85 | )c | |||||||||||||||
| Ratios to Average Net Assets and Supplemental Data | |||||||||||||||||||||
| Net assets, end of period ($ millions) | 17 | 19 | 21 | 22 | 18 | ||||||||||||||||
| Ratio of expenses before expense reductions (%) | 1.74 | 1.75 | 1.79 | 1.81 | 1.82 | ||||||||||||||||
| Ratio of expenses after expense reductions (%) | 1.74 | 1.75 | 1.79 | 1.81 | 1.82 | ||||||||||||||||
| Ratio of net investment income (%) | 1.84 | .76 | .68 | 1.39 | 1.65 | ||||||||||||||||
| Portfolio turnover rate (%) | 204 | 137 | 251 | 204 | 276 | ||||||||||||||||
a Based on average shares outstanding during the period. b Total return does not reflect the effect of any sales charges. c Total return would have been lower had certain expenses not been reduced. | |||||||||||||||||||||
| Years Ended October 31, | |||||||||||||||||||||
| Class S | 2012 | 2011 | 2010 | 2009 | 2008 | ||||||||||||||||
| Selected Per Share Data | |||||||||||||||||||||
| Net asset value, beginning of period | $ | 8.91 | $ | 8.85 | $ | 8.10 | $ | 7.11 | $ | 10.25 | |||||||||||
Income (loss) from investment operations: Net investment incomea | .27 | .16 | .14 | .18 | .25 | ||||||||||||||||
| Net realized and unrealized gain (loss) | .60 | .04 | .87 | .95 | (3.06 | ) | |||||||||||||||
| Total from investment operations | .87 | .20 | 1.01 | 1.13 | (2.81 | ) | |||||||||||||||
Less distributions from: Net investment income | (.22 | ) | (.14 | ) | (.19 | ) | (.14 | ) | (.24 | ) | |||||||||||
| Net realized gains | — | — | (.07 | ) | — | (.05 | ) | ||||||||||||||
| Tax return of capital | — | — | — | — | (.04 | ) | |||||||||||||||
| Total distributions | (.22 | ) | (.14 | ) | (.26 | ) | (.14 | ) | (.33 | ) | |||||||||||
| Net asset value, end of period | $ | 9.56 | $ | 8.91 | $ | 8.85 | $ | 8.10 | $ | 7.11 | |||||||||||
| Total Return (%) | 9.90 | 2.20 | 12.84 | 16.17 | b | (28.11 | )b | ||||||||||||||
| Ratios to Average Net Assets and Supplemental Data | |||||||||||||||||||||
| Net assets, end of period ($ millions) | 236 | 241 | 258 | 251 | 245 | ||||||||||||||||
| Ratio of expenses before expense reductions (%) | .71 | .73 | .77 | .80 | .79 | ||||||||||||||||
| Ratio of expenses after expense reductions (%) | .71 | .73 | .77 | .72 | .77 | ||||||||||||||||
| Ratio of net investment income (%) | 2.88 | 1.78 | 1.70 | 2.48 | 2.70 | ||||||||||||||||
| Portfolio turnover rate (%) | 204 | 137 | 251 | 204 | 276 | ||||||||||||||||
a Based on average shares outstanding during the period. b Total return would have been lower had certain expenses not been reduced. | |||||||||||||||||||||
| Years Ended October 31, | |||||||||||||||||||||
| Institutional Class | 2012 | 2011 | 2010 | 2009 | 2008 | ||||||||||||||||
| Selected Per Share Data | |||||||||||||||||||||
| Net asset value, beginning of period | $ | 8.91 | $ | 8.86 | $ | 8.11 | $ | 7.12 | $ | 10.26 | |||||||||||
Income (loss) from investment operations: Net investment incomea | .27 | .17 | .16 | .19 | .26 | ||||||||||||||||
| Net realized and unrealized gain (loss) | .61 | .04 | .87 | .95 | (3.06 | ) | |||||||||||||||
| Total from investment operations | .88 | .21 | 1.03 | 1.14 | (2.80 | ) | |||||||||||||||
Less distributions from: Net investment income | (.23 | ) | (.16 | ) | (.21 | ) | (.15 | ) | (.25 | ) | |||||||||||
| Net realized gains | — | — | (.07 | ) | — | (.05 | ) | ||||||||||||||
| Tax return of capital | — | — | — | — | (.04 | ) | |||||||||||||||
| Total distributions | (.23 | ) | (.16 | ) | (.28 | ) | (.15 | ) | (.34 | ) | |||||||||||
| Net asset value, end of period | $ | 9.56 | $ | 8.91 | $ | 8.86 | $ | 8.11 | $ | 7.12 | |||||||||||
| Total Return (%) | 10.02 | 2.37 | 12.85 | 16.23 | (27.99 | )b | |||||||||||||||
| Ratios to Average Net Assets and Supplemental Data | |||||||||||||||||||||
| Net assets, end of period ($ millions) | 2 | 1 | 4 | 3 | .27 | ||||||||||||||||
| Ratio of expenses before expense reductions (%) | .65 | .61 | .60 | .57 | .75 | ||||||||||||||||
| Ratio of expenses after expense reductions (%) | .65 | .61 | .60 | .57 | .71 | ||||||||||||||||
| Ratio of net investment income (%) | 2.94 | 1.90 | 1.87 | 2.63 | 2.76 | ||||||||||||||||
| Portfolio turnover rate (%) | 204 | 137 | 251 | 204 | 276 | ||||||||||||||||
a Based on average shares outstanding during the period. b Total return would have been lower had certain expenses not been reduced. | |||||||||||||||||||||
A. Organization and Significant Accounting Policies
DWS Global Income Builder Fund (formerly DWS Balanced Fund) (the "Fund") is a diversified series of DWS Market Trust (the "Trust"), which is registered under the Investment Company Act of 1940, as amended (the "1940 Act"), as an open-end management investment company organized as a Massachusetts business trust.
The Fund offers multiple classes of shares which provide investors with different purchase options. Class A shares are offered to investors subject to an initial sales charge. Class B shares of the Fund are closed to new purchases, except exchanges or the reinvestment of dividends or other distributions. Class B shares were offered to investors without an initial sales charge and are subject to higher ongoing expenses than Class A shares and a contingent deferred sales charge payable upon certain redemptions. Class B shares automatically convert to Class A shares six years after issuance. Class C shares are offered to investors without an initial sales charge but are subject to higher ongoing expenses than Class A shares and a contingent deferred sales charge payable upon certain redemptions within one year of purchase. Class C shares do not automatically convert into another class. Institutional Class shares are offered to a limited group of investors, are not subject to initial or contingent deferred sales charges and generally have lower ongoing expenses than other classes. Class S shares are not subject to initial or contingent deferred sales charges and are generally not available to new investors except under certain circumstances.
Investment income, realized and unrealized gains and losses, and certain fund-level expenses and expense reductions, if any, are borne pro rata on the basis of relative net assets by the holders of all classes of shares, except that each class bears certain expenses unique to that class such as distribution and service fees, administration fee, services to shareholders and certain other class-specific expenses. Differences in class-level expenses may result in payment of different per share dividends by class. All shares of the Fund have equal rights with respect to voting subject to class-specific arrangements.
The Fund's financial statements are prepared in accordance with accounting principles generally accepted in the United States of America which require the use of management estimates. Actual results could differ from those estimates. The policies described below are followed consistently by the Fund in the preparation of its financial statements.
Security Valuation. Investments are stated at value determined as of the close of regular trading on the New York Stock Exchange on each day the exchange is open for trading.
Various inputs are used in determining the value of the Fund's investments. These inputs are summarized in three broad levels. Level 1 includes quoted prices in active markets for identical securities. Level 2 includes other significant observable inputs (including quoted prices for similar securities, interest rates, prepayment speeds, and credit risk). Level 3 includes significant unobservable inputs (including the Fund's own assumptions in determining the fair value of investments). The inputs or methodology used for valuing securities are not necessarily an indication of the risk associated with investing in those securities.
Equity securities are valued at the most recent sale price or official closing price reported on the exchange (U.S. or foreign) or over-the-counter market on which they trade and are categorized as Level 1 securities. Securities for which no sales are reported are valued at the calculated mean between the most recent bid and asked quotations on the relevant market or, if a mean cannot be determined, at the most recent bid quotation. For certain international equity securities, in order to adjust for events which may occur between the close of the foreign exchanges and the close of the New York Stock Exchange, a fair valuation model may be used. This fair valuation model takes into account comparisons to the valuation of American Depository Receipts (ADRs), exchange-traded funds, futures contracts and certain indices and these securities are categorized as Level 2.
Debt securities and loan participations and assignments are valued at prices supplied by independent pricing services approved by the Fund's Board. If the pricing services are unable to provide valuations, securities are valued at the most recent bid quotation or evaluated price, as applicable, obtained from one or more broker-dealers. Such services may use various pricing techniques which take into account appropriate factors such as yield, quality, coupon rate, maturity, type of issue, trading characteristics and other data, as well as broker quotes. These securities are generally categorized as Level 2.
Money market instruments purchased with an original or remaining maturity of sixty days or less, maturing at par, are valued at amortized cost, which approximates value, and are categorized as Level 2. Investments in open-end investment companies are valued at their net asset value each business day and are categorized as Level 1.
Futures contracts are generally valued at the settlement prices established each day on the exchange on which they are traded and are categorized as Level 1.
Forward currency contracts are valued at the prevailing forward exchange rate of the underlying currencies and are categorized as Level 2.
Swap contracts are valued daily based upon prices supplied by a Board approved pricing vendor, if available, and otherwise are valued at the price provided by the broker-dealer. Swap contracts are generally categorized as Level 2.
Exchange-traded options are valued at the last sale price or, in the absence of a sale, the mean between the closing bid and asked prices or at the most recent asked price (bid for purchased options) if no bid or asked price is available. Exchange-traded options are categorized as Level 1. Over-the-counter written or purchased options are valued at the price provided by the broker-dealer with which the option was traded and are generally categorized as Level 2.
Securities and other assets for which market quotations are not readily available or for which the above valuation procedures are deemed not to reflect fair value are valued in a manner that is intended to reflect their fair value as determined in accordance with procedures approved by the Board and are generally categorized as Level 3. In accordance with the Fund's valuation procedures, factors used in determining value may include, but are not limited to, the type of the security; the size of the holding; the initial cost of the security; the existence of any contractual restrictions on the security's disposition; the price and extent of public trading in similar securities of the issuer or of comparable companies; quotations or evaluated prices from broker-dealers and/or pricing services; information obtained from the issuer, analysts, and/or the appropriate stock exchange (for exchange-traded securities); an analysis of the company's or issuer's financial statements; an evaluation of the forces that influence the issuer and the market(s) in which the security is purchased and sold and with respect to debt securities; the maturity, coupon, creditworthiness, currency denomination and the movement of the market in which the security is normally traded. The value determined under these procedures may differ from published values for the same securities.
Disclosure about the classification of fair value measurements is included in a table following the Fund's Investment Portfolio.
New Accounting Pronouncement. In December 2011, Accounting Standards Update 2011-11 (ASU 2011-11), Disclosures about Offsetting Assets and Liabilities, was issued and is effective for fiscal years beginning on or after January 1, 2013, and interim periods within those annual periods. ASU 2011-11 is intended to enhance disclosure requirements on the offsetting of financial assets and liabilities. Management is currently evaluating the application of ASU 2011-11 and its impact, if any, on the Fund's financial statements.
Foreign Currency Translations. The books and records of the Fund are maintained in U.S. dollars. Investment securities and other assets and liabilities denominated in a foreign currency are translated into U.S. dollars at the prevailing exchange rates at period end. Purchases and sales of investment securities, income and expenses are translated into U.S. dollars at the prevailing exchange rates on the respective dates of the transactions.
Net realized and unrealized gains and losses on foreign currency transactions represent net gains and losses between trade and settlement dates on securities transactions, the acquisition and disposition of foreign currencies, and the difference between the amount of net investment income accrued and the U.S. dollar amount actually received. That portion of both realized and unrealized gains and losses on investments that results from fluctuations in foreign currency exchange rates is not separately disclosed but is included with net realized and unrealized gain/appreciation and loss/depreciation on investments.
Securities Lending. The Fund lends securities to certain financial institutions. The Fund retains beneficial ownership of the securities it has loaned and continues to receive interest and dividends paid by the issuer of securities and to participate in any changes in their market value. The Fund requires the borrowers of the securities to maintain collateral with the Fund consisting of either cash or liquid, unencumbered assets having a value at least equal to the value of the securities loaned. When the collateral falls below specified amounts, the lending agent will use its best effort to obtain additional collateral on the next business day to meet required amounts under the security lending agreement. The Fund may invest the cash collateral into a joint trading account in an affiliated money market fund pursuant to Exemptive Orders issued by the SEC. The Fund receives compensation for lending its securities either in the form of fees or by earning interest on invested cash collateral net of borrower rebates and fees paid to a lending agent. Either the Fund or the borrower may terminate the loan. There may be risks of delay and costs in recovery of securities or even loss of rights in the collateral should the borrower of the securities fail financially. The Fund is also subject to all investment risks associated with the reinvestment of any cash collateral received, including, but not limited to, interest rate, credit and liquidity risk associated with such investments.
Loan Participations and Assignments. Loan Participations and Assignments are portions of loans originated by banks and sold in pieces to investors. These fixed and floating rate loans ("Loans") in which the Fund invests are arranged between the borrower and one or more financial institutions ("Lenders"). These Loans may take the form of Senior Loans, which are corporate obligations often issued in connection with recapitalizations, acquisitions, leveraged buy-outs and refinancings, and Sovereign Loans, which are debt instruments between a foreign sovereign entity and one or more financial institutions. The Fund invests in such Loans in the form of participations in Loans ("Participations") or assignments of all or a portion of Loans from third parties ("Assignments"). Participations typically result in the Fund having a contractual relationship only with the Lender, not with the borrower. The Fund has the right to receive payments of principal, interest and any fees to which it is entitled from the Lender selling the Participation and only upon receipt by the Lender of the payments from the borrower. In connection with purchasing Participations, the Fund generally has no right to enforce compliance by the borrower with the terms of the loan agreement relating to the Loan, or any rights of set-off against the borrower, and the Fund will not benefit directly from any collateral supporting the Loan in which it has purchased the Participation. As a result, the Fund assumes the credit risk of both the borrower and the Lender that is selling the Participation. Assignments typically result in the Fund having a direct contractual relationship with the borrower, and the Fund may enforce compliance by the borrower with the terms of the loan agreement. Loans held by the Fund are generally in the form of Assignments but the Fund may also invest in Participants. All Loan Participations and Assignments involve interest rate risk, liquidity risk and credit risk, including the potential default or insolvency of the borrower.
When-Issued/Delayed Delivery Securities. The Fund may purchase or sell securities with delivery or payment to occur at a later date beyond the normal settlement period. At the time the Fund enters into a commitment to purchase or sell a security, the transaction is recorded and the value of the transaction is reflected in the net asset value. The price of such security and the date when the security will be delivered and paid for are fixed at the time the transaction is negotiated. The value of the security may vary with market fluctuations. At the time the Fund enters into a purchase transaction it is required to segregate cash or other liquid assets at least equal to the amount of the commitment.
Certain risks may arise upon entering into when-issued or delayed delivery transactions from the potential inability of counterparties to meet the terms of their contracts or if the issuer does not issue the securities due to political, economic, or other factors. Additionally, losses may arise due to changes in the value of the underlying securities.
Federal Income Taxes. The Fund's policy is to comply with the requirements of the Internal Revenue Code, as amended, which are applicable to regulated investment companies, and to distribute all of its taxable income to its shareholders.
Under the Regulated Investment Company Modernization Act of 2010, net capital losses may be carried forward indefinitely, and their character is retained as short-term and/or long-term. Previously, net capital losses were carried forward for eight years and treated as short-term losses.
The Fund has reviewed the tax positions for the open tax years as of October 31, 2012 and has determined that no provision for income tax is required in the Fund's financial statements. The Fund's federal tax returns for the prior three fiscal years remain open subject to examination by the Internal Revenue Service.
Distribution of Income and Gains. Net investment income of the Fund, if any, is declared and distributed to shareholders quarterly. Net realized gains from investment transactions, in excess of available capital loss carryforwards, would be taxable to the Fund if not distributed, and, therefore, will be distributed to shareholders at least annually.
The timing and characterization of certain income and capital gain distributions are determined annually in accordance with federal tax regulations which may differ from accounting principles generally accepted in the United States of America. These differences primarily relate to investments in mortgage-backed securities, premium amortization on debt securities, investments in futures, investments in passive foreign investment companies, forward foreign currency exchange contracts, recognition of certain foreign currency gains (losses) as ordinary income (loss) and certain securities sold at a loss. As a result, net investment income (loss) and net realized gain (loss) on investment transactions for a reporting period may differ significantly from distributions during such period. Accordingly, the Fund may periodically make reclassifications among certain of its capital accounts without impacting the net asset value of the Fund.
At October 31, 2012, the Fund's components of distributable earnings (accumulated losses) on a tax basis were as follows:
| Undistributed ordinary income* | $ | 12,486,985 | ||
| Undistributed long-term capital gains | $ | 27,542,076 | ||
| Net unrealized appreciation (depreciation) on investments | $ | 25,402,211 |
In addition, the tax character of distributions paid to shareholders by the Fund is summarized as follows:
| Years Ended October 31, | ||||||||
| 2012 | 2011 | |||||||
| Distributions from ordinary income* | $ | 22,501,283 | $ | 15,933,838 | ||||
* For tax purposes, short-term capital gain distributions are considered ordinary income distributions.
Expenses. Expenses of the Trust arising in connection with a specific fund are allocated to that fund. Other Trust expenses which cannot be directly attributed to a fund are apportioned among the funds in the Trust based upon the relative net assets or other appropriate measures.
Contingencies. In the normal course of business, the Fund may enter into contracts with service providers that contain general indemnification clauses. The Fund's maximum exposure under these arrangements is unknown as this would involve future claims that may be made against the Fund that have not yet been made. However, based on experience, the Fund expects the risk of loss to be remote.
Other. Investment transactions are accounted for on a trade date plus one basis for daily net asset value calculations. However, for financial reporting purposes, investment transactions are reported on trade date. Interest income is recorded on the accrual basis. Dividend income is recorded on the ex-dividend date net of foreign withholding taxes. Certain dividends from foreign securities may be recorded subsequent to the ex-dividend date as soon as the Fund is informed of such dividends. Realized gains and losses from investment transactions are recorded on an identified cost basis and may include proceeds from litigation. All premiums and discounts are amortized/accreted for financial reporting purposes, with the exception of securities in default of principal.
B. Derivative Instruments
Interest Rate Swap Contracts. For the year ended October 31, 2012, the Fund entered into interest rate swap transactions to gain exposure to different parts of the yield curve while managing overall duration and to enhance potential gains. The use of interest rate swaps is a highly specialized activity that involves investment techniques and risks different from those associated with ordinary portfolio security transactions. In an interest rate swap, the Fund agrees to pay to the other party to the interest rate swap (which is known as the "counterparty") a fixed rate payment in exchange for the counterparty agreeing to pay to the Fund a variable rate payment, or the Fund agrees to receive from the counterparty a fixed rate payment in exchange for the counterparty agreeing to receive from the Fund a variable rate payment. In addition, both the Fund and counterparty may agree to exchange variable rate payments based on different indices. The payment obligations are based on the notional amount of the swap. Certain risks may arise when entering into swap transactions including counterparty default, liquidity or unfavorable changes in interest rates. In connection with these agreements, securities and or cash may be identified as collateral in accordance with the terms of the swap agreements to provide assets of value and recourse in the event of default. The maximum counterparty credit risk is the net present value of the cash flows to be received from or paid to the counterparty over the term of the interest rate swap contract, to the extent that this amount is beneficial to the Fund, in addition to any related collateral posted to the counterparty by the Fund. This risk may be partially reduced by a master netting arrangement between the Fund and the counterparty. The value of the swap is adjusted daily and the change in value, if any, is recorded as unrealized appreciation or depreciation in the Statement of Assets and Liabilities. An upfront payment, if any, made by the Fund is recorded as an asset in the Statement of Assets and Liabilities. An upfront payment, if any, received by the Fund is recorded as a liability in the Statement of Assets and Liabilities. Payments received or made at the end of the measurement period are recorded as realized gain or loss in the Statement of Operations.
A summary of the open interest rate swap contracts as of October 31, 2012 is included in a table following the Fund's Investment Portfolio. For the year ended October 31, 2012, the investment in interest rate swap contracts had a total notional amount generally indicative of a range from $0 to $46,300,000.
Credit Default Swap Contracts. A credit default swap is a contract between a buyer and a seller of protection against pre-defined credit events for the reference entity. The Fund may enter into credit default swap contracts to gain exposure to an underlying issuer's credit quality characteristics without directly investing in that issuer or to hedge against the risk of a credit event on debt securities. As a seller in the credit default swap contract, the Fund is required to pay the par (or other agreed-upon) value of the referenced entity to the counterparty with the occurrence of a credit event by a third party, such as a U.S. or foreign corporate issuer, on the reference entity, which would likely result in a loss to the Fund. In return, the Fund receives from the counterparty a periodic stream of payments over the term of the contract provided that no credit event has occurred. If no credit event occurs, the Fund keeps the stream of payments with no payment obligations. The Fund may also buy credit default swap contracts, in which case the Fund functions as the counterparty referenced above. This involves the risk that the contract may expire worthless. It also involves counterparty risk that the seller may fail to satisfy its payment obligations to the Fund with the occurrence of a credit event. When the Fund sells a credit default swap contract it will cover its commitment. This may be achieved by, among other methods, maintaining cash or liquid assets equal to the aggregate notional value of the reference entities for all outstanding credit default swap contracts sold by the Fund. For the year ended October 31, 2012, the Fund entered into credit default swap contracts to gain exposure to the underlying issuer's credit quality characteristics.
The value of the credit default swap is adjusted daily and the change in value, if any, is recorded daily as unrealized appreciation or depreciation in the Statement of Assets and Liabilities. An upfront payment, if any, made by the Fund is recorded as an asset in the Statement of Assets and Liabilities. An upfront payment, if any, received by the Fund is recorded as a liability in the Statement of Assets and Liabilities. Under the terms of the credit default swap contracts, the Fund receives or makes quarterly payments based on a specified interest rate on a fixed notional amount. These payments are recorded as a realized gain or loss in the Statement of Operations. Payments received or made as a result of a credit event or termination of the contract are recognized, net of a proportional amount of the upfront payment, as realized gains or losses in the Statement of Operations.
A summary of the open interest rate swap contracts as of October 31, 2012 is included in a table following the Fund's Investment Portfolio. For the year ended October 31, 2012, the investment in credit default swap contracts purchased had a total notional value generally indicative of a range from $0 to $7,200,000 and the investment in credit default swap contracts sold had a total notional value generally indicative of a range from $0 to $7,350,000.
Futures Contracts. A futures contract is an agreement between a buyer or seller and an established futures exchange or its clearinghouse in which the buyer or seller agrees to take or make a delivery of a specific amount of a financial instrument at a specified price on a specific date (settlement date). For the year ended October 31, 2012, the Fund entered into interest rate futures to gain exposure to different parts of the yield curve while managing overall duration, and to gain exposure to a particular asset class or to keep cash on hand to meet shareholder redemptions or other needs while maintaining exposure to the stock market. In addition, prior to March 1, 2012, the Fund sought to enhance returns by employing a global tactical asset allocation overlay strategy by entering into futures contracts on fixed-income securities, including on financial indices. As part of this strategy, the Fund used futures contracts to attempt to take advantage of inefficiencies within the global bond markets.
Upon entering into a futures contract, the Fund is required to deposit with a financial intermediary cash or securities ("initial margin") in an amount equal to a certain percentage of the face value indicated in the futures contract. Subsequent payments ("variation margin") are made or received by the Fund dependent upon the daily fluctuations in the value and are recorded for financial reporting purposes as unrealized gains or losses by the Fund. Gains or losses are realized when the contract expires or is closed. Since all futures contracts are exchange traded, counterparty risk is minimized as the exchange's clearinghouse acts as the counterparty and guarantees the futures against default.
Certain risks may arise upon entering into futures contracts, including the risk that an illiquid market will limit the Fund's ability to close out a futures contract prior to the settlement date and the risk that the futures contract is not well correlated with the security, index or currency to which it relates. Risk of loss may exceed amounts disclosed in the Statement of Assets and Liabilities.
A summary of the open futures contracts as of October 31, 2012, is included in a table following the Fund's Investment Portfolio. For the year ended October 31, 2012, the investment in futures contracts purchased had a total notional value generally indicative of a range from approximately $44,983,000 to $95,212,000, and the investment in futures contracts sold had a total notional value generally indicative of a range from $0 to approximately $189,942,000.
Options. An option contract is a contract in which the writer (seller) of the option grants the buyer of the option, upon payment of a premium, the right to purchase from (call option), or sell to (put option), the writer a designated instrument at a specified price within a specified period of time. Certain options, including options on indices and interest rate options, will require cash settlement by the Fund if exercised. For the year ended October 31, 2012, the Fund entered into options on interest rate futures and interest rate swaps in order to hedge against potential adverse interest rate movements of portfolio assets.
If the Fund writes a covered call option, the Fund foregoes, in exchange for the premium, the opportunity to profit during the option period from an increase in the market value of the underlying security above the exercise price. If the Fund writes a put option it accepts the risk of a decline in the value of the underlying security below the exercise price. Over-the-counter options have the risk of the potential inability of counterparties to meet the terms of their contracts. The Fund's maximum exposure to purchased options is limited to the premium initially paid. In addition, certain risks may arise upon entering into option contracts including the risk that an illiquid secondary market will limit the Fund's ability to close out an option contract prior to the expiration date and that a change in the value of the option contract may not correlate exactly with changes in the value of the securities hedged.
A summary of the open purchased option contracts as of October 31, 2012 is included in the Fund's Investment Portfolio. A summary of open written option contracts is included in the table following the Fund's Investment Portfolio. For the six months ended October 31, 2012, the investment in written option contracts had a total value generally indicative of a range from $0 to approximately $1,194,000, and purchased option contracts had a total value generally indicative of a range from $0 to approximately $849,000.
Forward Foreign Currency Exchange Contracts. A forward foreign currency exchange contract ("forward currency contract") is a commitment to purchase or sell a foreign currency at the settlement date at a negotiated rate. For the year ended October 31, 2012, the Fund entered into forward currency contracts in order to hedge its exposure to changes in foreign currency exchange rates on its foreign currency denominated portfolio holdings, to facilitate transactions in foreign currency denominated securities and to enhance total returns. Prior to March 1, 2012, the Fund also entered into forward currency contracts as part of its global tactical asset allocation overlay strategy.
Forward currency contracts are valued at the prevailing forward exchange rate of the underlying currencies and unrealized gain (loss) is recorded daily. On the settlement date of the forward currency contract, the Fund records a realized gain or loss equal to the difference between the value of the contract at the time it was opened and the value of the contract at the time it was closed. Certain risks may arise upon entering into forward currency contracts from the potential inability of counterparties to meet the terms of their contracts. The maximum counterparty credit risk to the Fund is measured by the unrealized gain on appreciated contracts. Additionally, when utilizing forward currency contracts to hedge, the Fund gives up the opportunity to profit from favorable exchange rate movements during the term of the contract.
A summary of the open forward currency contracts as of October 31, 2012, is included in a table following the Fund's Investment Portfolio. For the year ended October 31, 2012, the investment in forward currency contracts short vs. U.S. dollars had a total contract value generally indicative of a range from approximately $45,502,000 to $87,319,000, and the investment in forward currency contracts long vs. U.S. dollars had a total contract value generally indicative of a range from approximately $23,622,000 to $61,116,000. The investment in forward currency contracts long vs. other foreign currencies sold had a total contract value generally indicative of a range from $0 to approximately $12,844,000.
The following tables summarize the value of the Fund's derivative instruments held as of October 31, 2012 and the related location in the accompanying Statement of Assets and Liabilities, presented by primary underlying risk exposure:
| Asset Derivatives | Purchased Options | Forward Contracts | Swap Contracts | Futures Contracts | Total | |||||||||||||||
| Interest Rate Contracts (a) (b) | $ | 643,530 | $ | — | $ | 108,023 | $ | 336,947 | $ | 1,088,500 | ||||||||||
| Credit Contracts (a) | — | — | 265,302 | — | 265,302 | |||||||||||||||
| Foreign Exchange Contracts (c) | — | 415,895 | — | — | 415,895 | |||||||||||||||
| $ | 643,530 | $ | 415,895 | $ | 373,325 | $ | 336,947 | $ | 1,769,697 | |||||||||||
Each of the above derivatives is located in the following Statement of Assets and Liabilities accounts:
(a) Investments in securities, at value (includes purchased options) and unrealized appreciation on swap contracts
(b) Includes cumulative appreciation of futures contracts as disclosed in the Investment Portfolio. Unsettled variation margin is disclosed separately within the Statement of Assets and Liabilities.
(c) Unrealized appreciation on forward foreign currency exchange contracts
| Liability Derivatives | Written Options | Forward Contracts | Swap Contracts | Futures Contracts | Total | |||||||||||||||
| Interest Rate Contracts (a) (b) | $ | (792,988 | ) | $ | — | $ | (200,692 | ) | $ | (16,370 | ) | $ | (1,010,050 | ) | ||||||
| Credit Contracts (a) | — | — | (236,354 | ) | — | (236,354 | ) | |||||||||||||
| Foreign Exchange Contracts (c) | — | (236,506 | ) | — | — | (236,506 | ) | |||||||||||||
| $ | (792,988 | ) | $ | (236,506 | ) | $ | (437,046 | ) | $ | (16,370 | ) | $ | (1,482,910 | ) | ||||||
Each of the above derivatives is located in the following Statement of Assets and Liabilities accounts:
(a) Options written, at value and unrealized depreciation on swap contracts
(b) Includes cumulative depreciation of futures contracts as disclosed in the Investment Portfolio. Unsettled variation margin is disclosed separately within the Statement of Assets and Liabilities.
(c) Unrealized depreciation on forward foreign currency exchange contracts
Additionally, the amount of unrealized and realized gains and losses on derivative instruments recognized in Fund earnings during the year ended October 31, 2012 and the related location in the accompanying Statement of Operations is summarized in the following tables by primary underlying risk exposure:
| Realized Gain (Loss) | Purchased Options | Written Options | Forward Contracts | Swap Contracts | Futures Contracts | Total | ||||||||||||||||||
| Interest Rate Contracts (a) | $ | (5,080 | ) | $ | 74,394 | $ | — | $ | — | $ | 1,383,823 | $ | 1,453,137 | |||||||||||
| Equity Contracts (a) | — | — | — | — | 485,672 | 485,672 | ||||||||||||||||||
| Credit Contracts (a) | — | — | — | 3,938 | — | 3,938 | ||||||||||||||||||
| Foreign Exchange Contracts (b) | — | — | (1,232,082 | ) | — | — | (1,232,082 | ) | ||||||||||||||||
| $ | (5,080 | ) | $ | 74,394 | $ | (1,232,082 | ) | $ | 3,938 | $ | 1,869,495 | $ | 710,665 | |||||||||||
Each of the above derivatives is located in the following Statement of Operations accounts:
(a) Net realized gain (loss) from investments (includes purchased options), written options, swap contracts and futures, respectively
(b) Net realized gain (loss) from foreign currency (Statement of Operations includes both forward currency contracts and foreign currency transactions)
| Change in Net Unrealized Appreciation (Depreciation) | Purchased Options | Written Options | Forward Contracts | Swap Contracts | Futures Contracts | Total | ||||||||||||||||||
| Interest Rate Contracts (a) | $ | (447,229 | ) | $ | 367,124 | $ | — | $ | (92,669 | ) | $ | 389,079 | $ | 216,305 | ||||||||||
| Equity Contracts (a) | — | — | — | — | (148,600 | ) | (148,600 | ) | ||||||||||||||||
| Credit Contracts (a) | — | — | — | 28,948 | — | 28,948 | ||||||||||||||||||
| Foreign Exchange Contracts (b) | — | — | 662,351 | — | — | 662,351 | ||||||||||||||||||
| $ | (447,229 | ) | $ | 367,124 | $ | 662,351 | $ | (63,721 | ) | $ | 240,479 | $ | 759,004 | |||||||||||
Each of the above derivatives is located in the following Statement of Operations accounts:
(a) Change in net unrealized appreciation (depreciation) on investments (includes purchased options), written options, swaps contracts and futures, respectively
(b) Change in net unrealized appreciation (depreciation) on foreign currency (Statement of Operations includes both forward currency contracts and foreign currency transactions)
C. Purchases and Sales of Securities
During the year ended October 31, 2012, purchases and sales of investment securities (excluding short-term investments and U.S. Treasury securities) aggregated $1,666,927,526 and $1,694,079,132, respectively. Purchases and sales of U.S. Treasury securities aggregated $322,496,099 and $352,379,503, respectively.
For the year ended October 31, 2012, transactions for written options on interest rate swap contracts and futures contracts were as follows:
| Contracts/ Contract Amount | Premiums | |||||||
| Outstanding, beginning of period | — | $ | — | |||||
| Options written | 43,800,043 | 1,160,112 | ||||||
| Outstanding, end of period | 43,800,043 | $ | 1,160,112 | |||||
D. Related Parties
Management Agreement. Under the Management Agreement with Deutsche Investment Management Americas Inc. ("DIMA" or the "Advisor"), an indirect, wholly owned subsidiary of Deutsche Bank AG, the Advisor directs the investments of the Fund in accordance with its investment objectives, policies and restrictions. The Advisor determines the securities, instruments and other contracts relating to investments to be purchased, sold or entered into by the Fund. In addition to portfolio management services, the Advisor provides certain administrative services in accordance with the Amended and Restated Management Agreement.
Prior to March 1, 2012, pursuant to an investment subadvisory agreement with the Advisor, QS Investors, LLC ("QS Investors") acted as an investment subadvisor to the Fund. QS Investors rendered strategic asset allocation services and managed the portion of assets allocated to the Fund's global tactical asset allocation overlay strategy. QS Investors was paid by the Advisor for the services QS Investors provided to the Fund. The Fund's board approved the termination of QS Investors as the Fund's subadvisor and effective March 1, 2012, the Advisor assumed all day-to-day advisory responsibilities for the Fund that were previously delegated to QS Investors.
Prior to December 1, 2011, pursuant to a written contract with the Advisor, Deutsche Asset Management International GmbH ("DeAMi"), a direct, wholly owned subsidiary of Deutsche Bank AG, served as a subadvisor to the Fund and was responsible for portfolio management of a portion of the large cap value allocation of the Fund. DeAMi was paid for its services by the Advisor from its fee as Investment Advisor to the Fund. The Fund's board approved the termination of DeAMi as the Fund's subadvisor and effective December 1, 2011, the Advisor assumed all day-to-day advisory responsibilities for the Fund that were previously delegated to DeAMi.
Under the Management Agreement, the Fund pays a monthly management fee based on the Fund's average daily net assets, computed and accrued daily and payable monthly at the following rates:
| First $1.5 billion of the Fund's average daily net assets | .370 | % | ||
| Next $500 million of such net assets | .345 | % | ||
| Next $1.5 billion of such net assets | .310 | % | ||
| Next $2.0 billion of such net assets | .300 | % | ||
| Next $2.0 billion of such net assets | .290 | % | ||
| Next $2.5 billion of such net assets | .280 | % | ||
| Next $2.5 billion of such net assets | .270 | % | ||
| Over $12.5 billion of such net assets | .260 | % |
Accordingly, for the year ended October 31, 2012, the fee pursuant to the Management Agreement was equivalent to an annual effective rate of 0.37% of the Fund's average daily net assets.
Effective October 1, 2012 through September 30, 2013, the Advisor has contractually agreed to waive its fees and/or reimburse certain operating expenses of the Fund to the extent necessary to maintain the operating expenses (excluding certain expenses such as extraordinary expenses, taxes, brokerage and interest) of each class as follows:
| Class A | 1.15% |
| Class B | 1.90% |
| Class C | 1.90% |
| Class S | .90% |
| Institutional Class | .90% |
Administration Fee. Pursuant to an Administrative Services Agreement, DIMA provides most administrative services to the Fund. For all services provided under the Administrative Services Agreement, the Fund pays the Advisor an annual fee ("Administration fee") of 0.10% of the Fund's average daily net assets, computed and accrued daily and payable monthly. For the year ended October 31, 2012, the Administration Fee was $1,022,180, of which $86,038 is unpaid.
Service Provider Fees. DWS Investments Service Company ("DISC"), an affiliate of the Advisor, is the transfer agent, dividend-paying agent and shareholder service agent for the Fund. Pursuant to a sub-transfer agency agreement among DISC and DST Systems, Inc. ("DST"), DISC has delegated certain transfer agent, dividend-paying agent and shareholder service agent functions to DST. DISC compensates DST out of the shareholder servicing fee it receives from the Fund. For the year ended October 31, 2012, the amounts charged to the Fund by DISC were as follows:
| Services to Shareholders | Total Aggregated | Unpaid at October 31, 2012 | ||||||
| Class A | $ | 752,406 | $ | 124,392 | ||||
| Class B | 17,452 | 2,743 | ||||||
| Class C | 27,695 | 4,439 | ||||||
| Class S | 347,959 | 62,292 | ||||||
| Institutional Class | 943 | 151 | ||||||
| $ | 1,146,455 | $ | 194,017 | |||||
Distribution and Service Fees. Under the Fund's Class B and C 12b-1 Plans, DWS Investments Distributors, Inc. ("DIDI"), an affiliate of the Advisor, receives a fee ("Distribution Fee") of 0.75% of average daily net assets of each of Class B and C shares shares. In accordance with the Fund's Underwriting and Distribution Services Agreement, DIDI enters into related selling group agreements with various firms at various rates for sales of Class B and C shares. For the year ended October 31, 2012, the Distribution Fee was as follows:
| Distribution Fee | Total Aggregated | Unpaid at October 31, 2012 | ||||||
| Class B | $ | 40,405 | $ | 10,381 | ||||
| Class C | 133,095 | 13,939 | ||||||
| $ | 173,500 | $ | 24,320 | |||||
In addition, DIDI provides information and administrative services for a fee ("Service Fee") to Class A, B and C shareholders at an annual rate of up to 0.25% of average daily net assets for each such class. DIDI in turn has various agreements with financial services firms that provide these services and pays these fees based upon the assets of shareholder accounts the firms service. For the year ended October 31, 2012, the Service Fee was as follows:
| Service Fee | Total Aggregated | Unpaid at October 31, 2012 | Annual Effective Rate | |||||||||
| Class A | $ | 1,810,891 | $ | 344,716 | .24 | % | ||||||
| Class B | 13,107 | 2,100 | .24 | % | ||||||||
| Class C | 43,520 | 7,287 | .25 | % | ||||||||
| $ | 1,867,518 | $ | 354,103 | |||||||||
Underwriting and Contingent Deferred Sales Charge. DIDI is the principal underwriter for the Fund. Underwriting commissions paid in connection with the distribution of Class A shares for the year ended October 31, 2012 aggregated $26,043.
In addition, DIDI receives any contingent deferred sales charge ("CDSC") from Class B share redemptions occurring within six years of purchase and Class C share redemptions occurring within one year of purchase. There is no such charge upon redemption of any share appreciation or reinvested dividends. The CDSC is based on declining rates ranging from 4% to 1% for Class B and 1% for Class C, of the value of the shares redeemed. For the year ended October 31, 2012, the CDSC for Class B and C shares aggregated $6,700 and $519, respectively. A deferred sales charge of up to 1% is assessed on certain redemptions for Class A shares. For the year ended October 31, 2012, DIDI received $356 for Class A shares.
Typesetting and Filing Service Fees. Under an agreement with DIMA, DIMA is compensated for providing typesetting and certain regulatory, filing services to the Fund. For the year ended October 31, 2012, the amount charged to the Fund by DIMA included in the Statement of Operations under "reports to shareholders" aggregated $36,254, of which $11,693 is unpaid.
Trustees' Fees and Expenses. The Fund paid retainer fees to each Trustee not affiliated with the Advisor, plus specified amounts to the Board Chairperson and to each committee Chairperson.
Affiliated Cash Management Vehicle. The Fund may invest uninvested cash balances in Central Cash Management Fund, which is managed by the Advisor. The Fund indirectly bears its proportionate share of the expenses of Central Cash Management Fund. Central Cash Management Fund does not pay the Advisor an investment management fee. Central Cash Management Fund seeks a high level of current income consistent with liquidity and the preservation of capital.
Security Lending Fees. Deutsche Bank AG serves as lending agent for the Fund. For the year ended October 31, 2012, the Fund incurred lending agent fees to Deutsche Bank AG for the amount of $67,433.
E. Line of Credit
The Fund and other affiliated funds (the "Participants") share in a $375 million revolving credit facility provided by a syndication of banks. The Fund may borrow for temporary or emergency purposes, including the meeting of redemption requests that otherwise might require the untimely disposition of securities. The Participants are charged an annual commitment fee which is allocated based on net assets, among each of the Participants. Interest is calculated at a rate per annum equal to the sum of the Federal Funds Rate plus 1.25 percent plus if LIBOR exceeds the Federal Funds Rate the amount of such excess. The Fund may borrow up to a maximum of 33 percent of its net assets under the agreement. The Fund had no outstanding loans at October 31, 2012.
F. Share Transactions
The following table summarizes share and dollar activity in the Fund:
| Year Ended October 31, 2012 | Year Ended October 31, 2011 | |||||||||||||||
| Shares | Dollars | Shares | Dollars | |||||||||||||
| Shares sold | ||||||||||||||||
| Class A | 1,746,762 | $ | 16,097,518 | 2,600,426 | $ | 23,606,901 | ||||||||||
| Class B | 12,036 | 111,341 | 33,998 | 305,042 | ||||||||||||
| Class C | 117,993 | 1,097,649 | 255,402 | 2,321,762 | ||||||||||||
| Class S | 987,731 | 9,123,433 | 1,271,512 | 11,498,411 | ||||||||||||
| Institutional Class | 41,834 | 378,306 | 136,617 | 1,262,035 | ||||||||||||
| $ | 26,808,247 | $ | 38,994,151 | |||||||||||||
| Shares issued to shareholders in reinvestment of distributions | ||||||||||||||||
| Class A | 1,700,086 | $ | 15,676,393 | 1,236,011 | $ | 11,042,832 | ||||||||||
| Class B | 6,444 | 59,732 | 3,088 | 27,649 | ||||||||||||
| Class C | 24,666 | 228,201 | 12,597 | 112,476 | ||||||||||||
| Class S | 563,841 | 5,194,307 | 416,668 | 3,722,356 | ||||||||||||
| Institutional Class | 3,941 | 36,381 | 5,276 | 47,727 | ||||||||||||
| $ | 21,195,014 | $ | 14,953,040 | |||||||||||||
| Shares redeemed | ||||||||||||||||
| Class A | (12,732,481 | ) | $ | (117,303,395 | ) | (14,995,542 | ) | $ | (136,526,804 | ) | ||||||
| Class B | (262,688 | ) | (2,407,469 | ) | (419,179 | ) | (3,810,180 | ) | ||||||||
| Class C | (417,234 | ) | (3,841,500 | ) | (518,026 | ) | (4,687,663 | ) | ||||||||
| Class S | (3,880,699 | ) | (35,770,269 | ) | (3,791,077 | ) | (34,536,255 | ) | ||||||||
| Institutional Class | (16,282 | ) | (147,200 | ) | (419,544 | ) | (3,923,011 | ) | ||||||||
| $ | (159,469,833 | ) | $ | (183,483,913 | ) | |||||||||||
| Net increase (decrease) | ||||||||||||||||
| Class A | (9,285,633 | ) | $ | (85,529,484 | ) | (11,159,105 | ) | $ | (101,877,071 | ) | ||||||
| Class B | (244,208 | ) | (2,236,396 | ) | (382,093 | ) | (3,477,489 | ) | ||||||||
| Class C | (274,575 | ) | (2,515,650 | ) | (250,027 | ) | (2,253,425 | ) | ||||||||
| Class S | (2,329,127 | ) | (21,452,529 | ) | (2,102,897 | ) | (19,315,488 | ) | ||||||||
| Institutional Class | 29,493 | 267,487 | (277,651 | ) | (2,613,249 | ) | ||||||||||
| $ | (111,466,572 | ) | $ | (129,536,722 | ) | |||||||||||
G. Payment by Affiliate
During the year ended October 31, 2012, the Advisor fully reimbursed the Fund $5,469 for a loss incurred on a trade executed incorrectly. The amount reimbursed was less than 0.01% of the Fund's average net assets, thus having no impact on the Fund's total return.
H. Changes to Investment Strategies, Policies and Fund Name
Effective March 1, 2012, the Fund's investment objective changed from seeking the highest total return, a combination of income and capital appreciation, consistent with reasonable risk, to seeking to maximize income while maintaining prospects for capital appreciation. In connection with the implementation of the new objective, the Fund's name changed to DWS Global Income Builder Fund. For more information, please see the Fund's current prospectus.
To the Board of Trustees of DWS Market Trust and Shareholders of DWS Global Income Builder Fund:
We have audited the accompanying statement of assets and liabilities of DWS Global Income Builder Fund (formerly DWS Balanced Fund) (the "Fund"), a series of DWS Market Trust, including the investment portfolio, as of October 31, 2012, and the related statement of operations for the year then ended, the statement of changes in net assets for each of the two years in the period then ended, and the financial highlights for each of the five years in the period then ended. These financial statements and financial highlights are the responsibility of the Fund's management. Our responsibility is to express an opinion on these financial statements and financial highlights based on our audits.
We conducted our audits in accordance with the standards of the Public Company Accounting Oversight Board (United States). Those standards require that we plan and perform the audit to obtain reasonable assurance about whether the financial statements and financial highlights are free of material misstatement. We were not engaged to perform an audit of the Fund's internal control over financial reporting. Our audits included consideration of internal control over financial reporting as a basis for designing audit procedures that are appropriate in the circumstances, but not for the purpose of expressing an opinion on the effectiveness of the Fund's internal control over financial reporting. Accordingly, we express no such opinion. An audit also includes examining, on a test basis, evidence supporting the amounts and disclosures in the financial statements and financial highlights, assessing the accounting principles used and significant estimates made by management, and evaluating the overall financial statement presentation. Our procedures included confirmation of securities owned as of October 31, 2012, by correspondence with the custodian and brokers or by other appropriate auditing procedures where replies from brokers were not received. We believe that our audits provide a reasonable basis for our opinion.
In our opinion, the financial statements and financial highlights referred to above present fairly, in all material respects, the financial position of DWS Global Income Builder Fund at October 31, 2012, the results of its operations for the year then ended, the changes in its net assets for each of the two years in the period then ended, and the financial highlights for each of the five years in the period then ended, in conformity with U.S. generally accepted accounting principles.
 | |
Boston, Massachusetts December 20, 2012 |
As an investor of the Fund, you incur two types of costs: ongoing expenses and transaction costs. Ongoing expenses include management fees, distribution and service (12b-1) fees and other Fund expenses. Examples of transaction costs include sales charges (loads), redemption fees and account maintenance fees, which are not shown in this section. The following tables are intended to help you understand your ongoing expenses (in dollars) of investing in the Fund and to help you compare these expenses with the ongoing expenses of investing in other mutual funds. The example in the table is based on an investment of $1,000 invested at the beginning of the six-month period and held for the entire period (May 1, 2012 to October 31, 2012).
The tables illustrate your Fund's expenses in two ways:
•Actual Fund Return. This helps you estimate the actual dollar amount of ongoing expenses (but not transaction costs) paid on a $1,000 investment in the Fund using the Fund's actual return during the period. To estimate the expenses you paid over the period, simply divide your account value by $1,000 (for example, an $8,600 account value divided by $1,000 = 8.6), then multiply the result by the number in the "Expenses Paid per $1,000" line under the share class you hold.
•Hypothetical 5% Fund Return. This helps you to compare your Fund's ongoing expenses (but not transaction costs) with those of other mutual funds using the Fund's actual expense ratio and a hypothetical rate of return of 5% per year before expenses. Examples using a 5% hypothetical fund return may be found in the shareholder reports of other mutual funds. The hypothetical account values and expenses may not be used to estimate the actual ending account balance or expenses you paid for the period.
Please note that the expenses shown in these tables are meant to highlight your ongoing expenses only and do not reflect any transaction costs. The "Expenses Paid per $1,000" line of the tables is useful in comparing ongoing expenses only and will not help you determine the relative total expense of owning different funds. An account maintenance fee of $6.25 per quarter for Class S shares may apply for certain accounts whose balances do not meet the applicable minimum initial investment. This fee is not included in these tables. If it was, the estimate of expenses paid for Class S shares during the period would be higher, and account value during the period would be lower, by this amount.
Expenses and Value of a $1,000 Investment for the six months ended October 31, 2012 (Unaudited) | ||||||||||||||||||||
| Actual Fund Return | Class A | Class B | Class C | Class S | Institutional Class | |||||||||||||||
| Beginning Account Value 5/1/12 | $ | 1,000.00 | $ | 1,000.00 | $ | 1,000.00 | $ | 1,000.00 | $ | 1,000.00 | ||||||||||
| Ending Account Value 10/31/12 | $ | 1,028.90 | $ | 1,024.90 | $ | 1,025.80 | $ | 1,029.90 | $ | 1,031.50 | ||||||||||
| Expenses Paid per $1,000* | $ | 4.54 | $ | 9.31 | $ | 8.76 | $ | 3.42 | $ | 3.17 | ||||||||||
| Hypothetical 5% Fund Return | Class A | Class B | Class C | Class S | Institutional Class | |||||||||||||||
| Beginning Account Value 5/1/12 | $ | 1,000.00 | $ | 1,000.00 | $ | 1,000.00 | $ | 1,000.00 | $ | 1,000.00 | ||||||||||
| Ending Account Value 10/31/12 | $ | 1,020.66 | $ | 1,015.94 | $ | 1,016.49 | $ | 1,021.77 | $ | 1,022.02 | ||||||||||
| Expenses Paid per $1,000* | $ | 4.52 | $ | 9.27 | $ | 8.72 | $ | 3.40 | $ | 3.15 | ||||||||||
* Expenses are equal to the Fund's annualized expense ratio for each share class, multiplied by the average account value over the period, multiplied by 184 (the number of days in the most recent six-month period), then divided by 366.
| Annualized Expense Ratios | Class A | Class B | Class C | Class S | Institutional Class |
| DWS Global Income Builder Fund | .89% | 1.83% | 1.72% | .67% | .62% |
For more information, please refer to the Fund's prospectus.
Pursuant to Section 852 of the Internal Revenue Code, the Fund designates $30,124,000 as capital gain dividends for its year ended October 31, 2012, of which 100% represents 15% rate gains.
For corporate shareholders, 37% of the income dividends paid during the Fund's fiscal year ended October 31, 2012, qualified for the dividends received deduction.
For federal income tax purposes, the Fund designates approximately $22,564,000, or the maximum amount allowable under tax law, as qualified dividend income.
A total of 7% of the dividends distributed during the fiscal year was derived from interest on U.S. government securities, which is generally exempt from state income tax.
Please consult a tax advisor if you have questions about federal or state income tax laws, or on how to prepare your tax returns. If you have specific questions about your account, please call (800) 728-3337.
The Board of Trustees approved the renewal of DWS Global Income Builder Fund's investment management agreement (the "Agreement") with Deutsche Investment Management Americas Inc. ("DWS") in September 2012.
In terms of the process that the Board followed prior to approving the Agreement, shareholders should know that:
• In September 2012, all of the Fund's Trustees were independent of DWS and its affiliates.
• The Trustees met frequently during the past year to discuss fund matters and dedicated a substantial amount of time to contract review matters. Over the course of several months, the Board's Contract Committee, in coordination with the Board's Fixed Income and Quant Oversight Committee, reviewed comprehensive materials received from DWS, independent third parties and independent counsel. These materials included an analysis of the Fund's performance, fees and expenses, and profitability compiled by the Fund's independent fee consultant. The Board also received extensive information throughout the year regarding performance of the Fund.
• The Independent Trustees regularly meet privately with their independent counsel to discuss contract review and other matters. In addition, the Independent Trustees were also advised by the Fund's independent fee consultant in the course of their review of the Fund's contractual arrangements and considered a comprehensive report prepared by the independent fee consultant in connection with their deliberations (the "IFC Report").
• In connection with reviewing the Agreement, the Board also reviewed the terms of the Fund's Rule 12b-1 plan, distribution agreement, administrative services agreement, transfer agency agreement and other material service agreements.
• Based on its evaluation of the information provided, the Contract Committee presented its findings and recommendations to the Board. The Board then reviewed the Contract Committee's findings and recommendations.
In connection with the contract review process, the Contract Committee and the Board considered the factors discussed below, among others. The Board also considered that DWS and its predecessors have managed the Fund since its inception, and the Board believes that a long-term relationship with a capable, conscientious advisor is in the best interests of the Fund. The Board considered, generally, that shareholders chose to invest or remain invested in the Fund knowing that DWS managed the Fund, and that the Agreement was approved by the Fund's shareholders. DWS is part of Deutsche Bank, a major global banking institution that is engaged in a wide range of financial services. The Board believes that there are advantages to being part of a global asset management business that offers a wide range of investing expertise and resources, including hundreds of portfolio managers and analysts with research capabilities in many countries throughout the world.
As part of the contract review process, the Board carefully considered the fees and expenses of each DWS fund overseen by the Board in light of the fund's performance. In many cases, this led to a negotiation with DWS of lower expense caps for the coming year than had previously been in place. As part of these negotiations, the Board indicated that it would consider relaxing these new lower caps in future years following sustained improvements in performance, among other considerations.
In June 2012, Deutsche Bank ("DB"), DWS's parent company, announced that DB's new management team had concluded the strategic review of its global asset management business announced in late 2011 by DB's prior management team, and would combine its Asset Management (of which DWS is a part) and Wealth Management divisions. Prior to approving the investment management agreements, the Independent Trustees were apprised of the expected management and structure of the new combined Asset & Wealth Management division ("AWM") and DWS. DB also advised the Independent Trustees that the U.S. asset management business is a critical and integral part of DB and AWM, and that DB would be reinvesting a significant portion of the substantial savings it expects to realize by combining its Asset Management and Wealth Management divisions into a combined AWM division, including enhancements to its investment capabilities. DB also confirmed its commitment to maintaining strong legal and compliance groups within the combined division.
While shareholders may focus primarily on fund performance and fees, the Fund's Board considers these and many other factors, including the quality and integrity of DWS's personnel and such other issues as back-office operations, fund valuations, and compliance policies and procedures.
Nature, Quality and Extent of Services. The Board considered the terms of the Agreement, including the scope of advisory services provided under the Agreement. The Board noted that, under the Agreement, DWS provides portfolio management services to the Fund and that, pursuant to a separate administrative services agreement, DWS provides administrative services to the Fund. The Board considered the experience and skills of senior management and investment personnel, the resources made available to such personnel, the ability of DWS to attract and retain high-quality personnel, and the organizational depth and stability of DWS. The Board reviewed the Fund's performance over short-term and long-term periods and compared those returns to various agreed-upon performance measures, including market indices and a peer universe compiled by the independent fee consultant using information supplied by Lipper Inc. ("Lipper"), an independent fund data service. The Board also noted that it has put into place a process of identifying "Focus Funds" (e.g., funds performing poorly relative to their benchmark or a peer universe compiled by an independent fund data service), and receives more frequent reporting and information from DWS regarding such funds, along with DWS's remedial plans to address underperformance. The Board believes this process is an effective manner of identifying and addressing underperforming funds. Based on the information provided, the Board noted that for the one-, three- and five-year periods ended December 31, 2011, the Fund's performance (Class A shares) was in the 3rd quartile, 4th quartile and 4th quartile, respectively, of the applicable Lipper universe (the 1st quartile being the best performers and the 4th quartile being the worst performers). The Board also observed that the Fund has underperformed its benchmark in the one-, three- and five-year periods ended December 31, 2011. The Board noted the disappointing investment performance of the Fund in recent periods and continued to discuss with senior management of DWS the factors contributing to such underperformance and actions being taken to improve performance. The Board observed that the Fund had experienced improved relative performance during the first seven months of 2012. The Board recognized that DWS has made changes in an effort to improve Fund performance, including changes in the Fund's investment process and the introduction of new portfolio management team members in March 2012.
Fees and Expenses. The Board considered the Fund's investment management fee schedule, operating expenses and total expense ratios, and comparative information provided by Lipper and the independent fee consultant regarding investment management fee rates paid to other investment advisors by similar funds (1st quartile being the most favorable and 4th quartile being the least favorable). With respect to management fees paid to other investment advisors by similar funds, the Board noted that the contractual fee rates paid by the Fund, which include a 0.10% fee paid to DWS under the Fund's administrative services agreement, were lower than the median (1st quartile) of the applicable Lipper peer group (based on Lipper data provided as of December 31, 2011). The Board noted that the Fund's Class A shares total (net) operating expenses (excluding 12b-1 fees) were expected to be lower than the median (1st quartile) of the applicable Lipper expense universe (based on Lipper data provided as of December 31, 2011, and analyzing Lipper expense universe Class A (net) expenses less any applicable 12b-1 fees) ("Lipper Universe Expenses"). The Board also reviewed data comparing each share class's total (net) operating expenses to the applicable Lipper Universe Expenses. The Board considered the Fund's management fee rate as compared to fees charged by DWS and certain of its affiliates for comparable mutual funds and considered differences in fund and fee structures between the DWS Funds. The Board also considered how the Fund's total (net) operating expenses compared to the total (net) operating expenses of a more customized peer group selected by Lipper (based on such factors as asset size). The Board also noted that the expense limitations agreed to by DWS helped to ensure that the Fund's total (net) operating expenses would remain competitive.
The information considered by the Board as part of its review of management fees included information regarding fees charged by DWS and its affiliates to similar institutional accounts and to similar funds offered primarily to European investors ("DWS Europe funds"), in each case as applicable. The Board observed that advisory fee rates for institutional accounts generally were lower than the management fees charged by similarly managed DWS U.S. mutual funds ("DWS Funds"), but also took note of the differences in services provided to DWS Funds as compared to institutional accounts. In the case of DWS Europe funds, the Board observed that fee rates for DWS Europe funds generally were higher than for similarly managed DWS Funds, but noted that differences in the types of services provided to DWS Funds relative to DWS Europe funds made it difficult to compare such fees.
On the basis of the information provided, the Board concluded that management fees were reasonable and appropriate in light of the nature, quality and extent of services provided by DWS.
Profitability. The Board reviewed detailed information regarding revenues received by DWS under the Agreement. The Board considered the estimated costs and pre-tax profits realized by DWS from advising the DWS Funds, as well as estimates of the pre-tax profits attributable to managing the Fund in particular. The Board also received information regarding the estimated enterprise-wide profitability of DWS and its affiliates with respect to all fund services in totality and by fund. The Board and the independent fee consultant reviewed DWS's methodology in allocating its costs to the management of the Fund. Based on the information provided, the Board concluded that the pre-tax profits realized by DWS in connection with the management of the Fund were not unreasonable. The Board also reviewed information regarding the profitability of certain similar investment management firms. The Board noted that while information regarding the profitability of such firms is limited (and in some cases is not necessarily prepared on a comparable basis), DWS and its affiliates' overall profitability with respect to the DWS fund complex (after taking into account distribution and other services provided to the funds by DWS and its affiliates) was lower than the overall profitability levels of many comparable firms for which such data was available.
Economies of Scale. The Board considered whether there are economies of scale with respect to the management of the Fund and whether the Fund benefits from any economies of scale. The Board noted that the Fund's management fee schedule includes fee breakpoints. The Board concluded that the Fund's fee schedule represents an appropriate sharing between the Fund and DWS of such economies of scale as may exist in the management of the Fund at current asset levels.
Other Benefits to DWS and Its Affiliates. The Board also considered the character and amount of other incidental benefits received by DWS and its affiliates, including any fees received by DWS for administrative services provided to the Fund and any fees received by an affiliate of DWS for distribution services. The Board also considered benefits to DWS related to brokerage and soft-dollar allocations, including allocating brokerage to pay for research generated by parties other than the executing broker dealers, which pertain primarily to funds investing in equity securities, along with the incidental public relations benefits to DWS related to DWS Funds advertising and cross-selling opportunities among DWS products and services. The Board concluded that management fees were reasonable in light of these fallout benefits.
Compliance. The Board considered the significant attention and resources dedicated by DWS to documenting and enhancing its compliance processes in recent years. The Board noted in particular (i) the experience and seniority of both DWS's chief compliance officer and the Fund's chief compliance officer; (ii) the large number of DWS compliance personnel; and (iii) the substantial commitment of resources by DWS and its affiliates to compliance matters.
Based on all of the information considered and the conclusions reached, the Board unanimously determined that the continuation of the Agreement is in the best interests of the Fund. In making this determination, the Board did not give particular weight to any single factor identified above. The Board considered these factors over the course of numerous meetings, certain of which were in executive session with only the Independent Trustees and their counsel present. It is possible that individual Trustees may have weighed these factors differently in reaching their individual decisions to approve the continuation of the Agreement.
September 17, 2012
Pursuant to an Order entered into by Deutsche Investment Management Americas and affiliates (collectively, "DeAM") with the Attorney General of New York, I, Thomas H. Mack, have been appointed the Independent Fee Consultant for the DWS Funds (formerly the DWS Scudder Funds). My duties include preparing an annual written evaluation of the management fees DeAM charges the Funds, considering among other factors the management fees charged by other mutual fund companies for like services, management fees DeAM charges other clients for like services, DeAM's costs of supplying services under the management agreements and related profit margins, possible economies of scale if a Fund grows larger, and the nature and quality of DeAM's services, including fund performance. This report summarizes my evaluation for 2012, including my qualifications, the evaluation process for each of the DWS Funds, consideration of certain complex-level factors, and my conclusions. I served in substantially the same capacity in 2007, 2008, 2009, 2010 and 2011.
Qualifications
For more than 35 years I have served in various professional capacities within the investment management business. I have held investment analysis and advisory positions, including securities analyst, portfolio strategist and director of investment policy with a large investment firm. I have also performed business management functions, including business development, financial management and marketing research and analysis.
Since 1991, I have been an independent consultant within the asset management industry. I have provided services to over 125 client organizations, including investment managers, mutual fund boards, product distributors and related organizations. Over the past ten years I have completed a number of assignments for mutual fund boards, specifically including assisting boards with management contract renewal.
I hold a Master of Business Administration degree, with highest honors, from Harvard University and Master of Science and Bachelor of Science (highest honors) degrees from the University of California at Berkeley. I am an independent director and audit committee financial expert for two closed-end mutual funds and have served in various leadership and financial oversight capacities with non-profit organizations.
Evaluation of Fees for each DWS Fund
My work focused primarily on evaluating, fund-by-fund, the fees charged to each of the 103 mutual fund portfolios in the DWS Fund family. For each Fund, I considered each of the key factors mentioned above, as well as any other relevant information. In doing so I worked closely with the Funds' Independent Directors in their annual contract renewal process, as well as in their approval of contracts for several new funds (documented separately).
In evaluating each Fund's fees, I reviewed comprehensive materials provided by or on behalf of DeAM, including expense information prepared by Lipper Analytical, comparative performance information, profitability data, manager histories, and other materials. I also accessed certain additional information from the Lipper and Morningstar databases and drew on my industry knowledge and experience.
To facilitate evaluating this considerable body of information, I prepared for each Fund a document summarizing the key data elements in each area as well as additional analytics discussed below. This made it possible to consider each key data element in the context of the others.
In the course of contract renewal, DeAM agreed to implement a number of fee and expense adjustments requested by the Independent Directors which will favorably impact future fees and expenses, and my evaluation includes the effects of these changes.
Fees and Expenses Compared with Other Funds
The competitive fee and expense evaluation for each fund focused on two primary comparisons:
The Fund's contractual management fee (the advisory fee plus the administration fee where applicable) compared with those of a group of typically 12-15 funds in the same Lipper investment category (e.g. Large Capitalization Growth) having similar distribution arrangements and being of similar size.
The Fund's total expenses compared with a broader universe of funds from the same Lipper investment category and having similar distribution arrangements.
These two comparisons provide a view of not only the level of the fee compared with funds of similar scale but also the total expense the Fund bears for all the services it receives, in comparison with the investment choices available in the Fund's investment category and distribution channel. The principal figure-of-merit used in these comparisons was the subject Fund's percentile ranking against peers.
DeAM's Fees for Similar Services to Others
DeAM provided management fee schedules for all of its US domiciled fund and non-fund investment management accounts in any of the investment categories where there is a DWS Fund. These similar products included the other DWS Funds, non-fund pooled accounts, institutional accounts and sub-advisory accounts. Using this information, I calculated for each Fund the fee that would be charged to each similar product, at the subject Fund's asset level.
Evaluating information regarding non-fund products is difficult because there are varying levels of services required for different types of accounts, with mutual funds generally requiring considerably more regulatory and administrative types of service as well as having more frequent cash flows than other types of accounts. Also, while mutual fund fees for similar fund products can be expected to be similar, there will be some differences due to different pricing conditions in different distribution channels (e.g. retail funds versus those used in variable insurance products), differences in underlying investment processes and other factors.
Costs and Profit Margins
DeAM provided a detailed profitability analysis for each Fund. After making some adjustments so that the presentation would be more comparable to the available industry figures, I reviewed profit margins from investment management alone, from investment management plus other fund services (excluding distribution) provided to the Funds by DeAM (principally shareholder services), and DeAM profits from all sources, including distribution. A later section comments on overall profitability.
Economies of Scale
Economies of scale — an expected decline in management cost per dollar of fund assets as fund assets grow — are very rarely quantified and documented because of inherent difficulties in collecting and analyzing relevant data. However, in virtually every investment category that I reviewed, larger funds tend to have lower fees and lower total expenses than smaller funds. To see how each DWS Fund compares with this industry observation, I reviewed:
The trend in Fund assets over the last five years and the accompanying trend in total expenses. This shows if the Fund has grown and, if so, whether total expense (management fees as well as other expenses) have declined as a percent of assets.
Whether the Fund has break-points in its management fee schedule, the extent of the fee reduction built into the schedule and the asset levels where the breaks take effect, and in the case of a sub-advised Fund how the Fund's break-points compare with those of the sub-advisory fee schedule.
How the Fund's contractual fee schedule compares with trends in the industry data. To accomplish this, I constructed a chart showing how actual latest-fiscal-year contractual fees of the Fund and of other similar funds relate to average fund assets, with the subject Fund's contractual fee schedule superimposed.
Quality of Service — Performance
The quality-of-service evaluation focused on investment performance, which is the principal result of the investment management service. Each Fund's performance was reviewed over the past 1, 3, 5 and 10 years, as applicable, and compared with that of other funds in the same investment category and with a suitable market index.
In addition, I calculated and reviewed risk-adjusted returns relative to an index of similar mutual funds' returns and a suitable market index. The risk-adjusted returns analysis provides a way of determining the extent to which the Fund's return comparisons are mainly the product of investment value-added (or lack thereof) or alternatively taking considerably more or less risk than is typical in its investment category.
I also received and considered the history of portfolio manager changes for each Fund, as this provided an important context for evaluating the performance results.
Complex-Level Considerations
While this evaluation was conducted mainly at the individual fund level, there are some issues relating to the reasonableness of fees that can alternatively be considered across the whole fund complex:
I reviewed DeAM's profitability analysis for all DWS Funds, with a view toward determining if the allocation procedures used were reasonable and how profit levels compared with public data for other investment managers.
I considered whether DeAM and affiliates receive any significant ancillary or "fallout" benefits that should be considered in interpreting the direct profitability results. These would be situations where serving as the investment manager of the Funds is beneficial to another part of the Deutsche Bank organization.
I considered how aggregated DWS Fund expenses had varied over the years, by asset class and in the context of trends in asset levels.
I considered how aggregated DWS Fund performance measures relative to appropriate peers had varied by asset class and over time.
I reviewed the structure of the DeAM organization, trends in staffing levels, and information on compensation of investment management and other professionals compared with industry data.
Findings
Based on the process and analysis discussed above, which included reviewing a wide range of information from management and external data sources and considering among other factors the fees DeAM charges other clients, the fees charged by other fund managers, DeAM's costs and profits associated with managing the Funds, economies of scale, possible fall-out benefits, and the nature and quality of services provided, in my opinion the management fees charged the DWS Funds are reasonable.

Thomas H. Mack
President, Thomas H. Mack & Co., Inc.
The following table presents certain information regarding the Board Members and Officers of the fund as of October 31, 2012. Each Board Member's year of birth is set forth in parentheses after his or her name. Unless otherwise noted, (i) each Board Member has engaged in the principal occupation(s) noted in the table for at least the most recent five years, although not necessarily in the same capacity; and (ii) the address of each Independent Board Member is c/o Paul K. Freeman, Independent Chairman, DWS Funds, PO Box 101833, Denver, CO 80250-1833. Except as otherwise noted below, the term of office for each Board Member is until the election and qualification of a successor, or until such Board Member sooner dies, resigns, is removed or as otherwise provided in the governing documents of the fund. Because the fund does not hold an annual meeting of shareholders, each Board Member will hold office for an indeterminate period. The Board Members may also serve in similar capacities with other funds in the fund complex. The Length of Time Served represents the year in which the Board Member joined the Board of one or more DWS funds now overseen by the Board.
| Independent Board Members | ||||
Name, Year of Birth, Position with the Fund and Length of Time Served1 | Business Experience and Directorships During the Past Five Years | Number of Funds in DWS Fund Complex Overseen | Other Directorships Held by Board Member | |
Paul K. Freeman (1950) Chairperson since 2009 Board Member since 1993 | Consultant, World Bank/Inter-American Development Bank; Executive and Governing Council of the Independent Directors Council (Chairman of Education Committee); formerly: Project Leader, International Institute for Applied Systems Analysis (1998-2001); Chief Executive Officer, The Eric Group, Inc. (environmental insurance) (1986-1998) | 103 | — | |
John W. Ballantine (1946) Board Member since 1999 | Retired; formerly, Executive Vice President and Chief Risk Management Officer, First Chicago NBD Corporation/The First National Bank of Chicago (1996-1998); Executive Vice President and Head of International Banking (1995-1996). Directorships: Chairman of the Board, Healthways, Inc. (provider of disease and care management services); Portland General Electric (utility company); Stockwell Capital Investments PLC (private equity); former Directorships: First Oak Brook Bancshares, Inc. and Oak Brook Bank; Prisma Energy International | 103 | — | |
Henry P. Becton, Jr. (1943) Board Member since 1990 | Vice Chair and former President, WGBH Educational Foundation. Directorships: Public Radio International; Public Radio Exchange (PRX); The PBS Foundation; North Bennett Street School (Boston); former Directorships: Association of Public Television Stations; Boston Museum of Science; American Public Television; Concord Academy; New England Aquarium; Mass. Corporation for Educational Telecommunications; Committee for Economic Development; Public Broadcasting Service; Connecticut College | 103 | Lead Director, Becton Dickinson and Company2 (medical technology company); Lead Director, Belo Corporation2 (media company) | |
Dawn-Marie Driscoll (1946) Board Member since 1987 | President, Driscoll Associates (consulting firm); Executive Fellow, Center for Business Ethics, Bentley University; formerly, Partner, Palmer & Dodge (1988-1990); Vice President of Corporate Affairs and General Counsel, Filene's (1978-1988). Directorships: Director of ICI Mutual Insurance Company (since 2007); Advisory Board, Center for Business Ethics, Bentley University; Trustee, Southwest Florida Community Foundation (charitable organization); former Directorships: Investment Company Institute (audit, executive, nominating committees) and Independent Directors Council (governance, executive committees) | 103 | Trustee, Sun Capital Advisers, Inc. (22 open-end mutual funds advised by Sun Capital Advisers, Inc.) (since 2007) | |
Keith R. Fox, CFA (1954) Board Member since 1996 | Managing General Partner, Exeter Capital Partners (a series of private investment funds) (since 1986). Directorships: Progressive International Corporation (kitchen goods importer and distributor); BoxTop Media Inc. (advertising); The Kennel Shop (retailer); former Chairman, National Association of Small Business Investment Companies | 103 | Trustee, Sun Capital Advisers, Inc. (22 open-end mutual funds advised by Sun Capital Advisers, Inc.) (since 2011) | |
Kenneth C. Froewiss (1945) Board Member since 2001 | Adjunct Professor of Finance, NYU Stern School of Business (September 2009-present; Clinical Professor from 1997-September 2009); Member, Finance Committee, Association for Asian Studies (2002-present); Director, Mitsui Sumitomo Insurance Group (US) (2004-present); prior thereto, Managing Director, J.P. Morgan (investment banking firm) (until 1996) | 103 | — | |
Richard J. Herring (1946) Board Member since 1990 | Jacob Safra Professor of International Banking and Professor, Finance Department, The Wharton School, University of Pennsylvania (since July 1972); Co-Director, Wharton Financial Institutions Center (since July 2000); Co-Chair, U.S. Shadow Financial Regulatory Committee; Executive Director, Financial Economists Roundtable; formerly: Vice Dean and Director, Wharton Undergraduate Division (July 1995-June 2000); Director, Lauder Institute of International Management Studies (July 2000-June 2006) | 103 | Director, Japan Equity Fund, Inc. (since September 2007), Thai Capital Fund, Inc. (since September 2007), Singapore Fund, Inc. (since September 2007), Independent Director of Barclays Bank Delaware (since September 2010) | |
William McClayton (1944) Board Member since 2004 | Private equity investor (since October 2009); previously, Managing Director, Diamond Management & Technology Consultants, Inc. (global consulting firm) (2001-2009); Directorship: Board of Managers, YMCA of Metropolitan Chicago; formerly: Senior Partner, Arthur Andersen LLP (accounting) (1966-2001); Trustee, Ravinia Festival | 103 | — | |
Rebecca W. Rimel (1951) Board Member since 1995 | President and Chief Executive Officer, The Pew Charitable Trusts (charitable organization) (1994 to present); Trustee, Washington College (2011 to present); formerly: Executive Vice President, The Glenmede Trust Company (investment trust and wealth management) (1983-2004); Board Member, Investor Education (charitable organization) (2004-2005); Trustee, Executive Committee, Philadelphia Chamber of Commerce (2001-2007); Trustee, Pro Publica (charitable organization) (2007-2010); Trustee, Thomas Jefferson Foundation (charitable organization) (1994 to 2012) | 103 | Director, CardioNet, Inc.2 (health care) (2009- present); Director, Viasys Health Care2 (January 2007- June 2007) | |
William N. Searcy, Jr. (1946) Board Member since 1993 | Private investor since October 2003; formerly: Pension & Savings Trust Officer, Sprint Corporation2 (telecommunications) (November 1989-September 2003) | 103 | Trustee, Sun Capital Advisers, Inc. (22 open-end mutual funds advised by Sun Capital Advisers, Inc.) (since 1998) | |
Jean Gleason Stromberg (1943) Board Member since 1997 | Retired. Formerly, Consultant (1997-2001); Director, Financial Markets U.S. Government Accountability Office (1996-1997); Partner, Fulbright & Jaworski, L.L.P. (law firm) (1978-1996). Directorships: The William and Flora Hewlett Foundation; former Directorships: Service Source, Inc., Mutual Fund Directors Forum (2002-2004), American Bar Retirement Association (funding vehicle for retirement plans) (1987-1990 and 1994-1996) | 103 | — | |
Robert H. Wadsworth (1940) Board Member since 1999 | President, Robert H. Wadsworth & Associates, Inc. (consulting firm) (1983 to present); Director, National Horizon, Inc. (non-profit organization); Director and Treasurer, The Phoenix Boys Choir Association | 106 | — | |
Officers4 | ||
Name, Year of Birth, Position with the Fund and Length of Time Served5 | Principal Occupation(s) During Past 5 Years and Other Directorships Held | |
W. Douglas Beck, CFA6 (1967) President, 2011-present | Managing Director3, Deutsche Asset Management (2006-present); President of DWS family of funds and Head of Product Management, U.S. for DWS Investments; formerly, Executive Director, Head of Product Management (2002-2006) and President (2005-2006) of the UBS Funds at UBS Global Asset Management; Co-Head of Manager Research/Managed Solutions Group, Merrill Lynch (1998-2002) | |
John Millette7 (1962) Vice President and Secretary, 1999-present | Director3, Deutsche Asset Management | |
Paul H. Schubert6 (1963) Chief Financial Officer, 2004-present Treasurer, 2005-present | Managing Director3, Deutsche Asset Management (since July 2004); formerly, Executive Director, Head of Mutual Fund Services and Treasurer for UBS Family of Funds (1998-2004); Vice President and Director of Mutual Fund Finance at UBS Global Asset Management (1994-1998) | |
Caroline Pearson7 (1962) Chief Legal Officer, 2010-present | Managing Director3, Deutsche Asset Management; formerly, Assistant Secretary for DWS family of funds (1997-2010) | |
Melinda Morrow6 (1970) Vice President, 2012-present | Director3, Deutsche Asset Management | |
Paul Antosca7 (1957) Assistant Treasurer, 2007-present | Director3, Deutsche Asset Management | |
Jack Clark7 (1967) Assistant Treasurer, 2007-present | Director3, Deutsche Asset Management | |
Diane Kenneally7 (1966) Assistant Treasurer, 2007-present | Director3, Deutsche Asset Management | |
John Caruso6 (1965) Anti-Money Laundering Compliance Officer, 2010-present | Managing Director3, Deutsche Asset Management | |
Robert Kloby6 (1962) Chief Compliance Officer, 2006-present | Managing Director3, Deutsche Asset Management | |
1 The length of time served represents the year in which the Board Member joined the board of one or more DWS funds currently overseen by the Board.
2 A publicly held company with securities registered pursuant to Section 12 of the Securities Exchange Act of 1934.
3 Executive title, not a board directorship.
4 As a result of their respective positions held with the Advisor, these individuals are considered "interested persons" of the Advisor within the meaning of the 1940 Act. Interested persons receive no compensation from the fund.
5 The length of time served represents the year in which the officer was first elected in such capacity for one or more DWS funds.
6 Address: 60 Wall Street, New York, NY 10005.
7 Address: One Beacon Street, Boston, MA 02108.
The fund's Statement of Additional Information ("SAI") includes additional information about the Board Members. The SAI is available, without charge, upon request. If you would like to request a copy of the SAI, you may do so by calling the following toll-free number: (800) 728-3337.
| For More Information | The automated telephone system allows you to access personalized account information and obtain information on other DWS funds using either your voice or your telephone keypad. Certain account types within Classes A, B, C and S also have the ability to purchase, exchange or redeem shares using this system. For more information, contact your financial advisor. You may also access our automated telephone system or speak with a DWS Investments representative by calling: (800) 728-3337 | |
| Web Site | www.dws-investments.com View your account transactions and balances, trade shares, monitor your asset allocation, and change your address, 24 hours a day. Obtain prospectuses and applications, blank forms, interactive worksheets, news about DWS funds, subscription to fund updates by e-mail, retirement planning information, and more. | |
| Written Correspondence | DWS Investments PO Box 219151 Kansas City, MO 64121-9151 | |
| Proxy Voting | The fund's policies and procedures for voting proxies for portfolio securities and information about how the fund voted proxies related to its portfolio securities during the 12-month period ended June 30 are available on our Web site — www.dws-investments.com (click on "proxy voting"at the bottom of the page) — or on the SEC's Web site — www.sec.gov. To obtain a written copy of the fund's policies and procedures without charge, upon request, call us toll free at (800) 728-3337. | |
| Portfolio Holdings | Following the fund's fiscal first and third quarter-end, a complete portfolio holdings listing is filed with the SEC on Form N-Q. This form will be available on the SEC's Web site at www.sec.gov, and it also may be reviewed and copied at the SEC's Public Reference Room in Washington, D.C. Information on the operation of the SEC's Public Reference Room may be obtained by calling (800) SEC-0330. The fund's portfolio holdings are also posted on www.dws-investments.com from time to time. Please see the fund's current prospectus for more information. | |
| Principal Underwriter | If you have questions, comments or complaints, contact: DWS Investments Distributors, Inc. 222 South Riverside Plaza Chicago, IL 60606-5808 (800) 621-1148 | |
| Investment Management | Deutsche Investment Management Americas Inc. ("DIMA" or the "Advisor"), which is part of Deutsche Asset Management, is the investment advisor for the fund. DIMA and its predecessors have more than 80 years of experience managing mutual funds and DIMA provides a full range of investment advisory services to both institutional and retail clients. DIMA is an indirect, wholly owned subsidiary of Deutsche Bank AG. Deutsche Bank AG is a major global banking institution engaged in a wide variety of financial services, including investment management, retail, private and commercial banking, investment banking and insurance. DWS Investments is the retail brand name in the U.S. for the asset management activities of Deutsche Bank AG and DIMA. As such, DWS is committed to delivering the investing expertise, insight and resources of this global investment platform to American investors. | |
| Class A | Class B | Class C | Class S | Institutional Class | ||
| Nasdaq Symbol | KTRAX | KTRBX | KTRCX | KTRSX | KTRIX | |
| CUSIP Number | 23336W 106 | 23336W 205 | 23336W 304 | 23336W 502 | 23336W 601 | |
| Fund Number | 002 | 202 | 302 | 2033 | 1402 |
Notes

| ITEM 2. | CODE OF ETHICS |
As of the end of the period covered by this report, the registrant has adopted a code of ethics, as defined in Item 2 of Form N-CSR, that applies to its Principal Executive Officer and Principal Financial Officer. There have been no amendments to, or waivers from, a provision of the code of ethics during the period covered by this report that would require disclosure under Item 2. A copy of the code of ethics is filed as an exhibit to this Form N-CSR. | |
| ITEM 3. | AUDIT COMMITTEE FINANCIAL EXPERT |
| The fund’s audit committee is comprised solely of trustees who are "independent" (as such term has been defined by the Securities and Exchange Commission ("SEC") in regulations implementing Section 407 of the Sarbanes-Oxley Act (the "Regulations")). The fund’s Board of Trustees has determined that there are several "audit committee financial experts" (as such term has been defined by the Regulations) serving on the fund’s audit committee including Mr. William McClayton, the chair of the fund’s audit committee. An “audit committee financial expert” is not an “expert” for any purpose, including for purposes of Section 11 of the Securities Act of 1933 and the designation or identification of a person as an “audit committee financial expert” does not impose on such person any duties, obligations or liability that are greater than the duties, obligations and liability imposed on such person as a member of the audit committee and board of directors in the absence of such designation or identification. | |
| ITEM 4. | PRINCIPAL ACCOUNTANT FEES AND SERVICES |
DWS GLOBAL INCOME BUILDER FUND
FORM N-CSR DISCLOSURE RE: AUDIT FEES
The following table shows the amount of fees that Ernst & Young LLP (“E&Y”), the Fund’s Independent Registered Public Accounting Firm, billed to the Fund during the Fund’s last two fiscal years. The Audit Committee approved in advance all audit services and non-audit services that E&Y provided to the Fund.
Services that the Fund’s Independent Registered Public Accounting Firm Billed to the Fund
| Fiscal Year Ended October 31, | Audit Fees Billed to Fund | Audit-Related Fees Billed to Fund | Tax Fees Billed to Fund | All Other Fees Billed to Fund | ||||||||||||
| 2012 | $ | 89,336 | $ | 0 | $ | 9,760 | $ | 0 | ||||||||
| 2011 | $ | 91,063 | $ | 0 | $ | 9,476 | $ | 0 | ||||||||
The above “Tax Fees” were billed for professional services rendered for tax return preparation.
Services that the Fund’s Independent Registered Public Accounting Firm Billed to the Adviser and Affiliated Fund Service Providers
The following table shows the amount of fees billed by E&Y to Deutsche Investment Management Americas, Inc. (“DIMA” or the “Adviser”), and any entity controlling, controlled by or under common control with DIMA (“Control Affiliate”) that provides ongoing services to the Fund (“Affiliated Fund Service Provider”), for engagements directly related to the Fund’s operations and financial reporting, during the Fund’s last two fiscal years.
| Fiscal Year Ended October 31, | Audit-Related Fees Billed to Adviser and Affiliated Fund Service Providers | Tax Fees Billed to Adviser and Affiliated Fund Service Providers | All Other Fees Billed to Adviser and Affiliated Fund Service Providers | |||||||||
| 2012 | $ | 0 | $ | 359,967 | $ | 0 | ||||||
| 2011 | $ | 0 | $ | 285,550 | $ | 0 | ||||||
The above “Tax Fees” were billed in connection with tax compliance services and agreed upon procedures.
Non-Audit Services
The following table shows the amount of fees that E&Y billed during the Fund’s last two fiscal years for non-audit services. The Audit Committee pre-approved all non-audit services that E&Y provided to the Adviser and any Affiliated Fund Service Provider that related directly to the Fund’s operations and financial reporting. The Audit Committee requested and received information from E&Y about any non-audit services that E&Y rendered during the Fund’s last fiscal year to the Adviser and any Affiliated Fund Service Provider. The Committee considered this information in evaluating E&Y’s independence.
| Fiscal Year Ended October 31, | Total Non-Audit Fees Billed to Fund (A) | Total Non-Audit Fees billed to Adviser and Affiliated Fund Service Providers (engagements related directly to the operations and financial reporting of the Fund) (B) | Total Non-Audit Fees billed to Adviser and Affiliated Fund Service Providers (all other engagements) (C) | Total of (A), (B) and (C) | ||||||||||||
| 2012 | $ | 9,760 | $ | 359,967 | $ | 477,809 | $ | 847,536 | ||||||||
| 2011 | $ | 9,476 | $ | 285,550 | $ | 565,608 | $ | 860,634 | ||||||||
All other engagement fees were billed for services in connection with agreed upon procedures and tax compliance for DIMA and other related entities that provide support for the operations of the Fund.
Audit Committee Pre-Approval Policies and Procedures. Generally, each Fund’s Audit Committee must pre approve (i) all services to be performed for a Fund by a Fund’s Independent Registered Public Accounting Firm and (ii) all non-audit services to be performed by a Fund’s Independent Registered Public Accounting Firm for the DIMA Entities with respect to operations and financial reporting of the Fund, except that the Chairperson or Vice Chairperson of each Fund’s Audit Committee may grant the pre-approval for non-audit services described in items (i) and (ii) above for non-prohibited services for engagements of less than $100,000. All such delegated pre approvals shall be presented to each Fund’s Audit Committee no later than the next Audit Committee meeting.
There were no amounts that were approved by the Audit Committee pursuant to the de minimis exception under Rule 2-01 of Regulation S-X.
According to the registrant’s principal Independent Registered Public Accounting Firm, substantially all of the principal Independent Registered Public Accounting Firm's hours spent on auditing the registrant's financial statements were attributed to work performed by full-time permanent employees of the principal Independent Registered Public Accounting Firm.
***
In connection with the audit of the 2011 and 2012 financial statements, the Fund entered into an engagement letter with E&Y. The terms of the engagement letter required by E&Y, and agreed to by the Audit Committee, include provisions in which the parties consent to the sole jurisdiction of federal courts in New York, Boston or the Northern District of Illinois, as well as a waiver of right to a trial by jury and an exclusion of punitive damages.
***
E&Y advised the Fund’s Audit Committee that E&Y had identified two matters that it determined to be inconsistent with the SEC’s auditor independence rules.
First, E&Y advised the Fund’s Audit Committee that, in 2010, an investment advisor for a Covered Person in the Chain of Command (both as defined by SEC rules) purchased for the Covered Person’s account shares of a DWS Fund that is not audited by E&Y. E&Y informed the Audit Committee that this investment constituted an investment in an affiliate of an audit client in violation of the Rule 2-01(c)(1) of Regulation S-X. E&Y advised the Audit Committee that E&Y believes its independence has not been impacted as it relates to the audit of the Fund. In reaching this conclusion, E&Y noted a number of factors, including that the purchase was by the Covered Person’s investment advisor, not by the Covered Person himself and the Covered Person caused the shares of the DWS Fund to be sold immediately upon detection of the purchase.
Second, E&Y advised the Fund’s Audit Committee that, in 2010, a Covered Person in the same Office (as defined by SEC rules) as the lead audit engagement partner for the Fund became a trustee and executor to an estate whose assets included shares of a DWS Fund that is not audited by E&Y. E&Y informed the Audit Committee that this investment constituted an investment in an affiliate of an audit client in violation of the Rule 2-01(c)(1) of Regulation S-X. E&Y advised the Audit Committee that E&Y believes its independence has not been impacted as it relates to the audit of the Fund. In reaching this conclusion, E&Y noted a number of factors, including that the shares of the DWS Fund were already an asset of the estate when the Covered Person became executor, the Covered Person caused the shares of the DWS Fund to be sold immediately upon detection in the estate, and the Covered Person was not involved with the provision of audit services to the Fund.
| ITEM 5. | AUDIT COMMITTEE OF LISTED REGISTRANTS | |
| Not applicable | ||
| ITEM 6. | SCHEDULE OF INVESTMENTS | |
| Not applicable | ||
| ITEM 7. | DISCLOSURE OF PROXY VOTING POLICIES AND PROCEDURES FOR CLOSED-END MANAGEMENT INVESTMENT COMPANIES | |
| Not applicable | ||
| ITEM 8. | PORTFOLIO MANAGERS OF CLOSED-END MANAGEMENT INVESTMENT COMPANIES | |
| Not applicable | ||
| ITEM 9. | PURCHASES OF EQUITY SECURITIES BY CLOSED-END MANAGEMENT INVESTMENT COMPANY AND AFFILIATED PURCHASERS | |
| Not applicable | ||
| ITEM 10. | SUBMISSION OF MATTERS TO A VOTE OF SECURITY HOLDERS | |
| There were no material changes to the procedures by which shareholders may recommend nominees to the Fund’s Board. The primary function of the Nominating and Governance Committee is to identify and recommend individuals for membership on the Board and oversee the administration of the Board Governance Guidelines. Shareholders may recommend candidates for Board positions by forwarding their correspondence by U.S. mail or courier service to Paul K. Freeman, Independent Chairman, DWS Funds, P.O. Box 101833, Denver, CO 80250-1833. | ||
| ITEM 11. | CONTROLS AND PROCEDURES | |
| (a) | The Chief Executive and Financial Officers concluded that the Registrant’s Disclosure Controls and Procedures are effective based on the evaluation of the Disclosure Controls and Procedures as of a date within 90 days of the filing date of this report. | |
| (b) | There have been no changes in the registrant’s internal control over financial reporting that occurred during the second fiscal quarter of the period covered by this report that has materially affected, or is reasonably likely to materially affect, the registrant’s internal controls over financial reporting. | |
| ITEM 12. | EXHIBITS | |
| (a)(1) | Code of Ethics pursuant to Item 2 of Form N-CSR is filed and attached hereto as EX-99.CODE ETH. | |
| (a)(2) | Certification pursuant to Rule 30a-2(a) under the Investment Company Act of 1940 (17 CFR 270.30a-2(a)) is filed and attached hereto as Exhibit 99.CERT. | |
| (b) | Certification pursuant to Rule 30a-2(b) under the Investment Company Act of 1940 (17 CFR 270.30a-2(b)) is furnished and attached hereto as Exhibit 99.906CERT. | |
Form N-CSR Item F
SIGNATURES
Pursuant to the requirements of the Securities Exchange Act of 1934 and the Investment Company Act of 1940, the registrant has duly caused this report to be signed on its behalf by the undersigned, thereunto duly authorized.
| Registrant: | DWS Global Income Builder Fund, a series of DWS Market Trust |
| By: | /s/W. Douglas Beck W. Douglas Beck President |
| Date: | December 28, 2012 |
Pursuant to the requirements of the Securities Exchange Act of 1934 and the Investment Company Act of 1940, this report has been signed below by the following persons on behalf of the registrant and in the capacities and on the dates indicated.
| By: | /s/W. Douglas Beck W. Douglas Beck President |
| Date: | December 28, 2012 |
| By: | /s/Paul Schubert Paul Schubert Chief Financial Officer and Treasurer |
| Date: | December 28, 2012 |