UNITED STATES
SECURITIES AND EXCHANGE COMMISSION
WASHINGTON, D. C. 20549
FORM N-CSR
Investment Company Act file number: 811-01236
DWS Market Trust
(Exact Name of Registrant as Specified in Charter)
345 Park Avenue
New York, NY 10154-0004
(Address of Principal Executive Offices) (Zip Code)
Registrant’s Telephone Number, including Area Code: (212) 250-3220
Paul Schubert
60 Wall Street
New York, NY 10005
(Name and Address of Agent for Service)
| Date of fiscal year end: | 3/31 |
| Date of reporting period: | 3/31/2013 |
| ITEM 1. | REPORT TO STOCKHOLDERS |
MARCH 31, 2013 Annual Report to Shareholders |
| DWS Alternative Asset Allocation Fund |
 |
Contents
4 Letter to Shareholders 5 Portfolio Management Review 12 Performance Summary 15 Investment Portfolio 19 Statement of Assets and Liabilities 21 Statement of Operations 22 Statement of Changes in Net Assets 23 Financial Highlights 28 Notes to Financial Statements 40 Report of Independent Registered Public Accounting Firm 41 Information About Your Fund's Expenses 42 Tax Information 43 Summary of Management Fee Evaluation by Independent Fee Consultant 47 Board Members and Officers 52 Account Management Resources |
This report must be preceded or accompanied by a prospectus. To obtain a summary prospectus, if available, or prospectus for any of our funds, refer to the Account Management Resources information provided in the back of this booklet. We advise you to consider the fund's objectives, risks, charges and expenses carefully before investing. The summary prospectus and prospectus contain this and other important information about the fund. Please read the prospectus carefully before you invest.
Although allocation among different asset categories generally limits risk, portfolio management may favor an asset category that underperforms other assets or markets as a whole. The fund expects to invest in underlying funds that emphasize alternatives or non-traditional asset categories or investment strategies, and as a result, it is subject to the risk factors of those underlying funds. Some of those risks include stock market risk, credit and interest rate risk, volatility in commodity prices and high-yield debt securities, short sales risk and the political, general economic, liquidity and currency risks of foreign investments, which may be particularly significant for emerging markets. The fund may use derivatives, including as part of its Global Tactical Asset Allocation (GTAA) strategy. The fund expects to have direct and indirect exposure to derivatives, which may be more volatile and less liquid than traditional securities. The fund could suffer losses on its derivative positions. See the prospectus for additional risks and specific details regarding the fund's risk profile.
DWS Investments is part of the Deutsche Asset & Wealth Management division of Deutsche Bank AG.
NOT FDIC/NCUA INSURED NO BANK GUARANTEE MAY LOSE VALUE NOT A DEPOSIT NOT INSURED BY ANY FEDERAL GOVERNMENT AGENCY
Dear Investor:
As the U.S. and global economies regain their footing, economists are cautiously looking to a less erratic year for the financial markets in 2013. In the U.S. specifically, positive trends in areas such as housing starts and job creation suggest ongoing recovery, albeit at a relatively mild pace. Supporting this view, Larry Adam, Deutsche Asset & Wealth Management's Chief Investment Strategist for Wealth Management, cites the potential for increased bank lending, a rise in business spending, and improved consumer confidence as underlying forces that may act as catalysts for continued positive growth.
Still, critical issues are yet to be resolved. As Washington wrangles with debt concerns, spending, and monetary and fiscal policy, a fair amount of uncertainty lingers. Despite gains in the broad stock market, sluggish growth and historically low interest rates continue to pose a challenge to investors seeking a strategy for growth or retirement income.
Against this backdrop, what can you do? Stay focused. Second-guessing investment decisions based on headlines, short-term market fluctuations or emotion is never a reliable strategy. Also, remember that the investment professionals who manage your DWS fund bring a wealth of experience over a variety of market cycles, along with access to a broad network of research and analytical resources.
At Deutsche Asset & Wealth Management we embrace the concept of discipline and the value of maintaining a long-term view. We urge you to do the same.
Best regards,


Douglas Beck, CFA President, DWS Funds |
Market Overview and Fund Performance
All performance information below is historical and does not guarantee future results. Returns shown are for Class A shares, unadjusted for sales charges. Investment return and principal fluctuate, so your shares may be worth more or less when redeemed. Current performance may differ from performance data shown. Please visit www.dws-investments.com for the most recent month-end performance of all share classes. Fund performance includes reinvestment of all distributions. Unadjusted returns do not reflect sales charges and would have been lower if they had. Please refer to pages 12 through 14 for more complete performance information.
Investment Strategy The fund seeks to achieve its objective by investing in alternative (or non-traditional) asset categories and investment strategies. This fund is a fund-of-funds, which means its assets are invested in a combination of other DWS funds, certain other securities and derivative instruments. The fund may also invest in securities of exchange-traded funds ("ETFs") or hedge funds when the desired economic exposure to a particular asset category or investment strategy is not available through a DWS fund. |
DWS Alternative Asset Allocation Fund invests in a wide range of exchange-traded funds and DWS mutual funds, plus a Global Tactical Asset Allocation (GTAA) strategy, which together provide extensive exposure to alternative asset classes.
During the 12-month period ended March 31, 2013, the Class A shares of the fund returned 6.57% and underperformed the 9.58% return of the benchmark — a blend of 70% in the MSCI World Index and 30% in the Barclays U.S. Aggregate Bond Index. The two indices returned 11.86% and 3.77%, respectively. As always, it is important to remember that in keeping with the fund's objective of seeking capital appreciation, our primary goal is not to keep up with the stock market's short-term performance, but to provide investors with strategies for longer-term portfolio diversification.
The fund outperformed the 2.62% average return of the funds in its Morningstar peer group, Multialternative Funds, during the annual period. The fund is also comfortably ahead of the peer group in the three- (5.58% vs. 2.45%) and five-year (1.98% vs. 1.07%) intervals.
Fund Performance
We divide the fund's holdings into five categories in order to reflect what each allocation offers in terms of its ability to diversify traditional portfolios:
•Hedging Strategies (Target weighting, 16.5% of assets): This portion of the fund, which seeks to generate returns independent of the broader financial markets, lagged the blended benchmark but succeeded in its goal of providing positive absolute performance with a low correlation to traditional assets. Our position in DWS Disciplined Market Neutral Fund, which holds offsetting weightings on the long and short sides of the market, gained ground. The dollar value of the fund's long positions rose more than the dollar value of its shorts declined, which enabled it to capture a positive "spread" between the outperformance of its highest-rated stocks relative to those it ranked the lowest. However, this positive contribution was somewhat offset by the Global Tactical Asset Allocation strategy, which is designed to add value by taking advantage of short-term mispricings in the global bond and currency markets.
•Commodities (Target weighting, 17.75% of assets): In this allocation, which seeks to participate in the returns of the global commodity markets, we held two investments at the close of the period: DWS Enhanced Commodity Strategy Fund and Market Vectors Agribusiness ETF, which invests in the stocks of agriculture-related companies. We also held a position in DWS Gold & Precious Metals Fund, which we eliminated in September of 2012, and iShares S&P Global Timber & Forestry Index Fund, which we sold in March of 2013.
Commodities lagged during the past year due to the continued weakness in global economic conditions. Nevertheless, we believe commodities remain an attractive asset class offering a better return profile in inflationary environments, particularly relative to non-inflation-protected bonds.
•Real Return (Target weighting, 30% of assets): The purpose of this allocation is to provide a measure of protection against inflation via categories such as real estate, infrastructure and inflation-protected bonds. While inflation has been relatively low in recent years, we believe it has the potential to rise in the years ahead due to the highly accommodative policies of the world's central banks. This was the best-performing segment of the fund during the annual period, thanks to the strong, double-digit returns of DWS RREEF Global Real Estate Securities Fund and DWS RREEF Global Infrastructure Fund. Our position in DWS Global Inflation Fund, which invests in inflation-protected bonds, also closed the year with a healthy gain as the demand for inflation "hedges" offset concerns about rising interest rates.
•Currency (Target weighting, 15.5% of assets): Our currency allocation offers exposures to foreign investments, some of which are not denominated in U.S. dollars, in order to provide investors — who typically have large weightings in dollar-denominated assets in the their traditional portfolios — with improved currency diversification. For the majority of the year, this allocation held two investments: DWS Enhanced Emerging Markets Fixed Income Fund and the WisdomTree Emerging Markets Local Debt Fund. Both delivered strong returns amid the continued demand for higher-yielding segments of the bond market.
•Opportunistic (Target weighting, 20.25% of assets): This allocation is designed to offer investors exposure to categories that are generally not included in traditional allocations, such as preferred stocks (iShares S&P U.S. Preferred Stock Index ETF), convertible bonds (SPDR Barclays Capital Convertible Securities) and floating-rate notes (DWS Floating Rate Fund). All three investments performed very well in an environment characterized by investors' continued search for investments with above-average yields and the potential to provide an element of protection against rising interest rates.
Outlook and Fund Positioning
We rebalanced the portfolio late in the first calendar quarter in response to the changing market environment. Our most notable shift was the addition of two new strategies to the portfolio. We initiated a position in PowerShares DB G10 Currency Harvest Fund, which invests in a basket of 10 foreign currencies. In our view, foreign currencies have a relatively attractive risk/return profile when compared with more traditional asset classes such as equities and bonds. In addition, the fund provides added diversification to the portfolio through its exposure to non-U.S.-dollar currencies.
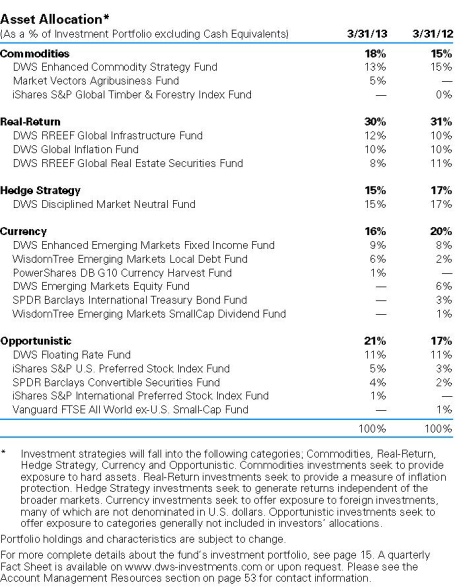
Portfolio Allocation as of 3/31/13 | |
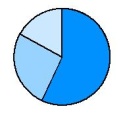 |  |
Commodities investments seek to provide exposure to hard assets. Real-Return investments seek to provide a measure of inflation protection. Hedge Strategy investments seek to generate returns independent of the broader markets. Currency investments seek to offer exposure to foreign investments, many of which are not denominated in U.S. dollars. Opportunistic investments seek to offer exposure to categories generally not included in investors' allocations.
We also added a position in iShares S&P International Preferred Stock Index Fund. We believe preferred stocks — which have certain characteristics of both equities and bonds — provide compelling diversification potential in the current low interest rate environment. This ETF provides an international complement to our existing position in iShares S&P U.S. Preferred Stock Index Fund.
| "We believe this fund, which offers one-stop access to more than a dozen asset classes, is an excellent way for investors to augment their portfolio diversification." |
In addition to adding these new investments, we significantly increased the fund's weighting in the WisdomTree Emerging Markets Local Debt Fund. We believe the ETF provides exposure to the higher yields and appreciation potential of local currencies, which stem from the emerging markets' strong economic growth, healthy currency reserves and low external debt. We also increased the fund's weighting in DWS RREEF Global Infrastructure Fund, based on our belief that local infrastructure projects are necessary for long-term economic growth and productivity, particularly in regions that are less developed. We funded these changes through modest reductions to the fund's allocations to commodities, real-estate-related securities, floating-rate bonds and DWS Disciplined Market Neutral Fund.
These shifts help demonstrate our ability to maximize return potential and/or reduce risk by moving among stocks, bonds, hard assets and hedge-fund-like strategies, as well as hybrid securities such as preferred stocks and convertible bonds. We believe this fund, which offers one-stop access to more than a dozen asset classes, is an excellent way for investors to augment their portfolio diversification.
Effective on or about May 31, 2013, the fund will no longer utilize the GTAA strategy and may instead employ proprietary rules-based currency and interest rate strategies using derivatives.
Subadvisor
QS Investors, LLC ("QS Investors"), New York, New York, is the subadvisor for the fund. Effective on or about May 31, 2013, QS Investors will no longer serve as subadvisor to the fund and day-to-day portfolio management of the fund will transition to Deutsche Investment Management Americas Inc.
Portfolio Management Team
Robert Wang, Head of Portfolio Management and Trading, QS Investors
Began managing the fund in 2007.
• Joined QS Investors in 2010 after 28 years of experience of trading fixed income, foreign exchange and derivative products at Deutsche Asset Management and J.P. Morgan.
• BS, The Wharton School, University of Pennsylvania.
Thomas Picciochi, Head of Global Tactical Asset Allocation Portfolio Management and Trading, QS Investors
Began managing the fund in 2007.
• Joined QS Investors in 2010 after 24 years of experience in portfolio management and various research and analysis positions at Deutsche Asset Management, State Street Global Advisors, FPL Energy, Barnett Bank, Trade Finance Corporation and Reserve Financial Management.
• BA and MBA, University of Miami.
Ellen Tesler, Portfolio Manager, QS Investors
Began managing the fund in 2012.
• Member of the QS Investors portfolio management and trading group.
• Formerly at DB Advisors (2000-2010). Prior to joining DB Advisors, one year as an analyst at Lord Abbett and Company.
• BBA and MBA from Pace University.
Effective on or about May 31, 2013, the portfolio management team for the fund will be as follows:
Pankaj Bhatnagar, PhD, Managing Director
Portfolio Manager of the fund. Joined the fund in 2013.
• Joined Deutsche Asset & Wealth Management in 2000 with seven years of industry experience; previously, served in Quantitative Strategy roles at Nomura Securities, Credit Suisse and Salomon Brothers.
• Portfolio Manager for the Quantitative Group: New York.
• Degree in Civil Engineering from Indian Institute of Technology; MBA from Kent State University; PhD in Finance from University of North Carolina at Chapel Hill.
Darwei Kung, Director
Portfolio Manager of the fund. Joined the fund in 2013.
• Joined Deutsche Asset & Wealth Management in 2006; previously has worked as a Director, Engineering and Business Development at Calpoint LLC from 2001-2004.
• Portfolio Manager: New York.
• BS and MS, University of Washington, Seattle; MS and MBA, Carnegie Mellon University.
The views expressed reflect those of the portfolio management team only through the end of the period of the report as stated on the cover. The management team's views are subject to change at any time based on market and other conditions and should not be construed as a recommendation. Past performance is no guarantee of future results. Current and future portfolio holdings are subject to risk.
Terms to Know
The global tactical asset allocation (GTAA) strategy attempts to take advantage of inefficiencies within global bond and currency markets. The strategy is implemented through the use of derivatives, which are contracts or other instruments whose value is based on, for example, indices, currencies or securities. The strategy primarily uses exchange-traded futures contracts and over-the-counter forward currency contracts.
The Morgan Stanley Capital International (MSCI) World Index is an unmanaged, capitalization-weighted measure of global stock markets including the U.S., Canada, Europe, Australia and the Far East. The index is calculated using closing local market prices and translates into U.S. dollars using the London close foreign exchange rates.
The Barclays U.S. Aggregate Bond Index is an unmanaged, market-value-weighted measure of Treasury issues, agency issues, corporate bond issues and mortgage securities.
Index returns do not reflect fees or expenses and it is not possible to invest directly into an index.
Exchange traded fund (ETF) is a security that tracks an index or asset like an index fund, but trades like a stock on an exchange.
Source: Morningstar, Inc. Rankings are historical and do not guarantee future results. As of March 31, 2013, Class A shares of DWS Alternative Asset Allocation Fund were ranked as follows in the Morningstar Multialternative Funds category: one-year 46/213, and three-year 23/122. Rankings are based on a fund's total return.
| Class A | 1-Year | 5-Year | Life of Fund* |
Average Annual Total Returns as of 3/31/13 | |||
| Unadjusted for Sales Charge | 6.57% | 1.98% | 2.56% |
| Adjusted for the Maximum Sales Charge (max 5.75% load) | 0.44% | 0.78% | 1.49% |
MSCI World Index† | 11.86% | 2.23% | 0.64% |
Barclays U.S. Aggregate Bond Index† | 3.77% | 5.47% | 6.13% |
S&P 500® Index† | 13.96% | 5.81% | 3.61% |
Blended Index† | 9.58% | 3.72% | 2.78% |
| Class C | 1-Year | 5-Year | Life of Fund* |
Average Annual Total Returns as of 3/31/13 | |||
| Unadjusted for Sales Charge | 5.78% | 1.23% | 1.72% |
| Adjusted for the Maximum Sales Charge (max 1.00% CDSC) | 5.78% | 1.23% | 1.72% |
MSCI World Index† | 11.86% | 2.23% | 0.64% |
Barclays U.S. Aggregate Bond Index† | 3.77% | 5.47% | 6.13% |
S&P 500® Index† | 13.96% | 5.81% | 3.61% |
Blended Index† | 9.58% | 3.72% | 2.78% |
| Class R | 1-Year | 5-Year | Life of Fund* |
Average Annual Total Returns as of 3/31/13 | |||
| No Sales Charges | 6.39% | 1.77% | 2.33% |
MSCI World Index† | 11.86% | 2.23% | 0.64% |
Barclays U.S. Aggregate Bond Index† | 3.77% | 5.47% | 6.13% |
S&P 500® Index† | 13.96% | 5.81% | 3.61% |
Blended Index† | 9.58% | 3.72% | 2.78% |
| Class S | 1-Year | 5-Year | Life of Fund* |
Average Annual Total Returns as of 3/31/13 | |||
| No Sales Charges | 6.74% | 2.23% | 2.74% |
MSCI World Index† | 11.86% | 2.23% | 0.64% |
Barclays U.S. Aggregate Bond Index† | 3.77% | 5.47% | 6.13% |
S&P 500® Index† | 13.96% | 5.81% | 3.61% |
Blended Index† | 9.58% | 3.72% | 2.78% |
| Institutional Class | 1-Year | 5-Year | Life of Fund* |
Average Annual Total Returns as of 3/31/13 | |||
| No Sales Charges | 6.87% | 2.25% | 2.76% |
MSCI World Index† | 11.86% | 2.23% | 0.64% |
Barclays U.S. Aggregate Bond Index† | 3.77% | 5.47% | 6.13% |
S&P 500® Index† | 13.96% | 5.81% | 3.61% |
Blended Index† | 9.58% | 3.72% | 2.78% |
Performance in the Average Annual Total Returns table above and the Growth of an Assumed $10,000 Investment line graph that follows is historical and does not guarantee future results. Investment return and principal fluctuate, so your shares may be worth more or less when redeemed. Current performance may differ from performance data shown. Please visit www.dws-investments.com for the Fund's most recent month-end performance. Fund performance includes reinvestment of all distributions. Unadjusted returns do not reflect sales charges and would have been lower if they had.
The gross expense ratios of the Fund, as stated in the fee table of the prospectus dated August 1, 2012 are 2.10%, 2.83%, 4.96%, 1.95% and 1.79% for Class A, Class C, Class R, Class S and Institutional Class shares, respectively, and may differ from the expense ratios disclosed in the Financial Highlights tables in this report. These expense ratios include net expenses of the underlying funds in which the Fund invests.
Index returns do not reflect any fees or expenses and it is not possible to invest directly into an index.
Performance figures do not reflect the deduction of taxes that a shareholder would pay on fund distributions or the redemptions of fund shares.
Returns shown for Class R shares for the period prior to its inception on June 1, 2011 are derived from the historical performance of Class A shares of the DWS Alternative Asset Allocation Fund during such periods and have been adjusted to reflect the higher total annual operating expenses. Any difference in expenses will affect performance.
Growth of an Assumed $10,000 Investment (Adjusted for Maximum Sales Charge) |
 |
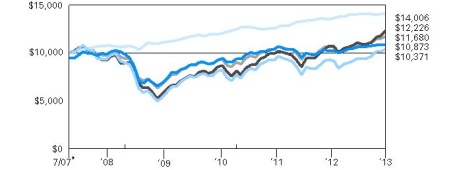 |
| Yearly periods ended March 31 |
The Fund's growth of an assumed $10,000 investment is adjusted for the maximum sales charge of 5.75%. This results in a net initial investment of $9,425.
The growth of $10,000 is cumulative.
Performance of other share classes will vary based on the sales charges and the fee structure of those classes.
* The Fund commenced operations on July 31, 2007. The performance shown for each index is for the time period of July 31, 2007 through March 31, 2013, which is based on the performance period of the life of the Fund.
† The Morgan Stanley Capital International (MSCI) World Index is an unmanaged, capitalization-weighted measure of global stock markets including the U.S., Canada, Europe, Australia and the Far East. The index is calculated using closing local market prices and translates into U.S. dollars using the London close foreign exchange rates.
The Barclays U.S. Aggregate Bond Index is an unmanaged index representing domestic taxable investment-grade bonds, with index components for government and corporate securities, mortgage pass-through securities, and asset-backed securities with an average maturity of one year or more.
The Standard & Poor's 500 (S&P 500) Index is an unmanaged, capitalization-weighted index of 500 stocks. The index is designed to measure performance of the broad domestic economy through changes in the aggregate market value of 500 stocks representing all major industries.
The Blended Index consists of 70% in the MSCI World Index and 30% in the Barclays U.S. Aggregate Bond Index.
| Class A | Class C | Class R | Class S | Institutional Class | ||||||||||||||||
| Net Asset Value | ||||||||||||||||||||
| 3/31/13 | $ | 9.53 | $ | 9.48 | $ | 9.59 | $ | 9.47 | $ | 9.47 | ||||||||||
| 3/31/12 | $ | 9.13 | $ | 9.09 | $ | 9.17 | $ | 9.07 | $ | 9.07 | ||||||||||
Distribution Information as of 3/31/13 | ||||||||||||||||||||
| Income Dividends, Twelve Months | $ | .20 | $ | .13 | $ | .17 | $ | .22 | $ | .22 | ||||||||||
| Shares | Value ($) | |||||||
| Mutual Funds 77.3% | ||||||||
| DWS Disciplined Market Neutral Fund "Institutional"* (a) | 10,370,283 | 101,110,257 | ||||||
| DWS Enhanced Commodity Strategy Fund "Institutional" (a) | 28,517,374 | 91,825,945 | ||||||
| DWS Enhanced Emerging Markets Fixed Income Fund "Institutional" (a) | 5,344,517 | 59,377,585 | ||||||
| DWS Floating Rate Fund "Institutional" (a) | 8,257,644 | 78,530,195 | ||||||
| DWS Global Inflation Fund "Institutional" (a) | 6,345,009 | 69,731,650 | ||||||
| DWS RREEF Global Infrastructure Fund "Institutional" (a) | 6,503,333 | 82,397,232 | ||||||
| DWS RREEF Global Real Estate Securities Fund "Institutional" (a) | 6,744,522 | 57,598,217 | ||||||
Total Mutual Funds (Cost $489,819,665) | 540,571,081 | |||||||
| Exchange-Traded Funds 20.6% | ||||||||
| iShares S&P International Preferred Stock Index Fund | 260,728 | 7,042,263 | ||||||
| iShares S&P U.S. Preferred Stock Index Fund | 776,749 | 31,473,870 | ||||||
| Market Vectors Agribusiness Fund | 582,228 | 31,527,646 | ||||||
| PowerShares DB G10 Currency Harvest Fund* (b) | 259,196 | 7,063,091 | ||||||
| SPDR Barclays Capital Convertible Securities | 581,901 | 24,666,783 | ||||||
| WisdomTree Emerging Markets Local Debt Fund | 797,375 | 41,918,003 | ||||||
Total Exchange-Traded Funds (Cost $136,008,392) | 143,691,656 | |||||||
| Cash Equivalents 1.3% | ||||||||
| Central Cash Management Fund, 0.12% (a) (c) (Cost $9,475,751) | 9,475,751 | 9,475,751 | ||||||
| % of Net Assets | Value ($) | |||||||
Total Investment Portfolio (Cost $635,303,808)† | 99.2 | 693,738,488 | ||||||
| Other Assets and Liabilities, Net | 0.8 | 5,290,702 | ||||||
| Net Assets | 100.0 | 699,029,190 | ||||||
* Non-income producing security.
† The cost for federal income tax purposes was $681,149,363. At March 31, 2013, net unrealized appreciation for all securities based on tax cost was $12,589,125. This consisted of aggregate gross unrealized appreciation for all securities in which there was an excess of value over tax cost of $62,631,389 and aggregate gross unrealized depreciation for all securities in which there was an excess of tax cost over value of $50,042,264.
(a) Affiliated fund managed by Deutsche Investment Management Americas Inc.
(b) Affiliated fund managed by DB Commodity Services LLC, a subsidiary of Deutsche Bank AG.
(c) The rate shown is the annualized seven-day yield at period end.
S&P: Standard & Poor's
SPDR: Standard & Poor's Depositary Receipt
At March 31, 2013, open futures contracts purchased were as follows:
| Futures | Currency | Expiration Date | Contracts | Notional Value ($) | Unrealized Appreciation ($) | |||||||||
| 10 Year Canadian Government Bond | CAD | 6/19/2013 | 385 | 51,171,630 | 974,521 | |||||||||
| 10 Year U.S. Treasury Note | USD | 6/19/2013 | 208 | 27,452,750 | 19,084 | |||||||||
| 2 Year U.S. Treasury Note | USD | 6/28/2013 | 184 | 40,563,375 | 19,758 | |||||||||
| Federal Republic of Germany Euro-Bund | EUR | 6/6/2013 | 71 | 13,241,249 | 190,086 | |||||||||
| Federal Republic of Germany Euro-Schatz | EUR | 6/6/2013 | 554 | 78,698,306 | 105,528 | |||||||||
| United Kingdom Long Gilt Bond | GBP | 6/26/2013 | 31 | 5,594,887 | 177,995 | |||||||||
| Total unrealized appreciation | 1,486,972 | |||||||||||||
At March 31, 2013, open futures contracts sold were as follows:
| Futures | Currency | Expiration Date | Contracts | Notional Value ($) | Unrealized Depreciation ($) | |||||||||
| 10 Year Australian Treasury Bond | AUD | 6/17/2013 | 351 | 44,438,379 | (550,040 | ) | ||||||||
| 10 Year Japanese Government Bond | JPY | 6/11/2013 | 53 | 81,897,063 | (366,654 | ) | ||||||||
| Total unrealized depreciation | (916,694 | ) | ||||||||||||
At March 31, 2013, the Fund had the following open forward foreign currency exchange contracts:
| Contracts to Deliver | In Exchange For | Settlement Date | Unrealized Appreciation ($) | Counterparty | |||||||||||
| USD | 30,910,443 | AUD | 29,830,000 | 4/26/2013 | 93,760 | UBS AG | |||||||||
| USD | 5,727,362 | GBP | 3,780,000 | 4/26/2013 | 15,434 | UBS AG | |||||||||
| USD | 15,503,437 | JPY | 1,477,170,000 | 4/26/2013 | 191,048 | UBS AG | |||||||||
| USD | 166,740 | CAD | 170,000 | 4/26/2013 | 518 | UBS AG | |||||||||
| EUR | 14,010,000 | USD | 18,146,635 | 4/26/2013 | 185,220 | UBS AG | |||||||||
| NOK | 59,820,000 | USD | 10,254,547 | 4/26/2013 | 21,979 | UBS AG | |||||||||
| CHF | 10,400,000 | USD | 10,961,815 | 4/26/2013 | 3,276 | UBS AG | |||||||||
| SEK | 14,060,000 | USD | 2,162,668 | 4/26/2013 | 6,176 | UBS AG | |||||||||
| AUD | 12,890,000 | USD | 13,488,225 | 4/26/2013 | 90,834 | UBS AG | |||||||||
| Total unrealized appreciation | 608,245 | ||||||||||||||
| Contracts to Deliver | In Exchange For | Settlement Date | Unrealized Depreciation ($) | Counterparty | |||||||||||
| USD | 17,910,605 | SEK | 115,400,000 | 4/26/2013 | (210,803 | ) | UBS AG | ||||||||
| USD | 1,650,118 | NOK | 9,620,000 | 4/26/2013 | (4,559 | ) | UBS AG | ||||||||
| USD | 14,405,726 | EUR | 11,190,000 | 4/26/2013 | (59,671 | ) | UBS AG | ||||||||
| CAD | 6,460,000 | USD | 6,293,009 | 4/26/2013 | (62,809 | ) | UBS AG | ||||||||
| GBP | 19,250,000 | USD | 29,201,865 | 4/26/2013 | (43,852 | ) | UBS AG | ||||||||
| NZD | 16,150,000 | USD | 13,376,707 | 4/26/2013 | (115,306 | ) | UBS AG | ||||||||
| Total unrealized depreciation | (497,000 | ) | |||||||||||||
| Currency Abbreviations |
AUD Australian Dollar CAD Canadian Dollar CHF Swiss Franc EUR Euro GBP British Pound JPY Japanese Yen NOK Norwegian Krone NZD New Zealand Dollar SEK Swedish Krona USD United States Dollar |
For information on the Fund's policy and additional disclosures regarding futures contracts and forward foreign currency exchange contracts, please refer to Note B in the accompanying Notes to Financial Statements.
Fair Value Measurements
Various inputs are used in determining the value of the Fund's investments. These inputs are summarized in three broad levels. Level 1 includes quoted prices in active markets for identical securities. Level 2 includes other significant observable inputs (including quoted prices for similar securities, interest rates, prepayment speeds and credit risk). Level 3 includes significant unobservable inputs (including the Fund's own assumptions in determining the fair value of investments). The inputs or methodology used for valuing securities are not necessarily an indication of the risk associated with investing in those securities.
The following is a summary of the inputs used as of March 31, 2013 in valuing the Fund's investments. For information on the Fund's policy regarding the valuation of investments, please refer to the Security Valuation section of Note A in the accompanying Notes to Financial Statements.
| Assets | Level 1 | Level 2 | Level 3 | Total | ||||||||||||
| Mutual Funds | $ | 540,571,081 | $ | — | $ | — | $ | 540,571,081 | ||||||||
| Exchange-Traded Funds | 143,691,656 | — | — | 143,691,656 | ||||||||||||
| Short-Term Investments | 9,475,751 | — | — | 9,475,751 | ||||||||||||
Derivatives (d) Futures Contracts | 1,486,972 | — | — | 1,486,972 | ||||||||||||
| Forward Foreign Currency Exchange Contracts | — | 608,245 | — | 608,245 | ||||||||||||
| Total | $ | 695,225,460 | $ | 608,245 | $ | — | $ | 695,833,705 | ||||||||
| Liabilities | ||||||||||||||||
Derivatives (d) Futures Contracts | $ | (916,694 | ) | $ | — | $ | — | $ | (916,694 | ) | ||||||
| Forward Foreign Currency Exchange Contracts | — | (497,000 | ) | — | (497,000 | ) | ||||||||||
| Total | $ | (916,694 | ) | $ | (497,000 | ) | $ | — | $ | (1,413,694 | ) | |||||
There have been no transfers between fair value measurement levels during the year ended March 31, 2013.
(d) Derivatives include unrealized appreciation (depreciation) on futures contracts and forward foreign currency exchange contracts.
The accompanying notes are an integral part of the financial statements.
| as of March 31, 2013 | ||||
| Assets | ||||
Investments: Investments in affiliated Underlying Funds, at value (cost $506,218,100) | $ | 557,109,923 | ||
| Investments in non-affiliated Underlying Funds, at value (cost $129,085,708) | 136,628,565 | |||
| Total investments in securities, at value (cost $635,303,808) | 693,738,488 | |||
| Deposit with broker for futures contracts | 2,953,386 | |||
| Cash held as collateral for forward foreign currency exchange contracts | 3,030,000 | |||
| Receivable for investments sold | 2,395,000 | |||
| Receivable for Fund shares sold | 2,561,931 | |||
| Interest receivable | 1,277 | |||
| Receivable for variation margin on futures contracts | 570,278 | |||
| Unrealized appreciation on forward foreign currency exchange contracts | 608,245 | |||
| Due from Advisor | 14,053 | |||
| Other assets | 29,351 | |||
| Total assets | 705,902,009 | |||
| Liabilities | ||||
| Payable for investments purchased | 4,086,711 | |||
| Payable for Fund shares redeemed | 1,422,808 | |||
| Unrealized depreciation on forward foreign currency exchange contracts | 497,000 | |||
| Accrued management fee | 33,916 | |||
| Accrued Trustees' fees | 6,528 | |||
| Other accrued expenses and payables | 825,856 | |||
| Total liabilities | 6,872,819 | |||
| Net assets, at value | $ | 699,029,190 | ||
| Net Assets Consist of | ||||
| Undistributed net investment income | 2,318,838 | |||
Net unrealized appreciation (depreciation) on: Investments | 58,434,680 | |||
| Futures | 570,278 | |||
| Foreign currency | 109,055 | |||
| Accumulated net realized gain (loss) | (100,302,724 | ) | ||
| Paid-in capital | 737,899,063 | |||
| Net assets, at value | $ | 699,029,190 | ||
The accompanying notes are an integral part of the financial statements.
Statement of Assets and Liabilities as of March 31, 2013 (continued) | ||||
| Net Asset Value | ||||
Class A Net Asset Value and redemption price per share ($238,407,776 ÷ 25,005,521 shares outstanding of beneficial interest, no par value, unlimited number of shares authorized) | $ | 9.53 | ||
| Maximum offering price per share (100 ÷ 94.25 of $9.53) | $ | 10.11 | ||
Class C Net Asset Value, offering and redemption price (subject to contingent deferred sales charge) per share ($155,139,489 ÷ 16,360,200 shares outstanding of beneficial interest, no par value, unlimited number of shares authorized) | $ | 9.48 | ||
Class R Net Asset Value, offering and redemption price per share ($2,110,449 ÷ 220,126 shares outstanding of beneficial interest, no par value, unlimited number of shares authorized) | $ | 9.59 | ||
Class S Net Asset Value, offering and redemption price per share ($259,334,899 ÷ 27,396,782 shares outstanding of beneficial interest, no par value, unlimited number of shares authorized) | $ | 9.47 | ||
Institutional Class Net Asset Value, offering and redemption price per share ($44,036,577 ÷ 4,649,352 shares outstanding of beneficial interest, no par value, unlimited number of shares authorized) | $ | 9.47 | ||
The accompanying notes are an integral part of the financial statements.
| for the year ended March 31, 2013 | ||||
| Investment Income | ||||
| Income distributions from affiliated Underlying Funds | $ | 14,532,492 | ||
| Dividends | 4,300,648 | |||
| Total income | 18,833,140 | |||
Expenses: Management fee | 1,378,365 | |||
| Administration fee | 689,183 | |||
| Services to shareholders | 1,157,412 | |||
| Distribution and service fees | 2,180,038 | |||
| Custodian fee | 19,452 | |||
| Professional fees | 72,072 | |||
| Reports to shareholders | 94,645 | |||
| Registration fees | 100,602 | |||
| Trustees' fees and expenses | 28,551 | |||
| Other | 55,873 | |||
| Total expenses before expense reductions | 5,776,193 | |||
| Expense reductions | (1,550,036 | ) | ||
| Total expenses after expense reductions | 4,226,157 | |||
| Net investment income | 14,606,983 | |||
| Realized and Unrealized Gain (Loss) | ||||
Net realized gain (loss) from: Sale of affiliated Underlying Funds | (12,249,977 | ) | ||
| Sale of non-affiliated Underlying Funds | 1,235,053 | |||
| Capital gain distributions from affiliated Underlying Funds | 1,835,722 | |||
| Capital gain distributions from non-affiliated Underlying Funds | 78,364 | |||
| Futures | 1,098,443 | |||
| Foreign currency | (816,799 | ) | ||
| (8,819,194 | ) | |||
Change in net unrealized appreciation (depreciation) on: Investments | 36,075,457 | |||
| Futures | 546,505 | |||
| Foreign currency | 423,014 | |||
| 37,044,976 | ||||
| Net gain (loss) | 28,225,782 | |||
| Net increase (decrease) in net assets resulting from operations | $ | 42,832,765 | ||
The accompanying notes are an integral part of the financial statements.
| Years Ended March 31, | ||||||||
| Increase (Decrease) in Net Assets | 2013 | 2012 | ||||||
Operations: Net investment income | $ | 14,606,983 | $ | 29,370,786 | ||||
| Net realized gain (loss) | (8,819,194 | ) | 16,062,632 | |||||
| Change in net unrealized appreciation (depreciation) | 37,044,976 | (62,153,086 | ) | |||||
| Net increase (decrease) in net assets resulting from operations | 42,832,765 | (16,719,668 | ) | |||||
Distributions to shareholders from: Net investment income: Class A | (4,887,827 | ) | (10,460,901 | ) | ||||
| Class C | (2,205,752 | ) | (4,880,016 | ) | ||||
| Class R | (38,470 | ) | (35 | ) | ||||
| Class S | (5,716,130 | ) | (9,814,777 | ) | ||||
| Institutional Class | (1,076,056 | ) | (1,822,029 | ) | ||||
| Total distributions | (13,924,235 | ) | (26,977,758 | ) | ||||
Fund share transactions: Proceeds from shares sold | 212,530,385 | 201,543,537 | ||||||
| Reinvestment of distributions | 12,279,330 | 23,343,453 | ||||||
| Payments for shares redeemed | (250,490,639 | ) | (244,568,014 | ) | ||||
| Net increase (decrease) in net assets from Fund share transactions | (25,680,924 | ) | (19,681,024 | ) | ||||
| Increase (decrease) in net assets | 3,227,606 | (63,378,450 | ) | |||||
| Net assets at beginning of period | 695,801,584 | 759,180,034 | ||||||
| Net assets at end of period (including undistributed net investment income of $2,318,838 and $894,982, respectively) | $ | 699,029,190 | $ | 695,801,584 | ||||
The accompanying notes are an integral part of the financial statements.
| Years Ended March 31, | |||||||||||||||||||||
| Class A | 2013 | 2012 | 2011 | 2010 | 2009 | ||||||||||||||||
| Selected Per Share Data | |||||||||||||||||||||
| Net asset value, beginning of period | $ | 9.13 | $ | 9.67 | $ | 8.71 | $ | 6.72 | $ | 10.21 | |||||||||||
Income (loss) from investment operations: Net investment incomea | .20 | .38 | .17 | .20 | .14 | ||||||||||||||||
| Net realized and unrealized gain (loss) | .40 | (.56 | ) | .90 | 2.08 | (3.20 | ) | ||||||||||||||
| Total from investment operations | .60 | (.18 | ) | 1.07 | 2.28 | (3.06 | ) | ||||||||||||||
Less distributions from: Net investment income | (.20 | ) | (.36 | ) | (.11 | ) | (.29 | ) | (.38 | ) | |||||||||||
| Net realized gain | — | — | — | — | (.05 | ) | |||||||||||||||
| Total distributions | (.20 | ) | (.36 | ) | (.11 | ) | (.29 | ) | (.43 | ) | |||||||||||
| Net asset value, end of period | $ | 9.53 | $ | 9.13 | $ | 9.67 | $ | 8.71 | $ | 6.72 | |||||||||||
Total Return (%)b,c,d | 6.57 | (1.77 | ) | 12.43 | 34.30 | (30.21 | ) | ||||||||||||||
| Ratios to Average Net Assets and Supplemental Data | |||||||||||||||||||||
| Net assets, end of period ($ millions) | 238 | 262 | 293 | 221 | 128 | ||||||||||||||||
Ratio of expenses before expense reductions (%)e | .75 | .76 | .79 | .83 | .89 | ||||||||||||||||
Ratio of expenses after expense reductions (%)e | .52 | .47 | .47 | .47 | .49 | ||||||||||||||||
| Ratio of net investment income (%) | 2.17 | 4.10 | 1.94 | 2.44 | 1.63 | ||||||||||||||||
| Portfolio turnover rate (%) | 30 | 32 | 24 | 18 | 42 | ||||||||||||||||
a Based on average shares outstanding during the period. b Total return does not reflect the effect of any sales charges. c Total return would have been lower had certain expenses not been reduced. d Total return would have been lower if the Advisor had not reduced some Underlying DWS Funds' expenses. e The Fund invests in other funds and indirectly bears its proportionate share of fees and expenses incurred by the Underlying Funds in which the Fund is invested. This ratio does not include these indirect fees and expenses. | |||||||||||||||||||||
| Years Ended March 31, | |||||||||||||||||||||
| Class C | 2013 | 2012 | 2011 | 2010 | 2009 | ||||||||||||||||
| Selected Per Share Data | |||||||||||||||||||||
| Net asset value, beginning of period | $ | 9.09 | $ | 9.61 | $ | 8.68 | $ | 6.69 | $ | 10.15 | |||||||||||
Income (loss) from investment operations: Net investment incomea | .13 | .31 | .11 | .14 | .07 | ||||||||||||||||
| Net realized and unrealized gain (loss) | .39 | (.56 | ) | .89 | 2.06 | (3.16 | ) | ||||||||||||||
| Total from investment operations | .52 | (.25 | ) | 1.00 | 2.20 | (3.09 | ) | ||||||||||||||
Less distributions from: Net investment income | (.13 | ) | (.27 | ) | (.07 | ) | (.21 | ) | (.32 | ) | |||||||||||
| Net realized gain | — | — | — | — | (.05 | ) | |||||||||||||||
| Total distributions | (.13 | ) | (.27 | ) | (.07 | ) | (.21 | ) | (.37 | ) | |||||||||||
| Net asset value, end of period | $ | 9.48 | $ | 9.09 | $ | 9.61 | $ | 8.68 | $ | 6.69 | |||||||||||
Total Return (%)b,c,d | 5.78 | (2.53 | ) | 11.63 | 33.17 | (30.65 | ) | ||||||||||||||
| Ratios to Average Net Assets and Supplemental Data | |||||||||||||||||||||
| Net assets, end of period ($ millions) | 155 | 162 | 176 | 138 | 87 | ||||||||||||||||
Ratio of expenses before expense reductions (%)e | 1.49 | 1.49 | 1.55 | 1.56 | 1.66 | ||||||||||||||||
Ratio of expenses after expense reductions (%)e | 1.28 | 1.22 | 1.22 | 1.22 | 1.24 | ||||||||||||||||
| Ratio of net investment income (%) | 1.45 | 3.37 | 1.19 | 1.69 | .88 | ||||||||||||||||
| Portfolio turnover rate (%) | 30 | 32 | 24 | 18 | 42 | ||||||||||||||||
a Based on average shares outstanding during the period. b Total return does not reflect the effect of any sales charges. c Total return would have been lower had certain expenses not been reduced. d Total return would have been lower if the Advisor had not reduced some Underlying DWS Funds' expenses. e The Fund invests in other funds and indirectly bears its proportionate share of fees and expenses incurred by the Underlying Funds in which the Fund is invested. This ratio does not include these indirect fees and expenses. | |||||||||||||||||||||
| Class R | Year Ended 3/31/13 | Period Ended 3/31/12a | ||||||
| Selected Per Share Data | ||||||||
| Net asset value, beginning of period | $ | 9.17 | $ | 9.65 | ||||
Income (loss) from investment operations: Net investment incomeb | .20 | .36 | ||||||
| Net realized and unrealized gain (loss) | .39 | (.54 | ) | |||||
| Total from investment operations | .59 | (.18 | ) | |||||
Less distributions from: Net investment income | (.17 | ) | (.30 | ) | ||||
| Net asset value, end of period | $ | 9.59 | $ | 9.17 | ||||
Total Return (%)c,d | 6.39 | (1.77 | )** | |||||
| Ratios to Average Net Assets and Supplemental Data | ||||||||
| Net assets, end of period ($ millions) | 2 | .001 | ||||||
Ratio of expenses before expense reductions (%)e | 1.07 | 3.62 | * | |||||
Ratio of expenses after expense reductions (%)e | .76 | .72 | * | |||||
| Ratio of net investment income (%) | 2.17 | 4.73 | * | |||||
| Portfolio turnover rate (%) | 30 | 32 | ||||||
a For the period from June 1, 2011 (commencement of operations) to March 31, 2012. b Based on average shares outstanding during the period. c Total return would have been lower had certain expenses not been reduced. d Total return would have been lower if the Advisor had not reduced some Underlying DWS Funds' expenses. e The Fund invests in other funds and indirectly bears its proportionate share of fees and expenses incurred by the Underlying Funds in which the Fund is invested. This ratio does not include these indirect fees and expenses. * Annualized ** Not annualized | ||||||||
| Years Ended March 31, | |||||||||||||||||||||
| Class S | 2013 | 2012 | 2011 | 2010 | 2009 | ||||||||||||||||
| Selected Per Share Data | |||||||||||||||||||||
| Net asset value, beginning of period | $ | 9.07 | $ | 9.61 | $ | 8.66 | $ | 6.69 | $ | 10.18 | |||||||||||
Income (loss) from investment operations: Net investment incomea | .22 | .40 | .20 | .22 | .16 | ||||||||||||||||
| Net realized and unrealized gain (loss) | .40 | (.56 | ) | .89 | 2.07 | (3.18 | ) | ||||||||||||||
| Total from investment operations | .62 | (.16 | ) | 1.09 | 2.29 | (3.02 | ) | ||||||||||||||
Less distributions from: Net investment income | (.22 | ) | (.38 | ) | (.14 | ) | (.32 | ) | (.42 | ) | |||||||||||
| Net realized gain | — | — | — | — | (.05 | ) | |||||||||||||||
| Total distributions | (.22 | ) | (.38 | ) | (.14 | ) | (.32 | ) | (.47 | ) | |||||||||||
| Net asset value, end of period | $ | 9.47 | $ | 9.07 | $ | 9.61 | $ | 8.66 | $ | 6.69 | |||||||||||
Total Return (%)b,c | 6.74 | (1.49 | ) | 12.66 | 34.56 | (29.97 | ) | ||||||||||||||
| Ratios to Average Net Assets and Supplemental Data | |||||||||||||||||||||
| Net assets, end of period ($ millions) | 259 | 230 | 250 | 170 | 97 | ||||||||||||||||
Ratio of expenses before expense reductions (%)d | .57 | .61 | .62 | .71 | .71 | ||||||||||||||||
Ratio of expenses after expense reductions (%)d | .34 | .22 | .22 | .22 | .24 | ||||||||||||||||
| Ratio of net investment income (%) | 2.42 | 4.37 | 2.19 | 2.69 | 1.88 | ||||||||||||||||
| Portfolio turnover rate (%) | 30 | 32 | 24 | 18 | 42 | ||||||||||||||||
a Based on average shares outstanding during the period. b Total return would have been lower had certain expenses not been reduced. c Total return would have been lower if the Advisor had not reduced some Underlying DWS Funds' expenses. d The Fund invests in other funds and indirectly bears its proportionate share of fees and expenses incurred by the Underlying Funds in which the Fund is invested. This ratio does not include these indirect fees and expenses. | |||||||||||||||||||||
| Years Ended March 31, | |||||||||||||||||||||
| Institutional Class | 2013 | 2012 | 2011 | 2010 | 2009 | ||||||||||||||||
| Selected Per Share Data | |||||||||||||||||||||
| Net asset value, beginning of period | $ | 9.07 | $ | 9.61 | $ | 8.65 | $ | 6.69 | $ | 10.18 | |||||||||||
Income (loss) from investment operations: Net investment incomea | .24 | .41 | .20 | .22 | .16 | ||||||||||||||||
| Net realized and unrealized gain (loss) | .38 | (.57 | ) | .90 | 2.06 | (3.18 | ) | ||||||||||||||
| Total from investment operations | .62 | (.16 | ) | 1.10 | 2.28 | (3.02 | ) | ||||||||||||||
Less distributions from: Net investment income | (.22 | ) | (.38 | ) | (.14 | ) | (.32 | ) | (.42 | ) | |||||||||||
| Net realized gain | — | — | — | — | (.05 | ) | |||||||||||||||
| Total distributions | (.22 | ) | (.38 | ) | (.14 | ) | (.32 | ) | (.47 | ) | |||||||||||
| Net asset value, end of period | $ | 9.47 | $ | 9.07 | $ | 9.61 | $ | 8.65 | $ | 6.69 | |||||||||||
Total Return (%)b,c | 6.87 | (1.50 | ) | 12.80 | 34.41 | (29.97 | ) | ||||||||||||||
| Ratios to Average Net Assets and Supplemental Data | |||||||||||||||||||||
| Net assets, end of period ($ millions) | 44 | 42 | 41 | 14 | 5 | ||||||||||||||||
Ratio of expenses before expense reductions (%)d | .45 | .45 | .41 | .46 | .50 | ||||||||||||||||
Ratio of expenses after expense reductions (%)d | .22 | .22 | .22 | .22 | .24 | ||||||||||||||||
| Ratio of net investment income (%) | 2.56 | 4.45 | 2.19 | 2.69 | 1.88 | ||||||||||||||||
| Portfolio turnover rate (%) | 30 | 32 | 24 | 18 | 42 | ||||||||||||||||
a Based on average shares outstanding during the period. b Total return would have been lower had certain expenses not been reduced. c Total return would have been lower if the Advisor had not reduced some Underlying DWS Funds' expenses. d The Fund invests in other funds and indirectly bears its proportionate share of fees and expenses incurred by the Underlying Funds in which the Fund is invested. This ratio does not include these indirect fees and expenses. | |||||||||||||||||||||
A. Organization and Significant Accounting Policies
DWS Alternative Asset Allocation Fund (the "Fund") is a diversified series of DWS Market Trust (the "Trust"), which is registered under the Investment Company Act of 1940, as amended (the "1940 Act"), as an open-end management investment company organized as a Massachusetts business trust. The Fund mainly invests in other affiliated DWS funds (i.e. mutual funds, exchange-traded funds and other pooled investment vehicles managed by Deutsche Investment Management Americas Inc. or one of its affiliates, together the "Underlying DWS Funds"), non-affiliated exchange-traded funds ("Non-affiliated ETFs") and derivative investments. Non-affiliated ETFs and Underlying DWS Funds are collectively referred to as "Underlying Funds." Each Underlying DWS Fund's accounting policies and investment holdings are outlined in the Underlying DWS Funds' financial statements and are available upon request.
The Fund offers multiple classes of shares which provide investors with different purchase options. Class A shares are offered to investors subject to an initial sales charge. Class C shares are offered to investors without an initial sales charge but are subject to higher ongoing expenses than Class A shares and a contingent deferred sales charge payable upon certain redemptions within one year of purchase. Class R shares are only available to participants in certain retirement plans and are offered to investors without an initial sales charge. Class S shares are not subject to initial or contingent deferred sales charges and are generally not available to new investors except under certain circumstances. Institutional Class shares are offered to a limited group of investors, are not subject to initial or contingent deferred sales charges and have lower ongoing expenses than other classes.
Investment income, realized and unrealized gains and losses, and certain fund-level expenses and expense reductions, if any, are borne pro rata on the basis of relative net assets by the holders of all classes of shares, except that each class bears certain expenses unique to that class such as services to shareholders, distribution and service fees and certain other class-specific expenses. Differences in class-level expenses may result in payment of different per share dividends by class. All shares of the Fund have equal rights with respect to voting subject to class-specific arrangements.
The Fund's financial statements are prepared in accordance with accounting principles generally accepted in the United States of America which require the use of management estimates. Actual results could differ from those estimates. The policies described below are followed consistently by the Fund in the preparation of its financial statements.
Security Valuation. Investments are stated at value determined as of the close of regular trading on the New York Stock Exchange on each day the exchange is open for trading.
Various inputs are used in determining the value of the Fund's investments. These inputs are summarized in three broad levels. Level 1 includes quoted prices in active markets for identical securities. Level 2 includes other significant observable inputs (including quoted prices for similar securities, interest rates, prepayment speeds, and credit risk). Level 3 includes significant unobservable inputs (including the Fund's own assumptions in determining the fair value of investments). The inputs or methodology used for valuing securities are not necessarily an indication of the risk associated with investing in those securities.
Investments in mutual funds are valued at the net asset value per share of each class of the mutual fund and are categorized as Level 1.
ETFs are valued at the most recent sale price or official closing price reported on the exchange (U.S. or foreign) or over-the-counter market on which they trade and are categorized as Level 1 securities. ETFs for which no sales are reported are valued at the calculated mean between the most recent bid and asked quotations on the relevant market or, if a mean cannot be determined, at the most recent bid quotation.
Futures contracts are generally valued at the settlement prices established each day on the exchange on which they are traded and are categorized as Level 1.
Forward currency contracts are valued at the prevailing forward exchange rate of the underlying currencies and are categorized as Level 2.
Disclosure about the classification of fair value measurements is included in a table following the Fund's Investment Portfolio.
New Accounting Pronouncement. In January 2013, Accounting Standard Update 2013-01 (ASU 2013-01), Clarifying the Scope of Disclosures about Offsetting Assets and Liabilities, replaced Accounting Standards Update 2011-11 (ASU 2011-11), Disclosures about Offsetting Assets and Liabilities. ASU 2013-01 is effective for fiscal years beginning on or after January 1, 2013, and interim periods within those annual periods. ASU 2011-11 was intended to enhance disclosure requirements on the offsetting of financial assets and liabilities. The ASU 2013-01 limits the scope of the new balance sheet offsetting disclosures to derivatives, repurchase agreements, and securities lending transactions to the extent that they are (1) offset in the financial statements or (2) subject to an enforceable master netting arrangement or similar agreement. Management is currently evaluating the application of ASU 2013-01 and its impact, if any, on the Fund's financial statements.
Foreign Currency Translations. The books and records of the Fund are maintained in U.S. dollars. Investment securities and other assets and liabilities denominated in a foreign currency are translated into U.S. dollars at the prevailing exchange rates at period end. Purchases and sales of investment securities, income and expenses are translated into U.S. dollars at the prevailing exchange rates on the respective dates of the transactions.
Net realized and unrealized gains and losses on foreign currency transactions represent net gains and losses between trade and settlement dates on securities transactions, the acquisition and disposition of foreign currencies, and the difference between the amount of net investment income accrued and the U.S. dollar amount actually received. That portion of both realized and unrealized gains and losses on investments that results from fluctuations in foreign currency exchange rates is not separately disclosed but is included with net realized and unrealized gain/appreciation and loss/depreciation on investments.
Federal Income Taxes. The Fund's policy is to comply with the requirements of the Internal Revenue Code, as amended, which are applicable to regulated investment companies, and to distribute all of its taxable income to its shareholders.
Under the Regulated Investment Company Modernization Act of 2010, net capital losses incurred post-enactment may be carried forward indefinitely, and their character is retained as short-term and/or long-term. Previously, net capital losses were carried forward for eight years and treated as short-term losses. As a transition rule, the Act requires that post-enactment net capital losses be used before pre-enactment net capital losses.
At March 31, 2013, the Fund had a net tax basis capital loss carryforward of approximately $53,945,000, including $36,529,000 of pre-enactment losses, which may be applied against any realized net taxable capital gains of each succeeding year until fully utilized or until March 31, 2017 ($1,048,000) and March 31, 2018 ($35,481,000), the respective expiration dates, whichever occurs first, and approximately $17,416,000 of post-enactment losses, which may be applied against realized net taxable capital gains indefinitely, including short-term losses ($325,000) and long-term losses ($17,091,000).
The Fund has reviewed the tax positions for the open tax years as of March 31, 2013 and has determined that no provision for income tax is required in the Fund's financial statements. The Fund's federal tax returns for the prior three fiscal years remain open subject to examination by the Internal Revenue Service.
Distribution of Income and Gains. Distributions from net investment income of the Fund, if any, are declared and distributed to shareholders annually. Net realized gains from investment transactions, in excess of available capital loss carryforwards, would be taxable to the Fund if not distributed, and, therefore, will be distributed to shareholders at least annually.The Fund may also make additional distributions for tax purposes if necessary.
The timing and characterization of certain income and capital gain distributions are determined annually in accordance with federal tax regulations which may differ from accounting principles generally accepted in the United States of America. These differences primarily relate to forward currency contracts, investments in futures and certain securities sold at a loss. As a result, net investment income (loss) and net realized gain (loss) on investment transactions for a reporting period may differ significantly from distributions during such period. Accordingly, the Fund may periodically make reclassifications among certain of its capital accounts without impacting the net asset value of the Fund.
At March 31, 2013, the Fund's components of distributable earnings (accumulated losses) on a tax basis were as follows:
Undistributed ordinary income* | $ | 2,430,083 | ||
| Capital loss carryforwards | $ | (53,945,000 | ) | |
| Net unrealized appreciation (depreciation) on investments | $ | 12,589,125 |
In addition, the tax character of distributions paid to shareholders by the Fund is summarized as follows:
| Years Ended March 31, | ||||||||
| 2013 | 2012 | |||||||
| Distributions from ordinary income* | $ | 13,924,235 | $ | 26,977,758 | ||||
* For tax purposes, short-term capital gain distributions are considered ordinary income distributions.
Expenses. Expenses of the Trust arising in connection with a specific fund are allocated to that fund. Other Trust expenses which cannot be directly attributed to a fund are apportioned among the funds in the Trust based upon the relative net assets or other appropriate measures.
Contingencies. In the normal course of business, the Fund may enter into contracts with service providers that contain general indemnification clauses. The Fund's maximum exposure under these arrangements is unknown as this would involve future claims that may be made against the Fund that have not yet been made. However, based on experience, the Fund expects the risk of loss to be remote.
Other. Investment transactions are accounted for on a trade date plus one basis for daily net asset value calculations. However, for financial reporting purposes, investment transactions are reported on trade date. Interest income is recorded on the accrual basis. Distributions of income and capital gains from the Underlying Funds are recorded on the ex-dividend date. Realized gains and losses from investment transactions are recorded on an identified cost basis.
B. Derivative Instruments
Futures Contracts. A futures contract is an agreement between a buyer or seller and an established futures exchange or its clearing house in which the buyer or seller agrees to take or make a delivery of a specific amount of a financial instrument at a specified price on a specific date (settlement date). The Fund seeks to enhance returns by employing a global tactical asset allocation overlay strategy by entering into futures contracts on global equity and bonds, including on financial indices and security indices. For the year ended March 31, 2013, as part of this strategy, the Fund used futures contracts to attempt to take advantage of inefficiencies within the global bond markets.
Upon entering into a futures contract, the Fund is required to deposit with a financial intermediary cash or securities ("initial margin") in an amount equal to a certain percentage of the face value indicated in the futures contract. Subsequent payments ("variation margin") are made or received by the Fund dependent upon the daily fluctuations in the value and are recorded for financial reporting purposes as unrealized gains or losses by the Fund. Gains or losses are realized when the contract expires or is closed. Since all futures contracts are exchange traded, counterparty risk is minimized as the exchange's clearinghouse acts as the counterparty, and guarantees the futures against default.
Certain risks may arise upon entering into futures contracts, including the risk that an illiquid market will limit the Fund's ability to close out a futures contract prior to the settlement date and the risk that the futures contract is not well correlated with the security, index or currency to which it relates. Risk of loss may exceed amounts disclosed in the Statement of Assets and Liabilities.
A summary of the open futures contracts as of March 31, 2013, is included in a table following the Fund's Investment Portfolio. For the year ended March 31, 2013, the investment in futures contracts purchased had a total notional value generally indicative of a range from approximately $102,021,000 to $302,124,000, and the investment in futures contracts sold had a total notional value generally indicative of a range from approximately $72,068,000 to $287,498,000.
Forward Foreign Currency Exchange Contracts. A forward foreign currency exchange contract ("forward currency contract") is a commitment to purchase or sell a foreign currency at the settlement date at a negotiated rate. The Fund seeks to enhance returns by employing a global tactical asset allocation overlay strategy. For the year ended March 31, 2013, as part of this strategy, the Fund used forward currency contracts to gain exposure to changes in the value of foreign currencies to attempt to take advantage of inefficiencies within the currency markets.
Forward currency contracts are valued at the prevailing forward exchange rate of the underlying currencies and unrealized gain (loss) is recorded daily. On the settlement date of the forward currency contract, the Fund records a realized gain or loss equal to the difference between the value of the contract at the time it was opened and the value of the contract at the time it was closed. Certain risks may arise upon entering into forward currency contracts from the potential inability of counterparties to meet the terms of their contracts. The maximum counterparty credit risk to the Fund is measured by the unrealized gain on appreciated contracts.
A summary of the open forward currency contracts as of March 31, 2013, is included in a table following the Fund's Investment Portfolio. For the year ended March 31, 2013, the investment in forward currency contracts U.S. dollars purchased had a total contract value generally indicative of a range from approximately $18,077,000 to $120,236,000, and the investment in forward currency contracts U.S. dollars sold had a total contract value generally indicative of a range from approximately $19,890,000 to $121,327,000.
The following tables summarize the value of the Fund's derivative instruments held as of March 31, 2013 and the related location in the accompanying Statement of Assets and Liabilities, presented by primary underlying risk exposure:
| Asset Derivatives | Forward Contracts | Futures Contracts | Total | |||||||||
| Foreign Exchange Contracts (a) | $ | 608,245 | $ | — | $ | 608,245 | ||||||
| Interest Rate Contracts (b) | — | 1,486,972 | 1,486,972 | |||||||||
| $ | 608,245 | $ | 1,486,972 | $ | 2,095,217 | |||||||
Each of the above derivatives is located in the following Statement of Assets and Liabilities accounts:
(a) Unrealized appreciation on forward foreign currency exchange contracts
(b) Includes cumulative appreciation of futures contracts as disclosed in the Investment Portfolio. Unsettled variation margin is disclosed separately within the Statement of Assets and Liabilities.
| Liability Derivatives | Forward Contracts | Futures Contracts | Total | |||||||||
| Foreign Exchange Contracts (a) | $ | (497,000 | ) | $ | — | $ | (497,000 | ) | ||||
| Interest Rate Contracts (b) | — | (916,694 | ) | (916,694 | ) | |||||||
| $ | (497,000 | ) | $ | (916,694 | ) | $ | (1,413,694 | ) | ||||
Each of the above derivatives is located in the following Statement of Assets and Liabilities accounts:
(a) Unrealized depreciation on forward foreign currency exchange contracts
(b) Includes cumulative depreciation of futures contracts as disclosed in the Investment Portfolio. Unsettled variation margin is disclosed separately within the Statement of Assets and Liabilities.
Additionally, the amount of unrealized and realized gains and losses on derivative instruments recognized in Fund earnings during the year ended March 31, 2013 and the related location in the accompanying Statement of Operations is summarized in the following tables by primary underlying risk exposure:
| Realized Gain (Loss) | Forward Contracts | Futures Contracts | Total | |||||||||
| Foreign Exchange Contracts (a) | $ | (805,991 | ) | $ | — | $ | (805,991 | ) | ||||
| Interest Rate Contracts (b) | — | 1,098,443 | 1,098,443 | |||||||||
| $ | (805,991 | ) | $ | 1,098,443 | $ | 292,452 | ||||||
Each of the above derivatives is located in the following Statement of Operations accounts:
(a) Net realized gain (loss) from foreign currency (Statement of Operations includes both forward currency contracts and foreign currency transactions)
(b) Net realized gain (loss) from futures
| Change in Net Unrealized Appreciation (Depreciation) | Forward Contracts | Futures Contracts | Total | |||||||||
| Foreign Exchange Contracts (a) | $ | 430,070 | $ | — | $ | 430,070 | ||||||
| Interest Rate Contracts (b) | — | 546,505 | 546,505 | |||||||||
| $ | 430,070 | $ | 546,505 | $ | 976,575 | |||||||
Each of the above derivatives is located in the following Statement of Operations accounts:
(a) Change in net unrealized appreciation (depreciation) on foreign currency (Statement of Operations includes both forward currency contracts and foreign currency transactions)
(b) Change in net unrealized appreciation (depreciation) on futures
C. Purchases and Sales of Underlying Funds
During the year ended March 31, 2013, purchases and sales of affiliated Underlying Funds (excluding short-term investments and money market funds) aggregated $110,192,325 and $178,685,380, respectively. Purchases and sales of non-affiliated Underlying Funds (excluding short-term investments and money market funds) aggregated $92,104,366 and $45,855,790, respectively.
D. Related Parties
Management Agreement. Under the Investment Management Agreement with Deutsche Investment Management Americas Inc. ("DIMA" or the "Advisor"), an indirect, wholly owned subsidiary of Deutsche Bank AG, the Advisor directs the investments of the Fund in accordance with its investment objectives, policies and restrictions. The Advisor determines the securities, instruments and other contracts relating to investments in Underlying Funds to be purchased, sold or entered into by the Fund or delegates such responsibility to the Fund's subadvisor. However, the Advisor will receive management fees from managing the Underlying DWS Funds in which the Fund invests.
QS Investors, LLC ("QS Investors") acts as investment subadvisor to the Fund. As an investment subadvisor to the Fund, QS Investors renders strategic asset allocation services and manages the portion of assets allocated to the Fund's global tactical asset allocation overlay strategy. QS Investors is paid by the Advisor for the services QS Investors provides to the Fund. Effective on or about May 31, 2013, QS Investors will no longer serve as subadvisor to the Fund and day-to-day portfolio management of the Fund will transition to DIMA.
The Fund does not invest in the Underlying DWS Funds for the purpose of exercising management or control; however, investments within the set limits may represent 5% or more of an Underlying DWS Fund's outstanding shares. At March 31, 2013, the Fund held greater than 5% of the following Underlying DWS Funds' outstanding shares: approximately 27% of DWS Global Inflation Fund, 26% of DWS Disciplined Market Neutral Fund, 23% of DWS Enhanced Emerging Markets Fixed Income Fund, 10% of DWS Enhanced Commodity Strategy Fund, 6% of DWS RREEF Global Real Estate Securities Fund and 5% of DWS RREEF Global Infrastructure Fund.
The management fee payable under the Investment Management Agreement is equivalent to the annual rate of 0.20% of the Fund's average daily net assets, computed and accrued daily and payable monthly. In addition, the Advisor will receive management fees from managing the Underlying DWS Funds in which the Fund invests.
For the period from April 1, 2012 through July 31, 2012, the Advisor had contractually agreed to waive its fees and/or reimburse certain operating expenses of the Fund to the extent necessary to maintain the operating expenses (excluding certain expenses such as extraordinary expenses, taxes, brokerage, interest and indirect expenses of Underlying Funds) of each class as follows:
| Class A | .46% |
| Class C | 1.21% |
| Class R | .71% |
| Class S | .21% |
| Institutional Class | .21% |
For the period from August 1, 2012 through September 30, 2012, the Advisor had contractually agreed to waive its fees and/or reimburse certain operating expenses of the Fund to the extent necessary to maintain the operating expenses (excluding certain expenses such as extraordinary expenses, taxes, brokerage, interest and indirect expenses of Underlying Funds) of each class as follows:
| Class A | .50% |
| Class C | 1.25% |
| Class R | .75% |
| Class S | .31% |
| Institutional Class | .25% |
Effective October 1, 2012 through September 30, 2013, the Advisor has contractually agreed to waive its fees and/or reimburse certain operating expenses of the Fund to the extent necessary to maintain the operating expenses (excluding certain expenses such as extraordinary expenses, taxes, brokerage, interest and indirect expenses of Underlying Funds) of each class as follows:
| Class A | .57% |
| Class C | 1.32% |
| Class R | .77% |
| Class S | .42% |
| Institutional Class | .27% |
In addition, effective October 1, 2012, the Advisor has voluntarily agreed to waive its fees and/or reimburse certain operating expenses of Institutional Class shares to the extent necessary to maintain the operating expenses (excluding certain expenses such as extraordinary expenses, taxes, brokerage, interest and indirect expenses of Underlying Funds) at 0.21%. This voluntary waiver or reimbursement may be terminated at any time at the option of the Advisor.
Accordingly, for the year ended March 31, 2013, the Advisor waived a portion of its management fee pursuant to the Investment Management Agreement aggregating $955,626, and the amount charged aggregated $422,739, which was equivalent to an annual effective rate of 0.06% of the Fund's average daily net assets.
The Fund indirectly bears its proportionate share of fees and expenses incurred by the Underlying Funds in which it is invested.
Administration Fee. Pursuant to an Administrative Services Agreement, DIMA provides most administrative services to the Fund. For all services provided under the Administrative Services Agreement, the Fund pays the Advisor an annual fee ("Administration Fee") of 0.10% of the Fund's average daily net assets, computed and accrued daily and payable monthly. For the year ended March 31, 2013, the Administration Fee was $689,183, of which $59,034 is unpaid.
Service Provider Fees. DWS Investments Service Company ("DISC"), an affiliate of the Advisor, is the transfer agent, dividend-paying agent and shareholder service agent of the Fund. Pursuant to a sub-transfer agency agreement between DISC and DST Systems, Inc. ("DST"), DISC has delegated certain transfer agent, dividend-paying agent and shareholder service agent functions to DST. DISC compensates DST out of the shareholder serving fee it receives from the Fund. For the year ended March 31, 2013, the amounts charged to the Fund by DISC were as follows:
| Services to Shareholders | Total Aggregated | Waived | ||||||
| Class A | $ | 67,193 | $ | 67,193 | ||||
| Class C | 41,733 | 41,733 | ||||||
| Class R | 595 | 595 | ||||||
| Class S | 57,836 | 57,836 | ||||||
| Institutional Class | 2,744 | 2,744 | ||||||
| $ | 170,101 | $ | 170,101 | |||||
In addition, for the year ended March 31, 2013, the Advisor reimbursed $177,130 and $34,114 of non-affiliated sub-recordkeeping fees for Class S and Institutional Class shares, respectively.
Distribution and Service Fees. Under the Fund's Class C and Class R 12b-1 Plans, DWS Investments Distributors, Inc., ("DIDI"), an affiliate of the Advisor, receives a fee ("Distribution Fee") of 0.75% of average daily net assets of C shares and 0.25% of average daily net assets of Class R shares. In accordance with the Fund's Underwriting and Distribution Services Agreement, DIDI enters into related selling group agreements with various firms at various rates for sales of Class C and R shares. For the year ended March 31, 2013, the Distribution Fee was as follows:
| Distribution Fee | Total Aggregated | Unpaid at March 31, 2013 | ||||||
| Class C | $ | 1,181,258 | $ | 99,014 | ||||
| Class R | 2,722 | 449 | ||||||
| $ | 1,183,980 | $ | 99,463 | |||||
In addition, DIDI provides information and administrative services for a fee ("Service Fee") to Class A, Class C and Class R shareholders at an annual rate of up to 0.25% of average daily net assets for each such class. DIDI in turn has various agreements with financial services firms that provide these services and pays these fees based upon the assets of shareholder accounts the firms service. For the year ended March 31, 2013, the Service Fee was as follows:
| Service Fee | Total Aggregated | Waived | Unpaid at March 31, 2013 | Annual Effective Rate | ||||||||||||
| Class A | $ | 600,530 | $ | 135,898 | $ | 181,612 | .19 | % | ||||||||
| Class C | 392,811 | 75,926 | 115,842 | .20 | % | |||||||||||
| Class R | 2,717 | 1,241 | 245 | .14 | % | |||||||||||
| $ | 996,058 | $ | 213,065 | $ | 297,699 | |||||||||||
Underwriting Agreement and Contingent Deferred Sales Charge. DIDI is the principal underwriter for the Fund. Underwriting commissions paid by shareholders in connection with the distribution of Class A shares for the year ended March 31, 2013, aggregated $33,051.
In addition, DIDI receives any contingent deferred sales charge ("CDSC") from Class C share redemptions occurring within one year of purchase. There is no such charge upon redemption of any share appreciation or reinvested dividends. The CDSC is 1% of the value of the shares redeemed for Class C. For the year ended March 31, 2013, the CDSC for the Fund's Class C shares aggregated $8,771. A deferred sales charge of up to 0.75% is assessed on certain redemptions of Class A shares. For the year ended March 31, 2013, DIDI received $2,384 for Class A shares.
Typesetting and Filing Service Fees. Under an agreement with DIMA, DIMA is compensated for providing typesetting and certain regulatory filing services to the Fund. For the year ended March 31, 2013, the amount charged to the Fund by DIMA included in the Statement of Operations under "reports to shareholders" aggregated $22,217, of which $6,384 is unpaid.
Trustees' Fees and Expenses. The Fund paid retainer fees to each Trustee not affiliated with the Advisor, plus specified amounts to the Board Chairperson and Vice Chairperson and to each committee Chairperson and Vice Chairperson.
Affiliated Cash Management Vehicle. The Fund may invest uninvested cash balances in Central Cash Management Fund, which is managed by the Advisor. The Fund indirectly bears its proportionate share of the expenses of Central Cash Management Fund. Central Cash Management Fund does not pay the Advisor an investment management fee. Central Cash Management Fund seeks a high level of current income consistent with liquidity and the preservation of capital.
E. Share Transactions
The following table summarizes share and dollar activity in the Fund:
| Year Ended March 31, 2013 | Year Ended March 31, 2012 | |||||||||||||||
| Shares | Dollars | Shares | Dollars | |||||||||||||
| Shares sold | ||||||||||||||||
| Class A | 6,278,864 | $ | 58,612,234 | 7,691,470 | $ | 71,585,969 | ||||||||||
| Class C | 1,962,311 | 18,199,137 | 3,026,332 | 28,036,965 | ||||||||||||
| Class R | 292,042 | 2,739,317 | 142 | * | 1,349 | * | ||||||||||
| Class S | 11,471,152 | 106,278,832 | 9,253,126 | 85,382,329 | ||||||||||||
| Institutional Class | 2,860,670 | 26,700,865 | 1,784,562 | 16,536,925 | ||||||||||||
| $ | 212,530,385 | $ | 201,543,537 | |||||||||||||
| Shares issued to shareholders in reinvestment of distributions | ||||||||||||||||
| Class A | 496,196 | $ | 4,630,961 | 1,101,292 | $ | 9,830,430 | ||||||||||
| Class C | 205,328 | 1,911,606 | 460,699 | 4,100,605 | ||||||||||||
| Class R | 3,986 | 37,387 | 4 | * | 35 | * | ||||||||||
| Class S | 502,155 | 4,648,581 | 889,057 | 7,877,075 | ||||||||||||
| Institutional Class | 113,496 | 1,050,795 | 173,526 | 1,535,308 | ||||||||||||
| $ | 12,279,330 | $ | 23,343,453 | |||||||||||||
| Shares redeemed | ||||||||||||||||
| Class A | (10,409,271 | ) | $ | (96,830,395 | ) | (10,413,142 | ) | $ | (95,858,777 | ) | ||||||
| Class C | (3,603,148 | ) | (33,380,502 | ) | (3,981,766 | ) | (36,392,557 | ) | ||||||||
| Class R | (76,048 | ) | (715,912 | ) | — | — | ||||||||||
| Class S | (9,939,184 | ) | (91,835,588 | ) | (10,798,432 | ) | (98,461,252 | ) | ||||||||
| Institutional Class | (2,990,834 | ) | (27,728,242 | ) | (1,524,478 | ) | (13,855,428 | ) | ||||||||
| $ | (250,490,639 | ) | $ | (244,568,014 | ) | |||||||||||
| Net increase (decrease) | ||||||||||||||||
| Class A | (3,634,211 | ) | $ | (33,587,200 | ) | (1,620,380 | ) | $ | (14,442,378 | ) | ||||||
| Class C | (1,435,509 | ) | (13,269,759 | ) | (494,735 | ) | (4,254,987 | ) | ||||||||
| Class R | 219,980 | 2,060,792 | 146 | * | 1,384 | * | ||||||||||
| Class S | 2,034,123 | 19,091,825 | (656,249 | ) | (5,201,848 | ) | ||||||||||
| Institutional Class | (16,668 | ) | 23,418 | 433,610 | 4,216,805 | |||||||||||
| $ | (25,680,924 | ) | $ | (19,681,024 | ) | |||||||||||
* For the period from June 1, 2011 (commencement of operations of Class R shares) through March 31, 2012.
F. Transactions with Affiliates
The Fund mainly invests in Underlying DWS Funds and Non-affiliated ETFs. The Underlying DWS Funds in which the Fund invests are considered to be affiliated investments. A summary of the Fund's transactions with affiliated Underlying DWS Funds during the year ended March 31, 2013 is as follows:
| Affiliate | Value ($) at 3/31/2012 | Purchases Cost ($) | Sales Cost ($) | Realized Gain/ (Loss) ($) | Income Distributions ($) | Capital Gain Distributions ($) | Value ($) at 3/31/2013 | |||||||||||||||||||||
| DWS Disciplined Market Neutral Fund | 115,094,278 | 11,845,000 | 27,410,000 | (174,096 | ) | — | — | 101,110,257 | ||||||||||||||||||||
| DWS Emerging Markets Equity Fund | 41,064,834 | 1,257,839 | 40,441,365 | (3,727,353 | ) | 122,840 | — | — | ||||||||||||||||||||
| DWS Enhanced Commodity Strategy Fund | 103,038,072 | 19,526,252 | 23,895,000 | (8,664,245 | ) | 2,031,252 | — | 91,825,945 | ||||||||||||||||||||
| DWS Enhanced Emerging Markets Fixed Income Fund | 54,330,797 | 8,560,901 | 7,070,000 | (288,803 | ) | 2,150,901 | — | 59,377,585 | ||||||||||||||||||||
| DWS Floating Rate Fund | 74,705,634 | 14,802,586 | 12,740,000 | (162,113 | ) | 3,937,586 | — | 78,530,195 | ||||||||||||||||||||
| DWS Global Inflation Fund | 66,032,917 | 15,321,756 | 13,025,000 | (233,875 | ) | 749,633 | 1,187,123 | 69,731,650 | ||||||||||||||||||||
| DWS Gold & Precious Metals Fund | — | 7,852,361 | 6,424,015 | (1,428,346 | ) | 72,361 | — | — | ||||||||||||||||||||
| DWS RREEF Global Infrastructure Fund | 68,295,039 | 17,207,401 | 14,555,000 | 493,328 | 1,503,802 | 648,599 | 82,397,232 | |||||||||||||||||||||
| DWS RREEF Global Real Estate Securities Fund | 75,320,917 | 6,895,544 | 33,125,000 | 1,935,526 | 3,950,544 | — | 57,598,217 | |||||||||||||||||||||
| PowerShares DB G10 Currency Harvest Fund | — | 6,922,685 | — | — | — | — | 7,063,091 | |||||||||||||||||||||
| Central Cash Management Fund | 8,528,512 | 214,538,617 | 213,591,378 | — | 13,573 | — | 9,475,751 | |||||||||||||||||||||
| Total | 606,411,000 | 324,730,942 | 392,276,758 | (12,249,977 | ) | 14,532,492 | 1,835,722 | 557,109,923 | ||||||||||||||||||||
To the Board of Trustees of DWS Market Trust and the Shareholders of DWS Alternative Asset Allocation Fund:
We have audited the accompanying statement of assets and liabilities of DWS Alternative Asset Allocation Fund (the "Fund"), a series of DWS Market Trust (the "Trust"), including the investment portfolio, as of March 31, 2013, and the related statement of operations for the year then ended, the statement of changes in net assets for each of the two years in the period then ended, and the financial highlights for each of the periods indicated therein. These financial statements and financial highlights are the responsibility of the Fund's management. Our responsibility is to express an opinion on these financial statements and financial highlights based on our audits.
We conducted our audits in accordance with the standards of the Public Company Accounting Oversight Board (United States). Those standards require that we plan and perform the audit to obtain reasonable assurance about whether the financial statements and financial highlights are free of material misstatement. We were not engaged to perform an audit of the Fund's internal control over financial reporting. Our audit included consideration of internal control over financial reporting as a basis for designing audit procedures that are appropriate in the circumstances, but not for the purpose of expressing an opinion on the effectiveness of the Fund's internal control over financial reporting. Accordingly, we express no such opinion. An audit also includes examining, on a test basis, evidence supporting the amounts and disclosures in the financial statements and financial highlights, assessing the accounting principles used and significant estimates made by management, and evaluating the overall financial statement presentation. Our procedures included confirmation of securities owned as of March 31, 2013, by correspondence with the custodian and brokers or by other appropriate auditing procedures where replies from brokers were not received. We believe that our audits provide a reasonable basis for our opinion.
In our opinion, the financial statements and financial highlights referred to above present fairly, in all material respects, the financial position of DWS Alternative Asset Allocation Fund at March 31, 2013, the results of its operations for the year then ended, the changes in its net assets for each of the two years in the period then ended, and the financial highlights for each of the periods indicated therein, in conformity with U.S. generally accepted accounting principles.
 | ||
Boston, Massachusetts May 21, 2013 |
As an investor of the Fund, you incur two types of costs: ongoing expenses and transaction costs. Ongoing expenses include management fees, distribution and service (12b-1) fees and other Fund expenses. Examples of transaction costs include sales charges (loads) and account maintenance fees, which are not shown in this section. The following table is intended to help you understand your ongoing expenses (in dollars) of investing in the Fund and to help you compare these expenses with the ongoing expenses of investing in other mutual funds. In addition to the ongoing expenses which the Fund bears directly, the Fund's shareholders indirectly bear the expense of the Underlying Funds in which the Fund invests. These expenses are not included in the Fund's annualized expense ratios used to calculate the expense estimate in the table. In the most recent six-month period, the Fund limited the ongoing expenses the Fund bears directly; had it not done so, expenses would have been higher. The examples in the table are based on an investment of $1,000 invested at the beginning of the six-month period and held for the entire period (October 1, 2012 to March 31, 2013).
The tables illustrate your Fund's expenses in two ways:
•Actual Fund Return. This helps you estimate the actual dollar amount of ongoing expenses (but not transaction costs) paid on a $1,000 investment in the Fund using the Fund's actual return during the period. To estimate the expenses you paid over the period, simply divide your account value by $1,000 (for example, an $8,600 account value divided by $1,000 = 8.6), then multiply the result by the number in the "Expenses Paid per $1,000" line under the share class you hold.
•Hypothetical 5% Fund Return. This helps you to compare your Fund's ongoing expenses (but not transaction costs) with those of other mutual funds using the Fund's actual expense ratio and a hypothetical rate of return of 5% per year before expenses. Examples using a 5% hypothetical fund return may be found in the shareholder reports of other mutual funds. The hypothetical account values and expenses may not be used to estimate the actual ending account balance or expenses you paid for the period.
Please note that the expenses shown in these tables are meant to highlight your ongoing expenses only and do not reflect any transaction costs. The "Expenses Paid per $1,000" line of the tables is useful in comparing ongoing expenses only and will not help you determine the relative total expense of owning different funds. Subject to certain exceptions, an account maintenance fee of $20.00 assessed once per calendar year for Classes A, C and S shares may apply for accounts with balances less than $10,000. This fee is not included in these tables. If it was, the estimate of expenses paid for Classes A, C and S shares during the period would be higher, and account value during the period would be lower, by this amount.
Expenses and Value of a $1,000 Investment for the six months ended March 31, 2013 (Unaudited) | ||||||||||||||||||||
| Actual Fund Return | Class A | Class C | Class R | Class S | Institutional Class | |||||||||||||||
| Beginning Account Value 10/1/12 | $ | 1,000.00 | $ | 1,000.00 | $ | 1,000.00 | $ | 1,000.00 | $ | 1,000.00 | ||||||||||
| Ending Account Value 3/31/13 | $ | 1,024.40 | $ | 1,020.80 | $ | 1,024.60 | $ | 1,025.20 | $ | 1,026.40 | ||||||||||
| Expenses Paid per $1,000* | $ | 2.88 | $ | 6.65 | $ | 3.94 | $ | 2.12 | $ | 1.11 | ||||||||||
| Hypothetical 5% Fund Return | Class A | Class C | Class R | Class S | Institutional Class | |||||||||||||||
| Beginning Account Value 10/1/12 | $ | 1,000.00 | $ | 1,000.00 | $ | 1,000.00 | $ | 1,000.00 | $ | 1,000.00 | ||||||||||
| Ending Account Value 3/31/13 | $ | 1,022.09 | $ | 1,018.35 | $ | 1,021.04 | $ | 1,022.84 | $ | 1,023.83 | ||||||||||
| Expenses Paid per $1,000* | $ | 2.87 | $ | 6.64 | $ | 3.93 | $ | 2.12 | $ | 1.11 | ||||||||||
* Expenses are equal to the Fund's annualized expense ratio for each share class, multiplied by the average account value over the period, multiplied by 182 (the number of days in the most recent six-month period), then divided by 365.
Annualized Expense Ratios** | Class A | Class C | Class R | Class S | Institutional Class |
| DWS Alternative Asset Allocation Fund | .57% | 1.32% | .78% | .42% | .22% |
** The Fund invests in other funds and indirectly bears its proportionate share of fees and expenses incurred by the Underlying Funds in which the Fund is invested. These ratios do not include these indirect fees and expenses.
For more information, please refer to the Fund's prospectus.
For an analysis of the fees associated with an investment in the Fund or similar funds, please refer to http://apps.finra.org/fundanalyzer/1/fa.aspx.
For corporate shareholders, 100% of the income dividends paid during the Fund's fiscal year ended March 31, 2013, qualified for the dividends received deduction.
For federal income tax purposes, the Fund designates $20,717,000, or the maximum amount allowable under tax law, as qualified dividend income.
Please consult a tax advisor if you have questions about federal or state income tax laws, or on how to prepare your tax returns. If you have specific questions about your account, please call (800) 728-3337.
September 17, 2012
Pursuant to an Order entered into by Deutsche Investment Management Americas and affiliates (collectively, "DeAM") with the Attorney General of New York, I, Thomas H. Mack, have been appointed the Independent Fee Consultant for the DWS Funds (formerly the DWS Scudder Funds). My duties include preparing an annual written evaluation of the management fees DeAM charges the Funds, considering among other factors the management fees charged by other mutual fund companies for like services, management fees DeAM charges other clients for like services, DeAM's costs of supplying services under the management agreements and related profit margins, possible economies of scale if a Fund grows larger, and the nature and quality of DeAM's services, including fund performance. This report summarizes my evaluation for 2012, including my qualifications, the evaluation process for each of the DWS Funds, consideration of certain complex-level factors, and my conclusions. I served in substantially the same capacity in 2007, 2008, 2009, 2010 and 2011.
Qualifications
For more than 35 years I have served in various professional capacities within the investment management business. I have held investment analysis and advisory positions, including securities analyst, portfolio strategist and director of investment policy with a large investment firm. I have also performed business management functions, including business development, financial management and marketing research and analysis.
Since 1991, I have been an independent consultant within the asset management industry. I have provided services to over 125 client organizations, including investment managers, mutual fund boards, product distributors and related organizations. Over the past ten years I have completed a number of assignments for mutual fund boards, specifically including assisting boards with management contract renewal.
I hold a Master of Business Administration degree, with highest honors, from Harvard University and Master of Science and Bachelor of Science (highest honors) degrees from the University of California at Berkeley. I am an independent director and audit committee financial expert for two closed-end mutual funds and have served in various leadership and financial oversight capacities with non-profit organizations.
Evaluation of Fees for each DWS Fund
My work focused primarily on evaluating, fund-by-fund, the fees charged to each of the 103 mutual fund portfolios in the DWS Fund family. For each Fund, I considered each of the key factors mentioned above, as well as any other relevant information. In doing so I worked closely with the Funds' Independent Directors in their annual contract renewal process, as well as in their approval of contracts for several new funds (documented separately).
In evaluating each Fund's fees, I reviewed comprehensive materials provided by or on behalf of DeAM, including expense information prepared by Lipper Analytical, comparative performance information, profitability data, manager histories, and other materials. I also accessed certain additional information from the Lipper and Morningstar databases and drew on my industry knowledge and experience.
To facilitate evaluating this considerable body of information, I prepared for each Fund a document summarizing the key data elements in each area as well as additional analytics discussed below. This made it possible to consider each key data element in the context of the others.
In the course of contract renewal, DeAM agreed to implement a number of fee and expense adjustments requested by the Independent Directors which will favorably impact future fees and expenses, and my evaluation includes the effects of these changes.
Fees and Expenses Compared with Other Funds
The competitive fee and expense evaluation for each fund focused on two primary comparisons:
The Fund's contractual management fee (the advisory fee plus the administration fee where applicable) compared with those of a group of typically 12-15 funds in the same Lipper investment category (e.g. Large Capitalization Growth) having similar distribution arrangements and being of similar size.
The Fund's total expenses compared with a broader universe of funds from the same Lipper investment category and having similar distribution arrangements.
These two comparisons provide a view of not only the level of the fee compared with funds of similar scale but also the total expense the Fund bears for all the services it receives, in comparison with the investment choices available in the Fund's investment category and distribution channel. The principal figure-of-merit used in these comparisons was the subject Fund's percentile ranking against peers.
DeAM's Fees for Similar Services to Others
DeAM provided management fee schedules for all of its US domiciled fund and non-fund investment management accounts in any of the investment categories where there is a DWS Fund. These similar products included the other DWS Funds, non-fund pooled accounts, institutional accounts and sub-advisory accounts. Using this information, I calculated for each Fund the fee that would be charged to each similar product, at the subject Fund's asset level.
Evaluating information regarding non-fund products is difficult because there are varying levels of services required for different types of accounts, with mutual funds generally requiring considerably more regulatory and administrative types of service as well as having more frequent cash flows than other types of accounts. Also, while mutual fund fees for similar fund products can be expected to be similar, there will be some differences due to different pricing conditions in different distribution channels (e.g. retail funds versus those used in variable insurance products), differences in underlying investment processes and other factors.
Costs and Profit Margins
DeAM provided a detailed profitability analysis for each Fund. After making some adjustments so that the presentation would be more comparable to the available industry figures, I reviewed profit margins from investment management alone, from investment management plus other fund services (excluding distribution) provided to the Funds by DeAM (principally shareholder services), and DeAM profits from all sources, including distribution. A later section comments on overall profitability.
Economies of Scale
Economies of scale — an expected decline in management cost per dollar of fund assets as fund assets grow — are very rarely quantified and documented because of inherent difficulties in collecting and analyzing relevant data. However, in virtually every investment category that I reviewed, larger funds tend to have lower fees and lower total expenses than smaller funds. To see how each DWS Fund compares with this industry observation, I reviewed:
The trend in Fund assets over the last five years and the accompanying trend in total expenses. This shows if the Fund has grown and, if so, whether total expense (management fees as well as other expenses) have declined as a percent of assets.
Whether the Fund has break-points in its management fee schedule, the extent of the fee reduction built into the schedule and the asset levels where the breaks take effect, and in the case of a sub-advised Fund how the Fund's break-points compare with those of the sub-advisory fee schedule.
How the Fund's contractual fee schedule compares with trends in the industry data. To accomplish this, I constructed a chart showing how actual latest-fiscal-year contractual fees of the Fund and of other similar funds relate to average fund assets, with the subject Fund's contractual fee schedule superimposed.
Quality of Service — Performance
The quality-of-service evaluation focused on investment performance, which is the principal result of the investment management service. Each Fund's performance was reviewed over the past 1, 3, 5 and 10 years, as applicable, and compared with that of other funds in the same investment category and with a suitable market index.
In addition, I calculated and reviewed risk-adjusted returns relative to an index of similar mutual funds' returns and a suitable market index. The risk-adjusted returns analysis provides a way of determining the extent to which the Fund's return comparisons are mainly the product of investment value-added (or lack thereof) or alternatively taking considerably more or less risk than is typical in its investment category.
I also received and considered the history of portfolio manager changes for each Fund, as this provided an important context for evaluating the performance results.
Complex-Level Considerations
While this evaluation was conducted mainly at the individual fund level, there are some issues relating to the reasonableness of fees that can alternatively be considered across the whole fund complex:
I reviewed DeAM's profitability analysis for all DWS Funds, with a view toward determining if the allocation procedures used were reasonable and how profit levels compared with public data for other investment managers.
I considered whether DeAM and affiliates receive any significant ancillary or "fallout" benefits that should be considered in interpreting the direct profitability results. These would be situations where serving as the investment manager of the Funds is beneficial to another part of the Deutsche Bank organization.
I considered how aggregated DWS Fund expenses had varied over the years, by asset class and in the context of trends in asset levels.
I considered how aggregated DWS Fund performance measures relative to appropriate peers had varied by asset class and over time.
I reviewed the structure of the DeAM organization, trends in staffing levels, and information on compensation of investment management and other professionals compared with industry data.
Findings
Based on the process and analysis discussed above, which included reviewing a wide range of information from management and external data sources and considering among other factors the fees DeAM charges other clients, the fees charged by other fund managers, DeAM's costs and profits associated with managing the Funds, economies of scale, possible fall-out benefits, and the nature and quality of services provided, in my opinion the management fees charged the DWS Funds are reasonable.

Thomas H. Mack
President, Thomas H. Mack & Co., Inc.
The following table presents certain information regarding the Board Members and Officers of the fund. Each Board Member's year of birth is set forth in parentheses after his or her name. Unless otherwise noted, (i) each Board Member has engaged in the principal occupation(s) noted in the table for at least the most recent five years, although not necessarily in the same capacity; and (ii) the address of each Independent Board Member is c/o Kenneth C. Froewiss, Chairman, DWS Mutual Funds, P.O. Box 78, Short Hills, NJ 07078. Except as otherwise noted below, the term of office for each Board Member is until the election and qualification of a successor, or until such Board Member sooner dies, resigns, is removed or as otherwise provided in the governing documents of the fund. Because the fund does not hold an annual meeting of shareholders, each Board Member will hold office for an indeterminate period. The Board Members may also serve in similar capacities with other funds in the fund complex.
| Independent Board Members | ||||
Name, Year of Birth, Position with the Fund and Length of Time Served1 | Business Experience and Directorships During the Past Five Years | Number of Funds in DWS Fund Complex Overseen | Other Directorships Held by Board Member | |
Kenneth C. Froewiss (1945) Chairperson since 2013,9 and Board Member since 2001 | Adjunct Professor of Finance, NYU Stern School of Business (September 2009-present; Clinical Professor from 1997-September 2009); Member, Finance Committee, Association for Asian Studies (2002-present); Director, Mitsui Sumitomo Insurance Group (US) (2004-present); prior thereto, Managing Director, J.P. Morgan (investment banking firm) (until 1996) | 102 | — | |
William McClayton (1944) Vice Chairperson since 2013,9 and Board Member since 2004 | Private equity investor (since October 2009); previously, Managing Director, Diamond Management & Technology Consultants, Inc. (global consulting firm) (2001-2009); Directorship: Board of Managers, YMCA of Metropolitan Chicago; formerly: Senior Partner, Arthur Andersen LLP (accounting) (1966-2001); Trustee, Ravinia Festival | 102 | — | |
John W. Ballantine (1946) Board Member since 1999 | Retired; formerly, Executive Vice President and Chief Risk Management Officer, First Chicago NBD Corporation/The First National Bank of Chicago (1996-1998); Executive Vice President and Head of International Banking (1995-1996); former Directorships: Stockwell Capital Investments PLC (private equity); First Oak Brook Bancshares, Inc. and Oak Brook Bank; Prisma Energy International | 102 | Chairman of the Board, Healthways, Inc.2 (provider of disease and care management services) (2003- present); Portland General Electric2 (utility company) (2003- present) | |
Henry P. Becton, Jr. (1943) Board Member since 1990 | Vice Chair and former President, WGBH Educational Foundation. Directorships: Public Radio International; Public Radio Exchange (PRX); The PBS Foundation; North Bennett Street School (Boston); former Directorships: Association of Public Television Stations; Boston Museum of Science; American Public Television; Concord Academy; New England Aquarium; Mass. Corporation for Educational Telecommunications; Committee for Economic Development; Public Broadcasting Service; Connecticut College | 102 | Lead Director, Becton Dickinson and Company2 (medical technology company); Lead Director, Belo Corporation2 (media company) | |
Dawn-Marie Driscoll (1946) Board Member since 1987 | President, Driscoll Associates (consulting firm); Emeritus Executive Fellow, Center for Business Ethics, Bentley University; formerly, Partner, Palmer & Dodge (1988-1990); Vice President of Corporate Affairs and General Counsel, Filene's (1978-1988). Directorships: Director of ICI Mutual Insurance Company (since 2007); Advisory Board, Center for Business Ethics, Bentley University; Chairman of the Board of Trustees, Southwest Florida Community Foundation (charitable organization); former Directorships: Sun Capital Advisers Trust (mutual funds) (2007-2012), Investment Company Institute (audit, executive, nominating committees) and Independent Directors Council (governance, executive committees) | 102 | — | |
Keith R. Fox, CFA (1954) Board Member since 1996 | Managing General Partner, Exeter Capital Partners (a series of private investment funds) (since 1986). Directorships: Progressive International Corporation (kitchen goods importer and distributor); The Kennel Shop (retailer); former Chairman, National Association of Small Business Investment Companies; former Directorships: BoxTop Media Inc. (advertising); Sun Capital Advisers Trust (mutual funds) (2011-2012) | 102 | — | |
Paul K. Freeman (1950) Board Member since 1993, and Chairperson (2009-Jan. 8, 2013) | Consultant, World Bank/Inter-American Development Bank; Executive and Governing Council of the Independent Directors Council (Chairman of Education Committee); formerly: Project Leader, International Institute for Applied Systems Analysis (1998-2001); Chief Executive Officer, The Eric Group, Inc. (environmental insurance) (1986-1998); Directorships: Denver Zoo Foundation (December 2012-present); former Directorships: Prisma Energy International | 102 | — | |
Richard J. Herring (1946) Board Member since 1990 | Jacob Safra Professor of International Banking and Professor, Finance Department, The Wharton School, University of Pennsylvania (since July 1972); Co-Director, Wharton Financial Institutions Center (since July 2000); Co-Chair, U.S. Shadow Financial Regulatory Committee; Executive Director, Financial Economists Roundtable; formerly: Vice Dean and Director, Wharton Undergraduate Division (July 1995-June 2000); Director, Lauder Institute of International Management Studies (July 2000-June 2006) | 102 | Director, Japan Equity Fund, Inc. (since September 2007), Thai Capital Fund, Inc. (since 2007), Singapore Fund, Inc. (since September 2007), Independent Director of Barclays Bank Delaware (since September 2010) | |
Rebecca W. Rimel (1951) Board Member since 1995 | President and Chief Executive Officer, The Pew Charitable Trusts (charitable organization) (1994 to present); formerly: Executive Vice President, The Glenmede Trust Company (investment trust and wealth management) (1983-2004); Board Member, Investor Education (charitable organization) (2004-2005); Trustee, Executive Committee, Philadelphia Chamber of Commerce (2001-2007); Director, Viasys Health Care2 (January 2007-June 2007); Trustee, Thomas Jefferson Foundation (charitable organization) (1994-2012) | 102 | Director, Becton Dickinson and Company2 (medical technology company) (2012- present); Director, CardioNet, Inc.2 (health care) (2009- present) | |
William N. Searcy, Jr. (1946) Board Member since 1993 | Private investor since October 2003; formerly: Pension & Savings Trust Officer, Sprint Corporation2 (telecommunications) (November 1989-September 2003); Trustee, Sun Capital Advisers Trust (mutual funds) (1998-2012) | 102 | — | |
Jean Gleason Stromberg (1943) Board Member since 1997 | Retired. Formerly, Consultant (1997-2001); Director, Financial Markets U.S. Government Accountability Office (1996-1997); Partner, Fulbright & Jaworski, L.L.P. (law firm) (1978-1996). Directorships: The William and Flora Hewlett Foundation; former Directorships: Service Source, Inc., Mutual Fund Directors Forum (2002-2004), American Bar Retirement Association (funding vehicle for retirement plans) (1987-1990 and 1994-1996) | 102 | — | |
Robert H. Wadsworth (1940) Board Member since 1999 | President, Robert H. Wadsworth & Associates, Inc. (consulting firm) (1983 to present); Director, National Horizon, Inc. (non-profit organization); Director and Treasurer, The Phoenix Boys Choir Association | 105 | — | |
Interested Board Member and Officer4 | ||||
Name, Year of Birth, Position with the Fund and Length of Time Served1,6 | Business Experience and Directorships During the Past Five Years | Number of Funds in DWS Fund Complex Overseen | Other Directorships Held by Board Member | |
Michael J. Woods5 (1967) Board Member since 2013,9 and Executive Vice President since 20139 | Managing Director,3 Deutsche Asset & Wealth Management (2009-present); Head of the Americas Asset Management Business for Deutsche Bank, Member of the Asset and Wealth Management ("AWM") Extended Executive Committee, AWM Global Client Group Executive Committee and the AWM Active Asset Management Executive Committee; CEO and US Regional Head of DWS Investments; formerly: Sr. VP, Head of the Financial Intermediaries and Investments Group of Evergreen Investments (2007-2009), CEO and Vice Chairman of Board of Directors of XTF Global Asset Management (2006-2007), Managing Director — US Head of Sub-Advisory and Investment Only Business at Citigroup Asset Management (2000-2006). Mr. Woods is currently a board member of The Children's Village, The Big Brothers Big Sisters Organization, and The Mutual Fund Education Alliance. | 38 | — | |
Officers4 | ||
Name, Year of Birth, Position with the Fund and Length of Time Served6 | Business Experience and Directorships During the Past Five Years | |
W. Douglas Beck, CFA7 (1967) President, 2011-present | Managing Director,3 Deutsche Asset & Wealth Management (2006-present); President of DWS family of funds and Head of Product Management, U.S. for DWS Investments; formerly: Executive Director, Head of Product Management (2002-2006) and President (2005-2006) of the UBS Funds at UBS Global Asset Management; Co-Head of Manager Research/Managed Solutions Group, Merrill Lynch (1998-2002) | |
John Millette8 (1962) Vice President and Secretary, 1999-present | Director,3 Deutsche Asset & Wealth Management | |
Paul H. Schubert7 (1963) Chief Financial Officer, 2004-present Treasurer, 2005-present | Managing Director,3 Deutsche Asset & Wealth Management (since July 2004); formerly: Executive Director, Head of Mutual Fund Services and Treasurer for UBS Family of Funds (1998-2004); Vice President and Director of Mutual Fund Finance at UBS Global Asset Management (1994-1998) | |
Caroline Pearson8 (1962) Chief Legal Officer, 2010-present | Managing Director,3 Deutsche Asset & Wealth Management; formerly: Assistant Secretary for DWS family of funds (1997-2010) | |
Melinda Morrow7 (1970) Vice President, 2012-present | Director,3 Deutsche Asset & Wealth Management | |
Hepsen Uzcan8 (1974) Assistant Secretary, since 20139 | Vice President, Deutsche Asset & Wealth Management | |
Paul Antosca8 (1957) Assistant Treasurer, 2007-present | Director,3 Deutsche Asset & Wealth Management | |
Jack Clark8 (1967) Assistant Treasurer, 2007-present | Director,3 Deutsche Asset & Wealth Management | |
Diane Kenneally8 (1966) Assistant Treasurer, 2007-present | Director,3 Deutsche Asset & Wealth Management | |
John Caruso7 (1965) Anti-Money Laundering Compliance Officer, 2010-present | Managing Director,3 Deutsche Asset & Wealth Management | |
Robert Kloby7 (1962) Chief Compliance Officer, 2006-present | Managing Director,3 Deutsche Asset & Wealth Management | |
1 The length of time served represents the year in which the Board Member joined the board of one or more DWS funds currently overseen by the Board.
2 A publicly held company with securities registered pursuant to Section 12 of the Securities Exchange Act of 1934.
3 Executive title, not a board directorship.
4 As a result of their respective positions held with the Advisor, these individuals are considered "interested persons" of the Advisor within the meaning of the 1940 Act. Interested persons receive no compensation from the fund.
5 The mailing address of Mr. Woods is 60 Wall Street, New York, New York 10005. Mr. Woods is an interested Board Member by virtue of his positions with Deutsche Asset & Wealth Management. As an interested person, Mr. Woods receives no compensation from the fund. Mr. Woods is a board member of the following trusts and corporations: Cash Account Trust, DWS Market Trust, DWS Money Funds, DWS State Tax-Free Income Series, DWS Target Fund, DWS Value Series, Inc., DWS Variable Series II, Investors Cash Trust, Tax-Exempt California Money Market Fund, DWS Global High Income Fund, Inc., DWS High Income Opportunities Fund, Inc., DWS High Income Trust, DWS Multi-Market Income Trust, DWS Municipal Income Trust, DWS Strategic Income Trust and DWS Strategic Municipal Income Trust.
6 The length of time served represents the year in which the officer was first elected in such capacity for one or more DWS funds.
7 Address: 60 Wall Street, New York, NY 10005.
8 Address: One Beacon Street, Boston, MA 02108.
9 Effective as of January 9, 2013.
The fund's Statement of Additional Information ("SAI") includes additional information about the Board Members. The SAI is available, without charge, upon request. If you would like to request a copy of the SAI, you may do so by calling the following toll-free number: (800) 728-3337.
| For More Information | The automated telephone system allows you to access personalized account information and obtain information on other DWS funds using either your voice or your telephone keypad. Certain account types within Classes A, C and S also have the ability to purchase, exchange or redeem shares using this system. For more information, contact your financial advisor. You may also access our automated telephone system or speak with a DWS Investments representative by calling: (800) 728-3337 | |
| Web Site | www.dws-investments.com View your account transactions and balances, trade shares, monitor your asset allocation, and change your address, 24 hours a day. Obtain prospectuses and applications, blank forms, interactive worksheets, news about DWS funds, subscription to fund updates by e-mail, retirement planning information, and more. | |
| Written Correspondence | DWS Investments PO Box 219151 Kansas City, MO 64121-9151 | |
| Proxy Voting | The fund's policies and procedures for voting proxies for portfolio securities and information about how the fund voted proxies related to its portfolio securities during the 12-month period ended June 30 are available on our Web site — www.dws-investments.com (click on "proxy voting"at the bottom of the page) — or on the SEC's Web site — www.sec.gov. To obtain a written copy of the fund's policies and procedures without charge, upon request, call us toll free at (800) 728-3337. | |
| Portfolio Holdings | Following the fund's fiscal first and third quarter-end, a complete portfolio holdings listing is filed with the SEC on Form N-Q. This form will be available on the SEC's Web site at www.sec.gov, and it also may be reviewed and copied at the SEC's Public Reference Room in Washington, D.C. Information on the operation of the SEC's Public Reference Room may be obtained by calling (800) SEC-0330. The fund's portfolio holdings are also posted on www.dws-investments.com from time to time. Please see the fund's current prospectus for more information. | |
| Principal Underwriter | If you have questions, comments or complaints, contact: DWS Investments Distributors, Inc. 222 South Riverside Plaza Chicago, IL 60606-5808 (800) 621-1148 | |
| Investment Management | Deutsche Investment Management Americas Inc. ("DIMA" or the "Advisor"), which is part of Deutsche Asset & Wealth Management, is the investment advisor for the fund. DIMA and its predecessors have more than 80 years of experience managing mutual funds and DIMA provides a full range of investment advisory services to both institutional and retail clients. DIMA is an indirect, wholly owned subsidiary of Deutsche Bank AG. Deutsche Bank AG is a major global banking institution engaged in a wide variety of financial services, including investment management, retail, private and commercial banking, investment banking and insurance. DWS Investments is the retail brand name in the U.S. for the asset management activities of Deutsche Bank AG and DIMA. As such, DWS is committed to delivering the investing expertise, insight and resources of this global investment platform to American investors. | |
| Class A | Class C | Class S | Institutional Class | ||
| Nasdaq Symbol | AAAAX | AAAPX | AAASX | AAAZX | |
| CUSIP Number | 233376 763 | 233376 755 | 233376 748 | 233376 730 | |
| Fund Number | 487 | 787 | 2087 | 1487 |
| For shareholders of Class R | ||
| Automated Information Line | DWS Investments Flex Plan Access (800) 728-3337 24-hour access to your retirement plan account. | |
| Web Site | www.dws-investments.com Click "Retirement Plans" to reallocate assets, process transactions and review your funds through our secure online account access. Obtain prospectuses and applications, blank forms, interactive worksheets, news about DWS funds, subscription to fund updates by e-mail, retirement planning information, and more. | |
| For More Information | (800) 728-3337 To speak with a service representative. | |
| Written Correspondence | DWS Investments Service Company 222 South Riverside Plaza Chicago, IL 60606-5806 | |
| Nasdaq Symbol | AAAQX | |
| CUSIP Number | 233376 672 | |
| Fund Number | 1587 | |

| ITEM 2. | CODE OF ETHICS |
As of the end of the period covered by this report, the registrant has adopted a code of ethics, as defined in Item 2 of Form N-CSR, that applies to its Principal Executive Officer and Principal Financial Officer. There have been no amendments to, or waivers from, a provision of the code of ethics during the period covered by this report that would require disclosure under Item 2. A copy of the code of ethics is filed as an exhibit to this Form N-CSR. | |
| ITEM 3. | AUDIT COMMITTEE FINANCIAL EXPERT |
| The fund’s audit committee is comprised solely of trustees who are "independent" (as such term has been defined by the Securities and Exchange Commission ("SEC") in regulations implementing Section 407 of the Sarbanes-Oxley Act (the "Regulations")). The fund’s Board of Trustees has determined that there are several "audit committee financial experts" (as such term has been defined by the Regulations) serving on the fund’s audit committee including Mr. Paul K. Freeman, the chair of the fund’s audit committee. An “audit committee financial expert” is not an “expert” for any purpose, including for purposes of Section 11 of the Securities Act of 1933 and the designation or identification of a person as an “audit committee financial expert” does not impose on such person any duties, obligations or liability that are greater than the duties, obligations and liability imposed on such person as a member of the audit committee and board of directors in the absence of such designation or identification. | |
| ITEM 4. | PRINCIPAL ACCOUNTANT FEES AND SERVICES |
DWS ALTERNATIVE ASSET ALLOCATION FUND
FORM N-CSR DISCLOSURE RE: AUDIT FEES
The following table shows the amount of fees that Ernst & Young LLP (“E&Y”), the Fund’s Independent Registered Public Accounting Firm, billed to the Fund during the Fund’s last two fiscal years. The Audit Committee approved in advance all audit services and non-audit services that E&Y provided to the Fund.
Services that the Fund’s Independent Registered Public Accounting Firm Billed to the Fund
| Fiscal Year Ended March 31, | Audit Fees Billed to Fund | Audit-Related Fees Billed to Fund | Tax Fees Billed to Fund | All Other Fees Billed to Fund | ||||||||||||
| 2013 | $ | 56,154 | $ | 0 | $ | 9,940 | $ | 0 | ||||||||
| 2012 | $ | 56,960 | $ | 0 | $ | 9,650 | $ | 0 | ||||||||
The above “Tax Fees” were billed for professional services rendered for tax return preparation.
Services that the Fund’s Independent Registered Public Accounting Firm Billed to the Adviser and Affiliated Fund Service Providers
The following table shows the amount of fees billed by E&Y to Deutsche Investment Management Americas, Inc. (“DIMA” or the “Adviser”), and any entity controlling, controlled by or under common control with DIMA (“Control Affiliate”) that provides ongoing services to the Fund (“Affiliated Fund Service Provider”), for engagements directly related to the Fund’s operations and financial reporting, during the Fund’s last two fiscal years.
| Fiscal Year Ended March 31, | Audit-Related Fees Billed to Adviser and Affiliated Fund Service Providers | Tax Fees Billed to Adviser and Affiliated Fund Service Providers | All Other Fees Billed to Adviser and Affiliated Fund Service Providers | |||||||||
| 2013 | $ | 0 | $ | 243,066 | $ | 0 | ||||||
| 2012 | $ | 0 | $ | 333,267 | $ | 0 | ||||||
The above “Tax Fees” were billed in connection with tax compliance services and agreed upon procedures.
Non-Audit Services
The following table shows the amount of fees that E&Y billed during the Fund’s last two fiscal years for non-audit services. The Audit Committee pre-approved all non-audit services that E&Y provided to the Adviser and any Affiliated Fund Service Provider that related directly to the Fund’s operations and financial reporting. The Audit Committee requested and received information from E&Y about any non-audit services that E&Y rendered during the Fund’s last fiscal year to the Adviser and any Affiliated Fund Service Provider. The Committee considered this information in evaluating E&Y’s independence.
| Fiscal Year Ended March 31, | Total Non-Audit Fees Billed to Fund (A) | Total Non-Audit Fees billed to Adviser and Affiliated Fund Service Providers (engagements related directly to the operations and financial reporting of the Fund) (B) | Total Non-Audit Fees billed to Adviser and Affiliated Fund Service Providers (all other engagements) (C) | Total of (A), (B) and (C) | ||||||||||||
| 2013 | $ | 9,940 | $ | 243,066 | $ | 387,432 | $ | 640,438 | ||||||||
| 2012 | $ | 9,650 | $ | 333,267 | $ | 539,555 | $ | 882,472 | ||||||||
All other engagement fees were billed for services in connection with agreed upon procedures and tax compliance for DIMA and other related entities that provide support for the operations of the Fund.
Audit Committee Pre-Approval Policies and Procedures. Generally, each Fund’s Audit Committee must pre approve (i) all services to be performed for a Fund by a Fund’s Independent Registered Public Accounting Firm and (ii) all non-audit services to be performed by a Fund’s Independent Registered Public Accounting Firm for the DIMA Entities with respect to operations and financial reporting of the Fund, except that the Chairperson or Vice Chairperson of each Fund’s Audit Committee may grant the pre-approval for non-audit services described in items (i) and (ii) above for non-prohibited services for engagements of less than $100,000. All such delegated pre approvals shall be presented to each Fund’s Audit Committee no later than the next Audit Committee meeting.
There were no amounts that were approved by the Audit Committee pursuant to the de minimis exception under Rule 2-01 of Regulation S-X.
According to the registrant’s principal Independent Registered Public Accounting Firm, substantially all of the principal Independent Registered Public Accounting Firm's hours spent on auditing the registrant's financial statements were attributed to work performed by full-time permanent employees of the principal Independent Registered Public Accounting Firm.
***
In connection with the audit of the 2012 and 2013 financial statements, the Fund entered into an engagement letter with E&Y. The terms of the engagement letter required by E&Y, and agreed to by the Audit Committee, include provisions in which the parties consent to the sole jurisdiction of federal courts in New York, Boston or the Northern District of Illinois, as well as a waiver of right to a trial by jury and an exclusion of punitive damages.
***
| ITEM 5. | AUDIT COMMITTEE OF LISTED REGISTRANTS | |
| Not applicable | ||
| ITEM 6. | SCHEDULE OF INVESTMENTS | |
| Not applicable | ||
| ITEM 7. | DISCLOSURE OF PROXY VOTING POLICIES AND PROCEDURES FOR CLOSED-END MANAGEMENT INVESTMENT COMPANIES | |
| Not applicable | ||
| ITEM 8. | PORTFOLIO MANAGERS OF CLOSED-END MANAGEMENT INVESTMENT COMPANIES | |
| Not applicable | ||
| ITEM 9. | PURCHASES OF EQUITY SECURITIES BY CLOSED-END MANAGEMENT INVESTMENT COMPANY AND AFFILIATED PURCHASERS | |
| Not applicable | ||
| ITEM 10. | SUBMISSION OF MATTERS TO A VOTE OF SECURITY HOLDERS | |
| There were no material changes to the procedures by which shareholders may recommend nominees to the Fund’s Board. The primary function of the Nominating and Governance Committee is to identify and recommend individuals for membership on the Board and oversee the administration of the Board Governance Guidelines. Shareholders may recommend candidates for Board positions by forwarding their correspondence by U.S. mail or courier service to Kenneth C. Froewiss, Independent Chairman, DWS Mutual Funds, P.O. Box 78, Short Hills, NJ 07078. | ||
| ITEM 11. | CONTROLS AND PROCEDURES | |
| (a) | The Chief Executive and Financial Officers concluded that the Registrant’s Disclosure Controls and Procedures are effective based on the evaluation of the Disclosure Controls and Procedures as of a date within 90 days of the filing date of this report. | |
| (b) | There have been no changes in the registrant’s internal control over financial reporting that occurred during the second fiscal quarter of the period covered by this report that has materially affected, or is reasonably likely to materially affect, the registrant’s internal controls over financial reporting. | |
| ITEM 12. | EXHIBITS | |
| (a)(1) | Code of Ethics pursuant to Item 2 of Form N-CSR is filed and attached hereto as EX-99.CODE ETH. | |
| (a)(2) | Certification pursuant to Rule 30a-2(a) under the Investment Company Act of 1940 (17 CFR 270.30a-2(a)) is filed and attached hereto as Exhibit 99.CERT. | |
| (b) | Certification pursuant to Rule 30a-2(b) under the Investment Company Act of 1940 (17 CFR 270.30a-2(b)) is furnished and attached hereto as Exhibit 99.906CERT. | |
Form N-CSR Item F
SIGNATURES
Pursuant to the requirements of the Securities Exchange Act of 1934 and the Investment Company Act of 1940, the registrant has duly caused this report to be signed on its behalf by the undersigned, thereunto duly authorized.
| Registrant: | DWS Alternative Asset Allocation Fund, a series of DWS Market Trust |
| By: | /s/W. Douglas Beck W. Douglas Beck President |
| Date: | May 29, 2013 |
Pursuant to the requirements of the Securities Exchange Act of 1934 and the Investment Company Act of 1940, this report has been signed below by the following persons on behalf of the registrant and in the capacities and on the dates indicated.
| By: | /s/W. Douglas Beck W. Douglas Beck President |
| Date: | May 29, 2013 |
| By: | /s/Paul Schubert Paul Schubert Chief Financial Officer and Treasurer |
| Date: | May 29, 2013 |