UNITED STATES
SECURITIES AND EXCHANGE COMMISSION
WASHINGTON, D. C. 20549
FORM N-CSRS
Investment Company Act file number: 811-01236
Deutsche Market Trust
(Exact Name of Registrant as Specified in Charter)
345 Park Avenue
New York, NY 10154-0004
(Address of Principal Executive Offices) (Zip Code)
Registrant’s Telephone Number, including Area Code: (212) 250-3220
Paul Schubert
60 Wall Street
New York, NY 10005
(Name and Address of Agent for Service)
| Date of fiscal year end: | 3/31 |
| Date of reporting period: | 9/30/2016 |
| ITEM 1. | REPORT TO STOCKHOLDERS |

September 30, 2016
Semiannual Report
to Shareholders
Deutsche Real Assets Fund
(formerly Deutsche Alternative Asset Allocation Fund)

Contents
3 Letter to Shareholders 5 Performance Summary 10 Portfolio Management Team 11 Consolidated Portfolio Summary 14 Consolidated Investment Portfolio 21 Consolidated Statement of Assets and Liabilities 23 Consolidated Statement of Operations 25 Consolidated Statements of Changes in Net Assets 26 Consolidated Financial Highlights 32 Notes to Consolidated Financial Statements 45 Information About Your Fund's Expenses 47 Advisory Agreement Board Considerations and Fee Evaluation 52 Account Management Resources 54 Privacy Statement |
This report must be preceded or accompanied by a prospectus. To obtain a summary prospectus, if available, or prospectus for any of our funds, refer to the Account Management Resources information provided in the back of this booklet. We advise you to consider the fund's objectives, risks, charges and expenses carefully before investing. The summary prospectus and prospectus contain this and other important information about the fund. Please read the prospectus carefully before you invest.
Stocks may decline in value. Investing in foreign securities presents certain risks, such as currency fluctuations, political and economic changes, and market risks. Emerging markets tend to be more volatile and less liquid than the markets of more mature economies, and generally have less diverse and less mature economic structures and less stable political systems than those of developed countries. Investing in derivatives entails special risks relating to liquidity, leverage and credit that may reduce returns and/or increase volatility. Bond investments are subject to interest-rate, credit, liquidity and market risks to varying degrees. When interest rates rise, bond prices generally fall. Credit risk refers to the ability of an issuer to make timely payments of principal and interest. The fund invests in commodity-linked derivatives which may subject the fund to special risks. Market price movements or regulatory and economic changes will have a significant impact on the fund’s performance. There are special risks associated with an investment in real estate, including REITS. These risks include credit risk, interest rate fluctuations and the impact of varied economic conditions. Companies in the infrastructure, transportation, energy and utility industries may be affected by a variety of factors, including, but not limited to, high interest costs, energy prices, high degrees of leverage, environmental and other government regulations, the level of government spending on infrastructure projects, intense competition and other factors. Any fund that focuses in a particular segment of the market or region of the world will generally be more volatile than a fund that invests more broadly. See the prospectus for details.
Deutsche Asset Management represents the asset management activities conducted by Deutsche Bank AG or any of its subsidiaries.
NOT FDIC/NCUA INSURED NO BANK GUARANTEE MAY LOSE VALUE NOT A DEPOSIT NOT INSURED BY ANY FEDERAL GOVERNMENT AGENCY
Letter to Shareholders
Dear Shareholder:
Today’s low-return investment environment — punctuated by periods of short-term volatility and plenty of opinions in the financial media — can be a challenge for those of us just trying to keep our portfolios moving forward.
Let’s face it: a report about the obstacles to economic growth grabs more attention than an article about the slow, steady improvement of the economy. The fact is, we continue to see the U.S. economy remaining on a moderate expansionary path. Although net exports are still challenged by modest global growth, most metrics suggest the labor market here at home continues to heal, which, along with low interest rates, is supporting the consumer.
Is action necessary? Numerous studies have found that acting impulsively on negative financial news can actually reduce your overall investment returns over time. That’s because there is a good chance you’ll miss the gains to be achieved if the market or a specific security recovers from a brief setback. So, assuming you have built your portfolio based on long-term needs and an honest assessment of your risk tolerance, short-term fluctuations should not cause an extreme level of worry.
As a global asset manager with decades of experience in helping investors through multiple market cycles, we want you to know and trust that our global intelligence, expertise and resources are here to support you. As always, we appreciate the opportunity to help you meet your goals.
Best regards,

 |
Brian Binder President, Deutsche Funds |
Assumptions, estimates and opinions contained in this document constitute our judgment as of the date of the document and are subject to change without notice. Any projections are based on a number of assumptions as to market conditions and there can be no guarantee that any projected results will be achieved. Past performance is not a guarantee of future results.
Performance Summary September 30, 2016 (Unaudited)
| Class A | 6-Month‡ | 1-Year | 5-Year | Life of Fund* |
| Average Annual Total Returns as of 9/30/16 | ||||
| Unadjusted for Sales Charge | 4.65% | 7.07% | 2.81% | 1.58% |
| Adjusted for the Maximum Sales Charge (max 5.75% load) | –1.37% | 0.91% | 1.60% | 0.93% |
| MSCI World Index† | 5.92% | 11.36% | 11.63% | 3.24% |
| Bloomberg Barclays US Treasury Inflation Notes Total Return Index† | 2.69% | 6.58% | 1.93% | 4.63% |
| Blended Index (Real Assets Fund)† | 8.13% | 12.87% | 6.66% | 3.00% |
| Bloomberg Barclays U.S. Aggregate Bond Index† | 2.68% | 5.19% | 3.08% | 4.90% |
| S&P 500® Index† | 6.40% | 15.43% | 16.37% | 6.59% |
| Blended Index (AAA Fund)† | 4.97% | 9.67% | 9.19% | 4.09% |
| Class C | 6-Month‡ | 1-Year | 5-Year | Life of Fund* |
| Average Annual Total Returns as of 9/30/16 | ||||
| Unadjusted for Sales Charge | 4.35% | 6.41% | 2.04% | 0.79% |
| Adjusted for the Maximum Sales Charge (max 1.00% CDSC) | 3.35% | 6.41% | 2.04% | 0.79% |
| MSCI World Index† | 5.92% | 11.36% | 11.63% | 3.24% |
| Bloomberg Barclays US Treasury Inflation Notes Total Return Index† | 2.69% | 6.58% | 1.93% | 4.63% |
| Blended Index (Real Assets Fund)† | 8.13% | 12.87% | 6.66% | 3.00% |
| Bloomberg Barclays U.S. Aggregate Bond Index† | 2.68% | 5.19% | 3.08% | 4.90% |
| S&P 500® Index† | 6.40% | 15.43% | 16.37% | 6.59% |
| Blended Index (AAA Fund)† | 4.97% | 9.67% | 9.19% | 4.09% |
| Class R | 6-Month‡ | 1-Year | 5-Year | Life of Fund* |
| Average Annual Total Returns as of 9/30/16 | ||||
| No Sales Charges | 4.46% | 6.83% | 2.62% | 0.72% |
| MSCI World Index† | 5.92% | 11.36% | 11.63% | 3.24% |
| Bloomberg Barclays US Treasury Inflation Notes Total Return Index† | 2.69% | 6.58% | 1.93% | 4.63% |
| Blended Index (Real Assets Fund)† | 8.13% | 12.87% | 6.66% | 3.00% |
| Bloomberg Barclays U.S. Aggregate Bond Index† | 2.68% | 5.19% | 3.08% | 4.90% |
| S&P 500® Index† | 6.40% | 15.43% | 16.37% | 6.59% |
| Blended Index (AAA Fund)† | 4.97% | 9.67% | 9.19% | 4.09% |
| Class R6 | 6-Month‡ | 1-Year | Life of Class** | |
| Average Annual Total Returns as of 9/30/16 | ||||
| No Sales Charges | 4.89% | 7.61% | –1.29% | |
| MSCI World Index† | 5.92% | 11.36% | 1.42% | |
| Bloomberg Barclays US Treasury Inflation Notes Total Return Index† | 2.69% | 6.58% | 2.42% | |
| Blended Index (Real Assets Fund)† | 8.13% | 12.87% | –0.09% | |
| Bloomberg Barclays U.S. Aggregate Bond Index† | 2.68% | 5.19% | 3.56% | |
| S&P 500® Index† | 6.40% | 15.43% | 4.67% | |
| Blended Index (AAA Fund)† | 4.97% | 9.67% | 2.34% | |
| Class S | 6-Month‡ | 1-Year | 5-Year | Life of Fund* |
| Average Annual Total Returns as of 9/30/16 | ||||
| No Sales Charges | 4.71% | 7.39% | 2.98% | 1.76% |
| MSCI World Index† | 5.92% | 11.36% | 11.63% | 3.24% |
| Bloomberg Barclays US Treasury Inflation Notes Total Return Index† | 2.69% | 6.58% | 1.93% | 4.63% |
| Blended Index (Real Assets Fund)† | 8.13% | 12.87% | 6.66% | 3.00% |
| Bloomberg Barclays U.S. Aggregate Bond Index† | 2.68% | 5.19% | 3.08% | 4.90% |
| S&P 500® Index† | 6.40% | 15.43% | 16.37% | 6.59% |
| Blended Index (AAA Fund)† | 4.97% | 9.67% | 9.19% | 4.09% |
| Institutional Class | 6-Month‡ | 1-Year | 5-Year | Life of Fund* |
| Average Annual Total Returns as of 9/30/16 | ||||
| No Sales Charges | 4.89% | 7.62% | 3.17% | 1.85% |
| MSCI World Index† | 5.92% | 11.36% | 11.63% | 3.24% |
| Bloomberg Barclays US Treasury Inflation Notes Total Return Index† | 2.69% | 6.58% | 1.93% | 4.63% |
| Blended Index (Real Assets Fund)† | 8.13% | 12.87% | 6.66% | 3.00% |
| Bloomberg Barclays U.S. Aggregate Bond Index† | 2.68% | 5.19% | 3.08% | 4.90% |
| S&P 500® Index† | 6.40% | 15.43% | 16.37% | 6.59% |
| Blended Index (AAA Fund)† | 4.97% | 9.67% | 9.19% | 4.09% |
Performance in the Average Annual Total Returns table above and the Growth of an Assumed $10,000 Investment line graph that follows is historical and does not guarantee future results. Investment return and principal fluctuate, so your shares may be worth more or less when redeemed. Current performance may differ from performance data shown. Please visit deutschefunds.com for the Fund's most recent month-end performance. Fund performance includes reinvestment of all distributions. Unadjusted returns do not reflect sales charges and would have been lower if they had.
The gross expense ratios of the Fund, as stated in the fee table of the prospectus dated August 1, 2016 are 1.38%, 2.11%, 1.76%, 1.00%, 1.20% and 1.08% for Class A, Class C, Class R, Class R6, Class S and Institutional Class shares, respectively, and may differ from the expense ratios disclosed in the Financial Highlights tables in this report.
Index returns do not reflect any fees or expenses and it is not possible to invest directly into an index.
Performance figures do not reflect the deduction of taxes that a shareholder would pay on fund distributions or the redemptions of fund shares.
Returns shown for Class R shares for the period prior to its inception on June 1, 2011 are derived from the historical performance of Class A shares of the Deutsche Real Assets Fund during such periods and have been adjusted to reflect the higher total annual operating expenses. Any difference in expenses will affect performance.
Prior to April 26, 2016, the Fund was known as the Deutsche Alternative Asset Allocation Fund (AAA Fund). On April 26, 2016, the Fund’s investment strategy was changed and the Fund was restructured from a fund-of-funds (i.e., a fund investing primarily in other Deutsche funds) to a direct investment fund (i.e., a fund investing directly in securities and other investments). Performance would have been different if the Fund’s current investment strategy and structure had been in effect.
| Growth of an Assumed $10,000 Investment (Adjusted for Maximum Sales Charge) |
■ Deutsche Real Assets Fund — Class A ■ MSCI World Index† ■ Bloomberg Barclays US Treasury Inflation Note Total Return Index† ■ Blended Index (Real Assets Fund)† ■ Bloomberg Barclays U.S. Aggregate Bond Index† ■ S&P 500 Index† ■ Blended Index (AAA Fund)† |
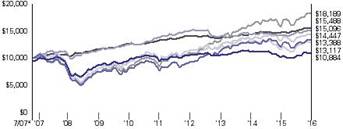 |
| Yearly periods ended September 30 |
The Fund's growth of an assumed $10,000 investment is adjusted for the maximum sales charge of 5.75%. This results in a net initial investment of $9,425.
The growth of $10,000 is cumulative.
Performance of other share classes will vary based on the sales charges and the fee structure of those classes.
* The Fund commenced operations on July 31, 2007.
** Class R6 shares commenced operations on November 28, 2014.
† The Morgan Stanley Capital International (MSCI) World Index is an unmanaged, capitalization-weighted measure of global stock markets including the U.S., Canada, Europe, Australia and the Far East. The index is calculated using closing local market prices and translates into U.S. dollars using the London close foreign exchange rates.
The Bloomberg Barclays US Treasury Inflation Notes Total Return Index includes all publicly traded U.S. Treasury inflation-protected securities that have at least one year remaining to maturity, are rated investment grade and have $250 million or more of outstanding face value.
The Blended Index (Real Assets Fund) is composed of 30% in the Dow Jones Brookfield Infrastructure Index, 30% in the FTSE EPRA/NAREIT Developed Index, 15% in the Bloomberg Commodity Index, 10% in the Barclays U.S. Treasury Inflation Notes Total Return Index, 7.5% in the MSCI World Energy Index, and 7.5% in the MSCI World Materials Index. Dow Jones Brookfield Infrastructure Index measures the stock performance of companies that exhibit strong infrastructure characteristics. FTSE EPRA/NAREIT Developed Index represents general trends in global real estate equities. Bloomberg Commodity Index is composed of a diversified group of commodities and futures contracts on physical commodities. Bloomberg Barclays U.S. Treasury Inflation Notes Total Return Index includes all publicly traded U.S. Treasury inflation-protected securities that have at least one year remaining to maturity, are rated investment grade and have $250 million or more of outstanding face value. MSCI World Energy Index captures large and mid-cap segments of 23 developed market countries in the Energy sector. MSCI World Materials Index captures large and mid-cap segments of 23 developed market countries in the Materials sector.
The Bloomberg Barclays U.S. Aggregate Bond Index is an unmanaged index that covers the U.S. investment-grade fixed-rate bond market, including government and credit securities, agency mortgage securities, asset-backed securities and commercial mortgage-backed securities.
On April 26, 2016, the comparative broad-based market indexes changed from the MSCI World Index, the Bloomberg Barclays U.S. Aggregate Bond Index and the Standard & Poor’s 500 Index to the MSCI World Index and Bloomberg Barclays U.S. Treasury Inflation Notes Total Return Index because the Advisor believes the MSCI World Index and the Bloomberg Barclays U.S. Treasury Inflation Notes Total Return Index more closely reflect the Fund’s investment strategies. On April 26, 2016, the Blended Index (Real Assets Fund) replaced the Blended Index (AAA Fund) as the sole additional comparative index. The Advisor believes the Blended Index (Real Assets Fund) provides additional comparative performance information and represents the Fund’s overall investment strategy.
The Standard & Poor's 500 (S&P 500) Index is an unmanaged, capitalization-weighted index of 500 stocks. The index is designed to measure performance of the broad domestic economy through changes in the aggregate market value of 500 stocks representing all major industries.
The Blended Index (AAA Fund) consists of 70% in the MSCI World Index and 30% in the Bloomberg Barclays U.S. Aggregate Bond Index.
‡ Total returns shown for periods less than one year are not annualized.
| Class A | Class C | Class R | Class R6 | Class S | Institutional Class | |
| Net Asset Value | ||||||
| 9/30/16 | $ 8.85 | $ 8.81 | $ 8.90 | $ 8.80 | $ 8.79 | $ 8.80 |
| 3/31/16 | $ 8.56 | $ 8.53 | $ 8.62 | $ 8.50 | $ 8.50 | $ 8.50 |
| Distribution Information as of 9/30/16 | ||||||
| Income Dividends, Six Months | $ .11 | $ .09 | $ .10 | $ .11 | $ .11 | $ .11 |
Portfolio Management Team
John W. Vojticek, Managing Director
Portfolio Manager of the fund. Began managing the fund in 2015.
— Joined Deutsche Asset Management in 2004; previously worked as Principal at KG Redding and Associates, March 2004–September 2004; and previously Managing Director of Deutsche Asset Management from 1996–March 2004.
— Co-Head and Chief Investment Officer of Liquid Real Assets for Deutsche Asset Management.
— BS, University of Southern California.
Francis X. Greywitt III, Managing Director
Portfolio Manager of the fund. Began managing the fund in 2016.
— Joined Deutsche Asset Management in 2005; previously has worked as a REIT analyst with KeyBanc Capital Markets covering the office sector.
— Co-Head of Infrastructure Securities and Co-Lead Portfolio Manager: Chicago.
— Investment industry experience began in 1999.
— BBA, St. Bonaventure University; MBA, University of Chicago.
Evan Rudy, CFA, Director
Portfolio Manager of the fund. Began managing the fund in 2016.
— Joined Deutsche Asset Management in 2007. Previously, worked as an Analyst at the Townsend Group, a real estate consulting firm.
— Portfolio Analyst, Real Estate & Infrastructure Securities: Chicago.
— BS, Miami University.
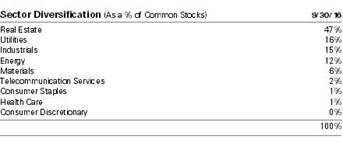
Consolidated Portfolio Summary (Unaudited)
| Ten Largest Equity Holdings at September 30, 2016 (21.0% of Net Assets) | Country | Percent |
1. Crown Castle International Corp. Provider of wireless infrastructure | United States | 3.4% |
2. American Tower Corp. Operator and developer of wireless communications and broadcast towers | United States | 3.0% |
3. Transurban Group Operation of Melbourne city link and the Hills Motorway M2 toll roads | Australia | 2.2% |
4. Pembina Pipeline Corp. Transports, stores and markets petroleum products | Canada | 2.1% |
5. Tokyo Gas Co., Ltd Produces and supplies liquefied natural gas | Japan | 1.9% |
6. Enagas SA Imports, stores and transports natural gas | Spain | 1.8% |
7. Sempra Energy Provider of electric and natural gas products and services | United States | 1.8% |
8. Klepierre Owns and manages office buildings | France | 1.7% |
9. Kinder Morgan, Inc Operator of natural gas and products pipelines | United States | 1.6% |
10. Equity Residential Operator of multifamily properties | United States | 1.5% |
Consolidated portfolio holdings and characteristics are subject to change. For more complete details about the fund's consolidated investment portfolio, see page 14. A quarterly Fact Sheet is available on deutschefunds.com or upon request. Please see the Account Management Resources section on page 52 for contact information. | ||
Consolidated Investment Portfolio
as of September 30, 2016 (Unaudited)
Shares | Value ($) | |
| Common Stocks 79.4% | ||
| Consumer Discretionary 0.3% | ||
| Media | ||
| Eutelsat Communications SA | 31,499 | 651,970 |
| Consumer Staples 1.0% | ||
| Food Products | ||
| Bunge Ltd. | 26,287 | 1,556,979 |
| KWS Saat SE | 1,664 | 561,057 |
| 2,118,036 | ||
| Energy 9.5% | ||
| Energy Equipment & Services 0.4% | ||
| Schlumberger Ltd. | 10,927 | 859,299 |
| Oil, Gas & Consumable Fuels 9.1% | ||
| Cheniere Energy, Inc.* | 50,886 | 2,218,630 |
| Enbridge Energy Management LLC* | 86,967 | 2,212,441 |
| Inter Pipeline Ltd. | 103,504 | 2,185,343 |
| Kinder Morgan, Inc. | 149,034 | 3,447,156 |
| Koninklijke Vopak NV | 45,396 | 2,386,084 |
| Marathon Petroleum Corp. | 31,192 | 1,266,083 |
| Pembina Pipeline Corp. | 144,599 | 4,406,470 |
| TOTAL SA (a) | 13,319 | 631,227 |
| TOTAL SA (a) | 8,415 | 400,948 |
| 19,154,382 | ||
| Health Care 0.9% | ||
| Health Care Providers & Services | ||
| Chartwell Retirement Residences (Units) | 162,699 | 1,959,407 |
| Industrials 11.6% | ||
| Building Products 0.3% | ||
| USG Corp.* | 26,132 | 675,512 |
| Commercial Services & Supplies 1.0% | ||
| Waste Management, Inc. | 33,441 | 2,132,198 |
| Construction & Engineering 0.7% | ||
| Ferrovial SA | 68,524 | 1,459,206 |
| Industrial Conglomerates 1.0% | ||
| Beijing Enterprises Holdings Ltd. | 411,182 | 2,098,779 |
| Machinery 1.2% | ||
| Deere & Co. | 18,576 | 1,585,462 |
| Kubota Corp. | 69,100 | 1,043,817 |
| 2,629,279 | ||
| Road & Rail 2.4% | ||
| Canadian Pacific Railway Ltd. | 14,523 | 2,217,662 |
| Union Pacific Corp. | 28,386 | 2,768,487 |
| 4,986,149 | ||
| Transportation Infrastructure 5.0% | ||
| China Merchants Port Holdings Co., Ltd. | 596,758 | 1,602,213 |
| Flughafen Zuerich AG (Registered) | 9,185 | 1,794,455 |
| Sydney Airport (Units) | 483,418 | 2,598,631 |
| Transurban Group (Units) | 522,223 | 4,560,359 |
| 10,555,658 | ||
| Materials 4.9% | ||
| Chemicals 1.8% | ||
| Akzo Nobel NV | 20,966 | 1,422,496 |
| Celanese Corp. "A" | 20,287 | 1,350,303 |
| Dow Chemical Co. | 20,000 | 1,036,600 |
| 3,809,399 | ||
| Construction Materials 1.0% | ||
| Vulcan Materials Co. | 17,586 | 2,000,056 |
| Metals & Mining 2.1% | ||
| Glencore PLC* | 463,649 | 1,276,598 |
| Lundin Mining Corp.* | 419,758 | 1,660,539 |
| Newmont Mining Corp. | 39,908 | 1,567,985 |
| 4,505,122 | ||
| Real Estate 37.3% | ||
| Equity Real Estate Investment Trusts (REITs) 27.5% | ||
| American Tower Corp. | 55,891 | 6,334,127 |
| Ascendas Real Estate Investment Trust | 633,100 | 1,172,558 |
| Brixmor Property Group, Inc. | 23,037 | 640,198 |
| Camden Property Trust | 12,289 | 1,029,081 |
| Crown Castle International Corp. | 77,206 | 7,273,577 |
| CubeSmart | 86,963 | 2,370,611 |
| DiamondRock Hospitality Co. | 80,021 | 728,191 |
| Duke Realty Corp. | 29,828 | 815,199 |
| DuPont Fabros Technology, Inc. | 49,841 | 2,055,941 |
| Equinix, Inc. | 7,373 | 2,656,123 |
| Equity Residential | 48,573 | 3,124,701 |
| Gecina SA | 10,739 | 1,689,387 |
| General Growth Properties, Inc. | 36,224 | 999,782 |
| Global One Real Estate Investment Corp. | 285 | 1,087,412 |
| Healthcare Trust of America, Inc. "A" | 31,074 | 1,013,634 |
| Host Hotels & Resorts, Inc. | 46,378 | 722,106 |
| Klepierre | 78,428 | 3,596,663 |
| Land Securities Group PLC | 93,066 | 1,275,937 |
| Link REIT | 293,938 | 2,169,019 |
| Mori Hills REIT Investment Corp. | 728 | 1,088,400 |
| Mori Trust Sogo REIT, Inc. | 297 | 520,079 |
| Prologis, Inc. | 46,716 | 2,501,175 |
| Public Storage | 6,569 | 1,465,807 |
| Scentre Group | 375,607 | 1,357,871 |
| Segro PLC | 191,771 | 1,130,100 |
| Simon Property Group, Inc. | 9,830 | 2,034,908 |
| Spirit Realty Capital, Inc. | 161,280 | 2,149,862 |
| STORE Capital Corp. | 57,478 | 1,693,877 |
| Urban Edge Properties | 21,949 | 617,645 |
| Ventas, Inc. | 21,711 | 1,533,448 |
| Vornado Realty Trust | 8,213 | 831,238 |
| Washington Real Estate Investment Trust | 16,732 | 520,700 |
| 58,199,357 | ||
| Real Estate Management & Development 9.8% | ||
| ADO Properties SA 144A | 33,509 | 1,343,583 |
| CapitaLand Ltd. | 369,800 | 872,725 |
| Cheung Kong Property Holdings Ltd. | 162,196 | 1,192,150 |
| City Developments Ltd. | 263,400 | 1,760,984 |
| Fabege AB | 141,551 | 2,580,945 |
| First Capital Realty, Inc. | 98,121 | 1,643,889 |
| Hang Lung Properties Ltd. | 689,788 | 1,563,503 |
| Hongkong Land Holdings Ltd. | 202,600 | 1,441,902 |
| Kungsleden AB | 339,294 | 2,482,669 |
| Mitsui Fudosan Co., Ltd. | 29,000 | 617,220 |
| NTT Urban Development Corp. | 47,500 | 459,496 |
| PSP Swiss Property AG (Registered) | 13,123 | 1,249,094 |
| Sino Land Co., Ltd. | 919,213 | 1,643,524 |
| Vonovia SE | 53,969 | 2,045,898 |
| 20,897,582 | ||
| Telecommunication Services 1.1% | ||
| Diversified Telecommunication Services | ||
| SBA Communications Corp. "A"* | 21,125 | 2,369,380 |
| Utilities 12.8% | ||
| Electric Utilities 1.0% | ||
| Eversource Energy | 38,511 | 2,086,526 |
| Gas Utilities 6.5% | ||
| Enagas SA | 126,990 | 3,823,949 |
| ENN Energy Holdings Ltd. | 440,162 | 2,155,281 |
| Infraestructura Energetica Nova SAB de CV | 186,434 | 726,228 |
| Snam SpA | 562,624 | 3,121,576 |
| Tokyo Gas Co., Ltd. | 900,643 | 4,013,989 |
| 13,841,023 | ||
| Multi-Utilities 3.5% | ||
| National Grid PLC | 111,502 | 1,575,446 |
| NorthWestern Corp. | 35,820 | 2,060,725 |
| Sempra Energy | 35,603 | 3,816,285 |
| 7,452,456 | ||
| Water Utilities 1.8% | ||
| Severn Trent PLC | 66,239 | 2,152,720 |
| United Utilities Group PLC | 132,397 | 1,722,757 |
| 3,875,477 | ||
| Total Common Stocks (Cost $165,630,367) | 168,316,253 | |
| Principal Amount ($) | Value ($) | |
| Government & Agency Obligations 8.2% | ||
| U.S. Treasury Obligations | ||
| U.S. Treasury Inflation-Indexed Bonds: | ||
| 1.375%, 2/15/2044 | 1,822,660 | 2,162,045 |
| 2.5%, 1/15/2029 | 1,338,254 | 1,698,862 |
| U.S. Treasury Inflation-Indexed Notes: | ||
| 0.125%, 4/15/2018 | 2,527,791 | 2,555,323 |
| 0.125%, 4/15/2019 | 2,094,483 | 2,130,140 |
| 0.125%, 1/15/2023 | 3,248,283 | 3,299,514 |
| 0.125%, 7/15/2024 | 1,154,219 | 1,171,070 |
| 0.625%, 7/15/2021 | 3,039,436 | 3,191,575 |
| 0.625%, 1/15/2024 | 1,115,160 | 1,169,935 |
| Total Government & Agency Obligations (Cost $17,068,529) | 17,378,464 | |
Shares | Value ($) | |
| Cash Equivalents 14.1% | ||
| Deutsche Central Cash Management Government Fund, 0.42% (b) (Cost $29,821,092) | 29,821,092 | 29,821,092 |
| % of Net Assets | Value ($) | |
| Total Consolidated Investment Portfolio (Cost $212,519,988)† | 101.7 | 215,515,809 |
| Other Assets and Liabilities, Net | (1.7) | (3,624,001) |
| Net Assets | 100.0 | 211,891,808 |
* Non-income producing security.
† The cost for federal income tax purposes was $222,858,696. At September 30, 2016, net unrealized depreciation for all securities based on tax cost was $7,342,887. This consisted of aggregate gross unrealized appreciation for all securities in which there was an excess of value over tax cost of $6,380,586 and aggregate gross unrealized depreciation for all securities in which there was an excess of tax cost over value of $13,723,473.
(a) Securities with the same description are the same corporate entity but trade on different stock exchanges.
(b) Affiliated fund managed by Deutsche Investment Management Americas Inc. The rate shown is the annualized seven-day yield at period end.
144A: Security exempt from registration under Rule 144A of the Securities Act of 1933. These securities may be resold in transactions exempt from registration, normally to qualified institutional buyers.
REIT: Real Estate Investment Trust
At September 30, 2016, open futures contracts purchased were as follows:
| Futures | Currency | Expiration Date | Contracts | Notional Value ($) | Unrealized Appreciation/ (Depreciation) ($) |
| Brent Crude Oil Futures | USD | 10/31/2016 | 22 | 1,104,180 | 67,023 |
| Coffee C Futures | USD | 12/19/2016 | 44 | 2,500,575 | 178,035 |
| Gold 100 Oz Futures | USD | 12/28/2016 | 22 | 2,897,620 | (68,722) |
| Lean Hogs Futures | USD | 12/14/2016 | 86 | 1,512,740 | (177,734) |
| Live Cattle Futures | USD | 12/30/2016 | 62 | 2,483,100 | (171,471) |
| Natural Gas Futures | USD | 10/27/2016 | 14 | 406,840 | (12,789) |
| Nickel Futures | USD | 12/19/2016 | 7 | 444,024 | 34,818 |
| Silver Futures | USD | 12/28/2016 | 27 | 2,593,890 | (94,736) |
| Soybean Futures | USD | 11/14/2016 | 38 | 1,812,600 | (347,791) |
| Soybean Meal Futures | USD | 12/14/2016 | 30 | 898,800 | (305,648) |
| Sugar Futures | USD | 2/28/2017 | 70 | 1,803,200 | 78,939 |
| WTI Light Sweet Crude Oil Futures | USD | 10/20/2016 | 24 | 1,157,760 | 86,076 |
| Zinc Futures | USD | 12/19/2016 | 11 | 654,294 | 38,225 |
| Total | 20,269,623 | (695,775) | |||
For information on the Fund's policy and additional disclosures regarding futures contracts, please refer to the Derivatives section of Note B in the accompanying Notes to Consolidated Financial Statements.
Fair Value Measurements
Various inputs are used in determining the value of the Fund's investments. These inputs are summarized in three broad levels. Level 1 includes quoted prices in active markets for identical securities. Level 2 includes other significant observable inputs (including quoted prices for similar securities, interest rates, prepayment speeds and credit risk). Level 3 includes significant unobservable inputs (including the Fund's own assumptions in determining the fair value of investments). The level assigned to the securities valuations may not be an indication of the risk or liquidity associated with investing in those securities.
The following is a summary of the inputs used as of September 30, 2016 in valuing the Fund's investments. For information on the Fund's policy regarding the valuation of investments, please refer to the Security Valuation section of Note A in the accompanying Notes to Consolidated Financial Statements.
| Assets | Level 1 | Level 2 | Level 3 | Total | |
| Common Stocks | |||||
| Consumer Discretionary | $ — | $ 651,970 | $ — | $ 651,970 | |
| Consumer Staples | 1,556,979 | 561,057 | — | 2,118,036 | |
| Energy | 16,595,422 | 3,418,259 | — | 20,013,681 | |
| Health Care | 1,959,407 | ��� | — | 1,959,407 | |
| Industrials | 9,379,321 | 15,157,460 | — | 24,536,781 | |
| Materials | 7,615,483 | 2,699,094 | — | 10,314,577 | |
| Real Estate | 44,755,820 | 34,341,119 | — | 79,096,939 | |
| Telecommunication Services | 2,369,380 | — | — | 2,369,380 | |
| Utilities | 8,217,050 | 19,038,432 | — | 27,255,482 | |
| Government & Agency Obligations | — | 17,378,464 | — | 17,378,464 | |
| Short-Term Investments | 29,821,092 | — | — | 29,821,092 | |
| Derivatives (c) | |||||
| Futures Contracts | 483,116 | — | — | 483,116 | |
| Total | $ 122,753,070 | $ 93,245,855 | $ — | $ 215,998,925 | |
| Liabilities | Level 1 | Level 2 | Level 3 | Total | |
| Derivatives (c) | |||||
| Futures Contracts | $ (1,178,891) | $ — | $ — | $ (1,178,891) | |
| Total | $ (1,178,891) | $ — | $ — | $ (1,178,891) | |
There have been no transfers between fair value measurement levels during the period ended September 30, 2016.
(c) Derivatives include unrealized appreciation (depreciation) on open futures contracts.
The accompanying notes are an integral part of the financial statements.
Consolidated Statement of Assets and Liabilities
| as of September 30, 2016 (Unaudited) | |
| Assets | |
Investments: Investments in non-affiliated securities, at value (cost $182,698,896) | 185,694,717 |
| Investments in Deutsche Central Cash Management Government Fund, at value (cost $29,821,092) | 29,821,092 |
| Total investments in securities, at value (cost $212,519,988) | 215,515,809 |
| Cash | 1,104,916 |
| Foreign currency, at value (cost $1,768,793) | 1,770,541 |
| Deposit with broker for futures contracts | 1,266,292 |
| Receivable for Fund investments sold | 2,030,565 |
| Receivable for Fund shares sold | 641,299 |
| Dividends receivable | 561,146 |
| Interest receivable | 27,966 |
| Foreign taxes recoverable | 26,203 |
| Other assets | 49,580 |
| Total assets | 222,994,317 |
| Liabilities | |
| Payable for investments purchased | 9,465,123 |
| Payable for Fund shares redeemed | 1,009,563 |
| Payable for variation margin on futures contracts | 164,715 |
| Accrued management fee | 151,221 |
| Accrued Trustees' fees | 3,517 |
| Other accrued expenses and payables | 308,370 |
| Total liabilities | 11,102,509 |
| Net assets, at value | $ 211,891,808 |
| Net Assets Consist of | |
| Undistributed net investment income | 1,621,066 |
Net unrealized appreciation (depreciation) on: Investments | 2,995,821 |
| Futures | (695,775) |
| Foreign currency | 295 |
| Accumulated net realized gain (loss) | (91,575,059) |
| Paid-in capital | 299,545,460 |
| Net assets, at value | $ 211,891,808 |
The accompanying notes are an integral part of the financial statements.
| Consolidated Statement of Assets and Liabilities as of September 30, 2016 (Unaudited) (continued) | |
| Net Asset Value | |
Class A Net Asset Value and redemption price per share ($75,357,566 ÷ 8,512,724 shares outstanding of beneficial interest, no par value, unlimited number of shares authorized) | $ 8.85 |
| Maximum offering price per share (100 ÷ 94.25 of $8.85) | $ 9.39 |
Class C Net Asset Value, offering and redemption price (subject to contingent deferred sales charge) per share ($52,752,442 ÷ 5,989,776 shares outstanding of beneficial interest, no par value, unlimited number of shares authorized) | $ 8.81 |
Class R Net Asset Value, offering and redemption price per share ($3,079,697 ÷ 345,964 shares outstanding of beneficial interest, no par value, unlimited number of shares authorized) | $ 8.90 |
Class R6 Net Asset Value, offering and redemption price per share ($774,330 ÷ 88,042 shares outstanding of beneficial interest, no par value, unlimited number of shares authorized) | $ 8.80 |
Class S Net Asset Value, offering and redemption price per share ($45,066,528 ÷ 5,128,872 shares outstanding of beneficial interest, no par value, unlimited number of shares authorized) | $ 8.79 |
Institutional Class Net Asset Value, offering and redemption price per share ($34,861,245 ÷ 3,962,862 shares outstanding of beneficial interest, no par value, unlimited number of shares authorized) | $ 8.80 |
The accompanying notes are an integral part of the financial statements.
Consolidated Statement of Operations
| for the six months ended September 30, 2016 (Unaudited) | |
| Investment Income | |
| Dividends (net of foreign taxes withheld of $96,082) | $ 2,522,404 |
| Interest | 489,607 |
| Income distributions — Deutsche Central Cash Management Government Fund | 62,619 |
| Total income | 3,074,630 |
Expenses: Management fee | 779,533 |
| Administration fee | 109,152 |
| Services to shareholders | 121,918 |
| Distribution and service fees | 389,370 |
| Custodian fee | 11,979 |
| Professional fees | 77,952 |
| Reports to shareholders | 32,757 |
| Registration fees | 41,059 |
| Trustees' fees and expenses | 6,893 |
| Other | 12,239 |
| Total expenses before expense reductions | 1,582,852 |
| Expense reductions | (227,753) |
| Total expenses after expense reductions | 1,355,099 |
| Net investment income | 1,719,531 |
| Realized and Unrealized Gain (Loss) | |
Net realized gain (loss) from: Sale of affiliated Underlying Funds | 24,261,211 |
| Sale of non-affiliated Underlying Funds | (515,720) |
| Investments | 3,330,498 |
| Futures | 490,242 |
| Foreign currency | (552,735) |
| 27,013,496 | |
Change in net unrealized appreciation (depreciation): Investments | (18,159,221) |
| Futures | (695,775) |
| Foreign currency | 295 |
| (18,854,701) | |
| Net gain (loss) | 8,158,795 |
| Net increase (decrease) in net assets resulting from operations | $ 9,878,326 |
The accompanying notes are an integral part of the financial statements.
Consolidated Statements of Changes in Net Assets
| Increase (Decrease) in Net Assets | Six Months Ended September 30, 2016 (Unaudited) | Year Ended March 31, 2016 | |
Operations: Net investment income | $ 1,719,531 | $ 5,866,603 | |
| Net realized gain (loss) | 27,013,496 | (31,481,219) | |
| Change in net unrealized appreciation (depreciation) | (18,854,701) | (11,200,746) | |
| Net increase (decrease) in net assets resulting from operations | 9,878,326 | (36,815,362) | |
Distributions to shareholders from: Net investment income: Class A | (927,383) | (2,138,650) | |
| Class C | (590,557) | (1,005,806) | |
| Class R | (36,985) | (51,619) | |
| Class R6 | (9,861) | (19,793) | |
| Class S | (601,013) | (1,955,080) | |
| Institutional Class | (394,708) | (1,532,609) | |
| Total distributions | (2,560,507) | (6,703,557) | |
Fund share transactions: Proceeds from shares sold | 23,188,316 | 65,412,213 | |
| Reinvestment of distributions | 2,424,824 | 6,322,472 | |
| Payments for shares redeemed | (50,655,185) | (328,498,554) | |
| Net increase (decrease) in net assets from Fund share transactions | (25,042,045) | (256,763,869) | |
| Increase (decrease) in net assets | (17,724,226) | (300,282,788) | |
| Net assets at beginning of year | 229,616,034 | 529,898,822 | |
| Net assets at end of period (including undistributed net investment income of $1,621,066 and $2,462,042, respectively) | $ 211,891,808 | $ 229,616,034 |
The accompanying notes are an integral part of the financial statements.
Consolidated Financial Highlights
| Class A | Six Months Ended 9/30/16 (Unaudited) | Years Ended March 31, | |||||
| 2016 | 2015 | 2014 | 2013 | 2012 | |||
| Selected Per Share Data | |||||||
| Net asset value, beginning of period | $ 8.56 | $ 9.36 | $ 9.56 | $ 9.53 | $ 9.13 | $ 9.67 | |
Income (loss) from investment operations: Net investment incomea | .07 | .14 | .19 | .13 | .20 | .38 | |
| Net realized and unrealized gain (loss) | .33 | (.76) | (.11) | .03 | .40 | (.56) | |
| Total from investment operations | .40 | (.62) | .08 | .16 | .60 | (.18) | |
Less distributions from: Net investment income | (.11) | (.18) | (.28) | (.13) | (.20) | (.36) | |
| Net asset value, end of year | $ 8.85 | $ 8.56 | $ 9.36 | $ 9.56 | $ 9.53 | $ 9.13 | |
| Total Return (%)b,c,d | 4.65** | (6.63) | .76 | 1.68 | 6.57 | (1.77) | |
| Ratios to Average Net Assets and Supplemental Data | |||||||
| Net assets, end of period ($ millions) | 75 | 79 | 158 | 197 | 238 | 262 | |
| Ratio of expenses before expense reductions (%)e | 1.35* | .78 | .73 | .76 | .75 | .76 | |
| Ratio of expenses after expense reductions (%)e | 1.13* | .57 | .57 | .57 | .52 | .47 | |
| Ratio of net investment income (%) | 1.68* | 1.61 | 2.02 | 1.35 | 2.17 | 4.10 | |
| Portfolio turnover rate (%) | 150** | 51 | 39 | 41 | 30 | 32 | |
a Based on average shares outstanding during the period. b Total return does not reflect the effect of any sales charges. c Total return would have been lower had certain expenses not been reduced. d Total return would have been lower if the Advisor had not reduced some Underlying Deutsche Funds' expenses. e Prior to April 26, 2016, the Fund invested in other funds and indirectly bore its proportionate share of fees and expenses incurred by the Underlying Funds in which the Fund was invested. This ratio does not include these indirect fees and expenses. * Annualized ** Not annualized | |||||||
| Class C | Six Months Ended 9/30/16 (Unaudited) | Years Ended March 31, | |||||
| 2016 | 2015 | 2014 | 2013 | 2012 | |||
| Selected Per Share Data | |||||||
| Net asset value, beginning of period | $ 8.53 | $ 9.33 | $ 9.53 | $ 9.48 | $ 9.09 | $ 9.61 | |
Income (loss) from investment operations: Net investment income (loss)a | .04 | .07 | .12 | .06 | .13 | .31 | |
| Net realized and unrealized loss | .33 | (.76) | (.12) | .03 | .39 | (.56) | |
| Total from investment operations | .37 | (.69) | — | .09 | .52 | (.25) | |
Less distributions from: Net investment income | (.09) | (.11) | (.20) | (.04) | (.13) | (.27) | |
| Net asset value, end of year | $ 8.81 | $ 8.53 | $ 9.33 | $ 9.53 | $ 9.48 | $ 9.09 | |
| Total Return (%)b,c,d | 4.35** | (7.37) | (.01) | .94 | 5.78 | (2.53) | |
| Ratios to Average Net Assets and Supplemental Data | |||||||
| Net assets, end of period ($ millions) | 53 | 61 | 103 | 119 | 155 | 162 | |
| Ratio of expenses before expense reductions (%)e | 2.11* | 1.51 | 1.47 | 1.51 | 1.49 | 1.49 | |
| Ratio of expenses after expense reductions (%)e | 1.88* | 1.32 | 1.31 | 1.32 | 1.28 | 1.22 | |
| Ratio of net investment income (%) | .94* | .83 | 1.30 | .60 | 1.45 | 3.37 | |
| Portfolio turnover rate (%) | 150** | 51 | 39 | 41 | 30 | 32 | |
a Based on average shares outstanding during the period. b Total return does not reflect the effect of any sales charges. c Total return would have been lower had certain expenses not been reduced. d Total return would have been lower if the Advisor had not reduced some Underlying Deutsche Funds' expenses. e Prior to April 26, 2016, the Fund invested in other funds and indirectly bore its proportionate share of fees and expenses incurred by the Underlying Funds in which the Fund was invested. This ratio does not include these indirect fees and expenses. * Annualized ** Not annualized | |||||||
| Class R | Six Months Ended 9/30/16 (Unaudited) | Years Ended March 31, | Period Ended 3/31/12a | ||||
| 2016 | 2015 | 2014 | 2013 | ||||
| Selected Per Share Data | |||||||
| Net asset value, beginning of year | $ 8.62 | $ 9.42 | $ 9.62 | $ 9.59 | $ 9.17 | $ 9.65 | |
Income (loss) from investment operations: Net investment income (loss)b | .07 | .13 | .18 | .11 | .20 | .36 | |
| Net realized and unrealized loss | .31 | (.77) | (.12) | .02 | .39 | (.54) | |
| Total from investment operations | .38 | (.64) | .06 | .13 | .59 | (.18) | |
Less distributions from: Net investment income | (.10) | (.16) | (.26) | (.10) | (.17) | (.30) | |
| Net asset value, end of year | $ 8.90 | $ 8.62 | $ 9.42 | $ 9.62 | $ 9.59 | $ 9.17 | |
| Total Return (%)c,d | 4.46** | (6.77) | .55 | 1.52 | 6.39 | (1.77)** | |
| Ratios to Average Net Assets and Supplemental Data | |||||||
| Net assets, end of period ($ millions) | 3 | 3 | 3 | 3 | 2 | .001 | |
| Ratio of expenses before expense reductions (%)e | 1.74* | 1.16 | 1.13 | 1.13 | 1.07 | 3.62* | |
| Ratio of expenses after expense reductions (%)e | 1.38* | .77 | .77 | .77 | .76 | .72* | |
| Ratio of net investment income (%) | 1.50* | 1.47 | 1.83 | 1.15 | 2.17 | 4.73* | |
| Portfolio turnover rate (%) | 150** | 51 | 39 | 41 | 30 | 32f | |
a For the period from June 1, 2011 (commencement of operations) to March 31, 2012. b Based on average shares outstanding during the period. c Total return would have been lower had certain expenses not been reduced. d Total return would have been lower if the Advisor had not reduced some Underlying Deutsche Funds' expenses. e Prior to April 26, 2016, the Fund invested in other funds and indirectly bore its proportionate share of fees and expenses incurred by the Underlying Funds in which the Fund was invested. This ratio does not include these indirect fees and expenses. f Represents the Fund's portfolio turnover rate for the year ended March 31, 2012. * Annualized ** Not annualized | |||||||
| Class R6 | Six Months Ended 9/30/16 (Unaudited) | Year Ended 3/31/16 | Period Ended 3/31/15a | ||
| Selected Per Share Data | |||||
| Net asset value, beginning of period | $ 8.50 | $ 9.29 | $ 9.60 | ||
Income (loss) from investment operations: Net investment income (loss)b | .08 | .25 | .12 | ||
| Net realized and unrealized loss | .33 | (.83) | (.19) | ||
| Total from investment operations | .41 | (.58) | (.07) | ||
Less distributions from: Net investment income | (.11) | (.21) | (.24) | ||
| Net asset value, end of year | $ 8.80 | $ 8.50 | $ 9.29 | ||
| Total Return (%)c,d | 4.89** | (6.25) | (.71)** | ||
| Ratios to Average Net Assets and Supplemental Data | |||||
| Net assets, end of year ($ millions) | 1 | 1 | .01 | ||
| Ratio of expenses before expense reductions (%)e | 1.00* | .40 | .58* | ||
| Ratio of expenses after expense reductions (%)e | .82* | .22 | .21* | ||
| Ratio of net investment income (loss) (%) | 1.90* | 2.97 | 3.73* | ||
| Portfolio turnover rate (%) | 150** | 51 | 39f | ||
a For the period from November 28, 2014 (commencement of operations) to March 31, 2015. b Based on average shares outstanding during the period. c Total return would have been lower had certain expenses not been reduced. d Total return would have been lower if the Advisor had not reduced some Underlying Deutsche Funds' expenses. e Prior to April 26, 2016, the Fund invested in other funds and indirectly bore its proportionate share of fees and expenses incurred by the Underlying Funds in which the Fund was invested. This ratio does not include these indirect fees and expenses. f Represents the Fund's portfolio turnover rate for the year ended March 31, 2015. * Annualized ** Not annualized | |||||
| Class S | Six Months Ended 9/30/16 (Unaudited) | Years Ended March 31, | |||||
| 2016 | 2015 | 2014 | 2013 | 2012 | |||
| Selected Per Share Data | |||||||
| Net asset value, beginning of period | $ 8.50 | $ 9.29 | $ 9.49 | $ 9.47 | $ 9.07 | $ 9.61 | |
Income (loss) from investment operations: Net investment income (loss)a | .08 | .15 | .22 | .14 | .22 | .40 | |
| Net realized and unrealized loss | .32 | (.75) | (.13) | .02 | .40 | (.56) | |
| Total from investment operations | .40 | (.60) | .09 | .16 | .62 | (.16) | |
Less distributions from: Net investment income | (.11) | (.19) | (.29) | (.14) | (.22) | (.38) | |
| Net asset value, end of year | $ 8.79 | $ 8.50 | $ 9.29 | $ 9.49 | $ 9.47 | $ 9.07 | |
| Total Return (%)b,c | 4.71** | (6.44) | .92 | 1.88 | 6.74 | (1.49) | |
| Ratios to Average Net Assets and Supplemental Data | |||||||
| Net assets, end of period ($ millions) | 45 | 55 | 152 | 163 | 259 | 230 | |
| Ratio of expenses before expense reductions (%)d | 1.13* | .60 | .55 | .62 | .57 | .61 | |
| Ratio of expenses after expense reductions (%)d | .96* | .42 | .39 | .42 | .34 | .22 | |
| Ratio of net investment income (loss) (%) | 1.83* | 1.70 | 2.26 | 1.50 | 2.42 | 4.37 | |
| Portfolio turnover rate (%) | 150** | 51 | 39 | 41 | 30 | 32 | |
a Based on average shares outstanding during the period. b Total return would have been lower had certain expenses not been reduced. c Total return would have been lower if the Advisor had not reduced some Underlying Deutsche Funds' expenses. d Prior to April 26, 2016, the Fund invested in other funds and indirectly bore its proportionate share of fees and expenses incurred by the Underlying Funds in which the Fund was invested. This ratio does not include these indirect fees and expenses. * Annualized ** Not annualized | |||||||
| Institutional Class | Six Months Ended 9/30/16 (Unaudited) | Years Ended March 31, | |||||
| 2016 | 2015 | 2014 | 2013 | 2012 | |||
| Selected Per Share Data | |||||||
| Net asset value, beginning of period | $ 8.50 | $ 9.29 | $ 9.49 | $ 9.47 | $ 9.07 | $ 9.61 | |
Income (loss) from investment operations: Net investment income (loss)a | .09 | .16 | .23 | .17 | .24 | .41 | |
| Net realized and unrealized loss | .32 | (.74) | (.12) | .02 | .38 | (.57) | |
| Total from investment operations | .41 | (.58) | .11 | .19 | .62 | (.16) | |
Less distributions from: Net investment income | (.11) | (.21) | (.31) | (.17) | (.22) | (.38) | |
| Net asset value, end of year | $ 8.80 | $ 8.50 | $ 9.29 | $ 9.49 | $ 9.47 | $ 9.07 | |
| Total Return (%)b,c | 4.89** | (6.25) | 1.10 | 2.02 | 6.87 | (1.50) | |
| Ratios to Average Net Assets and Supplemental Data | |||||||
| Net assets, end of period ($ millions) | 35 | 31 | 114 | 102 | 44 | 42 | |
| Ratio of expenses before expense reductions (%)d | .97* | .48 | .45 | .43 | .45 | .45 | |
| Ratio of expenses after expense reductions (%)d | .80* | .21 | .21 | .21 | .22 | .22 | |
| Ratio of net investment income (loss) (%) | 2.07* | 1.83 | 2.45 | 1.84 | 2.56 | 4.45 | |
| Portfolio turnover rate (%) | 150** | 51 | 39 | 41 | 30 | 32 | |
a Based on average shares outstanding during the period. b Total return would have been lower had certain expenses not been reduced. c Total return would have been lower if the Advisor had not reduced some Underlying Deutsche Funds' expenses. d Prior to April 26, 2016, the Fund invested in other funds and indirectly bore its proportionate share of fees and expenses incurred by the Underlying Funds in which the Fund was invested. This ratio does not include these indirect fees and expenses. * Annualized ** Not annualized | |||||||
Notes to Consolidated Financial Statements (Unaudited)
A. Organization and Significant Accounting Policies
Deutsche Real Assets Fund (formerly Deutsche Alternative Asset Allocation Fund) (the "Fund") is a diversified series of Deutsche Market Trust (the "Trust"), which is registered under the Investment Company Act of 1940, as amended (the "1940 Act"), as an open-end management investment company organized as a Massachusetts business trust. Prior to April 26, 2016, the Fund invested in other affiliated Deutsche funds (i.e., mutual funds, exchange-traded funds and other pooled investment vehicles managed by Deutsche Investment Management Americas Inc. or one of its affiliates, together the "Underlying Deutsche Funds") and non-affiliated exchange-traded funds ("Non-affiliated ETFs"). Non-affiliated ETFs and Underlying Deutsche Funds are collectively referred to as "Underlying Funds." On April 26, 2016, the Fund's investment strategy and name changed, and the Fund was restructured from a fund-of-funds (i.e., a fund investing primarily in other Deutsche funds) to a direct investment fund (i.e., a fund investing directly in securities and other investments).
The Fund offers multiple classes of shares which provide investors with different purchase options. Class A shares are subject to an initial sales charge. Class C shares are not subject to an initial sales charge but are subject to higher ongoing expenses than Class A shares and a contingent deferred sales charge payable upon certain redemptions within one year of purchase. Class R and Class R6 shares are not subject to an initial or contingent deferred sales charge and are only available to participants in certain retirement plans. Class S shares are not subject to initial or contingent deferred sales charges and are only available to a limited group of investors. Institutional Class shares are not subject to initial or contingent deferred sales charges and are generally available only to qualified institutions.
Investment income, realized and unrealized gains and losses, and certain fund-level expenses and expense reductions, if any, are borne pro rata on the basis of relative net assets by the holders of all classes of shares, except that each class bears certain expenses unique to that class such as services to shareholders, distribution and service fees and certain other class-specific expenses. Differences in class-level expenses may result in payment of different per share dividends by class. All shares of the Fund have equal rights with respect to voting subject to class-specific arrangements.
The Fund's Consolidated financial statements are prepared in accordance with accounting principles generally accepted in the United States of America which require the use of management estimates. Actual results could differ from those estimates. The policies described below are followed consistently by the Fund in the preparation of its consolidated financial statements.
Principles of Consolidation. The Fund invests indirectly in commodities markets through a wholly owned subsidiary, Cayman Real Assets Fund, Ltd., organized under the laws of the Cayman Islands (the "Subsidiary"). Among other investments, the Subsidiary may invest in commodity-linked derivative instruments, such as swaps and futures. The Subsidiary may also invest in debt securities, some of which are intended to serve as margin or collateral for the Subsidiary's derivative positions. The Subsidiary may also invest available cash in affiliated money market funds. The Subsidiary is managed by the same portfolio managers that manage the Fund. As of September 30, 2016, the Fund's investment in the Subsidiary was $20,814,593, representing 9.82% of the Fund's net assets. The Fund's Investment Portfolio has been consolidated and includes the portfolio holdings of the Fund and the Subsidiary.
The consolidated financial statements include the accounts of the Fund and the Subsidiary. All inter-company transactions and balances have been eliminated.
Security Valuation. Investments are stated at value determined as of the close of regular trading on the New York Stock Exchange on each day the exchange is open for trading.
Various inputs are used in determining the value of the Fund's investments. These inputs are summarized in three broad levels. Level 1 includes quoted prices in active markets for identical securities. Level 2 includes other significant observable inputs (including quoted prices for similar securities, interest rates, prepayment speeds and credit risk). Level 3 includes significant unobservable inputs (including the Fund's own assumptions in determining the fair value of investments). The level assigned to the securities valuations may not be an indication of the risk or liquidity associated with investing in those securities.
Equity securities are valued at the most recent sale price or official closing price reported on the exchange (U.S. or foreign) or over-the-counter market on which they trade. Securities for which no sales are reported are valued at the calculated mean between the most recent bid and asked quotations on the relevant market or, if a mean cannot be determined, at the most recent bid quotation. Equity securities are generally categorized as Level 1. For certain international equity securities, in order to adjust for events which may occur between the close of the foreign exchanges and the close of the New York Stock Exchange, a fair valuation model may be used. This fair valuation model takes into account comparisons to the valuation of American Depository Receipts (ADRs), exchange-traded funds, futures contracts and certain indices and these securities are categorized as Level 2.
Debt securities are valued at prices supplied by independent pricing services approved by the Fund's Board. Such services may use various pricing techniques which take into account appropriate factors such as yield, quality, coupon rate, maturity, type of issue, trading characteristics, prepayment speeds and other data, as well as broker quotes. If the pricing services are unable to provide valuations, debt securities are valued at the average of the most recent reliable bid quotations or evaluated prices, as applicable, obtained from broker-dealers. These securities are generally categorized as Level 2
Investments in mutual funds are valued at the net asset value per share of each class of the mutual fund and are categorized as Level 1.
Futures contracts are generally valued at the settlement prices established each day on the exchange on which they are traded and are categorized as Level 1
Disclosure about the classification of fair value measurements is included in a table following the Fund's Consolidated Investment Portfolio.
Taxes. The Fund's policy is to comply with the requirements of the Internal Revenue Code, as amended, which are applicable to regulated investment companies, and to distribute all of its taxable income to its shareholders.
Additionally, the Fund may be subject to taxes imposed by the governments of countries in which it invests and are generally based on income and/or capital gains earned or repatriated. Estimated tax liabilities on certain foreign securities are recorded on an accrual basis and are reflected as components of interest income or net change in unrealized gain/loss on investments. Tax liabilities realized as a result of security sales are reflected as a component of net realized gain/loss on investments.
Income from certain commodity-linked derivatives does not constitute "qualifying income" to the Fund. Receipt of such income could cause the Fund to be subject to tax at the Fund level. The IRS has issued a private letter ruling to the Fund stating that such income earned through its wholly owned Subsidiary constitutes qualifying income. The Fund is required to increase its taxable income by its share of the Subsidiary's income, including net gains from commodity-linked transactions. Net investment losses of the Subsidiary cannot be deducted by the Fund in the current period nor carried forward to offset taxable income for future periods.
Under the Regulated Investment Company Modernization Act of 2010, net capital losses incurred post-enactment may be carried forward indefinitely, and their character is retained as short-term and/or long-term. Previously, net capital losses were carried forward for eight years and treated as short-term losses. As a transition rule, the Act requires that post-enactment net capital losses be used before pre-enactment net capital losses.
At March 31, 2016, the Fund had a net tax basis capital loss carryforward of approximately $108,250,000, including $36,529,000 of pre-enactment losses, which may be applied against any realized net taxable capital gains of each succeeding year until fully utilized or until March 31, 2017 ($1,048,000) and March 31, 2018 ($35,481,000), the respective expiration dates, whichever occurs first; and approximately $71,721,000 of post-enactment losses, which may be applied against realized net taxable capital gains indefinitely, including short-term losses ($14,560,000) and long-term losses ($57,161,000).
The Fund has reviewed the tax positions for the open tax years as of March 31, 2016 and has determined that no provision for income tax and/or uncertain tax provisions is required in the Fund's consolidated financial statements. The Fund's federal tax returns for the prior three fiscal years remain open subject to examination by the Internal Revenue Service.
Distribution of Income and Gains. Distributions from net investment income of the Fund, if any, are declared and distributed to shareholders annually. Net realized gains from investment transactions, in excess of available capital loss carryforwards, would be taxable to the Fund if not distributed, and, therefore, will be distributed to shareholders at least annually. The Fund may also make additional distributions for tax purposes if necessary.
The timing and characterization of certain income and capital gain distributions are determined annually in accordance with federal tax regulations which may differ from accounting principles generally accepted in the United States of America. These differences primarily relate to investments in futures contracts and certain securities sold at a loss. As a result, net investment income (loss) and net realized gain (loss) on investment transactions for a reporting period may differ significantly from distributions during such period. Accordingly, the Fund may periodically make reclassifications among certain of its capital accounts without impacting the net asset value of the Fund.
The tax character of current year distributions will be determined at the end of the current fiscal year.
Expenses. Expenses of the Trust arising in connection with a specific fund are allocated to that fund. Other Trust expenses which cannot be directly attributed to a fund are apportioned among the funds in the Trust based upon the relative net assets or other appropriate measures.
Contingencies. In the normal course of business, the Fund may enter into contracts with service providers that contain general indemnification clauses. The Fund's maximum exposure under these arrangements is unknown, as this would involve future claims that may be made against the Fund that have not yet been made. However, based on experience, the Fund expects the risk of loss to be remote.
Real Estate Investment Trusts. The Fund periodically recharacterizes distributions received from a Real Estate Investment Trust ("REIT") investment based on information provided by the REIT into the following categories: ordinary income, long-term and short-term capital gains, and return of capital. If information is not available timely from a REIT, the recharacterization will be estimated for financial reporting purposes and a recharacterization will be made in the following year when such information becomes available. Distributions received from REITs in excess of income are recorded as either a reduction of cost of investments or realized gains.
Other. Investment transactions are accounted for on a trade date plus one basis for daily net asset value calculations. However, for financial reporting purposes, investment transactions are reported on trade date. Interest income is recorded on the accrual basis. Distributions of income and capital gains from the Underlying Funds are recorded on the ex-dividend date. Realized gains and losses from investment transactions are recorded on an identified cost basis. Proceeds from litigation payments, if any, are included in net realized gain (loss) from investments.
B. Derivative Instruments
Futures Contracts. A futures contract is an agreement between a buyer or seller and an established futures exchange or its clearinghouse in which the buyer or seller agrees to take or make a delivery of a specific amount of a financial instrument at a specified price on a specific date (settlement date). For the six months ended September 30, 2016, the Fund entered into commodity futures contracts to gain exposure to the investment return of assets that trade in the commodity markets, without investing directly in physical commodities.
Upon entering into a futures contract, the Fund is required to deposit with a financial intermediary cash or securities ("initial margin") in an amount equal to a certain percentage of the face value indicated in the futures contract. Subsequent payments ("variation margin") are made or received by the Fund dependent upon the daily fluctuations in the value and are recorded for financial reporting purposes as unrealized gains or losses by the Fund. Gains or losses are realized when the contract expires or is closed. Since all futures contracts are exchange traded, counterparty risk is minimized as the exchange's clearinghouse acts as the counterparty, and guarantees the futures against default.
Certain risks may arise upon entering into futures contracts, including the risk that an illiquid market will limit the Fund's ability to close out a futures contract prior to the settlement date and the risk that the futures contract is not well correlated with the security, index or currency to which it relates. Risk of loss may exceed amounts disclosed in the Consolidated Statement of Assets and Liabilities.
A summary of the open futures contracts as of September 30, 2016 is included in a table following the Fund's Consolidated Investment Portfolio. For the six months ended September 30, 2016, the investment in futures contracts purchased had a total notional value generally indicative of a range from $0 to approximately $25,397,000.
The following tables summarize the value of the Fund's derivative instruments held as of September 30, 2016 and the related location in the accompanying Consolidated Statement of Assets and Liabilities, presented by primary underlying risk exposure:
| Asset Derivative | Futures Contracts |
| Commodity Contracts (a) | $ 483,116 |
The above derivative is located in the following Consolidated Statement of Assets and Liabilities account: (a) Includes cumulative appreciation of futures contracts as disclosed in the Consolidated Investment Portfolio. Unsettled variation margin is disclosed separately within the Consolidated Statement of Assets and Liabilities. | |
| Liability Derivative | Futures Contracts |
| Commodity Contracts (a) | $ (1,178,891) |
The above derivative is located in the following Consolidated Statement of Assets and Liabilities account: (a) Includes cumulative depreciation of futures contracts as disclosed in the Consolidated Investment Portfolio. Unsettled variation margin is disclosed separately within the Consolidated Statement of Assets and Liabilities. | |
| Realized Gain (Loss) | Futures Contracts |
| Commodity Contracts (a) | $ 490,242 |
The above derivative is located in the following Consolidated Statement of Operations account: (a) Net realized gain (loss) from futures | |
| Change in Net Unrealized Appreciation (Depreciation) | Futures Contracts |
| Commodity Contracts (a) | $ (695,775) |
The above derivative is located in the following Consolidated Statement of Operations account: (a) Change in net unrealized appreciation (depreciation) on futures | |
C. Purchases and Sales of Underlying Funds and Securities
During the six months ended September 30, 2016, purchases and sales of affiliated Underlying Funds (excluding short-term investments and money market funds) aggregated $0 and $218,449,821, respectively. Purchases and sales of non-affiliated ETFs (excluding short-term investments and money market funds) aggregated $0 and $4,670,226, respectively. Purchases and sales of investment securities (excluding short-term investments and money market funds) aggregated $291,336,589 and $113,219,813, respectively.
D. Related Parties
Management Agreement. Under the Investment Management Agreement with Deutsche Investment Management Americas Inc. ("DIMA" or the "Advisor"), an indirect, wholly owned subsidiary of Deutsche Bank AG, the Advisor directs the investments of the Fund in accordance with its investment objectives, policies and restrictions. The Advisor determines the securities, instruments and other contracts relating to investments in Underlying Funds to be purchased, sold or entered into by the Fund or delegates such responsibility to the Fund's sub-advisor.
Prior to April 26, 2016, the management fee payable under the Investment Management Agreement was equivalent to the annual rate (exclusive of any applicable waivers/reimbursements) of 0.20% of the Fund's average daily net assets, computed and accrued daily and payable monthly. In addition, the Advisor received management fees from managing the Underlying Deutsche Funds in which the Fund invested.
For the period from April 1, 2016 through April 25, 2016, the Advisor had contractually agreed to waive its fees and/or reimburse certain operating expenses of the Fund to the extent necessary to maintain the total annual operating expenses (excluding certain expenses such as extraordinary expenses, taxes, brokerage, interest and indirect expenses of Underlying Funds) of each class as follows:
| Class A | .80% |
| Class C | 1.55% |
| Class R | 1.05% |
| Class R6 | .55% |
| Class S | .65% |
| Institutional Class | .55% |
In addition, for the period from April 1, 2016 through April 25, 2016, the Advisor had voluntarily agreed to waive its fees and/or reimburse certain operating expenses of the Fund to the extent necessary to maintain the total annual operating expenses (excluding certain expenses such as extraordinary expenses, taxes, brokerage, interest and indirect expenses of Underlying Funds) of each class as follows:
| Class A | .57% |
| Class C | 1.32% |
| Class R | .77% |
| Class R6 | .21% |
| Class S | .42% |
| Institutional Class | .21% |
The Fund indirectly bears its proportionate share of fees and expenses incurred by the Underlying Funds in which it is invested.
Effective April 26, 2016, shareholders of the Fund approved a new Investment Management Agreement that reflects a change in the Fund’s management fee structure. Shareholders also approved a sub-advisory agreement (the "Sub-Advisory Agreement") with RREEF America L.L.C. ("RREEF"), an affiliate of DIMA. Under the Sub-Advisory Agreement, RREEF, under the supervision and oversight of DIMA, manages all of the securities and other assets of the Fund. DIMA, not the Fund, pays RREEF for sub-advisory services.
Effective April 26, 2016, under the new Investment Management Agreement with the Advisor, the Fund pays a monthly management fee based on the Fund's average daily net assets, computed and accrued daily and payable monthly, at the following annual rates:
| First $2 billion of the Fund’s daily net assets | .800% |
| Over $2 billion of such net assets | .775% |
Accordingly, for the period from April 26, 2016 through September 30, 2016, the fee pursuant to the Investment Management Agreement was equivalent to an annual rate (exclusive of any applicable waivers/reimbursements) of 0.80% of the Fund's average daily net assets.
Effective April 26, 2016 through September 30, 2017, the Advisor has contractually agreed to waive its fees and/or reimburse certain operating expenses of the Fund to the extent necessary to maintain the total annual operating expenses (excluding certain expenses such as extraordinary expenses, taxes, brokerage and interest expense) of each class as follows:
| Class A | 1.22% |
| Class C | 1.97% |
| Class R | 1.47% |
| Class R6 | .95% |
| Class S | 1.07% |
| Institutional Class | .95% |
For the six months ended September 30, 2016, fees waived and/or expenses reimbursed for each class are as follows:
| Class A | $ 86,045 |
| Class C | 67,885 |
| Class R | 5,660 |
| Class R6 | 786 |
| Class S | 41,509 |
| Institutional Class | 25,868 |
| $ 227,753 |
Administration Fee. Pursuant to an Administrative Services Agreement, DIMA provides most administrative services to the Fund. For all services provided under the Administrative Services Agreement, the Fund pays the Advisor an annual fee ("Administration Fee") of 0.10% of the Fund's average daily net assets, computed and accrued daily and payable monthly. For the six months ended September 30, 2016, the Administration Fee was $109,152, of which $17,163 is unpaid.
Service Provider Fees. Deutsche AM Service Company ("DSC"), an affiliate of the Advisor, is the transfer agent, dividend-paying agent and shareholder service agent of the Fund. Pursuant to a sub-transfer agency agreement between DSC and DST Systems, Inc. ("DST"), DSC has delegated certain transfer agent, dividend-paying agent and shareholder service agent functions to DST. DSC compensates DST out of the shareholder servicing fee it receives from the Fund. For the six months ended September 30, 2016, the amounts charged to the Fund by DSC were as follows:
| Services to Shareholders | Total Aggregated | Unpaid at September 30, 2016 |
| Class A | $ 8,089 | $ 4,921 |
| Class C | 1,351 | 845 |
| Class R | 409 | 248 |
| Class R6 | 39 | 36 |
| Class S | 2,298 | 1,391 |
| Institutional Class | 418 | 283 |
| $ 12,604 | $ 7,724 |
Distribution and Service Fees. Under the Fund's Class C and Class R 12b-1 Plans, Deutsche AM Distributors, Inc., ("DDI"), an affiliate of the Advisor, receives a fee ("Distribution Fee") of 0.75% of average daily net assets of C shares and 0.25% of average daily net assets of Class R shares. In accordance with the Fund's Underwriting and Distribution Services Agreement, DDI enters into related selling group agreements with various firms at various rates for sales of Class C and R shares. For the six months ended September 30, 2016, the Distribution Fee was as follows:
| Distribution Fee | Total Aggregated | Unpaid at September 30, 2016 |
| Class C | $ 213,712 | $ 32,840 |
| Class R | 3,871 | 631 |
| $ 217,583 | $ 33,471 |
In addition, DDI provides information and administrative services for a fee ("Service Fee") to Class A, Class C and Class R shareholders at an annual rate of up to 0.25% of average daily net assets for each such class. DDI in turn has various agreements with financial services firms that provide these services and pays these fees based upon the assets of shareholder accounts the firms service. For the six months ended September 30, 2016, the Service Fee was as follows:
| Service Fee | Total Aggregated | Unpaid at September 30, 2016 | Annualized Rate |
| Class A | $ 96,475 | $ 32,263 | .25% |
| Class C | 71,435 | 22,652 | .25% |
| Class R | 3,877 | 1,310 | .25% |
| $ 171,787 | $ 56,225 |
Underwriting Agreement and Contingent Deferred Sales Charge. DDI is the principal underwriter for the Fund. Underwriting commissions paid by shareholders in connection with the distribution of Class A shares for the six months ended September 30, 2016, aggregated $2,106.
In addition, DDI receives any contingent deferred sales charge ("CDSC") from Class C share redemptions occurring within one year of purchase. There is no such charge upon redemption of any share appreciation or reinvested dividends. The CDSC is 1% of the value of the shares redeemed for Class C. For the six months ended September 30, 2016, the CDSC for the Fund's Class C shares aggregated $486. A deferred sales charge of up to 0.75% is assessed on certain redemptions of Class A shares. For the six months ended September 30, 2016, DDI received $1,650 for Class A shares.
Typesetting and Filing Service Fees. Under an agreement with DIMA, DIMA is compensated for providing typesetting and certain regulatory filing services to the Fund. For the six months ended September 30, 2016, the amount charged to the Fund by DIMA included in the Consolidated Statement of Operations under "Reports to shareholders" aggregated $10,980, of which $10,444 is unpaid.
Trustees' Fees and Expenses. The Fund paid retainer fees to each Trustee not affiliated with the Advisor, plus specified amounts to the Board Chairperson and Vice Chairperson and to each committee Chairperson.
Affiliated Cash Management Vehicles. The Fund may invest uninvested cash balances in Deutsche Central Cash Management Government Fund and Deutsche Variable NAV Money Fund, affiliated money market funds which are managed by the Advisor. Each affiliated money market fund is managed in accordance with Rule 2a-7 under the 1940 Act, which governs the quality, maturity, diversity and liquidity of instruments in which a money market fund may invest. Deutsche Central Cash Management Government Fund seeks to maintain a stable net asset value, and Deutsche Variable NAV Money Fund maintains a floating net asset value. The Fund indirectly bears its proportionate share of the expenses of each affiliated money market fund in which it invests. Deutsche Central Cash Management Government Fund does not pay the Advisor an investment management fee. To the extent that Deutsche Variable NAV Money Fund pays an investment management fee to the Advisor, the Advisor will waive an amount of the investment management fee payable to the Advisor by the Fund equal to the amount of the investment management fee payable on the Fund's assets invested in Deutsche Variable NAV Money Fund.
E. Share Transactions
The following table summarizes share and dollar activity in the Fund:
| Six Months Ended September 30, 2016 | Year Ended March 31, 2016 | |||
| Shares | Dollars | Shares | Dollars | |
| Shares sold | ||||
| Class A | 1,001,309 | $ 8,836,062 | 1,604,788 | $ 14,035,627 |
| Class C | 106,132 | 929,761 | 385,969 | 3,433,001 |
| Class R | 64,721 | 570,464 | 183,036 | 1,597,920 |
| Class R6 | 6,189 | 53,987 | 153,839 | 1,299,882 |
| Class S | 429,959 | 3,751,564 | 2,605,776 | 22,993,653 |
| Institutional Class | 1,035,562 | 9,046,478 | 2,531,979 | 22,052,130 |
| $ 23,188,316 | $ 65,412,213 | |||
| Shares issued to shareholders in reinvestment of distributions | ||||
| Class A | 103,273 | $ 907,766 | 241,833 | $ 2,081,548 |
| Class C | 62,359 | 546,264 | 106,904 | 917,983 |
| Class R | 4,184 | 36,985 | 6,022 | 51,619 |
| Class R6 | 1,131 | 9,861 | 1,733 | 14,198 |
| Class S | 62,903 | 548,514 | 208,804 | 1,798,760 |
| Institutional Class | 43,054 | 375,434 | 168,773 | 1,458,364 |
| $ 2,424,824 | $ 6,322,472 | |||
| Shares redeemed | ||||
| Class A | (1,848,184) | $ (16,210,598) | (9,481,919) | $ (82,229,717) |
| Class C | (1,338,873) | (11,693,483) | (4,350,413) | (37,498,817) |
| Class R | (65,061) | (575,515) | (128,552) | (1,116,513) |
| Class R6 | (53,326) | (459,488) | (22,593) | (185,454) |
| Class S | (1,796,598) | (15,577,530) | (12,769,144) | (110,086,947) |
| Institutional Class | (704,779) | (6,138,571) | (11,388,099) | (97,381,106) |
| $ (50,655,185) | $ (328,498,554) | |||
| Net increase (decrease) | ||||
| Class A | (743,602) | $ (6,466,770) | (7,635,298) | $ (66,112,542) |
| Class C | (1,170,382) | (10,217,458) | (3,857,540) | (33,147,833) |
| Class R | 3,844 | 31,934 | 60,506 | 533,026 |
| Class R6 | (46,006) | (395,640) | 132,979 | 1,128,626 |
| Class S | (1,303,736) | (11,277,452) | (9,954,564) | (85,294,534) |
| Institutional Class | 373,837 | 3,283,341 | (8,687,347) | (73,870,612) |
| $ (25,042,045) | $ (256,763,869) | |||
F. Transactions with Affiliates
Prior to April 26, 2016, the Fund invested in Underlying Deutsche Funds and Non-affiliated ETFs. The Underlying Deutsche Funds in which the Fund invested are considered to be affiliated investments. A summary of the Fund's transactions with affiliated Underlying Deutsche Funds during the six months ended September 30, 2016 is as follows:
| Affiliate | Value ($) at 3/31/2016 | Purchases Cost ($) | Sales Proceeds ($) | Realized Gain/ (Loss) ($) | Income Distributions ($) | Capital Gain Distributions ($) | Value ($) at 9/30/2016 |
| Deutsche Enhanced Commodity Strategy Fund | 23,513,336 | — | 24,669,729 | (3,414,996) | — | — | — |
| Deutsche Floating Rate Fund | 35,516,088 | — | 35,901,202 | (1,768,375) | — | — | — |
| Deutsche Global Inflation Fund | 71,630,603 | — | 71,558,613 | 1,415,388 | — | — | — |
| Deutsche Global Infrastructure Fund | 57,210,989 | — | 58,245,946 | 20,438,745 | — | — | — |
| Deutsche Global Real Estate Securities Fund | 13,410,020 | — | 13,498,340 | 7,786,938 | — | — | — |
| Deutsche Real Estate Securities Fund | 12,541,658 | — | 12,463,167 | (27,455) | — | — | — |
| Deutsche Real Estate Securities Income Fund | 2,106,262 | — | 2,112,824 | (169,034) | — | — | — |
| Deutsche Central Cash Management Government Fund | 8,716,121 | 312,530,960 | 291,425,989 | — | 62,619 | — | 29,821,092 |
| Total | 224,645,077 | 312,530,960 | 509,875,810 | 24,261,211 | 62,619 | — | 29,821,092 |
Information About Your Fund's Expenses
As an investor of the Fund, you incur two types of costs: ongoing expenses and transaction costs. Ongoing expenses include management fees, distribution and service (12b-1) fees and other Fund expenses. Examples of transaction costs include sales charges (loads) and account maintenance fees, which are not shown in this section. The following table is intended to help you understand your ongoing expenses (in dollars) of investing in the Fund and to help you compare these expenses with the ongoing expenses of investing in other mutual funds. In addition to the ongoing expenses which the Fund bears directly. Prior to April 26, 2016, the Fund's shareholders indirectly bore the expense of the Underlying Funds in which the Fund invested. These expenses are not included in the Fund's annualized expense ratios used to calculate the expense estimate in the table. In the most recent six-month period, the Fund limited the ongoing expenses the Fund bears directly; had it not done so, expenses would have been higher. The examples in the table are based on an investment of $1,000 invested at the beginning of the six-month period and held for the entire period (April 1, 2016 to September 30, 2016).
The tables illustrate your Fund's expenses in two ways:
— Actual Fund Return. This helps you estimate the actual dollar amount of ongoing expenses (but not transaction costs) paid on a $1,000 investment in the Fund using the Fund's actual return during the period. To estimate the expenses you paid over the period, simply divide your account value by $1,000 (for example, an $8,600 account value divided by $1,000 = 8.6), then multiply the result by the number in the "Expenses Paid per $1,000" line under the share class you hold.
— Hypothetical 5% Fund Return. This helps you to compare your Fund's ongoing expenses (but not transaction costs) with those of other mutual funds using the Fund's actual expense ratio and a hypothetical rate of return of 5% per year before expenses. Examples using a 5% hypothetical fund return may be found in the shareholder reports of other mutual funds. The hypothetical account values and expenses may not be used to estimate the actual ending account balance or expenses you paid for the period.
Please note that the expenses shown in these tables are meant to highlight your ongoing expenses only and do not reflect any transaction costs. The "Expenses Paid per $1,000" line of the tables is useful in comparing ongoing expenses only and will not help you determine the relative total expense of owning different funds. Subject to certain exceptions, an account maintenance fee of $20.00 assessed once per calendar year for Classes A, C and S shares may apply for accounts with balances less than $10,000. This fee is not included in these tables. If it was, the estimate of expenses paid for Classes A, C and S shares during the period would be higher, and account value during the period would be lower, by this amount.
| Expenses and Value of a $1,000 Investment for the six months ended September 30, 2016 (Unaudited) | ||||||
| Actual Fund Return | Class A | Class C | Class R | Class R6 | Class S | Institutional Class |
| Beginning Account Value 4/1/16 | $ 1,000.00 | $ 1,000.00 | $ 1,000.00 | $ 1,000.00 | $ 1,000.00 | $ 1,000.00 |
| Ending Account Value 9/30/16 | $ 1,046.50 | $ 1,043.50 | $ 1,044.60 | $1,048.90 | $ 1,047.10 | $ 1,048.90 |
| Expenses Paid per $1,000* | $ 5.80 | $ 9.63 | $ 7.07 | $ 4.21 | $ 4.93 | $ 4.11 |
| Hypothetical 5% Fund Return | Class A | Class C | Class R | Class R6 | Class S | Institutional Class |
| Beginning Account Value 4/1/16 | $ 1,000.00 | $ 1,000.00 | $ 1,000.00 | $ 1,000.00 | $ 1,000.00 | $ 1,000.00 |
| Ending Account Value 9/30/16 | $ 1,019.40 | $ 1,015.64 | $ 1,018.15 | $ 1,020.96 | $ 1,020.26 | $ 1,021.06 |
| Expenses Paid per $1,000* | $ 5.72 | $ 9.50 | $ 6.98 | $ 4.15 | $ 4.86 | $ 4.05 |
* Expenses are equal to the Fund's annualized expense ratio for each share class, multiplied by the average account value over the period, multiplied by 183 (the number of days in the most recent six-month period), then divided by 366.
| Annualized Expense Ratios** | Class A | Class C | Class R | Class R6 | Class S | Institutional Class |
| Deutsche Real Assets Fund | 1.13% | 1.88% | 1.38% | .82% | .96% | .80% |
** Prior to April 26, 2016, the Fund invested in other funds and indirectly bore its proportionate share of fees and expenses incurred by the Underlying Funds in which the Fund was invested. These ratios do not include these indirect fees and expenses.
For more information, please refer to the Fund's prospectus.
For an analysis of the fees associated with an investment in the Fund or similar funds, please refer to http://apps.finra.org/fundanalyzer/1/fa.aspx.
Advisory Agreement Board Considerations and Fee Evaluation
The Board of Trustees (hereinafter referred to as the "Board" or "Trustees") approved the renewal of Deutsche Real Assets Fund’s (the "Fund") investment management agreement (the "Agreement") with Deutsche Investment Management Americas Inc. ("DIMA") in September 2016.
In terms of the process that the Board followed prior to approving the Agreement, shareholders should know that:
— During the entire process, all of the Fund’s Trustees were independent of DIMA and its affiliates (the "Independent Trustees").
— The Board met frequently during the past year to discuss fund matters and dedicated a substantial amount of time to contract review matters. Over the course of several months, the Board’s Contract Committee reviewed extensive materials received from DIMA, independent third parties and independent counsel. These materials included an analysis of the Fund’s performance, fees and expenses, and profitability from a fee consultant retained by the Fund’s Independent Trustees (the "Fee Consultant"). The Board also received extensive information throughout the year regarding performance of the Fund.
— The Independent Trustees regularly meet privately with counsel to discuss contract review and other matters. In addition, the Independent Trustees were advised by the Fee Consultant in the course of their review of the Fund’s contractual arrangements and considered a comprehensive report prepared by the Fee Consultant in connection with their deliberations.
— In connection with reviewing the Agreement, the Board also reviewed the terms of the Fund’s Rule 12b-1 plan, distribution agreement, administrative services agreement, transfer agency agreement and other material service agreements.
— Based on its evaluation of the information provided, the Contract Committee presented its findings and recommendations to the Board. The Board then reviewed the Contract Committee’s findings and recommendations.
In connection with the contract review process, the Contract Committee and the Board considered the factors discussed below, among others. The Board also considered that DIMA has managed the Fund since its inception, and the Board believes that a long-term relationship with a capable, conscientious advisor is in the best interests of the Fund. The Board considered, generally, that shareholders chose to invest or remain invested in the Fund knowing that DIMA managed the Fund and that the Agreement was approved by the Fund’s shareholders. DIMA is part of Deutsche Bank AG’s ("Deutsche Bank") Asset Management ("Deutsche AM") division. Deutsche AM is a global asset management business that offers a wide range of investing expertise and resources, including research capabilities in many countries throughout the world. Deutsche Bank has advised the Board that the U.S. asset management business continues to be a critical and integral part of Deutsche Bank, and that Deutsche Bank will continue to invest in Deutsche AM and seek to enhance Deutsche AM’s investment platform. Deutsche Bank also has confirmed its commitment to maintaining strong legal and compliance groups within the Deutsche AM division.
As part of the contract review process, the Board carefully considered the fees and expenses of each Deutsche fund overseen by the Board in light of the fund’s performance. In many cases, this led to the negotiation and implementation of expense caps. As part of these negotiations, the Board indicated that it would consider relaxing these caps in future years following sustained improvements in performance, among other considerations.
While shareholders may focus primarily on fund performance and fees, the Fund’s Board considers these and many other factors, including the quality and integrity of DIMA’s personnel and such other issues as back-office operations, fund valuations, and compliance policies and procedures.
Nature, Quality and Extent of Services. The Board considered the terms of the Agreement, including the scope of advisory services provided under the Agreement. The Board noted that, under the Agreement, DIMA provides portfolio management services to the Fund and that, pursuant to a separate administrative services agreement, DIMA provides administrative services to the Fund. The Board considered the experience and skills of senior management and investment personnel and the resources made available to such personnel. The Board reviewed the Fund’s performance over short-term and long-term periods and compared those returns to various agreed-upon performance measures, including market index(es) and a peer universe compiled using information supplied by Morningstar Direct ("Morningstar"), an independent fund data service. The Board also noted that it has put into place a process of identifying "Focus Funds" (e.g., funds performing poorly relative to a peer universe), and receives additional reporting from DIMA regarding such funds and, where appropriate, DIMA’s plans to address underperformance. The Board believes this process is an effective manner of identifying and addressing underperforming funds. Based on the information provided, the Board noted that for the one-, three- and five-year periods ended December 31, 2015, the Fund’s performance (Class A shares) was in the 4th quartile of the applicable Morningstar universe (the 1st quartile being the best performers and the 4th quartile being the worst performers). The Board also observed that the Fund has underperformed its benchmark in the one-, three- and five-year periods ended December 31, 2015. The Board noted the disappointing investment performance of the Fund in recent periods and continued to discuss with senior management of DIMA the factors contributing to such underperformance and actions being taken to improve performance. The Board considered that, in an effort to improve the investment process and potential returns of the Fund, DIMA recommended, and the Board approved, changes to the Fund’s investment objective and principal investment strategy to restructure the Fund from a fund-of-funds with a focus on alternative (or non-traditional) investment strategies into a direct investment fund with a focus on investments offering exposure to "real assets." The Board noted that, in connection with these changes, RREEF America L.L.C., an affiliate of DIMA, was appointed as the Fund’s sub-adviser and that, in April 2016, shareholders of the Fund approved a new investment management agreement between the Fund and DIMA and a sub-advisory agreement between DIMA and RREEF America L.L.C. The changes to the Fund took effect in April 2016. The Board observed that the Fund had experienced improved relative performance during the first seven months of 2016. The Board recognized the efforts by DIMA in recent years to enhance its investment platform and improve long-term performance across the Deutsche fund complex.
Fees and Expenses. The Board considered the Fund’s investment management fee schedule, operating expenses and total expense ratios, and comparative information provided by Broadridge Financial Solutions. ("Broadridge") and the Fee Consultant regarding investment management fee rates paid to other investment advisors by similar funds (1st quartile being the most favorable and 4th quartile being the least favorable). With respect to management fees paid to other investment advisors by similar funds, the Board noted that the contractual fee rates paid by the Fund, which include a 0.10% fee paid to DIMA under the Fund’s administrative services agreement, were higher than the median (3rd quartile) of the applicable Broadridge peer group (based on Broadridge data provided as of December 31, 2015). The Board noted that the Fund’s Class A shares total (net) operating expenses (excluding 12b-1 fees) were expected to be lower than the median (2nd quartile) of the applicable Broadridge expense universe (based on Broadridge data provided as of December 31, 2015, and analyzing Broadridge expense universe Class A (net) expenses less any applicable 12b-1 fees) ("Broadridge Universe Expenses"). The Board also reviewed data comparing each share class’s total (net) operating expenses to the applicable Broadridge Universe Expenses. The Board noted that the expense limitations agreed to by DIMA were expected to help the Fund’s total (net) operating expenses remain competitive. The Board considered the Fund’s management fee rate as compared to fees charged by DIMA to comparable Deutsche U.S. registered funds ("Deutsche Funds") and considered differences between the Fund and the comparable Deutsche Funds. The information requested by the Board as part of its review of fees and expenses also included information about institutional accounts (including any sub-advised funds and accounts) and funds offered primarily to European investors ("Deutsche Europe funds") managed by Deutsche AM. The Board noted that DIMA indicated that Deutsche AM does not manage any institutional accounts or Deutsche Europe funds comparable to the Fund.
On the basis of the information provided, the Board concluded that management fees were reasonable and appropriate in light of the nature, quality and extent of services provided by DIMA.
Profitability. The Board reviewed detailed information regarding revenues received by DIMA from advising the Deutsche Funds along with the estimated costs and pre-tax profits realized by DIMA from advising the Deutsche Funds. The Board also received information regarding the estimated enterprise-wide profitability of DIMA and its affiliates with respect to all fund services in totality. The Board did not receive profitability information with respect to the Fund because it was structured as a fund-of-funds during all of 2015, but did receive such information with respect to the funds in which the Fund previously invested. The Board also reviewed certain publicly available information regarding the profitability of certain similar investment management firms. The Board noted that while information regarding the profitability of such firms is limited (and in some cases is not necessarily prepared on a comparable basis), DIMA and its affiliates’ overall profitability with respect to the Deutsche Funds (after taking into account distribution and other services provided to the funds by DIMA and its affiliates) was lower than the overall profitability levels of most comparable firms for which such data was available.
Economies of Scale. The Board considered whether there are economies of scale with respect to the management of the Fund and whether the Fund benefits from any economies of scale. The Board noted that the Fund’s investment management fee schedule includes fee breakpoints. The Board concluded that the Fund’s fee schedule represents an appropriate sharing between the Fund and DIMA of such economies of scale as may exist in the management of the Fund at current asset levels.
Other Benefits to DIMA and Its Affiliates. The Board also considered the character and amount of other incidental benefits received by DIMA and its affiliates, including any fees received by DIMA for administrative services provided to the Fund and any fees received by an affiliate of DIMA for distribution services. The Board also considered benefits to DIMA related to brokerage and soft-dollar allocations, including allocating brokerage to pay for research generated by parties other than the executing broker dealers, which pertain primarily to funds investing in equity securities, along with the incidental public relations benefits to DIMA related to Deutsche Funds advertising and cross-selling opportunities among DIMA products and services. The Board considered these benefits in reaching its conclusion that the Fund’s management fees were reasonable.
Compliance. The Board considered the significant attention and resources dedicated by DIMA to documenting and enhancing its compliance processes in recent years. The Board noted in particular (i) the experience, seniority and time commitment of the individuals serving as DIMA’s and the Fund’s chief compliance officers; (ii) the large number of DIMA compliance personnel; and (iii) the substantial commitment of resources by DIMA and its affiliates to compliance matters.
Based on all of the information considered and the conclusions reached, the Board unanimously determined that the continuation of the Agreement is in the best interests of the Fund. In making this determination, the Board did not give particular weight to any single factor identified above. The Board considered these factors over the course of numerous meetings, certain of which were in executive session with only the Independent Trustees and counsel present. It is possible that individual Independent Trustees may have weighed these factors differently in reaching their individual decisions to approve the continuation of the Agreement.
Account Management Resources
| For More Information | The automated telephone system allows you to access personalized account information and obtain information on other Deutsche funds using either your voice or your telephone keypad. Certain account types within Classes A, C and S also have the ability to purchase, exchange or redeem shares using this system. For more information, contact your financial advisor. You may also access our automated telephone system or speak with a Shareholder Service representative by calling: (800) 728-3337 |
| Web Site | deutschefunds.com View your account transactions and balances, trade shares, monitor your asset allocation, subscribe to fund and account updates by e-mail, and change your address, 24 hours a day. Obtain prospectuses and applications, blank forms, interactive worksheets, news about Deutsche funds, retirement planning information, and more. |
| Written Correspondence | Deutsche Asset Management PO Box 219151 |
| Proxy Voting | The fund's policies and procedures for voting proxies for portfolio securities and information about how the fund voted proxies related to its portfolio securities during the 12-month period ended June 30 are available on our Web site — deutschefunds.com (click on "proxy voting"at the bottom of the page) — or on the SEC's Web site — sec.gov. To obtain a written copy of the fund's policies and procedures without charge, upon request, call us toll free at (800) 728-3337. |
| Portfolio Holdings | Following the fund's fiscal first and third quarter-end, a complete portfolio holdings listing is filed with the SEC on Form N-Q. This form will be available on the SEC's Web site at sec.gov, and it also may be reviewed and copied at the SEC's Public Reference Room in Washington, D.C. Information on the operation of the SEC's Public Reference Room may be obtained by calling (800) SEC-0330. The fund's portfolio holdings are also posted on deutschefunds.com from time to time. Please see the fund's current prospectus for more information. |
| Principal Underwriter | If you have questions, comments or complaints, contact: Deutsche AM Distributors, Inc. 222 South Riverside Plaza (800) 621-1148 |
| Investment Management | Deutsche Investment Management Americas Inc. ("DIMA" or the "Advisor"), which is part of Deutsche Asset Management, is the investment advisor for the fund. DIMA and its predecessors have more than 80 years of experience managing mutual funds and DIMA provides a full range of investment advisory services to both institutional and retail clients. DIMA is an indirect, wholly owned subsidiary of Deutsche Bank AG. Deutsche Bank AG is a major global banking institution engaged in a wide variety of financial services, including investment management, retail, private and commercial banking, investment banking and insurance. Deutsche Asset Management is the retail brand name in the U.S. for the asset management activities of Deutsche Bank AG and DIMA. Deutsche Asset Management is committed to delivering the investing expertise, insight and resources of this global investment platform to American investors. |
| Class A | Class C | Class S | Institutional Class | |
| Nasdaq Symbol | AAAAX | AAAPX | AAASX | AAAZX |
| CUSIP Number | 25159K 879 | 25159K 887 | 25159K 804 | 25159K 705 |
| Fund Number | 487 | 787 | 2087 | 1487 |
| For shareholders of Class R and R6 | |
| Automated Information Line | Deutsche AM Flex Plan Access (800) 728-3337 24-hour access to your retirement plan account. |
| Web Site | deutschefunds.com Click "Retirement Plans" to reallocate assets, process transactions, review your funds, and subscribe to fund updates by e-mail through our secure online account access. Obtain prospectuses and applications, blank forms, interactive worksheets, news about Deutsche funds, retirement planning information, and more. |
| For More Information | (800) 728-3337 To speak with a service representative. |
| Written Correspondence | Deutsche AM Service Company 222 South Riverside Plaza |
| Class R | Class R6 | |
| Nasdaq Symbol | AAAQX | AAAVX |
| CUSIP Number | 25159K 200 | 25159K 713 |
| Fund Number | 1587 | 1687 |
Privacy Statement
| FACTS | What Does Deutsche Asset Management Do With Your Personal Information? | ||
| Why? | Financial companies choose how they share your personal information. Federal law gives consumers the right to limit some but not all sharing. Federal law also requires us to tell you how we collect, share and protect your personal information. Please read this notice carefully to understand what we do. | ||
| What? | The types of personal information we collect and share can include: — Social Security number — Account balances — Purchase and transaction history — Bank account information — Contact information such as mailing address, e-mail address and telephone number | ||
| How? | All financial companies need to share customers' personal information to run their everyday business. In the section below, we list the reasons financial companies can share their customers' personal information, the reasons Deutsche Asset Management chooses to share and whether you can limit this sharing. | ||
| Reasons we can share your personal information | Does Deutsche Asset Management share? | Can you limit this sharing? | |
| For our everyday business purposes — such as to process your transactions, maintain your account(s), respond to court orders or legal investigations | Yes | No | |
| For our marketing purposes — to offer our products and services to you | Yes | No | |
| For joint marketing with other financial companies | No | We do not share | |
| For our affiliates' everyday business purposes — information about your transactions and experiences | No | We do not share | |
| For our affiliates' everyday business purposes — information about your creditworthiness | No | We do not share | |
| For non-affiliates to market to you | No | We do not share | |
| Questions? | Call (800) 728-3337 or e-mail us at service@db.com | ||
| Who we are | |
| Who is providing this notice? | Deutsche AM Distributors, Inc; Deutsche Investment Management Americas Inc.; Deutsche AM Investor Services, Inc.; Deutsche AM Trust Company; the Deutsche Funds |
| What we do | |
| How does Deutsche Asset Management protect my personal information? | To protect your personal information from unauthorized access and use, we use security measures that comply with federal law. These measures include computer safeguards and secured files and buildings. |
| How does Deutsche Asset Management collect my personal information? | We collect your personal information, for example, when you: — open an account — give us your contact information — provide bank account information for ACH or wire transactions — tell us where to send money — seek advice about your investments |
| Why can't I limit all sharing? | Federal law gives you the right to limit only — sharing for affiliates' everyday business purposes — information about your creditworthiness — affiliates from using your information to market to you — sharing for non-affiliates to market to you State laws and individual companies may give you additional rights to limit sharing. |
| Definitions | |
| Affiliates | Companies related by common ownership or control. They can be financial or non-financial companies. Our affiliates include financial companies with the DWS or Deutsche Bank ("DB") name, such as DB AG Frankfurt. |
| Non-affiliates | Companies not related by common ownership or control. They can be financial and non-financial companies. Non-affiliates we share with include account service providers, service quality monitoring services, mailing service providers and verification services to help in the fight against money laundering and fraud. |
| Joint marketing | A formal agreement between non-affiliated financial companies that together market financial products or services to you. Deutsche Asset Management does not jointly market. |
| Rev. 09/2016 | |
Notes
Notes
Notes
Notes

| ITEM 2. | CODE OF ETHICS | |
| Not applicable. | ||
| ITEM 3. | AUDIT COMMITTEE FINANCIAL EXPERT | |
| Not applicable | ||
| ITEM 4. | PRINCIPAL ACCOUNTANT FEES AND SERVICES | |
| Not applicable | ||
| ITEM 5. | AUDIT COMMITTEE OF LISTED REGISTRANTS | |
| Not applicable | ||
| ITEM 6. | SCHEDULE OF INVESTMENTS | |
| Not applicable | ||
| ITEM 7. | DISCLOSURE OF PROXY VOTING POLICIES AND PROCEDURES FOR CLOSED-END MANAGEMENT INVESTMENT COMPANIES | |
| Not applicable | ||
| ITEM 8. | PORTFOLIO MANAGERS OF CLOSED-END MANAGEMENT INVESTMENT COMPANIES | |
| Not applicable | ||
| ITEM 9. | PURCHASES OF EQUITY SECURITIES BY CLOSED-END MANAGEMENT INVESTMENT COMPANY AND AFFILIATED PURCHASERS | |
| Not applicable | ||
| ITEM 10. | SUBMISSION OF MATTERS TO A VOTE OF SECURITY HOLDERS | |
| There were no material changes to the procedures by which shareholders may recommend nominees to the Fund’s Board. The primary function of the Nominating and Governance Committee is to identify and recommend individuals for membership on the Board and oversee the administration of the Board Governance Guidelines. Shareholders may recommend candidates for Board positions by forwarding their correspondence by U.S. mail or courier service to Kenneth C. Froewiss, Independent Chairman, Deutsche Mutual Funds, P.O. Box 390601, Cambridge, MA 02139. | ||
| ITEM 11. | CONTROLS AND PROCEDURES | |
| (a) | The Chief Executive and Financial Officers concluded that the Registrant’s Disclosure Controls and Procedures are effective based on the evaluation of the Disclosure Controls and Procedures as of a date within 90 days of the filing date of this report. | |
| (b) | There have been no changes in the registrant’s internal control over financial reporting that occurred during the second fiscal quarter of the period covered by this report that has materially affected, or is reasonably likely to materially affect, the registrant’s internal controls over financial reporting. | |
ITEM 12. | EXHIBITS | |
| (a)(1) | Not applicable | |
| (a)(2) | Certification pursuant to Rule 30a-2(a) under the Investment Company Act of 1940 (17 CFR 270.30a-2(a)) is filed and attached hereto as Exhibit 99.CERT. | |
| (b) | Certification pursuant to Rule 30a-2(b) under the Investment Company Act of 1940 (17 CFR 270.30a-2(b)) is furnished and attached hereto as Exhibit 99.906CERT. | |
SIGNATURES
Pursuant to the requirements of the Securities Exchange Act of 1934 and the Investment Company Act of 1940, the registrant has duly caused this report to be signed on its behalf by the undersigned, thereunto duly authorized.
| Registrant: | Deutsche Real Assets Fund, a series of Deutsche Market Trust |
| By: | /s/Brian E. Binder Brian E. Binder President |
| Date: | November 29, 2016 |
Pursuant to the requirements of the Securities Exchange Act of 1934 and the Investment Company Act of 1940, this report has been signed below by the following persons on behalf of the registrant and in the capacities and on the dates indicated.
| By: | /s/Brian E. Binder Brian E. Binder President |
| Date: | November 29, 2016 |
| By: | /s/Paul Schubert Paul Schubert Chief Financial Officer and Treasurer |
| Date: | November 29, 2016 |