UNITED STATES
SECURITIES AND EXCHANGE COMMISSION
WASHINGTON, D. C. 20549
FORM N-CSRS
Investment Company Act file number: 811-01236
Deutsche Market Trust
(Exact Name of Registrant as Specified in Charter)
345 Park Avenue
New York, NY 10154-0004
(Address of Principal Executive Offices) (Zip Code)
Registrant’s Telephone Number, including Area Code: (212) 250-3220
Paul Schubert
60 Wall Street
New York, NY 10005
(Name and Address of Agent for Service)
| Date of fiscal year end: | 8/31 |
| Date of reporting period: | 2/29/2016 |
| ITEM 1. | REPORT TO STOCKHOLDERS |

February 29, 2016
Semiannual Report
to Shareholders
Deutsche Diversified Market Neutral Fund

Contents
3 Letter to Shareholders 5 Performance Summary 8 Portfolio Management Team 11 Portfolio Summary 15 Investment Portfolio 31 Statement of Assets and Liabilities 33 Statement of Operations 35 Statement of Changes in Net Assets 36 Financial Highlights 40 Notes to Financial Statements 53 Information About Your Fund's Expenses 55 Advisory Agreement Board Considerations and Fee Evaluation 60 Account Management Resources 62 Privacy Statement |
This report must be preceded or accompanied by a prospectus. To obtain a summary prospectus, if available, or prospectus for any of our funds, refer to the Account Management Resources information provided in the back of this booklet. We advise you to consider the fund's objectives, risks, charges and expenses carefully before investing. The summary prospectus and prospectus contain this and other important information about the fund. Please read the prospectus carefully before you invest.
Bond investments are subject to interest-rate, credit, liquidity and market risks to varying degrees. When interest rates rise, bond prices generally fall. Credit risk refers to the ability of an issuer to make timely payments of principal and interest. Investing in derivatives entails special risks relating to liquidity, leverage and credit that may reduce returns and/or increase volatility. Emerging markets tend to be more volatile than the markets of more mature economies, and generally have less diverse and less mature economic structures and less stable political systems than those of developed countries. Investing in foreign securities presents certain risks, such as currency fluctuations, political and economic changes, and market risks. While market neutral funds may outperform the market during periods of severe downturn, they may also underperform the market during periods of market rallies. Investment strategies employed by the fund’s investment management teams are intended to be complementary, but may not be. The interplay of the various strategies may result in the fund holding a significant amount of certain types of securities and could increase the fund’s portfolio turnover rates which may result in higher transactional costs and/or capital gains or losses. Some money managers will have a greater degree of correlation with each other and with the market than others. The degree of correlation will vary as a result of market conditions and other factors. The fund may lend securities to approved institutions. Short sales — which involve selling borrowed securities in anticipation of a price decline, then returning an equal number of the securities at some point in the future — could magnify losses and increase volatility. Small company stocks tend to be more volatile than medium-sized or large company stocks. Stocks may decline in value. See the prospectus for details.
Deutsche Asset Management represents the asset management activities conducted by Deutsche Bank AG or any of its subsidiaries.
NOT FDIC/NCUA INSURED NO BANK GUARANTEE MAY LOSE VALUE NOT A DEPOSIT NOT INSURED BY ANY FEDERAL GOVERNMENT AGENCY
Letter to Shareholders
Dear Shareholder:
The global economy appears to be on track for continued, albeit modest, growth over the next year, with the U.S. leading Europe and Japan. Here at home, employment growth continues, although the pace has slowed in recent months. Housing data is positive and household finances are benefitting from lower levels of debt and debt service, gains in real income and lower energy prices.
Growth overseas, particularly in emerging economies, is a lingering concern. The stronger dollar and sluggish growth abroad have had a negative impact on U.S. exporters and manufacturers, and lower global energy prices have taken a toll on the domestic energy sector. Nevertheless, our economists see sufficient reason to expect the U.S. economy overall to maintain its moderate expansionary path.
For months, the most persistent question has been when the Federal Reserve Board (the Fed) would begin to tighten its monetary policy. That question was answered on December 16, when the Fed bumped short-term rates up by 0.25%. Based on financial data and guidance from the Fed itself, analysts agree that the tightening process is likely to be "low and slow."
As always, we encourage you to visit deutschefunds.com for timely information and insights about economic developments and your Deutsche fund investment. With frequent updates from our CIO Office and economists, we want to ensure that you are equipped to make informed decisions.
Thank you for your continued investment. We appreciate the opportunity to serve your investment needs.
Best regards,

 |
Brian Binder President, Deutsche Funds |
Assumptions, estimates and opinions contained in this document constitute our judgment as of the date of the document and are subject to change without notice. Any projections are based on a number of assumptions as to market conditions and there can be no guarantee that any projected results will be achieved. Past performance is not a guarantee of future results.
Performance Summary February 29, 2016 (Unaudited)
| Class A | 6-Month‡ | 1-Year | 5-Year | Life of Fund* |
| Average Annual Total Returns as of 2/29/16 | ||||
| Unadjusted for Sales Charge | –3.92% | –3.23% | –0.36% | –0.09% |
| Adjusted for the Maximum Sales Charge (max 5.75% load) | –9.44% | –8.79% | –1.53% | –0.72% |
| Citigroup 3-Month T-Bill Index† | 0.05% | 0.06% | 0.05% | 0.84% |
| Average Annual Total Returns as of 12/31/15 (most recent calendar quarter end) | ||||
| Unadjusted for Sales Charge | –0.24% | 0.17% | 0.28% | |
| Adjusted for the Maximum Sales Charge (max 5.75% load) | –5.97% | –1.01% | –3.29% | |
| Citigroup 3-Month T-Bill Index† | 0.03% | 0.05% | 0.85% | |
| Class C | 6-Month‡ | 1-Year | 5-Year | Life of Fund* |
| Average Annual Total Returns as of 2/29/16 | ||||
| Unadjusted for Sales Charge | –4.31% | –3.94% | –1.11% | –0.86% |
| Adjusted for the Maximum Sales Charge (max 1.00% CDSC) | –5.27% | –3.94% | –1.11% | –0.86% |
| Citigroup 3-Month T-Bill Index† | 0.05% | 0.06% | 0.05% | 0.84% |
| Average Annual Total Returns as of 12/31/15 (most recent calendar quarter end) | ||||
| Unadjusted for Sales Charge | –1.01% | –0.56% | –0.48% | |
| Adjusted for the Maximum Sales Charge (max 1.00% CDSC) | –1.01% | –0.56% | –4.33% | |
| Citigroup 3-Month T-Bill Index† | 0.03% | 0.05% | 0.85% | |
| Class S | 6-Month‡ | 1-Year | 5-Year | Life of Fund* |
| Average Annual Total Returns as of 2/29/16 | ||||
| No Sales Charges | –3.87% | –3.07% | –0.20% | 0.08% |
| Citigroup 3-Month T-Bill Index† | 0.05% | 0.06% | 0.05% | 0.84% |
| Average Annual Total Returns as of 12/31/15 (most recent calendar quarter end) | ||||
| No Sales Charges | 0.00% | 0.35% | 0.46% | |
| Citigroup 3-Month T-Bill Index† | 0.03% | 0.05% | 0.85% | |
| Institutional Class | 6-Month‡ | 1-Year | 5-Year | Life of Fund* |
| Average Annual Total Returns as of 2/29/16 | ||||
| No Sales Charges | –3.94% | –3.04% | –0.07% | 0.19% |
| Citigroup 3-Month T-Bill Index† | 0.05% | 0.06% | 0.05% | 0.84% |
| Average Annual Total Returns as of 12/31/15 (most recent calendar quarter end) | ||||
| No Sales Charges | 0.00% | 0.47% | 0.57% | |
| Citigroup 3-Month T-Bill Index† | 0.03% | 0.05% | 0.85% | |
Performance in the Average Annual Total Returns table above and the Growth of an Assumed $10,000 Investment line graph that follows is historical and does not guarantee future results. Investment return and principal fluctuate so your shares may be worth more or less when redeemed. Current performance may differ from performance data shown. Please visit deutschefunds.com for the Fund's most recent month-end performance. Fund performance includes reinvestment of all distributions. Unadjusted returns do not reflect sales charges and would have been lower if they had.
The gross expense ratios of the Fund, as stated in the fee table of the prospectus dated December 1, 2015 are 3.78%, 4.53%, 3.61% and 3.41% for Class A, Class C, Class S and Institutional Class shares, respectively, and may differ from the expense ratios disclosed in the Financial Highlights tables in this report.
Index returns do not reflect any fees or expenses and it is not possible to invest directly into an index.
Performance figures do not reflect the deduction of taxes that a shareholder would pay on fund distributions or the redemption of fund shares.
| Growth of an Assumed $10,000 Investment (Adjusted for Maximum Sales Charge) |
■ Deutsche Diversified Market Neutral Fund — Class A ■ Citigroup 3-Month T-Bill Index† |
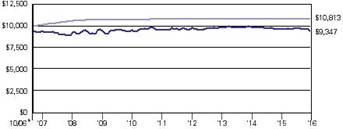 |
| Yearly periods ended February 29 |
The Fund's growth of an assumed $10,000 investment is adjusted for the maximum sales charge of 5.75%. This results in a net initial investment of $9,425.
The growth of $10,000 is cumulative.
Performance of other share classes will vary based on the sales charges and the fee structure of those classes.
* The Fund commenced operations on October 16, 2006. The performance shown for the index is for the time period of October 31, 2006 through February 29, 2016 (through December 31, 2015 for the most recent calendar quarter end returns), which is based on the performance period of the life of the Fund.
† Citigroup 3-Month T-Bill Index is an unmanaged index representative of the 3-month Treasury market.
‡ Total returns shown for periods less than one year are not annualized.
| Class A | Class C | Class S | Institutional Class | |
| Net Asset Value | ||||
| 2/29/16 | $ 8.09 | $ 7.55 | $ 8.20 | $ 8.28 |
| 8/31/15 | $ 8.42 | $ 7.89 | $ 8.53 | $ 8.62 |
Portfolio Management Team
Effective September 16, 2015, the fund's portfolio management team is as follows:
Deutsche Investment Management Americas Inc.
Mihir Meswani, Director, DIMA
Portfolio Manager of the fund. Began managing the fund in 2014.
— Joined Deutsche Asset Management in 2014 with 21 years of industry experience in asset allocation and portfolio management of multi-asset class portfolios.
— Previously, he worked at Mount Yale Capital Group where he was a portfolio manager for the group’s alternative mutual funds. Prior to that, he was Chief Investment Strategist at Sandalwood Securities, where he was a member of the Investment Committee with direct responsibility for the portfolio management of Sandalwood’s fund of hedge funds and alternative mutual fund portfolio.
— Previously, he held a position as Director of Public Investments for the Robert Wood Johnson Foundation where he managed assets across equity and fixed income, hedge funds, credit and real assets. He also worked for Bank of America and JP Morgan in similar roles.
— BS in Finance and a BA in Economics, Rutgers University.
Owen Fitzpatrick, CFA, Managing Director, DIMA
Portfolio Manager of a sleeve of the fund. Began managing the fund in 2013.
— Joined Deutsche Asset Management in 1995.
— Prior to his current role as Head of US Equity, he was Managing Director of Deutsche Bank Private Wealth Management, head of US Equity Strategy, manager of the US large cap core, value and growth portfolios, member of the US Investment Committee and head of the Equity Strategy Group.
— Previous experience includes over 21 years of experience in trust and investment management. Prior to joining Deutsche Bank, he managed an equity income fund, trust and advisory relationships for Princeton Bank & Trust Company, where he was also responsible for research coverage of the consumer cyclical sector. Previously he served as a portfolio manager at Manufacturer's Hanover Trust Company.
— BA and MBA, Fordham University.
Pankaj Bhatnagar, PhD, Managing Director, DIMA
Portfolio Manager of a sleeve of the fund. Began managing the fund in 2013.
— Joined Deutsche Asset Management in 2000 with seven years of industry experience; previously, served in Quantitative Strategy roles at Nomura Securities, Credit Suisse and Salomon Brothers.
— Portfolio Manager for the Quantitative Group: New York.
— Degree in Civil Engineering, Indian Institute of Technology; MBA, Kent State University; PhD in Finance, University of North Carolina at Chapel Hill.
Subadvisor
GAM International Management Limited
Andy Kastner, CFA, Portfolio Manager at GAM International Management Limited.
Lead Portfolio Manager of a sleeve of the fund. Began managing the fund in 2014.
— Joined GAM in July 2008.
— Lead manager of the Absolute Return European Equity strategy.
— Previously he worked as a fund manager at Credit Suisse for seven years. Prior to that, he was an analyst and portfolio manager at Bank Vontobel. He started his career at UBS in different functions in investment research and asset management.
— Master in Banking and Finance, University of Zurich; holder of the CAIA diploma.
Oliver Maslowski. Portfolio Manager at GAM International Management Limited
Portfolio Manager of a sleeve of the fund. Began managing the fund in 2014.
— Joined GAM in January 2006.
— Portfolio manager for European equities.
— Previously he was an analyst at Julius Baer Private Banking Investment Research. Before joining Julius Baer he was an equity analyst for Bank Vontobel.
— Master in Business Administration, Ludwig Maximilian University of Munich; Certified International Investment Analyst (CIIA).
Guido Marveggio. Portfolio Manager at GAM International Management Limited
Portfolio Manager of a sleeve of the fund. Began managing the fund in 2014.
— Joined GAM in May 1997.
— Portfolio manager and specialized in European equities.
— He previously spent several years at Credit Suisse and the then Swiss Volksbank. He worked for several years at Wiremas, Zurich, and at the then Handelsbank Nat West (now Coutts & Co.).
— Completed a commercial apprenticeship.
Désirée Mueller. Portfolio Manager at GAM International Management Limited
Portfolio Manager of a sleeve of the fund. Began managing the fund in 2014.
— Joined GAM in October 2011.
— She is a portfolio manager in the Equities Europe team.
— Prior to joining Swiss & Global she was a Junior Portfolio Manager for Credit Suisse. Previously, she worked in Credit Suisse Private Banking group.
— Master’s degree in Banking and Finance, University of St. Gallen.
Laurence Kubli. Portfolio Manager at GAM International Management Limited
Portfolio Manager of a sleeve of the fund. Began managing the fund in 2014.
— Joined GAM in October 2007.
— Portfolio manager focused on fixed income securities.
— Between 2006 and 2007 she was a portfolio manager at Clariden Leu. Between 1999 and 2006 she worked for Man Group (previously RMF Investment Management and Swiss Life Hedge Fund Partners). She started her career in 1992 at Credit Suisse and worked in the fixed income unit of Merrill Lynch Capital Markets from 1996 until 1999.
— Master, University of St. Gallen.
Matthias Wildhaber. Portfolio Manager at GAM International Management Limited
Portfolio Manager of a sleeve of the fund. Began managing the fund in 2014.
— Joined GAM in August 2000.
— Portfolio manager focused on fixed income securities.
— Previously, he spent several years at Julius Baer Investment Funds Services Ltd. His previous experience includes a wide range of activities in the areas of performance controlling and third-party fund analysis.
— Bachelor of Arts in Business Administration, University of Applied Sciences, Baden; Certified International Investment Analyst (CIIA).
Portfolio Summary (Unaudited)
| Ten Largest Long Equity Holdings at February 29, 2016 (13.8% of Net Assets) | |
1. Recordati SpA Manufactures pharmaceuticals | 1.6% |
2. Wal-Mart Stores, Inc. Operator of discount stores and super centers | 1.5% |
3. Imperial Brands PLC Manufacturer of tobacco products | 1.4% |
4. Koninklijke Ahold NV Operates retail stores in the United States and Europe | 1.4% |
5. Texas Instruments, Inc. Provider of semiconductors and electronic equipment | 1.4% |
6. United Internet AG Offers Internet access services | 1.3% |
7. Kroger Co. Operates supermarkets and convenience stores | 1.3% |
8. Enel SpA Generates, transmits and trades electricity | 1.3% |
9. Nokia Oyj Multinational communications and information technology company | 1.3% |
10. TUI AG Offers tourism and logistic services, and manufactures building materials | 1.3% |
| Ten Largest Short Equity Holdings at February 29, 2016 (13.2% of Net Assets) | |
1. NorthStar Asset Management Group, Inc. Offers a broad range of investment advisory services | 1.4% |
2. Essilor International SA Manufactures and sells plastic and glass ophthalmic lenses | 1.4% |
3. Legg Mason, Inc. Provider of investment management services | 1.3% |
4. Marvell Technology Group Ltd. Designer, developer and marketer of integrated circuits | 1.3% |
5. American Capital Ltd. Global asset management company | 1.3% |
6. Advanced Drainage Systems, Inc. Manfactures water drainage structures and supplies | 1.3% |
7. Maxim Integrated Products, Inc. Designs, develops, manufactures and markets a broad range of linear and mixed-signal integrated circuits | 1.3% |
8. Koninklijke Vopak NV Independent tank terminal operator | 1.3% |
9. Whole Foods Market, Inc. Owns and operates a chain of natural food supermarkets | 1.3% |
10. Eaton Vance Corp. Creates, markets and manages mutual funds | 1.3% |
Portfolio holdings and characteristics are subject to change. For more complete details about the fund's investment portfolio, see page 15. A quarterly Fact Sheet is available on deutschefunds.com or upon request. Please see the Account Management Resources section on page 60 for contact information. | |
Investment Portfolio as of February 29, 2016 (Unaudited)
| Shares | Value ($) | |
| Long Positions 149.8% | ||
| Common Stocks 87.9% | ||
| Consumer Discretionary 10.1% | ||
| Auto Components 1.7% | ||
| Autoliv, Inc. (SDR) (a) | 11,000 | 1,178,572 |
| Valeo SA | 3,000 | 417,360 |
| 1,595,932 | ||
| Hotels, Restaurants & Leisure 1.3% | ||
| TUI AG | 80,000 | 1,199,681 |
| Internet & Catalog Retail 0.6% | ||
| 1-800-Flowers.com, Inc. "A"* | 65,800 | 513,898 |
| Media 2.4% | ||
| Cablevision Systems Corp. (New York Group) "A" (b) | 19,646 | 639,084 |
| ITV PLC | 200,000 | 690,061 |
| Omnicom Group, Inc. (a) | 11,839 | 921,193 |
| 2,250,338 | ||
| Specialty Retail 2.1% | ||
| Best Buy Co., Inc. (a) | 11,014 | 356,743 |
| Outerwall, Inc. (a) | 18,750 | 584,813 |
| WH Smith PLC | 40,000 | 1,004,369 |
| 1,945,925 | ||
| Textiles, Apparel & Luxury Goods 2.0% | ||
| adidas AG | 8,000 | 856,285 |
| Pandora AS | 8,000 | 1,011,641 |
| 1,867,926 | ||
| Consumer Staples 12.7% | ||
| Beverages 3.0% | ||
| Coca-Cola Enterprises, Inc. (b) | 23,700 | 1,149,687 |
| PepsiCo, Inc. (b) | 7,450 | 728,759 |
| SABMiller PLC | 15,000 | 873,206 |
| 2,751,652 | ||
| Food & Staples Retailing 4.3% | ||
| Koninklijke Ahold NV | 60,000 | 1,317,851 |
| Kroger Co. (b) | 30,550 | 1,219,250 |
| Wal-Mart Stores, Inc. (a) | 21,200 | 1,406,408 |
| 3,943,509 | ||
| Food Products 1.7% | ||
| Marine Harvest ASA* | 50,000 | 715,633 |
| Omega Protein Corp.* (a) | 38,000 | 902,500 |
| 1,618,133 | ||
| Household Products 1.5% | ||
| Energizer Holdings, Inc. | 13,000 | 506,220 |
| Svenska Cellulosa AB SCA "B" | 30,000 | 898,444 |
| 1,404,664 | ||
| Personal Products 0.8% | ||
| Herbalife Ltd.* (b) | 13,000 | 711,750 |
| Tobacco 1.4% | ||
| Imperial Brands PLC | 25,541 | 1,319,191 |
| Energy 3.8% | ||
| Energy Equipment & Services 0.6% | ||
| Oil States International, Inc.* | 11,500 | 300,265 |
| Weatherford International PLC* (a) | 41,350 | 264,640 |
| 564,905 | ||
| Oil, Gas & Consumable Fuels 3.2% | ||
| Antero Resources Corp.* (a) | 42,400 | 968,840 |
| CONSOL Energy, Inc. (a) | 32,354 | 279,215 |
| Marathon Petroleum Corp. | 4,906 | 168,031 |
| Memorial Resource Development Corp.* (a) | 100,500 | 971,835 |
| Oasis Petroleum, Inc.* | 78,250 | 421,767 |
| SM Energy Co. (a) | 13,200 | 119,328 |
| 2,929,016 | ||
| Financials 16.1% | ||
| Banks 3.4% | ||
| Barclays PLC | 330,000 | 783,994 |
| CIT Group, Inc. (a) | 11,000 | 327,910 |
| Credit Agricole SA | 90,000 | 937,555 |
| Talmer Bancorp., Inc. "A" (b) | 56,150 | 943,320 |
| Wells Fargo & Co. | 3,776 | 177,170 |
| 3,169,949 | ||
| Capital Markets 5.2% | ||
| Affiliated Managers Group, Inc.* | 4,650 | 644,909 |
| Ameriprise Financial, Inc. | 8,500 | 713,575 |
| BlackRock, Inc. (b) | 3,300 | 1,029,468 |
| LPL Financial Holdings, Inc. (a) | 20,000 | 404,600 |
| SEI Investments Co. | 15,000 | 572,550 |
| TD Ameritrade Holding Corp. (a) | 21,000 | 600,180 |
| Waddell & Reed Financial, Inc. "A" (a) | 35,300 | 826,726 |
| 4,792,008 | ||
| Consumer Finance 0.3% | ||
| Santander Consumer U.S.A. Holdings, Inc.* (a) | 31,950 | 327,488 |
| Diversified Financial Services 0.5% | ||
| CME Group, Inc. | 5,100 | 466,344 |
| Insurance 3.6% | ||
| Allstate Corp. | 9,241 | 586,434 |
| Arch Capital Group Ltd.* | 3,000 | 203,820 |
| Everest Re Group Ltd. | 3,250 | 604,922 |
| Maiden Holdings Ltd. (a) | 24,100 | 288,477 |
| Prudential Financial, Inc. | 3,762 | 248,631 |
| The Travelers Companies, Inc. | 5,300 | 569,856 |
| Universal Insurance Holdings, Inc. (a) | 25,300 | 493,856 |
| Willis Towers Watson PLC | 2,686 | 304,377 |
| 3,300,373 | ||
| Real Estate Investment Trusts 2.6% | ||
| Cousins Properties, Inc. (REIT) (b) | 69,850 | 604,901 |
| New Senior Investment Group, Inc. (REIT) (a) | 88,000 | 852,720 |
| Ramco-Gershenson Properties Trust (REIT) (a) | 34,000 | 571,200 |
| SL Green Realty Corp. (REIT) (a) | 4,000 | 352,720 |
| 2,381,541 | ||
| Real Estate Management & Development 0.5% | ||
| CBRE Group, Inc. "A"* | 19,232 | 488,685 |
| Health Care 10.3% | ||
| Biotechnology 2.4% | ||
| AbbVie, Inc. | 2,600 | 141,986 |
| Alnylam Pharmaceuticals, Inc.* (a) | 3,725 | 218,173 |
| Emergent BioSolutions, Inc.* (a) (b) | 31,088 | 1,051,707 |
| Gilead Sciences, Inc. | 2,000 | 174,500 |
| Infinity Pharmaceuticals, Inc.* (a) (b) | 110,300 | 637,534 |
| 2,223,900 | ||
| Health Care Equipment & Supplies 2.8% | ||
| Boston Scientific Corp.* (b) | 65,800 | 1,117,284 |
| C.R. Bard, Inc. | 1,300 | 250,094 |
| Sonova Holding AG (Registered) | 8,000 | 962,243 |
| Stryker Corp. | 2,500 | 249,700 |
| 2,579,321 | ||
| Health Care Providers & Services 0.8% | ||
| Fresenius SE & Co. KGaA | 11,000 | 727,491 |
| Health Care Technology 0.8% | ||
| IMS Health Holdings, Inc.* (a) | 29,500 | 760,510 |
| Pharmaceuticals 3.5% | ||
| Hikma Pharmaceuticals PLC | 20,000 | 523,000 |
| Novartis AG (Registered) | 4,500 | 321,994 |
| Recordati SpA | 60,000 | 1,451,819 |
| Roche Holding AG (ADR) (a) | 6,244 | 200,120 |
| Sanofi | 10,000 | 794,723 |
| 3,291,656 | ||
| Industrials 8.9% | ||
| Aerospace & Defense 1.7% | ||
| Safran SA | 18,000 | 1,123,379 |
| Triumph Group, Inc. (a) | 15,000 | 456,900 |
| 1,580,279 | ||
| Airlines 0.7% | ||
| easyJet PLC | 30,000 | 627,360 |
| Building Products 0.6% | ||
| Builders FirstSource, Inc.* | 37,250 | 295,393 |
| Owens Corning | 5,000 | 214,600 |
| 509,993 | ||
| Commercial Services & Supplies 0.9% | ||
| Intrum Justitia AB | 18,000 | 551,438 |
| Stericycle, Inc.* (a) | 2,700 | 307,611 |
| 859,049 | ||
| Industrial Conglomerates 0.7% | ||
| Danaher Corp. | 7,471 | 666,936 |
| Machinery 1.7% | ||
| Briggs & Stratton Corp. | 16,250 | 345,637 |
| Cargotec Oyj "B" (a) | 12,300 | 383,825 |
| Caterpillar, Inc. (a) | 5,500 | 372,350 |
| Duerr AG | 8,000 | 476,790 |
| 1,578,602 | ||
| Professional Services 1.6% | ||
| Teleperformance | 15,000 | 1,161,694 |
| Verisk Analytics, Inc.* (a) | 3,783 | 275,554 |
| 1,437,248 | ||
| Road & Rail 1.0% | ||
| CSX Corp. | 7,958 | 192,106 |
| Norfolk Southern Corp. | 3,415 | 249,875 |
| Union Pacific Corp. | 6,624 | 522,369 |
| 964,350 | ||
| Information Technology 16.2% | ||
| Communications Equipment 2.2% | ||
| ARRIS International PLC* (a) | 25,000 | 597,250 |
| Cisco Systems, Inc. | 7,500 | 196,350 |
| Nokia Oyj | 198,000 | 1,203,624 |
| 1,997,224 | ||
| Electronic Equipment, Instruments & Components 2.1% | ||
| Flextronics International Ltd.* (b) | 96,000 | 1,042,560 |
| Ingenico Group SA | 9,000 | 912,227 |
| 1,954,787 | ||
| Internet Software & Services 2.1% | ||
| Rightmove PLC | 14,000 | 766,272 |
| United Internet AG (Registered) | 25,000 | 1,227,083 |
| 1,993,355 | ||
| IT Services 2.0% | ||
| Atos SE | 11,000 | 804,773 |
| PayPal Holdings, Inc.* | 4,400 | 167,816 |
| Wirecard AG | 22,000 | 875,072 |
| 1,847,661 | ||
| Semiconductors & Semiconductor Equipment 6.1% | ||
| Analog Devices, Inc. (b) | 18,800 | 996,212 |
| Cree, Inc.* (a) | 9,500 | 301,530 |
| Dialog Semiconductor PLC* | 28,000 | 927,439 |
| Lam Research Corp. (b) | 13,250 | 971,225 |
| Teradyne, Inc. | 10,350 | 197,478 |
| Texas Instruments, Inc. (a) | 23,500 | 1,245,970 |
| Xilinx, Inc. (b) | 21,050 | 993,981 |
| 5,633,835 | ||
| Software 1.1% | ||
| Microsoft Corp. | 9,000 | 457,920 |
| Playtech PLC | 35,500 | 417,810 |
| Rovi Corp.* | 6,500 | 148,070 |
| 1,023,800 | ||
| Technology Hardware, Storage & Peripherals 0.6% | ||
| Apple, Inc. | 5,350 | 517,291 |
| Materials 2.2% | ||
| Chemicals 0.8% | ||
| Innospec, Inc. | 5,500 | 238,700 |
| K+S AG (Registered) (a) | 22,500 | 475,666 |
| 714,366 | ||
| Construction Materials 0.4% | ||
| HeidelbergCement AG | 5,000 | 367,395 |
| Metals & Mining 1.0% | ||
| Steel Dynamics, Inc. (b) | 50,450 | 917,685 |
| Telecommunication Services 1.7% | ||
| Diversified Telecommunication Services 0.5% | ||
| Iliad SA | 2,000 | 491,776 |
| Wireless Telecommunication Services 1.2% | ||
| Freenet AG | 35,000 | 1,046,941 |
| Utilities 5.9% | ||
| Electric Utilities 4.1% | ||
| Duke Energy Corp. | 2,500 | 185,700 |
| Enel SpA | 300,000 | 1,208,880 |
| Iberdrola SA | 163,200 | 1,057,382 |
| Red Electrica Corporacion SA | 12,000 | 954,490 |
| WEC Energy Group, Inc. | 6,089 | 343,116 |
| 3,749,568 | ||
| Independent Power & Renewable Eletricity Producers 0.6% | ||
| Talen Energy Corp.* (a) | 93,000 | 591,480 |
| Multi-Utilities 1.2% | ||
| CMS Energy Corp. (a) | 11,650 | 460,874 |
| Engie | 40,000 | 621,912 |
| 1,082,786 | ||
| Total Common Stocks (Cost $87,719,036) | 81,279,553 | |
| Preferred Stock 1.1% | ||
| Consumer Staples | ||
| Household Products 1.1% | ||
| Henkel AG & Co. KGaA (Cost $1,144,843) | 10,000 | 1,009,192 |
| Closed-End Investment Company 0.8% | ||
| BB Biotech AG (Registered) (Cost $729,245) | 3,000 | 695,751 |
| Principal Amount ($) | Value ($) | |
| Corporate Bonds 9.8% | ||
| Financials | ||
| Bank of Montreal, 144A, 1.95%, 1/30/2017 | 1,000,000 | 1,007,815 |
| Bank of Nova Scotia, REG S, 2.15%, 8/3/2016 | 1,000,000 | 1,004,571 |
| Credit Suisse AG, 144A, 2.6%, 5/27/2016 (a) | 1,000,000 | 1,003,919 |
| DNB Boligkreditt AS, 144A, 2.9%, 3/29/2016 | 1,000,000 | 1,000,900 |
| Nordea Eiendomskreditt AS, REG S, 2.125%, 9/22/2016 | 1,000,000 | 1,005,761 |
| Royal Bank of Canada, 1.125%, 7/22/2016 | 1,000,000 | 1,001,030 |
| Toronto-Dominion Bank, 144A, 1.625%, 9/14/2016 | 1,000,000 | 1,003,738 |
| UBS AG, 144A, 0.75%, 3/24/2016 | 1,000,000 | 999,565 |
| Westpac Banking Corp., 144A, 2.45%, 11/28/2016 | 1,000,000 | 1,010,130 |
| Total Corporate Bonds (Cost $9,039,569) | 9,037,429 | |
| Government & Agency Obligations 6.5% | ||
| Other Government Related 2.2% | ||
| KFW, 0.682%***, 12/29/2017 | 2,000,000 | 1,999,230 |
| Sovereign Bonds 4.3% | ||
| Canada Government International Bond, 0.875%, 2/14/2017 | 2,000,000 | 2,002,340 |
| Kingdom of Sweden, REG S, 0.625%, 9/19/2016 | 2,000,000 | 1,998,722 |
| 4,001,062 | ||
| Total Government & Agency Obligations (Cost $6,003,510) | 6,000,292 | |
| Short-Term U.S. Treasury Obligations 23.7% | |||
| U.S. Treasury Bills: | |||
| 0.349%**, 6/30/2016 (b) | 3,000,000 | 2,996,619 | |
| 0.518%**, 2/2/2017 | 4,000,000 | 3,977,660 | |
| 0.223%**, 3/3/2016 (b) | 5,000,000 | 4,999,960 | |
| 0.022%**, 3/24/2016 (b) | 5,000,000 | 4,999,255 | |
| 0.425%**, 10/13/2016 (b) | 5,000,000 | 4,987,540 | |
| Total Short-Term U.S. Treasury Obligations (Cost $21,963,560) | 21,961,034 | ||
Shares | Value ($) | ||
| Securities Lending Collateral 18.5% | |||
| Daily Assets Fund "Capital Shares", 0.42% (c) (d) (Cost $17,140,151) | 17,140,151 | 17,140,151 | |
| Cash Equivalents 1.5% | |||
| Central Cash Management Fund, 0.33% (c) (Cost $1,389,551) | 1,389,551 | 1,389,551 | |
| % of Net Assets | Value ($) | |
| Total Long Positions (Cost $145,129,465)† | 149.8 | 138,512,953 |
| Other Assets and Liabilities, Net | 35.1 | 32,458,240 |
| Securities Sold Short | (84.9) | (78,500,012) |
| Net Assets | 100.0 | 92,471,181 |
† The cost for federal income tax purposes was $145,722,771. At February 29, 2016, net unrealized depreciation for all securities based on tax cost was $7,209,818. This consisted of aggregate gross unrealized appreciation for all securities in which there was an excess of value over tax cost of $5,418,433 and aggregate gross unrealized depreciation for all securities in which there was an excess of tax cost over value of $12,628,251.
| Shares | Value ($) | |
| Common Stocks Sold Short 84.8% | ||
| Consumer Discretionary 8.7% | ||
| Auto Components 0.1% | ||
| Tenneco, Inc. | 3,100 | 141,112 |
| Hotels, Restaurants & Leisure 1.2% | ||
| Accor SA | 26,239 | 1,116,885 |
| Household Durables 1.2% | ||
| Electrolux AB "B" | 46,000 | 1,081,457 |
| Internet & Catalog Retail 0.4% | ||
| Ocado Group PLC | 100,000 | 360,086 |
| Media 3.9% | ||
| Axel Springer SE | 14,000 | 710,485 |
| Informa PLC | 50,000 | 477,932 |
| Liberty Media Corp. "A" | 15,800 | 562,796 |
| Mediaset SpA | 150,000 | 535,076 |
| UBM PLC | 80,000 | 658,117 |
| Walt Disney Co. | 6,914 | 660,425 |
| 3,604,831 | ||
| Specialty Retail 1.4% | ||
| Barnes & Noble, Inc. | 75,800 | 735,260 |
| Kingfisher PLC | 120,000 | 556,040 |
| 1,291,300 | ||
| Textiles, Apparel & Luxury Goods 0.5% | ||
| Crocs, Inc. | 45,100 | 441,529 |
| Consumer Staples 11.0% | ||
| Beverages 1.5% | ||
| Coca-Cola Co. | 5,450 | 235,058 |
| Constellation Brands, Inc. "A" | 7,950 | 1,124,369 |
| 1,359,427 | ||
| Food & Staples Retailing 4.8% | ||
| Carrefour SA | 25,584 | 679,010 |
| Jeronimo Martins SGPS SA | 50,000 | 707,655 |
| Metro AG | 30,000 | 740,032 |
| Sysco Corp. | 25,150 | 1,109,869 |
| Whole Foods Market, Inc. | 37,050 | 1,160,036 |
| 4,396,602 | ||
| Food Products 0.9% | ||
| Danone SA | 12,314 | 859,757 |
| Household Products 1.1% | ||
| Church & Dwight Co., Inc. | 7,750 | 703,390 |
| Procter & Gamble Co. | 4,250 | 341,232 |
| 1,044,622 | ||
| Personal Products 1.8% | ||
| Beiersdorf AG | 12,000 | 1,042,886 |
| Unilever PLC | 15,000 | 644,618 |
| 1,687,504 | ||
| Tobacco 0.9% | ||
| Altria Group, Inc. | 13,909 | 856,377 |
| Energy 6.2% | ||
| Energy Equipment & Services 1.3% | ||
| Dril-Quip, Inc. | 10,242 | 555,629 |
| Frank's International NV | 48,434 | 672,748 |
| 1,228,377 | ||
| Oil, Gas & Consumable Fuels 4.9% | ||
| Apache Corp. | 28,450) | 1,089,066 |
| Koninklijke Vopak NV | 26,000 | 1,188,042 |
| Newfield Exploration Co. | 35,550 | 968,026 |
| World Fuel Services Corp. | 21,175 | 991,202 |
| WPX Energy, Inc. | 57,722 | 237,237 |
| 4,473,573 | ||
| Financials 17.8% | ||
| Banks 3.2% | ||
| Banco Bilbao Vizcaya Argentaria SA | 130,000 | 825,867 |
| BNP Paribas SA | 17,000 | 795,084 |
| JPMorgan Chase & Co. | 3,338 | 187,929 |
| PNC Financial Services Group, Inc. | 11,350 | 922,869 |
| The Bancorp., Inc. | 49,500 | 236,115 |
| 2,967,864 | ||
| Capital Markets 7.4% | ||
| American Capital Ltd. | 89,000 | 1,218,410 |
| Eaton Vance Corp. | 40,000 | 1,156,400 |
| Franklin Resources, Inc. | 25,000 | 896,250 |
| Legg Mason, Inc. | 43,508 | 1,242,589 |
| NorthStar Asset Management Group, Inc. | 120,900 | 1,321,437 |
| Raymond James Financial, Inc. | 21,950 | 962,288 |
| 6,797,374 | ||
| Diversified Financial Services 0.9% | ||
| CBOE Holdings, Inc. | 14,000 | 875,000 |
| Insurance 2.8% | ||
| Assured Guaranty Ltd. | 30,450 | 755,464 |
| Hartford Financial Services Group, Inc. | 4,946 | 208,326 |
| Loews Corp. | 26,500 | 963,275 |
| StanCorp Financial Group, Inc. | 1,400 | 160,860 |
| Validus Holdings Ltd. | 11,200 | 502,992 |
| 2,590,917 | ||
| Real Estate Investment Trusts 2.9% | ||
| Acadia Realty Trust (REIT) | 8,400 | 277,620 |
| Medical Properties Trust, Inc. (REIT) | 64,700 | 748,579 |
| Physicians Realty Trust (REIT) | 22,000 | 377,960 |
| Redwood Trust, Inc. (REIT) | 45,300 | 538,617 |
| Select Income REIT (REIT) | 18,500 | 381,470 |
| Senior Housing Properties Trust (REIT) | 23,000 | 359,030 |
| 2,683,276 | ||
| Real Estate Management & Development 0.1% | ||
| The RMR Group, Inc. "A" | 6,095 | 137,503 |
| Thrifts & Mortgage Finance 0.5% | ||
| PHH Corp. | 46,000 | 417,220 |
| Health Care 10.7% | ||
| Biotechnology 0.9% | ||
| Amgen, Inc. | 5,695 | 810,285 |
| Health Care Equipment & Supplies 4.2% | ||
| DexCom, Inc. | 11,300 | 735,178 |
| Essilor International SA | 10,600 | 1,261,852 |
| GN Store Nord AS | 44,000 | 882,613 |
| Straumann Holding AG (Registered) | 1,000 | 324,683 |
| The Cooper Companies, Inc. | 4,950 | 707,652 |
| 3,911,978 | ||
| Health Care Providers & Services 0.7% | ||
| Fresenius Medical Care AG & Co. KgaA | 8,000 | 674,974 |
| Health Care Technology 1.2% | ||
| Allscripts Healthcare Solutions, Inc. | 86,929 | 1,088,351 |
| Life Sciences Tools & Services 1.0% | ||
| Illumina, Inc. | 6,040 | 907,450 |
| Pharmaceuticals 2.7% | ||
| Akorn, Inc. | 16,150 | 429,428 |
| AstraZeneca PLC | 7,100 | 405,687 |
| GlaxoSmithKline PLC | 53,000 | 1,032,693 |
| STADA Arzneimittel AG | 20,000 | 681,505 |
| 2,549,313 | ||
| Industrials 8.6% | ||
| Aerospace & Defense 0.6% | ||
| United Technologies Corp. | 5,800 | 560,396 |
| Air Freight & Logistics 0.7% | ||
| CH Robinson Worldwide, Inc. | 8,754 | 611,292 |
| Building Products 1.3% | ||
| Advanced Drainage Systems, Inc. | 62,400 | 1,210,560 |
| Commercial Services & Supplies 0.5% | ||
| G4S PLC | 160,000 | 462,011 |
| Construction & Engineering 0.4% | ||
| Hochtief AG | 3,000 | 327,128 |
| Machinery 2.5% | ||
| IDEX Corp. | 10,400 | 781,664 |
| IMI PLC | 40,000 | 473,040 |
| Sulzer AG (Registered) | 7,000 | 660,258 |
| Wartsila Oyj Abp | 10,500 | 422,778 |
| 2,337,740 | ||
| Professional Services 2.0% | ||
| Bureau Veritas SA | 55,000 | 1,098,218 |
| ManpowerGroup, Inc. | 3,500 | 271,040 |
| TrueBlue, Inc. | 19,800 | 454,410 |
| 1,823,668 | ||
| Road & Rail 0.6% | ||
| Avis Budget Group, Inc. | 12,600 | 323,064 |
| Hertz Global Holdings, Inc. | 32,850 | 279,225 |
| 602,289 | ||
| Information Technology 13.0% | ||
| Communications Equipment 1.2% | ||
| Telefonaktiebolaget LM Ericsson "B" | 124,500 | 1,147,194 |
| Electronic Equipment, Instruments & Components 0.6% | ||
| Universal Display Corp. | 10,500 | 501,690 |
| Internet Software & Services 0.2% | ||
| RealNetworks, Inc. | 38,910 | 151,749 |
| Semiconductors & Semiconductor Equipment 7.4% | ||
| Aixtron SE | 55,000 | 200,756 |
| Applied Materials, Inc. | 41,800 | 788,766 |
| Applied Micro Circuits Corp. | 25,750 | 148,835 |
| ASML Holding NV | 12,000 | 1,103,142 |
| Intel Corp. | 23,233 | 687,465 |
| Marvell Technology Group Ltd. | 129,300 | 1,234,815 |
| Maxim Integrated Products, Inc. | 35,750 | 1,210,495 |
| Microchip Technology, Inc. | 14,550 | 647,330 |
| STMicroelectronics NV | 145,000 | 836,334 |
| 6,857,938 | ||
| Software 2.4% | ||
| Gemalto NV | 5,000 | 318,215 |
| SAP SE | 10,000 | 759,325 |
| SS&C Technologies Holdings, Inc. | 7,750 | 451,747 |
| Workday, Inc. "A" | 11,650 | 704,243 |
| 2,233,530 | ||
| Technology Hardware, Storage & Peripherals 1.2% | ||
| EMC Corp. | 42,000 | 1,097,460 |
| Materials 1.6% | ||
| Chemicals 0.8% | ||
| BASF SE | 11,000 | 718,993 |
| Metals & Mining 0.8% | ||
| Allegheny Technologies, Inc. | 54,950 | 736,880 |
| Telecommunication Services 2.0% | ||
| Diversified Telecommunication Services 2.0% | ||
| Orange SA | 50,000 | 870,155 |
| TeliaSonera AB | 220,000 | 1,012,468 |
| 1,882,623 | ||
| Utilities 5.2% | ||
| Electric Utilities 1.2% | ||
| Eversource Energy | 4,010 | 217,743 |
| Fortum Oyj | 65,000 | 866,521 |
| 1,084,264 | ||
| Gas Utilities 0.7% | ||
| South Jersey Industries, Inc. | 25,150 | 640,068 |
| Independent Power & Renewable Eletricity Producers 1.2% | ||
| AES Corp. | 22,163 | 217,197 |
| Drax Group PLC | 150,000 | 485,150 |
| Dynegy, Inc. | 40,900 | 412,272 |
| 1,114,619 | ||
| Multi-Utilities 2.1% | ||
| Dominion Resources, Inc. | 4,250 | 297,160 |
| MDU Resources Group, Inc. | 17,450 | 317,764 |
| National Grid PLC | 85,223 | 1,142,153 |
| RWE AG | 20,000 | 229,526 |
| 1,986,603 | ||
| Total Common Stocks Sold Short (Proceeds $89,523,705) | 78,443,639 | |
| Rights Sold Short 0.1% | ||
| Consumer Staples | ||
| Safeway Casa Ley, Expiration Date 1/30/2018 | 52,997 | 53,787 |
| Safeway PDC LLC, Expiration Date 1/30/2017 | 52,997 | 2,586 |
| Total Rights Sold Short (Cost $56,373) | 56,373 | |
| Total Position Sold Short (Proceeds $89,580,078) | 78,500,012 | |
* Non-income producing security.
** Annualized yield at time of purchase; not a coupon rate.
*** Floating rate securities’ yields vary with a designated market index or market rate, such as the coupon-equivalent of the U.S. Treasury Bill rate. These securities are shown at their current rate as of February 29, 2016,.
(a) All or a portion of these securities were on loan. In addition, "Other Assets and Liabilities, Net" may include pending sales that are also on loan. The value of securities loaned at February 29, 2016 amounted to $16,666,605, which is 18.0% of net assets.
(b) All or a portion of these securities are pledged as collateral for short sales.
(c) Affiliated fund managed by Deutsche Investment Management Americas Inc. The rate shown is the annualized seven-day yield at period end.
(d) Represents collateral held in connection with securities lending. Income earned by the Fund is net of borrower rebates.
144A: Security exempt from registration under Rule 144A of the Securities Act of 1933. These securities may be resold in transactions exempt from registration, normally to qualified institutional buyers.
ADR: American Depositary Receipt
REG S: Securities sold under Regulation S may not be offered, sold or delivered within the United States or to, or for the account or benefit of, U.S. persons, except pursuant to an exemption from, or in a transaction not subject to, the registration requirements of the Securities Act of 1933.
REIT: Real Estate Investment Trust
SDR: Swedish Depositary Receipt
As of February 29, 2016, the Fund had the following open forward foreign currency exchange contracts:
| Contracts to Deliver | In Exchange For | Settlement Date | Unrealized Appreciation ($) | Counterparty | ||||
| CHF | 470,000 | USD | 473,390 | 3/2/2016 | 2,683 | State Street Bank and Trust | ||
| EUR | 4,900,000 | USD | 5,352,481 | 3/2/2016 | 22,013 | State Street Bank and Trust | ||
| GBP | 485,000 | USD | 676,999 | 4/6/2016 | 1,860 | State Street Bank and Trust | ||
| EUR | 4,000,000 | USD | 4,412,368 | 4/6/2016 | 56,452 | State Street Bank and Trust | ||
| DKK | 7,000,000 | USD | 1,025,491 | 3/2/2016 | 4,614 | State Street Bank and Trust | ||
| DKK | 1,850,000 | USD | 273,482 | 4/6/2016 | 3,359 | State Street Bank and Trust | ||
| NOK | 5,500,000 | USD | 633,538 | 4/6/2016 | 1,681 | State Street Bank and Trust | ||
| SEK | 3,400,000 | USD | 401,317 | 4/6/2016 | 3,675 | State Street Bank and Trust | ||
| CHF | 1,000,000 | USD | 1,011,365 | 4/6/2016 | 8,115 | State Street Bank and Trust | ||
| SEK | 3,400,000 | USD | 401,071 | 3/2/2016 | 3,961 | State Street Bank and Trust | ||
| GBP | 760,000 | USD | 1,089,629 | 3/2/2016 | 31,823 | State Street Bank and Trust | ||
| Total unrealized appreciation | 140,236 | |||||||
| Contracts to Deliver | In Exchange For | Settlement Date | Unrealized Depreciation ($) | Counterparty | ||||
| USD | 1,072,816 | GBP | 760,000 | 3/2/2016 | (15,010) | State Street Bank and Trust | ||
| CHF | 530,000 | USD | 520,378 | 3/2/2016 | (10,418) | State Street Bank and Trust | ||
| NOK | 5,500,000 | USD | 630,635 | 3/2/2016 | (1,368) | State Street Bank and Trust | ||
| USD | 5,409,087 | EUR | 4,900,000 | 3/2/2016 | (78,620) | State Street Bank and Trust | ||
| USD | 1,026,760 | DKK | 7,000,000 | 3/2/2016 | (5,883) | State Street Bank and Trust | ||
| USD | 1,009,672 | CHF | 1,000,000 | 3/2/2016 | (8,169) | State Street Bank and Trust | ||
| USD | 633,703 | NOK | 5,500,000 | 3/2/2016 | (1,700) | State Street Bank and Trust | ||
| USD | 400,806 | SEK | 3,400,000 | 3/2/2016 | (3,695) | State Street Bank and Trust | ||
| Total unrealized depreciation | (124,863) | |||||||
| Currency Abbreviations |
CHF Swiss Franc DKK Danish Krone EUR Euro GBP Great British Pound NOK Norwegian Krone SEK Swedish Krona USD United States Dollar |
For information on the Fund's policy and additional disclosures regarding forward foreign currency exchange contracts, please refer to the Derivatives section of Note B in the accompanying Notes to Financial Statements.
Fair Value Measurements
Various inputs are used in determining the value of the Fund's investments. These inputs are summarized in three broad levels. Level 1 includes quoted prices in active markets for identical securities. Level 2 includes other significant observable inputs (including quoted prices for similar securities, interest rates, prepayment speeds and credit risk). Level 3 includes significant unobservable inputs (including the Fund's own assumptions in determining the fair value of investments). The level assigned to the securities valuations may not be an indication of the risk or liquidity associated with investing in those securities.
The following is a summary of the inputs used as of February 29, 2016 in valuing the Fund's investments. For information on the Fund's policy regarding the valuation of investments, please refer to the Security Valuation section of Note A in the accompanying Notes to Financial Statements.
| Assets | Level 1 | Level 2 | Level 3 | Total |
| Common Stocks (e) | $ 45,611,211 | $ 35,668,342 | $ — | $ 81,279,553 |
| Preferred Stock | — | 1,009,192 | — | 1,009,192 |
| Closed-End Investment Company | — | 695,751 | — | 695,751 |
| Corporate Bonds | — | 9,037,429 | — | 9,037,429 |
| Government & Agency Obligations (e) | — | 6,000,292 | — | 6,000,292 |
| Short-Term U.S. Treasury Obligations | — | 21,961,034 | — | 21,961,034 |
| Short-Term Investments (e) | 18,529,702 | — | — | 18,529,702 |
| Derivatives (f) | ||||
| Forward Foreign Currency Exchange Contracts | — | 140,236 | — | 140,236 |
| Total | $ 64,140,913 | $ 74,512,276 | $ — | $ 138,653,189 |
| Liabilities | Level 1 | Level 2 | Level 3 | Total |
| Common Stocks Sold Short, at Value (e) | $ (47,067,238) | $ (31,376,401) | $ — | $ (78,443,639) |
| Rights Sold Short, at Value | — | — | (56,373) | (56,373) |
| Derivatives (f) | ||||
| Forward Foreign Currency Exchange Contracts | — | (124,863) | — | (124,863) |
| Total | $ (47,067,238) | $ (31,501,264) | $ (56,373) | $ (78,624,875) |
There have been no transfers between fair value measurement levels during the period ended February 29, 2016.
(e) See Investment Portfolio for additional detailed categorizations.
(f) Derivatives include unrealized appreciation (depreciation) on forward foreign currency exchange contracts.
The accompanying notes are an integral part of the financial statements.
Statement of Assets and Liabilities
| as of February 29, 2016 (Unaudited) | |
| Assets | |
Investments: Investments in non-affiliated securities, at value (cost $126,599,763) — including $16,666,605 of securities loaned | $ 119,983,251 |
| Investment in Daily Assets Fund (cost $17,140,151)* | 17,140,151 |
| Investment in Central Cash Management Fund (cost $1,389,551) | 1,389,551 |
| Total investments in securities, at value (cost $145,129,465) | 138,512,953 |
| Foreign currency, at value (cost $1,013,660) | 984,870 |
| Deposit with broker for securities sold short | 47,941,480 |
| Receivable for investments sold | 930,171 |
| Receivable for Fund shares sold | 6,504 |
| Dividends receivable | 109,004 |
| Interest receivable | 59,476 |
| Unrealized appreciation on forward foreign currency exchange contracts | 140,236 |
| Foreign taxes recoverable | 43,331 |
| Other assets | 30,443 |
| Total assets | 188,758,468 |
| Liabilities | |
| Cash overdraft | 1,491 |
| Payable upon return of securities loaned | 17,140,151 |
| Payable for investments purchased | 106,047 |
| Payable for securities sold short, at value (proceeds of $89,580,078) | 78,500,012 |
| Payable for Fund shares redeemed | 20,611 |
| Unrealized depreciation on forward foreign currency exchange contracts | 124,863 |
| Dividends payable for securities sold short | 101,062 |
| Accrued management fee | 90,335 |
| Accrued Trustees' fee | 3,648 |
| Other accrued expenses and payables | 199,067 |
| Total liabilities | 96,287,287 |
| Net assets, at value | $ 92,471,181 |
* Represents collateral on securities loaned.
The accompanying notes are an integral part of the financial statements.
| Statement of Assets and Liabilities as of February 29, 2016 (Unaudited) (continued) | |
| Net Assets Consist of | |
| Accumulated net investment loss | (2,642,843) |
Net unrealized appreciation (depreciation) on: Investments | (6,616,512) |
| Securities sold short | 11,080,066 |
| Foreign currency | (14,911) |
| Accumulated net realized gain (loss) | (8,006,188) |
| Paid-in capital | 98,671,569 |
| Net assets, at value | $ 92,471,181 |
| Net Asset Value | |
Class A Net Asset Value and redemption price per share ($6,067,673 ÷ 750,040 outstanding shares of beneficial interest, no par value, unlimited number of shares authorized) | $ 8.09 |
| Maximum offering price per share (100 ÷ 94.25 of $8.09) | $ 8.58 |
Class C Net Asset Value, offering and redemption price (subject to contingent deferred sales charge) per share ($4,493,842 ÷ 594,945 outstanding shares of beneficial interest, no par value, unlimited number of shares authorized) | $ 7.55 |
Class S Net Asset Value, offering and redemption price per share ($34,548,977 ÷ 4,213,436 outstanding shares of beneficial interest, no par value, unlimited number of shares authorized) | $ 8.20 |
Institutional Class Net Asset Value, offering and redemption price per share ($47,360,689 ÷ 5,716,642 outstanding shares of beneficial interest, no par value, unlimited number of shares authorized) | $ 8.28 |
The accompanying notes are an integral part of the financial statements.
Statement of Operations
| for the six months ended February 29, 2016 (Unaudited) | |
| Investment Income | |
Income: Dividends (net of foreign taxes withheld of $19,091) | $ 675,913 |
| Interest | 56,990 |
| Income distributions — Central Cash Management Fund | 8,081 |
| Securities lending income, including income from Daily Assets Fund, net of borrower rebates | 37,509 |
| Total income | 778,493 |
Expenses: Management fee | 662,209 |
| Administration fee | 52,977 |
| Services to shareholders | 65,904 |
| Distribution and service fees | 34,792 |
| Custodian fee | 28,910 |
| Professional fees | 41,988 |
| Reports to shareholders | 25,976 |
| Registration fees | 27,052 |
| Trustees' fees and expenses | 4,960 |
| Dividend expense on securities sold short | 758,314 |
| Interest expense on securities sold short | 249,213 |
| Other | 13,788 |
| Total expenses before expense reductions | 1,966,083 |
| Expense reductions | (83,793) |
| Total expenses after expense reductions | 1,882,290 |
| Net investment income (loss) | (1,103,797) |
| Realized and Unrealized Gain (Loss) | |
Net realized gain (loss) from: Investments | (2,566,362) |
| Securities sold short | 2,590,137 |
| Foreign currency | 50,852 |
| 74,627 | |
Change in net unrealized appreciation (depreciation) on: Investments | (6,673,062) |
| Securities sold short | 3,731,391 |
| Foreign currency | 93,586 |
| (2,848,085) | |
| Net gain (loss) | (2,773,458) |
| Net increase (decrease) in net assets resulting from operations | $ (3,877,255) |
The accompanying notes are an integral part of the financial statements.
Statement of Changes in Net Assets
| Increase (Decrease) in Net Assets | Six Months Ended February 29, 2016 (Unaudited) | Year Ended August 31, 2015 | |
Operations: Net investment income (loss) | $ (1,103,797) | $ (2,805,474) | |
| Net realized gain (loss) | 74,627 | (27,105) | |
| Change in net unrealized appreciation (depreciation) | (2,848,085) | 2,566,787 | |
| Net increase (decrease) in net assets resulting from operations | (3,877,255) | (265,792) | |
Fund share transactions: Proceeds from shares sold | 15,780,713 | 14,250,544 | |
| Payments for shares redeemed | (31,658,608) | (134,407,669) | |
| Net increase (decrease) in net assets from Fund share transactions | (15,877,895) | (120,157,125) | |
| Increase (decrease) in net assets | (19,755,150) | (120,422,917) | |
| Net assets at beginning of period | 112,226,331 | 232,649,248 | |
| Net assets at end of period (including accumulated net investment loss of $2,642,843 and $1,539,046, respectively) | $ 92,471,181 | $ 112,226,331 |
The accompanying notes are an integral part of the financial statements.
Financial Highlights
| Class A | Six Months Ended 2/29/16 (Unaudited) | Years Ended August 31, | |||||
| 2015 | 2014 | 2013 | 2012 | 2011 | |||
| Selected Per Share Data | |||||||
| Net asset value, beginning of period | $ 8.42 | $ 8.43 | $ 9.61 | $ 9.49 | $ 9.49 | $ 9.48 | |
Income (loss) from investment operations: Net investment income (loss)a | (.09) | (.15) | (.19) | (.18) | (.21) | (.19) | |
| Net realized and unrealized gain (loss) | (.24) | .14 | .10 | .30 | .21 | .28 | |
| Total from investment operations | (.33) | (.01) | (.09) | .12 | .00 | .09 | |
Less distributions from: Net realized gains | — | — | (1.09) | — | — | (.08) | |
| Net asset value, end of period | $ 8.09 | $ 8.42 | $ 8.43 | $ 9.61 | $ 9.49 | $ 9.49 | |
| Total Return (%)b | (3.92)c** | (.12)c | (1.03)c | 1.26c | .00c | 1.06 | |
| Ratios to Average Net Assets and Supplemental Data | |||||||
| Net assets, end of period ($ millions) | 6 | 7 | 14 | 43 | 60 | 82 | |
| Ratio of expenses before expense reductions (including interest expense and dividend expense for securities sold short) (%) | 3.95* | 3.78 | 3.69 | 3.78 | 3.83 | 3.56 | |
| Ratio of expenses after expense reductions (including interest expense and dividend expense for securities sold short) (%) | 3.70* | 3.65 | 3.60 | 3.76 | 3.77 | 3.56 | |
| Ratio of expenses after expense reductions (excluding interest expense and dividend expense for securities sold short) (%) | 1.80* | 1.80 | 1.80 | 1.77 | 1.75 | 1.79 | |
| Ratio of net investment income (loss) (%) | (2.24)* | (1.80) | (2.14) | (1.91) | (2.25) | (2.04) | |
| Portfolio turnover rate (%) | 73** | 201 | 347 | 496 | 597 | 481 | |
a Based on average shares outstanding during the period. b Total return does not reflect the effect of any sales charges. c Total return would have been lower had certain expenses not been reduced. * Annualized ** Not annualized | |||||||
| Class C | Six Months Ended 2/29/16 (Unaudited) | Years Ended August 31, | |||||
| 2015 | 2014 | 2013 | 2012 | 2011 | |||
| Selected Per Share Data | |||||||
| Net asset value, beginning of period | $ 7.89 | $ 7.96 | $ 9.20 | $ 9.15 | $ 9.22 | $ 9.29 | |
Income (loss) from investment operations: Net investment income (loss)a | (.12) | (.20) | (.24) | (.25) | (.27) | (.25) | |
| Net realized and unrealized gain (loss) | (.22) | .13 | .09 | .30 | .20 | .26 | |
| Total from investment operations | (.34) | (.07) | (.15) | .05 | (.07) | .01 | |
Less distributions from: Net realized gains | — | — | (1.09) | — | — | (.08) | |
| Net asset value, end of period | $ 7.55 | $ 7.89 | $ 7.96 | $ 9.20 | $ 9.15 | $ 9.22 | |
| Total Return (%)b | (4.31)c** | (.88)c | (1.69)c | .55c | (.76)c | .32 | |
| Ratios to Average Net Assets and Supplemental Data | |||||||
| Net assets, end of period ($ millions) | 4 | 6 | 10 | 17 | 19 | 24 | |
| Ratio of expenses before expense reductions (including interest expense and dividend expense for securities sold short) (%) | 4.70* | 4.53 | 4.43 | 4.54 | 4.54 | 4.31 | |
| Ratio of expenses after expense reductions (including interest expense and dividend expense for securities sold short) (%) | 4.45* | 4.40 | 4.35 | 4.53 | 4.52 | 4.31 | |
| Ratio of expenses after expense reductions (excluding interest expense and dividend expense for securities sold short) (%) | 2.55* | 2.55 | 2.55 | 2.54 | 2.50 | 2.54 | |
| Ratio of net investment income (loss) (%) | (3.00)* | (2.53) | (2.89) | (2.69) | (2.99) | (2.78) | |
| Portfolio turnover rate (%) | 73** | 201 | 347 | 496 | 597 | 481 | |
a Based on average shares outstanding during the period. b Total return does not reflect the effect of any sales charges. c Total return would have been lower had certain expenses not been reduced. * Annualized ** Not annualized | |||||||
| Class S | Six Months Ended 2/29/16 (Unaudited) | Years Ended August 31, | |||||
| 2015 | 2014 | 2013 | 2012 | 2011 | |||
| Selected Per Share Data | |||||||
| Net asset value, beginning of period | $ 8.53 | $ 8.53 | $ 9.69 | $ 9.55 | $ 9.54 | $ 9.51 | |
Income (loss) from investment operations: Net investment income (loss)a | (.09) | (.14) | (.18) | (.18) | (.19) | (.17) | |
| Net realized and unrealized gain (loss) | (.24) | .14 | .11 | .32 | .20 | .28 | |
| Total from investment operations | (.33) | .00 | (.07) | .14 | .01 | .11 | |
Less distributions from: Net realized gains | — | — | (1.09) | — | — | (.08) | |
| Net asset value, end of period | $ 8.20 | $ 8.53 | $ 8.53 | $ 9.69 | $ 9.55 | $ 9.54 | |
| Total Return (%)b | (3.87)** | .00 | (.92) | 1.47 | .10 | 1.27 | |
| Ratios to Average Net Assets and Supplemental Data | |||||||
| Net assets, end of period ($ millions) | 35 | 37 | 56 | 84 | 77 | 61 | |
| Ratio of expenses before expense reductions (including interest expense and dividend expense for securities sold short) (%) | 3.78* | 3.61 | 3.59 | 3.69 | 3.64 | 3.41 | |
| Ratio of expenses after expense reductions (including interest expense and dividend expense for securities sold short) (%) | 3.55* | 3.50 | 3.45 | 3.63 | 3.61 | 3.35 | |
| Ratio of expenses after expense reductions (excluding interest expense and dividend expense for securities sold short) (%) | 1.65* | 1.65 | 1.65 | 1.64 | 1.59 | 1.58 | |
| Ratio of net investment income (loss) (%) | (2.05)* | (1.64) | (2.01) | (1.90) | (2.05) | (1.82) | |
| Portfolio turnover rate (%) | 73** | 201 | 347 | 496 | 597 | 481 | |
a Based on average shares outstanding during the period. b Total return would have been lower had certain expenses not been reduced. * Annualized ** Not annualized | |||||||
| Institutional Class | Six Months Ended 2/29/16 (Unaudited) | Years Ended August 31, | |||||
| 2015 | 2014 | 2013 | 2012 | 2011 | |||
| Selected Per Share Data | |||||||
| Net asset value, beginning of period | $ 8.62 | $ 8.60 | $ 9.76 | $ 9.60 | $ 9.58 | $ 9.53 | |
Income (loss) from investment operations: Net investment income (loss)a | (.09) | (.13) | (.17) | (.16) | (.18) | (.16) | |
| Net realized and unrealized gain (loss) | (.25) | .15 | .10 | .32 | .21 | .29 | |
| Total from investment operations | (.34) | .02 | (.07) | .16 | .03 | .13 | |
Less distributions from: Net investment income | — | — | — | — | (.01) | — | |
| Net realized gains | — | — | (1.09) | — | — | (.08) | |
| Total distributions | — | — | (1.09) | — | (.01) | (.08) | |
| Net asset value, end of period | $ 8.28 | $ 8.62 | $ 8.60 | $ 9.76 | $ 9.60 | $ 9.58 | |
| Total Return (%) | (3.94)b** | .23b | (.69) | 1.67 | .28 | 1.47 | |
| Ratios to Average Net Assets and Supplemental Data | |||||||
| Net assets, end of period ($ millions) | 47 | 62 | 152 | 235 | 238 | 197 | |
| Ratio of expenses before expense reductions (including interest expense and dividend expense for securities sold short) (%) | 3.55* | 3.41 | 3.32 | 3.43 | 3.46 | 3.20 | |
| Ratio of expenses after expense reductions (including interest expense and dividend expense for securities sold short) (%) | 3.45* | 3.40 | 3.32 | 3.43 | 3.46 | 3.20 | |
| Ratio of expenses after expense reductions (excluding interest expense and dividend expense for securities sold short) (%) | 1.55* | 1.55 | 1.52 | 1.44 | 1.44 | 1.43 | |
| Ratio of net investment income (loss) (%) | (2.00)* | (1.53) | (1.87) | (1.66) | (1.89) | (1.67) | |
| Portfolio turnover rate (%) | 73** | 201 | 347 | 496 | 597 | 481 | |
a Based on average shares outstanding during the period. b Total return would have been lower had certain expenses not been reduced. * Annualized ** Not annualized | |||||||
Notes to Financial Statements (Unaudited)
A. Organization and Significant Accounting Policies
Deutsche Diversified Market Neutral Fund (the "Fund") is a diversified series of Deutsche Market Trust (the "Trust"), which is registered under the Investment Company Act of 1940, as amended (the "1940 Act"), as an open-end management investment company organized as a Massachusetts business trust.
The Fund offers multiple classes of shares which provide investors with different purchase options. Class A shares are subject to an initial sales charge. Class C shares are not subject to an initial sales charge but are subject to higher ongoing expenses than Class A shares and a contingent deferred sales charge payable upon certain redemptions within one year of purchase. Class S shares are not subject to initial or contingent deferred sales charges and are only available to a limited group of investors. Institutional Class shares are not subject to initial or contingent deferred sales charges and are generally available only to qualified institutions.
Investment income, realized and unrealized gains and losses, and certain fund-level expenses and expense reductions, if any, are borne pro rata on the basis of relative net assets by the holders of all classes of shares, except that each class bears certain expenses unique to that class such as services to shareholders, distribution and service fees and certain other class-specific expenses. Differences in class-level expenses may result in payment of different per share dividends by class. All shares of the Fund have equal rights with respect to voting subject to class-specific arrangements.
The Fund's financial statements are prepared in accordance with accounting principles generally accepted in the United States of America which require the use of management estimates. Actual results could differ from those estimates. The policies described below are followed consistently by the Fund in the preparation of its financial statements.
Security Valuation. Investments are stated at value determined as of the close of regular trading on the New York Stock Exchange on each day the exchange is open for trading.
Various inputs are used in determining the value of the Fund's investments. These inputs are summarized in three broad levels. Level 1 includes quoted prices in active markets for identical securities. Level 2 includes other significant observable inputs (including quoted prices for similar securities, interest rates, prepayment speeds and credit risk). Level 3 includes significant unobservable inputs (including the Fund's own assumptions in determining the fair value of investments). The level assigned to the securities valuations may not be an indication of the risk or liquidity associated with investing in those securities.
Equity securities and exchange-traded funds ("ETFs") are valued at the most recent sale price or official closing price reported on the exchange (U.S. or foreign) or over-the-counter market on which they trade. Long equity securities and ETFs for which no sales are reported are valued at the calculated mean between the most recent bid and asked quotations on the relevant market or, if a mean cannot be determined, at the most recent bid quotation. Short equity securities and ETFs for which no sales are reported are valued at the calculated mean between the most recent bid and ask quotations on the relevant market or, if a mean cannot be determined, at the most recent ask quotation. Equity securities and ETFs are generally categorized as Level 1. For certain international equity securities, in order to adjust for events which may occur between the close of the foreign exchanges and the close of the New York Stock Exchange, a fair valuation model may be used. This fair valuation model takes into account comparisons to the valuation of American Depository Receipts (ADRs), exchange-traded funds, futures contracts and certain indices, and these securities are categorized as Level 2.
Debt securities are valued at prices supplied by independent pricing services approved by the Fund's Board. Such services may use various pricing techniques which take into account appropriate factors such as yield, quality, coupon rate, maturity, type of issue, trading characteristics, prepayment speeds and other data, as well as broker quotes. If the pricing services are unable to provide valuations, debt securities are valued at the average of the most recent reliable bid quotations or evaluated prices, as applicable, obtained from broker-dealers. These securities are generally categorized as Level 2.
Investments in open-end investment companies are valued at their net asset value each business day and are categorized as Level 1.
Forward currency contracts are valued at the prevailing forward exchange rate of the underlying currencies and are categorized as Level 2.
Securities and other assets for which market quotations are not readily available or for which the above valuation procedures are deemed not to reflect fair value are valued in a manner that is intended to reflect their fair value as determined in accordance with procedures approved by the Board and are generally categorized as Level 3. In accordance with the Fund's valuation procedures, factors considered in determining value may include, but are not limited to, the type of the security; the size of the holding; the initial cost of the security; the existence of any contractual restrictions on the security's disposition; the price and extent of public trading in similar securities of the issuer or of comparable companies; quotations or evaluated prices from broker-dealers and/or pricing services; information obtained from the issuer, analysts, and/or the appropriate stock exchange (for exchange-traded securities); an analysis of the company's or issuer's financial statements; an evaluation of the forces that influence the issuer and the market(s) in which the security is purchased and sold; and with respect to debt securities, the maturity, coupon, creditworthiness, currency denomination and the movement of the market in which the security is normally traded. The value determined under these procedures may differ from published values for the same securities.
Disclosure about the classification of fair value measurements is included in a table following the Fund's Investment Portfolio.
Securities Lending. State Street Bank and Trust, as lending agent, lends securities of the Fund to certain financial institutions under the terms of the Security Lending Agreement. The Fund retains benefits of owning the securities it has loaned and continues to receive interest and dividends generated by the securities and to participate in any changes in their market value. The Fund requires the borrowers of the securities to maintain collateral with the Fund consisting of either cash or liquid, unencumbered assets having a value at least equal to the value of the securities loaned. When the collateral falls below specified amounts, the lending agent will use its best effort to obtain additional collateral on the next business day to meet required amounts under the security lending agreement. As of period end, any securities on loan were collateralized by cash. The Fund may invest the cash collateral into a joint trading account in an affiliated money market fund pursuant to Exemptive Orders issued by the SEC. During the period ended February 29, 2016, the Fund invested the cash collateral in Daily Assets Fund, an affiliated money market fund managed by Deutsche Investment Management Americas Inc. Deutsche Investment Management Americas Inc. receives a management/administration fee (0.09% annualized effective rate as of February 29, 2016) on the cash collateral invested in Daily Assets Fund. The Fund receives compensation for lending its securities either in the form of fees or by earning interest on invested cash collateral net of borrower rebates and fees paid to a lending agent. Either the Fund or the borrower may terminate the loan at any time, and the borrower, after notice, is required to return borrowed securities within a standard time period. There may be risks of delay and costs in recovery of securities or even loss of rights in the collateral should the borrower of the securities fail financially. If the Fund is not able to recover securities lent, the Fund may sell the collateral and purchase a replacement investment in the market, incurring the risk that the value of the replacement security is greater than the value of the collateral. The Fund is also subject to all investment risks associated with the reinvestment of any cash collateral received, including, but not limited to, interest rate, credit and liquidity risk associated with such investments.
As of February 29, 2016, the Fund had securities on loan, all of which were classified as common stocks and corporate bond in the Investment Portfolio. The value of the related collateral exceeded the value of the securities loaned at period end.
| Remaining Contractual Maturity of the Agreements As of February 29, 2016 | |||||
| Overnight and Continuous | <30 days | Between 30 & 90 days | >90 days | Total | |
Securities Lending Transactions Common Stocks | $ 17,036,901 | $ — | $ — | $ — | $ 17,036,901 |
| Corporate Bond | 103,250 | — | — | — | 103,250 |
| Total Borrowings | $ 17,140,151 | $ — | $ — | $ — | $ 17,140,151 |
| Gross amount of recognized liabilities for securities lending transactions | $ 17,140,151 | ||||
Foreign Currency Translations. The books and records of the Fund are maintained in U.S. dollars. Investment securities and other assets and liabilities denominated in a foreign currency are translated into U.S. dollars at the prevailing exchange rates at period end. Purchases and sales of investment securities, income and expenses are translated into U.S. dollars at the prevailing exchange rates on the respective dates of the transactions.
Net realized and unrealized gains and losses on foreign currency transactions represent net gains and losses between trade and settlement dates on securities transactions, the acquisition and disposition of foreign currencies, and the difference between the amount of net investment income accrued and the U.S. dollar amount actually received. The portion of both realized and unrealized gains and losses on investments that results from fluctuations in foreign currency exchange rates is not separately disclosed but is included with net realized and unrealized gain/appreciation and loss/depreciation on investments.
Short Sales. When the Fund takes a short position, it sells at the current market price a security it does not own but has borrowed in anticipation that the market price of the security will decline. To complete, or close out, the short sale transaction, the Fund buys the same security in the market and returns it to the lender.
Upon entering into a short sale, the Fund is required to designate liquid assets it owns in the form of cash or securities as segregated assets at its custodian in an amount at least equal to its obligations to purchase the securities sold short. For financial statements purposes, segregated cash is reflected as an asset on the Statement of Assets and Liabilities, and the settlement amount for securities sold short is reflected as a corresponding liability. Securities segregated as collateral are identified in the Investment Portfolio. The amount of the liability is marked-to-market to reflect the current value of the short position.
The Fund may receive or pay the net of the borrowing fee on securities sold short and any income earned on the cash held as collateral for securities sold short. The net amounts of income or fees are included as interest income, or interest expense on securities sold short, in the Statement of Operations.
Short sales involve the risk that the Fund will incur a loss by subsequently buying a security at a higher price than the price at which the Fund previously sold the security short. Any loss will be increased by the amount of compensation, interest or dividends, and transaction costs the Fund must pay to a lender of the security. In addition, because the Fund's loss on a short sale stems from increases in the value of the security sold short, the extent of such loss, like the price of the security sold short, is theoretically unlimited. By contrast, the Fund's loss on a long position arises from decreases in the value of the security held by the Fund and therefore is limited by the fact that a security's value cannot drop below zero.
Taxes. The Fund's policy is to comply with the requirements of the Internal Revenue Code, as amended, which are applicable to regulated investment companies, and to distribute all of its taxable income to its shareholders.
Additionally, the Fund may be subject to taxes imposed by the governments of countries in which it invests and are generally based on income and/or capital gains earned or repatriated. Estimated tax liabilities on certain foreign securities are recorded on an accrual basis and are reflected as components of interest income or net change in unrealized gain/loss on investments. Tax liabilities realized as a result of security sales are reflected as a component of net realized gain/loss on investments.
At August 31, 2015, the Fund had $7,202,000 of short-term tax basis capital loss carryforwards, which may be applied against realized net taxable capital gains indefinitely.
In addition, from January 1, 2015 through August 31, 2015, the Fund elected to defer qualified late year losses of approximately $1,443,000 of net ordinary losses and treat them as arising in the fiscal year ending August 31, 2016.
The Fund has reviewed the tax positions for the open tax years as of August 31, 2015, and has determined that no provision for income tax and/or uncertain tax provisions is required in the Fund's financial statements. The Fund's federal tax returns for the prior three fiscal years remain open subject to examination by the Internal Revenue Service.
Distribution of Income and Gains. Distributions from net investment income of the Fund, if any, are declared and distributed to shareholders annually. Net realized gains from investment transactions, in excess of available capital loss carryforwards, would be taxable to the Fund if not distributed, and, therefore, will be distributed to shareholders at least annually. The Fund may also make additional distributions for tax purposes if necessary.
The timing and characterization of certain income and capital gain distributions are determined annually in accordance with federal tax regulations which may differ from accounting principles generally accepted in the United States of America. These differences primarily relate to investment in foreign denominated investments, investments in futures, investments in passive foreign investment companies, investments in short sales and certain securities sold at a loss. As a result, net investment income (loss) and net realized gain (loss) on investment transactions for a reporting period may differ significantly from distributions during such period. Accordingly, the Fund may periodically make reclassifications among certain of its capital accounts without impacting the net asset value of the Fund.
The tax character of current year distributions will be determined at the end of the current fiscal year.
Expenses. Expenses of the Trust arising in connection with a specific fund are allocated to that fund. Other Trust expenses which cannot be directly attributed to a fund are apportioned among the funds in the Trust based upon the relative net assets or other appropriate measures.
Contingencies. In the normal course of business, the Fund may enter into contracts with service providers that contain general indemnification clauses. The Fund's maximum exposure under these arrangements is unknown as this would involve future claims that may be made against the Fund that have not yet been made. However, based on experience, the Fund expects the risk of loss to be remote.
Other. Investment transactions are accounted for on a trade date plus one basis for daily net asset value calculations. However, for financial reporting purposes, investment transactions are reported on trade date. Interest income is recorded on the accrual basis. Dividend income is recorded on the ex-dividend date. Dividend income on short sale transactions is recorded on ex-date and disclosed as an expense in the Statement of Operations. Realized gains and losses from investment transactions are recorded on an identified cost basis. Proceeds from litigation payments, if any, are included in net realized gain (loss) from investments.
B. Derivative Instrument
Forward Foreign Currency Exchange Contracts. A forward foreign currency exchange contract ("forward currency contract") is a commitment to purchase or sell a foreign currency at the settlement date at a negotiated rate. For the six months ended February 29, 2016, the Fund entered into forward currency contracts in order to hedge its exposure to changes in foreign currency exchange rates on its foreign currency denominated assets and to facilitate transactions in foreign currency denominated securities.
Forward currency contracts are valued at the prevailing forward exchange rate of the underlying currencies and unrealized gain (loss) is recorded daily. On the settlement date of the forward currency contract, the Fund records a realized gain or loss equal to the difference between the value of the contract at the time it was opened and the value of the contract at the time it was closed. Certain risks may arise upon entering into forward currency contracts from the potential inability of counterparties to meet the terms of their contracts. The maximum counterparty credit risk to the Fund is measured by the unrealized gain on appreciated contracts. Additionally, when utilizing forward currency contracts to hedge, the Fund gives up the opportunity to profit from favorable exchange rate movements during the term of the contract.
A summary of the open forward currency contracts as of February 29, 2016 is included in a table following the Fund's Investment Portfolio. For the six months ended February 29, 2016, the investment in forward currency contracts short vs. U.S. dollars had a total contract value generally indicative of a range from approximately $8,148,000 to $16,902,000, and the investment in forward currency contracts long vs. U.S. dollars had a total contract value generally indicative of a range from approximately $2,094,000 to $9,553,000.
The following tables summarize the value of the Fund's derivative instruments held as of February 29, 2016 and the related location in the accompanying Statement of Assets and Liabilities, presented by primary underlying risk exposure:
| Asset Derivative | Forward Contracts |
| Foreign Exchange Contracts (a) | $ 140,236 |
The above derivative is located in the following Statement of Assets and Liabilities account: (a) Unrealized appreciation on forward foreign currency exchange contracts | |
| Liability Derivative | Forward Contracts |
| Foreign Exchange Contracts (a) | $ (124,863) |
The above derivative is located in the following Statement of Assets and Liabilities account: (a) Unrealized depreciation on forward foreign currency exchange contracts | |
Additionally, the amount of unrealized and realized gains and losses on derivative instruments recognized in Fund earnings during the six months ended February 29, 2016 and the related location in the accompanying Statement of Operations is summarized in the following tables by primary underlying risk exposure:
| Realized Gain (Loss) | Forward Contracts |
| Foreign Exchange Contracts (a) | $ 109,270 |
The above derivative is located in the following Statement of Operations account: (a) Net realized gain (loss) from foreign currency (Statement of Operations includes both forward currency contracts and foreign currency transactions) | |
| Change in Net Unrealized Appreciation (Depreciation) | Forward Contracts |
| Foreign Exchange Contracts (a) | $ 123,203 |
The above derivative is located in the following Statement of Operations account: (a) Change in net unrealized appreciation (depreciation) on foreign currency (Statement of Operations includes both forward currency contracts and foreign currency transactions) | |
As of February 29, 2016, the Fund has transactions subject to enforceable master netting agreements. A reconciliation of the gross amounts on the Statement of Assets and Liabilities to the net amounts by counterparty, including any collateral exposure, is included in the following tables:
| Counterparty | Gross Amounts of Assets Presented in the Statement of Assets and Liabilities | Financial Instruments and Derivatives Available for Offset | Collateral Received | Net Amount of Derivative Assets |
| State Street Bank & Trust Co. | $ 140,236 | $ (124,863) | $ — | $ 15,373 |
| Counterparty | Gross Amounts of Liabilities Presented in the Statement of Assets and Liabilities | Financial Instruments and Derivatives Available for Offset | Collateral Pledged | Net Amount of Derivative Liabilities |
| State Street Bank & Trust Co. | $ 124,863 | $ (124,863) | $ — | $ — |
C. Purchases and Sales of Securities
During the six months ended February 29, 2016, purchases and sales of investment securities (excluding short sale transactions and short-term investments) aggregated $39,860,212 and $44,425,542, respectively. Purchases to cover securities sold short and securities sold short aggregated $34,455,966 and $35,631,820, respectively.
D. Related Parties
Management Agreement. Under the Investment Management Agreement with Deutsche Investment Management Americas Inc. ("DIMA" or the "Advisor"), an indirect, wholly owned subsidiary of Deutsche Bank AG, the Advisor directs the investments of the Fund in accordance with its investment objectives, policies and restrictions. The Advisor determines the securities, instruments and other contracts relating to investments to be purchased, sold or entered into by the Fund or delegates such responsibility to the Fund's subadvisor.
The Advisor allocates the Fund's assets across one sub-advised sleeve managed by GAM International Management Limited ("GAM") and one sleeve managed by the Advisor. Each investment management team employs different market neutral investment strategies when managing the assets of the fund allocated to it. GAM is paid by the Advisor, not the Fund, for the services it provides to the Fund.
Pursuant to the Investment Management Agreement with the Advisor, the Fund pays a monthly investment management fee ("Management Fee") based on the Fund's average daily net assets, computed and accrued daily and payable monthly, at the following annual rates:
| First $1 billion of the Fund's average daily net assets | 1.25% |
| Next $1 billion of such net assets | 1.20% |
| Next $1 billion of such net assets | 1.15% |
| Over $3 billion of such net assets | 1.10% |
Accordingly, for the six months ended February 29, 2016, the fee pursuant to the Investment Management Agreement was equivalent to an annualized rate (exclusive of any applicable waivers/reimbursements) of 1.25% of the Fund's average daily net assets.
For the period from September 1, 2015 through November 30, 2016, the Advisor has contractually agreed to waive its fees and/or reimburse certain operating expenses of the Fund to the extent necessary to maintain the total annual operating expenses (excluding certain expenses such as extraordinary expenses, taxes, brokerage, interest and dividend expenses on short sales) of each class as follows:
| Class A | 1.80% |
| Class C | 2.55% |
| Class S | 1.65% |
| Institutional Class | 1.55% |
For the six months ended February 29, 2016, fees waived and/or expenses reimbursed for each class are as follows:
| Class A | $ 8,609 |
| Class C | 6,565 |
| Class S | 41,771 |
| Institutional Class | 26,848 |
| $ 83,793 |
Administration Fee. Pursuant to an Administrative Services Agreement, DIMA provides most administrative services to the Fund. For all services provided under the Administrative Services Agreement, the Fund pays the Advisor an annual fee ("Administration Fee") of 0.10% of the Fund's average daily net assets, computed and accrued daily and payable monthly. For the six months ended February 29, 2016, the Administration Fee was $52,977, of which $7,659 is unpaid.
Service Provider Fees. DeAWM Service Company ("DSC"), an affiliate of the Advisor, is the transfer agent, dividend-paying agent and shareholder service agent for the Fund. Pursuant to a sub-transfer agency agreement between DSC and DST Systems, Inc. ("DST"), DSC has delegated certain transfer agent, dividend-paying agent and shareholder service agent functions to DST. DSC compensates DST out of the shareholder servicing fees it receives from the Fund. For the six months ended February 29, 2016, the amounts charged to the Fund by DSC were as follows:
| Services to Shareholders | Total Aggregated | Unpaid at February 29, 2016 |
| Class A | $ 1,058 | $ 616 |
| Class C | 330 | 188 |
| Class S | 1,582 | 1,239 |
| Institutional Class | 3,140 | 1,830 |
| $ 6,110 | $ 3,873 |
Distribution and Services Fees. Under the Fund's Class C 12b-1 Plan, DeAWM Distributors, Inc. ("DDI"), an affiliate of the Advisor, receives a fee ("Distribution Fee") of 0.75% of average daily net assets of Class C shares. In accordance with the Fund's Underwriting and Distribution Services Agreement, DDI enters into related selling group agreements with various firms at various rates for sales of Class C shares. For the six months ended February 29, 2016, the Distribution Fee was as follows:
| Distribution Fee | Total Aggregated | Unpaid at February 29, 2016 |
| Class C | $ 19,696 | $ 2,735 |
In addition, DDI provides information and administrative services for a fee ("Service Fee") to the shareholders of Class A and Class C shareholders at an annual rate of up to 0.25% of average daily net assets for each such class. DDI in turn has various agreements with financial services firms that provide these services and pays these fees based upon the assets of shareholder accounts the firms service. For the six months ended February 29, 2016, the Service Fee was as follows:
| Service Fee | Total Aggregated | Unpaid at February 29, 2016 | Annualized Rate |
| Class A | $ 8,553 | $ 2,771 | .25% |
| Class C | 6,543 | 1,909 | .25% |
| $ 15,096 | $ 4,680 |
Underwriting Agreement and Contingent Deferred Sales Charge. DDI is the principal underwriter for the Fund. Underwriting commissions paid in connection with the distribution of Class A shares for the six months ended February 29, 2016 aggregated $553.
In addition, DDI receives any contingent deferred sales charge ("CDSC") from Class C share redemptions occurring within one year of purchase. There is no such charge upon redemption of any share appreciation or reinvested dividends. The CDSC is based on 1% of the value of the shares redeemed for Class C. A deferred sales charge of up to 0.75% is assessed on certain redemptions of Class A shares.
Trustees' Fees and Expenses. The Fund paid retainer fees to each Trustee not affiliated with the Advisor, plus specified amounts to the Board Chairperson and Vice Chairperson and to each committee Chairperson.
Typesetting and Filing Service Fees. Under an agreement with DIMA, DIMA is compensated for providing typesetting and certain regulatory filing services to the Fund. For the six months ended February 29, 2016, the amount charged to the Fund by DIMA included in the Statement of Operations under "Reports to shareholders" aggregated $11,548, of which $9,549 is unpaid.
Affiliated Cash Management Vehicles. The Fund may invest uninvested cash balances in Central Cash Management Fund and Deutsche Variable NAV Money Fund, affiliated money market funds which are managed by the Advisor. Each affiliated money market fund seeks to provide a high level of current income consistent with liquidity and the preservation of capital. Each affiliated money market fund is managed in accordance with Rule 2a-7 under the 1940 Act, which governs the quality, maturity, diversity and liquidity of instruments in which a money market fund may invest. Central Cash Management Fund seeks to maintain a stable net asset value, and Deutsche Variable NAV Money Fund maintains a floating net asset value. The Fund indirectly bears its proportionate share of the expenses of each affiliated money market fund in which it invests. Central Cash Management Fund does not pay the Advisor an investment management fee. To the extent that Deutsche Variable NAV Money Fund pays an investment management fee to the Advisor, the Advisor will waive an amount of the investment management fee payable to the Advisor by the Fund equal to the amount of the investment management fee payable on the Fund's assets invested in Deutsche Variable NAV Money Fund.
E. Concentration of Ownership
From time to time, the Fund may have a concentration of several shareholder accounts, including affiliated Deutsche Funds, holding a significant percentage of shares outstanding. Investment activities of these shareholders could have a material impact on the Fund.
At February 29, 2016, Deutsche Select Alternative Allocation Fund and Deutsche Alternative Asset Allocation VIP held approximately 35% and 14% of the outstanding shares of the Fund.
F. Line of Credit
The Fund and other affiliated funds (the "Participants") share in a $400 million revolving credit facility provided by a syndication of banks. The Fund may borrow for temporary or emergency purposes, including the meeting of redemption requests that otherwise might require the untimely disposition of securities. The Participants are charged an annual commitment fee which is allocated based on net assets, among each of the Participants. Interest is calculated at a rate per annum equal to the sum of the Federal Funds Rate plus 1.25 percent plus if the one-month LIBOR exceeds the Federal Funds Rate, the amount of such excess. The Fund may borrow up to a maximum of 20 percent of its net assets under the agreement. The Fund had no outstanding loans at February 29, 2016.
G. Share Transactions
The following table summarizes share and dollar activity in the Fund:
| Six Months Ended February 29, 2016 | Year Ended August 31, 2015 | |||
| Shares | Dollars | Shares | Dollars | |
| Shares sold | ||||
| Class A | 97,084 | $ 815,456 | 258,198 | $ 2,174,369 |
| Class C | 37,370 | 292,743 | 18,691 | 147,321 |
| Class S | 1,191,536 | 10,098,323 | 1,193,679 | 10,147,826 |
| Institutional Class | 534,012 | 4,574,191 | 207,799 | 1,781,028 |
| $ 15,780,713 | $ 14,250,544 | |||
| Shares redeemed | ||||
| Class A | (193,187) | $ (1,612,099) | (1,128,162) | $ (9,492,366) |
| Class C | (211,187) | (1,654,691) | (559,767) | (4,423,496) |
| Class S | (1,281,694) | (10,834,895) | (3,469,836) | (29,514,703) |
| Institutional Class | (2,050,678) | (17,556,923) | (10,598,032) | (90,977,104) |
| $ (31,658,608) | $ (134,407,669) | |||
| Net increase (decrease) | ||||
| Class A | (96,103) | $ (796,643) | (869,964) | $ (7,317,997) |
| Class C | (173,817) | (1,361,948) | (541,076) | (4,276,175) |
| Class S | (90,158) | (736,572) | (2,276,157) | (19,366,877) |
| Institutional Class | (1,516,666) | (12,982,732) | (10,390,233) | (89,196,076) |
| $ (15,877,895) | $ (120,157,125) | |||
Information About Your Fund's Expenses
As an investor of the Fund, you incur two types of costs: ongoing expenses and transaction costs. Ongoing expenses include management fees, distribution and service (12b-1) fees and other Fund expenses. Examples of transaction costs include sales charges (loads), redemption fees and account maintenance fees, which are not shown in this section. The following tables are intended to help you understand your ongoing expenses (in dollars) of investing in the Fund and to help you compare these expenses with the ongoing expenses of investing in other mutual funds. In the most recent six-month period, the Fund limited these expenses; had it not done so, expenses would have been higher. The example in the table is based on an investment of $1,000 invested at the beginning of the six-month period and held for the entire period (September 1, 2015 to February 29, 2016).
The tables illustrate your Fund's expenses in two ways:
— Actual Fund Return. This helps you estimate the actual dollar amount of ongoing expenses (but not transaction costs) paid on a $1,000 investment in the Fund using the Fund's actual return during the period. To estimate the expenses you paid over the period, simply divide your account value by $1,000 (for example, an $8,600 account value divided by $1,000 = 8.6), then multiply the result by the number in the "Expenses Paid per $1,000" line under the share class you hold.
— Hypothetical 5% Fund Return. This helps you to compare your Fund's ongoing expenses (but not transaction costs) with those of other mutual funds using the Fund's actual expense ratio and a hypothetical rate of return of 5% per year before expenses. Examples using a 5% hypothetical fund return may be found in the shareholder reports of other mutual funds. The hypothetical account values and expenses may not be used to estimate the actual ending account balance or expenses you paid for the period.
Please note that the expenses shown in these tables are meant to highlight your ongoing expenses only and do not reflect any transaction costs. The "Expenses Paid per $1,000" line of the tables is useful in comparing ongoing expenses only and will not help you determine the relative total expense of owning different funds. Subject to certain exceptions, an account maintenance fee of $20.00 assessed once per calendar year for Classes A, C and S shares may apply for accounts with balances less than $10,000. This fee is not included in these tables. If it was, the estimate of expenses paid for Classes A, C and S shares during the period would be higher, and account value during the period would be lower, by this amount.
| Expenses and Value of a $1,000 Investment for the six months ended February 29, 2016 (Unaudited) | ||||
| Actual Fund Return | Class A | Class C | Class S | Institutional Class |
| Beginning Account Value 9/1/15 | $ 1,000.00 | $ 1,000.00 | $ 1,000.00 | $ 1,000.00 |
| Ending Account Value 2/29/16 | $ 960.80 | $ 956.90 | $ 961.30 | $ 960.60 |
| Expenses Paid per $1,000* | $ 18.04 | $ 21.65 | $ 17.31 | $ 16.82 |
| Hypothetical 5% Fund Return | Class A | Class C | Class S | Institutional Class |
| Beginning Account Value 9/1/15 | $ 1,000.00 | $ 1,000.00 | $ 1,000.00 | $ 1,000.00 |
| Ending Account Value 2/29/16 | $ 1,006.46 | $ 1,002.73 | $ 1,007.21 | $ 1,007.71 |
| Expenses Paid per $1,000* | $ 18.46 | $ 22.16 | $ 17.72 | $ 17.22 |
* Expenses are equal to the Fund's annualized expense ratio for each share class, multiplied by the average account value over the period, multiplied by 182 (the number of days in the most recent six-month period), then divided by 366.
| Annualized Expense Ratios | Class A | Class C | Class S | Institutional Class |
| Deutsche Diversified Market Neutral Fund† | 3.70% | 4.45% | 3.55% | 3.45% |
† Includes interest and dividend expense on securities sold short of 1.90% for each class.
For more information, please refer to the Fund's prospectus.
For an analysis of the fees associated with an investment in the Fund or similar funds, please refer to http://apps.finra.org/fundanalyzer/1/fa.aspx.
Advisory Agreement Board Considerations and Fee Evaluation
The Board of Trustees approved the renewal of Deutsche Diversified Market Neutral Fund’s investment management agreement (the "Agreement") with Deutsche Investment Management Americas Inc. ("DIMA") and sub-advisory agreement (the "Sub-Advisory Agreement" and together with the Agreement, the "Agreements") between DIMA and GAM International Management Limited ("GAM") in September 2015.
In terms of the process that the Board followed prior to approving the Agreements, shareholders should know that:
— In September 2015, all of the Fund’s Trustees were independent of DIMA and its affiliates.
— The Trustees met frequently during the past year to discuss fund matters and dedicated a substantial amount of time to contract review matters. Over the course of several months, the Board’s Contract Committee reviewed comprehensive materials received from DIMA, independent third parties and independent counsel. These materials included an analysis of the Fund’s performance, fees and expenses, and profitability from a fee consultant retained by the Fund’s Independent Trustees (the "Fee Consultant"). The Board also received extensive information throughout the year regarding performance of the Fund.
— The Independent Trustees regularly meet privately with counsel to discuss contract review and other matters. In addition, the Independent Trustees were advised by the Fee Consultant in the course of their review of the Fund’s contractual arrangements and considered a comprehensive report prepared by the Fee Consultant in connection with their deliberations.
— In connection with reviewing the Agreements, the Board also reviewed the terms of the Fund’s Rule 12b-1 plan, distribution agreement, administrative services agreement, transfer agency agreement and other material service agreements.
— Based on its evaluation of the information provided, the Contract Committee presented its findings and recommendations to the Board. The Board then reviewed the Contract Committee’s findings and recommendations.
In connection with the contract review process, the Contract Committee and the Board considered the factors discussed below, among others. The Board also considered that DIMA has managed the Fund since its inception, and the Board believes that a long-term relationship with a capable, conscientious advisor is in the best interests of the Fund. The Board considered, generally, that shareholders chose to invest or remain invested in the Fund knowing that DIMA managed the Fund. DIMA is part of Deutsche Bank AG’s ("Deutsche Bank") Asset and Wealth Management ("Deutsche AWM") division. Deutsche AWM is a global asset management business that offers a wide range of investing expertise and resources, including research capabilities in many countries throughout the world. Deutsche Bank has advised the Independent Trustees that the U.S. asset management business continues to be a critical and integral part of Deutsche Bank, and that Deutsche Bank will continue to make significant investments in Deutsche AWM, including ongoing enhancements to Deutsche AWM’s investment platform. Deutsche Bank also has confirmed its commitment to maintaining strong legal and compliance groups within the Deutsche AWM division.
As part of the contract review process, the Board carefully considered the fees and expenses of each Deutsche fund overseen by the Board in light of the fund’s performance. In many cases, this led to the negotiation and implementation of expense caps. As part of these negotiations, the Board indicated that it would consider relaxing these caps in future years following sustained improvements in performance, among other considerations.
While shareholders may focus primarily on fund performance and fees, the Fund’s Board considers these and many other factors, including the quality and integrity of DIMA’s and GAM’s personnel and such other issues as back-office operations, fund valuations, and compliance policies and procedures.
Nature, Quality and Extent of Services. The Board considered the terms of the Agreements, including the scope of advisory services provided under the Agreements. The Board noted that, under the Agreements, DIMA and GAM provide portfolio management services to the Fund and that, pursuant to a separate administrative services agreement, DIMA provides administrative services to the Fund. The Board considered the experience and skills of senior management and investment personnel, the resources made available to such personnel, the ability of DIMA to attract and retain high-quality personnel, and the organizational depth and stability of DIMA. The Board also requested and received information regarding DIMA’s oversight of Fund sub-advisers, including GAM. The Board reviewed the Fund’s performance over short-term and long-term periods and compared those returns to various agreed-upon performance measures, including market index(es) and a peer universe compiled using information supplied by Morningstar Direct ("Morningstar"), an independent fund data service. The Board also noted that it has put into place a process of identifying "Focus Funds" (e.g., funds performing poorly relative to a peer universe), and receives additional reporting from DIMA regarding such funds and, where appropriate, DIMA’s plans to address underperformance. The Board believes this process is an effective manner of identifying and addressing underperforming funds. Based on the information provided, the Board noted that for the one-, three- and five-year periods ended December 31, 2014, the Fund’s performance (Class A shares) was in the 4th quartile, 3rd quartile and 2nd quartile, respectively of the applicable Morningstar universe (the 1st quartile being the best performers and the 4th quartile being the worst performers). The Board also observed that the Fund has underperformed its benchmark in the one-, three- and five-year periods ended December 31, 2014. The Board observed that there were limitations to the usefulness of the comparative data provided by Morningstar, noting that the applicable Morningstar universe for the Fund included funds that pursue different investment programs as compared to that pursued by the Fund. The Board noted the disappointing investment performance of the Fund in recent periods and continued to discuss with senior management of DIMA the factors contributing to such underperformance and actions being taken to improve performance. The Board observed that the Fund had experienced improved relative performance during the first seven months of 2015. The Board recognized the efforts by DIMA in recent years to enhance its investment platform and improve long-term performance across the Deutsche fund complex.
Fees and Expenses. The Board considered the Fund’s investment management fee schedule, sub-advisory fee schedule, operating expenses and total expense ratios, and comparative information provided by Lipper Inc. ("Lipper") and the Fee Consultant regarding investment management fee rates paid to other investment advisors by similar funds (1st quartile being the most favorable and 4th quartile being the least favorable). With respect to management fees paid to other investment advisors by similar funds, the Board noted that the contractual fee rates paid by the Fund, which include a 0.10% fee paid to DIMA under the Fund’s administrative services agreement, were equal to the median of the applicable Lipper peer group (based on Lipper data provided as of December 31, 2014). With respect to the sub-advisory fee paid to GAM, the Board noted that the fee is paid by DIMA out of its fee and not directly by the Fund. The Board noted that the Fund’s Class A shares total (net) operating expenses (excluding 12b-1 fees) were expected to be higher than the median (3rd quartile) of the applicable Lipper expense universe (based on Lipper data provided as of December 31, 2014, and analyzing Lipper expense universe Class A (net) expenses less any applicable 12b-1 fees) ("Lipper Universe Expenses"). The Board also reviewed data comparing each share class’s total (net) operating expenses to the applicable Lipper Universe Expenses. The Board observed that the Lipper expense universe for the Fund included funds that pursue different investment programs as compared to that pursued by the Fund. The Board noted that the expense limitations agreed to by DIMA were expected to help the Fund’s total (net) operating expenses remain competitive. The Board considered the Fund’s management fee rate as compared to fees charged by DIMA to comparable Deutsche U.S. registered funds ("Deutsche Funds"), noting that DIMA indicated that it does not provide services to any other comparable Deutsche Funds. The information requested by the Board as part of its review of fees and expenses also included information about institutional accounts (including any sub-advised funds and accounts) and funds offered primarily to European investors ("Deutsche Europe funds") managed by Deutsche AWM. The Board noted that DIMA indicated that Deutsche AWM does not manage any institutional accounts or Deutsche Europe funds comparable to the Fund.
On the basis of the information provided, the Board concluded that management fees were reasonable and appropriate in light of the nature, quality and extent of services provided by DIMA and GAM.
Profitability. The Board reviewed detailed information regarding revenues received by DIMA under the Agreement. The Board considered the estimated costs and pre-tax profits realized by DIMA from advising the Deutsche Funds, as well as estimates of the pre-tax profits attributable to managing the Fund in particular. The Board also received information regarding the estimated enterprise-wide profitability of DIMA and its affiliates with respect to all fund services in totality and by fund. The Board and the Fee Consultant reviewed DIMA’s methodology in allocating its costs to the management of the Fund. Based on the information provided, the Board concluded that the pre-tax profits realized by DIMA in connection with the management of the Fund were not unreasonable. The Board also reviewed certain publicly available information regarding the profitability of certain similar investment management firms. The Board noted that while information regarding the profitability of such firms is limited (and in some cases is not necessarily prepared on a comparable basis), DIMA and its affiliates’ overall profitability with respect to the Deutsche Funds (after taking into account distribution and other services provided to the funds by DIMA and its affiliates) was lower than the overall profitability levels of most comparable firms for which such data was available. The Board did not consider the profitability of GAM with respect to the Fund. The Board noted that DIMA pays GAM’s fee out of its management fee, and its understanding that GAM’s sub-advisory fee schedule was the product of an arm’s length negotiation with DIMA.
Economies of Scale. The Board considered whether there are economies of scale with respect to the management of the Fund and whether the Fund benefits from any economies of scale. The Board noted that the Fund’s investment management fee schedule includes fee breakpoints. The Board concluded that the Fund’s fee schedule represents an appropriate sharing between the Fund and DIMA of such economies of scale as may exist in the management of the Fund at current asset levels.
Other Benefits to DIMA and GAM and Their Affiliates. The Board also considered the character and amount of other incidental benefits received by DIMA and GAM and their affiliates, including any fees received by DIMA for administrative services provided to the Fund and any fees received by an affiliate of DIMA for distribution services. The Board also considered benefits to DIMA and GAM related to brokerage and soft-dollar allocations, including allocating brokerage to pay for research generated by parties other than the executing broker dealers, which pertain primarily to funds investing in equity securities, along with the incidental public relations benefits to DIMA and GAM related to Deutsche Funds advertising and cross-selling opportunities among DIMA products and services. The Board considered these benefits in reaching its conclusion that the Fund’s management fees were reasonable.
Compliance. The Board considered the significant attention and resources dedicated by DIMA to documenting and enhancing its compliance processes in recent years. The Board noted in particular (i) the experience and seniority of the individual serving as DIMA’s and the Fund’s chief compliance officer; (ii) the large number of DIMA compliance personnel; and (iii) the substantial commitment of resources by DIMA and its affiliates to compliance matters. The Board also considered the attention and resources dedicated by DIMA to the oversight of the investment sub-advisor’s compliance program and compliance with the applicable fund policies and procedures.
Based on all of the information considered and the conclusions reached, the Board unanimously determined that the continuation of the Agreements is in the best interests of the Fund. In making this determination, the Board did not give particular weight to any single factor identified above. The Board considered these factors over the course of numerous meetings, certain of which were in executive session with only the Independent Trustees and counsel present. It is possible that individual Trustees may have weighed these factors differently in reaching their individual decisions to approve the continuation of the Agreements.
Account Management Resources
| For More Information | The automated telephone system allows you to access personalized account information and obtain information on other Deutsche funds using either your voice or your telephone keypad. Certain account types within Classes A, C and S also have the ability to purchase, exchange or redeem shares using this system. For more information, contact your financial advisor. You may also access our automated telephone system or speak with a Shareholder Service representative by calling: (800) 728-3337 |
| Web Site | deutschefunds.com View your account transactions and balances, trade shares, monitor your asset allocation, subscribe to fund and account updates by e-mail, and change your address, 24 hours a day. Obtain prospectuses and applications, blank forms, interactive worksheets, news about Deutsche funds, retirement planning information, and more. |
| Written Correspondence | Deutsche Asset Management PO Box 219151 |
| Proxy Voting | The fund's policies and procedures for voting proxies for portfolio securities and information about how the fund voted proxies related to its portfolio securities during the 12-month period ended June 30 are available on our Web site — deutschefunds.com (click on "proxy voting"at the bottom of the page) — or on the SEC's Web site — sec.gov. To obtain a written copy of the fund's policies and procedures without charge, upon request, call us toll free at (800) 728-3337. |
| Portfolio Holdings | Following the fund's fiscal first and third quarter-end, a complete portfolio holdings listing is filed with the SEC on Form N-Q. This form will be available on the SEC's Web site at sec.gov, and it also may be reviewed and copied at the SEC's Public Reference Room in Washington, D.C. Information on the operation of the SEC's Public Reference Room may be obtained by calling (800) SEC-0330. The fund's portfolio holdings are also posted on deutschefunds.com from time to time. Please see the fund's current prospectus for more information. |
| Principal Underwriter | If you have questions, comments or complaints, contact: DeAWM Distributors, Inc. 222 South Riverside Plaza (800) 621-1148 |
| Investment Management | Deutsche Investment Management Americas Inc. ("DIMA" or the "Advisor"), which is part of Deutsche Asset Management, is the investment advisor for the fund. DIMA and its predecessors have more than 80 years of experience managing mutual funds and DIMA provides a full range of investment advisory services to both institutional and retail clients. DIMA is an indirect, wholly owned subsidiary of Deutsche Bank AG. Deutsche Bank AG is a major global banking institution engaged in a wide variety of financial services, including investment management, retail, private and commercial banking, investment banking and insurance. Deutsche Asset Management is the retail brand name in the U.S. for the asset management activities of Deutsche Bank AG and DIMA. Deutsche Asset Management is committed to delivering the investing expertise, insight and resources of this global investment platform to American investors. |
| Class A | Class C | Class S | Institutional Class | |
| Nasdaq Symbol | DDMAX | DDMCX | DDMSX | DDMIX |
| CUSIP Number | 25159K 861 | 25159K 838 | 25159K 846 | 25159K 853 |
| Fund Number | 496 | 796 | 2096 | 592 |
Privacy Statement
| FACTS | What Does Deutsche Asset Management Do With Your Personal Information? | ||
| Why? | Financial companies choose how they share your personal information. Federal law gives consumers the right to limit some but not all sharing. Federal law also requires us to tell you how we collect, share and protect your personal information. Please read this notice carefully to understand what we do. | ||
| What? | The types of personal information we collect and share can include: — Social Security number — Account balances — Purchase and transaction history — Bank account information — Contact information such as mailing address, e-mail address and telephone number | ||
| How? | All financial companies need to share customers' personal information to run their everyday business. In the section below, we list the reasons financial companies can share their customers' personal information, the reasons Deutsche Asset Management chooses to share and whether you can limit this sharing. | ||
| Reasons we can share your personal information | Does Deutsche Asset Management share? | Can you limit this sharing? | |
| For our everyday business purposes — such as to process your transactions, maintain your account(s), respond to court orders or legal investigations | Yes | No | |
| For our marketing purposes — to offer our products and services to you | Yes | No | |
| For joint marketing with other financial companies | No | We do not share | |
| For our affiliates' everyday business purposes — information about your transactions and experiences | No | We do not share | |
| For our affiliates' everyday business purposes — information about your creditworthiness | No | We do not share | |
| For non-affiliates to market to you | No | We do not share | |
| Questions? | Call (800) 728-3337 or e-mail us at service@db.com | ||
| Who we are | |
| Who is providing this notice? | DeAWM Distributors, Inc.; Deutsche Investment Management Americas Inc.; DeAWM Trust Company; the Deutsche Funds |
| What we do | |
| How does Deutsche Asset Management protect my personal information? | To protect your personal information from unauthorized access and use, we use security measures that comply with federal law. These measures include computer safeguards and secured files and buildings. |
| How does Deutsche Asset Management collect my personal information? | We collect your personal information, for example. When you: — open an account — give us your contact information — provide bank account information for ACH or wire transactions — tell us where to send money — seek advice about your investments |
| Why can't I limit all sharing? | Federal law gives you the right to limit only — sharing for affiliates' everyday business purposes — information about your creditworthiness — affiliates from using your information to market to you — sharing for non-affiliates to market to you State laws and individual companies may give you additional rights to limit sharing. |
| Definitions | |
| Affiliates | Companies related by common ownership or control. They can be financial or non-financial companies. Our affiliates include financial companies with the DWS or Deutsche Bank ("DB") name, such as DB AG Frankfurt and DB Alex Brown. |
| Non-affiliates | Companies not related by common ownership or control. They can be financial and non-financial companies. Non-affiliates we share with include account service providers, service quality monitoring services, mailing service providers and verification services to help in the fight against money laundering and fraud. |
| Joint marketing | A formal agreement between non-affiliated financial companies that together market financial products or services to you. Deutsche Asset Management does not jointly market. |
| Rev. 08/2015 | |
Notes
Notes
Notes
Notes
Notes

| ITEM 2. | CODE OF ETHICS | |
| Not applicable. | ||
| ITEM 3. | AUDIT COMMITTEE FINANCIAL EXPERT | |
| Not applicable | ||
| ITEM 4. | PRINCIPAL ACCOUNTANT FEES AND SERVICES | |
| Not applicable | ||
| ITEM 5. | AUDIT COMMITTEE OF LISTED REGISTRANTS | |
| Not applicable | ||
| ITEM 6. | SCHEDULE OF INVESTMENTS | |
| Not applicable | ||
| ITEM 7. | DISCLOSURE OF PROXY VOTING POLICIES AND PROCEDURES FOR CLOSED-END MANAGEMENT INVESTMENT COMPANIES | |
| Not applicable | ||
| ITEM 8. | PORTFOLIO MANAGERS OF CLOSED-END MANAGEMENT INVESTMENT COMPANIES | |
| Not applicable | ||
| ITEM 9. | PURCHASES OF EQUITY SECURITIES BY CLOSED-END MANAGEMENT INVESTMENT COMPANY AND AFFILIATED PURCHASERS | |
| Not applicable | ||
| ITEM 10. | SUBMISSION OF MATTERS TO A VOTE OF SECURITY HOLDERS | |
| There were no material changes to the procedures by which shareholders may recommend nominees to the Fund’s Board. The primary function of the Nominating and Governance Committee is to identify and recommend individuals for membership on the Board and oversee the administration of the Board Governance Guidelines. Shareholders may recommend candidates for Board positions by forwarding their correspondence by U.S. mail or courier service to Kenneth C. Froewiss, Independent Chairman, Deutsche Mutual Funds, P.O. Box 390601, Cambridge, MA 02139. | ||
| ITEM 11. | CONTROLS AND PROCEDURES | |
| (a) | The Chief Executive and Financial Officers concluded that the Registrant’s Disclosure Controls and Procedures are effective based on the evaluation of the Disclosure Controls and Procedures as of a date within 90 days of the filing date of this report. | |
| (b) | There have been no changes in the registrant’s internal control over financial reporting that occurred during the second fiscal quarter of the period covered by this report that has materially affected, or is reasonably likely to materially affect, the registrant’s internal controls over financial reporting. | |
ITEM 12. | EXHIBITS | |
| (a)(1) | Not applicable | |
| (a)(2) | Certification pursuant to Rule 30a-2(a) under the Investment Company Act of 1940 (17 CFR 270.30a-2(a)) is filed and attached hereto as Exhibit 99.CERT. | |
| (b) | Certification pursuant to Rule 30a-2(b) under the Investment Company Act of 1940 (17 CFR 270.30a-2(b)) is furnished and attached hereto as Exhibit 99.906CERT. | |
SIGNATURES
Pursuant to the requirements of the Securities Exchange Act of 1934 and the Investment Company Act of 1940, the registrant has duly caused this report to be signed on its behalf by the undersigned, thereunto duly authorized.
| Registrant: | Deutsche Diversified Market Neutral Fund, a series of Deutsche Market Trust |
| By: | /s/Brian E. Binder Brian E. Binder President |
| Date: | April 29, 2016 |
Pursuant to the requirements of the Securities Exchange Act of 1934 and the Investment Company Act of 1940, this report has been signed below by the following persons on behalf of the registrant and in the capacities and on the dates indicated.
| By: | /s/Brian E. Binder Brian E. Binder President |
| Date: | April 29, 2016 |
| By: | /s/Paul Schubert Paul Schubert Chief Financial Officer and Treasurer |
| Date: | April 29, 2016 |