Use these links to rapidly review the document
TABLE OF CONTENTS
Item 8. Financial Statements
Table of Contents
UNITED STATES SECURITIES AND EXCHANGE COMMISSION
Washington D.C. 20549
Form 10-K
| | |
| ý | | ANNUAL REPORT PURSUANT TO SECTION 13 OR 15(d)
OF THE SECURITIES EXCHANGE ACT OF 1934 |
|
|
For the fiscal year ended: December 31, 2008 |
OR |
o |
|
TRANSITION REPORT PURSUANT TO SECTION 13 OR 15(d)
OF THE SECURITIES EXCHANGE ACT OF 1934 |
Commission File Number: 0-02517
Toreador Resources Corporation
(Exact name of Registrant as specified in its charter)
| | |
| Delaware | | 75-0991164 |
(State or other jurisdiction
of incorporation) | | (I.R.S. Employer
Identification Number) |
13760 Noel Road #1100
Dallas, Texas
(Address of principal executive office) |
|
75240
(Zip Code) |
Registrant's telephone number, including area code: (214) 559-3933
Securities registered pursuant to Section 12(b) of the Exchange Act:
| | |
Title of each Class: | | Name of each exchange on which registered: |
|---|
COMMON STOCK, PAR VALUE
$.15625 PER SHARE | | NASDAQ GLOBAL MARKET |
Securities registered pursuant to Section 12(g) of the Exchange Act: None
Indicate by check mark if the registrant is a well-known seasoned issuer, as defined in Rule 405 of the Securities Act. Yes o No ý
Indicate by check mark if the registrant is not required to file reports pursuant to Section 13 or Section 15(d) of the Act. Yes o No ý
Indicate by check whether the registrant (1) has filed all reports required to be filed by Section 13 or 15(d) of the Securities Exchange Act of 1934 during the preceding 12 months (or for such shorter period that the Registrant was required to file such reports), and (2) has been subject to such filing requirements for the past 90 days. Yes ý No o
Indicate by check mark if disclosure of delinquent filers pursuant to Item 405 of Regulation S-K is not contained herein, and will not be contained, to the best of Registrant's knowledge, in definitive proxy or information statements incorporated by reference in Part III of this Form 10-K or any amendment to this Form 10-K. o
Indicate by check mark whether the registrant is a large accelerated filer, an accelerated filer, or a non-accelerated filer or a smaller reporting company. See definitions of "large accelerated filer," "accelerated filer," and "smaller reporting company" in Rule 12b-2 of the Exchange Act.
| | | | | | |
| Large accelerated filer o | | Accelerated filer ý | | Non-accelerated filer o
(Do Not Check if a Smaller
Reporting Company) | | Smaller reporting company o |
Indicate by check mark whether the registrant is a shell company (as defined by Rule 12b-2 of the Exchange Act). Yes o No ý
The aggregate market value of the voting and non-voting common equity of the registrant held by non-affiliates, computed by reference to the closing sales price of such stock, as of June 30, 2008 was $115,162,327. (For purposes of determination of the aggregate market value, only directors, executive officers and 10% or greater stockholders have been deemed affiliates.)
The number of shares outstanding of the registrant's common stock, par value $.15625, as of March 10, 2009 was 20,264,333 shares.
DOCUMENTS INCORPORATED BY REFERENCE
Portions of the registrant's Proxy Statement for the 2009 Annual Meeting of Stockholders, expected to be filed on or before April 30, 2009, are incorporated by reference into Part III of this Form 10-K
Table of Contents
TABLE OF CONTENTS
Table of Contents
PART I
Items 1 and 2. Business and Properties
Toreador Resources Corporation, a Delaware corporation (together with its direct and indirect subsidiaries, "Toreador," "we," "us," "our," or the "Company"), is an independent international energy company engaged in oil and natural gas exploration, development, production and acquisition activities. We are primarily focused on our core areas in France and Hungary. Our international operations are all located in European Union or European Union candidate countries that we believe have stable governments, have existing transportation infrastructure, have attractive fiscal policies and are net importers of oil and natural gas.
We currently hold interests in permits granting us the right to explore and develop oil and natural gas properties in offshore and onshore Turkey, Hungary, Romania and France. At December 31, 2008, we held interests in approximately 5.9 million gross acres and approximately 4.2 million net acres, of which 99.4% is undeveloped. At December 31, 2008, our estimated net proved reserves were 7.6 million barrels of oil equivalent (MMBOE).
Historically, our operations have been concentrated in the Paris Basin in France and in south central onshore Turkey and offshore Turkey in the Black Sea. These two regions accounted for 98% of our total proved reserves as of December 31, 2008 and approximately 90.4% of our total production for the year ended December 31, 2008.
Incorporated in 1951, we were formerly known as Toreador Royalty Corporation.
See the "Glossary of Selected Oil and Natural Gas Terms" at the end of Item 1 for the definition of certain terms in this annual report.
Recent Developments
On January 23, 2009 the Company and Nanes Balkany Partners I LP ("Nanes Balkany"), one of its largest stockholders, announced that they had entered into a settlement agreement (the "Agreement") pursuant to which the Company appointed Julien Balkany, Peter Hill, non-executive Chairman, and Craig McKenzie to its Board of Directors, Nigel J. Lovett resigned as Chief Executive Officer, President and a director of the Company, and John M. McLaughlin resigned as a non-executive Chairman and a director. The Company also appointed Craig McKenzie interim Chief Executive Officer while a search for a permanent Chief Executive Officer is completed. The Company has also agreed to redeem its Stockholder Rights Plan announced November 20, 2008 after obtaining the requisite approvals from its lender.
On February 3, 2009, the Company announced that it had agreed to revised terms for the sale to Petrol Ofisi of a 26.75% interest in the South Akcakoca Sub-Basin project and associated licenses located in the Black Sea offshore Turkey in the amount of US $55 million. Following the closing Toreador will retain a 10% interest in the SASB.
On February 23, 2009 the Company announced a cohesive plan to turn around the Company that includes cutting overhead, divesting non-core assets, reducing debt and improving its core operations in France and Hungary. The plan includes closing the corporate headquarters in Dallas, Texas and moving it to Paris, France and exiting Turkey by the end of 2009.
On March 3, 2009, the sale to Petrol Ofisi of 26.75% out of a 36.75% working interest in the South Akcakoca Sub-Basin for $55 million was closed. Upon closing the Company received cash proceeds of $50 million and the additional $5 million is due on September 1, 2009.
Upon funding of the sale to Petrol Ofisi, the Company retired the outstanding amount due under the facilities with the International Finance Corporation. The total amount paid was $36.4 million which was comprised of $30 million in principal, $5.9 million in additional compensation, as defined in the Loan and
1
Table of Contents
Guarantee Agreement among Toreador Resources Corporation and the International Finance Corporation dated December 28, 2006, and $500,000 in accrued interest and fees.
Update on current operations
On February 6, 2009, the Balotaszallas-E-1 ("THL Ba-E-1") well was spudded. This is a deep Kiskunhalas well in the Tompa Block. The well is being drilled in an updip location to evaluate a deep gas play that was first identified by two wells drilled in the late 1980's by OKGT (the former Hungarian state oil company) and the U.S. Geological Survey. The wells produced gas in drill stem tests from a conglomerate encountered below 3,200m depth in the northwestern corner of the Tompa block. The terms of the joint venture for drilling the THL Ba-E-1 well are for the partner to drill, case and test a well projected to cost up to $21 million in return for a 75% interest in the Tompa block. Toreador is being carried for the first well and retains a 25% working interest in the block.
In the fourth quarter of 2008 and during the first quarter of 2009, Toreador farmed out all of its working interest in Romania to three different companies and has closed its office. The terms of each farmout are as follows:
A joint venture agreement with Stratum Energy Company Limited, a private Texas-based exploration and production company was entered into in the third quarter of 2008. The terms of the agreement call for Stratum to either re-enter a well and drill two new wells or drill three new wells to earn a 70% interest and operatorship in the Moinesti block. In January 2009, Toreador farmed out its remaining 30% interest to a Romanian oil and gas company for a 15% gross overriding royalty interest.
In January 2009, Toreador sold its interest to Lotus Petrol SRL, a Romanian oil and gas company, in consideration of i) a 12.5% gross overriding royalty interest; ii) an agreement to drill a 3,000 meter obligation well in 2009; iii) the assumption of all environmental liabilities in the field, both past and future and iv) the assumption of all liabilities related to any and all service contracts.
In February 2009, we entered into a Farmout Agreement with Amromco Energy L.L.C., whereby we farmed out 100% of our interest in this block in exchange for a 10% gross overriding royalty interest and the agreement to drill a 1,500 meter well in the next two years.
Strategy
The Company is in the process of formulating a new long-term strategy that will be presented to shareholders by the planned Annual Shareholder Meeting set for June 2009. In the interim, the Company has developed a platform that is in direct response to the current crisis in the credit and equity markets and sharply reduced commodity prices. The Company is facing significant debt obligations and current commodity prices are less than half that of peak 2008 levels.
Under the new corporate platform the Company has taken the following proactive steps:
- •
- The $55 million sale of a 26.75% interest in the South Akcakoca Sub-Basin ("SASB") to Petrol Ofisi was closed and $50 million was funded on March 3, 2009;
2
Table of Contents
- •
- The Company has retained Stellar Energy Advisors, based in London, UK, to manage an open bid process to sell its remaining 10% interest in the SASB, in addition to its onshore production and 2.7 million net acres in exploration licenses that are currently held;
- •
- Per the covenants of the International Finance Corporation facilities, a portion of the net proceeds of the Petrol Ofisi sale have been used to fully repay and retire the facility;
- •
- A share buyback program has been adopted by the Board of Directors for the repurchase of up to 1 million common shares of Toreador that may be repurchased in the open market at any time over the next 12 months;
- •
- The Company intends to repurchase a portion of the Convertible Senior Notes;
- •
- Notwithstanding that the Company is incorporated in Delaware and listed on the NASDAQ, its operations are located in Europe. With its current headquarters in Dallas costing over $7 million a year in overhead, there is considerable room to improve efficiency and integrate activities across the Company. The Company expects to have completed moving its headquarters to its Paris office by July 2009, reducing its presence in the United States to focus only on securities exchange requirements and investor relations;
- •
- The Company plans to continue with its efforts to establish a strong presence in Hungary and is currently drilling an exploration well on the Tompa Block in Hungary, the results of which are expected by early second quarter 2009;
- •
- The Paris Basin will remain the Company's core asset with current production of approximately 1,000 net barrels per day coming from low-decline, long-life assets. A comprehensive portfolio review of our fields and 461,000 net acres held pursuant to licenses is now underway. The results of the study will be launched as part of the three year strategic plan at the Annual Stockholders Meeting in June 2009.
The Corporate Platform focuses on the following four areas:
Due to the Company's operations being in Europe we will relocate the corporate headquarters to our Paris, France office and we have retained Stellar Energy Advisors to assist in selling our remaining interest in Turkey. The relocation and the sale will result in a significant savings in general and administrative costs specifically that should be accomplished through a consolidation of job functions and success based compensation for employees.
In 2009 and 2010 the Company's primary use of cash will be for the reduction of debt, purchasing up to 1 million shares of Toreador common stock and funding our 2009 capital expenditure program.
Since we retired the facilities with the International Finance Corporation in March 2009, our focus will be on the repurchasing outstanding Convertible Senior Notes to reduce further our debt.
Our capital expenditure program is limited to those costs that must be incurred in order to retain our interest in the licenses. We estimate that our 2009 capital expenditure program will be approximately $7.2 million, which could possibly be reduced further if we sell our remaining interest in Turkey. We will continue to farmout all seismic and exploration drilling. We will attempt to secure partners to pay for all seismic and drilling costs up to casing point. Our plan is for industry partners to pay for 100% of all exploratory costs in order to earn a 50%-75% working interest.
3
Table of Contents
The Company believes that stockholder value can best be achieved by focusing on those areas that offer the best chance of success and have a proven infrastructure for the oil and natural gas industry. We believe that our current acreage positions in France and Hungary can serve as the platform for growth and offer the Company the best opportunity to create stockholder value. Therefore, we have farmed out our interest in Romania, retaining an override in the permits, and we plan to monetize our remaining interest in Turkey prior to the end of 2009.
The Board and management are committed to the best practices in corporate governance and will continually be reviewing and where necessary revising the procedures used to operate the Company. We intend to use third party expertise to review and challenge our procedures and methodologies, both operationally and administratively. Also, performance management actions followed by positive results will become a driving principle in operating the Company.
Our Properties
We hold a 100% working interest and operate the production permit covering the Charmottes Field, which currently has 7 producing oil wells. The field is producing from two separate reservoirs, one at 1,500m (4,500 feet) in a fractured limestone from the Dogger formation and the second reservoir from the Triassic sandstones at 2,500m (7,500 feet) in the Donnemarie formation. Production is approximately 140 BOPD from both reservoirs.
We operate and hold a 100% working interest in the two permits covering the Neocomian Fields, which consist of a group of four oil fields. The complex currently has 80 producing oil wells and production is approximately 850 BOPD.
An exploration prospect has been identified in the Dogger objective located 500 meters below the Neocomian producing reservoirs. This prospect is based upon oil shows found in 1957 in the Dogger section of the discovery well CR01 for the Chateaurenard field. A structural updip of 10 meters to the CR1 well has been identified from the seismic 500 meters north of the well.
We hold a 100% working interest and are the operator of this permit which covers approximately 93,157 net acres located east of the Neocomian Fields. A Dogger prospect called Les Colins was defined in 2008. Oil shows in the Dogger were encountered in 1984 in the Cudot 1 well drilled by Sun Oil on the flank of the structure in a downdip position. We propose to drill a well (Les Colins) to reach the top of the structure with a 20 meter updip to the Cudot 1 well. This prospect is analogous to the CR76 Dogger prospect on the Neocomian concession
We hold a 50% working interest in this permit covering approximately 23,635 net acres which is operated by Lundin Petroleum AB.
4
Table of Contents
We hold a 100% working interest and operate this permit covering approximately 33,111 acres. After drilling the Ichy 1D dry hole in May 2007, the seismic lines have been entirely reprocessed and are being re-interpreted now for delineating new attractive prospects at the Dogger objective. We anticipate that drilling activities will resume in 2010 on this acreage.
We hold a 100% working interest and operate this permit covering approximately 65,976 acres. The existing seismic lines representing around 900 km. have been interpreted to identify drillable Dogger prospects in the Jurassic section, analogous to the Itteville field sitting immediately north of our permit. It is anticipated that drilling will take place in 2010 to test our best Dogger prospect on this acreage.
We hold a 100% working interest and operate this permit covering approximately 82,779 acres. The existing seismic lines representing around 1000 km. were reprocessed and interpreted in 2008. Several Dogger prospects have been identified and mapped. We are anticipating drilling the Dogger La Garenne prospect in early 2010. This prospect is an analogous structure to the Saint Martin de Bossenay field located 15 km north which has produced 9 MMBbl. Two wells drilled by Total in the 1980's on the prospect had oil shows and some production. These wells were drilled downdip on the flank of the structure.
We hold a 100% working interest and operate this permit covering approximately 33,100 acres. Seismic interpretation is underway on the acreage to delineate prospects in the Portlandian limestone where significant oil shows and production occurred in the 1960's.
The Nogent sur Seine exploration permit was granted 100% to Toreador on September 23, 2008. This permit covers approximately 65,729 acres. All of the existing seismic coverage representing around 1,012 km has been purchased and seismic reprocessing will take place in 2009 to identify Dogger and Triassic prospects over this block, located in the heart of the oil kitchen of the Paris Basin.
The Leudon en Brie permit was granted 100% to Toreador on September 23, 2008 for an initial first four year period. This permit covers approximately 26,193 acres. The 655 km. grid of existing seismic recently purchased in 2008 will be reprocessed in 2009 and interpreted for identifying Dogger and Triassic prospects.
We established our initial position in Hungary in June 2005 through the acquisition of Pogo Hungary Ltd., from Pogo Producing Company for $9 million. We currently hold an interest in one exploration permit covering two blocks aggregating approximately 127,000 net acres.
Two new applications with a combined gross area of 405,000 acres have been submitted and are under consideration by the Hungarian Mining Authority. Both application areas have upside potential given their proximity to existing production and recent discoveries.
5
Table of Contents
As part of the farm-out that was concluded in late 2007, two exploration wells were drilled and a 133 sq. km 3D seismic program (Kunszentmárton program) was acquired in the southern portion of the Szolnok block. The exploration program was funded by four joint venture partners, who agreed to pay 100% of the program's cost to earn an aggregate of 75% working interest. Initially, we retained a 25% working interest in the joint venture and were the operator. The joint venture partners include three independent oil and gas exploration companies, one of which presently operates in Hungary, and a private investment company.
The Tik-1 well was drilled to the primary objective encountering approximately 40 net meters of reservoir quality, gas-filled sand in the lower Pannonian sequence, but analysis of the reservoir gas revealed that it was mainly composed of inert gases with only traces of methane. The well was subsequently suspended pending further analysis.
The second well in the program, Nko-Ny-1, which was drilled to the primary objective failed to encounter commercial hydrocarbons and was declared a dry hole.
In July 2008 one of the joint venture partners increased its participating interest to 59.5% leaving us as the operator with 15% of the Szolnok block. The remaining parties to the agreement reduced their interest in the block accordingly in return for future financial considerations.
A second 3D seismic campaign totaling 145sq. km. was carried out in October 2008 in the Endrod / Mezotur area. The acquisition focused on an area adjacent to several existing producing fields and to a number of discoveries made in the late 1970's by the previous state oil company, OKGT. Preliminary interpretation of the processed data has yielded positive indications however given the time remaining under the current license and the option to establish a production license over a considerable portion of the seismic acquisition area drilling within this area shall be deferred to the development phase which is expected in late 2009 or early 2010.
Interpretation of the Kunszentmárton seismic campaign has yielded a number of leads and prospects, one of which is scheduled to be drilled in the first quarter of 2009.
Two gas wells were drilled by the previous operator in the Szolnok Block, each of which initially tested at over 4 Mmcf per day. These stranded reserves are uneconomic to produce under current market conditions and therefore a call for bids shall be extended to a number of interested parties in 2009.
The farm-out to a private European energy fund was completed in March of 2008. A well of approximately 3,800m (12,470 feet) targeting deep, high-pressure gas up-dip of two wells drilled in the 1980's shall be drilled, cased, fraced and tested at a projected cost of $21 million in return for a 75% interest in any unconventional hydrocarbon resources discovered by the joint venture in the Kiskunhalas Trough area located in the northwest corner of Toreador's Tompa block. Toreador is being carried for its 25% interest in the well. The location was constructed in November and December of 2008 and the well was spudded on February 6, 2009.
A gas sales and technical agreement with a major European gas wholesaler in relation to the Kiha-15 production well is expected to be executed in early 2009. Permitting and planning for the pipeline route are well advanced and production is expected in 2009. Long lead items have been procured and delivery of such items is expected in the first half of 2009.
A 1 km. pipeline connecting the deep Kiskunhalas well and the Kiha-15 location is a component of the Kiha-15 pipeline plans, which once constructed should permit long term production and gas sales from the deep well in 2009.
6
Table of Contents
On March 3, 2009, the sale to Petrol Ofisi of 26.75% out of a 36.75% working interest in the South Akcakoca Sub-Basin for $55 million was closed. Upon closing the Company received proceeds of $50 million and the additional $5 million is due on September 1, 2009.
The Company has retained Stellar Energy Advisors, based in London, UK, to manage an open bid process to sell its remaining 10% interest in the SASB, in addition to its onshore production, and 2.2 million net acres in exploration licenses that are currently held;
We established our initial position in Turkey at the end of 2001 through the acquisition of Madison Oil Company. In Turkey we currently hold interests in 38 exploration and two exploitation permits covering approximately 2.2 million net acres. Our exploration and development program focuses on the following areas:
The Turkish national oil company, TPAO, currently is the operator, and after the sale to Petrol Ofisi, we hold a 10% working interest in the Western Black Sea permits, which cover approximately 961,550 gross acres.
The South Akcakoca sub-basin is an area of approximately 50,000 acres located in the Western Black Sea, offshore Turkey. We discovered gas in September 2004 with the Ayazli-1 well and since that time have drilled 18 additional successful delineation wells. The first phase of infrastructure development included: setting up three production platforms; laying a sub-sea pipeline; constructing the onshore processing facility for the entire sub-basin development; and constructing the onshore pipeline to tie into the national pipeline operated by the Turkish national gas utility. The Second Phase of the development to build a production platform over the Akcakoca 3 and 4 wells and tie the platform to the existing sub sea pipeline network is now in progress. First gas from the Phase II Development is expected to be completed mid 2010. Operator TPAO has proposed at least one deeper water exploration well during 2009.
The Eregli sub-basin is an area of approximately 75,000 acres located in the Western Black Sea, offshore Turkey. Approximately 1225 km of high resolution 2D marine seismic survey on the permit has been acquired in preparation for future exploration.
A joint venture agreement for exploration in the 844,382 gross acre Thrace Black Sea permit area in Turkish waters between the Bulgarian border and the Bosporus has been finalized with a Canadian oil and gas company which agreed to spend approximately $10.7 million in exploration expenses to earn a 42% interest in the seven permit blocks in the area. We have retained a 25% working interest and our prior partner HEMA retained a 33% interest.
Toreador has formed a joint venture with Thrace Basin Natural Gas Corporation and Pinnacle Turkey Inc. to explore six blocks in the northwest area of the Sea of Marmara adjacent to natural gas production onshore in the Thrace area of Turkey and to the immediate west of the offshore Kuzey Marmara Field. A 1,070 km 2D seismic survey and 1,014 km Gravity-Magnetic survey has been completed in the shallow water part of the licenses. The new seismic data is now being processed.
7
Table of Contents
The three permits cover approximately 329,204 acres. We hold a 100% working interest and negotiation is ongoing in the entire block with a potential partner that has already paid a portion of the costs for re-processing of existing 2D seismic data.
We have an exploration permit on three blocks in the Eastern Black Sea offshore Turkey in the coastal waters to the west-northwest of the city of Trabzon. The three blocks total approximately 357,062 acres. We are the operator and hold 100% working interest in this permit.
The Van permit area is in Eastern Turkey and covers approximately 964,629 acres. We have been gathering geological and geophysical data to define prospective structures. We have initiated the re-processing of existing 2D seismic data. We are the operator and hold a 100% working interest.
The Adiyaman permit, in which we hold a 100% working interest, covers approximately 39,450 acres located in southeast Turkey. We have completed interpretation of existing 2D seismic data in the permit area and negotiations are ongoing in the block with a potential farmout partner.
The area is on trend with oil fields in Turkey and Syria and is prospective for both natural gas and oil. Toreador has entered into a joint venture agreement with AKSA Enerji Uretim A.S., a division of the Kazanci Group of Companies, to evaluate the hydrocarbon potential in the 95,897 acre exploration permit area. We have completed the re-processing of all 2D seismic data which were acquired by the previous operator.
In the fourth quarter of 2008 and during the first quarter of 2009, Toreador farmed out all of its working interest in Romania to three different companies and has closed its office. The terms of each farmout are as follows:
A joint venture agreement with Stratum Energy Company Limited, a private Texas-based exploration and production company, was entered into in the third quarter of 2008. The terms of the agreement call for Stratum to either re-enter a well and drill two new wells or drill three new wells to earn a 70% interest and operatorship in the Moinesti block. In January 2009, we farmed out the remaining 30% interest to a Romanian oil and gas company for a 15% gross overriding royalty interest.
In January 2009, we sold our interest to Lotus Petrol SRL, a Romanian oil and gas company, for i) a 12.5% gross overriding royalty interest; ii) an agreement to drill a 3,000 meter well in 2009; iii) the assumption of all environmental liabilities in the field, both past and future, and iv) the assumption of all liabilities related to any and all service contracts.
8
Table of Contents
A farmout agreement was completed and signed in February 2009, with Amromco Energy L.L.C., whereby we farmed out 100% of our interest in exchange for a 10% gross overriding royalty interest in the block and an agreement to drill a 1,500m well in the next two years.
Title to Oil and Natural Gas Properties
We do not hold title to any of our properties, but we have been granted permits by the applicable government entities that allow us to engage in exploration, exploitation and production.
We hold nine French exploration permits: Aufferville, Nemours, Courtenay, Rigny, Joigny, Malesherbes, Mairy, Nogent sur Seine and Leudon en Brie. The French exploration permits have minimum financial requirements that we expect to meet during their terms. If such obligations are not met, the permits could be subject to forfeiture.
Under French mining law, exploitation permits can be extended by successive prolongations, with each prolongation not to exceed 25 years and such extensions are not subject to competitive bidding or public inquiry. Although the French government has no obligation to renew exploitation permits, based on conversations with the French mining authority, we believe it will renew such exploitation permits so long as we, the permit holder, demonstrate financial and technical capabilities and establish the studies used in defining the work schedule.
There is a long and clear track record of extending permits in France. Our subsidiaries have been operating in France since 1993 and have never been denied any exploration or exploitation permit for which they have applied or been denied any extension for which they have applied since 2001. However, there can be no assurance that we will be able to renew our exploitation permits.
The French exploitation permits that cover five producing oil fields in the Paris Basin are:
| | | | | | | | | | | | | |
| |
| | At December 31, 2008 | |
|---|
Property | | Permit
Expiration
Year | | Total Proved
Reserves
(MBbl) | | Post-Expiration
Proved Reserves
(MBbl) | | Percent of Proved
Reserves
Post-Expiration | |
|---|
Neocomian Fields | | | 2011 | | | 4,677 | | | 3,816 | | | 81.61 | % |
Charmottes Field | | | 2013 | | | 238 | | | 105 | | | 44.12 | % |
We have one exploration license that expires in March 2009. Several mining plots "production licenses" shall be applied for in both the Szolnok and Tompa blocks either prior to or post license expiration in March 2009. Development programs shall be implemented once the license has been awarded.
Our Hungarian proved reserves are as follows:
| | | | | | | | | | | | | | | | | | | |
| |
| | At December 31, 2008 | |
|---|
| |
| | Total Proved
Reserves | | Post-Expiration
Proved
Reserves | |
| |
|---|
| |
| | Percent of
Proved
Reserves
Post-Expiration | |
|---|
| | Permit
Expiration
Year | |
|---|
Property | | (MBbl) | | (MMCF) | | (MBbl) | | (MMCF) | |
|---|
Szolnok | | | 2009 | | | 1 | | | 950 | | | .572 | | | 806 | | | 84.86 | % |
In the opinion of Toreador's Hungarian counsel, PRK Partners/Bellak Law office under Hungarian mining law, if we provide the Hungarian mining authority with a closing report accounting for the results of
9
Table of Contents
our exploration on the exploration permit area and such closing report is approved, for one year after March 2009, we will have the exclusive right to apply for a mining plot designation in respect of that area.
If upon timely application for a mining plot designation, we meet the requirements of Hungarian mining law for a mining plot designation, the Hungarian mining authority must grant us the mining plot. We anticipate applying for a mining plot covering the relevant area within the exploration permit within the one year exclusivity period beginning in March 2009 and providing the Hungarian mining authority with the required information to obtain the mining plot designation for the relevant area.
There is a long and clear track record of exploration permits being converted into mining plot designations. Based on information provided by the Hungarian Mining Bureau, since 1991 when MOL (MOL Hungarian Oil and Gas Public Limited Company), formerly the Hungarian state oil company, became a private company, there have been at least 72 mining plots requested, all of which were granted except for eight due to non-compliance to the request for additional information, the lack of a final exploration report, the lack of an environmental license or due to regional incompatibility with the mining rights of another entity. There can be no assurance that we will be able to convert our exploration permit into a mining plot designation.
We have 38 exploration permits covering seven Petroleum Districts. The Western Black Sea permits have been extended through November 2010. The Bakuk permit and the Eastern Black Sea permits expire in September 2009, and we anticipate renewing them for an additional two year term. The Thrace Black Sea licenses expire in June 2009 and will be extended by an additional two years. The Central Black Sea license will be extended from the first quarter of 2009 for an additional two years. The Van and Adiyaman permits expire in May and July, 2010, respectively, and the Sea of Marmara permit expires in late 2011.
Onshore exploration permits are granted for four-year terms and may be extended for two additional two-year terms, and offshore exploration permits are granted for six-year terms and may be extended for two additional three-year terms, provided that drilling obligations stipulated under Turkish law are satisfied. Under Turkish law, exploitation permits are generally granted for a period of 20 years and may be renewed upon application for two additional 10-year periods. If an exploration permit is extended for development as an exploitation permit, the period of the exploration permit is counted toward the 20-year exploitation permit. In the opinion of Toreador's Turkish counsel, Kaya-Aksoy, a holder of an exploration permit that has had a discovery made on such exploration permit area and who applies for an exploitation permit in accordance with Turkish petroleum law shall be granted an exploitation permit for any area or areas covered by the exploration permit up to one-half of the exploration permit area. Therefore, in the opinion of Kaya-Aksoy, upon application for an exploitation permit, the exploration permit covering the area of the South Akcakoca Sub-Basin in which the gas discovery was made will be converted into an exploitation permit with an initial period of 20 years.
In addition, the Cendere exploitation permits are in their initial 20 year period and are eligible for renewal for up to two periods of 10 years each. In the opinion of Kaya-Aksoy, renewal applications for exploitation permits will be granted to those holders who have production of economical quantities of petroleum and comply fully with the obligations under the Turkish petroleum law. There is a long and clear track record of extending exploitation permits since 1998, there have been at least 48 renewals of exploitation permits with a majority of those renewals occurring since 2001, and as of March 2009, an application for renewal of an exploitation permit has never been denied and at least 70 conversions of exploration permits to exploitation permits have been granted and a conversion to an exploitation permit has never been denied. However, there can be no assurance that our exploration permit will be converted into exploitation permits or that our exploitation permits will be renewed.
10
Table of Contents
Our Turkish proved reserves at December 31, 2008 were as follows:
| | | | | | | | | | | | | | | | | | | |
| |
| | At December 31, 2008 | |
|---|
| |
| | Total Proved
Reserves | | Post-Expiration
Proved
Reserves | |
| |
|---|
| |
| | Percent of
Proved
Reserves
Post-Expiration | |
|---|
| | Permit
Expiration
Year | |
|---|
Property | | (MBbl) | | (MMCF) | | (MBbl) | | (MMCF) | |
|---|
Cendere (2 permits) | | | 2012 | (1) | | 740 | | | — | | | 423 | | | — | | | 57.15 | % |
S Akcakoca Sub-Basin | | | 2010 | (2) | | — | | | 10,477 | | | — | | | 8,440 | | | 80.56 | % |
Pro forma proved reserves reflecting the sale to Petrol Ofisi of 26.75% of our 36.75% interest in the South Akcakoca Sub-Basin are:
| | | | | | | | | | | | | | | | | | | |
| |
| | Pro Forma at December 31, 2008 | |
|---|
| |
| | Total Proved
Reserves | | Post-Expiration
Proved
Reserves | |
| |
|---|
| |
| | Percent of
Proved
Reserves
Post-Expiration | |
|---|
| | Permit
Expiration
Year | |
|---|
Property | | (MBbl) | | (MMCF) | | (MBbl) | | (MMCF) | |
|---|
Cendere (2 permits) | | | 2012 | (1) | | 740 | | | — | | | 423 | | | — | | | 57.15 | % |
S Akcakoca Sub-Basin | | | 2010 | (2) | | — | | | 2,851 | | | — | | | 2,297 | | | 80.56 | % |
- (1)
- Exploitation Permit
- (2)
- Exploration Permit
The Moinesti and Viperesti permits will expire in 2009 and the Fauresti rehabilitation permit will expire in 2015. If, prior to the expiration of our Romanian permits, we have not completed the minimum exploration program required by the permits, we must pay the estimated costs of such exploration program to the Romanian government. The Company does not expect to make such required payments to the Romanian government as the drilling obligations were assumed as part of the farmout agreements entered into with our partners. We have not yet established proved reserves on the Moinesti and Viperesti permits.
The following is information relating to our Romanian proved reserves at December 31, 2008, all of which relate to the pre-expiration period of the Fauresti Rehabilitation permit:
| | | | | | | | | | |
| |
| | At December 31, 2008 | |
|---|
Property | | Permit
Expiration
Year | | Oil
(MBbl) | | Gas
(MMcf) | |
|---|
Fauresti | | | 2015 | | | 1 | | | 86 | |
By the end of February 2009, we had either sold or farmed out all of our working interests in all Romanian permits while retaining an overriding royalty interest. See "Properties — Romania" for terms of each permit. Therefore we do not have any proved reserves in Romania.
Oil and Natural Gas Reserves
The following table sets forth information about our estimated net proved reserves at December 31, 2008 and December 31, 2007 for our properties. LaRoche Petroleum Consultants, Ltd., an independent petroleum engineering firm in Dallas, Texas, prepared the estimates of proved developed (PD) reserves, proved undeveloped (PUD) reserves and discounted present value (pretax). We prepared the estimate of standardized measure of proved reserves in accordance with Financial Accounting Standards Board Statement of Financial Accounting Standards No. 69,Disclosures about Oil and Gas Producing Activities. No reserve reports have been provided to any governmental agencies.
11
Table of Contents
The major changes affecting proved developed and undeveloped reserves when comparing December 31, 2008 to December 31, 2007 are summarized below:
- 1)
- Pertaining to France:
- a)
- A decrease in economic life of proved developed wells due to a decline in the oil price at December 31, 2008, to $34.72, as opposed to $96.65 at December 31, 2007. This resulted in a net decrease of 1,682 MBbl.
- b)
- Removing 12 proved undeveloped locations caused a net decrease 1,889 MBbl.
- c)
- Negative proved developed reserve revisions resulted in a decrease in reserves of 405 MBbl.
- d)
- Fourteen proved developed wells were shut-in resulting in a decrease of 401 MBbl.
- e)
- Three drilled locations in prior years resulted in one producing well which is non-commercial at December 31, 2008 causing a net decrease of 280 MBbl of proved developed reserves.
- f)
- One well was lost during 2008 workover operations causing a net decrease of 37 MBbl in proved developed reserves.
- 2)
- Total company production for 2008 was 805 MBOE.
- 3)
- In Hungary, we secured a gas contract which increased reserves by 159 MBOE.
- 4)
- In Romania, the poor operational performance of the wells resulted in a decrease of 54 MBOE in proved developed reserves. Additionally, effective January 1, 2009, we had sold our interest in the proved reserves associated with Romania.
- 5)
- In Turkey, a decrease in economic life of proved developed wells resulted in a net decrease of 390 MBOE.
The above changes also had a negative impact on the standardized measure of proved reserves. Additionally, in 2008 the operator of the offshore Turkey natural gas project finalized the budget for Phase II and increased the capital cost from $15.8 million (net) to $61.7 million (net). This $45.9 million increase resulted in almost a dollar-for-dollar reduction in the standardized measure value, since it is
12
Table of Contents
expected to be incurred in 2009 and 2010. The above referenced dollar amounts do not reflect the sale to Petrol Ofisi of 26.75% of 36.75% interest in SASB.
| | | | | | | |
| | December 31, | |
|---|
| | 2008 | | 2007 | |
|---|
TURKEY(1) | | | | | | | |
Proved developed: | | | | | | | |
Oil (MBbl) | | | 500 | | | 808 | |
Gas (MMcf) | | | 2,437 | | | 4,248 | |
Total (MBOE) | | | 906 | | | 1,516 | |
Proved undeveloped: | | | | | | | |
Oil (MBbl) | | | 240 | | | 241 | |
Gas (MMcf) | | | 8,040 | | | 8,691 | |
Total (MBOE) | | | 1,580 | | | 1,689 | |
Discounted present value at 10% (pretax) (in thousands)(2) | | $ | 27,047 | | $ | 89,376 | |
Standardized measure of proved reserves (in thousands) | | $ | 27,048 | | $ | 84,048 | |
HUNGARY | | | | | | | |
Proved developed: | | | | | | | |
Oil (MBbl) | | | 1 | | | — | |
Gas (MMcf) | | | 950 | | | — | |
Total (MBOE) | | | 159 | | | — | |
Discounted present value at 10% (pretax) (in thousands)(2) | | $ | 9,286 | | $ | — | |
Standardized measure of proved reserves (in thousands) | | $ | 9,278 | | $ | — | |
ROMANIA | | | | | | | |
Proved developed: | | | | | | | |
Oil (MBbl) | | | 1 | | | 6 | |
Gas (MMcf) | | | 86 | | | 772 | |
Total (MBOE) | | | 15 | | | 134 | |
Discounted present value at 10% (pretax) (in thousands)(2)(3) | | $ | (119 | ) | $ | 1,110 | |
Standardized measure of proved reserves (in thousands)(3) | | $ | (121 | ) | $ | 1,110 | |
FRANCE | | | | | | | |
Proved developed: | | | | | | | |
Oil (MBbl) | | | 4,385 | | | 7,170 | |
Proved undeveloped: | | | | | | | |
Oil (MBbl) | | | 530 | | | 2,798 | |
Discounted present value at 10% (pretax) (in thousands)(2) | | $ | 25,107 | | $ | 262,605 | |
Standardized measure of proved reserves (in thousands) | | $ | 18,563 | | $ | 174,211 | |
COMBINED(1) | | | | | | | |
Proved developed: | | | | | | | |
Oil (MBbl) | | | 4,887 | | | 7,984 | |
Gas (MMcf) | | | 3,473 | | | 5,020 | |
Total (MBOE) | | | 5,466 | | | 8,822 | |
Proved undeveloped: | | | | | | | |
Oil (MBbl) | | | 770 | | | 3,039 | |
Gas (MMcf) | | | 8,040 | | | 8,691 | |
Total (MBOE) | | | 2,110 | | | 4,488 | |
Total proved: | | | | | | | |
Oil (MBbl) | | | 5,657 | | | 11,023 | |
Gas (MMcf) | | | 11,513 | | | 13,711 | |
Total (MBOE) | | | 7,576 | | | 13,308 | |
Discounted present value at 10% (pretax) (in thousands)(2) | | $ | 61,321 | | $ | 353,091 | |
Standardized measure of proved reserves (in thousands) | | $ | 54,768 | | $ | 259,369 | |
- (1)
- Pro forma the sale to Petrol Ofisi of 26.75% of our 36.75% interest in the South Akcakoca Sub-Basin our December 31, 2008, Turkish proved developed gas reserves would be 663 MMcf and proved undeveloped reserves would be 2,188 MMcf. Total Turkey discounted present value at 10% would be $11,189 and standardized measure of proved reserves would be $11,189. Total Company proved reserves on a BOE basis would be 5,686 MBOE, discounted present value at 10% would be $47,075 and standardized measure of proved reserves would be $38,806.
- (2)
- The discounted present value represents the discounted future cash flows attributable to our proved oil and natural gas reserves before income tax, discounted at 10%. Although it is a non-GAAP measure, we believe that the presentation of the discounted present value is relevant and useful to our investors because it presents the discounted future net cash flows attributable to our proved reserves prior to taking into account corporate future income taxes and our current tax structure. We use this measure when assessing the potential return on investment related to our oil and natural gas properties. The standardized measure of discounted future net cash flows represents the present value of future cash flows attributable to our proved oil and natural gas reserves after income tax, discounted at 10%.
- (3)
- The negative values are due to plugging and abandonment costs incurred in the final year.
13
Table of Contents
Reserves were estimated using oil and natural gas prices and production and development costs in effect on December 31, 2008 and 2007, without escalation. The reserves were determined using both volumetric and production performance methods. Proved reserves are those estimated quantities of crude oil, natural gas and natural gas liquids that geological and engineering data demonstrate with reasonable certainty to be recoverable in future years from known reservoirs under existing economic and operating conditions.THE VALUES REPORTED MAY NOT NECESSARILY REFLECT THE FAIR MARKET VALUE OF THE RESERVES.
Approximately 27.9% of our proved reserves are classified as proved undeveloped (PUD) as determined by the LaRoche 2008 reserve report. These reserves were identified from 13 (PUD) locations as part of LaRoche's geological and reservoir engineering studies of our hydrocarbon producing assets.
The first 6 PUD locations are direct offsets to our existing French production in the Paris basin. Fault blocks have been mapped containing recoverable hydrocarbons that because of a lack of wellbores have typically underperformed from the existing waterflood. Additional wellbores may be drilled starting in 2009 to improve the recovery efficiency of the trapped hydrocarbons in these fault blocks.
Three other PUD locations were identified from our non-operated, onshore Cendere field in Turkey. Since we are not the operator of the Cendere field, we have no control of the timing or the success of any field operations.
The remaining PUD locations were identified from our 2007 drilling program in the Western Black Sea offshore Turkey. The company intends to commence recompletion operations in late 2009 as part of a Phase II development plan for the Akcakoca area.
The successful conversion of these PUD reserves into proved developed reserves is dependent upon the following:
- •
- Our ability to secure related oilfield equipment and services on a timely and competitive basis. Presently, there is great demand for and often extensive delays in securing oilfield equipment and services at any price. No assurance can be given that the requisite oilfield equipment and services can be secured in a timely and competitive manner.
- •
- Projections for proved undeveloped reserves are largely based on their analogy to similar producing properties and to volumetric calculations. Reserves projections based on analogy are subject to change due to subsequent changes in the analogous properties.
Productive Wells
The following table shows our gross and net interests in productive oil and natural gas wells as of December 31, 2008. Productive wells include wells currently producing or capable of production.
| | | | | | | | | | | | | | | | | | | |
| | Gross(1) | | Net(2) | |
|---|
| | Oil | | Gas | | Total | | Oil | | Gas | | Total | |
|---|
Turkey | | | 15 | | | 7 | | | 22 | | | 2.65 | | | 2.57 | | | 5.22 | |
Romania | | | — | | | 5 | | | 5 | | | — | | | 5.00 | | | 5.00 | |
France | | | 131 | | | — | | | 131 | | | 130.50 | | | — | | | 130.50 | |
Hungary | | | — | | | 1 | | | 1 | | | — | | | 1.00 | | | 1.00 | |
14
Table of Contents
Pro forma productive wells reflecting the sale of 26.75% of our 36.75% interest in the South Akcakoca Sub-Basin are as follows:
| | | | | | | | | | | | | | | | | | | |
| | Gross(1) | | Net(2) | |
|---|
| | Oil | | Gas | | Total | | Oil | | Gas | | Total | |
|---|
Turkey | | | 15 | | | 7 | | | 22 | | | 2.65 | | | 0.70 | | | 3.35 | |
- (1)
- "Gross" refers to wells in which we have a working interest.
- (2)
- "Net" refers to the aggregate of our percentage working interest in gross wells before royalties, before or after payout, as appropriate.
Acreage
The following table shows the developed and undeveloped acreage attributable to our ownership as of December 31, 2008.
| | | | | | | | | | | | | | | | | | | |
| | Developed Acreage | | Undeveloped Acreage | | Total Acreage | |
|---|
| | Gross | | Net | | Gross | | Net | | Gross | | Net | |
|---|
France | | | 24,260 | | | 24,260 | | | 555,236 | | | 454,800 | | | 579,496 | | | 479,060 | |
Turkey | | | 7,858 | | | 1,554 | | | 3,956,590 | | | 2,929,240 | | | 3,964,448 | | | 2,930,794 | |
Romania | | | 1,325 | | | 1,325 | | | 624,000 | | | 624,000 | | | 625,325 | | | 625,325 | |
Hungary | | | 494 | | | 494 | | | 763,743 | | | 126,282 | | | 764,237 | | | 126,776 | |
| | | | | | | | | | | | | | |
Total | | | 33,937 | | | 27,633 | | | 5,899,569 | | | 4,134,322 | | | 5,933,506 | | | 4,161,955 | |
| | | | | | | | | | | | | | |
Pro forma developed and undeveloped acreage reflecting the sale of 26.75% of our 36.75% interest in the South Akcakoca Sub-Basin would be:
| | | | | | | | | | | | | | | | | | | |
| | Developed Acreage | | Undeveloped Acreage | | Total Acreage | |
|---|
| | Gross | | Net | | Gross | | Net | | Gross | | Net | |
|---|
France | | | 24,260 | | | 24,260 | | | 555,236 | | | 454,800 | | | 579,496 | | | 479,060 | |
Turkey | | | 7,858 | | | 1,554 | | | 3,956,590 | | | 2,659,045 | | | 3,964,448 | | | 2,660,599 | |
Romania | | | 1,325 | | | 1,325 | | | 624,000 | | | 624,000 | | | 625,325 | | | 625,325 | |
Hungary | | | 494 | | | 494 | | | 763,743 | | | 126,270 | | | 764,237 | | | 126,764 | |
| | | | | | | | | | | | | | |
Total | | | 33,937 | | | 27,633 | | | 5,899,569 | | | 3,864,115 | | | 5,933,506 | | | 3,891,748 | |
| | | | | | | | | | | | | | |
Undeveloped acreage includes only those acres on which wells have not been drilled or completed to permit the production of commercial quantities of oil and natural gas regardless of whether or not the acreage contains proved reserves.
15
Table of Contents
Drilling Activity
The following table shows our drilling activities on a gross and net basis for the years ended 2008, 2007 and 2006.
| | | | | | | | | | | | | | | | | | | | | |
| | Year ended December 31, | |
|---|
| | 2008 | | 2007 | | 2006 | |
|---|
| | Gross(1) | | Net(2) | | Gross(1) | | Net(2) | | Gross(1) | | Net(2) | |
|---|
TURKEY | | | | | | | | | | | | | | | | | | | |
Development: | | | | | | | | | | | | | | | | | | | |
| | Gas(3) | | | — | | | — | | | — | | | — | | | 7 | | | 2.57 | |
| | Abandoned(4) | | | — | | | — | | | — | | | — | | | 2 | | | 0.56 | |
| | | | | | | | | | | | | | |
| | | Total | | | — | | | — | | | — | | | — | | | 9 | | | 3.13 | |
| | | | | | | | | | | | | | |
Exploratory | | | | | | | | | | | | | | | | | | | |
| | Gas(5) | | | — | | | — | | | 3 | | | 1.00 | | | — | | | — | |
| | Abandoned(4) | | | — | | | — | | | 1 | | | .50 | | | — | | | — | |
| | | | | | | | | | | | | | |
| | | Total | | | — | | | — | | | 4 | | | 1.50 | | | — | | | — | |
| | | | | | | | | | | | | | |
HUNGARY | | | | | | | | | | | | | | | | | | | |
Exploratory | | | | | | | | | | | | | | | | | | | |
| | | Abandoned(4) | | | 2 | | | .30 | | | 2 | | | 2.00 | | | 1 | | | 1.00 | |
ROMANIA | | | | | | | | | | | | | | | | | | | |
Exploratory | | | | | | | | | | | | | | | | | | | |
| | Abandoned(4) | | | — | | | — | | | 3 | | | 3.00 | | | — | | | — | |
FRANCE | | | | | | | | | | | | | | | | | | | |
Exploratory: | | | | | | | | | | | | | | | | | | | |
| | Abandoned(4) | | | — | | | — | | | 2 | | | 2.00 | | | — | | | — | |
- (1)
- "Gross" is the number of wells in which we have a working interest.
- (2)
- "Net" is the aggregate obtained by multiplying each gross well by our after payout percentage working interest.
- (3)
- "Gas" means natural gas wells that are either currently producing or are capable of production.
- (4)
- "Abandoned" means wells that were dry when drilled and were abandoned without production casing being run.
- (5)
- "Gas" means gas flow was tested and temporarily suspended awaiting further work.
16
Table of Contents
Net Production, Unit Prices and Costs
The following table summarizes our oil, natural gas and natural gas liquids production, net of royalties, for the periods indicated for France, Turkey and Romania. It also summarizes calculations of our total average unit sales prices and unit costs.
| | | | | | | | | | | | | |
| | France | | Turkey | | Romania | | Total | |
|---|
Year Ended December 31, 2008 | | | | | | | | | | | | | |
Production: | | | | | | | | | | | | | |
Oil (Bbls) | | | 365,361 | | | 55,417 | | | 3,262 | | | 424,040 | |
Daily average (Bbls/Day) | | | 1,001 | | | 152 | | | 9 | | | 1,162 | |
Gas (Mcf) | | | — | | | 1,840,420 | | | 445,606 | | | 2,286,026 | |
Daily average (Mcf/Day) | | | — | | | 5,042 | | | 1,221 | | | 6,263 | |
Daily average (BOE/Day) | | | 1,001 | | | 992 | | | 212 | | | 2,205 | |
Unit prices: | | | | | | | | | | | | | |
Average oil price ($/Bbl) | | $ | 93.32 | | $ | 93.21 | | $ | 57.97 | | $ | 93.04 | |
Average gas price ($/Mcf) | | | — | | | 11.14 | | | 5.32 | | | 10.00 | |
Average equivalent price ($/BOE) | | | 93.32 | | | 70.88 | | | 32.99 | | | 77.41 | |
Unit costs ($/BOE): | | | | | | | | | | | | | |
Lease operating | | $ | 25.35 | | $ | 9.60 | | $ | 57.58 | | $ | 21.38 | (1) |
Exploration and acquisition | | | 0.39 | | | 7.33 | | | 6.84 | | | 7.21 | (1) |
Depreciation, depletion and amortization | | | 12.83 | | | 75.01 | | | 11.48 | | | 41.17 | (1) |
Impairment of oil and natural gas properties | | | — | | | 227.36 | | | 7.88 | | | 105.88 | (1) |
General and administrative | | | 3.55 | | | 5.57 | | | — | | | 19.24 | (1) |
| | | | | | | | | | |
Total | | $ | 42.12 | | $ | 324.87 | | $ | 83.78 | | $ | 194.88 | |
| | | | | | | | | | |
Year Ended December 31, 2007 | | | | | | | | | | | | | |
Production: | | | | | | | | | | | | | |
Oil (Bbls) | | | 383,341 | | | 65,686 | | | 9,594 | | | 458,621 | |
Daily average (Bbls/Day) | | | 1,050 | | | 180 | | | 26 | | | 1,256 | |
Gas (Mcf) | | | — | | | 904,927 | | | 689,290 | | | 1,594,217 | |
Daily average (Mcf/Day) | | | — | | | 2,479 | | | 1,888 | | | 4,367 | |
Daily average (BOE/Day) | | | 1,050 | | | 593 | | | 341 | | | 1,984 | |
Unit prices: | | | | | | | | | | | | | |
Average oil price ($/Bbl) | | $ | 67.49 | | $ | 61.98 | | $ | 57.59 | | $ | 66.50 | |
Average gas price ($/Mcf) | | | — | | | 8.60 | | | 4.90 | | | 7.00 | |
Average equivalent price ($/BOE) | | | 67.49 | | | 54.77 | | | 31.55 | | | 57.51 | |
Unit costs ($/BOE): | | | | | | | | | | | | | |
Lease operating | | $ | 19.17 | | $ | 12.18 | | $ | 21.42 | | $ | 17.46 | (1) |
Exploration and acquisition | | | 2.23 | | | 11.83 | | | 51.83 | | | 20.36 | (1) |
Depreciation, depletion and amortization | | | 10.80 | | | 46.49 | | | 54.05 | | | 29.36 | (1) |
Dry hole cost and impairment of oil and natural gas properties | | | 10.04 | | | 20.74 | | | 189.16 | | | 48.74 | (1) |
General and administrative | | | 7.39 | | | 17.18 | | | 4.32 | | | 23.91 | (1) |
| | | | | | | | | | |
Total | | $ | 49.63 | | $ | 108.42 | | $ | 320.78 | | $ | 139.83 | |
| | | | | | | | | | |
17
Table of Contents
| | | | | | | | | | | | | |
| | France | | Turkey | | Romania | | Total | |
|---|
Year Ended December 31, 2006 | | | | | | | | | | | | | |
Production: | | | | | | | | | | | | | |
Oil (Bbls) | | | 441,759 | | | 68,342 | | | 7,728 | | | 517,829 | |
Daily average (Bbls/Day) | | | 1,210 | | | 187 | | | 21 | | | 1,418 | |
Gas (Mcf) | | | — | | | — | | | 502,192 | | | 502,192 | |
Daily average (Mcf/Day) | | | — | | | — | | | 1,376 | | | 1,376 | |
Daily average (BOE/Day) | | | 1,210 | | | 199 | | | 250 | | | 1,659 | |
Unit prices: | | | | | | | | | | | | | |
Average oil price ($/Bbl) | | $ | 61.74 | | $ | 56.10 | | $ | 52.71 | | $ | 60.86 | |
Average gas price ($/Mcf) | | | — | | | — | | | 3.57 | | | 3.57 | |
Average equivalent price ($/BOE) | | | 61.74 | | | 56.10 | | | 24.06 | | | 55.37 | |
Unit costs ($/BOE): | | | | | | | | | | | | | |
Lease operating | | $ | 16.36 | | $ | 11.60 | | $ | 7.86 | | $ | 14.52 | (1) |
Exploration and acquisition | | | 0.98 | | | 11.69 | | | 7.09 | | | 6.55 | (1) |
Depreciation, depletion and amortization | | | 7.06 | | | 10.94 | | | 22.85 | | | 10.43 | (1) |
Dry hole cost and impairment of oil and natural gas properties | | | — | | | — | | | — | | | 2.83 | (1) |
General and administrative | | | 4.31 | | | 11.81 | | | 6.09 | | | 15.78 | (1) |
| | | | | | | | | | |
Total | | $ | 28.71 | | $ | 46.04 | | $ | 43.89 | | $ | 50.11 | |
| | | | | | | | | | |
- (1)
- Total amounts include costs related to operations in the US and Hungary.
Office Lease
We occupy 23,297 square feet of office space at 13760 Noel Rd., Suite 1100, Dallas, Texas 75240. The lease for this space became effective on October 1, 2007 and is for seven years, and the average monthly rental is $33,005 per month for the term of the lease. We also occupy 3,218 square feet of office space in Paris, France, approximately 9,000 square feet of office in Ankara, Turkey, 3,767 square feet in Bucharest, Romania and 2,896 square feet of office space in Budapest, Hungary. Total rental expense for 2008 was approximately $953,000.
Markets and Competition
In France, we currently sell all of our oil production to Elf Antar France S.A., the largest purchaser in the area. This production is shipped by truck to a nearby Elf refinery. The oil also can be transported to refineries on the north coast of France via pipeline. Oil production in Turkey is sold to refineries in the southern part of the country. Our Turkish gas is sold through the national pipeline.
The oil and natural gas industry is highly competitive. We encounter strong competition from other independent operators and from major oil companies in acquiring properties, contracting for drilling equipment and securing trained personnel. Many of these competitors have financial and technical resources and staffs substantially larger than those available to us. As a result, our competitors may be able to pay more for desirable leases, and they may pay more to evaluate, bid for and purchase a greater number of properties or prospects than our financial or personnel resources permit us to do.
We also are affected by competition for drilling rigs and the availability of tubular goods and certain other equipment. While the oil and natural gas industry has experienced shortages of drilling rigs and equipment, pipe and personnel in the past, we are not presently experiencing any shortages and do not
18
Table of Contents
foresee any such shortages in the near future; however, we are unable to predict how long current market conditions will continue.
Competition for attractive oil and natural gas producing properties, undeveloped leases and drilling rights is also strong, and we can give no assurance we will be able to compete satisfactorily in acquiring properties. Since many major oil companies have publicly indicated their decision to focus on overseas activities, we cannot ensure we will be successful in acquiring any such properties.
Government Regulation
Our current exploration activities are conducted in Turkey, Hungary and France. Such activities are affected in varying degrees by political stability and government regulations relating to foreign investment and the oil and natural gas industry. Changes in these regulations or shifts in political attitudes are beyond our control and may adversely affect our business. Operations may be affected in varying degrees by government regulations with respect to restrictions on production, price controls, export controls, income taxes, expropriation of property, environmental legislation and mine safety.
Our current or future operations, including exploration and development activities on our properties, require permits from various governmental authorities, and such operations are and will be governed by laws and regulations governing prospecting, development, production, exports, taxes, labor standards, occupational health, waste disposal, toxic substances, land use, environmental protection and other matters. Compliance with these requirements may prove to be difficult and expensive. See "Risk Factors" for further information regarding international government regulation.
In order to carry out exploration and development of mineral interests or to place these into commercial production, we may require certain licenses and permits from various governmental authorities. There can be no guarantee that we will be able to obtain all necessary licenses and permits that may be required. In addition, such licenses and permits are subject to change and there can be no assurances that any application to renew any existing licenses or permits will be approved. See "Risk Factors" for further information regarding our foreign permits and licenses.
Currently, there are no restrictions on the repatriation of earnings or capital to foreign entities from France, Turkey, Romania or Hungary. However, there can be no assurance that any such restrictions on repatriation of earnings or capital from the aforementioned countries or any other country where we may invest will not be imposed in the future.
The oil and natural gas industry is subject to extensive and varying environmental regulations in each of the jurisdictions in which we may operate. Environmental regulations establish standards respecting health, safety and environmental matters and place restrictions and prohibitions on emissions of various substances produced concurrently with oil and natural gas. These regulations can have an impact on the selection of drilling locations and facilities, potentially resulting in increased capital expenditures. In addition, environmental legislation may require those wells and production facilities to be abandoned and sites reclaimed to the satisfaction of local authorities. We are committed to complying with environmental and operation legislation wherever we operate.
19
Table of Contents
Employees
As of March 10, 2009, we employed 81 full-time employees. None of our employees are represented by unions or covered by collective bargaining agreements. To date, we have not experienced any strikes or work stoppages due to labor problems, and we believe that we have good relations with our employees. As needed, we also utilize the services of independent consultants on a contract basis.
Segment Reporting
See Note 15 in the Notes to Consolidated Financial Statements for financial information by segment.
Internet Address/Availability of Reports
Our Annual Reports on Form 10-K, Quarterly Reports on Form 10-Q, Current Reports on Form 8-K and amendments to those reports filed or furnished pursuant to Section 13(a) or 15(d) of the Securities Exchange Act of 1934 are made available free of charge on our website athttp://www.toreador.net as soon as reasonably practicable after we electronically file such material with, or otherwise furnish it to, the Securities and Exchange Commission.
Glossary of Selected Oil and Natural Gas Terms
"2D" or"2D SEISMIC." An exploration method of sending energy waves or sound waves into the earth and recording the wave reflections to indicate the type, size, shape, and depth of subsurface rock formations. 2D seismic provides a two dimensional representation along the profile of the line as it was shot. 2D surveys are measured in kilometers or miles.
"3D" or"3D SEISMIC." An exploration method of sending energy waves or sound waves into the earth and recording the wave reflections to indicate the type, size, shape, and depth of subsurface rock formations. 3D seismic lines are shot very close together. This allows for the ability for computers to generate seismic profiles in any direction and form 3D surfaces. 3D surveys are measured in square kilometers or square miles.
"Bbl." One stock tank barrel, or 42 U.S. gallons liquid volume, used herein in reference to crude oil or other liquid hydrocarbons.
"BOE." Barrels of oil equivalent. BTU equivalent of six thousand cubic feet (Mcf) of natural gas which is equal to the BTU equivalent of one barrel of oil.
"BOPD" Barrels of oil per day.
"BTU." British Thermal Unit.
"DEVELOPMENT WELL" A well drilled within the proved boundaries of an oil or natural gas reservoir with the intention of completing the stratigraphic horizon known to be productive.
"DISCOUNTED PRESENT VALUE." The present value of proved reserves is an estimate of the discounted future net cash flows from each property at the specified date, or as otherwise indicated. Net cash flow is defined as net revenues, after deducting production and ad valorem taxes, less future capital costs and operating expenses, but before deducting federal income taxes. The future net cash flows have been discounted at an annual rate of 10% to determine their "present value." The present value is shown to indicate the effect of time on the value of the revenue stream and should not be construed as being the fair market value of the properties. In accordance with Securities and Exchange Commission rules, estimates have been made using constant oil and natural gas prices and operating costs at the specified date, or as otherwise indicated.
"DRY HOLE." A development or exploratory well found to be incapable of producing either oil or natural gas in sufficient quantities to justify completion as an oil or natural gas well.
20
Table of Contents
"EXPLORATORY WELL" A well drilled to find and produce oil or natural gas in an unproved area, to find a new reservoir in a field previously found to be productive of oil or natural gas in another reservoir, or to extend a known reservoir.
"GROSS ACRES" or"GROSS WELLS." The total number of acres or wells, as the case may be, in which a working or any type of royalty interest is owned.
"KM." One kilometer.
"MBbl." One thousand Bbls.
"MMBbl" One million Bbls.
"MBOE." One thousand BOE.
"MMBOE." One million BOE.
"Mcf." One thousand cubic feet of natural gas.
"MMcf" One million cubic feet of natural gas.
"NET ACRES." The sum of the fractional working or any type of royalty interests owned in gross acres.
"PERMIT." An area onshore or offshore that comprises a contiguous acreage, or leasehold, position on which an operator drills exploratory and/or development wells. Sometimes designated as a "lease" or "block."
"PRODUCING WELL" or"PRODUCTIVE WELL."A well that is capable of producing oil or natural gas in economic quantities.
"PROVED DEVELOPED RESERVES." The oil and natural gas reserves that can be expected to be recovered through existing wells with existing equipment and operating methods. Additional oil and natural gas expected to be obtained through the application of fluid injection or other improved recovery techniques for supplementing the natural forces and mechanisms of primary recovery should be included as "proved developed reserves" only after testing by a pilot project or after the operation of an installed program has confirmed through production response that increased recovery will be achieved.
"PROVED RESERVES." The estimated quantities of crude oil, natural gas and natural gas liquids that geological and engineering data demonstrate with reasonable certainty to be recoverable in future years from known reservoirs under existing economic and operating conditions.
"PROVED UNDEVELOPED RESERVES." The oil and natural gas reserves that are expected to be recovered from new wells on undrilled acreage or from existing wells where a relatively major expenditure is required for recompletion. Reserves on undrilled acreage are limited to those drilling units offsetting productive units that are reasonably certain of production when drilled. Proved reserves for other undrilled units can be claimed only where it can be demonstrated with certainty that there is continuity of production from the existing productive formation. Under no circumstances should estimates for proved undeveloped reserves be attributable to any acreage for which an application of fluid injection or other improved recovery techniques is contemplated, unless such techniques have been proved effective by actual tests in the area and in the same reservoir.
"ROYALTY INTEREST." An interest in an oil and natural gas property entitling the owner to a share of oil and natural gas production free of production costs.
"STANDARDIZED MEASURE." Under the Standardized Measure, future cash flows are estimated by applying year-end prices, adjusted for fixed and determinable changes, to the estimated future production of year-end proved reserves. Future cash inflows are reduced by estimated future production and development costs based on period-end costs to determine pretax cash inflows. Future income taxes
21
Table of Contents
are computed by applying the statutory tax rate to the excess inflows over a company's tax basis in the associated properties.
Tax credits, net operating loss carryforwards and permanent differences also are considered in the future tax calculation. Future net cash inflows after income taxes are discounted using a 10% annual discount rate to arrive at the Standardized Measure.
"UNDEVELOPED ACREAGE." Lease acreage on which wells have not been drilled or completed to a point that would permit the production of commercial quantities of oil and natural gas regardless of whether such acreage contains proved reserves.
"WORKING INTEREST." The operating interest (not necessarily as operator) that gives the owner the right to drill, produce and conduct operating activities on the property and a share of production, subject to all royalties, overriding royalties and other burdens, and to all exploration, development and operational costs including all risks in connection therewith.
Item 1A. Risk Factors
Risks Related To Our Company
Our growth depends on our ability to obtain additional capital and we may not be able to obtain sufficient additional capital to grow our business.
Effectuation of our business strategy will require substantial capital expenditures. In order to fund our future growth we will need to obtain additional capital. The amount and timing of our future capital requirements will depend upon a number of factors, including:
- •
- drilling results and costs;
- •
- transportation costs;
- •
- equipment costs and availability;
- •
- marketing expenses;
- •
- oil and natural gas prices;
- •
- requirements and commitments under existing permits;
- •
- staffing levels and competitive conditions; and
- •
- any purchases or dispositions of assets.
Our ability to raise additional capital will depend on the results of our operations and the status of various capital and industry markets at the time we seek such capital. Our failure or inability to obtain any required additional financing on favorable terms could materially and adversely affect our growth, cash flow and earnings, including our ability to meet our capital expenditures budgets.
Although we retired the facilities with the International Finance Corporation in March 2009, we have outstanding $80.3 million of Convertible Senior Notes due October 2025 and plan to attempt to enter into another credit facility.
Given the current state of the credit market, no assurance can be given that we will be able to enter into a new credit facility on acceptable terms; therefore there can be no assurances that we will have the needed additional capital to fund our future growth.
In addition, to the extent that we are not able to obtain additional capital by the incurrence of additional debt, we may need to issue additional equity which may be difficult in light of the current equity market. Any such issuance of equity could be materially dilutive to our outstanding equity and equity holders.
22
Table of Contents
If we enter into a new credit facility, our debt to equity ratio may limit our ability to obtain additional indebtedness. Additionally any new credit facility may restrict our ability to incur additional indebtedness because of financial ratios we must meet.
Thus, we may not be able to obtain sufficient capital to grow our business, effectuate our business strategy and may lose opportunities to acquire interests in oil and natural gas properties or related businesses because of our inability to fund such growth.
Our ability to comply with the restrictions and covenants of any future credit facility is uncertain and will be affected by the levels of cash flow from our operations and events or circumstances beyond our control. Our failure to comply with any of the restrictions and covenants could result in a default, which could permit the lender to accelerate repayments and foreclose on the collateral securing the indebtedness.
We currently have operations involving the U.S. dollar, Euro, New Turkish Lira, Forint and Romanian Lei. We are subject to fluctuations in the value of the U.S. dollar as compared to the Euro, New Turkish Lira, Forint and Romanian Lei respectively. These fluctuations, including the recent fluctuations, may adversely affect our results of operations.
On a consistent basis, we evaluate and, where appropriate, pursue acquisition opportunities on terms we consider favorable. In particular, we pursue acquisitions of businesses or interests that will complement and allow us to expand our exploration activities; however, currently, we have no binding commitments related to any acquisitions. The successful acquisition of interests in oil and natural gas properties requires an assessment of:
- •
- recoverable reserves;
- •
- exploration potential;
- •
- future oil and natural gas prices;
- •
- operating costs;
- •
- potential environmental and other liabilities and other factors; and
- •
- permitting and other environmental authorizations required for our operations.
In connection with such an assessment, we would expect to perform a review of the subject properties that we believe to be generally consistent with industry practices. Nonetheless, the resulting conclusions are necessarily inexact and their accuracy inherently uncertain and such an assessment may not reveal all existing or potential problems, nor will it necessarily permit us to become sufficiently familiar with the properties to fully assess their merits and deficiencies. Inspections may not always be performed on every platform or well, and structural and environmental problems are not necessarily observable even when an inspection is undertaken. As a result, acquired properties may prove to be worth less than we pay for them.
Future acquisitions could pose numerous additional risks to our operations and financial results, including:
- •
- problems integrating the purchased operations, personnel or technologies;
- •
- unanticipated costs;
- •
- diversion of resources and management attention from our core business;
- •
- entry into regions or markets in which we have limited or no prior experience; and
23
Table of Contents
- •
- potential loss of key employees, particularly those of any acquired organization.
Competition in the oil and natural gas industry is intense, and many of our competitors have greater financial, technological and other resources than we do.
We operate in the highly competitive areas of oil and natural gas exploration, development, production, leasing, and acquisition activities. The oil and natural gas industry is characterized by rapid and significant technological advancements and introductions of new products and services using new technologies. We face intense competition from independent, technology-driven companies as well as from both major and other independent oil and natural gas companies in each of the following areas:
- •
- seeking to acquire desirable producing properties or new leases for future exploration;
- •
- marketing our oil and natural gas production;
- •
- integrating new technologies; and
- •
- seeking to acquire the equipment and expertise necessary to develop and operate our properties.
Many of our competitors have financial, technological and other resources substantially greater than ours, and some of them are fully integrated oil and natural gas companies. These companies may be able to pay more for development prospects and productive oil and natural gas properties and may be able to define, evaluate, bid for and purchase a greater number of properties and prospects than our financial or human resources permit. Further, these companies may enjoy technological advantages and may be able to implement new technologies more rapidly than we can. Our ability to develop and exploit our oil and natural gas properties and to acquire additional properties in the future will depend upon our ability to successfully conduct operations, implement advanced technologies, evaluate and select suitable properties and consummate transactions in this highly competitive environment.
Our operations are subject to foreign laws and regulations controlling the discharge of materials into the environment or otherwise relating to the protection of the environment. Such laws and regulations not only expose us to liability for our own negligence, but may also expose us to liability for the conduct of others or for our actions that were in compliance with all applicable laws at the time those actions were taken. We may incur significant costs as a result of environmental accidents, such as oil spills, natural gas leaks, ruptures, or discharges of hazardous materials into the environment, including clean-up costs and fines or penalties. Additionally, we may incur significant costs in order to comply with environmental laws and regulations and may be forced to pay fines or penalties if we do not comply.
All of our operations are conducted in Turkey, Hungary and France. Therefore, we are subject to political and economic risks and other uncertainties.
We have international operations and are subject to the following foreign issues and uncertainties that can affect our operations adversely:
- •
- the risk of expropriation, nationalization, war, revolution, border disputes, renegotiation or modification of existing contracts, and import, export and transportation regulations and tariffs;
- •
- taxation policies, including royalty and tax increases and retroactive tax claims;
- •
- exchange controls, currency fluctuations and other uncertainties arising out of foreign government sovereignty over international operations;
- •
- laws and policies of the United States affecting foreign trade, taxation and investment;
24
Table of Contents
Terrorist activities, including events similar to those of September 11, 2001, or armed conflict involving the United States or any other country in which we hold interests, may adversely affect our business activities and financial condition. If events of this nature occur and persist, the resulting political and social instability could adversely affect prevailing oil and natural gas prices and cause a reduction in our revenues. In addition, oil and natural gas production facilities, transportation systems and storage facilities could be direct targets of terrorist attacks, and our operations could be adversely impacted if infrastructure integral to our operations is destroyed or damaged. Costs associated with insurance and other security measures may increase as a result of these threats, and some insurance coverage may become more difficult to obtain, if available at all.
We do not hold title to properties in Turkey, Hungary and France, but have exploration and exploitation permits granted by these countries' respective governments. Approximately 62% of our proved reserves are estimated to be recovered after the expiration of the applicable permit, as of December 31, 2008. There can be no assurance that we will be able to renew any of these permits when they expire, convert exploration permits into exploitation permits or obtain additional permits in the future. If we cannot renew some or all of these permits when they expire or convert exploration permits into exploitation permits, we will not be able to include the proved reserves associated with the permit.
Since we do not hold title to our foreign properties but rather hold exploitation and exploration permits granted to us by the applicable foreign governments, the Securities and Exchange Commission may require that a certain portion of proved reserves associated with these permits not be included in our proved reserves.
Rather than holding title to our foreign properties, we hold exploitation and exploration permits that have been granted to us for a specific time period by the applicable foreign governments. We must apply to have these permits renewed and extended in order to continue our exploration and development rights. Although we have always reported our proved reserves assuming that the permits will be extended in due course, the Securities and Exchange Commission may take the view that our ability to renew and extend our permits past their current expiration dates is not sufficiently certain such that we should not include the reserves that may be produced post expiration in our total proved reserves. Although we have previously been able to provide support to the Securities and Exchange Commission regarding the likelihood of extension, no assurance can be given that the Securities and Exchange Commission will allow us to continue to include these additional reserves in our proved reserves.
Any future hedging activities may require us to make significant payments that are not offset by sales of production and may prevent us from benefiting from increases in oil or natural gas prices.
Although we are not currently a party to a hedging transaction, occasionally we may reduce our exposure to the volatility of oil and natural gas prices by hedging a portion of our production. In a typical hedge transaction, we will have the right to receive from the counterparty to the hedge the excess of the fixed price specified in the hedge over a floating price based on a market index, multiplied by the quantity hedged. If the floating price exceeds the fixed price, we will be required to pay the counterparty this difference multiplied by the quantity hedged. In such case, we will be required to pay the difference regardless of whether we have sufficient production to cover the quantities specified in the hedge. Significant reductions in production at times when the floating price exceeds the fixed price could require
25
Table of Contents
us to make payments under the hedge agreements even though such payments are not offset by sales of production. Hedging also could prevent us from receiving the full advantage of increases in oil or natural gas prices above the fixed amount specified in the hedge.
Failure to maintain effective internal controls could have a material adverse effect on our operations and our stock price.
We are subject to Section 404 of the Sarbanes-Oxley Act which requires an annual management assessment of the effectiveness of our internal control over financial reporting and a report by our independent auditors addressing our internal controls and management's assessment. Effective internal controls are necessary for us to produce reliable financial reports. If, as a result of deficiencies in our internal controls, we cannot provide reliable financial reports, our business decision process may be adversely affected, our business and operating results could be harmed, we could be deemed in violation of any lending covenants, investors could lose confidence in our reported financial information and the price of our stock could decrease.
During the evaluation of disclosure controls and procedures for the year ended December 31, 2008, we concluded that our disclosure controls and procedures were effective in reaching a reasonable level of assurance of achieving management's desired controls and procedures objectives in our internal control over financial reporting. There is no guarantee that we will be able to conclude that our disclosure controls and procedures will be effective in future periods.
Risks Related To Our Industry
Our revenues, cash flows and profitability are substantially dependent upon prevailing prices for oil and natural gas. In recent years, oil and natural gas prices and, therefore, the level of drilling, exploration, development and production, have been extremely volatile. Any significant or extended decline in oil or natural gas prices will have a material adverse effect on our business, financial condition and results of operations and could impair access to future sources of capital. Volatility in the oil and natural gas industry results from numerous factors, over which we have no control, including:
- •
- the level of oil and natural gas prices, expectations about future oil and natural gas prices and the ability of international cartels to set and maintain production levels and prices;
- •
- the cost of exploring for, producing and transporting oil and natural gas;
- •
- the domestic and foreign supply of oil and natural gas;
- •
- domestic and foreign governmental regulation;
- •
- the level and price of foreign oil and natural gas transportation;
- •
- available pipeline and other oil and natural gas transportation capacity;
- •
- weather conditions;
- •
- international political, military, regulatory and economic conditions;
- •
- the level of consumer demand;
- •
- the price and the availability of alternative fuels;
- •
- the effect of worldwide energy conservation measures; and
- •
- the ability of oil and natural gas companies to raise capital.
26
Table of Contents
Significant declines in oil and natural gas prices, including the recent decline may:
- •
- impair our financial condition, liquidity, ability to finance planned capital expenditures and results of operations;
- •
- cause us to delay or postpone some of our capital projects;
- •
- reduce our revenues, operating income and cash flow; and
- •
- reduce the carrying value of our oil and natural gas properties.
We expect oil and natural gas prices, as well as the oil and natural gas industry generally, to continue to be volatile.
Our future success as an oil and natural gas producer depends upon our ability to find, develop and acquire additional oil and natural gas reserves that are profitable. Oil and natural gas are depleting assets, and production from oil and natural gas from properties declines as reserves are depleted with the rate of decline depending on reservoir characteristics. If we are unable to conduct successful exploration or development activities or acquire properties containing proved reserves, our proved reserves generally will decline as the reserves are produced, and our level of production and cash flows will be adversely affected. Replacing our reserves through exploration or development activities or acquisitions will require significant capital which may not be available to us.
Our drilling will involve numerous risks, including the risk that no commercially productive oil or natural gas reservoirs will be encountered. We may incur significant expenditures for the identification and acquisition of properties and for the drilling and completion of wells. The cost of drilling, completing and operating wells is often uncertain, and drilling operations may be curtailed, delayed or canceled as a result of a variety of factors, including unexpected drilling conditions, pressure or irregularities in formations, equipment failures or accidents, weather conditions and shortages or delays in the delivery of equipment.
In addition, any use by us of 3D seismic and other advanced technology to explore for oil and natural gas requires greater pre-drilling expenditures than traditional drilling methodologies. While we use advanced technology in our operations, this technology does not allow us to know conclusively prior to drilling a well that oil or natural gas is present or economically producible.
In addition, as a "successful efforts" company, we account for unsuccessful exploration efforts, i.e., the drilling of "dry holes," as an expense of operations which impacts our earnings. Significant expensed exploration charges in any period would materially adversely affect our earnings for that period and could cause our earnings to be volatile from period to period.
Our operations are subject to the risks inherent in the oil and natural gas industry, including the risks of:
- •
- fire, explosions and blowouts;
- •
- pipe failure;
- •
- abnormally pressured formations; and
- •
- environmental accidents such as oil spills, natural gas leaks, ruptures or discharges of toxic gases, brine or well fluids into the environment (including groundwater contamination).
27
Table of Contents
These events may result in substantial losses to us from:
- •
- injury or loss of life;
- •
- severe damage to or destruction of property, natural resources and equipment;
- •
- pollution or other environmental damage;
- •
- clean-up responsibilities;
- •
- regulatory investigation;
- •
- penalties and suspension of operations; and
- •
- attorney's fees and other expenses incurred in the prosecution or defense of litigation.
As is customary in our industry, we maintain insurance against some, but not all, of these risks. We cannot assure investors that our insurance will be adequate to cover these losses or liabilities. We do not carry business interruption insurance. Losses and liabilities arising from uninsured or underinsured events may have a material adverse effect on our financial condition and operations. We carry well control insurance for our drilling operations. Our coverage includes blowout protection and liability protection on domestic and international wells.
The producing wells in which we have an interest occasionally experience reduced or terminated production. These curtailments can result from mechanical failures, contract terms, pipeline and processing plant interruptions, market conditions and weather conditions. These curtailments can last from a few days to many months.
Any material inaccuracies in our reserve estimates or underlying assumptions could materially affect the quantities and present values of our reserves. The process of estimating natural gas and oil reserves is complex. It requires interpretations of available technical data and various assumptions, including assumptions relating to economic factors. Any significant inaccuracies in these interpretations or assumptions could materially affect the estimated quantities and present value of reserves shown in this prospectus. In order to prepare these estimates, we must project production rates and timing of development expenditures. We must also analyze available geological, geophysical, production and engineering data, and the extent, quality and reliability of this data can vary. The process also requires economic assumptions relating to matters such as oil and natural gas prices, drilling and operating expenses, capital expenditures, taxes and availability of funds.
Actual future production, oil and natural gas prices, revenues, taxes, development expenditures, operating expenses and quantities of recoverable oil and natural gas reserves most likely will vary from our estimates. Any significant variance could materially affect the estimated quantities and pre-tax net present value of reserves shown in this prospectus. In addition, we may adjust estimates of proved reserves to reflect production history, results of exploration and development, prevailing oil and natural gas prices and other factors, many of which are beyond our control.
Investors should not assume that the pre-tax net present value of our proved reserves referred to in this Form 10-K is the current market value of our estimated oil and natural gas reserves. We base the pre-tax net present value of future net cash flows from our proved reserves on prices and costs on the date of the estimate. Actual future prices, costs, and the volume of produced reserves may differ materially from those used in the pre-tax net present value estimate.
28
Table of Contents
Risks Related To Our Common Stock
Our stock's public trading price has been volatile, which may depress the trading price of our common stock.
Our stock price is subject to significant volatility. Overall market conditions, in addition to other risks and uncertainties described in this "Risk Factors" section and elsewhere in this prospectus, has caused the market price of our common stock to fall. We participate in a price sensitive industry, which often results in significant volatility in the market price of common stock irrespective of company performance. As a result, our high and low closing stock prices for the twelve months ended March 10, 2009 were $10.49 and $1.96, respectively. Fluctuations in the price of our common stock may be exacerbated by conditions in the energy and oil and natural gas industries or conditions in the financial markets generally.
Our common stock is quoted on the Nasdaq Global Market under the symbol "TRGL." However, daily trading volumes for our common stock are, and may continue to be, relatively small compared to many other publicly traded securities. It may be difficult for investors to sell their shares of common stock in the public market at any given time at prevailing prices, and the price of our common stock may, therefore, be volatile.
Numerous factors, including many over which we have no control, may have a significant impact on the market price of our common stock, including, among other things:
- •
- current events affecting the political, economic and social situation in the United States and other countries where we operate;
- •
- trends in our industry and the markets in which we operate;
- •
- litigation involving or affecting us;
- •
- changes in financial estimates and recommendations by securities analysts;
- •
- acquisitions and financings by us or our competitors;
- •
- quarterly variations in operating results;
- •
- volatility in exchange rates between the US dollar and the currencies of the foreign countries in which we operate;
- •
- the operating and stock price performance of other companies that investors may consider to be comparable; and
- •
- purchases or sales of blocks of our securities.
In addition, the stock market in recent years has experienced extreme price and trading volume fluctuations that often have been unrelated or disproportionate to the operating performance of individual companies. These broad market fluctuations may adversely affect the price of our common stock, regardless of our operating performance. In addition, sales of substantial amounts of our common stock in the public market, or the perception that those sales may occur, could cause the market price of our common stock to decline. Furthermore, stockholders may initiate securities class action lawsuits if the market price of our stock drops significantly, which may cause us to incur substantial costs and could divert the time and attention of our management.
These factors, among others, could significantly depress the price of our common stock.
We currently intend to continue our policy of retaining earnings to finance the growth of our business. As a result, we do not anticipate paying cash dividends on our common stock in the foreseeable future. In addition, the terms of any future credit facility may restrict our ability to pay dividends on our common stock.
29
Table of Contents
We may issue equity securities in the future which may depress the trading price of our common stock and may dilute the interests of our existing stockholders.
Future sales or issuances of common stock or the issuance of securities senior to our common stock may depress the trading price of our common stock. We may not have the ability to issue new common stock due to the decline in the equity market and our share price.
Any issuance of equity securities, including the issuance of shares upon conversion of the Convertible Senior Notes, could dilute the interests of our existing stockholders and could substantially decrease the trading price of our common stock and the notes. We may issue equity securities in the future for a number of reasons, including to finance our operations and business strategy, to adjust our ratio of debt to equity, to satisfy our obligations upon the exercise of outstanding warrants or options, or upon conversion of debentures, or for other reasons. As of March 10, 2009, there were:
- •
- 248,370 shares of our common stock issuable upon exercise of outstanding options, at a weighted average exercise price of $6.77 per share, of which options to purchase 148,870 shares were exercisable;
- •
- 98,760 shares of our common stock issuable upon exercise of outstanding warrants, at a weighted average exercise price of $19.82 per share, all of which were exercisable;
- •
- 1,875,192 shares of our common stock issuable upon conversion of our Convertible Senior Notes; and
- •
- 1,053,397 shares of our common stock available for future grant under our equity incentive plan.
Our total consolidated debt as of December 31, 2008 was approximately $110.3 million and represented approximately 2.10 of our total capitalization as of that date. After giving effect to the repayment of the facility to the International Finance Corporation, on March 3, 2009, our debt to equity ratio would be 1.53 to 1. Our level of indebtedness could have important consequences to investors, because:
- •
- it could affect our ability to satisfy our payment obligations under our indebtedness;
- •
- a substantial portion of our cash flows from operations will have to be dedicated to interest and principal payments and may not be available for operations, working capital, capital expenditures, expansion, acquisitions or general corporate or other purposes;
- •
- it may impair our ability to obtain additional financing in the future;
- •
- it may impair our ability to compete with companies that are not as highly leveraged;
- •
- it may limit our flexibility in planning for, or reacting to, changes in our business and industry; and
- •
- it may make us more vulnerable to downturns in our business, our industry or the economy in general.
Provisions in our charter documents, the indenture for the Convertible Senior Notes and Delaware law could discourage an acquisition of us by a third party, even if the acquisition would be favorable to holders of our common stock.
If a "change in control" (as defined in the indenture for the Convertible Senior Notes) occurs, holders of the Convertible Senior Notes will have the right, at their option, to require us to repurchase all or a portion of their notes. In the event of certain "fundamental changes" (as defined in the indenture for the Convertible Senior Notes), we also may be required to increase the conversion rate applicable to notes surrendered for conversion upon the fundamental change. In addition, the indenture for the Convertible Senior Notes prohibits us from engaging in certain mergers or acquisitions unless, among other things, the
30
Table of Contents
surviving entity assumes our obligations under the notes. These and other provisions, including the provisions of our charter documents and Delaware law, could prevent or deter a third party from acquiring us even where the acquisition could be beneficial to holders of our common stock or the notes.
Our charter documents provide our board of directors the right to issue preferred stock upon such terms and conditions as it deems to be in our best interests. The terms of such preferred stock may adversely impact the dividend and liquidation rights of the common stockholders without the approval of the common stockholders.
ITEM 1B. Unresolved Staff Comments
None.
ITEM 2. Properties (see Items 1 and 2. Business and Properties)
ITEM 3. Legal Proceedings
Black Sea Incidents
In October 2005, in an incident involving a vessel owned by Micoperi Srl, the Ayazli 2 and Ayazli 3 wells were damaged, and subsequently had to be re-drilled. We and our co-venturers made a claim in respect of the cost of re-drilling and repeating flow-testing. The amount claimed was approximately $10.8 million before interest, subject to adjustment when the actual cost of flow-testing the re-drilled wells was known. In addition, we and our co-venturers claimed to recover back from Micoperi a sum of about $8.2 million paid to Micoperi under the contract between us, our co-venturers and Micoperi. Micoperi made a cross-claim for about $7.1 million in respect of sums allegedly due to Micoperi under the contract between us, our co-venturers and Micoperi. Micoperi also asserted a claim that the arrest of the vessel "MICOPERI 30" at Palermo, Italy was wrongful and asserted a claim for damages in respect of such allegedly wrongful arrest. We and our co-ventures received security from Micoperi by way of a letter of undertaking from their insurers, and provided security to Micoperi in respect of their cross-claims by way of a bank guarantee of $8.2 million. The claims and cross-claims were subject to the jurisdiction of the English Court; however, neither side commenced any court proceedings. All the amounts stated above are gross and our share was equal to 36.75%. Following mediation in London, an agreement was reached on November 14, 2008 between Toreador, our co-venturers and Micoperi, whereby a full settlement of all claims related to the 2005 incident was reached. The settlement's net proceeds to us were approximately $1.4 million and we were released of all cross-claims from Micoperi regarding the 2005 incident.
The Company has indemnified a third party vendor for any claims made related to this incident. However, the Company believes the possibility of a claim being asserted is remote.
Other
From time to time, we are named as a defendant in other legal proceedings arising in the normal course of business. In our opinion, the final judgment or settlement, if any, that may be awarded with any suit or claim would not have a material adverse effect on our financial position.
Item 4. Submission of Matters to a Vote of Security Holders
No matters were submitted to a vote of security holders during the quarter ended December 31, 2008.
31
Table of Contents
PART II
Item 5. Market for Registrant's Common Equity, Related Stockholder Matters and Issuer Purchases of Equity Securities
Common Stock
Our shares of common stock, par value $.15625 per share, are traded on the Nasdaq Global Market under the trading symbol "TRGL." The following table sets forth the high and low sale prices per share for the common stock for each quarterly period during the past two calendar years as reported by Nasdaq Global Market (previously known as the Nasdaq National Market) based upon quotations that reflect inter-dealer prices, without retail mark-up, mark-down or commission and may not necessarily represent actual transactions.
| | | | | | | |
| | High | | Low | |
|---|
2008: | | | | | | | |
Fourth quarter | | $ | 9.67 | | $ | 2.84 | |
Third quarter | | | 10.15 | | | 6.45 | |
Second quarter | | | 10.49 | | | 7.40 | |
First quarter | | | 10.58 | | | 6.15 | |
2007: | | | | | | | |
Fourth quarter | | $ | 12.13 | | $ | 5.69 | |
Third quarter | | | 15.71 | | | 9.75 | |
Second quarter | | | 19.41 | | | 12.44 | |
First quarter | | | 28.29 | | | 17.42 | |
As of March 10, 2008, there were 20,264,333 shares of common stock outstanding and held of record by approximately 450 holders (inclusive of those brokerage firms, clearing houses, banks and other nominee holders, holding common stock for clients, with each such nominee being considered as one holder).
The closing price of the common stock on the Nasdaq Global Market on March 10, 2008 was $2.85.
Dividends on the common stock may be declared and paid out of funds legally available when and as determined by our board of directors. Our board of directors plans to continue our policy of holding and investing corporate funds on a conservative basis, retaining earnings to finance the growth of our business. Therefore, we do not anticipate paying cash dividends on our common stock in the foreseeable future. In addition, prior to its retirement, the terms of the loan and guarantee agreement with the International Finance Corporation restricted our ability to pay dividends to only those required by law and on the Series A-1 Convertible Preferred Stock, which series is no longer outstanding.
Until the Series A-1 Convertible Preferred Stock was no longer outstanding on December 31, 2007, dividends on our Series A-1 Convertible Preferred Stock were paid on a quarterly basis per the terms of such series. Cash dividends totaling $162,000 were paid for the years ended December 31, 2007 and December 31, 2006 on the Series A-1 Convertible Preferred Stock. In December 2007, the remaining 72,000 shares of the Series A-1 Convertible Preferred Stock were converted into 450,000 shares of common stock.
During 2008, there were no equity securities issued pursuant to transactions exempt from the registration requirements under the Securities Act of 1933, as amended, that were not disclosed previously in Current Reports on Form 8-K or Quarterly Reports on Form 10-Q.
32
Table of Contents
For the year ended December 31, 2008, we did not repurchase any shares of our common stock which is our only class of equity securities that is registered pursuant to Section 12 of the Securities and Exchange Act of 1934, as amended.
Below is a line graph comparing the 5-year cumulative total stockholder return on our common stock with the Nasdaq Market Index and the Hemscott Group Index:
COMPARISON 5-YEAR CUMULATIVE TOTAL RETURN
AMONG TOREADOR RESOURCES CORP.,
NASDAQ MARKET INDEX AND HEMSCOTT GROUP INDEX
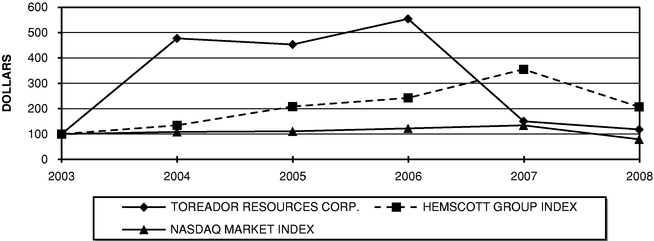
ASSUMES $100 INVESTED ON JAN. 01, 2004
ASSUMES DIVIDEND REINVESTED
FISCAL YEAR ENDING DEC. 31, 2008
33
Table of Contents
Item 6. Selected Financial Data
The following selected financial information (which is not covered by the report of an independent registered public accounting firm) is summarized from our results of operations for the five-year period ended December 31, 2008 and as well as selected consolidated balance sheet data as of December 31, 2008, 2007, 2006, 2005 and 2004 and should be read in conjunction with the consolidated financial statements and the notes thereto included herewith.
The results of operations of assets in the United States have been presented as discontinued operations in the accompanying consolidated statements of operations.
| | | | | | | | | | | | | | | | | | |
| | Years Ended December 31, | |
|---|
| | 2008 | | 2007 | | 2006 | | 2005 | | 2004 | |
|---|
| | (Amounts in thousands, except per share amounts)
| |
|---|
Operating Results: | | | | | | | | | | | | | | | | |
| | Revenues | | $ | 62,374 | | $ | 41,691 | | $ | 33,328 | | $ | 23,411 | | $ | 15,041 | |
| | Costs and expenses | | | (158,783 | ) | | (99,088 | ) | | (29,741 | ) | | (21,504 | ) | | (20,329 | ) |
| | Operating income (loss) | | | (96,409 | ) | | (57,397 | ) | | 3,587 | | | 1,907 | | | (5,288 | ) |
| | Other income (expense) | | | (6,098 | ) | | (28,745 | ) | | 893 | | | 4,015 | | | (790 | ) |
| | Income (loss) from continuing operations before income tax | | | (102,507 | ) | | (86,142 | ) | | 4,480 | | | 5,922 | | | (6,078 | ) |
| | Income tax benefit (provision) | | | (6,076 | ) | | 4,676 | | | (3,005 | ) | | 1,911 | | | 2,194 | |
| | Income (loss) from continuing operations, net of tax | | | (108,583 | ) | | (81,466 | ) | | 1,475 | | | 7,833 | | | (3,884 | ) |
| | Income (loss) from discontinued operations, net of tax | | | (22 | ) | | 7,045 | | | 1,103 | | | 2,762 | | | 19,304 | |
| | Dividends on preferred shares | | | — | | | (162 | ) | | (162 | ) | | (684 | ) | | (714 | ) |
| | Income (loss) available to common shares | | $ | (108,605 | ) | $ | (74,583 | ) | $ | 2,416 | | $ | 9,911 | | $ | 14,706 | |
| | Basic income (loss) available to common shares per share | | $ | (5.48 | ) | $ | (4.07 | ) | $ | 0.16 | | $ | 0.69 | | $ | 1.54 | |
| | Diluted income (loss) available to common shares per share | | $ | (5.48 | ) | $ | (4.07 | ) | $ | 0.15 | | $ | 0.66 | | $ | 1.54 | |
| | Weighted average shares outstanding | | | | | | | | | | | | | | | | |
| | | Basic | | | 19,831 | | | 18,358 | | | 15,527 | | | 14,213 | | | 9,571 | |
| | | Diluted | | | 19,831 | | | 18,358 | | | 15,884 | | | 15,140 | | | 9,571 | |
Balance Sheet Data: | | | | | | | | | | | | | | | | |
| | Working capital | | $ | 33,948 | | $ | 9,644 | | $ | 14,388 | | $ | 101,977 | | $ | 11,113 | |
| | Oil and natural gas properties, net | | | 109,711 | | | 271,951 | | | 241,099 | | | 127,480 | | | 69,644 | |
| | Oil and natural gas properties held for sale, net | | | 55,000 | | | — | | | — | | | — | | | — | |
| | Total assets | | | 207,156 | | | 323,111 | | | 317,204 | | | 261,814 | | | 94,674 | |
| | Debt, including current portion | | | 110,275 | | | 116,250 | | | 112,800 | | | 92,060 | | | 9,022 | |
| | Stockholders' equity | | | 52,560 | | | 163,825 | | | 147,151 | | | 132,359 | | | 63,250 | |
Cash Flow Data: | | | | | | | | | | | | | | | | |
| | Net cash provided by (used in) operating activities | | $ | 17,834 | | $ | (25,786 | ) | $ | 14,104 | | $ | (138 | ) | $ | (8,177 | ) |
| | Capital expenditures for oil and natural gas property and equipment, including acquisitions | | | 10,702 | | | 90,644 | | | 105,165 | | | 50,163 | | | 15,985 | |
34
Table of Contents
Item 7. Management's Discussion and Analysis of Financial Condition and Results of Operations
CAUTIONARY STATEMENT REGARDING FORWARD-LOOKING STATEMENTS
Certain of the matters discussed under the captions "Business and Properties," "Legal Proceedings," "Management's Discussion and Analysis of Financial Condition and Results of Operations," and elsewhere in this annual report may constitute "forward-looking" statements for purposes of the Securities Act of 1933, and the Securities Exchange Act of 1934 and, as such, may involve known and unknown risks, uncertainties and other factors that may cause the actual results, performance or achievements to be materially different from future results, performance or achievements expressed or implied by such forward-looking statements. When used in this report, the words "anticipates," "estimates," "plans," "believes," "continues," "expects," "projections," "forecasts," "intends," "may," "might," "could," "should," and similar expressions are intended to be among the statements that identify forward-looking statements. Various factors that could cause the actual results, performance or achievements to differ materially from our expectations are disclosed in this report ("Cautionary Statements"), including, without limitation, those statements made in conjunction with the forward-looking statements included under the captions identified above and otherwise herein. All written and oral forward-looking statements attributable to us are expressly qualified in their entirety by the Cautionary Statements.
Executive Overview
We are an independent international energy company engaged in oil and natural gas exploration, development, production, leasing and acquisition activities. We have developed a corporate platform that will be the building blocks of our new corporate strategy that will be presented at the Annual Shareholder Meeting in June 2009. The Board and management are committed to restoring shareholder value, exercising financial discipline, transparency in all transactions, assessing strategic alternatives that lay outside and beyond the platform and strengthening the Company during the current economic crisis, so that we may outperform our peers.
We believe that the following proactive steps will be the base for the future growth of the Company:
- •
- The $55 million sale of a 26.75% interest in the South Akcakoca Sub-Basin (SASB) to Petrol Ofisi was closed and $50 million was funded on March 3, 2009;
- •
- The Company has retained Stellar Energy Advisors, based in London, UK, to manage an open bid process to sell its remaining 10% interest in the SASB, in addition to its onshore production, and 2.2 million net acres in exploration licenses that are currently held;
- •
- Per the covenants of the International Finance Corporation revolving credit facility, net proceeds of the Petrol Ofisi sale have been used to fully repay and retire the facility;
- •
- A share buyback program has been adopted by the Board of Directors for the repurchase of up to 1 million common shares of Toreador that may be repurchased in the open market at any time over the next 12 months;
- •
- The Company intends to buy back a portion of its currently outstanding Convertible Senior Notes;
- •
- Notwithstanding that the Company is incorporated in Delaware and listed on the NASDAQ, its operations are located in Europe. With its current headquarters in Dallas costing over $7 million a year in overhead, there is considerable room to improve efficiency and integrate activities across the Company. The Company expects to have completed moving its headquarters to its Paris office by July 2009, reducing its presence in the United States to focus only on securities exchange requirements and investor relations;
- •
- The Company plans to continue with its efforts to establish a strong presence in Hungary, and it is currently drilling an exploration well on the Tompa Block in Hungary, with results expected by early second quarter;
35
Table of Contents
- •
- The Paris Basin will remain the Company's core asset with current production of approximately 1,000 net barrels per day coming from low-decline, long-life assets. A comprehensive portfolio review of our fields and 461,000 net acres held pursuant to licenses is now underway. The results of the study will be launched as part of the three year strategic plan at the Annual Stockholders Meeting in June 2009.
Financial Summary
- •
- For the year ended December 31, 2008, we had revenues of $62.4 million which is primarily due to the dramatic increase in worldwide oil prices received in 2008.
- •
- Operating costs for the year ended December 31, 2008 were $158.8 million of which $85 million is attributable to the impairment of oil and gas property, primarily in Turkey.
- •
- Net loss available to common shares was $108.6 million for the year ended December 31, 2008.
- •
- Production was 805 MBOE for the year ended December 31, 2008.
- •
- Capital expenditures were $11 million for the year ended December 31, 2008.
- •
- Cash and cash equivalents of $19.4 million for the year ended December 31, 2008.
- •
- Repurchase of $6 million of convertible notes at a discounted purchase price of $5.3 million for the year ended December 31, 2008.
- •
- A current ratio of 1.66 to 1 at December 31, 2008.
- •
- A debt (current portion of long-term debt and Convertible Senior Notes) to equity ratio of 2.10 to 1 at December 31, 2008.
- •
- Oil and natural gas properties held for sale of $55 million, is the fair value of the assets in the sale of our 26.75% of 36.75% interest in the South Akcakoca Sub-basin project to Petrol Ofisi. It is classified as a current asset as the sale was expected to close within one year of the December 31, 2008.
The discussion and analysis of our financial condition and results of operations is based upon the consolidated financial statements, which have been prepared in accordance with accounting principles generally accepted in the United States. The preparation of these financial statements requires us to make estimates and judgments that affect the reported amounts of assets, liabilities, revenues and expenses. Our significant accounting policies are described in Note 2 to our consolidated financial statements included in this Form 10-K. We have identified below, policies that are of particular importance to the portrayal of our financial position and results of operations and which require the application of significant judgment by management. We analyze our estimates on a periodic basis and base our estimates on experience and various other assumptions that we believe to be reasonable under the circumstances. Actual results may differ from these estimates. We believe the following critical accounting policies affect our more significant judgments and estimates used in the preparation of our financial statements:
We account for our oil and natural gas exploration and development activities utilizing the successful efforts method of accounting. Under this method, costs of productive exploratory wells, development dry holes and productive wells and undeveloped leases are capitalized. Oil and natural gas lease acquisition costs are also capitalized. Exploration costs, including personnel costs, certain geological and geophysical expenses and delay rentals for oil and natural gas leases, are charged to expense as incurred. Exploratory drilling costs are initially capitalized, but such costs are charged to expense if and when the well is
36
Table of Contents
determined not to have found reserves in commercial quantities. In most cases, a gain or loss is recognized for sales of producing properties.
As of December 31, 2008, we had no costs associated with exploratory costs that had been capitalized for a period of one year or less.
As of December 31, 2008, we had $2.4 million associated with exploratory costs that have been capitalized for a period of greater than one year.
The application of the successful efforts method of accounting requires management's judgment to determine the proper designation of wells as either developmental or exploratory, which will ultimately determine the proper accounting treatment of the costs incurred. The results from a drilling operation can take considerable time to analyze, and the determination that commercial reserves have been discovered requires both judgment and application of industry experience. Wells may be completed that are assumed to be productive and actually deliver oil and natural gas in quantities insufficient to be economic, which may result in the abandonment of the wells at a later date. On occasion, wells are drilled which have targeted geologic structures that are both developmental and exploratory in nature, and in such instances an allocation of costs is required to properly account for the results. Delineation seismic costs incurred to select development locations within a productive oil and natural gas field are typically treated as development costs and capitalized, but often these seismic programs extend beyond the proved reserve areas and, therefore, management must estimate the portion of seismic costs to expense as exploratory. The evaluation of oil and natural gas leasehold acquisition costs requires management's judgment to estimate the fair value of exploratory costs related to drilling activity in a given area. Drilling activities in an area by other companies may also effectively condemn leasehold positions.
The successful efforts method of accounting can have a significant impact on the operational results reported when we enter a new exploratory area in hopes of finding oil and natural gas reserves. The initial exploratory wells may be unsuccessful and the associated costs will be expensed as dry hole costs. Seismic costs can be substantial which will result in additional exploration expenses when incurred.
Proved reserves are estimated quantities of crude oil, natural gas and natural gas liquids that geological and engineering data demonstrate with reasonable certainty to be recoverable in future years from known reservoirs under existing economic and operating conditions. Proved developed reserves are reserves that can be expected to be recovered through existing wells with existing equipment and operating methods as well as oil and natural gas expected to be obtained through the application of fluid injection or other improved recovery techniques for supplementing the natural forces and mechanisms of primary recovery after testing by a pilot project or after the operation of an installed program has been confirmed through production response that increased recovery will be achieved. Proved undeveloped reserves are reserves that are expected to be recovered from new wells on undrilled acreage or from existing wells where a relatively major expenditure is required for recompletion. Proved undeveloped reserves on undrilled acreage are limited (i) to those drilling units offsetting productive units that are reasonably certain of production when drilled and (ii) to other undrilled units where it can be demonstrated with certainty that there is continuity of production from the existing productive formation. We emphasize that the volume of reserves are estimates that, by their nature are subject to revision. The estimates are made using geological and reservoir data, as well as production performance data. These estimates are reviewed annually and revised, either upward or downward, as warranted by additional performance data. These reserve revisions result primarily from improved or a decline in performance from a variety of sources such as an addition to or a reduction in recoveries below or above previously established lowest known hydrocarbon levels, improved or a decline in drainage from natural drive mechanisms, and the realization of improved or declined drainage areas. If the estimates of proved reserves were to decline, the rate at which we record depletion expense would increase.
37
Table of Contents
For the year ended December 31, 2008, we had a downward reserve revision of 37.41%. At December 31, 2007 the price used for evaluating our oil reserves was $95.72 per barrel as compared to the December 31, 2008 price of $34.29 per barrel. This 65% decrease in oil price had a severe impact on the economic life of our wells, but also on the discounted present value at 10% and the standardized measure of proved reserves. This downward revision, which primarily affected our French oil reserves, was due to the following factors (i) decrease in economic life due to change in economics caused a net decrease of 1,682 MBbl; (ii) removing twelve proved undeveloped locations caused a net decrease of 1,889 MBbl; (iii) negative reserve revisions resulted in a decrease in reserves of 405 MBbl; (iv) fourteen wells were shut-in resulting in a decrease of 401 MBbl; (v) three drilled locations in prior years resulted in one producing well which was non-commercial at December 31, 2008 causing a net decrease of 280 MBbl; (vi) one well was lost during workover operations causing a net decrease 37 MBbl; and (vii) 2008 production of 805 MBOE. In Hungary, we were able to secure a gas contract and were able to restore the reserves lost in 2007, this resulted in an increase of 159 MBOE and in Romania due to the poor performance of the field resulted in a decrease of 54 MBOE. In Turkey, we had downward revisions of 390 MBOE. which was due to a decrease in the economic life of the proved developed wells.
For the year ended December 31, 2007, we had a downward reserve revision of 4.8%. This downward revision was due to the following factors: (i) in Hungary, lack of a gas market caused a deletion of previously booked, technical recoverable reserves of 159 MBOE; (ii) in Romania, one gas well watered out and another is under performing based on previous projections resulting in a downward revision of 305.6 MBOE; and (iii) in the South Akcakoca Sub-Basin in Turkey, new pressure information and early performance data refined the geological interpretation resulting in a downward revision of 1,369.4 MBOE. These downward revisions were partially offset by improved performance in the Neocomian Field in France and the Cendere Field in Turkey.
For the year ended December 31, 2006, we had a downward reserve revision of 9%. This downward revision was due to the following factors: (i) in the Charmottes Field in France, several high volume producing wells experienced rapidly increasing water production which caused performance declines resulting in a downward revision of 921 MBbl; (ii) in Romania, two gas wells watered out after producing for short periods of time resulting in a downward revision of 197 MBOE; (iii) in the South Akcakoca Sub-Basin, due to new drilling, a previous geological interpretation was refined resulting in a downward revision of 192 MBOE and (iv) there was a downward revision of 73 MBOE due to a decline in prices. These downward revisions were partially offset by upward revisions of 187 MBOE due to performance revisions over several fields, none of which individually contributed a significant portion of this upward revision.
We review our proved oil and natural gas properties for impairment on an annual basis or whenever events and circumstances indicate a potential decline in the recoverability of their carrying value. We estimate the expected future cash flows from our proved oil and natural gas properties and compare these future cash flows to the carrying value of the oil and natural gas properties to determine if the carrying value is recoverable. If the carrying value exceeds the estimated undiscounted future cash flows, we will adjust the carrying value of the oil and natural gas properties to its fair value in the current period. The factors used to determine fair value include, but are not limited to, estimates of reserves, future commodity prices, future production estimates, anticipated capital expenditures, and a discount rate commensurate with the risk associated with realizing the expected cash flows projected. Unproved properties are reviewed quarterly to determine if there has been impairment of the carrying value, with any such impairment charged to expense in the period. Given the complexities associated with oil and natural gas reserve estimates and the history of price volatility in the oil and natural gas markets, events may arise that will require us to record an impairment of our oil and natural gas properties and there can be no assurance that such impairments will not be required in the future nor that they will not be material.
38
Table of Contents
Impairment charged in 2008 was $85.2 million compared to $13.4 million in 2007. The impairment was a result of the following:
(1) In 2008, the impairment charge in Turkey was a result of a decline in the fair market value of the Company's interest in South Akcakoca Sub-Basin assets. In June 2008, we determined the fair market value based on a Letter of Intent to sell a 26.75% interest in the South Akcakoca Sub-Basin assets to Petrol Ofisi AS for $80.3 million. This sale price indicated that the fair value of our 36.75% working interest was approximately $103.8 million. The net book value of the Black Sea asset at June 30, 2008 was $157.3 million, resulting in an impairment of $53.5 million.
(2) In January 2009, the Company and Petrol Ofisi agreed to a revised purchase price of $55 million. This resulted in an impairment on assets held for sale, which is comprised of the 26.75% interest in the South Akcakoca Sub-basin assets, of $25.6 million.
(3) In December 2008, we incurred an additional $2.4 million impairment charge in Turkey for assets that were unrelated to the sale of South Akcakoca Sub-Basin assets. The impairment was a result of writing off an exploratory well where sufficient progress was not made to develop the area and a plan of development will not be prepared by the operator in the foreseeable future.
(4) We recorded an impairment charge of $2 million for the undeveloped leasehold costs in Trinidad, due to management's decision to exit Trinidad and discontinue our association with our registered agent in the country.
(5) When recording the acquisition of Madison Oil in 2002, we recorded $833,000 of goodwill associated with the Turkish assets. We periodically review the value of goodwill to determine if an impairment is required. The review at December 31, 2008, indicated that the total amount recorded for goodwill should be impaired. The reason for this impairment is due to the fair value of the Turkish subsidiary, based on the discounted present value of the oil and gas reserves being less than the carrying value of the Turkish subsidiary. This resulted in an impairment charge of $833,000.
(6) In December 2008, we recorded an impairment in Romania of $600,000 due to the net book value of the oil and natural gas properties exceeding future cash flows.
(7) In April 2007, we sold our interest in ePsolutions for $3.4 million in cash and 50,000 shares of preferred stock with a value of $10.00 per share. Due to the rising cost of electricity and the deterioration of the deregulated electric market in Texas, ePsolutions has reduced their forecasted growth for the next several years. Accordingly, we have reduced our carrying value of our investment in ePsolutions by $300,000 which we believe more accurately reflects the current market value of this investment.
Future Development and Abandonment Costs
Future development costs include costs to be incurred to obtain access to proved reserves, including drilling costs and the installation of production equipment. Future abandonment costs include costs to dismantle and relocate or dispose of our production equipment, gathering systems, wells and related structures and restoration costs of land. We develop estimates of these costs for each of our properties based upon the type of production structure, depth of water, reservoir characteristics, depth of the reservoir, market demand for equipment, currently available procedures and consultations with construction and engineering consultants. Because these costs typically extend many years into the future, estimating these future costs is difficult and requires management to make estimates and judgments that are subject to future revisions based upon numerous factors, including changing technology, the ultimate settlement amount, inflation factors, credit adjusted discount rates, timing of settlement and changes in the political, legal, environmental and regulatory environment. We review our assumptions and estimates of future abandonment costs on an annual basis. The accounting for future abandonment costs changed on January 1, 2003, with the adoption of SFAS 143"Accounting for Asset Retirement Obligations". SFAS 143 requires that the fair value of a liability for an asset retirement obligation be recorded in the period in
39
Table of Contents
which it is incurred and the corresponding cost be capitalized by increasing the carrying amount of the related long-lived asset. The liability is accreted to its present value each period, and the capitalized cost is depreciated over the useful life of the related asset. If the liability is settled for an amount other than the recorded amount, a gain or loss is recognized. In 2005, two separate incidents occurred offshore Turkey in the Black Sea, which resulted in the sinking of two caissons and the loss of three natural gas wells. The Company has not been requested to or ordered by any government or regulatory body to remove the caissons. Therefore, the Company believes the likelihood of receiving such an order is remote and no liability has been recorded.
Holding all other factors constant, if our estimate of future abandonment costs is revised upward, earnings would decrease due to higher depreciation, depletion and amortization expense. Likewise, if these estimates were revised downward, earnings would increase due to lower depreciation, depletion and amortization expense.
For financial reporting purposes, we generally provide taxes at the rate applicable for the appropriate tax jurisdiction. Because our present intention is to reinvest the unremitted earnings in our foreign operations, we do not provide U.S. income taxes on unremitted earnings of foreign subsidiaries. Management periodically assesses the need to utilize these unremitted earnings to finance our foreign operations. This assessment is based on cash flow projections that are the result of estimates of future production, commodity prices and expenditures by tax jurisdiction for our operations. Such estimates are inherently imprecise since many assumptions utilized in the cash flow projections are subject to revision in the future.
Management also periodically assesses, by tax jurisdiction, the probability of recovery of recorded deferred tax assets based on its assessment of future earnings estimates. Such estimates are inherently imprecise since many assumptions utilized in the assessments are subject to revision in the future.
We periodically utilize derivatives instruments such as futures and swaps for purposes of hedging our exposure to fluctuations in the price of crude oil sales. In accordance with SFAS No. 133, Accounting for"Derivative Instruments and Hedging Activities," we have elected not to designate the derivative financial instruments to which we are a party as hedges, and accordingly, we record such contracts at fair value and recognize changes in such fair value in current earnings as they occur. We determine the fair value of futures and swap contracts based on the difference between their fixed contract price and the underlying market price at the determination date. The realized and unrealized gains and losses on derivatives are recorded as a derivative fair value gain or loss in the income statement.
The functional currency for Turkey, Romania and Hungary is the United States Dollar and in France the functional currency is the Euro. Translation gains or losses resulting from transactions in the New Turkish Lira in Turkey, the Lei in Romania and the Forint in Hungary are included in income available to common shares for the current period. Translation gains and losses resulting from transactions in Euros are included in other comprehensive income for the current period. We periodically review the operations of our entities to ensure the functional currency of each entity is the currency of the primary economic environment in which we operate.
New Accounting Pronouncements
In September 2006, the Financial Accounting Standards Board ("FASB") issued Statement No. 157"Fair Value Measurements" ("SFAS No. 157"). SFAS No. 157 provides guidance for using fair value to measure assets and liabilities. It applies whenever other standards require or permit assets or liabilities to
40
Table of Contents
be measured at fair value but it does not expand the use of fair value in any new circumstances. In November 2007, the FASB issued FSP No. 157-2 to defer the effective date of SFAS 157 to fiscal year beginning after November 15, 2008, and the interim period for that fiscal year for all non-financial assets and liabilities, except those that are recognized or disclosed at fair value on a recurring basis. We are currently evaluating the impact of our adoption of FSP No. 157-2 which was adopted effective January 1, 2009. The provisions of SFAS No. 157 that were not deferred were effective for financial statements issued for fiscal years beginning after November 15, 2007. The adoption of SFAS No. 157, effective January 1, 2008, did not have a significant effect on our reported financial position or earnings. In October 2008, the FASB issued FSP No. 157-3,"Determining the Fair Value of a Financial Asset When the Market for That Asset is Not Active" (FSP 157-3). FSP 157-3 clarifies the application of SFAS 157, which the Company adopted as of January 1, 2008, in cases where a market is not active. The Company has considered FSP 157-3 in its determination of estimated fair values as of December 31, 2008, and the impact was not material.
In February 2007, the FASB issued Statement 159,"The Fair Value Option for Financial Assets and Financial Liabilities —Including an Amendment of FASB Statement 115" ("SFAS No. 159"). SFAS No. 159 permits entities to choose to measure certain financial instruments and other items at fair value. The objective is to improve financial reporting by providing entities with the opportunity to mitigate volatility in reported earnings caused by measuring related assets and liabilities differently without having to apply complex hedge accounting provisions. Unrealized gains and losses on any items for which we elect the fair value measurement option are to be reported in earnings. SFAS No. 159 is effective for fiscal years beginning after November 15, 2007. The Company elected not to measure any eligible items using the fair value option in accordance with SFAS No. 159 and therefore the adoption of SFAS No. 159, effective January 1, 2008, did not have an effect on our reported financial position or earnings.
In December 2007, the FASB issued Statement No. 141R,"Business Combinations" ("SFAS No. 141R"). Under SFAS No. 141R, a company is required to recognize the assets acquired, liabilities assumed, contractual contingencies, and any contingent consideration measured at their fair value at the acquisition date. It further requires that research and development assets acquired in a business combination that have no alternative future use are to be measured at their acquisition-date fair value and then immediately charged to expense, and that acquisition-related costs are to be recognized separately from the acquisition and expensed as incurred. Among other changes, this statement also requires that "negative goodwill" be recognized in earnings as a gain attributable to the acquisition, and any deferred tax benefits resultant in a business combination be recognized in income from continuing operations in the period of the combination. SFAS No. 141R is effective for business combinations for which the acquisition date is on or after the beginning of the first annual reporting period beginning after December 15, 2008. We are currently determining the effect of adopting SFAS No. 141R.
In December 2007, the FASB issued Statement No. 160,"Noncontrolling Interests in Consolidated Financial Statements" —an amendment of ARB No. 51 ("SFAS No. 160"). SFAS No. 160 amends ARB 51 to establish accounting and reporting standards for the noncontrolling interest in a subsidiary and for the deconsolidation of a subsidiary. It clarifies that a noncontrolling interest in a subsidiary, which is sometimes referred to as minority interest, is an ownership interest in the consolidated entity that should be reported as equity in the consolidated financial statements. Among other requirements, this statement requires consolidated net income to be reported at amounts that include the amounts attributable to both the parent and the noncontrolling interest. It also requires disclosure, on the face of the consolidated income statement, of the amounts of consolidated net income attributable to the parent and to the noncontrolling interest. SFAS No. 160 is effective for financial statements issued for fiscal years, and interim periods within those fiscal years, beginning after December 15, 2008. The effect of adopting SFAS No. 160 is not expected to have an effect on our reported financial position or earnings.
In March 2008, the FASB issued Statement No. 161 —"Disclosures about Derivative Instruments and Hedging Activities" — an Amendment of FASB Statement No. 133 ("SFAS No. 161"). This statement changes the disclosure requirements for derivative instruments and hedging activities. Entities are required to provide enhanced disclosures about (i) how and why an entity uses derivative instruments, (ii) how
41
Table of Contents
derivative instruments and related hedged items are accounted for under FASB Statement No. 133 and its related interpretations, and (iii) how derivative instruments and related hedged items affect an entity's financial position, financial performance, and cash flows. SFAS No. 161 is effective for annual periods beginning after November 15, 2008. We are currently assessing the effect, if any, the adoption of SFAS No. 161 will have on our financial statements and related disclosures.
In May 2008, the FASB issued Statement No. 162 —"The Hierarchy of Generally Accepted Accounting Principles ("SFAS No. 162"). The new standard is intended to improve financial reporting by identifying a consistent framework, or hierarchy, for selecting accounting principles to be used in preparing financial statements that are presented in conformity with U.S. generally accepted accounting principles for nongovernmental entities. SFAS No. 162 will be effective 60 days following the SEC's approval of the Public Company Accounting Oversight Board Auditing amendments to AU Section 411,The Meaning of Present Fairly in Conformity with Generally Accepted Accounting Principles. We are currently assessing the effect, if any, the adoption of SFAS No. 162 will have on our financial statements and related disclosures.
On December 31, 2008 the Securities and Exchange Commission ("SEC") issued the final rule, "Modernization of Oil and Gas Reporting" (Final Reporting Rule). The Final Reporting Rule adopts revisions to the SEC's oil and gas reporting disclosure requirements and is effective for annual reports on Forms 10-K for years ending on or after December 31, 2009. The revisions are intended to provide investors with a more meaningful and comprehensive understanding of oil and gas reserves to help investors evaluate their investments in oil and gas companies. The amendments are also designed to modernize the oil and gas disclosure requirements to align them with current practices and changes in technology. Revised requirements in the Final Reporting Rule include, but are not limited to:
- •
- Oil and gas reserves must be reported using the un-weighted arithmetic average of the first day of the month price for each month within a 12 month period, rather than year-end prices;
- •
- Companies will be allowed to report, on an optional basis, probable and possible reserves;
- •
- Non-traditional reserves, such as oil and gas extracted from coal and shales, will be included in the definition of "oil and gas producing activities;"
- •
- Companies will be permitted to use new technologies to determine proved reserves, as long as those technologies have demonstrated empirically to lead to reliable conclusions with respect to reserve volumes;
- •
- Companies will be required to disclose, in narrative form, additional details on their proved undeveloped reserves ("PUDs"), including the total quantity of PUDs at year end, and any material changes to PUDs that occurred during the year, investments and progress made to convert PUDs to developed oil and gas reserves and an explanation of the reasons why material concentrations of PUDs in individual fields or countries have remained undeveloped for five years or more after disclosure as PUDs; and
- •
- Companies will be required to report the qualifications and measures taken to assure the independence and objectivity of any business entity or employee primarily responsible for preparing or auditing reserve estimates.
We are currently evaluating the potential impact of adopting the Final Reporting Rule. The SEC is discussing the Final Reporting Rule with the FASB staff to align FASB accounting standards with the new SEC rules. These discussions may delay the required compliance date. Absent any change in the effective date, we will comply with the disclosure requirements in our annual report on Form 10-K for the year ended December 31, 2009.
In November 2008, the FASB ratified EITF 08-6, "Equity Method Investment Accounting Considerations" ("EITF08-6") which clarifies how to account for certain transactions involving equity method investments. The initial measurement, decreases in value and changes in the level of ownership of the equity method investment are addressed. EITF 08-6 is effective on a prospective basis for our fiscal
42
Table of Contents
year beginning January 1, 2009 and interim periods within the year. Early application by an entity that has previously adopted an alternative accounting policy is not permitted. Adoption is not expected to have a significant impact on our consolidated results of operations or cash flows.
In May 2008, the FASB issued FASB Staff Position ("FSP") No. APB 14-1, "Accounting for Convertible Debt Instruments That May Be Settled in Cash Upon Conversion (Including Partial Cash Settlement)" ("FSP APB No. 14-1"). FSP APB No. 14-1 specifies that issuers of such instruments should separately account for the liability and equity components in a manner that will reflect the entity's nonconvertible debt borrowing rate when interest costs are recognized in subsequent periods. FSP APB No. 14-1 is effective for financial statements issued for fiscal years beginning after December 15, 2008 and interim periods within those fiscal years. FSP ABP No. 14-1 should be applied retrospectively for all periods presented. The Company is currently evaluating what impact the adoption of this pronouncement will have on its consolidated financial statements.
LIQUIDITY AND CAPITAL RESOURCES
This section should be read in conjunction with Notes 7 and 8 to Notes to Consolidated Financial Statements included in this filing.
As of December 31, 2008, we had cash and cash equivalents and restricted cash of $19.4 million, a current ratio of approximately 1.66 to 1 and a debt (current portion of long-term debt and Convertible Senior Notes) to equity ratio of 2.10 to 1. For the twelve months ended December 31, 2008, we had an operating loss of $96.4 million and capital expenditures were $11 million. The restricted cash relates to a letter of credit to secure additional permits in Hungary.
During 2008, we saw oil prices rise to unprecedented levels and then in September we saw the start of a deterioration in the credit and equity markets which has continued to deteriorate further in 2009. We also experienced a 50% - 60% decline in oil prices from the highest prices received in 2008. These severe economic conditions have caused the Company to reevaluate its capital expenditure program for 2009 and how the Company will operate on a go forward basis.
In February 2009, the Company announced a new platform from which a new strategy will be built. The platform is built on (i) reduction in overhead — through moving our corporate headquarters to Paris, France, significant savings of general and administrative expense due to a consolidation of job functions and the sale of all the Company's remaining interest in Turkey. We estimate that these measures will result in a decrease of general and administrative expenses of approximately 50% as compared to 2008; (ii) uses of cash — other than funding our mandatory capital expenditures, our primary use of discretionary cash will be used to reduce debt; (iii) a focused oil and natural gas portfolio — the Company will refocus its efforts to those areas that offer the best chance of success and have a proven infrastructure for the oil and natural gas industry. We believe that our current acreage positions in France and Hungary can serve as the platform for growth and offer the Company the best opportunity to create stockholder value; and (iv) performance management — the Board and management are committed to the best practices in corporate governance and will continually be reviewing and where necessary revising the procedures used to operate the Company. We intend to use third party expertise to review and challenge our procedures and methodologies, both operationally and administratively. Also performance management, actions followed by positive results, will become a driving principle in operating the Company.
On March 3, 2009, we closed the sale of a 26.75% interest in the South Akcakoca Sub-Basin project and associated licenses located in the Black Sea offshore Turkey, to Petrol Ofisi for US $55 million. In accordance with the revised assignment, $50 million of the proceeds was paid by Petrol Ofisi upon closing and the remaining $5 million is due on September 1, 2009.
43
Table of Contents
Simultaneous with the closing of the sale to Petrol Ofisi, we repaid the Secured Revolving Credit Facility with the International Finance Corporation. The total amount of the payment was $36.4 million, which was comprised of $30 million principal, $5.9 million additional compensation due under the $10 million facility and $500,000 for accrued interest and fees. After giving effect to the repayment, our debt to equity ratio would be 1.53 to 1.
The remaining cash totaling $13.6 million after repaying the International Finance Corporation and cash and cash equivalents on hand of $19.4 million, will be used to retire a portion of the Convertible Senior Notes and fund the 2009 capital program to meet minimum commitments associated with the Company's licenses.
After the retirement of the credit facility with the International Finance Corporation, the Company does not have a credit facility and will rely on its cash balance to meet its immediate cash requirements. Management will consider securing a new facility in 2009, but given today's economic environment there can be no assurance that a new facility can be obtained, and any draw down made if the facility is successfully secured would only be made to offset any further retirement of Convertible Senior Notes.
Our capital expenditure budget for 2009 is currently set at $7.2 million and assumes a sale of our remaining interest in Turkey to be closed by September 1, 2009. This amount represents our 10% share of Phase II development cost in the South Akcakoca Sub-Basin, our estimated share of the cost in the drilling of a Thrace Black Sea well after we are carried on the first $10.7 million of costs and the cost of installing a pipeline in Hungary in order to produce the reserves associated with the Szolnok Permit. If the sale does not close as anticipated we could incur an additional $800,000 in capital expenditures in 2009.
We believe we will have sufficient cash flow from operations to meet all of our 2009 obligations. However, if the cash flow from our operations is less than anticipated and if we have used up our cash we may also seek additional capital by (i) forward selling our crude oil and natural gas production; (ii) selling our interest in prospects and or licenses; (iii) selling our working interest in properties; or (iv) a combination of these actions in addition to issuing new debt or equity securities We believe such actions will allow us to meet our capital commitments and that as a result, we will have sufficient liquidity for the remainder of 2009.
On December 28, 2006, we entered into a loan and guarantee agreement with International Finance Corporation. The loan and guarantee agreement provided for a $25 million facility which was a secured revolving facility with a maximum facility amount of $25 million which maximum facility amount would have increased to $40 million when the projected total borrowing base amount exceeds $50 million. The $25 million facility funded on March 2, 2007. The total proceeds received on March 2, 2007 were approximately $25 million, of which $11 million was used to retire the outstanding balance on the $15 million credit facility and the remaining $14 million of funds was used to finance our capital expenditures in Turkey and Romania. The loan and guarantee agreement also provided for an unsecured $10 million facility which funded on December 28, 2006. Both the $25 million facility and the $10 million facility were to fund our operations in Turkey and Romania.
Interest accrued on any loans under the $25 million facility at a rate of 2% over the six month LIBOR rate. Interest accrued on the $10 million facility at a rate of 1.5% over the six month LIBOR rate until the $25 million facility funded on March 2, 2007 after which the rate for the $10 million facility was lowered to 0.5% over the six month LIBOR rate. As of December 31, 2008 the interest rate on the $10 million facility was 2.823% and 4.323% on the $25 million facility. Interest was to be paid on each June 15 and December 15.
On December 31, 2011, the maximum amount available under the $25 million facility was to decrease by $5 million every six months from $40 million (assuming the projected borrowing base amount exceeded $50 million) until the final portion of the $25 million facility is due on December 15, 2014. On
44
Table of Contents
December 15, 2014, $5 million of the $10 million facility was to be repaid with the remaining $5 million being due on June 15, 2015.
We were to meet the following ratios on a consolidated basis: (i) the life of loan coverage ratio of not less than: (a) 1.2:1.0 in 2006 and 2007; (b) 1.3:1.0 in 2008; and (c) 1.4:1.0 in 2009 and each subsequent year thereafter; (ii) reserve tail ratio of not less than 25%; (iii) adjusted financed debt to EBITDAX ratio of not more than 3.0:1.0; (iv) liabilities to tangible net worth ratio of not more than 60:40; and (v) interest coverage ratio of not less than 3.0:1.0. At December 31, 2008, we were not in compliance with the liabilities to tangible net worth ratio of not more than 60:40, however we did not request a waiver from the IFC as the facility was subsequently retired on March 3, 2009
We were subject to certain negative covenants, including, but not limited to, the following: (i) except as required by law or to pay the dividends on the Series A-1 Convertible Preferred Stock, which is no longer outstanding, paying dividends; (ii) subject to certain exceptions, incurring debt, making guarantees or creating or permitting to exist any liens, (iii) subject to certain exceptions, making or permitting to exist loans or advances to, or deposits, with other persons or investments in any person or enterprise; (iv) subject to certain exceptions, selling, transferring, leasing or otherwise disposing of all or a material part of its borrowing base assets; and (v) subject to certain exceptions, undertaking or permitting any merger, spin-off, consolidation or reorganization.
On March 3, 2009, we repaid and retired the facilities with the International Finance Corporation. The total amount of the payment was $36.4 million, which was comprised of $30 million principal, $5.9 million additional compensation due under the $10 million facility and $500,000 for accrued interest and fees.
On September 27, 2005, we sold $75 million of Convertible Senior Notes due October 1, 2025 to qualified institutional buyers pursuant to Rule 144A of the Securities Act of 1933. We also granted the initial purchasers the option to purchase an additional $11.25 million aggregate principal amount of Convertible Senior Notes to cover over-allotments. The option was exercised on September 30, 2005. The total principal amount of Convertible Senior Notes issued was $86.25 million and total net proceeds were approximately $82.2 million.
The Convertible Senior Notes bear interest at a rate of 5% per annum and can be converted into common stock at an initial conversion rate of 23.3596 shares of common stock per $1,000 principal amount of Convertible Senior Notes, subject to adjustment (equivalent to a conversion price of approximately $42.81 per share). We may redeem the Convertible Senior Notes, in whole or in part, on or after October 6, 2008, and prior to October 1, 2010, for cash at a redemption price equal to 100% of the principal amount of Convertible Senior Notes to be redeemed, plus any accrued and unpaid interest, if the closing price of its common stock exceeds 130% of the conversion price over a specified period. On or after October 1, 2010, we may redeem the Convertible Senior Notes, in whole or in part, at a redemption price equal to 100% of the principal amount of Convertible Senior Notes to be redeemed, plus any accrued and unpaid interest, irrespective of the price of its common stock. Holders may convert their Convertible Senior Notes at any time prior to the close of business on the business day immediately preceding their stated maturity, and holders may, upon the occurrence of certain fundamental changes, and on October 1, 2010, October 1, 2015, and October 1, 2020, require us to repurchase all or a portion of their Convertible Senior Notes for cash in an amount equal to 100% of the principal amount of such Convertible Senior Notes, plus any accrued and unpaid interest.
Due to our restating the consolidated financial statements for the years ended December 31, 2003, 2004 and 2005 and our consolidated financial statements for each of the quarters ended March 31 and June 30, 2006, we did not provide the trustee under the indenture of the Convertible Senior Notes with copies of our annual reports, information, documents and other reports that were required to file with the Securities and Exchange Commission pursuant to Section 13 or 15(d) of the Securities Exchange Act of
45
Table of Contents
1934 within thirty (30) days of when such reports were required to be filed with the Securities and Exchange Commission.
On December 15, 2006, we received a notice from the trustee for failing to provide the trustee with a copy of our Form 10-Q for the nine month period ended September 30, 2006. Since we cured the covenant default within thirty (30) days after receiving the written notice from the trustee, we cured the default and an event of default did not occur.
The registration rights agreement covering the Convertible Senior Notes provides for a penalty if the registration statement is filed and declared effective but thereafter ceases to be effective (a "Suspension Period") for an aggregate of forty-five (45) days in any three month period or ninety (90) days in any twelve month period (an "Event Date"). Such penalty calls for an additional 0.25% per annum in interest expense on the aggregate principal amount of the Convertible Senior Notes for the first ninety (90) days following an Event Date and an additional 0.50% per annum in interest expense on the aggregate principal amount of the Convertible Senior Notes thereafter, until such Suspension Period ends upon the registration statement again becoming effective or not being required to be effective pursuant to the registration rights agreement. Because we did not file our Quarterly Report on Form 10-Q for the nine month period ended September 30, 2006 in a timely manner, the registration statement for the Convertible Senior Notes became ineffective and we entered a Suspension Period on November 15, 2006. Such Suspension Period ended on January 23, 2007 when we provided notice that the Form 10-Q had been filed and the Suspension Period was no longer in effect. Because the Suspension Period exceeded forty-five (45) days in any three month period, we paid approximately $14,375 in additional interest expense. On March 16, 2007, the date we filed our Form 10-K for the year ended December 31, 2006, we again entered a Suspension Period until all the Convertible Senior Notes became eligible for sale pursuant to Rule 144(k) on September 30, 2007. On October 1, 2007, $155,000 was deposited with the trustee for the Convertible Senior Notes as the penalty for any holders of the Notes who were eligible on October 1, 2007 to receive a pro rate portion of such payment. Such eligible holders had to have registered their Notes on the registration statement and still held those Convertible Senior Notes on October 1, 2007. On April 1, 2008, we requested that the trustee return $150,957 which represents the unclaimed portion of the penalty and on April 3, 2008 we received the funds from the trustee. Through December 31, 2008, we released $4,043 of the penalty deposit to eligible holders of Convertible Senior Notes.
On July 9, 2008, our Board of Directors authorized a program to repurchase up to $10 million of the Convertible Senior Notes by December 31, 2008. We repurchased $6 million of the Convertible Senior Notes for $5.3 million plus accrued interest of $109,347. Additionally, we expensed $241,965 of prepaid loan fees that attributable to the repurchased notes. This resulted in a $458,535 gain on the early extinguishment of debt.
On February 22, 2005, 82,000 shares of Series A-1 Convertible Preferred Stock were exchanged for an aggregate of 512,000 shares of our common stock. As of December 31, 2006, there were 72,000 shares of Series A-1 Convertible Preferred Stock outstanding. At the option of the holder, the Series A-1 Convertible Preferred Stock could be converted into common shares at a price of $4.00 per common share. The Series A-1 Convertible Preferred Stock accrued dividends at an annual rate of $2.25 per share payable quarterly in cash. At any time on or after November 1, 2007, we had the right to redeem for cash any or all shares of Series A-1 Convertible Preferred Stock. In December 2007, the remaining 72,000 shares of Series A-1 Convertible Preferred Stock were converted into 450,000 shares of common stock.
Dividends on our common stock may be declared and paid out of funds legally available when and as determined by our board of directors. Our policy is to hold and invest corporate funds on a conservative basis, and, thus, we do not anticipate paying cash dividends on our common stock in the foreseeable future.
46
Table of Contents
Dividends on our Series A-1 Convertible Preferred Stock were paid quarterly. For the year ended December 31, 2007 dividends totaled $162,000. The remaining shares of Series A-1 Convertible Preferred Stock were converted into common stock in December 2007.
The terms of the loan and guarantee agreement with the International Finance Corporation limited the payment of dividends only to those that are required by law and to dividends associated with our Series A-1 Convertible Preferred Stock, which is no longer outstanding.
The following table sets forth our contractual obligations in thousands at December 31, 2008 for the periods shown:
| | | | | | | | | | | | | | | | |
| | Total | | Less than
One Year | | One to
Three Years | | Four to
Five Years | | More than
Five Years | |
|---|
Long-term debt | | $ | 110,275 | | $ | 30,000 | | $ | — | | $ | — | | $ | 80,275 | |
Lease commitments | | | 4,183 | | | 770 | | | 2,324 | | | 1,089 | | | — | |
| | | | | | | | | | | | |
Total contractual obligations | | $ | 114,458 | | $ | 30,770 | | $ | 2,324 | | $ | 1,089 | | $ | 80,275 | |
| | | | | | | | | | | | |
Contractual obligations for long-term debt above does not include amounts for interest payments.
On March 3, 2009 the Company retired the outstanding amount due under the Secured Revolving Facility with the International Finance Corporation. The total amount paid was $36.4 million which was comprised of $30 million in principal, $5.9 million in additional compensation and $500,000 in accrued interest and fees.
47
Table of Contents
Results of Operations
Comparison of Years Ended December 31, 2008 and 2007
| | | | | | | | | | | | | | | | | |
| | For the Years Ended December 31, | |
|---|
| | 2008 | | 2007 | |
| | 2008 | | 2007 | |
|---|
Production: | | | | | | | | Average Price: | | | | | | | |
Oil (MBbls): | | | | | | | | Oil ($/Bbl): | | | | | | | |
| | France | | | 365 | | | 383 | | France | | $ | 93.32 | | $ | 67.49 | |
| | Turkey | | | 56 | | | 66 | | Turkey | | | 93.21 | | | 61.98 | |
| | Romania | | | 3 | | | 10 | | Romania | | | 57.97 | | | 57.59 | |
| | | | | | | | | | | | | | |
| | | Total | | | 424 | | | 459 | | Total average oil price | | | 93.04 | | | 66.50 | |
| | | | | | | | | | | | | | |
Gas (MMcf): | | | | | | | | Gas ($/Mcf): | | | | | | | |
| | Turkey | | | 1,840 | | | 905 | | Turkey | | $ | 11.14 | | $ | 8.60 | |
| | Romania | | | 446 | | | 689 | | Romania | | | 5.32 | | | 4.90 | |
| | | | | | | | | | | | | | |
| | | Total | | | 2,286 | | | 1,594 | | Total average gas price | | | 10.00 | | | 7.00 | |
| | | | | | | | | | | | | | |
MBOE: | | | | | | | | $/ BOE: | | | | | | | |
| | France | | | 365 | | | 383 | | France | | $ | 93.32 | | $ | 67.49 | |
| | Turkey | | | 362 | | | 217 | | Turkey | | | 70.88 | | | 54.77 | |
| | Romania | | | 78 | | | 124 | | Romania | | | 32.99 | | | 31.55 | |
| | | | | | | | | | | | | | |
| | | Total | | | 805 | | | 724 | | Total average price per BOE | | | 77.41 | | | 57.51 | |
| | | | | | | | | | | | | | |
Revenues
Oil and natural gas sales for the twelve months ended December 31, 2008 were $62.4 million, as compared to $41.7 million for the comparable period in 2007. This increase is due to 1) the increase in the average realized price for oil, $12 million; 2) the increase in the average realized price for gas, $2.6 million and 3) increased Turkish gas volumes, $10.4 million. This was partially offset by a 1) reduction in total oil production of 35 MBbls or $3 million and 2) a reduction in Romanian gas production of 243 MMcf or $1.3 million.
Oil production decreased in France primarily due to the loss of production from a well that encountered mechanical and downhole problems during a workover operation that was eventually plugged and several wells that were shut-in in the fourth quarter waiting on rig availability to commence workover operations. The decline in Turkey oil production is normal decline and in Romania gas the field is depleting quicker than anticipated.
The above table compares both volumes and prices received for oil and natural gas for the twelve months ended December 31, 2008 and 2007. Oil and natural gas prices are and probably will continue to be extremely volatile and a significant change will have a material impact on our revenue.
Costs and expenses
Lease operating expense was $17.2 million, or $21.38 per BOE produced for the twelve months ended December 31, 2008, as compared to $12.6 million, or $17.46 per BOE produced for the comparable period
48
Table of Contents
in 2007. This increase is primarily due to increased operating costs in France due to the age of the fields and additional workover costs in 2008, increased operating costs in offshore Turkey due primarily to the field being on production for all of 2008, as opposed to nine months in 2007 and workover costs incurred on the East Ayazli wells which developed problems sustaining adequate pressure in order for the wells to continue producing, increased operating expense in Romania due to increased workover cost incurred to increase production and due to inflation in the oil and gas industry during 2008 as compared to 2007.
Exploration expense for the twelve months ended December 31, 2008 was $5.8 million, as compared to $14.7 million for the comparable period in 2007. The $5.8 million in 2008 is the cost associated with our exploration departments in France, Hungary, Turkey and Dallas, compared to $8.5 million in 2007. This decrease is due primarily to the reduction of staff in the exploration department in Dallas. In 2008, there were no seismic surveys performed, compared to a $6.2 million 2D seismic survey that was done in Romania during the third quarter of 2007.
Dry hole and abandonment cost for the twelve months ended December 31, 2008 was zero, as compared to $21.8 million in 2007. During 2008, we participated in the drilling of two exploratory wells in Hungary which were both dry holes. However, we incurred zero dry hole costs because our partners paid our share of the costs as per the farmout agreement. During 2007 we drilled two dry holes in France costing $3.8 million, three dry holes in Romania $10 million, two dry holes in Hungary costing $3.5 million and one dry hole in Turkey costing $4.5 million. Additionally, the Company made a strategic decision to no longer drill 100% exploratory wells or fund 100% seismic programs on exploratory acreage. We have begun a systematic process of farming out our exploratory prospects to industry partners. The terms of farm outs have been and will generally be structured so that the farmee will pay at least a majority of all seismic costs and drill an exploratory well to casing point in order to earn a 50%-75% working interest in the prospect or concession.
Depreciation, depletion and amortization.
For the twelve months ended December 31, 2008, depreciation, depletion and amortization expense was $33.1 million, or $41.17 per BOE produced, as compared to $21.3 million, or $29.36 per BOE produced for the twelve months ended December 31, 2007. This increase is primarily due to the start of natural gas production in offshore Turkey in May 2007, from two of the three platforms, and in May 2008 we began production from the third platform. The depreciation rate per BOE in Turkey is excessively high due to cost overruns in the development of the offshore gas field, in addition to the reduction in proved reserves at December 31, 2008.
Impairment charged in 2008 was $85.2 million compared to $13.4 million in 2007. The impairment was a result of the following:
(1) In 2008, the impairment charge in Turkey was a result of a decline in the fair market value of the Company's interest in South Akcakoca Sub-Basin assets. In June 2008, we determined the fair market value based on a Letter of Intent to sell a 26.75% interest in the South Akcakoca Sub-Basin assets to Petrol Ofisi AS for $80.3 million. This sale price indicated that the fair value of our 36.75% working interest was approximately $103.8 million. The net book value of the Black Sea asset at June 30, 2008 was $157.3 million, resulting in an impairment of $53.5 million.
(2) In January 2009, the Company and Petrol Ofisi agreed to a revised purchase price of $55 million. This resulted in an impairment on assets held for sale, which is comprised of the 26.75% interest in the South Akcakoca Sub-basin assets, of $25.6 million.
49
Table of Contents
(3) In December 2008, we incurred an additional $2.4 million impairment charge in Turkey for assets that were unrelated to the sale of South Akcakoca Sub-Basin assets. The impairment was a result of writing off an exploratory well where sufficient progress was not made to develop the area and a plan of development will not be prepared, by the operator, in the foreseeable future.
(4) We recorded an impairment charge of $2 million for the undeveloped leasehold costs in Trinidad, due to management's decision to exit Trinidad and discontinue our association with our registered agent in the country.
(5) When recording the acquisition of Madison Oil in 2002, we recorded $833,000 of goodwill associated with the Turkish assets. We periodically review the value of goodwill to determine if an impairment is required. The review at December 31, 2008, indicated that the total amount recorded for goodwill should be impaired. The reason for this impairment is due to the fair value of the Turkish subsidiary, based on the discounted present value of the oil and gas reserves being less than the carrying value of the Turkish subsidiary. This resulted in an impairment charge of $833,000.
(6) In December 2008, we recorded an impairment in Romania of $600,000 due to the net book value of the oil and natural gas properties exceeding future cash flows.
(7) In April 2007, we sold our interest in ePsolutions for $3.4 million in cash and 50,000 shares of preferred stock with a value of $10.00 per share. Due to the rising cost of electricity and the deterioration of the deregulated electric market in Texas, ePsolutions has reduced their forecasted growth for the next several years. Accordingly, we have reduced our carrying value of our investment in ePsolutions by $300,000 which we believe more accurately reflects the current market value of this investment.
For the year ended December 31, 2007, we recorded an impairment due to the downward revisions of proved reserves in the Fauresti Field in Romania. At December 31, 2007 the cash flow before income tax and the discounted future cash flows attributable to our proved oil and natural gas reserves before income tax, discounted at 10% attributable to the 134 MBOE, in Romania, was $1.2 million and $1.1 million, respectively, and the net book value of asset was $14.5 million. This resulted in an impairment charge of $13.4 million.
General and administrative expense was $15.5 million for the twelve months ended December 31, 2008, compared with $17.3 million for the comparable period of 2007. General and administrative expense is divided into the following categories:
General and administrative expense, not including stock compensation expense and amounts due the former employees upon their resignation, was $12.1 million for the twelve months ended December 31, 2008, compared with $12.2 million for the comparable period of 2007. This decrease is primarily due to the resignation of three employees in June 2008 and the strengthening U. S. Dollar in the last quarter of 2008.
Stock compensation expense was $2.3 million for the twelve months ended December 31, 2008, compared with $2.9 million for the comparable period of 2007. This decrease is primarily due to the forfeiture of most of the restricted stock granted to the executives that resigned in June 2008.
In June 2008, Mr. Michael FitzGerald resigned as Executive Vice President — Exploration and Production and Mr. Edward Ramirez resigned as Senior Vice President — Exploration and Production.
50
Table of Contents
The Separation and Release Agreements provide for one year of salary for each individual which resulted in an expense of $600,000, and for Mr. FitzGerald the immediate vesting of 5,000 shares of restricted stock grants and for Mr. Ramirez the immediate vesting of 7,000 shares of restricted stock grants which resulted in an expense of $35,000.
Also in June 2008, three other employees resigned which resulted in an additional $304,000 of expense.
In January 2007, Mr. G. Thomas Graves III resigned as President and Chief Executive Officer. The Separation Agreement between Mr. Graves and the Company called for the immediate vesting of all restricted stock grants which resulted in an expense of $1.1 million and two years of salary and one year of bonus of $1.1 million.
Loss on oil and gas derivative contracts of $1.8 million for 2008 represents the recognized loss on the commodity derivative contracts with Total Oil Trading. Presented in the table below is a summary of the contracts entered into with the gain (loss) in thousands:
| | | | | | | | | | | | | | | |
Type | | Period | | Barrels | | Floor | | Ceiling | | Gain/(Loss) | |
|---|
Collar | | January 1 — March 31, 2008 | | | 48,000 | | $ | 84.75 | | $ | 92.75 | | $ | (19 | ) |
Collar | | April 1 — June 30, 2008 | | | 48,000 | | $ | 92.25 | | $ | 100.25 | | | (2,239 | ) |
Collar | | July 1 — September 30, 2008 | | | 48,000 | | $ | 91.75 | | $ | 99.75 | | | 477 | |
| | | | | | | | | | | | | | | |
| | | | | | | | | | | | | $ | (1,781 | ) |
| | | | | | | | | | | | | | | |
For the year ended December 31, 2007, we recorded a loss of $1 million for the net realized and unrealized loss on derivative financial instruments which fluctuate based on changes in the fair value of underlying commodities. We entered into futures and swap contracts for approximately 15,000 Bbls per month for the months of June 2007 through December 2008 and subsequently sold all contracts as of December 31, 2007.
For the twelve months ended December 31, 2008, we recorded a loss on the sale of other assets of $123,000, as compared to a gain of $3.2 million for 2007, which was primarily attributable to the gain on the sale of our unconsolidated investments.
We recorded a loss on foreign currency exchange of $486,000 for the year ended December 31, 2008 as compared with a $26.3 million loss for the comparable period of 2007. This decrease in loss is primarily due to a change in accounting method regarding intercompany accounts receivable due from our subsidiaries in Turkey, Romania and Hungary. Pursuant to a Board of Directors' resolution, we expect to be repaid the intercompany accounts receivable from our subsidiaries in Turkey, Romania and Hungary in the foreseeable future. Due to this resolution subsequent to October 1, 2007, the foreign currency exchange change in the intercompany accounts receivable balance is reflected in current earnings, as a foreign exchange gain or loss rather than in accumulated other comprehensive income.
In 2008, we repurchased $6 million of the Convertible Senior Notes for $5.3 million plus accrued interest of $109,347. Additionally, we expensed $241,965 of prepaid loan fees that were attributable to the repurchased notes. This resulted in a $458,535 gain on the early extinguishment of debt.
51
Table of Contents
Interest and other income was $1.8 million for the year ended December 31, 2008 as compared with $1.8 million in the comparable period of 2007. Interest and other income remained consistent in 2008 from 2007.
Interest expense, net of interest capitalization
Interest expense was $7.8 million for the year ended December 31, 2008, as compared to $4.3 million for the comparable period of 2007. The increase is primarily due to $3.7 million of interest that was capitalized in 2007, as opposed to $1 million in 2008 and due to a full year of interest on the International Finance Corporation credit facility in 2008, as opposed to nine months of interest expense in 2007.
On June 14, 2007, the Board of Directors authorized management to sell all our oil and natural gas properties in the United States. The sale of these properties completed the divestiture of the company's non-core domestic assets and allowed us to focus exclusively on our international operations. The sale was closed on September 1, 2007. The sales price was $19.1 million which resulted in a pre-tax gain of $9.2 million. The table below compares discontinued operations for the years ended December 31, 2008 and 2007:
| | | | | | | | | |
| | Year Ended
December 31 | |
|---|
| | 2008 | | 2007 | |
|---|
| | (In thousands)
| |
|---|
Revenues: | | | | | | | |
| | Oil and natural gas sales | | $ | — | | $ | 4,489 | |
Costs and expenses: | | | | | | | |
| | Lease operating | | | 22 | | | 1,592 | |
| | Exploration expense | | | — | | | 105 | |
| | Impairment of oil and natural gas properties | | | — | | | — | |
| | Depreciation, depletion and amortization | | | — | | | 611 | |
| | Dry hole costs | | | — | | | 103 | |
| | Allocated general and administrative | | | — | | | 325 | |
| | Gain on sale of properties | | | — | | | (9,244 | ) |
| | | | | | |
| | | Total costs and expenses | | | (22 | ) | | (6,508 | ) |
| | Income (loss) before taxes | | | (22 | ) | | 10,977 | |
| | Income tax provision | | | — | | | (3,952 | ) |
| | | | | | |
| | Income from discontinued operations | | $ | (22 | ) | $ | 7,045 | |
| | | | | | |
For the year ended December 31, 2008 we reported income tax expense of $6 million, compared to a benefit of $5 million for the same period of 2007. The increase of $11 million is primarily due to the establishment of a $7 million valuation allowance and an increase in French taxes of $4 million in 2008.
For the year ended December 31, 2008, we reported a loss from continuing operations net of taxes of $108.6 million, compared with a loss of $81.5 million for the same period of 2007. For the twelve months
52
Table of Contents
ended December 31, 2008 we recorded a loss available to common shares of $108.6 million versus a loss available to common shares of $74.6 million for the year ended December 31, 2007.
The most significant element of comprehensive income, other than net income, is foreign currency translation. As of December 31, 2008, we had accumulated an unrealized loss of $5.3 million. For the year ended December 31, 2007, we had an unrealized gain of $38.4 million. The decrease is a result of a change in accounting method regarding our intercompany accounts receivable due from our subsidiaries in Turkey, Romania and Hungary. Pursuant to a Board of Directors resolution, we expect to be repaid the intercompany accounts receivable from our subsidiaries in Turkey, Romania and Hungary in the foreseeable future. Due to this resolution subsequent to October 1, 2007, the foreign exchange in the intercompany accounts receivable balance is reflected in current earnings, as a foreign exchange gain or loss, rather than in accumulated other comprehensive income.
The functional currency of our operations in France is the Euro and in Romania, Turkey and Hungary, the functional currency is the United States Dollar. The exchange rates used to translate the financial position of the French, Turkish, Romanian and Hungarian operations at December 31, 2008 and 2007 are shown below:
| | | | | | | |
| | December 31, | |
|---|
| | 2008 | | 2007 | |
|---|
Euro | | $ | 1.3917 | | $ | 1.4721 | |
| | | | | | |
New Turkish Lira | | $ | 0.6477 | | $ | 0.8574 | |
| | | | | | |
Romania Lei | | $ | 0.3460 | | $ | 0.4076 | |
| | | | | | |
Hungarian Forint | | $ | 0.0052 | | $ | 0.0058 | |
| | | | | | |
Comparison of Years Ended December 31, 2007 and 2006
| | | | | | | | | | | | | | | | | |
| | For the Years Ended December 31, | |
|---|
| | 2007 | | 2006 | |
| | 2007 | | 2006 | |
|---|
Production: | | | | | | | | Average Price: | | | | | | | |
Oil (MBbls): | | | | | | | | Oil ($/Bbl): | | | | | | | |
| | France | | | 383 | | | 442 | | France | | $ | 67.49 | | $ | 61.74 | |
| | Turkey | | | 66 | | | 68 | | Turkey | | | 61.98 | | | 56.10 | |
| | Romania | | | 10 | | | 8 | | Romania | | | 57.59 | | | 52.71 | |
| | | | | | | | | | | | | | |
| | | Total | | | 459 | | | 518 | | Total average oil price | | | 66.50 | | | 60.86 | |
| | | | | | | | | | | | | | |
Gas (MMcf): | | | | | | | | Gas ($/Mcf): | | | | | | | |
| | Turkey | | | 905 | | | — | | Turkey | | $ | 8.60 | | $ | — | |
| | Romania | | | 689 | | | 502 | | Romania | | | 4.90 | | | 3.57 | |
| | | | | | | | | | | | | | |
| | | Total | | | 1,594 | | | 502 | | Total average gas price | | | 7.00 | | | 3.57 | |
| | | | | | | | | | | | | | |
MBOE: | | | | | | | | $/ BOE: | | | | | | | |
| | France | | | 383 | | | 442 | | France | | $ | 67.49 | | $ | 61.74 | |
| | Turkey | | | 217 | | | 68 | | Turkey | | | 54.77 | | | 56.10 | |
| | Romania | | | 124 | | | 92 | | Turkey | | | 31.55 | | | 24.06 | |
| | | | | | | | | | | | | | |
| | | Total | | | 724 | | | 602 | | Total average price per BOE | | | 57.51 | | | 55.37 | |
| | | | | | | | | | | | | | |
53
Table of Contents
Revenues
Oil and natural gas sales for the year ended December 31, 2007 were $41.7 million, as compared to $33.3 million for the comparable period in 2006. This increase is due to 1) the increase in the average realized price for oil and natural gas, $3.6 million and 2) Turkish gas sales which were not in production in 2006, $7.8 million. This was partially offset by a reduction in total oil production of 59 MBbls or $3 million. Production increased by approximately 122 MBOE due primarily to the start of gas production in Turkey resulting in 151 MBOE and a full year of gas production in Romania resulting in an additional 33 MBOE. This was partially offset by a decline in French and Turkey oil production of 61 MBOE.
The above table compares both volumes and prices received for oil and natural gas for the years ended December 31, 2007 and 2006. Oil and natural gas prices are and probably will continue to be extremely volatile and a significant change will have a material impact on our revenue.
Costs and expenses
Lease operating expense was $12.6 million, or $17.46 per BOE produced for the year ended December 31, 2007, as compared to $8.7 million, or $14.52 per BOE produced for the year ended 2006. This increase is primarily due to increased operating costs in France due to the age of the fields, increased operating costs in offshore Turkey due primarily to the fact that fixed operating costs is for three tripods while only two were on production, increased operating expense in Romania due to increased workover cost incurred to increase production and the decline in value of the U.S. Dollar.
Exploration expense for the year ended December 31, 2007 was $14.7 million, as compared to $3.9 million for the comparable period in 2006. This change is primarily due to the 2D seismic survey that was done in Romania during the third quarter and increased interpretation of existing seismic in order to prepare prospects for farmout consideration.
Dry hole and abandonment cost for the year ended December 31, 2007 was $21.8 million, as compared to $1.7 million in 2006. During 2007 we drilled two dry holes in France costing $3.8 million, three dry holes in Romania costing $10 million, two dry holes in Hungary costing $3.5 million and one dry hole in Turkey costing $4.5 million. In the comparable period for 2006 we drilled one dry hole in Hungary for $1.7 million.
Depreciation, depletion and amortization.
For the year ended December 31, 2007, depreciation, depletion and amortization expense was $21.3 million, or $29.36 per BOE produced, as compared to $6.3 million, or $10.43 per BOE produced for the twelve months ended December 31, 2006. This increase is primarily due to offshore Turkey starting production in May 2007 resulting in an additional $9.4 million in depreciation, depletion and amortization, an increase in Romania of $4.6 million due to a full year of production and a decline in proved reserves and a $1 million increase in France due primarily to the decline in the value of the U. S. Dollar
Impairment charged in 2007 was $13.4 million compared to zero in 2006. This increase was due to the downward revisions of proved reserves in the Fauresti Field in Romania. At December 31, 2007 the cash flow before income tax and the discounted future cash flows attributable to our proved oil and natural gas
54
Table of Contents
reserves before income tax, discounted at 10% attributable to the 134 MBOE, in Romania, was $1.2 million and $1.1 million, respectively, and the net book value of asset was $14.5 million. This resulted in an impairment charge of $13.4 million.
General and administrative expense, not including stock compensation expense and amounts due the former President and CEO, was $12.2 million for the year ended December 31, 2007, compared with $6.8 million for the comparable period of 2006. This increase is primarily due to $2.6 million for restating the financial statements for the years ended December 31, 2003, 2004 and 2005 and the quarters ended March 31, 2006 and June 30, 2006, (accounting, legal and printing), the 2006 audit of approximately $1.1 million, increased professional fees for engineering and recruiters of $213,000, and increased travel costs $353,000.
Stock compensation expense was $2.9 million for the twelve months ended December 31, 2007, compared with $2.7 million for the comparable period of 2006. The increase is due to the restricted stock granted by the Board of Directors to certain employees, consultants and non-employee directors and the expensing of stock options as required by the adoption of SFAS 123 (R).
In January 2007, Mr. G. Thomas Graves III resigned as President and Chief Executive Officer. The Separation Agreement between Mr. Graves and the Company called for the immediate vesting of all restricted stock grants which resulted in an expense of $1.1 million and two years of salary and one year of bonus of $ 1.1 million.
Loss on oil and gas derivative contracts represents the net realized loss on derivative financial instruments and fluctuates based on changes in the fair value of underlying commodities. We entered into futures and swap contracts for approximately 15,000 Bbls per month for the months of June 2007 through December 2008 and subsequently sold all contracts as of September 30, 2007. This resulted in a net derivative fair value loss of $1 million for the twelve months ended December 31, 2007. We were not a party to any derivative contracts in the comparable period of 2006.
For the twelve months ended December 31, 2007, we recorded a gain on the sale of the properties and other assets of $3.2 million, which was primarily attributable to the gain on the sale of our unconsolidated investments. A gain of $436,000 was recorded in the comparable period of 2006.
We recorded a loss on foreign currency exchange of $26.3 million for the twelve months ended December 31, 2007 compared with $605,000 loss for the comparable period of 2006. This loss is primarily due to the weakening of the U. S. Dollar as compared to the New Turkish Lira, Romanian Lei and the Hungarian Forint. In these countries the U. S. Dollar is the functional currency and foreign exchange translation gains and losses are charged to earnings.
Interest and other income was $1.8 million for the period ended December 31, 2007 as compared with $2 million in the comparable period of 2006. For the twelve months ended December 31, 2006, our average
55
Table of Contents
cash balance was larger than our average cash balance for the twelve months ended December 31, 2007, which resulted in less interest income in the current period.
Interest expense, net of interest capitalization
Interest expense was $4.3 million for the twelve months ended December 31, 2007, as compared to $891,000 for the comparable period of 2006. The increase in interest expense is primarily due expensing the deferred loan fees on the Natixis facility and the Texas Capital Bank facility since these facilities were paid off in the first quarter of 2007 and the increased debt level for the twelve months ended December 31, 2007 as compared to the comparable period in 2006.
On June 14, 2007, the Board of Directors authorized management to sell all our oil and natural gas properties in the United States. The sale of these properties completed the divestiture of the company's non-core domestic assets and allows us to focus exclusively on our international operations. The sale was closed on September 1, 2007. The sales price was $19.1 million which resulted in a pre-tax gain of $9.2 million. The table below compares discontinued operations for year ended December 31, 2007 and 2006:
| | | | | | | | | |
| | Twelve Months
Ended
December 31. | |
|---|
| | 2007 | | 2006 | |
|---|
| | (In thousands)
| |
|---|
Revenues: | | | | | | | |
| | Oil and natural gas sales | | $ | 4,489 | | $ | 7,070 | |
Costs and expenses: | | | | | | | |
| | Lease operating | | | 1,592 | | | 2,200 | |
| | Exploration expense | | | 105 | | | | |
| | Impairment of oil and natural gas properties | | | — | | | 345 | |
| | Depreciation, depletion and amortization | | | 611 | | | 1,265 | |
| | Dry hole costs | | | 103 | | | 1,393 | |
| | Allocated general and administrative | | | 325 | | | 324 | |
| | Gain on sale of properties | | | (9,244 | ) | | (202 | ) |
| | | | | | |
| | | Total costs and expenses | | | (6,508 | ) | | 5,325 | |
| | Income before taxes | | | 10,997 | | | 1,745 | |
| | Income tax provision | | | (3,952 | ) | | (642 | ) |
| | | | | | |
| | Income from discontinued operations | | $ | 7,045 | | $ | 1,103 | |
| | | | | | |
For the year ended December 31, 2007 we reported an income tax benefit of $5 million, compared to a benefit of $3 million for the same period of 2006. The $2 million decrease primarily due to the tax effect of the 2007 Turkish loss.
56
Table of Contents
For the twelve months ended December 31, 2007, we reported a loss from continuing operations net of taxes of $81.5 million, compared with income of $1.5 million for the same period of 2006. For the twelve months ended December 31, 2007 we recorded a loss available to common shares of $74.6 million versus income available to common shares of $2.4 million for the year ended December 31, 2006.
The most significant element of comprehensive income, other than net income, is foreign currency translation. As of December 31, 2007, we had an unrealized gain of $38.4 million as compared to an unrealized gain of $6.7 million in 2006. The reason for the increase in the unrealized gain is due to the weakening of the United States dollar compared to the currencies in countries in which we operate. The functional currency of our operations in France is the Euro and in Romania, Turkey and Hungary the functional currency is the United States Dollar. The exchange rates used to translate the financial position of the French, Turkish, Romanian and Hungarian operations at December 31, 2007 and 2006 are shown below:
| | | | | | | |
| | December 31, | |
|---|
| | 2007 | | 2006 | |
|---|
Euro | | $ | 1.4721 | | $ | 1.3170 | |
| | | | | | |
New Turkish Lira | | $ | 0.8574 | | $ | 0.7065 | |
| | | | | | |
Romania Lei | | $ | 0.4076 | | $ | 0.3886 | |
| | | | | | |
Hungarian Forint | | $ | 0.0058 | | $ | 0.0052 | |
| | | | | | |
57
Table of Contents
Selected Quarterly Financial Data (Unaudited)
We derived the selected historical financial data in the table below from our unaudited interim consolidated financial statements. The sum of net income per share by quarter may not equal the net income per share for the year due to variations in the weighted average shares outstanding used in computing such amounts. The historical data presented here is only a summary and should be read in conjunction with the consolidated financial statements, related notes and other financial information included elsewhere in this annual report.
| | | | | | | | | | | | | | |
| | Three Months Ended | |
|---|
| | March 31, | | June 30, | | September 30, | | December 31, | |
|---|
| | (in thousands, except per share data)
| |
|---|
For the year ended December 31, 2008: | | | | | | | | | | | | | |
| | Total revenues | | $ | 13,981 | | $ | 19,864 | | $ | 17,695 | | $ | 10,834 | |
| | Total costs and expenses | | | 18,392 | | | 85,611 | | | 17,639 | | | 49,315 | |
| | Income (loss) from continuing operations, net of tax | | | (4,411 | ) | | (65,747 | ) | | 56 | | | (38,481 | ) |
| | Income (loss) from discontinued operations, net of tax | | | (15 | ) | | (21 | ) | | 14 | | | — | |
| | Net income (loss) | | | (4,426 | ) | | (65,768 | ) | | 70 | | | (38,481 | ) |
| | Income (loss) available to common shares | | | (4,426 | ) | | (65,768 | ) | | 70 | | | (38,481 | ) |
| | Basic income (loss) available to common shares per share | | | (0.22 | ) | | (3.33 | ) | | — | | | (1.93 | ) |
| | Diluted income (loss) available to common shares per share | | | (0.22 | ) | | (3.33 | ) | | — | | | (1.93 | ) |
For the year ended December 31, 2007 : | | | | | | | | | | | | | |
| | Total revenues | | $ | 6,821 | | $ | 9,962 | | $ | 12,400 | | $ | 12,508 | |
| | Total costs and expenses | | | 16,147 | | | 35,368 | | | 39,161 | | | 32,481 | |
| | Income (loss) from continuing operations, net of tax | | | (9,326 | ) | | (25,406 | ) | | (26,761 | ) | | (19,973 | ) |
| | Income (loss) from discontinued operations, net of tax | | | 551 | | | 359 | | | 6,021 | | | 114 | |
| | Net income (loss) | | | (8,775 | ) | | (25,047 | ) | | (20,740 | ) | | (19,859 | ) |
| | Income available to common shares | | | (8,816 | ) | | (25,087 | ) | | (20,780 | ) | | (19,900 | ) |
| | Basic income available to common shares per share | | | (0.55 | ) | | (1.32 | ) | | (1.09 | ) | | (1.05 | ) |
| | Diluted income available to common shares per share | | | (0.55 | ) | | (1.32 | ) | | (1.09 | ) | | (1.05 | ) |
In the fourth quarter of 2008 we incurred an impairment of approximately $29.4 million. Included in the impairment charge was an impairment on our assets held for sale of $25.6 million which was a result of a revision to the purchase price of $55 million. In Turkey, we incurred an additional $2.4 million impairment charge on assets unrelated to the sale. This is a result of an exploratory well that was charged to expense due to the operator not making sufficient progress to develop the well and not having a plan for development in the foreseeable future. We also recorded an impairment of $833,000 for goodwill associated with our Turkish oil and natural gas properties. In Romania we recorded an impairment of
58
Table of Contents
$600,000, which was a result of the net book value of the oil and natural gas properties exceeding the future cash flows.
We do not have any off-balance sheet arrangements that have or are reasonably likely to have a current or material future effect on our financial condition, changes in financial condition, revenues or expenses, results of operations, liquidity, capital expenditures or capital resources.
Item 7A. Quantitative and Qualitative Disclosures About Market Risk
The risks inherent in our market-sensitive instruments are the potential loss arising from adverse changes in oil and natural gas prices and foreign currency exchange rates as discussed below. The sensitivity analysis however, neither considers the effects that such adverse changes may have on overall economic activity nor does it consider additional actions we may take to mitigate our exposure to such changes. Actual results may differ.
The following quantitative and qualitative information is provided about financial instruments from which we may incur future earnings gains or losses from changes in commodity prices. We do not designate our derivatives as hedges; however, we do not enter into derivative or other financial instruments for trading purposes.
We market our oil and natural gas production primarily on a spot market basis. As a result, our earnings could be affected by changes in the prices for these commodities, regulatory matters or demand for the commodities. As market conditions dictate, from time to time we will lock in future oil and natural gas prices using various hedging techniques. We do not use such financial instruments for trading purposes, and we are not a party to any leveraged derivatives. Market risk is estimated as a 10% decrease in the prices of oil and natural gas. Based on our projections for 2009 sales volumes at fixed prices, such a decrease would result in a reduction to oil and natural gas sales revenue of approximately $2.2 million.
The functional currency of our French operations is the Euro. While our oil sales are calculated on a U.S. dollar basis, we are exposed to the risk that the values of our French assets will decrease and that the amounts of our French liabilities will increase. Market risk is estimated as a 10% decrease in the exchange rate for Euros to U.S. dollars. Based on the net assets in our French operations at December 31, 2008, such a decrease would result in an unrealized loss of approximately $6.8 million due to foreign currency exchange rates.
At times we utilize commodity derivative instruments as part of our risk management program. These transactions are generally structured as either swaps or collar contracts. A swap has the effect of an outright sale at a specific price. A collar has the effect of creating a sale only if a floor or ceiling price is exceeded. These instruments (i) reduce the effect of the price fluctuations of the commodities we produce and sell and (ii) support our annual capital budgeting and expenditure plans. When we had our senior credit facilities that required these instruments, these instruments protected the amounts required for servicing outstanding debt and maximized the funds available under these facilities. The trading party that represents the other side of each of these transactions is known as a "counterparty." Currently, we do not have any commodity derivative instruments for our production.
59
Table of Contents
See Note 2 of Notes to Consolidated Financial Statements for a description of our accounting policies followed relative to derivative financial instruments and for specific information regarding the terms of our derivative financial instruments that are sensitive to changes in crude oil and natural gas commodity prices.
Item 8. Financial Statements and Supplementary Data.
The Report of Independent Registered Public Accounting Firm and Consolidated Financial Statements are set forth beginning on page F-1 of this Annual Report on Form 10-K and are incorporated herein.
The financial statement schedules have been omitted because they are not applicable or the required information is shown in the Consolidated Financial Statements or the Notes to the Consolidated Financial Statements.
ITEM 9. Changes In And Disagreements With Accountants On Accounting And Financial Disclosure.
None.
Item 9A. Controls and Procedures
Corporate Disclosure Controls
Evaluation of Disclosure Controls and Procedures
We maintain disclosure controls and procedures (as defined in Rules 13a-15(e) and 15d-15(e) under the Securities Exchange Act of 1934, as amended) that are designed to provide reasonable assurance that the information required to be disclosed by us in reports filed under the Securities Exchange Act of 1934 is recorded, processed, summarized and reported within the time periods specified in the rules and forms of the Securities and Exchange Commission.
We carried out an evaluation, under the supervision and with the participation of our management, including our Chief Executive Officer and our Chief Financial Officer of the effectiveness of our disclosure controls and procedures as of the end of the period covered by this annual report. Based on that evaluation, our Chief Executive Officer and the Chief Financial Officer concluded that our disclosure controls and procedures as of December 31, 2008 were effective.
Our management is responsible for establishing and maintaining adequate internal control over financial reporting as that term is defined in Securities Exchange Act of 1934, as amended, Rules 13a-15(f) and 15d-15(f). Our internal control over financial reporting is a process designed to provide reasonable assurance regarding the reliability of our financial reporting and the preparation of our financial statements for external purposes in accordance with U.S. generally accepted accounting principles. Our control environment is the foundation for our system of internal control over financial reporting and is an integral part of our Code of Ethical Conduct and Business Practices, which sets the tone of our Company. Our internal control over financial reporting includes those policies and procedures that (i) pertain to the maintenance of records that, in reasonable detail, accurately and fairly reflect our transactions and dispositions of our assets; (ii) provide reasonable assurance that transactions are recorded as necessary to permit preparation of our financial statements in accordance with U.S. generally accepted accounting principles, and that our receipts and expenditures are being made only in accordance with authorizations of our management and directors; and (iii) provide reasonable assurance regarding prevention or timely detection of unauthorized acquisition, use or disposition of our assets that could have a material effect on our financial statements.
In order to evaluate the effectiveness of our internal control over financial reporting as of December 31, 2008, as required by Section 404 of the Sarbanes-Oxley Act of 2002, our management
60
Table of Contents
conducted an assessment, including testing, based on the criteria set forth inInternal Control — Integrated Framework issued by the Committee of Sponsoring Organizations of the Treadway Commission (the "COSO Framework"). Because of its inherent limitations, internal control over financial reporting may not prevent or detect misstatements. In addition, projections of any evaluation of effectiveness to future periods are subject to the risk that controls may become inadequate because of changes in conditions or that the degree of compliance with the policies or procedures may deteriorate.
Under the supervision and with the participation of our management, including our Chief Executive Officer and Chief Financial Officer, we conducted an evaluation of the effectiveness of our internal control over financial reporting in connection with preparation of the Annual Report on Form 10-K for the year ended December 31, 2008.
Based on our assessment, management has concluded that our internal control over financial reporting was effective as of December 31, 2008, in order to provide reasonable assurance regarding the reliability of financial reporting and the preparation of financial statements for external reporting purposes in accordance with generally accepted accounting principles.
Grant Thornton LLP, the independent registered public accounting firm that audited our consolidated financial statements included in this annual report on Form 10-K for the year ended December 31, 2008, has issued an attestation report on our internal control over financial reporting as of December 31, 2008, which is included in Item 8. "Financial Statements".
For the quarter ended December 31, 2008, we implemented the use of a computerized integrated financial reporting system which automated manual processes that were causing errors in spreadsheets and this change in internal control over financial reporting has materially affected or is reasonably likely to materially affect our internal control over financial reporting.
ITEM 9B. Other Information.
None.
61
Table of Contents
PART III
ITEM 10. Directors, Executive Officers of the Registrant and Corporate Governance.
Information required by this item relating to our (i) directors, nominees for directors and executive officers, (ii) audit committee, (iii) Code of Ethical Conduct and Business Practices, (iv) changes in procedures by which security holders may recommend nominees to our board of directors, and (v) compliance with Section 16(a) of the Securities Exchange Act will be set forth in our Proxy Statement relating to the 2009 Annual Meeting of Stockholders, that will be filed with the Securities and Exchange Commission on or prior to April 30, 2009, and that is incorporated herein by reference.
ITEM 11. Executive Compensation.
Information required by this item relating to executive compensation will be set forth in our Proxy Statement relating to the 2009 Annual Meeting of Stockholders, that will be filed with the Securities and Exchange Commission on or prior to April 30, 2009, and that is incorporated herein by reference.
ITEM 12. Security Ownership Of Certain Beneficial Owners And Management And Related Stockholder Matters.
Information required by this item relating to (i) security ownership of certain beneficial owners and management and (ii) securities authorized for issuance under equity compensation plans will be set forth in our Proxy Statement relating to the 2009 Annual Meeting of Stockholders, that will be filed with the Securities and Exchange Commission on or prior to April 30, 2009, and that is incorporated herein by reference.
ITEM 13. Certain Relationships and Related Transactions, and Director Independence.
Information required by this item relating to (i) certain business relationships and related transactions with management and (ii) other related parties and director independence will be set forth in our Proxy Statement relating to the 2009 Annual Meeting of Stockholders, that will be filed with the Securities and Exchange Commission on or prior to April 30, 2009, and that is incorporated herein by reference.
ITEM 14. Principal Accountant Fees And Services.
The information relating to (i) fees billed to the Company by the independent public accountants for services in 2008 and 2007 and (ii) audit committee's pre-approval policies and procedures for audit and non-audit services, will be set in our Proxy Statement relating to the 2009 Annual Meeting of Stockholders, that will be filed with the Securities and Exchange Commission on or prior to April 30, 2009, and that is incorporated herein by reference.
62
Table of Contents
PART IV
ITEM 15. Exhibits and Financial Statement Schedules.
(a) The following documents are filed as part of this report:
1. Index to Consolidated Financial Statements, Reports of Independent Registered Public Accounting Firm, Consolidated Balance Sheets as of December 31, 2008 and 2007, Consolidated Statements of Operations and Comprehensive Income (Loss) for the three years in the period ended December 31, 2008, Consolidated Statements of Changes in Stockholders' Equity for each of the three years in the period ended December 31, 2008, Consolidated Statements of Cash Flows for each of the three years in the period ended December 31, 2008, and Notes to Consolidated Financial Statements.
2. The financial statement schedules have been omitted because they are not applicable or the required information is shown in the Consolidated Financial Statements or the Notes to Consolidated Financial Statements.
3. Exhibits: The exhibits required to be filed by this Item 15 are set forth in the Index to Exhibits accompanying this report.
63
Table of Contents
SIGNATURES
Pursuant to the requirements of Section 13 or 15(d) of the Securities Exchange Act of 1934, the registrant has duly caused this Form 10-K to be signed on its behalf by the undersigned, thereunto duly authorized.
| | |
| | | TOREADOR RESOURCES CORPORATION |
|
|
/s/ Craig M. McKenzie
Craig M. McKenzie,
President and Chief Executive Officer |
March 16, 2009
KNOW ALL MEN BY THESE PRESENTS, that each of the undersigned officers and directors of Toreador Resources Corporation hereby constitutes and appoints Craig M. McKenzie and Charles J. Campise, or either of them (with full power to each of them to act alone), his true and lawful attorneys-in-fact and agents, with full power of substitution, for him and on his behalf and in his name, place and stead, in any and all capacities, to sign, execute and file any and all amendments (including post-effective amendments) to this Form 10-K, and to file the same, with all exhibits thereto, and other documents in connection therewith, with the Securities and Exchange Commission, granting unto said attorneys, and each of them, full power and authority to do so and perform each and every act and thing requisite and necessary to be done in and about the premises in order to effectuate the same as full to all intents and purposes as he himself might or could do if personally present, thereby ratifying and confirming all that said attorneys-in-fact and agents, or either of them, or their or his substitute or substitutes, may lawfully do or cause to be done.
Pursuant to the requirements of the Securities Exchange Act of 1934, this report has been signed below by the following persons on behalf of the registrant and in the capacities and on the dates as indicated therein.
| | | | |
Signature | | Capacity in Which Signed | | Date |
|---|
|
|
|
|
|
/s/ Craig M. McKenzie
Craig M. McKenzie | | President, Chief Executive Officer and Director | | March 16, 2009 |
/s/ Charles J. Campise
Charles J. Campise |
|
Sr. Vice President, Chief Financial Officer |
|
March 16, 2009 |
/s/ Peter Hill
Peter Hill |
|
Chairman & Director |
|
March 16, 2009 |
/s/ Julien Balkany
Julien Balkany |
|
Director |
|
March 16, 2009 |
/s/ Alan Bell
Alan Bell |
|
Director |
|
March 16, 2009 |
/s/ Peter L. Falb
Peter L. Falb |
|
Director |
|
March 16, 2009 |
/s/ Nicholas Rostow
Nicholas Rostow |
|
Director |
|
March 16, 2009 |
/s/ Herbert Williamson
Herbert Williamson |
|
Director |
|
March 16, 2009 |
64
Table of Contents
INDEX TO EXHIBITS
| | | |
Exhibit
Number | | Description |
|---|
| | 2.1 | | Agreement for Purchase and Sale, dated December 17, 2003, by and among Toreador Resources Corporation and Tormin, Inc., as Sellers, and Black Stone Acquisitions Partners I, L.P., as Buyer (previously filed as Exhibit 2.1 to Toreador Resources Corporation Current Report on Form 8-K filed on January 15, 2004, File No. 0-2517, and incorporated herein by reference). |
|
2.2 |
|
Quota Purchase Agreement between Pogo Overseas Production BV, as Seller, and Toreador Resources Corporation, as Purchaser, dated as of June 7, 2005 (previously filed as Exhibit 2.1 to Toreador Resources Corporation Current Report on Form 8-K filed with the Securities and Exchange Commission on June 13, 2005, File No. 0-2517, and incorporated herein by reference). |
|
2.3 |
|
Agreement for Purchase and Sale among Toreador Resources Corporation, Toreador Exploration & Production Inc. and Toreador Acquisition Corporation, as Sellers, and RTF Realty Inc., as Buyer dated August 2, 2007. (Certain of the exhibits and schedules have been omitted. An exhibit to the exhibit and schedules is contained in the Agreement for Purchase and Sale and the omitted exhibits and schedules are available to the Securities and Exchange Commission upon request) (previously filed as Exhibit 10.1 to Toreador Resources Corporation Current Report on Form 8-K filed on August 6, 2007, File No. 0-2517, and incorporated herein by reference). |
|
2.4 |
|
Letter of Intent by and between Toreador Turkey Limited and Toreador Turkey Limited, Ankara Turkey Branch, and PETROL OFISI AS, dated August 8, 2008 (The attachments to the Letter of Intent have been omitted. A list of attachments is contained in the Letter of Intent and the attachments are available to the Securities and Exchange Commission upon request) (previously filed as Exhibit 2.1 to Toreador Resources Corporation Current Report on Form 8-K filed on August 13, 2008, File No. 0-2517, and incorporated herein by reference). |
|
2.5 |
|
Assignment Agreement between PETROL OFISI AS, PETROL OFISI ARAMA URETIM SANAYI ve TICARET ANONIM SIRKETI and Toreador Turkey Limited, Toreador Turkey Limited, Ankara Turkey Branch and Toreador Resources Corporation, dated September 17, 2008 (The attachments to the Assignment Agreement have been omitted. A list of attachments is contained in the Assignment Agreement and the attachments are available to the Securities and Exchange Commission upon request) (previously filed as Exhibit 2.2 to Toreador Resources Corporation Quarterly Report on Form 10-Q for the quarter ended September 30, 2008, File No. 0-2517, and incorporated herein by reference). |
|
2.6 |
|
Amendment Protocol dated January 30, 2009 relating to the Assignment Agreement between PETROL OFISI AS, PETROL OFISI ARAMA URETIM SANAYI ve TICARET ANONIM SIRKETI and Toreador Turkey Limited, Toreador Turkey Limited, Ankara Turkey Branch and Toreador Resources Corporation, dated September 17, 2008 (previously filed as Exhibit 2.1 to Toreador Resources Corporation Current Report on Form 8-K filed on February 4, 2009, File No. 0-2517, and incorporated herein by reference). |
|
3.1 |
|
Restated Certificate of Incorporation, of Toreador Resources Corporation (previously filed as Exhibit 3.1 to Toreador Resources Corporation Current Report on Form 8-K filed with the Securities and Exchange Commission on March 29, 2005, File No. 0-2517, and incorporated herein by reference). |
65
Table of Contents
| | | |
Exhibit
Number | | Description |
|---|
| | 3.2 | | Fourth Amended and Restated Bylaws of Toreador Resources Corporation (previously filed as Exhibit 3.1 to Toreador Resources Corporation Current Report on Form 8-K filed with the Securities and Exchange Commission on November 13, 2007, File No. 0-2517, and incorporated herein by reference). |
|
3.3 |
|
Certificate of Designation, Preferences and Rights of Series B Preferred Stock (previously filed as Exhibit 3.1 to Toreador Resources Corporation Current Report on Form 8-K filed with the Securities and Exchange Commission on November 24, 2008, File No. 0-2517, and incorporated herein by reference). |
|
4.1 |
|
Settlement Agreement, dated June 25, 1998, among the Gralee Persons, the Dane Falb Persons and Toreador Royalty Corporation (previously filed as Exhibit 4.1 to Toreador Resources Corporation Annual Report on Form 10-K for the year ended December 31, 2004, File No. 0-2517, and incorporated herein by reference). |
|
4.2 |
|
Warrant, dated July 22, 2004, issued by Toreador Resources Corporation to Nigel Lovett (previously filed as Exhibit 4.14 to Toreador Resources Corporation Registration Statement on Form S-3 filed with the Securities and Exchange Commission on August 20, 2004, File No. 0-2517, and incorporated herein by reference). |
|
4.3 |
|
Warrant No. 39, issued by Toreador Resources Corporation to Rich Brand amending and replacing Warrant No. 30 (previously filed as Exhibit 4.1 to Toreador Resources Corporation Quarterly Report on Form 10-Q for the quarter ended March 31, 2008, File No. 0-2517, and incorporated herein by reference). |
|
4.4 |
|
Warrant No. 40, issued by Toreador Resources Corporation to Dianne Brand (previously filed as Exhibit 4.2 to Toreador Resources Corporation Quarterly Report on Form 10-Q for the quarter ended March 31, 2008, File No. 0-2517, and incorporated herein by reference). |
|
4.5 |
|
Registration Rights Agreement dated September 27, 2005 by and between Toreador Resources Corporation and UBS Securities LLC and the other initial purchasers named in the purchase agreement (previously filed as Exhibit 4.18 to the Registration Statement on Form S-3 (333-129628) filed with the Securities and Exchange Commission on November 10, 2005, File No. 0-2517, and incorporated herein by reference). |
|
4.6 |
|
Indenture dated as of September 27, 2005 by and between Toreador Resources Corporation and The Bank of New York Trust Company, N.A. (previously filed as Exhibit 4.19 to the Registration Statement on Form S-3 (333-129628) filed with the Securities and Exchange Commission on November 10, 2005, File No. 0-2517, and incorporated herein by reference). |
|
4.7 |
|
Registration Rights Agreement dated March 21, 2007 by and among Toreador Resources Corporation and the Buyers listed therein (previously filed as Exhibit 4.1 to Toreador Resources Corporation Current Report on Form 8-K filed on March 22, 2007, File No. 0-2571, and incorporated herein by reference). |
|
4.8 |
|
Warrant to Purchase Common Stock of Toreador Resources Corporation dated July 11, 2005, by and between Toreador Resources Corporation and Natexis Banques Popularis (previously filed as Exhibit 10.1 to Toreador Resources Corporation Current Report on Form 8-K filed with the Securities and Exchange Commission on July 13, 2005, File No. 0-2517, and incorporated herein by reference). |
66
Table of Contents
| | | |
Exhibit
Number | | Description |
|---|
| | 4.9 | | First Amendment to Registration Rights Agreement dated as of February 15, 2008 by and among Toreador Resources Corporation, Capital Ventures International and Goldman, Sachs & Co. (previously filed as Exhibit 4.11 to Toreador Resources Corporation Annual Report on Form 10-K for the year ended December 31, 2007, File No. 0-2517, and incorporated herein by reference). |
|
4.10 |
|
Rights Agreement dated as of November 20, 2008 between Toreador Resources Corporation and American Stock Transfer, as Rights Agent (previously filed as Exhibit 4.1 to Toreador Resources Corporation Form 8-A filed on November 24, 2008, File No. 0-2517, and incorporated herein by reference). |
|
5.1* |
|
Legal Opinion of Kaya & Aksoy. |
|
5.2* |
|
Legal Opinion of PRK Partners/Bellak Law offices |
|
10.1+ |
|
Toreador Royalty Corporation 1990 Stock Option Plan (previously filed as Exhibit 10.2 to Toreador Resources Corporation Annual Report on Form 10-K for the year ended December 31, 2004, File No. 0-2517, and incorporated herein by reference). |
|
10.2+ |
|
Amendment to Toreador Royalty Corporation 1990 Stock Option Plan, effective as of May 15, 1997 (previously filed as Exhibit 10.3 to Toreador Resources Corporation Annual Report on Form 10-K for the year ended December 31, 2004, File No. 0-2517, and incorporated herein by reference). |
|
10.3+ |
|
Toreador Royalty Corporation Amended and Restated 1990 Stock Option Plan, effective as of September 24, 1998 (previously filed as Exhibit 10.4 to Toreador Resources Corporation Annual Report on Form 10-K for the year ended December 31, 2004, File No. 0-2517, and incorporated herein by reference). |
|
10.4+ |
|
Amendment Number One to Toreador Resources Corporation Amended and Restated 1990 Stock Option Plan (previously filed as Exhibit 10.4 to Toreador Resources Corporation Annual Report on Form 10-K for the year ended December 31, 2007, File No. 0-2517, and incorporated herein by reference). |
|
10.5+ |
|
Amendment Number Two to Toreador Resources Corporation Amended and Restated 1990 Stock Option Plan (previously filed as Exhibit 10.5 to Toreador Resources Corporation Annual Report on Form 10-K for the year ended December 31, 2007, File No. 0-2517, and incorporated herein by reference). |
|
10.6+ |
|
Toreador Royalty Corporation 1994 Non-Employee Director Stock Option Plan, as amended (previously filed as Exhibit 10.7 to Toreador Resources Corporation Annual Report on Form 10-K for the year ended December 31, 2004, File No. 0-2517, and incorporated herein by reference). |
|
10.7+ |
|
Toreador Resources Corporation Amended and Restated 1994 Non-employee Director Stock Option Plan (previously filed as Exhibit 10.7 to Toreador Resources Corporation Annual Report on Form 10-K for the year ended December 31, 2007, File No. 0-2517, and incorporated herein by reference). |
|
10.8+ |
|
Toreador Resources Corporation 2002 Stock Option Plan (previously filed as Exhibit 10.8 to Toreador Resources Corporation Annual Report on Form 10-K for the year ended December 31, 2007, File No. 0-2517, and incorporated herein by reference). |
67
Table of Contents
| | | |
Exhibit
Number | | Description |
|---|
| | 10.9+ | | Amendment Number One to the Toreador Resources Corporation 2002 Stock Option Plan (previously filed as Exhibit 10.9 to Toreador Resources Corporation Annual Report on Form 10-K for the year ended December 31, 2007, File No. 0-2517, and incorporated herein by reference). |
|
10.10+ |
|
Toreador Resources Corporation 2005 Long-Term Incentive Plan (previously filed as Exhibit 10.1 to Toreador Resources Corporation Current Report on Form 8-K filed with the Securities and Exchange Commission on May 23, 2005, File No. 0-2517, and incorporated herein by reference). |
|
10.11+ |
|
Amendment to Toreador Resources Corporation 2005 Long-Term Incentive Plan (previously filed as Exhibit 10.1 to Toreador Resources Corporation Current Report on Form 8-K filed with the Securities and Exchange Commission on May 12, 2006, File No. 0-2517, and incorporated herein by reference). |
|
10.12+ |
|
Form of Employee Restricted Stock Award (previously filed as Exhibit 10.2 to Toreador Resources Corporation Current Report on Form 8-K filed with the Securities and Exchange Commission on May 23, 2005, File No. 0-2517, and incorporated herein by reference). |
|
10.13+ |
|
Form of 2005 Outside Director Restricted Stock Award (previously filed as Exhibit 10.3 to Toreador Resources Corporation Current Report on Form 8-K filed with the Securities and Exchange Commission on May 23, 2005, File No. 0-2517, and incorporated herein by reference). |
|
10.14+ |
|
Form of 2006 Outside Director Restricted Stock Award (previously filed as Exhibit 10.3 to Toreador Resources Corporation Current Report on Form 8-K filed with the Securities and Exchange Commission on May 12, 2006, File No. 0-2517, and incorporated herein by reference). |
|
10.15+ |
|
Summary Sheet: 2007 Director Compensation (previously filed as Exhibit 10.21 to Toreador Resources Corporation Annual Report on Form 10-K for the year ended December 31, 2006, File No. 0-2517, and incorporated herein by reference). |
|
10.16+ |
|
Herbert C. Williamson III Restricted Stock Award Agreement dated November 8, 2006 (previously filed as Exhibit 10.25 to Toreador Resources Corporation Annual Report on Form 10-K for the year ended December 31, 2006, File No. 0-2517 and incorporated herein by reference). |
|
10.17+ |
|
Nicholas Rostow Restricted Stock Award Agreement dated November 8, 2006 (previously filed as Exhibit 10.27 to Toreador Resources Corporation Annual Report on Form 10-K for the year ended December 31, 2006, File No. 0-2517 and incorporated herein by reference). |
|
10.18+ |
|
Employment Agreement of Nigel Lovett dated March 14, 2007 (previously filed as Exhibit 10.33 to Toreador Resources Corporation Registration Statement on Form S-1 filed with the Securities and Exchange Commission on May 8, 2007, No. 333-142731, and incorporated herein by reference). |
|
10.19+ |
|
Employment Agreement of Michael FitzGerald dated March 14, 2007 (previously filed as Exhibit 10.34 to Toreador Resources Corporation Registration Statement on Form S-1/A filed with the Securities and Exchange Commission on July 23, 2007, No. 333-142731, and incorporated herein by reference). |
|
10.20+ |
|
Employment Agreement of Douglas Weir dated March 14, 2007 (previously filed as Exhibit 10.35 to Toreador Resources Corporation Registration Statement on Form S-1/A filed with the Securities and Exchange Commission on July 23, 2007, No. 333-142731, and incorporated herein by reference). |
68
Table of Contents
| | | |
Exhibit
Number | | Description |
|---|
| | 10.21+ | | Employment Agreement of Edward Ramirez dated March 14, 2007 (previously filed as Exhibit 10.36 to Toreador Resources Corporation Registration Statement on Form S-1 filed with the Securities and Exchange Commission on May 8, 2007, No. 333-142731, and incorporated herein by reference). |
|
10.22+ |
|
Employment Agreement of Charles Campise dated March 14, 2007 (previously filed as Exhibit 10.37 to Toreador Resources Corporation Registration Statement on Form S-1 filed with the Securities and Exchange Commission on May 8, 2007, No. 333-142731, and incorporated herein by reference). |
|
10.23 |
|
Securities Purchase Agreement dated March 21, 2007 by and among Toreador Resources Corporation and the Buyers listed therein (previously filed as Exhibit 10.1 to Toreador Resources Corporation Current Report on Form 8-K filed on March 22, 2007, File No. 0-2157, and incorporated herein by reference). |
|
10.24+ |
|
Form of Amendment to Form of 2005 Outside Director Restricted Stock Award (previously filed as Exhibit 10.41 to Toreador Resources Corporation Registration Statement on Form S-1 filed with the Securities and Exchange Commission on May 8, 2007, No. 333-142731, and incorporated herein by reference). |
|
10.25+ |
|
Increase in Salaries of Michael FitzGerald and Edward Ramirez effective May 1, 2007 (previously filed as Exhibit 10.42 to Toreador Resources Corporation Registration Statement on Form S-1 filed with the Securities and Exchange Commission on May 8, 2007, No. 333-142731, and incorporated herein by reference). |
|
10.26+ |
|
Form of Indemnification Agreement, dated as of April 25, 1995, between Toreador Royalty Corporation and certain of the members of our Board of Directors (previously filed as Exhibit 10.11 to Toreador Resources Corporation Annual Report on Form 10-K for the year ended December 31, 2004, File No. 0-2517, and incorporated herein by reference). |
|
10.27 |
|
Contract for the Supply of Crude Oil from the Parisian Basin, effective January 1, 1997, between Elf Antwar France and Midland Madison Petroleum Company (n/k/a Madison Energy France) (previously filed as Exhibit 10.43 to Toreador Resources Corporation Annual Report on Form 10-K for the year ended December 31, 2007, File No. 0-2517, and incorporated herein by reference). |
|
10.28 |
|
Purchase Agreement dated November 22, 2005 by and among Toreador Resources Corporation, UBS Securities LLC and the other initial Purchasers named in Exhibit A attached thereto (previously filed as Exhibit 10.2 to the Registration Statement on Form S-3 (333-129628) filed with the Securities and Exchange Commission on November 10, 2005, File No. 0-2517, and incorporated herein by reference). |
|
10.29+ |
|
Summary Sheet — 2007 Charles J. Campise Annual Base Salary (previously filed as Exhibit 10.1 to Toreador Resources Corporation Current Report on Form 8-K filed with the Securities and Exchange Commission on June 18, 2007, File No. 0-2517, and incorporated herein by reference). |
|
10.30+ |
|
Form of 2007 Outside Director Restricted Stock Award Agreement (previously filed as Exhibit 10.56 to Toreador Resources Corporation Registration Statement on Form S-1/A filed with the Securities and Exchange Commission on July 23, 2007, No. 333-142731, and incorporated herein by reference). |
69
Table of Contents
| | | |
Exhibit
Number | | Description |
|---|
| | 10.31 | | Amendment No. 1 dated August 9, 2007 to Loan and Guarantee Agreement dated December 28, 2006 between Toreador Resources Corporation, Toreador Turkey Ltd., Toreador Romania Ltd., Madison Oil France SAS, Toreador Energy France S.C.S., Toreador International Holding Limited Liability Company and Toreador International Finance Corporation (previously filed as Exhibit 10.1 to Toreador Resources Corporation Quarterly Report on Form 10-Q for the quarter ended September 30, 2007, File No. 0-2517, and incorporated hereby by reference). |
|
10.32+ |
|
Form of Amendment to Restricted Stock Award Agreement for Employees (November 2007) (previously filed as Exhibit 10.1 to Toreador Resources Corporation Current Report on Form 8-K filed on January 25, 2008, File No. 0-2517, and incorporated herein by reference). |
|
10.33+ |
|
Form of Restricted Stock Award Agreement for Employees (November 2007) (previously filed as Exhibit 10.2 to Toreador Resources Corporation Current Report on Form 8-K filed on January 25, 2008, File No. 0-2517, and incorporated herein by reference). |
|
10.34+ |
|
Summary Sheet — 2008 Charles J. Campise Annual Base Salary (previously filed as Exhibit 10.53 to Toreador Resources Corporation Annual Report on Form 10-K for the year ended December 31, 2007, File No. 0-2517, and incorporated herein by reference). |
|
10.35+ |
|
Form of Amendment to Restricted Stock Agreement for Outside Directors (January 2008) (previously filed as Exhibit 10.54 to Toreador Resources Corporation Annual Report on Form 10-K for the year ended December 31, 2007, File No. 0-2517, and incorporated herein by reference). |
|
10.36+ |
|
Amendment No. 2 to the Toreador Resources Corporation 2005 Long-Term Incentive Plan (previously filed as Exhibit 10.3 to Toreador Resources Corporation Quarterly Report on Form 10-Q for the quarter ended March 31, 2008, File No. 0-2517, and incorporated herein by reference). |
|
10.37 |
|
Waiver Letter dated March 3, 2008 by International Finance Corporation in favor of Toreador Resources Corporation, Toreador Turkey Ltd., Toreador Romania Ltd., Madison Oil France SAS, Toreador Energy France S.C.S., and Toreador International Holding Limited Liability Company (previously filed as Exhibit 10.4 to Toreador Resources Corporation Quarterly Report on Form 10-Q for the quarter ended March 31, 2008, File No. 0-2517, and incorporated herein by reference). |
|
10.38+ |
|
Release Agreement by and between David M. Brewer and Toreador Resources Corporation dated March 24, 2008(previously filed as Exhibit 10.5 to Toreador Resources Corporation Quarterly Report on Form 10-Q for the quarter ended March 31, 2008, File No. 0-2517, and incorporated herein by reference). (previously filed as Exhibit 10.5 to Toreador Resources Corporation Quarterly Report on Form 10-Q for the quarter ended March 31, 2008, File No. 0-2517, and incorporated herein by reference). |
|
10.39+ |
|
Employment Agreement of Nigel Lovett dated March 12, 2008 (previously filed as Exhibit 10.6 to Toreador Resources Corporation Quarterly Report on Form 10-Q for the quarter ended March 31, 2008, File No. 0-2517, and incorporated herein by reference). |
|
10.40+ |
|
Employment Agreement of Michael J. FitzGerald dated March 12, 2008 (previously filed as Exhibit 10.7 to Toreador Resources Corporation Quarterly Report on Form 10-Q for the quarter ended March 31, 2008, File No. 0-2517, and incorporated herein by reference). |
|
10.41+ |
|
Employment Agreement of Edward Ramirez dated March 12, 2008 (previously filed as Exhibit 10.8 to Toreador Resources Corporation Quarterly Report on Form 10-Q for the quarter ended March 31, 2008, File No. 0-2517, and incorporated herein by reference). |
70
Table of Contents
| | | |
Exhibit
Number | | Description |
|---|
| | 10.42+ | | Employment Agreement of Charles Campise dated March 12, 2008 (previously filed as Exhibit 10.9 to Toreador Resources Corporation Quarterly Report on Form 10-Q for the quarter ended March 31, 2008, File No. 0-2517, and incorporated herein by reference). |
|
10.43+ |
|
2008 Discretionary Employee Bonus Policy (previously filed as Exhibit 10.10 to Toreador Resources Corporation Quarterly Report on Form 10-Q for the quarter ended March 31, 2008, File No. 0-2517, and incorporated herein by reference). |
|
10.44+ |
|
2008 Performance Goals and Payout Amounts (previously filed as Exhibit 10.11 to Toreador Resources Corporation Quarterly Report on Form 10-Q for the quarter ended March 31, 2008, File No. 0-2517, and incorporated herein by reference). |
|
10.45+ |
|
Summary Sheet — 2008 Director Compensation (previously filed as Exhibit 10.12 to Toreador Resources Corporation Quarterly Report on Form 10-Q for the quarter ended March 31, 2008, File No. 0-2517, and incorporated herein by reference). |
|
10.46 |
|
Waiver Letter dated May 3, 2008 by International Finance Corporation in favor of Toreador Resources Corporation, Toreador Turkey Ltd., Toreador Romania Ltd., Madison Oil France, SAS, Toreador Energy France S.C.S., and Toreador International Holding Limited Liability Company (previously filed as Exhibit 10.13 to Toreador Resources Corporation Quarterly Report on Form 10-Q for the quarter ended March 31, 2008, File No. 0-2517, and incorporated herein by reference). |
|
10.47+ |
|
Form of Outside Director Stock Award Agreement (2008) (previously filed as Exhibit 10.2 to Toreador Resources Corporation Quarterly Report on Form 10-Q for the quarter ended June 30, 2008, File No. 0-2517, and incorporated herein by reference). |
|
10.48+ |
|
Nigel Lovett Nonqualified Stock Option Agreement dated May 15, 2008(previously filed as Exhibit 10.3 to Toreador Resources Corporation Quarterly Report on Form 10-Q for the quarter ended June 30, 2008, File No. 0-2517, and incorporated herein by reference). |
|
10.49+ |
|
Nigel Lovett Incentive Stock Option Agreement dated May 15, 2008 (previously filed as Exhibit 10.4 to Toreador Resources Corporation Quarterly Report on Form 10-Q for the quarter ended June 30, 2008, File No. 0-2517, and incorporated herein by reference). |
|
10.50+ |
|
Nigel Lovett Restricted Stock Agreement dated May 15, 2008 (previously filed as Exhibit 10.5 to Toreador Resources Corporation Quarterly Report on Form 10-Q for the quarter ended June 30, 2008, File No. 0-2517, and incorporated herein by reference). |
|
10.51+ |
|
Amendment No. 3 to Toreador Resources Corporation 2005 Long-Term Incentive Plan (previously filed as Exhibit 10.6 to Toreador Resources Corporation Quarterly Report on Form 10-Q for the quarter ended June 30, 2008, File No. 0-2517, and incorporated herein by reference). |
|
10.52+ |
|
Separation Agreement and Release dated June 27, 2008 by and between Toreador Resources Corporation and Michael J. FitzGerald (previously filed as Exhibit 10.7 to Toreador Resources Corporation Quarterly Report on Form 10-Q for the quarter ended June 30, 2008, File No. 0-2517, and incorporated herein by reference). |
|
10.53+ |
|
Separation Agreement and Release dated June 27, 2008 by and between Toreador Resources Corporation and Edward Ramirez (previously filed as Exhibit 10.8 to Toreador Resources Corporation Quarterly Report on Form 10-Q for the quarter ended June 30, 2008, File No. 0-2517, and incorporated herein by reference). |
71
Table of Contents
| | | |
Exhibit
Number | | Description |
|---|
| | 10.54+ | | First Amendment dated July 3, 2008 to the Separation Agreement and Release between Edward Ramirez and Toreador Resources Corporation dated June 27, 2008 (previously filed as Exhibit 10.9 to Toreador Resources Corporation Quarterly Report on Form 10-Q for the quarter ended June 30, 2008, File No. 0-2517, and incorporated herein by reference). |
|
10.55 |
|
Parent Corporate Guaranty by PETROL OFISI AS in favor of Toreador Turkey Limited and Toreador Turkey Limited, Ankara Turkey Branch , dated September 17, 2008 (previously filed as Exhibit 10.1 to Toreador Resources Corporation Quarterly Report on Form 10-Q for the quarter ended September 30, 2008, File No. 0-2517, and incorporated herein by reference). |
|
10.56+ |
|
Form of Amendment to Employee Restricted Stock Agreement (August 2008) (previously filed as Exhibit 10.2 to Toreador Resources Corporation Quarterly Report on Form 10-Q for the quarter ended September 30, 2008, File No. 0-2517, and incorporated herein by reference). |
|
10.57+ |
|
Form of Employee Restricted Stock Agreement (August 2008) (previously filed as Exhibit 10.3 to Toreador Resources Corporation Quarterly Report on Form 10-Q for the quarter ended September 30, 2008, File No. 0-2517, and incorporated herein by reference). |
|
10.58+ |
|
Summary Sheet regarding changes in Director Compensation (July 2008) (previously filed as Exhibit 10.4 to Toreador Resources Corporation Quarterly Report on Form 10-Q for the quarter ended September 30, 2008, File No. 0-2517, and incorporated herein by reference). |
|
10.59+ |
|
Settlement Agreement, dated January 22, 2009, among Toreador Resources Corporation, Nanes Balkany Partners I LP, John M. McLaughlin, Nigel J. Lovett, Craig M. McKenzie, Julien Balkany, and Peter Hill (previously filed as Exhibit 10.1 to Toreador Resources Corporation Current Report on Form 8-K filed on January 27, 2009, File No. 0-2517, and incorporated herein by reference). |
|
10.60+ |
|
Resignation and Mutual Release Agreement, dated January 22, 2009, between Toreador Resources Corporation and John M. McLaughlin (previously filed as Exhibit 10.2 to Toreador Resources Corporation Current Report on Form 8-K filed on January 27, 2009, File No. 0-2517, and incorporated herein by reference). |
|
10.61+ |
|
Separation and Mutual Release Agreement, dated January 22, 2009, between Toreador Resources Corporation and Nigel J. Lovett (previously filed as Exhibit 10.3 to Toreador Resources Corporation Current Report on Form 8-K filed on January 27, 2009, File No. 0-2517, and incorporated herein by reference). |
|
10.62+ |
|
Form of McLaughlin/Lovett Indemnity Agreement, dated January 22, 2009, for John M. McLaughlin and Nigel J. Lovett (previously filed as Exhibit 10.4 to Toreador Resources Corporation Current Report on Form 8-K filed on January 27, 2009, File No. 0-2517, and incorporated herein by reference). |
|
10.63+ |
|
Form of Director Indemnity Agreement, dated January 22, 2009, for current directors (previously filed as Exhibit 10.5 to Toreador Resources Corporation Current Report on Form 8-K filed on January 27, 2009, File No. 0-2517, and incorporated herein by reference). |
|
10.64+ |
|
Letter Agreement, dated January 22, 2009, between Toreador Resources Corporation and Craig M. McKenzie (previously filed as Exhibit 10.6 to Toreador Resources Corporation Current Report on Form 8-K filed on January 27, 2009, File No. 0-2517, and incorporated herein by reference). |
|
12.1* |
|
Computation of Ratio of Earnings to Fixed Charges. |
|
21.1* |
|
Subsidiaries of Toreador Resources Corporation. |
|
23.1* |
|
Consent of Grant Thornton LLP |
72
Table of Contents
| | | |
Exhibit
Number | | Description |
|---|
| | 23.2* | | Consent of LaRoche Petroleum Consultants, Ltd. |
|
23.3* |
|
Consent of Kaya & Aksoy, contained in Exhibit 5.1. |
|
23.4* |
|
Consent of PRK Partners/Bellak Law offices, contained in Exhibit 5.2 |
|
24.1* |
|
Power of Attorney (included as part of the signature page). |
|
31.1* |
|
Certification of Chief Executive Officer pursuant to 18 U.S.C. Section 1350, as adopted pursuant to Section 302 of the Sarbanes-Oxley Act of 2002. |
|
31.2* |
|
Certification of Senior Vice President and Chief Financial Officer pursuant to 18 U.S.C. Section 1350, as adopted pursuant to Section 302 of the Sarbanes-Oxley Act of 2002. |
|
32.1* |
|
Certification of Chief Executive Officer and Senior Vice President and Chief Financial Officer pursuant to 18 U.S.C. Section 1350, as adopted pursuant to Section 906 of the Sarbanes-Oxley Act of 2002. |
|
99.1 |
|
French Ministry Documentation (previously filed as Exhibit 99.1 to Toreador Resources Corporation Amended Annual Report on Form 10-K/A for the year ended December 31, 2006, File No. 0-2517, and incorporated herein by reference). |
|
99.2 |
|
Summary of Hungarian Mining Law (previously filed as Exhibit 99.2 to Toreador Resources Corporation Amended Annual Report on Form 10-K/A for the year ended December 31, 2006, File No. 0-2517, and incorporated herein by reference). |
|
99.3 |
|
Portions of Hungarian Mining Act (previously filed as Exhibit 99.3 to Toreador Resources Corporation Amended Annual Report on Form 10-K/A for the year ended December 31, 2006, File No. 0-2517, and incorporated herein by reference). |
|
99.4 |
|
Portions of Governmental Decree Implementing the Hungarian Mining Act (previously filed as Exhibit 99.4 to Toreador Resources Corporation Amended Annual Report on Form 10-K/A for the year ended December 31, 2006, File No. 0-2517, and incorporated herein by reference). |
|
99.5 |
|
Letter from Hungarian Mining Bureau dated August 13, 2007 (previously filed as Exhibit 99.5 to Toreador Resources Corporation Annual Report on Form 10-K for the year ended December 31, 2007, File No. 0-2517, and incorporated herein by reference). |
- *
- Filed herewith
- +
- Management contract or compensatory plan
73
Table of Contents
Item 8. Financial Statements
INDEX TO CONSOLIDATED FINANCIAL STATEMENTS
| | | |
| | Page |
|---|
Report of Independent Registered Public Accounting Firm | | F-2 |
Financial Statements | | |
| | Consolidated Balance Sheets as of December 31, 2008 and 2007 | | F-4 |
| | Consolidated Statements of Operations and Comprehensive Income (Loss) for each of the three years in the period ended December 31, 2008 | | F-5 |
| | Consolidated Statements of Changes in Stockholders' Equity for each of the three years in the period ended December 31, 2008 | | F-6 |
| | Consolidated Statements of Cash Flows for each of the three years in the period ended December 31, 2008 | | F-7 |
| | Notes to Consolidated Financial Statements | | F-8 |
F-1
Table of Contents
REPORT OF INDEPENDENT REGISTERED PUBLIC ACCOUNTING FIRM
Board of Directors and Stockholders
Toreador Resources Corporation
We have audited Toreador Resources Corporation (a Delaware Corporation) and subsidiaries' (the "Company") internal control over financial reporting as of December 31, 2008, based on criteria established inInternal Control — Integrated Framework issued by the Committee of Sponsoring Organizations of the Treadway Commission (COSO). The Company's management is responsible for maintaining effective internal control over financial reporting and for its assessment of the effectiveness of internal control over financial reporting, included in the accompanying "Management's Annual Report on Internal Control Over Financial Reporting". Our responsibility is to express an opinion on the Company's internal control over financial reporting based on our audit.
We conducted our audit in accordance with the standards of the Public Company Accounting Oversight Board (United States). Those standards require that we plan and perform the audit to obtain reasonable assurance about whether effective internal control over financial reporting was maintained in all material respects. Our audit included obtaining an understanding of internal control over financial reporting, assessing the risk that a material weakness exists, testing and evaluating the design and operating effectiveness of internal control based on the assessed risk, and performing such other procedures as we considered necessary in the circumstances. We believe that our audit provides a reasonable basis for our opinion.
A company's internal control over financial reporting is a process designed to provide reasonable assurance regarding the reliability of financial reporting and the preparation of financial statements for external purposes in accordance with generally accepted accounting principles. A company's internal control over financial reporting includes those policies and procedures that (1) pertain to the maintenance of records that, in reasonable detail, accurately and fairly reflect the transactions and dispositions of the assets of the company; (2) provide reasonable assurance that transactions are recorded as necessary to permit preparation of financial statements in accordance with generally accepted accounting principles, and that receipts and expenditures of the company are being made only in accordance with authorizations of management and directors of the company; and (3) provide reasonable assurance regarding prevention or timely detection of unauthorized acquisition, use, or disposition of the company's assets that could have a material effect on the financial statements.
Because of its inherent limitations, internal control over financial reporting may not prevent or detect misstatements. Also, projections of any evaluation of effectiveness to future periods are subject to the risk that controls may become inadequate because of changes in conditions, or that the degree of compliance with the policies or procedures may deteriorate.
In our opinion, the Company maintained, in all material respects, effective internal control over financial reporting as of December 31, 2008, based on criteria established inInternal Control — Integrated Framework issued by COSO.
We also have audited, in accordance with the standards of the Public Company Accounting Oversight Board (United States), the consolidated balance sheets of Toreador Resources Corporation and subsidiaries as of December 31, 2008 and 2007, and the related statements of operations and comprehensive income (loss), changes in stockholders' equity and cash flows for each of the three years in the period ended December 31, 2008 and our report dated March 16, 2009 expressed an unqualified opinion.
Houston, Texas
March 16, 2009
F-2
Table of Contents
REPORT OF INDEPENDENT REGISTERED PUBLIC ACCOUNTING FIRM
Board of Directors and Stockholders
Toreador Resources Corporation
We have audited the accompanying consolidated balance sheets of Toreador Resources Corporation (a Delaware corporation) and subsidiaries (the 'Company") as of December 31, 2008 and 2007, and the related consolidated statements of operations and comprehensive income (loss), changes in stockholders' equity, and cash flows for each of the three years in the period ended December 31, 2008. These financial statements are the responsibility of the Company's management. Our responsibility is to express an opinion on these financial statements based on our audits.
We conducted our audits in accordance with the standards of the Public Company Accounting Oversight Board (United States). Those standards require that we plan and perform the audit to obtain reasonable assurance about whether the financial statements are free of material misstatement. An audit includes examining, on a test basis, evidence supporting the amounts and disclosures in the financial statements. An audit also includes assessing the accounting principles used and significant estimates made by management, as well as evaluating the overall financial statement presentation. We believe that our audits provide a reasonable basis for our opinion.
In our opinion, the consolidated financial statements referred to above present fairly, in all material respects, the financial position of Toreador Resources Corporation and subsidiaries as of December 31, 2008 and 2007, and the results of their operations and their cash flows for each of the three years in the period ended December 31, 2008 in conformity with accounting principles generally accepted in the United States of America.
We also have audited, in accordance with the standards of the Public Company Accounting Oversight Board (United States), the Company's internal control over financial reporting as of December 31, 2008, based on criteria established inInternal Control — Integrated Framework issued by the Committee of Sponsoring Organizations of the Treadway Commission (COSO) and our report dated March 16, 2009 expressed an unqualified opinion.
Houston, Texas
March 16, 2009
F-3
Table of Contents
TOREADOR RESOURCES CORPORATION
CONSOLIDATED BALANCE SHEETS
| | | | | | | | | | |
| | December 31, | |
|---|
| | 2008 | | 2007 | |
|---|
| | (in thousands, except
share and per share data)
| |
|---|
ASSETS | |
Current assets: | | | | | | | |
| | Cash and cash equivalents | | $ | 19,457 | | $ | 12,721 | |
| | Accounts receivable, net of allowance of $220 and $120 | | | 5,450 | | | 12,340 | |
| | Oil and natural gas properties, net, held for sale | | | 55,000 | | | — | |
| | Other | | | 5,280 | | | 3,912 | |
| | | | | | |
| | | | Total current assets | | | 85,187 | | | 28,973 | |
| | | | | | |
Oil and natural gas properties, net, using successful efforts method of accounting | | | 109,711 | | | 271,951 | |
Investments | | | 200 | | | 500 | |
Restricted cash | | | 2,922 | | | 10,818 | |
Goodwill | | | 3,838 | | | 4,942 | |
Other assets | | | 5,298 | | | 5,927 | |
| | | | | | |
| | $ | 207,156 | | $ | 323,111 | |
| | | | | | |
LIABILITIES AND STOCKHOLDERS' EQUITY | |
Current liabilities: | | | | | | | |
| | Accounts payable and accrued liabilities | | $ | 16,929 | | $ | 18,280 | |
| | Deferred lease payable | | | 93 | | | 183 | |
| | Fair value of oil and gas derivatives | | | — | | | 192 | |
| | Current portion of long-term debt | | | 30,000 | | | — | |
| | Income taxes payable | | | 4,217 | | | 674 | |
| | | | | | |
| | | | Total current liabilities | | | 51,239 | | | 19,329 | |
| | | | | | |
Accrued liabilities | | | 501 | | | 522 | |
Deferred lease payable | | | 665 | | | 478 | |
Long-term debt, net of current portion | | | — | | | 30,000 | |
Asset retirement obligations | | | 8,065 | | | 7,339 | |
Deferred income tax liabilities | | | 13,851 | | | 15,368 | |
Convertible subordinated notes | | | 80,275 | | | 86,250 | |
| | | | | | |
| | | | Total liabilities | | | 154,596 | | | 159,286 | |
| | | | | | |
Commitments and contingencies (Note 12) | | | | | | | |
Stockholders' equity: | | | | | | | |
| | | Common stock, $0.15625 par value, 30,000,000 shares authorized; 20,984,360 and 20,566,470 shares issued | | | 3,279 | | | 3,214 | |
| | Additional paid-in capital | | | 166,484 | | | 163,955 | |
| | Accumulated deficit | | | (151,169 | ) | | (42,564 | ) |
| | Accumulated other comprehensive income | | | 36,500 | | | 41,754 | |
| | Treasury stock at cost, 721,027 shares | | | (2,534 | ) | | (2,534 | ) |
| | | | | | |
| | | | Total stockholders' equity | | | 52,560 | | | 163,825 | |
| | | | | | |
| | $ | 207,156 | | $ | 323,111 | |
| | | | | | |
See accompanying notes to the consolidated financial statements.
F-4
Table of Contents
TOREADOR RESOURCES CORPORATION
CONSOLIDATED STATEMENTS OF OPERATIONS AND COMPREHENSIVE INCOME (LOSS)
| | | | | | | | | | | | | |
| | Year ended December 31, | |
|---|
| | 2008 | | 2007 | | 2006 | |
|---|
| | (in thousands, except per share data)
| |
|---|
Revenue: | | | | | | | | | | |
| | Oil and natural gas sales | | $ | 62,374 | | $ | 41,691 | | $ | 33,328 | |
Operating costs and expenses: | | | | | | | | | | |
| | Lease operating expense | | | 17,211 | | | 12,644 | | | 8,741 | |
| | Exploration expense | | | 5,806 | | | 14,742 | | | 3,946 | |
| | Dry hole and abandonment | | | — | | | 21,840 | | | 1,706 | |
| | Depreciation, depletion and amortization | | | 32,727 | | | 20,795 | | | 6,054 | |
| | Asset retirement accretion | | | 415 | | | 462 | | | 225 | |
| | Impairment of oil and natural gas properties and intangible assets | | | 85,233 | | | 13,446 | | | — | |
| | General and administrative | | | 15,487 | | | 17,313 | | | 9,505 | |
| | Loss on oil and gas derivative contracts | | | 1,781 | | | 1,005 | | | — | |
| | Loss (gain) on sale of properties and other assets | | | 123 | | | (3,159 | ) | | (436 | ) |
| | | | | | | | |
| | | | Total operating costs and expenses | | | 158,783 | | | 99,088 | | | 29,741 | |
| | | | | | | | |
Operating income (loss) | | | (96,409 | ) | | (57,397 | ) | | 3,587 | |
Other income (expense): | | | | | | | | | | |
| | Equity in earnings of unconsolidated investments | | | — | | | 22 | | | 401 | |
| | Foreign currency exchange loss | | | (486 | ) | | (26,305 | ) | | (605 | ) |
| | Interest and other income | | | 1,779 | | | 1,829 | | | 1,988 | |
| | Gain on the extinguishment of debt | | | 458 | | | — | | | — | |
| | Interest expense | | | (7,849 | ) | | (4,291 | ) | | (891 | ) |
| | | | | | | | |
| | | | Total other income (expense) | | | (6,098 | ) | | (28,745 | ) | | 893 | |
| | | | | | | | |
Income (loss) from continuing operations before income taxes | | | (102,507 | ) | | (86,142 | ) | | 4,480 | |
Income tax benefit (provision) | | | (6,076 | ) | | 4,676 | | | (3,005 | ) |
| | | | | | | | |
Income (loss) from continuing operations, net of tax | | | (108,583 | ) | | (81,466 | ) | | 1,475 | |
Income (loss) from discontinued operations, net of tax | | | (22 | ) | | 7,045 | | | 1,103 | |
| | | | | | | | |
Net income (loss) | | | (108,605 | ) | | (74,421 | ) | | 2,578 | |
Preferred dividends | | | — | | | (162 | ) | | (162 | ) |
| | | | | | | | |
Income (loss) available to common shares | | $ | (108,605 | ) | $ | (74,583 | ) | $ | 2,416 | |
| | | | | | | | |
Basic income (loss) available to common shares per share from: | | | | | | | | | | |
| | | Continuing operations | | $ | (5.48 | ) | $ | (4.45 | ) | $ | 0.09 | |
| | | Discontinued operations | | | — | | | 0.38 | | | 0.07 | |
| | | | | | | | |
| | $ | (5.48 | ) | $ | (4.07 | ) | $ | 0.16 | |
| | | | | | | | |
Diluted income (loss) available to common shares per share from: | | | | | | | | | | |
| | | Continuing operations | | $ | (5.48 | ) | $ | (4.45 | ) | $ | 0.08 | |
| | | Discontinued operations | | | — | | | 0.38 | | | 0.07 | |
| | | | | | | | |
| | $ | (5.48 | ) | $ | (4.07 | ) | $ | 0.15 | |
| | | | | | | | |
Weighted average shares outstanding: | | | | | | | | | | |
| | Basic | | | 19,831 | | | 18,358 | | | 15,527 | |
| | Diluted | | | 19,831 | | | 18,358 | | | 15,884 | |
Statement of Comprehensive Income (Loss) | | | | | | | | | | |
Net income (loss) | | $ | (108,605 | ) | $ | (74,421 | ) | $ | 2,578 | |
Foreign currency translation adjustments | | | (5,254 | ) | | 38,431 | | | 6,687 | |
| | | | | | | | |
Comprehensive income (loss) | | $ | (113,859 | ) | $ | (35,990 | ) | $ | 9,265 | |
| | | | | | | | |
See accompanying notes to the consolidated financial statements.
F-5
Table of Contents
TOREADOR RESOURCES CORPORATION
CONSOLIDATED STATEMENTS OF CHANGES IN STOCKHOLDERS' EQUITY
| | | | | | | | | | | | | | | | | | | | | | | | | | | | | | | |
| | Preferred
Stock
(Shares) | | Preferred
Stock
($) | | Common
Stock
(Shares) | | Common
Stock
($) | | Additional
Paid-in
Capital | | Retained
Earnings | | Accumulated
Other
Comprehensive
Income (loss) | | Treasury
Stock
($) | | Deferred
Compensation | | Total
Stockholders'
Equity | |
|---|
| | (in thousands)
| |
|---|
Balance at December 31, 2005 | | | 72 | | | 72 | | | 16,143 | | | 2,522 | | | 108,001 | | | 29,564 | | | (3,364 | ) | | (2,534 | ) | | (1,902 | ) | | 132,359 | |
Transfer deferred compensation to additional paid-in capital | | | — | | | — | | | — | | | — | | | (1,902 | ) | | — | | | — | | | — | | | 1,902 | | | — | |
Cash payment of preferred dividends | | | — | | | — | | | — | | | — | | | — | | | (162 | ) | | — | | | — | | | — | | | (162 | ) |
Conversion of convertible debenture | | | — | | | — | | | 120 | | | 19 | | | 791 | | | — | | | — | | | — | | | — | | | 810 | |
Exercise of stock options | | | — | | | — | | | 175 | | | 27 | | | 839 | | | — | | | — | | | — | | | — | | | 866 | |
Issuance of restricted stock | | | — | | | — | | | 214 | | | 33 | | | (33 | ) | | — | | | — | | | — | | | — | | | — | |
Exercise of warrants | | | — | | | — | | | 4 | | | 1 | | | 33 | | | — | | | — | | | — | | | — | | | 34 | |
Issuance of warrants | | | — | | | — | | | — | | | — | | | 883 | | | — | | | — | | | — | | | — | | | 883 | |
Tax benefit of stock option exercises | | | — | | | — | | | — | | | — | | | 293 | | | — | | | — | | | — | | | — | | | 293 | |
Stock option expense | | | — | | | — | | | — | | | — | | | 66 | | | — | | | — | | | — | | | — | | | 66 | |
Amortization of deferred stock compensation | | | — | | | — | | | — | | | — | | | 2,737 | | | — | | | — | | | — | | | — | | | 2,737 | |
Net income | | | — | | | — | | | — | | | — | | | — | | | 2,578 | | | — | | | — | | | — | | | 2,578 | |
Foreign currency translation adjustment | | | — | | | — | | | — | | | — | | | — | | | — | | | 6,687 | | | — | | | — | | | 6,687 | |
| | | | | | | | | | | | | | | | | | | | | | |
Balance at December 31, 2006 | | | 72 | | | 72 | | | 16,656 | | | 2,602 | | | 111,708 | | | 31,980 | | | 3,323 | | | (2,534 | ) | | — | | | 147,151 | |
Cash payment of preferred dividends | | | — | | | — | | | — | | | — | | | | | | (162 | ) | | — | | | — | | | — | | | (162 | ) |
Exercise of stock options | | | — | | | — | | | 321 | | | 50 | | | 1,574 | | | — | | | — | | | — | | | — | | | 1,624 | |
Issuance of restricted stock | | | — | | | — | | | 103 | | | 16 | | | (16 | ) | | — | | | — | | | — | | | — | | | — | |
Issuance of common stock | | | — | | | — | | | 3,037 | | | 476 | | | 49,937 | | | — | | | — | | | — | | | — | | | 50,413 | |
Stock option expense | | | — | | | — | | | — | | | — | | | 49 | | | — | | | — | | | — | | | — | | | 49 | |
Amortization of deferred stock compensation expense | | | — | | | — | | | — | | | — | | | 3,982 | | | — | | | — | | | — | | | — | | | 3,982 | |
Adoption of FIN 48 | | | — | | | — | | | — | | | — | | | — | | | (45 | ) | | — | | | — | | | — | | | (45 | ) |
Conversion of preferred stock to common stock | | | (72 | ) | | (72 | ) | | 450 | | | 70 | | | 2 | | | — | | | — | | | — | | | — | | | — | |
Net loss | | | — | | | — | | | — | | | — | | | — | | | (74,421 | ) | | — | | | — | | | — | | | (74,421 | ) |
Foreign currency translation adjustments | | | — | | | — | | | — | | | — | | | — | | | — | | | 38,431 | | | — | | | — | | | 38,431 | |
Tax effect of restricted stock | | | — | | | — | | | — | | | — | | | (316 | ) | | — | | | — | | | — | | | — | | | (316 | ) |
Payment of equity issuance costs | | | — | | | — | | | — | | | — | | | (2,965 | ) | | — | | | — | | | — | | | — | | | (2,965 | ) |
Other | | | — | | | — | | | — | | | — | | | — | | | 84 | | | — | | | — | | | — | | | 84 | |
| | | | | | | | | | | | | | | | | | | | | | |
Balance at December 31, 2007 | | | — | | | — | | | 20,567 | | $ | 3,214 | | $ | 163,955 | | $ | (42,564 | ) | $ | 41,754 | | $ | (2,534 | ) | $ | — | | $ | 163,825 | |
Exercise of stock options | | | — | | | — | | | 189 | | | 29 | | | 716 | | | — | | | — | | | — | | | — | | | 745 | |
Issuance of restricted stock | | | — | | | — | | | 228 | | | 36 | | | (36 | ) | | — | | | — | | | — | | | — | | | — | |
Stock option expense | | | — | | | — | | | — | | | — | | | 94 | | | — | | | — | | | — | | | — | | | 94 | |
Amortization of deferred stock compensation | | | — | | | — | | | — | | | — | | | 2,231 | | | — | | | — | | | — | | | — | | | 2,231 | |
Net loss | | | — | | | — | | | — | | | — | | | — | | | (108,605 | ) | | — | | | — | | | — | | | (108,605 | ) |
Foreign currency translation adjustments | | | — | | | — | | | — | | | — | | | — | | | — | | | (5,254 | ) | | — | | | — | | | (5,254 | ) |
Tax effect of restricted stock | | | — | | | — | | | — | | | — | | | (444 | ) | | — | | | — | | | — | | | — | | | (444 | ) |
Other | | | — | | | — | | | — | | | — | | | (32 | ) | | — | | | — | | | — | | | — | | | (32 | ) |
| | | | | | | | | | | | | | | | | | | | | | |
Balance at December 31, 2008 | | | — | | | — | | | 20,984 | | $ | 3,279 | | $ | 166,484 | | $ | (151,169 | ) | $ | 36,500 | | $ | (2,534 | ) | $ | — | | $ | 52,560 | |
| | | | | | | | | | | | | | | | | | | | | | |
See accompanying notes to the consolidated financial statements.
F-6
Table of Contents
TOREADOR RESOURCES CORPORATION
CONSOLIDATED STATEMENTS OF CASH FLOWS
| | | | | | | | | | | | | | |
| | Year Ended December 31 | |
|---|
| | 2008 | | 2007 | | 2006 | |
|---|
| | (in thousands)
| |
|---|
Cash flows from operating activities: | | | | | | | | | | |
| | | Net Income (loss) | | $ | (108,605 | ) | $ | (74,421 | ) | $ | 2,578 | |
| | | Adjustments to reconcile net income (loss) to net cash provided by (used in) operating activities | | | | | | | | | | |
| | | | | Depreciation, depletion and amortization | | | 32,727 | | | 21,406 | | | 7,319 | |
| | | | | Asset retirement accretion expense | | | 415 | | | 462 | | | 225 | |
| | | | | Amortization of deferred debt issuance costs | | | 338 | | | 612 | | | — | |
| | | | | Issuance of warrants to non-employees | | | — | | | — | | | 107 | |
| | | | | Impairment of oil and natural gas properties and intangible assets | | | 85,233 | | | 13,446 | | | 345 | |
| | | | | Dry hole and abandonment costs | | | — | | | 21,840 | | | 3,099 | |
| | | | | Deferred income taxes | | | — | | | (3,425 | ) | | 2,642 | |
| | | | | Unrealized loss on commodity derivatives | | | — | | | 192 | | | — | |
| | | | | Allowance for doubtful accounts | | | 100 | | | 120 | | | — | |
| | | | | Loss (gain) on sale of properties and equipment | | | 123 | | | 343 | | | (638 | ) |
| | | | | Gain on the sale of discontinued operations | | | — | | | (9,244 | ) | | — | |
| | | | | Gain on the extinguishment of debt | | | (458 | ) | | — | | | — | |
| | | | | Equity in earnings of unconsolidated investments | | | — | | | (22 | ) | | (401 | ) |
| | | | | Stock-based compensation | | | 2,325 | | | 4,031 | | | 2,803 | |
| | | | | Gain on sale of unconsolidated investments | | | — | | | (3,502 | ) | | — | |
| | Change in operating assets and liabilities, net of acquisitions | | | | | | | | | | |
| | | Decrease (increase) in accounts receivable | | | 6,791 | | | (2,575 | ) | | (1,027 | ) |
| | | Decrease (increase) in income taxes receivable | | | — | | | 715 | | | (655 | ) |
| | | Decrease (increase) in other current assets | | | (1,508 | ) | | 4,880 | | | (4,596 | ) |
| | | Decrease in accounts payable and accrued liabilities | | | (1,243 | ) | | (1,862 | ) | | (1,322 | ) |
| | | Increase (decrease) in lease payable | | | (19 | ) | | 661 | | | — | |
| | | Decrease in other assets | | | 31 | | | 118 | | | — | |
| | | Increase in income taxes payable | | | 1,584 | | | 439 | | | 3,625 | |
| | | | | | | | |
| | | | | Net cash provided by (used in) operating activities | | | 17,834 | | | (25,786 | ) | | 14,104 | |
| | | | | | | | |
Cash flows from investing activities: | | | | | | | | | | |
| | | Expenditures for property and equipment | | | (10,702 | ) | | (90,644 | ) | | (105,165 | ) |
| | | Restricted cash | | | 7,896 | | | 10,636 | | | (20,504 | ) |
| | | Proceeds from the sale of properties and equipment | | | — | | | 21,002 | | | 1,672 | |
| | | Distributions from unconsolidated entities | | | — | | | 60 | | | 250 | |
| | | Sale (purchase) of short-term investments | | | — | | | (500 | ) | | 40,000 | |
| | | Sale (purchase) of investments in unconsolidated entities | | | — | | | 6,123 | | | (257 | ) |
| | | | | | | | |
| | | | | Net cash used in investing activities | | | (2,806 | ) | | (53,323 | ) | | (84,004 | ) |
| | | | | | | | |
Cash flows from financing activities: | | | | | | | | | | |
| | | Repayment of revolving credit facilities | | | — | | | — | | | (5,000 | ) |
| | | Net borrowings under revolving credit arrangements | | | — | | | 3,450 | | | 26,550 | |
| | | Exercise of stock options | | | 745 | | | 1,624 | | | 866 | |
| | | Proceeds from the exercise of warrants | | | — | | | — | | | 34 | |
| | | Proceeds from issuance of common stock, net of issuance cost of $32, $2,965, and $0 | | | (32 | ) | | 47,448 | | | — | |
| | | Tax benefit related to stock options | | | — | | | — | | | 293 | |
| | | Payments of long term debt | | | (5,275 | ) | | — | | | — | |
| | | Payment of preferred dividends | | | — | | | (162 | ) | | (162 | ) |
| | | | | | | | |
| | | | | Net cash provided by (used in) financing activities | | | (4,562 | ) | | 52,360 | | | 22,581 | |
| | | | | | | | |
Net increase (decrease) in cash and cash equivalents | | |
10,466 | | |
(26,749 |
) | |
(47,319 |
) |
Effects of foreign currency translation on cash and cash equivalents | | | (3,730 | ) | | 26,806 | | | 6,870 | |
Cash and cash equivalents, beginning of year | | | 12,721 | | | 12,664 | | | 53,113 | |
| | | | | | | | |
Cash and cash equivalents, end of year | | $ | 19,457 | | $ | 12,721 | | $ | 12,664 | |
| | | | | | | | |
Supplemental disclosures: | | | | | | | | | | |
Cash paid during the period for interest, net of interest capitalized | | $ | 5,626 | | $ | 2,927 | | $ | — | |
| | | Cash paid during the period for income taxes | | $ | 3,058 | | $ | 2,761 | | $ | 2,414 | |
Non-cash investing and financing activities | | | | | | | | | | |
| | | Conversion of preferred stock to common stock | | $ | — | | $ | 72 | | $ | — | |
| | | Conversion of convertible debentures to common stock | | $ | — | | $ | — | | $ | 810 | |
| | | Additions to oil and natural gas properties related to asset retirement obligations | | $ | 1,294 | | $ | 1,964 | | $ | 882 | |
See accompanying notes to the consolidated financial statements.
F-7
Table of Contents
TOREADOR RESOURCES CORPORATION
NOTES TO CONSOLIDATED FINANCIAL STATEMENTS
NOTE 1 — DESCRIPTION OF BUSINESS
Toreador Resources Corporation ("Toreador") is an independent energy company engaged in foreign oil and natural gas exploration, development, production, leasing and acquisition activities in France, Turkey, Romania and Hungary. The accompanying consolidated financial statements are presented in U.S. dollars and in accordance with accounting principles generally accepted in the United States.
Toreador consolidates all of its majority-owned subsidiaries (collectively, "we," "us," "our," or the "Company"). All intercompany accounts and transactions are eliminated in consolidation. We account for our investments in entities in which we hold less than a majority interest under the equity method.
NOTE 2 — SIGNIFICANT ACCOUNTING POLICIES
The preparation of the consolidated financial statements requires management of the Company to make a number of estimates and assumptions relating to the reported amounts of assets and liabilities and the disclosure of contingent assets and liabilities at the date of the consolidated financial statements and the reported amounts of revenues and expenses during the reporting period.
The Company's estimates of crude oil and natural gas reserves are the most significant estimates used. All of the reserve data in the Annual Report on Form 10-K for the year ended December 31, 2008 are estimates. Reservoir engineering is a subjective process of estimating underground accumulations of crude oil and natural gas. There are numerous uncertainties inherent in estimating quantities of proved crude oil and natural gas reserves. The accuracy of any reserve estimates is a function of the quality of available data and of engineering and geological interpretation and judgment. As a result, reserve estimates may be different from the quantities of crude oil and natural gas that are ultimately recovered.
Other items subject to estimates and assumptions include the carrying amounts of oil and natural gas properties, goodwill, asset retirement obligations and deferred income tax assets. Actual results could differ significantly from those estimates.
Cash and cash equivalents include cash on hand, amounts due from banks and all highly liquid investments with original maturities of three months or less. We believe we maintain our cash in bank deposit accounts, substantially all of which exceed federally insured limits. We have not experienced any losses in such accounts.
As of December 31, 2008 and 2007 we had $16.8 million and $10.7 million, respectively, on deposit in foreign banks.
Restricted cash consists $2.9 million for letters of credit to secure additional permits in Hungary. The total amount is on deposit in a foreign bank. As of December 31, 2007 we had restricted cash of $8.7 million used to secure a bank "Letter Guarantee" that was issued as required under mediation proceedings with Micoperi, Srl and $2.1 million for a letter of credit to secure additional permits in Hungary.
F-8
Table of Contents
TOREADOR RESOURCES CORPORATION
NOTES TO CONSOLIDATED FINANCIAL STATEMENTS — (Continued)
Financial instruments that potentially subject us to a concentration of credit risk consist principally of cash, accounts receivable, and our hedging and derivative financial instruments. We place our cash with high credit quality financial institutions. We sell oil and natural gas to various customers. An allowance for doubtful accounts was established for accounts receivable in Romania in 2007. The balance of this allowance for doubtful accounts was $219,772 in 2008 and $120,000 in 2007. Substantially all of our accounts receivable are due from purchasers of oil and natural gas. We place our hedging and derivative financial instruments with financial institutions and other firms that we believe have high credit ratings. For a discussion of the credit risks associated with our hedging activities, please see "Derivative Financial Instruments" below.
We periodically review the collectability of accounts receivable and record a valuation allowance for those accounts which are, in our judgment, unlikely to be collected. We have not had any significant credit losses in the past and we believe our accounts receivable are fully collectable with the exception of the current allowance.
The carrying amounts of financial instruments including cash and cash equivalents, short-term investments, accounts receivable, accounts payable and accrued liabilities approximate fair value, at December 31, 2008 and 2007, due to the short-term nature or maturity of the instruments.
Long-term debt approximated fair value based on the quoted market prices for the same or similar issues or on the current rates offered to the Company for debt of the same maturities.
On December 31, 2008 the convertible subordinate notes which had a book value of $80.28 million, were trading at $770.00, which would equal a fair market value of approximately $61.8 million.
We periodically utilize derivatives instruments such as futures and swaps for purposes of hedging our exposure to fluctuations in the price of crude oil and natural gas sales. We entered into futures and swap contracts for approximately 16,000 Bbls per month for the months of January 2008 through September 2008. This resulted in a fair value loss of $1.8 million. For the comparable period in 2007, we entered into futures and swap contracts for approximately 15,000 Bbls per month for the months of June 2007 through December 2008 and subsequently sold all contracts as of September 30, 2007 which resulted in a net loss of $813,000. As of December 31, 2008 we had no open commodity derivative contracts.
At December 31, 2007 we had the following open commodity contract with Total Oil Trading SA:
| | | | | | | | | | | | |
Type | | Period | | Barrels | | Floor | | Ceiling | |
|---|
Collar | | January 1 — March 31, 2008 | | | 48,000 | | $ | 84.75 | | $ | 92.75 | |
As of December 31, 2007, we recorded a net unrealized loss of $192,000 on the above open derivative contract. For the year ended December 31, 2007 we recognized a total derivative fair value loss of $1 million.
We have elected not to designate the derivative financial instruments to which we are a party as hedges, and accordingly, we record such contracts at fair value and recognize changes in such fair value in current earnings as they occur.
F-9
Table of Contents
TOREADOR RESOURCES CORPORATION
NOTES TO CONSOLIDATED FINANCIAL STATEMENTS — (Continued)
At December 31, 2008 and 2007, other current assets included $727,000, and $2.5 million of inventory, respectively. Those amounts consist of tubular goods and crude oil held in storage tanks. Inventories are stated at the lower of actual cost or market based on the average cost method.
At December 31, 2008 and 2007, other current assets included $1.6 million and $0 of payments made to vendors in advance of performing the services or receiving the equipment.
We follow the successful efforts method of accounting for oil and natural gas exploration and development expenditures. Under this method, costs of successful exploratory wells and all development wells are capitalized. Costs to drill exploratory wells that do not find proved reserves are expensed. Significant costs associated with the acquisition of oil and natural gas properties are capitalized. Upon sale or abandonment of units of property or the disposition of miscellaneous equipment, the cost is removed from the asset account, net of the accumulated depreciation or depletion, and the gain or loss is credited to or charged against operations.
Maintenance and repairs are charged to expense; betterments of property are capitalized and depreciated as described above.
We capitalize interest on major projects that require an extended period of time to complete. Interest capitalized in 2008, 2007 and 2006 was $1 million, $3.7 million, and $4.3 million, respectively.
We record furniture, fixtures and equipment at cost.
On September 17, 2008, we entered into an Assignment Agreement with Petrol Ofisi AS, a Turkish Company, to sell a 26.75% interest in the South Akcakoca sub-basin ("SASB") assets, which was subsequently amended on January 30, 2009, for $55 million. These assets have been classified on the balance sheet as held for sale and are valued at lower of the book value or fair value less the cost to sale. Subsequent to the sale to Petrol Ofisi, the Company has retained a 10% working interest in the SASB assets.
DEPRECIATION, DEPLETION AND AMORTIZATION
We provide depreciation, depletion and amortization of our investment in producing oil and natural gas properties on the units-of-production method, based upon independent reserve engineers' estimates of recoverable oil and natural gas reserves from the property. Depreciation expense for furniture, fixtures and equipment is generally calculated on a straight-line basis based upon estimated useful lives of three to seven years.
We evaluate producing property costs for impairment and reduce such costs to fair value if the sum of expected undiscounted future cash flows is less than net book value pursuant to Statement of Financial Accounting Standard No. 144, "Accounting for the Impairment or Disposal of Long-Lived Assets" ("Statement 144"). We assess impairment of non-producing leasehold costs and undeveloped mineral and
F-10
Table of Contents
TOREADOR RESOURCES CORPORATION
NOTES TO CONSOLIDATED FINANCIAL STATEMENTS — (Continued)
royalty interests periodically on a property-by-property basis. We charge any impairment in value to expense in the period incurred.
Impairment charged in 2008 was $85.2 million compared to $13.4 million in 2007. The impairment was a result of the following:
(1) In 2008, the impairment charge in Turkey was a result of a decline in the fair market value of the Company's interest in South Akcakoca Sub-Basin assets. In June 2008, we determined the fair market value based on a Letter of Intent to sell a 26.75% interest in the South Akcakoca Sub-Basin assets to Petrol Ofisi AS for $80.3 million. This sale price indicated that the fair value of our 36.75% working interest was approximately $103.8 million. The net book value of the Black Sea asset at June 30, 2008 was $157.3 million, resulting in an impairment of $53.5 million.
(2) In January 2009, the Company and Petrol Ofisi agreed to a revised purchase price of $55 million. This resulted in an impairment on assets held for sale, which is comprised of the 26.75% interest in the South Akcakoca Sub-basin assets, of $25.6 million.
(3) In December 2008, we incurred an additional $2.4 million impairment charge in Turkey for assets that were unrelated to the sale of South Akcakoca Sub-Basin assets. The impairment was a result of writing off an exploratory well where sufficient progress was not made to develop the area and a plan of development will not be prepared, by the operator, in the foreseeable future.
(4) We recorded an impairment charge of $2 million for the undeveloped leasehold costs in Trinidad, due to management's decision to exit Trinidad and discontinue our association with our registered agent in the country.
(5) When recording the acquisition of Madison Oil in 2002, we recorded $833,000 of goodwill associated with the Turkish assets. We periodically review the value of goodwill to determine if an impairment is required. The review at December 31, 2008, indicated that the total amount recorded for goodwill should be impaired. The reason for this impairment is due to the fair value of the Turkish subsidiary, based on the discounted present value of the oil and gas reserves being less than the carrying value of the Turkish subsidiary. This resulted in an impairment charge of $833,000.
(6) In December 2008, we recorded an impairment in Romania of $600,000 due to the net book value of the oil and natural gas properties exceeding future cash flows.
(7) In April 2007, we sold our interest in ePsolutions for $3.4 million in cash and 50,000 shares of preferred stock with a value of $10.00 per share. Due to the rising cost of electricity and the deterioration of the deregulated electric market in Texas, ePsolutions has reduced their forecasted growth for the next several years. Accordingly, we have reduced our carrying value of our investment in ePsolutions by $300,000 which we believe more accurately reflects the current market value of this investment.
ASSET RETIREMENT OBLIGATIONS
We account for our asset retirement obligations in accordance with Statement No. 143, "Accounting for Asset Retirement Obligations" ("Statement 143"), which requires us to record the fair value of a liability for an asset retirement obligation in the period in which it is incurred. When the liability is initially recorded, the entity capitalizes a cost by increasing the carrying amount of the related long-lived asset. Over time, the liability is accreted to its present value each period, and the capitalized cost is depreciated over the useful life of the related asset. Upon settlement of the liability, we either settle the obligation for its recorded amount or incur a gain or loss upon settlement.
F-11
Table of Contents
TOREADOR RESOURCES CORPORATION
NOTES TO CONSOLIDATED FINANCIAL STATEMENTS — (Continued)
The following table summarizes the changes in our asset retirement liability during the years ended December 31, 2008 and 2007:
| | | | | | | |
| | 2008 | | 2007 | |
|---|
| | (in thousands)
| |
|---|
Asset retirement obligation January 1 | | $ | 7,339 | | $ | 4,519 | |
Asset retirement accretion expense | | | 415 | | | 462 | |
Foreign currency exchange (gain) loss | | | (389 | ) | | 394 | |
Change in estimates | | | 873 | | | 1,964 | |
Property additions | | | 421 | | | — | |
Property dispositions | | | (594 | ) | | — | |
| | | | | | |
Asset retirement obligation at December 31 | | $ | 8,065 | | $ | 7,339 | |
| | | | | | |
We account for goodwill in accordance with Statement of Financial Accounting Standard No. 142,"Goodwill and Other Intangible Assets" ("Statement 142"). Under Statement 142, goodwill and indefinite-lived intangible assets are not amortized but are reviewed annually (or more frequently if impairment indicators arise) for impairment. Separable intangible assets that are not deemed to have an indefinite life are amortized over their useful lives. At December 31, 2008 and 2007 we did not have any intangible assets that did not have an indefinite life.
We review annually the value of goodwill recorded or more frequently if impairment indicators arise. We recognized $883,000, $0 and $0 goodwill impairment during 2008, 2007 and 2006 respectively. The impairment of goodwill was due to the fair value of the Turkish subsidiary, based on the discounted present value of the oil and gas reserves being less than the carrying value of the Turkish subsidiary. Goodwill was adjusted $222,000 in 2008 and $391,000 in 2007 for the foreign currency translation adjustment. The balance of goodwill at December 31, 2008 and 2007 is approximately $3.8 million and $4.9 million, respectively.
Our French crude oil production accounts for the majority of our sales. We sell our French crude oil to Elf Antar France S.A. ("ELF"), and recognize the related revenues when the production is delivered to ELF's refinery, typically via truck. At the time of delivery to the plant, title to the crude oil transfers to ELF. The terms of the contract with ELF state that the price received for oil sold will be the arithmetic mean of all average daily quotations of Dated Brent published in Platt's Oil Market Wire for the month of production less a specified differential per barrel. The pricing of oil sales is done on the first day of the month following the month of production. In accordance with the terms of the contract, payment is made within six working days of the date of issue of the invoice. The contract with ELF is automatically extended for a period of one year unless either party cancels it in writing no later than six months prior to the beginning of the next year. We periodically review ELF's payment timing to ensure that receivables from ELF for crude oil sales are collectible. In 2008, 2007 and 2006 sales to ELF represents approximately 55%, 62% and 67%, respectively, of the Company's total revenue and approximately 18% and 21% of the Company's accounts receivable at December 31, 2008 and 2007, respectively.
We recognize revenue for our remaining production when the quantities are delivered to or collected by the respective purchaser. Title to the produced quantities transfers to the purchaser at the time the purchaser collects or receives the quantities. Prices for such production are defined in sales contracts and
F-12
Table of Contents
TOREADOR RESOURCES CORPORATION
NOTES TO CONSOLIDATED FINANCIAL STATEMENTS — (Continued)
are readily determinable based on certain publicly available indices. The purchasers of such production have historically made payment for crude oil and natural gas purchases within thirty and sixty days of the end of each production month, respectively. We periodically review the difference between the dates of production and the dates we collect payment for such production to ensure that receivables from those purchasers are collectible. Taxes associated with production are classified as lease operating expense.
In December 2004, the Financial Accounting Standards Board ("FASB") issued Statement of Financial Accounting Standards No. 123 (revised 2004),"Share Based Payment," ("SFAS 123R"). SFAS 123R establishes the accounting for transactions in which an entity pays for employee services in share-based payment transactions. SFAS 123R requires companies to measure the cost of employee services received in exchange for an award of equity instruments based on the grant-date fair value of the award. The fair value of employee share options and similar instruments is estimated using option-pricing models adjusted for the unique characteristics of those instruments. That cost is recognized over the period during which an employee is required to provide service in exchange for the award. The Company adopted SFAS 123R effective January 1, 2006, using the modified-prospective transition method. Under this method, compensation cost is recognized for awards granted and for awards modified, repurchased or cancelled in the period after adoption. Compensation cost is also recognized for the unvested portion of awards granted prior to adoption. The Company's results for the year ended December 31, 2006, include an additional compensation expense of $65,916, that is included in general and administrative expenses relating to the adoption of SFAS 123R. Additionally, upon adoption of SFAS 123R, excess tax benefits related to stock option exercises of $293,000 were presented as a cash inflow from financing activities.
The functional currency of the countries in which we operate is the U.S. dollar in the United States, Turkey, Romania and Hungary and the Euro in France. Gains and losses resulting from the translation of Euros into U.S. dollars are included in other comprehensive income for the current period. Gains and losses resulting from the transactions in the New Turkish Lira in Turkey, the Lei in Romania and the Forint in Hungary are included in income available to common shares for the current period. We periodically review the operations of our entities to ensure the functional currency of each entity is the currency of the primary economic environment in which we operate. In October 2007, we made a change in accounting method regarding intercompany accounts receivable due from our subsidiaries in Turkey, Romania and Hungary. Pursuant to a Board of Directors' resolution, we expect to be repaid the intercompany accounts receivable from our subsidiaries in Turkey, Romania and Hungary in the foreseeable future. Due to this resolution, subsequent to October 1, 2007, the change in intercompany accounts receivable balances is reflected in current earnings, as a foreign exchange gain or loss rather than accumulated other comprehensive income.
We are subject to income taxes in the United States, France, Turkey, Hungary and Romania. The current provision for taxes on income consists primarily of income taxes based on the tax laws and rates of the countries in which operations were conducted during the periods presented. All interest and penalties related to income tax is charged to general and administrative expense. We compute our provision for deferred income taxes using the liability method. Under the liability method, deferred income tax assets and liabilities are determined based on differences between financial reporting and income tax basis of assets and liabilities and are measured using the enacted tax rates and laws. The measurement of deferred tax assets is adjusted by a valuation allowance, if necessary, to reduce the future tax benefits to the amount,
F-13
Table of Contents
TOREADOR RESOURCES CORPORATION
NOTES TO CONSOLIDATED FINANCIAL STATEMENTS — (Continued)
based on available evidence it is more likely than not deferred tax assets will be realized. We made a commitment to be fully reinvested in our international subsidiaries.
Effective January 1, 2007, we adopted the provisions of FASB Interpretation (FIN) No. 48,Accounting for Uncertainty in Income Taxes — An Interpretation of FASBStatement No. 109 (FIN No. 48"). FIN No. 48 clarifies financial statement recognition and disclosure requirements for uncertain tax positions taken or expected to be taken in a tax return. Financial statement recognition of the tax position will be sustained upon examination, based on the technical merits of the position. Any interest and penalties related to uncertain tax positions are recorded as interest expense and general and administrative expenses, respectively. The adoption of FIN No. 48 did not have a significant effect on our reported financial position or earnings. See Note 9.
We do not accrue for estimated legal fees or other related costs when accruing for loss contingencies, rather they are expensed as incurred.
Deferred debt issue costs are amortized on a straight line basis, which approximates the effective interest method over the term of the loan as a component of interest expense. Deferred debt issue costs, which are included in other assets, totaled approximately $4,073,000 and $4,652,000 net of accumulated amortization of $889,000 and $552,000 as of December 31, 2008 and 2007, respectively.
At December 31, 2008 and 2007 we had 721,027 shares of treasury stock valued at a historical cost of approximately $2.5 million or $3.47 a share.
In September 2006, the FASB issued Statement No. 157"Fair Value Measurements" ("SFAS No. 157"). SFAS No. 157 provides guidance for using fair value to measure assets and liabilities. It applies whenever other standards require or permit assets or liabilities to be measured at fair value but it does not expand the use of fair value in any new circumstances. In November 2007, the FASB issued FSP No. 157-2 ("FASB No. 157-2") to defer the effective date of SFAS 157 to fiscal year beginning after November 15, 2008, and the interim period for that fiscal year for all non-financial assets and liabilities, except those that are recognized or disclosed at fair value on a recurring basis. We are currently evaluating the impact of our adoption of FSP No. 157-2 which will be adopted effective January 1, 2009. The provisions of SFAS No. 157 that were not deferred were effective for financial statements issued for fiscal years beginning after November 15, 2007. The adoption of SFAS No. 157, effective January 1, 2008, did not have a significant effect on our reported financial position or earnings. In October 2008, the FASB issued FSP No. 157-3,"Determining the Fair Value of a Financial Asset When the Market for That Asset is Not Active" (FSP 157-3). FSP 157-3 clarifies the application of SFAS 157, which the Company adopted as of January 1, 2008, in cases where a market is not active. The Company has considered FSP 157-3 in its determination of estimated fair values as of December 31, 2008, and the impact was not material.
In February 2007, the FASB issued Statement 159,"The Fair Value Option for Financial Assets and Financial Liabilities —Including an Amendment of FASB Statement 115" ("SFAS No. 159"). SFAS No. 159 permits entities to choose to measure certain financial instruments and other items at fair value. The objective is to improve financial reporting by providing entities with the opportunity to mitigate volatility in reported earnings caused by measuring related assets and liabilities differently without having
F-14
Table of Contents
TOREADOR RESOURCES CORPORATION
NOTES TO CONSOLIDATED FINANCIAL STATEMENTS — (Continued)
to apply complex hedge accounting provisions. Unrealized gains and losses on any items for which we elect the fair value measurement option are to be reported in earnings. SFAS No. 159 is effective for fiscal years beginning after November 15, 2007. The Company elected not to measure any eligible items using the fair value option in accordance with SFAS No. 159 and therefore the adoption of SFAS No. 159, effective January 1, 2008, did not have an effect on our reported financial position or earnings.
In December 2007, the FASB issued Statement No. 141R,"Business Combinations" ("SFAS No. 141R"). Under SFAS No. 141R, a company is required to recognize the assets acquired, liabilities assumed, contractual contingencies, and any contingent consideration measured at their fair value at the acquisition date. It further requires that research and development assets acquired in a business combination that have no alternative future use are to be measured at their acquisition-date fair value and then immediately charged to expense, and that acquisition-related costs are to be recognized separately from the acquisition and expensed as incurred. Among other changes, this statement also requires that "negative goodwill" be recognized in earnings as a gain attributable to the acquisition, and any deferred tax benefits resultant in a business combination be recognized in income from continuing operations in the period of the combination. SFAS No. 141R is effective for business combinations for which the acquisition date is on or after the beginning of the first annual reporting period beginning after December 15, 2008. We are currently determining the effect of adopting SFAS No. 141R.
In December 2007, the FASB issued Statement No. 160,"Noncontrolling Interests in Consolidated Financial Statements" —an amendment of ARB No. 51 ("SFAS No. 160"). SFAS No. 160 amends ARB 51 to establish accounting and reporting standards for the noncontrolling interest in a subsidiary and for the deconsolidation of a subsidiary. It clarifies that a noncontrolling interest in a subsidiary, which is sometimes referred to as minority interest, is an ownership interest in the consolidated entity that should be reported as equity in the consolidated financial statements. Among other requirements, this statement requires consolidated net income to be reported at amounts that include the amounts attributable to both the parent and the noncontrolling interest. It also requires disclosure, on the face of the consolidated income statement, of the amounts of consolidated net income attributable to the parent and to the noncontrolling interest. SFAS No. 160 is effective for financial statements issued for fiscal years, and interim periods within those fiscal years, beginning after December 15, 2008. The effect of adopting SFAS No. 160 is not expected to have an effect on our reported financial position or earnings.
In March 2008, the FASB issued Statement No. 161 —"Disclosures about Derivative Instruments and Hedging Activities" — an Amendment of FASB Statement No. 133 ("SFAS No. 161"). This statement changes the disclosure requirements for derivative instruments and hedging activities. Entities are required to provide enhanced disclosures about (i) how and why an entity uses derivative instruments, (ii) how derivative instruments and related hedged items are accounted for under FASB Statement No. 133 and its related interpretations, and (iii) how derivative instruments and related hedged items affect an entity's financial position, financial performance, and cash flows. SFAS No. 161 is effective for annual periods beginning after November 15, 2008. We are currently assessing the effect, if any, the adoption of SFAS No. 161 will have on our financial statements and related disclosures.
In May 2008, the FASB issued Statement No. 162 —"The Hierarchy of Generally Accepted Accounting Principles ("SFAS No. 162"). The new standard is intended to improve financial reporting by identifying a consistent framework, or hierarchy, for selecting accounting principles to be used in preparing financial statements that are presented in conformity with U.S. generally accepted accounting principles for nongovernmental entities. SFAS No. 162 will be effective 60 days following the SEC's approval of the Public Company Accounting Oversight Board Auditing amendments to AU Section 411,The Meaning of Present Fairly in Conformity with Generally Accepted Accounting Principles. We are currently assessing the effect, if any, the adoption of SFAS No. 162 will have on our financial statements and related disclosures.
F-15
Table of Contents
TOREADOR RESOURCES CORPORATION
NOTES TO CONSOLIDATED FINANCIAL STATEMENTS — (Continued)
On December 31, 2008 the Securities and Exchange Commission ("SEC") issued the final rule, "Modernization of Oil and Gas Reporting" ("Final Reporting Rule"). The Final Reporting Rule adopts revisions to the SEC's oil and gas reporting disclosure requirements and is effective for annual reports on Forms 10-K for years ending on or after December 31, 2009. The revisions are intended to provide investors with a more meaningful and comprehensive understanding of oil and gas reserves to help investors evaluate their investments in oil and gas companies. The amendments are also designed to modernize the oil and gas disclosure requirements to align them with current practices and changes in technology. Revised requirements in the Final Reporting Rule include, but are not limited to:
- •
- Oil and gas reserves must be reported using the un-weighted arithmetic average of the first day of the month price for each month within a 12 month period, rather than year-end prices;
- •
- Companies will be allowed to report, on an optional basis, probable and possible reserves;
- •
- Non-traditional reserves, such as oil and gas extracted from coal and shales, will be included in the definition of "oil and gas producing activities;"
- •
- Companies will be permitted to use new technologies to determine proved reserves, as long as those technologies have been demonstrated empirically to lead to reliable conclusions with respect to reserve volumes;
- •
- Companies will be required to disclose, in narrative form, additional details on their proved undeveloped reserves ("PUDs"), including the total quantity of PUDs at year end, and any material changes to PUDs that occurred during the year, investments and progress made to convert PUDs to developed oil and gas reserves and an explanation of the reasons why material concentrations of PUDs in individual fields or countries have remained undeveloped for five years or more after disclosure as PUDs; and
- •
- Companies will be required to report the qualifications and measures taken to assure the independence and objectivity of any business entity or employee primarily responsible for preparing or auditing reserve estimates.
We are currently evaluating the potential impact of adopting the Final Reporting Rule. The SEC is discussing the Final Reporting Rule with the FASB staff to align FASB accounting standards with the new SEC rules. These discussions may delay the required compliance date. Absent any change in the effective date, we will comply with the disclosure requirements in our annual report on Form 10-K for the year ended December 31, 2009.
In November 2008, the FASB ratified EITF 08-6, "Equity Method Investment Accounting Considerations" (EITF08-6") which clarifies how to account for certain transactions involving equity method investments. The initial measurement, decreases in value and changes in the level of ownership of the equity method investment are addressed. EITF 08-6 is effective on a prospective basis for our fiscal year beginning January 1, 2009 and interim periods within the years. Early application by an entity that has previously adopted an alternative accounting policy is not permitted. Adoption is not expected to have a significant impact on our consolidated results of operations or cash flows.
In May 2008, the FASB issued FASB Staff Position ("FSP") No. APB 14-1, "Accounting for Convertible Debt Instruments That May Be Settled in Cash Upon Conversion (Including Partial Cash Settlement)" ("FSP APB No. 14-1"). FSP APB No. 14-1 specifies that issuers of such instruments should separately account for the liability and equity components in a manner that will reflect the entity's nonconvertible debt borrowing rate when interest costs are recognized in subsequent periods. FSP APB No. 14-1 is effective for financial statements issued for fiscal years beginning after December 15, 2008 and interim periods within those fiscal years. FSP ABP No. 14-1 should be applied retrospectively for all periods presented. The Company is currently evaluating what impact the adoption of this pronouncement will have on its consolidated financial statements.
F-16
Table of Contents
TOREADOR RESOURCES CORPORATION
NOTES TO CONSOLIDATED FINANCIAL STATEMENTS — (Continued)
NOTE 3 — EARNINGS PER SHARE
In accordance with the provisions of FASB Statement of Financial Accounting Standards No. 128,"Earnings per Share" ("Statement 128"), basic earnings per share are computed on the basis of the weighted-average number of common shares outstanding during the periods. Diluted earnings per share are computed based upon the weighted-average number of common shares plus the assumed issuance of common shares for all potentially dilutive securities.
| | | | | | | | | | | | | | | |
| | Year ended December 31, | |
|---|
| | 2008 | | 2007 | | 2006 | |
|---|
| | (in thousands, except per share data)
| |
|---|
Basic earnings (loss) per share: | | | | | | | | | | |
| | Numerator | | | | | | | | | | |
| | | Income (loss) from continuing operations, net of income tax | | $ | (108,583 | ) | $ | (81,466 | ) | $ | 1,475 | |
| | | Less: dividends on preferred shares | | | — | | | 162 | | | 162 | |
| | | | | | | | |
| | | Income (loss) from continuing operations, net of tax | | | (108,583 | ) | | (81,628 | ) | | 1,313 | |
| | | Income (loss) from discontinued operations, net of tax | | | (22 | ) | | 7,045 | | | 1,103 | |
| | | | | | | | |
| | | Income (loss) available to common shares | | $ | (108,605 | ) | $ | (74,583 | ) | $ | 2,416 | |
| | | | | | | | |
| | Denominator | | | | | | | | | | |
| | | Common shares outstanding | | | 19,831 | | | 18,358 | | | 15,527 | |
| | | Basic earnings (loss) available to common shares per share from: | | | | | | | | | | |
| | | | Continuing operations | | $ | (5.48 | ) | $ | (4.45 | ) | $ | 0.09 | |
| | | | Discontinued operations | | | — | | | 0.38 | | | 0.07 | |
| | | | | | | | |
| | | | Basic income (loss) per share | | $ | (5.48 | ) | $ | (4.07 | ) | $ | 0.16 | |
| | | | | | | | |
Diluted earnings (loss) per share: | | | | | | | | | | |
| | Numerator | | | | | | | | | | |
| | | Income (loss) from continuing operations, net of income tax | | $ | (108,583 | ) | $ | (81,466 | ) | $ | 1,475 | |
| | | Less: dividends on preferred shares | | | — | | | 162 | | | 162 | |
| | | | | | | | |
| | | Income (loss) from continuing operations, net of tax | | | (108,583 | ) | | (81,628 | ) | | 1,313 | |
| | | Income (loss) from discontinued operations, net of tax | | | (22 | ) | | 7,045 | | | 1,103 | |
| | | | | | | | |
| | $ | (108,605 | ) | $ | (74,583 | ) | $ | 2,416 | |
| | | | | | | | |
| | Denominator | | | | | | | | | | |
| | | Common shares outstanding | | | 19,831 | | | 18,358 | | | 15,527 | |
| | | | Stock options, restricted stock and warrants | | | — | (1) | | — | (1) | | 357 | |
| | | Conversion of preferred shares | | | — | (2) | | — | (2) | | — | (2) |
| | | Conversion of 5.0% notes payable | | | — | (3) | | — | (3) | | — | (3) |
| | | | | | | | |
| | | | Diluted shares outstanding | | | 19,831 | | | 18,358 | | | 15,884 | |
| | | | | | | | |
| | | | Diluted earnings (loss) available to common shares per share from: | | | | | | | | | | |
| | | | | | Continuing operations | | $ | (5.48 | ) | $ | (4.45 | ) | $ | 0.08 | |
| | | | | | Discontinued operations | | | — | | | 0.38 | | | 0.07 | |
| | | | | | | | |
| | | | | | Diluted income (loss) per share | | $ | (5.48 | ) | $ | (4.07 | ) | $ | 0.15 | |
| | | | | | | | |
| | | Anti-dilutive securities not included above are as follows: | | | | | | | | | | |
| | | | | Stock options, restricted stock and warrants | | | 25 | | | 148 | | | — | |
| | | | | Preferred shares | | | — | | | 450 | | | 450 | |
| | | | | Debentures | | | — | | | — | | | 26 | |
| | | | | 5% notes payable(3) | | | 1,966 | | | 2,015 | | | 2,015 | |
- (1)
- Conversion of these securities would be antidilutive; therefore, there are no dilutive shares.
- (2)
- Conversion of these securities would be antidilutive; therefore there are no dilutive shares. These securities were converted on or prior to December 31, 2007.
- (3)
- Conversion of the 5% Senior Convertible Notes would be antidilutive therefore, there are no dilutive shares.
F-17
Table of Contents
TOREADOR RESOURCES CORPORATION
NOTES TO CONSOLIDATED FINANCIAL STATEMENTS — (Continued)
NOTE 4 — ACCOUNTS RECEIVABLE
Accounts receivable consisted of the following:
| | | | | | | |
| | December 31, | |
|---|
| | 2008 | | 2007 | |
|---|
| | (in thousands)
| |
|---|
Accrued oil and natural gas sales receivables, net of allowance of $220 and $120 | | $ | 3,726 | | $ | 3,154 | |
Trade receivables | | | 29 | | | 2,182 | |
Joint interest billing | | | 65 | | | 2,163 | |
Recoverable VAT | | | 1,219 | | | 4,221 | |
Other accounts receivable | | | 411 | | | 620 | |
| | | | | | |
| | $ | 5,450 | | $ | 12,340 | |
| | | | | | |
Accrued oil and natural gas sales receivables are due from either purchasers of oil and gas or operators in oil and natural gas wells for which the Company owns an interest. Oil and natural gas sales are generally unsecured and such amounts are generally due within 30 days after the month of sale.
Trade receivables and joint interest billings are the amounts due from our joint interest partners and amounts due from contractors where we have paid for supplies on their behalf. These receivables are generally due within 15 days after receipt of monthly joint interest billing or they are offset against invoices from contractors when billed.
Other receivables and VAT at December 31, 2008 and 2007 consist of accrued interest receivable on time deposits, value added tax refunds and travel advances to employees.
NOTE 5 — OIL AND NATURAL GAS PROPERTIES
Oil and Natural Gas Properties consist of the following:
| | | | | | | |
| | December 31, | |
|---|
| | 2008 | | 2007 | |
|---|
| | (in thousands)
| |
|---|
Licenses and concessions | | $ | 1,134 | | $ | 3,591 | |
Non-producing leaseholds | | | 18,306 | | | 184,067 | |
Producing leaseholds and intangible drilling costs | | | 244,167 | | | 154,437 | |
Furniture, fixtures and office equipment | | | 3,479 | | | 3,370 | |
| | | | | | |
| | | 267,086 | | | 345,465 | |
Accumulated depreciation, depletion and amortization | | | (157,375 | ) | | (73,514 | ) |
| | | | | | |
Total oil and natural gas properties | | $ | 109,711 | | $ | 271,951 | |
| | | | | | |
F-18
Table of Contents
TOREADOR RESOURCES CORPORATION
NOTES TO CONSOLIDATED FINANCIAL STATEMENTS — (Continued)
The Company capitalizes exploratory well costs until a determination is made that the well has found proved reserves or is deemed noncommercial, in the latter case the well costs are immediately charged to exploration expense.
| | | | | | | |
| | December 31 | |
|---|
| | 2008 | | 2007 | |
|---|
| | (in thousands)
| |
|---|
Capitalized exploratory well cost, beginning of the year | | $ | 17,109 | | $ | 5,256 | |
Additions to capitalized exploratory costs pending determination of proved reserves | | | 377 | | | 17,109 | |
Reclassified to dry hole costs | | | — | | | (5,256 | ) |
Reclassified to assets held for sale | | | (12,728 | ) | | — | |
Impairments | | | (2,441 | ) | | — | |
| | | | | | |
Capitalized exploratory well costs, end of year | | $ | 2,317 | | $ | 17,109 | |
| | | | | | |
The following table provides an aging of capitalized exploratory well costs (suspended well costs), as of December 31, of each year, based on the date the drilling was completed:
| | | | | | | |
| | December 31 | |
|---|
| | 2008 | | 2007 | |
|---|
| | (in thousands)
| |
|---|
Capitalized exploratory well cost that have been capitalized for a period of one year or less | | $ | — | | $ | 17,109 | |
Capitalized exploratory well costs that have been capitalized for a period greater than one year | | | 2,317 | | | — | |
| | | | | | |
Balance at end of year | | $ | 2,317 | | $ | 17,109 | |
| | | | | | |
The amount of exploratory well costs that have been capitalized for a period greater than one year include two wells drilled in 2007 that were drilled to test the outer limits of the shallow water wells drilled and currently on production in the Black Sea, offshore Turkey. The current operational plan calls for sub-sea completions and connection to an existing platform in late 2009 or early 2010.
NOTE 6 — INVESTMENTS IN UNCONSOLIDATED ENTITIES
In February 2004, we acquired 45% of ePsolutions. Based in Austin, Texas, ePsolutions is a software and energy services company in the electric industry and deregulated energy markets. ePsolutions is the developer of emPower system, a CIS, EDI and billing solution for energy companies within deregulated energy markets. We recorded equity in the earnings of ePsolutions of a gain of $41,000 in 2007 and a loss of $70,000 in 2006. In April 2007, we sold our interest in ePsolutions to ePsolutions for $3.4 million in cash and 50,000 shares of preferred stock with a value of $10.00 per share and recorded a gain on the sale of $2.3 million.
In June 2008 due to the rising cost of electricity and the deterioration of the deregulated electric market in Texas we reduced the carrying value of our investment by $300,000. We believe this more accurately reflects the current value of this investment.
F-19
Table of Contents
TOREADOR RESOURCES CORPORATION
NOTES TO CONSOLIDATED FINANCIAL STATEMENTS — (Continued)
In July 2000, we acquired 35% of EnergyNet.com, Inc. ("EnergyNet"), an Internet based oil and natural gas property auction company. We recorded equity in the earnings of EnergyNet of a loss of $45,000 in 2007 and a gain of $340,000 in 2006. We received a dividend from EnergyNet of $175,000 in 2006. In April 2007, we sold our interest in EnergyNet.com to EnergyNet.com for $2 million and recorded a gain on the sale of $1.1 million.
In April 2000, we acquired a 50% interest in Capstone Royalty, LLC ("Capstone"), a joint venture formed to acquire mineral interests at county auctions in west Texas and develop those interests. We recorded equity in the earnings of Capstone amounting to $26,000 in 2007 and $131,000 in 2006. We received a distribution from Capstone of $60,000 in 2007 and $75,000 in 2006. In April 2007, we sold our interest in Capstone Royalty, LLC to Capstone Royalty, LLC for $250,000 and recorded a gain on the sale of $124,000.
NOTE 7 — LONG-TERM DEBT
Long-term debt consisted of the following:
| | | | | | | |
| | December 31, | |
|---|
| | 2008 | | 2007 | |
|---|
| | (in thousands)
| |
|---|
Secured revolving facility with the International Finance Corporation | | $ | 30,000 | | $ | 30,000 | |
Convertible senior notes | | | 80,275 | | | 86,250 | |
| | | | | | |
| | | 110,275 | | | 116,250 | |
Less: current portion | | | (30,000 | ) | | — | |
| | | | | | |
| | $ | 80,275 | | $ | 116,250 | |
| | | | | | |
CONVERTIBLE SENIOR NOTES DUE OCTOBER 1, 2025
On September 27, 2005, we issued $75 million of Convertible Senior Notes due October 1, 2025 ("Notes") to qualified institutional buyers pursuant to Rule 144A of the Securities Act of 1933. The Company also granted the initial purchasers the option to purchase an additional $11.25 million aggregate principal amount of Notes to cover over-allotments. The option was exercised on September 30, 2005. The total principal amount of Notes issued was $86.25 million and total net proceeds were approximately $82.2 million. We incurred approximately $4.1 million of costs associated with the issuance of the Notes; these costs have been recorded in other assets on the balance sheet and are being amortized to interest expense using the straight-line interest rate method over the term of the Notes.
The net proceeds were used for general corporate purposes, including funding a portion of the Company's 2005 and 2006 exploration and development activities.
The Notes bear interest at a rate of 5% per annum and can be converted into common stock at an initial conversion rate of 23.3596 shares of common stock per $1,000 principal amount of Notes, subject to adjustment in an event of a fundamental change, as defined, (equivalent to a conversion price of approximately $42.81 per share). The Company may redeem the Notes, in whole or in part, on or after October 6, 2008, and prior to October 1, 2010, for cash at a redemption price equal to 100% of the principal amount of Notes to be redeemed, plus any accrued and unpaid interest, if the closing price of its common stock exceeds 130% of the conversion price over a specified period. On or after October 1, 2010, the Company may redeem the Notes, in whole or in part, at a redemption price equal to 100% of the principal amount of Notes to be redeemed, plus any accrued and unpaid interest, irrespective of the price
F-20
Table of Contents
TOREADOR RESOURCES CORPORATION
NOTES TO CONSOLIDATED FINANCIAL STATEMENTS — (Continued)
of our common stock. Holders may convert their Notes at any time prior to the close of business on the business day immediately preceding their stated maturity, and holders may, (i) upon the occurrence of certain fundamental changes, and also (ii) on October 1, 2010, October 1, 2015, and October 1, 2020, require the Company to repurchase all or a portion of their Notes for cash in an amount equal to 100% of the principal amount of such Notes, plus any accrued and unpaid interest. At December 31, 2008, the outstanding principal amount of the Notes was $80.3 million.
Due to our restating the consolidated financial statements for the years ended December 31, 2003, 2004 and 2005 and our consolidated financial statements for each of the quarters ended March 31 and June 30, 2006, we did not provide the trustee under the indenture of the Notes with copies of our annual reports, information, documents and other reports that we are required to file with the Securities and Exchange Commission pursuant to Section 13 or 15(d) of the Securities Exchange Act of 1934 within thirty (30) days of when such reports were required to be filed with the Securities and Exchange Commission.
On December 15, 2006, we received a notice from the trustee for failure to provide the trustee with a copy of our Form 10-Q for the nine month period ended September 30, 2006. Since we cured the covenant default within thirty (30) days after receiving the written notice from the trustee, an event of default did not occur.
The registration rights agreement covering the Notes provided for a penalty if the registration statement was filed and declared effective but thereafter ceased to be effective (a "Suspension Period") for an aggregate of forty-five (45) days in any three month period or ninety (90) days in any twelve month period (an "Event Date"). Such penalty called for an additional 0.25% per annum in interest expense on the aggregate principal amount of the Notes for the first ninety (90) days following an Event Date and an additional 0.50% per annum in interest expense on the aggregate principal amount of the Notes thereafter, until such Suspension Period ended upon the registration statement again becoming effective or not being required to be effective pursuant to the registration rights agreement. Because we did not file our Quarterly Report on Form 10-Q for the nine month period ended September 30, 2006 in a timely manner, the registration statement for the Notes became ineffective and we entered a Suspension Period on November 15, 2006. Such Suspension Period ended on January 23, 2007 when we provided notice that the Form 10-Q had been filed and the Suspension Period was no longer in effect. Because the Suspension Period exceeded forty-five (45) days in any three month period, we paid approximately $14,375 in additional interest expense. On March 16, 2007, the date we filed our Form 10-K for the year ended December 31, 2006, we again entered a Suspension Period until all the Notes became eligible for sale pursuant to Rule 144(k) on September 30, 2007. On October 1, 2007, $155,000 was deposited with the trustee for the Notes as the penalty for any holders of the Notes who were eligible on October 1, 2007 to receive a pro rata portion of such payment. Such eligible holders had to have registered their Notes on the registration statement and still held those Notes on October 1, 2007. On April 1, 2008, we requested that the trustee return $150,957 which represents the unclaimed portion of the penalty and on April 3, 2008 we received the funds from the trustee. During the year we paid $4,043 of the penalty deposit to eligible holders of Notes.
On July 9, 2008, our Board of Directors authorized a program to repurchase up to $10 million of the Notes by December 31, 2008. During this period, we repurchased $6 million of the Notes for $5.3 million plus accrued interest of $109,347. Additionally, we expensed $241,965 of prepaid loan fees attributable to the repurchased notes. This resulted in a $458,535 gain on the early extinguishment of debt. The repurchases were made in the open market, or in privately negotiated transactions, subject to market conditions, applicable legal requirements and other factors.
F-21
Table of Contents
TOREADOR RESOURCES CORPORATION
NOTES TO CONSOLIDATED FINANCIAL STATEMENTS — (Continued)
On December 28, 2006, we guaranteed the obligations of certain of our direct and indirect subsidiaries in a loan and guarantee agreement with the International Finance Corporation. The loan and guarantee agreement provides for the $25 million loan facility which is a secured revolving facility with a maximum facility amount of $25 million which maximum facility amount would have increased to $40 million when the projected total borrowing base amount exceeded $50 million. The $25 million facility was funded on March 2, 2007. The total proceeds received on March 2, 2007 were approximately $25 million, of which $11 million was used to retire the outstanding balance on the $15 million credit facility with Natixis Banques Populaires and the remaining $14 million of funds was used to finance our capital expenditures in Turkey and Romania. The loan and guarantee agreement also provided for a $10 million facility which was funded on December 28, 2006. In September 2007, we repaid $5 million on the $25 million facility from proceeds received on the U.S. oil and gas property sale. As of December 31, 2007, the International Finance Corporation reduced our borrowing base under both loans to $30 million from $35 million. Both the $25 million facility and $10 million facility were to fund our operations in Turkey and Romania.
Interest accrued on any loans under the $25 million facility at a rate of 2% over the six month LIBOR rate. Interest accrued on the $10 million facility at a rate of 1.5% over the six month LIBOR rate until the $25 million facility was funded after which the rate for the $10 million facility was lowered to 0.5% over the six month LIBOR rate. At December 31, 2008, the interest rate on the $10 million facility was 2.823% and the interest rate on the $25 million facility was 4.323%. Interest was to be paid on each June 15 and December 15.
The $25 million facility was secured as follows: (i) the lender has a first ranking security interest in (a) certain proceeds, receivables and contract rights relating to and from the sale of oil or gas production in France, Turkey and Romania and (b) funds held in certain bank accounts; (ii) the lender had an assignment of all rights and claims to any compensation or other special payments in respect of all concessions other than those arising in the normal course of operations payable by the government of Turkey and Romania; and (iii) the lender has a first ranking pledge (a) by Toreador International Holding, LLC of all its shares in the borrowers; (b) by Madison Oil France SAS of all its shares in Toreador France; and (c) by the Company of all its shares in Toreador International Holding, LLC.
On December 31, 2011, the maximum amount available under the $25 million facility would have begun to decrease by $5 million every six months from $40 million (assuming the projected borrowing base amount exceeds $50 million) until the final portion of the $25 million facility would have been due on December 15, 2014. On December 15, 2014, $5 million of the $10 million facility would have been required to be repaid with the remaining $5 million being due on June 15, 2015.
We were required to meet the following ratios on a consolidated basis: (i) the life of loan coverage ratio of not less than: (a) 1.2:1.0 in 2006 and 2007; (b) 1.3:1.0 in 2008; and (c) 1.4:1.0 in 2009 and each subsequent year thereafter; (ii) reserve tail ratio of not less than 25%; (iii) adjusted financial debt to EBITDAX (earnings before interest, taxes, depreciation and amortization and exploration expenses) ratio of not more than 3.0:1.0; (iv) liabilities to tangible net worth ratio of not more than 60:40; and (v) interest coverage ratio of not less than 3.0:1.0. On August 9, 2007, the ratios were amended to replace the adjusted financial debt to EBITDA ratio not being more than 3.0:1.0 with the adjusted financial debt to EBITDAX ratio not being more than 3.0:1.0 and the definition of interest coverage ratio was adjusted to substitute EBITDAX instead of EBITDA for calculation purposes. At December 31, 2007, we were not in compliance with the interest coverage ratio of not less than 3.0:1.0; the actual ratio was 2.8:1.0. The International Finance Corporation granted the Company a temporary waiver for the interest coverage ratio provided the Company maintained EBITDAX to net interest expense ratio of 2.7:1.0 until July 2,
F-22
Table of Contents
TOREADOR RESOURCES CORPORATION
NOTES TO CONSOLIDATED FINANCIAL STATEMENTS — (Continued)
2008 and EBITDA to net interest expense ratio of at least 2.7:1.0 during the remaining period of the waiver's effectiveness. The waiver was effective until March 8, 2009.
At March 31, 2008, we were not in compliance with the adjusted financial debt to EBITDAX ratio threshold of not more than 3.0:1.0; the actual ratio was 4.5:1.00. The International Finance Corporation granted the Company a temporary waiver on the condition that the Company maintains the adjusted financial debt to EBITDA ratio for the (i) quarter ending March 31, 2008 of 4.5:1.0; (ii) quarter ending June 30, 2008 of 4.0:1.0; (iii) quarter ending September 30, 2008 of 3.5:1.0, and (iv) quarter ending December 31, 2008 of 3.25:1.0. We must also be compliant with the original requirement of adjusted financial debt to EBITDA of not more than 3.0:1.0 starting from the end of the first quarter ending March 31, 2009. The waiver is effective until April 1, 2009.
At December 31, 2008, we were not in compliance with the liabilities to tangible net worth ratio of not more than 60:40, however we did not request a waiver from the IFC as the facility was subsequently retired on March 3, 2009 as explained below.
We were subject to certain negative covenants, including, but not limited to, the following: (i) subject to certain exceptions, paying dividends; (ii) subject to certain exceptions, incurring debt, making guarantees or creating or permitting to exist any liens, (iii) subject to certain exceptions, making or permitting to exist loans or advances to, or deposits, with other persons or investments in any person or enterprise; (iv) subject to certain exceptions, selling, transferring, leasing or otherwise disposing of all or a material part of our borrowing base assets; and (v) subject to certain exceptions, undertaking or permitting any merger, spin-off, consolidation or reorganization.
Included in interest expense for the year ended December 31, 2008, is $701,625 of additional compensation due to the IFC related to the prior year. This amount should have been recognized as additional interest expense in the prior year. Management does not believe the error had a material effect on the financial results for the year ended December 31, 2007 or that the correction of the error in the current period will have a material effect on the financial results for the year ended December 31, 2008. Also included in interest expense for the year ended December 31, 2008 is an estimate of $2.1 million to be paid in 2009 relating to 2008 operations.
On March 3, 2009, we repaid the facility with the International Finance Corporation with the proceeds from our sale of 26.75% of our 36.75% interest in the Black Sea Project. The total amount of the payment was $36.4 million, which was comprised of $30 million principal, $5.9 million additional compensation, as defined in the Loan and Guarantee Agreement among Toreador Resources Corporation and the International Finance Corporation dated December 28, 2006, due under the $10 million facility and $500,000 for accrued interest and fees.
The following table summarizes the principal maturities under our long-term debt arrangements at December 31, 2008, (in thousands):
| | | | | | | | | | | | | | | | | | | | | | |
| | 2009 | | 2010 | | 2011 | | 2012 | | 2013 | | Thereafter | | Total | |
|---|
Long-term debt | | $ | 30,000 | | $ | — | | $ | — | | $ | — | | $ | — | | $ | 80,275 | | $ | 110,275 | |
| | | | | | | | | | | | | | | | |
NOTE 8 — CAPITAL
On March 23, 2007, we closed a $45 million private placement of equity. In the transaction, we issued an aggregate of 2,710,843 shares of common stock to six institutional investors, providing us with $45 million of gross proceeds at closing. We also granted the investors the right to purchase an additional $8.1 million aggregate amount of common stock within the next 30-day period. On April 24, 2007, two of
F-23
Table of Contents
TOREADOR RESOURCES CORPORATION
NOTES TO CONSOLIDATED FINANCIAL STATEMENTS — (Continued)
the institutional investors exercised their warrants for an aggregate of 326,104 additional shares of common stock, providing us with approximately $5.4 million of gross proceeds. The net proceeds from the private placement totaled approximately $47 million and were used to help fund our 2007 exploration and development activities.
In connection with the private placement, we entered into a registration rights agreement with the investors. The registration rights agreement provided that we would file a registration statement with the Securities and Exchange Commission covering the resale of the common stock within 60 days after the closing date. If the registration statement was not filed with the Securities and Exchange Commission within such time, we had to pay 1.0% of the aggregate purchase price, an additional 1.0% on the one month anniversary of the 60th day after closing if the registration statement had not been filed by such date and an additional 2.0% of the aggregate purchase price for each 30 day period after the one month anniversary if the registration statement was not filed by such date. We filed the registration statement with the Securities and Exchange Commission on May 8, 2007. If the registration statement was not declared effective by the Securities and Exchange Commission within 150 days after the closing date, we had to pay 1.0% of the aggregate purchase price, an additional 1.0% on the one month anniversary of the 150th day after the closing if the registration statement had not been declared effective by the Securities and Exchange Commission by such date and an additional 2.0% of the aggregate purchase price for each 30 day period after the one month anniversary if the registration statement was not declared effective by such date. The registration statement was declared effective July 26, 2007. Now that the registration statement has been declared effective by the Securities and Exchange Commission, if, subject to certain exceptions, future sales cannot be made pursuant to the registration statement after 60 days has elapsed, we must pay 1.0% of the aggregate purchase price on the date sales cannot be made pursuant to the registration statement, an additional 1% on the one month anniversary of the date sales are not permitted under the registration statement if sales are not permitted under the registration statement by such date and an additional 2.0% of the aggregate purchase price for each 30 day period after the one month anniversary if sales under the registration statement are not permitted by such date. Any one month or 30 day periods during which we cure the violation will cause the payment for such period to be made on a pro rata basis. As a result of the change in the resale restrictions under Rule 144, effective February 15, 2008, we amended the registration rights agreement to provide that we do not have to keep the registration statement effective if the holders of the shares covered by the registration rights agreement can sell all of the shares pursuant to Rule 144.
We account for registration rights agreements containing a contingent obligation to make future payments or otherwise transfer consideration under a registration payment arrangement, in accordance withEITF Issue No. 00-19-2, "Accounting for Registration Payment Arrangements". Under this approach, the contingent obligation to make future payments or otherwise transfer consideration under a registration payment arrangement shall be recognized and measured separately in accordance with"FAS No. 5, Accounting for Contingencies" and "FASB Interpretation No. 14, Reasonable Estimation of the Amount of a Loss".
Toreador had zero shares of nonvoting Series A-1 Convertible Preferred Stock outstanding at December 31, 2008 and 2007. At the option of the holder, the Series A-1 Convertible Preferred Stock were convertible into common shares at a price of $4.00 per common share (conversion would amount to 450,000 Toreador common shares at December 31, 2007). The Series A-1 Convertible Preferred Stock accrues dividends at an annual rate of $2.25 per share payable quarterly in cash. At any time on or after November 1, 2007, we could elect to redeem for cash any or all shares of Series A-1 Convertible Preferred Stock. The optional redemption price per share was the sum of (1) $25.00 per share of the Series A-1 Convertible Preferred Stock plus (2) any accrued unpaid dividends, and such sum was multiplied by a declining multiplier. The multiplier was 105% until October 31, 2008, 104% until October 31, 2009, 103%
F-24
Table of Contents
TOREADOR RESOURCES CORPORATION
NOTES TO CONSOLIDATED FINANCIAL STATEMENTS — (Continued)
until October 31, 2010, 102% until October 31, 2011, 101% until October 31, 2012, and 100% thereafter. In December 2007, all the Series A-1 Convertible Preferred Stock was converted into common shares.
On July 22, 2004, we issued warrants for the purchase of 40,000 shares of our common stock at $8.20 per share. The warrant was issued pursuant to the terms of the letter agreement dated July 19, 2004. At December 31, 2008 there were 36,400 warrants outstanding all of which expire on July 22, 2009. We recognized $58,410 in expense relating to the issuance of the warrants.
On July 11, 2005, we issued warrants for the purchase of 50,000 shares of our common stock at $27.40 per share. The warrants were issued pursuant to the terms of the Fee Letter, dated February 21, 2005, between the Company, Natexis Banques Populaires and Madison Energy France. At December 31, 2008 all 50,000 warrants were outstanding and expire on December 23, 2009. In 2006, we recognized $836,000 in expense relating to the issuance of the warrants.
On January 3, 2006, we issued warrants for the purchase of 10,000 shares of our common stock at $27.65 per share. The warrant was issued pursuant to the terms of the Engagement Letter, dated January 3, 2006, between the Company and ParCon Consulting. At December 31, 2008 all 10,000 warrants were outstanding and expire on January 3, 2011. We recognized $106,800 of expense in 2006 relating to the issuance of the warrants.
NOTE 9 — INCOME TAXES
The Company's provision (benefit) for income taxes consists of the following at December 31:
| | | | | | | | | | | | |
| | 2008 | | 2007 | | 2006 | |
|---|
| | (in thousands)
| |
|---|
Current: | | | | | | | | | | |
| | U.S. Federal | | $ | (5 | ) | $ | (31 | ) | $ | (581 | ) |
| | U.S. State | | | (115 | ) | | 323 | | | (7 | ) |
| | Foreign | | | 7,526 | | | 2,409 | | | 1,156 | |
Deferred: | | | | | | | | | | |
| | U.S. Federal | | | (443 | ) | | (32 | ) | | 135 | |
| | Foreign | | | (887 | ) | | (3,393 | ) | | 2,944 | |
| | | | | | | | |
| | $ | 6,076 | | $ | (724 | ) | $ | 3,647 | |
| | | | | | | | |
The tax provision (benefit) has been allocated between continuing operations and discontinued operations as follows: | | | | | | | | | | |
Provision (benefit) allocated to: | | | | | | | | | | |
| | | Continuing operations | | $ | 6,076 | | $ | (4,676 | ) | $ | 3,005 | |
| | | Discontinued operations | | | — | | | 3,952 | | | 642 | |
| | | | | | | | |
| | $ | 6,076 | | $ | (724 | ) | $ | 3,647 | |
| | | | | | | | |
F-25
Table of Contents
TOREADOR RESOURCES CORPORATION
NOTES TO CONSOLIDATED FINANCIAL STATEMENTS — (Continued)
The primary reasons for the difference between tax expense at the statutory federal income tax rate and our provision for income taxes were:
| | | | | | | | | | |
| | 2008 | | 2007 | | 2006 | |
|---|
| | (in thousands)
| |
|---|
Statutory tax at 34% | | $ | (34,860 | ) | $ | (25,549 | ) | $ | 2,113 | |
Rate differences related to foreign operations | | | 13,706 | | | 6,479 | | | 584 | |
Use of NOL carryforwards | | | — | | | — | | | (121 | ) |
Reduction in Turkish net operating loss | | | — | | | — | | | 143 | |
State income tax, net | | | (76 | ) | | 213 | | | (5 | ) |
Foreign currency gain (loss) not taxable in foreign jurisdictions | | | 498 | | | 4,497 | | | 265 | |
Effect of rate changes in foreign countries | | | — | | | — | | | (1,062 | ) |
Adjustments to valuation allowance | | | 26,440 | | | 14,172 | | | 1,846 | |
Other | | | 368 | | | (536 | ) | | (116 | ) |
| | | | | | | | |
| | $ | 6,076 | | $ | (724 | ) | $ | 3,647 | |
| | | | | | | | |
F-26
Table of Contents
TOREADOR RESOURCES CORPORATION
NOTES TO CONSOLIDATED FINANCIAL STATEMENTS — (Continued)
The tax effects of temporary differences that give rise to significant portions of the deferred tax assets and deferred tax liabilities as of December 31, 2008 and 2007 were as follows:
| | | | | | | | | | |
| | December 31, | |
|---|
| | 2008 | | 2007 | |
|---|
| | (in thousands)
| |
|---|
Deferred tax assets: | | | | | | | |
| | Net operating loss carryforward — United States | | $ | 15,005 | | $ | 8,620 | |
| | Net operating loss carryforward — State | | | 135 | | | 135 | |
| | Net operating loss carryforward — Foreign | | | 9,617 | | | 12,265 | |
| | Restricted stock | | | 565 | | | 689 | |
| | Impairment — Foreign | | | 16,468 | | | 4,571 | |
| | Impairment — US | | | 5,453 | | | — | |
| | Other | | | 690 | | | 475 | |
| | | | | | |
| | | Gross deferred tax assets | | | 47,933 | | | 26,755 | |
| | Valuation allowance | | | (46,984 | ) | | (20,900 | ) |
| | | | | | |
| | | Net deferred tax assets | | $ | 949 | | $ | 5,855 | |
| | | | | | |
Deferred tax liabilities: | | | | | | | |
| | Differences in oil and gas property capitalization and depletion methods — Foreign | | | (13,851 | ) | | (20,768 | ) |
Unrealized foreign currency translation gains | | | (949 | ) | | (455 | ) |
| | | | | | |
| | | Gross deferred tax liabilities | | | (14,800 | ) | | (21,223 | ) |
| | | | | | |
| | | | Net deferred tax liabilities | | $ | (13,851 | ) | $ | (15,368 | ) |
| | | | | | |
During 2008 the Company increased its tax valuation allowance by $26 million due to our expectation that tax benefits will not be realized in the future in the amount of $7 million related to U.S. operations and $19 million related to Turkish operations.
At December 31, 2008, Toreador had the following carryforwards available to reduce future taxable income (in thousands):
| | | | | | | |
Jurisdiction | | Expiry | | Amount | |
|---|
United States | | | 2010 — 2023 | | $ | 44,132 | |
Hungary | | | Unlimited | | | 38,656 | |
Turkey | | | 2008 — 2012 | | | 12,956 | |
France | | | Unlimited | | | 2,523 | |
Realization of net operating loss carryforwards depends on our ability to generate taxable income within the carryforward period. Due to uncertainty related to the Company's ability to generate taxable
F-27
Table of Contents
TOREADOR RESOURCES CORPORATION
NOTES TO CONSOLIDATED FINANCIAL STATEMENTS — (Continued)
income in the respective countries sufficient to realize all of our deferred tax assets we have recorded the following valuation allowances:
| | | | | | | |
| | December 31, | |
|---|
| | 2008 | | 2007 | |
|---|
| | (in thousands)
| |
|---|
United States | | $ | 15,005 | | $ | 8,755 | |
Turkey | | | 2,591 | | | — | |
Hungary | | | 6,185 | | | 6,024 | |
France | | | 841 | | | 841 | |
| | | | | | |
| | $ | 24,622 | | $ | 15,620 | |
| | | | | | |
Future net operating loss carryforwards for which a valuation allowance has been provided will be realized when taxable income amounts below are generated in the following countries:
| | | | |
| | Required
Taxable Income | |
|---|
United States | | $ | 44,132 | |
Turkey | | | 12,956 | |
Hungary | | | 38,656 | |
France | | | 2,523 | |
A portion of the Hungarian net operating loss was acquired in a purchase; therefore realization of $25 million of the Hungarian net operating loss will be credited to oil and natural gas properties rather than a credit to income tax expense.
Under APB 23,Accounting for Income Taxes — Special Areas, we have elected to treat our foreign earnings as permanently reinvested outside the US and are not providing US tax expense on those earnings. However, Romania and Turkey both have US branches which are not permanently reinvested outside the US. Consequently the US tax on their earnings is reflected in consolidated income tax expense at the US tax rate of 34%.
We adopted FIN No. 48,"Accounting for Uncertainty in Income Taxes" ("FIN No. 48") on January 1, 2007. As a result of the adoption the Company recognized an increase in the liability for unrecognized tax benefits of approximately $45,000, which was accounted for as a decrease to the January 1, 2007 balance of retained earnings. As of the date of adoption and after the impact of recognizing the increase in liability noted above, our unrecognized tax benefits totaled approximately $357,000, the disallowance of which would not materially affect the effective income tax rate. There are no tax positions for which a material change in the unrecognized tax benefit liability is reasonably possible in the next 12 months.
We recognize potential accrued interest and penalties related to unrecognized tax benefits within our global operations in income tax expense. In conjunction with the adoption of FIN No. 48, we recognized approximately $28,000 for the accrual of interest and penalties at January 1, 2007 which is included as a component of $357,000 unrecognized tax benefit noted above. During the year 2008 we recognized $0 in potential interest and penalties associated with uncertain tax positions. To the extent interest and penalties are not assessed with respect to uncertain tax positions, amounts accrued will be reduced and reflected as a reduction of the overall income tax provision.
F-28
Table of Contents
TOREADOR RESOURCES CORPORATION
NOTES TO CONSOLIDATED FINANCIAL STATEMENTS — (Continued)
The following table summarizes the changes in our liability for unrecognized tax benefits for the year ended December 31, 2008:
| | | | |
Unrecognized tax benefit at January 1, 2008 | | $ | 326 | |
Tax Year Closed | | | (5 | ) |
| | | | |
Unrecognized tax benefit at December 31, 2008 | | $ | 321 | |
| | | | |
We have not paid any significant interest or penalties associated with our income taxes, but classify both interest expense and penalties as part of our income tax expense.
The Company files several state and foreign tax returns, many of which remain open for examination for five years.
NOTE 10 — BENEFIT PLANS
We have a 401(k) retirement savings plan. Employees are eligible to defer portions of their salaries, limited by Internal Revenue Service regulations. The Company is subject to the 3% safe harbor rule and contributed $95,000 in 2008 and $115,000 in 2007. Discretionary employer matches are determined annually by the board of directors and such discretionary matches amounted to $0 in 2008, $112,500 in 2007 and $74,000 in 2006.
NOTE 11 — STOCK COMPENSATION PLANS
We have granted stock options to key employees and outside directors of Toreador as described below.
In May 1990, we adopted the 1990 Stock Option Plan ("1990 Plan"). The 1990 Plan, as amended and restated, provides for grants of up to 1,000,000 stock options to employees and directors at exercise prices greater than or equal to market on the date of the grant.
In December 2001, we adopted the 2002 Stock Option Plan ("2002 Plan"). The 2002 Plan provides for grants of up to 500,000 stock options to employees and outside directors at exercise prices greater than or equal to market on the date of the grant.
In September 1994, we adopted the 1994 Non-employee Director Stock Option Plan ("1994 Plan"). The 1994 Plan, as amended and restated, provides for grants of up to 500,000 stock options to non-employee directors of Toreador at exercise prices greater than or equal to market on the date of the grant.
The Board of Directors grants options under our plans periodically. Generally, option grants are exercisable in equal increments over a three-year period, and have a maximum term of 10 years.
F-29
Table of Contents
TOREADOR RESOURCES CORPORATION
NOTES TO CONSOLIDATED FINANCIAL STATEMENTS — (Continued)
A summary of stock option transactions is as follows:
| | | | | | | | | | | | | | | | | | | |
| | 2008 | | 2007 | | 2006 | |
|---|
| | Shares | | Weighted
Average
Exercise
Price | | Shares | | Weighted
Average
Exercise
Price | | Shares | | Weighted
Average
Exercise
Price | |
|---|
Outstanding at January 1 | | | 338,170 | | $ | 4.85 | | | 673,870 | | $ | 5.13 | | | 858,940 | | $ | 5.07 | |
Granted | | | 100,000 | | | 7.88 | | | — | | | — | | | — | | | — | |
Exercised | | | (189,800 | ) | | 3.93 | | | (320,700 | ) | | 5.06 | | | (175,070 | ) | | 4.95 | |
Forfeited | | | — | | | — | | | (15,000 | ) | | 13.18 | | | (10,000 | ) | | 3.10 | |
| | | | | | | | | | | | | | | | | |
Outstanding at December 31 | | | 248,370 | | | 6.77 | | | 338,170 | | | 4.85 | | | 673,870 | | | 5.13 | |
| | | | | | | | | | | | | | | | | |
Exercisable at December 31 | | | 148,370 | | | 6.02 | | | 334,837 | | | 4.73 | | | 660,536 | | | 4.90 | |
| | | | | | | | | | | | | | | | | |
The intrinsic value of the options exercised in 2008 was $979,609. For the year ended December 31, 2008, 2007 and 2006 we received cash from stock option exercises of $745,000, $1.6 million and $866,000, respectively. During 2008, 3,333 shares vested. As of December 31, 2008, the total compensation cost related to non-vested stock options not yet recognized is approximately $255,000. This amount will be recognized as compensation expense over the next 29 months.
For stock options granted the following table represents the weighted-average exercise prices and the weighted-average fair value based upon whether or not the exercise price of the option was greater than, less than or equal to the market price of the stock on the grant date:
| | | | | | | | | | | | | |
| Year | | Option Type | | Shares | | Weighted-
Average
Exercise
Price | | Weighted-
Average
Fair Value | |
|---|
| | 2008 | | Exercise price equal to market price | | | 100,000 | | $ | 7.88 | | $ | 3.61 | |
The option was valued using Black-Scholes, with an expected volatility of .666, expected life of three years and a risk free interest rate of 2.70%.
F-30
Table of Contents
TOREADOR RESOURCES CORPORATION
NOTES TO CONSOLIDATED FINANCIAL STATEMENTS — (Continued)
The following table summarizes information about the fixed price stock options outstanding at December 31, 2008:
| | | | | | | | | | | | | | | | |
| | Number Outstanding | | Number Exercisable | |
| |
|---|
| | Weighted Average
Remaining
Contractual
Life in Years | |
|---|
Exercise Price | | Shares | | Intrinsic
Value | | Shares | | Intrinsic
Value | |
|---|
| |
| | (in thousands)
| |
| | (in thousands)
| |
| |
|---|
$ 3.00 | | | 5,000 | | $ | 12 | | | 5,000 | | $ | 12 | | | 0.42 | |
3.10 | | | 20,000 | | | 48 | | | 20,000 | | | 48 | | | 4.47 | |
3.12 | | | 4,420 | | | 11 | | | 4,420 | | | 11 | | | 1.72 | |
3.88 | | | 5,000 | | | 8 | | | 5,000 | | | 8 | | | 0.82 | |
4.12 | | | 15,000 | | | 21 | | | 15,000 | | | 21 | | | 3.41 | |
4.96 | | | 10,000 | | | 5 | | | 10,000 | | | 5 | | | 5.39 | |
5.50 | | | 56,450 | | | (1 | ) | | 56,450 | | | (1 | ) | | 5.32 | |
5.95 | | | 15,000 | | | (7 | ) | | 15,000 | | | (7 | ) | | 2.38 | |
7.88 | | | 100,000 | | | (239 | ) | | — | | | — | | | 9.38 | |
13.75 | | | 7,500 | | | (62 | ) | | 7,500 | | | (62 | ) | | 5.88 | |
16.90 | | | 10,000 | | | (114 | ) | | 10,000 | | | (114 | ) | | 6.38 | |
| | | | | | | | | | | | | |
| | | 248,370 | | | (318 | ) | | 148,370 | | | (79 | ) | | 4.14 | |
| | | | | | | | | | | | | |
At December 31, 2008, there were 20,208, remaining shares available for grant under the plans collectively.
In May 2005, stockholders approved the Toreador Resources Corporation 2005 Long-Term Incentive Plan (the "Plan"). The Plan, as amended, authorizes the issuance of up to 750,000 shares of the Company's common stock to key employees, key consultants and outside directors of the Company. The Board of Directors has authorized a total of 314,184 shares of restricted stock be granted to employees and non-employee directors. The compensation cost is measured by the difference between the quoted market price of the stock at the date of grant and the price, if any, to be paid by an employee and is recognized as an expense over the period the recipient performs related services. The restricted stock grants vest over a one to four year period depending on the grant and the weighted average price of the stock on the date of the grants was $8.08 for the year ended December 31, 2008. Stock compensation expense of $2.3 million and $3.9 million is included in the Statement of Operations for the years ended December 31, 2008 and 2007, which represents the cost recognized from the date of the grants through December 31, 2008 and 2007. During 2008, 172,463 shares vested having a fair value of approximately $1.5 million on the date of vesting. As of December 31, 2008, the total compensation cost related to non-vested restricted stock grants not yet recognized is approximately $2 million. This amount will be recognized as compensation expense over the next 24 months.
For the years ended December 31, 2008 and 2007 we recognized a current tax benefit related to restricted stock grants of approximately $0 and $0 and a deferred tax benefit of approximately $443,000 and $1.3 million, respectively.
F-31
Table of Contents
TOREADOR RESOURCES CORPORATION
NOTES TO CONSOLIDATED FINANCIAL STATEMENTS — (Continued)
The following table summarizes the changes in outstanding restricted stock grants along with their related grant-date fair values for the year ended December 31, 2008:
| | | | | | | |
| | Shares | | Weighted Average
Grant-Date
Fair Value | |
|---|
Non-vested at January 1, 2008 | | | 222,599 | | $ | 25.91 | |
Shares granted | | | 314,184 | | | 8.08 | |
Shares vested | | | (172,465 | ) | | 16.56 | |
Shares forfeited | | | (86,094 | ) | | 26.38 | |
| | | | | | | |
Non-vested at December 31,2008 | | | 278,224 | | $ | 11.63 | |
| | | | | | | |
NOTE 12 — COMMITMENTS AND CONTINGENCIES
We lease our office space under non-cancelable operating leases that escalate annually, expiring during 2009 through 2014. The following is a schedule of minimum future rentals under our non-cancelable operating leases as of December 31, 2008 (in thousands):
| | | | |
2009 | | $ | 770 | |
2010 | | | 816 | |
2011 | | | 827 | |
2012 | | | 681 | |
2013 | | | 636 | |
Thereafter | | | 453 | |
| | | | |
| | $ | 4,183 | |
| | | | |
Net rent expense totaled $952,000 in 2008, $818,000 in 2007 and $699,000 in 2006.
Black Sea Incidents. In October 2005, in an incident involving a vessel owned by Micoperi Srl, the Ayazli 2 and Ayazli 3 wells were damaged, and subsequently had to be re-drilled. We and our co-venturers made a claim in respect of the cost of re-drilling and repeating flow-testing. The amount claimed was approximately $10.8 million before interest, subject to adjustment when the actual cost of flow-testing the re-drilled wells was known. In addition, we and our co-venturers claimed to recover back from Micoperi a sum of about $8.2 million paid to Micoperi under the contract between us, our co-venturers and Micoperi. Micoperi made a cross-claim for about $7.1 million in respect of sums allegedly due to Micoperi under the contract between us, our co-venturers and Micoperi. Micoperi also asserted a claim that the arrest of the vessel "MICOPERI 30" at Palermo, Italy was wrongful and asserted a claim for damages in respect of such allegedly wrongful arrest. We and our co-ventures received security from Micoperi by way of a letter of undertaking from their insurers, and provided security to Micoperi in respect of their cross-claims by way of a bank guarantee of $8.2 million. The claims and cross-claims were subject to the jurisdiction of the English Court; however, neither side commenced any court proceedings. All the amounts stated above are gross and our share was equal to 36.75%. Following mediation in London, an agreement was reached on November 14, 2008 between Toreador, our co-venturers and Micoperi, whereby a full settlement of all claims related to the 2005 incident were reached. The settlement's net proceeds to us were approximately $1.4 million and we were released of all cross-claims from Micoperi regarding the 2005 incident.
F-32
Table of Contents
TOREADOR RESOURCES CORPORATION
NOTES TO CONSOLIDATED FINANCIAL STATEMENTS — (Continued)
The Company has indemnified a third party vendor for any claims made related to this incident. However, the Company believes the possibility of a claim being asserted is remote.
In 2005, two separate incidents occurred offshore Turkey in the Black Sea, which resulted in the sinking of two caissions and the loss of three natural gas wells. The Company has not been requested to or ordered by any governmental or regulatory body to remove the caissions. Therefore, the Company believes that the likelihood of receiving such a request or order is remote and no liability has been recorded.
From time to time, we are named as a defendant in other legal proceedings arising in the normal course of business. In our opinion, the final judgment or settlement, if any, which may be awarded with any suit or claim would not have a material adverse effect on our financial position.
NOTE 13 — RELATED PARTY TRANSACTIONS
William I. Lee (deceased), was a former director of the Company and the majority owner of Wilco Properties, Inc ("Wilco"). The Company subleased office space to Wilco pursuant to a sub-lease agreement. We recorded reductions to rent expense totaling $0 in 2008, $25,000 in 2007 and $50,000 in 2006 related to the sublease with Wilco. We had an informal agreement with Wilco under which one of the two companies incurs, on behalf of the other, certain miscellaneous expenses that were subsequently reimbursed by the other company. As of December 31, 2008 the informal lease agreement has been terminated and no amounts are owed or are due to the company.
On November 1, 2002, pursuant to a private placement we issued $925,000 of Series A-1 Convertible Preferred Stock to certain of our directors or entities controlled by certain of our directors. In connection with the securities purchase agreements, Toreador entered into a registration rights agreement effective November 1, 2002, among Toreador and the purchasers which provides for the registration of the common stock issuable upon conversion of the Series A-1 Convertible Preferred Stock. During 2003, pursuant to private placements we issued 41,000 shares of our Series A-1 Convertible Preferred Stock for the total amount of $1,025,000 to William I. Lee and Wilco as follows: (i) in October 2003, 34,000 shares were issued to William I. Lee and Wilco, an entity controlled by Mr. Lee; and (ii) in December 2003, 7,000 shares were issued to Wilco. The Series A-1 Convertible Preferred Stock was governed by a certificate of designation. The Series A-1 Convertible Preferred Stock was sold for a face value of $25.00 per share, and pays an annual cash dividend of $2.25 per share that result in an annual yield of 9.0%. At the option of the holder, the Series A-1 Convertible Preferred Stock was convertible into common shares at a price of $4.00 per common share. The $4.00 conversion price was higher than the market price of our common stock at the time of issuances. The Series A-1 Convertible Preferred Stock was redeemable at our option, in whole or in part, at any time on or after November 1, 2007. The optional redemption price per share was the sum of (1) $25.00 per share of the Series A-1 Convertible Preferred Stock plus (2) any accrued unpaid dividends, and such sum is multiplied by a declining multiplier. The multiplier is 105% until October 31, 2008, 104% until October 31, 2009, 103% until October 31, 2010, 102% until October 31, 2011, 101% until October 31, 2012, and 100% thereafter. In connection with the securities purchase agreements entered into with William I. Lee and Wilco, Toreador granted certain "piggy-back" registration rights relating to the common stock issuable upon conversion of the Series A-1 Convertible Preferred Stock. The sale of the Series A-1 Convertible Preferred Stock was effected in reliance upon the exemption from securities registration afforded by the provisions of Section 4(2) of the Securities Act of 1933, as amended, and Regulation D as promulgated by the Securities and Exchange Commission under the Securities Act of 1933, as amended. In December 2007, all the series A-1 Convertible Preferred Stock was converted into common shares.
F-33
Table of Contents
TOREADOR RESOURCES CORPORATION
NOTES TO CONSOLIDATED FINANCIAL STATEMENTS — (Continued)
NOTE 14 — DISCONTINUED OPERATIONS
On June 14, 2007, the Board of Directors authorized management to sell all oil and natural gas properties in the United States. The sale of these properties completed the divestiture of the company's non-core domestic assets and allows us to focus exclusively on our international operations. The sale was closed on September 1, 2007. The sales price was $19.1 million which resulted in a pre-tax gain of $9.2 million. Prior year financial statements for 2007 and 2006 have been adjusted to present the operations of the U.S. properties as a discontinued operation. The table below compares discontinued operations for the years ended December 31, 2008, 2007 and 2006:
| | | | | | | | | | | | |
| | Year ended December 31, | |
|---|
| | 2008 | | 2007 | | 2006 | |
|---|
Revenue: | | | | | | | | | | |
| | Oil and natural gas sales | | $ | — | | $ | 4,489 | | $ | 7,070 | |
Operating costs and expenses: | | | | | | | | | | |
| | Lease operating expense | | | 22 | | | 1,592 | | | 2,200 | |
| | Exploration expense | | | — | | | 105 | | | — | |
| | Depreciation, depletion and amortization | | | — | | | 611 | | | 1,265 | |
| | Dry hole expense | | | — | | | 103 | | | 1,393 | |
| | Impairment | | | — | | | — | | | 345 | |
| | General and administrative expense | | | — | | | 325 | | | 324 | |
| | Gain on sale of properties and other assets | | | — | | | (9,244 | ) | | (202 | ) |
| | | | | | | | |
| | | Total operating costs and expenses | | | (22 | ) | | (6,508 | ) | | 5,325 | |
| | | | | | | | |
| | Operating income | | | (22 | ) | | 10,997 | | | 1,745 | |
Income tax provision | | | — | | | (3,952 | ) | | (642 | ) |
| | | | | | | | |
Income (loss) from discontinued operations | | $ | (22 | ) | $ | 7,045 | | $ | 1,103 | |
| | | | | | | | |
NOTE 15 — INFORMATION ABOUT OIL AND NATURAL GAS PRODUCING ACTIVITIES AND OPERATING SEGMENTS
We have operations in only one industry segment, the oil and natural gas exploration and production industry. We are structured along geographic operating segments or regions. As a result, we have reportable operations in the United States, Western Europe (France) and Eastern Europe (Hungary, Romania and Turkey). Geographic operating segment income tax expenses have been determined based on statutory rates existing in the various tax jurisdictions where we have oil and natural gas producing activities.
We allocate a portion of certain United States based employees salaries to our foreign subsidiaries. The amount allocated is based on an estimate of the time that employee has spent working on that on that subsidiary. We periodically review these percentages to make sure that our assumptions are still valid.
F-34
Table of Contents
TOREADOR RESOURCES CORPORATION
NOTES TO CONSOLIDATED FINANCIAL STATEMENTS — (Continued)
The following tables provide the geographic operating segment data required by Statement of Financial Accounting Standards No. 131, "Disclosure about Segments of an Enterprise and Related Information". The United States segment data for the years ended December 31, 2008, 2007, and 2006 has been adjusted to reflect the sale of oil and natural gas properties in the United States as of September 1, 2007 (see Note 14).
| | | | | | | | | | | | | | | | | | | | | |
| | United
States | | France | | Turkey | | Hungary | | Romania | | Total | |
|---|
| | (In thousands)
| |
|---|
For the year ended December 31, 2008 | | | | | | | | | | | | | | | | |
Revenues: | | | | | | | | | | | | | | | | | | | |
| | Oil and natural gas sales | | $ | 52 | | $ | 34,096 | | $ | 25,668 | | $ | — | | $ | 2,558 | | $ | 62,374 | |
Costs and expenses: | | | | | | | | | | | | | | | | | | | |
| | Lease operating | | | — | | | 9,263 | | | 3,477 | | | 7 | | | 4,464 | | | 17,211 | |
| | Exploration expense | | | 1,080 | | | 144 | | | 2,655 | | | 1,397 | | | 530 | | | 5,806 | |
| | Depreciation, depletion and amortization | | | 307 | | | 4,687 | | | 27,164 | | | 94 | | | 890 | | | 33,142 | |
| | Impairment of oil and natural gas properties and intangible assets | | | 2,282 | | | — | | | 82,340 | | | — | | | 611 | | | 85,233 | |
| | General and administrative | | | 11,746 | | | 1,295 | | | 2,018 | | | 428 | | | — | | | 15,487 | |
| | (Gain) loss on sale of properties and other assets | | | — | | | — | | | — | | | — | | | 123 | | | 123 | |
| | Loss on sale of oil and gas derivative contracts | | | — | | | 1,781 | | | — | | | — | | | — | | | 1,781 | |
| | | | | | | | | | | | | | |
| | | Total costs and expenses | | | 15,415 | | | 17,170 | | | 117,654 | | | 1,926 | | | 6,618 | | | 158,783 | |
| | | | | | | | | | | | | | |
Operating income (loss) | | | (15,363 | ) | | 16,926 | | | (91,986 | ) | | (1,926 | ) | | (4,060 | ) | | (96,409 | ) |
| | Other income (expense) | | | (3,154 | ) | | 72 | | | (5,434 | ) | | 920 | | | 1,498 | | | (6,098 | ) |
| | | | | | | | | | | | | | |
Income (loss) before income taxes | | | (18,517 | ) | | 16,998 | | | (97,420 | ) | | (1,006 | ) | | (2,562 | ) | | (102,507 | ) |
| | Benefit (provision) for income taxes | | | 563 | | | (6,066 | ) | | (573 | ) | | — | | | — | | | (6,076 | ) |
| | | | | | | | | | | | | | |
Income (loss) from continuing operations, net of tax | | $ | (17,954 | ) | $ | 10,932 | | $ | (97,993 | ) | $ | (1,006 | ) | $ | (2,562 | ) | $ | (108,583 | ) |
| | | | | | | | | | | | | | |
Selected assets: | | | | | | | | | | | | | | | | | | | |
| | Properties and equipment | | $ | 1,860 | | $ | 108,669 | | $ | 115,057 | | $ | 17,618 | | $ | 23,882 | | $ | 267,086 | |
| | Properties and equipment held for sale | | | — | | | — | | | 55,000 | | | — | | | — | | | 55,000 | |
| | Accumulated depreciation, depletion, and amortization | | | (1,163 | ) | | (36,613 | ) | | (95,318 | ) | | (399 | ) | | (23,882 | ) | | (157,375 | ) |
| | | | | | | | | | | | | | |
| | Oil and natural gas properties, net | | $ | 697 | | $ | 72,056 | | $ | 74,739 | | $ | 17,219 | | $ | — | | $ | 164,711 | |
| | | | | | | | | | | | | | |
| | Goodwill | | $ | — | | $ | 3,838 | | $ | — | | $ | — | | $ | — | | $ | 3,838 | |
| | | | | | | | | | | | | | |
| | Total assets | | $ | 276,434 | | $ | 93,691 | | $ | (69,537 | ) | $ | 1,974 | | $ | (33,046 | ) | $ | 269,516 | |
| | | | | | | | | | | | | | |
Expenditures for additions to long-lived assets: | | | | | | | | | | | | | | | | | | | |
| | Development costs | | $ | — | | $ | 431 | | $ | 8,649 | | $ | 1,487 | | $ | — | | $ | 10,567 | |
| | Exploration costs | | | — | | | — | | | 575 | | | — | | | — | | | 575 | |
| | Other | | | 10 | | | — | | | 241 | | | 163 | | | — | | | 414 | |
| | | | | | | | | | | | | | |
| | Total expenditures for long-lived assets | | $ | 10 | | $ | 431 | | $ | 9,465 | | $ | 1,650 | | $ | — | | $ | 11,556 | |
| | | | | | | | | | | | | | |
F-35
Table of Contents
TOREADOR RESOURCES CORPORATION
NOTES TO CONSOLIDATED FINANCIAL STATEMENTS — (Continued)
| | | | | | | | | | | | | | | | | | | | | |
| | United
States | | France | | Turkey | | Hungary | | Romania | | Total | |
|---|
| | (In thousands)
| |
|---|
For the year ended December 31, 2007 | | | | | | | | | | | | | | | | |
Revenues: | | | | | | | | | | | | | | | | | | | |
| | Oil and natural gas sales | | $ | 34 | | $ | 25,873 | | $ | 11,857 | | $ | — | | $ | 3,927 | | $ | 41,691 | |
Costs and expenses: | | | | | | | | | | | | | | | | | | | |
| | Lease operating | | | — | | | 7,344 | | | 2,644 | | | — | | | 2,656 | | | 12,644 | |
| | Exploration expense | | | 2,668 | | | 855 | | | 2,568 | | | 2,224 | | | 6,427 | | | 14,742 | |
| | Depreciation, depletion and amortization | | | 265 | | | 4,137 | | | 10,088 | | | 65 | | | 6,702 | | | 21,257 | |
| | Dry hole cost | | | — | | | 3,847 | | | 4,500 | | | 3,484 | | | 10,009 | | | 21,840 | |
| | Impairment of oil and natural gas properties and intangible assets | | | — | | | — | | | — | | | — | | | 13,446 | | | 13,446 | |
| | General and administrative | | | 9,675 | | | 2,832 | | | 3,727 | | | 543 | | | 536 | | | 17,313 | |
| | (Gain) loss on sale of properties and other assets | | | (3,155 | ) | | — | | | (4 | ) | | — | | | — | | | (3,159 | ) |
| | Loss on sale of oil and gas derivative contracts | | | 1,005 | | | — | | | — | | | — | | | — | | | 1,005 | |
| | | | | | | | | | | | | | |
| | | Total costs and expenses | | | 10,458 | | | 19,015 | | | 23,523 | | | 6,316 | | | 39,776 | | | 99,088 | |
| | | | | | | | | | | | | | |
Operating income (loss) | | | (10,424 | ) | | 6,858 | | | (11,666 | ) | | (6,316 | ) | | (35,849 | ) | | (57,397 | ) |
| | Other income (expense) | | | (1,914 | ) | | (470 | ) | | (23,495 | ) | | (2,562 | ) | | (304 | ) | | (28,745 | ) |
| | | | | | | | | | | | | | |
Income (loss) before income taxes | | | (12,338 | ) | | 6,388 | | | (35,161 | ) | | (8,878 | ) | | (36,153 | ) | | (86,142 | ) |
| | Benefit (provision) for income taxes | | | 3,692 | | | (2,290 | ) | | 3,274 | | | — | | | — | | | 4,676 | |
| | | | | | | | | | | | | | |
Income (loss) from continuing operations, net of tax | | $ | (8,646 | ) | $ | 4,098 | | $ | (31,887 | ) | $ | (8,878 | ) | $ | (36,153 | ) | $ | (81,466 | ) |
| | | | | | | | | | | | | | |
Selected assets: | | | | | | | | | | | | | | | | | | | |
| | Properties and equipment | | $ | 3,905 | | $ | 115,666 | | $ | 185,844 | | $ | 15,968 | | $ | 24,082 | | $ | 345,465 | |
| | Accumulated depreciation, depletion, and amortization | | | (928 | ) | | (37,660 | ) | | (12,342 | ) | | (376 | ) | | (22,208 | ) | | (73,514 | ) |
| | | | | | | | | | | | | | |
| | Oil and natural gas properties, net | | $ | 2,977 | | $ | 78,006 | | $ | 173,502 | | $ | 15,592 | | $ | 1,874 | | $ | 271,951 | |
| | | | | | | | | | | | | | |
| | Goodwill | | $ | — | | $ | 4,059 | | $ | 883 | | $ | — | | $ | — | | $ | 4,942 | |
| | | | | | | | | | | | | | |
| | Total assets | | $ | 298,949 | | $ | 83,683 | | $ | 31,417 | | $ | 693 | | $ | (29,271 | ) | $ | 385,471 | |
| | | | | | | | | | | | | | |
Expenditures for additions to long-lived assets: | | | | | | | | | | | | | | | | | | | |
| | Development costs | | $ | — | | $ | — | | $ | 59,086 | | $ | 1,672 | | $ | 2,381 | | $ | 63,139 | |
| | Exploration costs | | | — | | | 3,847 | | | 4,500 | | | 3,484 | | | 10,009 | | | 21,840 | |
| | Other | | | 398 | | | — | | | 36 | | | — | | | 115 | | | 549 | |
| | | | | | | | | | | | | | |
| | Total expenditures for long-lived assets | | $ | 398 | | $ | 3,847 | | $ | 63,622 | | $ | 5,156 | | $ | 12,505 | | $ | 85,528 | |
| | | | | | | | | | | | | | |
F-36
Table of Contents
TOREADOR RESOURCES CORPORATION
NOTES TO CONSOLIDATED FINANCIAL STATEMENTS — (Continued)
| | | | | | | | | | | | | | | | | | | | | |
| | United
States | | France | | Turkey | | Hungary | | Romania | | Total | |
|---|
| | (In thousands)
| |
|---|
For the year ended December 31, 2006 | | | | | | | | | | | | | | | | |
Revenues: | | | | | | | | | | | | | | | | | | | |
| | Oil and natural gas sales | | $ | 20 | | $ | 27,274 | | $ | 3,834 | | $ | — | | $ | 2,200 | | $ | 33,328 | |
Costs and expenses: | | | | | | | | | | | | | | | | | | | |
| | Lease operating | | | — | | | 7,229 | | | 793 | | | — | | | 719 | | | 8,741 | |
| | Exploration expense | | | 1,883 | | | 432 | | | 799 | | | 184 | | | 648 | | | 3,946 | |
| | Depreciation, depletion and amortization | | | 264 | | | 3,119 | | | 748 | | | 59 | | | 2,089 | | | 6,279 | |
| | Dry hole cost | | | — | | | — | | | — | | | 1,706 | | | — | | | 1,706 | |
| | General and administrative | | | 5,720 | | | 1,905 | | | 807 | | | 516 | | | 557 | | | 9,505 | |
| | (Gain) loss on sale of properties and other assets | | | — | | | — | | | (436 | ) | | — | | | — | | | (436 | ) |
| | | | | | | | | | | | | | |
| | | Total costs and expenses | | | 7,867 | | | 12,685 | | | 2,711 | | | 2,465 | | | 4,013 | | | 29,741 | |
| | | | | | | | | | | | | | |
Operating income (loss) | | | (7,847 | ) | | 14,589 | | | 1,123 | | | (2,465 | ) | | (1,813 | ) | | 3,587 | |
| | Other income (expense) | | | 3,186 | | | 187 | | | (1,055 | ) | | (1,484 | ) | | 59 | | | 893 | |
| | | | | | | | | | | | | | |
Income (loss) before income taxes | | | (4,661 | ) | | 14,776 | | | 68 | | | (3,949 | ) | | (1,754 | ) | | 4,480 | |
| | Benefit (provision) for income taxes | | | 1,020 | | | (4,256 | ) | | 231 | | | — | | | — | | | (3,005 | ) |
| | | | | | | | | | | | | | |
Income (loss) from continuing operations, net of tax | | $ | (3,641 | ) | $ | 10,520 | | $ | 299 | | $ | (3,949 | ) | $ | (1,754 | ) | $ | 1,475 | |
| | | | | | | | | | | | | | |
Selected assets: | | | | | | | | | | | | | | | | | | | |
| | Oil and natural gas properties | | $ | 3,602 | | $ | 99,751 | | $ | 137,499 | | $ | 15,334 | | $ | 21,840 | | $ | 278,044 | |
| | Accumulated depreciation, depletion, and amortization | | | (1,271 | ) | | (30,439 | ) | | (2,893 | ) | | (283 | ) | | (2,059 | ) | | (36,945 | ) |
| | | | | | | | | | | | | | |
| | Oil and natural gas properties, net | | $ | 2,349 | | $ | 69,312 | | $ | 134,606 | | $ | 15,051 | | $ | 19,781 | | $ | 241,099 | |
| | | | | | | | | | | | | | |
| | Investments in unconsolidated entities | | $ | 2,659 | | $ | — | | $ | — | | $ | — | | $ | — | | $ | 2,659 | |
| | | | | | | | | | | | | | |
| | Goodwill | | $ | — | | $ | 3,632 | | $ | 919 | | $ | — | | $ | — | | $ | 4,551 | |
| | | | | | | | | | | | | | |
| | Total assets | | $ | 251,422 | | $ | 80,574 | | $ | 35,209 | | $ | 7,745 | | $ | 4,638 | | $ | 379,588 | |
| | | | | | | | | | | | | | |
Expenditures for additions to long-lived assets: | | | | | | | | | | | | | | | | | | | |
| | Development costs | | $ | — | | $ | 15,931 | | $ | 86,222 | | $ | 1,759 | | $ | 6,943 | | $ | 110,855 | |
| | Exploration costs | | | — | | | — | | | — | | | 6,249 | | | 7,320 | | | 13,569 | |
| | Other | | | 283 | | | 127 | | | 228 | | | 83 | | | 111 | | | 832 | |
| | | | | | | | | | | | | | |
| | Total expenditures for long-lived assets | | $ | 283 | | $ | 16,058 | | $ | 86,450 | | $ | 8,091 | | $ | 14,374 | | $ | 125,256 | |
| | | | | | | | | | | | | | |
- (1)
- Amounts reflect reclassifications to discontinued operations.
F-37
Table of Contents
TOREADOR RESOURCES CORPORATION
NOTES TO CONSOLIDATED FINANCIAL STATEMENTS — (Continued)
The following table reconciles the total assets for reportable segments to consolidated assets.
| | | | | | | |
| | December 31, | |
|---|
| | 2008 | | 2007 | |
|---|
| | (in thousands)
| |
|---|
Total assets for reportable segments | | $ | 269,516 | | $ | 385,471 | |
Elimination of intersegment receivables and investments | | | (62,360 | ) | | (62,360 | ) |
| | | | | | |
Total consolidated assets | | $ | 207,156 | | $ | 323,111 | |
| | | | | | |
NOTE 16 — SUBSEQUENT EVENT
On February 18, 2009 the Board of Directors has authorized management to engage Stellar Energy Advisors, based in London, UK, to manage an open bid process to sell its remaining 10% interest in the SASB, in addition to its onshore production and 2.7 million net acres in exploration licenses that are currently held. The Company will begin accounting for the Turkish segment as a discontinued operation in the first quarter of 2009.
On March 3, 2009 we completed the sale of a 26.75% interest in the South Akcakoca Sub-Basin (SASB) project associated licenses located in the Black Sea offshore Turkey, to Petrol Ofisi for $55 million. In accordance with the revised assignment announced on February 3, 2009, $50 million of the proceeds was paid by Petrol Ofisi on March 3, 2009, and the remaining $5 million will be paid unconditionally on September 1, 2009.
In accordance with the covenants of the International Finance Corporation revolving credit facility, proceeds of the Petrol Ofisi sale will be used to fully repay and retire the outstanding balance of $36.4 million, which includes $5.9 million of additional compensation, accrued interest and fees. Remaining proceeds will be used to retire a portion of the Notes and fund this year's capital program to meet minimum commitments associated with the Company's licenses.
NOTE 17 — SUPPLEMENTAL OIL AND NATURAL GAS RESERVES AND STANDARDIZED MEASURE INFORMATION (UNAUDITED)
We retain an independent engineering firm to provide annual year-end estimates of our future net recoverable oil and natural gas reserves. Estimated proved net recoverable reserves we have shown below include only those quantities that we can expect to be commercially recoverable at prices and costs in effect at the balance sheet dates under existing regulatory practices and with conventional equipment and operating methods. Proved developed reserves represent only those reserves that we may recover through existing wells. Proved undeveloped reserves include those reserves that we may recover from new wells on undrilled acreage or from existing wells on which we must make a relatively major expenditure for recompletion or secondary recovery operations.
F-38
Table of Contents
TOREADOR RESOURCES CORPORATION
NOTES TO CONSOLIDATED FINANCIAL STATEMENTS — (Continued)
Discounted future cash flow estimates like those shown below are not intended to represent estimates of the fair value of oil and natural gas properties. Estimates of fair value should also consider probable reserves, anticipated future oil and natural gas prices, interest rates, changes in development and production costs and risks associated with future production. Because of these and other considerations, any estimate of fair value is necessarily subjective and imprecise.
| | | | | | | | | | | | | | | | | |
| | France | | Turkey | | Romania | | Hungary | | Total | |
|---|
| | Natural Gas (MMcf)
| |
|---|
| | PROVED RESERVES | | | | | | | | | | | | | | | | |
December 31, 2005 | | | — | | | 6,476 | | | 3,486 | | | — | | | 9,962 | |
Revisions of previous estimates | | | — | | | (1,151 | ) | | (1,185 | ) | | — | | | (2,336 | ) |
Extensions, discoveries and other additions | | | — | | | 16,099 | | | 1,186 | | | 950 | | | 18,235 | |
Sale of reserves | | | — | | | — | | | — | | | — | | | — | |
Production | | | — | | | — | | | (446 | ) | | — | | | (446 | ) |
| | | | | | | | | | | | |
December 31, 2006 | | | — | | | 21,424 | | | 3,041 | | | 950 | | | 25,415 | |
Revisions of previous estimates | | | — | | | (8,215 | ) | | (1,671 | ) | | (950 | ) | | (10,836 | ) |
Extensions, discoveries and other additions | | | — | | | 741 | | | — | | | — | | | 741 | |
Sale of reserves | | | — | | | — | | | — | | | — | | | — | |
Production | | | — | | | (1,011 | ) | | (598 | ) | | — | | | (1,069 | ) |
| | | | | | | | | | | | |
December 31, 2007 | | | — | | | 12,939 | | | 772 | | | — | | | 13,711 | |
Revisions of previous estimates | | | — | | | (819 | ) | | (310 | ) | | 950 | | | (179 | ) |
Extensions, discoveries and other additions | | | — | | | — | | | — | | | — | | | — | |
Sale of reserves | | | — | | | — | | | — | | | — | | | — | |
Production | | | — | | | (1,643 | ) | | (376 | ) | | — | | | (2,019 | ) |
| | | | | | | | | | | | |
December 31, 2008 | | | — | | | 10,477 | | | 86 | | | 950 | | | 11,513 | |
| | | | | | | | | | | | |
| | PROVED DEVELOPED | | | | | | | | | | | | | | | | |
December 31, 2006 | | | — | | | — | | | 3,040 | | | 950 | | | 3,990 | |
| | | | | | | | | | | | |
December 31, 2007 | | | — | | | 4,248 | | | 772 | | | — | | | 5,020 | |
| | | | | | | | | | | | |
December 31, 2008 | | | — | | | 2,437 | | | 86 | | | 950 | | | 3,473 | |
| | | | | | | | | | | | |
|
|
Oil (MBbls)
|
|
|---|
| | PROVED RESERVES | | | | | | | | | | | | | | | | |
December 31, 2005 | | | 10,978 | | | 639 | | | 24 | | | — | | | 11,641 | |
Revisions of previous estimates | | | (906 | ) | | 95 | | | 4 | | | — | | | (807 | ) |
Extensions, discoveries and other additions | | | — | | | — | | | 19 | | | 1 | | | 20 | |
Sale of reserves | | | — | | | — | | | — | | | — | | | — | |
Production | | | (444 | ) | | (69 | ) | | (6 | ) | | — | | | (519 | ) |
| | | | | | | | | | | | |
December 31, 2006 | | | 9,628 | | | 665 | | | 41 | | | 1 | | | 10,335 | |
Revisions of previous estimates | | | 661 | | | 481 | | | (27 | ) | | (1 | ) | | 1,114 | |
Extensions, discoveries and other additions | | | 39 | | | — | | | — | | | — | | | 39 | |
Sale of reserves | | | — | | | (30 | ) | | — | | | — | | | (30 | ) |
Production | | | (360 | ) | | (67 | ) | | (8 | ) | | — | | | (435 | ) |
| | | | | | | | | | | | |
December 31, 2007 | | | 9,968 | | | 1,049 | | | 6 | | | — | | | 11,023 | |
Revisions of previous estimates | | | (4,694 | ) | | (253 | ) | | (2 | ) | | 1 | | | (4,948 | ) |
Extensions, discoveries and other additions | | | — | | | — | | | — | | | — | | | — | |
Sale of reserves | | | — | | | — | | | — | | | — | | | — | |
Production | | | (360 | ) | | (55 | ) | | (3 | ) | | — | | | (418 | ) |
| | | | | | | | | | | | |
December 31, 2008 | | | 4,914 | | | 741 | | | 1 | | | 1 | | | 5,657 | |
| | | | | | | | | | | | |
| | PROVED DEVELOPED | | | | | | | | | | | | | | | | |
December 31, 2006 | | | 6,770 | | | 405 | | | 41 | | | 1 | | | 7,217 | |
| | | | | | | | | | | | |
December 31, 2007 | | | 7,170 | | | 808 | | | 6 | | | — | | | 7,984 | |
| | | | | | | | | | | | |
December 31, 2008 | | | 4,385 | | | 500 | | | 1 | | | 1 | | | 4,887 | |
| | | | | | | | | | | | |
F-39
Table of Contents
TOREADOR RESOURCES CORPORATION
NOTES TO CONSOLIDATED FINANCIAL STATEMENTS — (Continued)
We have summarized the standardized measure of discounted future net cash flows related to our proved oil and natural gas reserves. We have based the following summary on a valuation of proved reserves using discounted cash flows based on year-end prices, costs and economic conditions and a 10% discount rate. The additions to proved reserves from purchase of reserves in place and new discoveries and extensions could vary significantly from year to year; additionally, the impact of changes to reflect current prices and costs of proved reserves in prior years could also be significant. Accordingly, investors should not view the information presented below as an estimate of the fair value of our oil and natural gas properties, nor should investors consider the information indicative of any trends.
For the year ended December 31, 2008, we had a downward reserve revision of 37.4%. At December 31, 2007 the price used for evaluating our oil reserves was $95.72 per barrel as compared to the December 31, 2008 price of $34.29 per barrel. This 62% decrease in oil price had a severe impact on the economic life of our wells, but also on the discounted present value at 10% and the standardized measure of proved reserves. This downward revision, which primarily affected our French oil reserves, was due to the following factors (i) decrease in economic life due to change in economics caused a net decrease of 1,682 MBbl; (ii) removing twelve proved undeveloped locations caused a net decrease 1,889 MBbl; (iii) negative reserve revisions resulted in a decrease in reserves of 405 MBbl; (iv) fourteen wells were shut-in resulting in a decrease of 401 MBbl; (v) three drilled locations in prior years resulted in one producing well which was non-commercial at December 31, 2008 causing a net decrease of 280 MBbl; (vi) one well was lost during workover operations causing a net decrease 37 MBbl; and (vii) 2008 production of 805 MBOE. In Hungary, we were able to secure a gas contract and were able to restore the reserves lost in 2007, this resulted in an increase of 159 MBOE and in Romania the poor performance of the field resulted in a decrease of 54 MBbl. In Turkey, we had downward revisions of 390 MBbl. which was due to a decrease in the economic life of the proved developed wells.
The prices of oil and natural gas at December 31, 2008, 2007, and 2006 used to estimate reserves in the table shown below, were $34.29, $95.72 and $57.75 per Bbl of oil, respectively, and $12.68, $8.91 and $6.98 per Mcf of natural gas, respectively.
| | | | | | | | | | | | | | | | |
| | France | | Turkey | | Romania | | Hungary | | Total | |
|---|
| | (In thousands)
| |
|---|
As of and for the year ended December 31, 2006 | | | | | | | | | | | | | | | | |
Future cash inflows | | $ | 551,139 | | $ | 185,815 | | $ | 21,163 | | $ | 5,732 | | $ | 763,849 | |
Future production costs | | | 214,474 | | | 20,407 | | | 5,198 | | | 1,658 | | | 241,737 | |
Future development costs | | | 33,580 | | | 20,757 | | | 159 | | | 800 | | | 55,296 | |
Future income tax expense | | | 95,067 | | | 7,114 | | | (602 | ) | | 2,057 | | | 103,636 | |
| | | | | | | | | | | | |
Future net cash flows | | | 208,018 | | | 137,537 | | | 16,408 | | | 1,217 | | | 363,180 | |
10% annual discount for estimated timing of cash flows | | | 121,828 | | | 53,207 | | | 3,019 | | | 248 | | | 178,302 | |
| | | | | | | | | | | | |
Standardized measure of discounted future net cash flows related to proved reserves | | $ | 86,190 | | $ | 84,330 | | $ | 13,389 | | $ | 969 | | $ | 184,878 | |
| | | | | | | | | | | | |
F-40
Table of Contents
TOREADOR RESOURCES CORPORATION
NOTES TO CONSOLIDATED FINANCIAL STATEMENTS — (Continued)
| | | | | | | | | | | | | | | | |
| | France | | Turkey | | Romania | | Hungary | | Total | |
|---|
| | (In thousands)
| |
|---|
As of and for the year ended December 31, 2007 | | | | | | | | | | | | | | | | |
Future cash inflows | | $ | 963,444 | | $ | 209,405 | | $ | 4,495 | | $ | — | | $ | 1,177,344 | |
Future production costs | | | 305,939 | | | 29,759 | | | 3,202 | | | — | | | 338,900 | |
Future development costs | | | 32,221 | | | 22,272 | | | 95 | | | — | | | 54,588 | |
Future income tax expense | | | 200,094 | | | 6,597 | | | — | | | — | | | 206,691 | |
| | | | | | | | | | | | |
Future net cash flows | | | 425,190 | | | 150,777 | | | 1,198 | | | — | | | 577,165 | |
10% annual discount for estimated timing of cash flows | | | 250,979 | | | 66,729 | | | 88 | | | — | | | 317,796 | |
| | | | | | | | | | | | |
Standardized measure of discounted future net cash flows related to proved reserves | | $ | 174,211 | | $ | 84,048 | | $ | 1,110 | | $ | — | | $ | 259,369 | |
| | | | | | | | | | | | |
As of and for the year ended December 31, 2008 | | | | | | | | | | | | | | | | |
Future cash inflows | | $ | 170,662 | | $ | 155,179 | | $ | 412 | | $ | 13,735 | | $ | 339,988 | |
Future production costs | | | 105,298 | | | 26,939 | | | 381 | | | 1,851 | | | 134,469 | |
Future development costs | | | 13,658 | | | 71,283 | | | 159 | | | 550 | | | 85,650 | |
Future income tax expense | | | 10,027 | | | — | | | — | | | — | | | 10,027 | |
| | | | | | | | | | | | |
Future net cash flows(1) | | | 41,679 | | | 56,957 | | | (128 | ) | | 11,334 | | | 109,842 | |
10% annual discount for estimated timing of cash flows | | | 23,116 | | | 29,909 | | | (7 | ) | | 2,056 | | | 55,074 | |
| | | | | | | | | | | | |
Standardized measure of discounted future net cash flows related to proved reserves(1) | | $ | 18,563 | | $ | 27,048 | | $ | (121 | ) | $ | 9,278 | | $ | 54,768 | |
| | | | | | | | | | | | |
- (1)
- The negative values are due to plugging and abandonment costs incurred in the final year.
F-41
Table of Contents
TOREADOR RESOURCES CORPORATION
NOTES TO CONSOLIDATED FINANCIAL STATEMENTS — (Continued)
The following are the principal sources of change in the standardized measure:
| | | | | | | | | | | | | | | | |
| | France | | Turkey | | Romania | | Hungary | | Total | |
|---|
| | (In thousands)
| |
|---|
Balance at December 31, 2005 | | $ | 109,129 | | $ | 15,788 | | $ | 10,675 | | $ | — | | $ | 135,592 | |
Sales of oil and natural gas, net | | | (20,201 | ) | | (3,041 | ) | | (1,481 | ) | | — | | | (24,723 | ) |
Net changes in prices and production costs | | | (6,102 | ) | | 7,074 | | | 2,987 | | | | | | 3,959 | |
Net change in development costs | | | (2,101 | ) | | 970 | | | (130 | ) | | (641 | ) | | (1,902 | ) |
Extensions and discoveries | | | — | | | 65,127 | | | 5,159 | | | 3,267 | | | 73,553 | |
Revisions of previous quantity estimates | | | (13,781 | ) | | (2,355 | ) | | (4,617 | ) | | — | | | (20,753 | ) |
Previously estimated development costs incurred | | | (2,132 | ) | | — | | | (552 | ) | | — | | | (2,684 | ) |
Net change in income taxes | | | 9,312 | | | (3,445 | ) | | 1,262 | | | (1,656 | ) | | 5,473 | |
Accretion of discount | | | 13,570 | | | 1,679 | | | 989 | | | — | | | 16,238 | |
Other | | | (1,504 | ) | | 2,533 | | | (905 | ) | | — | | | 124 | |
| | | | | | | | | | | | |
Balance at December 31, 2006 | | | 86,190 | | | 84,330 | | | 13,387 | | | 970 | | | 184,877 | |
Sales of oil and natural gas, net | | | (18,529 | ) | | (9,213 | ) | | (1,271 | ) | | — | | | (29,013 | ) |
Net changes in prices and production costs | | | 120,639 | | | 38,613 | | | (7,953 | ) | | — | | | 151,299 | |
Net change in development costs | | | (266 | ) | | (5,701 | ) | | 59 | | | 641 | | | (5,267 | ) |
Extensions and discoveries | | | 1,076 | | | 3,930 | | | — | | | — | | | 5,006 | |
Revisions of previous quantity estimates | | | 18,303 | | | (28,262 | ) | | (2,726 | ) | | (3,267 | ) | | (15,952 | ) |
Previously estimated development costs incurred | | | (1,992 | ) | | (8,523 | ) | | — | | | — | | | (10,515 | ) |
Net change in income taxes | | | (42,760 | ) | | 257 | | | 448 | | | 1,656 | | | (40,399 | ) |
Accretion of discount | | | 11,871 | | | 8,492 | | | (841 | ) | | — | | | 19,522 | |
Sale of reserves | | | — | | | (967 | ) | | — | | | — | | | (967 | ) |
Other | | | (321 | ) | | 1,092 | | | 7 | | | — | | | 778 | |
| | | | | | | | | | | | |
Balance at December 31, 2007 | | | 174,211 | | | 84,048 | | | 1,110 | | | — | | | 259,369 | |
Sales of oil and natural gas, net | | | (24,834 | ) | | (22,191 | ) | | 1,906 | | | — | | | (45,119 | ) |
Net changes in prices and production costs | | | (212,520 | ) | | (7,298 | ) | | (481 | ) | | — | | | (220,299 | ) |
Net change in development costs | | | 7,795 | | | (30,943 | ) | | (62 | ) | | (451 | ) | | (23,661 | ) |
Extensions and discoveries | | | — | | | — | | | — | | | — | | | — | |
Revisions of previous quantity estimates | | | (26,219 | ) | | (11,419 | ) | | (105 | ) | | 9,737 | | | (28,006 | ) |
Previously estimated development costs incurred | | | — | | | (5,475 | ) | | — | | | — | | | (5,475 | ) |
Net change in income taxes | | | 81,846 | | | 5,329 | | | (2,712 | ) | | 38 | | | 84,501 | |
Accretion of discount | | | 26,260 | | | 8,938 | | | 111 | | | — | | | 35,309 | |
Sale of reserves | | | — | | | — | | | — | | | — | | | — | |
Other | | | (7,976 | ) | | 6,059 | | | 112 | | | (46 | ) | | (1,851 | ) |
| | | | | | | | | | | | |
Balance at December 31, 2008 | | $ | 18,563 | | $ | 27,048 | | $ | (121 | ) | $ | 9,278 | | $ | 54,768 | |
| | | | | | | | | | | | |
F-42