Use these links to rapidly review the document
TABLE OF CONTENTS
Item 7. Financial Statements
Table of Contents
UNITED STATES SECURITIES AND EXCHANGE COMMISSION
WASHINGTON D.C. 20549
FORM 10-K
| | |
| ý | | ANNUAL REPORT PURSUANT TO SECTION 13 OR 15(d)
OF THE SECURITIES EXCHANGE ACT OF 1934 |
|
|
For the fiscal year ended: December 31, 2009 |
OR |
o |
|
TRANSITION REPORT PURSUANT TO SECTION 13 OR 15(d)
OF THE SECURITIES EXCHANGE ACT OF 1934 |
COMMISSION FILE NUMBER: 0-02517
Toreador Resources Corporation
(Exact name of Registrant as specified in its charter)
| | |
| Delaware | | 75-0991164 |
(State or other jurisdiction
of incorporation) | | (I.R.S. Employer
Identification Number) |
c/o Toreador Holding SAS
9 rue Scribe
Paris, France
(Address of principal executive office) |
|
75009
(Zip Code) |
Registrant's telephone number, including area code: + 33 1 47 03 34 24
Securities registered pursuant to Section 12(b) of the Exchange Act:
| | |
Title of each Class: | | Name of each exchange on which registered: |
|---|
COMMON STOCK, PAR VALUE
$.15625 PER SHARE | | NASDAQ GLOBAL MARKET |
Securities registered pursuant to Section 12(g) of the Exchange Act: None
Indicate by check mark if the registrant is a well-known seasoned issuer, as defined in Rule 405 of the Securities Act. Yes o No þ
Indicate by check mark if the registrant is not required to file reports pursuant to Section 13 or Section 15(d) of the Act. Yes o No þ
Indicate by check whether the registrant (1) has filed all reports required to be filed by Section 13 or 15(d) of the Securities Exchange Act of 1934 during the preceding 12 months (or for such shorter period that the Registrant was required to file such reports), and (2) has been subject to such filing requirements for the past 90 days. Yes þ No o
Indicate by check mark whether the registrant has submitted electronically and posted on its Web site, if any, every Interactive Data File required to be submitted and posted pursuant to Rule 405 of Regulation S-T (§232.405 of this chapter) during the preceding 12 months (or for such shorter period that the registrant was required to submit and post such files). Yes o No o
Indicate by check mark if disclosure of delinquent filers pursuant to Item 405 of Regulation S-K is not contained herein, and will not be contained, to the best of Registrant's knowledge, in definitive proxy or information statements incorporated by reference in Part III of this Form 10-K or any amendment to this Form 10-K. o
Indicate by check mark whether the registrant is a large accelerated filer, an accelerated filer, or a non-accelerated filer or a smaller reporting company. See definitions of "accelerated filer and large accelerated filer," "accelerated filer," and "smaller reporting company" in Rule 12b-2 of the Exchange Act.
| | | | | | |
| Large accelerated filer o | | Accelerated filer þ | | Non-accelerated filer o
(Do Not Check if a Smaller
Reporting Company) | | Smaller reporting company o |
Indicate by check mark whether the registrant is a shell company (as defined by Rule 12b-2 of the Exchange Act). Yes o No þ
The aggregate market value of the voting and non-voting common equity of the registrant held by non-affiliates, computed by reference to the closing sales price of such stock, as of June 30, 2009 was $126,794,592. (For purposes of determination of the aggregate market value, only directors, executive officers and 10% or greater stockholders have been deemed affiliates.)
The number of shares outstanding of the registrant's common stock, par value $.15625, as of March 12, 2010 was 24,941,155 shares.
DOCUMENTS INCORPORATED BY REFERENCE
Portions of the registrant's Proxy Statement for the 2010 Annual Meeting of Stockholders, expected to be filed on or before April 30, 2010, are incorporated by reference into Part III of this Form 10-K
Table of Contents
TABLE OF CONTENTS
Table of Contents
PART I
Items 1 and 2. Business and Properties
See the "Glossary of Selected Oil and Natural Gas Terms" at the end of Item 1 for the definition of certain terms in this annual report.
Toreador Resources Corporation (together with its direct and indirect subsidiaries, "Toreador," "we," "us," "our," or the "Company"), is an independent energy company engaged in the exploration and production of crude oil with interests in developed and undeveloped oil properties in the Paris Basin, France. We are currently focused on the development of our conventional fields and the exploitation of the prospective shale oil play within our Paris Basin acreage position.
We currently operate solely in the Paris Basin, which covers approximately 170,000 km2 of northeastern France, centered 50 to 100 km east and south of Paris. At December 31, 2009, we held interests in approximately 750,000 gross exploration acres. According to Gaffney, Cline & Associates Ltd, an independent petroleum and geological engineering firm, or Gaffney Cline, as of December 31, 2009, our proved reserves were 5.8 MBbls, our proved plus probable reserves were 9.1 MBbls and our proved plus probable plus possible reserves were 14.3 MBbls. Our production for 2009 averaged approximately 900 bbl/d from two conventional oilfield areas in the Paris Basin — the Neocomian Complex and Charmottes fields. As of December 31, 2009, production from these oil fields represented substantially all of our revenue. We intend to maintain production from these mature assets using suitable enhanced oil recovery techniques. In addition to this production base, we have identified several additional conventional exploration targets. We received well results on the La Garenne, the first of these targets, in January 2010. Following a more detailed analysis of the data, we intend to formulate a development plan for the field.
We are also currently focused on exploiting our shale oil acreage in the Paris Basin. Our current priority is to execute a proof of concept program by drilling, completing and testing three pilot wells in the second half of 2010, subject to approval of drilling by the French government, for which the Company intends to submit an application by the end of March 2010. The Company has commenced a process to identify a potential partner to assist with our proof of concept program.
Our management team, Board of Directors and strategy underwent a significant transformation in 2009. In January 2009, we appointed a new Chief Executive Officer and three new directors (the CEO, Non-Executive Chairman and Non-Executive Vice Chairman), and in September 2009, we appointed a new Chief Financial Officer and Commercial Director. In addition, over the course of 2009, Toreador completed its exit of Romania and exited Hungary and Turkey. In the fourth quarter of 2008 and during the first quarter of 2009, Toreador farmed out or sold all of its working interests in Romania to three different companies and closed its office; thus, we no longer have any operational involvement in Romania. On March 3, 2009, Toreador completed the sale of a 26.75% interest in the South Akcakoca Sub-Basin ("SASB") project-associated licenses located in the Black Sea offshore Turkey. On September 30, 2009, Toreador completed its sale of its wholly owned subsidiary, Toreador Hungary Limited, and on October 7, 2009, Toreador completed the sale of its wholly owned subsidiary, Toreador Turkey Ltd., exiting both countries.
We are a Delaware corporation that was incorporated in 1951. Our common stock is traded on the NASDAQ Global Market under the trading symbol "TRGL." Our offices in the United States are located at 13760 Noel Road, Suite 1100, Dallas, TX, 75240-1383 (telephone number: (214) 559-3933). Our principal executive offices are located at c/o Toreador Holding SAS, 9 rue Scribe, 75009 Paris, France (telephone number: +33 1 47 03 34 24). Our website address is www.toreador.net.
1
Table of Contents
Recent Developments
On February 12, 2010, we completed a registered underwritten public offering of 3,450,000 shares of common stock, including 450,000 shares of common stock acquired by the underwriters from us to cover over-allotment options. The net proceeds to Toreador from the offering were approximately $27.2 million, after deducting underwriting discounts, commissions and estimated offering expenses. We intend to use the net proceeds, together with cash on hand, to satisfy payment obligations arising from the holders' exercise, if any, of their right on October 1, 2010 to require the Company to repurchase its 5.00% Convertible Senior Notes due 2025 and for general corporate purposes, which may include working capital, capital expenditures and acquisitions.
On February 1, 2010, Toreador consummated an exchange transaction, or the Convertible Notes Exchange. In the Convertible Notes Exchange, in exchange for (a) $22,231,000 principal amount of our outstanding 5.00% Convertible Senior Notes due 2025, or the Old Notes, and (b) $9.4 million cash, we issued $31,631,000 aggregate principal amount of our 8.00%/7.00% Convertible Senior Notes due 2025, or the New Convertible Senior Notes, and paid accrued and unpaid interest on the Old Notes.
The New Convertible Senior Notes are senior unsecured obligations of the Company, ranking equal in right of payment with the Company's 5.00% Convertible Senior and future unsubordinated indebtedness. The New Convertible Senior Notes will mature on October 1, 2025 and pay annual cash interest at 8.00% from February 1, 2010 until January 31, 2011 and at 7.00% per annum thereafter. Interest on the New Convertible Senior Notes will be payable on February 1 and August 1 of each year, beginning on August 1, 2010.
The New Convertible Senior Notes are convertible prior to February 1, 2011 only if an event of default occurs and is continuing under the terms of the indenture, upon a Change of Control (as defined in the indenture) and to the extent the Company elects to redeem the New Convertible Senior Notes in a Provisional Redemption (as defined below). The New Convertible Senior Notes are convertible at any time on or after February 1, 2011 and before the close of business on October 1, 2025.
The New Convertible Senior Notes are convertible into shares of our common stock at an initial conversion rate of 72.9927 shares of common stock per $1,000 principal amount of New Convertible Senior Notes (which is equivalent to an initial conversion price of $13.70 per share), subject to adjustment upon certain events. Under the terms of the indenture governing the New Convertible Senior Notes, if on or before October 1, 2010, we sold shares of our common stock in an equity offering or an equity-linked offering (other than for compensation), for cash consideration per share such that 120% of the issuance price was less than the conversion price of the New Convertible Senior Notes then in effect, the conversion price was to be reduced to an amount equal to 120% of such offering price. As a result of our February 2010 public offering, the conversion rate of the New Convertible Senior Notes adjusted to 98.0392 shares of common stock per $1,000 principal amount of New Convertible Senior Notes (which is equivalent to a conversion price of approximately $10.20 per share). Pursuant to the indenture, the conversion price of the New Convertible Senior Notes will not be further adjusted under such provision because the proceeds from the public offering were in excess of $20 million.
The New Convertible Senior Notes may be redeemed in whole or in part at the Company's option prior to October 1, 2013, in cash at a redemption price equal to one hundred percent (100%) of the principal amount of the New Convertible Senior Notes redeemed, plus accrued and unpaid interest, if any, to, but excluding, the redemption date plus a make-whole payment, if the closing sale price of the Company's common stock has exceeded 200% of the conversion price then in effect for at least twenty (20) trading days in any consecutive thirty (30)-trading day period ending on the trading day prior to the date of mailing of the relevant notice of redemption. The New Convertible Senior Notes may be redeemed
2
Table of Contents
in whole or in part at the Company's option on or after October 1, 2013 for cash at a redemption price equal to 100% of the principal amount of the New Convertible Senior Notes redeemed, plus any accrued and unpaid interest to, but excluding, the redemption date. In addition, upon the occurrence of certain fundamental changes, and on each of October 1, 2013, October 1, 2015 and October 1, 2020, a holder may require the Company to repurchase all or a portion of the New Convertible Senior Notes in cash for 100% of the principal amount of the New Convertible Senior Notes to be purchased, plus any accrued and unpaid interest to, but excluding, the purchase date.
Pursuant to the indenture, the Company and its subsidiaries may not incur debt other than Permitted Indebtedness. "Permitted Indebtedness" includes (i) the New Convertible Senior Notes; (ii) the 5.00% Convertible Senior Notes or any indebtedness of the Company that serves to refund or refinance the 5.00% Convertible Senior Notes ("Refinancing Debt"), so long as the principal amount of the Refinancing Debt does not exceed the outstanding principal amount of the 5.00% Convertible Senior Notes; (iii) indebtedness incurred by the Company or its subsidiaries not to exceed the sum of (i) the product of (x) $7.00 and (y) the number of barrels of proved plus probable reserves and (ii) cash equivalents less the aggregate principal amount of the New Convertible Senior Notes outstanding less the aggregate principal amount of the 5.00% Convertible Senior Notes less any Refinancing Debt; (iv) indebtedness that is nonrecourse to the Company or any of its subsidiaries used to finance projects or acquisitions, joint ventures or partnerships, including acquired indebtedness ("Nonrecourse Debt"); and (v) certain other customary categories of permitted debt. In addition, the Company may not permit its total consolidated net debt as of any date to exceed the product of (x) $7.00 and (y) the number of barrels of proved plus probable reserves other than for Nonrecourse Debt. The proved plus probable reserves underlying any Nonrecourse Debt for which debt has been incurred as permitted debt pursuant to clause (iv) above will be excluded from the proved plus probable reserves calculation for the purposes of the above debt covenants.
Operations Update
La Garenne Well
We began drilling on the La Garenne well on November 12, 2009. The well confirmed a five-meter reservoir within a 50-meter oil column in the target Dogger formation. Based on our continued evaluation of the well results, we believe the well confirms a porous and hydrocarbon-bearing reservoir with a localized low-permeability area at the crest of the structure. We completed production testing of the well in January 2010, and the results were inconclusive. The well flowed only limited quantities from one of its two horizons in the Dogger. We intend to formulate a development plan for La Garenne following a more detailed analysis. We expect that the vertical well drilled will be used as a water disposal or an injection well in the development of this field.
In November 2009, our Board of Directors retained RBC Capital Markets to assist the Board's Strategic Committee in the review of various strategic alternatives. The approach we are principally focused on is identifying a potential partner to assist us, through a farm-out agreement or other means, in exploiting our shale oil acreage in the Paris Basin. Our current priority is to execute a proof of concept program by drilling, completing and testing three pilot wells in the second half of 2010, subject to approval of drilling by the French government, for which we intend to submit an application by the end of March 2010. To the extent we are able to identify and reach agreement with a partner, we expect that this process could be completed during the first half of 2010, with development intended to begin thereafter.
3
Table of Contents
Strategy
The primary components of our strategy are:
- •
- Focus on France. All of our oil assets are currently located in France, having disposed of our interests in Turkey and Hungary in 2009. We believe we can leverage our substantial acreage position and our experience and industry relationships in France to grow the Company.
- •
- Capture, develop and accelerate conventional prospects. We have identified a number of conventional oil prospects, which we intend to evaluate for potential development, beginning with La Garenne.
- •
- Target the prospective unconventional oil resource play. We are currently seeking a strategic partner to assist in our proof of concept program and potential development of our Paris Basin shale oil acreage position.
- •
- Continue to focus on operational costs. Since the beginning of 2009, we have improved operational efficiencies, and we intend to reduce general and administrative costs and continue to focus on maintaining efficient operations.
- •
- Seek and maintain optimal capital structure. We expect the proceeds from the February 2010 public offering to enable us to reduce our debt, and we intend to maintain a conservative capital structure over time.
Our Properties
Toreador does not hold title to any of its properties; we hold interests in permits or concessions granted by French governmental authorities granting us the right to explore and develop oil properties in France. We currently hold interests in approximately 750,000 gross exploration acres in the Paris Basin and have applied for approximately 423,000 additional gross acres. Our conventional exploration and production operations consist primarily of our existing producing fields, development of the La Garenne field and the development of additional identified targets. Our unconventional exploration operations consist primarily of the exploration of the prospective shale oil play within our Paris Basin acreage position. We believe the French fiscal regime presents attractive and stable terms, and we have ready access to existing infrastructure (pipelines) and end-markets (refineries) in the Paris Basin. The table below summarizes the acreage covered by the exploration permits and exploitation concessions we
4
Table of Contents
currently hold or for which we have applied. For a more detailed description of each permit, concession or application, see " — Permits, Concessions and Pending Applications."
| | | | | | | | | | | | |
Permit Name | | Working Interest | | Type | | Expiration Date | | Gross Acreage | |
|---|
Charmottes | | | 100 | % | Production | | October 24, 2013 | | | 9,019 | |
Chateaurenard | | | 100 | % | Production | | January 1, 2011* | | | 11,268 | |
St. Firmin Des Bois | | | 100 | % | Production | | January 1, 2011* | | | 3,973 | |
| | | | | | | Total Production | | | 24,260 | |
Courtenay | | | 100 | % | Exploration | | October 1, 2009* | | | 93,159 | |
Aufferville | | | 100 | % | Exploration | | June 16, 2010* | | | 33,112 | |
Nemours | | | 50 | % | Exploration | | June 16, 2013 | | | 47,197 | |
Malesherbes | | | 100 | % | Exploration | | March 30, 2010 | | | 65,977 | |
Rigny le Ferron | | | 100 | % | Exploration | | February 20, 2011 | | | 82,780 | |
Joigny | | | 100 | % | Exploration | | February 20, 2011 | | | 33,112 | |
Mairy | | | 30 | % | Exploration | | August 15, 2011 | | | 109,715 | |
Nogent sur Seine | | | 100 | % | Exploration | | August 8, 2012 | | | 65,730 | |
Chateau Thierry | | | 100 | % | Exploration | | October 24, 2014 | | | 192,495 | |
Leudon en Brie | | | 100 | % | Exploration | | August 8, 2012 | | | 25,946 | |
| | | | | | | Total Exploration | | | 749,222 | |
Plaisir | | | — | | Application | | | | | 32,618 | ** |
Nangis | | | — | | Application | | | | | 53,049 | ** |
Valence en Brie | | | — | | Application | | | | | 15,815 | ** |
Coulommiers | | | — | | Application | | | | | 81,545 | ** |
Fere en Tardenois | | | — | | Application | | | | | 239,890 | ** |
| | | | | | | Total Applications | | | 422,917 | |
| | TOTAL EXPLORATION (PERMITS AND APPLICATIONS) | | | 1,172,139 | *** |
- *
- Renewal application pending.
- **
- The application award process may result in Toreador receiving less than a 100% working interest in the pending applications or only part of the acreage represented by an application.
- ***
- Assuming successful applications.
Our production for 2009 was 328.4 mbbl, representing an average of approximately 900 bbl/d, from two areas for which we hold exploitation concessions: the Neocomian Complex and Charmottes fields (producing from the Dogger and Trias horizon). As of December 31, 2009, these fields represented 100% of our total proved reserves (5.8 MBbls).
All our production is currently sold to Total pursuant to an agreement signed with Elf Antar in 1996, as amended. Following an initial term expiring in 2002, the agreement automatically renews for one-year periods unless notice of termination is given at least six months in advance. The sale price is based on the monthly-average dated Brent price over the month of production, less a discount. In 2009, sales to Total, representing all of our oil production revenues, totaled $18.8 million.
We began drilling on the La Garenne well on November 12, 2009. The well confirmed a five-meter reservoir within a 50-meter oil column in the target Dogger formation. Based on our continued evaluation of the well results, We believe the well confirms a porous and hydrocarbon-bearing reservoir with a localized low-permeability area at the crest of the structure. We completed production testing of the well in
5
Table of Contents
January 2010, and the results were inconclusive. The well flowed only limited quantities from one of its two horizons in the Dogger. We intend to formulate a development plan for La Garenne following a more detailed analysis. We expect that the vertical well we drilled will be used as a water disposal or an injection well in the development of this field.
We have identified seven additional conventional potential fields: Rachée (on the pending Nangis application), Valence en Brie (on the pending Valence Brie application), Mairy (on the Mairy permit), L'Orme (on the Plaisir pending application), CR 76 Dogger (on the Chateaurenard concession), Les Colins (on the Courtenay permit, subject to renewal) and Arville (on the Aufferville permit). We have retained Beicip-Franlab to model the basin and fields and have retained Gaffney Cline on exploration inventory and enhanced recovery advice. Our ability to explore and develop these targeted fields will be subject to us obtaining additional funding.
In addition to our conventional exploration and production, we are also currently focused on exploiting our shale oil acreage in the Paris Basin. Our current priority is to execute a proof of concept program by drilling, completing and testing three pilot wells in the second half of 2010, subject to approval of drilling by the French government, for which the Company intends to submit an application by the end of March 2010. Toreador has retained RBC Capital Markets to manage a process to identify a potential partner to assist us, through a farm-out agreement or other means, in exploiting this acreage. To the extent we are able to identify and reach agreement with a partner, we believe that this process could be completed during the first half of 2010, with development intended to begin thereafter. There can be no assurance that we will be successful in obtaining a partner or achieving an alternative solution to proving the concept. If the process to obtain a partner to assist with this phase is unsuccessful, we may consider alternative solutions to attempt to prove the concept on our own, including by seeking alternative financing, hiring or engaging third parties or additional personnel with the appropriate technical capabilities or a joint venture or other arrangement with a service provider. The design of the following phases would be a function of the results of this pilot and sufficient funding.
Toreador believes that the Paris Basin presents attractive and stable fiscal terms. Mineral rights in France belong to the French State, and production of hydrocarbons occurs under a concession regime. Holders of a concession or production license must pay the French tax authorities a royalty proportional to the value of the products extracted. This royalty is paid starting from production. The royalty regime distinguishes between production from wells drilled before and after January 1, 1980 and is ring-fenced by production concession. Under current French regulation, the royalty payable is progressive and depends on annual production levels, with royalty rates currently ranging between 0% (below 50,000 tonnes, i.e., 970 bbl/d) and 12% (above 300,000 tonnes, i.e., 5,820 bbl/d) for post-1980 production. Production from pre-1980 wells is subject to an 8% royalty (below 50,000 tonnes), increasing to 30% (above 300,000 tonnes, i.e., 5,820 bbl/d).
Local mining taxes, or RCDM (redevance communale et départementale des mines), are also payable to the applicable administrative French county and municipality on whose territory the oil is produced. This local tax is determined by multiplying production by a unit rate, which is set each year by the Ministry of the Environment and Energy. The local mining tax is payable in arrears (tax for the production of 2008 is payable in 2010), is ring-fenced by well, and the regime distinguishes between fields entered into production before and after January 1, 1992. For the year 2009 (payable in 2011), the level of tax has been set at €16.51 per ton of oil equivalent to approximately $3.24 per bbl based on an exchange rate of 0.719,
6
Table of Contents
for pre-1992 production and €5.30 per ton of oil produced for post-1992 production, equivalent to approximately $1.04 per bbl based on an exchange rate of 0.719. Both the royalties and local mining taxes described above generally apply only to onshore fields; there is a reduced rate for offshore fields located less than one nautical mile from the coast (Toreador does not currently hold any permits covering offshore fields). Each of the taxes is deductible when determining the profit subject to French corporate tax. We are not required to pay surface rental or fees.
The Paris Basin is conveniently located to utilize existing French infrastructure. The Grandpuits refinery operated by Total is in the heart of the Paris Basin (approximately 30 miles south of the Chateau Thierry permit). Paris Basin crude oil production is currently approximately 11,000 bbl/d (as of December 31, 2009). Our current Paris Basin oil is trucked to the Grandpuits refinery operated by Total after being stored in on-site storage tanks. There is also a major pipeline operated by Lundin Petroleum from the Villeperdue field to the Grandpuits refinery, in which there is substantial free capacity.
Permits, Concessions and Pending Applications
Exploration Permits
We currently hold 10 exploration permits: Rigny le Ferron, Chateau Thierry, Aufferville, Nemours, Courtenay, Joigny, Malesherbes, Mairy, Nogent sur Seine and Leudon en Brie.
Under French mining law, an exploration permit gives the holder an exclusive right to explore and then produce hydrocarbons. Any area, offshore and onshore, which is not covered yet by such a permit may be subject to application at any time. An application for a permit, or a renewal of a permit, is awarded by ministerial order following an administrative consultation and a submission to the regulatory authorities. An exploration permit is initially granted for a period of up to five years and may be renewed twice for up to five years each time; however, the area covered by the permit is reduced by half at the first renewal and by a quarter of the remaining area at the second renewal. The permit holder may designate the areas to remain after such reduction, and in any event, the area covered by a permit may not be reduced below 175 km2. The exploration permits have minimum financial requirements, and if such obligations are not met, the permits could be subject to forfeiture. The renewal of a permit is generally granted, provided the holder has met all its obligations thereunder and has agreed to certain future financial commitments at least equal to the financial commitments made during the previous permit period.
We hold a 100% working interest in, and operate, the Rigny le Ferron permit, which covers approximately 82,780 acres. The existing seismic lines representing around 1,000 km2 were reprocessed and interpreted in 2008. Several Dogger prospects have been identified and mapped. Toreador began drilling on the La Garenne well on November 12, 2009. Toreador completed production testing of the well in January 2010, and the results were inconclusive. The well flowed only limited quantities from one of its two horizons in the Dogger. We intend to formulate a development plan for La Garenne following a more detailed analysis. See " — Conventional Exploration and Production — La Garenne." The Rigny le Ferron permit expires in 2011.
We hold a 100% working interest in, and operate, the Chateau Thierry permit, which covers approximately 192,495 acres. The Chateau Thierry permit expires in 2014.
7
Table of Contents
We hold a 100% working interest in, and operate, the Aufferville permit, which covers approximately 33,112 acres. After drilling the Ichy 1D dry hole in May 2007, the seismic lines have been entirely reprocessed and are being re-interpreted for delineating new attractive prospects at the Dogger objective. The Aufferville permit expires in June 2010. We have recently filed a renewal application on this permit to drill a Dogger prospect on this acreage in its third period of validity.
We hold a 50% working interest in the Nemours permit, which covers approximately 47,197 acres (23,598 net acres for our working interest) and is operated by Lundin Petroleum AB. A reassessment of the prospect potential is ongoing. The Nemours permit expires in 2013.
We hold a 100% working interest in, and operate, the Courtenay permit, which covers approximately 93,159 net acres located east of the Neocomian Complex. We filed a renewal application for the Courtenay permit in the first quarter of 2009 for an additional five-year period. We intend to farm out the Les Colins prospect, which is analogous to the CR76 Dogger prospect on the Neocomian concession.
We hold a 100% working interest in, and operate, the Joigny permit, which covers approximately 33,112 acres. Seismic interpretation is underway on the acreage to delineate prospects in the Portlandian limestone. The Joigny permit expires in 2011.
We hold a 100% working interest in, and operate, the Malesherbes permit, which covers approximately 65,977 acres. The Malesherbes permit expires on March 30, 2010, and the Company does not intend to renew the permit.
We currently hold a 30% working interest in the Mairy permit, which covers approximately 109,715 acres (32,914 net acres for our working interest) and is operated by Lundin Petroleum AB. The Mairy permit expires in 2011.
We hold a 100% working interest in, and operate, the Nogent sur Seine permit, which covers approximately 65,730 acres. All of the existing seismic coverage representing around 1,012 km2 has been purchased, and seismic reprocessing is expected to take place in 2010 to identify Dogger and Triassic prospects over this block. The Nogent sur Seine permit expires in 2012.
We hold a 100% working interest in, and operate, the Leudon en Brie permit, which covers approximately 25,946 acres. Reprocessing and reinterpretation of the 655 km2 grid of existing 2D seismic purchased in 2008 commenced in the first quarter of 2010 to identify Dogger and Triassic prospects. The Leudon en Brie permit expires in 2012.
8
Table of Contents
We currently hold two exploitation concessions covering two producing oil fields in the Paris Basin: the Neocomian Complex and Charmottes fields (Dogger and Trias). As of December 31, 2009, production from these oil fields represented substantially all of our revenue.
| | | | | | | | | | | | | |
| |
| | At December 31, 2009 | |
|---|
Property | | Permit Expiration
Year | | Total Proved
Reserves (mbbl) | | Post-Expiration
Proved Reserves
(mbbl) | | Percent of Proved
Reserves
Post-Expiration | |
|---|
Neocomian Fields | | | 2011 | * | | 5,418 | | | 5,153 | | | 95.11 | % |
Charmottes Field | | | 2013 | | | 387 | | | 348 | | | 89.92 | % |
- *
- Renewal application pending
Under French mining law, hydrocarbons may only be developed once a concession has been granted. During the exploration permit period, the permit holder has the exclusive right to obtain an exploitation concession. An exploitation concession is granted by decree, after a public enquiry, a local administrative consultation and a submission to the regulatory authorities. The decree sets forth the concession's perimeter and duration, which cannot exceed 50 years. To be awarded an exploitation concession, the applicant must, among other things, prove that it has the appropriate technical and financial capabilities to perform the operations and comply with regulations. An exploitation concession may be extended several times, each time for no longer than 25 years. An application for a renewal must be submitted two years before the expiration of the concession. The French government is not obligated to renew an exploitation concession, and such renewal would be subject to our satisfaction of technical and financial capability requirements.
Holders of a concession or production license must pay the French government a royalty proportional to the value of the products extracted. This royalty generally applies only to onshore fields and is backdated and paid when the concession is granted. It is deductible from the French corporate tax. Local mining taxes are also payable by the holder, and are determined by multiplying production by a unit rate, which is set each year by the regulatory authorities. These taxes also generally apply only to onshore fields; there is a reduced rate for offshore fields located less than one nautical mile from the coast (we do not currently hold any permits covering offshore fields). Mining taxes are deductible when determining profit subject to French corporate tax.
We hold a 100% working interest in, and operate, the two concessions (Chateaurenard and St. Firmin Des Bois) covering the Neocomian Complex, which consist of a group of four smaller field units. As of December 31, 2009, the complex had 80 producing oil wells, and production was approximately 782 bbl/d. An exploration prospect has been identified in the Dogger objective located 500 meters below the Neocomian producing reservoirs. The Chateaurenard concession, which covers approximately 11,268 acres, and the St. Firmin Des Bois concession, which covers approximately 3,973 acres, both expire in January 2011. Renewal applications for both permits were filed in December 2008 and are currently pending.
We hold a 100% working interest in, and operate, the Charmottes concession, which consists of two oil fields at different horizons (Dogger and Trias). As of December 31, 2009, the fields had seven producing oil wells, and production was approximately 117 bbl/d. The Charmottes concession, which covers approximately 9,019 acres, expires in October 2013.
9
Table of Contents
The application award process may result in Toreador getting less than a 100% working interest in the pending applications or only part of that application depending on competition for all or part of the acreage.
We filed an application in September 2008 (revised in December 2008) for the Plaisir permit, which covers approximately 32,618 acres.
We filed an application in January 2009 for the Nangis permit, which covers approximately 53,049 acres.
We filed an application in January 2009 for the Valence en Brie permit, which covers approximately 15,815 acres.
We filed an application in November 2008 for the Coulommiers permit, which covers approximately 81,545 acres.
We filed an application in August 2009 for the Fere en Tardenois permit, which covers approximately 239,890 acres.
Oil Reserves
Summary of Oil Reserves as of December 31, 2009 and 2008
The following table sets forth information about our estimated net proved reserves, probable reserves and possible reserves at December 31, 2009 and 2008 for our properties in France. Gaffney, Cline & Associates Ltd, an independent petroleum engineering firm in the United Kingdom ("GCA"), audited our proved developed reserves, proved undeveloped reserves, probable reserves, possible reserves and discounted present value (pretax) as of December 31, 2009, and LaRoche Petroleum Consultants, Ltd., an independent petroleum engineering firm in Dallas, Texas, prepared the estimates of proved developed reserves, proved undeveloped reserves, probable reserves, possible reserves and discounted present value (pretax) as of December 31, 2008. We prepared the estimate of standardized measure of proved reserves in accordance with FASB ASC 932,"Extractive Activities-Oil and Gas." No reserve reports have been provided to any governmental agencies.
| | | | | | | |
| | December 31, | |
|---|
| | 2009 | | 2008 | |
|---|
| | (MBbl)
| | (MBbl)
| |
|---|
Proved developed | | | 5,383 | | | 4,385 | |
Proved undeveloped | | | 420 | | | 529 | |
Total Proved | | | 5,803 | | | 4,914 | |
Probable | | | 3,333 | | | 3,492 | |
Possible | | | 5,202 | | | 370 | |
Our proved reserves at December 31, 2009 were 5.8 Mbbl. All of our proved reserves are located in the Paris Basin, France. The Neocomian Complex, one of our two producing assets, accounted for 93.31%
10
Table of Contents
of our proved reserves. The increase of our proved reserves from 4.9 Mbbl in 2008 to 5.8 Mbbl in 2009 can be correlated to a better long-term performance of the Neocomian Complex and a higher oil price (see " — Effect of Adoption").
Proved Reserves Disclosures
Recent SEC Rule-Making Activity In December 2008, the Securities and Exchange Commission ("SEC") announced that it had adopted amendments designed to modernize the oil and gas company reserves reporting requirements. The most significant amendments to the requirements include the following:
- •
- replacement of the year-end price with the average prices over 12 months to calculate reserve estimates;
- •
- inclusion of oil and gas extracted from nontraditional sources in reserve estimates;
- •
- permitted use of new technologies that meet the definition of "reliable" to determine oil and gas reserves and requirement to disclose which technologies the registrant used to determine reserves;
- •
- required disclosure of reserves by specific geographic area;
- •
- permitted disclosure of both probable and possible reserves, as defined, in addition to required disclosure of proved reserves;
- •
- requirement to include reports and related consents from third parties who prepare, audit, or perform a process review of the registrant's reserves estimates if the registrant discloses the involvement of third parties for such purposes.
We adopted these rules effective December 31, 2009 and requested GCA to provide us with a third-party opinion on our two producing assets, the Charmottes field and the Neocomian Complexes (see "Third-Party Reserves Audit" below for further detail).
Effect of Adoption Application of the new reserves rules resulted in the use of lower prices at December 31, 2009 for crude oil than would have been used under the previous rules. Nonetheless, given the low decline and the maturity of the Neocomian Complex, which accounted for 93.31% of our proved reserves, once a certain threshold price is reached, use of a higher oil price does not have a significant effect on our reserves estimates. Because the prices used under the new reserves rules already exceed this threshold price, reserves under the new rules are identical to the reserves under the previous rules.
Probable reserves are those additional reserves that are less certain to be recovered than proved reserves but which, together with proved reserves, are as likely as not to be recovered. When deterministic methods are used, it is as likely as not that actual remaining quantities recovered will exceed the sum of estimated proved plus probable reserves. When probabilistic methods are used, there should be at least a 50% probability that the actual quantities recovered will equal or exceed the proved plus probable reserves estimates. Probable reserves may be assigned to areas of a reservoir adjacent to proved reserves where data control or interpretations of available data are less certain, even if the interpreted reservoir continuity of structure or productivity does not meet the reasonable certainty criterion. Probable reserves may be assigned to areas that are structurally higher than the proved area if these areas are in communication with the proved reservoir. Probable reserves estimates also include potential incremental quantities associated with a greater percentage recovery of the hydrocarbons in place than assumed for proved reserves.
Possible reserves are those additional reserves that are less certain to be recovered than probable reserves. When deterministic methods are used, the total quantities ultimately recovered from a project have a low probability of exceeding proved plus probable plus possible reserves. When probabilistic methods are used, there should be at least a 10% probability that the total quantities ultimately recovered
11
Table of Contents
will equal or exceed the proved plus probable plus possible reserves estimates. Possible reserves may be assigned to areas of a reservoir adjacent to probable reserves where data control and interpretations of available data are progressively less certain. Frequently, this will be in areas where geoscience and engineering data are unable to define clearly the area and vertical limits of commercial production from the reservoir by a defined project. Possible reserves also include incremental quantities associated with a greater percentage recovery of the hydrocarbons in place than the recovery quantities assumed for probable reserves.
Internal Controls Over Reserves Estimates
Our policies regarding internal controls over the recording of reserves estimates require reserves to be in compliance with the SEC definitions and guidance and prepared in accordance with generally accepted petroleum engineering principles. Responsibility for compliance in reserves bookings is delegated to a qualified petroleum engineer in our Paris office under the supervision of the Country Manager for France and our Chief Executive Officer. The petroleum engineer has more than 10 years experience in various aspects of reservoir engineering in different basins in the world, particularly the Middle East and North Africa regions. He holds an engineering degree completed with an advance degree in Petroleum engineering. He prepares all reserves estimates for our two producing assets. Data used in these integrated assessments include information obtained directly from the subsurface via wellbores such as well logs, reservoir cores, fluid samples, static and dynamic information, production test data and production history. Other type of data used include 2D seismic recently reprocessed and calibrated to available well control. The tools used to interpret the data included reservoir modeling and simulation, Decline Curve Analyses and data analysis packages. We engage a third-party petroleum consulting firm (GCA) to audit all of our reserves. See "Third-Party Reserves Audit" below.
Third-Party Reserves Audit
The reserves audit for the year ending December 31, 2009 was performed by Gaffney, Cline & Associates ("GCA"), a leading international petroleum engineering consultancy.
GCA carried out an audit of the oil and gas reserves of the Paris Basin producing assets owned by Toreador as at December 31, 2009: the Neocomian Complex and Charmottes Fields. The audit was carried out in accordance with SEC rules, as amended as described above. Toreador provided to GCA a data set of technical information, including geological, geophysical and engineering data and reports, together with financial data and development plans. In carrying out its review, GCA relied on the accuracy and completeness of the information received from Toreador and did not independently verify the accuracy and completeness of information and data furnished by us with respect to ownership interests, oil and gas production, well test data, historical costs of operation and development, product prices, or any agreements relating to current and future operations of the fields and sales of production.
GCA noted in its report that the concessions that cover the Neocomian Complex and Charmottes fields expire in 2011 and 2013, respectively. Under French law, exploitation concessions can be generally be renewed for periods of up to 25 years. Although the French government has no obligation to renew the exploitation permits, renewals have been generally granted as long as the operator demonstrates continued financial and technical capabilities to operate under such permits. Toreador applied for a renewal of the concessions covering the Neocomian Complex in December 2008 and intends to apply for a renewal of the concession covering the Charmottes fields in 2010. GCA has assumed for purposes of its report that such renewals will be granted and that the economic terms of the concessions will not be altered on renewal.
GCA determined that our estimates of reserves conform to the guidelines of the SEC, including the criteria of "reasonable certainty," as it pertains to expectations about the recoverability of reserves in future years, under existing economic and operating conditions, consistent with the definition in the recently amended Rule 4-10(a) of Regulation S-X. GCA issued an unqualified audit opinion on our proved reserves at December 31, 2009, based upon its evaluation. The GCA opinion concluded that our estimates
12
Table of Contents
of proved, probable and possible reserves were, in aggregate, reasonable and have been prepared in accordance with generally accepted petroleum engineering and evaluation principles. GCA's report is attached to this Annual Report on Form 10-K as an exhibit.
The technical personnel at GCA responsible for overseeing the audit of our reserves estimate are Brian Rhodes and Chris Freeman. Mr. Rhodes holds a B.Sc (Hons) Geology, is a member of the Energy Institute, the Petroleum Exploration Society of Great Britain, the Society of Petroleum Engineers and the European Association of Geoscientists and Engineers, and has more than 33 years industry experience. Dr. Freeman has nearly 30 years of Industry experience, holds a B.Sc. (Hons) Physics from Lancaster University, a Ph.D. from the University of Cambridge, an MBA from Cass Business School in London, he has been a member of the Society of Petroleum Engineers (SPE) for over 25 years, and is a member of the Petroleum Exploration Society of Great Britain, and the Energy Institute.
As of December 31, 2009, our proved undeveloped reserves ("PUDs") totaled 420 MBBL of crude oil, all of which were associated with the Neocomian fields. As of December 31, 2009, PUDs represented approximately 7.3% of our total proved reserves. The change in our PUDs from 529 MBBL in 2008 to 420 MBBL in 2009 was due to a reclassification from proved undeveloped reserves to probable reserves of approximately 108 MBBL that are not scheduled to be developed within five years. We currently estimate that future development costs relating to the development of these PUDs are projected to be approximately $1.3 million in 2010, $1.3 million in 2011 and $2.6 million in 2012. No activity was undertaken in 2009 to convert PUDs to proved developed reserves.
Productive Wells
The following table shows our gross and net interests in productive oil wells as of December 31, 2009. Productive wells include wells currently producing or capable of production.
| | | | | | | | | | | | | | | | | | | |
| | Gross(1) | | Net(2) | |
|---|
| | Oil | | Gas | | Total | | Oil | | Gas | | Total | |
|---|
France | | | 131 | | | — | | | 131 | | | 131 | | | — | | | 131 | |
- (1)
- "Gross" refers to wells in which we have a working interest.
- (2)
- "Net" refers to the aggregate of our percentage working interest in gross wells before royalties, before or after payout, as appropriate.
Acreage
The following table shows the developed and undeveloped acreage attributable to our ownership as of December 31, 2009.
| | | | | | | | | | | | | | | | | | | |
| | Developed Acreage | | Undeveloped Acreage | | Total Acreage | |
|---|
| | Gross | | Net | | Gross | | Net | | Gross | | Net | |
|---|
France | | | 24,260 | | | 24,260 | | | 749,222 | | | 648,824 | | | 773,482 | | | 673,084 | |
Undeveloped acreage includes only those acres on which wells have not been drilled or completed to permit the production of commercial quantities of oil and natural gas regardless of whether or not the acreage contains proved reserves.
13
Table of Contents
Drilling and Other Exploratory and Development Activities
The following table shows our drilling activities on a gross and net basis for the years ended 2009, 2008 and 2007.
| | | | | | | | | | | | | | | | | | | | |
| | Year ended December 31, | |
|---|
| | 2009 | | 2008 | | 2007 | |
|---|
| | Gross(1) | | Net(2) | | Gross(1) | | Net(2) | | Gross(1) | | Net(2) | |
|---|
FRANCE | | | | | | | | | | | | | | | | | | | |
Exploratory: | | | 1 | | | 1 | | | | | | | | | | | | | |
| | Abandoned(3) | | | | | | | | | — | | | — | | | 2 | | | 2.00 | |
- (1)
- "Gross" is the number of wells in which we have a working interest.
- (2)
- "Net" is the aggregate obtained by multiplying each gross well by our after payout percentage working interest.
- (3)
- "Abandoned" means wells that were dry when drilled and were abandoned without production casing being run.
Production, Production Prices and Costs
The following table summarizes our oil production, net of royalties, for the periods indicated for France. It also summarizes calculations of our total average unit sales prices and unit costs.
| | | | | | | | | | |
| | For the Year Ended December 31, | |
|---|
| | 2009 | | 2008 | | 2007 | |
|---|
Production: | | | | | | | | | | |
Oil (Bbls) | | | 328,416 | | | 365,361 | | | 383,341 | |
Daily average (Bbls/Day) | | | 900 | | | 1,001 | | | 1,050 | |
Unit prices: | | | | | | | | | | |
Average oil price ($/Bbl) | | $ | 57.17 | | $ | 93.32 | | $ | 67.49 | |
Unit costs ($/BOE): | | | | | | | | | | |
Lease operating | | $ | 25.57 | | $ | 25.35 | | $ | 19.16 | |
Exploration and acquisition | | | — | | | 0.39 | | | 2.23 | |
Depreciation, depletion and amortization | | | 16.66 | | | 12.83 | | | 10.79 | |
Dry hole costs | | | — | | | — | | | 10.01 | |
General and administrative | | | 11.25 | | | 3.54 | | | 7.39 | |
| | | | | | | | |
Total | | $ | 53.48 | | $ | 42.11 | | $ | 49.58 | |
| | | | | | | | |
Office Leases
We occupy 23,297 square feet of office space at 13760 Noel Rd., Suite 1100, Dallas, Texas 75240. The lease for this space became effective on October 1, 2007 and is for seven years, and the average monthly rental is $33,050 per month for the term of the lease. In July 2009, we subleased approximately 16,638 square feet of our Dallas office due to the relocation of corporate headquarters to Paris, France. We received approximately $103,987 from the sublease in 2009, which was recorded as a reduction in rent expense. We also lease 3,218 square feet of office space in Paris, France. The lease expires on December 1, 2010 and rent is $16,795 per month. Total rental expense for 2009 was approximately $442,144.
14
Table of Contents
Markets and Competition
All our production is currently sold to Total, the largest purchaser in the Paris Basin, pursuant to an agreement signed with Elf Antar in 1996, as amended. Following an initial term expiring in 2002, the agreement automatically renews for one-year periods unless notice of termination is given at least six months in advance. The sale price is based on the monthly-average dated Brent price over the month of production, less a discount. In 2009, sales to Total, representing all of our oil production net revenues, totaled $18.8 million and represented 98% of our total revenue. In 2008 and 2007, sales to Total represented all of our oil production revenues from France, totaled $34.1 million and $25.9 million, respectively, and represented 99% and 99%, respectively, of our total revenue. This production is shipped by truck to a nearby Total refinery.
The oil and natural gas industry is highly competitive. We encounter strong competition from other independent operators and from major oil companies in acquiring exploration permits and exploitation concessions, contracting for drilling equipment and securing trained personnel. Many of these competitors have financial and technical resources and staffs substantially larger than those available to us. As a result, our competitors may secure desirable permits and concessions, and they may pay more to evaluate, bid for and purchase a greater number of permits and concessions or prospects than our financial or personnel resources permit us to do.
We are also affected by competition for drilling rigs and the availability of tubular goods and certain other equipment. While the oil and natural gas industry has experienced shortages of drilling rigs and equipment, pipe and personnel in the past, we are not presently experiencing any shortages and do not foresee any such shortages in the near future; however, we are unable to predict how long current market conditions will continue.
Competition for attractive oil permits and concessions and drilling rights is also strong, and we can give no assurance we will be able to compete satisfactorily in acquiring these permits and concessions. Since many major oil companies have publicly indicated their decision to focus on non-U.S. activities, we cannot ensure we will be successful in acquiring any such permits and concessions.
Government Regulation
Toreador currently operates solely in France. The oil and natural gas industry is subject to extensive and continually changing regulations on environmental, drilling, production, transportation and sale matters, which can increase the cost of doing business, and consequently, may affect profitability. These laws and regulations may, among other things:
- •
- require acquisition of a permit before drilling commences;
- •
- set the methods of drilling and casing wells;
- •
- restrict the types, quantities and concentrations of various materials that can be released into the environment in connection with drilling and production activities;
- •
- require installation of expensive pollution control equipment;
- •
- require a special license for the transportation of hydrocarbons;
- •
- limit or prohibit construction or drilling activities in certain ecologically sensitive and other protected areas; and
- •
- require remedial measures to mitigate pollution from historical and ongoing operations.
Failure to comply with these laws and regulations or to obtain or comply with permits may result in the assessment of administrative, civil and criminal penalties, imposition of remedial requirements and the imposition of injunctions to force future compliance. See also " — Fiscal Terms and Infrastructure."
15
Table of Contents
Our activities are affected by political stability and government regulations relating to foreign investment and the oil and natural gas industry. Changes in these regulations or shifts in political attitudes are beyond our control and may adversely affect our business. Our operations may be affected by government regulations with respect to restrictions on production, price controls, income taxes, expropriation of property, environmental legislation and mine safety.
Our current or future operations, including exploration and development activities on our acreage, require permits from various governmental authorities, and such operations are and will be governed by laws and regulations governing prospecting, development, production, taxes, labor standards, occupational health, waste disposal, toxic substances, land use, environmental protection and other matters. Compliance with these requirements may prove to be difficult and expensive. See "Risk Factors" for further information regarding government regulation.
The oil and natural gas industry is subject to extensive and varying environmental regulations in each of the jurisdictions in which we have historically operated or in which we currently, or may in the future, operate. Environmental regulations establish standards respecting health, safety and environmental matters and place restrictions and prohibitions on emissions of various substances produced concurrently with oil and natural gas. These regulations can have an impact on the selection of drilling locations and facilities, potentially resulting in increased capital expenditures. In addition, environmental legislation may require those wells and production facilities to be abandoned and sites reclaimed to the satisfaction of local authorities.
Our operations are subject to various laws and regulations controlling the discharge of materials into the environment or otherwise relating to the protection of the environment. Such laws and regulations not only expose us to liability for our own negligence, but also may expose us to liability for the conduct of others or for our actions that were in compliance with all applicable laws at the time those actions were taken. We may incur significant costs as a result of environmental accidents, such as oil spills, natural gas leaks, ruptures, or discharges of hazardous materials into the environment, including clean-up costs and fines or penalties. Additionally, we may incur significant costs in order to comply with environmental laws and regulations and may be forced to pay fines or penalties if we do not comply. In addition, future climate change regulation, a subject of discussion in many jurisdictions currently, could require us to incur increased operating costs and could adversely affect the price or market demand for the oil that we produce. See "Risk Factors" for further information regarding environmental regulation.
We are committed to complying with environmental and operation legislation wherever we operate.
In order to carry out exploration and development of mineral interests or to place these into commercial production, we are required to obtain certain licenses and concessions from governmental authorities. There can be no guarantee that we will be able to obtain all necessary licenses and concessions that may be required. In addition, such licenses and concessions are subject to change and there can be no assurances that any application to renew any existing licenses or concessions will be approved. See " — Permits, Concessions and Pending Applications" for a description of our permits and concessions, and see "Risk Factors" for further information regarding renewal of such permits and concessions.
Currently, there are no restrictions on the repatriation of earnings or capital to foreign entities from France. However, there can be no assurance that any such restrictions on repatriation of earnings or capital from the aforementioned countries or any other country where we may invest will not be imposed in the future.
16
Table of Contents
As of March 12, 2010, we employed 35 full-time employees. None of our employees are represented by unions or covered by collective bargaining agreements. To date, we have not experienced any strikes or work stoppages due to labor problems, and we believe that we have good relations with our employees. As needed, we also utilize the services of independent consultants on a contract basis.
Segment Reporting
See Note 16 in the Notes to Consolidated Financial Statements for information about oil producing activities and operating segments.
Internet Address/Availability of Reports
Our Annual Reports on Form 10-K, Quarterly Reports on Form 10-Q, Current Reports on Form 8-K and amendments to those reports filed or furnished pursuant to Section 13(a) or 15(d) of the Securities Exchange Act of 1934, as amended (the "Exchange Act"), are made available free of charge on our website athttp://www.toreador.net as soon as reasonably practicable after we electronically file such material with, or otherwise furnish it to, the SEC.
Glossary of Selected Oil and Natural Gas Terms
"2D"or"2D SEISMIC." An exploration method of sending energy waves or sound waves into the earth and recording the wave reflections to indicate the type, size, shape, and depth of subsurface rock formations. 2D seismic provides a two dimensional representation along the profile of the line as it was shot. 2D surveys are measured in kilometers or miles.
"3D" or"3D SEISMIC." An exploration method of sending energy waves or sound waves into the earth and recording the wave reflections to indicate the type, size, shape, and depth of subsurface rock formations. 3D seismic lines are shot very close together. This allows for the ability for computers to generate seismic profiles in any direction and form 3D surfaces. 3D surveys are measured in square kilometers or square miles.
"BBL." One stock tank barrel, or 42 U.S. gallons liquid volume, used herein in reference to crude oil or other liquid hydrocarbons.
"BBL/D." Bbl per day.
"BOE." Barrels of oil equivalent.
"DEVELOPED OIL AND GAS RESERVES." Reserves of any category that can be expected to be recovered (i) through existing wells with existing equipment and operating methods or in which the cost of the required equipment is relatively minor compared to the cost of a new well and (ii) through installed extraction equipment and infrastructure operational at the time of the reserves estimate if the extraction is by means not involving a well.
"DEVELOPMENT WELL." A well drilled within the proved area of an oil or gas reservoir to the depth of a stratigraphic horizon known to be productive.
"DISCOUNTED PRESENT VALUE." The present value of proved reserves is an estimate of the discounted future net cash flows from each property at the specified date, or as otherwise indicated. Net cash flow is defined as net revenues, after deducting production and ad valorem taxes, less future capital costs and operating expenses, but before deducting federal income taxes. The future net cash flows have been discounted at an annual rate of 10% to determine their "present value." The present value is shown to indicate the effect of time on the value of the revenue stream and should not be construed as being the fair market value of the properties. In accordance with SEC rules, estimates have been made using constant oil and natural gas prices calculated based on unweighted arithmetic average of the first day of
17
Table of Contents
the month price during the 12-month period on the specified date and operating costs in effect at the specified date, or as otherwise indicated.
"DRY HOLE." A development or exploratory well found to be incapable of producing either oil or natural gas in sufficient quantities to justify completion as an oil or natural gas well.
"EXPLORATORY WELL." A well drilled to find a new field or to find a new reservoir in a field previously found to be productive of oil or gas in another reservoir.
"GROSS ACRES" or"GROSS WELLS." The total number of acres or wells, as the case may be, in which a working or any type of royalty interest is owned.
"KM." One kilometer.
"MBBL." One thousand bbl.
"MBBLS." One million bbl.
"MBOE." One thousand boe.
"MCF." One thousand cubic feet of natural gas.
"MMCF" One million cubic feet of natural gas.
"NET ACRES." The sum of the fractional working or any type of royalty interests owned in gross acres.
"PERMIT." An area onshore or offshore that comprises a contiguous acreage, or leasehold, position on which an operator drills exploratory and/or development wells. Sometimes designated as a "lease" or "block."
"POSSIBLE RESERVES." Those additional reserves that are less certain to be recovered than probable reserves.
"PROBABLE RESERVES." Those additional reserves that are less certain to be recovered than proved reserves but which, together with proved reserves, are as likely as not to be recovered.
"PRODUCING WELL" or"PRODUCTIVE WELL." A well that is capable of producing oil or natural gas in economic quantities.
"PROVED RESERVES." The estimated quantities of oil and gas, which, by analysis of geoscience and engineering data, can be estimated with reasonable certainty to be economically producible — from a given date forward, from known reservoirs, and under existing economic conditions, operating methods, and government regulations — prior to the time at which contracts providing the right to operate expire, unless evidence indicates that renewal is reasonably certain, regardless of whether deterministic or probabilistic methods are used for the estimation.
"ROYALTY INTEREST." An interest in an oil and natural gas property entitling the owner to a share of oil and natural gas production free of production costs.
"UNDEVELOPED ACREAGE." Lease acreage on which wells have not been drilled or completed to a point that would permit the production of commercial quantities of oil and natural gas regardless of whether such acreage contains proved reserves.
"UNDEVELOPED OIL AND GAS RESERVES." Reserves of any category that are expected to be recovered from new wells on undrilled acreage, or from existing wells where a relatively major expenditure is required for recompletion.
"WORKING INTEREST." The operating interest (not necessarily as operator) that gives the owner the right to drill, produce and conduct operating activities on the property and a share of production, subject to all royalties, overriding royalties and other burdens, and to all exploration, development and operational costs including all risks in connection therewith.
18
Table of Contents
Item 1A. Risk Factors
Risks Related to Our Company
We may require additional capital in the future, which may not be available on favorable terms, if at all.
We may require additional capital in 2010 and beyond to, among other things to execute our business plan, which would entail substantial capital expenditures. Under French law, each of our exploration permits and exploitation concessions require that we commit to expenditures of a certain amount over the period of the applicable permit or concession. Though we consider these amounts discretionary, such expenditures would be required to renew such permits.
We currently have a limited amount of oil production in France, and the revenues from our current production are not expected to be sufficient to cover all of the costs that would be necessary to explore and develop all our existing permits. Accordingly, we will continue to rely, to the extent available, on existing working capital and additional funds obtained from external sources, including potential strategic partners, to cover these costs. If these resources are unavailable, we may be required to curtail our drilling, development and other activities. If we are unable to identify a strategic partner for development of our Paris Basin shale oil acreage, we will be required to delay such development until we are able to secure alternative financing. See " — If we are unable to obtain a strategic partner, we will need to pursue alternatives to implement our proof of concept program, including seeking alternative financing to proceed with, and hiring or engaging third-party personnel with the appropriate technical capabilities to pursue, our proof of concept program."
The amount and timing of our future capital requirements will depend upon a number of factors, including:
- •
- drilling results and costs;
- •
- transportation costs;
- •
- equipment costs and availability;
- •
- marketing expenses;
- •
- oil prices;
- •
- requirements and commitments under existing permits;
- •
- staffing levels and competitive conditions;
- •
- any purchases or dispositions of assets; and
- •
- other factors affecting our business at any given time.
To the extent that our existing capital and borrowing capabilities are insufficient to meet these requirements and cover any losses, we will need to raise additional funds through debt or equity financings, including offerings of our common stock, securities convertible into our common stock or rights to acquire our common stock, or revise our business plan and/or curtail our growth. Any equity or debt financing or additional borrowings, if available at all, may be on terms that are not favorable to us. In addition, the New Convertible Senior Notes limit our ability to incur or increase our debt based on our proved plus probable reserves. Under the terms of the New Convertible Senior Notes, we may not maintain total consolidated net debt, or incur debt, in excess of the product of (x) $7.00 and (y) the number of barrels of our proved plus probable reserves, except for nonrecourse financing for projects or acquisitions, joint ventures or partnerships and certain other permitted debt. Any securities we issue in future financings may have rights, preferences and privileges that are senior to those of our common stock. If our need for capital arises because of significant losses, the occurrence of these losses may make it more difficult for us to raise the necessary capital. If we cannot raise funds on acceptable terms if and when needed, we may not be able to
19
Table of Contents
take advantage of future opportunities, grow our business or respond to competitive pressures or unanticipated requirements.
Our ability to raise additional capital will depend on the results of our operations and the status of various capital and industry markets at the time we seek such capital. Our failure or inability to obtain any required additional financing on favorable terms could materially and adversely affect our growth, cash flow and earnings, including our ability to meet our capital expenditures budget.
In addition, if we issue additional equity securities, including upon conversion of our existing or any future convertible or similar securities, the value of currently outstanding common stock may be diluted and the trading price of our common stock may be adversely affected. See " — Risks Related to Our Common Stock — We may issue equity securities that may depress the trading price of our common stock and may dilute the interests of our existing stockholders."
We may not be able to maintain or renew our existing exploration permits or exploitation concessions or obtain new ones, which could reduce our proved reserves.
We do not hold title to our properties in France but hold exploration permits and exploitation concessions granted by the French government. Under French law, each exploration permit requires us to commit expenditures of a certain amount of exploration costs and is subject to renewal after the initial term of up to five years. Under French law, each exploitation concession requires a similar commitment of expenditure and is granted for up to 50 years.
We currently hold two exploitation concessions covering two producing oil fields in the Paris Basin — the Neocomian Complex (Chateaurenard and St. Firmin Des Bois) and Charmottes fields. The production from these oil fields currently represents substantially all of our revenue. We estimate that, as of December 31, 2009, 95.11% and 89.92% of our proved reserves from the Neocomian Complex and Charmottes fields, respectively, are to be recovered after the expiration of the applicable concession. The Neocomian Complex concessions expire in January 2011, and we have filed renewal applications for each. We have also filed renewal applications for exploration permits that expired in 2009 (Courtenay) or expire in 2010 (Aufferville). These renewal applications are currently pending with the French government.
There can be no assurance that we will be able to renew any of these permits or concessions when they expire, convert exploration permits into exploitation concessions or obtain additional permits or concessions in the future. If we do not satisfy the French government that we have financial and technical capacities necessary to operate under such permits, such permits or concessions may be withdrawn and/or not renewed. If we cannot renew some or all of these permits or concessions when they expire or convert exploration permits into exploitation concessions, we will not be able to include the proved reserves associated with the permit or concession and we will be unable to engage in production to recover reserves, which production currently represents substantially all of our revenue. Any such negative developments with respect to our permits would have a material adverse effect on our ability to conduct our business.
Our indebtedness and near-term debt obligations could materially adversely affect our financial health, limit our ability to finance capital expenditures and future acquisitions and prevent us from executing our business plan.
On February 1, 2010, we had approximately $32.4 million aggregate principal amount outstanding of our 5.00% Convertible Senior Notes and $31.6 million outstanding aggregate principal amount of our New Convertible Senior Notes. Our level of indebtedness has, or could have, important consequences to investors, because:
- •
- a substantial portion of our cash flows from operations will have to be dedicated to interest and principal payments and may not be available for operations, working capital, capital expenditures, expansion, acquisitions or general corporate or other purposes;
- •
- it may impair our ability to obtain additional financing in the future for acquisitions, capital expenditures or general corporate purposes;
20
Table of Contents
- •
- it may limit our flexibility in planning for, or reacting to, changes in our business and industry; and
- •
- we may be substantially more leveraged than some of our competitors, which may place us at a relative competitive disadvantage and make us more vulnerable to downturns in our business, our industry or the economy in general.
In addition, the terms of our New Convertible Senior Notes restrict, and the terms of any future indebtedness, including any future credit facility, may restrict, our ability to incur additional indebtedness because of debt or financial covenants we are, or may be, required to meet. Under the terms of the New Convertible Senior Notes, we may not maintain total consolidated net debt, or incur debt, in excess of the product of (x) $7.00 and (y) the number of barrels of our proved plus probable reserves, except for nonrecourse financing for projects or acquisitions, joint ventures or partnerships and certain other permitted debt. Thus, we may not be able to obtain sufficient capital to grow our business or implement our business strategy and may lose opportunities to acquire interests in oil properties or related businesses because of our inability to fund such growth.
Our ability to comply with restrictions and covenants, including those in our New Convertible Senior Notes or in any future credit facility, is uncertain and will be affected by the level of our proved plus probable reserves, the levels of cash flow from our operations, and events or circumstances beyond our control. Our failure to comply with any of the restrictions and covenants could result in a default, which could permit the lender to accelerate repayments and foreclose on the collateral securing the indebtedness.
If we are unable to obtain a strategic partner, we will need to pursue alternatives to implement our proof of concept program, including by seeking alternative financing to proceed with, and hiring or engaging personnel with the appropriate technical capabilities to pursue, our proof of concept program.
We are currently in the process of identifying a potential partner to assist with the proof of concept program for the development of the shale oil play within our Paris Basin acreage. If we are not able to obtain a strategic partner for our proof of concept program for the development of the shale oil play within our Paris Basin acreage, we will need to pursue alternatives to implement our proof of concept program and/or reconsider our planned capital expenditures for the near term. Alternatives to a strategic partnership include seeking alternative financing, hiring or engaging third parties or additional personnel with the appropriate technical capabilities or a joint venture or other arrangement with a service provider. If we are not able to obtain such financing and/or retain such personnel on a timely basis, or at all, it could have a material adverse effect on our operations. We may also need to reconsider our planned capital expenditure program to reduce or eliminate all or a portion of our discretionary expenditures in the near term.
We have incurred net losses in recent years, and there can be no assurance we will be profitable in the future.
Our future financial results are uncertain. We incurred net losses of approximately $25.4 million, $108.6 million and $74.6 million in the years ended December 31, 2009, 2008 and 2007, respectively. Our strategy includes reduction in operational costs and seeking and maintaining an optimal capital structure; however, there can be no assurance that our strategy will be effective or that we will be profitable in the future.
Our future success as an oil producer depends upon our ability to find, develop and acquire additional oil reserves that are profitable. Oil reserves are depleting assets, and production of oil from properties declines as reserves are depleted with the rate of decline depending on reservoir characteristics. If we are unable to conduct successful exploration or development activities or acquire properties containing proved reserves, our proved reserves generally will decline as the reserves are produced, and our level of production, revenues and cash flows will be adversely affected. Replacing our reserves through exploration or development activities or acquisitions will require significant capital, which may not be available to us.
21
Table of Contents
This risk may be compounded by the fact that as of December 31, 2009, 7.3% of our total estimated proved reserves were classified as undeveloped, which, by their nature, are less certain and will require significant capital expenditures and successful drilling operations.
Since we do not hold title to our properties but rather hold exploration permits and exploitation concessions granted to us by the French government, the SEC may require that a portion of reported proved reserves associated with these permits not be included in our proved reserves.
Rather than holding title to our properties, we hold exploration permits and exploitation concessions that have been granted to us by the French government for a specific time period. We must apply to have these permits renewed and extended in order to continue our exploration and development rights. Although we have historically reported our proved reserves assuming that the permits will be extended in due course, the SEC may take the view that our ability to renew and extend our permits past their current expiration dates is not sufficiently certain for us to include the reserves that may be produced post-expiration in our total proved reserves. Although we have previously been able to provide support to the SEC regarding the likelihood of extension, no assurance can be given that the SEC will allow us to continue to include these additional reserves in our proved reserves.
The loss of the current single purchaser of our oil production could have a material adverse effect on our financial condition and results of operations.
For the year ended December 31, 2009, Total accounted for all of our revenues from oil production in France. Our contract with Total was signed in 1996 (then with Elf Antar) and automatically renews for one-year periods unless notice of termination is given at least six months in advance. If Total determines not to renew this contract, ceases purchasing our oil on terms that are favorable to us or fails to pay us and we are unable to contract with another purchaser, it would have a material adverse effect on our financial condition, future cash flows and the results of operations. This customer concentration may also increase our overall exposure to credit risk.
Hedging activities may require us to make significant payments that are not offset by sales of production and may prevent us from benefiting from increases in oil prices.
We currently, and may in the future, enter into various hedging transactions for a portion of our production in an attempt to reduce our exposure to the volatility of oil prices. In a typical hedge transaction, we will have the right to receive from the counterparty to the hedge the excess of the fixed price specified in the hedge over a floating price based on a market index, multiplied by the quantity hedged. If the floating price exceeds the fixed price, we will be required to pay the counterparty this difference multiplied by the quantity hedged. In such case, we will be required to pay the difference regardless of whether we have sufficient production to cover the quantities specified in the hedge. Significant reductions in production at times when the floating price exceeds the fixed price could require us to make payments under the hedge agreements even though such payments are not offset by sales of production. Hedging also could prevent us from receiving the full advantage of increases in oil prices above the fixed amount specified in the hedge.
We depend on our senior management team and other key personnel. Accordingly, the loss of any of these individuals could adversely affect our business, financial condition and results of operations and future growth.
Our success is largely dependent on the skills, experience and efforts of our senior management and other key personnel. Although we have entered into employment agreements with our Chief Executive Officer and Chief Financial Officer, we can give no assurance that either of these individuals will remain with us. The loss of the services of either of these individuals or other employees with critical skills needed to operate our business could have a negative effect on our business, financial conditions and results of operations and future growth. Our ability to manage our growth, if any, will require us to continue to train, motivate and manage our employees and to attract, motivate and retain additional qualified personnel.
22
Table of Contents
Competition for these types of personnel is intense in our industry, and we may not be successful in attracting, assimilating and retaining the personnel required to grow and operate our business profitably.
It may not be possible to serve process on our directors and officers or enforce judgments against them or us.
Many of our directors and executive officers live outside of the United States. Most of the assets of certain of our directors and executive officers and substantially all of our assets are located outside of the United States. As a result, it may not be possible to serve process on such persons in the United States or to enforce judgments obtained in U.S. courts against them based on the civil liability provisions of the securities laws of the United States.
Our operations are in France and we have previously operated in other international jurisdictions and we are subject to political, economic and legal risks and other uncertainties.
Our operations are in France and we have previously operated in other international jurisdictions, including through joint venture arrangements with parties in various international jurisdictions. We are, and have been, subject to the following risks and uncertainties that can affect our international operations adversely:
- •
- the risk of expropriation, nationalization, war, revolution, border disputes, renegotiation or modification of existing contracts, and import, export and transportation regulations and tariffs;
- •
- taxation policies, including royalty and tax increases and retroactive tax claims;
- •
- exchange controls, currency fluctuations and other uncertainties arising out of non-U.S. government sovereignty over international operations;
- •
- laws and policies of the United States affecting foreign trade, taxation and investment;
- •
- the possibility of being subjected to the exclusive jurisdiction of non-U.S. courts in connection with legal disputes and the possible inability to subject non-U.S. persons to the jurisdiction of courts in the United States; and
- •
- the possibility of restrictions on repatriation of earnings or capital from foreign countries.
Further, our non-U.S. operations and international business relationships are subject to laws and regulations that may restrict activities involving restricted countries, organizations, entities and persons that have been identified as unlawful actors or that are subject to U.S. economic sanctions. If we are not in compliance with any such applicable laws and regulations or U.S. economic sanctions, we may be subject to civil or criminal penalties and other remedial measures.
All of our revenues are currently attributable to our properties in the Paris Basin in France. Any disruption in production, development or our ability to produce and sell oil in France would have a material adverse effect on our results of operations or reduce future revenues.
All of our revenues are currently attributable to our properties in the Paris Basin in France. We depend on third parties in France for the transportation and refining of our oil production. Any disruption in production, development or our ability to produce and sell oil in France would have a material adverse effect on our results of operations or reduce future revenues. If production of oil in the Paris Basin were disrupted or curtailed, or in the case of labor or other disruptions affecting French refineries, transportation or other infrastructure, our cash flows and revenues would be significantly reduced.
We currently have operations involving the U.S. dollar and Euro, and we are subject to fluctuations in the value of the U.S. dollar as compared to the Euro. While our oil sales are calculated on a U.S. dollar basis, our expenditures are in Euro and we are exposed to the risk that the values of our French assets will
23
Table of Contents
decrease and that the amounts of our French liabilities will increase. These currency fluctuations, including the recent fluctuations, may adversely affect our results of operations. We do not currently hedge our exposure to currency fluctuations.
We have identified a material weakness in our internal control over financial reporting. Failure to maintain effective internal controls could have a material adverse effect on our operations and our stock price.
We are subject to Section 404 of the Sarbanes-Oxley Act of 2002, which requires an annual management assessment of the effectiveness of our internal control over financial reporting and a report by our independent auditors addressing our internal controls and management's assessment. Effective internal controls are necessary for us to produce reliable financial reports and prevent fraud and other errors in our reporting and recordkeeping.
During the evaluation of disclosure controls and procedures conducted as of December 31, 2009, we identified a material weakness in our internal control over financial reporting. As a result, this annual report on Form 10-K includes an adverse opinion from Grant Thornton LLP, our independent registered public accounting firm, on our internal control over financial reporting. If, as a result of deficiencies in our financial or other internal controls, including the identified material weakness, we have not or cannot provide reliable financial reports or internal recordkeeping or compliance procedures, our business decision or compliance process may be adversely affected, our business and operating results could be harmed, we may be subject to legal penalties or other claims, investors could lose confidence in our reported financial information and the price of our stock could decrease. For a discussion of our internal control over financial reporting and a description of the identified material weakness, see Item 9A, "Controls and Procedures."
In connection with the recent sales of our assets in Turkey, we granted certain significant indemnities to the purchasers of those assets.
In 2005, two separate incidents occurred offshore Turkey in the Black Sea, which resulted in the sinking of the Fallen Structures, as defined below, and the loss of three natural gas wells. We have not been requested, or ordered by any governmental or regulatory body, to remove the Fallen Structures. Therefore, we believe it is unlikely that we will receive such a request or order, and no liability has been recorded. In connection with the 2009 sales of our assets in Turkey we agreed to indemnify each purchaser against and in respect of any claims, liabilities and losses arising from the Fallen Structures. We have also indemnified a third-party vendor for any claims made related to these incidents. We are unable to estimate the potential liability associated with the Fallen Structures. We have also granted certain other indemnities to the purchasers of our assets in Turkey and to the purchaser of our assets in Hungary in connection with the 2009 sales. Though certain of these indemnities are subject to limitations, including limitations on the time period during which claims may be asserted and the amounts for which we are liable, there can be no assurance that we will not incur future liabilities to the purchasers in connection with these transactions or that the amount of such liabilities will not be material or will not have a material adverse effect on our financial condition.
We face certain litigation risks, and unfavorable results of legal proceedings could have a material adverse effect on us.
We are party to certain lawsuits. Regardless of the merits of any claim, litigation can be lengthy, time-consuming, expensive, and disruptive to normal business operations and may divert management's time and resources, which may have a material adverse effect on our business, financial condition and results of operations, including our cash flow. The results of complex legal proceedings are difficult to predict. Should we fail to prevail in these matters, or should any of these matters be resolved against us, we may be faced with significant monetary damages, which also could materially adversely affect our business, financial condition and results of operations, including our cash flow.
24
Table of Contents
We continue to evaluate and, where appropriate, intend to pursue acquisition opportunities on terms we consider favorable. In particular, we consider acquisitions of businesses or interests that will complement and allow us to expand our exploration activities; however, currently, we have no binding commitments related to any acquisitions.
Future acquisitions could pose numerous additional risks to our operations and financial results, including:
- •
- problems integrating the purchased operations, personnel or technologies;
- •
- unanticipated costs;
- •
- diversion of resources and management attention from our core business;
- •
- entry into regions or markets in which we have limited or no prior experience; and
- •
- potential loss of key employees, particularly those of any acquired organization.
Risks Related to Our Industry
A decline in oil gas prices will have an adverse impact on our operations, and recent economic conditions have negatively impacted oil prices.
Our future revenues, cash flows and profitability are substantially dependent upon prevailing prices for oil. In recent years, oil prices and, therefore, the level of drilling, exploration, development and production, have been extremely volatile. Any significant or extended decline in oil prices will have a material adverse effect on our business, financial condition and results of operations and could impair access to future sources of capital. Lower prices may make it uneconomical for us to increase or even continue current production levels of oil.
Volatility in the oil industry results from numerous factors, over which we have no control, including:
- •
- the level of oil prices, expectations about future oil prices and the ability of international cartels to set and maintain production levels and prices;
- •
- the cost of exploring for, producing and transporting oil;
- •
- the domestic and foreign supply and demand of oil;
- •
- domestic and foreign governmental regulation;
- •
- the level and price of foreign oil transportation;
- •
- available pipeline and other oil transportation capacity;
- •
- weather and other natural conditions;
- •
- international political, military, regulatory and economic conditions, particularly in oil-producing regions;
- •
- the level of consumer demand;
- •
- the price and availability of alternative fuels;
- •
- the effect of worldwide energy conservation measures; and
- •
- the ability of oil and natural gas companies to raise capital.
Significant declines in oil prices may:
- •
- impair our financial condition, liquidity, ability to finance planned capital expenditures and results of operations;
25
Table of Contents
- •
- reduce the amount of oil we can produce economically;
- •
- cause us to delay or postpone some of our capital projects;
- •
- reduce our revenues, operating income and cash flow;
- •
- reduce the carrying value of our oil properties; and
- •
- limit our access to sources of capital.
Oil prices rose to unprecedented levels during 2008. Then in September 2008 the credit and equity markets started to deteriorate, which continued further in the beginning of 2009 before recovering somewhat later in the year. In the first half of 2009 we experienced on average a more than 60% decline in oil prices from the highest point received in 2008. These severe economic conditions caused us to reevaluate our capital expenditure program for 2009 and how we will operate on a go-forward basis. Our internally generated cash flow and cash on hand historically have not been sufficient to fund all of our expenditures, and we have recently relied on the sales of noncore assets to provide us with additional capital. Though average oil prices increased by approximately 40% from the six months ended June 30, 2009 to the six months ended December 31, 2009, oil prices are, and we expect will continue to be, volatile. The results of our operations are highly dependent upon the prices received from our oil production, which are dependent on numerous factors beyond our control. Accordingly, significant changes to oil prices are likely to have a material impact on our financial condition, results of operation, cash flows and revenue.
Competition in the oil and natural gas industry is intense, and many of our competitors have greater financial, technological and other resources than we do.
We operate in the highly competitive areas of oil exploration, development, production, and acquisition activities. The oil and natural gas industry is characterized by rapid and significant technological advancements and introductions of new products and services using new technologies. We face intense competition from independent, technology-driven companies as well as from both major and other independent oil and natural gas companies in each of the following areas:
- •
- seeking to acquire desirable exploration permits or exploitation concessions;
- •
- marketing our oil production;
- •
- integrating new technologies; and
- •
- seeking to acquire the equipment and expertise necessary to develop and operate our acreage.
Many of our competitors have financial, technological and other resources substantially greater than ours, and some of them are fully integrated oil and natural gas companies. These companies may be able to pay more for development prospects and productive oil and natural gas acreage and may be able to define, evaluate, bid for and purchase a greater number of permits or concessions than our financial or human resources permit. Further, these companies may enjoy technological advantages over us and may be able to implement new technologies more rapidly than we can. Our ability to develop and exploit our oil acreage and to acquire additional acreage in the future will depend upon our ability to successfully conduct operations, implement advanced technologies, evaluate and select suitable acreage and consummate transactions in this highly competitive environment.
The unavailability or high cost of drilling rigs, equipment, supplies, insurance, personnel and oil field services could adversely affect our ability to execute our exploration and development plans on a timely basis and within our budget.
Our industry is cyclical and, from time to time, there could be a shortage of drilling rigs, equipment, supplies, insurance, qualified personnel or oil field services. During these periods, the costs and delivery times of rigs, equipment and supplies are substantially greater. In addition, the demand for, and wages of,
26
Table of Contents
qualified drilling rig crews rise as the number of active rigs in service increases. When oil and gas prices are high, the demand for oilfield services rises and the cost of these services increases.
We are subject to complex laws and regulations that could adversely affect the cost, manner or feasibility of conducting our operations.
Our operations are subject to complex and stringent laws and regulations, including the French Mining Code. In order to conduct our operations in compliance with these laws and regulations, we must obtain and maintain numerous permits, concessions approvals and certificates from various governmental authorities. We may incur substantial costs in order to maintain compliance with these existing laws and regulations. In addition, our costs of compliance may increase if existing laws and regulations are revised or reinterpreted, or if new laws and regulations become applicable to our operations. For instance, we may be unable to obtain all necessary permits, concessions approvals and certificates, or renewals thereof, for proposed projects. Alternatively, we may have to incur substantial expenditures to obtain, maintain or renew authorizations to conduct existing projects. If a project is unable to function as planned due to changing requirements or public opposition, we may suffer expensive delays, extended periods of non-operation or significant loss of value in a project. All such costs may have a negative effect on our business and results of operations.
Our operations are subject to various laws and regulations controlling the discharge of materials into the environment or otherwise relating to the protection of the environment. Such laws and regulations not only expose us to liability for our own negligence, but also may expose us to liability for the conduct of others or for our actions that were in compliance with all applicable laws at the time those actions were taken. We may incur significant costs as a result of environmental accidents, such as oil spills, natural gas leaks, ruptures, or discharges of hazardous materials into the environment, including clean-up costs and fines or penalties. Additionally, we may incur significant costs in order to comply with environmental laws and regulations and may be forced to pay fines or penalties if we do not comply.
For example, in 2005, two separate incidents occurred offshore Turkey in the Black Sea, which resulted in the sinking of two caissons, or the Fallen Structures, and the loss of three natural gas wells. We have not been requested or ordered by any governmental or regulatory body to remove the Fallen Structures. Therefore, we believe that the likelihood of receiving such a request or order is remote, and no liability has been recorded. In connection with the 2009 sales of our assets in Turkey, we agreed to indemnify each purchaser against and in respect of any claims, liabilities and losses arising from the Fallen Structures. We have also indemnified a third-party vendor for any claims made related to these incidents. See " — Risks Related to Our Company — In connection with the recent sales of our assets in Turkey, we granted certain significant indemnities to the purchasers of those assets."
In addition, future climate change regulation, a subject of discussion in many jurisdictions currently, could require us to incur increased operating costs and could adversely affect the price or market demand for the oil that we produce.
Terrorist activities, including events similar to those of September 11, 2001, or armed conflict involving the United States, France or any other country in which we may hold interests, may adversely affect our business activities and financial condition. If events of this nature occur and persist, the resulting political and social instability could adversely affect prevailing oil prices and cause a reduction in our revenues. In addition, oil production facilities, transportation systems and storage facilities could be direct targets of terrorist attacks, and our operations could be adversely impacted if infrastructure integral to our operations is destroyed or damaged. Costs associated with insurance and other security measures may
27
Table of Contents
increase as a result of these threats, and some insurance coverage may become more difficult to obtain, if available at all.
We face numerous risks in finding commercially productive oil reservoirs, including delays in our drilling operations as a result of factors that are beyond our control and that may not be covered by insurance.
Our drilling will involve numerous risks, including the risk that no commercially productive oil reservoirs will be encountered. We may incur significant expenditures for the identification and acquisition of properties and for the drilling and completion of wells. The cost of drilling, completing and operating wells is often uncertain, and drilling operations may be curtailed, delayed or canceled as a result of a variety of factors, including:
- •
- unexpected drilling conditions;
- •
- fire, explosions and blowouts;
- •
- pressure or irregularities in formations;
- •
- environmental accidents such as oil spills, natural gas leaks, ruptures or discharges of toxic gases, brine or well fluids into the environment (including groundwater contamination);
- •
- equipment failures or accidents;
- •
- weather conditions; and
- •
- shortages or delays in the delivery of equipment.
Any of these events could adversely affect our ability to conduct our operations or cause substantial losses, including:
- •
- injury or loss of life;
- •
- severe damage to or destruction of property, natural resources and equipment;
- •
- pollution or other environmental damage;
- •
- clean-up responsibilities;
- •
- regulatory investigation;
- •
- penalties and suspension of operations; and
- •
- attorneys' fees and other expenses incurred in the prosecution or defense of litigation.
As is customary in our industry, we maintain insurance against some, but not all, of these risks. We cannot assure investors that our insurance will be adequate to cover these losses or liabilities. We do not carry business interruption insurance. Losses and liabilities arising from uninsured or underinsured events may have a material adverse effect on our financial condition and operations. We carry well control insurance for our drilling operations. Our coverage includes blowout protection and liability protection on our wells.
The producing wells in which we have an interest occasionally experience reduced or terminated production. These curtailments can result from mechanical failures, contract terms, pipeline and processing plant interruptions, market conditions and weather conditions. These curtailments can last from a few days to many months and may significantly reduce our revenues.
In addition, any use by us of 3D seismic and other advanced technology to explore for oil requires greater predrilling expenditures than traditional drilling methodologies. While we use advanced technology in our operations, this technology does not allow us to know conclusively, prior to drilling a well, that oil is present or economically producible.
28
Table of Contents
In addition, as a "successful efforts" company, we account for unsuccessful exploration efforts, i.e., the drilling of "dry holes," as an expense of operations that impacts our earnings. Significant expensed exploration charges in any period would materially adversely affect our earnings for that period and could cause our earnings to be volatile from period to period.
The process of estimating oil reserves is complex. It requires interpretations of available technical data and various assumptions, including assumptions relating to economic factors. Any material inaccuracies in our reserve estimates or underlying assumptions could materially affect the quantities and present values of our reserves. In order to prepare these estimates, we must project production rates and timing of development expenditures. We must also analyze available geological, geophysical, production and engineering data, and the extent, quality and reliability of this data can vary. The process also requires economic assumptions relating to matters such as oil prices, drilling and operating expenses, capital expenditures, taxes and availability of funds.
Actual future production, oil prices, revenues, taxes, development expenditures, operating expenses and quantities of recoverable oil reserves most likely will vary from our estimates. Any significant variance could materially affect the estimated quantities and pre-tax net present value of reserves incorporated by reference in this prospectus supplement. In addition, we may adjust estimates of proved reserves to reflect production history, results of exploration and development, prevailing oil prices and other factors, many of which are beyond our control.
You should not assume that the present value of our proved reserves is the current market value of our estimated oil reserves.
You should not assume that the pre-tax net present value of our proved reserves is the current market value of our estimated oil reserves. In accordance with the revised SEC requirements, we base the pre-tax net present value of future net cash flows from our proved reserves on 12-month average prices and costs on the date of the estimate. Actual future prices, costs, and the volume of produced reserves may differ materially from those used in the pre-tax net present value estimate and may be affected by factors such as:
- •
- supply of and demand for oil;
- •
- actual prices we receive for oil;
- •
- our actual operating costs;
- •
- the amount and timing of our capital expenditures;
- •
- the amount and timing of actual production; and
- •
- changes in governmental regulations or taxation.
The timing of both our production and our incurrence of expenses in connection with the development and production of our properties will affect the timing of actual future net cash flows from proved reserves, and thus their actual present value. In addition, the 10% discount factor we use when calculating discounted future net cash flow, which is required by the SEC, may not be the most appropriate discount factor based on interest rates in effect from time to time and risks associated with us or the oil and gas industry in general.
Risks Related to Our Common Stock
Our stock's public trading price has been volatile, which may depress the trading price of our common stock.
Our stock price is subject to significant volatility. We operate in a price-sensitive industry, and there is often significant volatility in the market price of common stock irrespective of company performance. As a result, our high and low stock prices for the twelve months ended March 12, 2010 were $13.69 and $2.39,
29
Table of Contents
respectively. Fluctuations in the price of our common stock may be exacerbated by conditions in the energy and oil and natural gas industries or conditions in the financial markets generally.
Our common stock is quoted on The NASDAQ Global Market under the symbol "TRGL." However, daily trading volumes for our common stock are, and may continue to be, relatively small compared to many other publicly traded securities. It may be difficult for investors to sell their shares of common stock in the public market at any given time at prevailing prices, and the price of our common stock may, therefore, be volatile.
Numerous factors, including many over which we have no control, may have a significant impact on the market price of our common stock, including, among other things:
- •
- current events affecting the political, economic and social situation in the United States and France;
- •
- trends in our industry and the markets in which we operate;
- •
- changes in financial estimates and recommendations by securities analysts;
- •
- acquisitions and financings by us or our competitors;
- •
- quarterly variations in operating results;
- •
- litigation or governmental action involving or affecting us;
- •
- volatility in exchange rates between the U.S. dollar and the Euro;
- •
- the operating and stock price performance of other companies that investors may consider to be comparable; and
- •
- purchases or sales of blocks of our securities.
In addition, the stock market in recent years has experienced extreme price and trading volume fluctuations that often have been unrelated or disproportionate to the operating performance of individual companies. These broad market fluctuations may adversely affect the price of our common stock, regardless of our operating performance. In addition, sales of substantial amounts of our common stock in the public market, or the perception that those sales may occur, could cause the market price of our common stock to decline. Furthermore, stockholders may initiate securities class action lawsuits if the market price of our stock drops significantly, which may cause us to incur substantial costs and could divert the time and attention of our management. These factors, among others, could significantly depress the price of our common stock.
We currently intend to continue our policy of retaining earnings to finance the growth of our business. As a result, we do not anticipate paying cash dividends on our common stock in the foreseeable future. In addition, the terms of any future credit facility may restrict our ability to pay dividends on our common stock.
We may issue equity securities, including upon conversion of existing securities, that may depress the trading price of our common stock and may dilute the interests of our existing stockholders.
Sales or issuances of common stock or securities convertible into our common stock or the issuance of securities senior to our common stock may depress the trading price of our common stock. We may not have the ability to issue new common stock or securities convertible into common stock due to the decline in the equity market and our share price.
Any issuance of equity securities, including the issuance of shares upon conversion of our 5.00% Convertible Senior Notes or our New Convertible Senior Notes, could dilute the interests of our existing stockholders and could substantially decrease the trading price of our common stock, the 5.00%
30
Table of Contents
Convertible Senior Notes and the New Convertible Senior Notes. The terms of the New Convertible Senior Notes provide that the conversion rate be adjusted for certain securities offerings conducted prior to October 1, 2010 if 120% of the offering price in such offering is less than the then current conversion price. Thus, because we sold shares in the February 2010 offering at $8.50 per share, the conversion price of the New Convertible Senior Notes was adjusted to approximately $10.20 per share, representing 120% of the public offering price of the offering. Such adjustment will result in further dilution to our stockholders, if and when such notes are converted. The conversion price of the New Convertible Senior Notes will not be further adjusted under such provision in the indenture because the proceeds from the offering were in excess of $20 million. Under the terms of the indenture, we will not be required to issue shares of common stock upon conversion of the aggregate principal amount of the New Convertible Senior Notes that would exceed 19.9% of our outstanding shares of common stock or otherwise require shareholder approval.
We may issue common stock or securities convertible into our common stock in the future for a number of reasons, including to finance our operations and business strategy, to adjust our ratio of debt to equity, to satisfy our obligations upon the exercise of outstanding warrants or options or the conversion of debentures, or for other reasons.
We have an effective shelf registration from which additional shares of our common stock and other securities can be issued. We may not be able to sell shares of our common stock or other securities at a price per share that is equal to or greater than the price per share paid by our current shareholders. If the price per share at which we sell additional shares of our common stock or related securities in future transactions is less than the price per share at which we have sold shares in the past, shareholders will suffer a dilution in their investment.
Provisions in the indentures for the 5.00% Convertible Senior Notes and the New Convertible Senior Notes and our charter and Delaware law could discourage an acquisition of us by a third party, even if the acquisition would be favorable to holders of our common stock.
If a "change in control" (as defined in the indentures for the 5.00% Convertible Senior Notes and the New Convertible Senior Notes) occurs, holders of notes will have the right, at their option, to require us to repurchase all or a portion of their notes. In the event of certain "fundamental changes" (as defined in the indentures for the 5.00% Convertible Senior Notes and the New Convertible Senior Notes), we also may be required to increase the conversion rate applicable to the notes surrendered for conversion upon the fundamental change. In addition, the indentures for the 5.00% Convertible Senior Notes and the New Convertible Senior Notes prohibit us from engaging in certain mergers or acquisitions unless, among other things, the surviving entity assumes our obligations under the notes.
Our charter authorizes our Board of Directors to set the terms of preferred stock, and our bylaws limit stockholder proposals at meetings of stockholders. In addition, Delaware law contains provisions that impose restrictions on business combinations with interested parties. Because of these provisions of our charter and bylaws and of Delaware law, persons considering unsolicited tender offers or other unilateral takeover proposals may be more likely to negotiate with our Board of Directors rather than pursue non-negotiated takeover attempts. As a result, these provisions may make it more difficult for our stockholders to benefit from transactions that are opposed by an incumbent Board of Directors.
The personal liability of our directors for monetary damages for breach of their fiduciary duty of care is limited by the Delaware General Corporation Law and by our certificate of incorporation.
The Delaware General Corporation Law allows corporations to limit available relief for the breach of directors' duty of care to equitable remedies such as injunction or rescission. Our certificate of incorporation limits the liability of our directors to the fullest extent permitted by Delaware law.
31
Table of Contents
Specifically, our directors will not be personally liable for monetary damages for any breach of their fiduciary duty as a director, except for liability:
- •
- for any breach of their duty of loyalty to the company or our stockholders;
- •
- for acts or omissions not in good faith or that involve intentional misconduct or a knowing violation of law;
- •
- under provisions relating to unlawful payments of dividends or unlawful stock repurchases or redemptions; and
- •
- for any transaction from which the director derived an improper personal benefit.
This limitation may have the effect of reducing the likelihood of derivative litigation against directors, and may discourage or deter stockholders or management from bringing a lawsuit against directors for breach of their duty of care, even though such an action, if successful, might otherwise have benefited our stockholders.
We have the ability to issue "blank check" preferred stock, which, if issued, could affect the rights of holders of our common stock.
Our charter authorizes our Board of Directors, subject to the rules of The NASDAQ Global Market, to issue up to four million shares of preferred stock and to set the terms of the preferred stock without seeking stockholder approval. The terms of such preferred stock may adversely impact the dividend and liquidation rights of holders of our common stock.
ITEM 1B. Unresolved Staff Comments
None.
ITEM 2. Properties (see Items 1 and 2. Business and Properties)
ITEM 3. Legal Proceedings
On October 16, 2003, we entered into an agreement, or the Netherby Agreement, with Phillip Hunnisett and Roy Barker, or Hunnisett and Barker, pursuant to which Hunnisett and Barker agreed to post the collateral required by the Turkish government for Madison Oil Turkey Inc. (a Liberian company later reincorporated in the Cayman Islands as Toreador Turkey Limited) to retain its 36.75% interest in relation to eight offshore exploration SASB licenses in exchange for a 1.5% gross overriding royalty interest, or the Overriding Royalty, on the net value to Madison Oil Turkey of all future production, if any, deriving from Madison's interest in such SASB licenses. Since March 2009, we have corresponded with Hunnisett and Barker regarding a dispute over the compensation payable by us to Hunnisett and Barker under the Netherby Agreement as a result of Toreador Turkey's sale of a 26.75% interest in the SASB licenses to Petrol Ofisi in March 2009, or the Netherby Payment Amount. Hunnisett and Barker have contended that the Netherby Payment Amount could be up to $10.4 million; however, we do not believe that Hunnisett and Barker are entitled to such amount. There has been subsequent correspondence regarding a dispute as to whether an agreement between the parties had been reached regarding the Netherby Payment Amount; Hunnisett and Barker's contention is that such agreed Netherby Payment Amount was $7.2 million. We do not believe that any such agreement was reached, and we do not believe that Hunnisett and Barker are entitled to such amount. We intend to vigorously defend ourselves against any claim for payment of an amount in excess of the amount to which we believe that Hunnisett and Barker are entitled. We have since completed the sale of Toreador Turkey Ltd., including with it Toreador Turkey's remaining 10% interest in the SASB license, to Tiway Oil, or Tiway. In connection with the sales referred to above, we have agreed to indemnify Petrol Ofisi and Tiway against and in respect of any and all claims, liabilities, and losses arising from the Overriding Royalty. As of December 31, 2009, we have accrued approximately $870,000 as a contingent liability for these claims.
32
Table of Contents
On June 17, 2009, The Scowcroft Group, Inc., or Scowcroft, filed a complaint in the United States District Court for the District of Columbia against us. The complaint alleges that we breached a contract, or the Scowcroft Contract, between Scowcroft and us relating to the sale of our interests in the SASB and that Scowcroft is entitled to a success fee thereunder as a result of the sale of our interests in the SASB to Petrol Ofisi in March 2009. The complaint also alleges unjust enrichment/quantum meruit and fraud. Scowcroft is seeking damages in the amount of $2 million plus interest, costs and expenses. On July 24, 2009, we filed a motion to dismiss the complaint. The district court denied our motion to dismiss the action on October 26, 2009. On November 30, 2009, we filed an answer to the complaint. There was an initial scheduling conference in the matter on March 12, 2010. At the hearing the Court signed The Scowcroft Group's proposed protective order (which permits the parties to mark appropriate documents for confidential treatment), ordered that The Scowcroft Group produce its documents by March 15, 2010, suspended further discovery for 60 days while the parties mediate with a Magistrate Judge and set the next status conference for May 21, 2010, at which time the Court indicated that it will set a schedule if the case is not settled. We believe that we have defenses to Scowcroft's claims and intend to continue vigorously defending ourselves.
On January 25, 2010, we received a claim notice from Tiway under the Share Purchase Agreement, dated September 30, 2009, among us, Tiway Oil BV and Tiway relating to the sale of Toreador Turkey Ltd. in respect of a third-party claim asserted by Petrol Ofisi against Toreador Turkey Ltd. in the amount of TRY 7.6 million ($5.1 million), for which Tiway alleges we are liable for an estimated TRY 2.1 million ($1.4 million). No formal legal evaluation can be made at this time as to the extent of the Company's liability, if any.
From time to time, we are named as a defendant in other legal proceedings arising in the normal course of business. In our opinion, the final judgment or settlement, if any, that may be awarded with any suit or claim would not have a material adverse effect on our financial position.
33
Table of Contents
PART II
Item 5. Market for Registrant's Common Equity, Related Stockholder Matters and Issuer Purchases of Equity Securities
Common Stock
Our shares of common stock, par value $.15625 per share, are traded on the Nasdaq Global Market under the trading symbol "TRGL." The following table sets forth the high and low sale prices per share for the common stock for each quarterly period during the past two fiscal years as reported by the Nasdaq Global Market based upon quotations that reflect inter-dealer prices, without retail mark-up, mark-down or commission and may not necessarily represent actual transactions.
| | | | | | | |
| | High | | Low | |
|---|
2009: | | | | | | | |
Fourth quarter | | $ | 11.58 | | $ | 7.60 | |
Third quarter | | | 10.79 | | | 4.50 | |
Second quarter | | | 7.26 | | | 2.39 | |
First quarter | | | 4.74 | | | 1.96 | |
2008: | | | | | | | |
Fourth quarter | | $ | 9.67 | | $ | 2.84 | |
Third quarter | | | 10.15 | | | 6.45 | |
Second quarter | | | 10.49 | | | 7.40 | |
First quarter | | | 10.58 | | | 6.15 | |
As of March 12, 2010, there were 24,941,155 shares of common stock outstanding and held of record by approximately 359 holders (inclusive of those brokerage firms, clearing houses, banks and other nominee holders, holding common stock for clients, with each such nominee being considered as one holder).
Dividends on the common stock may be declared and paid out of funds legally available when and as determined by our board of directors. Our board of directors plans to continue its policy of holding and investing corporate funds on a conservative basis, retaining earnings to finance the growth of its business. We did not declare or pay any cash dividends on our common stock in 2008 or 2009, and we do not anticipate paying cash dividends on our common stock in the foreseeable future.
During 2009 and 2008, there were no equity securities issued pursuant to transactions exempt from the registration requirements under the Securities Act of 1933, as amended, that were not disclosed previously in Current Reports on Form 8-K or Quarterly Reports on Form 10-Q.
For the three months ended December 31, 2009, we did not repurchase any shares of our common stock. See "Liquidity and Capital Resources — 5.00% Convertible Senior Notes Due 2025" for a discussion of repurchases of our 5.00% Convertible Senior Notes.
34
Table of Contents
Below is a line graph comparing the 5-year cumulative total stockholder return on our common stock with the Nasdaq Market Index and the Hemscott Group Index (Independent Oil & Gas Companies):
COMPARISON 5-YEAR CUMULATIVE TOTAL RETURN
AMONG TOREADOR RESOURCES CORP.,
NASDAQ MARKET INDEX AND HEMSCOTT GROUP INDEX
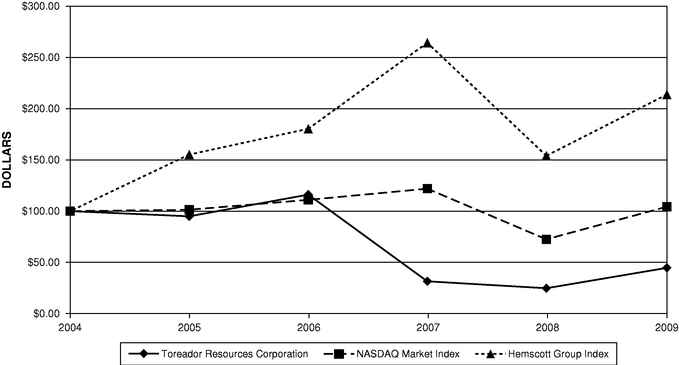
ASSUMES $100 INVESTED IN JAN. 01, 2005
ASSUMES DIVIDEND REINVESTED
FISCAL YEAR ENDING DEC. 31, 2009
35
Table of Contents
Item 6. Selected Financial Data
The following selected financial information (which is not covered by the report of an independent registered public accounting firm) is summarized from our results of operations for the five-year period ended December 31, 2009 as well as selected consolidated balance sheet data as of December 31, 2009, 2008, 2007, 2006 and 2005 and should be read in conjunction with the consolidated financial statements and the notes thereto included herewith.
On June 14, 2007, the Board of Directors authorized management to sell all our oil and natural gas properties in the United States. The sale of these properties completed the divestiture of the Company's non-core U.S. assets and allowed Toreador to focus exclusively on its non-U.S. operations. The sale was closed on September 1, 2007 for $19.1 million, which resulted in a pre-tax gain of $9.2 million.
In the fourth quarter of 2008 and during the first quarter of 2009, Toreador farmed out or sold all of its working interests in Romania to three different companies and closed its office; thus, we no longer have any operational involvement in Romania. This resulted in a gain of $5.8 million, which was recorded in the first quarter of 2009.
On March 3, 2009 we completed the sale of a 26.75% interest in the South Akcakoca Sub-Basin (SASB) project associated licenses located in the Black Sea offshore Turkey, to Petrol Ofisi for $55 million. In accordance with the revised assignment announced on February 3, 2009, $50 million of the proceeds was paid by Petrol Ofisi on March 3, 2009, and the remaining $5 million was paid on September 1, 2009. There was no gain or loss resulting from this sale.
On September 30, 2009, the Company entered into a Share Purchase Agreement (the "Share Purchase Agreement") with Tiway Oil BV, a company organized under the laws of the Netherlands ("Tiway"), and Tiway Oil AS, a company organized under the laws of Norway, pursuant to which the Company agreed to sell 100% of the outstanding shares of Toreador Turkey Ltd. ("Toreador Turkey") to Tiway for total consideration consisting of: (1) a cash payment of $10.5 million to be paid at closing, (2) exploration success payments dependent upon certain future commercial discoveries as provided in the Share Purchase Agreement, up to a maximum aggregate consideration of $40 million, and (3) future quarterly 10% pre-tax net profit interest payments if a field goes into production that was discovered by an exploration well drilled within four years of closing on certain of the licenses then still held by Tiway. The sale of Toreador Turkey was completed on October 7, 2009 and resulted in a gain of $1.8 million.
On September 30, 2009, the Company entered into a Quota Purchase Agreement (the "Quota Purchase Agreement") with RAG (Rohöl-Aufsuchungs Aktiengesellschaft), a corporation organized under the laws of Austria ("RAG"), pursuant to which the Company agreed to sell 100% of its equity interests in Toreador Hungary Limited ("Toreador Hungary") to RAG for total consideration consisting of (1) a cash payment of US$5.4 million (€3.7 million) paid at closing, (2) US$435,000 (€300,000), which was held back subject to a post-closing adjustment and was paid to us on November 5, 2009 and (3) a contingent payment of US$2.9 million (€2 million) to be paid upon post-transaction completion of agreements relating to certain assets of Toreador Hungary. The sale of Toreador Hungary was completed on September 30, 2009 and resulted in a loss of $4.1 million.
36
Table of Contents
The results of operations of assets in the United States, Turkey, Hungary and Romania have been presented as discontinued operations in the accompanying consolidated statements of operations.
| | | | | | | | | | | | | | | | | | |
| | Years Ended December 31, | |
|---|
| | 2009 | | 2008 | | 2007 | | 2006 | | 2005 | |
|---|
| | (Amounts in thousands, except per share amounts)
| |
|---|
Operating Results: | | | | | | | | | | | | | | | | |
| | Revenues | | $ | 19,236 | | $ | 34,150 | | $ | 25,907 | | $ | 27,294 | | $ | 20,594 | |
| | Costs and expenses | | | (35,415 | ) | | (32,586 | ) | | (29,473 | ) | | (20,552 | ) | | (17,296 | ) |
| | Operating income (loss) | | | (16,179 | ) | | 1,564 | | | (3,566 | ) | | 6,742 | | | 3,298 | |
| | Other income (expense) | | | 397 | | | (3,082 | ) | | (2,384 | ) | | 3,373 | | | 19 | |
| | Income (loss) from continuing operations before income tax | | | (15,782 | ) | | (1,518 | ) | | (5,950 | ) | | 10,115 | | | 3,317 | |
| | Income tax benefit (provision) | | | 450 | | | (5,502 | ) | | 1,402 | | | (3,236 | ) | | 2,665 | |
| | Income (loss) from continuing operations, net of tax | | | (15,332 | ) | | (7,020 | ) | | (4,548 | ) | | 6,879 | | | 5,982 | |
| | Income (loss) from discontinued operations, net of tax | | | (10,080 | ) | | (101,585 | ) | | (69,873 | ) | | (4,301 | ) | | 4,613 | |
| | Dividends on preferred shares | | | — | | | — | | | (162 | ) | | (162 | ) | | (684 | ) |
| | Income (loss) available to common shares | | $ | (25,412 | ) | $ | (108,605 | ) | $ | (74,583 | ) | $ | 2,416 | | $ | 9,911 | |
| | Basic income (loss) available to common shares per share | | $ | (1.24 | ) | $ | (5.48 | ) | $ | (4.07 | ) | $ | 0.16 | | $ | 0.69 | |
| | Diluted income (loss) available to common shares per share | | $ | (1.24 | ) | $ | (5.48 | ) | $ | (4.07 | ) | $ | 0.15 | | $ | 0.66 | |
| | Weighted average shares outstanding | | | | | | | | | | | | | | | | |
| | | Basic | | | 20,564 | | | 19,831 | | | 18,358 | | | 15,527 | | | 14,213 | |
| | | Diluted | | | 20,564 | | | 19,831 | | | 18,358 | | | 15,884 | | | 15,140 | |
Balance Sheet Data: | | | | | | | | | | | | | | | | |
| | Working capital | | $ | (30,193 | ) | $ | 73,286 | | $ | 203,591 | | $ | 188,029 | | $ | 168,802 | |
| | Oil and natural gas properties, net | | | 74,621 | | | 72,753 | | | 80,983 | | | 71,663 | | | 60,967 | |
| | Oil and natural gas properties held for sale, net | | | — | | | 91,959 | | | 190,968 | | | 179,352 | | | 77,191 | |
| | Total assets | | | 97,155 | | | 207,156 | | | 323,111 | | | 317,204 | | | 261,814 | |
| | Debt, including current portion | | | 54,616 | | | 110,275 | | | 116,250 | | | 112,800 | | | 92,060 | |
| | Stockholders' equity | | | 6,137 | | | 52,560 | | | 163,825 | | | 147,151 | | | 132,359 | |
Cash Flow Data: | | | | | | | | | | | | | | | | |
| | Net cash provided by (used in) operating activities | | $ | (7,345 | ) | $ | 16,766 | | $ | (12,434 | ) | $ | 122 | | $ | (138 | ) |
| | Capital expenditures for oil and natural gas property and equipment, including acquisitions | | | 3,386 | | | (770) | (1) | | 3,824 | | | 5,883 | | | 18,350 | |
| | Capital expenditures for oil and natural gas property and equipment held for sale | | | 4,528 | | | 11,472 | | | 86,820 | | | 99,282 | | | 31,813 | |
- (1)
- Due to overaccrual in 2007
37
Table of Contents
Item 7. Management's Discussion and Analysis of Financial Condition and Results of Operations
CAUTIONARY STATEMENT REGARDING FORWARD-LOOKING STATEMENTS
Certain of the matters discussed under the captions "Business and Properties," "Legal Proceedings," "Management's Discussion and Analysis of Financial Condition and Results of Operations," and elsewhere in this annual report may constitute "forward-looking" statements for purposes of the Securities Act of 1933, and the Securities Exchange Act of 1934 and, as such, may involve known and unknown risks, uncertainties and other factors that may cause the actual results, performance or achievements to be materially different from future results, performance or achievements expressed or implied by such forward-looking statements. When used in this report, the words "anticipates," "estimates," "plans," "believes," "continues," "expects," "projections," "forecasts," "intends," "may," "might," "could," "should," and similar expressions are intended to be among the statements that identify forward-looking statements. Various factors that could cause the actual results, performance or achievements to differ materially from our expectations are disclosed in this report ("Cautionary Statements"), including, without limitation, those statements made in conjunction with the forward-looking statements included under the captions identified above and otherwise herein. All written and oral forward-looking statements attributable to us are expressly qualified in their entirety by the Cautionary Statements.
Executive Overview
We are an independent energy company engaged in the exploration and production of crude oil with interests in developed and undeveloped oil properties in the Paris Basin, France. We are currently focused on the development of our conventional fields and the exploitation of the prospective shale oil play within our Paris Basin acreage position.
We currently operate solely in the Paris Basin, which covers approximately 170,000 km2 of northeastern France, centered 50 to 100 km east and south of Paris. At December 31, 2009, we held interests in approximately 750,000 gross exploration acres. According to Gaffney, Cline & Associates Ltd, an independent petroleum and geological engineering firm, or Gaffney Cline, as of December 31, 2009, our proved reserves were 5.8 MBbls, our proved plus probable reserves were 9.1 MBbls and our proved plus probable plus possible reserves were 14.3 MBbls. Our production for 2009 averaged approximately 900 bbl/d from two conventional oilfield areas in the Paris Basin — the Neocomian Complex and Charmottes fields. As of December 31, 2009, production from these oil fields represented substantially all of our revenue. We intend to maintain production from these mature assets using suitable enhanced oil recovery techniques. In addition to this production base, we have identified several additional conventional exploration targets. We received well results on the La Garenne, the first of these targets, in January 2010. Following a more detailed analysis of the data, we intend to formulate a development plan for the field.
We are also currently focused on exploiting our shale oil acreage in the Paris Basin. Our current priority is to execute a proof of concept program by drilling, completing and testing three pilot wells in the second half of 2010, subject to approval of drilling by the French government, for which the Company intends to submit an application by the end of March 2010.The Company has commenced a process to identify a potential partner to assist with our proof of concept program.
Our management team, Board of Directors and strategy underwent a significant transformation in 2009. In January 2009, we appointed a new Chief Executive Officer and three new directors (the CEO, Non-Executive Chairman and Non-Executive Vice Chairman), and in September 2009, we appointed a new Chief Financial Officer and Commercial Director. We improved operational efficiencies and intend to reduce general and administrative costs and continue to focus on maintaining efficient operations. We moved our corporate headquarters from Dallas, Texas to Paris, France and we expect to achieve savings of general and administrative expense due to a consolidation of job functions. Based on our budget for 2010, we estimate that these measures could result in a decrease of general and administrative expenses of approximately 50% in 2010 (excluding exceptional items).
38
Table of Contents
In addition, in 2009, the Company redirected its corporate and operational focus to France, completing our exit of Romania and exiting Hungary and Turkey. In the fourth quarter of 2008 and during the first quarter of 2009, Toreador farmed out or sold all of its working interests in Romania to three different companies and closed its office; thus, we no longer have any operational involvement in Romania. On March 3, 2009, we sold a 26.75% interest in our major Turkish asset, the South Akcakoca Sub-Basin ("SASB"), to Petrol Ofisi for aggregate cash consideration of $55 million, $50 million of which was funded on March 3, 2009 and the remaining $5 million of which was funded on September 1, 2009. On September 30, 2009, we sold 100% of the shares of Toreador Hungary Limited, our wholly owned subsidiary, for total consideration consisting of: (1) a cash payment of $5.4 million (€3.7 million) paid at closing, (2) $435,000 (€300,000), which was paid to us on November 5, 2009 as part of a post-closing adjustment, and (3) a contingent payment of $2.9 million (€2 million) to be paid upon post-transaction completion of agreements relating to certain assets of Toreador Hungary. On October 7, 2009, we sold 100% of the shares of Toreador Turkey Limited, our wholly owned subsidiary, for total consideration consisting of: (1) a cash payment of $10.5 million paid at closing, (2) exploration success payments dependent upon certain future commercial discoveries under the licenses sold, up to a maximum aggregate consideration of $40 million, and (3) future quarterly 10% pre-tax net profit interest payments if a field goes into production that was discovered by an exploration well drilled within four years of closing on certain of the licenses then still held by the Tiway.
For the year ended December 31, 2009:
- •
- Revenues were $19.2 million.
- •
- Total costs and expenses were $35.4 million.
- •
- Net loss available to common shares was $25.4 million.
- •
- Production was 328 MBOE.
- •
- Cash and cash equivalents were $8.7 million.
- •
- We repurchased $25.7 million aggregate principal amount of our 5.00% Convertible Senior Notes at a purchase price of $21.3 million.
At December 31, 2009, we had:
- •
- A current ratio of 0.34 to 1; however, without considering the current portion of long-term debt, the ratio would be 1.16 to 1.
- •
- A debt (5.00% Convertible Senior Notes) to equity ratio of 8.90 to 1.
The discussion and analysis of our financial condition and results of operations is based upon the consolidated financial statements, which have been prepared in accordance with accounting principles generally accepted in the United States. The preparation of these financial statements requires us to make estimates and judgments that affect the reported amounts of assets, liabilities, revenues and expenses. Our significant accounting policies are described in Note 2 to our consolidated financial statements included in this Form 10-K. We have identified below policies that are of particular importance to the portrayal of our financial position and results of operations and which require the application of significant judgment by management. We analyze our estimates on a periodic basis and base our estimates on experience and various other assumptions that we believe to be reasonable under the circumstances. Actual results may
39
Table of Contents
differ from these estimates. We believe the following critical accounting policies affect our more significant judgments and estimates used in the preparation of our financial statements:
We account for our oil and natural gas exploration and development activities utilizing the successful efforts method of accounting. Under this method, costs of productive exploratory wells, development dry holes and productive wells and undeveloped leases are capitalized. Oil and natural gas lease acquisition costs are also capitalized. Exploration costs, including personnel costs, certain geological and geophysical expenses and delay rentals for oil and natural gas leases, are charged to expense as incurred. Exploratory drilling costs are initially capitalized, but such costs are charged to expense if and when the well is determined not to have found reserves in commercial quantities. In most cases, a gain or loss is recognized for sales of producing properties.
As of December 31, 2009, we had $2.9 million of costs associated with exploratory costs that had been capitalized for a period of one year or less.
As of December 31, 2009, we had no exploratory costs that have been capitalized for a period of greater than one year.
The application of the successful efforts method of accounting requires management's judgment to determine the proper designation of wells as either developmental or exploratory, which will ultimately determine the proper accounting treatment of the costs incurred. The results from a drilling operation can take considerable time to analyze, and the determination that commercial reserves have been discovered requires both judgment and application of industry experience. Wells may be completed that are assumed to be productive and actually deliver oil and natural gas in quantities insufficient to be economic, which may result in the abandonment of the wells at a later date. On occasion, wells are drilled which have targeted geologic structures that are both developmental and exploratory in nature, and in such instances an allocation of costs is required to properly account for the results. Delineation seismic costs incurred to select development locations within a productive oil and natural gas field are typically treated as development costs and capitalized, but often these seismic programs extend beyond the proved reserve areas and, therefore, management must estimate the portion of seismic costs to expense as exploratory. The evaluation of oil and natural gas leasehold acquisition costs requires management's judgment to estimate the fair value of exploratory costs related to drilling activity in a given area. Drilling activities in an area by other companies may also effectively condemn leasehold positions.
The successful efforts method of accounting can have a significant impact on the operational results reported when we enter a new exploratory area in hopes of finding oil and natural gas reserves. The initial exploratory wells may be unsuccessful and the associated costs will be expensed as dry hole costs. Seismic costs can be substantial which will result in additional exploration expenses when incurred.
Proved reserves are estimated quantities of oil and gas, which, by analysis of geoscience and engineering data, can be estimated with reasonable certainty to be economically producible — from a given date forward recoverable in future years from known reservoirs, and under existing economic conditions, operating methods, and government regulations — prior to the time at which contracts providing the right to operate expire, unless evidence indicates that renewal is reasonably certain. Proved developed reserves are reserves that can be expected to be recovered through existing wells with existing equipment and operating methods or in which the cost of the required equipment is relatively minor compared to the cost of a new well and through installed extraction equipment and infrastructure operational at the time of the reserves estimate if the extraction is by means not involving a well. Proved undeveloped reserves are reserves that are expected to be recovered from new wells on undrilled acreage or from existing wells where a relatively major expenditure is required for recompletion. Proved undeveloped reserves on undrilled acreage are limited (i) to those directly offsetting development spacing areas that are reasonably certain of production when drilled, unless evidence using reliable technology
40
Table of Contents
exists that establishes reasonable certainty of economic producibility at greater distances and (ii) to other undrilled locations if a development plan has been adopted indicating that they are scheduled to be drilled within five years, unless the specific circumstances justify a longer time.
Probable reserves are those additional reserves that are less certain to be recovered than proved reserves but which, together with proved reserves, are as likely as not to be recovered. When deterministic methods are used, it is as likely as not that actual remaining quantities recovered will exceed the sum of estimated proved plus probable reserves. When probabilistic methods are used, there should be at least a 50% probability that the actual quantities recovered will equal or exceed the proved plus probable reserves estimates. Probable reserves may be assigned to areas of a reservoir adjacent to proved reserves where data control or interpretations of available data are less certain, even if the interpreted reservoir continuity of structure or productivity does not meet the reasonable certainty criterion. Probable reserves may be assigned to areas that are structurally higher than the proved area if these areas are in communication with the proved reservoir. Probable reserves estimates also include potential incremental quantities associated with a greater percentage recovery of the hydrocarbons in place than assumed for proved reserves.
Possible reserves are those additional reserves that are less certain to be recovered than probable reserves. When deterministic methods are used, the total quantities ultimately recovered from a project have a low probability of exceeding proved plus probable plus possible reserves. When probabilistic methods are used, there should be at least a 10% probability that the total quantities ultimately recovered will equal or exceed the proved plus probable plus possible reserves estimates. Possible reserves may be assigned to areas of a reservoir adjacent to probable reserves where data control and interpretations of available data are progressively less certain. Frequently, this will be in areas where geoscience and engineering data are unable to define clearly the area and vertical limits of commercial production from the reservoir by a defined project. Possible reserves also include incremental quantities associated with a greater percentage recovery of the hydrocarbons in place than the recovery quantities assumed for probable reserves.
We emphasize that the volume of reserves are estimates that, by their nature are subject to revision. The estimates are made using geological and reservoir data, as well as production performance data. These estimates are reviewed annually and revised, either upward or downward, as warranted by additional performance data. These reserve revisions result primarily from improved or a decline in performance from a variety of sources such as an addition to or a reduction in recoveries below or above previously established lowest known hydrocarbon levels, improved or a decline in drainage from natural drive mechanisms, and the realization of improved or declined drainage areas. If the estimates of proved reserves were to decline, the rate at which we record depletion expense would increase.
For the year ended December 31, 2009, we had an upward reserve revision of 18.11% in total proved reserves. This increase can be correlated to a better long-term performance of our main producing asset, the Neocomian Complex, and a higher oil price. The reserves at December 31, 2009 were priced at $56.99 per Bbl, as compared to $34.29 at December 31, 2008.
For the year ended December 31, 2008, we had a downward reserve revision of 37.41% in total proved reserves. At December 31, 2007 the price used for evaluating our oil reserves was $95.72 per barrel as compared to the December 31, 2008 price of $34.29 per barrel. This 65% decrease in oil price had a severe impact on the economic life of our wells, but also on the discounted present value at 10% and the standardized measure of proved reserves. This downward revision, which primarily affected our French oil reserves, was due to the following factors (i) decrease in economic life due to change in economics caused a net decrease of 1,682 MBbl; (ii) removing 12 proved undeveloped locations from the report caused a net decrease 1,889 MBbl; (iii) negative reserve revisions resulted in a decrease in reserves of 405 MBbl; (iv) 14 wells were shut-in resulting in a decrease of 401 MBbl; (v) three drilled locations in prior years resulted in one producing well which was non-commercial at December 31, 2008 causing a net decrease of 280 MBbl; (vi) one well was lost during workover operations causing a net decrease 37 MBbl; (vii) 2008 production of 805 MBOE. In Hungary, we were able to secure a gas contract and were able to restore the reserves lost in 2007, this resulted in an increase of 159 MBOE and in Romania due to the poor performance of the field
41
Table of Contents
resulted in a decrease of 54 MBOE. In Turkey, we had downward revisions of 390 MBOE. which was due to a decrease in the economic life of the proved developed wells.
We review our proved oil and natural gas properties for impairment on an annual basis or whenever events and circumstances indicate a potential decline in the recoverability of their carrying value. We estimate the expected future cash flows from our proved oil and natural gas properties and compare these future cash flows to the carrying value of the oil and natural gas properties to determine if the carrying value is recoverable. If the carrying value exceeds the estimated undiscounted future cash flows, we will adjust the carrying value of the oil and natural gas properties to its fair value in the current period. The factors used to determine fair value include, but are not limited to, estimates of reserves, future commodity prices, future production estimates, anticipated capital expenditures, and a discount rate commensurate with the risk associated with realizing the expected cash flows projected. Unproved properties are reviewed quarterly to determine if there has been impairment of the carrying value, with any such impairment charged to expense in the period. Given the complexities associated with oil and natural gas reserve estimates and the history of price volatility in the oil and natural gas markets, events may arise that will require us to record an impairment of our oil and natural gas properties and there can be no assurance that such impairments will not be required in the future nor that they will not be material.
We recorded a $2.3 million impairment to continuing operations in 2008 compared to zero in 2009. The 2008 impairment, to continuing operations, was due to management's decision to exit Trinidad and discontinue our association with our registered agent in the country $2 million and a reduction in the carrying value of our investment in ePsolutions by $300,000 which we believed more accurately reflects the current market value of this investment.
In 2009, we recorded an impairment charge of $10.7 million, to discontinued operations, compared to $83 million in 2008. The 2009 impairment was due to 1) the Company's decision not to proceed with the Kiha pipeline in Hungary $5.4 million and 2) the decline in the fair market value of the South Akcakoca Sub-basin assets in Turkey $5.3 million.
The 2008 impairment, to discontinued operations, was due to the following:
(1) In 2008, the impairment charge in Turkey was a result of a decline in the fair market value of the Company's interest in South Akcakoca Sub-Basin assets. In June 2008, we determined the fair market value based on a Letter of Intent to sell a 26.75% interest in the South Akcakoca Sub-Basin assets to Petrol Ofisi AS for $80.3 million. This sale price indicated that the fair value of our 36.75% working interest was approximately $103.8 million. The net book value of the Black Sea asset at June 30, 2008 was $157.3 million, resulting in an impairment of $53.5 million.
(2) In January 2009, the Company and Petrol Ofisi agreed to a revised purchase price of $55 million. This resulted in an impairment on assets held for sale as of December 31, 2008, which is comprised of the 26.75% interest in the South Akcakoca Sub-basin assets, of $25.6 million.
(3) In December 2008, we incurred an additional $2.4 million impairment charge in Turkey for assets that were unrelated to the sale of South Akcakoca Sub-Basin assets. The impairment was a result of writing off an exploratory well where sufficient progress was not made to develop the area and a plan of development will not be prepared, by the operator, in the foreseeable future.
(4) When recording the acquisition of Madison Oil in 2002, we recorded $833,000 of goodwill associated with the Turkish assets. We periodically review the value of goodwill to determine if an impairment is required. The review at December 31, 2008, indicated that the total amount recorded for goodwill should be impaired. The reason for this impairment is due to the fair value of the Turkish subsidiary, based on the discounted present value of the oil and gas reserves being less than the carrying value of the Turkish subsidiary. This resulted in an impairment charge of $833,000.
42
Table of Contents
(5) In December 2008, we recorded an impairment in Romania of $600,000 due to the net book value of the oil and natural gas properties exceeding future cash flows.
Future Development and Abandonment Costs
Future development costs include costs to be incurred to obtain access to proved reserves, including drilling costs and the installation of production equipment. Future abandonment costs include costs to dismantle and relocate or dispose of our production equipment, gathering systems, wells and related structures and restoration costs of land. We develop estimates of these costs for each of our properties based upon the type of production structure, depth of water, reservoir characteristics, depth of the reservoir, market demand for equipment, currently available procedures and consultations with construction and engineering consultants. Because these costs typically extend many years into the future, estimating these future costs is difficult and requires management to make estimates and judgments that are subject to future revisions based upon numerous factors, including changing technology, the ultimate settlement amount, inflation factors, credit adjusted discount rates, timing of settlement and changes in the political, legal, environmental and regulatory environment. We review our assumptions and estimates of future abandonment costs on an annual basis. The accounting for future abandonment costs changed on January 1, 2003, with the adoption of FASB ASC 410"Asset Retirement and Environmental Obligations". ASC 410 requires that the fair value of a liability for an asset retirement obligation be recorded in the period in which it is incurred and the corresponding cost be capitalized by increasing the carrying amount of the related long-lived asset. The liability is accreted to its present value each period, and the capitalized cost is depreciated over the useful life of the related asset. If the liability is settled for an amount other than the recorded amount, a gain or loss is recognized. In 2005, two separate incidents occurred offshore Turkey in the Black Sea, which resulted in the sinking of the Fallen Structures and the loss of three natural gas wells. We have not been requested, or ordered by any governmental or regulatory body, to remove the Fallen Structures. Therefore, we believe it is unlikely that we will receive such a request or order, and no liability has been recorded.
Holding all other factors constant, if our estimate of future abandonment costs is revised upward, earnings would decrease due to higher depreciation, depletion and amortization expense. Likewise, if these estimates were revised downward, earnings would increase due to lower depreciation, depletion and amortization expense.
For financial reporting purposes, we generally provide taxes at the rate applicable for the appropriate tax jurisdiction. Because our present intention is to reinvest the unremitted earnings in our foreign operations, we do not provide U.S. income taxes on unremitted earnings of foreign subsidiaries. Management periodically assesses the need to utilize these unremitted earnings to finance our foreign operations. This assessment is based on cash flow projections that are the result of estimates of future production, commodity prices and expenditures by tax jurisdiction for our operations. Such estimates are inherently imprecise since many assumptions utilized in the cash flow projections are subject to revision in the future.
Management also periodically assesses, by tax jurisdiction, the probability of recovery of recorded deferred tax assets based on its assessment of future earnings estimates. Such estimates are inherently imprecise since many assumptions utilized in the assessments are subject to revision in the future.
We periodically utilize derivatives instruments such as futures and swaps for purposes of hedging our exposure to fluctuations in the price of crude oil sales. In accordance with FASB ASC 815,"Derivatives and Hedging ," we have elected not to designate the derivative financial instruments to which we are a party as hedges, and accordingly, we record such contracts at fair value as an asset or a liability and recognize changes in such fair value in current earnings as they occur. We determine the fair value of futures and
43
Table of Contents
swap contracts based on the difference between their fixed contract price and the underlying market price at the determination date. The realized and unrealized gains and losses on derivatives are recorded as a derivative fair value gain or loss in the income statement.
The functional currency for France is the Euro. Translation gains and losses resulting from transactions in Euros are included in other comprehensive income for the current period. We periodically review the operations of our entities to ensure the functional currency of each entity is the currency of the primary economic environment in which we operate.
New Accounting Pronouncements
In December 2007, the Financial Accounting Standards Board (the "FASB") issued FASB Accounting Standards Codification (ASC) 805,"Business Combinations", formerly Statement No. 141R,"Business Combinations" ("SFAS No. 141R"). Under ASC 805, a company is required to recognize the assets acquired, liabilities assumed, contractual contingencies, and any contingent consideration measured at their fair value at the acquisition date. It further requires that research and development assets acquired in a business combination that have no alternative future use are to be measured at their acquisition-date fair value and then immediately charged to expense, and that acquisition-related costs are to be recognized separately from the acquisition and expensed as incurred. Among other changes, this statement also requires that "negative goodwill" be recognized in earnings as a gain attributable to the acquisition, and any deferred tax benefits resultant in a business combination be recognized in income from continuing operations in the period of the combination. ASC 805 is effective for business combinations for which the acquisition date is on or after the beginning of the first annual reporting period beginning after December 15, 2008. On January 1, 2009, the Company adopted ASC 805 and applies its provisions prospectively to business combinations that occur after adoption. The adoption did not have any immediate effect on the financial statements and related disclosures.
In December 2007, the FASB issued FASB Accounting Standards Codification (ASC) 810,"Consolidations", formerly Statement No. 160,"Non-controlling Interests in Consolidated Financial Statements" —an amendment of ARB No. 51 ("SFAS No. 160"). The Standard establishes accounting and reporting standards for the non-controlling interest in a subsidiary and for the deconsolidation of a subsidiary. It clarifies that a non-controlling interest in a subsidiary, which is sometimes referred to as minority interest, is an ownership interest in the consolidated entity that should be reported as equity in the consolidated financial statements. Among other requirements, this statement requires consolidated net income to be reported at amounts that include the amounts attributable to both the parent and the non-controlling interest. It also requires disclosure, on the face of the consolidated income statement, of the amounts of consolidated net income attributable to the parent and to the non-controlling interest. The Standard is effective for financial statements issued for fiscal years, and interim periods within those fiscal years, beginning after December 15, 2008. On January 1, 2009, the Company adopted ASC 810 and there was no effect on the financial statements and related disclosures.
In February 2008, the FASB issued FASB Accounting Standards Codification (ASC) 820,"Fair Value Measurements and Disclosures", formerly FSP No. 157-2 ("FASB No. 157-2") to defer the effective date to fiscal years beginning after November 15, 2008, and the interim periods within such fiscal years, for all related nonfinancial assets and liabilities, including nonfinancial assets and liabilities measured at fair value in a business combination; impaired property, plant and equipment; goodwill; and initial recognition of asset retirement obligations. We adopted the deferred portion of the Standard effective January 1, 2009 and the adoption did not have a significant effect on the financial positions and results of operations. Refer to Note 14 of the financial statements for related disclosures.
In March 2008, the FASB issued FASB Accounting Standards Codification (ASC) 815,"Derivatives and Hedging", formerly Statement No. 161,"Disclosures about Derivative Instruments and Hedging Activities" — an Amendment of FASB Statement No. 133 ("SFAS No. 161"). This statement changes the
44
Table of Contents
disclosure requirements for derivative instruments and hedging activities. Entities are required to provide enhanced disclosures about (i) how and why an entity uses derivative instruments, (ii) how derivative instruments and related hedged items are accounted for and (iii) how derivative instruments and related hedged items affect an entity's financial position, financial performance, and cash flows. The Standard is effective for annual periods beginning after November 15, 2008. On January 1, 2009, the Company adopted the Standard.
In May 2008, the FASB issued FASB Accounting Standards Codification (ASC) 470,"Debt", formerly FASB Staff Position ("FSP") No. APB 14-1,"Accounting for Convertible Debt Instruments That May Be Settled in Cash Upon Conversion (Including Partial Cash Settlement)" ("FSP APB No. 14-1"). The Standard specifies that issuers of such instruments should separately account for the liability and equity components in a manner that will reflect the entity's nonconvertible debt borrowing rate when interest costs is recognized in subsequent periods. The Standard is effective for financial statements issued for fiscal years beginning after December 15, 2008 and interim periods within those fiscal years and should be applied retrospectively for all periods presented. On January 1, 2009, the Company adopted the Standard and there was no effect on our financial statements and related disclosures.
On December 31, 2008 the SEC issued the final rule,"Modernization of Oil and Gas Reporting" (the "Final Reporting Rule"). The Final Reporting Rule adopts revisions to the SEC's oil and gas reporting disclosure requirements and is effective for annual reports on Forms 10-K for years ending on or after December 31, 2009. The revisions are intended to provide investors with a more meaningful and comprehensive understanding of oil and gas reserves to help investors evaluate their investments in oil and gas companies. The amendments are also designed to modernize the oil and gas disclosure requirements to align them with current practices and changes in technology. Revised requirements in the Final Reporting Rule include, but are not limited to:
- •
- Oil and gas reserves must be reported using the un-weighted arithmetic average of the first day of the month price for each month within a 12 month period, rather than year-end prices;
- •
- Companies will be allowed to report, on an optional basis, probable and possible reserves;
- •
- Non-traditional reserves, such as oil and gas extracted from coal and shales, will be included in the definition of "oil and gas producing activities;"
- •
- Companies will be permitted to use new technologies to determine proved reserves, as long as those technologies have been demonstrated empirically to lead to reliable conclusions with respect to reserve volumes;
- •
- Companies will be required to disclose, in narrative form, additional details on their proved undeveloped reserves ("PUDs"), including the total quantity of PUDs at year end, and any material changes to PUDs that occurred during the year, investments and progress made to convert PUDs to developed oil and gas reserves and an explanation of the reasons why material concentrations of PUDs in individual fields or countries have remained undeveloped for five years or more after disclosure as PUDs; and
- •
- Companies will be required to report the qualifications and measures taken to assure the independence and objectivity of any business entity or employee primarily responsible for preparing or auditing reserves estimate.
We have complied with the disclosure requirements in our annual report on Form 10-K for the year ended December 31, 2009.
Application of the new reserves rules resulted in the use of lower prices at December 31, 2009 for crude oil than would have been used under the previous rules. Nonetheless, given the low decline and the maturity of the Neocomian Complex, which accounted for 93.31% of our proved reserves, once a certain threshold price is reached, use of a higher oil price does not have a significant effect on our reserves estimates. Because the prices used under the new reserves rules already exceed this threshold price, reserves under the new rules are identical to the reserves under the previous rules.
45
Table of Contents
On April 9, 2009, the FASB issued FASB Accounting Standards Codification (ASC) 825,"Financial Instruments", formerly FASB Staff Position No. FAS 107-1 and APB 28-1,"Interim Disclosures about Fair Value of Financial Instruments" (FSP 107-1). The Standard requires disclosures about financial instruments, including fair value, carrying amount, and method and significant assumptions used to estimate the fair value. The Company adopted this standard as of June 30, 2009. Our adoption of this standard did not affect our financial position or results of operations.
In June 2009, the FASB issued Accounting Standards Update 2009-01,Amendments based on SFAS No. 168 — The FASB Accounting Standards Codification™and the Hierarchy of Generally Accepted Accounting Principles to codify in ASC 105,Generally Accepted Accounting Principles, FASB Statement 168,The FASB Accounting Standards Codification™and the Hierarchy of Generally Accepted Accounting Principles, which was issued to establish the Codification as the sole source of authoritative U.S. GAAP recognized by the FASB, excluding SEC guidance, to be applied by nongovernmental entities. The guidance in ASC 105 is effective for financial statements issued for interim and annual periods ending after September 15, 2009. Applying the guidance in ASC 105 did not impact the Company's financial condition and results of operations. The Company has revised its references to pre-Codification GAAP in its financial statements.
In August 2009, the FASB issued ASU 2009-05,"Fair Value Measurements and Disclosures (Topic 820) — Measuring Liabilities at Fair Value" to provide guidance when estimating the fair value of a liability. When a quoted price in an active market for the identical liability is not available, fair value should be measured using:
- •
- the quoted price of an identical liability when traded as an asset,
- •
- quoted prices for similar liabilities or similar liabilities when traded as assets, or
- •
- another valuation technique consistent with the principles of Topic 820 such as an income approach or a market approach.
If a restriction exists that prevents the transfer of the liability, a separate adjustment related to the restriction is not required when estimating fair value. The Standard is effective for the first reporting period (including interim periods) beginning after issuance. The Company adopted this standard as of December 31, 2009. Our adoption of this standard did not affect our financial position or results of operations.
On January 6, 2010, the FASB issued ASU 2010-03, which aligns the FASB's oil and gas reserve estimation and disclosure requirements with the requirements in the SEC's Final Rule.
We adopted the Final Reporting Rule and ASU 2010-03 effective December 31, 2009 as a change in accounting principle that is inseparable from a change in accounting estimate. Such a change is accounted for prospectively under the authoritative accounting guidance. Comparative disclosures applying the new rules for periods before the adoption of ASU 2010-03 and the Final Reporting Rule are not required.
Our adoption of ASU 2010-03 and the Final Rule on December 31, 2009 impacted our financial statements and other disclosures in this annual report on Form 10-K for the year ended December 31, 2009, as follows:
- •
- All oil and gas reserves volumes presented as of and for the year ended December 31, 2009 were prepared using the updated reserves rules and are not on a basis comparable with prior periods. This change in comparability occurred because we estimated our proved reserves at December 31, 2009 using the updated reserves rules, which require use of the unweighted average first-day-of-the-month commodity prices for the prior twelve months, adjusted for market differentials, and permits the use of reliable technologies to support reserve estimates. Under the previous reserve estimation rules, which are no longer in effect, our net proved oil and gas reserves would have been calculated using end of period oil and gas prices. In addition, the new rules permit us to disclose probable and possible reserves (and we have so disclosed probable and possible reserves), which was not permitted under previous rules. Adoption of ASU 2010-03 and the Final
46
Table of Contents
Rule did not have any significant effect on our reserves estimate, however, standardized measure of discounted future net cash flows related to proved reserves decreased by approximately $23 million due to use of unweighted twelve month average price compare to year end price.
LIQUIDITY AND CAPITAL RESOURCES
This section should be read in conjunction with Notes 7, 8 and 17 to Notes to Consolidated Financial Statements included in this filing.
The Company's liquidity depends on cash flow from operations and existing cash resources. As of December 31, 2009, we had cash of $8.7 million, a current ratio of approximately 0.34 to 1; however, without considering the current portion of long-term debt, the ratio would be 1.16 to 1 and a debt (5.00% Convertible Senior Notes) to equity ratio of 8.90 to 1. For the twelve months ended December 31, 2009, we had an operating loss of $16.2 million and negative cash flows from operating activities of $7.3 million. In addition, in 2009, we received proceeds from the sales of our assets in Turkey and Hungary.
Other than funding our mandatory capital expenditures, our primary use of discretionary cash in 2009 was to reduce debt. We have no mandatory capital expenditures in 2010; however, execution of our business plan entails substantial capital expenditures. Under French law, each of our exploration permits and exploitation concessions require that we commit to expenditures of a certain amount over the period of the applicable permit or concession. Though we consider these amounts discretionary, such expenditures would be required to renew such permits. We believe we will have sufficient cash flow from operations and cash on hand to meet all of our 2010 obligations.
On March 3, 2009, we completed the sale of a 26.75% interest in the SASB to Petrol Ofisi for $55 million. In accordance with the agreement, $50 million of the proceeds was paid by Petrol Ofisi upon closing and the remaining $5 million was paid on September 1, 2009. Simultaneous with the closing of the sale of the 26.75% interest in the SASB to Petrol Ofisi, we repaid the secured revolving credit facility with the International Finance Corporation. The total amount of the payment was $36.4 million, which was comprised of $30 million principal, $5.9 million additional compensation due under the credit facility as a result of our repayment (such additional compensation calculated under the terms of the credit facility as a percentage of the Company's earnings before interest, tax, depreciation, amortization, and exploration expense) and $500,000 for accrued interest and fees. As a result of the early extinguishment, we recorded a loss of $4.9 million for the nine months ended September 30, 2009, which was recorded in discontinued operations. Following the retirement of the credit facility with the International Finance Corporation, the Company does not have a credit facility and currently relies on its cash balance to meet its immediate cash requirements.
On September 30, 2009, we sold 100% of the shares of Toreador Hungary Limited, our wholly owned subsidiary, for total consideration consisting of: (1) a cash payment of $5.4 million (€3.7 million) paid at closing, (2) $435,000 (€300,000), which was paid to us on November 5, 2009 as part of a post-closing adjustment, and (3) a contingent payment of $2.9 million (€2 million) to be paid upon post-transaction completion of agreements relating to certain assets of Toreador Hungary.
On October 7, 2009, we sold 100% of the shares of Toreador Turkey Limited, our wholly owned subsidiary, for total consideration consisting of: (1) a cash payment of $10.5 million paid at closing, (2) exploration success payments dependent upon certain future commercial discoveries under the licenses sold, up to a maximum aggregate consideration of $40 million, and (3) future quarterly 10% pre-tax net profit interest payments if a field goes into production that was discovered by an exploration well drilled within four years of closing on certain of the licenses then still held by the Tiway.
47
Table of Contents
On December 28, 2006, we entered into a loan and guarantee agreement with International Finance Corporation. The loan and guarantee agreement provided for a $25 million facility which was a secured revolving facility with a maximum facility amount of $25 million which maximum facility amount would have increased to $40 million when the projected total borrowing base amount exceeds $50 million. The $25 million facility funded on March 2, 2007. The total proceeds received on March 2, 2007 were approximately $25 million, of which $11 million was used to retire the outstanding balance on the $15 million credit facility and the remaining $14 million of funds was used to finance our capital expenditures in Turkey and Romania. The loan and guarantee agreement also provided for an unsecured $10 million facility which funded on December 28, 2006. Both the $25 million facility and the $10 million facility were to fund our operations in Turkey and Romania.
On March 3, 2009, we repaid and retired the facilities with the International Finance Corporation. The total amount of the payment was $36.4 million, which was comprised of $30 million principal, $5.9 million additional compensation due under the credit facility as a result of our repayment (such additional compensation calculated under the terms of the credit facility as a percentage of the Company's earnings before interest, tax, depreciation, amortization and exploration expense) and $500,000 for accrued interest and fees. As a result of the early extinguishment, we recorded a loss of $4.9 million which was recorded in discontinued operations for the year ended December 31, 2009.
Following retirement of the credit facility with the International Finance Corporation, the Company does not have a credit facility and will rely on its cash balance to meet its immediate cash requirements.
On September 27, 2005, we sold $75 million of 5.00% Convertible Senior Notes due October 1, 2025 to qualified institutional buyers pursuant to Rule 144A of the Securities Act of 1933. We also granted the initial purchasers the option to purchase an additional $11.25 million aggregate principal amount of 5.00% Convertible Senior Notes to cover over-allotments. The option was exercised on September 30, 2005. The total principal amount of 5.00% Convertible Senior Notes issued was $86.25 million and total net proceeds were approximately $82.2 million.
The 5.00% Convertible Senior Notes bear interest at a rate of 5% per annum and can be converted into common stock at an initial conversion rate of 23.3596 shares of common stock per $1,000 principal amount of 5.00% Convertible Senior Notes, subject to adjustment (equivalent to a conversion price of approximately $42.81 per share). We may redeem the 5.00% Convertible Senior Notes, in whole or in part, on or after October 6, 2008, and prior to October 1, 2010, for cash at a redemption price equal to 100% of the principal amount of 5.00% Convertible Senior Notes to be redeemed, plus any accrued and unpaid interest, if the closing price of our common stock exceeds 130% of the conversion price over a specified period. On or after October 1, 2010, we may redeem the 5.00% Convertible Senior Notes, in whole or in part, at a redemption price equal to 100% of the principal amount of 5.00% Convertible Senior Notes to be redeemed, plus any accrued and unpaid interest, irrespective of the price of its common stock. Holders may convert their 5.00% Convertible Senior Notes at any time prior to the close of business on the business day immediately preceding their stated maturity, and holders may, upon the occurrence of certain fundamental changes, and on October 1, 2010, October 1, 2015, and October 1, 2020, require us to repurchase all or a portion of their 5.00% Convertible Senior Notes for cash in an amount equal to 100% of the principal amount of such 5.00% Convertible Senior Notes, plus any accrued and unpaid interest.
In 2008, we repurchased $6 million in principal amount of the 5.00% Convertible Senior Notes on the open market and through privately negotiated transactions for $5.3 million plus accrued interest of $109,347. Additionally, we expensed $241,965 of prepaid loan fees attributable to the repurchased 5.00% Convertible Senior Notes. This resulted in a $458,535 gain on the early extinguishment of debt. In April 2009, we repurchased $16.7 million in principal amount of the 5.00% Convertible Senior Notes on the open market for $12.7 million plus accrued interest and prepaid loan fees of $652,000. This repurchase
48
Table of Contents
resulted in a gain of $3.4 million on the early extinguishment of debt which was recorded in the second quarter of 2009. In October 2009, we repurchased $9 million principal amount of the 5.00% Convertible Senior Notes on the open market and through privately negotiated transactions for $8.7 million plus accrued interest and prepaid loan fees of $307,000. This repurchase resulted in a loss of $26,000 on the early extinguishment of debt which was recorded in the fourth quarter of 2009. As of December 31, 2009, $54.6 million aggregate principal amount of the 5.00% Convertible Senior Notes was outstanding.
On February 1, 2010, Toreador consummated an exchange transaction (the "Convertible Notes Exchange"). In the Convertible Notes Exchange, in exchange for (a) $22,231,000 principal amount of our outstanding 5.00% Convertible Senior Notes due 2025, or the Old Notes, and (b) $9.4 million cash, we issued $31,631,000 aggregate principal amount of our 8.00%/7.00% Convertible Senior Notes due 2025, or the New Convertible Senior Notes, and paid accrued and unpaid interest on the Old Notes. On February 1, 2010, we had approximately $32.4 million aggregate principal amount outstanding of our 5.00% Convertible Senior Notes and $31.6 million outstanding aggregate principal amount of our New Convertible Senior Notes. See Note 17 (Subsequent Events) of Notes to Consolidated Financial Statements. The New Convertible Senior Notes may be redeemed in whole or in part at the Company's option prior to October 1, 2013, in cash at a redemption price equal to one hundred percent (100%) of the principal amount of the New Convertible Senior Notes redeemed, plus accrued and unpaid interest, if any, to, but excluding, the redemption date plus a make-whole payment, if the closing sale price of the Company's common stock has exceeded 200% of the conversion price then in effect for at least twenty (20) trading days in any consecutive thirty (30)-trading day period ending on the trading day prior to the date of mailing of the relevant notice of redemption. The New Convertible Senior Notes may be redeemed in whole or in part at the Company's option on or after October 1, 2013 for cash at a redemption price equal to 100% of the principal amount of the New Convertible Senior Notes redeemed, plus any accrued and unpaid interest to, but excluding, the redemption date. In addition, upon the occurrence of certain fundamental changes, and on each of October 1, 2013, October 1, 2015 and October 1, 2020, a holder may require the Company to repurchase all or a portion of the New Convertible Senior Notes in cash for 100% of the principal amount of the New Convertible Senior Notes to be purchased, plus any accrued and unpaid interest to, but excluding, the purchase date.
On February 12, 2010, we completed a registered underwritten public offering of 3,450,000 shares of common stock, including 450,000 shares of common stock acquired by the underwriters from us to cover over-allotment options. The net proceeds to Toreador from the offering were approximately $27.2 million, after deducting underwriting discounts, commissions and estimated offering expenses. We intend to use the net proceeds, together with cash on hand, to satisfy payment obligations arising from the holders' exercise, if any, of their right on October 1, 2010 to require the Company to repurchase its 5.00% Convertible Senior Notes due 2025 and for general corporate purposes, which may include working capital, capital expenditures and acquisitions. See Note 17 (Subsequent Events) of Notes to Consolidated Financial Statements.
The following table sets forth our contractual obligations in thousands at December 31, 2009 for the periods shown:
| | | | | | | | | | | | | | | | |
| | Total | | Less than
One Year | | One to
Three Years | | Four to
Five Years | | More than
Five Years | |
|---|
Long-term debt | | $ | 54,616 | | $ | 32,385 | | $ | — | | $ | 22,231 | | $ | — | |
Lease commitments | | | 2,175 | | | 357 | | | 1,358 | | | 460 | | | — | |
| | | | | | | | | | | | |
Total contractual obligations | | $ | 56,791 | | $ | 32,742 | | $ | 1,358 | | $ | 22,691 | | $ | — | |
| | | | | | | | | | | | |
Contractual obligations for long-term debt above does not include amounts for interest payments.
49
Table of Contents
Results of Operations
In 2009, the Company disposed of its interest in Turkey, Hungary and Romania. The results of operations for these operations have been reclassified as discontinued operations for all periods presented and are discussed separately under the heading " — Results of discontinued operations."
Comparison of Years Ended December 31, 2009 and 2008
| | | | | | | | | | | | | | | | |
| | For the Years Ended December 31, | |
|---|
| | 2009 | | 2008 | |
| | 2009 | | 2008 | |
|---|
Production: | | | | | | | | Average Price: | | | | | | | |
Oil (MBbls): | | | | | | | | Oil ($/Bbl): | | | | | | | |
| | France | | | 328 | | | 365 | | France | | $ | 57.17 | | $ | 93.32 | |
Revenues
Oil sales for the twelve months ended December 31, 2009 were $19.2 million, as compared to $34.2 million for the comparable period in 2008. This decrease is primarily due to the global decrease in oil prices and decreased production in 2009, as compared to the prior year. The decline in production of 37 mbbl is primarily a result of wells being shut in for workovers and of natural decline. The decrease in the average realized price for oil from $93.32 in 2008 to $57.17 in 2009 resulted in a decrease of revenue of $11.9 million, and the decline in production resulted in a decrease of revenue of $3.5 million.
The above table compares both volumes and prices received for oil for the twelve months ended December 31, 2009 and 2008. Oil prices are and probably will continue to be extremely volatile and a significant change will have a material impact on our revenue.
Costs and expenses
Lease operating expense was $8.4 million, or $25.60 per BOE produced, for the twelve months ended December 31, 2009, as compared to $9.3 million, or $25.37 per BOE produced, for the comparable period in 2008. This decrease is primarily due to the decrease in production.
Exploration expense for the twelve months ended December 31, 2009 was $138,000, as compared to $1.2 million for the comparable period in 2008. The decrease is due to the elimination of the exploration staff in the Dallas office due to the relocation of our headquarters to Paris, France.
Depreciation, depletion and amortization
For the twelve months ended December 31, 2009, depreciation, depletion and amortization expense was $5.8 million, or $17.57 per BOE produced, as compared to $5 million, or $13.70 per BOE produced for the twelve months ended December 31, 2008. This increase is primarily due to the lower proved reserves assigned to our French assets at December 31, 2008 due to depressed oil prices and was partially offset by the decline in oil production of 37 MBbls and increased reserves at December 31, 2009.
50
Table of Contents
Impairment charged in 2009 was zero compared to $2.3 million in 2008. The impairment was primarily a result of an impairment charge of $2 million for the undeveloped leasehold costs in Trinidad, due to management's decision to exit Trinidad and discontinue our association with our registered agent in the country. Additionally, in April 2007, we sold our interest in ePsolutions for $3.4 million in cash and 50,000 shares of preferred stock with a value of $10.00 per share. Due to the rising cost of electricity and the deterioration of the deregulated electric market in Texas, in 2008, ePsolutions reduced their forecasted growth for the next several years. Accordingly, we reduced our carrying value of our investment in ePsolutions by $300,000 which we believe more accurately reflects the current market value of this investment.
General and administrative expense was $20.4 million for the twelve months ended December 31, 2009, as compared to $13 million for the comparable period of 2008. This includes stock compensation, cost incurred due to resignation of former officers, costs associated with subsidiary sales and costs associated with the Dallas office/relocation of headquarters.
Excluding those exceptional items, general and administrative expense was $11.3 million for the twelve months ended December 31, 2009, compared with $9.8 million for the comparable period of 2008.
Exceptional general and administrative expenses are as follows: stock compensation, cost incurred due to resignation of former officers, costs associated with subsidiary sales and costs associated with the Dallas office/relocation of headquarters.
Stock compensation expense was $3.6 million for the twelve months ended December 31, 2009, compared with $2.3 million for the comparable period of 2008. This increase is primarily due to the change in the structure of Board compensation, effective beginning in 2009, whereby directors receive a greater portion of their compensation in stock rather than cash in addition to a stock bonus that was granted to foreign office employees. The immediate vesting of grants made to employees in the Dallas office that have been terminated has been classified as "Cost associated with the Dallas office/relocation of corporate headquarters from Dallas, Texas to Paris, France" and are not reflected in this amount.
The Company and Nigel Lovett, our former President and Chief Executive Officer, entered into a Separation and Mutual Release Agreement (the "Lovett Release") in connection with his resignation from the Company in January 2009. Pursuant to the Lovett Release, Toreador amended certain terms and conditions of Mr. Lovett's 2008 employment agreement (the "2008 Employment Agreement") with Toreador. The terms of the 2008 Employment Agreement, as amended, provide for Toreador to: (i) pay Mr. Lovett all unpaid compensation earned but not paid, (ii) pay Mr. Lovett certain severance payments totaling $720,000 to be paid in 24 equal monthly installments, (iii) issue 90,000 shares of Toreador common stock to Mr. Lovett, and (iv) vest 6,800 shares of Toreador restricted stock held by Mr. Lovett. The cost associated with the Lovett Release totaled $832,000, which was recorded in the first quarter of 2009.
In June 2008, Michael FitzGerald resigned as Executive Vice President — Exploration and Production and Edward Ramirez resigned as Senior Vice President — Exploration and Production. Their Separation and Release Agreements provided for (i) each to receive one year of salary which together resulted in an expense of $600,000, and (ii) for Mr. FitzGerald the immediate vesting of 5,000 shares of restricted stock grants and for Mr. Ramirez the immediate vesting of 7,000 shares of restricted stock grants which together resulted in an expense of $35,000.
51
Table of Contents
In addition in June 2008, three other employees resigned, which collectively resulted in an additional $304,000 of expense.
For the year ended December 31, 2009 we had $545,000 in legal and consulting expenses due to the sale of the Turkish and Hungarian subsidiaries, as compared to zero for the comparable period in 2008.
Cost associated with the Dallas office/ relocation of corporate headquarters from Dallas, Texas to Paris, France
For the year ended December 31, 2009 we had $4.0 million of costs associated with the Dallas office/ relocation of our headquarters from Dallas, Texas to Paris, France. The major components are: 1) salaries and wages associated with Dallas office employees $919,000; 2) severance payments to terminated Dallas employees $1.7 million, which includes stock compensation of $866,000; 3) corporate restructuring expenses $847,000; 4) travel by Dallas office employees $322,000; 5) miscellaneous relocation costs $322,000 and 6) Dallas office rent $241,000. For the twelve months ended December 31, 2008, we did not have any such relocation costs.
Loss on oil derivative contracts was $879,000 for the year ended December 31, 2009, as compared to a loss of $1.8 million for 2008.
The realized gain in 2009 represents the recognized gain on the commodity derivative contracts with Vitol S.A. Presented in the table below is a summary of the contracts entered into:
| | | | | | | | | | | | | | | |
Type | | Period | | Barrels | | Floor | | Ceiling | | Gain | |
|---|
Collar | | July 1 — September 30, 2009 | | | 55,200 | | $ | 65.00 | | $ | 77.00 | | $ | 7 | |
Collar | | October 1 — December 30, 2009 | | | 55,200 | | $ | 65.00 | | $ | 77.00 | | | — | |
Additionally, we recorded an unrecognized loss on the commodity derivative contracts for 2010, with Vitol S.A. Presented in the table below is a summary of the contracts entered into:
| | | | | | | | | | | | | | | |
Type | | Period | | Barrels | | Floor | | Ceiling | | Loss | |
|---|
Collar | | January 1 — December 31, 2010 | | | 182,500 | | $ | 68.00 | | $ | 81.00 | | $ | (886 | ) |
The 2008 loss represents the recognized loss on the commodity derivative contracts with Total Oil Trading. Presented in the table below is a summary of the contracts entered into with the gain (loss) in thousands:
| | | | | | | | | | | | | | | |
Type | | Period | | Barrels | | Floor | | Ceiling | | Gain/(Loss) | |
|---|
Collar | | January 1 — March 31, 2008 | | | 48,000 | | $ | 84.75 | | $ | 92.75 | | $ | (19 | ) |
Collar | | April 1 — June 30, 2008 | | | 48,000 | | $ | 92.25 | | $ | 100.25 | | | (2,239 | ) |
Collar | | July 1 — September 30, 2008 | | | 48,000 | | $ | 91.75 | | $ | 99.75 | | | 477 | |
| | | | | | | | | | | | | | | |
| | | | | | | | | | | | | $ | (1,781 | ) |
| | | | | | | | | | | | | | | |
52
Table of Contents
We recorded a gain on foreign currency exchange of $169,000 for the year ended December 31, 2009 as compared with a loss of $145,000 for the comparable period of 2008. This increase is primarily due to the strengthening of the Euro compared to the U.S. Dollar in 2009.
For the year ended December 31, 2009, we repurchased $25.7 million principal amount of our 5.00% Convertible Senior Notes on the open market and through privately negotiated transactions for $21.3 million plus accrued interest and prepaid loan fees resulting in a gain of $3.3 million on the early extinguishment of debt. For the comparable period of 2008, we repurchased $6 million of the Convertible Senior Notes for $5.3 million plus accrued interest and prepaid loan fees resulting in a $458,535 gain on the early extinguishment of debt.
Interest and other income was $251,000 for the year ended December 31, 2009 as compared with $775,000 in the comparable period of 2008. The decrease is due primarily to having a lower average cash balance in 2009, as compared to 2008 as a result of lower revenues due to decreased oil prices and increased general and administrative expense.
Interest expense, net of interest capitalization
Interest expense was $3.4 million for the year ended December 31, 2009, as compared to $4.2 million for the comparable period of 2008. This decrease is due to the repurchase of $25.7 million principal of the 5.00% Convertible Senior Notes. This is offset by the amount recorded in 2008 for capitalized interest $1 million, as compared to $355,000 for the comparable period in 2009.
For the year ended December 31, 2009 we reported an income tax benefit of $450,000, compared to an expense of $5.5 million for the same period of 2008. The reduction in income tax is primarily due to a decrease in the French tax provision due to a tax refund of 2008 French income tax in 2009 and a reduction in 2009 French taxable income as a result of decreased revenues.
For the year ended December 31, 2009, we reported a loss from continuing operations net of taxes of $15.3 million, compared with a loss of $7 million for the same period of 2008. For the twelve months ended December 31, 2009 we recorded a loss available to common shares of $25.4 million versus a loss available to common shares of $108.6 million for the year ended December 31, 2008.
The most significant element of comprehensive income, other than net income, is foreign currency translation. As of December 31, 2009, we had accumulated an unrealized gain of $4.6 million. For the year ended December 31, 2008, we had an unrealized loss of $5.3 million. This increase is primarily due to the strengthening of the Euro in 2009 as compared to the U.S. Dollar.
53
Table of Contents
The functional currency of our operations in France is the Euro, and the exchange rate used to translate the financial position of the French operations at December 31, 2009 and 2008 is shown below:
| | | | | | | |
| | December 31, | |
|---|
| | 2009 | | 2008 | |
|---|
Euro | | $ | 1.4406 | | $ | 1.3917 | |
| | | | | | |
On June 14, 2007, the Board of Directors authorized management to sell all our oil and natural gas properties in the United States. The sale of these properties completed the divestiture of the company's non-core domestic assets and allowed us to focus exclusively on our International operations. The sale was closed on September 1, 2007. The sales price was $19.1 million which resulted in a pre-tax gain of $9.2 million, which was recorded in September 2007.
In the fourth quarter of 2008 and during the first quarter of 2009, Toreador farmed out or sold all of its working interests in Romania to three different companies and closed its office; thus, we no longer have any operational involvement in Romania. This resulted in a gain of $5.8 million which was recorded in the first quarter of 2009.
On March 3, 2009 we completed the sale of a 26.75% interest in the South Akcakoca Sub-Basin (SASB) project associated licenses located in the Black Sea offshore Turkey, to Petrol Ofisi for $55 million. In accordance with the revised assignment announced on February 3, 2009, $50 million of the proceeds was paid by Petrol Ofisi on March 3, 2009, and the remaining $5 million was paid on September 1, 2009. No gain or loss resulting from this sale.
On September 30, 2009, the Company entered into a Share Purchase Agreement (the "Share Purchase Agreement") with Tiway Oil BV, a company organized under the laws of the Netherlands ("Tiway"), and Tiway Oil AS, a company organized under the laws of Norway, pursuant to which the Company agreed to sell 100% of the outstanding shares of Toreador Turkey Ltd. ("Toreador Turkey") to Tiway for total consideration consisting of: (1) a cash payment of $10.5 million to be paid at closing, (2) exploration success payments dependent upon certain future commercial discoveries as provided in the Share Purchase Agreement, up to a maximum aggregate consideration of $40 million, and (3) future quarterly 10% pre-tax net profit interest payments if a field goes into production that was discovered by an exploration well drilled within four years of closing on certain of the licenses then still held by Tiway. The sale of Toreador Turkey was completed on October 7, 2009 which resulted in a gain of $1.8 million.
On September 30, 2009, the Company entered into a Quota Purchase Agreement (the "Quota Purchase Agreement") with RAG (Rohöl-Aufsuchungs Aktiengesellschaft), a corporation organized under the laws of Austria ("RAG"), pursuant to which the Company agreed to sell 100% of its equity interests in Toreador Hungary Limited ("Toreador Hungary") to RAG for total consideration consisting of (1) a cash payment of US$5.4 million (€3.7 million) paid at closing, (2) US$435,000 (€300,000), which was held back subject to a post-closing adjustment and was paid to us on November 5, 2009 and (3) a contingent payment of US$2.9 million (€2 million) to be paid upon post-transaction completion of agreements relating to certain assets of Toreador Hungary. The sale of Toreador Hungary was completed on September 30, 2009. The sale of Toreador Hungary resulted in a loss of $4.1 million.
54
Table of Contents
The results of operations of assets in the United States, Romania, Turkey and Hungary have been presented as discontinued operations in the accompanying consolidated statement of operations. Results for these assets reported as discontinued operations were as follows:
The table below compares discontinued operations for the years ended December 31, 2009 and 2008:
| | | | | | | | | |
| | Year Ended December 31 | |
|---|
| | 2009 | | 2008 | |
|---|
| | (In thousands)
| |
|---|
Revenues: | | | | | | | |
| | Oil and natural gas sales | | $ | 4,545 | | $ | 28,226 | |
Costs and expenses: | | | | | | | |
| | Lease operating | | | 886 | | | 7,971 | |
| | Exploration expense | | | 868 | | | 4,582 | |
| | Impairment of oil and natural gas properties | | | 10,725 | | | 82,951 | |
| | Depreciation, depletion and amortization | | | 157 | | | 28,148 | |
| | Dry hole costs | | | 1,318 | | | — | |
| | General and administrative | | | 3,424 | | | 2,445 | |
| | (Gain) loss on sale of properties | | | (3,583 | ) | | 123 | |
| | | | | | |
| | | Total costs and expenses | | | 13,795 | | | 126,220 | |
| | | | | | |
| | Operating loss | | | (9,250 | ) | | (97,994 | ) |
| | Other income (expense): | | | | | | | |
| | | Loss on early extinguishment of debt | | | (4,881 | ) | | — | |
| | | Foreign currency exchange | | | 3,822 | | | (342 | ) |
| | | Interest and other income | | | 414 | | | 1,004 | |
| | | Interest expense | | | (185 | ) | | (3,679 | ) |
| | | | | | |
| | Loss before taxes | | | (10,080 | ) | | (101,011 | ) |
| | Income tax provision | | | — | | | 574 | |
| | | | | | |
| | Loss from discontinued operations | | $ | (10,080 | ) | $ | (101,585 | ) |
| | | | | | |
55
Table of Contents
Comparison of Years Ended December 31, 2009 and 2008
| | | | | | | | | | | | | | | | | |
| | For the Years Ended December 31, | |
|---|
| | 2009 | | 2008 | |
| | 2009 | | 2008 | |
|---|
Production: | | | | | | | | Average Price: | | | | | | | |
Oil (MBbls): | | | | | | | | Oil ($/Bbl): | | | | | | | |
| | Turkey | | | 39 | | | 56 | | Turkey | | | 49.78 | | | 93.21 | |
| | Romania | | | — | | | 3 | | Romania | | | — | | | 57.97 | |
| | | | | | | | | | | | | | |
| | | Total | | | 39 | | | 59 | | Total average oil price | | | 49.78 | | | 91.25 | |
| | | | | | | | | | | | | | |
Gas (MMcf): | | | | | | | | Gas ($/Mcf): | | | | | | | |
| | Turkey | | | 301 | | | 1,840 | | Turkey | | | 8.64 | | | 11.14 | |
| | Romania | | | — | | | 446 | | Romania | | | — | | | 5.32 | |
| | | | | | | | | | | | | | |
| | | Total | | | 301 | | | 2,286 | | Total average gas price | | | 8.64 | | | 10.00 | |
| | | | | | | | | | | | | | |
MBOE: | | | | | | | | $/ BOE: | | | | | | | |
| | Turkey | | | 89 | | | 363 | | Turkey | | | 50.94 | | | 70.88 | |
| | Romania | | | — | | | 77 | | Romania | | | — | | | 32.99 | |
| | | | | | | | | | | | | | |
| | | Total | | | 89 | | | 440 | | Total average price per BOE | | | 50.94 | | | 64.20 | |
| | | | | | | | | | | | | | |
Revenues
Oil and natural gas sales for the twelve months ended December 31, 2009 were $4.5 million, as compared to $28.2 million for the comparable period in 2008. This decrease is primarily due to the sale of our 26.75% interest in the SASB to Petrol Ofisi in March 2009, followed by the sale of Toreador Turkey to Tiway in October 2009 and the disposal of our Romanian operations in January 2009. The decrease in oil and natural gas prices in 2009, when compared to 2008 also contributed to the decrease.
Total costs and expenses
Lease operating expense was $886,000 for the twelve months ended December 31, 2009, as compared to $8 million, for the comparable period in 2008. This decrease is primarily due to the sale of our 26.75% interest in the SASB to Petrol Ofisi in March 2009, followed by the sale of Toreador Turkey to Tiway in October 2009 and the disposal of our Romanian operations in January 2009.
Exploration expense for the twelve months ended December 31, 2009 was $868,000, as compared to $4.6 million for the comparable period in 2008. This decrease is primarily due to the sale of our 26.75% interest in the SASB to Petrol Ofisi in March 2009, followed by the sale of Toreador Turkey to Tiway in October 2009 and the disposal of our Romanian operations in January 2009.
Dry hole and abandonment cost for the twelve months ended December 31, 2009 was $1.3 million as compared to zero in 2008. In 2009 we drilled the Durusu#1, in offshore Turkey, which was a dry hole.
56
Table of Contents
Depreciation, depletion and amortization.
For the twelve months ended December 31, 2009, depreciation, depletion and amortization expense was $157,000, as compared to $28.1 million for the twelve months ended December 31, 2008. This decrease is primarily due to the assets being held for sale which required us to suspend calculating depletion on these assets.
Impairment charged in 2009 was $10.7 million compared to $83 million in 2008. The 2009 impairment was a result of 1) the Company's decision not to proceed with the Kiha pipeline in Hungary $5.4 million and 2) the decline in the fair market value of the South Akcakoca Sub-basin assets in Turkey $5.3 million. The 2008 impairment was due to:
(1) In 2008, the impairment charge in Turkey was a result of a decline in the fair market value of the Company's interest in South Akcakoca Sub-Basin assets. In June 2008, we determined the fair market value based on a Letter of Intent to sell a 26.75% interest in the South Akcakoca Sub-Basin assets to Petrol Ofisi AS for $80.3 million. This sale price indicated that the fair value of our 36.75% working interest was approximately $103.8 million. The net book value of the Black Sea asset at June 30, 2008 was $157.3 million, resulting in an impairment of $53.5 million.
(2) In January 2009, the Company and Petrol Ofisi agreed to a revised purchase price of $55 million. This resulted in an impairment on assets held for sale, which is comprised of the 26.75% interest in the South Akcakoca Sub-basin assets, of $25.6 million.
(3) In December 2008, we incurred an additional $2.4 million impairment charge in Turkey for assets that were unrelated to the sale of South Akcakoca Sub-Basin assets. The impairment was a result of writing off an exploratory well where sufficient progress was not made to develop the area and a plan of development will not be prepared, by the operator, in the foreseeable future.
(4) When recording the acquisition of Madison Oil in 2002, we recorded $833,000 of goodwill associated with the Turkish assets. We periodically review the value of goodwill to determine if an impairment is required. The review at December 31, 2008, indicated that the total amount recorded for goodwill should be impaired. The reason for this impairment is due to the fair value of the Turkish subsidiary, based on the discounted present value of the oil and gas reserves being less than the carrying value of the Turkish subsidiary. This resulted in an impairment charge of $833,000.
(5) In December 2008, we recorded an impairment in Romania of $600,000 due to the net book value of the oil and natural gas properties exceeding future cash flows.
General and administrative
General and administrative expense was $3.4 million for the twelve months ended December 31, 2009, compared with $2.4 million for the comparable period of 2008. The increase is primarily due to the severance paid to employees in Turkey and Hungary, after the sale of those operations.
57
Table of Contents
For the year ended December 31, 2009, we recorded a gain on sale of assets of $3.6 million, compared to a loss of $123,000 for the comparable period of 2008. The table below shows the gain/(loss) by country:
| | | | | | | |
| | Year Ended December 31 | |
|---|
| | 2009 | | 2008 | |
|---|
| | (In thousands)
| |
|---|
Turkey | | $ | 1,811 | | $ | — | |
Romania | | | 5,846 | | | — | |
Hungary | | | (4,074 | ) | | — | |
United States | | | — | | | (123 | ) |
| | | | | | |
Gain (loss) on sale of assets | | $ | 3,583 | | $ | (123 | ) |
| | | | | | |
The gains are primarily attributable to the reclassification of Accumulated Other Comprehensive Income, recorded on the balance sheet, to gain/(loss) on sale.
In accordance with the covenants of the International Finance Corporation revolving credit facility, proceeds of the Petrol Ofisi sale were used to fully repay and retire the outstanding balance of $36.4 million, which includes $5.9 million of additional compensation and $500,000 for accrued interest and fees. This resulted in a loss on the early extinguishment of debt of $4.9 million.
We recorded a gain on foreign currency exchange of $3.8 million for the year ended December 31, 2009 as compared with a $342,000 loss for the comparable period of 2008. This increase is primarily due to the strengthening of the U.S. Dollar compared to the Turkish Lira, Hungarian Forent and Romanian Lei.
Interest and other income was $414,000 for the year ended December 31, 2009 as compared with $1 million in the comparable period of 2008. The decrease is due primarily to having a lower average cash balance in 2009, as compared to 2008.
Interest expense, net of interest capitalization
Interest expense was $185,000 for the year ended December 31, 2009, as compared to $3.7 million for the comparable period of 2008. This decrease is due to the repayment of the facility with the International Finance Corporation In March 2009.
Results of Continuing Operations — Comparison of Years Ended December 31, 2008 and 2007
In 2009, the Company disposed of its interest in Turkey, Hungary and Romania. The results of operations for these operations have been reclassified as discontinued operations for all periods presented and are discussed separately under the heading " — Results of discontinued operations."
| | | | | | | | | | | | | | | | |
| | For the Years Ended December 31, | |
|---|
| | 2008 | | 2007 | |
| | 2008 | | 2007 | |
|---|
Production: | | | | | | | | Average Price: | | | | | | | |
Oil (MBbls): | | | | | | | | Oil ($/Bbl): | | | | | | | |
| | France | | | 365 | | | 383 | | France | | $ | 93.32 | | $ | 67.49 | |
58
Table of Contents
Revenues
Oil sales for the twelve months ended December 31, 2008 were $34.2 million, as compared to $25.9 million for the comparable period in 2007. This increase is due to the increase in the average realized price for oil $9.4 million, partially offset by the decline in production $1.2 million.
Oil production decreased in France primarily due to the loss of production from a well that encountered mechanical and downhole problems during a workover operation that was eventually plugged and several wells that were shut-in in the fourth quarter waiting on rig availability to commence workover operations.
The above table compares both volumes and prices received for oil for the twelve months ended December 31, 2008 and 2007.
Costs and expenses
Lease operating expense was $9.3 million, or $25.37 per BOE produced for the twelve months ended December 31, 2008, as compared to $7.3 million, or $19.17 per BOE produced for the comparable period in 2007. This increase is primarily due to increased operating costs in France due to the age of the fields and additional workover costs in 2008.
Exploration expense for the twelve months ended December 31, 2008 was $1.2 million, as compared to $3.5 million for the comparable period in 2007. These costs are associated with our exploration departments in France and Dallas and the decrease is due primarily to the reduction of staff in the exploration department in Dallas.
Dry hole and abandonment cost for the twelve months ended December 31, 2008 was zero, as compared to $3.8 million in 2007. During 2007 we drilled two dry holes in France costing $3.8 million. Additionally, the Company made a strategic decision to no longer drill 100% exploratory wells or fund 100% seismic programs on exploratory acreage. We have begun a systematic process of farming out our exploratory prospects to industry partners. The terms of farm outs have been and will generally be structured so that the farmee will pay at least a majority of all seismic costs and drill an exploratory well to casing point in order to earn a 50%-75% working interest in the prospect or concession.
Depreciation, depletion and amortization
For the twelve months ended December 31, 2008, depreciation, depletion and amortization expense was $5 million, or $13.67 per BOE produced, as compared to $4.4 million, or $11.49 per BOE produced, for the twelve months ended December 31, 2007. This increase is primarily due to the reduction in proved reserves at December 31, 2008.
Impairment charged in 2008 was $2.3 million compared to zero in 2007. The impairment was primarily a result of an impairment charge of $2 million for the undeveloped leasehold costs in Trinidad, due to management's decision to exit Trinidad and discontinue our association with our registered agent in the country. Additionally, in April 2007, we sold our interest in ePsolutions for $3.4 million in cash and 50,000 shares of preferred stock with a value of $10.00 per share. Due to the rising cost of electricity and the deterioration of the deregulated electric market in Texas, in 2008, ePsolutions reduced their forecasted
59
Table of Contents
growth for the next several years. Accordingly, we have reduced our carrying value of our investment in ePsolutions by $300,000 which we believe more accurately reflects the current market value of this investment.
General and administrative expense was $13 million for the twelve months ended December 31, 2008, compared with $12.5 million for the comparable period of 2007. General and administrative expense is divided into the following categories:
General and administrative expense, not including stock compensation expense and amounts due the former employees upon their resignation, was $9.8 million for the twelve months ended December 31, 2008, compared with $7.5 million for the comparable period of 2007. This increase is due to no longer being able to allocate general and administrative expenses to the foreign subsidiaries due to the decreased exploration and development activities in 2008, as compared to 2007.
Stock compensation expense was $2.3 million for the twelve months ended December 31, 2008, compared with $2.9 million for the comparable period of 2007. This decrease is primarily due to the forfeiture of most of the restricted stock granted to the executives that resigned in June 2008.
In June 2008, Mr. Michael FitzGerald resigned as Executive Vice President — Exploration and Production and Mr. Edward Ramirez resigned as Senior Vice President — Exploration and Production. The Separation and Release Agreements provide for one year of salary for each individual which resulted in an expense of $600,000, and for Mr. FitzGerald the immediate vesting of 5,000 shares of restricted stock grants and for Mr. Ramirez the immediate vesting of 7,000 shares of restricted stock grants which resulted in an expense of $35,000.
Also in June 2008, three other employees resigned which resulted in an additional $304,000 of expense.
In January 2007, Mr. G. Thomas Graves III resigned as President and Chief Executive Officer. The Separation Agreement between Mr. Graves and the Company called for the immediate vesting of all restricted stock grants which resulted in an expense of $1.1 million and two years of salary and one year of bonus of $1.1 million.
Loss on oil and gas derivative contracts of $1.8 million for 2008 represents the recognized loss on the commodity derivative contracts with Total Oil Trading. Presented in the table below is a summary of the contracts entered into with the gain (loss) in thousands:
| | | | | | | | | | | | | | | |
Type | | Period | | Barrels | | Floor | | Ceiling | | Gain/(Loss) | |
|---|
Collar | | January 1 — March 31, 2008 | | | 48,000 | | $ | 84.75 | | $ | 92.75 | | $ | (19 | ) |
Collar | | April 1 — June 30, 2008 | | | 48,000 | | $ | 92.25 | | $ | 100.25 | | | (2,239 | ) |
Collar | | July 1 — September 30, 2008 | | | 48,000 | | $ | 91.75 | | $ | 99.75 | | | 477 | |
| | | | | | | | | | | | | | | |
| | | | | | | | | | | | | $ | (1,781 | ) |
| | | | | | | | | | | | | | | |
60
Table of Contents
For the year ended December 31, 2007, we recorded a loss of $1 million for the net realized and unrealized loss on derivative financial instruments which fluctuate based on changes in the fair value of underlying commodities. We entered into futures and swap contracts for approximately 15,000 Bbls per month for the months of June 2007 through December 2008 and subsequently sold all contracts as of December 31, 2007.
For the twelve months ended December 31, 2008, we recorded no gain or loss on the sale of properties and other assets, as compared to a gain of $3.2 million for 2007, which was primarily attributable to the gain on the sale of our unconsolidated investments.
We recorded a loss on foreign currency exchange of $145,000 for the year ended December 31, 2008 as compared with a $321,000 loss for the comparable period of 2007. This decrease is primarily due to the strengthening of the U.S. Dollar compared to the Euro in 2008.
In 2008, we repurchased $6 million of the 5.00% Convertible Senior Notes for $5.3 million plus accrued interest of $109,347. Additionally, we expensed $241,965 of prepaid loan fees that were attributable to the repurchased notes. This resulted in a $458,535 gain on the early extinguishment of debt. For the year ended December 31, 2007 we did not repurchase any of the 5.00% Convertible Senior Notes.
Interest and other income was $775,000 for the year ended December 31, 2008 as compared with $1.4 million in the comparable period of 2007. The decrease is due primarily to having a lower average cash balance in 2008, as compared to 2007 and a decline in interest rates during the later part of 2008.
Interest expense, net of interest capitalization
Interest expense was $4.2 million for the year ended December 31, 2008, as compared to $3.5 million for the comparable period of 2007. The increase is primarily due to $3.7 million of interest that was capitalized in 2007, as opposed to $1 million in 2008 and due to a full year of interest on the International Finance Corporation credit facility in 2008, as opposed to nine months of interest expense in 2007.
For the year ended December 31, 2008 we reported income tax expense of $5.5 million, compared to a benefit of $1.4 million for the same period of 2007. This increase is primarily due to an increase in the French tax provision of $4 million due to higher taxable income in 2008 and an increase in the valuation allowance, relating to the United States, to reflect the likelihood that additional income tax would not be generated to offset losses $2.9 million.
For the year ended December 31, 2008, we reported a loss from continuing operations net of taxes of $7 million, compared with a loss of $4.5 million for the same period of 2007. For the twelve months ended December 31, 2008 we recorded a loss available to common shares of $108.6 million versus a loss available to common shares of $74.4 million for the year ended December 31, 2007.
61
Table of Contents
The most significant element of comprehensive income, other than net income, is foreign currency translation. As of December 31, 2008, we had accumulated an unrealized loss of $5.3 million. For the year ended December 31, 2007, we had an unrealized gain of $38.4 million. The decrease is a result of a change in accounting method regarding our intercompany accounts receivable due from our subsidiaries in Turkey, Romania and Hungary. The foreign exchange in the intercompany accounts receivable balance is reflected in current earnings, as a foreign exchange gain or loss, rather than in accumulated other comprehensive income.
The functional currency of our operations in France is the Euro. The exchange rate used to translate the financial position of the French operations at December 31, 2008 and 2007 is shown below:
| | | | | | | |
| | December 31, | |
|---|
| | 2008 | | 2007 | |
|---|
Euro | | $ | 1.3917 | | $ | 1.4721 | |
| | | | | | |
Results of discontinued operations — Comparison of Years Ended December 31, 2008 and 2007
On June 14, 2007, the Board of Directors authorized management to sell all our oil and natural gas properties in the United States. The sale of these properties completed the divestiture of the company's non-core domestic assets and allowed us to focus exclusively on our International operations. The sale was closed on September 1, 2007. The sales price was $19.1 million which resulted in a pre-tax gain of $9.2 million, which was recorded in September 2007.
In the fourth quarter of 2008 and during the first quarter of 2009, Toreador farmed out or sold all of its working interests in Romania to three different companies and closed its office; thus, we no longer have any operational involvement in Romania. This resulted in a financial gain of $5.8 million which was recorded in the first quarter of 2009.
In February 2009, the Board of Directors authorized management to retain Stellar Energy Advisors, based in London, UK, to manage a process to monetize its wholly owned subsidiary, Toreador Turkey, including the Company's remaining 10% interest in the SASB, in addition to the onshore production, and 2.2 million net acres in exploration licenses that are currently held in Turkey. On September 30, 2009, the Company entered into the Share Purchase Agreement with Tiway, pursuant to which the Company agreed to sell 100% of the outstanding shares of Toreador Turkey to Tiway. The sale of Toreador Turkey was completed on October 7, 2009. This resulted in a financial gain of $1.8 million which was recorded in the fourth quarter of 2009.
On March 3, 2009 we completed the sale of a 26.75% interest in the South Akcakoca Sub-Basin (SASB) project associated licenses located in the Black Sea offshore Turkey, to Petrol Ofisi for $55 million. In accordance with the revised assignment announced on February 3, 2009, $50 million of the proceeds was paid by Petrol Ofisi on March 3, 2009, and the remaining $5 million was paid on September 1, 2009.
Additionally, on September 30, 2009, the Company entered into the Quota Purchase Agreement with RAG, pursuant to which the Company agreed to sell 100% of its equity interests in Toreador Hungary to RAG. The sale of Toreador Hungary was completed on September 30, 2009. This resulted in a financial loss of $4.1 million which was recorded in the third quarter of 2009.
62
Table of Contents
The results of operations of assets in the United States, Romania, Turkey and Hungary have been presented as discontinued operations in the accompanying consolidated statement of operations. Results for these assets reported as discontinued operations were as follows:
The table below compares discontinued operations for the years ended December 31, 2008 and 2007:
| | | | | | | | | | |
| | Year Ended December 31 | |
|---|
| | 2008 | | 2007 | |
|---|
| | (In thousands)
| |
|---|
Revenues: | | | | | | | |
| | Oil and natural gas sales | | $ | 28,226 | | $ | 20,273 | |
Costs and expenses: | | | | | | | |
| | Lease operating | | | 7,971 | | | 6,892 | |
| | Exploration expense | | | 4,582 | | | 11,324 | |
| | Impairment of oil and natural gas properties | | | 82,951 | | | 13,446 | |
| | Depreciation, depletion and amortization | | | 28,148 | | | 17,466 | |
| | Dry hole costs | | | — | | | 18,096 | |
| | General and administrative | | | 2,445 | | | 5,131 | |
| | (Gain) loss on sale of properties | | | 123 | | | (9,248 | ) |
| | | | | | |
| | | Total costs and expenses | | | 126,220 | | | 63,107 | |
| | | | | | |
| | Operating loss | | | (97,994 | ) | | (42,834 | ) |
| | Other income(expense) | | | | | | | |
| | | Foreign currency | | | (342 | ) | | (25,984 | ) |
| | | Interest income | | | 1,004 | | | 445 | |
| | | Interest expense | | | (3,679 | ) | | (822 | ) |
| | | | | | |
| | | | Total other income (expense) | | | (3,017 | ) | | (26,361 | ) |
| | | | | | |
| | Loss before taxes | | | (101,011 | ) | | (69,195 | ) |
| | Income tax provision | | | 574 | | | 678 | |
| | | | | | |
| | Loss from discontinued operations | | $ | (101,585 | ) | $ | (69,873 | ) |
| | | | | | |
63
Table of Contents
| | | | | | | | | | | | | | | | | |
| | For the Years Ended December 31, | |
|---|
| | 2008 | | 2007 | |
| | 2008 | | 2007 | |
|---|
Production: | | | | | | | | Average Price: | | | | | | | |
Oil (MBbls): | | | | | | | | Oil ($/Bbl): | | | | | | | |
| | United States | | | — | | | 38 | | United States | | | — | | | 60.14 | |
| | Turkey | | | 56 | | | 66 | | Turkey | | | 93.21 | | | 61.98 | |
| | Romania | | | 3 | | | 10 | | Romania | | | 57.97 | | | 57.59 | |
| | | | | | | | | | | | | | |
| | | Total | | | 59 | | | 114 | | Total average oil price | | | 91.25 | | | 61.42 | |
| | | | | | | | | | | | | | |
Gas (MMcf): | | | | | | | | Gas ($/Mcf): | | | | | �� | | |
| | United States | | | — | | | 296 | | United States | | | — | | | 6.67 | |
| | Turkey | | | 1,840 | | | 905 | | Turkey | | | 11.14 | | | 8.60 | |
| | Romania | | | 446 | | | 689 | | Romania | | | 5.32 | | | 4.90 | |
| | | | | | | | | | | | | | |
| | | Total | | | 2,286 | | | 1,890 | | Total average gas price | | | 10.00 | | | 6.92 | |
| | | | | | | | | | | | | | |
MBOE: | | | | | | | | $/ BOE: | | | | | | | |
| | United States | | | — | | | 87 | | United States | | | — | | | 48.25 | |
| | Turkey | | | 363 | | | 217 | | Turkey | | | 70.88 | | | 54.77 | |
| | Romania | | | 77 | | | 124 | | Romania | | | 32.99 | | | 31.55 | |
| | | | | | | | | | | | | | |
| | | Total | | | 440 | | | 428 | | Total average price per BOE | | | 64.20 | | | 46.69 | |
| | | | | | | | | | | | | | |
Revenues
Oil and natural gas sales for the twelve months ended December 31, 2008 were $28.2 million, as compared to $20.3 million for the comparable period in 2007. This increase is due to 1) the increase in the average realized price for oil, $1.8 million; 2) the increase in the average realized price for gas, $2.6 million and 3) increased Turkish gas volumes, $10.4 million. This was partially offset by a 1) reduction in total oil production of 17 MBbls or $1 million; 2) a reduction in Romanian gas production of 243 MMcf or $1.3 million and 3) no United States revenue in 2008 compared to $4.4 in 2007.
The decline in Turkey oil production is normal decline and in Romania the gas field was depleting quicker than anticipated.
Costs and expenses
Lease operating expense was $8 million, or $17.95 per BOE produced for the twelve months ended December 31, 2008, as compared to $6.9 million, or $16.08 per BOE produced for the comparable period in 2007. This increase is primarily due to increased operating costs in offshore Turkey due primarily to the field being on production for all of 2008, as opposed to nine months in 2007 and workover costs incurred on the East Ayazli wells which developed problems sustaining adequate pressure in order for the wells to continue producing, increased operating expense in Romania due to increased workover cost incurred to increase production and due to inflation in the oil and gas industry during 2008 as compared to 2007.
Exploration expense for the twelve months ended December 31, 2008 was $4.6 million, as compared to $11.3 million for the comparable period in 2007. This decrease is due primarily to the reduction of staff in the exploration department in Dallas. In 2008, there were no seismic surveys performed, compared to a $6.2 million 2D seismic survey that was done in Romania during the third quarter of 2007.
64
Table of Contents
Dry hole and abandonment cost for the twelve months ended December 31, 2008 was zero, as compared to $18 million in 2007. During 2008, we participated in the drilling of two exploratory wells in Hungary which were both dry holes. However, we incurred zero dry hole costs because our partners paid our share of the costs as per the farmout agreement. During 2007 we drilled three dry holes in Romania $10 million, two dry holes in Hungary costing $3.5 million and one dry hole in Turkey costing $4.5 million. Additionally, the Company made a strategic decision to no longer drill 100% exploratory wells or fund 100% seismic programs on exploratory acreage. We have begun a systematic process of farming out our exploratory prospects to industry partners. The terms of farm outs have been and will generally be structured so that the farmee will pay at least a majority of all seismic costs and drill an exploratory well to casing point in order to earn a 50%-75% working interest in the prospect or concession.
Depreciation, depletion and amortization.
For the twelve months ended December 31, 2008, depreciation, depletion and amortization expense was $28.1 million, or $63.86 per BOE produced, as compared to $17.5 million, or $40.79 per BOE produced for the twelve months ended December 31, 2007. This increase is primarily due to the start of natural gas production in offshore Turkey in May 2007, from two of the three platforms, and in May 2008 we began production from the third platform. The depreciation rate per BOE in Turkey is excessively high due to cost overruns in the development of the offshore gas field, in addition to the reduction in proved reserves at December 31, 2008.
Impairment charged in 2008 was $83 million compared to $13.4 million in 2007. The impairment was a result of the following:
(1) In 2008, the impairment charge in Turkey was a result of a decline in the fair market value of the Company's interest in South Akcakoca Sub-Basin assets. In June 2008, we determined the fair market value based on a Letter of Intent to sell a 26.75% interest in the South Akcakoca Sub-Basin assets to Petrol Ofisi AS for $80.3 million. This sale price indicated that the fair value of our 36.75% working interest was approximately $103.8 million. The net book value of the Black Sea asset at June 30, 2008 was $157.3 million, resulting in an impairment of $53.5 million.
(2) In January 2009, the Company and Petrol Ofisi agreed to a revised purchase price of $55 million. This resulted in an impairment on assets held for sale, which is comprised of the 26.75% interest in the South Akcakoca Sub-basin assets, of $25.6 million.
(3) In December 2008, we incurred an additional $2.4 million impairment charge in Turkey for assets that were unrelated to the sale of South Akcakoca Sub-Basin assets. The impairment was a result of writing off an exploratory well where sufficient progress was not made to develop the area and a plan of development will not be prepared, by the operator, in the foreseeable future.
(4) When recording the acquisition of Madison Oil in 2002, we recorded $833,000 of goodwill associated with the Turkish assets. We periodically review the value of goodwill to determine if an impairment is required. The review at December 31, 2008, indicated that the total amount recorded for goodwill should be impaired. The reason for this impairment is due to the fair value of the Turkish subsidiary, based on the discounted present value of the oil and gas reserves being less than the carrying value of the Turkish subsidiary. This resulted in an impairment charge of $833,000.
(5) In December 2008, we recorded an impairment in Romania of $600,000 due to the net book value of the oil and natural gas properties exceeding future cash flows.
65
Table of Contents
For the year ended December 31, 2007, we recorded an impairment due to the downward revisions of proved reserves in the Fauresti Field in Romania. At December 31, 2007 the cash flow before income tax and the discounted future cash flows attributable to our proved oil and natural gas reserves before income tax, discounted at 10% attributable to the 134 MBOE, in Romania, was $1.2 million and $1.1 million, respectively, and the net book value of asset was $14.5 million. This resulted in an impairment charge of $13.4 million.
General and administrative expense was $2.4 million for the twelve months ended December 31, 2008, compared with $5.1 million for the comparable period of 2007. The decrease is attributable to the reduced activity during 2008.
Selected Quarterly Financial Data (Unaudited)
We derived the selected historical financial data in the table below from our unaudited interim consolidated financial statements. The sum of net income per share by quarter may not equal the net income per share for the year due to variations in the weighted average shares outstanding used in computing such amounts. The historical data presented here is only a summary and should be read in conjunction with the consolidated financial statements, related notes and other financial information included elsewhere in this annual report.
| | | | | | | | | | | | | | |
| | Three Months Ended | |
|---|
| | March 31, | | June 30, | | September 30, | | December 31, | |
|---|
| | (in thousands, except per share data)
| |
|---|
For the year ended December 31, 2009: | | | | | | | | | | | | | |
| | Total revenues | | $ | 3,387 | | $ | 4,504 | | $ | 5,205 | | $ | 6,140 | |
| | Total costs and expenses | | | 8,471 | | | 8,748 | | | 7,012 | | | 11,184 | |
| | Income (loss) from continuing operations, net of tax | | | (5,923 | ) | | (601 | ) | | (1,941 | ) | | (6,867 | ) |
| | Income (loss) from discontinued operations, net of tax | | | (4,953 | ) | | 3,483 | | | (10,518 | ) | | 1,908 | |
| | Net income (loss) | | | (10,876 | ) | | 2,882 | | | (12,459 | ) | | (4,959 | ) |
| | Income (loss) available to common shares | | | (10,876 | ) | | 2,882 | | | (12,459 | ) | | (4,959 | ) |
| | Basic income (loss) available to common shares per share | | | (0.54 | ) | | 0.14 | | | (0.59 | ) | | (0.24 | ) |
| | Diluted income (loss) available to common shares per share | | | (0.54 | ) | | 0.14 | | | (0.59 | ) | | (0.24 | ) |
For the year ended December 31, 2008 : | | | | | | | | | | | | | |
| | Total revenues | | $ | 8,850 | | $ | 10,987 | | $ | 9,641 | | $ | 4,672 | |
| | Total costs and expenses | | | 9,488 | | | 18,032 | | | 5,844 | | | 7,806 | |
| | Income (loss) from continuing operations, net of tax | | | (638 | ) | | (7,045 | ) | | 3,797 | | | (3,134 | ) |
| | Income (loss) from discontinued operations, net of tax | | | (3,788 | ) | | (58,723 | ) | | (3,727 | ) | | (35,347 | ) |
| | Net income (loss) | | | (4,426 | ) | | (65,768 | ) | | 70 | | | (38,481 | ) |
| | Income available to common shares | | | (4,426 | ) | | (65,768 | ) | | 70 | | | (38,481 | ) |
| | Basic income available to common shares per share | | | (0.22 | ) | | (3.33 | ) | | — | | | (1.93 | ) |
| | Diluted income available to common shares per share | | | (0.22 | ) | | (3.33 | ) | | — | | | (1.93 | ) |
66
Table of Contents
We do not have any off-balance sheet arrangements that have or are reasonably likely to have a current or material future effect on our financial condition, changes in financial condition, revenues or expenses, results of operations, liquidity, capital expenditures or capital resources.
Item 7A. Quantitative and Qualitative Disclosures About Market Risk
The risks inherent in our market-sensitive instruments are the potential loss arising from adverse changes in oil prices and foreign currency exchange rates as discussed below. The sensitivity analysis however, neither considers the effects that such adverse changes may have on overall economic activity nor does it consider additional actions we may take to mitigate our exposure to such changes. Actual results may differ.
The following quantitative and qualitative information is provided about financial instruments from which we may incur future earnings gains or losses from changes in commodity prices. We do not designate our derivatives as hedges; however, we do not enter into derivative or other financial instruments for trading purposes.
We market our oil production primarily on a spot market basis. As a result, our earnings could be affected by changes in oil prices, regulatory matters or demand for oil. As market conditions dictate, from time to time we will lock in future oil prices using various hedging techniques. We do not use such financial instruments for trading purposes, and we are not a party to any leveraged derivatives.
The functional currency of our French operations is the Euro. While our oil sales are calculated on a U.S. dollar basis, we are exposed to the risk that the values of our French assets will decrease and that the amounts of our French liabilities will increase.
At times we utilize commodity derivative instruments as part of our risk management program. These transactions are generally structured as either swaps or collar contracts. A swap has the effect of an outright sale at a specific price. A collar has the effect of creating a sale only if a floor or ceiling price is exceeded. These instruments (i) reduce the effect of the price fluctuations of the commodities we produce and sell and (ii) support our annual capital budgeting and expenditure plans. When we had our senior credit facilities that required these instruments, these instruments protected the amounts required for servicing outstanding debt and maximized the funds available under these facilities. The trading party that represents the other side of each of these transactions is known as a "counterparty." Currently we have the following derivative outstanding.
| | | | | | | | | | | | |
Type | | Period | | Barrels | | Floor | | Ceiling | |
|---|
| Collar | | January 1 — December 31, 2010 | | | 182,500 | | $ | 68.00 | | $ | 81.00 | |
See Note 2 of Notes to Consolidated Financial Statements for a description of our accounting policies followed relative to derivative financial instruments and for specific information regarding the terms of our derivative financial instruments that are sensitive to changes in crude oil commodity prices.
67
Table of Contents
Item 8. Financial Statements and Supplementary Data.
The Report of Independent Registered Public Accounting Firm and Consolidated Financial Statements are set forth beginning on page F-1 of this Annual Report on Form 10-K and are incorporated herein.
The financial statement schedules have been omitted because they are not applicable or the required information is shown in the Consolidated Financial Statements or the Notes to the Consolidated Financial Statements.
ITEM 9. Changes In And Disagreements With Accountants On Accounting And Financial Disclosure.
None.
Item 9A. Controls and Procedures
Corporate Disclosure Controls
Evaluation of Disclosure Controls and Procedures
We maintain disclosure controls and procedures (as defined in Rules 13a-15(e) and 15d-15(e) under the Securities Exchange Act of 1934, as amended) that are designed to provide reasonable assurance that the information required to be disclosed by us in reports filed under the Securities Exchange Act of 1934 is recorded, processed, summarized and reported within the time periods specified in the rules and forms of the Securities and Exchange Commission.
We carried out an evaluation, under the supervision and with the participation of our management, including our Chief Executive Officer and our Chief Financial Officer of the effectiveness of our disclosure controls and procedures as of the end of the period covered by this annual report. Based on that evaluation, our Chief Executive Officer and the Chief Financial Officer concluded that our disclosure controls and procedures as of December 31, 2009 were not effective as described below.
Our management is responsible for establishing and maintaining adequate internal control over financial reporting as that term is defined in Rules 13a-15(f) and 15d-15(f) of the Securities Exchange Act of 1934, as amended. Our internal control over financial reporting is a process designed to provide reasonable assurance regarding the reliability of our financial reporting and the preparation of our financial statements for external purposes in accordance with U.S. generally accepted accounting principles. Our control environment is the foundation for our system of internal control over financial reporting and is an integral part of our Code of Ethical Conduct and Business Practices, which sets the tone of our Company. Our internal control over financial reporting includes those policies and procedures that (i) pertain to the maintenance of records that, in reasonable detail, accurately and fairly reflect our transactions and dispositions of our assets; (ii) provide reasonable assurance that transactions are recorded as necessary to permit preparation of our financial statements in accordance with U.S. generally accepted accounting principles, and that our receipts and expenditures are being made only in accordance with authorizations of our management and directors; and (iii) provide reasonable assurance regarding prevention or timely detection of unauthorized acquisition, use or disposition of our assets that could have a material effect on our financial statements.
In order to evaluate the effectiveness of our internal control over financial reporting as of December 31, 2009, as required by Section 404 of the Sarbanes-Oxley Act of 2002, our management conducted an assessment, including testing, based on the criteria set forth inInternal Control — Integrated Framework issued by the Committee of Sponsoring Organizations of the Treadway Commission (the "COSO Framework"). Because of its inherent limitations, internal control over financial reporting may not prevent or detect misstatements. In addition, projections of any evaluation of effectiveness to future
68
Table of Contents
periods are subject to the risk that controls may become inadequate because of changes in conditions or that the degree of compliance with the policies or procedures may deteriorate.
Under the supervision and with the participation of our management, including our Chief Executive Officer and Chief Financial Officer, we conducted an evaluation of the effectiveness of our internal control over financial reporting in connection with preparation of this annual report on Form 10-K for the year ended December 31, 2009. As a result of these assessments, a material weakness was identified and is described below. A material weakness is a control deficiency, or combination of control deficiencies, that results in more than a remote likelihood that a material misstatement of the annual or interim financial statements will not be prevented or detected.
- •
- Our accounting and financial reporting procedures were not sufficiently designed to ensure consistent and complete application of our accounting policies and to prepare financial statements in accordance with accounting principles generally accepted in the United States. This includes the lack of a sufficient review of sensitive calculations, reconciliations and critical spreadsheets by personnel in key financial reporting positions.
Management believes the material weakness can be attributed to the significant changes the Company underwent during 2009, including the closing of its Dallas office and relocation of its headquarters to Paris and the change in management and finance department. The Company intends to review its internal procedures and for management, including the Chief Financial Officer, and a senior partner at the external accounting consulting firm it has engaged to actively strengthen the overall financial reporting and internal review process. Management does not believe it is cost effective at this time to hire additional staff and intends to continue to rely on the assistance of the external accounting consulting firm to prepare selected portions of the Company's financial statements with the increased level of review described above.
Based on our assessment, and because of the material weakness described above, management has concluded that our internal control over financial reporting was not effective as of December 31, 2009 to provide reasonable assurance regarding the reliability of financial reporting and the preparation of financial statements for external reporting purposes in accordance with generally accepted accounting principles.
Grant Thornton LLP, the independent registered public accounting firm that audited our consolidated financial statements included in this annual report on Form 10-K for the year ended December 31, 2009, has issued an attestation report on our internal control over financial reporting as of December 31, 2009, which is included in Item 8. "Financial Statements".
For the quarter ended December 31, 2009, there were no changes to the system of internal controls.
Item 9B. Other Information.
None.
69
Table of Contents
PART III
Item 10. Directors, Executive Officers and Corporate Governance.
Information required by this item relating to our (i) directors, nominees for directors and executive officers, (ii) audit committee, (iii) Code of Ethical Conduct and Business Practices, (iv) changes in procedures by which security holders may recommend nominees to our board of directors, and (v) compliance with Section 16(a) of the Securities Exchange Act will be set forth in our Proxy Statement relating to the 2010 Annual Meeting of Stockholders, and that is incorporated herein by reference.
Item 11. Executive Compensation.
Information required by this item relating to executive compensation will be set forth in our Proxy Statement relating to the 2010 Annual Meeting of Stockholders and that is incorporated herein by reference.
Item 12. Security Ownership Of Certain Beneficial Owners And Management And Related Stockholder Matters.
Information required by this item relating to (i) security ownership of certain beneficial owners and management and (ii) securities authorized for issuance under equity compensation plans will be set forth in our Proxy Statement relating to the 2010 Annual Meeting of Stockholders and that is incorporated herein by reference.
Item 13. Certain Relationships and Related Transactions, and Director Independence.
Information required by this item relating to (i) certain business relationships and related transactions with management and (ii) other related parties and director independence will be set forth in our Proxy Statement relating to the 2010 Annual Meeting of Stockholders and that is incorporated herein by reference.
Item 14. Principal Accountant Fees And Services.
The information relating to (i) fees billed to the Company by the independent public accountants for services in 2009 and 2008 and (ii) audit committee's pre-approval policies and procedures for audit and non-audit services, will be set forth in our Proxy Statement relating to the 2010 Annual Meeting of Stockholders and that is incorporated herein by reference.
70
Table of Contents
PART IV
ITEM 15. Exhibits and Financial Statement Schedules.
(a) The following documents are filed as part of this report:
1. Index to Consolidated Financial Statements, Reports of Independent Registered Public Accounting Firm, Consolidated Balance Sheets as of December 31, 2009 and 2008, Consolidated Statements of Operations and Comprehensive Income (Loss) for each of the three years in the period ended December 31, 2009, Consolidated Statements of Changes in Stockholders' Equity for each of the three years in the period ended December 31, 2009, Consolidated Statements of Cash Flows for each of the three years in the period ended December 31, 2009, and Notes to Consolidated Financial Statements.
2. The financial statement schedules have been omitted because they are not applicable or the required information is shown in the Consolidated Financial Statements or the Notes to Consolidated Financial Statements.
3. Exhibits: The exhibits required to be filed by this Item 15 are set forth in the Index to Exhibits accompanying this report.
71
Table of Contents
SIGNATURES
Pursuant to the requirements of Section 13 or 15(d) of the Securities Exchange Act of 1934, the registrant has duly caused this Form 10-K to be signed on its behalf by the undersigned, thereunto duly authorized.
| | |
| March 16, 2010 | | TOREADOR RESOURCES CORPORATION |
|
|
/s/ Craig M. McKenzie
Craig M. McKenzie
President and Chief Executive Officer |
KNOW ALL MEN BY THESE PRESENTS, that each of the undersigned officers and directors of Toreador Resources Corporation hereby constitutes and appoints Craig M. McKenzie and Marc Sengès, or either of them (with full power to each of them to act alone), his true and lawful attorneys-in-fact and agents, with full power of substitution, for him and on his behalf and in his name, place and stead, in any and all capacities, to sign, execute and file any and all amendments (including post-effective amendments) to this Form 10-K, and to file the same, with all exhibits thereto, and other documents in connection therewith, with the Securities and Exchange Commission, granting unto said attorneys, and each of them, full power and authority to do so and perform each and every act and thing requisite and necessary to be done in and about the premises in order to effectuate the same as full to all intents and purposes as he himself might or could do if personally present, thereby ratifying and confirming all that said attorneys-in-fact and agents, or either of them, or their or his substitute or substitutes, may lawfully do or cause to be done.
Pursuant to the requirements of the Securities Exchange Act of 1934, this report has been signed below by the following persons on behalf of the registrant and in the capacities and on the dates as indicated therein.
| | | | |
Signature | | Capacity in Which Signed | | Date |
|---|
|
|
|
|
|
/s/ Craig M. McKenzie
Craig M. McKenzie | | President, Chief Executive Officer and Director
(Principal Executive Officer) | | March 16, 2010 |
/s/ Marc Sengès
Marc Sengès |
|
Chief Financial Officer
(Principal Financial and Accounting Officer) |
|
March 16, 2010 |
/s/ Peter Hill
Peter Hill |
|
Chairman and Director |
|
March 16, 2010 |
/s/ Julien Balkany
Julien Balkany |
|
Director |
|
March 16, 2010 |
/s/ Ian Vann
Ian Van |
|
Director |
|
March 16, 2010 |
/s/ Bernard Polge de Combret
Bernard Polge de Combret |
|
Director |
|
March 16, 2010 |
/s/ Herbert Williamson
Herbert Williamson |
|
Director |
|
March 16, 2010 |
/s/ Adam Kroloff
Adam Kroloff |
|
Director |
|
March 16, 2010 |
72
Table of Contents
INDEX TO EXHIBITS
| | | |
Exhibit
Number | | Description |
|---|
| | 2.1 | | Agreement for Purchase and Sale among Toreador Resources Corporation, Toreador Exploration & Production Inc. and Toreador Acquisition Corporation, as Sellers, and RTF Realty Inc., as Buyer dated August 2, 2007 (previously filed as Exhibit 10.1 to the Current Report on Form 8-K filed on August 6, 2007 and incorporated herein by reference). |
|
2.2 |
|
Letter of Intent by and between Toreador Turkey Limited and Toreador Turkey Limited, Ankara Turkey Branch, and PETROL OFISI AS, dated August 8, 2008 (previously filed as Exhibit 2.1 to the Current Report on Form 8-K filed on August 13, 2008 and incorporated herein by reference). |
|
2.3 |
|
Assignment Agreement between PETROL OFISI AS, PETROL OFISI ARAMA URETIM SANAYI ve TICARET ANONIM SIRKETI and Toreador Turkey Limited, Toreador Turkey Limited, Ankara Turkey Branch and Toreador Resources Corporation, dated September 17, 2008 (previously filed as Exhibit 2.2 to the Quarterly Report on Form 10-Q for the quarter ended September 30, 2008 and incorporated herein by reference). |
|
2.4 |
|
Amendment Protocol dated January 30, 2009 relating to the Assignment Agreement between PETROL OFISI AS, PETROL OFISI ARAMA URETIM SANAYI ve TICARET ANONIM SIRKETI and Toreador Turkey Limited, Toreador Turkey Limited, Ankara Turkey Branch and Toreador Resources Corporation, dated September 17, 2008 (previously filed as Exhibit 2.1 to the Current Report on Form 8-K filed on February 4, 2009 and incorporated herein by reference). |
|
3.1 |
|
Restated Certificate of Incorporation of Toreador Resources Corporation (previously filed as Exhibit 3.1 to the Current Report on Form 8-K filed on March 29, 2005 and incorporated herein by reference). |
|
3.2 |
|
Fourth Amended and Restated Bylaws of Toreador Resources Corporation (previously filed as Exhibit 3.1 to the Current Report on Form 8-K filed on November 13, 2007 and incorporated herein by reference). |
|
4.1 |
|
Certificate of Designation, Preferences and Rights of Series B Preferred Stock (previously filed as Exhibit 3.1 to the Current Report on Form 8-K filed on November 24, 2008 and incorporated herein by reference). |
|
4.2 |
|
Indenture dated as of September 27, 2005 by and between Toreador Resources Corporation and The Bank of New York Trust Company, N.A. (previously filed as Exhibit 4.19 to the Registration Statement on Form S-3 (333-129628) filed on November 10, 2005 and incorporated herein by reference). |
|
4.3 |
|
Rights Agreement dated as of November 20, 2008 between Toreador Resources Corporation and American Stock Transfer, as Rights Agent (previously filed as Exhibit 4.1 to the Form 8-A filed on November 24, 2008 and incorporated herein by reference). |
|
4.4 |
|
Indenture dated as of February 1, 2010, by and between Toreador Resources Corporation and The Bank of New York Trust Company, N.A. (previously filed as Exhibit 4.1 to the Current Report on Form 8-K filed on February 3, 2010 and incorporated herein by reference). |
|
4.5* |
|
Warrant No. 32 issued by Toreador Resources Corporation to ParCon Consulting on January 3, 2006. |
|
10.1+ |
|
Toreador Resources Corporation Amended and Restated 1990 Stock Option Plan, effective as of September 24, 1998 (previously filed as Exhibit 10.4 to the Annual Report on Form 10-K for the year ended December 31, 2004 and incorporated herein by reference). |
73
Table of Contents
| | | |
Exhibit
Number | | Description |
|---|
| | 10.2+ | | Amendment Number One to Toreador Resources Corporation Amended and Restated 1990 Stock Option Plan (previously filed as Exhibit 10.4 to the Annual Report on Form 10-K for the year ended December 31, 2007 and incorporated herein by reference). |
|
10.3+ |
|
Amendment Number Two to Toreador Resources Corporation Amended and Restated 1990 Stock Option Plan (previously filed as Exhibit 10.5 to the Annual Report on Form 10-K for the year ended December 31, 2007 and incorporated herein by reference). |
|
10.4+ |
|
Toreador Resources Corporation Amended and Restated 1994 Non-employee Director Stock Option Plan (previously filed as Exhibit 10.7 to the Annual Report on Form 10-K for the year ended December 31, 2007 and incorporated herein by reference). |
|
10.5+ |
|
Toreador Resources Corporation 2002 Stock Option Plan (previously filed as Exhibit 10.8 to the Annual Report on Form 10-K for the year ended December 31, 2007 and incorporated herein by reference). |
|
10.6+ |
|
Amendment Number One to the Toreador Resources Corporation 2002 Stock Option Plan (previously filed as Exhibit 10.9 to the Annual Report on Form 10-K for the year ended December 31, 2007 and incorporated herein by reference). |
|
10.7+ |
|
Toreador Resources Corporation 2005 Long-Term Incentive Plan (previously filed as Exhibit 10.1 to Toreador Resources Corporation Current Report on Form 8-K filed on May 23, 2005 and incorporated herein by reference). |
|
10.8+ |
|
Amendment Number One to Toreador Resources Corporation 2005 Long-Term Incentive Plan (previously filed as Exhibit 10.1 to the Current Report on Form 8-K filed on May 12, 2006 and incorporated herein by reference). |
|
10.9+ |
|
Amendment Number Two to Toreador Resources Corporation 2005 Long-Term Incentive Plan (previously filed as Exhibit 10.3 to the Quarterly Report on Form 10-Q for the quarter ended March 31, 2008 and incorporated herein by reference). |
|
10.10+ |
|
Amendment Number Three to Toreador Resources Corporation 2005 Long-Term Incentive Plan (previously filed as Exhibit 4.7 to the Registration Statement on Form S-8 filed on May 15, 2008 and incorporated herein by reference). |
|
10.11+ |
|
Employment Agreement of Nigel Lovett dated March 14, 2007 (previously filed as Exhibit 10.33 to the Registration Statement on Form S-1 filed on May 8, 2007 and incorporated herein by reference). |
|
10.12 |
|
Contract for the Supply of Crude Oil from the Parisian Basin, effective January 1, 1997, between Elf Antwar France and Midland Madison Petroleum Company (n/k/a Toreador Energy France) (previously filed as Exhibit 10.43 to the Annual Report on Form 10-K for the year ended December 31, 2007 and incorporated herein by reference). |
|
10.13 |
|
Amendment No. 1 dated August 9, 2007 to Loan and Guarantee Agreement dated December 28, 2006 between Toreador Resources Corporation, Toreador Turkey Ltd., Toreador Romania Ltd., Madison Oil France SAS, Toreador Energy France S.C.S., Toreador International Holding Limited Liability Company and Toreador International Finance Corporation (previously filed as Exhibit 10.1 to Toreador Resources Corporation Quarterly Report on Form 10-Q for the quarter ended September 30, 2007, File No. 0-2517, and incorporated hereby by reference). |
|
10.14+ |
|
Release Agreement by and between David M. Brewer and Toreador Resources Corporation dated March 24, 2008 (previously filed as Exhibit 10.5 to the Quarterly Report on Form 10-Q for the quarter ended March 31, 2008 and incorporated herein by reference). |
74
Table of Contents
| | | |
Exhibit
Number | | Description |
|---|
| | 10.15+ | | 2008 Discretionary Employee Bonus Policy (previously filed as Exhibit 10.10 to the Quarterly Report on Form 10-Q for the quarter ended March 31, 2008 and incorporated herein by reference). |
|
10.16+ |
|
2008 Performance Goals and Payout Amounts (previously filed as Exhibit 10.11 to the Quarterly Report on Form 10-Q for the quarter ended March 31, 2008 and incorporated herein by reference). |
|
10.17+ |
|
Summary Sheet — 2008 Director Compensation (previously filed as Exhibit 10.12 to the Quarterly Report on Form 10-Q for the quarter ended March 31, 2008 and incorporated herein by reference). |
|
10.18 |
|
Waiver Letter dated May 3, 2008 by International Finance Corporation in favor of Toreador Resources Corporation, Toreador Turkey Ltd., Toreador Romania Ltd., Madison Oil France, SAS, Toreador Energy France S.C.S., and Toreador International Holding Limited Liability Company (previously filed as Exhibit 10.13 to the Quarterly Report on Form 10-Q for the quarter ended March 31, 2008, File No. 0-2517, and incorporated herein by reference). |
|
10.19+ |
|
Form of Outside Director Stock Award Agreement (previously filed as Exhibit 10.2 to the Quarterly Report on Form 10-Q for the quarter ended June 30, 2008 and incorporated herein by reference). |
|
10.20+ |
|
Nigel Lovett Nonqualified Stock Option Agreement dated May 15, 2008 (previously filed as Exhibit 10.3 to the Quarterly Report on Form 10-Q for the quarter ended June 30, 2008 and incorporated herein by reference). |
|
10.21+ |
|
Nigel Lovett Incentive Stock Option Agreement dated May 15, 2008 (previously filed as Exhibit 10.4 to the Quarterly Report on Form 10-Q for the quarter ended June 30, 2008 and incorporated herein by reference). |
|
10.22+ |
|
Nigel Lovett Restricted Stock Agreement dated May 15, 2008 (previously filed as Exhibit 10.5 to the Quarterly Report on Form 10-Q for the quarter ended June 30, 2008 and incorporated herein by reference). |
|
10.23+ |
|
Separation Agreement and Release dated June 27, 2008 by and between Toreador Resources Corporation and Michael J. FitzGerald (previously filed as Exhibit 10.7 to the Quarterly Report on Form 10-Q for the quarter ended June 30, 2008 and incorporated herein by reference). |
|
10.24+ |
|
Separation Agreement and Release dated June 27, 2008 by and between Toreador Resources Corporation and Edward Ramirez (previously filed as Exhibit 10.8 to the Quarterly Report on Form 10-Q for the quarter ended June 30, 2008 and incorporated herein by reference). |
|
10.25+ |
|
First Amendment dated July 3, 2008 to the Separation Agreement and Release between Edward Ramirez and Toreador Resources Corporation dated June 27, 2008 (previously filed as Exhibit 10.9 to the Quarterly Report on Form 10-Q for the quarter ended June 30, 2008 and incorporated herein by reference). |
|
10.26 |
|
Parent Corporate Guaranty by PETROL OFISI AS in favor of Toreador Turkey Limited and Toreador Turkey Limited, Ankara Turkey Branch, dated September 17, 2008 (previously filed as Exhibit 10.1 to the Quarterly Report on Form 10-Q for the quarter ended September 30, 2008 and incorporated herein by reference). |
|
10.27 |
|
Form of Employee Restricted Stock Agreement (previously filed as Exhibit 10.3 to the Quarterly Report on Form 10-Q for the quarter ended September 30, 2008 and incorporated herein by reference). |
75
Table of Contents
| | | |
Exhibit
Number | | Description |
|---|
| | 10.28+ | | Summary Sheet regarding changes in Director Compensation (July 2008) (previously filed as Exhibit 10.4 to the Quarterly Report on Form 10-Q for the quarter ended September 30, 2008 and incorporated herein by reference). |
|
10.29+ |
|
Settlement Agreement, dated January 22, 2009, among Toreador Resources Corporation, Nanes Balkany Partners I LP, John M. McLaughlin, Nigel J. Lovett, Craig M. McKenzie, Julien Balkany, and Peter Hill (previously filed as Exhibit 10.1 to the Current Report on Form 8-K filed on January 27, 2009 and incorporated herein by reference). |
|
10.30+ |
|
Resignation and Mutual Release Agreement, dated January 22, 2009, between Toreador Resources Corporation and John M. McLaughlin (previously filed as Exhibit 10.2 to the Current Report on Form 8-K filed on January 27, 2009 and incorporated herein by reference). |
|
10.31+ |
|
Separation and Mutual Release Agreement, dated January 22, 2009, between Toreador Resources Corporation and Nigel J. Lovett (previously filed as Exhibit 10.3 to the Current Report on Form 8-K filed on January 27, 2009 and incorporated herein by reference). |
|
10.32+ |
|
Form of McLaughlin/Lovett Indemnity Agreement, dated January 22, 2009, for John M. McLaughlin and Nigel J. Lovett (previously filed as Exhibit 10.4 to the Current Report on Form 8-K filed on January 27, 2009 and incorporated herein by reference). |
|
10.33+ |
|
Form of Director Indemnity Agreement, dated January 22, 2009, for current directors (previously filed as Exhibit 10.5 to the Current Report on Form 8-K filed on January 27, 2009 and incorporated herein by reference). |
|
10.34+ |
|
Letter Agreement, dated January 22, 2009, between Toreador Resources Corporation and Craig M. McKenzie (previously filed as Exhibit 10.6 to the Current Report on Form 8-K filed on January 27, 2009 and incorporated herein by reference). |
|
10.35+ |
|
Retention Agreement dated March 19, 2009 by and between Toreador Resources Corporation and Charles Campise (previously filed as Exhibit 10.1 to the Current Report on Form 8-K filed on March 23, 2009 and incorporated herein by reference). |
|
10.36+ |
|
Employment Agreement by and between Toreador Resources Corporation and Craig McKenzie, dated August 24, 2009 (previously filed as Exhibit 10.1 to the Current Report on Form 8-K filed on August 24, 2009 and incorporated herein by reference) |
|
10.37+ |
|
Employment Agreement by and between Toreador Resources Corporation and Marc Sengès dated September 15, 2009 (previously filed as Exhibit 10.1 to the Current Report on Form 8-K filed on September 17, 2009 and incorporated herein by reference). |
|
10.38 |
|
Quota Purchase Agreement, dated September 30, 2009, between Toreador Resources Corporation and Rohöl-Aufsuchungs Aktiengesellschaft (previously filed as Exhibit 10.1 to the Current Report Form 8-K filed on October 6, 2009 and incorporated herein by reference). |
|
10.39 |
|
Share Purchase Agreement dated September 30, 2009 among Toreador Resources Corporation, Tiway Oil BV and Tiway Oil AS (previously filed as Exhibit 10.1 to the Current Report on Form 8-K filed on October 6, 2009 and incorporated herein by reference). |
|
12.1* |
|
Computation of Ratio of Earnings to Fixed Charges. |
|
21.1* |
|
Subsidiaries of Toreador Resources Corporation. |
|
23.1* |
|
Consent of Grant Thornton LLP. |
|
23.2* |
|
Consent of Gaffney, Cline & Associates Ltd. |
|
24.1* |
|
Power of Attorney (included as part of the signature page). |
76
Table of Contents
| | | |
Exhibit
Number | | Description |
|---|
| | 31.1* | | Certification of Chief Executive Officer pursuant to 18 U.S.C. Section 1350, as adopted pursuant to Section 302 of the Sarbanes-Oxley Act of 2002. |
|
31.2* |
|
Certification of Chief Financial Officer pursuant to 18 U.S.C. Section 1350, as adopted pursuant to Section 302 of the Sarbanes-Oxley Act of 2002. |
|
32.1* |
|
Certification of Chief Executive Officer and Chief Financial Officer pursuant to 18 U.S.C. Section 1350, as adopted pursuant to Section 906 of the Sarbanes-Oxley Act of 2002. |
|
99.1 |
|
French Ministry Documentation (previously filed as Exhibit 99.1 to the Amended Annual Report on Form 10-K/A for the year ended December 31, 2006 and incorporated herein by reference). |
|
99.2* |
|
Report of Gaffney, Cline & Associates Ltd. |
- *
- Filed herewith
- +
- Management contract or compensatory plan
77
Table of Contents
Item 7. Financial Statements
INDEX TO CONSOLIDATED FINANCIAL STATEMENTS
| | | |
| | Page |
|---|
Report of Independent Registered Public Accounting Firm | | F-2 |
Financial Statements | | |
| | Consolidated Balance Sheets as of December 31, 2009 and 2008 | | F-5 |
| | Consolidated Statements of Operations and Comprehensive Income (Loss) for each of the three years in the period ended December 31, 2009 | | F-6 |
| | Consolidated Statements of Changes in Stockholders' Equity for each of the three years in the period ended December 31, 2009 | | F-7 |
| | Consolidated Statements of Cash Flows for each of the three years in the period ended December 31, 2009 | | F-8 |
| | Notes to Consolidated Financial Statements | | F-9 |
F-1
Table of Contents
REPORT OF INDEPENDENT REGISTERED PUBLIC ACCOUNTING FIRM
Board of Directors and Stockholders
Toreador Resources Corporation
We have audited Toreador Resources Corporation (a Delaware Corporation) and subsidiaries' (the "Company") internal control over financial reporting as of December 31, 2009, based on criteria established inInternal Control — Integrated Framework issued by the Committee of Sponsoring Organizations of the Treadway Commission (COSO). The Company's management is responsible for maintaining effective internal control over financial reporting and for its assessment of the effectiveness of internal control over financial reporting, included in the accompanying "Management's Annual Report on Internal Control Over Financial Reporting". Our responsibility is to express an opinion on the Company's internal control over financial reporting based on our audit.
We conducted our audit in accordance with the standards of the Public Company Accounting Oversight Board (United States). Those standards require that we plan and perform the audit to obtain reasonable assurance about whether effective internal control over financial reporting was maintained in all material respects. Our audit included obtaining an understanding of internal control over financial reporting, assessing the risk that a material weakness exists, testing and evaluating the design and operating effectiveness of internal control based on the assessed risk, and performing such other procedures as we considered necessary in the circumstances. We believe that our audit provides a reasonable basis for our opinion.
A company's internal control over financial reporting is a process designed to provide reasonable assurance regarding the reliability of financial reporting and the preparation of financial statements for external purposes in accordance with generally accepted accounting principles. A company's internal control over financial reporting includes those policies and procedures that (1) pertain to the maintenance of records that, in reasonable detail, accurately and fairly reflect the transactions and dispositions of the assets of the company; (2) provide reasonable assurance that transactions are recorded as necessary to permit preparation of financial statements in accordance with generally accepted accounting principles, and that receipts and expenditures of the company are being made only in accordance with authorizations of management and directors of the company; and (3) provide reasonable assurance regarding prevention or timely detection of unauthorized acquisition, use, or disposition of the company's assets that could have a material effect on the financial statements.
Because of its inherent limitations, internal control over financial reporting may not prevent or detect misstatements. Also, projections of any evaluation of effectiveness to future periods are subject to the risk that controls may become inadequate because of changes in conditions, or that the degree of compliance with the policies or procedures may deteriorate.
A material weakness is a deficiency, or combination of control deficiencies, in internal control over financial reporting, such that there is a reasonable possibility that a material misstatement of the company's annual or interim financial statements will not be prevented or detected on a timely basis. The following material weakness has been identified and included in management's assessment.
- •
- The Company's accounting and financial reporting procedures were not sufficiently designed to ensure consistent and complete application of accounting policies and to prepare financial statements in accordance with accounting principles generally accepted in the United States. This includes the lack of a sufficient review of sensitive calculations, reconciliations and critical spreadsheets by personnel in key financial reporting positions.
In our opinion, because of the effect of the material weakness described above on the achievement of the objectives of the control criteria, the Company has not maintained effective internal control over financial reporting as of December 31, 2009, based on criteria established in Internal Control — Integrated Framework issued by COSO.
F-2
Table of Contents
We also have audited, in accordance with the standards of the Public Company Accounting Oversight Board (United States), the consolidated balance sheets of Toreador Resources Corporation and subsidiaries as of December 31, 2009 and 2008, and the related statements of operations and comprehensive income (loss), changes in stockholders' equity and cash flows for each of the three years in the period ended December 31, 2009. The material weakness identified above was considered in determining the nature, timing and extent of audit tests applied in our audit of the 2009 financial statements, and this report does not affect our report dated March 16, 2010, which expressed an unqualified opinion on those financial statements.
/s/ GRANT THORNTON LLP
Houston, Texas
March 16, 2010
F-3
Table of Contents
REPORT OF INDEPENDENT REGISTERED PUBLIC ACCOUNTING FIRM
Board of Directors and Stockholders
Toreador Resources Corporation
We have audited the accompanying consolidated balance sheets of Toreador Resources Corporation (a Delaware corporation) and subsidiaries (the 'Company") as of December 31, 2009 and 2008, and the related consolidated statements of operations and comprehensive income (loss), changes in stockholders' equity, and cash flows for each of the three years in the period ended December 31, 2009. These financial statements are the responsibility of the Company's management. Our responsibility is to express an opinion on these financial statements based on our audits.
We conducted our audits in accordance with the standards of the Public Company Accounting Oversight Board (United States). Those standards require that we plan and perform the audit to obtain reasonable assurance about whether the financial statements are free of material misstatement. An audit includes examining, on a test basis, evidence supporting the amounts and disclosures in the financial statements. An audit also includes assessing the accounting principles used and significant estimates made by management, as well as evaluating the overall financial statement presentation. We believe that our audits provide a reasonable basis for our opinion.
In our opinion, the consolidated financial statements referred to above present fairly, in all material respects, the financial position of Toreador Resources Corporation and subsidiaries as of December 31, 2009 and 2008, and the results of their operations and their cash flows for each of the three years in the period ended December 31, 2009 in conformity with accounting principles generally accepted in the United States of America.
As discussed in Note 1 to the consolidated financial statements, the Company has changed its reserve estimates and related disclosures as a result of adopting new oil and gas reserve estimation and disclosure requirements as of December 31, 2009.
We also have audited, in accordance with the standards of the Public Company Accounting Oversight Board (United States), the Company's internal control over financial reporting as of December 31, 2009, based on criteria established inInternal Control — Integrated Framework issued by the Committee of Sponsoring Organizations of the Treadway Commission (COSO) and our report dated March 16, 2010 expressed an adverse opinion.
/s/ GRANT THORNTON LLP
Houston, Texas
March 16, 2010
F-4
Table of Contents
TOREADOR RESOURCES CORPORATION
CONSOLIDATED BALANCE SHEETS
| | | | | | | | | | |
| | December 31, | |
|---|
| | 2009 | | 2008 | |
|---|
| | (in thousands, except
share and per share data)
| |
|---|
ASSETS | |
Current assets: | | | | | | | |
Cash and cash equivalents | | $ | 8,712 | | $ | 14,860 | |
Accounts receivable | | | 3,126 | | | 1,058 | |
Oil and natural gas properties, net, held for sale | | | — | | | 91,959 | |
Income tax receivable | | | 245 | | | — | |
Other assets held for sale | | | — | | | 14,963 | |
Other | | | 3,593 | | | 3,713 | |
| | | | | | |
| | | | Total current assets | | | 15,676 | | | 126,553 | |
| | | | | | |
Oil and natural gas properties, net, using successful efforts method of accounting | | | 74,621 | | | 72,753 | |
Investments | | | 200 | | | 200 | |
Goodwill | | | 3,973 | | | 3,838 | |
Other assets | | | 2,685 | | | 3,812 | |
| | | | | | |
| | $ | 97,155 | | $ | 207,156 | |
| | | | | | |
LIABILITIES AND STOCKHOLDERS' EQUITY | |
Current liabilities: | | | | | | | |
| | Accounts payable and accrued liabilities | | $ | 12,491 | | $ | 7,700 | |
| | Liabilities held for sale | | | — | | | 11,251 | |
| | Deferred lease payable | | | 107 | | | 93 | |
| | Derivatives | | | 886 | | | — | |
| | Current portion of long-term debt | | | 32,385 | | | 30,000 | |
| | Income taxes payable | | | — | | | 4,223 | |
| | | | | | |
| | | | Total current liabilities | | | 45,869 | | | 53,267 | |
| | | | | | |
Accrued liabilities | | | 385 | | | 501 | |
Deferred lease payable | | | 442 | | | 665 | |
Asset retirement obligations | | | 6,733 | | | 6,037 | |
Deferred income tax liabilities | | | 15,358 | | | 13,851 | |
Convertible senior notes | | | 22,231 | | | 80,275 | |
| | | | | | |
| | | | Total liabilities | | | 91,018 | | | 154,596 | |
| | | | | | |
Commitments and contingencies (Note 12) | | | | | | | |
Stockholders' equity: | | | | | | | |
| | | Common stock, $0.15625 par value, 30,000,000 shares authorized; 22,106,955 and 20,984,360 shares issued | | | 3,454 | | | 3,279 | |
| | Additional paid-in capital | | | 170,895 | | | 166,484 | |
| | Accumulated deficit | | | (176,578 | ) | | (151,169 | ) |
| | Accumulated other comprehensive income | | | 10,900 | | | 36,500 | |
| | Treasury stock at cost, 721,027 shares | | | (2,534 | ) | | (2,534 | ) |
| | | | | | |
| | | | Total stockholders' equity | | | 6,137 | | | 52,560 | |
| | | | | | |
| | $ | 97,155 | | $ | 207,156 | |
| | | | | | |
See accompanying notes to the consolidated financial statements
F-5
Table of Contents
TOREADOR RESOURCES CORPORATION
CONSOLIDATED STATEMENTS OF OPERATIONS AND COMPREHENSIVE INCOME (LOSS)
| | | | | | | | | | | | | |
| | Year ended December 31, | |
|---|
| | 2009 | | 2008 | | 2007 | |
|---|
| | (in thousands, except per share data)
| |
|---|
Revenue: | | | | | | | | | | |
| | Oil and natural gas sales | | $ | 19,236 | | $ | 34,150 | | $ | 25,907 | |
Operating costs and expenses: | | | | | | | | | | |
| | Lease operating expense | | | 8,396 | | | 9,263 | | | 7,344 | |
| | Exploration expense | | | 138 | | | 1,224 | | | 3,523 | |
| | Dry hole and abandonment | | | — | | | — | | | 3,847 | |
| | Depreciation, depletion and amortization | | | 5,763 | | | 4,994 | | | 4,402 | |
| | Impairment of oil and natural gas properties and intangible assets | | | — | | | 2,282 | | | — | |
| | General and administrative | | | 20,360 | | | 13,042 | | | 12,507 | |
| | Loss on oil and gas derivative contracts | | | 879 | | | 1,781 | | | 1,005 | |
| | Gain on sale of properties and other assets | | | (121 | ) | | — | | | (3,155 | ) |
| | | | | | | | |
| | | | Total operating costs and expenses | | | 35,415 | | | 32,586 | | | 29,473 | |
| | | | | | | | |
Operating income (loss) | | | (16,179 | ) | | 1,564 | | | (3,566 | ) |
Other income (expense): | | | | | | | | | | |
| | Equity in earnings of unconsolidated investments | | | — | | | — | | | 22 | |
| | Foreign currency exchange gain (loss) | | | 169 | | | (145 | ) | | (321 | ) |
| | Interest and other income | | | 251 | | | 775 | | | 1,384 | |
| | Gain on the extinguishment of debt | | | 3,345 | | | 458 | | | — | |
| | Interest expense | | | (3,368 | ) | | (4,170 | ) | | (3,469 | ) |
| | | | | | | | |
| | | | Total other income (expense) | | | 397 | | | (3,082 | ) | | (2,384 | ) |
| | | | | | | | |
Loss from continuing operations before income taxes | | | (15,782 | ) | | (1,518 | ) | | (5,950 | ) |
Income tax benefit (provision) | | | 450 | | | (5,502 | ) | | 1,402 | |
| | | | | | | | |
Loss from continuing operations, net of tax | | | (15,332 | ) | | (7,020 | ) | | (4,548 | ) |
Loss from discontinued operations, net of tax | | | (10,080 | ) | | (101,585 | ) | | (69,873 | ) |
| | | | | | | | |
Net loss | | | (25,412 | ) | | (108,605 | ) | | (74,421 | ) |
Preferred dividends | | | — | | | — | | | (162 | ) |
| | | | | | | | |
Loss available to common shares | | $ | (25,412 | ) | $ | (108,605 | ) | $ | (74,583 | ) |
| | | | | | | | |
Basic loss available to common shares per share from: | | | | | | | | | | |
| | | Continuing operations | | $ | (0.75 | ) | $ | (0.35 | ) | $ | (0.26 | ) |
| | | Discontinued operations | | | (0.49 | ) | | (5.13 | ) | | (3.81 | ) |
| | | | | | | | |
| | $ | (1.24 | ) | $ | (5.48 | ) | $ | (4.07 | ) |
| | | | | | | | |
Diluted loss available to common shares per share from: | | | | | | | | | | |
| | | Continuing operations | | $ | (0.75 | ) | $ | (0.35 | ) | $ | (0.26 | ) |
| | | Discontinued operations | | | (0.49 | ) | | (5.13 | ) | | (3.81 | ) |
| | | | | | | | |
| | $ | (1.24 | ) | $ | (5.48 | ) | $ | (4.07 | ) |
| | | | | | | | |
Weighted average shares outstanding: | | | | | | | | | | |
| | Basic | | | 20,564 | | | 19,831 | | | 18,358 | |
| | Diluted | | | 20,564 | | | 19,831 | | | 18,358 | |
Statement of Comprehensive Loss | | | | | | | | | | |
Net loss | | $ | (25,412 | ) | $ | (108,605 | ) | $ | (74,421 | ) |
Foreign currency translation adjustments | | | 4,561 | | | (5,254 | ) | | 38,431 | |
Foreign currency translation adjustments subsidiaries sold | | | (30,161 | ) | | — | | | — | |
| | | | | | | | |
Comprehensive income loss | | $ | (51,012 | ) | $ | (113,859 | ) | $ | (35,990 | ) |
| | | | | | | | |
See accompanying notes to the consolidated financial statements.
F-6
Table of Contents
TOREADOR RESOURCES CORPORATION
CONSOLIDATED STATEMENTS OF CHANGES IN STOCKHOLDERS' EQUITY
| | | | | | | | | | | | | | | | | | | | | | | | | | | | |
| | Preferred
Stock
(Shares) | | Preferred
Stock
($) | | Common
Stock
(Shares) | | Common
Stock
($) | | Additional
Paid-in
Capital | | Retained
Earnings | | Accumulated
Other
Comprehensive
Income (loss) | | Treasury
Stock
($) | | Total
Stockholders'
Equity | |
|---|
| | (in thousands)
| |
|---|
Balance at December 31, 2006 | | | 72 | | | 72 | | | 16,656 | | | 2,602 | | | 111,708 | | | 31,980 | | | 3,323 | | | (2,534 | ) | | 147,151 | |
Cash payment of preferred dividends | | | — | | | — | | | — | | | — | | | — | | | (162 | ) | | — | | | — | | | (162 | ) |
Exercise of stock options | | | — | | | — | | | 321 | | | 50 | | | 1,574 | | | — | | | — | | | — | | | 1,624 | |
Issuance of restricted stock | | | — | | | — | | | 103 | | | 16 | | | (16 | ) | | — | | | — | | | — | | | — | |
Issuance of common stock | | | — | | | — | | | 3,037 | | | 476 | | | 49,937 | | | — | | | — | | | — | | | 50,413 | |
Stock option expense | | | — | | | — | | | — | | | — | | | 49 | | | — | | | — | | | — | | | 49 | |
Amortization of deferred stock compensation | | | — | | | — | | | — | | | — | | | 3,982 | | | — | | | — | | | — | | | 3,982 | |
Adoption of FIN 48 | | | — | | | — | | | — | | | — | | | — | | | (45 | ) | | — | | | — | | | (45 | ) |
Conversion of preferred stock to common stock | | | (72 | ) | | (72 | ) | | 450 | | | 70 | | | 2 | | | — | | | — | | | — | | | — | |
Net loss | | | — | | | — | | | — | | | — | | | — | | | (74,421 | ) | | — | | | — | | | (74,421 | ) |
Foreign currency translation adjustment | | | — | | | — | | | — | | | — | | | — | | | — | | | 38,431 | | | — | | | 38,431 | |
Tax effect of restricted stock | | | — | | | — | | | — | | | — | | | (316 | ) | | — | | | — | | | — | | | (316 | ) |
Payment of equity issuance costs | | | — | | | — | | | — | | | — | | | (2,965 | ) | | — | | | — | | | — | | | (2,965 | ) |
Other | | | — | | | — | | | — | | | — | | | — | | | 84 | | | — | | | — | | | 84 | |
| | | | | | | | | | | | | | | | | | | | |
Balance at December 31, 2007 | | | — | | | — | | | 20,567 | | $ | 3,214 | | $ | 163,955 | | $ | (42,564 | ) | $ | 41,754 | | $ | (2,534 | ) | $ | 163,825 | |
Exercise of stock options | | | — | | | — | | | 189 | | | 29 | | | 716 | | | — | | | — | | | — | | | 745 | |
Issuance of restricted stock | | | — | | | — | | | 228 | | | 36 | | | (36 | ) | | — | | | — | | | — | | | — | |
Stock option expense | | | — | | | — | | | — | | | — | | | 94 | | | — | | | — | | | — | | | 94 | |
Amortization of deferred stock compensation | | | — | | | — | | | — | | | — | | | 2,231 | | | — | | | — | | | — | | | 2,231 | |
Net loss | | | — | | | — | | | — | | | — | | | — | | | (108,605 | ) | | — | | | — | | | (108,605 | ) |
Foreign currency translation adjustments | | | — | | | — | | | — | | | — | | | — | | | — | | | (5,254 | ) | | — | | | (5,254 | ) |
Tax effect of restricted stock | | | — | | | — | | | — | | | — | | | (444 | ) | | — | | | — | | | — | | | (444 | ) |
Other | | | — | | | — | | | — | | | — | | | (32 | ) | | — | | | — | | | — | | | (32 | ) |
| | | | | | | | | | | | | | | | | | | | |
Balance at December 31, 2008 | | | — | | | — | | | 20,984 | | $ | 3,279 | | $ | 166,484 | | $ | (151,169 | ) | $ | 36,500 | | $ | (2,534 | ) | $ | 52,560 | |
Exercise of stock options | | | — | | | — | | | 31 | | | 5 | | | 109 | | | — | | | — | | | — | | | 114 | |
Return stock options exercised | | | — | | | — | | | (30 | ) | | (5 | ) | | (158 | ) | | — | | | — | | | — | | | (163 | ) |
Issuance of restricted stock, net of forfeitures | | | — | | | — | | | 1,122 | | | 175 | | | (175 | ) | | — | | | — | | | — | | | — | |
Stock option expense | | | — | | | — | | | — | | | — | | | 38 | | | — | | | — | | | — | | | 38 | |
Amortization of deferred stock compensation expense | | | — | | | — | | | — | | | — | | | 4,618 | | | — | | | — | | | — | | | 4,618 | |
Net loss | | | — | | | — | | | — | | | — | | | — | | | (25,412 | ) | | — | | | — | | | (25,412 | ) |
Foreign currency translation adjustments | | | — | | | — | | | — | | | — | | | — | | | — | | | 4,561 | | | — | | | 4,561 | |
Foreign currency translation adjustments subsidiaries sold | | | — | | | — | | | — | | | — | | | — | | | — | | | (30,161 | ) | | — | | | (30,161 | ) |
Tax effect of restricted stock | | | — | | | — | | | — | | | — | | | (21 | ) | | — | | | — | | | — | | | (21 | ) |
Other | | | — | | | — | | | — | | | — | | | — | | | 3 | | | — | | | — | | | 3 | |
| | | | | | | | | | | | | | | | | | | | |
Balance at December 31, 2009 | | | — | | | — | | | 22,107 | | $ | 3,454 | | $ | 170,895 | | $ | (176,578 | ) | $ | 10,900 | | $ | (2,534 | ) | $ | 6,137 | |
| | | | | | | | | | | | | | | | | | | | |
See accompanying notes to the consolidated financial statements.
F-7
Table of Contents
TOREADOR RESOURCES CORPORATION
CONSOLIDATED STATEMENTS OF CASH FLOWS
| | | | | | | | | | | | | | |
| | Year Ended December 31 | |
|---|
| | 2009 | | 2008 | | 2007 | |
|---|
| | (in thousands)
| |
|---|
Cash flows from operating activities: | | | | | | | | | | |
| | | Net loss | | $ | (25,412 | ) | $ | (108,605 | ) | $ | (74,421 | ) |
| | | Adjustments to reconcile net loss to net cash provided by (used in) operating activities | | | | | | | | | | |
| | | | | Depreciation, depletion and amortization | | | 5,920 | | | 33,141 | | | 21,868 | |
| | | | | Amortization of deferred debt issuance costs | | | 158 | | | 338 | | | 612 | |
| | | | | Impairment of oil and natural gas properties and intangible assets | | | 10,725 | | | 85,233 | | | 13,446 | |
| | | | | Dry hole and abandonment costs | | | 1,318 | | | — | | | 21,840 | |
| | | | | Deferred income taxes | | | 968 | | | — | | | (3,425 | ) |
| | | | | Unrealized loss on commodity derivatives | | | 886 | | | — | | | 192 | |
| | | | | Gain on sale of properties and equipment | | | (121 | ) | | | | | 343 | |
| | | | | Gain on the sale of discontinued operations | | | (3,582 | ) | | 123 | | | (9,244 | ) |
| | | | | Loss on the extinguishment of debt | | | 1,554 | | | (458 | ) | | — | |
| | | | | Equity in earnings of unconsolidated investments | | | — | | | — | | | (22 | ) |
| | | | | Stock-based compensation | | | 4,656 | | | 2,325 | | | 4,031 | |
| | | | | Gain on sale of unconsolidated investments | | | — | | | — | | | (3,502 | ) |
| | Change in operating assets and liabilities, net of acquisitions | | | | | | | | | | |
| | | Decrease (increase) in accounts receivable | | | (2,069 | ) | | 2,027 | | | 1,020 | |
| | | Decrease (increase) in income taxes receivable | | | — | | | — | | | 715 | |
| | | Decrease (increase) in other current assets | | | (125 | ) | | 135 | | | (130 | ) |
| | | Decrease (increase) in assets and liabilities held for sale | | | (3,050 | ) | | 604 | | | 13,504 | |
| | | Increase (decrease) in accounts payable and accrued liabilities | | | 5,187 | | | 858 | | | (1,826 | ) |
| | | Increase (decrease) in lease payable | | | (114 | ) | | (19 | ) | | 661 | |
| | | Decrease in other assets | | | (21 | ) | | 108 | | | 1,466 | |
| | | Increase (decrease) in income taxes payable | | | (4,223 | ) | | 956 | | | 439 | |
| | | | | | | | |
| | | | | Net cash provided by (used in) operating activities | | | (7,345 | ) | | 16,766 | | | (12,434 | ) |
| | | | | | | | |
Cash flows from investing activities: | | | | | | | | | | |
| | | Expenditures for property and equipment | | | (7,914 | ) | | (10,702 | ) | | (90,644 | ) |
| | | Restricted cash | | | — | | | 8,685 | | | 1,243 | |
| | | Proceeds from the sale of properties and equipment | | | 70,851 | | | — | | | 21,002 | |
| | | Distributions from unconsolidated entities | | | — | | | — | | | 60 | |
| | | Sale (purchase) of short-term investments | | | — | | | — | | | (500 | ) |
| | | Sale (purchase) of investments in unconsolidated entities | | | — | | | — | | | 6,123 | |
| | | | | | | | |
| | | | | Net cash used in investing activities | | | 62,937 | | | (2,017 | ) | | (62,716 | ) |
| | | | | | | | |
Cash flows from financing activities: | | | | | | | | | | |
| | | Net borrowings under revolving credit arrangements | | | — | | | — | | | 3,450 | |
| | | Exercise of stock options, net of returns | | | (49 | ) | | 745 | | | 1,624 | |
| | | Proceeds from issuance of common stock, net of issuance cost of $0, $32 and $2,965 | | | — | | | (32 | ) | | 47,448 | |
| | | Payments of long term debt | | | (57,712 | ) | | (5,275 | ) | | — | |
| | | Payment of preferred dividends | | | — | | | — | | | (162 | ) |
| | | | | | | | |
| | | | | Net cash provided by (used in) financing activities | | | (57,761 | ) | | (4,562 | ) | | 52,360 | |
| | | | | | | | |
Net increase (decrease) in cash and cash equivalents | | |
(2,169 |
) | |
10,187 | | |
(22,790 |
) |
Effects of foreign currency translation on cash and cash equivalents | | | (3,979 | ) | | (3,731 | ) | | 26,806 | |
Cash and cash equivalents, beginning of year | | | 14,860 | | | 8,404 | | | 4,388 | |
| | | | | | | | |
Cash and cash equivalents, end of year | | $ | 8,712 | | $ | 14,860 | | $ | 8,404 | |
| | | | | | | | |
Supplemental disclosures: | | | | | | | | | | |
Cash paid during the period for interest, net of interest capitalized | | $ | 3,169 | | $ | 5,626 | | $ | 2,927 | |
Cash paid during the period for income taxes | | $ | 4,032 | | $ | 3,058 | | $ | 2,761 | |
Non-cash investing and financing activities | | | | | | | | | | |
| | | Conversion of preferred stock to common stock | | | — | | | — | | | 72 | |
| | | Additions to oil and natural gas properties related to asset retirement obligations | | | — | | | 1,294 | | | 1,964 | |
F-8
Table of Contents
TOREADOR RESOURCES CORPORATION
NOTES TO CONSOLIDATED FINANCIAL STATEMENTS
NOTE 1 — DESCRIPTION OF BUSINESS
Toreador Resources Corporation ("Toreador") is an independent energy company engaged in the exploration and production of crude oil interests in developed and underdeveloped oil properties in the Paris Basin, France. The accompanying consolidated financial statements are presented in U.S. dollars and in accordance with accounting principles generally accepted in the United States.
Toreador consolidates all of its majority-owned subsidiaries (collectively, "we," "us," "our," or the "Company"). All intercompany accounts and transactions are eliminated in consolidation. We account for our investments in entities in which we hold less than a majority interest under the equity method.
NOTE 2 — SIGNIFICANT ACCOUNTING POLICIES
The preparation of the consolidated financial statements requires management of the Company to make a number of estimates and assumptions relating to the reported amounts of assets and liabilities and the disclosure of contingent assets and liabilities at the date of the consolidated financial statements and the reported amounts of revenues and expenses during the reporting period.
The Company's estimates of crude oil and natural gas reserves are the most significant estimates used. All of the reserve data in the Annual Report on Form 10-K for the year ended December 31, 2009 are estimates. Reservoir engineering is a subjective process of estimating underground accumulations of crude oil and natural gas. There are numerous uncertainties inherent in estimating quantities of proved crude oil and natural gas reserves. The accuracy of any reserve estimates is a function of the quality of available data and of engineering and geological interpretation and judgment. As a result, reserve estimates may be different from the quantities of crude oil and natural gas that are ultimately recovered.
Other items subject to estimates and assumptions include the carrying amounts of oil and natural gas properties, goodwill, asset retirement obligations derivative financial instruments and deferred income tax assets. Actual results could differ significantly from those estimates.
Cash and cash equivalents include cash on hand, amounts due from banks and all highly liquid investments with original maturities of three months or less. We maintain our cash in bank deposit accounts, substantially all of which exceed federally insured limits. We have not experienced any losses in such accounts.
As of December 31, 2009 and 2008 we had $8.6 million and $12.2 million, respectively, on deposit in foreign banks.
Financial instruments that potentially subject us to a concentration of credit risk consist principally of cash, accounts receivable, and our hedging and derivative financial instruments. We place our cash with high credit quality financial institutions. We sell oil to one customer, Total. Substantially all of our accounts receivable are due from the purchaser of oil production. We place our hedging and derivative financial instruments with financial institutions and other firms that we believe have high credit ratings. For a discussion of the credit risks associated with our hedging activities, please see "Derivative Financial Instruments" below.
F-9
Table of Contents
TOREADOR RESOURCES CORPORATION
NOTES TO CONSOLIDATED FINANCIAL STATEMENTS — (Continued)
We periodically review the collectability of accounts receivable and record a valuation allowance for those accounts which are, in our judgment, unlikely to be collected. We have not had any significant credit losses in the past and we believe our accounts receivable are fully collectable with the exception of the current allowance.
DERIVATIVES
We periodically utilize derivatives instruments such as futures and swaps for purposes of hedging our exposure to fluctuations in the price of crude oil sales. We have elected not to designate the derivative financial instruments to which we are a party as hedges, and accordingly, we record such contracts at fair value and recognize changes in such fair value in current earnings as they occur. We determine the fair value of futures and swap contracts based on the difference between their fixed contract price and the underlying market price at the determination date. The realized and unrealized gains and losses on derivatives are recorded as a derivative fair value gain or loss in the income statement.
The carrying amounts of financial instruments including cash and cash equivalents, accounts receivable, accounts payable and accrued liabilities approximate fair value, at December 31, 2009 and 2008, due to the short-term nature or maturity of the instruments.
The current portion of long-term debt approximated fair value based on the quoted market prices for the same or similar issues or on the current rates offered to the Company for debt of the same maturities.
On December 31, 2009 the 5% convertible senior notes which had a book value of $54.6 million, were trading at or near par value, which would equal a fair market value of approximately $52.416 million.
At December 31, 2009 and 2008, other current assets included $3.2 million, and $727,000 of inventory, respectively. Those amounts consist of tubular goods and crude oil held in storage tanks. Inventories are stated at the lower of actual cost or market based on the average cost method.
We follow the successful efforts method of accounting for oil and natural gas exploration and development expenditures. Under this method, costs of successful exploratory wells and all development wells are capitalized. Costs to drill exploratory wells that do not find proved reserves are expensed. Significant costs associated with the acquisition of oil and natural gas properties are capitalized. Upon sale or abandonment of units of property or the disposition of miscellaneous equipment, the cost is removed from the asset account, net of the accumulated depreciation or depletion, and the gain or loss is credited to or charged against operations.
Maintenance and repairs are charged to expense; betterments of property are capitalized and depreciated as described above.
We capitalize interest on major projects that require an extended period of time to complete. Interest capitalized in 2009, 2008 and 2007 was $355,000, $1 million, and $3.7 million, respectively.
We record furniture, fixtures and equipment at cost.
F-10
Table of Contents
TOREADOR RESOURCES CORPORATION
NOTES TO CONSOLIDATED FINANCIAL STATEMENTS — (Continued)
In the fourth quarter of 2008 and during the first quarter of 2009, Toreador farmed out or sold all of its working interests in Romania to three different companies and closed its office; thus, we no longer have any operational involvement in Romania. This resulted in a gain of $5.8 million which was recorded in the first quarter of 2009. We retained a royalty of 1.5% of gross proceeds from oil and gas sales from the Fauresti Field.
On March 3, 2009 we completed the sale of a 26.75% interest in the South Akcakoca Sub-Basin (SASB) project associated licenses located in the Black Sea offshore Turkey, to Petrol Ofisi for $55 million. In accordance with the revised assignment announced on February 3, 2009, $50 million of the proceeds was paid by Petrol Ofisi on March 3, 2009, and the remaining $5 million was paid on September 1, 2009. There was no gain or loss resulting from this sale.
On September 30, 2009, the Company entered into a Share Purchase Agreement (the "Share Purchase Agreement") with Tiway Oil BV, a company organized under the laws of the Netherlands ("Tiway"), and Tiway Oil AS, a company organized under the laws of Norway, pursuant to which the Company agreed to sell 100% of the outstanding shares of Toreador Turkey Ltd. ("Toreador Turkey") to Tiway for total consideration consisting of: (1) a cash payment of $10.5 million to be paid at closing, (2) exploration success payments dependent upon certain future commercial discoveries as provided in the Share Purchase Agreement, up to a maximum aggregate consideration of $40 million, and (3) future quarterly 10% pre-tax net profit interest payments if a field goes into production that was discovered by an exploration well drilled within four years of closing on certain of the licenses then still held by Tiway. The sale of Toreador Turkey was completed on October 7, 2009 which resulted in a gain of $1.8 million.
On September 30, 2009, the Company entered into a Quota Purchase Agreement (the "Quota Purchase Agreement") with RAG (Rohöl-Aufsuchungs Aktiengesellschaft), a corporation organized under the laws of Austria ("RAG"), pursuant to which the Company agreed to sell 100% of its equity interests in Toreador Hungary Limited ("Toreador Hungary") to RAG for total consideration consisting of (1) a cash payment of US$5.4 million (€3.7 million) paid at closing, (2) US$435,000 (€300,000), which was held back subject to a post closing adjustment and was paid to us on November 5, 2009, and (3) a contingent payment of US$2.9 million (€2 million) to be paid upon post-transaction completion of agreements relating to certain assets of Toreador Hungary. The sale of Toreador Hungary was completed on September 30, 2009. The sale of Toreador Hungary resulted in a loss of $4.1 million.
The net book balances of oil and gas properties has been reclassified to oil and natural gas properties held for sale. The table below reflects the amount that was transferred to oil and gas properties held for sale:
| | | | | | | | | | | | | |
For the Year Ended | | Turkey | | Hungary | | Romania | | Total | |
|---|
December 31, 2008 | | $ | 74,740 | | $ | 17,219 | | $ | — | | $ | 91,959 | |
DEPRECIATION, DEPLETION AND AMORTIZATION
We provide depreciation, depletion and amortization of our investment in producing oil and natural gas properties on the units-of-production method, based upon independent reserve engineers' estimates of recoverable oil and natural gas reserves from the property. Depreciation expense for furniture, fixtures and equipment is leasehold improvements are amortized over shorter of its useful life or lease term generally calculated on a straight-line basis based upon estimated useful lives of three to seven years.
F-11
Table of Contents
TOREADOR RESOURCES CORPORATION
NOTES TO CONSOLIDATED FINANCIAL STATEMENTS — (Continued)
We evaluate producing property costs for impairment and reduce such costs to fair value if the sum of expected undiscounted future cash flows is less than net book value pursuant to the Financial Accounting Standards Board (FASB) Accounting Standard Codification (ASC) 360,"Property, Plant, and Equipment". We assess impairment of non-producing leasehold costs and undeveloped mineral and royalty interests periodically on a property-by-property basis. We charge any impairment in value to expense in the period incurred.
Impairment charged in 2009 for continuing operations was zero as compared to $2.3 million in 2008. The 2008 impairment was a result of the following:
(1) We recorded an impairment charge of $2 million for the undeveloped leasehold costs in Trinidad, due to management's decision to exit Trinidad and discontinue our association with our registered agent in the country.
(2) In April 2007, we sold our interest in ePsolutions for $3.4 million in cash and 50,000 shares of preferred stock with a value of $10.00 per share. Due to the rising cost of electricity and the deterioration of the deregulated electric market in Texas, ePsolutions has reduced their forecasted growth for the next several years. Accordingly, we reduced our carrying value of our investment in ePsolutions by $300,000 during 2008, which we believe more accurately reflects the current market value of this investment.
Impairment charged in 2009 for discontinued operations was $10.7 million as compared to $82.9 million in 2008. The 2009 impairment was a result of 1) the Company's decision not to proceed with the Kiha pipeline in Hungary $5.4 million and 2) the decline in the fair market value of the South Akcakoca Sub-basin assets in Turkey for $5.3 million. The 2008 impairment was due to:
(1) In 2008, the impairment charge in Turkey was a result of a decline in the fair market value of the Company's interest in South Akcakoca Sub-Basin assets. In June 2008, we determined the fair market value based on a Letter of Intent to sell a 26.75% interest in the South Akcakoca Sub-Basin assets to Petrol Ofisi AS for $80.3 million. This sale price indicated that the fair value of our 36.75% working interest was approximately $103.8 million. The net book value of the Black Sea asset at June 30, 2008 was $157.3 million, resulting in an impairment of $53.5 million.
(2) In January 2009, the Company and Petrol Ofisi agreed to a revised purchase price of $55 million. This resulted in an impairment on assets held for sale as of December 31, 2008, which is comprised of the 26.75% interest in the South Akcakoca Sub-basin assets, of $25.6 million.
(3) In December 2008, we incurred an additional $2.4 million impairment charge in Turkey for assets that were unrelated to the sale of South Akcakoca Sub-Basin assets. The impairment was a result of writing off an exploratory well where sufficient progress was not made to develop the area and a plan of development will not be prepared, by the operator, in the foreseeable future.
(4) When recording the acquisition of Madison Oil in 2002, we recorded $833,000 of goodwill associated with the Turkish assets. We periodically review the value of goodwill to determine if an impairment is required. The review at December 31, 2008, indicated that the total amount recorded for goodwill should be impaired. The reason for this impairment is due to the fair value of the Turkish subsidiary, based on the discounted present value of the oil and gas reserves being less than the carrying value of the Turkish subsidiary. This resulted in an impairment charge of $833,000.
(5) In December 2008, we recorded an impairment in Romania of $600,000 due to the net book value of the oil and natural gas properties exceeding future cash flows.
F-12
Table of Contents
TOREADOR RESOURCES CORPORATION
NOTES TO CONSOLIDATED FINANCIAL STATEMENTS — (Continued)
We account for our asset retirement obligations in accordance with FASB ASC 410,"Asset Retirement and Environmental Obligations", which requires us to record the fair value of a liability for an asset retirement obligation in the period in which it is incurred. When the liability is initially recorded, the entity capitalizes a cost by increasing the carrying amount of the related long-lived asset. Over time, the liability is accreted to its present value each period, and the capitalized cost is depreciated over the useful life of the related asset. Upon settlement of the liability, we either settle the obligation for its recorded amount or incur a gain or loss upon settlement.
The following table summarizes the changes in our asset retirement liability during the years ended December 31, 2009 and 2008:
| | | | | | | |
| | 2009 | | 2008 | |
|---|
| | (in thousands)
| |
|---|
Asset retirement obligation January 1 | | $ | 6,037 | | $ | 5,106 | |
Asset retirement accretion expense | | | 507 | | | 357 | |
Foreign currency exchange (gain) loss | | | 189 | | | (279 | ) |
Change in estimates | | | — | | | 1,213 | |
Property dispositions | | | — | | | (360 | ) |
| | | | | | |
Asset retirement obligation at December 31 | | $ | 6,733 | | $ | 6,037 | |
| | | | | | |
We account for goodwill in accordance with FASB ASC 350,"Intangibles — Goodwill and Other". Under ASC 350, goodwill and indefinite-lived intangible assets are not amortized but are reviewed annually (or more frequently if impairment indicators arise) for impairment. Separable intangible assets that are not deemed to have an indefinite life are amortized over their useful lives. At December 31, 2009 and 2008 we did not have any intangible assets that did not have an indefinite life.
We review annually at fiscal year end the value of goodwill recorded or more frequently if impairment indicators arise. We recognized $0, $883,000 and $0 goodwill impairment during 2009, 2008 and 2007 respectively. The impairment of goodwill in 2008 was due to the fair value of the Turkish subsidiary, based on the discounted present value of the oil and gas reserves being less than the carrying value of the Turkish subsidiary. Goodwill was adjusted $135,000 in 2009 and $222,000 in 2008 for the foreign currency translation adjustment. The balance of goodwill at December 31, 2009 and 2008 is approximately $4 million and $3.8 million, respectively.
Our French crude oil production accounts for substantially all of our sales. We sell our French crude oil to Total ("TOTAL"), and recognize the related revenues when the production is delivered to TOTAL's refinery, typically via truck. At the time of delivery to the plant, title to the crude oil transfers to TOTAL. The terms of the contract with TOTAL state that the price received for oil sold will be the arithmetic mean of all average daily quotations of Dated Brent published in Platt's Oil Market Wire for the month of production less a specified differential per barrel. The pricing of oil sales is done on the first day of the month following the month of production. In accordance with the terms of the contract, payment is made within six working days of the date of issue of the invoice. The contract with TOTAL is automatically extended for a period of one year unless either party cancels it in writing no later than six months prior to the beginning of the next year. We periodically review TOTAL's payment timing to ensure that receivables
F-13
Table of Contents
TOREADOR RESOURCES CORPORATION
NOTES TO CONSOLIDATED FINANCIAL STATEMENTS — (Continued)
from TOTAL for crude oil sales are collectible. In 2009, 2008 and 2007 sales to TOTAL represents approximately 98%, 99% and 99%, respectively, of the Company's total revenue and approximately 62% and 71% of the Company's accounts receivable at December 31, 2009 and 2008, respectively.
We recognize revenue for our remaining production when the quantities are delivered to or collected by the respective purchaser. Title to the produced quantities transfers to the purchaser at the time the purchaser collects or receives the quantities. Prices for such production are defined in sales contracts and are readily determinable based on certain publicly available indices. The purchasers of such production have historically made payment for crude oil and natural gas purchases within thirty and sixty days of the end of each production month, respectively. We periodically review the difference between the dates of production and the dates we collect payment for such production to ensure that receivables from those purchasers are collectible. Taxes associated with production are classified as lease operating expense.
We account for stock-based compensation in accordance with FASB ASC 718,"Compensation — Stock Compensation" ASC 718 establishes the accounting for transactions in which an entity pays for employee services in share-based payment transactions. ASC 718 requires companies to measure the cost of employee services received in exchange for an award of equity instruments based on the grant-date fair value of the award. The fair value of employee share options and similar instruments is estimated using option-pricing models adjusted for the unique characteristics of those instruments. That cost is recognized over the period during which an employee is required to provide service in exchange for the award.
The functional currency of the countries in which we operate is the U.S. dollar in the United States and the Euro in France. Gains and losses resulting from the translation of Euros into U.S. dollars are included in other comprehensive income for the current period. We periodically review the operations of our entities to ensure the functional currency of each entity is the currency of the primary economic environment in which we operate.
We are subject to income taxes in the United States and France. The current provision for taxes on income consists primarily of income taxes based on the tax laws and rates of the countries in which operations were conducted during the periods presented. All interest and penalties related to income tax is charged to general and administrative expense. We compute our provision for deferred income taxes using the liability method. Under the liability method, deferred income tax assets and liabilities are determined based on differences between financial reporting and income tax basis of assets and liabilities and are measured using the enacted tax rates and laws. The measurement of deferred tax assets is adjusted by a valuation allowance, if necessary, to reduce the future tax benefits to the amount, based on available evidence it is more likely than not deferred tax assets will be realized. We made a commitment to be fully reinvested in our international subsidiaries.
Effective January 1, 2007, we adopted the provisions of FASB ASC 740,"Income Taxes" relating to financial statement recognition and disclosure requirements for uncertain tax positions taken or expected to be taken in a tax return. Financial statement recognition of the tax position will be sustained upon examination, based on the technical merits of the position. Any interest and penalties related to uncertain tax positions are recorded as interest expense and general and administrative expenses, respectively.
F-14
Table of Contents
TOREADOR RESOURCES CORPORATION
NOTES TO CONSOLIDATED FINANCIAL STATEMENTS — (Continued)
We do not accrue for estimated legal fees or other related costs when accruing for loss contingencies, rather they are expensed as incurred.
Deferred debt issue costs are amortized on a straight line basis, which approximates the effective interest method over the term of the loan as a component of interest expense. Deferred debt issue costs, which are included in other assets, totaled approximately $2 million and $3.2 million net of accumulated amortization of $766,000 million and $608,000 as of December 31, 2009 and 2008, respectively.
At December 31, 2009 and 2008 we had 721,027 shares of treasury stock valued at a historical cost of approximately $2.5 million or $3.47 a share.
In December 2007, the Financial Accounting Standards Board (the "FASB") issued FASB Accounting Standards Codification (ASC) 805,"Business Combinations", formerly Statement No. 141R,"Business Combinations" ("SFAS No. 141R"). Under ASC 805, a company is required to recognize the assets acquired, liabilities assumed, contractual contingencies, and any contingent consideration measured at their fair value at the acquisition date. It further requires that research and development assets acquired in a business combination that have no alternative future use are to be measured at their acquisition-date fair value and then immediately charged to expense, and that acquisition-related costs are to be recognized separately from the acquisition and expensed as incurred. Among other changes, this statement also requires that "negative goodwill" be recognized in earnings as a gain attributable to the acquisition, and any deferred tax benefits resultant in a business combination be recognized in income from continuing operations in the period of the combination. ASC 805 is effective for business combinations for which the acquisition date is on or after the beginning of the first annual reporting period beginning after December 15, 2008. On January 1, 2009, the Company adopted ASC 805 and applies its provisions prospectively to business combinations that occur after adoption. The adoption did not have any immediate effect on the financial statements and related disclosures.
In December 2007, the FASB issued FASB Accounting Standards Codification (ASC) 810,"Consolidations", formerly Statement No. 160,"Non-controlling Interests in Consolidated Financial Statements" —an amendment of ARB No. 51 ("SFAS No. 160"). The Standard establishes accounting and reporting standards for the non-controlling interest in a subsidiary and for the deconsolidation of a subsidiary. It clarifies that a non-controlling interest in a subsidiary, which is sometimes referred to as minority interest, is an ownership interest in the consolidated entity that should be reported as equity in the consolidated financial statements. Among other requirements, this statement requires consolidated net income to be reported at amounts that include the amounts attributable to both the parent and the non-controlling interest. It also requires disclosure, on the face of the consolidated income statement, of the amounts of consolidated net income attributable to the parent and to the non-controlling interest. The Standard is effective for financial statements issued for fiscal years, and interim periods within those fiscal years, beginning after December 15, 2008. On January 1, 2009, the Company adopted ASC 810 and there was no effect on the financial statements and related disclosures.
In February 2008, the FASB issued FASB Accounting Standards Codification (ASC) 820,"Fair Value Measurements and Disclosures", formerly FSP No. 157-2 ("FASB No. 157-2") to defer the effective date to fiscal years beginning after November 15, 2008, and the interim periods within such fiscal years, for all
F-15
Table of Contents
TOREADOR RESOURCES CORPORATION
NOTES TO CONSOLIDATED FINANCIAL STATEMENTS — (Continued)
related nonfinancial assets and liabilities, including nonfinancial assets and liabilities measured at fair value in a business combination; impaired property, plant and equipment; goodwill; and initial recognition of asset retirement obligations. We adopted the deferred portion of the Standard effective January 1, 2009 and the adoption did not have a significant effect on the financial positions and results of operations. Refer to Note 14 of the financial statements for related disclosures.
In March 2008, the FASB issued FASB Accounting Standards Codification (ASC) 815,"Derivitives and Hedging", formerly Statement No. 161,"Disclosures about Derivative Instruments and Hedging Activities" — an Amendment of FASB Statement No. 133 ("SFAS No. 161"). This statement changes the disclosure requirements for derivative instruments and hedging activities. Entities are required to provide enhanced disclosures about (i) how and why an entity uses derivative instruments, (ii) how derivative instruments and related hedged items are accounted for and (iii) how derivative instruments and related hedged items affect an entity's financial position, financial performance, and cash flows. The Standard is effective for annual periods beginning after November 15, 2008. On January 1, 2009, the Company adopted the Standard.
In May 2008, the FASB issued FASB Accounting Standards Codification (ASC) 470,"Debt", formerly FASB Staff Position ("FSP") No. APB 14-1,"Accounting for Convertible Debt Instruments That May Be Settled in Cash Upon Conversion (Including Partial Cash Settlement)" ("FSP APB No. 14-1"). The Standard specifies that issuers of such instruments should separately account for the liability and equity components in a manner that will reflect the entity's nonconvertible debt borrowing rate when interest costs is recognized in subsequent periods. The Standard is effective for financial statements issued for fiscal years beginning after December 15, 2008 and interim periods within those fiscal years and should be applied retrospectively for all periods presented. On January 1, 2009, the Company adopted the Standard and there was no effect on our financial statements and related disclosures.
On December 31, 2008 the SEC issued the final rule,"Modernization of Oil and Gas Reporting" (the "Final Reporting Rule"). The Final Reporting Rule adopts revisions to the SEC's oil and gas reporting disclosure requirements and is effective for annual reports on Forms 10-K for years ending on or after December 31, 2009. The revisions are intended to provide investors with a more meaningful and comprehensive understanding of oil and gas reserves to help investors evaluate their investments in oil and gas companies. The amendments are also designed to modernize the oil and gas disclosure requirements to align them with current practices and changes in technology. Revised requirements in the Final Reporting Rule include, but are not limited to:
- •
- Oil and gas reserves must be reported using the un-weighted arithmetic average of the first day of the month price for each month within a 12 month period, rather than year-end prices;
- •
- Companies will be allowed to report, on an optional basis, probable and possible reserves;
- •
- Non-traditional reserves, such as oil and gas extracted from coal and shales, will be included in the definition of "oil and gas producing activities;"
- •
- Companies will be permitted to use new technologies to determine proved reserves, as long as those technologies have been demonstrated empirically to lead to reliable conclusions with respect to reserve volumes;
- •
- Companies will be required to disclose, in narrative form, additional details on their proved undeveloped reserves ("PUDs"), including the total quantity of PUDs at year end, and any material changes to PUDs that occurred during the year, investments and progress made to convert PUDs to developed oil and gas reserves and an explanation of the reasons why material concentrations of PUDs in individual fields or countries have remained undeveloped for five years or more after disclosure as PUDs; and
F-16
Table of Contents
TOREADOR RESOURCES CORPORATION
NOTES TO CONSOLIDATED FINANCIAL STATEMENTS — (Continued)
- •
- Companies will be required to report the qualifications and measures taken to assure the independence and objectivity of any business entity or employee primarily responsible for preparing or auditing reserves estimate.
We have complied with the disclosure requirements in our annual report on Form 10-K for the year ended December 31, 2009.
Application of the new reserves rules resulted in the use of lower prices at December 31, 2009 for crude oil than would have been used under the previous rules. Nonetheless, given the low decline and the maturity of the Neocomian Complex, which accounted for 93.31% of our proved reserves, once a certain threshold price is reached, use of a higher oil price does not have a significant effect on our reserves estimates. Because the prices used under the new reserves rules already exceed this threshold price, reserves under the new rules are identical to the reserves under the previous rules.
On April 9, 2009, the FASB issued FASB Accounting Standards Codification (ASC) 825,"Financial Instruments", formerly FASB Staff Position No. FAS 107-1 and APB 28-1,"Interim Disclosures about Fair Value of Financial Instruments" (FSP 107-1). The Standard requires disclosures about financial instruments, including fair value, carrying amount, and method and significant assumptions used to estimate the fair value. The Company adopted this standard as of June 30, 2009. Our adoption of this standard did not affect our financial position or results of operations.
In June 2009, the FASB issued Accounting Standards Update 2009-01,Amendments based on SFAS No. 168 — TheFASB Accounting Standards Codification™and the Hierarchy of Generally Accepted Accounting Principles to codify in ASC 105,Generally Accepted Accounting Principles, FASB Statement 168,The FASB Accounting Standards Codification™and the Hierarchy of Generally Accepted Accounting Principles, which was issued to establish the Codification as the sole source of authoritative U.S. GAAP recognized by the FASB, excluding SEC guidance, to be applied by nongovernmental entities. The guidance in ASC 105 is effective for financial statements issued for interim and annual periods ending after September 15, 2009. Applying the guidance in ASC 105 did not impact the Company's financial condition and results of operations. The Company has revised its references to pre-Codification GAAP in its financial statements.
In August 2009, the FASB issued ASU 2009-05,"Fair Value Measurements and Disclosures (Topic 820) — Measuring Liabilities at Fair Value" to provide guidance when estimating the fair value of a liability. When a quoted price in an active market for the identical liability is not available, fair value should be measured using:
- •
- the quoted price of an identical liability when traded as an asset,
- •
- quoted prices for similar liabilities or similar liabilities when traded as assets, or
- •
- another valuation technique consistent with the principles of Topic 820 such as an income approach or a market approach.
If a restriction exists that prevents the transfer of the liability, a separate adjustment related to the restriction is not required when estimating fair value. The Standard is effective for the first reporting period (including interim periods) beginning after issuance. The Company adopted this standard as of December 31, 2009. Our adoption of this standard did not affect our financial position or results of operations.
On January 6, 2010, the FASB issued ASU 2010-03, which aligns the FASB's oil and gas reserve estimation and disclosure requirements with the requirements in the SEC's Final Rule.
F-17
Table of Contents
TOREADOR RESOURCES CORPORATION
NOTES TO CONSOLIDATED FINANCIAL STATEMENTS — (Continued)
We adopted the Final Rule and ASU 2010-03 effective December 31, 2009 as a change in accounting principle that is inseparable from a change in accounting estimate. Such a change is accounted for prospectively under the authoritative accounting guidance. Comparative disclosures applying the new rules for periods before the adoption of ASU 2010-03 and the Final Rule are not required.
Our adoption of ASU 2010-03 and the Final Rule on December 31, 2009 impacted our financial statements and other disclosures in our annual report on Form 10-K for the year ended December 31, 2009, as follows:
- •
- All oil and gas reserves volumes presented as of and for the year ended December 31, 2009 were prepared using the updated reserves rules and are not on a basis comparable with prior periods. This change in comparability occurred because we estimated our proved reserves at December 31, 2009 using the updated reserves rules, which require use of the unweighted average first-day-of-the-month commodity prices for the prior twelve months, adjusted for market differentials, and permits the use of reliable technologies to support reserve estimates. Under the previous reserve estimation rules, which are no longer in effect, our net proved oil and gas reserves would have been calculated using end of period oil and gas prices. In addition, the new rules permit us to disclose probable and possible reserves (and we have so disclosed probable and possible reserves), which was not permitted under previous rules. Adoption of ASU 2010-03 and the Final Rule did not have any significant effect on our reserves estimate, however, standardized measure of discounted future net cash flows related to proved reserves decreased by approximately $23 million due to use of unweighted twelve month average price compare to year end price.
NOTE 3 — EARNINGS PER SHARE
In accordance with the provisions of FASB ASC 260,"Earnings per Share", basic earnings per share are computed on the basis of the weighted-average number of common shares outstanding during the
F-18
Table of Contents
TOREADOR RESOURCES CORPORATION
NOTES TO CONSOLIDATED FINANCIAL STATEMENTS — (Continued)
periods. Diluted earnings per share are computed based upon the weighted-average number of common shares plus the assumed issuance of common shares for all potentially dilutive securities.
| | | | | | | | | | | | | | | |
| | Year ended December 31, | |
|---|
| | 2009 | | 2008 | | 2007 | |
|---|
| | (in thousands, except per share data)
| |
|---|
Basic loss per share: | | | | | | | | | | |
| | Numerator | | | | | | | | | | |
| | | Loss from continuing operations, net of income tax | | $ | (15,332 | ) | $ | (7,020 | ) | $ | (4,548 | ) |
| | | Less: dividends on preferred shares | | | — | | | — | | | 162 | |
| | | | | | | | |
| | | Loss from continuing operations, net of tax | | | (15,332 | ) | | (7,020 | ) | | (4,710 | ) |
| | | Loss from discontinued operations, net of tax | | | (10,080 | ) | | (101,585 | ) | | (69,873 | ) |
| | | | | | | | |
| | | Loss available to common shares | | $ | (25,412 | ) | $ | (108,605 | ) | $ | (74,583 | ) |
| | | | | | | | |
| | Denominator | | | | | | | | | | |
| | | Common shares outstanding | | | 20,564 | | | 19,831 | | | 18,358 | |
| | | Basic loss available to common shares per share from: | | | | | | | | | | |
| | | | Continuing operations | | $ | (0.75 | ) | $ | (0.35 | ) | $ | (0.26 | ) |
| | | | Discontinued operations | | | (0.49 | ) | | (5.13 | ) | | (3.81 | ) |
| | | | | | | | |
| | | | Basic loss per share | | $ | (1.24 | ) | $ | (5.48 | ) | $ | (4.07 | ) |
| | | | | | | | |
Diluted loss per share: | | | | | | | | | | |
| | Numerator | | | | | | | | | | |
| | | Loss from continuing operations, net of income tax | | $ | (15,332 | ) | $ | (7,020 | ) | $ | (4,548 | ) |
| | | Less: dividends on preferred shares | | | — | | | — | | | 162 | |
| | | | | | | | |
| | | Loss from continuing operations, net of tax | | | (15,332 | ) | | (7,020 | ) | | (4,710 | ) |
| | | Loss from discontinued operations, net of tax | | | (10,080 | ) | | (101,585 | ) | | (69,873 | ) |
| | | | | | | | |
| | $ | (25,412 | ) | $ | (108,605 | ) | $ | (74,583 | ) |
| | | | | | | | |
| | Denominator | | | | | | | | | | |
| | | Common shares outstanding | | | 20,564 | | | 19,831 | | | 18,358 | |
| | | | Stock options, restricted stock and warrants | | | — | (1) | | — | (1) | | — | (1) |
| | | Conversion of preferred shares | | | — | (2) | | — | (2) | | — | (2) |
| | | Conversion of 5.0% notes payable | | | — | (3) | | — | (3) | | — | (3) |
| | | | | | | | |
| | | | Diluted shares outstanding | | | 20,564 | | | 19,831 | | | 18,358 | |
| | | | | | | | |
| | | | Diluted loss available to common shares per share from: | | | | | | | | | | |
| | | | | | Continuing operations | | $ | (0.75 | ) | $ | (0.35 | ) | $ | (0.26 | ) |
| | | | | | Discontinued operations | | | (0.49 | ) | | (5.13 | ) | | (3.81 | ) |
| | | | | | | | |
| | | | | | Diluted loss per share | | $ | (1.24 | ) | $ | (5.48 | ) | $ | (4.07 | ) |
| | | | | | | | |
| | | Anti-dilutive securities not included above are as follows: | | | | | | | | | | |
| | | | | Stock options, restricted stock and warrants | | | 37 | | | 25 | | | 148 | |
| | | | | Preferred shares | | | — | | | — | | | 450 | |
| | | | | 5% notes payable | | | 1,376 | | | 1,966 | | | 2,015 | |
- (1)
- Conversion of these securities would be antidilutive; therefore, there are no dilutive shares.
- (2)
- Conversion of these securities would be antidilutive; therefore there are no dilutive shares. These securities were converted on or prior to December 31, 2007.
- (3)
- Conversion of the 5% Senior Convertible Notes would be antidilutive therefore, there are no dilutive shares.
On February 12, 2010, the Company completed a registered underwritten public offering of 3,450,000 shares of common stock. Refer to Note 17, for subsequent events information.
F-19
Table of Contents
TOREADOR RESOURCES CORPORATION
NOTES TO CONSOLIDATED FINANCIAL STATEMENTS — (Continued)
NOTE 4 — ACCOUNTS RECEIVABLE
Accounts receivable consisted of the following:
| | | | | | | |
| | December 31, | |
|---|
| | 2009 | | 2008 | |
|---|
| | (in thousands)
| |
|---|
Accrued oil sales receivables | | $ | 2,072 | | $ | 752 | |
Recoverable VAT | | | 778 | | | — | |
Other accounts receivable | | | 276 | | | 306 | |
| | | | | | |
| | $ | 3,126 | | $ | 1,058 | |
| | | | | | |
Accrued oil sales receivables are due from purchasers of oil production from our French wells for which the Company owns an interest. Oil sales are generally unsecured and such amounts are generally due within 30 days after the month of sale.
Other receivables and VAT at December 31, 2009 and 2008 consist of accrued interest receivable on time deposits, value added tax refunds and travel advances to employees.
NOTE 5 — OIL AND NATURAL GAS PROPERTIES
Oil and Natural Gas Properties consist of the following:
| | | | | | | |
| | December 31, | |
|---|
| | 2009 | | 2008 | |
|---|
| | (in thousands)
| |
|---|
Licenses and concessions | | $ | 205 | | $ | 198 | |
Producing leaseholds and intangible drilling costs | | | 115,112 | | | 108,130 | |
Furniture, fixtures and office equipment | | | 1,118 | | | 2,200 | |
| | | | | | |
| | | 116,435 | | | 110,528 | |
Accumulated depreciation, depletion and amortization | | | (41,814 | ) | | (37,775 | ) |
| | | | | | |
Total oil and natural gas properties | | $ | 74,621 | | $ | 72,753 | |
| | | | | | |
The Company capitalizes exploratory well costs until a determination is made that the well has found proved reserves or is deemed noncommercial, in the latter case the well costs are immediately charged to exploration expense.
| | | | | | | |
| | December 31 | |
|---|
| | 2009 | | 2008 | |
|---|
| | (in thousands)
| |
|---|
Capitalized exploratory well cost, beginning of the year | | $ | — | | $ | 17,109 | |
Additions to capitalized exploratory costs pending determination of proved reserves | | | 2,887 | | | 377 | |
Reclassified to assets held for sale | | | — | | | (15,045 | ) |
Impairments | | | — | | | (2,441 | ) |
| | | | | | |
Capitalized exploratory well costs, end of year | | $ | 2,887 | | $ | — | |
| | | | | | |
F-20
Table of Contents
TOREADOR RESOURCES CORPORATION
NOTES TO CONSOLIDATED FINANCIAL STATEMENTS — (Continued)
The following table provides an aging of capitalized exploratory well costs (suspended well costs), as of December 31, of each year, based on the date the drilling was completed:
| | | | | | | |
| | December 31 | |
|---|
| | 2009 | | 2008 | |
|---|
| | (in thousands)
| |
|---|
Capitalized exploratory well cost that have been capitalized for a period of one year or less | | $ | 2,887 | | $ | — | |
Capitalized exploratory well costs that have been capitalized for a period greater than one year | | | — | | | — | |
| | | | | | |
Balance at end of year | | $ | 2,887 | | $ | — | |
| | | | | | |
NOTE 6 — INVESTMENTS IN UNCONSOLIDATED ENTITIES
In February 2004, we acquired 45% of ePsolutions. Based in Austin, Texas, ePsolutions is a software and energy services company in the electric industry and deregulated energy markets. ePsolutions is the developer of emPower system, a CIS, EDI and billing solution for energy companies within deregulated energy markets. We recorded equity in the earnings of ePsolutions of a gain of $41,000 in 2007 and a loss of $70,000 in 2006. In April 2007, we sold our interest in ePsolutions to ePsolutions for $3.9 million and recorded a gain on the sale of $2.3 million.
In July 2000, we acquired 35% of EnergyNet.com, Inc. ("EnergyNet"), an Internet based oil and natural gas property auction company. We recorded equity in the earnings of EnergyNet of a loss of $45,000 in 2007 and a gain of $340,000 in 2006. We received a dividend from EnergyNet of $175,000 in 2006. In April 2007, we sold our interest in EnergyNet.com to EnergyNet.com for $2 million and recorded a gain on the sale of $1.1 million.
In April 2000, we acquired a 50% interest in Capstone Royalty, LLC ("Capstone"), a joint venture formed to acquire mineral interests at county auctions in west Texas and develop those interests. We recorded equity in the earnings of Capstone amounting to $26,000 in 2007 and $131,000 in 2006. We received a distribution from Capstone of $60,000 in 2007 and $75,000 in 2006. In April 2007, we sold our interest in Capstone Royalty, LLC to Capstone Royalty, LLC for $250,000 and recorded a gain on the sale of $124,000.
NOTE 7 — LONG-TERM DEBT
Long-term debt consisted of the following:
| | | | | | | |
| | December 31, | |
|---|
| | 2009 | | 2008 | |
|---|
| | (in thousands)
| |
|---|
Secured revolving facility with the International Finance Corporation | | $ | — | | $ | 30,000 | |
5.00% convertible senior notes | | | 54,616 | | | 80,275 | |
| | | | | | |
| | | 54,616 | | | 110,275 | |
Less: current portion | | | (32,385 | ) | | (30,000 | ) |
| | | | | | |
| | $ | 22,231 | | $ | 80,275 | |
| | | | | | |
F-21
Table of Contents
TOREADOR RESOURCES CORPORATION
NOTES TO CONSOLIDATED FINANCIAL STATEMENTS — (Continued)
5.00% CONVERTIBLE SENIOR NOTES DUE OCTOBER 1, 2025
On September 27, 2005, we issued $75 million of 5.00% Convertible Senior Notes due October 1, 2025 ("Notes") to qualified institutional buyers pursuant to Rule 144A of the Securities Act of 1933. The Company also granted the initial purchasers the option to purchase an additional $11.25 million aggregate principal amount of Notes to cover over-allotments. The option was exercised on September 30, 2005. The total principal amount of Notes issued was $86.25 million and total net proceeds were approximately $82.2 million. We incurred approximately $4.1 million of costs associated with the issuance of the Notes; these costs have been recorded in other assets on the balance sheet and are being amortized to interest expense using the straight-line interest rate method over the term of the Notes.
The net proceeds were used for general corporate purposes, including funding a portion of the Company's 2005 and 2006 exploration and development activities.
The Notes bear interest at a rate of 5% per annum and can be converted into common stock at an initial conversion rate of 23.3596 shares of common stock per $1,000 principal amount of Notes, subject to adjustment in an event of a fundamental change, as defined, (equivalent to a conversion price of approximately $42.81 per share). The Company may redeem the Notes, in whole or in part, on or after October 6, 2008, and prior to October 1, 2010, for cash at a redemption price equal to 100% of the principal amount of Notes to be redeemed, plus any accrued and unpaid interest, if the closing price of its common stock exceeds 130% of the conversion price over a specified period. On or after October 1, 2010, the Company may redeem the Notes, in whole or in part, at a redemption price equal to 100% of the principal amount of Notes to be redeemed, plus any accrued and unpaid interest, irrespective of the price of our common stock. Holders may convert their Notes at any time prior to the close of business on the business day immediately preceding their stated maturity, and holders may, (i) upon the occurrence of certain fundamental changes, and also (ii) on October 1, 2010, October 1, 2015, and October 1, 2020, require the Company to repurchase all or a portion of their Notes for cash in an amount equal to 100% of the principal amount of such Notes, plus any accrued and unpaid interest. At December 31, 2009, the outstanding principal amount of the Notes was $54.6 million.
The registration rights agreement covering the Notes provided for a penalty if the registration statement was filed and declared effective but thereafter ceased to be effective (a "Suspension Period") for an aggregate of forty-five (45) days in any three month period or ninety (90) days in any twelve month period (an "Event Date"). Such penalty called for an additional 0.25% per annum in interest expense on the aggregate principal amount of the Notes for the first ninety (90) days following an Event Date and an additional 0.50% per annum in interest expense on the aggregate principal amount of the Notes thereafter, until such Suspension Period ended upon the registration statement again becoming effective or not being required to be effective pursuant to the registration rights agreement. Because we did not file our Quarterly Report on Form 10-Q for the nine month period ended September 30, 2006 in a timely manner, the registration statement for the Notes became ineffective and we entered a Suspension Period on November 15, 2006. Such Suspension Period ended on January 23, 2007 when we provided notice that the Form 10-Q had been filed and the Suspension Period was no longer in effect. Because the Suspension Period exceeded forty-five (45) days in any three month period, we paid approximately $14,375 in additional interest expense. On March 16, 2007, the date we filed our Form 10-K for the year ended December 31, 2006, we again entered a Suspension Period until all the Notes became eligible for sale pursuant to Rule 144(k) on September 30, 2007. On October 1, 2007, $155,000 was deposited with the trustee for the Notes as the penalty for any holders of the Notes who were eligible on October 1, 2007 to receive a pro rata portion of such payment. Such eligible holders had to have registered their Notes on the registration statement and still held those Notes on October 1, 2007. On April 1, 2008, we requested that the trustee return $150,957 which represents the unclaimed portion of the penalty and on April 3, 2008 we
F-22
Table of Contents
TOREADOR RESOURCES CORPORATION
NOTES TO CONSOLIDATED FINANCIAL STATEMENTS — (Continued)
received the funds from the trustee. In 2008 we paid $4,043 of the penalty deposit to eligible holders of Notes.
During 2008 the Company repurchased $6 million, face value, of the Notes on the open market for $5.3 million. This resulted in a gain on the early extinguishment of debt totaling $458,000. In 2009 the Company repurchased $25.7 million face value of the Notes on the open market for $21.3 million, resulting in a gain on the early extinguishment of debt of $3.4 million after writing off deferred loan costs of approximately $1 million.
On February 1, 2010, Toreador consummated an exchange transaction, or the Convertible Notes Exchange. In the Convertible Notes Exchange, in exchange for (a) $22,231,000 principal amount of our outstanding 5.00% Convertible Senior Notes due 2025, or the Old Notes, and (b) $9.4 million cash, we issued $31,631,000 aggregate principal amount of our 8.00%/7.00% Convertible Senior Notes due 2025, or the New Convertible Senior Notes, and paid accrued and unpaid interest on the Old Notes.
The New Convertible Senior Notes may be redeemed in whole or in part at the Company's option prior to October 1, 2013, in cash at a redemption price equal to one hundred percent (100%) of the principal amount of the New Convertible Senior Notes redeemed, plus accrued and unpaid interest, if any, to, but excluding, the redemption date plus a make-whole payment, if the closing sale price of the Company's common stock has exceeded 200% of the conversion price then in effect for at least twenty (20) trading days in any consecutive thirty (30)-trading day period ending on the trading day prior to the date of mailing of the relevant notice of redemption. The New Convertible Senior Notes may be redeemed in whole or in part at the Company's option on or after October 1, 2013 for cash at a redemption price equal to 100% of the principal amount of the New Convertible Senior Notes redeemed, plus any accrued and unpaid interest to, but excluding, the redemption date. In addition, upon the occurrence of certain fundamental changes, and on each of October 1, 2013, October 1, 2015 and October 1, 2020, a holder may require the Company to repurchase all or a portion of the New Convertible Senior Notes in cash for 100% of the principal amount of the New Convertible Senior Notes to be purchased, plus any accrued and unpaid interest to, but excluding, the purchase date. See Note 17 (Subsequent Events) of Notes to the Consolidated Financial Statements.
On December 28, 2006, we guaranteed the obligations of certain of our direct and indirect subsidiaries in a loan and guarantee agreement with the International Finance Corporation. The loan and guarantee agreement provides for the $25 million loan facility which is a secured revolving facility with a maximum facility amount of $25 million which maximum facility amount would have increase to $40 million when the projected total borrowing base amount exceeded $50 million. The $25 million facility was funded on March 2, 2007. The total proceeds received on March 2, 2007 were approximately $25 million, of which $11 million was used to retire the outstanding balance on the $15 million credit facility with Natixis Banques Populaires and the remaining $14 million of funds was used to finance our capital expenditures in Turkey and Romania. The loan and guarantee agreement also provided for a $10 million facility which was funded on December 28, 2006. In September 2007, we repaid $5 million on the $25 million facility from proceeds received on the U.S. oil and gas property sale. As of December 31, 2007, the International Finance Corporation reduced our borrowing base under both loans to $30 million from $35 million. Both the $25 million facility and $10 million facility were to fund our operations in Turkey and Romania.
Interest accrued on any loans under the $25 million facility at a rate of 2% over the six month LIBOR rate. Interest accrued on the $10 million facility at a rate of 1.5% over the six month LIBOR rate until the $25 million facility was funded after which the rate for the $10 million facility was lowered to 0.5% over the six month LIBOR rate. At December 31, 2008, the interest rate on the $10 million facility was 2.823% and
F-23
Table of Contents
TOREADOR RESOURCES CORPORATION
NOTES TO CONSOLIDATED FINANCIAL STATEMENTS — (Continued)
the interest rate on the $25 million facility was 4.323%. Interest was to be paid on each June 15 and December 15.
The $25 million facility was secured as follows: (i) the lender has a first ranking security interest in (a) certain proceeds, receivables and contract rights relating to and from the sale of oil or gas production in France, Turkey and Romania and (b) funds held in certain bank accounts; (ii) the lender had an assignment of all rights and claims to any compensation or other special payments in respect of all concessions other than those arising in the normal course of operations payable by the government of Turkey and Romania; and (iii) the lender has a first ranking pledge (a) by Toreador International Holding, LLC of all its shares in the borrowers; (b) by Madison Oil France SAS of all its shares in Toreador France; and (c) by the Company of all its shares in Toreador International Holding, LLC.
On December 31, 2011, the maximum amount available under the $25 million facility would have begun to decrease by $5 million every six months from $40 million (assuming the projected borrowing base amount exceeds $50 million) until the final portion of the $25 million facility would have been due on December 15, 2014. On December 15, 2014, $5 million of the $10 million facility would have been required to be repaid with the remaining $5 million being due on June 15, 2015.
We were required to meet the following ratios on a consolidated basis: (i) the life of loan coverage ratio of not less than: (a) 1.2:1.0 in 2006 and 2007; (b) 1.3:1.0 in 2008; and (c) 1.4:1.0 in 2009 and each subsequent year thereafter; (ii) reserve tail ratio of not less than 25%; (iii) adjusted financial debt to EBITDAX (earnings before interest, taxes, depreciation and amortization and exploration expenses) ratio of not more than 3.0:1.0; (iv) liabilities to tangible net worth ratio of not more than 60:40; and (v) interest coverage ratio of not less than 3.0:1.0. On August 9, 2007, the ratios were amended to replace the adjusted financial debt to EBITDA ratio not being more than 3.0:1.0 with the adjusted financial debt to EBITDAX ratio not being more than 3.0:1.0 and the definition of interest coverage ratio was adjusted to substitute EBITDAX instead of EBITDA for calculation purposes. At December 31, 2007, we were not in compliance with the interest coverage ratio of not less than 3.0:1.0; the actual ratio was 2.8:1.0. The International Finance Corporation granted the Company a temporary waiver for the interest coverage ratio provided the Company maintained EBITDAX to net interest expense ratio of 2.7:1.0 until July 2, 2008 and EBITDA to net interest expense ratio of at least 2.7:1.0 during the remaining period of the waiver's effectiveness. The waiver was effective until March 8, 2009.
At March 31, 2008, we were not in compliance with the adjusted financial debt to EBITDAX ratio threshold of not more than 3.0:1.0; the actual ratio was 4.5:1.00. The International Finance Corporation granted the Company a temporary waiver on the condition that the Company maintains the adjusted financial debt to EBITDA ratio for the (i) quarter ending March 31, 2008 of 4.5:1.0; (ii) quarter ending June 30, 2008 of 4.0:1.0; (iii) quarter ending September 30, 2008 of 3.5:1.0, and (iv) quarter ending December 31, 2008 of 3.25:1.0. We must also be compliant with the original requirement of adjusted financial debt to EBITDA of not more than 3.0:1.0 starting from the end of the first quarter ending March 31, 2009. The waiver is effective until April 1, 2009.
At December 31, 2008, we were not in compliance with the liabilities to tangible net worth ratio, however we did not request a waiver from the IFC as the facility was subsequently retired on March 3, 2009 as explained below.
We were subject to certain negative covenants, including, but not limited to, the following: (i) subject to certain exceptions, paying dividends; (ii) subject to certain exceptions, incurring debt, making guarantees or creating or permitting to exist any liens, (iii) subject to certain exceptions, making or permitting to exist loans or advances to, or deposits, with other persons or investments in any person or enterprise; (iv) subject to certain exceptions, selling, transferring, leasing or otherwise disposing of all or a
F-24
Table of Contents
TOREADOR RESOURCES CORPORATION
NOTES TO CONSOLIDATED FINANCIAL STATEMENTS — (Continued)
material part of our borrowing base assets; and (v) subject to certain exceptions, undertaking or permitting any merger, spin-off, consolidation or reorganization.
Included in interest expense for the year ended December 31, 2008, is $701,625 of additional compensation due to the IFC related to the prior year. This amount should have been recognized as additional interest expense in the prior year. Management does not believe the error had a material effect on the financial results for the year ended December 31, 2007 or that the correction of the error in the current period will have a material effect on the financial results for the year ended December 31, 2008. Also included in interest expense for the year ended December 31, 2008 is an estimate of $2.1 million to be paid in 2009 relating to 2008 operations.
On March 3, 2009, we repaid the Secured Revolving Credit Facility with the International Finance Corporation with the proceeds from our sale of 26.75% of our 36.75% interest in the Black Sea Project. The total amount of the payment was $36.4 million, which was comprised of $30 million principal, $5.9 million additional compensation, as defined in the Loan and Guarantee Agreement among Toreador Resources Corporation and the International Finance Corporation dated December 28, 2006, due under the $10 million facility and $500,000 for accrued interest and fees. As a result of the early extinguishment, we recorded a loss of $4.9 million which was recorded in discontinued operations for the year ended December 31, 2009.
The following table summarizes the principal maturities under our long-term debt arrangements at December 31, 2009, (in thousands):
| | | | | | | | | | | | | | | | | | | | | | |
| | 2010 | | 2011 | | 2012 | | 2013 | | 2014 | | Thereafter | | Total | |
|---|
Long-term debt | | $ | 32,385 | | $ | — | | $ | — | | $ | 22,231 | | | | | $ | — | | $ | 54,616 | |
| | | | | | | | | | | | | | | | |
NOTE 8 — CAPITAL
On March 23, 2007, we closed a $45 million private placement of equity. In the transaction, we issued an aggregate of 2,710,843 shares of common stock to six institutional investors, providing us with $45 million of gross proceeds at closing. We also granted the investors the right to purchase an additional $8.1 million aggregate amount of common stock within the next 30-day period. On April 24, 2007, two of the institutional investors exercised their warrants for an aggregate of 326,104 additional shares of common stock, providing us with approximately $5.4 million of gross proceeds. The net proceeds from the private placement totaled approximately $47 million and were used to help fund our 2007 exploration and development activities.
In connection with the private placement, we entered into a registration rights agreement with the investors. The registration rights agreement provided that we would file a registration statement with the Securities and Exchange Commission covering the resale of the common stock within 60 days after the closing date. If the registration statement was not filed with the Securities and Exchange Commission within such time, we had to pay 1.0% of the aggregate purchase price, an additional 1.0% on the one month anniversary of the 60th day after closing if the registration statement had not been filed by such date and an additional 2.0% of the aggregate purchase price for each 30 day period after the one month anniversary if the registration statement was not filed by such date. We filed the registration statement with the Securities and Exchange Commission on May 8, 2007. If the registration statement was not declared effective by the Securities and Exchange Commission within 150 days after the closing date, we had to pay 1.0% of the aggregate purchase price, an additional 1.0% on the one month anniversary of the 150th day after the closing if the registration statement had not been declared effective by the Securities and Exchange Commission by such date and an additional 2.0% of the aggregate purchase price for each
F-25
Table of Contents
TOREADOR RESOURCES CORPORATION
NOTES TO CONSOLIDATED FINANCIAL STATEMENTS — (Continued)
30 day period after the one month anniversary if the registration statement was not declared effective by such date. The registration statement was declared effective July 26, 2007. Now that the registration statement has been declared effective by the Securities and Exchange Commission, if, subject to certain exceptions, future sales cannot be made pursuant to the registration statement after 60 days has elapsed, we must pay 1.0% of the aggregate purchase price on the date sales cannot be made pursuant to the registration statement, an additional 1% on the one month anniversary of the date sales are not permitted under the registration statement if sales are not permitted under the registration statement by such date and an additional 2.0% of the aggregate purchase price for each 30 day period after the one month anniversary if sales under the registration statement are not permitted by such date. Any one month or 30 day periods during which we cure the violation will cause the payment for such period to be made on a pro rata basis. As a result of the change in the resale restrictions under Rule 144, effective February 15, 2008, we amended the registration rights agreement to provide that we do not have to keep the registration statement effective if the holders of the shares covered by the registration rights agreement can sell all of the shares pursuant to Rule 144.
We account for registration rights agreements containing a contingent obligation to make future payments or otherwise transfer consideration under a registration payment arrangement. Under this approach, the contingent obligation to make future payments or otherwise transfer consideration under a registration payment arrangement shall be recognized and measured separately in accordance with FASB ASC 450"Contingencies".
Toreador had zero shares of nonvoting Series A-1 Convertible Preferred Stock outstanding at December 31, 2009, 2008 and 2007. At the option of the holder, the Series A-1 Convertible Preferred Stock were convertible into common shares at a price of $4.00 per common share (conversion would amount to 450,000 Toreador common shares at December 31, 2007). The Series A-1 Convertible Preferred Stock accrues dividends at an annual rate of $2.25 per share payable quarterly in cash. At any time on or after November 1, 2007, we could elect to redeem for cash any or all shares of Series A-1 Convertible Preferred Stock. The optional redemption price per share was the sum of (1) $25.00 per share of the Series A-1 Convertible Preferred Stock plus (2) any accrued unpaid dividends, and such sum was multiplied by a declining multiplier. The multiplier was 105% until October 31, 2008, 104% until October 31, 2009, 103% until October 31, 2010, 102% until October 31, 2011, 101% until October 31, 2012, and 100% thereafter. In December 2007, all the Series A-1 Convertible Preferred Stock was converted into common shares.
On July 22, 2004, we issued warrants for the purchase of 40,000 shares of our common stock at $8.20 per share. The warrant was issued pursuant to the terms of the letter agreement dated July 19, 2004. At December 31, 2009 there were zero warrants outstanding due to their expiration on July 22, 2009.
On July 11, 2005, we issued warrants for the purchase of 50,000 shares of our common stock at $27.40 per share. The warrants were issued pursuant to the terms of the Fee Letter, dated February 21, 2005, between the Company, Natexis Banques Populaires and Madison Energy France. At December 31, 2009 there were zero outstanding due to their expiration on December 23, 2009.
On January 3, 2006, we issued warrants for the purchase of 10,000 shares of our common stock at $27.65 per share. The warrant was issued pursuant to the terms of the Engagement Letter, dated January 3, 2006, between the Company and ParCon Consulting. At December 31, 2009 all 10,000 warrants were outstanding and expire on January 3, 2011.
For the twelve months ended December 31, 2009, the Company issued 1,289,387 shares of stock to employees and directors, of which 939,597 shares were immediately vested in accordance with the terms of the grants and 31,000 stock options, were exercised under the terms of the option agreements. Forfeitures for the twelve months ended December 31, 2009 were 168,292 shares of restricted stock and 150,000 stock options.
F-26
Table of Contents
TOREADOR RESOURCES CORPORATION
NOTES TO CONSOLIDATED FINANCIAL STATEMENTS — (Continued)
NOTE 9 — INCOME TAXES
The Company's provision (benefit) for income taxes consists of the following at December 31:
| | | | | | | | | | | | |
| | 2009 | | 2008 | | 2007 | |
|---|
| | (in thousands)
| |
|---|
Current: | | | | | | | | | | |
| | U.S. Federal | | $ | (388 | ) | $ | (5 | ) | $ | (31 | ) |
| | U.S. State | | | 0 | | | (115 | ) | | 323 | |
| | Foreign | | | (1,030 | ) | | 7,526 | | | 2,409 | |
Deferred: | | | | | | | | | | |
| | U.S. Federal | | | (19 | ) | | (443 | ) | | (32 | ) |
| | Foreign | | | 987 | | | (887 | ) | | (3,393 | ) |
| | | | | | | | |
| | $ | (450 | ) | $ | 6,076 | | $ | (724 | ) |
| | | | | | | | |
The tax provision (benefit) has been allocated between continuing operations and discontinued operations as follows: | | | | | | | | | | |
Provision (benefit) allocated to: | | | | | | | | | | |
| | | Continuing operations | | $ | (450 | ) | $ | 5,502 | | $ | (1,402 | ) |
| | | Discontinued operations | | | — | | | 574 | | | 678 | |
| | | | | | | | |
| | $ | (450 | ) | $ | 6,076 | | $ | (724 | ) |
| | | | | | | | |
The primary reasons for the difference between tax expense at the statutory federal income tax rate and our provision for income taxes were:
| | | | | | | | | | |
| | 2009 | | 2008 | | 2007 | |
|---|
| | (in thousands)
| |
|---|
Statutory tax at 34% | | $ | (8,675 | ) | $ | (34,860 | ) | $ | (25,549 | ) |
Rate differences related to foreign operations | | | 150 | | | 13,706 | | | 6,479 | |
Utilization of foreign net operating loss | | |
(286 |
) | |
— | | |
— | |
State income tax, net | | | — | | | (76 | ) | | 213 | |
Foreign currency gain (loss) not taxable in foreign jurisdictions | | | (1,978 | ) | | 498 | | | 4,497 | |
Release of FIN 48 liability | | | (314 | ) | | — | | | — | |
Adjustments to valuation allowance | | | 11,133 | | | 26,440 | | | 14,172 | |
Other | | | (480 | ) | | 368 | | | (536 | ) |
| | | | | | | | |
| | $ | (450 | ) | $ | 6,076 | | $ | (724 | ) |
| | | | | | | | |
F-27
Table of Contents
TOREADOR RESOURCES CORPORATION
NOTES TO CONSOLIDATED FINANCIAL STATEMENTS — (Continued)
The tax effects of temporary differences that give rise to significant portions of the deferred tax assets and deferred tax liabilities as of December 31, 2009 and 2008 were as follows:
| | | | | | | | | | |
| | December 31, | |
|---|
| | 2009 | | 2008 | |
|---|
| | (in thousands)
| |
|---|
Deferred tax assets: | | | | | | | |
| | Net operating loss carryforward — United States | | $ | 31,029 | | $ | 15,005 | |
| | Net operating loss carryforward — State | | | 0 | | | 135 | |
| | Net operating loss carryforward — Foreign | | | — | | | 9,617 | |
| | Restricted stock | | | 370 | | | 565 | |
| | Impairment — Foreign | | | — | | | 16,468 | |
| | Impairment — US | | | — | | | 5,453 | |
| | Other | | | 114 | | | 690 | |
| | | | | | |
| | | Gross deferred tax assets | | | 31,513 | | | 47,933 | |
| | Valuation allowance | | | (31,513 | ) | | (46,984 | ) |
| | | | | | |
| | | Net deferred tax assets | | $ | 0 | | $ | 949 | |
| | | | | | |
Deferred tax liabilities: | | | | | | | |
| | Differences in oil and gas property capitalization and depletion methods — Foreign | | | (15,358 | ) | | (13,851 | ) |
| | Other | | | 0 | | | (949 | ) |
| | | | | | |
| | | Gross deferred tax liabilities | | | (15,358 | ) | | (14,800 | ) |
| | | | | | |
| | | | Net deferred tax liabilities | | $ | (15,358 | ) | $ | (13,851 | ) |
| | | | | | |
At December 31, 2009, Toreador had the following carryforwards available to reduce future taxable income (in thousands):
| | | | | | | |
Jurisdiction | | Expiry | | Amount | |
|---|
United States | | | 2010 — 2023 | | $ | 91,262 | |
F-28
Table of Contents
TOREADOR RESOURCES CORPORATION
NOTES TO CONSOLIDATED FINANCIAL STATEMENTS — (Continued)
Realization of net operating loss carryforwards depends on our ability to generate taxable income within the carryforward period. Due to uncertainty related to the Company's ability to generate taxable income in the respective countries sufficient to realize all of our deferred tax assets we have recorded the following valuation allowances:
| | | | | | | |
| | December 31, | |
|---|
| | 2009 | | 2008 | |
|---|
| | (in thousands)
| |
|---|
United States | | $ | 31,029 | | $ | 15,005 | |
Turkey | | | — | | | 2,591 | |
Hungary | | | — | | | 6,185 | |
France | | | | | | 841 | |
| | | | | | |
| | $ | 31,029 | | $ | 24,622 | |
| | | | | | |
Future net operating loss carryforwards for which a valuation allowance has been provided will be realized when taxable income amounts below are generated in the following countries:
| | | | |
| | Required
Taxable Income | |
|---|
United States | | $ | 91,262 | |
Under FASB ASC 740, "Income Taxes", we have elected to treat our foreign earnings as permanently reinvested outside the US and are not providing US tax expense on those earnings. However, Romania and Turkey both have US branches which are not permanently reinvested outside the US. Consequently the US tax on their earnings is reflected in consolidated income tax expense at the US tax rate of 34%.
We adopted provisions of FASB ASC 740, "Income Taxes" relating to uncertain tax positions, on January 1, 2007. As a result of the adoption the Company recognized an increase in the liability for unrecognized tax benefits of approximately $45,000, which was accounted for as a decrease to the January 1, 2007 balance of retained earnings. As of the date of adoption and after the impact of recognizing the increase in liability noted above, our unrecognized tax benefits totaled approximately $357,000, the disallowance of which would not materially affect the effective income tax rate.
We recognize potential accrued interest and penalties related to unrecognized tax benefits within our global operations in income tax expense. In conjunction with the adoption of provisions relating to uncertain tax provisions, we recognized approximately $28,000 for the accrual of interest and penalties at January 1, 2007 which is included as a component of $357,000 unrecognized tax benefit noted above. During the year 2009 we recognized $0 in potential interest and penalties associated with uncertain tax positions. To the extent interest and penalties are not assessed with respect to uncertain tax positions, amounts accrued will be reduced and reflected as a reduction of the overall income tax provision.
The following table summarizes the changes in our liability for unrecognized tax benefits for the year ended December 31, 2009:
| | | | |
Unrecognized tax benefit at January 1, 2009 | | $ | 321 | |
Tax Year Closed | | | (314 | ) |
| | | | |
Unrecognized tax benefit at December 31, 2009 | | $ | 7 | |
| | | | |
F-29
Table of Contents
TOREADOR RESOURCES CORPORATION
NOTES TO CONSOLIDATED FINANCIAL STATEMENTS — (Continued)
We have not paid any significant interest or penalties associated with our income taxes, but classify both interest expense and penalties as part of our income tax expense.
The Company files several state and foreign tax returns, many of which remain open for examination for five years.
For the years ended December 31, 2009 and 2008 we recognized a current tax benefit related to restricted stock grants of approximately $0 and $0 and a deferred tax liability and a deferred tax benefit of approximately $21,000 and $443,000, respectively.
NOTE 10 — BENEFIT PLANS
In 2009 we terminated our 401(k) retirement savings plan due to the Company closing the Dallas, Texas office and relocating to Paris France. Employees were eligible to defer portions of their salaries, limited by Internal Revenue Service regulations. The Company is subject to the 3% safe harbor rule and contributed $37,701 in 2009, $95,000 in 2008 and $115,000 in 2007. Discretionary employer matches are determined annually by the board of directors and such discretionary matches amounted to $0 in 2009, $0 in 2008 and $112,500 in 2007.
NOTE 11 — STOCK COMPENSATION PLANS
We have granted stock options to key employees and outside directors of Toreador as described below.
In May 1990, we adopted the 1990 Stock Option Plan ("1990 Plan"). The 1990 Plan, as amended and restated, provides for grants of up to 1,000,000 stock options to employees and directors at exercise prices greater than or equal to market on the date of the grant.
In December 2001, we adopted the 2002 Stock Option Plan ("2002 Plan"). The 2002 Plan provides for grants of up to 500,000 stock options to employees and outside directors at exercise prices greater than or equal to market on the date of the grant.
In September 1994, we adopted the 1994 Non-employee Director Stock Option Plan ("1994 Plan"). The 1994 Plan, as amended and restated, provides for grants of up to 500,000 stock options to non-employee directors of Toreador at exercise prices greater than or equal to market on the date of the grant.
The Board of Directors grants options under our plans periodically. Generally, option grants are exercisable in equal increments over a three-year period, and have a maximum term of 10 years.
F-30
Table of Contents
TOREADOR RESOURCES CORPORATION
NOTES TO CONSOLIDATED FINANCIAL STATEMENTS — (Continued)
A summary of stock option transactions is as follows:
| | | | | | | | | | | | | | | | | | | |
| | 2009 | | 2008 | | 2007 | |
|---|
| | Shares | | Weighted
Average
Exercise
Price | | Shares | | Weighted
Average
Exercise
Price | | Shares | | Weighted
Average
Exercise
Price | |
|---|
Outstanding at January 1 | | | 248,370 | | $ | 6.77 | | | 338,170 | | $ | 4.85 | | | 673,870 | | $ | 5.13 | |
Granted | | | — | | | — | | | 100,000 | | | 7.88 | | | — | | | — | |
Exercised | | | (31,000 | ) | | 3.67 | | | (189,800 | ) | | 3.93 | | | (320,700 | ) | | 5.06 | |
Forfeited | | | (150,000 | ) | | 6.96 | | | — | | | — | | | (15,000 | ) | | 13.18 | |
| | | | | | | | | | | | | | | | | |
Outstanding at December 31 | | | 67,370 | | | 7.78 | | | 248,370 | | | 6.77 | | | 338,170 | | | 4.85 | |
| | | | | | | | | | | | | | | | | |
Exercisable at December 31 | | | 67,370 | | | 7.78 | | | 148,370 | | | 6.02 | | | 334,837 | | | 4.73 | |
| | | | | | | | | | | | | | | | | |
The intrinsic value of the options exercised in 2009 was zero. For the year ended December 31, 2009, 2008 and 2007 we received cash from stock option exercises of $113,875, $745,000 and $1.6 million, respectively. As of December 31, 2009, all outstanding options were 100% vested. As of December 31, 2009, the total compensation cost related to non-vested stock options not yet recognized was zero.
The following table summarizes information about the fixed price stock options outstanding at December 31, 2009:
| | | | | | | | | | | | | | | | |
| | Number Outstanding | | Number Exercisable | |
| |
|---|
| | Weighted Average
Remaining
Contractual
Life in Years | |
|---|
Exercise Price | | Shares | | Intrinsic
Value | | Shares | | Intrinsic
Value | |
|---|
| |
| | (in thousands)
| |
| | (in thousands)
| |
| |
|---|
3.10 | | | 5,000 | | $ | 34 | | | 5,000 | | $ | 34 | | | 3.47 | |
3.12 | | | 4,420 | | | 30 | | | 4,420 | | | 30 | | | 0.72 | |
5.50 | | | 40,450 | | | 178 | | | 40,450 | | | 178 | | | 4.32 | |
13.75 | | | 7,500 | | | (29 | ) | | 7,500 | | | (29 | ) | | 4.88 | |
16.90 | | | 10,000 | | | (70 | ) | | 10,000 | | | (70 | ) | | 5.38 | |
| | | | | | | | | | | | | |
| | | 67,370 | | $ | 143 | | | 67,370 | | $ | 143 | | | 3.75 | |
| | | | | | | | | | | | | |
At December 31, 2009, there were 20,208 remaining shares available for grant under the plans collectively.
In May 2005, stockholders approved the Toreador Resources Corporation 2005 Long-Term Incentive Plan (the "Plan"). The Plan, as amended, authorizes the issuance of up to 1,750,000 shares of the Company's common stock to key employees, key consultants and outside directors of the Company. In 2009 the Board of Directors authorized a total of 1,289,387 shares of restricted stock be granted to employees and non-employee directors. The compensation cost is measured by the difference between the quoted market price of the stock at the date of grant and the price, if any, to be paid by an employee and is recognized as an expense over the period the recipient performs related services. The restricted stock grants vest immediately or up to a four-year period depending on the grant and the weighted average price of the stock on the date of the grants was $5.46 for the year ended December 31, 2009. Stock compensation expense of $4.7 million and $2.3 million is included in the Statement of Operations for the years ended
F-31
Table of Contents
TOREADOR RESOURCES CORPORATION
NOTES TO CONSOLIDATED FINANCIAL STATEMENTS — (Continued)
December 31, 2009 and 2008, which represents the cost recognized from the date of the grants through December 31, 2009 and 2008. During 2009, 1,021,189 shares vested having a fair value of approximately $5.1 million on the date of vesting. As of December 31, 2009, the total compensation cost related to non-vested restricted stock grants not yet recognized is approximately $3.2 million. This amount will be recognized as compensation expense over the next 36 months.
At December 31, 2009, there were 106,171 remaining shares available for grant under the Plan.
For the years ended December 31, 2009 and 2008 we recognized a current tax benefit related to restricted stock grants of approximately $0 and $0, respectively, and a deferred tax liability and a deferred tax benefit of approximately $21,000 and $443,000, respectively.
The following table summarizes the changes in outstanding restricted stock grants along with their related grant-date fair values for the year ended December 31, 2009:
| | | | | | | |
| | Shares | | Weighted Average
Grant-Date
Fair Value | |
|---|
Non-vested at January 1, 2009 | | | 278,224 | | $ | 11.63 | |
Shares granted | | | 1,289,387 | | | 5.46 | |
Shares vested | | | (1,021,189 | ) | | 6.27 | |
Shares forfeited | | | (168,292 | ) | | 7.33 | |
| | | | | | | |
Non-vested at December 31, 2009 | | | 378,130 | | $ | 10.25 | |
| | | | | | | |
NOTE 12 — COMMITMENTS AND CONTINGENCIES
We lease our office space under non-cancelable operating leases, expiring during 2010 through 2014. The following is a schedule of minimum future rentals under our non-cancelable operating leases as of December 31, 2009 (in thousands):
| | | | | | | | | | |
| | Rent
Expense | | Sub-lease
Income | | Net Rental
Expense | |
|---|
2010 | | $ | 565 | | $ | (208 | ) | $ | 357 | |
2011 | | | 571 | | | (208 | ) | | 363 | |
2012 | | | 575 | | | (156 | ) | | 419 | |
2013 | | | 576 | | | — | | | 576 | |
2014 | | | 460 | | | — | | | 460 | |
| | | | | | | | |
| | $ | 2,747 | | $ | (572 | ) | $ | 2,175 | |
| | | | | | | | |
Net rent expense totaled $442,144 in 2009, $952,000 in 2008 and $818,000 in 2007.
In 2005, two separate incidents occurred offshore Turkey in the Black Sea, which resulted in the sinking of two caissons (the "Fallen Structures") and the loss of three natural gas wells. The Company has not been requested to or ordered by any governmental or regulatory body to remove the caissons. Therefore, the Company believes that the likelihood of receiving such a request or order is remote and no liability has been recorded. In connection with the Company's sale of its 26.75% interest in the SASB to Petrol Ofisi in March 2009 and its sale of Toreador Turkey to Tiway in October 2009, the Company has agreed to indemnify Petrol Ofisi and Tiway, respectively, against and in respect of any claims, liabilities and
F-32
Table of Contents
TOREADOR RESOURCES CORPORATION
NOTES TO CONSOLIDATED FINANCIAL STATEMENTS — (Continued)
losses arising from the Fallen Structures. The Company has also indemnified a third party vendor for any claims made related to these incidents.
On October 16, 2003, we entered into an agreement, or the Netherby Agreement, with Phillip Hunnisett and Roy Barker, or Hunnisett and Barker, pursuant to which Hunnisett and Barker agreed to post the collateral required by the Turkish government for Madison Oil Turkey Inc. (a Liberian company later reincorporated in the Cayman Islands as Toreador Turkey Limited) to retain its 36.75% interest in relation to eight offshore exploration SASB licenses in exchange for a 1.5% gross overriding royalty interest, or the Overriding Royalty, on the net value to Madison Oil Turkey of all future production, if any, deriving from Madison's interest in such SASB licenses. Since March 2009, we have corresponded with Hunnisett and Barker regarding a dispute over the compensation payable by us to Hunnisett and Barker under the Netherby Agreement as a result of Toreador Turkey's sale of a 26.75% interest in the SASB licenses to Petrol Ofisi in March 2009, or the Netherby Payment Amount. Hunnisett and Barker have contended that the Netherby Payment Amount could be up to $10.4 million; however, we do not believe that Hunnisett and Barker are entitled to such amount. There has been subsequent correspondence regarding a dispute as to whether an agreement between the parties had been reached regarding the Netherby Payment Amount; Hunnisett and Barker's contention is that such agreed Netherby Payment Amount was $7.2 million. We do not believe that any such agreement was reached, and we do not believe that Hunnisett and Barker are entitled to such amount. We intend to vigorously defend ourselves against any claim for payment of an amount in excess of the amount to which we believe that Hunnisett and Barker are entitled. We have since completed the sale of Toreador Turkey Ltd., including with it Toreador Turkey's remaining 10% interest in the SASB license, to Tiway Oil, or Tiway. In connection with the sales referred to above, we have agreed to indemnify Petrol Ofisi and Tiway against and in respect of any and all claims, liabilities, and losses arising from the Overriding Royalty. As of December 31, 2009, we have accrued approximately $870,000 as a contingent liability for these claims.
On June 17, 2009, The Scowcroft Group, Inc., or Scowcroft, filed a complaint in the United States District Court for the District of Columbia against us. The complaint alleges that we breached a contract, or the Scowcroft Contract, between Scowcroft and us relating to the sale of our interests in the SASB and that Scowcroft is entitled to a success fee thereunder as a result of the sale of our interests in the SASB to Petrol Ofisi in March 2009. The complaint also alleges unjust enrichment/quantum meruit and fraud. Scowcroft is seeking damages in the amount of $2 million plus interest, costs and expenses. On July 24, 2009, we filed a motion to dismiss the complaint. The district court denied our motion to dismiss the action on October 26, 2009. On November 30, 2009, we filed an answer to the complaint. There was an initial scheduling conference in the matter on March 12, 2010. At the hearing the Court signed The Scowcroft Group's proposed protective order (which permits the parties to mark appropriate documents for confidential treatment), ordered that The Scowcroft Group produce its documents by March 15, 2010, suspended further discovery for 60 days while the parties mediate with a Magistrate Judge and set the next status conference for May 21, 2010, at which time the Court indicated that it will set a schedule if the case is not settled. We believe that we have defenses to Scowcroft's claims and intend to continue vigorously defending ourselves.
On January 25, 2010, we received a claim notice from Tiway under the Share Purchase Agreement, dated September 30, 2009, among us, Tiway Oil BV and Tiway relating to the sale of Toreador Turkey Ltd. in respect of a third-party claim asserted by Petrol Ofisi against Toreador Turkey Ltd. in the amount of TRY 7.6 million ($5.1 million), for which Tiway alleges we are liable for an estimated TRY 2.1 million ($1.4 million). No formal legal evaluation can be made at this time as to the extent of the Company's liability, if any.
From time to time, we are named as a defendant in other legal proceedings arising in the normal course of business. In our opinion, the final judgment or settlement, if any, which may be awarded with any suit or claim would not have a material adverse effect on our financial position.
F-33
Table of Contents
TOREADOR RESOURCES CORPORATION
NOTES TO CONSOLIDATED FINANCIAL STATEMENTS — (Continued)
NOTE 13 — DERIVATIVE FINANCIAL INSTRUMENTS
We periodically utilize derivatives instruments such as futures, collar and swaps for purposes of hedging our exposure to fluctuations in the price of crude oil and natural gas sales. We entered into collar contracts for approximately 16,000 Bbls per month for the months of January 2008 through September 2008. This resulted in a net derivative fair value loss of $1.8 million for the twelve months ended December 31, 2008, as presented in the table below:
| | | | | | | | | | | | | | | |
Type | | Period | | Barrels | | Floor | | Ceiling | | (Gain) Loss | |
|---|
Collar | | January 1 — March 31, 2008 | | | 48,000 | | $ | 84.75 | | $ | 92.75 | | $ | 19 | |
Collar | | April 1 — June 2008 | | | 48,000 | | $ | 92.25 | | $ | 100.75 | | | 2,239 | |
Collar | | July 1 — September 2008 | | | 48,000 | | $ | 91.75 | | $ | 99.75 | | | (477 | ) |
| | | | | | | | | | | | | | | |
| | | | | | | | | | | | | $ | 1,781 | |
| | | | | | | | | | | | | | | |
On June 16, 2009 we entered into collars contracts for approximately 18,000 Bbls per month for the months of July 2009 through December 2009. This resulted in a realized gain of $7,000 for the year ended December 31, 2009. Presented in the table below is a summary of the contracts entered into for the year ended December 31, 2009 and loss as of December 31, 2009
| | | | | | | | | | | | | | | |
Type | | Period | | Barrels | | Floor | | Ceiling | | Loss | |
|---|
Collar | | July 1 — December 2009 | | | 110,400 | | $ | 65.00 | | $ | 77.00 | | $ | (7 | ) |
| | | | | | | | | | | | | | | |
In December 2009, we entered into collars contracts for approximately 15,208 Bbls per month for the entire year of 2010. This resulted in an unrealized loss at December 31, 2010 of $886,000. Presented in the table below is a summary of the contracts entered into for the year end December 31, 2009.
| | | | | | | | | | | | | | | |
Type | | Period | | Barrels | | Floor | | Ceiling | | (Gain) Loss | |
|---|
Collar | | January 1 — December 31, 2010 | | | 182,500 | | $ | 68.00 | | $ | 81.00 | | $ | 886 | |
| | | | | | | | | | | | | | | |
NOTE 14 — FAIR VALUE MEASUREMENT
Effective January 1, 2008, we adopted the authoritative guidance that applies to all financial assets and liabilities required to be measured and reported on a fair value basis. Beginning January 1, 2009, we also applied the guidance to non-financial assets and liabilities. Fair value is the price that would be received to sell an asset or paid to transfer a liability in an orderly transaction between market participants at the measurement date (exit price). The guidance requires disclosure that establishes a framework for measuring fair value, expands disclosure about fair value measurements and requires that fair value measurements be classified and disclosed in one of the following categories:
| | | |
| | Level 1: | | Unadjusted quoted prices in active markets that are accessible at the measurement date for identical, unrestricted assets or liabilities. We consider active markets as those in which transactions for the assets or liabilities occur with sufficient frequency and volume to provide pricing information on an ongoing basis. |
F-34
Table of Contents
TOREADOR RESOURCES CORPORATION
NOTES TO CONSOLIDATED FINANCIAL STATEMENTS — (Continued)
| | | |
| | Level 2: | | Quoted prices in markets that are not active, or inputs that are observable, either directly or indirectly, for substantially the full term of the asset or liability. This category includes those derivative instruments that we value using observable market data. Substantially all of these inputs are observable in the marketplace throughout the full term of the derivative instrument, can be derived from observable data or supported by observable levels at which transactions are executed in the market place. Instruments in this category include non-exchange traded derivatives such as over-the-counter commodity price swaps, certain investments and interest rate swaps. |
|
Level 3: |
|
Measured based on prices or valuation models that require inputs that are both significant to the fair value measurement and less observable from objective sources (i.e., supported by little or no market activity). Our valuation models for derivative contracts are primarily industry-standard models (i.e., Black-Scholes) that consider various inputs including: (a) quoted forward prices for commodities, (b) time value, (c) volatility factors, (d) counterparty credit risk and (e) current market and contractual prices for the underlying instruments, as well as other relevant economic measures. Level 3 instruments primarily include derivative instruments, such as basis swaps, commodity price collars and floors and accrued liabilities. Although we utilize third party broker quotes to assess the reasonableness of our prices and valuation techniques, we do not have sufficient corroborating market evidence to support classifying these assets and liabilities as Level 2. |
Financial assets and liabilities are classified based on the lowest level of input that is significant to the fair value measurement. Our assessment of the significance of a particular input to the fair value measurement requires judgment, and may affect the valuation of the fair value of assets and liabilities and their placement within the fair value hierarchy levels.
Fair Value of Financial Instruments
The following table summarizes the valuation of our investments and financial instrument assets (liabilities) by pricing levels, recorded or disclosed at fair value on a recurring basis:
| | | | | | | | | | | | | | |
| | Fair Value Measurement
Classification | |
| |
|---|
| | (Level 1) | | (Level 2) | | (Level 3) | | Total | |
|---|
| | (In millions)
| |
|---|
As of December 31, 2009: | | | | | | | | | | | | | |
Oil derivative contracts | | | — | | | — | | | 886 | | | 886 | |
| | | | | | | | | | |
| | Total | | $ | — | | $ | — | | $ | 886 | | $ | 886 | |
| | | | | | | | | | |
F-35
Table of Contents
TOREADOR RESOURCES CORPORATION
NOTES TO CONSOLIDATED FINANCIAL STATEMENTS — (Continued)
The table below summarizes the change in carrying values associated with Level 3 financial instruments during the year ended December 31, 2009.
| | | | | |
| | Oil
Derivative
Contract | |
|---|
Balance at December 31, 2008 | | $ | — | |
| | Purchases | | | — | |
| | Proceeds received on settlement | | | (7 | ) |
| | Realized gain | | | 7 | |
| | Unrealized depreciation | | | (886 | ) |
| | | | |
Balance at December 31, 2009 | | $ | (886 | ) |
| | | | |
The amount of total gains for the period included in earnings attributable to the change in unrealized gains relating to assets still held at the reporting date | | $ | 886 | |
| | | | |
At December 31, 2009 and 2008, the Company did not have any assets or liabilities measured at fair value on a non-recurring basis.
Asset Impairments —The Company reviews proved oil and gas properties for impairment when events and circumstances indicate a significant decline in the recoverability of the carrying value of such properties. When events and circumstances indicate a significant decline in the recoverability of a property, the Company estimates the future cash flows expected in connection with the property and compares such future cash flows to the carrying value of the property to determine if the carrying amount is recoverable. If the carrying amount of the property exceeds its estimated undiscounted future cash flows, the carrying amount of the property is reduced to its estimated fair value. Fair value may be estimated using comparable market data, a discounted cash flow method, or a combination of the two. In the discounted cash flow method, estimated future cash flows are based on management's expectations for the future and include estimates of future oil and gas production, commodity prices based on commodity futures price strips as of the date of the estimate, operating and development costs, and a risk-adjusted discount rate.
The Company recorded asset impairments of $10.7 million in discontinued operations on proved properties during the year ended December 31, 2009. During the year December 31, 2008, the Company recorded impairments of $82.9 million for discontinued operation and $2.3 million for continued operations on proved properties. Significant Level 3 assumptions associated with the calculation of discounted cash flows used in the impairment analysis include the Company's estimate of future natural gas and crude oil prices, operating and development costs, anticipated production of proved reserves, appropriate risk-adjusted discount rates and other relevant data.
Asset Retirement Obligations —The initial measurement of asset retirement obligations at fair value is calculated using discounted cash flow techniques and based on internal estimates of future retirement costs associated with oil and gas properties. Significant Level 3 inputs used in the calculation of asset retirement obligations include plugging costs and reserve lives. A reconciliation of the Company's asset retirement obligation is presented in Note 2.
We account for goodwill in accordance with FASB ASC 350, "Intangibles — Goodwill and Other". Under ASC 350, goodwill and indefinite-lived intangible assets are not amortized but are reviewed annually (or more frequently if impairment indicators arise) for impairment
F-36
Table of Contents
TOREADOR RESOURCES CORPORATION
NOTES TO CONSOLIDATED FINANCIAL STATEMENTS — (Continued)
NOTE 15 — DISCONTINUED OPERATIONS
On June 14, 2007, the Board of Directors authorized management to sell all oil and natural gas properties in the United States. The sale of these properties completed the divestiture of the company's non-core domestic assets and allowed us to focus exclusively on our international operations. The sale was closed on September 1, 2007. The sales price was $19.1 million which resulted in a pre-tax gain of $9.2 million.
In the fourth quarter of 2008 and during the first quarter of 2009, Toreador farmed out or sold all of its working interests in Romania to three different companies and closed its office; thus, we no longer have any operational involvement in Romania. This resulted in a gain of $5.8 million, which was recorded in the first quarter of 2009.
On March 3, 2009 we completed the sale of a 26.75% interest in the South Akcakoca Sub-Basin (SASB) project associated licenses located in the Black Sea offshore Turkey, to Petrol Ofisi for $55 million. In accordance with the revised assignment announced on February 3, 2009, $50 million of the proceeds was paid by Petrol Ofisi on March 3, 2009, and the remaining $5 million was paid on September 1, 2009. There was no gain or loss resulting from this sale.
On September 30, 2009, the Company entered into a Share Purchase Agreement (the "Share Purchase Agreement") with Tiway Oil BV, a company organized under the laws of the Netherlands ("Tiway"), and Tiway Oil AS, a company organized under the laws of Norway, pursuant to which the Company agreed to sell 100% of the outstanding shares of Toreador Turkey Ltd. ("Toreador Turkey") to Tiway for total consideration consisting of: (1) a cash payment of $10.5 million to be paid at closing, (2) exploration success payments dependent upon certain future commercial discoveries as provided in the Share Purchase Agreement, up to a maximum aggregate consideration of $40 million, and (3) future quarterly 10% pre-tax net profit interest payments if a field goes into production that was discovered by an exploration well drilled within four years of closing on certain of the licenses then still held by Tiway. The sale of Toreador Turkey was completed on October 7, 2009 which resulted in a gain of $1.8 million.
On September 30, 2009, the Company entered into a Quota Purchase Agreement (the "Quota Purchase Agreement") with RAG (Rohöl-Aufsuchungs Aktiengesellschaft), a corporation organized under the laws of Austria ("RAG"), pursuant to which the Company agreed to sell 100% of its equity interests in Toreador Hungary Limited ("Toreador Hungary") to RAG for total consideration consisting of (1) a cash payment of US$5.4 million (€3.7 million) paid at closing, (2) US$435,000 (€300,000), which was held back subject to a post-closing adjustment and was paid to us on November 5, 2009 and (3) a contingent payment of US$2.9 million (€2 million) to be paid upon post-transaction completion of agreements relating to certain assets of Toreador Hungary. The sale of Toreador Hungary was completed on September 30, 2009 and resulted in a loss of $4.1 million.
F-37
Table of Contents
TOREADOR RESOURCES CORPORATION
NOTES TO CONSOLIDATED FINANCIAL STATEMENTS — (Continued)
The results of operations of assets in the United States, Romania, Turkey and Hungary have been presented as discontinued operations. The table below compares discontinued operations for the years ended December 31, 2009, 2008 and 2007:
| | | | | | | | | | | | |
| | Year ended December 31, | |
|---|
| | 2009 | | 2008 | | 2007 | |
|---|
Revenue: | | | | | | | | | | |
| | Oil and natural gas sales | | $ | 4,545 | | $ | 28,226 | | $ | 20,273 | |
Operating costs and expenses: | | | | | | | | | | |
| | Lease operating expense | | | 886 | | | 7,971 | | | 6,892 | |
| | Exploration expense | | | 868 | | | 4,582 | | | 11,324 | |
| | Depreciation, depletion and amortization | | | 157 | | | 28,148 | | | 17,466 | |
| | Dry hole expense | | | 1,318 | | | — | | | 18,096 | |
| | Impairment | | | 10,725 | | | 82,951 | | | 13,446 | |
| | General and administrative expense | | | 3,424 | | | 2,445 | | | 5,131 | |
| | (Gain) loss on sale of properties and other assets | | | (3,583 | ) | | 123 | | | 9,248 | |
| | | | | | | | |
| | | Total operating costs and expenses | | | 13,795 | | | 126,220 | | | 63,107 | |
| | | | | | | | |
| | Operating loss | | | (9,250 | ) | | (97,994 | ) | | (42,834 | ) |
Other income (expense): | | | | | | | | | | |
| | | Loss on early extinguishment of debt | | | (4,881 | ) | | — | | | — | |
| | | Foreign currency exchange | | | 3,822 | | | (342 | ) | | (25,984 | ) |
| | | Interest and other income | | | 414 | | | 1,004 | | | 445 | |
| | | Interest expense | | | (185 | ) | | (3,679 | ) | | (822 | ) |
| | | | | | | | |
Loss before taxes | | | (10,080 | ) | | (101,011 | ) | | (69,195 | ) |
Income tax provision | | | — | | | 574 | | | 678 | |
| | | | | | | | |
Loss from discontinued operations | | $ | (10,080 | ) | $ | (101,585 | ) | $ | (69,873 | ) |
| | | | | | | | |
The assets and liabilities of discontinued operations presented separately under the captions "Oil and natural gas properties, net, held for sale", "Other assets held for sale" and "Liabilities held for sale" in balance sheet for the period ended December 31, 2008 are valued at the lower of cost or fair value less cost
F-38
Table of Contents
TOREADOR RESOURCES CORPORATION
NOTES TO CONSOLIDATED FINANCIAL STATEMENTS — (Continued)
of selling such assets. The table below shows the components of the other assets held for sale and liabilities held for sale.
| | | | | | |
| | December 31,
2008 | |
|---|
Current assets: | | | | |
| | Cash | | $ | 4,597 | |
| | Restricted cash | | | 2,922 | |
| | Accounts receivable | | | 4,392 | |
| | Other | | | 1,568 | |
| | | | |
| | | Total current assets | | | 13,479 | |
| | | | |
Other assets | | | 1,484 | |
| | | | |
| | | Other assets held for sale | | $ | 14,963 | |
| | | | |
Current liabilities: | | | | |
| | Accounts payable and accrued liabilities | | $ | 9,223 | |
| | Asset retirement obligations | | | 2,028 | |
| | | | |
| | | Liabilities held for sale | | $ | 11,251 | |
| | | | |
NOTE 16 — INFORMATION ABOUT OIL AND NATURAL GAS PRODUCING ACTIVITIES AND OPERATING SEGMENTS
We have operations in only one industry segment, the oil and natural gas exploration and production industry. We are structured along geographic operating segments or regions. As a result, we have reportable operations in the United States and Western Europe (France). Geographic operating segment income tax expenses have been determined based on statutory rates existing in the various tax jurisdictions where we have oil and natural gas producing activities.
We allocate a portion of certain United States based employees salaries to our foreign subsidiaries. The amount allocated is based on an estimate of the time that employee has spent working on that on that subsidiary. We periodically review these percentages to make sure that our assumptions are still valid.
F-39
Table of Contents
TOREADOR RESOURCES CORPORATION
NOTES TO CONSOLIDATED FINANCIAL STATEMENTS — (Continued)
The following tables provide the geographic operating segment data required by FASB ASC 280,"Segment Reporting".
| | | | | | | | | | | | |
| | United
States | | France | | Total | |
|---|
| | (In thousands)
| |
|---|
For the year ended December 31, 2009 | | | | | | | |
Revenues: | | | | | | | | | | |
| | Oil and natural gas sales | | $ | 461 | | $ | 18,775 | | $ | 19,236 | |
Costs and expenses: | | | | | | | | | | |
| | Lease operating | | | — | | | 8,396 | | | 8,396 | |
| | Exploration expense | | | 138 | | | — | | | 138 | |
| | Depreciation, depletion and amortization | | | 292 | | | 5,471 | | | 5,763 | |
| | General and administrative | | | 16,666 | | | 3,694 | | | 20,360 | |
| | Gain on sale of properties and other assets | | | (121 | ) | | | | | (121 | ) |
| | (Gain)loss on sale of oil and gas derivative contracts | | | 886 | | | (7 | ) | | 879 | |
| | | | | | | | |
| | | Total costs and expenses | | | 17,861 | | | 17,554 | | | 35,415 | |
| | | | | | | | |
Operating income (loss) | | | (17,400 | ) | | 1,221 | | | (16,179 | ) |
| | Other income | | | 182 | | | 215 | | | 397 | |
| | | | | | | | |
Income (loss) before income taxes | | | (17,218 | ) | | 1,436 | | | (15,782 | ) |
| | Benefit for income taxes | | | 408 | | | 42 | | | 450 | |
| | | | | | | | |
Income (loss) from continuing operations, net of tax | | $ | (16,810 | ) | $ | 1,478 | | $ | (15,332 | ) |
| | | | | | | | |
Selected assets: | | | | | | | | | | |
| | Properties and equipment | | $ | 650 | | $ | 115,785 | | $ | 116,435 | |
| | Accumulated depreciation, depletion, and amortization | | | (246 | ) | | (41,568 | ) | | (41,814 | ) |
| | | | | | | | |
| | Oil and natural gas properties, net | | $ | 404 | | $ | 74,217 | | $ | 74,621 | |
| | | | | | | | |
| | Goodwill | | $ | — | | $ | 3,973 | | $ | 3,973 | |
| | | | | | | | |
| | Total assets | | $ | 42,996 | | $ | 100,989 | | $ | 143,985 | |
| | | | | | | | |
Expenditures for additions to long-lived assets: | | | | | | | | | | |
| | Exploration costs | | $ | — | | $ | 2,887 | | $ | 2,887 | |
| | Development costs | | | — | | | 499 | | | 499 | |
| | | | | | | | |
| | Total expenditures for long-lived assets | | $ | — | | $ | 3,386 | | $ | 3,386 | |
| | | | | | | | |
F-40
Table of Contents
TOREADOR RESOURCES CORPORATION
NOTES TO CONSOLIDATED FINANCIAL STATEMENTS — (Continued)
| | | | | | | | | | | | |
| | United
States | | France | | Total | |
|---|
| | (In thousands)
| |
|---|
For the year ended December 31, 2008 | | | | | | | |
Revenues: | | | | | | | | | | |
| | Oil and natural gas sales | | $ | 52 | | $ | 34,098 | | $ | 34,150 | |
Costs and expenses: | | | | | | | | | | |
| | Lease operating | | | — | | | 9,263 | | | 9,263 | |
| | Exploration expense | | | 1,080 | | | 144 | | | 1,224 | |
| | Depreciation, depletion and amortization | | | 307 | | | 4,687 | | | 4,994 | |
| | Impairment of oil and natural gas properties and intangible assets | | | 2,282 | | | — | | | 2,282 | |
| | General and administrative | | | 11,747 | | | 1,295 | | | 13,042 | |
| | Loss on sale of oil and gas derivative contracts | | | — | | | 1,781 | | | 1,781 | |
| | | | | | | | |
| | | Total costs and expenses | | | 15,416 | | | 17,170 | | | 32,586 | |
| | | | | | | | |
Operating income (loss) | | | (15,364 | ) | | 16,928 | | | 1,564 | |
| | Other income (expense) | | | (3,154 | ) | | 72 | | | (3,082 | ) |
| | | | | | | | |
Income (loss) before income taxes | | | (18,518 | ) | | 17,000 | | | (1,518 | ) |
| | Benefit (provision) for income taxes | | | 563 | | | (6,065 | ) | | (5,502 | ) |
| | | | | | | | |
Income (loss) from continuing operations, net of tax | | $ | (17,955 | ) | $ | 10,935 | | $ | (7,020 | ) |
| | | | | | | | |
Selected assets: | | | | | | | | | | |
| | Properties and equipment | | $ | 1,860 | | $ | 108,668 | | $ | 110,528 | |
| | Accumulated depreciation, depletion, and amortization | | | (1,163 | ) | | (36,612 | ) | | (37,775 | ) |
| | | | | | | | |
| | Oil and natural gas properties, net | | $ | 697 | | $ | 72,056 | | $ | 72,753 | |
| | | | | | | | |
| | Goodwill | | $ | — | | $ | 3,838 | | $ | 3,838 | |
| | | | | | | | |
| | Total assets | | $ | 276,434 | | $ | 93,691 | | $ | 370,125 | |
| | | | | | | | |
Expenditures for additions to long-lived assets: | | | | | | | | | | |
| | Property acquisition costs | | $ | — | | $ | — | | $ | — | |
| | Development costs | | | — | | | 431 | | | 431 | |
| | Other | | | 10 | | | — | | | 10 | |
| | | | | | | | |
| | Total expenditures for long-lived assets | | $ | 10 | | $ | 431 | | $ | 441 | |
| | | | | | | | |
F-41
Table of Contents
TOREADOR RESOURCES CORPORATION
NOTES TO CONSOLIDATED FINANCIAL STATEMENTS — (Continued)
| | | | | | | | | | | | |
| | United
States | | France | | Total | |
|---|
| | (In thousands)
| |
|---|
For the year ended December 31, 2007 | | | | | | | |
Revenues: | | | | | | | | | | |
| | Oil and natural gas sales | | $ | 34 | | $ | 25,873 | | $ | 25,907 | |
Costs and expenses: | | | | | | | | | | |
| | Lease operating | | | — | | | 7,344 | | | 7,344 | |
| | Exploration expense | | | 2,668 | | | 855 | | | 3,523 | |
| | Depreciation, depletion and amortization | | | 265 | | | 4,137 | | | 4,402 | |
| | Dry hole cost | | | — | | | 3,847 | | | 3,847 | |
| | General and administrative | | | 9,675 | | | 2,832 | | | 12,507 | |
| | Gain on sale of properties and other assets | | | (3,155 | ) | | — | | | (3,155 | ) |
| | | Loss on sale of oil and gas derivative contracts | | | 1,005 | | | — | | | 1,005 | |
| | | | | | | | |
| | Total costs and expenses | | | 10,458 | | | 19,015 | | | 29,473 | |
| | | | | | | | |
Operating income (loss) | | | (10,424 | ) | | 6,858 | | | (3,566 | ) |
| | Other expense | | | (1,914 | ) | | (470 | ) | | (2,384 | ) |
| | | | | | | | |
Income (loss) before income taxes | | | (12,338 | ) | | 6,388 | | | (5,950 | ) |
| | Benefit (provision) for income taxes | | | 3,692 | | | (2,290 | ) | | 1,402 | |
| | | | | | | | |
Income (loss) from continuing operations, net of tax | | $ | (8,646 | ) | $ | 4,098 | | $ | (4,548 | ) |
| | | | | | | | |
Selected assets: | | | | | | | | | | |
| | Properties and equipment | | $ | 3,905 | | $ | 115,666 | | $ | 119,571 | |
| | Accumulated depreciation, depletion, and amortization | | | (928 | ) | | (37,660 | ) | | (38,588 | ) |
| | | | | | | | |
| | Oil and natural gas properties, net | | $ | 2,977 | | $ | 78,006 | | $ | 80,983 | |
| | | | | | | | |
| | Goodwill | | $ | — | | $ | 4,059 | | $ | 4,059 | |
| | | | | | | | |
| | Total assets | | $ | 298,949 | | $ | 83,683 | | $ | 382,632 | |
| | | | | | | | |
Expenditures for additions to long-lived assets: | | | | | | | | | | |
| | Exploration costs | | $ | — | | $ | 3,847 | | $ | 3,847 | |
| | Other | | | 398 | | | — | | | 398 | |
| | | | | | | | |
| | Total expenditures for long-lived assets | | $ | 398 | | $ | 3,847 | | $ | 4,245 | |
| | | | | | | | |
The following table reconciles the total assets for reportable segments to consolidated assets.
| | | | | | | |
| | December 31, | |
|---|
| | 2009 | | 2008 | |
|---|
| | (in thousands)
| |
|---|
Total assets for reportable segments | | $ | 143,985 | | $ | 370,125 | |
Total assets of entities held for sale | | | | | | (100,609 | ) |
Elimination of intersegment receivables and investments | | | (46,830 | ) | | (62,360 | ) |
| | | | | | |
Total consolidated assets | | $ | 97,155 | | $ | 207,156 | |
| | | | | | |
F-42
Table of Contents
TOREADOR RESOURCES CORPORATION
NOTES TO CONSOLIDATED FINANCIAL STATEMENTS — (Continued)
NOTE 17 — SUBSEQUENT EVENTS
On February 12, 2010, we completed a registered underwritten public offering of 3,450,000 shares of common stock, including 450,000 shares of common stock acquired by the underwriters from us to cover over-allotment options. The net proceeds to Toreador from the offering were approximately $27.2 million, after deducting underwriting discounts, commissions and estimated offering expenses. We intend to use the net proceeds, together with cash on hand, to satisfy payment obligations arising from the holders' exercise, if any, of their right on October 1, 2010 to require the Company to repurchase its 5.00% Convertible Senior Notes due 2025 and for general corporate purposes, which may include working capital, capital expenditures and acquisitions.
On February 1, 2010, Toreador consummated an exchange transaction, or the Convertible Notes Exchange. In the Convertible Notes Exchange, in exchange for (a) $22,231,000 principal amount of its outstanding 5.00% Convertible Senior Notes due 2025, or the Old Notes, and (b) $9.4 million cash, we issued $31,631,000 aggregate principal amount its 8.00%/7.00% Convertible Senior Notes due 2025, or the New Convertible Senior Notes, and paid accrued and unpaid interest on the Old Notes.
The New Convertible Senior Notes are senior unsecured obligations of the Company, ranking equal in right of payment with the Company's 5.00% Convertible Senior and future unsubordinated indebtedness. The New Convertible Senior Notes will mature on October 1, 2025 and pay annual cash interest at 8.00% from February 1, 2010 until January 31, 2011 and at 7.00% per annum thereafter. Interest on the New Convertible Senior Notes will be payable on February 1 and August 1 of each year, beginning on August 1, 2010.
The New Convertible Senior Notes are convertible prior to February 1, 2011 only if an event of default occurs and is continuing under the terms of the indenture, upon a Change of Control (as defined in the indenture) and to the extent the Company elects to redeem the New Convertible Senior Notes in a Provisional Redemption (as defined below). The New Convertible Senior Notes are convertible at any time on or after February 1, 2011 and before the close of business on October 1, 2025.
The New Convertible Senior Notes are convertible into shares of our common stock at an initial conversion rate of 72.9927 shares of common stock per $1,000 principal amount of New Convertible Senior Notes (which is equivalent to an initial conversion price of $13.70 per share), subject to adjustment upon certain events. Under the terms of the indenture governing the New Convertible Senior Notes, if on or before October 1, 2010, we sold shares of its common stock in an equity offering or an equity-linked offering (other than for compensation), for cash consideration per share such that 120% of the issuance price was less than the conversion price of the New Convertible Senior Notes then in effect, the conversion price was to be reduced to an amount equal to 120% of such offering price. As a result of our February 2010 public offering, the conversion rate of the New Convertible Senior Notes adjusted to 98.0392 shares of common stock per $1,000 principal amount of New Convertible Senior Notes (which is equivalent to a conversion price of approximately $10.20 per share). Pursuant to the indenture, the conversion price of the New Convertible Senior Notes will not be further adjusted under such provision because the proceeds from the public offering were in excess of $20 million.
The New Convertible Senior Notes may be redeemed in whole or in part at the Company's option prior to October 1, 2013, in cash at a redemption price equal to one hundred percent (100%) of the principal amount of the New Convertible Senior Notes redeemed, plus accrued and unpaid interest, if any, to, but excluding, the redemption date plus a make-whole payment, if the closing sale price of the Company's common stock has exceeded 200% of the conversion price then in effect for at least twenty (20) trading days in any consecutive thirty (30)-trading day period ending on the trading day prior to the date of mailing of the relevant notice of redemption. The New Convertible Senior Notes may be redeemed in whole or in part at the Company's option on or after October 1, 2013 for cash at a redemption price
F-43
Table of Contents
TOREADOR RESOURCES CORPORATION
NOTES TO CONSOLIDATED FINANCIAL STATEMENTS — (Continued)
equal to 100% of the principal amount of the New Convertible Senior Notes redeemed, plus any accrued and unpaid interest to, but excluding, the redemption date. In addition, upon the occurrence of certain fundamental changes, and on each of October 1, 2013, October 1, 2015 and October 1, 2020, a holder may require the Company to repurchase all or a portion of the New Convertible Senior Notes in cash for 100% of the principal amount of the New Convertible Senior Notes to be purchased, plus any accrued and unpaid interest to, but excluding, the purchase date.
Pursuant to the indenture, the Company and its subsidiaries may not incur debt other than Permitted Indebtedness. "Permitted Indebtedness" includes (i) the New Convertible Senior Notes; (ii) the 5.00% Convertible Senior Notes or any indebtedness of the Company that serves to refund or refinance the 5.00% Convertible Senior Notes ("Refinancing Debt"), so long as the principal amount of the Refinancing Debt does not exceed the outstanding principal amount of the 5.00% Convertible Senior Notes; (iii) indebtedness incurred by the Company or its subsidiaries not to exceed the sum of (i) the product of (x) $7.00 and (y) the number of barrels of proved plus probable reserves and (ii) cash equivalents less the aggregate principal amount of the New Convertible Senior Notes outstanding less the aggregate principal amount of the 5.00% Convertible Senior Notes less any Refinancing Debt; (iv) indebtedness that is nonrecourse to the Company or any of its subsidiaries used to finance projects or acquisitions, joint ventures or partnerships, including acquired indebtedness ("Nonrecourse Debt"); and (v) certain other customary categories of permitted debt. In addition, the Company may not permit its total consolidated net debt as of any date to exceed the product of (x) $7.00 and (y) the number of barrels of proved plus probable reserves other than for Nonrecourse Debt. The proved plus probable reserves underlying any Nonrecourse Debt for which debt has been incurred as permitted debt pursuant to clause (iv) above will be excluded from the proved plus probable reserves calculation for the purposes of the above debt covenants.
NOTE 18 — SUPPLEMENTAL OIL AND NATURAL GAS RESERVES AND STANDARDIZED MEASURE INFORMATION (UNAUDITED)
Users of this information should be aware that the process of estimating quantities of proved and proved developed oil and gas reserves is very complex, requiring significant subjective decisions in the evaluation of all available geological, engineering and economic data for each reservoir. The data for a given reservoir also may change substantially over time as a result of numerous factors, including additional development activity, evolving production history and continual reassessment of the viability of production under varying economic conditions. Consequently, material revisions to existing reserve estimates may occur from time to time.
Recent SEC and FASB Rule-Making Activities. On December 31, 2008, the SEC issued the Final Rule adopting revisions to the SEC's oil and gas reporting disclosure requirements. In addition, in January 2010, the FASB issued ASU 2010-03, which aligns the FASB's oil and gas reserve estimation and disclosure requirements with the requirements in the SEC's Final Rule.
We adopted the Final Rule and ASU 2010-03 effective December 31, 2009 as a change in accounting principle that is inseparable from a change in accounting estimate. Such a change is accounted for prospectively under the authoritative accounting guidance. Comparative disclosures applying the new rules for periods before the adoption of ASU 2010-03 and the Final Rule are not required.
Our adoption of ASU 2010-03 and the Final Rule on December 31, 2009 impacted our financial statements and other disclosures in our annual report on Form 10-K for the year ended December 31, 2009, as follows:
- •
- All oil and gas reserves volumes presented as of and for the year ended December 31, 2009 were prepared using the updated reserves rules and are not on a basis comparable with prior periods.
F-44
Table of Contents
TOREADOR RESOURCES CORPORATION
NOTES TO CONSOLIDATED FINANCIAL STATEMENTS — (Continued)
This change in comparability occurred because we estimated our proved reserves at December 31, 2009 using the updated reserves rules, which require use of the unweighted average first-day-of-the-month commodity prices for the prior twelve months, adjusted for market differentials, and permits the use of reliable technologies to support reserve estimates. Under the previous reserve estimation rules, which are no longer in effect, our net proved oil and gas reserves would have been calculated using end of period oil and gas prices. Adoption of ASU 2010-03 and the Final Rule did not have any significant effect on our reserves estimate, however, standardized measure of discounted future net cash flows related to proved reserves decreased by approximately $23 million due to use of unweighted twelve month average price compare to year end price.
Reserves Estimates. All reserve information in this report is based on estimates prepared by our independent engineering firm and is the responsibility of management. The preparation of our oil reserves estimates is completed in accordance with our prescribed internal control procedures, which include verification of data input into reserves forecasting and economics evaluation software, as well as multi-discipline management reviews.
We retain an independent engineering firm to provide annual year-end estimates of our future net recoverable oil and natural gas reserves. Estimated proved net recoverable reserves we have shown below include only those quantities that we can expect to be commercially recoverable at prices and costs in effect at the balance sheet dates under existing regulatory practices and with conventional equipment and operating methods. Proved developed reserves represent only those reserves that we may recover through existing wells. Proved undeveloped reserves include those reserves that we may recover from new wells on undrilled acreage or from existing wells on which we must make a relatively major expenditure for recompletion or secondary recovery operations.
Discounted future cash flow estimates like those shown below are not intended to represent estimates of the fair value of oil and natural gas properties. Estimates of fair value should also consider probable reserves, anticipated future oil and natural gas prices, interest rates, changes in development and
F-45
Table of Contents
TOREADOR RESOURCES CORPORATION
NOTES TO CONSOLIDATED FINANCIAL STATEMENTS — (Continued)
production costs and risks associated with future production. Because of these and other considerations, any estimate of fair value is necessarily subjective and imprecise.
| | | | | | | | | | | | | | | | | |
| | France | | Turkey | | Romania | | Hungary | | Total | |
|---|
| | Natural Gas (MMcf)
| |
|---|
| | PROVED RESERVES | | | | | | | | | | | | | | | | |
December 31, 2006 | | | — | | | 21,424 | | | 3,041 | | | 950 | | | 25,415 | |
Revisions of previous estimates | | | — | | | (8,215 | ) | | (1,671 | ) | | (950 | ) | | (10,836 | ) |
Extensions, discoveries and other additions | | | — | | | 741 | | | — | | | — | | | 741 | |
Sale of reserves | | | — | | | — | | | — | | | — | | | — | |
Production | | | — | | | (1,011 | ) | | (598 | ) | | — | | | (1,069 | ) |
| | | | | | | | | | | | |
December 31, 2007 | | | — | | | 12,939 | | | 772 | | | — | | | 13,711 | |
Revisions of previous estimates | | | — | | | (819 | ) | | (310 | ) | | 950 | | | (179 | ) |
Extensions, discoveries and other additions | | | — | | | — | | | — | | | — | | | — | |
Sale of reserves | | | — | | | — | | | — | | | — | | | — | |
Production | | | — | | | (1,643 | ) | | (376 | ) | | — | | | (2,019 | ) |
| | | | | | | | | | | | |
December 31, 2008 | | | — | | | 10,477 | | | 86 | | | 950 | | | 11,513 | |
Revisions of previous estimates | | | — | | | — | | | — | | | — | | | — | |
Extensions, discoveries and other additions | | | — | | | — | | | — | | | — | | | — | |
Sale of reserves | | | — | | | (10,477 | ) | | (86 | ) | | (950 | ) | | (11,513 | ) |
Production | | | — | | | — | | | — | | | — | | | — | |
| | | | | | | | | | | | |
December 31, 2009 | | | — | | | — | | | — | | | — | | | — | |
| | | | | | | | | | | | |
| | PROVED DEVELOPED | | | | | | | | | | | | | | | | |
December 31, 2007 | | | — | | | 4,248 | | | 772 | | | — | | | 5,020 | |
| | | | | | | | | | | | |
December 31, 2008 | | | — | | | 2,437 | | | 86 | | | 950 | | | 3,473 | |
| | | | | | | | | | | | |
December 31, 2009 | | | — | | | — | | | — | | | — | | | — | |
| | | | | | | | | | | | |
|
|
Oil (MBbls)
|
|
|---|
| | PROVED RESERVES | | | | | | | | | | | | | | | | |
December 31, 2006 | | | 9,628 | | | 665 | | | 41 | | | 1 | | | 10,335 | |
Revisions of previous estimates | | | 661 | | | 481 | | | (27 | ) | | (1 | ) | | 1,114 | |
Extensions, discoveries and other additions | | | 39 | | | — | | | — | | | — | | | 39 | |
Sale of reserves | | | — | | | (30 | ) | | — | | | — | | | (30 | ) |
Production | | | (360 | ) | | (67 | ) | | (8 | ) | | — | | | (435 | ) |
| | | | | | | | | | | | |
December 31, 2007 | | | 9,968 | | | 1,049 | | | 6 | | | — | | | 11,023 | |
Revisions of previous estimates | | | (4,694 | ) | | (253 | ) | | (2 | ) | | 1 | | | (4,948 | ) |
Extensions, discoveries and other additions | | | — | | | — | | | — | | | — | | | — | |
Sale of reserves | | | — | | | — | | | — | | | — | | | — | |
Production | | | (360 | ) | | (55 | ) | | (3 | ) | | — | | | (418 | ) |
| | | | | | | | | | | | |
December 31, 2008 | | | 4,914 | | | 741 | | | 1 | | | 1 | | | 5,657 | |
Revisions of previous estimates | | | 1,217 | | | — | | | — | | | — | | | 1,217 | |
Extensions, discoveries and other additions | | | — | | | — | | | — | | | — | | | — | |
Sale of reserves | | | — | | | (741 | ) | | (1 | ) | | (1 | ) | | (743 | ) |
Production | | | (328 | ) | | — | | | — | | | — | | | (328 | ) |
| | | | | | | | | | | | |
December 31, 2009 | | | 5,803 | | | — | | | — | | | — | | | 5,803 | |
| | | | | | | | | | | | |
| | PROVED DEVELOPED | | | | | | | | | | | | | | | | |
December 31, 2007 | | | 7,170 | | | 808 | | | 6 | | | — | | | 7,984 | |
| | | | | | | | | | | | |
December 31, 2008 | | | 4,385 | | | 500 | | | 1 | | | 1 | | | 4,887 | |
| | | | | | | | | | | | |
December 31, 2009 | | | 5,383 | | | — | | | — | | | — | | | 5,383 | |
| | | | | | | | | | | | |
| | PROVED UNDEVELOPED | | | | | | | | | | | | | | | | |
December 31, 2007 | | | 2,798 | | | 241 | | | 0 | | | — | | | 3,039 | |
December 31, 2008 | | | 529 | | | 241 | | | 0 | | | — | | | 770 | |
December 31, 2009 | | | 420 | | | — | | | — | | | — | | | 420 | |
F-46
Table of Contents
TOREADOR RESOURCES CORPORATION
NOTES TO CONSOLIDATED FINANCIAL STATEMENTS — (Continued)
The following information was developed utilizing procedures prescribed by FASB Accounting Standards Codification Topic 932,Extractive Industries — Oil and Gas (Topic 932). The information is based on estimates prepared by our independent engineering firm. The "standardized measure of discounted future net cash flows" should not be viewed as representative of the current value of our proved oil and gas reserves. It and the other information contained in the following tables may be useful for certain comparative purposes, but should not be solely relied upon in evaluating us or our performance.
In reviewing the information that follows, we believe that the following factors should be taken into account:
- •
- future costs and sales prices will probably differ from those required to be used in these calculations;
- •
- actual production rates for future periods may vary significantly from the rates assumed in the calculations;
- •
- a 10% discount rate may not be reasonable relative to risk inherent in realizing future net oil and gas revenues; and
- •
- future net revenues may be subject to different rates of income taxation.
Under the standardized measure, future cash inflows were estimated by applying the prices used in estimating our proved oil and gas reserves to the year-end quantities of those reserves. Future cash inflows do not reflect the impact of open hedge positions. Future cash inflows were reduced by estimated future development, abandonment and production costs based on year-end costs in order to arrive at net cash flows before tax. Future income tax expense has been computed by applying year-end statutory tax rates to aggregate future pre-tax net cash flows reduced by the tax basis of the properties involved and tax carryforwards. The standardized measure is derived from using a discount rate of 10% a year to reflect the timing of future net cash flows relating to proved oil and gas reserves.
In general, management does not rely on the following information in making investment and operating decisions. Such decisions are based upon a wide range of factors, including estimates of probable as well as proved reserves and varying price and cost assumptions considered more representative of a range of possible outcomes.
The prices of oil and natural gas at December 31, 2009, 2008, and 2007 used to estimate reserves in the table shown below, were $56.99, $34.29 and $95.72 per Bbl of oil, respectively, and $0, $12.68 and $8.91 per Mcf of natural gas, respectively. The price at December 31, 2009, was the average price for the previous twelve months. All other years are the price at December 31 of the year shown.
| | | | | | | | | | | | | | | | |
| | France | | Turkey | | Romania | | Hungary | | Total | |
|---|
| | (In thousands)
| |
|---|
As of and for the year ended December 31, 2007 | | | | | | | | | | | | | | | | |
Future cash inflows | | $ | 963,444 | | $ | 209,405 | | $ | 4,495 | | $ | — | | $ | 1,177,344 | |
Future production costs | | | 305,939 | | | 29,759 | | | 3,202 | | | — | | | 338,900 | |
Future development costs | | | 32,221 | | | 22,272 | | | 95 | | | — | | | 54,588 | |
Future income tax expense | | | 200,094 | | | 6,597 | | | — | | | — | | | 206,691 | |
| | | | | | | | | | | | |
Future net cash flows | | | 425,190 | | | 150,777 | | | 1,198 | | | — | | | 577,165 | |
10% annual discount for estimated timing of cash flows | | | 250,979 | | | 66,729 | | | 88 | | | — | | | 317,796 | |
| | | | | | | | | | | | |
Standardized measure of discounted future net cash flows related to proved reserves | | $ | 174,211 | | $ | 84,048 | | $ | 1,110 | | $ | — | | $ | 259,369 | |
| | | | | | | | | | | | |
F-47
Table of Contents
TOREADOR RESOURCES CORPORATION
NOTES TO CONSOLIDATED FINANCIAL STATEMENTS — (Continued)
| | | | | | | | | | | | | | | | |
| | France | | Turkey | | Romania | | Hungary | | Total | |
|---|
| | (In thousands)
| |
|---|
As of and for the year ended December 31, 2008 | | | | | | | | | | | | | | | | |
Future cash inflows | | $ | 170,662 | | $ | 155,179 | | $ | 412 | | $ | 13,735 | | $ | 339,988 | |
Future production costs | | | 105,298 | | | 26,939 | | | 381 | | | 1,851 | | | 134,469 | |
Future development costs | | | 13,658 | | | 71,283 | | | 159 | | | 550 | | | 85,650 | |
Future income tax expense | | | 10,027 | | | — | | | — | | | — | | | 10,027 | |
| | | | | | | | | | | | |
Future net cash flows(1) | | | 41,679 | | | 56,957 | | | (128 | ) | | 11,334 | | | 109,842 | |
10% annual discount for estimated timing of cash flows | | | 23,116 | | | 29,909 | | | (7 | ) | | 2,056 | | | 55,074 | |
| | | | | | | | | | | | |
Standardized measure of discounted future net cash flows related to proved reserves(1) | | $ | 18,563 | | $ | 27,048 | | $ | (121 | ) | $ | 9,278 | | $ | 54,768 | |
| | | | | | | | | | | | |
As of and for the year ended December 31, 2009 | | | | | | | | | | | | | | | | |
Future cash inflows | | $ | 301,070 | | $ | — | | $ | — | | $ | — | | $ | 301,070 | |
Future production costs | | | 187,900 | | | — | | | — | | | — | | | 187,900 | |
Future development costs | | | 60,160 | | | — | | | — | | | — | | | 60,160 | |
Future income tax expense | | | 11,959 | | | — | | | — | | | — | | | 11,959 | |
| | | | | | | | | | | | |
Future net cash flows | | | 41,051 | | | — | | | — | | | — | | | 41,051 | |
10% annual discount for estimated timing of cash flows | | | 24,282 | | | — | | | — | | | — | | | 24,282 | |
| | | | | | | | | | | | |
Standardized measure of discounted future net cash flows related to proved reserves | | $ | 16,769 | | $ | — | | $ | — | | $ | — | | $ | 16,769 | |
| | | | | | | | | | | | |
- (1)
- The negative values are due to plugging and abandonment costs incurred in the final year.
F-48
Table of Contents
TOREADOR RESOURCES CORPORATION
NOTES TO CONSOLIDATED FINANCIAL STATEMENTS — (Continued)
The following are the principal sources of change in the standardized measure:
| | | | | | | | | | | | | | | | |
| | France | | Turkey | | Romania | | Hungary | | Total | |
|---|
| | (In thousands)
| |
|---|
Balance at December 31, 2006 | | | 86,190 | | | 84,330 | | | 13,387 | | | 970 | | | 184,877 | |
Sales of oil and natural gas, net | | | (18,529 | ) | | (9,213 | ) | | (1,271 | ) | | — | | | (29,013 | ) |
Net changes in prices and production costs | | | 120,639 | | | 38,613 | | | (7,953 | ) | | — | | | 151,299 | |
Net change in development costs | | | (266 | ) | | (5,701 | ) | | 59 | | | 641 | | | (5,267 | ) |
Extensions and discoveries | | | 1,076 | | | 3,930 | | | — | | | — | | | 5,006 | |
Revisions of previous quantity estimates | | | 18,303 | | | (28,262 | ) | | (2,726 | ) | | (3,267 | ) | | (15,952 | ) |
Previously estimated development costs incurred | | | (1,992 | ) | | (8,523 | ) | | — | | | — | | | (10,515 | ) |
Net change in income taxes | | | (42,760 | ) | | 257 | | | 448 | | | 1,656 | | | (40,399 | ) |
Accretion of discount | | | 11,871 | | | 8,492 | | | (841 | ) | | — | | | 19,522 | |
Sale of reserves | | | — | | | (967 | ) | | — | | | — | | | (967 | ) |
Other | | | (321 | ) | | 1,092 | | | 7 | | | — | | | 778 | |
| | | | | | | | | | | | |
Balance at December 31, 2007 | | | 174,211 | | | 84,048 | | | 1,110 | | | — | | | 259,369 | |
Sales of oil and natural gas, net | | | (24,834 | ) | | (22,191 | ) | | 1,906 | | | — | | | (45,119 | ) |
Net changes in prices and production costs | | | (212,520 | ) | | (7,298 | ) | | (481 | ) | | — | | | (220,299 | ) |
Net change in development costs | | | 7,795 | | | (30,943 | ) | | (62 | ) | | (451 | ) | | (23,661 | ) |
Extensions and discoveries | | | — | | | — | | | — | | | — | | | — | |
Revisions of previous quantity estimates | | | (26,219 | ) | | (11,419 | ) | | (105 | ) | | 9,737 | | | (28,006 | ) |
Previously estimated development costs incurred | | | — | | | (5,475 | ) | | — | | | — | | | (5,475 | ) |
Net change in income taxes | | | 81,846 | | | 5,329 | | | (2,712 | ) | | 38 | | | 84,501 | |
Accretion of discount | | | 26,260 | | | 8,938 | | | 111 | | | — | | | 35,309 | |
Sale of reserves | | | — | | | — | | | — | | | — | | | — | |
Other | | | (7,976 | ) | | 6,059 | | | 112 | | | (46 | ) | | (1,851 | ) |
| | | | | | | | | | | | |
Balance at December 31, 2008 | | $ | 18,563 | | $ | 27,048 | | $ | (121 | ) | $ | 9,278 | | $ | 54,768 | |
Sales of oil and natural gas, net | | | (10,379 | ) | | (4,753 | ) | | (72 | ) | | — | | | (15,204 | ) |
Net changes in prices and production costs | | | 18,069 | | | — | | | — | | | — | | | 18,069 | |
Net change in development costs | | | (22,579 | ) | | — | | | — | | | — | | | (22,579 | ) |
Extensions and discoveries | | | — | | | — | | | — | | | — | | | — | |
Revisions of previous quantity estimates | | | 11,531 | | | — | | | — | | | — | | | 11,531 | |
Previously estimated development costs incurred | | | — | | | — | | | — | | | — | | | — | |
Net change in income taxes | | | (7,774 | ) | | — | | | — | | | — | | | (7,774 | ) |
Accretion of discount | | | 2,511 | | | — | | | — | | | — | | | 2,511 | |
Sale of reserves | | | — | | | (22,295 | ) | | 193 | | | (9,278 | ) | | (31,380 | ) |
Other | | | 6,827 | | | — | | | — | | | — | | | 6,827 | |
| | | | | | | | | | | | |
Balance at December 31, 2009 | | $ | 16,769 | | $ | — | | $ | — | | $ | — | | $ | 16,769 | |
| | | | | | | | | | | | |
F-49
Table of Contents
TOREADOR RESOURCES CORPORATION
NOTES TO CONSOLIDATED FINANCIAL STATEMENTS — (Continued)
The following table shows the cash flow summary for the year ended December 31, 2009, using the year end oil price of $74.75 per BBL.
| | | | | | | | | | | | | | | | |
As of and for the year ended December 31, 2009 | | | | | | | | | | | | | | | | |
Future cash inflows | | $ | 400,310 | | $ | — | | $ | — | | $ | — | | $ | 400,310 | |
Future production costs | | | 187,900 | | | — | | | — | | | — | | | 187,900 | |
Future development costs | | | 60,160 | | | — | | | — | | | — | | | 60,160 | |
Future income tax expense | | | 45,024 | | | — | | | — | | | — | | | 45,024 | |
| | | | | | | | | | | | |
Future net cash flows | | | 107,226 | | | — | | | — | | | — | | | 107,226 | |
10% annual discount for estimated timing of cash flows | | | 67,858 | | | — | | | — | | | — | | | 67,858 | |
| | | | | | | | | | | | |
Standardized measure of discounted future net cash flows related to proved reserves | | $ | 39,368 | | $ | — | | $ | — | | $ | — | | $ | 39,368 | |
| | | | | | | | | | | | |
The following are the principal sources of change in the standardized measure using a year end oil price of $74.75 per BBL:
| | | | | | | | | | | | | | | | |
Balance at December 31, 2008 | | $ | 18,563 | | $ | 27,048 | | $ | (121 | ) | $ | 9,278 | | $ | 54,768 | |
Sales of oil and natural gas, net | | | (10,379 | ) | | (4,753 | ) | | (72 | ) | | — | | | (15,204 | ) |
Net changes in prices and production costs | | | 56,916 | | | — | | | — | | | — | | | 56,916 | |
Net change in development costs | | | (22,579 | ) | | — | | | — | | | — | | | (22,579 | ) |
Extensions and discoveries | | | — | | | — | | | — | | | — | | | — | |
Revisions of previous quantity estimates | | | 21,642 | | | — | | | — | | | — | | | 21,642 | |
Previously estimated development costs incurred | | | — | | | — | | | — | | | — | | | — | |
Net change in income taxes | | | (18,784 | ) | | — | | | — | | | — | | | (18,784 | ) |
Accretion of discount | | | 2,511 | | | — | | | — | | | — | | | 2,511 | |
Sale of reserves | | | — | | | (22,295 | ) | | 193 | | | (9,278 | ) | | (31,380 | ) |
Other | | | (8,522 | ) | | — | | | — | | | — | | | (8,522 | ) |
| | | | | | | | | | | | |
Balance at December 31, 2009 | | $ | 39,368 | | $ | — | | $ | — | | $ | — | | $ | 39,368 | |
| | | | | | | | | | | | |
F-50