Exhibit 99.2

| Gaffney, Cline & Associates Ltd | | Bentley Hall |
| Blacknest, Alton |
| Hampshire GU34 4PU |
| United Kingdom |
Technical and Management Advisers to the Petroleum Industry Internationally Since 1962 Registered London No. 1122740 | | Telephone: +44 (0) 1420 525366 Facsimile: +44 (0) 1420 525367 email: gcauk@gaffney-cline.com www.gaffney-cline.com |
CJF/E2126.02/nxd/0422 | 11th March, 2010 |
Mr. Craig McKenzie,
President and Chief Executive Officer,
Toreador Resources Corporation,
9 rue Scribe,
75009 Paris,
France.
Dear Mr. McKenzie,
UNITED STATES SECURITIES AND EXCHANGE COMMISSION COMPLIANT RESERVES FOR CERTAIN OF TOREADOR’S FRENCH OIL PRODUCING ASSETS AS AT 31ST DECEMBER, 2009
INTRODUCTION
In accordance with your instructions, Gaffney, Cline & Associates Ltd (GCA) has carried out an audit of the oil and gas Reserves of certain Paris Basin assets owned by Toreador Resources Corporation (Toreador) as at 31st December, 2009. This audit has been carried out in accordance with the United States Securities and Exchange Commission (SEC) Rule 4-10 of the Securities Exchange Act of 1934, with due regard for the amendments to that Rule, which were introduced in 2009 for reserves reporting effective from 2010.
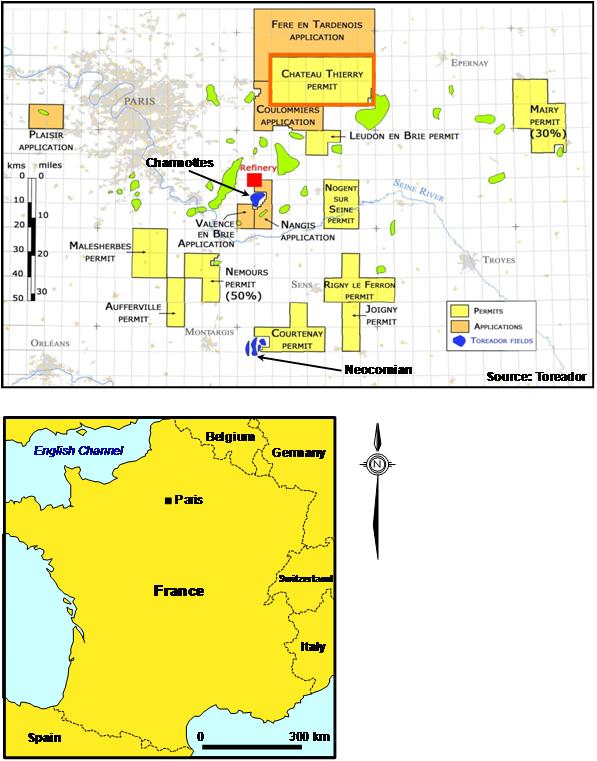
Toreador operates three main producing assets namely, the Neocomian Fields, Charmottes (Triassic) and Charmottes (Dogger) and has 100% equity in all of these fields. The Neocomian fields are very mature with over 50 years of production and 350 wells have been drilled since discovery in 1958. The Charmottes fields were discovered 1984, and over 14 wells have been drilled in the Dogger reservoir and 4 wells in the Triassic.
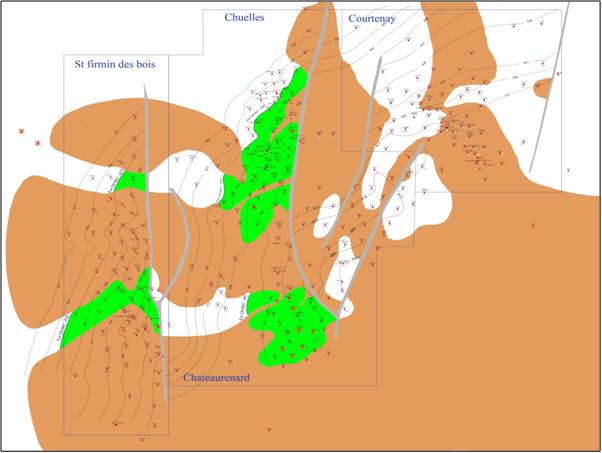
The location of these fields is shown in Figure 0.1.
Toreador provided to GCA a data set of technical information, including geological, geophysical and engineering data and reports, together with financial data and development plans. Further Toreador provided a copy of the third party Reserves Audit for year-end, 2008. GCA has also had several meetings and discussions with Toreador technical and managerial personnel. In carrying out this review GCA has relied on the accuracy and completeness of the information received from Toreador.
Industry standard abbreviations are contained in the attached Glossary in Appendix I, some or all of which have been used in this report.
The Proved, Proved plus Probable, and Proved plus Probable plus Possible Reserves are reported gross since Toreador is the 100% owner of the assets.
UNITED KINGDOM UNITED STATES SINGAPORE AUSTRALIA ARGENTINA UAE RUSSIA KAZAKHSTAN
FIGURE 0.1
LOCATION OF TOREADOR FIELDS
In preparation of this report, GCA has maintained, and continues to maintain, a strict consultant-client relationship with Toreador. The firm’s management and employees have been, and continue to be, independent of Toreador in the services they provide, including the provision of the opinion expressed in this report and have no interest in any assets or share capital of Toreador, or
2
in the promotion of Toreador. GCA’s remuneration was not in any way contingent on reported Reserves estimates.
This report must only be used for the purpose for which it was intended.
SUMMARY
The assets audited in the Paris Basin are all producing fields. On the basis of the technical and commercial information made available, GCA has conducted its audit as of 31st December, 2009, of the Proved, Proved plus Probable, and Proved plus Probable plus Possible Reserves for these fields. Fields under development, and exploration prospects associated with the fields and developments have not formed part of this audit.
The Toreador SEC Reserves at 31st December, 2009 are summarised in Table 0.1.
The Net Present Values (NPVs) for Proved, Proved plus Probable and Proved plus Probable plus Possible Reserves are presented in Table 0.2 and the relevant cash flows are shown in Appendix II.
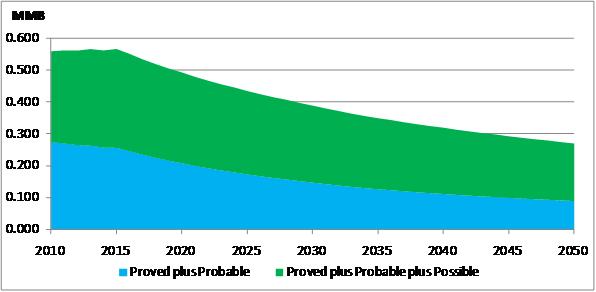
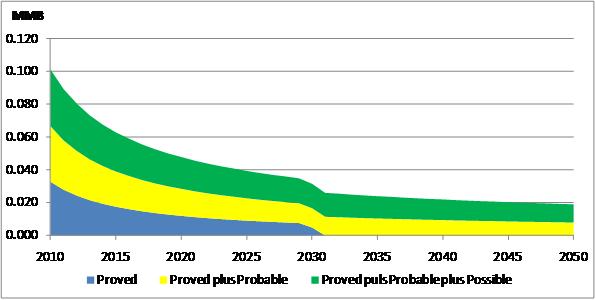
The Reserves reported here are subject to an economic limit test (ELT). The Neocomian fields and Charmottes have been analysed as single units with each of the parts being considered within the whole. The aggregated production profiles are shown in Figures 0.2 to 0.5.
GCA also considered the effect of using the old methodology using the Brent oil price at the date of assessment. The Brent price at year end, 2009 was U.S.$ 77.67/Bbl. This resulted in no changes to the Reserves shown in Table 0.1 but resulted in different NPV’s as shown in Table 0.3. The relevant cash flows are presented in Appendix III.
The reported volumes are based on professional geological and engineering judgement, and are subject to future revisions, upward or downward, as a result of future operations or as new information becomes available.
It should be noted that the estimated production profiles for these fields are relatively long and the level of uncertainty over production and operational performance will increase with time.
TABLE 0.1
SUMMARY OF GROSS RESERVES
AS AT 31st DECEMBER, 2009
| | Proved | | Proved + | | Proved +
Probable + | |
Field | | PDP
(MMBbl) | | PUD
(MMBbl) | | Total
(MMBbl) | | Probable
(MMBbl) | | Possible
(MMBbl) | |
Neocomian Complex | | 4.996 | | 0.422 | | 5.418 | | 8.188 | | 13.153 | |
Charmottes Triassic | | 0.086 | | — | | 0.086 | | 0.339 | | 0.378 | |
Charmottes Dogger | | 0.301 | | — | | 0.301 | | 0.611 | | 0.810 | |
Total | | 5.383 | | 0.422 | | 5.805 | | 9.138 | | 14.340 | |
Notes:
1. GCA’s 1Q, 2010 Brent price scenario was used to establish the economic limit of each field.
2. Totals may not add up due to rounding.
3
TABLE 0.2
SUMMARY OF DISCOUNTED POST TAX FUTURE NET CASH FLOWS
BASED ON NEW SEC RULE FOR OIL PRICE
FOR PROVED, PROVED PLUS PROBABLE AND
PROVED PLUS PROBABLE PLUS POSSIBLE RESERVES
AS AT 31st DECEMBER, 2009
| | NPV10 (U.S.$ MM) | |
Field | | Proved | | Proved +
Probable | | Proved +
Probable +
Possible | |
Neocomian Complex | | 12.03 | | 20.09 | | 33.27 | |
Charmottes | | 4.17 | | 6.91 | | 7.80 | |
Total | | 16.20 | | 27.00 | | 41.07 | |
TABLE 0.3
SUMMARY OF DISCOUNTED POST TAX FUTURE NET CASH FLOWS
BASED ON BRENT OIL PRICE OF U.S.$77.67/BBL AT YEAR END 2009
FOR PROVED, PROVED PLUS PROBABLE AND
PROVED PLUS PROBABLE PLUS POSSIBLE RESERVES
AS AT 31st DECEMBER, 2009
| | NPV10 (U.S.$ MM) | |
Field | | Proved | | Proved +
Probable | | Proved +
Probable +
Possible | |
Neocomian Complex | | 33.56 | | 46.25 | | 66.43 | |
Charmottes | | 6.61 | | 10.65 | | 11.93 | |
Total | | 40.17 | | 56.90 | | 78.36 | |
4
FIGURE 0.2
NEOCOMIAN PROVED PRODUCTION PROFILES
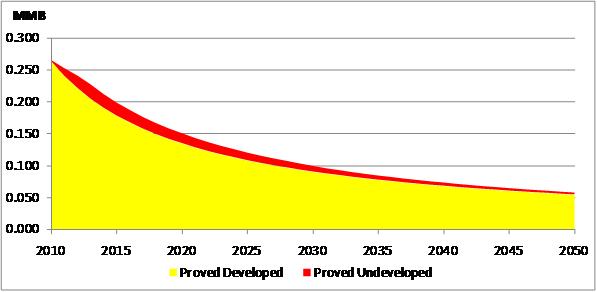
FIGURE 0.3
NEOCOMIAN PROVED PLUS POSSIBLE AND PROVED PLUS POSSIBLE PLUS PROBABLE PRODUCTION PROFILES
5
FIGURE 0.4
CHARMOTTES — TRIASSIC PRODUCTION PROFILES

FIGURE 0.5
CHARMOTTES — DOGGER PRODUCTION PROFILES
6
DISCUSSION
1. BACKGROUND
Toreador holds a 100% interest in Exploitation permits covering the Neocomian Complex, consisting of four oilfields, and the Charmottes fields producing oil in the Paris Basin, France. The location of the fields is shown in Figure 0.1 and Figure 1.1. Exploration prospects exist in the locality but these Prospective Resources are not included in this audit.
FIGURE 1.1
NEOCOMIAN FIELDS
The Exploitation permits that cover the Neocomian and Charmottes Fields expire in 2011 and 2013 respectively. These Exploitation permits can be normally be renewed for period of 25 years. Although the French government has no obligation to renew the exploitation permits, it is understood that renewals have always been granted as long as the operator demonstrates continued financial and technical capabilities. Toreador has already applied for a renewal for the Neocomian permit (December, 2008) extensions and will apply for a renewal of the Charmottes permit in 2010. GCA has accepetd that the permit renewals will be granted and that the economic terms of the permits will not be altered on renewal.
7
1.1 Methodology and Data Availability
Reserves have been estimated using a variety of tools including the investigation of a range of decline curve analyses (DCA) and full field simulation models. All of the results obtained have been reviewed by senior GCA staff to ensure that the appropriate methodologies and approaches were used and that the results are sustainable.
Toreador provided GCA with a dataset that included production databases (OFM), and a dynamic reservoir model (Eclipse). These data were supported by some presentations and reports, and commercial and economic information on the individual fields and assets. During the audit Toreador provided GCA with additional information and material to clarify and substantiate its analysis.
2. GEOLOGICAL SETTING
The Paris Basin is France’s largest onshore sedimentary basin, and has been producing hydrocarbons from 1958 until present. This saucer shaped mature intracratonic basin has a maximum thickness of 3,000 m at its centre and lies on Y pattern basement fault system formed during the Variscan (Hercynian) orogeny. The basin first evolved due Permo-Triassic extension, which caused rifting and subsidence of the basin. This transgressional period saw the deposition of organic-rich black shales, known as the Liassic shales. These shales were overlain by the Dogger Carbonates, followed by the Malm limestone.
The Paris Basin emerged at the end of the Jurassic when tectonic subsidence ceased, giving way to uplift and erosion. During the Lower Cretacous weak east-west compression arose due to the Austrian phase, continued sedimentation followed and the North-South faults were reactivated. In the Middle to Upper Cretaceous subsidence occurred causing the reactivation of the NW-SE Bray fault. This aided the maturation and expulsion of the hydrocarbons from the Liassic source rocks. Resulting from the depression the sea returned depositing the Upper Cretaceous chalk. By the end of the Cretaceous there were low rates of tectonic subsidence occurring, and a second phase of North-South compression caused by the Pyrenean orogeny followed in the early Eocene. This created new E-W faults, inverted the existing E-W faults, caused wrenching of the NW-SE and NE-SW faults, and some uplift and erosion of the borders of the basin. More recently the Alpine orogenic cycle has caused NW-SE compression and uplift which resulted in the Paris basin taking its current shape. A sedimentological column is shown in Figure 1.2.
8
FIGURE 1.2
PARIS BASIN — SEDIMENTOLOGICAL COLUMN
9
3. NEOCOMIAN FIELDS
The Neocomian Fields are very mature, and have undergone over 50 years of production. They consist of high porosity sandstone reservoirs, which were deposited at the end of the Cretaceous Period after substantial erosion had occurred. The sands have been proved to be of excellent reservoir quality, but are in channel systems and are very thin, and therefore it yields only small fields. The Main Source rock is the upper Liassic Toarcian marine shales, from which mature oil migrates to the Dogger carbonates before undergoing secondary migration to saturate the Neocomian sandstones during the Oligocene rift period.
This asset consists of five oil fields with three sandstone reservoirs. Approximately 32 MMBbl has been produced via a mature water injection process involving over 350 wells and over 50 years of production. Current performance is around 800 bopd from approximately 80 wells with an average water-cut of 96%. A high quality OFM production database exists.
The reservoirs are shallow (approx 600 m), the produced oil is under saturated and viscous (40 cP), and the reservoirs are highly permeable. Toreador recently completed re-mapping the fields and reservoirs (R1, R2 and R3) which resulted in a more geologically reasonable interpretation. Field boundaries are now defined by faults and structural closures / OWC’s. Toreador has not yet calculated STOIIP based on its new iso-pach maps, but the previous mapping resulted in a STOIIP of 104.7 MMBbl.
Toreador performed a reserves analysis using DCA with wells grouped into reservoirs and/or fields and used a technical production limit of 3 bopd per well and 99% water-cut.
GCA has reviewed Toreador’s DCA analysis and has used the total field (i.e. all wells) analyses in order to estimate Reserves. Thus GCA uses the linear cumulative oil production versus oil cut (Figure 3.1) as the basis for the low case; an oil rate versus time hyperbolic curve for the mid case (Figure 3.2) and cumulative oil production versus log oil-cut (%) for the high case (Figure 3.3). Further GCA has assumed that Toreador accesses 4 of the proposed PUD opportunities in the low case and 8 of them in the mid and high cases.
GCA estimates Proved, Proved plus Probable, and Proved plus Probable plus Possible Reserves of 5.418 MMBbl, 8.188 MMBbl and 13.153 MMBbl respectively.
10
FIGURE 3.1
NEOCOMIAN - CUMULATIVE OIL PRODUCTION VS. OIL CUT %
11
FIGURE 3.2
NEOCOMIAN - OIL RATE VS. TIME
12
FIGURE 3.3
NEOCOMIAN - CUMULATIVE PRODUCTION VS. OIL CUT %
4. CHARMOTTES FIELDS
4.1 Dogger
The Dogger carbonate reservoirs are subdivided into the Bathonian Limestone and the Lower Callovian Limestone. The older carbonate, the Bathonian Limestone consists of both low energy lagoonal and high energy oolithic shelf facies. The oolithic carbonate platform protected the lagoon from marine influences. The younger Callovian carbonate platform deposits cover the Bathonian deposits, and consist of mostly oolithic facies representing a more restricted lagoon carbonate deposits. The high energy environment results in the excellent reservoir properties.
The main source rock for the Dogger play is the Liassic Toarcian marine shales. This type II source rock is currently in the oil window in the centre of the basin and is the principal source rock for oils in the Paris Basin. Primary migration of the oil occurred along the faults and saturated the Dogger reservoir in the Eocene- Oligocene in the West of the basin, and during the Turonian-Maastrichtian in the East.
This carbonate reservoir is located at approx 1,700 m and is comprised of four layers with both matrix and fracture porosity/permeability. No pressure depletion is evident and the field’s production mechanism is an imbibition process whereby the matrix reservoir charges fractures connected to wellbores. A well cycling programme was initiated recently with good results. There are approximately 6 production wells currently producing a total of ~100 bopd and historic oil and water production data are stored in an OFM database.
13
The oil is under saturated with a bubble point pressure of 12 bars (reservoir pressure of 180 bars) and has a viscosity of 3 cP. Toreador’s current STOIIP estimate is 5.6 MMBbl and the gross reservoir thickness is estimated to be 30 m. GCA has reviewed Toreador’s in-place volumes and considers them to be reasonable.
GCA reviewed Toreador’s analysis and used a DCA (hyperbolic curve) methodology for estimating reserves. GCA thus estimates Proved, Proved plus Probable, and Proved plus Probable plus Possible Reserves of 0.301 MMBbl, 0.611 MMBbl, 0.810 MMBbl respectively.
4.2 Triassic
The Triassic Keuper Sandstones have three sub-divisions. The first is the Donnemarie Sandstone, which consists of bioturbated clays and represents a coastal plain environment. The formation is 60 m thick, 20 m of which is sandstone. The second sub-set of the Keuper is the Chaunoy Sandstone, which is located west of the Paris basin and is part of a braided fluvial system. The last is the Rheatic, which consists of both continental and marine sandstones, both of which underlie shaley deposits forming productive traps. These reservoirs are sealed by 400 m thick Liassic shale.
The source rocks feeding these reservoirs are the Lower to Middle Liassic marine shales, known as the Lotharingian and the Domerian. Both were deposited in a calm marine environment and are micaceous, with the Domerian containing macro- and mirco-fossils. For these Liassic source rocks, maturation and lateral migration occurred during the Upper Cretaceous period.
This deeper (approx 2,500 m) low permeability sandstone reservoir is producing approximately 20 bopd via solution gas drive. Reservoir pressure has declined from approximately 260 to 150 bars and potential exists to convert an existing non-producing well into a water injector. Preliminary Eclipse modelling indicates recovery of an incremental 0.3 MMBbl by converting well Ch-6 to water injection; however, this only results in a 15% recovery factor. Identification of an optimised water injection project would likely yield higher incremental recovery.
GCA reviewed the Eclipse model and performed some basic quality checks and then used the Eclipse model to run suitable cases for reserve estimation. The base case assumes that the current producer (CHL1) continues producing, whilst the mid-case assumes one (i.e. CHL2) well is sidetracked as a second producer and one well (CHL6) is converted to a water injector. Additionally, the high case assumes a higher water injection pressure. The resulting production profiles were used to determine the reserve estimates.
GCA estimates Proved, Proved plus Probable, and Proved plus Probable plus Possible Reserves of 0.086 MMBbl, 0.339 MMBbl and 0.378 MMBbl respectively.
5. CAPEX AND OPEX
Toreador’s CAPEX and OPEX estimates for these fields were reviewed by GCA. GCA has added some additional CAPEX in later years for the Neocomian complex as it was believed that additional workovers and wells would be required in order meet the production profiles as given below:
· Ten workovers per year at a cost of U.S.$40 M each;
· Two wells re-drilled every year, primarily to replace unserviceable wells, until 2023, and then one each year up to 2034 with an estimated cost of U.S.$1.24 MM per well; and
· Some additional facilities in 2015 to 17, primarily to replace and/or improve water injection handling capabilities at a cost of U.S.$15 MM.
14
GCA has also increased the variable OPEX for the Neocomian as it is believed that as the wells get older and the level of produced water increases during field life more maintenance etc will be required in order to keep the wells productive.
For the Charmottes fields GCA has assumed 1 workover (at a cost of U.S.$40 M each) every two years and no additional re-drills.
6. ECONOMIC ANALYSIS
GCA has constructed a cash flow model to estimate the Economic Limit, Reserves and Net Present Values for the Charmottes and Neocomian fields.
In performing this assessment, the following economic, commercial and fiscal assumptions have been made:
· The relevant elements of the fiscal regime in France is summarised in the table below:
France Fiscal Summary
Royalty/Tax | | Annual Production
(MTon) | | Rate
(Pre-1980 Wells) | | Rate
(Post-1980 Wells) | |
Royalty | | 0-50 | | 8% | | 0% | |
| 50-100 | | 20% | | 6% | |
| 100-300 | | 30% | | 9% | |
| > 300 | | 30% | | 12% | |
Local Tax | | €15.39/ton | |
· Oil Price: A flat Brent oil price of U.S.$59.91/bbl, which represents the 12 month prior average for Brent crude based on the oil price on the first day of each of the 12 months, except in the case where year-end 2009 pricing was used. Adjustments to this price are made for each Field Group using the price differential to reflect the actual sales prices achievable due to crude quality differentials to Brent;
· Neocomian and Charmottes crude oil are priced at discounts of U.S.$2.925/Bbl and U.S.$2.30/Bbl respectively to Brent;
· CAPEX has been based on Toreador’s Plan for the period 2010 to 2011 inclusive. In future years GCA has assumed additional CAPEX and OPEX as described in section 5;
· Operating cost is unescalated and based on information provided by Toreador;
· Exchange rate: A flat exchange rate of U.S.$1.4:Euro 1, which represents the average exchange rate in 2009; and
· Cash flow summaries are shown in Appendix II.
QUALIFICATIONS
GCA is an independent international energy advisory group of almost 50 years’ standing, whose expertise includes petroleum reservoir evaluation and economic analysis.
The report is based on information compiled by professional Associates of GCA.
15
BASIS OF OPINION
This assessment has been conducted within the context of GCA’s understanding of the effects of petroleum legislation, taxation, and other regulations that currently apply to these properties. However, GCA is not in a position to attest to property title, financial interest relationships or encumbrances thereon for any part of the appraised properties.
Sincerely yours,
GAFFNEY, CLINE & ASSOCIATES
| /s/ Brian Rhodes | |
Brian Rhodes |
16
List of Standard Oil Industry Terms and Abbreviations
ABEX | | Abandonment Expenditure |
ACQ | | Annual Contract Quantity |
oAPI | | Degrees API (American Petroleum Institute) |
AAPG | | American Association of Petroleum Geologists |
AVO | | Amplitude versus Offset |
A$ | | Australian Dollars |
B | | Billion (109) |
Bbl | | Barrels |
/Bbl | | per barrel |
BBbl | | Billion Barrels |
BHA | | Bottom Hole Assembly |
BHC | | Bottom Hole Compensated |
Bscf or Bcf | | Billion standard cubic feet |
Bscfd or Bcfd | | Billion standard cubic feet per day |
Bm3 | | Billion cubic metres |
bcpd | | Barrels of condensate per day |
BHP | | Bottom Hole Pressure |
blpd | | Barrels of liquid per day |
bpd | | Barrels per day |
boe | | Barrels of oil equivalent @ xxx mcf/bbl |
boepd | | Barrels of oil equivalent per day @ xxx mcf/bbl |
BOP | | Blow Out Preventer |
bopd | | Barrels of oil per day |
BS&W | | Bottom sediment and water |
BTU | | British Thermal Units |
bwpd | | Barrels of water per day |
CBM | | Coal Bed Methane |
CO2 | | Carbon Dioxide |
CAPEX | | Capital Expenditure |
CCGT | | Combined Cycle Gas Turbine |
cm | | centimetres |
CMM | | Coal Mine Methane |
CNG | | Compressed Natural Gas |
Cp | | Centipoise (a measure of viscosity) |
CSG | | Coal Seam Gas |
CT | | Corporation Tax |
DCQ | | Daily Contract Quantity |
Deg C | | Degrees Celsius |
Deg F | | Degrees Fahrenheit |
DHI | | Direct Hydrocarbon Indicator |
DST | | Drill Stem Test |
DWT | | Dead-weight ton |
E&A | | Exploration & Appraisal |
E&P | | Exploration and Production |
EBIT | | Earnings before Interest and Tax |
EBITDA | | Earnings before interest, tax, depreciation and amortisation |
EI | | Entitlement Interest |
EIA | | Environmental Impact Assessment |
EMV | | Expected Monetary Value |
EOR | | Enhanced Oil Recovery |
EUR | | Estimated Ultimate Recovery |
FDP | | Field Development Plan |
GLOSSARY (Cont’d.)
FEED | | Front End Engineering and Design |
FPSO | | Floating Production, Storage and Offloading |
FSO | | Floating Storage and Offloading |
ft | | Foot/feet |
Fx | | Foreign Exchange Rate |
g | | gram |
g/cc | | grams per cubic centimetre |
gal | | gallon |
gal/d | | gallons per day |
G&A | | General and Administrative costs |
GBP | | Pounds Sterling |
GDT | | Gas Down to |
GIIP | | Gas initially in place |
Gj | | Gigajoules (one billion Joules) |
GOR | | Gas Oil Ratio |
GTL | | Gas to Liquids |
GWC | | Gas water contact |
HDT | | Hydrocarbons Down to |
HSE | | Health, Safety and Environment |
HSFO | | High Sulphur Fuel Oil |
HUT | | Hydrocarbons up to |
H2S | | Hydrogen Sulphide |
IOR | | Improved Oil Recovery |
IPP | | Independent Power Producer |
IRR | | Internal Rate of Return |
J | | Joule (Metric measurement of energy. I kilojoule = 0.9478 BTU) |
k | | Permeability |
KB | | Kelly Bushing |
KJ | | Kilojoules (one Thousand Joules) |
kl | | Kilolitres |
km | | Kilometres |
km2 | | Square kilometres |
kPa | | Thousands of Pascals (measurement of pressure) |
KW | | Kilowatt |
KWh | | Kilowatt hour |
LKG | | Lowest Known Gas |
LKH | | Lowest Known Hydrocarbons |
LKO | | Lowest Known Oil |
LNG | | Liquefied Natural Gas |
LoF | | Life of Field |
LPG | | Liquefied Petroleum Gas |
LTI | | Lost Time Injury |
LWD | | Logging while drilling |
m | | Metres |
M | | Thousand |
m3 | | Cubic metres |
Mcf or Mscf | | Thousand standard cubic feet |
MCM | | Management Committee Meeting |
MMcf or MMscf | | Million standard cubic feet |
m3d | | Cubic metres per day |
mD | | Measure of Permeability in millidarcies |
MD | | Measured Depth |
GLOSSARY (Cont’d.)
MDT | | Modular Dynamic Tester |
Mean | | Arithmetic average of a set of numbers |
Median | | Middle value in a set of values |
MFT | | Multi Formation Tester |
mg/l | | milligrames per litre |
MJ | | Megajoules (One Million Joules) |
Mm3 | | Thousand Cubic metres |
Mm3d | | Thousand Cubic metres per day |
MM | | Million |
MMBbl | | Millions of barrels |
MMBTU | | Millions of British Thermal Units |
Mode | | Value that exists most frequently in a set of values = most likely |
Mscfd | | Thousand standard cubic feet per day |
MMscfd | | Million standard cubic feet per day |
MW | | Megawatt |
MWD | | Measuring While Drilling |
MWh | | Megawatt hour |
mya | | Million years ago |
NGL | | Natural Gas Liquids |
N2 | | Nitrogen |
NPV | | Net Present Value |
OBM | | Oil Based Mud |
OCM | | Operating Committee Meeting |
ODT | | Oil down to |
OPEX | | Operating Expenditure |
OWC | | Oil Water Contact |
p.a. | | Per annum |
Pa | | Pascals (metric measurement of pressure) |
P&A | | Plugged and Abandoned |
PDP | | Proved Developed Producing |
PI | | Productivity Index |
PJ | | Petajoules (1015 Joules) |
PSDM | | Post Stack Depth Migration |
psi | | Pounds per square inch |
psia | | Pounds per square inch absolute |
psig | | Pounds per square inch gauge |
PUD | | Proved Undeveloped |
PVT | | Pressure volume temperature |
P10 | | 10% Probability |
P50 | | 50% Probability |
P90 | | 90% Probability |
Rf | | Recovery factor |
RFT | | Repeat Formation Tester |
RT | | Rotary Table |
Rw | | Resistivity of water |
SCAL | | Special core analysis |
cf or scf | | Standard Cubic Feet |
cfd or scfd | | Standard Cubic Feet per day |
scf/ton | | Standard cubic foot per ton |
SL | | Straight line (for depreciation) |
so | | Oil Saturation |
SPE | | Society of Petroleum Engineers |
GLOSSARY (Cont’d.)
SPEE | | Society of Petroleum Evaluation Engineers |
ss | | Subsea |
stb | | Stock tank barrel |
STOIIP | | Stock tank oil initially in place |
sw | | Water Saturation |
T | | Tonnes |
TD | | Total Depth |
Te | | Tonnes equivalent |
THP | | Tubing Head Pressure |
TJ | | Terajoules (1012 Joules) |
Tscf or Tcf | | Trillion standard cubic feet |
TCM | | Technical Committee Meeting |
TOC | | Total Organic Carbon |
TOP | | Take or Pay |
Tpd | | Tonnes per day |
TVD | | True Vertical Depth |
TVDss | | True Vertical Depth Subsea |
USGS | | United States Geological Survey |
U.S.$ | | United States Dollar |
VSP | | Vertical Seismic Profiling |
WC | | Water Cut |
WI | | Working Interest |
WPC | | World Petroleum Council |
WTI | | West Texas Intermediate |
wt% | | Weight percent |
1H05 | | First half (6 months) of 2005 (example of date) |
2Q06 | | Second quarter (3 months) of 2006 (example of date) |
2D | | Two dimensional |
3D | | Three dimensional |
4D | | Four dimensional |
1P | | Proved Reserves |
2P | | Proved plus Probable Reserves |
3P | | Proved plus Probable plus Possible Reserves |
% | | Percentage |
APPENDIX II
ELT Profiles and Cash Flows for the Neocomian and Charmottes Fields

| | France Gross Field (100%) Working Interest Cashflow Analysis Unescalated Prices & Costs | | |
| | Nominal Net Present Values | |
Field: | Neocomian | | as at 01-Jan-10 (US$ MM) | |
Case: | 1P | | Disc Rate | | Pre-Tax | | Post-Tax | |
| | 10.0 | % | 23.39 | | 12.03 | |
| | Developed | | Undeveloped | | Field | | | | Net | | Capital | | Operating | | Pre Tax | | Corporate | | Post Tax | |
Period
Beginning | | Production
MMB | | Price
US$/Bbl | | Production
MMB | | Price
US$/Bbl | | Revenue
US$ MM | | Royalty
US$ MM | | Revenue
US$ MM | | Costs
US$ MM | | Costs
US$ MM | | NCF
US$ MM | | Tax
US$ MM | | NCF
US$ MM | |
Jan-10 | | 0.263 | | 56.99 | | 0.002 | | 56.99 | | 15.11 | | 1.38 | | 13.73 | | 3.30 | | 4.29 | | 6.14 | | 3.04 | | 3.10 | |
Jan-11 | | 0.240 | | 56.99 | | 0.012 | | 56.99 | | 14.38 | | 1.30 | | 13.08 | | 3.30 | | 4.16 | | 5.63 | | 2.75 | | 2.87 | |
Jan-12 | | 0.222 | | 56.99 | | 0.019 | | 56.99 | | 13.73 | | 1.23 | | 12.49 | | 2.60 | | 4.03 | | 5.86 | | 2.51 | | 3.35 | |
Jan-13 | | 0.205 | | 56.99 | | 0.023 | | 56.99 | | 12.95 | | 1.16 | | 11.79 | | | | 3.89 | | 7.90 | | 2.33 | | 5.57 | |
Jan-14 | | 0.190 | | 56.99 | | 0.021 | | 56.99 | | 12.07 | | 1.09 | | 10.99 | | | | 3.73 | | 7.26 | | 2.11 | | 5.15 | |
Jan-15 | | 0.178 | | 56.99 | | 0.020 | | 56.99 | | 11.31 | | 1.02 | | 10.28 | | 7.48 | | 5.69 | | -2.88 | | 0.98 | | -3.86 | |
Jan-16 | | 0.168 | | 56.99 | | 0.019 | | 56.99 | | 10.65 | | 0.97 | | 9.69 | | 7.48 | | 5.44 | | -3.24 | | 0.61 | | -3.85 | |
Jan-17 | | 0.158 | | 56.99 | | 0.018 | | 56.99 | | 10.02 | | 0.91 | | 9.11 | | 7.48 | | 5.21 | | -3.58 | | 0.25 | | -3.82 | |
Jan-18 | | 0.149 | | 56.99 | | 0.017 | | 56.99 | | 9.48 | | 0.87 | | 8.62 | | 2.48 | | 5.01 | | 1.13 | | 0.07 | | 1.06 | |
Jan-19 | | 0.142 | | 56.99 | | 0.016 | | 56.99 | | 8.99 | | 0.82 | | 8.17 | | 2.48 | | 4.83 | | 0.86 | | | | 0.86 | |
Jan-20 | | 0.135 | | 56.99 | | 0.015 | | 56.99 | | 8.57 | | 0.79 | | 7.78 | | 2.48 | | 4.67 | | 0.64 | | | | 0.64 | |
Jan-21 | | 0.128 | | 56.99 | | 0.015 | | 56.99 | | 8.15 | | 0.75 | | 7.40 | | 2.48 | | 4.51 | | 0.41 | | | | 0.41 | |
Jan-22 | | 0.123 | | 56.99 | | 0.014 | | 56.99 | | 7.78 | | 0.72 | | 7.06 | | 2.48 | | 4.37 | | 0.21 | | | | 0.21 | |
Jan-23 | | 0.117 | | 56.99 | | 0.013 | | 56.99 | | 7.44 | | 0.69 | | 6.75 | | 2.48 | | 4.25 | | 0.02 | | | | 0.02 | |
Jan-24 | | 0.113 | | 56.99 | | 0.012 | | 56.99 | | 7.14 | | 0.66 | | 6.48 | | 1.24 | | 4.14 | | 1.10 | | | | 1.10 | |
Jan-25 | | 0.108 | | 56.99 | | 0.012 | | 56.99 | | 6.84 | | 0.64 | | 6.20 | | 1.24 | | 4.02 | | 0.94 | | | | 0.94 | |
Jan-26 | | 0.104 | | 56.99 | | 0.011 | | 56.99 | | 6.57 | | 0.61 | | 5.96 | | 1.24 | | 3.92 | | 0.79 | | | | 0.79 | |
Jan-27 | | 0.100 | | 56.99 | | 0.011 | | 56.99 | | 6.32 | | 0.59 | | 5.73 | | 1.24 | | 3.83 | | 0.66 | | | | 0.66 | |
Jan-28 | | 0.097 | | 56.99 | | 0.010 | | 56.99 | | 6.10 | | 0.57 | | 5.53 | | 1.24 | | 3.75 | | 0.54 | | | | 0.54 | |
Jan-29 | | 0.093 | | 56.99 | | 0.009 | | 56.99 | | 5.87 | | 0.55 | | 5.32 | | 1.24 | | 3.66 | | 0.41 | | | | 0.41 | |
Jan-30 | | 0.090 | | 56.99 | | 0.009 | | 56.99 | | 5.66 | | 0.53 | | 5.13 | | 1.24 | | 3.59 | | 0.30 | | | | 0.30 | |
Jan-31 | | 0.088 | | 56.99 | | 0.008 | | 56.99 | | 5.44 | | 0.51 | | 4.93 | | 1.24 | | 3.50 | | 0.18 | | | | 0.18 | |
Jan-32 | | 0.085 | | 56.99 | | 0.008 | | 56.99 | | 5.28 | | 0.50 | | 4.78 | | 1.24 | | 3.44 | | 0.10 | | | | 0.10 | |
Jan-33 | | 0.082 | | 56.99 | | 0.007 | | 56.99 | | 5.10 | | 0.48 | | 4.61 | | 1.24 | | 3.38 | | - 0.00 | | | | -0.00 | |
Jan-34 | | 0.080 | | 56.99 | | 0.007 | | 56.99 | | 4.94 | | 0.47 | | 4.47 | | 1.24 | | 3.32 | | - 0.09 | | | | -0.09 | |
Jan-35 | | 0.078 | | 56.99 | | 0.006 | | 56.99 | | 4.79 | | 0.46 | | 4.34 | | | | 3.26 | | 1.07 | | | | 1.07 | |
Jan-36 | | 0.076 | | 56.99 | | 0.006 | | 56.99 | | 4.66 | | 0.44 | | 4.22 | | | | 3.21 | | 1.00 | | | | 1.00 | |
Jan-37 | | 0.074 | | 56.99 | | 0.006 | | 56.99 | | 4.52 | | 0.43 | | 4.09 | | | | 3.16 | | 0.93 | | | | 0.93 | |
Jan-38 | | 0.072 | | 56.99 | | 0.005 | | 56.99 | | 4.39 | | 0.42 | | 3.97 | | | | 3.11 | | 0.86 | | | | 0.86 | |
Jan-39 | | 0.070 | | 56.99 | | 0.005 | | 56.99 | | 4.27 | | 0.41 | | 3.86 | | | | 3.07 | | 0.79 | | | | 0.79 | |
Jan-40 | | 0.068 | | 56.99 | | 0.005 | | 56.99 | | 4.17 | | 0.40 | | 3.77 | | | | 3.03 | | 0.74 | | | | 0.74 | |
Jan-41 | | 0.066 | | 56.99 | | 0.005 | | 56.99 | | 4.05 | | 0.39 | | 3.66 | | | | 2.99 | | 0.67 | | | | 0.67 | |
Jan-42 | | 0.065 | | 56.99 | | 0.004 | | 56.99 | | 3.95 | | 0.38 | | 3.57 | | | | 2.95 | | 0.62 | | | | 0.62 | |
Jan-43 | | 0.063 | | 56.99 | | 0.004 | | 56.99 | | 3.85 | | 0.37 | | 3.48 | | | | 2.91 | | 0.57 | | | | 0.57 | |
Jan-44 | | 0.062 | | 56.99 | | 0.004 | | 56.99 | | 3.76 | | 0.36 | | 3.40 | | | | 2.88 | | 0.52 | | | | 0.52 | |
Jan-45 | | 0.061 | | 56.99 | | 0.004 | | 56.99 | | 3.67 | | 0.35 | | 3.31 | | | | 2.84 | | 0.47 | | | | 0.47 | |
Jan-46 | | 0.059 | | 56.99 | | 0.004 | | 56.99 | | 3.58 | | 0.35 | | 3.23 | | | | 2.81 | | 0.42 | | | | 0.42 | |
Jan-47 | | 0.058 | | 56.99 | | 0.003 | | 56.99 | | 3.50 | | 0.34 | | 3.16 | | | | 2.78 | | 0.38 | | | | 0.38 | |
Jan-48 | | 0.057 | | 56.99 | | 0.003 | | 56.99 | | 3.43 | | 0.33 | | 3.10 | | | | 2.76 | | 0.34 | | | | 0.34 | |
Jan-49 | | 0.056 | | 56.99 | | 0.003 | | 56.99 | | 3.35 | | 0.33 | | 3.02 | | | | 2.72 | | 0.30 | | | | 0.30 | |
Jan-50 | | 0.055 | | 56.99 | | 0.003 | | 56.99 | | 3.27 | | 0.32 | | 2.95 | | | | 2.70 | | 0.26 | | | | 0.26 | |
| | | | | | | | | | | | | | | | | | | | | | | | | |
Totals
(2010-2050) | | 4.498 | | MMBbl | | 0.400 | | MMBbl | | 279.09 | | 25.90 | | 253.20 | | 60.16 | | 151.82 | | 41.22 | | 1 4.64 | | 26.58 | |
Totals
(>2050): | | 0.498 | | MMBbl | | 0.022 | | MMBbl | | 29.63 | | 2.90 | | 26.73 | | — | | 25.82 | | 0.91 | | 0.06 | | 0.85 | |
| | France Gross Field (100%) Working Interest Cashflow Analysis Unescalated Prices & Costs | | |
| | Nominal Net Present Values | |
Field: | Neocomian | | as at 01-Jan-10 (US$ MM) | |
Case: | 2P | | Disc Rate | | Pre-Tax | | Post-Tax | |
| | 10.0 | % | 35.19 | | 20.09 | |
| | Developed | | Undeveloped | | Field | | | | Net | | Capital | | Operating | | Pre Tax | | Corporate | | Post Tax | |
Period
Beginning | | Production
MMB | | Price
US$/Bbl | | Production
MMB | | Price
US$/Bbl | | Revenue
US$ MM | | Royalty
US$ MM | | Revenue
US$ MM | | Costs
US$ MM | | Costs
US$ MM | | NCF
US$ MM | | Tax
US$ MM | | NCF
US$ MM | |
Jan-10 | | 0.273 | | 56.99 | | 0.002 | | 56.99 | | 15.64 | | 1.41 | | 14.23 | | 3.30 | | 4.39 | | 6.54 | | 3.17 | | 3.37 | |
Jan-11 | | 0.258 | | 56.99 | | 0.012 | | 56.99 | | 15.40 | | 1.36 | | 14.03 | | 3.30 | | 4.34 | | 6.39 | | 3.01 | | 3.38 | |
Jan-12 | | 0.246 | | 56.99 | | 0.019 | | 56.99 | | 15.10 | | 1.31 | | 13.79 | | 2.60 | | 4.29 | | 6.90 | | 2.86 | | 4.04 | |
Jan-13 | | 0.233 | | 56.99 | | 0.030 | | 56.99 | | 15.00 | | 1.28 | | 13.72 | | 2.60 | | 4.27 | | 6.85 | | 2.76 | | 4.10 | |
Jan-14 | | 0.223 | | 56.99 | | 0.035 | | 56.99 | | 14.67 | | 1.23 | | 13.43 | | 2.60 | | 4.21 | | 6.63 | | 2.60 | | 4.03 | |
Jan-15 | | 0.213 | | 56.99 | | 0.044 | | 56.99 | | 14.61 | | 1.21 | | 13.41 | | 7.48 | | 6.92 | | -0.99 | | 1.43 | | -2.42 | |
Jan-16 | | 0.204 | | 56.99 | | 0.041 | | 56.99 | | 14.00 | | 1.15 | | 12.85 | | 7.48 | | 6.69 | | -1.32 | | 1.07 | | -2.40 | |
Jan-17 | | 0.196 | | 56.99 | | 0.039 | | 56.99 | | 13.38 | | 1.10 | | 12.28 | | 7.48 | | 6.46 | | -1.66 | | 0.71 | | -2.37 | |
Jan-18 | | 0.188 | | 56.99 | | 0.037 | | 56.99 | | 12.83 | | 1.05 | | 11.77 | | 2.48 | | 6.25 | | 3.04 | | 0.53 | | 2.51 | |
Jan-19 | | 0.181 | | 56.99 | | 0.035 | | 56.99 | | 12.32 | | 1.01 | | 11.31 | | 2.48 | | 6.06 | | 2.76 | | 0.35 | | 2.41 | |
Jan-20 | | 0.175 | | 56.99 | | 0.033 | | 56.99 | | 11.87 | | 0.97 | | 10.89 | | 2.48 | | 5.89 | | 2.52 | | 0.30 | | 2.22 | |
Jan-21 | | 0.169 | | 56.99 | | 0.031 | | 56.99 | | 11.39 | | 0.93 | | 10.46 | | 2.48 | | 5.72 | | 2.26 | | 0.24 | | 2.02 | |
Jan-22 | | 0.163 | | 56.99 | | 0.030 | | 56.99 | | 10.98 | | 0.90 | | 10.08 | | 2.48 | | 5.56 | | 2.03 | | 0.17 | | 1.86 | |
Jan-23 | | 0.158 | | 56.99 | | 0.028 | | 56.99 | | 10.58 | | 0.87 | | 9.72 | | 2.48 | | 5.42 | | 1.82 | | 0.10 | | 1.72 | |
Jan-24 | | 0.153 | | 56.99 | | 0.027 | | 56.99 | | 10.24 | | 0.84 | | 9.40 | | 1.24 | | 5.29 | | 2.87 | | 0.09 | | 2.79 | |
Jan-25 | | 0.148 | | 56.99 | | 0.025 | | 56.99 | | 9.87 | | 0.81 | | 9.06 | | 1.24 | | 5.15 | | 2.67 | | 0.23 | | 2.45 | |
Jan-26 | | 0.144 | | 56.99 | | 0.024 | | 56.99 | | 9.55 | | 0.78 | | 8.77 | | 1.24 | | 5.03 | | 2.49 | | 0.38 | | 2.12 | |
Jan-27 | | 0.139 | | 56.99 | | 0.023 | | 56.99 | | 9.24 | | 0.76 | | 8.48 | | 1.24 | | 4.92 | | 2.33 | | 0.53 | | 1.80 | |
Jan-28 | | 0.136 | | 56.99 | | 0.021 | | 56.99 | | 8.97 | | 0.73 | | 8.24 | | 1.24 | | 4.82 | | 2.18 | | 0.52 | | 1.66 | |
Jan-29 | | 0.132 | | 56.99 | | 0.020 | | 56.99 | | 8.67 | | 0.71 | | 7.96 | | 1.24 | | 4.71 | | 2.02 | | 0.51 | | 1.51 | |
Jan-30 | | 0.128 | | 56.99 | | 0.019 | | 56.99 | | 8.41 | | 0.69 | | 7.72 | | 1.24 | | 4.61 | | 1.87 | | 0.50 | | 1.37 | |
Jan-31 | | 0.125 | | 56.99 | | 0.018 | | 56.99 | | 8.13 | | 0.67 | | 7.47 | | 1.24 | | 4.51 | | 1.72 | | 0.49 | | 1.23 | |
Jan-32 | | 0.122 | | 56.99 | | 0.016 | | 56.99 | | 7.88 | | 0.65 | | 7.24 | | 1.24 | | 4.41 | | 1.58 | | 0.49 | | 1.10 | |
Jan-33 | | 0.119 | | 56.99 | | 0.015 | | 56.99 | | 7.64 | | 0.63 | | 7.01 | | 1.24 | | 4.32 | | 1.45 | | 0.48 | | 0.97 | |
Jan-34 | | 0.116 | | 56.99 | | 0.014 | | 56.99 | | 7.42 | | 0.61 | | 6.81 | | 1.24 | | 4.24 | | 1.33 | | 0.44 | | 0.89 | |
Jan-35 | | 0.113 | | 56.99 | | 0.013 | | 56.99 | | 7.23 | | 0.59 | | 6.63 | | | | 4.17 | | 2.46 | | 0.45 | | 2.01 | |
Jan-36 | | 0.111 | | 56.99 | | 0.013 | | 56.99 | | 7.06 | | 0.58 | | 6.48 | | | | 4.11 | | 2.37 | | 0.46 | | 1.91 | |
Jan-37 | | 0.108 | | 56.99 | | 0.012 | | 56.99 | | 6.86 | | 0.56 | | 6.30 | | | | 4.03 | | 2.26 | | 0.46 | | 1.80 | |
Jan-38 | | 0.106 | | 56.99 | | 0.011 | | 56.99 | | 6.69 | | 0.55 | | 6.14 | | | | 3.97 | | 2.17 | | 0.48 | | 1.69 | |
Jan-39 | | 0.104 | | 56.99 | | 0.011 | | 56.99 | | 6.53 | | 0.54 | | 5.99 | | | | 3.91 | | 2.08 | | 0.49 | | 1.59 | |
Jan-40 | | 0.102 | | 56.99 | | 0.010 | | 56.99 | | 6.39 | | 0.53 | | 5.86 | | | | 3.86 | | 2.00 | | 0.50 | | 1.50 | |
Jan-41 | | 0.099 | | 56.99 | | 0.010 | | 56.99 | | 6.22 | | 0.51 | | 5.71 | | | | 3.79 | | 1.91 | | 0.51 | | 1.40 | |
Jan-42 | | 0.097 | | 56.99 | | 0.009 | | 56.99 | | 6.08 | | 0.50 | | 5.58 | | | | 3.74 | | 1.83 | | 0.53 | | 1.31 | |
Jan-43 | | 0.096 | | 56.99 | | 0.009 | | 56.99 | | 5.94 | | 0.49 | | 5.45 | | | | 3.69 | | 1.76 | | 0.55 | | 1.21 | |
Jan-44 | | 0.094 | | 56.99 | | 0.008 | | 56.99 | | 5.82 | | 0.48 | | 5.34 | | | | 3.65 | | 1.70 | | 0.57 | | 1.13 | |
Jan-45 | | 0.092 | | 56.99 | | 0.008 | | 56.99 | | 5.68 | | 0.47 | | 5.21 | | | | 3.59 | | 1.62 | | 0.54 | | 1.08 | |
Jan-46 | | 0.090 | | 56.99 | | 0.007 | | 56.99 | | 5.56 | | 0.46 | | 5.10 | | | | 3.55 | | 1.55 | | 0.52 | | 1.04 | |
Jan-47 | | 0.089 | | 56.99 | | 0.007 | | 56.99 | | 5.45 | | 0.45 | | 5.00 | | | | 3.51 | | 1.49 | | 0.50 | | 0.99 | |
Jan-48 | | 0.087 | | 56.99 | | 0.007 | | 56.99 | | 5.35 | | 0.44 | | 4.91 | | | | 3.47 | | 1.44 | | 0.48 | | 0.96 | |
Jan-49 | | 0.085 | | 56.99 | | 0.006 | | 56.99 | | 5.23 | | 0.43 | | 4.79 | | | | 3.42 | | 1.37 | | 0.46 | | 0.91 | |
Jan-50 | | 0.084 | | 56.99 | | 0.006 | | 56.99 | | 5.12 | | 0.42 | | 4.70 | | | | 3.39 | | 1.31 | | 0.44 | | 0.88 | |
| | | | | | | | | | | | | | | | | | | | | | | | | |
Totals
(2010-2050) | | 5.900 | | MMBbl | | 0.786 | | MMBbl | | 380.98 | | 31.68 | | 349.30 | | 65.36 | | 188.31 | | 95.63 | | 31.87 | | 63.75 | |
Totals
(>2050): | | 1.432 | | MMBbl | | 0.071 | | MMBbl | | 85.66 | | 7.12 | | 78.54 | | — | | 61.47 | | 17.07 | | 5.69 | | 11.38 | |
| | France Gross Field (100%) Working Interest Cashflow Analysis Unescalated Prices & Costs | | |
| | Nominal Net Present Values | |
Field: | Neocomian | | as at 01-Jan-10 (US$ MM) | |
Case: | 3P | | Disc Rate | | Pre-Tax | | Post-Tax | |
| | 10.0 | % | 54.97 | | 33.27 | |
| | Developed | | Undeveloped | | Field | | | | Net | | Capital | | Operating | | Pre Tax | | Corporate | | Post Tax | |
Period
Beginning | | Production
MMB | | Price
US$/Bbl | | Production
MMB | | Price
US$/Bbl | | Revenue
US$ MM | | Royalty
US$ MM | | Revenue
US$ MM | | Costs
US$ MM | | Costs
US$ MM | | NCF
US$ MM | | Tax
US$ MM | | NCF
US$ MM | |
Jan-10 | | 0.283 | | 56.99 | | 0.002 | | 56.99 | | 16.24 | | 1.50 | | 14.73 | | 3.30 | | 4.50 | | 6.93 | | 3.30 | | 3.63 | |
Jan-11 | | 0.280 | | 56.99 | | 0.012 | | 56.99 | | 16.62 | | 1.52 | | 15.11 | | 3.30 | | 4.57 | | 7.24 | | 3.29 | | 3.94 | |
Jan-12 | | 0.277 | | 56.99 | | 0.019 | | 56.99 | | 16.89 | | 1.52 | | 15.36 | | 2.60 | | 4.62 | | 8.14 | | 3.27 | | 4.87 | |
Jan-13 | | 0.273 | | 56.99 | | 0.030 | | 56.99 | | 17.26 | | 1.53 | | 15.73 | | 2.60 | | 4.69 | | 8.44 | | 3.29 | | 5.15 | |
Jan-14 | | 0.270 | | 56.99 | | 0.035 | | 56.99 | | 17.35 | | 1.53 | | 15.83 | | 2.60 | | 4.71 | | 8.52 | | 3.23 | | 5.29 | |
Jan-15 | | 0.267 | | 56.99 | | 0.044 | | 56.99 | | 17.67 | | 1.53 | | 16.13 | | 7.48 | | 8.05 | | 0.60 | | 1.96 | | -1.36 | |
Jan-16 | | 0.264 | | 56.99 | | 0.041 | | 56.99 | | 17.39 | | 1.51 | | 15.88 | | 7.48 | | 7.95 | | 0.45 | | 1.66 | | -1.21 | |
Jan-17 | | 0.260 | | 56.99 | | 0.039 | | 56.99 | | 17.05 | | 1.48 | | 15.56 | | 7.48 | | 7.82 | | 0.26 | | 1.35 | | -1.09 | |
Jan-18 | | 0.257 | | 56.99 | | 0.037 | | 56.99 | | 16.75 | | 1.46 | | 15.29 | | 2.48 | | 7.71 | | 5.10 | | 1.22 | | 3.88 | |
Jan-19 | | 0.254 | | 56.99 | | 0.035 | | 56.99 | | 16.46 | | 1.44 | | 15.03 | | 2.48 | | 7.61 | | 4.94 | | 1.08 | | 3.86 | |
Jan-20 | | 0.252 | | 56.99 | | 0.033 | | 56.99 | | 16.22 | | 1.42 | | 14.81 | | 2.48 | | 7.52 | | 4.81 | | 1.06 | | 3.75 | |
Jan-21 | | 0.248 | | 56.99 | | 0.031 | | 56.99 | | 15.91 | | 1.39 | | 14.52 | | 2.48 | | 7.40 | | 4.64 | | 1.04 | | 3.61 | |
Jan-22 | | 0.245 | | 56.99 | | 0.030 | | 56.99 | | 15.65 | | 1.37 | | 14.28 | | 2.48 | | 7.30 | | 4.50 | | 0.99 | | 3.51 | |
Jan-23 | | 0.242 | | 56.99 | | 0.028 | | 56.99 | | 15.39 | | 1.35 | | 14.04 | | 2.48 | | 7.21 | | 4.36 | | 0.95 | | 3.41 | |
Jan-24 | | 0.240 | | 56.99 | | 0.027 | | 56.99 | | 15.18 | | 1.33 | | 13.85 | | 1.24 | | 7.13 | | 5.48 | | 0.95 | | 4.53 | |
Jan-25 | | 0.236 | | 56.99 | | 0.025 | | 56.99 | | 14.90 | | 1.31 | | 13.59 | | 1.24 | | 7.02 | | 5.33 | | 1.11 | | 4.22 | |
Jan-26 | | 0.233 | | 56.99 | | 0.024 | | 56.99 | | 14.66 | | 1.29 | | 13.37 | | 1.24 | | 6.93 | | 5.20 | | 1.28 | | 3.92 | |
Jan-27 | | 0.230 | | 56.99 | | 0.023 | | 56.99 | | 14.43 | | 1.27 | | 13.16 | | 1.24 | | 6.85 | | 5.07 | | 1.44 | | 3.63 | |
Jan-28 | | 0.228 | | 56.99 | | 0.021 | | 56.99 | | 14.23 | | 1.25 | | 12.98 | | 1.24 | | 6.78 | | 4.97 | | 1.45 | | 3.52 | |
Jan-29 | | 0.225 | | 56.99 | | 0.020 | | 56.99 | | 13.98 | | 1.23 | | 12.75 | | 1.24 | | 6.68 | | 4.83 | | 1.44 | | 3.39 | |
Jan-30 | | 0.222 | | 56.99 | | 0.019 | | 56.99 | | 13.76 | | 1.21 | | 12.55 | | 1.24 | | 6.60 | | 4.71 | | 1.45 | | 3.26 | |
Jan-31 | | 0.220 | | 56.99 | | 0.018 | | 56.99 | | 13.52 | | 1.19 | | 12.33 | | 1.24 | | 6.51 | | 4.58 | | 1.44 | | 3.14 | |
Jan-32 | | 0.218 | | 56.99 | | 0.016 | | 56.99 | | 13.31 | | 1.17 | | 12.14 | | 1.24 | | 6.43 | | 4.47 | | 1.45 | | 3.02 | |
Jan-33 | | 0.214 | | 56.99 | | 0.015 | | 56.99 | | 13.08 | | 1.15 | | 11.92 | | 1.24 | | 6.34 | | 4.34 | | 1.45 | | 2.89 | |
Jan-34 | | 0.212 | | 56.99 | | 0.014 | | 56.99 | | 12.88 | | 1.13 | | 11.74 | | 1.24 | | 6.27 | | 4.23 | | 1.41 | | 2.82 | |
Jan-35 | | 0.209 | | 56.99 | | 0.013 | | 56.99 | | 12.69 | | 1.12 | | 11.57 | | | | 6.20 | | 5.37 | | 1.42 | | 3.95 | |
Jan-36 | | 0.207 | | 56.99 | | 0.013 | | 56.99 | | 12.54 | | 1.10 | | 11.43 | | | | 6.14 | | 5.29 | | 1.43 | | 3.86 | |
Jan-37 | | 0.204 | | 56.99 | | 0.012 | | 56.99 | | 12.32 | | 1.09 | | 11.24 | | | | 6.06 | | 5.17 | | 1.44 | | 3.74 | |
Jan-38 | | 0.202 | | 56.99 | | 0.011 | | 56.99 | | 12.15 | | 1.07 | | 11.08 | | | | 6.00 | | 5.08 | | 1.44 | | 3.63 | |
Jan-39 | | 0.199 | | 56.99 | | 0.011 | | 56.99 | | 11.98 | | 1.05 | | 10.92 | | | | 5.94 | | 4.99 | | 1.46 | | 3.53 | |
Jan-40 | | 0.197 | | 56.99 | | 0.010 | | 56.99 | | 11.84 | | 1.04 | | 10.80 | | | | 5.88 | | 4.91 | | 1.47 | | 3.44 | |
Jan-41 | | 0.195 | | 56.99 | | 0.010 | | 56.99 | | 11.64 | | 1.02 | | 10.62 | | | | 5.81 | | 4.81 | | 1.48 | | 3.33 | |
Jan-42 | | 0.192 | | 56.99 | | 0.009 | | 56.99 | | 11.48 | | 1.01 | | 10.47 | | | | 5.75 | | 4.72 | | 1.49 | | 3.23 | |
Jan-43 | | 0.190 | | 56.99 | | 0.009 | | 56.99 | | 11.32 | | 0.99 | | 10.32 | | | | 5.69 | | 4.63 | | 1.50 | | 3.13 | |
Jan-44 | | 0.188 | | 56.99 | | 0.008 | | 56.99 | | 11.19 | | 0.98 | | 10.21 | | | | 5.64 | | 4.56 | | 1.52 | | 3.04 | |
Jan-45 | | 0.185 | | 56.99 | | 0.008 | | 56.99 | | 11.01 | | 0.97 | | 10.04 | | | | 5.58 | | 4.47 | | 1.49 | | 2.98 | |
Jan-46 | | 0.183 | | 56.99 | | 0.007 | | 56.99 | | 10.86 | | 0.95 | | 9.91 | | | | 5.52 | | 4.39 | | 1.46 | | 2.92 | |
Jan-47 | | 0.181 | | 56.99 | | 0.007 | | 56.99 | | 10.71 | | 0.94 | | 9.77 | | | | 5.46 | | 4.31 | | 1.44 | | 2.87 | |
Jan-48 | | 0.179 | | 56.99 | | 0.007 | | 56.99 | | 10.59 | | 0.93 | | 9.66 | | | | 5.42 | | 4.24 | | 1.41 | | 2.83 | |
Jan-49 | | 0.177 | | 56.99 | | 0.006 | | 56.99 | | 10.42 | | 0.91 | | 9.51 | | | | 5.36 | | 4.15 | | 1.38 | | 2.77 | |
Jan-50 | | 0.174 | | 56.99 | | 0.006 | | 56.99 | | 10.28 | | 0.90 | | 9.38 | | | | 5.31 | | 4.08 | | 1.36 | | 2.72 | |
| | | | | | | | | | | | | | | | | | | | | | | | | |
Totals
(2010-2050) | | 9.213 | | MMBbl | | 0.786 | | MMBbl | | 569.79 | | 50.16 | | 519.63 | | 65.36 | | 256.97 | | 197.30 | | 65.76 | | 131.54 | |
Totals
(>2050): | | 3.083 | | MMBbl | | 0.071 | | MMBbl | | 179.73 | | 13.12 | | 166.60 | | — | | 96.46 | | 70.14 | | 23.38 | | 46.76 | |
| | France Gross Field (100%) Working Interest Cashflow Analysis Unescalated Prices & Costs | | |
| | Nominal Net Present Values | |
Field: | Charmottes | | as at 01-Jan-10 (US$ MM) | |
Case: | 1P | | Disc Rate | | Pre-Tax | | Post-Tax | |
| | 10.0 | % | 6.25 | | 4.17 | |
| | Triassic | | Dogger | | Field | | | | Net | | Capital | | Operating | | Pre Tax | | Corporate | | Post Tax | |
Period
Beginning | | Production
MMB | | Price
US$/Bbl | | Production
MMB | | Price
US$/Bbl | | Revenue
US$ MM | | Royalty
US$ MM | | Revenue
US$ MM | | Costs
US$ MM | | Costs
US$ MM | | NCF
US$ MM | | Tax
US$ MM | | NCF
US$ MM | |
Jan-10 | | 0.006 | | 57.61 | | 0.033 | | 57.61 | | 2.21 | | 0.12 | | 2.10 | | | | 0.76 | | 1.33 | | 0.44 | | 0.89 | |
Jan-11 | | 0.005 | | 57.61 | | 0.028 | | 57.61 | | 1.91 | | 0.10 | | 1.81 | | | | 0.72 | | 1.09 | | 0.36 | | 0.72 | |
Jan-12 | | 0.005 | | 57.61 | | 0.024 | | 57.61 | | 1.69 | | 0.09 | | 1.60 | | | | 0.63 | | 0.97 | | 0.32 | | 0.65 | |
Jan-13 | | 0.005 | | 57.61 | | 0.022 | | 57.61 | | 1.52 | | 0.08 | | 1.44 | | | | 0.62 | | 0.81 | | 0.27 | | 0.54 | |
Jan-14 | | 0.005 | | 57.61 | | 0.019 | | 57.61 | | 1.38 | | 0.07 | | 1.31 | | | | 0.55 | | 0.76 | | 0.25 | | 0.51 | |
Jan-15 | | 0.004 | | 57.61 | | 0.018 | | 57.61 | | 1.27 | | 0.07 | | 1.20 | | | | 0.56 | | 0.64 | | 0.21 | | 0.43 | |
Jan-16 | | 0.004 | | 57.61 | | 0.016 | | 57.61 | | 1.18 | | 0.06 | | 1.12 | | | | 0.50 | | 0.62 | | 0.21 | | 0.41 | |
Jan-17 | | 0.004 | | 57.61 | | 0.015 | | 57.61 | | 1.10 | | 0.06 | | 1.04 | | | | 0.52 | | 0.52 | | 0.17 | | 0.35 | |
Jan-18 | | 0.004 | | 57.61 | | 0.014 | | 57.61 | | 1.03 | | 0.05 | | 0.98 | | | | 0.46 | | 0.51 | | 0.17 | | 0.34 | |
Jan-19 | | 0.004 | | 57.61 | | 0.013 | | 57.61 | | 0.97 | | 0.05 | | 0.92 | | | | 0.49 | | 0.43 | | 0.14 | | 0.29 | |
Jan-20 | | 0.004 | | 57.61 | | 0.012 | | 57.61 | | 0.92 | | 0.05 | | 0.87 | | | | 0.43 | | 0.44 | | 0.15 | | 0.29 | |
Jan-21 | | 0.004 | | 57.61 | | 0.011 | | 57.61 | | 0.87 | | 0.05 | | 0.83 | | | | 0.46 | | 0.37 | | 0.12 | | 0.24 | |
Jan-22 | | 0.004 | | 57.61 | | 0.011 | | 57.61 | | 0.83 | | 0.04 | | 0.79 | | | | 0.41 | | 0.38 | | 0.13 | | 0.25 | |
Jan-23 | | 0.004 | | 57.61 | | 0.010 | | 57.61 | | 0.79 | | 0.04 | | 0.75 | | | | 0.44 | | 0.31 | | 0.10 | | 0.21 | |
Jan-24 | | 0.004 | | 57.61 | | 0.010 | | 57.61 | | 0.76 | | 0.04 | | 0.72 | | | | 0.39 | | 0.33 | | 0.11 | | 0.22 | |
Jan-25 | | 0.004 | | 57.61 | | 0.009 | | 57.61 | | 0.73 | | 0.04 | | 0.69 | | | | 0.43 | | 0.27 | | 0.09 | | 0.18 | |
Jan-26 | | 0.004 | | 57.61 | | 0.009 | | 57.61 | | 0.70 | | 0.04 | | 0.67 | | | | 0.38 | | 0.29 | | 0.10 | | 0.19 | |
Jan-27 | | 0.003 | | 57.61 | | 0.008 | | 57.61 | | 0.68 | | 0.04 | | 0.64 | | | | 0.41 | | 0.23 | | 0.08 | | 0.15 | |
Jan-28 | | 0.003 | | 57.61 | | 0.008 | | 57.61 | | 0.66 | | 0.03 | | 0.62 | | | | 0.37 | | 0.26 | | 0.09 | | 0.17 | |
Jan-29 | | 0.003 | | 57.61 | | 0.008 | | 57.61 | | 0.63 | | 0.03 | | 0.60 | | | | 0.40 | | 0.20 | | 0.07 | | 0.13 | |
Jan-30 | | 0.003 | | 57.61 | | 0.005 | | 57.61 | | 0.47 | | 0.02 | | 0.45 | | | | 0.32 | | 0.13 | | 0.04 | | 0.09 | |
| | | | | | | | | | | | | | | | | | | | | | | | | |
Totals
(2010-2050) | | 0.086 | | MMBbl | | 0.301 | | MMBbl | | 22.32 | | 1.18 | | 21.14 | | — | | 10.26 | | 10.89 | | 3.63 | | 7.26 | |
Totals
(>2050): | | — | | MMBbl | | — | | MMBbl | | — | | — | | — | | — | | — | | — | | — | | — | |

| | France Gross Field (100%) Working Interest Cashflow Analysis Unescalated Prices & Costs | | |
| | Nominal Net Present Values | |
Field: | Charmottes | | as at 01-Jan-10 (US$ MM) | |
Case: | 2P | | Disc Rate | | Pre-Tax | | Post-Tax | |
| | 10.0 | % | 10.36 | | 6.91 | |
| | Triassic | | Dogger | | Field | | | | Net | | Capital | | Operating | | Pre Tax | | Corporate | | Post Tax | |
Period
Beginning | | Production
MMB | | Price
US$/Bbl | | Production
MMB | | Price
US$/Bbl | | Revenue
US$ MM | | Royalty
US$ MM | | Revenue
US$ MM | | Costs
US$ MM | | Costs
US$ MM | | NCF
US$ MM | | Tax
US$ MM | | NCF
US$ MM | |
Jan-10 | | 0.010 | | 57.61 | | 0.034 | | 57.61 | | 2.52 | | 0.13 | | 2.38 | | | | 0.84 | | 1.55 | | 0.52 | | 1.03 | |
Jan-11 | | 0.011 | | 57.61 | | 0.030 | | 57.61 | | 2.39 | | 0.13 | | 2.26 | | | | 0.85 | | 1.42 | | 0.47 | | 0.95 | |
Jan-12 | | 0.011 | | 57.61 | | 0.027 | | 57.61 | | 2.19 | | 0.12 | | 2.08 | | | | 0.76 | | 1.32 | | 0.44 | | 0.88 | |
Jan-13 | | 0.010 | | 57.61 | | 0.025 | | 57.61 | | 2.03 | | 0.11 | | 1.93 | | | | 0.76 | | 1.17 | | 0.39 | | 0.78 | |
Jan-14 | | 0.010 | | 57.61 | | 0.023 | | 57.61 | | 1.92 | | 0.10 | | 1.82 | | | | 0.69 | | 1.13 | | 0.38 | | 0.75 | |
Jan-15 | | 0.010 | | 57.61 | | 0.021 | | 57.61 | | 1.83 | | 0.10 | | 1.73 | | | | 0.70 | | 1.03 | | 0.34 | | 0.69 | |
Jan-16 | | 0.010 | | 57.61 | | 0.020 | | 57.61 | | 1.76 | | 0.09 | | 1.67 | | | | 0.65 | | 1.02 | | 0.34 | | 0.68 | |
Jan-17 | | 0.010 | | 57.61 | | 0.019 | | 57.61 | | 1.69 | | 0.09 | | 1.60 | | | | 0.67 | | 0.93 | | 0.31 | | 0.62 | |
Jan-18 | | 0.010 | | 57.61 | | 0.018 | | 57.61 | | 1.64 | | 0.09 | | 1.55 | | | | 0.62 | | 0.94 | | 0.31 | | 0.62 | |
Jan-19 | | 0.011 | | 57.61 | | 0.017 | | 57.61 | | 1.59 | | 0.08 | | 1.51 | | | | 0.64 | | 0.86 | | 0.29 | | 0.58 | |
Jan-20 | | 0.011 | | 57.61 | | 0.016 | | 57.61 | | 1.56 | | 0.08 | | 1.47 | | | | 0.59 | | 0.88 | | 0.29 | | 0.59 | |
Jan-21 | | 0.011 | | 57.61 | | 0.016 | | 57.61 | | 1.52 | | 0.08 | | 1.44 | | | | 0.62 | | 0.81 | | 0.27 | | 0.54 | |
Jan-22 | | 0.011 | | 57.61 | | 0.015 | | 57.61 | | 1.48 | | 0.08 | | 1.41 | | | | 0.58 | | 0.83 | | 0.28 | | 0.55 | |
Jan-23 | | 0.011 | | 57.61 | | 0.014 | | 57.61 | | 1.46 | | 0.08 | | 1.38 | | | | 0.61 | | 0.77 | | 0.26 | | 0.51 | |
Jan-24 | | 0.011 | | 57.61 | | 0.014 | | 57.61 | | 1.43 | | 0.08 | | 1.36 | | | | 0.56 | | 0.80 | | 0.27 | | 0.53 | |
Jan-25 | | 0.011 | | 57.61 | | 0.014 | | 57.61 | | 1.41 | | 0.07 | | 1.33 | | | | 0.60 | | 0.74 | | 0.25 | | 0.49 | |
Jan-26 | | 0.011 | | 57.61 | | 0.013 | | 57.61 | | 1.38 | | 0.07 | | 1.31 | | | | 0.55 | | 0.76 | | 0.25 | | 0.51 | |
Jan-27 | | 0.011 | | 57.61 | | 0.013 | | 57.61 | | 1.36 | | 0.07 | | 1.29 | | | | 0.59 | | 0.71 | | 0.24 | | 0.47 | |
Jan-28 | | 0.011 | | 57.61 | | 0.012 | | 57.61 | | 1.35 | | 0.07 | | 1.28 | | | | 0.54 | | 0.74 | | 0.25 | | 0.49 | |
Jan-29 | | 0.011 | | 57.61 | | 0.012 | | 57.61 | | 1.33 | | 0.07 | | 1.26 | | | | 0.58 | | 0.68 | | 0.23 | | 0.45 | |
Jan-30 | | 0.011 | | 57.61 | | 0.012 | | 57.61 | | 1.31 | | 0.07 | | 1.24 | | | | 0.53 | | 0.71 | | 0.24 | | 0.47 | |
Jan-31 | | 0.011 | | 57.61 | | 0.011 | | 57.61 | | 1.29 | | 0.07 | | 1.23 | | | | 0.57 | | 0.66 | | 0.22 | | 0.44 | |
Jan-32 | | 0.011 | | 57.61 | | 0.011 | | 57.61 | | 1.28 | | 0.07 | | 1.21 | | | | 0.52 | | 0.69 | | 0.23 | | 0.46 | |
Jan-33 | | 0.011 | | 57.61 | | 0.011 | | 57.61 | | 1.26 | | 0.07 | | 1.20 | | | | 0.56 | | 0.64 | | 0.21 | | 0.42 | |
Jan-34 | | 0.011 | | 57.61 | | 0.011 | | 57.61 | | 1.25 | | 0.07 | | 1.18 | | | | 0.52 | | 0.67 | | 0.22 | | 0.45 | |
Jan-35 | | 0.011 | | 57.61 | | 0.010 | | 57.61 | | 1.24 | | 0.07 | | 1.17 | | | | 0.55 | | 0.62 | | 0.21 | | 0.41 | |
Jan-36 | | 0.011 | | 57.61 | | 0.010 | | 57.61 | | 1.23 | | 0.06 | | 1.16 | | | | 0.51 | | 0.65 | | 0.22 | | 0.44 | |
Jan-37 | | 0.011 | | 57.61 | | 0.010 | | 57.61 | | 1.21 | | 0.06 | | 1.15 | | | | 0.55 | | 0.60 | | 0.20 | | 0.40 | |
Jan-38 | | 0.011 | | 57.61 | | 0.010 | | 57.61 | | 1.20 | | 0.06 | | 1.14 | | | | 0.50 | | 0.64 | | 0.21 | | 0.42 | |
Jan-39 | | 0.011 | | 57.61 | | 0.009 | | 57.61 | | 1.19 | | 0.06 | | 1.13 | | | | 0.54 | | 0.59 | | 0.20 | | 0.39 | |
Jan-40 | | 0.011 | | 57.61 | | 0.009 | | 57.61 | | 1.19 | | 0.06 | | 1.12 | | | | 0.50 | | 0.62 | | 0.21 | | 0.41 | |
Jan-41 | | 0.003 | | 57.61 | | 0.009 | | 57.61 | | 0.69 | | 0.04 | | 0.65 | | | | 0.41 | | 0.24 | | 0.08 | | 0.16 | |
Jan-42 | | | | 57.61 | | 0.009 | | 57.61 | | 0.52 | | 0.03 | | 0.49 | | | | 0.33 | | 0.16 | | 0.05 | | 0.11 | |
Jan-43 | | | | 57.61 | | 0.009 | | 57.61 | | 0.51 | | 0.03 | | 0.48 | | | | 0.37 | | 0.11 | | 0.04 | | 0.08 | |
Jan-44 | | | | 57.61 | | 0.009 | | 57.61 | | 0.50 | | 0.03 | | 0.47 | | | | 0.33 | | 0.15 | | 0.05 | | 0.10 | |
Jan-45 | | | | 57.61 | | 0.009 | | 57.61 | | 0.49 | | 0.03 | | 0.47 | | | | 0.36 | | 0.10 | | 0.03 | | 0.07 | |
Jan-46 | | | | 57.61 | | 0.008 | | 57.61 | | 0.48 | | 0.03 | | 0.46 | | | | 0.32 | | 0.14 | | 0.05 | | 0.09 | |
Jan-47 | | | | 57.61 | | 0.008 | | 57.61 | | 0.48 | | 0.03 | | 0.45 | | | | 0.36 | | 0.09 | | 0.03 | | 0.06 | |
Jan-48 | | | | 57.61 | | 0.008 | | 57.61 | | 0.47 | | 0.02 | | 0.44 | | | | 0.32 | | 0.13 | | 0.04 | | 0.08 | |
Jan-49 | | | | 57.61 | | 0.008 | | 57.61 | | 0.46 | | 0.02 | | 0.44 | | | | 0.36 | | 0.08 | | 0.03 | | 0.05 | |
Jan-50 | | | | 57.61 | | 0.008 | | 57.61 | | 0.45 | | 0.02 | | 0.43 | | | | 0.32 | | 0.11 | | 0.04 | | 0.08 | |
| | | | | | | | | | | | | | | | | | | | | | | | | |
Totals
(2010-2050) | | 0.339 | | MMBbl | | 0.573 | | MMBbl | | 52.55 | | 2.77 | | 49.78 | | — | | 22.32 | | 27.47 | | 9.15 | | 18.31 | |
Totals
(>2050): | | — | | MMBbl | | 0.038 | | MMBbl | | 2.18 | | 0.11 | | 2.06 | | — | | 1.67 | | 0.39 | | 0.13 | | 0.26 | |
| | France Gross Field (100%) Working Interest Cashflow Analysis Unescalated Prices & Costs | | |
| | Nominal Net Present Values | |
Field: | Charmottes | | as at 01-Jan-10 (US$ MM) | |
Case: | 3P | | Disc Rate | | Pre-Tax | | Post-Tax | |
| | 10.0 | % | 11.69 | | 7.80 | |
| | Triassic | | Dogger | | Field | | | | Net | | Capital | | Operating | | Pre Tax | | Corporate | | Post Tax | |
Period
Beginning | | Production
MMB | | Price
US$/Bbl | | Production
MMB | | Price
US$/Bbl | | Revenue
US$ MM | | Royalty
US$ MM | | Revenue
US$ MM | | Costs
US$ MM | | Costs
US$ MM | | NCF
US$ MM | | Tax
US$ MM | | NCF
US$ MM | |
Jan-10 | | 0.010 | | 57.61 | | 0.035 | | 57.61 | | 2.55 | | 0.13 | | 2.42 | | | | 0.85 | | 1.57 | | 0.52 | | 1.05 | |
Jan-11 | | 0.011 | | 57.61 | | 0.031 | | 57.61 | | 2.47 | | 0.13 | | 2.34 | | | | 0.87 | | 1.47 | | 0.49 | | 0.98 | |
Jan-12 | | 0.011 | | 57.61 | | 0.029 | | 57.61 | | 2.30 | | 0.12 | | 2.18 | | | | 0.78 | | 1.40 | | 0.47 | | 0.93 | |
Jan-13 | | 0.011 | | 57.61 | | 0.027 | | 57.61 | | 2.17 | | 0.11 | | 2.06 | | | | 0.79 | | 1.27 | | 0.42 | | 0.85 | |
Jan-14 | | 0.011 | | 57.61 | | 0.025 | | 57.61 | | 2.08 | | 0.11 | | 1.97 | | | | 0.73 | | 1.24 | | 0.41 | | 0.83 | |
Jan-15 | | 0.011 | | 57.61 | | 0.024 | | 57.61 | | 2.01 | | 0.11 | | 1.90 | | | | 0.75 | | 1.15 | | 0.38 | | 0.77 | |
Jan-16 | | 0.011 | | 57.61 | | 0.023 | | 57.61 | | 1.95 | | 0.10 | | 1.85 | | | | 0.70 | | 1.16 | | 0.39 | | 0.77 | |
Jan-17 | | 0.011 | | 57.61 | | 0.022 | | 57.61 | | 1.90 | | 0.10 | | 1.80 | | | | 0.72 | | 1.08 | | 0.36 | | 0.72 | |
Jan-18 | | 0.011 | | 57.61 | | 0.021 | | 57.61 | | 1.85 | | 0.10 | | 1.76 | | | | 0.67 | | 1.09 | | 0.36 | | 0.72 | |
Jan-19 | | 0.011 | | 57.61 | | 0.020 | | 57.61 | | 1.82 | | 0.10 | | 1.72 | | | | 0.70 | | 1.02 | | 0.34 | | 0.68 | |
Jan-20 | | 0.012 | | 57.61 | | 0.019 | | 57.61 | | 1.79 | | 0.09 | | 1.70 | | | | 0.65 | | 1.04 | | 0.35 | | 0.69 | |
Jan-21 | | 0.012 | | 57.61 | | 0.019 | | 57.61 | | 1.76 | | 0.09 | | 1.66 | | | | 0.69 | | 0.98 | | 0.33 | | 0.65 | |
Jan-22 | | 0.012 | | 57.61 | | 0.018 | | 57.61 | | 1.73 | | 0.09 | | 1.64 | | | | 0.64 | | 1.00 | | 0.33 | | 0.67 | |
Jan-23 | | 0.012 | | 57.61 | | 0.018 | | 57.61 | | 1.71 | | 0.09 | | 1.62 | | | | 0.67 | | 0.95 | | 0.32 | | 0.63 | |
Jan-24 | | 0.012 | | 57.61 | | 0.017 | | 57.61 | | 1.69 | | 0.09 | | 1.60 | | | | 0.63 | | 0.97 | | 0.32 | | 0.65 | |
Jan-25 | | 0.012 | | 57.61 | | 0.017 | | 57.61 | | 1.67 | | 0.09 | | 1.58 | | | | 0.66 | | 0.92 | | 0.31 | | 0.61 | |
Jan-26 | | 0.012 | | 57.61 | | 0.016 | | 57.61 | | 1.65 | | 0.09 | | 1.56 | | | | 0.62 | | 0.95 | | 0.32 | | 0.63 | |
Jan-27 | | 0.012 | | 57.61 | | 0.016 | | 57.61 | | 1.64 | | 0.09 | | 1.55 | | | | 0.65 | | 0.89 | | 0.30 | | 0.60 | |
Jan-28 | | 0.013 | | 57.61 | | 0.016 | | 57.61 | | 1.63 | | 0.09 | | 1.54 | | | | 0.61 | | 0.93 | | 0.31 | | 0.62 | |
Jan-29 | | 0.013 | | 57.61 | | 0.015 | | 57.61 | | 1.61 | | 0.08 | | 1.52 | | | | 0.65 | | 0.87 | | 0.29 | | 0.58 | |
Jan-30 | | 0.013 | | 57.61 | | 0.015 | | 57.61 | | 1.59 | | 0.08 | | 1.51 | | | | 0.60 | | 0.91 | | 0.30 | | 0.60 | |
Jan-31 | | 0.013 | | 57.61 | | 0.015 | | 57.61 | | 1.58 | | 0.08 | | 1.50 | | | | 0.64 | | 0.86 | | 0.29 | | 0.57 | |
Jan-32 | | 0.013 | | 57.61 | | 0.014 | | 57.61 | | 1.57 | | 0.08 | | 1.49 | | | | 0.60 | | 0.89 | | 0.30 | | 0.59 | |
Jan-33 | | 0.013 | | 57.61 | | 0.014 | | 57.61 | | 1.56 | | 0.08 | | 1.48 | | | | 0.63 | | 0.84 | | 0.28 | | 0.56 | |
Jan-34 | | 0.013 | | 57.61 | | 0.014 | | 57.61 | | 1.55 | | 0.08 | | 1.47 | | | | 0.59 | | 0.87 | | 0.29 | | 0.58 | |
Jan-35 | | 0.013 | | 57.61 | | 0.014 | | 57.61 | | 1.54 | | 0.08 | | 1.46 | | | | 0.63 | | 0.83 | | 0.28 | | 0.55 | |
Jan-36 | | 0.013 | | 57.61 | | 0.013 | | 57.61 | | 1.53 | | 0.08 | | 1.45 | | | | 0.59 | | 0.86 | | 0.29 | | 0.57 | |
Jan-37 | | 0.013 | | 57.61 | | 0.013 | | 57.61 | | 1.52 | | 0.08 | | 1.44 | | | | 0.62 | | 0.81 | | 0.27 | | 0.54 | |
Jan-38 | | 0.013 | | 57.61 | | 0.013 | | 57.61 | | 1.50 | | 0.08 | | 1.43 | | | | 0.58 | | 0.84 | | 0.28 | | 0.56 | |
Jan-39 | | 0.013 | | 57.61 | | 0.013 | | 57.61 | | 1.49 | | 0.08 | | 1.41 | | | | 0.62 | | 0.80 | | 0.27 | | 0.53 | |
Jan-40 | | 0.013 | | 57.61 | | 0.013 | | 57.61 | | 1.48 | | 0.08 | | 1.41 | | | | 0.58 | | 0.83 | | 0.28 | | 0.55 | |
Jan-41 | | 0.003 | | 57.61 | | 0.012 | | 57.61 | | 0.90 | | 0.05 | | 0.85 | | | | 0.47 | | 0.39 | | 0.13 | | 0.26 | |
Jan-42 | | | | 57.61 | | 0.012 | | 57.61 | | 0.70 | | 0.04 | | 0.67 | | | | 0.38 | | 0.29 | | 0.10 | | 0.19 | |
Jan-43 | | | | 57.61 | | 0.012 | | 57.61 | | 0.70 | | 0.04 | | 0.66 | | | | 0.42 | | 0.24 | | 0.08 | | 0.16 | |
Jan-44 | | | | 57.61 | | 0.012 | | 57.61 | | 0.69 | | 0.04 | | 0.65 | | | | 0.37 | | 0.28 | | 0.09 | | 0.18 | |
Jan-45 | | | | 57.61 | | 0.012 | | 57.61 | | 0.68 | | 0.04 | | 0.64 | | | | 0.41 | | 0.23 | | 0.08 | | 0.15 | |
Jan-46 | | | | 57.61 | | 0.012 | | 57.61 | | 0.67 | | 0.04 | | 0.63 | | | | 0.37 | | 0.26 | | 0.09 | | 0.18 | |
Jan-47 | | | | 57.61 | | 0.011 | | 57.61 | | 0.66 | | 0.03 | | 0.63 | | | | 0.41 | | 0.22 | | 0.07 | | 0.15 | |
Jan-48 | | | | 57.61 | | 0.011 | | 57.61 | | 0.65 | | 0.03 | | 0.62 | | | | 0.37 | | 0.25 | | 0.08 | | 0.17 | |
Jan-49 | | | | 57.61 | | 0.011 | | 57.61 | | 0.65 | | 0.03 | | 0.61 | | | | 0.40 | | 0.21 | | 0.07 | | 0.14 | |
Jan-50 | | | | 57.61 | | 0.011 | | 57.61 | | 0.64 | | 0.03 | | 0.60 | | | | 0.36 | | 0.24 | | 0.08 | | 0.16 | |
| | | | | | | | | | | | | | | | | | | | | | | | | |
Totals
(2010-2050) | | 0.378 | | MMBbl | | 0.695 | | MMBbl | | 61.83 | | 3.26 | | 58.58 | | — | | 24.67 | | 33.91 | | 11.30 | | 22.60 | |
Totals
(>2050): | | — | | MMBbl | | 0.115 | | MMBbl | | 6.61 | | 0.35 | | 6.26 | | — | | 4.11 | | 2.14 | | 0.71 | | 1.43 | |
APPENDIX III
ELT Profiles and Cash Flows for the Neocomian and Charmottes Fields
Based On Year-End 2009 Price
| | France Gross Field (100%) Working Interest Cashflow Analysis Year-End 2009 Price | | |
| | Nominal Net Present Values | |
Field: | Neocomian | | as at 01-Jan-10 (US$ MM) | |
Case: | 1P | | Disc Rate | | Pre-Tax | | Post-Tax | |
| | 10.0 | % | 54.81 | | 33.56 | |
| | Developed | | Undeveloped | | Field | | | | Net | | Capital | | Operating | | Pre Tax | | Corporate | | Post Tax | |
Period
Beginning | | Production
MMB | | Price
US$/Bbl | | Production
MMB | | Price
US$/Bbl | | Revenue
US$ MM | | Royalty
US$ MM | | Revenue
US$ MM | | Costs
US$ MM | | Costs
US$ MM | | NCF
US$ MM | | Tax
US$ MM | | NCF
US$ MM | |
Jan-10 | | 0.263 | | 74.75 | | 0.002 | | 74.75 | | 19.82 | | 1.56 | | 18.26 | | 3.30 | | 4.29 | | 10.67 | | 4.55 | | 6.12 | |
Jan-11 | | 0.240 | | 74.75 | | 0.012 | | 74.75 | | 18.87 | | 1.47 | | 17.40 | | 3.30 | | 4.16 | | 9.94 | | 4.19 | | 5.75 | |
Jan-12 | | 0.222 | | 74.75 | | 0.019 | | 74.75 | | 18.01 | | 1.39 | | 16.61 | | 2.60 | | 4.03 | | 9.98 | | 3.89 | | 6.09 | |
Jan-13 | | 0.205 | | 74.75 | | 0.023 | | 74.75 | | 16.98 | | 1.31 | | 15.67 | | | | 3.89 | | 11.79 | | 3.62 | | 8.16 | |
Jan-14 | | 0.190 | | 74.75 | | 0.021 | | 74.75 | | 15.83 | | 1.23 | | 14.61 | | | | 3.73 | | 10.88 | | 3.32 | | 7.56 | |
Jan-15 | | 0.178 | | 74.75 | | 0.020 | | 74.75 | | 14.83 | | 1.15 | | 13.68 | | 7.48 | | 5.69 | | 0.51 | | 2.11 | | -1.60 | |
Jan-16 | | 0.168 | | 74.75 | | 0.019 | | 74.75 | | 13.97 | | 1.09 | | 12.88 | | 7.48 | | 5.44 | | -0.04 | | 1.67 | | -1.71 | |
Jan-17 | | 0.158 | | 74.75 | | 0.018 | | 74.75 | | 13.15 | | 1.03 | | 12.12 | | 7.48 | | 5.21 | | -0.57 | | 1.25 | | -1.82 | |
Jan-18 | | 0.149 | | 74.75 | | 0.017 | | 74.75 | | 12.44 | | 0.98 | | 11.46 | | 2.48 | | 5.01 | | 3.97 | | 1.01 | | 2.96 | |
Jan-19 | | 0.142 | | 74.75 | | 0.016 | | 74.75 | | 11.80 | | 0.93 | | 10.87 | | 2.48 | | 4.83 | | 3.56 | | 0.79 | | 2.77 | |
Jan-20 | | 0.135 | | 74.75 | | 0.015 | | 74.75 | | 11.24 | | 0.89 | | 10.35 | | 2.48 | | 4.67 | | 3.20 | | 0.70 | | 2.50 | |
Jan-21 | | 0.128 | | 74.75 | | 0.015 | | 74.75 | | 10.69 | | 0.85 | | 9.84 | | 2.48 | | 4.51 | | 2.85 | | 0.61 | | 2.24 | |
Jan-22 | | 0.123 | | 74.75 | | 0.014 | | 74.75 | | 10.20 | | 0.81 | | 9.39 | | 2.48 | | 4.37 | | 2.54 | | 0.51 | | 2.03 | |
Jan-23 | | 0.117 | | 74.75 | | 0.013 | | 74.75 | | 9.76 | | 0.78 | | 8.98 | | 2.48 | | 4.25 | | 2.25 | | 0.33 | | 1.92 | |
Jan-24 | | 0.113 | | 74.75 | | 0.012 | | 74.75 | | 9.37 | | 0.75 | | 8.62 | | 1.24 | | 4.14 | | 3.24 | | 0.21 | | 3.03 | |
Jan-25 | | 0.108 | | 74.75 | | 0.012 | | 74.75 | | 8.97 | | 0.72 | | 8.25 | | 1.24 | | 4.02 | | 2.98 | | 0.33 | | 2.65 | |
Jan-26 | | 0.104 | | 74.75 | | 0.011 | | 74.75 | | 8.61 | | 0.69 | | 7.92 | | 1.24 | | 3.92 | | 2.76 | | 0.46 | | 2.29 | |
Jan-27 | | 0.100 | | 74.75 | | 0.011 | | 74.75 | | 8.29 | | 0.67 | | 7.62 | | 1.24 | | 3.83 | | 2.55 | | 0.60 | | 1.95 | |
Jan-28 | | 0.097 | | 74.75 | | 0.010 | | 74.75 | | 8.00 | | 0.65 | | 7.35 | | 1.24 | | 3.75 | | 2.36 | | 0.58 | | 1.78 | |
Jan-29 | | 0.093 | | 74.75 | | 0.009 | | 74.75 | | 7.70 | | 0.62 | | 7.07 | | 1.24 | | 3.66 | | 2.17 | | 0.56 | | 1.61 | |
Jan-30 | | 0.090 | | 74.75 | | 0.009 | | 74.75 | | 7.42 | | 0.60 | | 6.82 | | 1.24 | | 3.59 | | 1.99 | | 0.54 | | 1.45 | |
Jan-31 | | 0.088 | | 74.75 | | 0.008 | | 74.75 | | 7.14 | | 0.58 | | 6.55 | | 1.24 | | 3.50 | | 1.81 | | 0.52 | | 1.29 | |
Jan-32 | | 0.085 | | 74.75 | | 0.008 | | 74.75 | | 6.92 | | 0.57 | | 6.36 | | 1.24 | | 3.44 | | 1.67 | | 0.52 | | 1.16 | |
Jan-33 | | 0.082 | | 74.75 | | 0.007 | | 74.75 | | 6.69 | | 0.55 | | 6.14 | | 1.24 | | 3.38 | | 1.52 | | 0.51 | | 1.01 | |
Jan-34 | | 0.080 | | 74.75 | | 0.007 | | 74.75 | | 6.48 | | 0.53 | | 5.95 | | 1.24 | | 3.32 | | 1.39 | | 0.46 | | 0.93 | |
Jan-35 | | 0.078 | | 74.75 | | 0.006 | | 74.75 | | 6.28 | | 0.52 | | 5.77 | | | | 3.26 | | 2.50 | | 0.46 | | 2.04 | |
Jan-36 | | 0.076 | | 74.75 | | 0.006 | | 74.75 | | 6.12 | | 0.51 | | 5.61 | | | | 3.21 | | 2.40 | | 0.47 | | 1.93 | |
Jan-37 | | 0.074 | | 74.75 | | 0.006 | | 74.75 | | 5.93 | | 0.49 | | 5.44 | | | | 3.16 | | 2.27 | | 0.47 | | 1.81 | |
Jan-38 | | 0.072 | | 74.75 | | 0.005 | | 74.75 | | 5.76 | | 0.48 | | 5.28 | | | | 3.11 | | 2.17 | | 0.47 | | 1.69 | |
Jan-39 | | 0.070 | | 74.75 | | 0.005 | | 74.75 | | 5.60 | | 0.47 | | 5.14 | | | | 3.07 | | 2.07 | | 0.48 | | 1.59 | |
Jan-40 | | 0.068 | | 74.75 | | 0.005 | | 74.75 | | 5.47 | | 0.46 | | 5.01 | | | | 3.03 | | 1.98 | | 0.50 | | 1.49 | |
Jan-41 | | 0.066 | | 74.75 | | 0.005 | | 74.75 | | 5.31 | | 0.44 | | 4.87 | | | | 2.99 | | 1.88 | | 0.50 | | 1.38 | |
Jan-42 | | 0.065 | | 74.75 | | 0.004 | | 74.75 | | 5.18 | | 0.43 | | 4.74 | | | | 2.95 | | 1.80 | | 0.52 | | 1.28 | |
Jan-43 | | 0.063 | | 74.75 | | 0.004 | | 74.75 | | 5.05 | | 0.42 | | 4.63 | | | | 2.91 | | 1.71 | | 0.53 | | 1.18 | |
Jan-44 | | 0.062 | | 74.75 | | 0.004 | | 74.75 | | 4.94 | | 0.41 | | 4.52 | | | | 2.88 | | 1.64 | | 0.55 | | 1.10 | |
Jan-45 | | 0.061 | | 74.75 | | 0.004 | | 74.75 | | 4.81 | | 0.40 | | 4.40 | | | | 2.84 | | 1.56 | | 0.52 | | 1.04 | |
Jan-46 | | 0.059 | | 74.75 | | 0.004 | | 74.75 | | 4.70 | | 0.40 | | 4.30 | | | | 2.81 | | 1.49 | | 0.50 | | 0.99 | |
Jan-47 | | 0.058 | | 74.75 | | 0.003 | | 74.75 | | 4.59 | | 0.39 | | 4.20 | | | | 2.78 | | 1.42 | | 0.47 | | 0.95 | |
Jan-48 | | 0.057 | | 74.75 | | 0.003 | | 74.75 | | 4.50 | | 0.38 | | 4.12 | | | | 2.76 | | 1.36 | | 0.45 | | 0.91 | |
Jan-49 | | 0.056 | | 74.75 | | 0.003 | | 74.75 | | 4.39 | | 0.37 | | 4.02 | | | | 2.72 | | 1.29 | | 0.43 | | 0.86 | |
Jan-50 | | 0.055 | | 74.75 | | 0.003 | | 74.75 | | 4.29 | | 0.36 | | 3.93 | | | | 2.70 | | 1.23 | | 0.41 | | 0.82 | |
| | | | | | | | | | | | | | | | | | | | — | | | | — | |
Totals
(2010-2050) | | 4.498 | | MMBbl | | 0.400 | | MMBbl | | 366.08 | | 29.34 | | 336.74 | | 60.16 | | 151.82 | | 124.77 | | 41.58 | | 83.18 | |
Totals
(>2050): | | 0.498 | | MMBbl | | 0.022 | | MMBbl | | 38.86 | | 3.31 | | 35.55 | | — | | 25.82 | | 9.73 | | 3.24 | | 6.49 | |

| | France Gross Field (100%) Working Interest Cashflow Analysis Year-End 2009 Price | | |
| | Nominal Net Present Values | |
Field: | Neocomian | | as at 01-Jan-10 (US$ MM) | |
Case: | 2P | | Disc Rate | | Pre-Tax | | Post-Tax | |
| | 10.0 | % | 74.44 | | 46.25 | |
| | Developed | | Undeveloped | | Field | | | | Net | | Capital | | Operating | | Pre Tax | | Corporate | | Post Tax | |
Period
Beginning | | Production
MMB | | Price
US$/Bbl | | Production
MMB | | Price
US$/Bbl | | Revenue
US$ MM | | Royalty
US$ MM | | Revenue
US$ MM | | Costs
US$ MM | | Costs
US$ MM | | NCF
US$ MM | | Tax
US$ MM | | NCF
US$ MM | |
Jan-10 | | 0.273 | | 74.75 | | 0.002 | | 74.75 | | 20.51 | | 1.59 | | 18.92 | | 3.30 | | 4.39 | | 11.23 | | 4.73 | | 6.50 | |
Jan-11 | | 0.258 | | 74.75 | | 0.012 | | 74.75 | | 20.19 | | 1.53 | | 18.66 | | 3.30 | | 4.34 | | 11.02 | | 4.55 | | 6.47 | |
Jan-12 | | 0.246 | | 74.75 | | 0.019 | | 74.75 | | 19.81 | | 1.47 | | 18.34 | | 2.60 | | 4.29 | | 11.45 | | 4.37 | | 7.07 | |
Jan-13 | | 0.233 | | 74.75 | | 0.030 | | 74.75 | | 19.68 | | 1.43 | | 18.25 | | 2.60 | | 4.27 | | 11.38 | | 4.27 | | 7.11 | |
Jan-14 | | 0.223 | | 74.75 | | 0.035 | | 74.75 | | 19.24 | | 1.37 | | 17.86 | | 2.60 | | 4.21 | | 11.06 | | 4.07 | | 6.98 | |
Jan-15 | | 0.213 | | 74.75 | | 0.044 | | 74.75 | | 19.17 | | 1.34 | | 17.83 | | 7.48 | | 6.92 | | 3.43 | | 2.91 | | 0.52 | |
Jan-16 | | 0.204 | | 74.75 | | 0.041 | | 74.75 | | 18.37 | | 1.28 | | 17.08 | | 7.48 | | 6.69 | | 2.92 | | 2.49 | | 0.43 | |
Jan-17 | | 0.196 | | 74.75 | | 0.039 | | 74.75 | | 17.55 | | 1.22 | | 16.32 | | 7.48 | | 6.46 | | 2.39 | | 2.06 | | 0.33 | |
Jan-18 | | 0.188 | | 74.75 | | 0.037 | | 74.75 | | 16.82 | | 1.17 | | 15.66 | | 2.48 | | 6.25 | | 6.92 | | 1.82 | | 5.10 | |
Jan-19 | | 0.181 | | 74.75 | | 0.035 | | 74.75 | | 16.15 | | 1.12 | | 15.03 | | 2.48 | | 6.06 | | 6.49 | | 1.60 | | 4.89 | |
Jan-20 | | 0.175 | | 74.75 | | 0.033 | | 74.75 | | 15.56 | | 1.08 | | 14.48 | | 2.48 | | 5.89 | | 6.11 | | 1.50 | | 4.61 | |
Jan-21 | | 0.169 | | 74.75 | | 0.031 | | 74.75 | | 14.94 | | 1.03 | | 13.91 | | 2.48 | | 5.72 | | 5.71 | | 1.39 | | 4.32 | |
Jan-22 | | 0.163 | | 74.75 | | 0.030 | | 74.75 | | 14.40 | | 1.00 | | 13.40 | | 2.48 | | 5.56 | | 5.36 | | 1.28 | | 4.08 | |
Jan-23 | | 0.158 | | 74.75 | | 0.028 | | 74.75 | | 13.88 | | 0.96 | | 12.92 | | 2.48 | | 5.42 | | 5.03 | | 1.17 | | 3.85 | |
Jan-24 | | 0.153 | | 74.75 | | 0.027 | | 74.75 | | 13.43 | | 0.93 | | 12.50 | | 1.24 | | 5.29 | | 5.97 | | 1.12 | | 4.85 | |
Jan-25 | | 0.148 | | 74.75 | | 0.025 | | 74.75 | | 12.95 | | 0.89 | | 12.05 | | 1.24 | | 5.15 | | 5.66 | | 1.22 | | 4.44 | |
Jan-26 | | 0.144 | | 74.75 | | 0.024 | | 74.75 | | 12.52 | | 0.87 | | 11.66 | | 1.24 | | 5.03 | | 5.38 | | 1.34 | | 4.05 | |
Jan-27 | | 0.139 | | 74.75 | | 0.023 | | 74.75 | | 12.12 | | 0.84 | | 11.28 | | 1.24 | | 4.92 | | 5.12 | | 1.46 | | 3.66 | |
Jan-28 | | 0.136 | | 74.75 | | 0.021 | | 74.75 | | 11.76 | | 0.81 | | 10.95 | | 1.24 | | 4.82 | | 4.89 | | 1.42 | | 3.47 | |
Jan-29 | | 0.132 | | 74.75 | | 0.020 | | 74.75 | | 11.38 | | 0.79 | | 10.59 | | 1.24 | | 4.71 | | 4.64 | | 1.38 | | 3.26 | |
Jan-30 | | 0.128 | | 74.75 | | 0.019 | | 74.75 | | 11.03 | | 0.76 | | 10.26 | | 1.24 | | 4.61 | | 4.42 | | 1.35 | | 3.07 | |
Jan-31 | | 0.125 | | 74.75 | | 0.018 | | 74.75 | | 10.67 | | 0.74 | | 9.93 | | 1.24 | | 4.51 | | 4.18 | | 1.31 | | 2.87 | |
Jan-32 | | 0.122 | | 74.75 | | 0.016 | | 74.75 | | 10.34 | | 0.72 | | 9.62 | | 1.24 | | 4.41 | | 3.97 | | 1.28 | | 2.69 | |
Jan-33 | | 0.119 | | 74.75 | | 0.015 | | 74.75 | | 10.02 | | 0.70 | | 9.32 | | 1.24 | | 4.32 | | 3.76 | | 1.25 | | 2.51 | |
Jan-34 | | 0.116 | | 74.75 | | 0.014 | | 74.75 | | 9.74 | | 0.68 | | 9.06 | | 1.24 | | 4.24 | | 3.58 | | 1.19 | | 2.39 | |
Jan-35 | | 0.113 | | 74.75 | | 0.013 | | 74.75 | | 9.48 | | 0.66 | | 8.82 | | | | 4.17 | | 4.65 | | 1.18 | | 3.47 | |
Jan-36 | | 0.111 | | 74.75 | | 0.013 | | 74.75 | | 9.26 | | 0.64 | | 8.61 | | | | 4.11 | | 4.51 | | 1.17 | | 3.33 | |
Jan-37 | | 0.108 | | 74.75 | | 0.012 | | 74.75 | | 9.00 | | 0.63 | | 8.37 | | | | 4.03 | | 4.34 | | 1.16 | | 3.18 | |
Jan-38 | | 0.106 | | 74.75 | | 0.011 | | 74.75 | | 8.77 | | 0.61 | | 8.16 | | | | 3.97 | | 4.19 | | 1.15 | | 3.04 | |
Jan-39 | | 0.104 | | 74.75 | | 0.011 | | 74.75 | | 8.56 | | 0.60 | | 7.96 | | | | 3.91 | | 4.05 | | 1.14 | | 2.91 | |
Jan-40 | | 0.102 | | 74.75 | | 0.010 | | 74.75 | | 8.38 | | 0.58 | | 7.79 | | | | 3.86 | | 3.94 | | 1.15 | | 2.79 | |
Jan-41 | | 0.099 | | 74.75 | | 0.010 | | 74.75 | | 8.16 | | 0.57 | | 7.59 | | | | 3.79 | | 3.79 | | 1.14 | | 2.65 | |
Jan-42 | | 0.097 | | 74.75 | | 0.009 | | 74.75 | | 7.97 | | 0.56 | | 7.41 | | | | 3.74 | | 3.67 | | 1.14 | | 2.53 | |
Jan-43 | | 0.096 | | 74.75 | | 0.009 | | 74.75 | | 7.79 | | 0.54 | | 7.25 | | | | 3.69 | | 3.56 | | 1.14 | | 2.41 | |
Jan-44 | | 0.094 | | 74.75 | | 0.008 | | 74.75 | | 7.64 | | 0.53 | | 7.10 | | | | 3.65 | | 3.46 | | 1.15 | | 2.31 | |
Jan-45 | | 0.092 | | 74.75 | | 0.008 | | 74.75 | | 7.45 | | 0.52 | | 6.93 | | | | 3.59 | | 3.34 | | 1.11 | | 2.23 | |
Jan-46 | | 0.090 | | 74.75 | | 0.007 | | 74.75 | | 7.30 | | 0.51 | | 6.78 | | | | 3.55 | | 3.24 | | 1.08 | | 2.16 | |
Jan-47 | | 0.089 | | 74.75 | | 0.007 | | 74.75 | | 7.14 | | 0.50 | | 6.64 | | | | 3.51 | | 3.14 | | 1.05 | | 2.09 | |
Jan-48 | | 0.087 | | 74.75 | | 0.007 | | 74.75 | | 7.01 | | 0.49 | | 6.52 | | | | 3.47 | | 3.05 | | 1.02 | | 2.04 | |
Jan-49 | | 0.085 | | 74.75 | | 0.006 | | 74.75 | | 6.86 | | 0.48 | | 6.38 | | | | 3.42 | | 2.95 | | 0.98 | | 1.97 | |
Jan-50 | | 0.084 | | 74.75 | | 0.006 | | 74.75 | | 6.72 | | 0.47 | | 6.25 | | | | 3.39 | | 2.86 | | 0.95 | | 1.91 | |
| | | | | | | | | | | | | | | | | | | | | | | | | |
Totals
(2010-2050) | | 5.900 | | MMBbl | | 0.786 | | MMBbl | | 499.71 | | 35.23 | | 464.49 | | 65.36 | | 188.31 | | 210.81 | | 70.26 | | 140.55 | |
Totals
(>2050): | | 1.432 | | MMBbl | | 0.071 | | MMBbl | | 112.36 | | 7.92 | | 104.43 | | — | | 61.47 | | 42.97 | | 14.32 | | 28.65 | |
| | France Gross Field (100%) Working Interest Cashflow Analysis Year-End 2009 Price | | |
| | Nominal Net Present Values | |
Field: | Neocomian | | as at 01-Jan-10 (US$ MM) | |
Case: | 3P | | Disc Rate | | Pre-Tax | | Post-Tax | |
| | 10.0 | % | 104.70 | | 66.43 | |
| | Developed | | Undeveloped | | Field | | | | Net | | Capital | | Operating | | Pre Tax | | Corporate | | Post Tax | |
Period
Beginning | | Production
MMB | | Price
US$/Bbl | | Production
MMB | | Price
US$/Bbl | | Revenue
US$ MM | | Royalty
US$ MM | | Revenue
US$ MM | | Costs
US$ MM | | Costs
US$ MM | | NCF
US$ MM | | Tax
US$ MM | | NCF
US$ MM | |
Jan-10 | | 0.283 | | 74.75 | | 0.002 | | 74.75 | | 21.30 | | 1.70 | | 19.59 | | 3.30 | | 4.50 | | 11.79 | | 4.92 | | 6.87 | |
Jan-11 | | 0.280 | | 74.75 | | 0.012 | | 74.75 | | 21.80 | | 1.71 | | 20.09 | | 3.30 | | 4.57 | | 12.22 | | 4.95 | | 7.27 | |
Jan-12 | | 0.277 | | 74.75 | | 0.019 | | 74.75 | | 22.15 | | 1.72 | | 20.43 | | 2.60 | | 4.62 | | 13.21 | | 4.96 | | 8.25 | |
Jan-13 | | 0.273 | | 74.75 | | 0.030 | | 74.75 | | 22.64 | | 1.72 | | 20.92 | | 2.60 | | 4.69 | | 13.63 | | 5.02 | | 8.61 | |
Jan-14 | | 0.270 | | 74.75 | | 0.035 | | 74.75 | | 22.76 | | 1.71 | | 21.05 | | 2.60 | | 4.71 | | 13.74 | | 4.97 | | 8.77 | |
Jan-15 | | 0.267 | | 74.75 | | 0.044 | | 74.75 | | 23.17 | | 1.72 | | 21.45 | | 7.48 | | 8.05 | | 5.92 | | 3.74 | | 2.18 | |
Jan-16 | | 0.264 | | 74.75 | | 0.041 | | 74.75 | | 22.82 | | 1.70 | | 21.12 | | 7.48 | | 7.95 | | 5.69 | | 3.41 | | 2.28 | |
Jan-17 | | 0.260 | | 74.75 | | 0.039 | | 74.75 | | 22.36 | | 1.66 | | 20.70 | | 7.48 | | 7.82 | | 5.39 | | 3.06 | | 2.33 | |
Jan-18 | | 0.257 | | 74.75 | | 0.037 | | 74.75 | | 21.97 | | 1.64 | | 20.34 | | 2.48 | | 7.71 | | 10.14 | | 2.90 | | 7.25 | |
Jan-19 | | 0.254 | | 74.75 | | 0.035 | | 74.75 | | 21.60 | | 1.61 | | 19.98 | | 2.48 | | 7.61 | | 9.90 | | 2.73 | | 7.17 | |
Jan-20 | | 0.252 | | 74.75 | | 0.033 | | 74.75 | | 21.28 | | 1.59 | | 19.69 | | 2.48 | | 7.52 | | 9.69 | | 2.69 | | 7.00 | |
Jan-21 | | 0.248 | | 74.75 | | 0.031 | | 74.75 | | 20.87 | | 1.56 | | 19.31 | | 2.48 | | 7.40 | | 9.43 | | 2.63 | | 6.80 | |
Jan-22 | | 0.245 | | 74.75 | | 0.030 | | 74.75 | | 20.53 | | 1.54 | | 18.99 | | 2.48 | | 7.30 | | 9.21 | | 2.56 | | 6.65 | |
Jan-23 | | 0.242 | | 74.75 | | 0.028 | | 74.75 | | 20.19 | | 1.51 | | 18.68 | | 2.48 | | 7.21 | | 8.99 | | 2.49 | | 6.50 | |
Jan-24 | | 0.240 | | 74.75 | | 0.027 | | 74.75 | | 19.91 | | 1.49 | | 18.41 | | 1.24 | | 7.13 | | 10.05 | | 2.48 | | 7.57 | |
Jan-25 | | 0.236 | | 74.75 | | 0.025 | | 74.75 | | 19.54 | | 1.47 | | 18.07 | | 1.24 | | 7.02 | | 9.81 | | 2.61 | | 7.20 | |
Jan-26 | | 0.233 | | 74.75 | | 0.024 | | 74.75 | | 19.23 | | 1.44 | | 17.78 | | 1.24 | | 6.93 | | 9.61 | | 2.75 | | 6.86 | |
Jan-27 | | 0.230 | | 74.75 | | 0.023 | | 74.75 | | 18.92 | | 1.42 | | 17.50 | | 1.24 | | 6.85 | | 9.41 | | 2.89 | | 6.52 | |
Jan-28 | | 0.228 | | 74.75 | | 0.021 | | 74.75 | | 18.67 | | 1.40 | | 17.27 | | 1.24 | | 6.78 | | 9.25 | | 2.88 | | 6.38 | |
Jan-29 | | 0.225 | | 74.75 | | 0.020 | | 74.75 | | 18.33 | | 1.38 | | 16.96 | | 1.24 | | 6.68 | | 9.04 | | 2.85 | | 6.19 | |
Jan-30 | | 0.222 | | 74.75 | | 0.019 | | 74.75 | | 18.04 | | 1.36 | | 16.69 | | 1.24 | | 6.60 | | 8.85 | | 2.83 | | 6.02 | |
Jan-31 | | 0.220 | | 74.75 | | 0.018 | | 74.75 | | 17.73 | | 1.34 | | 16.40 | | 1.24 | | 6.51 | | 8.65 | | 2.80 | | 5.85 | |
Jan-32 | | 0.218 | | 74.75 | | 0.016 | | 74.75 | | 17.46 | | 1.32 | | 16.14 | | 1.24 | | 6.43 | | 8.47 | | 2.78 | | 5.69 | |
Jan-33 | | 0.214 | | 74.75 | | 0.015 | | 74.75 | | 17.15 | | 1.29 | | 15.86 | | 1.24 | | 6.34 | | 8.27 | | 2.76 | | 5.52 | |
Jan-34 | | 0.212 | | 74.75 | | 0.014 | | 74.75 | | 16.89 | | 1.27 | | 15.61 | | 1.24 | | 6.27 | | 8.10 | | 2.70 | | 5.40 | |
Jan-35 | | 0.209 | | 74.75 | | 0.013 | | 74.75 | | 16.64 | | 1.26 | | 15.39 | | | | 6.20 | | 9.19 | | 2.69 | | 6.50 | |
Jan-36 | | 0.207 | | 74.75 | | 0.013 | | 74.75 | | 16.44 | | 1.24 | | 15.20 | | | | 6.14 | | 9.06 | | 2.69 | | 6.37 | |
Jan-37 | | 0.204 | | 74.75 | | 0.012 | | 74.75 | | 16.17 | | 1.22 | | 14.95 | | | | 6.06 | | 8.88 | | 2.67 | | 6.21 | |
Jan-38 | | 0.202 | | 74.75 | | 0.011 | | 74.75 | | 15.93 | | 1.20 | | 14.73 | | | | 6.00 | | 8.73 | | 2.66 | | 6.07 | |
Jan-39 | | 0.199 | | 74.75 | | 0.011 | | 74.75 | | 15.71 | | 1.18 | | 14.52 | | | | 5.94 | | 8.59 | | 2.66 | | 5.93 | |
Jan-40 | | 0.197 | | 74.75 | | 0.010 | | 74.75 | | 15.53 | | 1.17 | | 14.36 | | | | 5.88 | | 8.47 | | 2.66 | | 5.81 | |
Jan-41 | | 0.195 | | 74.75 | | 0.010 | | 74.75 | | 15.27 | | 1.15 | | 14.12 | | | | 5.81 | | 8.31 | | 2.64 | | 5.66 | |
Jan-42 | | 0.192 | | 74.75 | | 0.009 | | 74.75 | | 15.06 | | 1.13 | | 13.92 | | | | 5.75 | | 8.17 | | 2.64 | | 5.53 | |
Jan-43 | | 0.190 | | 74.75 | | 0.009 | | 74.75 | | 14.85 | | 1.12 | | 13.73 | | | | 5.69 | | 8.04 | | 2.64 | | 5.40 | |
Jan-44 | | 0.188 | | 74.75 | | 0.008 | | 74.75 | | 14.68 | | 1.10 | | 13.58 | | | | 5.64 | | 7.93 | | 2.64 | | 5.29 | |
Jan-45 | | 0.185 | | 74.75 | | 0.008 | | 74.75 | | 14.44 | | 1.09 | | 13.35 | | | | 5.58 | | 7.78 | | 2.59 | | 5.19 | |
Jan-46 | | 0.183 | | 74.75 | | 0.007 | | 74.75 | | 14.24 | | 1.07 | | 13.17 | | | | 5.52 | | 7.65 | | 2.55 | | 5.10 | |
Jan-47 | | 0.181 | | 74.75 | | 0.007 | | 74.75 | | 14.05 | | 1.05 | | 12.99 | | | | 5.46 | | 7.53 | | 2.51 | | 5.02 | |
Jan-48 | | 0.179 | | 74.75 | | 0.007 | | 74.75 | | 13.89 | | 1.04 | | 12.85 | | | | 5.42 | | 7.43 | | 2.48 | | 4.95 | |
Jan-49 | | 0.177 | | 74.75 | | 0.006 | | 74.75 | | 13.67 | | 1.02 | | 12.65 | | | | 5.36 | | 7.29 | | 2.43 | | 4.86 | |
Jan-50 | | 0.174 | | 74.75 | | 0.006 | | 74.75 | | 13.49 | | 1.01 | | 12.48 | | | | 5.31 | | 7.17 | | 2.39 | | 4.78 | |
| | | | | | | | | | | | | | | | | | | | | | | | | |
Totals
(2010-2050) | | 9.213 | | MMBbl | | 0.786 | | MMBbl | | 747.37 | | 56.34 | | 691.03 | | 65.36 | | 256.97 | | 368.70 | | 122.89 | | 245.82 | |
Totals
(>2050): | | 3.083 | | MMBbl | | 0.071 | | MMBbl | | 235.74 | | 14.23 | | 221.51 | | — | | 96.46 | | 125.05 | | 41.68 | | 83.37 | |
| | France Gross Field (100%) Working Interest Cashflow Analysis Year-End 2009 Price | | |
| | Nominal Net Present Values | |
Field: | Charmottes | | as at 01-Jan-10 (US$ MM) | |
Case: | 1P | | Disc Rate | | Pre-Tax | | Post-Tax | |
| | 10.0 | % | 9.91 | | 6.61 | |
| | Triassic | | Dogger | | Field | | | | Net | | Capital | | Operating | | Pre Tax | | Corporate | | Post Tax | |
Period
Beginning | | Production
MMB | | Price
US$/Bbl | | Production
MMB | | Price
US$/Bbl | | Revenue
US$ MM | | Royalty
US$ MM | | Revenue
US$ MM | | Costs
US$ MM | | Costs
US$ MM | | NCF
US$ MM | | Tax
US$ MM | | NCF
US$ MM | |
Jan-10 | | 0.006 | | 75.37 | | 0.033 | | 75.37 | | 2.89 | | 0.12 | | 2.78 | | | | 0.76 | | 2.02 | | 0.67 | | 1.34 | |
Jan-11 | | 0.005 | | 75.37 | | 0.028 | | 75.37 | | 2.50 | | 0.10 | | 2.40 | | | | 0.72 | | 1.67 | | 0.56 | | 1.12 | |
Jan-12 | | 0.005 | | 75.37 | | 0.024 | | 75.37 | | 2.21 | | 0.09 | | 2.13 | | | | 0.63 | | 1.50 | | 0.50 | | 1.00 | |
Jan-13 | | 0.005 | | 75.37 | | 0.022 | | 75.37 | | 1.98 | | 0.08 | | 1.90 | | | | 0.62 | | 1.28 | | 0.43 | | 0.85 | |
Jan-14 | | 0.005 | | 75.37 | | 0.019 | | 75.37 | | 1.81 | | 0.07 | | 1.73 | | | | 0.55 | | 1.18 | | 0.39 | | 0.79 | |
Jan-15 | | 0.004 | | 75.37 | | 0.018 | | 75.37 | | 1.66 | | 0.07 | | 1.59 | | | | 0.56 | | 1.03 | | 0.34 | | 0.69 | |
Jan-16 | | 0.004 | | 75.37 | | 0.016 | | 75.37 | | 1.54 | | 0.06 | | 1.48 | | | | 0.50 | | 0.98 | | 0.33 | | 0.66 | |
Jan-17 | | 0.004 | | 75.37 | | 0.015 | | 75.37 | | 1.44 | | 0.06 | | 1.38 | | | | 0.52 | | 0.86 | | 0.29 | | 0.57 | |
Jan-18 | | 0.004 | | 75.37 | | 0.014 | | 75.37 | | 1.35 | | 0.05 | | 1.29 | | | | 0.46 | | 0.83 | | 0.28 | | 0.55 | |
Jan-19 | | 0.004 | | 75.37 | | 0.013 | | 75.37 | | 1.27 | | 0.05 | | 1.22 | | | | 0.49 | | 0.73 | | 0.24 | | 0.49 | |
Jan-20 | | 0.004 | | 75.37 | | 0.012 | | 75.37 | | 1.20 | | 0.05 | | 1.16 | | | | 0.43 | | 0.72 | | 0.24 | | 0.48 | |
Jan-21 | | 0.004 | | 75.37 | | 0.011 | | 75.37 | | 1.14 | | 0.05 | | 1.10 | | | | 0.46 | | 0.63 | | 0.21 | | 0.42 | |
Jan-22 | | 0.004 | | 75.37 | | 0.011 | | 75.37 | | 1.09 | | 0.04 | | 1.04 | | | | 0.41 | | 0.63 | | 0.21 | | 0.42 | |
Jan-23 | | 0.004 | | 75.37 | | 0.010 | | 75.37 | | 1.04 | | 0.04 | | 1.00 | | | | 0.44 | | 0.56 | | 0.19 | | 0.37 | |
Jan-24 | | 0.004 | | 75.37 | | 0.010 | | 75.37 | | 1.00 | | 0.04 | | 0.96 | | | | 0.39 | | 0.56 | | 0.19 | | 0.38 | |
Jan-25 | | 0.004 | | 75.37 | | 0.009 | | 75.37 | | 0.96 | | 0.04 | | 0.92 | | | | 0.43 | | 0.49 | | 0.16 | | 0.33 | |
Jan-26 | | 0.004 | | 75.37 | | 0.009 | | 75.37 | | 0.92 | | 0.04 | | 0.88 | | | | 0.38 | | 0.51 | | 0.17 | | 0.34 | |
Jan-27 | | 0.003 | | 75.37 | | 0.008 | | 75.37 | | 0.89 | | 0.04 | | 0.85 | | | | 0.41 | | 0.44 | | 0.15 | | 0.29 | |
Jan-28 | | 0.003 | | 75.37 | | 0.008 | | 75.37 | | 0.86 | | 0.03 | | 0.83 | | | | 0.37 | | 0.46 | | 0.15 | | 0.31 | |
Jan-29 | | 0.003 | | 75.37 | | 0.008 | | 75.37 | | 0.83 | | 0.03 | | 0.80 | | | | 0.40 | | 0.40 | | 0.13 | | 0.26 | |
Jan-30 | | 0.003 | | 75.37 | | 0.005 | | 75.37 | | 0.62 | | 0.02 | | 0.60 | | | | 0.32 | | 0.28 | | 0.09 | | 0.18 | |
| | | | | | | | | | | | | | | | | | | | | | | | | |
Totals (>01-
Jan-10): | | 0.086 | | MMBbl | | 0.301 | | MMBbl | | 29.20 | | 1.18 | | 28.02 | | — | | 10.26 | | 17.77 | | 5.92 | | 11.85 | |
| | France Gross Field (100%) Working Interest Cashflow Analysis Year-End 2009 Price | | |
| | Nominal Net Present Values | |
Field: | Charmottes | | as at 01-Jan-10 (US$ MM) | |
Case: | 2P | | Disc Rate | | Pre-Tax | | Post-Tax | |
| | 10.0 | % | 15.97 | | 10.65 | |
| | Triassic | | Dogger | | Field | | | | Net | | Capital | | Operating | | Pre Tax | | Corporate | | Post Tax | |
Period
Beginning | | Production
MMB | | Price
US$/Bbl | | Production
MMB | | Price
US$/Bbl | | Revenue
US$ MM | | Royalty
US$ MM | | Revenue
US$ MM | | Costs
US$ MM | | Costs
US$ MM | | NCF
US$ MM | | Tax
US$ MM | | NCF
US$ MM | |
Jan-10 | | 0.010 | | 75.37 | | 0.034 | | 75.37 | | 3.29 | | 0.13 | | 3.16 | | | | 0.84 | | 2.32 | | 0.77 | | 1.55 | |
Jan-11 | | 0.011 | | 75.37 | | 0.030 | | 75.37 | | 3.13 | | 0.13 | | 3.00 | | | | 0.85 | | 2.16 | | 0.72 | | 1.44 | |
Jan-12 | | 0.011 | | 75.37 | | 0.027 | | 75.37 | | 2.87 | | 0.12 | | 2.75 | | | | 0.76 | | 2.00 | | 0.67 | | 1.33 | |
Jan-13 | | 0.010 | | 75.37 | | 0.025 | | 75.37 | | 2.66 | | 0.11 | | 2.56 | | | | 0.76 | | 1.80 | | 0.60 | | 1.20 | |
Jan-14 | | 0.010 | | 75.37 | | 0.023 | | 75.37 | | 2.51 | | 0.10 | | 2.41 | | | | 0.69 | | 1.72 | | 0.57 | | 1.15 | |
Jan-15 | | 0.010 | | 75.37 | | 0.021 | | 75.37 | | 2.39 | | 0.10 | | 2.30 | | | | 0.70 | | 1.59 | | 0.53 | | 1.06 | |
Jan-16 | | 0.010 | | 75.37 | | 0.020 | | 75.37 | | 2.30 | | 0.09 | | 2.21 | | | | 0.65 | | 1.56 | | 0.52 | | 1.04 | |
Jan-17 | | 0.010 | | 75.37 | | 0.019 | | 75.37 | | 2.21 | | 0.09 | | 2.12 | | | | 0.67 | | 1.46 | | 0.49 | | 0.97 | |
Jan-18 | | 0.010 | | 75.37 | | 0.018 | | 75.37 | | 2.14 | | 0.09 | | 2.06 | | | | 0.62 | | 1.44 | | 0.48 | | 0.96 | |
Jan-19 | | 0.011 | | 75.37 | | 0.017 | | 75.37 | | 2.08 | | 0.08 | | 2.00 | | | | 0.64 | | 1.36 | | 0.45 | | 0.90 | |
Jan-20 | | 0.011 | | 75.37 | | 0.016 | | 75.37 | | 2.04 | | 0.08 | | 1.95 | | | | 0.59 | | 1.36 | | 0.45 | | 0.91 | |
Jan-21 | | 0.011 | | 75.37 | | 0.016 | | 75.37 | | 1.98 | | 0.08 | | 1.90 | | | | 0.62 | | 1.28 | | 0.43 | | 0.85 | |
Jan-22 | | 0.011 | | 75.37 | | 0.015 | | 75.37 | | 1.94 | | 0.08 | | 1.86 | | | | 0.58 | | 1.29 | | 0.43 | | 0.86 | |
Jan-23 | | 0.011 | | 75.37 | | 0.014 | | 75.37 | | 1.91 | | 0.08 | | 1.83 | | | | 0.61 | | 1.22 | | 0.41 | | 0.81 | |
Jan-24 | | 0.011 | | 75.37 | | 0.014 | | 75.37 | | 1.88 | | 0.08 | | 1.80 | | | | 0.56 | | 1.24 | | 0.41 | | 0.83 | |
Jan-25 | | 0.011 | | 75.37 | | 0.014 | | 75.37 | | 1.84 | | 0.07 | | 1.77 | | | | 0.60 | | 1.17 | | 0.39 | | 0.78 | |
Jan-26 | | 0.011 | | 75.37 | | 0.013 | | 75.37 | | 1.81 | | 0.07 | | 1.74 | | | | 0.55 | | 1.19 | | 0.40 | | 0.79 | |
Jan-27 | | 0.011 | | 75.37 | | 0.013 | | 75.37 | | 1.78 | | 0.07 | | 1.71 | | | | 0.59 | | 1.13 | | 0.38 | | 0.75 | |
Jan-28 | | 0.011 | | 75.37 | | 0.012 | | 75.37 | | 1.76 | | 0.07 | | 1.69 | | | | 0.54 | | 1.15 | | 0.38 | | 0.77 | |
Jan-29 | | 0.011 | | 75.37 | | 0.012 | | 75.37 | | 1.74 | | 0.07 | | 1.67 | | | | 0.58 | | 1.09 | | 0.36 | | 0.73 | |
Jan-30 | | 0.011 | | 75.37 | | 0.012 | | 75.37 | | 1.71 | | 0.07 | | 1.65 | | | | 0.53 | | 1.11 | | 0.37 | | 0.74 | |
Jan-31 | | 0.011 | | 75.37 | | 0.011 | | 75.37 | | 1.69 | | 0.07 | | 1.62 | | | | 0.57 | | 1.06 | | 0.35 | | 0.70 | |
Jan-32 | | 0.011 | | 75.37 | | 0.011 | | 75.37 | | 1.68 | | 0.07 | | 1.61 | | | | 0.52 | | 1.09 | | 0.36 | | 0.72 | |
Jan-33 | | 0.011 | | 75.37 | | 0.011 | | 75.37 | | 1.65 | | 0.07 | | 1.59 | | | | 0.56 | | 1.03 | | 0.34 | | 0.68 | |
Jan-34 | | 0.011 | | 75.37 | | 0.011 | | 75.37 | | 1.64 | | 0.07 | | 1.57 | | | | 0.52 | | 1.05 | | 0.35 | | 0.70 | |
Jan-35 | | 0.011 | | 75.37 | | 0.010 | | 75.37 | | 1.62 | | 0.07 | | 1.55 | | | | 0.55 | | 1.00 | | 0.33 | | 0.67 | |
Jan-36 | | 0.011 | | 75.37 | | 0.010 | | 75.37 | | 1.61 | | 0.06 | | 1.54 | | | | 0.51 | | 1.03 | | 0.34 | | 0.69 | |
Jan-37 | | 0.011 | | 75.37 | | 0.010 | | 75.37 | | 1.59 | | 0.06 | | 1.52 | | | | 0.55 | | 0.98 | | 0.33 | | 0.65 | |
Jan-38 | | 0.011 | | 75.37 | | 0.010 | | 75.37 | | 1.57 | | 0.06 | | 1.51 | | | | 0.50 | | 1.01 | | 0.34 | | 0.67 | |
Jan-39 | | 0.011 | | 75.37 | | 0.009 | | 75.37 | | 1.56 | | 0.06 | | 1.50 | | | | 0.54 | | 0.96 | | 0.32 | | 0.64 | |
Jan-40 | | 0.011 | | 75.37 | | 0.009 | | 75.37 | | 1.55 | | 0.06 | | 1.49 | | | | 0.50 | | 0.99 | | 0.33 | | 0.66 | |
Jan-41 | | 0.003 | | 75.37 | | 0.009 | | 75.37 | | 0.90 | | 0.04 | | 0.86 | | | | 0.41 | | 0.45 | | 0.15 | | 0.30 | |
Jan-42 | | | | 75.37 | | 0.009 | | 75.37 | | 0.68 | | 0.03 | | 0.65 | | | | 0.33 | | 0.32 | | 0.11 | | 0.21 | |
Jan-43 | | | | 75.37 | | 0.009 | | 75.37 | | 0.66 | | 0.03 | | 0.64 | | | | 0.37 | | 0.27 | | 0.09 | | 0.18 | |
Jan-44 | | | | 75.37 | | 0.009 | | 75.37 | | 0.66 | | 0.03 | | 0.63 | | | | 0.33 | | 0.30 | | 0.10 | | 0.20 | |
Jan-45 | | | | 75.37 | | 0.009 | | 75.37 | | 0.64 | | 0.03 | | 0.62 | | | | 0.36 | | 0.25 | | 0.08 | | 0.17 | |
Jan-46 | | | | 75.37 | | 0.008 | | 75.37 | | 0.63 | | 0.03 | | 0.61 | | | | 0.32 | | 0.28 | | 0.09 | | 0.19 | |
Jan-47 | | | | 75.37 | | 0.008 | | 75.37 | | 0.62 | | 0.03 | | 0.60 | | | | 0.36 | | 0.24 | | 0.08 | | 0.16 | |
Jan-48 | | | | 75.37 | | 0.008 | | 75.37 | | 0.61 | | 0.02 | | 0.59 | | | | 0.32 | | 0.27 | | 0.09 | | 0.18 | |
Jan-49 | | | | 75.37 | | 0.008 | | 75.37 | | 0.60 | | 0.02 | | 0.58 | | | | 0.36 | | 0.22 | | 0.07 | | 0.15 | |
Jan-50 | | | | 75.37 | | 0.008 | | 75.37 | | 0.59 | | 0.02 | | 0.57 | | | | 0.32 | | 0.25 | | 0.08 | | 0.17 | |
| | | | | | | | | | | | | | | | | | | | | | | | | |
Totals
(2010-2050) | | 0.339 | | MMBbl | | 0.573 | | MMBbl | | 68.75 | | 2.77 | | 65.99 | | — | | 22.32 | | 43.67 | | 14.55 | | 29.11 | |
Totals
(>2050): | | — | | MMBbl | | 0.038 | | MMBbl | | 2.85 | | 0.11 | | 2.73 | | — | | 1.67 | | 1.06 | | 0.35 | | 0.71 | |
| | France Gross Field (100%) Working Interest Cashflow Analysis Year-End 2009 Price | | |
| | Nominal Net Present Values | |
Field: | Charmottes | | as at 01-Jan-10 (US$ MM) | |
Case: | 3P | | Disc Rate | | Pre-Tax | | Post-Tax | |
| | 10.0 | % | 17.90 | | 11.93 | |
| | Triassic | | Dogger | | Field | | | | Net | | Capital | | Operating | | Pre Tax | | Corporate | | Post Tax | |
Period
Beginning | | Production
MMB | | Price
US$/Bbl | | Production
MMB | | Price
US$/Bbl | | Revenue
US$ MM | | Royalty
US$ MM | | Revenue
US$ MM | | Costs
US$ MM | | Costs
US$ MM | | NCF
US$ MM | | Tax
US$ MM | | NCF
US$ MM | |
Jan-10 | | 0.010 | | 75.37 | | 0.035 | | 75.37 | | 3.34 | | 0.13 | | 3.21 | | | | 0.85 | | 2.36 | | 0.79 | | 1.57 | |
Jan-11 | | 0.011 | | 75.37 | | 0.031 | | 75.37 | | 3.23 | | 0.13 | | 3.10 | | | | 0.87 | | 2.23 | | 0.74 | | 1.49 | |
Jan-12 | | 0.011 | | 75.37 | | 0.029 | | 75.37 | | 3.01 | | 0.12 | | 2.89 | | | | 0.78 | | 2.11 | | 0.70 | | 1.40 | |
Jan-13 | | 0.011 | | 75.37 | | 0.027 | | 75.37 | | 2.84 | | 0.11 | | 2.73 | | | | 0.79 | | 1.94 | | 0.65 | | 1.29 | |
Jan-14 | | 0.011 | | 75.37 | | 0.025 | | 75.37 | | 2.72 | | 0.11 | | 2.61 | | | | 0.73 | | 1.89 | | 0.63 | | 1.26 | |
Jan-15 | | 0.011 | | 75.37 | | 0.024 | | 75.37 | | 2.63 | | 0.11 | | 2.52 | | | | 0.75 | | 1.77 | | 0.59 | | 1.18 | |
Jan-16 | | 0.011 | | 75.37 | | 0.023 | | 75.37 | | 2.56 | | 0.10 | | 2.45 | | | | 0.70 | | 1.76 | | 0.59 | | 1.17 | |
Jan-17 | | 0.011 | | 75.37 | | 0.022 | | 75.37 | | 2.48 | | 0.10 | | 2.38 | | | | 0.72 | | 1.66 | | 0.55 | | 1.11 | |
Jan-18 | | 0.011 | | 75.37 | | 0.021 | | 75.37 | | 2.43 | | 0.10 | | 2.33 | | | | 0.67 | | 1.66 | | 0.55 | | 1.11 | |
Jan-19 | | 0.011 | | 75.37 | | 0.020 | | 75.37 | | 2.38 | | 0.10 | | 2.28 | | | | 0.70 | | 1.58 | | 0.53 | | 1.05 | |
Jan-20 | | 0.012 | | 75.37 | | 0.019 | | 75.37 | | 2.34 | | 0.09 | | 2.25 | | | | 0.65 | | 1.59 | | 0.53 | | 1.06 | |
Jan-21 | | 0.012 | | 75.37 | | 0.019 | | 75.37 | | 2.30 | | 0.09 | | 2.21 | | | | 0.69 | | 1.52 | | 0.51 | | 1.01 | |
Jan-22 | | 0.012 | | 75.37 | | 0.018 | | 75.37 | | 2.27 | | 0.09 | | 2.17 | | | | 0.64 | | 1.54 | | 0.51 | | 1.02 | |
Jan-23 | | 0.012 | | 75.37 | | 0.018 | | 75.37 | | 2.24 | | 0.09 | | 2.15 | | | | 0.67 | | 1.47 | | 0.49 | | 0.98 | |
Jan-24 | | 0.012 | | 75.37 | | 0.017 | | 75.37 | | 2.21 | | 0.09 | | 2.13 | | | | 0.63 | | 1.50 | | 0.50 | | 1.00 | |
Jan-25 | | 0.012 | | 75.37 | | 0.017 | | 75.37 | | 2.18 | | 0.09 | | 2.10 | | | | 0.66 | | 1.43 | | 0.48 | | 0.96 | |
Jan-26 | | 0.012 | | 75.37 | | 0.016 | | 75.37 | | 2.16 | | 0.09 | | 2.07 | | | | 0.62 | | 1.46 | | 0.49 | | 0.97 | |
Jan-27 | | 0.012 | | 75.37 | | 0.016 | | 75.37 | | 2.14 | | 0.09 | | 2.05 | | | | 0.65 | | 1.40 | | 0.47 | | 0.93 | |
Jan-28 | | 0.013 | | 75.37 | | 0.016 | | 75.37 | | 2.13 | | 0.09 | | 2.04 | | | | 0.61 | | 1.43 | | 0.48 | | 0.95 | |
Jan-29 | | 0.013 | | 75.37 | | 0.015 | | 75.37 | | 2.10 | | 0.08 | | 2.02 | | | | 0.65 | | 1.37 | | 0.46 | | 0.91 | |
Jan-30 | | 0.013 | | 75.37 | | 0.015 | | 75.37 | | 2.08 | | 0.08 | | 2.00 | | | | 0.60 | | 1.40 | | 0.47 | | 0.93 | |
Jan-31 | | 0.013 | | 75.37 | | 0.015 | | 75.37 | | 2.07 | | 0.08 | | 1.98 | | | | 0.64 | | 1.34 | | 0.45 | | 0.90 | |
Jan-32 | | 0.013 | | 75.37 | | 0.014 | | 75.37 | | 2.06 | | 0.08 | | 1.97 | | | | 0.60 | | 1.38 | | 0.46 | | 0.92 | |
Jan-33 | | 0.013 | | 75.37 | | 0.014 | | 75.37 | | 2.04 | | 0.08 | | 1.96 | | | | 0.63 | | 1.32 | | 0.44 | | 0.88 | |
Jan-34 | | 0.013 | | 75.37 | | 0.014 | | 75.37 | | 2.02 | | 0.08 | | 1.94 | | | | 0.59 | | 1.35 | | 0.45 | | 0.90 | |
Jan-35 | | 0.013 | | 75.37 | | 0.014 | | 75.37 | | 2.01 | | 0.08 | | 1.93 | | | | 0.63 | | 1.30 | | 0.43 | | 0.87 | |
Jan-36 | | 0.013 | | 75.37 | | 0.013 | | 75.37 | | 2.00 | | 0.08 | | 1.92 | | | | 0.59 | | 1.33 | | 0.44 | | 0.89 | |
Jan-37 | | 0.013 | | 75.37 | | 0.013 | | 75.37 | | 1.98 | | 0.08 | | 1.90 | | | | 0.62 | | 1.28 | | 0.43 | | 0.85 | |
Jan-38 | | 0.013 | | 75.37 | | 0.013 | | 75.37 | | 1.97 | | 0.08 | | 1.89 | | | | 0.58 | | 1.31 | | 0.44 | | 0.87 | |
Jan-39 | | 0.013 | | 75.37 | | 0.013 | | 75.37 | | 1.95 | | 0.08 | | 1.88 | | | | 0.62 | | 1.26 | | 0.42 | | 0.84 | |
Jan-40 | | 0.013 | | 75.37 | | 0.013 | | 75.37 | | 1.94 | | 0.08 | | 1.86 | | | | 0.58 | | 1.29 | | 0.43 | | 0.86 | |
Jan-41 | | 0.003 | | 75.37 | | 0.012 | | 75.37 | | 1.18 | | 0.05 | | 1.13 | | | | 0.47 | | 0.66 | | 0.22 | | 0.44 | |
Jan-42 | | | | 75.37 | | 0.012 | | 75.37 | | 0.92 | | 0.04 | | 0.88 | | | | 0.38 | | 0.51 | | 0.17 | | 0.34 | |
Jan-43 | | | | 75.37 | | 0.012 | | 75.37 | | 0.91 | | 0.04 | | 0.87 | | | | 0.42 | | 0.46 | | 0.15 | | 0.30 | |
Jan-44 | | | | 75.37 | | 0.012 | | 75.37 | | 0.90 | | 0.04 | | 0.86 | | | | 0.37 | | 0.49 | | 0.16 | | 0.33 | |
Jan-45 | | | | 75.37 | | 0.012 | | 75.37 | | 0.89 | | 0.04 | | 0.85 | | | | 0.41 | | 0.44 | | 0.15 | | 0.29 | |
Jan-46 | | | | 75.37 | | 0.012 | | 75.37 | | 0.88 | | 0.04 | | 0.84 | | | | 0.37 | | 0.47 | | 0.16 | | 0.31 | |
Jan-47 | | | | 75.37 | | 0.011 | | 75.37 | | 0.86 | | 0.03 | | 0.83 | | | | 0.41 | | 0.42 | | 0.14 | | 0.28 | |
Jan-48 | | | | 75.37 | | 0.011 | | 75.37 | | 0.86 | | 0.03 | | 0.82 | | | | 0.37 | | 0.46 | | 0.15 | | 0.30 | |
Jan-49 | | | | 75.37 | | 0.011 | | 75.37 | | 0.84 | | 0.03 | | 0.81 | | | | 0.40 | | 0.41 | | 0.14 | | 0.27 | |
Jan-50 | | | | 75.37 | | 0.011 | | 75.37 | | 0.84 | | 0.03 | | 0.80 | | | | 0.36 | | 0.44 | | 0.15 | | 0.29 | |
| | | | | | | | | | | | | | | | | | | | | | | | | |
Totals
(2010-2050) | | 0.378 | | MMBbl | | 0.695 | | MMBbl | | 80.89 | | 3.26 | | 77.64 | | — | | 24.67 | | 52.97 | | 17.65 | | 35.31 | |
Totals
(>2050): | | — | | MMBbl | | 0.115 | | MMBbl | | 8.64 | | 0.35 | | 8.30 | | — | | 4.11 | | 4.18 | | 1.39 | | 2.79 | |