UNITED STATES
SECURITIES AND EXCHANGE COMMISSION
Washington, D.C. 20549
FORM N-CSR
CERTIFIED SHAREHOLDER REPORT OF REGISTERED
MANAGEMENT INVESTMENT COMPANIES
Investment Company Act file number | 811-1596 |
|
FPA CAPITAL FUND, INC. |
(Exact name of registrant as specified in charter) |
|
11601 WILSHIRE BLVD., STE. 1200 LOS ANGELES, CALIFORNIA | | 90025 |
(Address of principal executive offices) | | (Zip code) |
|
(Name and address of agent for service) | Copy to: |
| |
J. RICHARD ATWOOD, PRESIDENT FPA CAPITAL FUND, INC. 11601 WILSHIRE BLVD., STE. 1200 LOS ANGELES, CALIFORNIA 90025 | MARK D. PERLOW, ESQ. DECHERT LLP ONE BUSH STREET, STE. 1600 SAN FRANCISCO, CA 94104 |
|
Registrant’s telephone number, including area code: | (310) 473-0225 | |
|
Date of fiscal year end: | March 31 | |
|
Date of reporting period: | March 31, 2017 | |
| | | | | | | | | |
Item 1: Report to Shareholders.

Distributor:
UMB DISTRIBUTION SERVICES, LLC
235 West Galena Street
Milwaukee, Wisconsin 53212
FPA CAPITAL FUND, INC.
LETTER TO SHAREHOLDERS
Déjà vu
One of the side effects of running a highly focused portfolio is volatility. We do not mind that volatility because, paraphrasing Warren Buffett, we prefer a higher return that is lumpy over a lower return that is smooth. This is especially true if that volatility allows us to add to our positions at a low price and trim our positions at elevated prices. At one point during last year's first quarter, our portfolio returned -13.26%. We ended the year up 22.86%. This quarter was another one of those where a number of positions worked against us and our portfolio returned -3.73%. For the fiscal year ending March 31, 2017, the portfolio was up by 18.09%. Our energy investments, collectively, detracted -2.02% from our performance for the first quarter of the year; however they contributed 6.95% to performance for the trailing twelve month period. Large detractors for the fiscal year were Babcock & Wilcox Enterprises (-2.45%) and Vista Outdoor Inc. (-0.82%). We will highlight them later in this letter. Last year, we mentioned that despite some of the "hits" the portfolio had taken, there were catalysts that could lift many portfolio companies up substantially. Our objective has been to construct our portfolio similarly for this year.
Market commentary
There is a new sheriff in town.
On Election Day 2016, your Portfolio Managers talked late into the night discussing which stocks we would buy the next morning. We had a list of 11 (including many existing portfolio holdings). The futures market was down about 10% with the news that the next president of the United States would be Donald Trump. Early the next morning, we had to draw up a different list. What are we selling into this strength? As of the end of the first quarter 2017, the Russell 2500 index is up 14.78% since the Nov. 8, 2016 presidential election. Investors decided President Trump's programs would stimulate the economy. It is hard to disagree with the market's conclusion when we consider each component of his platform independently: tax reform, defense spending, infrastructure spending, fewer regulations, etc. We believe that any one of those, in a vacuum, could be very beneficial to the U.S. economy, and hence, to stock prices.
In reality, however, no clear progress has been made in any of those areas. Cabinet appointment confirmations have been taking longer than expected, and a number of them have been very contentious. Additionally, President Trump's tweets continue to divide an already divided country, so why should we expect any bipartisanship today? How will the president's legislative agenda move forward without bipartisan agreement? The market is pricing in success, but what about failure or a substantial delay? Despite control of both houses of the United States Congress, the Republican Party failed to repeal the Affordable Care Act. We would not call this a good start.
Then there are the inconsistencies. For example, President Trump pledged to make blue-collar workers relevant again, but he is talking about tariffs, which could result in a stronger dollar. The higher dollar may make U.S. manufacturing less competitive and endanger blue-collar jobs. In our opinion, a Border Adjustment Tax would likely result in higher consumer prices, which would hurt financially strapped blue-collar workers. Cutting taxes helps companies, but how would the government plug that hole in revenue and increase defense and infrastructure spending at the same time? Chair Janet Yellen's Federal Reserve raised interest rates at the March 15 meeting and we believe more interest rate hikes are expected. Higher interest rates mean higher outlays by the government for interest expense on its debt (further widening the budget gap).
The same is true for companies. The total debt outstanding for Russell 2500 companies is $2.1 trillion (vs. a market capitalization of around $4.8 trillion). Every one percent rate increase would translate to over $20 billion of additional interest expense over a period of time (assuming a parallel shift up in the yield curve). Even if all the efforts to stimulate the economy work without a hitch, we would most probably end up with higher inflation (do people still remember what inflation means?).
1
FPA CAPITAL FUND, INC.
LETTER TO SHAREHOLDERS
(Continued)
Are ETFs the new weapons of mass destruction?
Notwithstanding any of the concerns mentioned above, investors appear excited about the future as they continue to pour money into the stock market. They express this excitement by allocating a tremendous amount of capital into index funds and Exchange-Traded Funds (ETFs). Last year, passive funds had $563 billion of inflows, while active funds experienced $326 billion of outflows, according to Morningstar. Active U.S. equity funds manage $3.6 trillion and passive instruments are about to catch them at $3.1 trillion.1 When we add the $124 billion poured into ETFs in the first two months of 2017,2 active and passive investments are almost at parity. This does not even include the so-called active managers that tend to hug an index. The long-term trend is very pronounced. Since 2007, $1.2 trillion dollars disappeared from actively managed U.S. domestic equity funds and $1.4 trillion dollars were added to passive strategies. As the number of corporate listings continues to dwindle, more and more ETFs are brought to the marketplace. This leads to more ETFs (financial vehicles), some of which use leverage, chasing fewer and fewer actual companies. Financial vehicles using leverage to purchase a shrinking pool of real assets — sound familiar?3
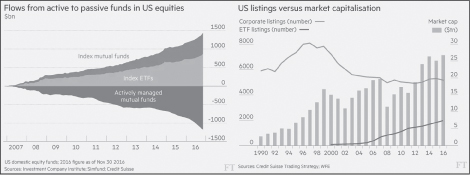
The consequence of unrelenting inflows into passive funds is that stocks that are included in a major index receive ongoing support by the indiscriminate purchases made by these funds regardless of a company's fundamentals. The benefits are amplified for companies that are owned by dozens of ETFs and index funds. On the flip side, those unfortunate stocks that are not included in a major index receive the reverse treatment, as active managers that tend to be fully invested are forced to sell shares to meet the onslaught of redemptions they are facing. But the worst fate is saved for those orphan securities that are removed from an index. These stocks face both indiscriminate selling from index funds on their removal date and continued redemption-related selling from actively managed funds. Unfortunately, these buy and sell decisions are entirely disconnected from a company's fundamentals. This potentially sets the stage, should the tables turn, for an exceptionally compelling investment environment where companies with strong fundamentals are available for purchase at cheap valuations for those searching outside of the indices (as we often are).
1 http://www.cnbc.com/2017/02/18/massive-exodus-continues-from-active-funds-and-vanguard-is-reaping-the-gains.html
2 https://www.wsj.com/articles/small-investors-run-to-etfs-1488586244
3 https://www.ft.com/content/6dabad28-e19c-11e6-9645-c9357a75844a
2
FPA CAPITAL FUND, INC.
LETTER TO SHAREHOLDERS
(Continued)
Moreover, as more investors move from active to passive investments, the market for many individual stocks becomes less liquid. With reduced liquidity, we expect increasing volatility in the marketplace. Last month Kopin Tan wrote in Barron's, "For weeks, the stretch from 3 p.m. to 4 p.m. became known as the market's happiest hour, since a surge in late-day buying often nudged indexes from the red into the green. This happened because ETFs and passive index funds, unlike actively managed ones, must rebalance by the end of the day to match the benchmarks they track. According to JP Morgan, a whopping 37% of daily New York Stock Exchange trading recently took place in the last 30 minutes of each session. But when the indexes turn down, will this be the unhappiest hour?"4
The weapons of mass destruction during the Great Financial Crisis were three-letter words: CDS (credit default swap), CDO (collateralized debt obligation), etc. The current weapon of mass destruction is also a three-letter word: ETF (exchange-traded fund). When the world decides that there is no need for fundamental research and investors can just blindly purchase index funds and ETFs without any regard to valuation, we say the time to be fearful is now.
What about the fundamentals?
While the indices have all rallied substantially, the fundamentals have not kept pace. In the analysis below, we looked at the performance of the Russell 2500 constituents (as of December 2014). The cumulative market cap of these companies has grown 16% from the end of 2014 through the end of first quarter of 2017 and yet the decline in net income was nearly 20% in 2016 (as shown below) over the past two years. Essentially, stock appreciation has come entirely from multiple expansion. Our analysis also showed that 32% of the companies in the Russell 2500 had negative income in 2016 (about the same as in 2015). Furthermore, when we narrow the Russell 2500 down to the universe of companies with market caps ranging from $1 billion — $4 billion (our sweet spot), we can see that those companies have seen an even more pronounced disparity between their cumulative market cap gain and their deteriorating fundamentals. Net income for this set of companies actually declined by 32%, yet the cumulative market cap grew by over 15%, driven entirely by multiple expansion.

Interestingly, according to the Bespoke Investment Group, during March 2017, the 50 S&P 500 stocks with the highest price to earnings ratio lost 0.9% of value. On the other hand, the 50 stocks with the lowest price to earnings ratio lost 4.3% of value. The 50 stocks that experienced the greatest price increase in the first two months of 2017 appreciated another 0.3% in March 2017, whereas the worst performing 50 S&P constituents experienced yet another 3% decline.
4 http://www.barrons.com/articles/does-oils-slide-signal-weakening-growth-1489210612
3
FPA CAPITAL FUND, INC.
LETTER TO SHAREHOLDERS
(Continued)
What are management teams doing as stock indices continue climbing higher? Evidently, they are selling. According to Vickers Stock Report's latest count, insider sales were eleven times larger than purchases — which amounts to a 3.5 standard deviation above the mean.5 Another research firm, Washington Service, reported that both total insider buys and the ratio of buyers to sellers were at their lowest points since at least 1988 (29 years). To put it in perspective, there were 3,200 insider buyers in November 2008 and only 279 in January 2017.6 In the face of these cautionary signs, what are the investors doing? The investors are so excited about the market that margin debt hit an all-time record in February 2017. They borrowed $528.2 billion against their brokerage accounts.7 Margin debt was also at peak levels in 2000 and 2008. Since 2009, global investors decreased their cash positions to a two-decade low and increased their stock weighting by over 60% (almost no change in fixed income).8
This relatively dramatic increase in valuation without a commensurate improvement in financials is a key driver of the recent rise in our cash balance. Broadly speaking, when prices rise, there are fewer and fewer opportunities to purchase undervalued stocks. What's more, existing stocks in the portfolio begin to approach our exit prices. While this part of the cycle can be frustrating for value investors like ourselves because our hunting grounds shrink, we hold firm to the belief that stock prices cannot remain untethered from fundamentals indefinitely. Ultimately, we believe that the higher stock prices rise without improving company fundamentals, the harder they will fall. And if they do, we will be ready to deploy the capital that you have entrusted us with at much more attractive valuations than what's available today.
5 http://www.cnbc.com/2017/02/28/company-insiders-are-dumping-stock-at-levels-rarely-seen-report-indicates.html
6 https://www.wsj.com/articles/corporate-insiders-havent-been-this-uninterested-in-buying-stocks-since-ronald-reagan-was-president-1489055409?tesla=y&utm_medium=email&utm_source=newsletter&utm_term=170310&utm_campaign=moneystuff
7 https://www.wsj.com/articles/margin-debt-hit-all-time-high-in-february-1490825475?tesla=y&utm_medium=email&utm_source=newsletter&utm_term=170330&utm_campaign=moneystuff
8 https://www.bloomberg.com/news/articles/2017-03-07/cash-dwindling-to-two-decade-low-in-global-investment-portfolio
4
FPA CAPITAL FUND, INC.
LETTER TO SHAREHOLDERS
(Continued)
Portfolio commentary
Q1 2017 Winners9 | | Performance
Contribution | | Q1 2017 Losers9 | | Performance
Contribution | |
Western Digital Corp | | | 1.41 | % | | Babcock & Wilcox Enterprises Inc | | | -1.75 | % | |
DeVry Education Group Inc | | | 0.36 | % | | Vista Outdoor Inc | | | -0.68 | % | |
Cubic Corp | | | 0.16 | % | | Arris International Plc | | | -0.64 | % | |
Akorn IncInc | | | 0.13 | % | | SM Energy Company | | | -0.41 | % | |
AGCO Corporation | | | 0.09 | % | | Cimarex Energy Co | | | -0.39 | % | |
Fiscal Year Winners10 | | Performance
Contribution | | Fiscal Year Losers10 | | Performance
Contribution | |
Western Digital Corp | | | 4.57 | % | | Babcock & Wilcox Enterprises Inc | | | -2.45 | % | |
DeVry Education Group Inc | | | 2.64 | % | | Houghton Mifflin Harcourt | | | -1.64 | % | |
InterDigital | | | 2.05 | % | | Vista Outdoor | | | -0.82 | % | |
Patterson-UTI Energy | | | 1.75 | % | | Undisclosed 1 | | | -0.17 | % | |
Dana | | | 1.41 | % | | Barnes & Noble | | | 0.00 | % | |
Energy investments
Energy — a sector that had generated higher returns for us in 2016 — struggled in the first quarter of 2017. Russell 2500 energy companies were down 9.12%, representing 4.26% underperformance vs. the index. We view the sector's weakness as a speed bump on the road to market rebalancing and higher oil prices. Our conviction in this thesis remains firm, as the Organization for Economic Co-operation and Development (OECD) inventory (the proxy for global storage) draws suggest that the market has been under-supplied since Q3 2016. Additionally, OPEC and 13 additional countries have accelerated reductions in excess inventory by largely complying with their November agreement to cut production by 1.8 billion barrels per day (bpd). Meanwhile, global demand has been consistently revised upward. So why have oil prices declined during the quarter? There are a few primary reasons, all of which we believe will prove short-lived.
The first is simply investor impatience surrounding U.S petroleum stocks, which we believe remain stubbornly high relative to the rest of the world. We would note here that weekly imports have been trending downward since January11, just as refining utilization is set to ramp up after a particularly heavy maintenance season. At the same time, OECD Europe & Asia Pacific stocks have been falling sharply toward their respective long-term averages since
9 Reflects the top contributors and top detractors to the Fund's performance based on contribution to return for the quarter. Contribution is presented as gross of investment management fees, transactions costs, and Fund operating expenses, which if included, would reduce the returns presented. This is not a recommendation for a specific security and these securities may not be in the fund at the time you receive this report. Past performance does not guarantee future results.
10 Reflects the top contributors and top detractors to the Fund's performance based on contribution to return for the Fund's fiscal year ended March 31. Contribution is presented as the gross of investment management fees, transactions costs, and Fund operating expenses, which if included, would reduce the returns presented. This is not a recommendation for a specific security and these securities may not be in the Fund at the time you receive this report. Past performance does not guarantee future results.
11 Cornerstone Analytics: The Morning Energy Update dated April 3, 2017.
5
FPA CAPITAL FUND, INC.
LETTER TO SHAREHOLDERS
(Continued)
mid-2016. The second issue is anxiety about a resurgence in U.S. shale supply. Indeed, the domestic rig count experienced a notable acceleration since November, while crude production has bounced back by over 600,000 bpd over the last five months. Interestingly, The Energy Information Agency's (EIA) data show that more than 100% of the increase from September to December 2016 came from Alaska and federal offshore projects, not from the lower 48 states. Moreover, U.S. production alone is simply insufficient to offset the onslaught of OPEC production cuts, limited OPEC spare capacity, historically muted production gains outside OPEC and the United States, multiple years of lower global capital investment, natural production decline rates, and, yes, steadily growing global demand. Further, there are multiple underappreciated headwinds to U.S. production growth, including service bottlenecks, levered balance sheets, potential imbalances between high- and low-density crude supplies, and a limited footprint of tier-one core acreage.
Finally, many investors worry OPEC will scale back recent cuts in response to surging U.S. shale production. We believe a Saudi-led extension of the cuts is more likely than not, because the International Monetary Fund estimates that the kingdom needs at least an $80 oil price to balance its (slimmed down) budget, and because of Saudi Arabia's publicly acknowledged goal this year of reducing global storage levels back to their five-year average. Moreover, OPEC sources have indicated that the group's members increasingly favor an extension beyond this June.
Let's end with some simple math to better illustrate why those concerned with today's oil market concerns may be missing the larger picture. On the demand side, the International Energy Agency expects global oil demand to grow by 6 million bpd from YE2016 to YE2022. On the supply side, the IEA estimates that OPEC currently has 2 million bpd in spare capacity (just 3% of global supply); U.S. production is expected to increase by just 800 million bpd by YE2018; and Non-OPEC ex. U.S. production growth has not budged since 2010 while investment has fallen off a cliff. Add in a supply shock emanating from Venezuela, Nigeria, Libya, or elsewhere and the situation becomes more precarious, and yet constructive for higher oil prices. These are the asymmetric scenarios that we look for, and we are confident that our high quality energy companies are well positioned to benefit in this environment going forward.
Babcock & Wilcox Enterprises, Inc. (NYSE: BW)
Babcock & Wilcox Enterprises (BW) is a leader in the construction of power generation systems. The company has an operating history of 150 years (founded in 1867). Babcock & Wilcox designs, engineers, constructs, installs, and services utility and industrial boiler plants, scrubbers, steam generators, environmental control systems, power plant equipment, air pollution control systems, etc. It manufactures large components such as burners, generators, and boilers that can be fired up by many different energy sources (coal, waste, etc.). The company operates three segments: Power (62% of revenues), Renewables (22% of revenues), and Industrial (16% of revenues, but will be higher pro-forma of their latest acquisition).
We were initially intrigued by the company's leadership position in its markets, the CEO's experience at larger companies and keen focus on cost cutting, the company's large backlog that provides visibility to future revenues, and our belief in BW's ability to apply its expertise to similar products and different geographies.
We initiated a position in the third quarter of 2015, and the company executed in-line with our expectations. BW spun out its nuclear business, which we subsequently sold at a gain. The company generated strong free cash flow and used it to either buy back stock or make acquisitions that diversify them away from coal. All was going according to plan until March 1, 2017, when BW reported its fourth quarter 2016 earnings and announced a number of project errors in their Renewables division (the other two divisions performed well).
We believe the errors occurred because the company has been emphasizing its goal to increase BW's valuation multiple by decreasing its reliance on coal. In order to achieve this, the company may have grown the Renewables business too fast. Upon bidding and successfully winning a number of projects with its superior technology, BW simply did not have enough engineers at the right time. BW has replaced the top three managers in the Renewables business, reviewed each project in detail, and identified seven problem projects. The company replaced on-site
6
FPA CAPITAL FUND, INC.
LETTER TO SHAREHOLDERS
(Continued)
managers, and halted bids on any new projects for six months so it could focus on execution and getting the issues under control. In our view, BW's problems are confined to only one business segment.
When one examines closer, the Renewables business itself could be separated into three divisions: operations & maintenance, technology, and architectural engineering. The operations & maintenance business is doing well. The technology BW provides (boilers and grates) is considered superior to that of their competitors. The company has a good technology solution in waste-to-energy (burns almost anything the client wants at high capacity). Where BW struggled was the architectural engineering section. This is the lowest margin, highest risk part of the segment, and there is no reason for BW to perform this phase of any project. The company can simply partner with a different firm — a strategy the management team agreed with in our subsequent conversations.
There is no denying that the management team made a strategic mistake and the company is in the penalty box. On the day of the announcement, BW's stock price decreased by 37%, wiping out $300 million in market value. When we sharpened our pencils and calculated the new normalized earning power of the company (not what they will earn in 2017 when they are working through their problems, but what we expect them to earn over the long-term), we calculated a deterioration of $4 million per year. How the market reacted to this development ties really well to what we wrote about in the market commentary section of this letter. There is simply not enough liquidity in the market for companies with smaller market capitalizations.
Vista Outdoor Inc. (NYSE: VSTO)
Vista Outdoors ("VSTO") derives 56% of revenue from its Shooting Sports segment, which sells consumer ammunition predominantly, and long-gun firearms to a much lesser extent. The remaining 44% of revenue comes from the Outdoor Products segment, which consists of a portfolio of leading brands in firearm accessories, hydration products, water sports, grilling, and action sports helmets. The company is the market leader in all of its primary categories and has a consistent history of profitability.
We initiated a small position in VSTO prior to the 2016 election (smallest position in the portfolio as of Nov. 8, 2016 at less than 50bps). We opted for the small position because of the company's brief independent operating history (VSTO was spun out of ATK in 2015), the limited visibility into how the election would impact the business, and the lower reward-to-risk ratio relative to our opportunity set.
Our thesis at initial investment was that the stock price did not fully reflect VSTO's ability to grow earnings over the long term for two reasons. First, despite event-driven cyclicality issues (elections, terrorism, gun control media coverage, etc.), we believe demand for Shooting Sports products should benefit from an industry that now has many more shooting participants (+17 million new shooters from 2009-14), including a higher proportion of women (50% of new shooters) and young people (68% of new shooters). Further, this larger pool of participants is more interested in target practice than hunting, and the installed base of product has shifted toward more ammunition-intensive firearms. Nearer term, VSTO's relative financial strength and cost leadership strategically positions the company to retake share from smaller competitors that opportunistically entered the market during recent industry capacity constraints.
Second, unlike the highly concentrated ammunition industry, the outdoor product businesses that VSTO competes in are not only highly fractured, but also have very little overlap with other well-resourced competitors. Our research showed that VSTO has an unparalleled distribution relationship with leading retailers of outdoor products, including Walmart, Amazon, Cabela's, and Bass Pro Shops. The company's largest customers actually let VSTO design their annual outdoor product floor plans, providing a valuable advantage when it comes to securing and expanding shelf space. Much of VSTO's recent top-line growth has come from acquiring niche brands with leading category share at reasonable multiples. The company then adds value by growing each brand's presence within its much larger distribution footprint.
The stock has sold off since our small purchase on news of an impairment charge and by concerns about data indicating another cyclical downturn in firearms and ammunition. We are more concerned about the first issue than
7
FPA CAPITAL FUND, INC.
LETTER TO SHAREHOLDERS
(Continued)
the latter development. The impairment charge was related to two older acquisitions that already had been widely discussed prior to each deal. We are, however, growing more alarmed about the underperforming organic growth in the recently acquired brands, and the fact that management has not shared key data with investors so they can assess VSTO's progress in achieving synergies.
Regarding the ammunition business, we believe much of the concern is transitory. For instance, inventory levels are elevated partially due to recent retailer bankruptcies, and because many firearm and firearm accessory distributors bet on a Hillary Clinton victory and stocked too much product ahead of the election. Further, the industry is also lapping the one-year anniversary of surge buying associated with the Paris terrorist attacks. These events have contributed to deteriorating comps that are still holding up better than sales levels a year after the Sandy Hook shootings. Admittedly, it is early, but we believe this is yet another cyclical gyration (rather than the end of an Obama-era super cycle) and that long-term growth will remain supported by higher shooting participation and the increased emphasis on target shooting and ammunition intensive firearms.
With this in mind, we have slightly increased our position (1.3% as of 03/31/17). We are holding back because we want more clarity on acquisition performance and we believe it will take several quarters to clear out excess firearm and ammunition inventory across the industry. While ammunition sales (VSTO's key driver) have not experienced a peak-to-trough decline of more than a low teens figure over the last 15 years, we are now modeling a 20% consolidated sales decline in our downside case along with 30% decremental margins. In our upside case, we remain conservative by modeling a 10% sales contraction this year, followed by three years of pre-Obama era top-line growth, and margins getting back in line with the last twelve months. Using a low teens multiple gets us to a 3:1 reward-to-risk ratio at a mid-to-high teens stock price.
Arris International plc (NasdaqGS: ARRS)
We have been investors at ARRS since October 2010 and discussed the company in detail in previous letters. A good summary can be found in our first quarter 2016 commentary (http://fpafunds.com/docs/hc_capital/fcap-q1-letter-2016_final.pdf?sfvrsn=4). In that commentary, we mentioned that the company's then-new acquisition of Pace plc. would be a success, but that the market was in a wait-and-see mode. That thesis worked out throughout the remainder of 2016. In February 2017, ARRS agreed to purchase Ruckus. This is yet another acquisition that needs to be digested by the investment community. We are excited about this combination. Wireless broadband investment is growing rapidly. The convergence of wired and wireless networks is upon us and we believe that ARRS would be a very strong player. In our opinion, this deal will likely increase ARRS' gross margins and will be highly accretive to the company's 2018 earnings. But public investors are worried about increasing DRAM (dynamic random-access memory) pricing, which was up 27% in 2016, and 24% in Q1'17. Memory pricing is volatile and cyclical, so we are not worried about this issue over the long term. ARRS hosted investor day on March 23, 2017. Even during a year with increased DRAM cost and the E6000 Gen2 router delay, ARRS is expected to generate $630 million-$720 million of free cash flow — that would be ~13% free cash flow yield.
Western Digital Corporation (NasdaqGS: WDC)
Our largest contributor this quarter was WDC. This investment had the highest weighting in our portfolio at the end of both the fourth quarter 2016 and first quarter 2017. We have owned WDC continuously over the last 10 years and have written about the company in detail many times. As one can see in the chart12 below, we have actively managed the position size based on our upside/downside valuations and the prevailing stock price.
12 Percentages are based on the Percentages are based on the absolute number of shares.
8
FPA CAPITAL FUND, INC.
LETTER TO SHAREHOLDERS
(Continued)
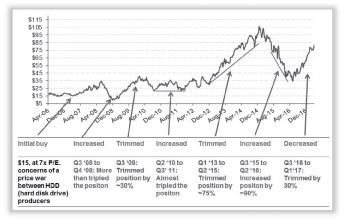
WDC's stock price started declining in 2015 when the company announced its intention to acquire SanDisk in a $17 billion deal. The selling pressure was due to the high sticker price on the deal, the increased debt load, and the foray into a new business (NAND flash semiconductors). We, on the other hand, saw this as an incredible opportunity to almost double our position because we believed the deal would catapult WDC into a leadership position in the NAND memory business. While the acquisition did not come cheaply, WDC now has a very competitive NAND offering that we believe should put to rest fears that the company could be disintermediated by NAND memory companies. WDC immediately started integrating the business and used its strong cash flow to decrease its debt load. The big news now involves its flash manufacturing joint venture partner Toshiba, which has recently run into major financial difficulty due to its unrelated nuclear business. These issues forced Toshiba to put its memory business on the selling block, which includes its ownership interest in the joint venture. While it is very difficult to know the impact of a future transaction, we think WDC may be well situated to benefit if they participate in a deal. We continue to track the situation closely.
Conclusion
We will close this letter the same way we closed our first quarter 2016 commentary: We are true contrarian investors, so we own a portfolio of battered-down names. We believe many of them are like a coiled spring waiting to be sprung. We remain very excited about our portfolio prospectively. We thank you for your continued confidence in us.
Respectfully submitted,

| | 
| |
Arik Ahitov
Portfolio Manager
April 6, 2017 | | Dennis Bryan
Portfolio Manager | |
9
FPA CAPITAL FUND, INC.
LETTER TO SHAREHOLDERS
(Continued)
Fund shares are presently offered for sale only to existing shareholders and to directors, officers and employees of the Fund, the Adviser, and affiliated companies, and their immediate relatives, and certain categories of shareholders.
Performance data quoted in this letter represents past performance and neither indicates nor guarantees future performance. The discussions of Fund investments represent the views of the Fund's managers at the time of this report and are subject to change without notice. References to individual securities are for informational purposes only and should not be construed as recommendations to purchase or sell individual securities. While the Fund's managers believe that the Fund's holdings are value stocks, there can be no assurance that others will consider them as such. Further, investing in value stocks presents the risk that value stocks may fall out of favor with investors and underperform growth stocks during given periods.
Portfolio composition will change due to ongoing management of the Fund.
The Russell 2500 Index is an unmanaged index comprised of the 2,500 smallest companies in the Russell 3000 Index.
FUND RISKS
Investments in mutual funds carry risks and investors may lose principal value. Stock markets are volatile and can decline significantly in response to adverse issuer, political, regulatory, market, or economic developments. The funds may purchase foreign securities which are subject to interest rate, currency exchange rate, economic and political risks: this may be enhanced when investing in emerging markets. Small and mid-cap stocks involve greater risks and they can fluctuate in price more than larger company stocks. Groups of stocks, such as value and growth, go in and out of favor which may cause certain funds to underperform other equity funds.
FORWARD LOOKING STATEMENT DISCLOSURE
As mutual fund managers, one of our responsibilities is to communicate with shareholders in an open and direct manner. Insofar as some of our opinions and comments in our letters to shareholders are based on our current expectations, they are considered "forward-looking statements" which may or may not prove to be accurate over the long term. While we believe we have a reasonable basis for our comments and we have confidence in our opinions, actual results may differ materially from those we anticipate. You can identify forward-looking statements by words such as "believe," "expect," "may," "anticipate," and other similar expressions when discussing prospects for particular portfolio holdings and/or the markets, generally. We cannot, however, assure future results and disclaim any obligation to update or alter any forward-looking statements, whether as a result of new information, future events, or otherwise. Further, information provided in this report should not be construed as a recommendation to purchase or sell any particular security.
10
FPA CAPITAL FUND, INC.
HISTORICAL PERFORMANCE
(Unaudited)
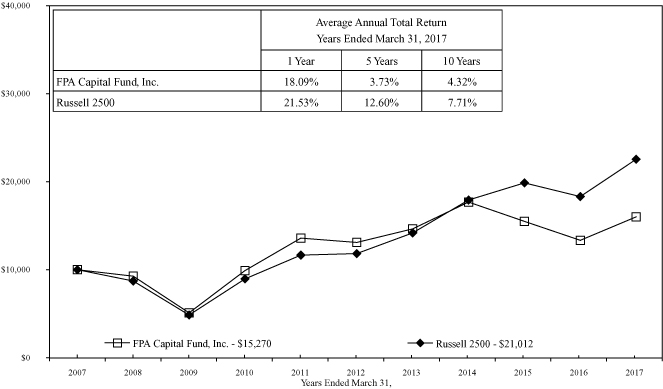
Change in Value of a $10,000 Investment in FPA Capital Fund, Inc. vs. Russell 2500 from April 1, 2007 to March 31, 2017
Past performance is not indicative of future performance. Current performance may be higher or lower than the performance data shown above. The Fund's most recent month-end performance can be obtained online at www.fpafunds.com. The Index does not reflect any commissions or fees which would be incurred by an investor purchasing the stocks they represent. Past performance is no guarantee of future results and current performance may be higher or lower than the performance shown. This data represents past performance and investors should understand that investment returns and principal values fluctuate, so that when you redeem, your investment may be worth more or less than its original cost. Current month-end performance data can be obtained by visiting the website at www.fpafunds.com or by calling toll-free, 1-800-982-4372. Information regarding the Fund's expense ratio and redemption fees can be found on pages 19 and 23. The Prospectus details the Fund's objective and policies, fees, and other matters of interest to prospective investors. Please read the prospectus carefully before investing. The Prospectus may be obtained by visiting the website at www.fpafunds.com, by email at crm@fpafunds.com, toll-free by calling 1-800-982-4372 or by contacting the Fund in writing.
11
FPA CAPITAL FUND, INC.
PORTFOLIO SUMMARY
March 31, 2017
Common Stocks | | | | | | | 64.7 | % | |
Exploration & Production | | | 8.1 | % | | | | | |
Communications Equipment | | | 7.7 | % | | | | | |
Technology Distributors | | | 7.6 | % | | | | | |
Computer Hardware & Storage | | | 7.6 | % | | | | | |
Oil & Gas Services & Equipment | | | 6.2 | % | | | | | |
Consumer Goods — Rental | | | 4.3 | % | | | | | |
Semiconductor Manufacturing | | | 3.1 | % | | | | | |
Auto Parts | | | 2.8 | % | | | | | |
Publishing & Broadcasting | | | 2.8 | % | | | | | |
Electrical Power Equipment | | | 2.7 | % | | | | | |
Educational Services | | | 2.5 | % | | | | | |
Specialty Apparel Stores | | | 1.9 | % | | | | | |
Information Technology Services | | | 1.9 | % | | | | | |
Agricultural Machinery | | | 1.9 | % | | | | | |
Other Common Stocks | | | 1.3 | % | | | | | |
Specialty Pharma | | | 1.2 | % | | | | | |
Construction & Mining Machinery | | | 1.1 | % | | | | | |
Bonds & Debentures | | | | | | | 33.3 | % | |
Short-term Investments | | | | | | | 2.0 | % | |
Other Assets And Liabilities, Net | | | | | | | 0.0 | % | |
Net Assets | | | | | 100.0 | % | |
12
FPA CAPITAL FUND, INC.
PORTFOLIO OF INVESTMENTS
March 31, 2017
COMMON STOCKS | | Shares | | Fair Value | |
EXPLORATION & PRODUCTION — 8.1% | |
Cimarex Energy Co. | | | 196,504 | | | $ | 23,480,263 | | |
Noble Energy, Inc. | | | 844,890 | | | | 29,013,523 | | |
SM Energy Co. | | | 464,453 | | | | 11,156,161 | | |
| | | $ | 63,649,947 | | |
COMMUNICATIONS EQUIPMENT — 7.7% | |
ARRIS International plc* | | | 1,580,144 | | | $ | 41,794,809 | | |
InterDigital, Inc. | | | 223,955 | | | | 19,327,316 | | |
| | | $ | 61,122,125 | | |
TECHNOLOGY DISTRIBUTORS — 7.6% | |
Arrow Electronics, Inc.* | | | 279,083 | | | $ | 20,487,483 | | |
Avnet, Inc. | | | 867,520 | | | | 39,697,715 | | |
| | | $ | 60,185,198 | | |
COMPUTER HARDWARE & STORAGE — 7.6% | |
Western Digital Corporation | | | 723,760 | | | $ | 59,731,913 | | |
OIL & GAS SERVICES & EQUIPMENT — 6.2% | |
Helmerich & Payne, Inc. | | | 210,778 | | | $ | 14,031,491 | | |
Patterson-UTI Energy, Inc. | | | 822,558 | | | | 19,963,483 | | |
Rowan Cos. plc (Class A)* | | | 965,710 | | | | 15,045,762 | | |
| | | $ | 49,040,736 | | |
CONSUMER GOODS — RENTAL — 4.3% | |
Aaron's, Inc. | | | 1,137,219 | | | $ | 33,820,893 | | |
SEMICONDUCTOR MANUFACTURING — 3.1% | |
Veeco Instruments, Inc.* | | | 810,280 | | | $ | 24,186,858 | | |
AUTO PARTS — 2.8% | |
Dana, Inc. | | | 1,141,274 | | | $ | 22,038,001 | | |
PUBLISHING & BROADCASTING — 2.8% | |
Houghton Mifflin Harcourt Co.* | | | 2,166,977 | | | $ | 21,994,817 | | |
ELECTRICAL POWER EQUIPMENT — 2.7% | |
Babcock & Wilcox Enterprises, Inc.* | | | 2,286,239 | | | $ | 21,353,472 | | |
13
FPA CAPITAL FUND, INC.
PORTFOLIO OF INVESTMENTS (Continued)
March 31, 2017
COMMON STOCKS — Continued | | Shares or
Principal
Amount | | Fair Value | |
EDUCATIONAL SERVICES — 2.5% | |
DeVry Education Group, Inc. | | | 560,592 | | | $ | 19,872,986 | | |
SPECIALTY APPAREL STORES — 1.9% | |
Foot Locker, Inc. | | | 68,870 | | | $ | 5,152,164 | | |
Vista Outdoor, Inc.* | | | 489,820 | | | | 10,085,394 | | |
| | | $ | 15,237,558 | | |
INFORMATION TECHNOLOGY SERVICES — 1.9% | |
Cubic Corporation | | | 286,300 | | | $ | 15,116,640 | | |
AGRICULTURAL MACHINERY — 1.9% | |
AGCO Corporation | | | 249,611 | | | $ | 15,021,590 | | |
SPECIALTY PHARMA — 1.2% | |
Akorn, Inc.* | | | 380,120 | | | $ | 9,153,290 | | |
CONSTRUCTION & MINING MACHINERY — 1.1% | |
Oshkosh Corporation | | | 127,000 | | | $ | 8,710,930 | | |
OTHER COMMON STOCKS — 1.3% | | $ | 10,413,441 | | |
| TOTAL COMMON STOCKS — 64.7% (Cost $350,088,408) | | $ | 510,650,395 | | |
BONDS & DEBENTURES | |
U.S. TREASURIES — 33.3% | |
U.S. Treasury Bills | |
| — 0.731% 4/20/2017@@@ | | $ | 25,000,000 | | | $ | 24,991,325 | | |
| — 0.700% 4/27/2017@@@ | | | 198,000,000 | | | | 197,902,980 | | |
| — 0.600% 6/29/2017@@@ | | | 40,000,000 | | | | 39,927,016 | | |
| TOTAL U.S. TREASURIES (Cost $262,822,345) | | $ | 262,821,321 | | |
| TOTAL BONDS & DEBENTURES — 33.3% (Cost $262,822,345) | | $ | 262,821,321 | | |
| TOTAL INVESTMENT SECURITIES — 98.0% (Cost $612,910,753) | | $ | 773,471,716 | | |
14
FPA CAPITAL FUND, INC.
PORTFOLIO OF INVESTMENTS (Continued)
March 31, 2017
| | Principal
Amount | | Fair Value | |
SHORT-TERM INVESTMENTS — 2.0% | |
State Street Bank Repurchase Agreement — 0.09% 4/3/2017
(Dated 3/31/2017, repurchase price of $15,859,119, collateralized by
$16,935,000 principal amount U.S. Treasury Bond —
2.75% 2042, fair value $16,177,870) | | $ | 15,859,000 | | | $ | 15,859,000 | | |
TOTAL SHORT-TERM INVESTMENTS (Cost $15,859,000) | | $ | 15,859,000 | | |
TOTAL INVESTMENTS — 100.0% (Cost $628,769,753) | | $ | 789,330,716 | | |
Other Assets and Liabilities, net — 0.0% | | | | $ | 110,625 | | |
NET ASSETS — 100.0% | | $ | 789,441,341 | | |
* Non-income producing security.
@@@ Zero coupon bond. Coupon amount represents effective yield to maturity.
As permitted by U.S. Securities and Exchange Commission regulations, "Other" Common Stocks include holdings in their first year of acquisition that have not previously been publicly disclosed.
See notes to financial statements.
15
FPA CAPITAL FUND, INC.
STATEMENT OF ASSETS AND LIABILITIES
March 31, 2017
ASSETS | |
Investment securities — at fair value (identified cost $612,910,753) | | $ | 773,471,716 | | |
Short-term investments — at amortized cost (maturities 60 days or less) | | | 15,859,000 | | |
Cash | | | 666 | | |
Due from broker — OTC derivatives collateral | | | 250,588 | | |
Receivable for: | |
Investment securities sold | | | 1,020,244 | | |
Dividends and interest | | | 393,194 | | |
Capital Stock sold | | | 315,908 | | |
Prepaid expenses and other assets | | | 7,102 | | |
Total assets | | | 791,318,418 | | |
LIABILITIES | |
Payable for: | |
Investment securities purchased | | | 865,529 | | |
Advisory fees | | | 439,005 | | |
Capital Stock repurchased | | | 352,449 | | |
Accrued expenses and other liabilities | | | 220,094 | | |
Total liabilities | | | 1,877,077 | | |
NET ASSETS | | $ | 789,441,341 | | |
SUMMARY OF SHAREHOLDERS' EQUITY | |
Capital Stock — par value $0.01 per share; authorized
100,000,000 shares; outstanding 21,692,694 shares | | $ | 216,927 | | |
| Additional Paid-in Capital | | | 609,429,776 | | |
| Undistributed net realized gain | | | 19,233,675 | | |
Unrealized appreciation of investments | | | 160,560,963 | | |
NET ASSETS | | $ | 789,441,341 | | |
NET ASSET VALUE | |
Offering and redemption price per share | | $ | 36.39 | | |
See notes to financial statements.
16
FPA CAPITAL FUND, INC.
STATEMENT OF OPERATIONS
For the Year Ended March 31, 2017
INVESTMENT INCOME | |
Dividends | | $ | 5,770,372 | | |
Interest | | | 1,681,295 | | |
Total investment income | | | 7,451,667 | | |
EXPENSES | |
Advisory fees | | | 5,242,309 | | |
Transfer agent fees and expenses | | | 354,268 | | |
Legal fees | | | 249,159 | | |
Director fees and expenses | | | 210,470 | | |
Reports to shareholders | | | 102,620 | | |
Audit and tax services fees | | | 54,480 | | |
Administrative services fees | | | 41,549 | | |
Professional fees | | | 37,578 | | |
Filing fees | | | 32,453 | | |
Custodian fees | | | 24,244 | | |
Other | | | 2,707 | | |
Total expenses | | | 6,351,837 | | |
Net expenses | | | 6,351,837 | | |
Net investment income | | | 1,099,830 | | |
NET REALIZED AND UNREALIZED GAIN (LOSS) | |
Net realized gain (loss) on: | |
Investments | | | 56,505,483 | | |
Written Options | | | 634,997 | | |
Net change in unrealized appreciation (depreciation) of: | |
Investments | | | 73,480,801 | | |
Net realized and unrealized gain | | | 130,621,281 | | |
NET INCREASE IN NET ASSETS RESULTING FROM OPERATIONS | | $ | 131,721,111 | | |
See notes to financial statements.
17
FPA CAPITAL FUND, INC.
STATEMENTS OF CHANGES IN NET ASSETS
| | | Year
Ended
March 31,
2017 | | Year
Ended
March 31,
2016 | |
INCREASE (DECREASE) IN NET ASSETS | |
Operations: | |
Net investment income | | $ | 1,099,830 | | | $ | 3,016,447 | | |
Net realized gain | | | 57,140,480 | | | | 13,727,991 | | |
Net change in unrealized appreciation (depreciation) | | | 73,480,801 | | | | (135,512,598 | ) | |
Net increase (decrease) in net assets resulting from operations | | | 131,721,111 | | | | (118,768,160 | ) | |
Distributions to shareholders from: | |
Net investment income | | | (2,253,045 | ) | | | (2,971,492 | ) | |
Net realized capital gains | | | (39,457,798 | ) | | | (7,894,776 | ) | |
Total distributions | | | (41,710,843 | ) | | | (10,866,268 | ) | |
Capital Stock transactions: | |
Proceeds from Capital Stock sold | | | 61,491,321 | | | | 65,302,557 | | |
Proceeds from shares issued to shareholders upon
reinvestment of dividends and distributions | | | 37,996,105 | | | | 9,896,045 | | |
Cost of Capital Stock repurchased | | | (159,522,908 | )* | | | (262,574,374 | )* | |
Net decrease from Capital Stock transactions | | | (60,035,482 | ) | | | (187,375,772 | ) | |
Total change in net assets | | | 29,974,786 | | | | (317,010,200 | ) | |
NET ASSETS | |
Beginning of Year | | | 759,466,555 | | | | 1,076,476,755 | | |
End of Year | | $ | 789,441,341 | | | $ | 759,466,555 | | |
CHANGE IN CAPITAL STOCK OUTSTANDING | |
Shares of Capital Stock sold | | | 1,697,828 | | | | 1,929,687 | | |
Shares issued to shareholders upon reinvestment of dividends and
distributions | | | 1,041,182 | | | | 306,480 | | |
Shares of Capital Stock repurchased | | | (4,481,940 | ) | | | (7,383,150 | ) | |
Change in Capital Stock outstanding | | | (1,742,930 | ) | | | (5,146,983 | ) | |
* Net of redemption fees of $30,164 and $19,357 for the year ended March 31, 2017 and year ended March 31, 2016, respectively.
See notes to financial statements.
18
FPA CAPITAL FUND, INC.
FINANCIAL HIGHLIGHTS
Selected Data for Each Share of Capital Stock Outstanding Throughout Each Year
| | | Year Ended March 31, | |
| | | 2017 | | 2016 | | 2015 | | 2014 | | 2013 | |
Per share operating performance: | |
Net asset value at beginning of year | | $ | 32.41 | | | $ | 37.66 | | | $ | 47.46 | | | $ | 45.60 | | | $ | 45.11 | | |
Income from investment operations: | |
Net investment income (loss)* | | | 0.05 | | | | 0.12 | | | | 0.03 | | | | (0.03 | ) | | | 0.05 | | |
Net realized and unrealized gain (loss)
on investment securities | | | 5.80 | | | | (4.92 | ) | | | (5.02 | ) | | | 7.90 | | | | 4.37 | | |
| Total from investment operations | | | 5.85 | | | | (4.80 | ) | | | (4.99 | ) | | | 7.87 | | | | 4.42 | | |
Less distributions: | |
Dividends from net investment income | | | (0.10 | ) | | | (0.12 | ) | | | — | | | | — | | | | (0.07 | ) | |
Distributions from net realized
capital gains | | | (1.77 | ) | | | (0.33 | ) | | | (4.81 | ) | | | (6.01 | ) | | | (3.86 | ) | |
| Total distributions | | | (1.87 | ) | | | (0.45 | ) | | | (4.81 | ) | | | (6.01 | ) | | | (3.93 | ) | |
Redemption fees | | | — | ** | | | — | ** | | | — | ** | | | — | ** | | | — | ** | |
Net asset value at end of year | | $ | 36.39 | | | $ | 32.41 | | | $ | 37.66 | | | $ | 47.46 | | | $ | 45.60 | | |
Total investment return*** | | | 18.09 | % | | | (12.74 | )% | | | (11.49 | )% | | | 18.99 | % | | | 10.64 | % | |
Ratios/supplemental data: | |
Net assets, end of year (in $000's) | | $ | 789,441 | | | $ | 759,467 | | | $ | 1,076,477 | | | $ | 1,372,336 | | | $ | 1,273,822 | | |
Ratio of expenses to average net assets | | | 0.80 | % | | | 0.77 | % | | | 0.83 | % | | | 0.83 | % | | | 0.83 | % | |
Ratio of net investment income (loss) to
average net assets | | | 0.14 | % | | | 0.34 | % | | | 0.08 | % | | | (0.07 | )% | | | 0.12 | % | |
Portfolio turnover rate | | | 23 | % | | | 45 | % | | | 38 | % | | | 17 | % | | | 10 | % | |
* Per share amount is based on average shares outstanding.
** Rounds to less than $0.01 per share.
*** Return is based on net asset value per share, adjusted for reinvestment of distributions, and does not reflect deduction of the sales charge.
See notes to financial statements.
19
FPA CAPITAL FUND, INC.
NOTES TO FINANCIAL STATEMENTS
March 31, 2017
NOTE 1 — Significant Accounting Policies
FPA Capital Fund, Inc. (the "Fund") is registered under the Investment Company Act of 1940, as a diversified, open-end investment company. The Fund's primary investment objective is long-term capital growth. Current income is a factor, but a secondary consideration. The Fund qualifies as an investment company pursuant to Financial Accounting Standard Board (FASB) Accounting Standards Codification (ASC) No. 946, Financial Services — Investment Companies. The following is a summary of significant accounting policies consistently followed by the Fund in the preparation of its financial statements.
A. Security Valuation
The Fund's investments are reported at fair value as defined by accounting principles generally accepted in the United States of America, ("U.S. GAAP"). The Fund generally determines its net asset value as of approximately 4:00 p.m. New York time each day the New York Stock Exchange is open. Further discussion of valuation methods, inputs and classifications can be found under Disclosure of Fair Value Measurements.
B. Securities Transactions and Related Investment Income
Securities transactions are accounted for on the date the securities are purchased or sold. Dividend income and distributions to shareholders are recorded on the ex-dividend date. Interest income and expenses are recorded on an accrual basis.
C. Use of Estimates
The preparation of the financial statements in accordance with U.S. GAAP requires management to make estimates and assumptions that affect the amounts reported. Actual results could differ from those estimates.
D. Recent Accounting Pronouncements
In December 2016, the FASB released an accounting standard update ("ASU") 2016-19 that makes technical changes to various section of the ASC, including Topic 820, Fair Value Measurement. The changes to Topic 820 are intended to clarify the difference between a valuation approach and a valuation technique. The changes to ASC 820-10-50-2 require a reporting entity to disclose, for Level 2 and Level 3 fair value measurements, a change in either or both a valuation approach and a valuation technique and the reason(s) for the changes. The changes to Topic 820 are effective for fiscal years, and interim periods within those fiscal years, beginning after December 15, 2016. At this time, management is evaluating the implications of the ASU and has not yet determined its impact on the financial statements and disclosures.
E. New and Amended Financial Reporting Rules and Forms
On October 13, 2016, the U.S. Securities Exchange Commission ("SEC") adopted new rules and forms, and amended existing rules and forms. The new and amended rules and forms are intended to modernize the reporting of information provided by funds and to improve the quality and type of information that funds provide to the SEC and investors. The new and amended rules and forms will be effective for the Fund for reporting periods beginning on and after June 1, 2018. Management is evaluating the new and amended rules and forms to determine the impact to the Fund.
NOTE 2 — Risk Considerations
Investing in the Fund may involve certain risks including, but not limited to, those described below.
20
FPA CAPITAL FUND, INC.
NOTES TO FINANCIAL STATEMENTS
Continued
Market Risk: Because the values of the Fund's investments will fluctuate with market conditions, so will the value of your investment in the Fund. You could lose money on your investment in the Fund or the Fund could underperform other investments.
Common Stocks and Other Securities: The prices of common stocks and other securities held by the Fund may decline in response to certain events taking place around the world, including; those directly involving companies whose securities are owned by the Fund; conditions affecting the general economy; overall market changes; local, regional or global political, social or economic instability; and currency, interest rate and commodity price fluctuations. In addition, the Adviser's emphasis on a value-oriented investment approach generally results in the Fund's portfolio being invested primarily in medium or smaller sized companies. Smaller companies may be subject to a greater degree of change in earnings and business prospects than larger, more established companies, and smaller companies are often more reliant on key products or personnel than larger companies. Also, securities of smaller companies are traded in lower volumes than those issued by larger companies and may be more volatile than those of larger companies. In light of these characteristics of smaller companies and their securities, the Fund may be subjected to greater risk than that assumed when investing in the equity securities of larger companies.
Repurchase Agreements: Repurchase agreements permit the Fund to maintain liquidity and earn income over periods of time as short as overnight. Repurchase agreements held by the Fund are fully collateralized by U.S. Government securities, or securities issued by U.S. Government agencies, or securities that are within the three highest credit categories assigned by established rating agencies (Aaa, Aa, or A by Moody's or AAA, AA or A by Standard & Poor's) or, if not rated by Moody's or Standard & Poor's, are of equivalent investment quality as determined by the Adviser. Such collateral is in the possession of the Fund's custodian. The collateral is evaluated daily to ensure its market value equals or exceeds the current market value of the repurchase agreements including accrued interest. In the event of default on the obligation to repurchase, the Fund has the right to liquidate the collateral and apply the proceeds in satisfaction of the obligation.
The Fund may enter into repurchase agreements, under the terms of a Master Repurchase Agreement ("MRA"). The MRA permits the Fund, under certain circumstances including an event of default (such as bankruptcy or insolvency), to offset payables and/or receivables under the MRA with collateral held and/or posted to the counterparty and create one single net payment due to or from the Fund. However, bankruptcy or insolvency laws of a particular jurisdiction may impose restrictions on or prohibitions against such a right of offset in the event of a MRA counterparty's bankruptcy or insolvency. Pursuant to the terms of the MRA, the Fund receives securities as collateral with a market value in excess of the repurchase price to be received by the Fund upon the maturity of the repurchase transaction. Upon a bankruptcy or insolvency of the MRA counterparty, the Fund recognizes a liability with respect to such excess collateral to reflect the Fund's obligation under bankruptcy law to return the excess to the counterparty. Repurchase agreements outstanding at the end of the period are listed in the Fund's Portfolio of Investments.
NOTE 3 — Purchases and Sales of Investment Securities
Cost of purchases of investment securities (excluding short-term investments) aggregated $125,728,023 for the year ended March 31, 2017. The proceeds and cost of securities sold resulting in net realized gains of $56,505,483 aggregated $294,722,895 and $238,217,412, respectively, for the year ended March 31, 2017. Realized gains or losses are based on the specific identification method.
21
FPA CAPITAL FUND, INC.
NOTES TO FINANCIAL STATEMENTS
Continued
NOTE 4 — Federal Income Tax
No provision for federal income tax is required because the Fund has elected to be taxed as a "regulated investment company" under the Internal Revenue Code (the "Code") and intends to maintain this qualification and to distribute each year to its shareholders, in accordance with the minimum distribution requirements of the Code, its taxable net investment income and taxable net realized gains on investments.
Distributions paid to shareholders are based on net investment income and net realized gains determined on a tax reporting basis, which may differ from financial reporting. For federal income tax purposes, the Fund had the following components of distributable earnings at March 31, 2017:
Undistributed Ordinary Income | | $ | 768,392 | | |
Undistributed Net Realized Gains | | | 23,464,910 | | |
The tax status of distributions paid during the fiscal years ended March 31, 2017 and 2016 were as follows:
| | | 2017 | | 2016 | |
Dividends from ordinary income | | $ | 5,565,149 | | | $ | 2,971,492 | | |
Distributions from long-term capital gains | | $ | 36,145,693 | | | $ | 7,894,776 | | |
In addition, the Fund claimed a portion of the payment made to redeeming shareholders as a distribution for income tax purposes.
The cost of investment securities held at March 31, 2017, was $617,910,381 for federal income tax purposes. Gross unrealized appreciation and depreciation for all investments (excluding short-term investments) at March 31, 2017, for federal income tax purposes was $189,226,601 and $33,665,266, respectively resulting in net unrealized appreciation of $155,561,335. The Fund recognizes interest and penalties, if any, related to unrecognized tax benefits as income tax expense in the Statement of Operations. During the year, the Fund did not incur any interest or penalties. The Fund is not subject to examination by U.S. federal tax authorities for years ended on or before March 31, 2013 or by state tax authorities for years ended on or before March 31, 2012.
NOTE 5 — Advisory Fees and Other Affiliated Transactions
Pursuant to an Investment Advisory Agreement, advisory fees were paid by the Fund to First Pacific Advisors, LLC (the "Adviser"). Under the terms of this Agreement, the Fund pays the Adviser a monthly fee calculated at the annual rate of 0.75% of the first $50 million of the Fund's average daily net assets and 0.65% of the average daily net assets in excess of $50 million. The Agreement obligates the Adviser to reduce its fee to the extent necessary to reimburse the Fund for any annual expenses (exclusive of interest, taxes, the cost of any supplemental statistical and research information, and extraordinary expenses such as litigation) in excess of 11/2% of the first $30 million and 1% of the remaining average net assets of the Fund for the year.
For the year ended March 31, 2017, the Fund paid aggregate fees and expenses of $210,470 to all Directors who are not affiliated persons of the Adviser. Certain officers of the Fund are also officers of the Adviser.
During the year ended March 31, 2017, the Fund reclassified $172,543 from Net Investment Loss to Paid in Capital, and $3,522,540 from Accumulated Realized Gain to Paid in Capital, to align financial reporting with tax reporting. The permanent book/tax differences are primarily attributed to tax-Equalization and distribution re-designations. Net assets were not affected by these reclassifications.
22
FPA CAPITAL FUND, INC.
NOTES TO FINANCIAL STATEMENTS
Continued
NOTE 6 — Redemption Fees
A redemption fee of 2% applies to redemptions within 90 days of purchase. For the year ended March 31, 2017, the Fund collected $30,164 in redemption fees. The impact of these fees is less than $0.01 per share.
NOTE 7 — Disclosure of Fair Value Measurements
The Fund uses the following methods and inputs to establish the fair value of its assets and liabilities. Use of particular methods and inputs may vary over time based on availability and relevance as market and economic conditions evolve.
Equity securities are generally valued each day at the official closing price of, or the last reported sale price on, the exchange or market on which such securities principally are traded, as of the close of business on that day. If there have been no sales that day, equity securities are generally valued at the last available bid price. Securities that are unlisted and fixed-income and convertible securities listed on a national securities exchange for which the over-the-counter ("OTC") market more accurately reflects the securities' value in the judgment of the Fund's officers, are valued at the most recent bid price. Short-term corporate notes with maturities of 60 days or less at the time of purchase are valued at amortized cost.
Securities for which representative market quotations are not readily available or are considered unreliable by the Adviser are valued as determined in good faith under procedures adopted by the authority of the Fund's Board of Directors. Various inputs may be reviewed in order to make a good faith determination of a security's value. These inputs include, but are not limited to, the type and cost of the security; contractual or legal restrictions on resale of the security; relevant financial or business developments of the issuer; actively traded similar or related securities; conversion or exchange rights on the security; related corporate actions; significant events occurring after the close of trading in the security; and changes in overall market conditions. Fair valuations and valuations of investments that are not actively trading involve judgment and may differ materially from valuations of investments that would have been used had greater market activity occurred.
The Fund classifies its assets based on three valuation methodologies. Level 1 values are based on quoted market prices in active markets for identical assets. Level 2 values are based on significant observable market inputs, such as quoted prices for similar assets and quoted prices in inactive markets or other market observable inputs as noted above including spreads, cash flows, financial performance, prepayments, defaults, collateral, credit enhancements, and interest rate volatility. Level 3 values are based on significant unobservable inputs that reflect the Fund's determination of assumptions that market participants might reasonably use in valuing the assets. The valuation levels are not necessarily an indication of the risk associated with investing in those securities. The valuation levels are not necessarily an indication of the risk associated with investing in those securities. The following table presents the valuation levels of the Fund's investments as of March 31, 2017:
Investments | | Level 1 | | Level 2 | | Level 3 | | Total | |
Common Stocks | |
Exploration & Production | | $ | 63,649,947 | | | | — | | | | — | | | $ | 63,649,947 | | |
Communications Equipment | | | 61,122,125 | | | | — | | | | — | | | | 61,122,125 | | |
Technology Distributors | | | 60,185,198 | | | | — | | | | — | | | | 60,185,198 | | |
Computer Hardware & Storage | | | 59,731,913 | | | | — | | | | — | | | | 59,731,913 | | |
Oil & Gas Services & Equipment | | | 49,040,736 | | | | — | | | | — | | | | 49,040,736 | | |
23
FPA CAPITAL FUND, INC.
NOTES TO FINANCIAL STATEMENTS
Continued
Investments | | Level 1 | | Level 2 | | Level 3 | | Total | |
Consumer Goods — Rental | | $ | 33,820,893 | | | | — | | | | — | | | $ | 33,820,893 | | |
Semiconductor Manufacturing | | | 24,186,858 | | | | — | | | | — | | | | 24,186,858 | | |
Auto Parts | | | 22,038,001 | | | | — | | | | — | | | | 22,038,001 | | |
Publishing & Broadcasting | | | 21,994,817 | | | | — | | | | — | | | | 21,994,817 | | |
Electrical Power Equipment | | | 21,353,472 | | | | — | | | | — | | | | 21,353,472 | | |
Educational Services | | | 19,872,986 | | | | — | | | | — | | | | 19,872,986 | | |
Specialty Apparel Stores | | | 15,237,558 | | | | — | | | | — | | | | 15,237,558 | | |
Information Technology Services | | | 15,116,640 | | | | — | | | | — | | | | 15,116,640 | | |
Agricultural Machinery | | | 15,021,590 | | | | — | | | | — | | | | 15,021,590 | | |
Specialty Pharma | | | 9,153,290 | | | | — | | | | — | | | | 9,153,290 | | |
Construction & Mining Machinery | | | 8,710,930 | | | | — | | | | — | | | | 8,710,930 | | |
Other Common Stocks | | | 10,413,441 | | | | — | | | | — | | | | 10,413,441 | | |
U.S. Treasuries | | | — | | | $ | 262,821,321 | | | | — | | | | 262,821,321 | | |
Short-Term Investment | | | — | | | | 15,859,000 | | | | — | | | | 15,859,000 | | |
| | | $ | 510,650,395 | | | $ | 278,680,321 | | | | — | | | $ | 789,330,716 | | |
Transfers of investments between different levels of the fair value hierarchy are recorded at market value as of the end of the reporting period. There were no transfers between Levels 1, 2, or 3 during the year ended March 31, 2017.
NOTE 8 — Covered Call Options
In an effort to increase potential income, the Fund may write (i.e. sell) covered call options listed on a national securities exchange. When the Fund writes a listed call option, the purchaser has the right to buy a security from the Fund at a fixed exercise price any time before the option contract expires, regardless of changes in the market price of the underlying security. The Fund writes options only on securities it owns (covered options) and must retain ownership of the underlying security while the option is outstanding. Until the option expires, the Fund cannot profit from a rise in the market price of the underlying security over the exercise price, except insofar as the premium which the Fund receives, net of commissions, represents a profit. The premium paid to the Fund is the consideration for undertaking this obligation.
If a covered call option written by the Fund expires unexercised, the Fund realizes a capital gain on the expiration date equal to the premium received at the time the option was written. Prior to the earlier of exercise or expiration, an option may be closed out by an offsetting purchase of an option of the same series (type, underlying security, exercise price and expiration). There can be no assurance, however, that a closing purchase transaction can be effected when the Fund desires. The Fund will realize a capital gain from a closing purchase transaction if the cost of the closing option is less than the premium received from writing the option, or a capital loss if the cost of the closing option is more than the premium received from writing the option.
24
FPA CAPITAL FUND, INC.
NOTES TO FINANCIAL STATEMENTS
Continued
Transactions in covered call options for the year ended March 31, 2017 were as follows:
| | | Number of
Contracts | | Premium | |
Outstanding, March 31, 2016 | | | — | | | | — | | |
Covered Call Options Written | | | 2,750 | | | $ | 634,997 | | |
Covered Call Options Expired | | | (1,000 | ) | | | (198,914 | ) | |
Covered Call Options Closed | | | (1,750 | ) | | | (436,083 | ) | |
Outstanding, March 31, 2017 | | | — | | | | — | | |
NOTE 9 — Collateral Requirements
FASB Accounting Standards Update No. 2011-11, Disclosures about Offsetting Assets and Liabilities, requires disclosures to make financial statements that are prepared under U.S. GAAP more comparable to those prepared under International Financial Reporting Standards. Under this guidance the Fund discloses both gross and net information about instruments and transactions eligible for offset such as instruments and transactions subject to an agreement similar to a master netting arrangement. In addition, the Fund discloses collateral received and posted in connection with master netting agreements or similar arrangements.
The following table presents the Fund's repurchase agreements by counterparty net of amounts available for offset under an ISDA Master agreement or similar agreements and net of the related collateral received or pledged by the Fund as of March 31, 2017, are as follows:
Counterparty | | Gross Assets
in the Statement of
Assets and Liabilities | | Collateral
Received | | Assets (Liabilities)
Available for Offset | | Net Amount
of Assets* | |
State Street Bank
and Trust Company | | $ | 15,859,000 | | | $ | 15,859,000 | ** | | | — | | | | — | | |
* Represents the net amount receivable from the counterparty in the event of default.
** Collateral with a value of $16,177,870 has been received in connection with a master repurchase agreement. Excess of collateral received from the individual master repurchase agreement is not shown for financial reporting purposes.
25
FPA CAPITAL FUND, INC.
REPORT OF INDEPENDENT REGISTERED
PUBLIC ACCOUNTING FIRM
TO THE SHAREHOLDERS AND
BOARD OF DIRECTORS OF FPA CAPITAL FUND, INC.
We have audited the accompanying statement of assets and liabilities of FPA Capital Fund, Inc. (the "Fund"), including the portfolio of investments, as of March 31, 2017, and the related statement of operations for the year then ended, the statements of changes in net assets for each of the two years in the period then ended, and the financial highlights for each of the five years in the period then ended. These financial statements and financial highlights are the responsibility of the Fund's management. Our responsibility is to express an opinion on these financial statements and financial highlights based on our audits.
We conducted our audits in accordance with the standards of the Public Company Accounting Oversight Board (United States). Those standards require that we plan and perform the audit to obtain reasonable assurance about whether the financial statements and financial highlights are free of material misstatement. The Fund is not required to have, nor were we engaged to perform, an audit of its internal control over financial reporting. Our audits included consideration of internal control over financial reporting as a basis for designing audit procedures that are appropriate in the circumstances, but not for the purpose of expressing an opinion on the effectiveness of the Fund's internal control over financial reporting. Accordingly, we express no such opinion. An audit also includes examining, on a test basis, evidence supporting the amounts and disclosures in the financial statements, assessing the accounting principles used and significant estimates made by management, as well as evaluating the overall financial statement presentation. Our procedures included confirmation of securities owned as of March 31, 2017, by correspondence with the custodian and brokers; when replies were not received from brokers, we performed other auditing procedures. We believe that our audits provide a reasonable basis for our opinion.
In our opinion, such financial statements and financial highlights referred to above present fairly, in all material respects, the financial position of FPA Capital Fund, Inc. as of March 31, 2017, the results of its operations for the year then ended, the changes in its net assets for each of the two years in the period then ended, and the financial highlights for each of the five years in the period then ended, in conformity with accounting principles generally accepted in the United States of America.

Los Angeles, California
May 22, 2017
26
FPA CAPITAL FUND, INC.
SHAREHOLDER EXPENSE EXAMPLE
March 31, 2017 (Unaudited)
Fund Expenses
Mutual fund shareholders generally incur two types of costs: (1) transaction costs, and (2) ongoing costs, including advisory and administrative fees; shareholder service fees; and other Fund expenses. The Example is intended to help you understand your ongoing costs (in dollars) of investing in the Fund and to compare these costs with the ongoing costs of investing in other mutual funds. The Example is based on an investment of $1,000 invested at the beginning of the year and held for the entire year.
Actual Expenses
The information in the table under the heading "Actual Performance" provides information about actual account values and actual expenses. You may use the information in this column, together with the amount you invested, to estimate the expenses that you paid over the period. Simply divide your account value by $1,000 (for example, an $8,600 account value divided by $1,000= 8.6), then multiply the result by the number in the first column in the row entitled "Expenses Paid During Period" to estimate the expenses you paid on your account during this period.
Hypothetical Example for Comparison Purposes
The information in the table under the heading "Hypothetical Performance (5% return before expenses)" provides information about hypothetical account values and hypothetical expenses based on the Fund's actual expense ratio and an assumed rate of return of 5% per year before expenses, which is not the Fund's actual return. The hypothetical account values and expenses may not be used to estimate the actual ending account balance or expenses you paid for the period. You may use this information to compare the ongoing costs of investing in the Fund
and other funds. To do so, compare this 5% hypothetical example with the 5% hypothetical examples that appear in the shareholder reports of other funds.
Please note that the expenses shown in the table are meant to highlight your ongoing costs only and do not reflect any transactional costs. Therefore, the information under the heading "Hypothetical Performance (5% return before expenses)" is useful in comparing ongoing costs only, and will not help you determine the relative total costs of owning different funds. In addition, if these transactional costs were included, your costs would have been higher. Even though the Fund does not charge transaction fees, if you purchase shares through a broker, the broker may charge you a fee. You should evaluate other mutual funds' transaction fees and any applicable broker fees to assess the total cost of ownership for comparison purposes.
| | | Actual
Performance | | Hypothetical
Performance
(5% return
before
expenses) | |
Beginning Account Value
September 30, 2016 | | $ | 1,000.00 | | | $ | 1,000.00 | | |
Ending Account Value
March 31, 2017 | | $ | 1,053.40 | | | $ | 1,021.96 | | |
Expenses Paid During
Period* | | $ | 4.10 | | | $ | 4.04 | | |
* Expenses are equal to the Fund's annualized expense ratio of 0.80%, multiplied by the average account value over the period and prorated for the six-months ended March 31, 2017 (182/365 days).
27
FPA CAPITAL FUND, INC.
DIRECTOR AND OFFICER INFORMATION
(Unaudited)
| Name and Year of Birth | | Position(s)
With Fund
Years Served | | Principal Occupation(s)
During the Past 5 Years | | Portfolios in
Fund Complex
Overseen | | Other
Directorships | |
Allan M. Rudnick – 1940† | | Director and Chairman*
Years Served: 5 | | Private Investor. Formerly Co-Founder, Chief Executive Officer, Chairman and Chief Investment Officer of Kayne Anderson Rudnick Investment Management from 1989 to 2007. | | | 7 | | | | |
Sandra Brown – 1955† | | Director*
Years Served: 1 | | Consultant. Formerly CEO and President of Transamerica Financial Advisers, Inc., 1999 to 2009; President, Transamerica Securities Sales Corp. 1998 to 2009; VP, Bank of America Mutual Fund Administration 1990 to 1998. | | | 7 | | | | |
Mark L. Lipson – 1949† | | Director*
Years Served: 1 | | Consultant. ML2Advisors, LLC. Former member of the Management Committee and Western Region Head at Bessemer Trust Company from 2007 to 2014. | | | 7 | | | | |
Alfred E. Osborne, Jr. – 1944† | | Director*
Years Served: 16 | | Senior Associate Dean of the John E. Anderson School of Management at UCLA. | | | 7 | | | Wedbush, Inc., Nuverra Environmental Solutions, Inc., and Kaiser Aluminun, Inc. | |
A. Robert Pisano – 1943† | | Director*
Years Served: 3 | | Consultant. Formerly President and Chief Operating Officer of the Motion Picture Association of America, Inc. from 2005 to 2011 | | | 7 | | | Entertainment Partners, Resources Global Professionals | |
Patrick B. Purcell – 1943† | | Director*
Years Served: 10 | | Retired. Formerly Executive Vice President, Chief Financial and Administrative Officer of Paramount Pictures from 1983 to 1998. | | | 7 | | | | |
J. Richard Atwood – 1960 | | Director* and President
Years Served: 19 | | Managing Partner of the Adviser. | | | 7 | | | | |
Dennis M. Bryan – 1961 | | Portfolio Manager
Years Served: 20 | | Partner of the Adviser | | | | | |
Arik A. Ahitov – 1975 | | Portfolio Manager
Years Served: 3 | | Partner of the Adviser since 2015. Managing Director of the Adviser from 2013-2014 and Vice President of the Adviser from 2010 to 2013. | | | | | |
28
FPA CAPITAL FUND, INC.
DIRECTOR AND OFFICER INFORMATION
Continued (Unaudited)
| Name and Year of Birth | | Position(s)
With Fund
Years Served | | Principal Occupation(s)
During the Past 5 Years | | Portfolios in
Fund Complex
Overseen | | Other
Directorships | |
David C. Lebisky – 1972 | | Chief Compliance Officer
Years Served: <1 | | President of Lebisky Compliance Consulting LLC (since October 2015). Consultant, Duff & Phelps Compliance Consulting (since 2016). Senior Consultant, Freeh Group International Solutions, LLC (a global risk management firm) (since 2015). Formerly, Director of Regulatory Administration, Scotia Institutional Investments US, LP (2010 to 2014). | | | | | |
E. Lake Setzler – 1967 | | Treasurer
Years Served: 10 | | Senior Vice President and Controller of the Adviser. | | | | | |
Francine S. Hayes – 1967 | | Secretary
Years Served: 1 | | Vice President and Senior Counsel of State Street Bank and Trust Company | | | | | |
* Directors serve until their resignation, removal or retirement.
† Audit Committee member
The Statement of Additional Information includes additional information about the Directors and is available, without charge, upon request by calling (800) 982-4372.
29
FPA CAPITAL FUND, INC.
(Unaudited)
INVESTMENT ADVISER
First Pacific Advisors, LLC
11601 Wilshire Boulevard, Suite 1200
Los Angeles, CA 90025
TRANSFER & SHAREHOLDER
SERVICE AGENT
UMB Fund Services, Inc.
P.O. Box 2175
Milwaukee, WI 53201-2175
or
235 Galena Street
Milwaukee, WI 53212
(800) 638-3060
CUSTODIAN AND ADMINISTRATOR
State Street Bank and Trust Company
Boston, Massachusetts
TICKER: FPPTX
CUSIP: 302539101
DISTRIBUTOR
UMB Distribution Services, LLC
235 Galena Street
Milwaukee, Wisconsin 53212
COUNSEL
Dechert LLP
San Francisco, California
INDEPENDENT REGISTERED PUBLIC ACCOUNTING FIRM
Deloitte & Touche LLP
Los Angeles, California
This report has been prepared for the information of shareholders of FPA Capital Fund, Inc., and is not authorized for distribution to prospective investors unless preceded or accompanied by an effective prospectus. The financial information included in this report has been taken from the records of the Fund without examination by independent auditors.
The Fund's complete proxy voting record for the 12 months ended June 30, 2016 is available without charge, upon request, by calling (800) 982-4372 and on the SEC's web site at www.sec.gov.
The Fund's schedule of portfolio holdings, filed the first and third quarter of the Fund's fiscal year on Form N-Q with the SEC, is available on the SEC's website at www.sec.gov. Form N-Q is available at the SEC's Public Reference Room in Washington, D.C., and information on the operations of the Public Reference Room may be obtained by calling (202) 551-8090. To obtain Form N-Q from the Fund, shareholders can call (800) 982-4372.
Additional information about the Fund is available online at www.fpafunds.com. This information includes, among other things, holdings, top sectors and performance, and is updated on or about the 15th business day after the end of the quarter.
Item 2. Code of Ethics.
(a) The registrant has adopted a code of ethics that applies to the registrant’s principal executive and financial officers.
(b) Not applicable.
(c) During the period covered by this report, there were no amendments to the provisions of the code of ethics adopted in 2(a) above.
(d) During the period covered by this report, there were not any implicit or explicit waivers to the provisions of the code of ethics adopted in 2(a).
(e) Not applicable.
(f) A copy of the registrant’s code of ethics is filed as an exhibit to this Form N-CSR.
Item 3. Audit Committee Financial Expert.
The registrant’s board of directors has determined that Patrick B. Purcell, who is a member of the registrant’s audit committee and board of directors, is an “audit committee financial expert” and is “independent,” as those terms are defined in this Item. This designation will not increase the designee’s duties, obligations or liability as compared to his duties, obligations or liability as a member of the audit committee and of the board of directors. This designation does not affect the duties, obligations or liability of any other member of the audit committee or the board of directors.
Item 4. Principal Accountant Fees and Services.
| | 2016 | | 2017 | |
(a) Audit Fees | | $ | 42,500 | | $ | 43,988 | |
(b) Audit Related Fees | | $ | -0- | | $ | -0- | |
(c) Tax Fees(1) | | $ | 8,600 | | $ | 8,900 | |
(d) All Other Fees | | $ | -0- | | $ | -0- | |
(1) Tax Fees are for preparation of the Fund’s tax return(s).
(e)(1) The audit committee shall pre-approve all audit and permissible non-audit services that the committee considers compatible with maintaining the independent auditors’ independence. The pre-approval requirement will extend to all non-audit services provided to the registrant, the adviser, and any entity controlling, controlled by, or under common control with the adviser that provides ongoing services to the registrant, if the engagement relates directly to the operations and financial reporting of the registrant; provided, however, that an engagement of the registrant’s independent auditors to perform attest services for the registrant, the adviser or its affiliates required by generally accepted auditing standards to complete the examination of the registrant’s financial statements (such as an examination conducted in accordance with Statement on Standards for Attestation Engagements Number 16, or a Successor Statement, issued by the American Institute of Certified Public Accountants), will be deem pre-approved if:
(i) the registrant’s independent auditors inform the audit committee of the engagement,
(ii) the registrant’s independent auditors advise the audit committee at least annually that the performance of this engagement will not impair the independent auditor’s independence with respect to the registrant, and
(iii) the audit committee receives a copy of the independent auditor’s report prepared in connection with such services. The committee may delegate to one or more committee members the authority to review and pre-approve audit and permissible non-audit services. Actions taken under any such delegation will be reported to the full committee at its next meeting.
(e)(2) 0% of the services provided to the registrant described in paragraphs b—d of this Item were approved by the Audit Committee pursuant to paragraph (c)(7)(i)(C) of Rule 2-01 of Regulation S-X. There were no services provided to the investment adviser or any entity controlling, controlled by or under common control with the adviser described in paragraphs (b) — (d) of this Item that were required to be pre-approved by the audit committee.
(f) All services performed on the engagement to audit the registrant’s financial statements for the most recent fiscal year end were performed by the principal accountant’s full-time, permanent employees.
(g) None.
(h) Not applicable.
Item 5. Audit Committee of Listed Registrants.
Not applicable.
Item 6. Investments.
(a) Schedule of Investments is included as a part of the report to shareholders filed under Item 1 of this Form N-CSR.
(b) Not applicable.
Item 7. Disclosure of Proxy Voting Policies and Procedures for Closed-End Management Investment Companies.
Not applicable.
Item 8. Portfolio Managers of Closed-End Management Investment Companies.
Not applicable.
Item 9. Purchases of Equity Securities by Closed-End Management Investment Company and Affiliated Purchasers.
Not applicable.
Item 10. Submission of Matters to a Vote of Security Holders.
There have been no material changes to the procedures by which the shareholders may recommend nominees to the registrant’s board of directors.
Item 11. Controls and Procedures.
(a) The principal executive officer and principal financial officer of the registrant have concluded that the registrant’s disclosure controls and procedures (as defined in Rule 30a-3(c) under the Investment Company Act of 1940) are effective based on their evaluation of the disclosure controls and procedures as of a date within 90 days of the filing date of this report.
(b) There have been no significant changes in the registrant’s internal controls over financial reporting (as defined in Rule 30a-3(d) under the Investment Company Act of 1940) that occurred during the registrant’s second fiscal quarter of the period covered by this report that have materially affected, or is reasonably likely to materially affect, the registrant’s internal controls over financial reporting.
Item 12. Exhibits.
(a)(1) Code of ethics as applies to the registrant’s principal executive and financial officers is attached hereto.
(a)(2) The certifications required by Rule 30a-2(a) under the Investment Company Act of 1940 are attached hereto.
(a)(3) Not applicable.
(b) The certifications required by Rule 30a-2(b) under the Investment Company Act of 1940 and Section 906 of the Sarbanes-Oxley Act of 2002 are attached hereto.
SIGNATURES
Pursuant to the requirements of the Securities Exchange Act of 1934 and the Investment Company Act of 1940, the registrant has duly caused this report to be signed on its behalf by the undersigned, thereunto duly authorized.
FPA CAPITAL FUND, INC. | |
| |
| |
By: | /s/ J. Richard Atwood | |
| J. Richard Atwood | |
| President (principal executive officer) | |
| | |
Date: | May 31, 2017 | |
Pursuant to the requirements of the Securities Exchange Act of 1934 and the Investment Company Act of 1940, this report has been signed below by the following persons on behalf of the registrant and in the capacities and on the dates indicated.
By: | /s/ J. Richard Atwood | |
| J. Richard Atwood | |
| President (principal executive officer) | |
| | |
Date: | May 31, 2017 | |
| | |
| | |
By: | /s/ E. Lake Setzler III | |
| E. Lake Setzler III | |
| Treasurer (principal financial officer) | |
| | |
Date: | May 31, 2017 | |