UNITED STATES
SECURITIES AND EXCHANGE COMMISSION
Washington, D.C. 20549
FORM N-CSR
CERTIFIED SHAREHOLDER REPORT OF REGISTERED
MANAGEMENT INVESTMENT COMPANIES
Investment Company Act file number | 811-01596 |
|
FPA CAPITAL FUND, INC. |
(Exact name of registrant as specified in charter) |
|
11601 WILSHIRE BLVD., STE. 1200 LOS ANGELES, CALIFORNIA | | 90025 |
(Address of principal executive offices) | | (Zip code) |
|
| Copy to: |
| |
J. RICHARD ATWOOD, PRESIDENT FPA CAPITAL FUND, INC. 11601 WILSHIRE BLVD., STE. 1200 LOS ANGELES, CALIFORNIA 90025 | MARK D. PERLOW, ESQ. DECHERT LLP ONE BUSH STREET, STE. 1600 SAN FRANCISCO, CA 94104 |
(Name and address of agent for service) |
|
Registrant’s telephone number, including area code: | (310) 473-0225 | |
|
Date of fiscal year end: | March 31 | |
|
Date of reporting period: | March 31, 2018 | |
| | | | | | | | | |
Item 1: Report to Shareholders.

Distributor:
UMB DISTRIBUTION SERVICES, LLC
235 West Galena Street
Milwaukee, Wisconsin 53212
FPA CAPITAL FUND, INC.
LETTER TO SHAREHOLDERS
For the fiscal year ending and quarter ending on March 31, 2018, the Fund was down by -4.05% and -2.65%, respectively. In many cases, our companies' earnings have grown, but because their share prices have not kept up with earnings, their multiples have compressed.
Our largest detractor for the last fiscal year 2017 was Babcock & Wilcox (BW). We have discussed our investment in BW in detail in our first quarter and third quarter 2017 letters.1 BW, after a successful 100-year run with few missteps, managed to incur significant charges from half a dozen projects in a short period. We exited the position in August 2017 because it no longer fit our investment criteria. Another area that detracted from our performance was energy. We believe we are in the early stages of another historic multi-year oil bull market and explained our rationale in detail in our fourth quarter 2017 letter.2 In summary, our energy investment is not just tied to our belief that oil prices will go higher. We also see that extreme investor bearishness has caused oil-related equity performance to disconnect from crude oil commodity performance. As we said in our previous investor letter, we expect our energy shares to benefit from both continued earnings acceleration and a likely multiple re-rating as the performance gap between crude oil and crude oil equities closes over time.
On the positive side, in fiscal year 2017 Aaron's Inc. (AAN) was our largest contributor to performance followed by Allegiant Travel Company (ALGT). AAN is an RTO (rent-to-own) operator. It serves the part of the population that does not have immediate access to credit via its company-owned, franchised locations, and its Progressive brand (virtual). The Company had strong results in 2017, where it beat its revenue and earnings per share (all record results) guidance and raised 2018 guidance across the board. ALGT is an ultra-low cost domestic airline focused on underserved routes. Their results were robust with revenues at the high end of the recently revised (upward) range, better than expected fixed fee and other revenue, and lower than expected unit operating cost on lower maintenance & repair expenses.
As we finish another fiscal year, our 35th, we would like to report our progress on the three portfolio management initiatives we committed to since FPA announced that I would become the sole Portfolio Manager of the FPA Capital Fund (the "Fund") at the beginning of the fourth quarter of 2017.
1. Avoid position inertia
2. Be more nimble
3. Differentiate between long-term and opportunistic investments
Avoid position inertia:
Our team has been busy transitioning the portfolio. Since the announcement, we have initiated eight new positions and eliminated seven holdings. To put this level of activity into perspective, over the preceding seven years, we invested in an average of four new names per year. It is important to note that our in-depth research process remains intact. We believe we are doing a better job in cutting our work short when the opportunity is not there, which allows us to look at more companies. Also, having just one portfolio manager has streamlined our decision-making process. Because our purchases more than offset our sales, the portfolio's cash level decreased from 32.0% when I took over on Oct. 1, to 26% at the end of first quarter 2018.
1 http://fpafunds.com/quarterlyinfo_capital
2 http://fpafunds.com/docs/hc_capital/fpa-capital-fund-commentary-2017-q4.pdf?sfvrsn=2
1
FPA CAPITAL FUND, INC.
LETTER TO SHAREHOLDERS
(Continued)
Be more nimble:
We have focused on adjusting position sizing when there are changes in our analysis and the risk/reward profile. Here are a few examples of what we have done since the portfolio management change announcement:

3
As shown above, we cut our position in Cubic (CUB) by more than 80% as our thesis played out and the stock price approached our target price. We also added opportunistically to one of our newer positions, Capital Federal Financial (CFFN), as the risk/reward ratio got more attractive, allowing us to lower our average cost basis while collecting a very attractive dividend yield. Finally, as you can see on the right side of the above chart, we have been taking advantage of the volatility inherent in our energy positions, and we will look to opportunistically adjust our position sizing to take advantage of these swings. Of course, there can be no guarantee that such strategies will be successful in the future, and past performance does not guarantee future results.
3 Px is an abbreviation for the price of the position
2
FPA CAPITAL FUND, INC.
LETTER TO SHAREHOLDERS
(Continued)
Differentiate between long-term and opportunistic investments:
Going forward, you should expect your invested capital to reflect a higher allocation to long-term core holdings in businesses that we view as having strong competitive positions in stable or growing industries at attractive valuations. We believe increasing the Fund's weighting to these businesses is especially important during the later stages of the economic cycle, since the larger allocation seeks to mitigate downside risk and in our view increases the likelihood of generating long-term market outperformance.
At the same time, we intend to reserve some room for opportunistic investments in lower-quality businesses, particularly when valuations are at extreme levels. We believe flexing this higher-beta segment of the portfolio during times of market distress also enhances full-cycle returns. In keeping with our philosophy of seeking to minimize downside risk, we will always seek to ensure such investments have ample balance sheet strength to minimize thesis duration risk. Right now, our offshore energy investments are a perfect example of this.
Additionally, we have tightened our process to avoid a permanent loss of your capital by generally sidestepping opportunities that require a correct call on industry cycle timing and identifying where consensus is categorically incorrect about a secular decline theme. The margin for error on such a thesis is very small, while the consequences of getting things wrong can be devastating.
Finally, we would like to point out that we have enacted a process to score our portfolio and pipeline companies on a quality ranking ("1" being highest, and "3" being the lowest) and we are able to track these metrics in the aggregate. A company's quality score reflects our historic framework (market leadership, history of profitability, solid balance sheets, and high-quality management teams) as well as aspects like industry quality assessed via Porter's Five Forces.4 Importantly, the entire FPA Capital team reviews and debates each company's score. Since I became the sole portfolio manager of the Fund, the positions we have sold had an average score of 2.5, while the positions we have initiated have an average score of 1.9. We will continue to update you on this facet of the ongoing portfolio transformation.
4 Porter's Five Forces analysis seeks to assess the competitive strengths and weaknesses of industries and companies by looking at competitive rivalry, supplier power, buyer power, threat of substitution, and threat of new entry.
3
FPA CAPITAL FUND, INC.
LETTER TO SHAREHOLDERS
(Continued)
Our portfolio has gotten cheaper:
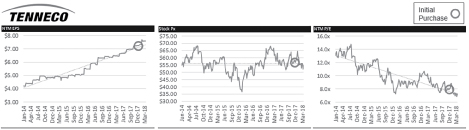
In many cases, our companies' earnings have grown, but because their share prices have not kept up with earnings, their multiples have compressed. That phenomenon can be seen in the charts below for Western Digital (WDC) and Arris International (ARRS) and is especially prominent in the chart for Tenneco (TEN), one of our latest investments. The charts below show each issuer's earnings per share (a measure of profitability), price to earnings ratio (a measure of valuation that compares profitability to the stock price), and stock price.

4
FPA CAPITAL FUND, INC.
LETTER TO SHAREHOLDERS
(Continued)
As shown above, Tenneco has done an exceptional job delivering earnings growth, yet the stock has been flattish, producing multiple compression. The bear thesis equates adoptions of electric vehicles with the demise of Tenneco's Clean Air division. We think this view is an oversimplification and underestimates the growth in clean air content per vehicle as environmental regulations continue to tighten. Furthermore, we believe battery-only vehicles will represent only a tiny fraction of vehicles sold, and that the shift to electrification will start with hybrids — and those still require a substantial amount of clean-air technology. We believe Tenneco will continue delivering organic top-line growth, even stronger bottom-line growth, and ultimately, we think the market will decide that an 8x P/E multiple is insufficient given these metrics.
We believe that our largest positions have significant upside potential. Below you can see a quick summary of our thesis for our largest six positions:
 n Unique business model allows ALGT to sustain a monopoly on over 80% of its routes n Unique business model allows ALGT to sustain a monopoly on over 80% of its routes
n Top tier operating cost structure that is improving as they complete transition to an all-A320 fleet
n Large growth opportunity that's supported by a solid balance sheet
n Proven Chairman/CEO/founder that is also the largest shareholder | |
 n Market leader w/ a diversified customer base, supplier base, & geographic revenue mix n Market leader w/ a diversified customer base, supplier base, & geographic revenue mix
n Difficult business to disrupt as they are not wed to a particular technology & benefit from scale
n Generates countercyclical cash flows and has delivered reasonable returns on capital
n ERP (Enterprise Resource Planning) system missteps presented a compelling opportunity to increase our position size particularly as a clear self-improvement story was taking root | |
 n Consistent cash flow generation: n Consistent cash flow generation:
– $200mm per year average in the past 10 years / $250mm per year in the past 5
– 30%+ of market cap in cash
n Recurring revenues with high operating leverage
n Strong CEO, who has steered the company well operationally and allocated capital successfully | |
 n The market is still not providing full credit for: n The market is still not providing full credit for:
– A portfolio that has transitioned to Tier-1 U.S. shale assets with incremental growth coming from high margin wells in the DJ Basin (Colorado) and Delaware Basin (Permian Basin in TX)
– Two world-class gas developments that provide excellent cash flow visibility over the next 10+ years
– A credible path to higher ROICs, FCF generation, and low risk investment opportunities (including returning cash to shareholders) at $50/barrel WTI | |
5
FPA CAPITAL FUND, INC.
LETTER TO SHAREHOLDERS
(Continued)
 n E&P with operations primarily in the Eagle Ford (57% of production) and Permian (35%) n E&P with operations primarily in the Eagle Ford (57% of production) and Permian (35%)
n Management team has historically generated impressive organic proved-reserves growth and above average returns on capital
n Undergoing a major transition to become a core Permian Basin operator
n Acreage delineation, balance sheet improvement, and margin expansion via oilier wells remains in line or above pre-investment assumptions | |
 n Market leader in both the high consolidated HDD & SSD market n Market leader in both the high consolidated HDD & SSD market
n Mgmt has a superb track record of consolidating acquisitions and returning the firm's strong & consistent FCF to shareholders via both buybacks & dividends
n Fears of a NAND cycle top, have provided an attractive opportunity to increase our position as we believe the street undervalues shifting industry dynamics that have improved the fundamental economics of this business | |
We are excited about the current state of our portfolio. Despite near-peak valuation levels in the market, in our view, we have been able to construct a portfolio that is defensively positioned. Our portfolio is trading at earnings multiples that are substantially lower than those of the Russell 2500 Index. We believe that our largest positions, as described above, have substantial upside potential. Moreover, our 26% cash position provides us with great optionality to take advantage of volatility.
In conclusion:
We have been diligently carrying out our commitment to our shareholders. Our goal is threefold: First, we want to avoid position inertia and not hold portfolio holdings past their prime. Second, we will seek to be more nimble. We took steps to accelerate both idea-generation and portfolio execution. And finally, we will seek to do a better job in differentiating between long-term and opportunistic investments. We have made significant changes to the portfolio over the past seven months. Our investments include many strong-but-cheap names. I have increased my ownership in the Fund and expect to continue to add to it.
We appreciate your continued trust in our team and our process.
Respectfully submitted,

Arik Ahitov — on behalf of the FPA Capital Fund Team
Portfolio Manager
March 31, 2018
6
FPA CAPITAL FUND, INC.
LETTER TO SHAREHOLDERS
(Continued)
Fund shares are presently offered for sale only to existing shareholders and to directors, officers and employees of the Fund, the Adviser, and affiliated companies, and their immediate relatives.
Performance data quoted in this letter represents past performance and neither indicates nor guarantees future performance. The discussions of Fund investments represent the views of the Fund's managers at the time of this report and are subject to change without notice. References to individual securities are for informational purposes only and should not be construed as recommendations to purchase or sell individual securities. While the Fund's managers believe that the Fund's holdings are value stocks, there can be no assurance that others will consider them as such. Further, investing in value stocks presents the risk that value stocks may fall out of favor with investors and underperform growth stocks during given periods.
Portfolio composition will change due to ongoing management of the Fund.
The Russell 2500 Index is an unmanaged index comprised of the 2,500 smallest companies in the Russell 3000 Index.
FUND RISKS
Investments in mutual funds carry risks and investors may lose principal value. Stock markets are volatile and can decline significantly in response to adverse issuer, political, regulatory, market, or economic developments. The funds may purchase foreign securities which are subject to interest rate, currency exchange rate, economic and political risks: this may be enhanced when investing in emerging markets. Small and mid-cap stocks involve greater risks and they can fluctuate in price more than larger company stocks. Groups of stocks, such as value and growth, go in and out of favor which may cause certain funds to underperform other equity funds.
FORWARD LOOKING STATEMENT DISCLOSURE
As mutual fund managers, one of our responsibilities is to communicate with shareholders in an open and direct manner. Insofar as some of our opinions and comments in our letters to shareholders are based on our current expectations, they are considered "forward-looking statements" which may or may not prove to be accurate over the long term. While we believe we have a reasonable basis for our comments and we have confidence in our opinions, actual results may differ materially from those we anticipate. You can identify forward-looking statements by words such as "believe," "expect," "may," "anticipate," and other similar expressions when discussing prospects for particular portfolio holdings and/or the markets, generally. We cannot, however, assure future results and disclaim any obligation to update or alter any forward-looking statements, whether as a result of new information, future events, or otherwise. Further, information provided in this report should not be construed as a recommendation to purchase or sell any particular security.
7
FPA CAPITAL FUND, INC.
HISTORICAL PERFORMANCE
(Unaudited)
Change in Value of a $10,000 Investment in FPA Capital Fund, Inc. vs. Russell 2500 from April 1, 2008 to March 31, 2018

Past performance is not indicative of future performance. Current performance may be higher or lower than the performance data shown above. The Fund's most recent month-end performance can be obtained online at www.fpafunds.com. The Index does not reflect any commissions or fees which would be incurred by an investor purchasing the stocks they represent. Past performance is no guarantee of future results and current performance may be higher or lower than the performance shown. This data represents past performance and investors should understand that investment returns and principal values fluctuate, so that when you redeem, your investment may be worth more or less than its original cost. Current month-end performance data can be obtained by visiting the website at www.fpafunds.com or by calling toll-free, 1-800-982-4372. Information regarding the Fund's expense ratio and redemption fees can be found on pages 16 and 20. The Prospectus details the Fund's objective and policies, fees, and other matters of interest to prospective investors. Please read the prospectus carefully before investing. The Prospectus may be obtained by visiting the website at www.fpafunds.com, by email at crm@fpafunds.com, toll-free by calling 1-800-982-4372 or by contacting the Fund in writing.
8
FPA CAPITAL FUND, INC.
PORTFOLIO SUMMARY
March 31, 2018
Common Stocks | | | | | | | 75.3 | % | |
Exploration & Production | | | 15.6 | % | | | | | |
Communications Equipment | | | 10.5 | % | | | | | |
Oil & Gas Services & Equipment | | | 8.6 | % | | | | | |
Airlines | | | 7.2 | % | | | | | |
Technology Distributors | | | 6.9 | % | | | | | |
Computer Hardware & Storage | | | 6.1 | % | | | | | |
Consumer Goods — Rental | | | 3.9 | % | | | | | |
Auto Parts | | | 3.5 | % | | | | | |
Semiconductor Manufacturing | | | 2.3 | % | | | | | |
Banks | | | 2.2 | % | | | | | |
Publishing & Broadcasting | | | 1.8 | % | | | | | |
Other Common Stocks | | | 1.5 | % | | | | | |
Agricultural Machinery | | | 1.4 | % | | | | | |
Containers & Packaging | | | 1.4 | % | | | | | |
Marine Shipping | | | 0.8 | % | | | | | |
Infrastructure Software | | | 0.8 | % | | | | | |
Information Technology Services | | | 0.8 | % | | | | | |
Bonds & Debentures | | | | | | | 22.6 | % | |
Short-term Investments | | | | | | | 2.5 | % | |
Other Assets And Liabilities, Net | | | | | | | (0.4 | )% | |
Net Assets | | | | | 100.0 | % | |
9
FPA CAPITAL FUND, INC.
PORTFOLIO OF INVESTMENTS
March 31, 2018
COMMON STOCKS | | Shares | | Fair Value | |
EXPLORATION & PRODUCTION — 15.6% | |
Cimarex Energy Co. | | | 200,617 | | | $ | 18,757,690 | | |
Noble Energy, Inc. | | | 609,420 | | | | 18,465,426 | | |
SM Energy Co. | | | 992,415 | | | | 17,893,242 | | |
| | | $ | 55,116,358 | | |
COMMUNICATIONS EQUIPMENT — 10.5% | |
ARRIS International plc(a) | | | 698,470 | | | $ | 18,558,348 | | |
InterDigital, Inc. | | | 251,320 | | | | 18,497,152 | | |
| | | $ | 37,055,500 | | |
OIL & GAS SERVICES & EQUIPMENT — 8.6% | |
Helmerich & Payne, Inc. | | | 111,420 | | | $ | 7,416,115 | | |
Patterson-UTI Energy, Inc. | | | 577,157 | | | | 10,106,019 | | |
Rowan Cos. plc (Class A)(a) | | | 1,126,792 | | | | 13,003,180 | | |
| | | $ | 30,525,314 | | |
AIRLINES — 7.2% | |
Allegiant Travel Co. | | | 104,491 | | | $ | 18,029,922 | | |
Spirit Airlines, Inc.(a) | | | 197,293 | | | | 7,453,730 | | |
| | | $ | 25,483,652 | | |
TECHNOLOGY DISTRIBUTORS — 6.9% | |
Arrow Electronics, Inc.(a) | | | 86,059 | | | $ | 6,628,264 | | |
Avnet, Inc. | | | 429,720 | | | | 17,945,107 | | |
| | | $ | 24,573,371 | | |
COMPUTER HARDWARE & STORAGE — 6.1% | |
Western Digital Corporation | | | 232,354 | | | $ | 21,439,303 | | |
CONSUMER GOODS — RENTAL — 3.9% | |
Aaron's, Inc. | | | 295,050 | | | $ | 13,749,330 | | |
AUTO PARTS — 3.5% | |
Gentex Corp. | | | 191,064 | | | $ | 4,398,293 | | |
Tenneco, Inc. | | | 147,270 | | | | 8,080,705 | | |
| | | $ | 12,478,998 | | |
SEMICONDUCTOR MANUFACTURING — 2.3% | |
Veeco Instruments, Inc.(a) | | | 477,084 | | | $ | 8,110,428 | | |
BANKS — 2.2% | |
Capitol Federal Financial, Inc. | | | 623,849 | | | $ | 7,704,535 | | |
10
FPA CAPITAL FUND, INC.
PORTFOLIO OF INVESTMENTS (Continued)
March 31, 2018
COMMON STOCKS — Continued | | Shares or
Principal
Amount | | Fair Value | |
PUBLISHING & BROADCASTING — 1.8% | |
Houghton Mifflin Harcourt Co.(a) | | | 921,480 | | | $ | 6,404,286 | | |
AGRICULTURAL MACHINERY — 1.4% | |
AGCO Corporation | | | 77,408 | | | $ | 5,019,909 | | |
CONTAINERS & PACKAGING — 1.4% | |
Graphic Packaging Holding Co. | | | 321,042 | | | $ | 4,927,995 | | |
MARINE SHIPPING — 0.8% | |
Matson, Inc. | | | 96,140 | | | $ | 2,753,450 | | |
INFRASTRUCTURE SOFTWARE — 0.8% | |
Cision Ltd.(a) | | | 233,712 | | | $ | 2,704,048 | | |
INFORMATION TECHNOLOGY SERVICES — 0.8% | |
Cubic Corporation | | | 42,490 | | | $ | 2,702,364 | | |
OTHER COMMON STOCKS — 1.5%(b) | | $ | 5,288,277 | | |
| TOTAL COMMON STOCKS — 75.3% (Cost $224,723,169) | | $ | 266,037,118 | | |
BONDS & DEBENTURES | |
U.S. TREASURIES — 22.6% | |
U.S. Treasury Notes — 0.75% 4/30/2018 | | $ | 20,000,000 | | | $ | 19,984,180 | | |
U.S. Treasury Notes — 0.75% 7/31/2018 | | | 7,500,000 | | | | 7,472,950 | | |
U.S. Treasury Notes — 0.75% 8/31/2018 | | | 7,500,000 | | | | 7,464,604 | | |
U.S. Treasury Notes — 0.875% 5/31/2018 | | | 25,000,000 | | | | 24,963,340 | | |
U.S. Treasury Notes — 1.375% 6/30/2018 | | | 20,000,000 | | | | 19,978,808 | | |
| TOTAL U.S. TREASURIES (Cost $79,914,678) | | $ | 79,863,882 | | |
| TOTAL BONDS & DEBENTURES — 22.6% (Cost $79,914,678) | | $ | 79,863,882 | | |
| TOTAL INVESTMENT SECURITIES — 97.9% (Cost $304,637,847) | | $ | 345,901,000 | | |
11
FPA CAPITAL FUND, INC.
PORTFOLIO OF INVESTMENTS (Continued)
March 31, 2018
| | | Principal
Amount | | Fair Value | |
SHORT-TERM INVESTMENTS — 2.5% | |
State Street Bank Repurchase Agreement — 0.28% 4/2/2018
(Dated 03/29/2018, repurchase price of $8,858,276, collateralized by
$9,205,000 principal amount U.S. Treasury Notes —
2.25% 2024, fair value $9,038,546) | | $ | 8,858,000 | | | $ | 8,858,000 | | |
| TOTAL SHORT-TERM INVESTMENTS (Cost $8,858,000) | | $ | 8,858,000 | | |
| TOTAL INVESTMENTS — 100.4% (Cost $313,495,847) | | $ | 354,759,000 | | |
Other Assets and Liabilities, net — (0.4)% | | | | | (1,492,771 | ) | |
NET ASSETS — 100.0% | | $ | 353,266,229 | | |
(a) Non-income producing security.
(b) As permitted by U.S. Securities and Exchange Commission regulations, "Other" Common Stocks include holdings in their first year of acquisition that have not previously been publicly disclosed.
See notes to financial statements.
12
FPA CAPITAL FUND, INC.
STATEMENT OF ASSETS AND LIABILITIES
March 31, 2018
ASSETS | |
Investment securities — at fair value (identified cost $304,637,847) | | $ | 345,901,000 | | |
Short-term investments — at amortized cost (maturities 60 days or less) | | | 8,858,000 | | |
Cash | | | 693 | | |
Due from broker — OTC derivatives collateral | | | 251,404 | | |
Receivable for: | |
Dividends and interest | | | 362,990 | | |
Capital Stock sold | | | 52,716 | | |
Prepaid expenses and other assets | | | 2,836 | | |
Total assets | | | 355,429,639 | | |
LIABILITIES | |
Payable for: | |
Investment securities purchased | | | 1,183,049 | | |
Capital Stock repurchased | | | 601,912 | | |
Advisory fees | | | 208,238 | | |
Accrued expenses and other liabilities | | | 170,211 | | |
Total liabilities | | | 2,163,410 | | |
NET ASSETS | | $ | 353,266,229 | | |
SUMMARY OF SHAREHOLDERS' EQUITY | |
Capital Stock — par value $0.01 per share; authorized
100,000,000 shares; outstanding 10,572,049 shares | | $ | 105,720 | | |
| Additional Paid-in Capital | | | 320,253,082 | | |
| Undistributed net realized loss | | | (9,012,393 | ) | |
| Undistributed net investment income | | | 656,667 | | |
Unrealized appreciation of investments | | | 41,263,153 | | |
NET ASSETS | | $ | 353,266,229 | | |
NET ASSET VALUE | |
Offering and redemption price per share | | $ | 33.42 | | |
See notes to financial statements.
13
FPA CAPITAL FUND, INC.
STATEMENT OF OPERATIONS
For the Year Ended March 31, 2018
INVESTMENT INCOME | |
Dividends | | $ | 3,522,111 | | |
Interest | | | 1,564,024 | | |
Total investment income | | | 5,086,135 | | |
EXPENSES | |
Advisory fees | | | 3,413,742 | | |
Transfer agent fees and expenses | | | 254,649 | | |
Director fees and expenses | | | 190,423 | | |
Legal fees | | | 172,664 | | |
Reports to shareholders | | | 101,429 | | |
Audit and tax services fees | | | 60,485 | | |
Filing fees | | | 30,490 | | |
Administrative services fees | | | 26,639 | | |
Professional fees | | | 24,049 | | |
Custodian fees | | | 22,503 | | |
Other | | | 13,000 | | |
Total expenses | | | 4,310,073 | | |
Net expenses | | | 4,310,073 | | |
Net investment income | | | 776,062 | | |
NET REALIZED AND UNREALIZED GAIN (LOSS) | |
Net realized gain (loss) on: | |
Investments | | | 94,390,828 | | |
Written options | | | 152,818 | | |
Net change in unrealized appreciation (depreciation) of: | |
Investments | | | (119,297,810 | ) | |
Net realized and unrealized loss | | | (24,754,164 | ) | |
NET DECREASE IN NET ASSETS RESULTING FROM OPERATIONS | | $ | (23,978,102 | ) | |
See notes to financial statements.
14
FPA CAPITAL FUND, INC.
STATEMENTS OF CHANGES IN NET ASSETS
| | | Year
Ended
March 31,
2018 | | Year
Ended
March 31,
2017 | |
INCREASE (DECREASE) IN NET ASSETS | |
Operations: | |
Net investment income | | $ | 776,062 | | | $ | 1,099,830 | | |
Net realized gain | | | 94,543,646 | | | | 57,140,480 | | |
Net change in unrealized appreciation (depreciation) | | | (119,297,810 | ) | | | 73,480,801 | | |
Net increase (decrease) in net assets resulting from operations | | | (23,978,102 | ) | | | 131,721,111 | | |
Distributions to shareholders from: | |
Net investment income | | | — | | | | (2,253,045 | ) | |
Net realized capital gains | | | (24,352,698 | ) | | | (39,457,798 | ) | |
Total distributions | | | (24,352,698 | ) | | | (41,710,843 | ) | |
Capital Stock transactions: | |
Proceeds from Capital Stock sold | | | 15,636,936 | | | | 61,491,321 | | |
Proceeds from shares issued to shareholders upon
reinvestment of dividends and distributions | | | 21,393,932 | | | | 37,996,105 | | |
Cost of Capital Stock repurchased | | | (424,875,180 | )* | | | (159,522,908 | )* | |
Net decrease from Capital Stock transactions | | | (387,844,312 | ) | | | (60,035,482 | ) | |
Total change in net assets | | | (436,175,112 | ) | | | 29,974,786 | | |
NET ASSETS | |
Beginning of Year | | | 789,441,341 | | | | 759,466,555 | | |
End of Year | | $ | 353,266,229 | | | $ | 789,441,341 | | |
CHANGE IN CAPITAL STOCK OUTSTANDING | |
Shares of Capital Stock sold | | | 445,345 | | | | 1,697,828 | | |
Shares issued to shareholders upon reinvestment of dividends and
distributions | | | 618,132 | | | | 1,041,182 | | |
Shares of Capital Stock repurchased | | | (12,184,122 | ) | | | (4,481,940 | ) | |
Change in Capital Stock outstanding | | | (11,120,645 | ) | | | (1,742,930 | ) | |
* Net of redemption fees of $36,394 and $30,164 for the year ended March 31, 2018 and year ended March 31, 2017, respectively.
See notes to financial statements.
15
FPA CAPITAL FUND, INC.
FINANCIAL HIGHLIGHTS
Selected Data for Each Share of Capital Stock Outstanding Throughout Each Year
| | | Year Ended March 31, | |
| | | 2018 | | 2017 | | 2016 | | 2015 | | 2014 | |
Per share operating performance: | |
Net asset value at beginning of year | | $ | 36.39 | | | $ | 32.41 | | | $ | 37.66 | | | $ | 47.46 | | | $ | 45.60 | | |
Income from investment operations: | |
Net investment income (loss)* | | $ | 0.05 | | | $ | 0.05 | | | $ | 0.12 | | | $ | 0.03 | | | $ | (0.03 | ) | |
Net realized and unrealized gain (loss)
on investment securities | | | (1.47 | ) | | | 5.80 | | | | (4.92 | ) | | | (5.02 | ) | | | 7.90 | | |
Total from investment operations | | $ | (1.42 | ) | | $ | 5.85 | | | $ | (4.80 | ) | | $ | (4.99 | ) | | $ | 7.87 | | |
Less distributions: | |
Dividends from net investment income | | | — | | | $ | (0.10 | ) | | $ | (0.12 | ) | | | — | | | | — | | |
Distributions from net realized capital gains | | $ | (1.55 | ) | | | (1.77 | ) | | | (0.33 | ) | | $ | (4.81 | ) | | $ | (6.01 | ) | |
Total distributions | | $ | (1.55 | ) | | $ | (1.87 | ) | | $ | (0.45 | ) | | $ | (4.81 | ) | | $ | (6.01 | ) | |
Redemption fees | | | — | ** | | | — | ** | | | — | ** | | | — | ** | | | — | ** | |
Net asset value at end of year | | $ | 33.42 | | | $ | 36.39 | | | $ | 32.41 | | | $ | 37.66 | | | $ | 47.46 | | |
Total investment return*** | | | (4.05 | )% | | | 18.09 | % | | | (12.74 | )% | | | (11.49 | )% | | | 18.99 | % | |
Ratios/supplemental data: | |
Net assets, end of year (in $000's) | | $ | 353,266 | | | $ | 789,441 | | | $ | 759,467 | | | $ | 1,076,477 | | | $ | 1,372,336 | | |
Ratio of expenses to average net assets | | | 0.83 | % | | | 0.80 | % | | | 0.77 | % | | | 0.83 | % | | | 0.83 | % | |
Ratio of net investment income (loss) to
average net assets | | | 0.15 | % | | | 0.14 | % | | | 0.34 | % | | | 0.08 | % | | | (0.07 | )% | |
Portfolio turnover rate | | | 66 | % | | | 23 | % | | | 45 | % | | | 38 | % | | | 17 | % | |
* Per share amount is based on average shares outstanding.
** Rounds to less than $0.01 per share.
*** Return is based on net asset value per share, adjusted for reinvestment of distributions, and does not reflect deduction of the sales charge.
See notes to financial statements.
16
FPA CAPITAL FUND, INC.
NOTES TO FINANCIAL STATEMENTS
March 31, 2018
NOTE 1 — Significant Accounting Policies
FPA Capital Fund, Inc. (the "Fund") is registered under the Investment Company Act of 1940, as a diversified, open-end investment company. The Fund's primary investment objective is long-term capital growth. Current income is a factor, but a secondary consideration. The Fund qualifies as an investment company pursuant to Financial Accounting Standard Board (FASB) Accounting Standards Codification (ASC) No. 946, Financial Services — Investment Companies. The following is a summary of significant accounting policies consistently followed by the Fund in the preparation of its financial statements.
A. Security Valuation
The Fund's investments are reported at fair value as defined by accounting principles generally accepted in the United States of America, ("U.S. GAAP"). The Fund generally determines its net asset value as of approximately 4:00 p.m. New York time each day the New York Stock Exchange is open. Further discussion of valuation methods, inputs and classifications can be found under Disclosure of Fair Value Measurements.
B. Securities Transactions and Related Investment Income
Securities transactions are accounted for on the date the securities are purchased or sold. Dividend income and distributions to shareholders are recorded on the ex-dividend date. Interest income and expenses are recorded on an accrual basis.
C. Use of Estimates
The preparation of the financial statements in accordance with U.S. GAAP requires management to make estimates and assumptions that affect the amounts reported. Actual results could differ from those estimates.
NOTE 2 — Risk Considerations
Investing in the Fund may involve certain risks including, but not limited to, those described below.
Market Risk: Because the values of the Fund's investments will fluctuate with market conditions, so will the value of your investment in the Fund. You could lose money on your investment in the Fund or the Fund could underperform other investments.
Common Stocks and Other Securities: The prices of common stocks and other securities held by the Fund may decline in response to certain events taking place around the world, including; those directly involving companies whose securities are owned by the Fund; conditions affecting the general economy; overall market changes; local, regional or global political, social or economic instability; and currency, interest rate and commodity price fluctuations. In addition, the Adviser's emphasis on a value-oriented investment approach generally results in the Fund's portfolio being invested primarily in medium or smaller sized companies. Smaller companies may be subject to a greater degree of change in earnings and business prospects than larger, more established companies, and smaller companies are often more reliant on key products or personnel than larger companies. Also, securities of smaller companies are traded in lower volumes than those issued by larger companies and may be more volatile than those of larger companies. In light of these characteristics of smaller companies and their securities, the Fund may be subjected to greater risk than that assumed when investing in the equity securities of larger companies.
17
FPA CAPITAL FUND, INC.
NOTES TO FINANCIAL STATEMENTS
Continued
Covered Call Options: In an effort to increase potential income, the Fund may write (i.e. sell) covered call options listed on a national securities exchange. When the Fund writes a listed call option, the purchaser has the right to buy a security from the Fund at a fixed exercise price any time before the option contract expires, regardless of changes in the market price of the underlying security. The Fund writes options only on securities it owns (covered options) and must retain ownership of the underlying security while the option is outstanding. Until the option expires, the Fund cannot profit from a rise in the market price of the underlying security over the exercise price, except insofar as the premium which the Fund receives, net of commissions, represents a profit. The premium paid to the Fund is the consideration for undertaking this obligation.
If a covered call option written by the Fund expires unexercised, the Fund realizes a capital gain on the expiration date equal to the premium received at the time the option was written. Prior to the earlier of exercise or expiration, an option may be closed out by an offsetting purchase of an option of the same series (type, underlying security, exercise price and expiration). There can be no assurance, however, that a closing purchase transaction can be effected when the Fund desires. The Fund will realize a capital gain from a closing purchase transaction if the cost of the closing option is less than the premium received from writing the option, or a capital loss if the cost of the closing option is more than the premium received from writing the option.
Repurchase Agreements: Repurchase agreements permit the Fund to maintain liquidity and earn income over periods of time as short as overnight. Repurchase agreements held by the Fund are fully collateralized by U.S. Government securities, or securities issued by U.S. Government agencies, or securities that are within the three highest credit categories assigned by established rating agencies (Aaa, Aa, or A by Moody's or AAA, AA or A by Standard & Poor's) or, if not rated by Moody's or Standard & Poor's, are of equivalent investment quality as determined by the Adviser. Such collateral is in the possession of the Fund's custodian. The collateral is evaluated daily to ensure its market value equals or exceeds the current market value of the repurchase agreements including accrued interest. In the event of default on the obligation to repurchase, the Fund has the right to liquidate the collateral and apply the proceeds in satisfaction of the obligation.
The Fund may enter into repurchase agreements, under the terms of a Master Repurchase Agreement ("MRA"). The MRA permits the Fund, under certain circumstances including an event of default (such as bankruptcy or insolvency), to offset payables and/or receivables under the MRA with collateral held and/or posted to the counterparty and create one single net payment due to or from the Fund. However, bankruptcy or insolvency laws of a particular jurisdiction may impose restrictions on or prohibitions against such a right of offset in the event of a MRA counterparty's bankruptcy or insolvency. Pursuant to the terms of the MRA, the Fund receives securities as collateral with a market value in excess of the repurchase price to be received by the Fund upon the maturity of the repurchase transaction. Upon a bankruptcy or insolvency of the MRA counterparty, the Fund recognizes a liability with respect to such excess collateral to reflect the Fund's obligation under bankruptcy law to return the excess to the counterparty. Repurchase agreements outstanding at the end of the period are listed in the Fund's Portfolio of Investments.
NOTE 3 — Purchases and Sales of Investment Securities
Cost of purchases of investment securities (excluding short-term investments) aggregated $233,060,045 for the year ended March 31, 2018. The proceeds and cost of securities sold resulting in net realized gains of $94,543,646 aggregated $275,490,914 and $180,947,268, respectively, for the year ended March 31, 2018. Realized gains or losses are based on the specific identification method.
18
FPA CAPITAL FUND, INC.
NOTES TO FINANCIAL STATEMENTS
Continued
NOTE 4 — Federal Income Tax
No provision for federal income tax is required because the Fund has elected to be taxed as a "regulated investment company" under the Internal Revenue Code (the "Code") and intends to maintain this qualification and to distribute each year to its shareholders, in accordance with the minimum distribution requirements of the Code, its taxable net investment income and taxable net realized gains on investments.
Distributions paid to shareholders are based on net investment income and net realized gains determined on a tax reporting basis, which may differ from financial reporting. For federal income tax purposes, the Fund had the following components of distributable earnings at March 31, 2018:
Undistributed Ordinary Income | | $ | 656,667 | | |
Post October Capital Loss Deferral | | | (294,044 | ) | |
Capital Loss Carryover | | | (7,783,327 | ) | |
Unrealized Appreciation | | | 40,328,131 | | |
| | $ | 32,907,427 | | |
During the tax year ended March 31, 2018, the Fund elected to defer post October short-term losses of $294,044. These losses are deemed to arise on the first day of the Fund's next taxable year.
As of March 31, 2018 for federal income tax purposes, the Fund had $7,783,327 of non-expiring short-term capital losses available to offset possible future capital gains.
The tax status of distributions paid during the fiscal years ended March 31, 2018 and 2017 were as follows:
| | | 2018 | | 2017 | |
Dividends from ordinary income | | $ | 887,789 | | | $ | 5,565,149 | | |
Distributions from long-term capital gains | | $ | 23,464,909 | | | $ | 36,145,693 | | |
The cost of investment securities held at March 31, 2018, was $305,572,869 for federal income tax purposes. Gross unrealized appreciation and depreciation for all investments (excluding short-term investments) at March 31, 2018, for federal income tax purposes was $56,807,932 and $16,479,801, respectively resulting in net unrealized appreciation of $40,328,131. The Fund recognizes interest and penalties, if any, related to unrecognized tax benefits as income tax expense in the Statement of Operations. During the year, the Fund did not incur any interest or penalties. The Fund is not subject to examination by U.S. federal tax authorities for years ended on or before March 31, 2014 or by state tax authorities for years ended on or before March 31, 2013.
During the year ended March 31, 2018, the Fund reclassified $119,395 from Accumulated Net Investment Income to Additional Paid in Capital and $98,437,016 from Accumulated Net Realized Gain to Additional Paid in Capital to align financial reporting with tax reporting. These permanent differences are primarily due to reclassification of redemption-in-kind gains and losses and distribution re-designations. Net assets were not affected by these reclassifications.
NOTE 5 — Advisory Fees and Other Affiliated Transactions
Pursuant to an Investment Advisory Agreement, advisory fees were paid by the Fund to First Pacific Advisors, LLC (the "Adviser"). Under the terms of this Agreement, the Fund pays the Adviser a monthly fee calculated at the annual rate of 0.75% of the first $50 million of the Fund's average daily net assets and 0.65% of the average daily net assets in excess of $50 million. The Agreement obligates the Adviser to reduce its fee to the extent
19
FPA CAPITAL FUND, INC.
NOTES TO FINANCIAL STATEMENTS
Continued
necessary to reimburse the Fund for any annual expenses (exclusive of interest, taxes, the cost of any supplemental statistical and research information, and extraordinary expenses such as litigation) in excess of 11/2% of the first $30 million and 1% of the remaining average net assets of the Fund for the year.
For the year ended March 31, 2018, the Fund paid aggregate fees and expenses of $190,423 to all Directors who are not affiliated persons of the Adviser. Certain officers of the Fund are also officers of the Adviser.
NOTE 6 — Redemption Fees
Effective June 26, 2017, the Board of Directors of the Fund approved the removal of the 2% redemption fee. Prior to that date, a redemption fee of 2% applied to redemptions within 90 days of purchase. For the year ended March 31, 2018, the Fund collected $36,394 in redemption fees. The impact of these fees is less than $0.01 per share.
NOTE 7 — Disclosure of Fair Value Measurements
The Fund uses the following methods and inputs to establish the fair value of its assets and liabilities. Use of particular methods and inputs may vary over time based on availability and relevance as market and economic conditions evolve.
Equity securities are generally valued each day at the official closing price of, or the last reported sale price on, the exchange or market on which such securities principally are traded, as of the close of business on that day. If there have been no sales that day, equity securities are generally valued at the last available bid price. Securities that are unlisted and fixed-income and convertible securities listed on a national securities exchange for which the over-the-counter ("OTC") market more accurately reflects the securities' value in the judgment of the Fund's officers, are valued at the most recent bid price. Short-term corporate notes with maturities of 60 days or less at the time of purchase are valued at amortized cost.
Securities for which representative market quotations are not readily available or are considered unreliable by the Adviser are valued as determined in good faith under procedures adopted by the authority of the Fund's Board of Directors. Various inputs may be reviewed in order to make a good faith determination of a security's value. These inputs include, but are not limited to, the type and cost of the security; contractual or legal restrictions on resale of the security; relevant financial or business developments of the issuer; actively traded similar or related securities; conversion or exchange rights on the security; related corporate actions; significant events occurring after the close of trading in the security; and changes in overall market conditions. Fair valuations and valuations of investments that are not actively trading involve judgment and may differ materially from valuations of investments that would have been used had greater market activity occurred.
The Fund classifies its assets based on three valuation methodologies. Level 1 values are based on quoted market prices in active markets for identical assets. Level 2 values are based on significant observable market inputs, such as quoted prices for similar assets and quoted prices in inactive markets or other market observable inputs as noted above including spreads, cash flows, financial performance, prepayments, defaults, collateral, credit enhancements, and interest rate volatility. Level 3 values are based on significant unobservable inputs that reflect the Fund's determination of assumptions that market participants might reasonably use in valuing the
20
FPA CAPITAL FUND, INC.
NOTES TO FINANCIAL STATEMENTS
Continued
assets. The valuation levels are not necessarily an indication of the risk associated with investing in those securities. The following table presents the valuation levels of the Fund's investments as of March 31, 2018:
Investments | | Level 1 | | Level 2 | | Level 3 | | Total | |
Common Stocks | |
Exploration & Production | | $ | 55,116,358 | | | | — | | | | — | | | $ | 55,116,358 | | |
Communications Equipment | | | 37,055,500 | | | | — | | | | — | | | | 37,055,500 | | |
Oil & Gas Services & Equipment | | | 30,525,314 | | | | — | | | | — | | | | 30,525,314 | | |
Airlines | | | 25,483,652 | | | | — | | | | — | | | | 25,483,652 | | |
Technology Distributors | | | 24,573,371 | | | | — | | | | — | | | | 24,573,371 | | |
Computer Hardware & Storage | | | 21,439,303 | | | | — | | | | — | | | | 21,439,303 | | |
Consumer Goods — Rental | | | 13,749,330 | | | | — | | | | — | | | | 13,749,330 | | |
Auto Parts | | | 12,478,998 | | | | — | | | | — | | | | 12,478,998 | | |
Semiconductor Manufacturing | | | 8,110,428 | | | | — | | | | — | | | | 8,110,428 | | |
Banks | | | 7,704,535 | | | | — | | | | — | | | | 7,704,535 | | |
Publishing & Broadcasting | | | 6,404,286 | | | | — | | | | — | | | | 6,404,286 | | |
Agricultural Machinery | | | 5,019,909 | | | | — | | | | — | | | | 5,019,909 | | |
Containers & Packaging | | | 4,927,995 | | | | — | | | | — | | | | 4,927,995 | | |
Marine Shipping | | | 2,753,450 | | | | — | | | | — | | | | 2,753,450 | | |
Infrastructure Software | | | 2,704,048 | | | | — | | | | — | | | | 2,704,048 | | |
Information Technology Services | | | 2,702,364 | | | | — | | | | — | | | | 2,702,364 | | |
Other Common Stocks | | | 5,288,277 | | | | — | | | | — | | | | 5,288,277 | | |
U.S. Treasuries | | | — | | | $ | 79,863,882 | | | | — | | | | 79,863,882 | | |
Short-Term Investment | | | — | | | | 8,858,000 | | | | — | | | | 8,858,000 | | |
| | | $ | 266,037,118 | | | $ | 88,721,882 | | | | — | | | $ | 354,759,000 | | |
Transfers of investments between different levels of the fair value hierarchy are recorded at market value as of the end of the reporting period. There were no transfers between Levels 1, 2, or 3 during the year ended March 31, 2018.
NOTE 8 — Collateral Requirements
FASB Accounting Standards Update No. 2011-11, Disclosures about Offsetting Assets and Liabilities, requires disclosures to make financial statements that are prepared under U.S. GAAP more comparable to those prepared under International Financial Reporting Standards. Under this guidance the Fund discloses both gross and net information about instruments and transactions eligible for offset such as instruments and transactions subject to an agreement similar to a master netting arrangement. In addition, the Fund discloses collateral received and posted in connection with master netting agreements or similar arrangements.
21
FPA CAPITAL FUND, INC.
NOTES TO FINANCIAL STATEMENTS
Continued
The following table presents the Fund's repurchase agreements by counterparty net of amounts available for offset under an ISDA Master agreement or similar agreements and net of the related collateral received or pledged by the Fund as of March 31, 2018, are as follows:
Counterparty | | Gross Assets
in the Statement of
Assets and Liabilities | | Collateral
Received | | Assets (Liabilities)
Available for Offset | | Net Amount
of Assets* | |
State Street Bank
and Trust Company | | $ | 8,858,000 | | | $ | 8,858,000 | ** | | | — | | | | — | | |
* Represents the net amount receivable from the counterparty in the event of default.
** Collateral with a value of $9,038,546 has been received in connection with a master repurchase agreement. Excess of collateral received from the individual master repurchase agreement is not shown for financial reporting purposes.
22
FPA CAPITAL FUND, INC.
REPORT OF INDEPENDENT REGISTERED
PUBLIC ACCOUNTING FIRM
TO THE SHAREHOLDERS AND
THE BOARD OF DIRECTORS OF FPA CAPITAL FUND, INC.
Opinion on the Financial Statements and Financial Highlights
We have audited the accompanying statement of assets and liabilities of FPA Capital Fund, Inc. (the "Fund"), including the portfolio of investments, as of March 31, 2018, the related statement of operations for the year then ended, the statements of changes in net assets for each of the two years in the period then ended, the financial highlights for each of the five years in the period then ended, and the related notes. In our opinion, the financial statements and financial highlights present fairly, in all material respects, the financial position of the Fund as of March 31, 2018, and the results of its operations for the year then ended, the changes in its net assets for each of the two years in the period then ended, and the financial highlights for each of the five years in the period then ended, in conformity with accounting principles generally accepted in the United States of America.
Basis for Opinion
These financial statements and financial highlights are the responsibility of the Fund's management. Our responsibility is to express an opinion on the Fund's financial statements and financial highlights based on our audits. We are a public accounting firm registered with the Public Company Accounting Oversight Board (United States) (PCAOB) and are required to be independent with respect to the Fund in accordance with the U.S. federal securities laws and the applicable rules and regulations of the Securities and Exchange Commission and the PCAOB.
We conducted our audits in accordance with the standards of the PCAOB. Those standards require that we plan and perform the audit to obtain reasonable assurance about whether the financial statements and financial highlights are free of material misstatement, whether due to error or fraud. The Fund is not required to have, nor were we engaged to perform, an audit of its internal control over financial reporting. As part of our audits we are required to obtain an understanding of internal control over financial reporting but not for the purpose of expressing an opinion on the effectiveness of the Fund's internal control over financial reporting. Accordingly, we express no such opinion.
Our audits included performing procedures to assess the risks of material misstatement of the financial statements and financial highlights, whether due to error or fraud, and performing procedures that respond to those risks. Such procedures included examining, on a test basis, evidence regarding the amounts and disclosures in the financial statements and financial highlights. Our audits also included evaluating the accounting principles used and significant estimates made by management, as well as evaluating the overall presentation of the financial statements and financial highlights. Our procedures included confirmation of securities owned as of March 31, 2018, by correspondence with the custodian and brokers. We believe that our audits provide a reasonable basis for our opinion.

Los Angeles, California
May 22, 2018
We have served as the auditor of one or more of the investment companies managed by First Pacific Advisors, LLC since 2002.
23
FPA CAPITAL FUND, INC.
SHAREHOLDER EXPENSE EXAMPLE
March 31, 2018 (Unaudited)
Fund Expenses
Mutual fund shareholders generally incur two types of costs: (1) transaction costs, and (2) ongoing costs, including advisory and administrative fees; shareholder service fees; and other Fund expenses. The Example is intended to help you understand your ongoing costs (in dollars) of investing in the Fund and to compare these costs with the ongoing costs of investing in other mutual funds. The Example is based on an investment of $1,000 invested at the beginning of the year and held for the entire year.
Actual Expenses
The information in the table under the heading "Actual Performance" provides information about actual account values and actual expenses. You may use the information in this column, together with the amount you invested, to estimate the expenses that you paid over the period. Simply divide your account value by $1,000 (for example, an $8,600 account value divided by $1,000 = 8.6), then multiply the result by the number in the first column in the row entitled "Expenses Paid During Period" to estimate the expenses you paid on your account during this period.
Hypothetical Example for Comparison Purposes
The information in the table under the heading "Hypothetical Performance (5% return before expenses)" provides information about hypothetical account values and hypothetical expenses based on the Fund's actual expense ratio and an assumed rate of return of 5% per year before expenses, which is not the Fund's actual return. The hypothetical account values and expenses may not be used to estimate the actual ending account balance or expenses you paid for the period. You may use this information to compare the ongoing costs of investing in the Fund
and other funds. To do so, compare this 5% hypothetical example with the 5% hypothetical examples that appear in the shareholder reports of other funds.
Please note that the expenses shown in the table are meant to highlight your ongoing costs only and do not reflect any transactional costs. Therefore, the information under the heading "Hypothetical Performance (5% return before expenses)" is useful in comparing ongoing costs only, and will not help you determine the relative total costs of owning different funds. In addition, if these transactional costs were included, your costs would have been higher. Even though the Fund does not charge transaction fees, if you purchase shares through a broker, the broker may charge you a fee. You should evaluate other mutual funds' transaction fees and any applicable broker fees to assess the total cost of ownership for comparison purposes.
| | | Actual
Performance | | Hypothetical
Performance
(5% return
before
expenses) | |
Beginning Account Value
September 30, 2017 | | $ | 1,000.00 | | | $ | 1,000.00 | | |
Ending Account Value
March 31, 2018 | | $ | 991.40 | | | $ | 1,020.79 | | |
Expenses Paid During
Period* | | $ | 4.12 | | | $ | 4.18 | | |
* Expenses are equal to the Fund's annualized expense ratio of 0.83%, multiplied by the average account value over the period and prorated for the six-months ended March 31, 2018 (182/365 days).
24
FPA CAPITAL FUND, INC.
PRIVACY POLICY
The Fund considers customer privacy to be an essential part of its investor relationships and is committed to maintaining the confidentiality, integrity and security of its current, prospective and former investors' non-public personal information. The Fund has developed policies that are designed to protect this confidentiality, while permitting investor needs to be served.
Obtaining Personal Information
While providing investors with products and services, the Fund and certain service providers, such as the Fund's Transfer Agent and/or Administrator, may obtain non-public personal information about investors, which may come from sources such as (i) account applications, subscription agreements and other forms, (ii) written, electronic or verbal correspondence, (iii) investor transactions, (iv) an investor's brokerage or financial advisory firm, financial advisor or consultant, and/or (v) from information captured on applicable websites. The nonpublic personal information that may be collected from investors may include the investor's name, address, tax identification number, birth date, investment selection, beneficiary information, and possibly the investor's personal bank account information and/or email address if the investor has provided that information, as well as the investor's transaction and account history with the Fund or other investment companies advised by First Pacific Advisors, LLC.
Respecting Your Privacy
The Fund does not disclose any non-public personal information provided by investors or gathered by the Fund to third parties, except as required or permitted by law or as necessary for such third parties to perform their agreements with respect to the Fund. Non-affiliated companies may from time to time be used to provide certain services, such as maintaining investor accounts, preparing and mailing prospectuses, reports, account statements and other information, and gathering shareholder proxies. In many instances, the investors will be clients of a third party, but the Fund may also provide an investor's personal and account information to the investor's respective brokerage or financial advisory firm and/or financial advisor or consultant.
Sharing Information with Third Parties
The Fund reserves the right to report or disclose personal or account information to third parties in circumstances where the Fund believes in good faith that disclosure is required or permitted under law, to cooperate with regulators or law enforcement authorities, to protect its rights or property, or upon reasonable request by the Fund in which an investor has invested. In addition, the Fund may disclose information about an investor or an investor's accounts to a third party at the investor's request or with the consent of the investor.
Procedures to Safeguard Private Information
The Fund is committed to its obligation to safeguard investor non-public personal information. In addition to this policy, the Fund has implemented procedures that are designed to limit access to an investor's non-public personal information to internal personnel who require the information to complete tasks, such as processing transactions, maintaining client accounts or otherwise providing services the investor requested. Physical, electronic and procedural safeguards are in place to guard an investor's non-public personal information.
Information Collected from Websites
Websites maintained by the Fund or its service providers may use a variety of technologies to collect information that helps the Fund and its service providers understand how the website is used. Information collected from your web browser (including small files stored on your device that are commonly referred to as "cookies") allow the websites to recognize your web browser and help to personalize and improve your user experience and enhance navigation of the website. If you are a registered user of the Fund's and/or its service providers' website,
25
FPA CAPITAL FUND, INC.
PRIVACY POLICY
Continued
the Fund, its service providers or third party firms engaged by the Fund or its service providers, may collect or share information submitted by you, which may include personally identifiable information. You can change your cookie preferences by changing the setting on your web browser to delete or reject cookies. If you delete or reject cookies, some website pages may not function properly. The Fund does not look for web browser "do not track" requests.
Changes to the Privacy Policy
From time to time, the Fund may update or revise this privacy policy. If there are changes to the terms of this privacy policy, documents containing the revised policy on the relevant website will be updated.
Revised: February, 2018
26
FPA CAPITAL FUND, INC.
DIRECTOR AND OFFICER INFORMATION
(Unaudited)
Name, Address(1)
and Year of Birth | | Position(s)
With Fund
Years Served | | Principal Occupation(s)
During the Past 5 Years | | Portfolios in
Fund Complex
Overseen | | Other
Directorships | |
Independent Directors
Allan M. Rudnick – 1940† | | Director and
Chairman*
Years Served: 6 | | Private Investor. Formerly Co-Founder, Chief Executive Officer, Chairman and Chief Investment Officer of Kayne Anderson Rudnick Investment Management from 1989 to 2007. | | | 7 | | | | |
Sandra Brown – 1955† | | Trustee*
Years Served: 2 | | Consultant. Formerly CEO and President of Transamerica Financial Advisers, Inc., 1999 to 2009; President, Transamerica Securities Sales Corp. 1998 to 2009; VP, Bank of America Mutual Fund Administration 1990 to 1998. | | | 7 | | | | |
Mark L. Lipson – 1949† | | Director*
Years Served: 2 | | Consultant. ML2Advisors, LLC. Former Managing Director, Bessemer Trust (2007-2014) and US Trust (2003-2006); Founder, Chairman and CEO of the Northstar Mutual Funds (1993-2001). | | | 7 | | | | |
Alfred E. Osborne, Jr. – 1944† | | Director*
Years Served: 17 | | Senior Associate Dean of the John E. Anderson School of Management at UCLA. | | | 7 | | | Wedbush, Inc., Nuverra Environmental Solutions, Inc., and Kaiser Aluminum, Inc. | |
A. Robert Pisano – 1943† | | Director*
Years Served: 4 | | Consultant. Formerly President and Chief Operating Officer of the Motion Picture Association of America, Inc. from 2005 to 2011. | | | 7 | | | Entertainment Partners, and Resources Global Professionals | |
Patrick B. Purcell – 1943† | | Director*
Years Served: 11 | | Retired. Formerly Executive Vice President, Chief Financial and Administrative Officer of Paramount Pictures from 1983 to 1998. | | | 7 | | | | |
Interested Director(2)
J. Richard Atwood – 1960 | | Director* and
President
Years Served: 20 | | Managing Partner of the Adviser. | | | 7 | | | | |
27
FPA CAPITAL FUND, INC.
DIRECTOR AND OFFICER INFORMATION
(Unaudited) Continued
Name, Address(1)
and Year of Birth | | Position(s)
With Fund
Years Served | | Principal Occupation(s)
During the Past 5 Years | | Portfolios in
Fund Complex
Overseen | | Other
Directorships | |
Officers
Arik A. Ahitov – 1975 | | Portfolio Manager
Years Served: 4 | | Partner of the Adviser since 2015. Managing Director of the Adviser from 2013-2014 and Vice President of the Adviser from 2010 to 2013. | | | 7 | | | | |
David C. Lebisky – 1972 | | Chief Compliance Officer
Years Served: 1 | | President of Lebisky Compliance Consulting LLC (since October 2015). Consultant, Duff & Phelps Compliance Consulting (since 2016). Senior Consultant, Freeh Group International Solutions, LLC (a global risk management firm) (since 2015). Formerly, Director of Regulatory Administration, Scotia Institutional Investments US, LP (2010 to 2014). | | | 7 | | | | |
E. Lake Setzler – 1967 | | Treasurer
Years Served: 11 | | Senior Vice President and Controller of the Adviser. | | | 7 | | | | |
Francine S. Hayes – 1967 | | Secretary
Years Served: 2 | | Vice President and Senior Counsel of State Street Bank and Trust Company | | | 7 | | | | |
(1) The address for each Director and each Officer (except Ms. Hayes) is 11601 Wilshire Boulevard, Suite 1200, Los Angeles, California 90025. Ms. Hayes' address is State Street Bank and Trust Company, One Lincoln Street, Boston, Massachusetts 02111.
(2) "Interested person" within the meaning of the 1940 Act by virtue of his affiliation with the Fund's Adviser.
* Directors serve until their resignation, removal or retirement.
† Audit Committee member
The Statement of Additional Information includes additional information about the Directors and is available, without charge, upon request by calling (800) 982-4372.
28
FPA CAPITAL FUND, INC.
(Unaudited)
INVESTMENT ADVISER
First Pacific Advisors, LLC
11601 Wilshire Boulevard, Suite 1200
Los Angeles, CA 90025
TRANSFER & SHAREHOLDER
SERVICE AGENT
UMB Fund Services, Inc.
P.O. Box 2175
Milwaukee, WI 53201-2175
or
235 Galena Street
Milwaukee, WI 53212
(800) 638-3060
CUSTODIAN AND ADMINISTRATOR
State Street Bank and Trust Company
One Lincoln Street
Boston, Massachusetts 02111
TICKER: FPPTX
CUSIP: 302539101
DISTRIBUTOR
UMB Distribution Services, LLC
235 Galena Street
Milwaukee, Wisconsin 53212
LEGAL COUNSEL
Dechert LLP
One Bush Street, Suite 1600
San Francisco, California 94014
INDEPENDENT REGISTERED PUBLIC ACCOUNTING FIRM
Deloitte & Touche LLP
555 West 5th Street, Suite 2700
Los Angeles, California 90013
This report has been prepared for the information of shareholders of FPA CAPITAL FUND, INC., and is not authorized for distribution to prospective investors unless preceded or accompanied by an effective prospectus.The financial information included in this report has been taken from the records of the Fund without examination by independent auditors.
A description of the policies and procedures that the Adviser uses to vote proxies related to the Fund's portfolio securities is set forth in the Fund's Statement of Additional Information which is available without charge, upon request, on the Fund's website at www.fpafunds.com or by calling (800) 982-4372 and on the Securities and Exchange Commission's (SEC) website at www.sec.gov. The Fund's complete proxy voting record for the 12 months ended June 30, 2017 is available without charge, upon request by calling (800) 982-4372 and on the SEC's website at www.sec.gov.
The Fund's schedule of portfolio holdings, filed the first and third quarter of the Fund's fiscal year on Form N-Q with the SEC, is available on the SEC's website at www.sec.gov. Form N-Q is available at the SEC's Public Reference Room in Washington, D.C., and information on the operations of the Public Reference Room may be obtained by calling (202) 551-8090. To obtain Form N-Q from the Fund, shareholders can call (800) 982-4372.
Additional information about the Fund is available online at www.fpafunds.com. This information includes, among other things, holdings, top sectors, and performance, and is updated on or about the 15th business day after the end of each quarter.
Item 2. Code of Ethics.
(a) The registrant has adopted a code of ethics that applies to the registrant’s principal executive and financial officers.
(b) Not applicable.
(c) During the period covered by this report, there were no amendments to the provisions of the code of ethics adopted in 2(a) above.
(d) During the period covered by this report, there were not any implicit or explicit waivers to the provisions of the code of ethics adopted in 2(a).
(e) Not applicable.
(f) A copy of the registrant’s code of ethics is filed as an exhibit to this Form N-CSR.
Item 3. Audit Committee Financial Expert.
The registrant’s board of directors has determined that Patrick B. Purcell, who is a member of the registrant’s audit committee and board of directors, is an “audit committee financial expert” and is “independent,” as those terms are defined in this Item. This designation will not increase the designee’s duties, obligations or liability as compared to his duties, obligations or liability as a member of the audit committee and of the board of directors. This designation does not affect the duties, obligations or liability of any other member of the audit committee or the board of directors.
Item 4. Principal Accountant Fees and Services.
| | 2017 | | 2018 | |
(a) Audit Fees | | $ | 43,988 | | $ | 45,087 | |
(b) Audit Related Fees | | $ | -0- | | $ | -0- | |
(c) Tax Fees(1) | | $ | 8,900 | | $ | 9,124 | |
(d) All Other Fees | | $ | -0- | | $ | -0- | |
(1) Tax fees are for the preparation of the Fund’s tax return(s).
(e)(1) The audit committee shall pre-approve all audit and permissible non-audit services that the committee considers compatible with maintaining the independent auditors’ independence. The pre-approval requirement will extend to all non-audit services provided to the registrant, the adviser, and any entity controlling, controlled by, or under common control with the adviser that provides ongoing services to the registrant, if the engagement relates directly to the operations and financial reporting of the registrant; provided, however, that an engagement of the registrant’s independent auditors to perform attest services for the registrant, the adviser or its affiliates required by generally accepted auditing standards to complete the examination of the registrant’s financial statements (such as an examination conducted in accordance with Statement on Standards for Attestation Engagements Number 16, or a Successor Statement, issued by the American Institute of Certified Public Accountants), will be deem pre-approved if:
(i) the registrant’s independent auditors inform the audit committee of the engagement,
(ii) the registrant’s independent auditors advise the audit committee at least annually that the performance of this engagement will not impair the independent auditor’s independence with respect to the registrant, and
(iii) the audit committee receives a copy of the independent auditor’s report prepared in connection with such services. The committee may delegate to one or more committee members the authority to review and pre-approve audit and permissible non-audit services. Actions taken under any such delegation will be reported to the full committee at its next meeting.
(e)(2) 0% of the services provided to the registrant described in paragraphs b-d of this items were approved by the Audit Committee pursuant to paragraph (c)(7)(i)(C) of Rule 2-01 of Regulation S-X. There were no services provided to the investment adviser or any entity controlling, controlled by or under common control with the adviser described in paragraphs (b) — (d) of this Item that were required to be pre-approved by the audit committee.
(f) All services performed on the engagement to audit the registrant’s financial statements for the most recent fiscal year end were performed by the principal accountant’s full-time, permanent employees.
(g) None.
(h) Not applicable.
Item 5. Audit Committee of Listed Registrants.
Not applicable.
Item 6. Investments.
(a) Schedule of Investments is included as a part of the report to shareholders filed under Item 1 of this Form N-CSR.
(b) Not applicable.
Item 7. Disclosure of Proxy Voting Policies and Procedures for Closed-End Management Investment Companies.
Not applicable.
Item 8. Portfolio Managers of Closed-End Management Investment Companies.
Not applicable.
Item 9. Purchases of Equity Securities by Closed-End Management Investment Company and Affiliated Purchasers.
Not applicable.
Item 10. Submission of Matters to a Vote of Security Holders.
There have been no material changes to the procedures by which the shareholders may recommend nominees to the registrant’s board of directors.
Item 11. Controls and Procedures.
(a) The principal executive officer and principal financial officer of the registrant have concluded that the registrant’s disclosure controls and procedures (as defined in Rule 30a-3(c) under the Investment Company Act of 1940) are effective based on their evaluation of the disclosure controls and procedures as of a date within 90 days of the filing date of this report.
(b) There have been no significant changes in the registrant’s internal controls over financial reporting (as defined in Rule 30a-3(d) under the Investment Company Act of 1940) that occurred during the registrant’s second fiscal quarter of the period covered by this report that have materially affected, or is reasonably likely to materially affect, the registrant’s internal controls over financial reporting.
Item 12. Disclosure of Securities Lending Activities for Closed-End Management Investment Companies
Not applicable.
Item 13. Exhibits.
(a)(1) Code of ethics as applies to the registrant’s principal executive and financial officers is attached hereto.
(a)(2) The certifications required by Rule 30a-2(a) under the Investment Company Act of 1940 are attached hereto.
(a)(3) Not applicable.
(a)(4) Not applicable.
(b) The certifications required by Rule 30a-2(b) under the Investment Company Act of 1940 and Section 906 of the Sarbanes-Oxley Act of 2002 are attached hereto.
SIGNATURES
Pursuant to the requirements of the Securities Exchange Act of 1934 and the Investment Company Act of 1940, the registrant has duly caused this report to be signed on its behalf by the undersigned, thereunto duly authorized.
FPA CAPITAL FUND, INC.
By: | /s/ J. Richard Atwood | |
| J. Richard Atwood | |
| President (principal executive officer) | |
| | |
Date: | June 7, 2018 | |
Pursuant to the requirements of the Securities Exchange Act of 1934 and the Investment Company Act of 1940, this report has been signed below by the following persons on behalf of the registrant and in the capacities and on the dates indicated.
By: | /s/ J. Richard Atwood | |
| J. Richard Atwood | |
| President (principal executive officer) | |
| | |
Date: | June 7, 2018 | |
| | |
By: | /s/ E. Lake Setzler III | |
| E. Lake Setzler III | |
| Treasurer (principal financial officer) | |
| | |
Date: | June 7, 2018 | |