UNITED STATES
SECURITIES AND EXCHANGE COMMISSION
Washington, D.C. 20549
FORM N-CSR
CERTIFIED SHAREHOLDER REPORT OF REGISTERED
MANAGEMENT INVESTMENT COMPANIES
Investment Company Act file number | 811-1596 |
|
FPA CAPITAL FUND, INC. |
(Exact name of registrant as specified in charter) |
|
11601 WILSHIRE BLVD., STE. 1200 LOS ANGELES, CALIFORNIA | | 90025 |
(Address of principal executive offices) | | (Zip code) |
|
| | | |
(Name and Address of Agent for Service) | | Copy to: |
| | |
J. RICHARD ATWOOD, PRESIDENT
FPA CAPITAL FUND, INC.
11601 WILSHIRE BLVD., STE. 1200
LOS ANGELES, CALIFORNIA 90025 | | MARK D. PERLOW, ESQ. DECHERT LLP ONE BUSH STREET, STE. 1600 SAN FRANCISCO, CA 94104 |
Registrant’s telephone number, including area code: | (310) 473-0225 | |
|
Date of fiscal year end: | March 31 | |
|
Date of reporting period: | September 30, 2017 | |
| | | | | |
Item 1: Report to Shareholders.

Distributor:
UMB DISTRIBUTION SERVICES, LLC
235 West Galena Street
Milwaukee, Wisconsin 53212
FPA CAPITAL FUND, INC.
LETTER TO SHAREHOLDERS
Introduction
Dear Shareholders,
On August 22, 2017, FPA announced that I would become the sole Portfolio Manager of the FPA Capital Fund as of the beginning of the fourth quarter of 2017. I appreciate the trust that the FPA Managing Partners and the FPA Capital Fund Board have placed in me, and I will work hard to earn the trust of all our stakeholders.
I have already started repositioning the portfolio. I chose to eliminate five companies and add three new names amounting to 21% of invested capital. Our first full month of performance since the announcement against our benchmark was 6.51% vs. 4.54%. But as many of you know, we — here at FPA — do not focus on the short-term results. As we have stated on our website, one of our firm values is "the value of the long view," which we described as market cycles rather than a short period.1 Our team's overarching goal is to generate strong returns over a market cycle and we urge everyone to judge our team the same way.
The primary objective of the FPA Capital Fund is long-term growth of capital. The Fund's performance relative to its targeted objective has been disappointing over the last five years. As we continue to evolve, and as we strive for continuous improvement, there will be a number of changes. However, let me start with what will not change. We do not plan to change our mandate or our values. You can continue to expect the same level of commitment, focus, and integrity that you have always expected from us.
As a refresher, the FPA Capital Fund is a long-only, absolute-value fund that is benchmark indifferent. We look for market leading companies with a history of profitability, strong balance sheets, and good management teams. Once we identify and research these companies, we will buy when there is a compelling reward-to-risk ratio and we will sell when we believe the ratio is unfavorable. The resulting portfolio tends to be concentrated. I eat my own cooking. I am (and will continue to be) invested in the Fund alongside you.
We put all of our investment candidates through rigorous analyses. The process starts with reading publicly available filings and studying the financial statements. Our goal here is to develop a thorough understanding of how a company makes money and what major challenges it could face. Then we expand our knowledge by talking to anyone who can shed more light on the company or industry. For example, we talk to management teams, competitors, suppliers, clients, and industry experts. We prepare in-depth investment memos that summarize all of our learnings. We then decide whether we want to invest in the company, and if so, at what price and at what weighting. Once a company becomes a portfolio holding, we continuously monitor it and its competitors.
"An organization's ability to learn, and translate that learning into action rapidly, is the ultimate competitive business advantage." — Jack Welch
The core of our investment process and our investment philosophy is not changing, but we have learned some lessons from the past, and we intend to incorporate those lessons into our process going forward. Our analysis of the Fund showed that since the beginning of 2011, the vast majority of our shortfall against our benchmark was caused by our investments in energy and carrying significant amounts of cash. The steps outlined below should help minimize both of those issues going forward.
1 http://fpafunds.com/about-us/values
1
FPA CAPITAL FUND, INC.
LETTER TO SHAREHOLDERS
Continued
We will diligently avoid position inertia — We will seek to act quickly to adjust position sizing when there are changes in our analysis of facts and the risk/reward profile. We will guard against the natural tendency to remain attached to positions we like even when information and prices change. If we observe a shift in the underlying fundamentals of a position, or find it expensive, we will look to trim/exit that position as aggressively as possible (market conditions permitting). We will not make small adjustments when we believe bigger changes are warranted.
We will differentiate between long-term and opportunistic investments — We expect our long-term holdings will be in high quality businesses. High quality can come in a variety of forms, such as a strong market position, pricing power, or a unique business model that translates into a high return on capital over a cycle. We will be more vigilant and disciplined about exiting lower quality businesses once valuations are no longer extreme. As such, you can expect us to trim our lower quality energy holdings once prices normalize (again, market conditions permitting). That does not mean that we will not occasionally take positions in lower quality businesses when valuations are at extreme levels (e.g. some energy names following the great recession, or where they are trading today).
We will be more nimble — Our research process is very robust, and it takes at least a month to fully research a company. Before we decide whether to embark on a full analysis, we need to make sure that we are spending our time wisely. To that end, we initiated an interim step of generally spending just two days looking at an idea and preparing a short memo to assess whether an idea warrants further research. This way we should be able to look at more companies and spend our time on those that are more likely to become portfolio positions. I expect our faster process to allow us to convert more of our ideas into new investments. Moreover, having just one portfolio manager making the final decision should accelerate investment decisions.
Despite our lackluster performance in the past few years, not all was bad for the Fund. Let's quickly review what has worked:
We stayed true to our process and our mandate — Value investing has been out of favor for the last five years, and that has hurt our results, but we have never strayed from our process or our mandate. We continued to search for the same types of opportunities we always have with the same level of diligence, and an unwavering insistence on an attractive absolute valuation. And going forward, you can expect the same unwavering commitment to our mandate and process.
Our research process, apart from a few tweaks, remains unchanged — A continuing source of pride for the Capital Team is our internal research process. When researching investment ideas, we hope to understand and quantify potential sources of upside and risk and to understand the key drivers of a business and industry at a fundamental level. This deep understanding helps us build the confidence required to weather the many rainy days that inevitably come with value investing. Our research process remains as thorough and as committed to objectivity as ever.
Our new positions added value — We continued to insist that new positions must be thoroughly vetted prior to adding them to the portfolio. This includes a detailed memo and model as a result of our research process. The good news is our new positions (positions added since the beginning of 2011) have performed well, with the majority of them profitable and with gains handily outstripping losses.
"When the facts change, I change my mind. What do you do, sir?"
— Attributed to John Maynard Keynes
2
FPA CAPITAL FUND, INC.
LETTER TO SHAREHOLDERS
Continued
Portfolio alterations since the announcement of Portfolio Manager change:
Since I was announced as the sole Portfolio Manager of the FPA Capital Fund, there have been a number of changes in the portfolio. As value investors, we recognize there are often opportunities hidden in plain sight that allow us to invest in businesses at attractive valuations, such as when a thematic view impacts an entire sector and ignores company-specific details. For this reason, we tend to spend a reasonable amount of time picking through stocks in sectors that have underperformed. Two sectors that fit the bill today are retail and energy. The overarching negative theme in each sector is easy enough to understand. In energy, the theme is that there's just too much oil and prices will be lower forever. In retail, it's that Amazon is taking over the world, and the store-based model is dead. There's certainly at least a kernel of truth to both of these thematic ideas, but value can be found in either disagreeing with the consensus (as we do with energy) or in finding the baby that's been thrown out with the bathwater.
Retail:
Finding the baby is what we've been trying to do in retail. We recently dusted off a memo we had originally written in 2014. The stock in question had been sucked into the retail sector's downdraft and was trading at 10x free cashflow. As the stock price fell, we did a full refresh of our memo and sharpened our pencils on our valuation work. A key question we asked ourselves was whether the company was susceptible to disruption from Amazon (the key theme dragging down the sector). Our research led us to conclude that close to half of the business is insulated from this risk and the other half, while not immune, is much less impacted than many other retailers. We also recognized that unlike many retailers, this business was not cyclical and not seasonal, meaning that we think the firm should continue to generate steady free cash flow year in and year out regardless of what the broader economy is doing. Finally, we met with management in their headquarters to confirm that these cash flows would in our view be deployed wisely. Satisfied with their answer, we have begun building a position in this baby (thrown out with the bathwater).
We have also used this time to review our other retail holdings and reassess whether we have appropriately evaluated this looming threat. We evaluated each position's risk/reward ratio from its current level, taking into account the changing retail landscape. As we reviewed some of the holdings, we decided to eliminate Hibbett Sports, Signet Jewelers & Vista Outdoor, and to reduce our holdings in Foot Locker. We determined that these businesses would be facing increasing secular headwinds over the coming years. We made those changes despite their relatively undemanding valuations because we have learned that management teams faced with a declining business often take inappropriate risks that can destroy value (e.g. buying unfamiliar businesses, doubling down on a shrinking business).
Energy:
We have discussed our objective to dedicate more capital to well-run companies in higher quality industries earlier in this letter, so how does our current oil & gas sector allocation fit in as our portfolio evolves?
Ultimately, our high-level conclusion is that, barring extreme cyclical troughs where the market is clearly under-supplied and prices appear unsustainable, oil & gas investments do not currently fit our process and philosophy. Before discussing why we believe today is one of those rare times to own a significant position, there are three central reasons why energy investments currently conflict with our process.
First, this is a fractured market with limited barriers to entry, so it is destined to operate irrationally to the detriment of shareholders. Second, it is a global industry that is largely controlled by state entities (meaning that
3
FPA CAPITAL FUND, INC.
LETTER TO SHAREHOLDERS
Continued
government interests will conflict with economic ones) or run by management teams that are highly paid regardless of the returns they produce. As Evercore ISI recently pointed out, Big Oil and E&P (exploration and production) entities earned 113% and 106% of target annual bonus compensation during the past three years despite one of the industry's worst periods of financial performance.2 For E&Ps specifically, resource growth outweighs earnings and return on capital employed in the pay packages of CEO's by a 12:1 margin. Finally, as a whole, the capital markets turn a blind eye and continue to fund the vast majority of operators that do not earn their cost of capital over a full market cycle.3 This perpetuates the cycle of value destruction.
This is an earned insight. We select what we believe to be the highest quality energy companies, demonstrated by a strong track record of value creation across cycles, and balance sheets that can withstand a prolonged trough in commodity prices. However, based on the facts mentioned above, it is currently imprudent to hold even well managed energy companies beyond the point of market normalization.
Today, like just after the financial crisis, is one of those situations where the market appears so favorably imbalanced that we are willing to stay meaningfully invested in the sector. To put this into perspective:
• Global crude inventories — the intersection of supply and demand — declined 10 out of the last 12 months. In a typical year, inventories build seven out of 12 months and draw at much lower magnitudes.4
• Oil bears primarily focus on three things. I list these concerns below along with what the data actually show:
° U.S. production growth. Calendar year 2018 YoY growth estimates range from 600k barrels per day to 1.4mm b/d.5
• The latest Energy Information Administration (EIA) monthly data through June 2017 show that U.S. onshore production grew just 295k b/d over the last 12 months, with the oil rig count up 122% (it has since flattened).6 This production growth is literally a quarter of what many believe the growth rate to have been and roughly 200k b/d below the less reliable EIA weekly estimates.
° OPEC rational guardianship in CY2018 (i.e. will they release spare capacity?)
• This is a reasonable concern, but it's important to understand that:
• The majority of cuts are from Saudi Arabia, a country that 1) is burning FX reserves and needs $70+ Brent to balance the fiscal budget;7 2) is preparing to IPO a portion of the state oil company in order to help finance a multi-decade restructuring of the national economy; 3) has recently supported the idea of extending cuts beyond March 2018;8 and 4) is widely believed to already be operating near capacity, all while the probability of supply disruptions in Libya, Nigeria, Venezuela, and Iraq is higher than last year.
2 Evercore ISI, "The Path to Prosperity? Big Oil and E&P Compensation Review," May 31, 2017.
3 We sampled 48 E&Ps and found that only seven earned a 9% ROIC from 2008 through 2016. We own two of them (XEC & SM).
4 CornerStone Analytics, Aug. 10, 2017.
5 CornerStone Analytics, Sept. 6, 2017 report: On the low end, the EIA estimates +570k b/d, the International Energy Agency estimates +811k b/d, and the pundit community estimates +1mm to 1.4mm b/d.
6 Baird Rig Count, June 30, 2017.
7 International Monetary Fund's Middle East and Central East Regional Economic Outlook.
8 Bloomberg, "Saudi Arabia Says It's Open to Another OPEC Cuts Extension," Sept. 10,2017, https://bloom.bg/2wUvBuQ.
4
FPA CAPITAL FUND, INC.
LETTER TO SHAREHOLDERS
Continued
° A downturn in global demand
• The IEA — which has a long history of underestimating demand — continues to revise demand higher. The agency has increased 2Q'17 estimates by 800k b/d over the last three months, and CY2017 demand growth is now projected to be +1.6mm b/d versus an estimate of +1.3mm b/d back in January.
With supply growth more constrained than the market realizes, inventory draws are set to accelerate as global oil consumption on average runs higher in the back half of each year. As inventories approach normal levels, we expect to see much higher oil prices. Further, once our stocks reflect what we believe to be a more reasonable (yet still conservative) global marginal cost of production, we are prepared to fully exit the sector. We have already exited one of our energy investments.
Even though my goal in this letter is to focus your attention on the future, I will address the elephant in the room: Babcock & Wilcox Enterprises, Inc. (BW). We wrote about BW extensively in our Q1'2017 letter. At the time, we mentioned that the company took a charge due to some project mishaps in one of their three businesses. Subsequently, when BW reported its first quarter 2017 earnings it announced that the issues were contained and that they did not expect any additional charges. One quarter later, in their second quarter 2017 earnings call, BW changed its tune again and substantially increased the amount of money needed to resolve the issues. BW has been in business for over a hundred years and has not, to our knowledge, experienced any charges similar to what the company has incurred over the past few quarters. However, this management team found a way to take over $250mm of charges for a potential gross margin amount of $500mm from six projects. This outcome was not in our downside case scenario. Judging from the stock price movement of the day of the announcement, it caught a lot of people by surprise, including us. Needless to say, we exited the position because it no longer fit our criteria and we lost confidence in BW's management.
Criteria | | At the time of investment | | Now | |
Market leading company | | 100+ years in the business with high market share. | | Same | |
History of profitability | | Strong profitability and cash flow generation over cycles | | Large charges, not clear when (if ever) will reach profitability | |
Strong balance sheet | | Net cash position | | Net debt position and might worsen should BW take more charges | |
Good management team | | Experienced CEO that spun out an unrelated division, focused on cost cutting | | The same CEO took excessive risks, has not been able to contain the charges, brought the company to the brink of insolvency | |
5
FPA CAPITAL FUND, INC.
LETTER TO SHAREHOLDERS
Continued
Conclusion
This is the longest stretch of time that value has underperformed growth for Russell 2500.9
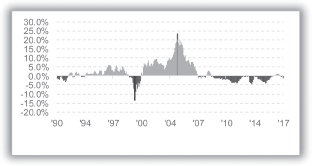
Since the Great Financial Crisis, the valuation gap of growth companies over value companies in Russell 2500 has been widening.10
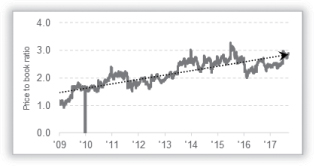
We cannot predict when (or if) this situation will reverse itself. However, following the previous five cycles when growth outperformed value, value stocks have delivered very robust performance (although there can be no guarantee this pattern will be repeated in the future).11
We remain committed to our absolute value roots. We realize that the Fund has performed poorly since the second half 2014 (notwithstanding our robust performance of 2016). However, my duty is to think about the future. And I think that the future is bright: Our portfolio is trading at a significant discount to our estimate of our companies' intrinsic values. Moreover, our pipeline of investment ideas has never been stronger. We expect to deploy capital into good companies in a very swift manner should the valuations permit.
9 Bloomberg — performance of Russell 2500 Value vs. Russell 2500 growth.
10 Bloomberg.
11 https://www.advisorperspectives.com/articles/2015/08/11/why-you-should-allocate-to-value-over-growth.
6
FPA CAPITAL FUND, INC.
LETTER TO SHAREHOLDERS
Continued
I am a true believer in transparency and open communication. I thank all of you who have reached out since the announcement of this transition. Please continue to do so. As always, we appreciate the trust you have placed in us — and know that it is not taken for granted. I can be reached at ahitov@fpafunds.com.
Respectfully submitted,
Arik Ahitov
Portfolio Manager
September 2017
Fund shares are presently offered for sale only to existing shareholders and to directors, officers and employees of the Fund, the Adviser, and affiliated companies, and their immediate relatives.
Performance data quoted in this letter represents past performance and neither indicates nor guarantees future performance. The discussions of Fund investments represent the views of the Fund's managers at the time of this report and are subject to change without notice. References to individual securities are for informational purposes only and should not be construed as recommendations to purchase or sell individual securities. While the Fund's managers believe that the Fund's holdings are value stocks, there can be no assurance that others will consider them as such. Further, investing in value stocks presents the risk that value stocks may fall out of favor with investors and underperform growth stocks during given periods.
Portfolio composition will change due to ongoing management of the Fund.
The Russell 2500 Index is an unmanaged index comprised of the 2,500 smallest companies in the Russell 3000 Index.
FUND RISKS
Investments in mutual funds carry risks and investors may lose principal value. Stock markets are volatile and can decline significantly in response to adverse issuer, political, regulatory, market, or economic developments. The funds may purchase foreign securities which are subject to interest rate, currency exchange rate, economic and political risks: this may be enhanced when investing in emerging markets. Small and mid-cap stocks involve greater risks and they can fluctuate in price more than larger company stocks. Groups of stocks, such as value and growth, go in and out of favor which may cause certain funds to underperform other equity funds.
FORWARD LOOKING STATEMENT DISCLOSURE
As mutual fund managers, one of our responsibilities is to communicate with shareholders in an open and direct manner. Insofar as some of our opinions and comments in our letters to shareholders are based on our current expectations, they are considered "forward-looking statements" which may or may not prove to be accurate over the long term. While we believe we have a reasonable basis for our comments and we have confidence in our opinions, actual results may differ materially from those we anticipate. You can identify forward-looking statements by words such as "believe," "expect," "may," "anticipate," and other similar expressions when discussing prospects for particular portfolio holdings and/or the markets, generally. We cannot, however, assure future results and disclaim any obligation to update or alter any forward-looking statements, whether as a result of new information, future events, or otherwise. Further, information provided in this report should not be construed as a recommendation to purchase or sell any particular security.
7
FPA CAPITAL FUND, INC.
PORTFOLIO SUMMARY
September 30, 2017
(Unaudited)
Common Stocks | | | | | | | 68.1 | % | |
Exploration & Production | | | 13.3 | % | | | | | |
Communications Equipment | | | 9.2 | % | | | | | |
Technology Distributors | | | 7.4 | % | | | | | |
Oil & Gas Services & Equipment | | | 7.0 | % | | | | | |
Computer Hardware & Storage | | | 6.0 | % | | | | | |
Airlines | | | 3.9 | % | | | | | |
Publishing & Broadcasting | | | 3.9 | % | | | | | |
Other Common Stocks | | | 3.9 | % | | | | | |
Semiconductor Manufacturing | | | 2.8 | % | | | | | |
Consumer Goods — Rental | | | 2.7 | % | | | | | |
Information Technology Services | | | 2.4 | % | | | | | |
Auto Parts | | | 1.8 | % | | | | | |
Agricultural Machinery | | | 1.7 | % | | | | | |
Specialty Apparel Stores | | | 1.2 | % | | | | | |
Diversified Financial Services | | | 0.9 | % | | | | | |
Bonds & Debentures | | | | | | | 30.4 | % | |
Short-term Investments | | | | | | | 1.5 | % | |
Other Assets And Liabilities, Net | | | | | | | 0.0 | % | |
Net Assets | | | | | 100.0 | % | |
8
FPA CAPITAL FUND, INC.
PORTFOLIO OF INVESTMENTS
September 30, 2017
(Unaudited)
COMMON STOCKS | | Shares | | Fair Value | |
EXPLORATION & PRODUCTION — 13.3% | |
Cimarex Energy Co. | | | 215,080 | | | $ | 24,448,144 | | |
Noble Energy, Inc. | | | 825,830 | | | | 23,420,539 | | |
SM Energy Co. | | | 876,610 | | | | 15,551,061 | | |
| | | $ | 63,419,744 | | |
COMMUNICATIONS EQUIPMENT — 9.2% | |
ARRIS International plc* | | | 1,076,170 | | | $ | 30,660,083 | | |
InterDigital, Inc. | | | 179,440 | | | | 13,233,700 | | |
| | | $ | 43,893,783 | | |
TECHNOLOGY DISTRIBUTORS — 7.4% | |
Arrow Electronics, Inc.* | | | 168,190 | | | $ | 13,524,158 | | |
Avnet, Inc. | | | 552,350 | | | | 21,707,355 | | |
| | | $ | 35,231,513 | | |
OIL & GAS SERVICES & EQUIPMENT —7 .0% | |
Helmerich & Payne, Inc. | | | 307,447 | | | $ | 16,021,063 | | |
Patterson-UTI Energy, Inc. | | | 822,510 | | | | 17,223,360 | | |
| | | $ | 33,244,423 | | |
COMPUTER HARDWARE & STORAGE — 6.0% | |
Western Digital Corporation | | | 331,340 | | | $ | 28,627,776 | | |
AIRLINES — 3.9% | |
Allegiant Travel Co. | | | 141,674 | | | $ | 18,658,466 | | |
PUBLISHING & BROADCASTING — 3.9% | |
Houghton Mifflin Harcourt Co.* | | | 1,531,847 | | | $ | 18,458,756 | | |
SEMICONDUCTOR MANUFACTURING — 2.8% | |
Veeco Instruments, Inc.* | | | 630,694 | | | $ | 13,496,852 | | |
CONSUMER GOODS — RENTAL — 2.7% | |
Aaron's, Inc. | | | 295,569 | | | $ | 12,895,675 | | |
INFORMATION TECHNOLOGY SERVICES — 2.4% | |
Cubic Corporation | | | 226,289 | | | $ | 11,540,739 | | |
AUTO PARTS — 1.8% | |
Dana, Inc. | | | 298,784 | | | $ | 8,354,001 | | |
9
FPA CAPITAL FUND, INC.
PORTFOLIO OF INVESTMENTS (Continued)
September 30, 2017
(Unaudited)
COMMON STOCKS — Continued | | Shares or
Principal
Amount | | Fair Value | |
AGRICULTURAL MACHINERY — 1.7% | |
AGCO Corporation | | | 109,720 | | | $ | 8,094,044 | | |
SPECIALTY APPAREL STORES — 1.2% | |
Foot Locker, Inc. | | | 165,832 | | | $ | 5,840,603 | | |
DIVERSIFIED FINANCIAL SERVICES — 0.9% | |
Federated Investors, Inc. (Class B) | | | 139,440 | | | $ | 4,141,368 | | |
OTHER COMMON STOCKS — 3.9% | | $ | 18,440,149 | | |
| TOTAL COMMON STOCKS — 68.1% (Cost $258,427,166) | | $ | 324,337,892 | | |
BONDS & DEBENTURES | |
U.S. TREASURIES — 30.4% | |
U.S. Treasury Bills — 1.07% 03/01/2018@@@ | | $ | 40,000,000 | | | $ | 39,815,020 | | |
U.S. Treasury Notes — 2.25% 11/30/2017 | | | 15,000,000 | | | | 15,026,367 | | |
U.S. Treasury Notes — 1.00% 12/15/2017 | | | 50,000,000 | | | | 49,997,070 | | |
U.S. Treasury Notes — 3.50% 02/15/2018 | | | 15,000,000 | | | | 15,127,734 | | |
U.S. Treasury Notes — 0.875% 05/31/2018 | | | 25,000,000 | | | | 24,935,547 | | |
| TOTAL U.S. TREASURIES (Cost $145,093,969) | | $ | 144,901,738 | | |
| TOTAL BONDS & DEBENTURES — 30.4% (Cost $145,093,969) | | $ | 144,901,738 | | |
| TOTAL INVESTMENT SECURITIES — 98.5% (Cost $403,521,135) | | $ | 469,239,630 | | |
10
FPA CAPITAL FUND, INC.
PORTFOLIO OF INVESTMENTS (Continued)
September 30, 2017
(Unaudited)
SHORT-TERM INVESTMENTS | | Principal
Amount | | Fair Value | |
State Street Bank Repurchase Agreement — 0.12% 10/2/2017
(Dated 09/29/2017, repurchase price of $7,068,071, collateralized by
$7,105,000 principal amount U.S. Treasury Notes —
2.25% 2024, fair value $7,213,806) | | $ | 7,068,000 | | | $ | 7,068,000 | | |
| TOTAL SHORT-TERM INVESTMENTS — 1.5% (Cost $7,068,000) | | | | $ | 7,068,000 | | |
| TOTAL INVESTMENTS — 100.0% (Cost $410,589,135) | | $ | 476,307,630 | | |
Other Assets and Liabilities, net — 0.0% | | | | | 187,174 | | |
NET ASSETS — 100.0% | | $ | 476,494,804 | | |
* Non-income producing security.
@@@ Zero coupon bond. Coupon amount represents effective yield to maturity.
As permitted by U.S. Securities and Exchange Commission regulations, "Other" Common Stocks include holdings in their first year of acquisition that have not previously been publicly disclosed.
See notes to financial statements.
11
FPA CAPITAL FUND, INC.
STATEMENT OF ASSETS AND LIABILITIES
September 30, 2017
(Unaudited)
ASSETS | |
Investment securities — at fair value (identified cost $403,521,135) | | $ | 469,239,630 | | |
Short-term investments — at amortized cost (maturities 60 days or less) | | | 7,068,000 | | |
Cash | | | 389 | | |
Due from broker — OTC derivatives collateral | | | 250,000 | | |
Receivable for: | |
Dividends and interest | | | 583,747 | | |
Capital Stock sold | | | 197,833 | | |
Prepaid expenses and other assets | | | 795 | | |
Total assets | | | 477,340,394 | | |
LIABILITIES | |
Payable for: | |
Capital Stock repurchased | | | 328,709 | | |
Advisory fees | | | 258,413 | | |
Investment securities purchased | | | 72,581 | | |
Accrued expenses and other liabilities | | | 185,887 | | |
Total liabilities | | | 845,590 | | |
NET ASSETS | | $ | 476,494,804 | | |
SUMMARY OF SHAREHOLDERS' EQUITY | |
Capital Stock — par value $0.01 per share; authorized 100,000,000 shares;
outstanding 14,134,427 shares | | $ | 141,344 | | |
Additional Paid-in Capital | | | 342,111,316 | | |
Undistributed net realized gain | | | 68,233,431 | | |
Undistributed net investment income | | | 290,218 | | |
Unrealized appreciation of investments | | | 65,718,495 | | |
NET ASSETS | | $ | 476,494,804 | | |
NET ASSET VALUE | |
Offering and redemption price per share | | $ | 33.71 | | |
See notes to financial statements.
12
FPA CAPITAL FUND, INC.
STATEMENT OF OPERATIONS
For the Six Months Ended September 30, 2017
(Unaudited)
INVESTMENT INCOME | |
Dividends | | $ | 1,871,632 | | |
Interest | | | 996,055 | | |
Total investment income | | | 2,867,687 | | |
EXPENSES | |
Advisory fees | | | 2,030,333 | | |
Transfer agent fees and expenses | | | 194,821 | | |
Legal fees | | | 100,567 | | |
Director fees and expenses | | | 87,731 | | |
Reports to shareholders | | | 61,271 | | |
Audit and tax services fees | | | 26,074 | | |
Administrative services fees | | | 21,336 | | |
Filing fees | | | 21,225 | | |
Professional fees | | | 19,276 | | |
Custodian fees | | | 11,403 | | |
Other | | | 3,432 | | |
Total expenses | | | 2,577,469 | | |
Net expenses | | | 2,577,469 | | |
Net investment income | | | 290,218 | | |
NET REALIZED AND UNREALIZED GAIN (LOSS) | |
Net realized gain (loss) on: | |
Investments | | | 73,199,636 | | |
Written Options | | | 152,818 | | |
Net change in unrealized appreciation (depreciation) of: | |
Investments | | | (94,842,468 | ) | |
Net realized and unrealized loss | | | (21,490,014 | ) | |
NET DECREASE IN NET ASSETS RESULTING FROM OPERATIONS | | $ | (21,199,796 | ) | |
See notes to financial statements.
13
FPA CAPITAL FUND, INC.
STATEMENTS OF CHANGES IN NET ASSETS
| | | Six Months Ended
September 30, 2017
(Unaudited) | | Year Ended
March 31, 2017 | |
INCREASE (DECREASE) IN NET ASSETS | |
Operations: | |
Net investment income | | $ | 290,218 | | | $ | 1,099,830 | | |
Net realized gain | | | 73,352,454 | | | | 57,140,480 | | |
Net change in unrealized appreciation (depreciation) | | | (94,842,468 | ) | | | 73,480,801 | | |
Net increase (decrease) in net assets resulting
from operations | | | (21,199,796 | ) | | | 131,721,111 | | |
Distributions to shareholders from: | |
Net investment income | | | — | | | | (2,253,045 | ) | |
Net realized capital gains | | | (24,352,698 | ) | | | (39,457,798 | ) | |
Total distributions | | | (24,352,698 | ) | | | (41,710,843 | ) | |
Capital Stock transactions: | |
Proceeds from Capital Stock sold | | | 11,627,941 | | | | 61,491,321 | | |
Proceeds from shares issued to shareholders upon reinvestment of
dividends and distributions | | | 21,393,932 | | | | 37,996,105 | | |
Cost of Capital Stock repurchased | | | (300,415,916 | )* | | | (159,522,908 | )* | |
Net decrease from Capital Stock transactions | | | (267,394,043 | ) | | | (60,035,482 | ) | |
Total change in net assets | | | (312,946,537 | ) | | | 29,974,786 | | |
NET ASSETS | |
Beginning of period | | | 789,441,341 | | | | 759,466,555 | | |
End of period | | $ | 476,494,804 | | | $ | 789,441,341 | | |
CHANGE IN CAPITAL STOCK OUTSTANDING | |
Shares of Capital Stock sold | | | 327,468 | | | | 1,697,828 | | |
Shares issued to shareholders upon reinvestment of
dividends and distributions | | | 618,132 | | | | 1,041,182 | | |
Shares of Capital Stock repurchased | | | (8,503,867 | ) | | | (4,481,940 | ) | |
Change in Capital Stock outstanding | | | (7,558,267 | ) | | | (1,742,930 | ) | |
* Net of redemption fees of $36,394 and $30,164 for the period ended September 30, 2017 and year ended March 31, 2017, respectively.
See notes to financial statements.
14
FPA CAPITAL FUND, INC.
FINANCIAL HIGHLIGHTS
Selected Data for Each Share of Capital Stock Outstanding Throughout Each Period
| | | Six
Months
Ended
September 30,
2017 | | Year ended March 31 | |
| | | (Unaudited) | | 2017 | | 2016 | | 2015 | | 2014 | | 2013 | |
Per share operating performance: | |
Net asset value at beginning of period | | $ | 36.39 | | | $ | 32.41 | | | $ | 37.66 | | | $ | 47.46 | | | $ | 45.60 | | | $ | 45.11 | | |
Income from investment operations: | |
Net investment income (loss)* | | | 0.02 | | | | 0.05 | | | | 0.12 | | | | 0.03 | | | | (0.03 | ) | | | 0.05 | | |
Net realized and unrealized gain
(loss) on investment securities | | | (1.15 | ) | | | 5.80 | | | | (4.92 | ) | | | (5.02 | ) | | | 7.90 | | | | 4.37 | | |
| Total from investment operations | | | (1.13 | ) | | | 5.85 | | | | (4.80 | ) | | | (4.99 | ) | | | 7.87 | | | | 4.42 | | |
Less distributions: | |
Dividends from net investment
income | | | — | | | | (0.10 | ) | | | (0.12 | ) | | | — | | | | — | | | | (0.07 | ) | |
Distributions from net realized
capital gains | | | (1.55 | ) | | | (1.77 | ) | | | (0.33 | ) | | | (4.81 | ) | | | (6.01 | ) | | | (3.86 | ) | |
| Total distributions | | | (1.55 | ) | | | (1.87 | ) | | | (0.45 | ) | | | (4.81 | ) | | | (6.01 | ) | | | (3.93 | ) | |
Redemption fees | | | — | ** | | | — | ** | | | — | ** | | | — | ** | | | — | ** | | | — | ** | |
Net asset value at end of period | | $ | 33.71 | | | $ | 36.39 | | | $ | 32.41 | | | $ | 37.66 | | | $ | 47.46 | | | $ | 45.60 | | |
Total investment return*** | | | (3.22 | )% | | | 18.09 | % | | | (12.74 | )% | | | (11.49 | )% | | | 18.99 | % | | | 10.64 | % | |
Ratios/supplemental data: | |
Net assets, end of period (in $000's) | | $ | 476,495 | | | $ | 789,441 | | | $ | 759,467 | | | $ | 1,076,477 | | | $ | 1,372,336 | | | $ | 1,273,822 | | |
Ratio of expenses to average
net assets | | | 0.84 | %† | | | 0.80 | % | | | 0.77 | % | | | 0.83 | % | | | 0.83 | % | | | 0.83 | % | |
Ratio of net investment income
(loss) to average net assets | | | 0.09 | %† | | | 0.14 | % | | | 0.34 | % | | | 0.08 | % | | | (0.07 | )% | | | 0.12 | % | |
Portfolio turnover rate | | | 64 | %† | | | 23 | % | | | 45 | % | | | 38 | % | | | 17 | % | | | 10 | % | |
* Per share amount is based on average shares outstanding.
** Rounds to less than $0.01 per share.
*** Return is based on net asset value per share, adjusted for reinvestment of distributions, and does not reflect deduction of the sales charge.
† Annualized.
See notes to financial statements.
15
FPA CAPITAL FUND, INC.
NOTES TO FINANCIAL STATEMENTS
September 30, 2017
(Unaudited)
NOTE 1 — Significant Accounting Policies
FPA Capital Fund, Inc. (the "Fund") is registered under the Investment Company Act of 1940, as a diversified, open-end investment company. The Fund's primary investment objective is long-term capital growth. Current income is a factor, but a secondary consideration. The Fund qualifies as an investment company pursuant to Financial Accounting Standard Board (FASB) Accounting Standards Codification (ASC) No. 946, Financial Services — Investment Companies. The following is a summary of significant accounting policies consistently followed by the Fund in the preparation of its financial statements.
A. Security Valuation
The Fund's investments are reported at fair value as defined by accounting principles generally accepted in the United States of America, ("U.S. GAAP"). The Fund generally determines its net asset value as of approximately 4:00 p.m. New York time each day the New York Stock Exchange is open. Further discussion of valuation methods, inputs and classifications can be found under Disclosure of Fair Value Measurements.
B. Securities Transactions and Related Investment Income
Securities transactions are accounted for on the date the securities are purchased or sold. Dividend income and distributions to shareholders are recorded on the ex-dividend date. Interest income and expenses are recorded on an accrual basis.
C. Use of Estimates
The preparation of the financial statements in accordance with U.S. GAAP requires management to make estimates and assumptions that affect the amounts reported. Actual results could differ from those estimates.
D. Recent Accounting Pronouncements
In March 2017, FASB issued Accounting Standards Update (ASU) No. 2017-08, Receivables — Nonrefundable Fees and Other Costs (Subtopic 310-20). The amendments in this update shorten the amortization period for certain callable debt securities held at a premium. Specifically, the amendments require the premium to be amortized to the earliest call date. The amendments do not require an accounting change for securities held at a discount; the discount continues to be amortized to maturity. For public entities this update will be effective for fiscal years beginning after December 15, 2018, and for interim periods within those fiscal years. The Adviser is currently evaluating the impact of this new guidance on the Fund's financial statements.
NOTE 2 — Risk Considerations
Investing in the Fund may involve certain risks including, but not limited to, those described below.
Market Risk: Because the values of the Fund's investments will fluctuate with market conditions, so will the value of your investment in the Fund. You could lose money on your investment in the Fund or the Fund could underperform other investments.
Common Stocks and Other Securities: The prices of common stocks and other securities held by the Fund may decline in response to certain events taking place around the world, including; those directly involving companies whose securities are owned by the Fund; conditions affecting the general economy; overall market changes; local, regional or global political, social or economic instability; and currency, interest rate and commodity price fluctuations. In addition, the Adviser's emphasis on a value-oriented investment approach
16
FPA CAPITAL FUND, INC.
NOTES TO FINANCIAL STATEMENTS
Continued
generally results in the Fund's portfolio being invested primarily in medium or smaller sized companies. Smaller companies may be subject to a greater degree of change in earnings and business prospects than larger, more established companies, and smaller companies are often more reliant on key products or personnel than larger companies. Also, securities of smaller companies are traded in lower volumes than those issued by larger companies and may be more volatile than those of larger companies. In light of these characteristics of smaller companies and their securities, the Fund may be subjected to greater risk than that assumed when investing in the equity securities of larger companies.
Covered Call Options: In an effort to increase potential income, the Fund may write (i.e. sell) covered call options listed on a national securities exchange. When the Fund writes a listed call option, the purchaser has the right to buy a security from the Fund at a fixed exercise price any time before the option contract expires, regardless of changes in the market price of the underlying security. The Fund writes options only on securities it owns (covered options) and must retain ownership of the underlying security while the option is outstanding. Until the option expires, the Fund cannot profit from a rise in the market price of the underlying security over the exercise price, except insofar as the premium which the Fund receives, net of commissions, represents a profit. The premium paid to the Fund is the consideration for undertaking this obligation.
If a covered call option written by the Fund expires unexercised, the Fund realizes a capital gain on the expiration date equal to the premium received at the time the option was written. Prior to the earlier of exercise or expiration, an option may be closed out by an offsetting purchase of an option of the same series (type, underlying security, exercise price and expiration). There can be no assurance, however, that a closing purchase transaction can be effected when the Fund desires. The Fund will realize a capital gain from a closing purchase transaction if the cost of the closing option is less than the premium received from writing the option, or a capital loss if the cost of the closing option is more than the premium received from writing the option.
Repurchase Agreements: Repurchase agreements permit the Fund to maintain liquidity and earn income over periods of time as short as overnight. Repurchase agreements held by the Fund are fully collateralized by U.S. Government securities, or securities issued by U.S. Government agencies, or securities that are within the three highest credit categories assigned by established rating agencies (Aaa, Aa, or A by Moody's or AAA, AA or A by Standard & Poor's) or, if not rated by Moody's or Standard & Poor's, are of equivalent investment quality as determined by the Adviser. Such collateral is in the possession of the Fund's custodian. The collateral is evaluated daily to ensure its market value equals or exceeds the current market value of the repurchase agreements including accrued interest. In the event of default on the obligation to repurchase, the Fund has the right to liquidate the collateral and apply the proceeds in satisfaction of the obligation.
The Fund may enter into repurchase agreements, under the terms of a Master Repurchase Agreement ("MRA"). The MRA permits the Fund, under certain circumstances including an event of default (such as bankruptcy or insolvency), to offset payables and/or receivables under the MRA with collateral held and/or posted to the counterparty and create one single net payment due to or from the Fund. However, bankruptcy or insolvency laws of a particular jurisdiction may impose restrictions on or prohibitions against such a right of offset in the event of a MRA counterparty's bankruptcy or insolvency. Pursuant to the terms of the MRA, the Fund receives securities as collateral with a market value in excess of the repurchase price to be received by the Fund upon the maturity of the repurchase transaction. Upon a bankruptcy or insolvency of the MRA counterparty, the Fund recognizes a liability with respect to such excess collateral to reflect the Fund's obligation under bankruptcy law to return the excess to the counterparty. Repurchase agreements outstanding at the end of the period are listed in the Fund's Portfolio of Investments.
17
FPA CAPITAL FUND, INC.
NOTES TO FINANCIAL STATEMENTS
Continued
NOTE 3 — Purchases and Sales of Investment Securities
Cost of purchases of investment securities (excluding short-term investments) aggregated $ 141,808,619 for the period ended September 30, 2017. The proceeds and cost of securities sold resulting in net realized gains of $27,794,957 aggregated $ 132,963,111 and $105,168,154, respectively, for the period ended September 30, 2017. Realized gains or losses are based on the specific identification method. During the period ended September 30, 2017, redemptions in-kind aggregated $173,706,107 resulting in net realized gain of $100,994,593.
NOTE 4 — Federal Income Tax
No provision for federal income tax is required because the Fund has elected to be taxed as a "regulated investment company" under the Internal Revenue Code (the "Code") and intends to maintain this qualification and to distribute each year to its shareholders, in accordance with the minimum distribution requirements of the Code, its taxable net investment income and taxable net realized gains on investments.
The cost of investment securities held at September 30, 2017, was $404,921,911 for federal income tax purposes. Gross unrealized appreciation and depreciation for all investments (excluding short-term investments) at September 30, 2017, for federal income tax purposes was $75,864,186 and $11,546,467, respectively resulting in net unrealized appreciation of $ 64,317,719. The Fund recognizes interest and penalties, if any, related to unrecognized tax benefits as income tax expense in the Statement of Operations. During the year, the Fund did not incur any interest or penalties. The Fund is not subject to examination by U.S. federal tax authorities for years ended on or before March 31, 2013 or by state tax authorities for years ended on or before March 31, 2012.
NOTE 5 — Advisory Fees and Other Affiliated Transactions
Pursuant to an Investment Advisory Agreement, advisory fees were paid by the Fund to First Pacific Advisors, LLC (the "Adviser"). Under the terms of this Agreement, the Fund pays the Adviser a monthly fee calculated at the annual rate of 0.75% of the first $50 million of the Fund's average daily net assets and 0.65% of the average daily net assets in excess of $50 million. The Agreement obligates the Adviser to reduce its fee to the extent necessary to reimburse the Fund for any annual expenses (exclusive of interest, taxes, the cost of any supplemental statistical and research information, and extraordinary expenses such as litigation) in excess of 11/2% of the first $30 million and 1% of the remaining average net assets of the Fund for the year.
For the period ended September 30, 2017, the Fund paid aggregate fees and expenses of $87,731 to all Directors who are not affiliated persons of the Adviser. Certain officers of the Fund are also officers of the Adviser.
NOTE 6 — Redemption Fees
Effective June 26, 2017, the Board of Directors of the Fund approved the removal of the 2% redemption fee. Prior to that date, a redemption fee of 2% applied to redemptions within 90 days of purchase. For the period ended September 30, 2017, the Fund collected $36,394 in redemption fees. The impact of these fees is less than $0.01 per share.
NOTE 7 — Disclosure of Fair Value Measurements
The Fund uses the following methods and inputs to establish the fair value of its assets and liabilities. Use of particular methods and inputs may vary over time based on availability and relevance as market and economic conditions evolve.
18
FPA CAPITAL FUND, INC.
NOTES TO FINANCIAL STATEMENTS
Continued
Equity securities are generally valued each day at the official closing price of, or the last reported sale price on, the exchange or market on which such securities principally are traded, as of the close of business on that day. If there have been no sales that day, equity securities are generally valued at the last available bid price. Securities that are unlisted and fixed-income and convertible securities listed on a national securities exchange for which the over-the-counter ("OTC") market more accurately reflects the securities' value in the judgment of the Fund's officers, are valued at the most recent bid price. Short-term corporate notes with maturities of 60 days or less at the time of purchase are valued at amortized cost.
Securities for which representative market quotations are not readily available or are considered unreliable by the Adviser are valued as determined in good faith under procedures adopted by the authority of the Fund's Board of Directors. Various inputs may be reviewed in order to make a good faith determination of a security's value. These inputs include, but are not limited to, the type and cost of the security; contractual or legal restrictions on resale of the security; relevant financial or business developments of the issuer; actively traded similar or related securities; conversion or exchange rights on the security; related corporate actions; significant events occurring after the close of trading in the security; and changes in overall market conditions. Fair valuations and valuations of investments that are not actively trading involve judgment and may differ materially from valuations of investments that would have been used had greater market activity occurred.
The Fund classifies its assets based on three valuation methodologies. Level 1 values are based on quoted market prices in active markets for identical assets. Level 2 values are based on significant observable market inputs, such as quoted prices for similar assets and quoted prices in inactive markets or other market observable inputs as noted above including spreads, cash flows, financial performance, prepayments, defaults, collateral, credit enhancements, and interest rate volatility. Level 3 values are based on significant unobservable inputs that reflect the Fund's determination of assumptions that market participants might reasonably use in valuing the assets. The valuation levels are not necessarily an indication of the risk associated with investing in those securities. The valuation levels are not necessarily an indication of the risk associated with investing in those securities. The following table presents the valuation levels of the Fund's investments as of September 30, 2017:
Investments | | Level 1 | | Level 2 | | Level 3 | | Total | |
Common Stocks | |
Exploration & Production | | $ | 63,419,744 | | | | — | | | | — | | | $ | 63,419,744 | | |
Communications Equipment | | | 43,893,783 | | | | — | | | | — | | | | 43,893,783 | | |
Technology Distributors | | | 35,231,513 | | | | — | | | | — | | | | 35,231,513 | | |
Oil & Gas Services & Equipment | | | 33,244,423 | | | | — | | | | — | | | | 33,244,423 | | |
Computer Hardware & Storage | | | 28,627,776 | | | | — | | | | — | | | | 28,627,776 | | |
Airlines | | | 18,658,466 | | | | — | | | | — | | | | 18,658,466 | | |
Publishing & Broadcasting | | | 18,458,756 | | | | — | | | | — | | | | 18,458,756 | | |
Semiconductor Manufacturing | | | 13,496,852 | | | | — | | | | — | | | | 13,496,852 | | |
Consumer Goods — Rental | | | 12,895,675 | | | | — | | | | — | | | | 12,895,675 | | |
Information Technology Services | | | 11,540,739 | | | | — | | | | — | | | | 11,540,739 | | |
Auto Parts | | | 8,354,001 | | | | — | | | | — | | | | 8,354,001 | | |
19
FPA CAPITAL FUND, INC.
NOTES TO FINANCIAL STATEMENTS
Continued
Investments | | Level 1 | | Level 2 | | Level 3 | | Total | |
Agricultural Machinery | | $ | 8,094,044 | | | | — | | | | — | | | $ | 8,094,044 | | |
Specialty Apparel Stores | | | 5,840,603 | | | | — | | | | — | | | | 5,840,603 | | |
Investment Companies | | | 4,141,368 | | | | — | | | | — | | | | 4,141,368 | | |
Other Common Stocks | | | 18,440,149 | | | | — | | | | — | | | | 18,440,149 | | |
U.S. Treasuries | | | — | | | $ | 144,901,738 | | | | — | | | | 144,901,738 | | |
Short-Term Investment | | | — | | | | 7,068,000 | | | | — | | | | 7,068,000 | | |
| | | $ | 324,337,892 | | | $ | 151,969,738 | | | | — | | | $ | 476,307,630 | | |
Transfers of investments between different levels of the fair value hierarchy are recorded at market value as of the end of the reporting period. There were no transfers between Levels 1, 2, or 3 during the period ended September 30, 2017.
NOTE 8 — Collateral Requirements
FASB Accounting Standards Update No. 2011-11, Disclosures about Offsetting Assets and Liabilities, requires disclosures to make financial statements that are prepared under U.S. GAAP more comparable to those prepared under International Financial Reporting Standards. Under this guidance the Fund discloses both gross and net information about instruments and transactions eligible for offset such as instruments and transactions subject to an agreement similar to a master netting arrangement. In addition, the Fund discloses collateral received and posted in connection with master netting agreements or similar arrangements.
The following table presents the Fund's repurchase agreements by counterparty net of amounts available for offset under an ISDA Master agreement or similar agreements and net of the related collateral received or pledged by the Fund as of September 30, 2017, are as follows:
Counterparty | | Gross Assets
in the Statement of
Assets and Liabilities | | Collateral
Received | | Assets (Liabilities)
Available for Offset | | Net Amount
of Assets* | |
State Street Bank
and Trust Company | | $ | 7,068,000 | | | $ | 7,068,000 | ** | | | — | | | | — | | |
* Represents the net amount receivable from the counterparty in the event of default.
** Collateral with a value of $7,213,806 has been received in connection with a master repurchase agreement. Excess of collateral received from the individual master repurchase agreement is not shown for financial reporting purpose.
20
FPA CAPITAL FUND, INC.
SHAREHOLDER EXPENSE EXAMPLE
September 30, 2017 (Unaudited)
Fund Expenses
Mutual fund shareholders generally incur two types of costs: (1) transaction costs, and (2) ongoing costs, including advisory and administrative fees; shareholder service fees; and other Fund expenses. The Example is intended to help you understand your ongoing costs (in dollars) of investing in the Fund and to compare these costs with the ongoing costs of investing in other mutual funds. The Example is based on an investment of $1,000 invested at the beginning of the year and held for the entire year.
Actual Expenses
The information in the table under the heading "Actual Performance" provides information about actual account values and actual expenses. You may use the information in this column, together with the amount you invested, to estimate the expenses that you paid over the period. Simply divide your account value by $1,000 (for example, an $8,600 account value divided by $1,000 = 8.6), then multiply the result by the number in the first column in the row entitled "Expenses Paid During Period" to estimate the expenses you paid on your account during this period.
Hypothetical Example for Comparison Purposes
The information in the table under the heading "Hypothetical Performance (5% return before expenses)" provides information about hypothetical account values and hypothetical expenses based on the Fund's actual expense ratio and an assumed rate of return of 5% per year before expenses, which is not the Fund's actual return. The hypothetical account values and expenses may not be used to estimate the actual ending account balance or expenses you paid for the period. You may use this information to compare the ongoing costs of investing in the Fund
and other funds. To do so, compare this 5% hypothetical example with the 5% hypothetical examples that appear in the shareholder reports of other funds.
Please note that the expenses shown in the table are meant to highlight your ongoing costs only and do not reflect any transactional costs. Therefore, the information under the heading "Hypothetical Performance (5% return before expenses)" is useful in comparing ongoing costs only, and will not help you determine the relative total costs of owning different funds. In addition, if these transactional costs were included, your costs would have been higher. Even though the Fund does not charge transaction fees, if you purchase shares through a broker, the broker may charge you a fee. You should evaluate other mutual funds' transaction fees and any applicable broker fees to assess the total cost of ownership for comparison purposes.
| | | Actual
Performance | | Hypothetical
Performance
(5% return
before
expenses) | |
Beginning Account Value
March 31, 2017 | | $ | 1,000.00 | | | $ | 1,000.00 | | |
Ending Account Value
September 30, 2017 | | $ | 967.80 | | | $ | 1,020.86 | | |
Expenses Paid During
Period* | | $ | 4.14 | | | $ | 4.26 | | |
* Expenses are equal to the Fund's annualized expense ratio of 0.84%, multiplied by the average account value over the period and prorated for the six-months ended September 30, 2017 (183/365 days).
21
FPA CAPITAL FUND, INC.
APPROVAL OF INVESTMENT ADVISORY AGREEMENT
(Unaudited)
Approval of the Advisory Agreement. At a meeting of the Board of Directors held on August 14, 2017, the Directors approved the continuation of the advisory agreement between the Fund and the Adviser for an additional one-year period through September 30, 2018, on the recommendation of the Independent Directors, who met in executive session on August 14, 2017 prior to the Board meeting to review and discuss the proposed continuation of the advisory agreement. The following paragraphs summarize the material information and factors considered by the Board and the Independent Directors, as well as the Directors' conclusions relative to such factors.
Nature, Extent and Quality of Services. The Board and the Independent Directors considered information provided by the Adviser in response to their requests, as well as information provided throughout the year regarding the Adviser and its staffing in connection with the Fund, including the Fund's portfolio managers, the two analysts supporting the team, the scope of services supervised and provided by the Adviser, and additional portfolio supervision to be provided by the Adviser. The Board and the Independent Directors noted the experience, length of service and reputation of the Fund's portfolio managers: Dennis Bryan, who has served as portfolio manager of the Fund since November 2007 and Arik A. Ahitov, who has served as portfolio manager of the Fund since February 2014 and as an associate portfolio manager of the Fund from July 2013 to February 2014. They also noted that FPA had proposed a transition in the management of the Fund: Arik Ahitov will become the Fund's sole portfolio manager effective October 1, 2017, and Dennis Bryan will become a strategic adviser to Mr. Ahitov and the investment team. The Board and the Independent Directors concluded that the nature, extent and quality of services provided by the Adviser have benefited and should continue to benefit the Fund and its shareholders.
Investment Performance. The Board and the Independent Directors reviewed the overall investment performance of the Fund. The Directors also received information from an independent consultant, Morningstar, regarding the Fund's performance relative to a peer group of midcap core funds selected by Morningstar (the "Peer Group"). The Board and the Independent Directors noted that the Fund underperformed its Peer Group for the one-, three-, five- and 10-year periods ending March 31, 2017 and the Fund's benchmark, Russell 2000 Index, for the one-, three-, five- and 10-year period ended March 31, 2017. They also noted that Morningstar had given the Fund a "Neutral" Analyst Rating. The Board and the Independent Directors considered the Fund's investment results in light of the Fund's objectives and the Adviser's transition plan, and they concluded that the Adviser's continued management of the Fund should benefit the Fund and its shareholders.
Advisory Fees and Fund Expenses; Comparison with Peer Group and Institutional Fees. The Board and the Independent Directors considered information provided by the Adviser regarding the Fund's advisory fees and total expense levels. The Board and the Independent Directors reviewed comparative information regarding fees and expenses for the Peer Group. The Directors noted that the Fund's fees and expenses were at the lower end of the range for the Peer Group. The Board and the Independent Directors also noted that the overall expense ratio of the Fund was relatively low compared to the Peer Group. The Board and the Independent Directors considered the fees charged by the Adviser for advising institutional accounts and for sub-advising another mutual fund, and the Adviser's discussion of the differences between the services provided by the Adviser to the Fund and those provided by the Adviser to the sub-advised fund and institutional accounts. The Board and the Independent Directors concluded that the continued payment of advisory fees and expenses by the Fund to the Adviser was fair and reasonable and should continue to benefit the Fund and its shareholders.
Adviser Profitability and Costs. The Board and the Independent Directors considered information provided by the Adviser regarding the Adviser's costs in providing services to the Fund, the profitability of the Adviser and the benefits to the Adviser from its relationship to the Fund. They reviewed and considered the Adviser's
22
FPA CAPITAL FUND, INC.
APPROVAL OF INVESTMENT ADVISORY AGREEMENT
Continued (Unaudited)
representations regarding its assumptions and methods of allocating certain costs, such as personnel costs, which constitute the Adviser's largest operating cost, overhead and trading costs with respect to the provision of investment advisory services. The Independent Directors discussed with the Adviser the general process through which individuals' compensation is determined and then reviewed by the management committee of the Adviser, as well as the Adviser's methods for determining that the compensation levels are at appropriate levels to attract and retain the personnel necessary to provide high quality professional investment advice. In evaluating the Adviser's profitability, they excluded certain distribution and marketing-related expenses. The Board and the Independent Directors recognized that the Adviser is entitled under the law to earn a reasonable level of profits for the services that it provides to the Fund. The Board and the Independent Directors concluded that the Adviser's level of profitability from its relationship with the Fund did not indicate that the Adviser's compensation was unreasonable or excessive.
Economies of Scale and Sharing of Economies of Scale. The Board and the Independent Directors considered whether there have been economies of scale with respect to the management of the Fund, whether the Fund has appropriately benefited from any economies of scale, and whether the fee rate is reasonable in relation to the Fund's asset levels and any economies of scale that may exist. The Board and the Independent Directors considered the Adviser's representation that its internal costs of providing investment management services to the Fund have significantly increased in recent years as a result of a number of factors, including the Adviser's substantial investment in additional professional resources and staffing. The Board and the Independent Directors considered quantitative and qualitative information regarding the Adviser's representation that it has also made significant investments in: (1) the portfolio managers, analysts, traders and other investment personnel who assist with the management of the Fund; (2) new compliance, operations, and administrative personnel; (3) information technology, portfolio accounting and trading systems; and (4) office space, each of which enhances the quality of services provided to the Fund. The Board and the Independent Directors also considered that the Adviser had foregone the reimbursement for providing certain financial services that it had previously received from the Fund. The Board and the Independent Directors also considered the Adviser's willingness to close funds, including the Fund, to new investors when it believed that the Fund had limited capacity to grow or that it otherwise would benefit fund shareholders. The Board and the Independent Directors also noted that, even though the Fund is currently closed to new investors and it continues to experience outflows of investment capital, the Adviser has continued to make investments in personnel servicing the Fund.
The Independent Directors noted that the fee rate contained a breakpoint as the Fund's assets increased. They considered that many mutual funds have breakpoints in the advisory fee structure as a means by which to share in the benefits of potential economies of scale as a fund's assets grow. They also considered that not all funds have breakpoints in their fee structures and that breakpoints are not the exclusive means of sharing potential economies of scale. The Board and the Independent Directors considered the Adviser's statement that it believes that additional breakpoints would not be appropriate for the Fund at this time given the ongoing investments the Adviser is making in its business for the benefit of the Fund, uncertainties regarding the direction of the economy, rising inflation, increasing costs for personnel and systems, and the limited prospect for growth in the Fund's assets given that the Fund is still closed to new shareholders, all of which could negatively impact the profitability of the Adviser. The Board and the Independent Directors concluded that the Fund is benefitting from the ongoing investments made by the Adviser in its team of personnel serving the Fund and in the Adviser's service infrastructure, and that in light of these investments, additional breakpoints in the Fund's advisory fee structure were not warranted at current asset levels.
23
FPA CAPITAL FUND, INC.
APPROVAL OF INVESTMENT ADVISORY AGREEMENT
Continued (Unaudited)
Ancillary Benefits. The Board and the Independent Directors considered other actual and potential benefits to the Adviser from managing the Fund, including the acquisition and use of research services with commissions generated by the Fund, in concluding that the contractual advisory and other fees are fair and reasonable for the Fund. They noted that the Adviser does not have any affiliates that benefit from the Adviser's relationship to the Fund.
Conclusions. The Board and the Independent Directors determined that the Fund continues to benefit from the services of the Adviser's portfolio management and research team. In addition, the Board and the Independent Directors agreed that the Fund continues to receive high quality services from the Adviser. The Board and the Independent Directors concluded that the current advisory fee rate is reasonable and fair to the Fund and its shareholders in light of the nature and quality of the services provided by the Adviser and the Adviser's profitability and costs. The Board and the Independent Directors also noted their intention to continue monitoring the factors relevant to the Adviser's compensation, such as the performance of the Fund, changes in the Fund's asset levels, changes in portfolio management personnel and the cost and quality of the services provided by the Adviser to the Fund. On the basis of the foregoing, and without assigning particular weight to any single factor, none of which was dispositive, the Board and the Independent Directors concluded that it would be in the best interests of the Fund to continue to be advised and managed by the Adviser and determined to approve the continuation of the current Advisory Agreement for another one-year period through September 30, 2018.
24
FPA CAPITAL FUND, INC.
DIRECTOR AND OFFICER INFORMATION
(Unaudited)
Name, Address(1)
and Year of Birth | | Position(s)
With Fund
Years Served | | Principal Occupation(s)
During the Past 5 Years | | Portfolios in
Fund Complex
Overseen | | Other
Directorships
During the
Past 5 Years | |
Independent Directors
Allan M. Rudnick – 1940† | | Director and Chairman*
Years Served: 5 | | Private Investor. Formerly Co-Founder, Chief Executive Officer, Chairman and Chief Investment Officer of Kayne Anderson Rudnick Investment Management from 1989 to 2007. | | | 7 | | | | |
Sandra Brown – 1955† | | Director*
Years Served: 1 | | Consultant. Formerly CEO and President of Transamerica Financial Advisers, Inc., 1999 to 2009; President, Transamerica Securities Sales Corp. 1998 to 2009; VP, Bank of America Mutual Fund Administration 1990 to 1998. | | | 7 | | | | |
Mark L. Lipson – 1949† | | Director*
Years Served: 2 | | Consultant. ML2Advisors, LLC. Formerly Managing Director, Bessemer Trust (2007-2014) and US Trust (2003-2006); Founder, Chairman and CEO of the Northstar Mutual Funds (1993-2001). | | | 7 | | | | |
Alfred E. Osborne, Jr. – 1944† | | Director*
Years Served: 17 | | Senior Associate Dean of the John E. Anderson School of Management at UCLA. | | | 7 | | | Wedbush, Inc., Nuverra Environmental Solutions, Inc., and Kaiser Aluminun, Inc. | |
A. Robert Pisano – 1943† | | Director*
Years Served: 4 | | Consultant. Formerly President and Chief Operating Officer of the Motion Picture Association of America, Inc. from 2005 to 2011. | | | 7 | | | Entertainment Partners and Resources Global Professionals. | |
Patrick B. Purcell – 1943† | | Director*
Years Served: 11 | | Retired. Formerly Executive Vice President, Chief Financial and Administrative Officer of Paramount Pictures from 1983 to 1998. | | | 7 | | | | |
Interested Director(2)
J. Richard Atwood – 1960 | | Director* and President
Years Served: 20 | | Managing Partner of the Adviser. | | | 7 | | | | |
25
FPA CAPITAL FUND, INC.
DIRECTOR AND OFFICER INFORMATION
Continued (Unaudited)
Name, Address(1)
and Year of Birth | | Position(s)
With Fund
Years Served | | Principal Occupation(s)
During the Past 5 Years | | Portfolios in
Fund Complex
Overseen | | Other
Directorships
During the
Past 5 Years | |
Officers
Arik A. Ahitov – 1975 | | Portfolio Manager
Years Served: 4 | | Partner of the Adviser since 2015. Managing Director of the Adviser from 2013-2014 and Vice President of the Adviser from 2010 to 2013. | | | | | |
David C. Lebisky – 1972 | | Chief Compliance Officer
Years Served: <1 | | President of Lebisky Compliance Consulting LLC (since October 2015). Consultant, Duff & Phelps Compliance Consulting (since 2016). Senior Consultant, Freeh Group International Solutions, LLC (a global risk management firm) (since 2015). Formerly, Director of Regulatory Administration, Scotia Institutional Investments US, LP (2010 to 2014). | | | | | |
E. Lake Setzler – 1967 | | Treasurer
Years Served: 10 | | Senior Vice President and Controller of the Adviser. | | | | | |
Francine S. Hayes – 1967 | | Secretary
Years Served: 2 | | Vice President and Senior Counsel of State Street Bank and Trust Company | | | | | |
(1) The address for each Director and each Officer (except Ms. Hayes) is 11601 Wilshire Boulevard, Suite 1200, Los Angeles, California 90025. Ms. Hayes' address is State Street Bank and Trust Company, One Lincoln Street, Boston, Massachusetts 02111.
(2) "Interested person" within the meaning of the 1940 Act by virtue of his affiliation with the Fund's Adviser.
* Directors serve until their resignation, removal or retirement.
† Audit Committee member
The Statement of Additional Information includes additional information about the Directors and is available, without charge, upon request by calling (800) 982-4372.
26
FPA CAPITAL FUND, INC.
(Unaudited)
INVESTMENT ADVISER
First Pacific Advisors, LLC
11601 Wilshire Boulevard, Suite 1200
Los Angeles, CA 90025
TRANSFER & SHAREHOLDER
SERVICE AGENT
UMB Fund Services, Inc.
P.O. Box 2175
Milwaukee, WI 53201-2175
or
235 Galena Street
Milwaukee, WI 53212-3948
(800) 638-3060
CUSTODIAN AND ADMINISTRATOR
State Street Bank and Trust Company
Boston, Massachusetts
TICKER: FPPTX
CUSIP: 302539101
DISTRIBUTOR
UMB Distribution Services, LLC
235 Galena Street
Milwaukee, Wisconsin 53212-3948
LEGAL COUNSEL
Dechert LLP
San Francisco, California
INDEPENDENT REGISTERED PUBLIC ACCOUNTING FIRM
Deloitte & Touche LLP
Los Angeles, California
This report has been prepared for the information of shareholders of FPA CAPITAL FUND, INC., and is not authorized for distribution to prospective investors unless preceded or accompanied by an effective prospectus. The financial information included in this report has been taken from the records of the Fund without examination by independent auditors.
The Fund's complete proxy voting record for the 12 months ended June 30, 2017 is available without charge, upon request by calling (800) 982-4372 and on the SEC's website at www.sec.gov.
The Fund's schedule of portfolio holdings, filed the first and third quarter of the Fund's fiscal year on Form N-Q with the SEC, is available on the SEC's website at www.sec.gov. Form N-Q is available at the SEC's Public Reference Room in Washington, D.C., and information on the operations of the Public Reference Room may be obtained by calling (202) 551-8090. To obtain Form N-Q from the Fund, shareholders can call (800) 982-4372.
Additional information about the Fund is available online at www.fpafunds.com. This information includes, among other things, holdings, top sectors, and performance, and is updated on or about the 15th business day after the end of each quarter.
Item 2. Code of Ethics.
Not applicable to this semi-annual report.
Item 3. Audit Committee Financial Expert.
Not applicable to this semi-annual report.
Item 4. Principal Accountant Fees and Services.
Not applicable to this semi-annual report.
Item 5. Audit Committee of Listed Registrants.
Not applicable to this semi-annual report.
Item 6. Investments.
(a) Schedule of Investments is included as a part of the report to shareholders filed under Item 1 of this Form N-CSR.
(b) Not applicable.
Item 7. Disclosure of Proxy Voting Policies and Procedures for Closed-End Management Investment Companies.
Not applicable.
Item 8. Portfolio Managers of Closed-End Management Investment Companies.
Not applicable.
Item 9. Purchases of Equity Securities by Closed-End Management Investment Company and Affiliated Purchasers.
Not applicable.
Item 10. Submission of Matters to a Vote of Security Holders.
There have been no material changes to the procedures by which the shareholders may recommend nominees to the registrant’s board of directors.
Item 11. Controls and Procedures.
(a) The principal executive officer and principal financial officer of the registrant have concluded that the registrant’s disclosure controls and procedures (as defined in Rule 30a-3(c) under the Investment Company Act of 1940) are effective based on their evaluation of the disclosure controls and procedures as of a date within 90 days of the filing date of this report.
(b) There have been no significant changes in the registrant’s internal controls over financial reporting (as defined in Rule 30a-3(d) under the Investment Company Act of 1940) that occurred during the
registrant’s second fiscal quarter of the period covered by this report that have materially affected, or is reasonably likely to materially affect, the registrant’s internal controls over financial reporting.
Item 12. Disclosure of Securities Lending Activities for Closed-End Management Investment Companies.
Not applicable.
Item 13. Exhibits.
(a)(1) Not applicable.
(a)(2) The certifications required by Rule 30a-2(a) under the Investment Company Act of 1940 are attached hereto.
(a)(3) Not applicable.
(b) The certifications required by Rule 30a-2(b) under the Investment Company Act of 1940 and Section 906 of the Sarbanes-Oxley Act of 2002 are attached hereto.
SIGNATURES
Pursuant to the requirements of the Securities Exchange Act of 1934 and the Investment Company Act of 1940, the registrant has duly caused this report to be signed on its behalf by the undersigned, thereunto duly authorized.
FPA CAPITAL FUND, INC.
By: | /s/ J. Richard Atwood | |
| J. Richard Atwood | |
| President (principal executive officer) | |
| | |
Date: | December 4, 2017 | |
Pursuant to the requirements of the Securities Exchange Act of 1934 and the Investment Company Act of 1940, this report has been signed below by the following persons on behalf of the registrant and in the capacities and on the dates indicated.
By: | /s/ J. Richard Atwood | |
| J. Richard Atwood | |
| President (principal executive officer) | |
| | |
Date: | December 4, 2017 | |
By: | /s/ E. Lake Setzler III | |
| E. Lake Setzler III | |
| Treasurer (principal financial officer) | |
| | |
Date: | December 4, 2017 | |
