UNITED STATES
SECURITIES AND EXCHANGE COMMISSION
Washington, D.C. 20549
FORM N-CSR
CERTIFIED SHAREHOLDER REPORT OF REGISTERED
MANAGEMENT INVESTMENT COMPANIES
Investment Company Act file number | 811-1735 |
|
FPA NEW INCOME, INC. |
(Exact name of registrant as specified in charter) |
|
11400 WEST OLYMPIC BLVD., SUITE 1200, LOS ANGELES, CALIFORNIA | | 90064 |
(Address of principal executive offices) | | (Zip code) |
|
J. RICHARD ATWOOD,
11400 WEST OLYMPIC BLVD., SUITE 1200, LOS ANGELES, CALIFORNIA 90064 |
(Name and address of agent for service) |
|
Registrant’s telephone number, including area code: | 310-473-0225 | |
|
Date of fiscal year end: | SEPTEMBER 30 | |
|
Date of reporting period: | September 30, 2005 | |
| | | | | | | | |
Item 1. Report to Stockholders.
Annual Report

Distributor:
FPA FUND DISTRIBUTORS, INC.
11400 West Olympic Boulevard, Suite 1200
Los Angeles, California 90064
45236
FPA New Income, Inc.
September 30, 2005
LETTER TO SHAREHOLDERS
Dear Fellow Shareholders:
This Annual Report covers the fiscal year ended September 30, 2005. Your Fund's net asset value (NAV) per share closed at $11.04. During the fiscal year, your Fund distributed four income dividends totaling $0.40. There were no capital gains distributions.
The following table shows the average annual total return for several different periods ended September 30 for the Fund and comparative indices. The data quoted represents past performance, and an investment in the Fund may fluctuate so that an investor's shares, when redeemed, may be worth more or less than their original cost.
| | | Periods Ended September 30, 2005 | |
| | | 1 Year | | 5 Years | | 10 Years | | 15 Years | | 20 Years | |
FPA New Income,
Inc. (NAV) | | | 1.27 | %* | | | 6.09 | %* | | | 6.26 | %* | | | 8.08 | %* | | | 8.46 | %* | |
FPA New Income,
Inc. (Net of Sales
Charge) | | | -2.27 | %** | | | 5.33 | %** | | | 5.88 | %** | | | 7.82 | %** | | | 8.26 | %** | |
Lipper Corporate
Debt Funds A-Rated
Average | | | 2.61 | % | | | 6.14 | % | | | 5.92 | % | | | 7.51 | % | | | 8.04 | % | |
Lehman Brothers
Government/Credit
Index | | | 2.58 | % | | | 6.89 | % | | | 6.59 | % | | | 7.68 | % | | | 8.26 | % | |
The Fund's total rate of return for the fiscal year was 1.27%* versus 2.61% and 2.58% for the Lipper Corporate Debt Funds A-Rated Average and Lehman Brothers Government/Credit Index, respectively. For the second half of the fiscal year, the total returns were: FPA New Income, Inc., 0.55%*; Lipper Average, 2.01%; and the Lehman Brothers Index, 2.45%. Finally, on a calendar year-to-date basis, the total returns were: FPA New Income, Inc., 0.64%*; the Lipper Average 1.47%; and the Lehman Brothers Index, 1.76%.
Commentary
Your Fund's fiscal year-end performance relative to that of the Lehman Brothers Index and the Lipper Index is poor. On our website at www.fpafunds.com on August 2, we published the piece entitled, "Lousy Performance." In it you may read a fuller discussion as to the reasons for the recent poor performance by your Fund. In our opinion, we have taken the appropriate actions to remedy this situation. For those of you who have not read it, we discussed the three areas that hurt the Fund's performance during the quarter ended June 30. In that quarter, your Fund materially underperformed the bond market with a negative 0.36% total return versus the 3.44% return for the Lehman Index. Since these actions were taken, your Fund's performance has done a 180-degree reversal. For the quarter ended September 30, your F und had a total positive return of 0.91% while the Lehman Index experienced a negative 0.96% return.
Our improved performance is the direct result of reducing most of our remaining high-yield exposure and maintaining our extraordinarily short average portfolio duration. As of September 30, the portfolio's average duration was 0.53 years, a new low. We are continuing our "Buyer's Strike" that we wrote about in June 2003. We do not see any real value in long-term, high-quality fixed-income securities and the same goes for the high-yield sector. Until bond yields are materially higher, in all segments of the bond market, we anticipate maintaining our buyer's strike.
Since writing "Buyer's Strike," long-term yields have remained considerably lower than we would have expected. Over time we have asked ourselves whether we had missed anything. In prior letters, we have discussed several different possibilities, but one that stuck out to us was the effect of foreign capital inflows into the U.S. We felt this was not something we could reasonably forecast, and that these inflows were keeping yields lower than they otherwise might be. A Federal Reserve paper published in September entitled, "International Capital Flows and U.S. Interest Rates," by Francis E. Warnock and Veronica Cacdac Warnock, concluded that "large foreign purchases of U.S. bonds have contributed importantly to the low levels of U.S. interest rates observed over the past two years." Their model suggests that the ten-year Treasury yield could be as much as 150 basis points (there are 100 basis points in
* Does not reflect deduction of the sales charge which, if reflected, would reduce the performance shown.
** Reflects deduction of the maximum sales charge of 3.50% of the offering price.
1
a percentage point) higher than if these foreign purchases were not occurring. Given the potentially volatile characteristics of foreign capital flows, this risk, in our opinion, is not factored into the current level of bond yields and helps to explain your Fund's defensive positioning.
In the event that interest rates rise, your Fund's extraordinarily short portfolio duration helps because short-duration securities do not have the same degree of sensitivity as do longer-maturity securities. As an example, during the September quarter, Treasury bond yields rose, on average, 50 basis points between the maturities of two and five years, while the ten-year rose 41 basis points. This rise produced a zero total return (yield plus the change in value of the security) for the two-year bond while the ten-year experienced a negative 2.35% total return. Your Fund's duration, which is significantly shorter than a two-year security, allowed it to achieve a substantially better total return.
We are maintaining our vigilance against any unforeseen risks in the Fund's high-quality bonds. For example, we have been combing through our high-quality mortgage-backed bond segment. We found two suspicious-looking mortgaged-backed CMO (collateralized mortgage obligation) securities; in both, the underlying mortgage loans were of borrowers classified as Alternative-A. Alt-A borrowers are typically very high-quality borrowers, i.e., with high FICO scores, which lack some of the information required, because they are owner/operators of a business, or the loan size is too large for a conventional loan that would qualify for one of the government mortgage agency programs; therefore, they are securitized via CMOs. We hold many of these securities and virtually all of them have had excellent loan performance. Two securitzations, originated in January of this year, caught our attention. With less than six months of seasoning, we discovered an elevated level of non-performing loans as well as some initial bankruptcy filings. Our discussions with the underwriters did not alleviate our anxiety. We did not expect this occurrence since similar types of CMOs that we own, originated in 2002 and 2003, are not exhibiting any of these negative characteristics. We sold both of them. We are concerned that these trends may be a very early sign of the emergence of credit-quality deterioration in general.
We are also very concerned about the sub-prime sector. Julian Mann, on our fixed-income team, has been researching this area and has discovered some unsettling trends. Many of these securities are exhibiting deteriorating credit statistics. These trends were in existence before any of the negative impacts from recent increases in energy prices or rises in short-term yields. This again is confirming to us that we must be very careful before taking on any degree of credit risk. We have virtually no exposure to this credit sector.
Despite our cautious outlook for both interest rates and credit quality, we have begun to gradually add a little duration to the portfolio. Recently, we established an initial position in two-year maturity Treasury notes. With their yields rising past the 4% level, we believe some value is now entering this segment of the market. We do anticipate that their yields will likely increase more; however, we are beginning with only a small position, less than 3% of the portfolio. As their yields rise, we will consider adding more. We are also considering agency securities with similar maturities, but we are mindful of some of the challenges facing some of these governmental entities and, thus, we are attempting to be very selective in this area as well.
We do not anticipate a major shift in the portfolio's duration or its credit positioning until we are rewarded with considerably higher yields and much wider credit-quality spreads. As of September 30, your Fund continues to maintain a very high credit-quality profile, with 51% of net assets in Government/Agency securities, 9% in AAA/AA-rated securities, and 30% in short-term money-market securities. High-yield represents a very low 4.3%. Within the Government/Agency component, 17% is invested in Treasury Inflation Protected Securities (TIPS) that mature January 2007. Most of our agency securities, with monthly adjustable or step-up rate features, are issued by the Federal Home Loan Bank. Our exposure to debentures of FNMA, the Federal National Mortgage Association, is less than 4%.
2
Outlook
We believe that inflationary pressures are building. As oil prices have escalated higher, most view this as a temporary phenomenon. It has been only within the last couple of months that the sustainability of high-energy prices is being considered a possibility by the consensus. We have been anticipating higher prices for some time, given that we have maintained large energy exposures in FPA's equity funds for several years. However, the rise in both oil and natural gas prices to $70 per barrel and $14 per million BTUs, respectively, was considerably more than what we were anticipating last year for this year. What this demonstrates is that the world energy supply system does not have a sufficiently large supply cushion to withstand any type of disruption. We are of the opinion that a fundamental change has occurred, whereby the period of low energy prices has ended, and a new one has begun that will be considerably higher on average.
Should we be correct in our assessment, this change may affect inflationary expectations. We believe these higher energy price levels are just now starting to feed through the system. Because of the recent Hurricanes Katrina and Rita, energy prices are likely to be maintained at a higher level than what many would have expected. The result is likely to be a much higher than anticipated Consumer Price Index (CPI), equaling or exceeding 4.5% for a period of time. Many will discount this as only temporary by referring to the Core CPI that excludes the volatile elements of food and energy. Should energy prices begin to be viewed as having risen to a new sustainable level, many companies will likely attempt to push through these higher costs to their end-market customers. If this occurs, the investment community may become more concerned about the level and sustainability of inflation. This change in perception could be significant since investors have not factored this potential outcome into the valuation of longer-term bonds.
The rise in energy prices, along with the rise in short-term interest rates, has the potential of materially slowing the economy next year. Many will view this possibility as positive for the bond market and, therefore, will likely anticipate lower interest rates. We do not view this scenario as unlikely nor do we view it as likely. We believe that a scenario of elevated inflation in conjunction with slowing economic growth could lead to a period of perceived stagflation. This would not be positive for either the bond or stock markets. We do not believe that longer-term bond yields are high enough to compensate us for this possible risk. Furthermore, we are of the opinion that the Fed is growing more anxious about the possibility of higher inflation and, therefore, it will continue its policy of "measured" tightening in to next year. This should place greater upward pressure on both short-term and long-term interest rates. During this process, it is possible the yield curve may invert (short-term yields being higher than longer-term yields); however, we do not view this as the most likely scenario.
This process should place greater pressure on consumers to meet their debt service as well as their discretionary spending needs. We recently read a very thoughtful piece by Stephanie Pomboy of MacroMavens entitled, "When the Levee Breaks" (September 9, 2005). Her conclusion is that the combination of rising credit costs and energy prices will hit the consumer hard next year. We think this is a reasonable conclusion and, therefore, we have taken action to limit our exposure to these potential consequences.
We do believe the most likely outcome next year is a material slowing in aggregate economic activity with real GDP growth into the low 3% range. The rate of slowdown in economic activity will depend upon the magnitude and timeliness of federal economic aid to disaster-ridden areas. In our opinion, the pressures to rebuild quickly pose threats to various types of goods that could add to the inflation outlook. In summary, next year should be a very challenging one for both the economy and the financial markets.
Final Thoughts
I have been monitoring the events taking place in Washington regarding entitlement spending programs, in particular, and government spending, in general. I am very disappointed with the current results. The year began with great promise that an attack on the actuarially unsound Social Security program would begin. As you know, there was a great debate as to how this program should be corrected.
3
Each side argued that its method was better, but in total, both sides were debating how to save the program between $1.7 and $2 trillion, in present value terms. Unfortunately, no compromise was reached so, in all likelihood, nothing will be accomplished this year. In my opinion, this was the last opportunity to tackle the Social Security funding issue until 2013-the first year of the second term of the 2008 presidency. What is amazing is that this is the smallest of all the entitlement spending issues. If members of Congress were unable to agree on this, it sets a very negative tone for anything else.
It is hard for me to take our representatives seriously, when they talk about "saving" the taxpayer trillions, while at the same time they allow the fiscal integrity of the country to deteriorate. A very condemning document is the 2004 Financial Report of the United States Government (www.fms.treas.gov/fr/04frusg/04frusg/pdf). This report attempts to place the financial statements of the U.S. on an accrual basis rather than a cash basis that most of us are familiar with. It takes into consideration the present value of liabilities, in much the same way a corporation would have to value their pension and health-care liabilities. In other words, it attempts to size the entire liability rather than just the one-year cost. It is discouraging that, on page 11, a summary table shows how the estimated U.S. liabilities grew by $11.1 trillion in just one year, from $36.2 to $47.3 trillion. Of this increase, $9.6 trillion was the result of Medicare (Parts A, B, and D). Of this increase, $8.1 trillion is the result of the Medicare Prescription Drug Plan. With the stroke of a pen, the legislative and executive branches of our government created a liability more than four times greater than the anticipated Social Security savings. Before this government even corrected an existing plan, Social Security, it created a new liability that is the largest entitlement increase since the establishment of Medicare. Another way of understanding its magnitude is to compare it to the total debt of the United States. As of September 30, 2004, the federal government's gross debt was approximately $7.4 trillion, with $4.3 trillion held by the public and $3.1 trillion held by governmental entities.
Comments by the Comptroller General of the United States, David M. Walker, are quite enlightening. "Because of the federal government's inability to demonstrate the reliability of significant portions of the U.S. government's accompanying consolidated financial statements for 2004 and 2003, principally resulting from the material deficiencies, and other limitations on the scope of our work, described in this report, we are unable to, and we do not, express an opinion on such financial statements." This is a disclaimer of opinion. If this were a public company, the management and the board of directors would be facing legal prosecution for fiduciary irresponsibility or for producing financially misleading and inaccurate financial statements.
Between questionable accounting and control over current spending, fighting the war on terror, and the expansion of new entitlements, i.e., the payment for hurricane disasters; this entire government is creating liabilities that will one day come home to roost. I do not believe that we, as investors, are being sufficiently compensated for these additional risks in either the stock or bond markets. When your team uncovers investment opportunities that compensate us sufficiently for the various risks we perceive, we will deploy your capital. Until then, we will patiently wait. Now Tom Atteberry will share his thoughts with you.
Thomas H. Atteberry Commentary
Earlier, Bob alluded to some suspect credit performance in two mortgage-backed bonds that appeared at first to be comprised of borrowers with high FICO scores (high credit quality). In addition, Julian Mann has analyzed the sub-prime mortgage segment of the mortgage market and uncovered deteriorating credit trends.
As the economy slipped into recession at the early part of this decade, Federal Reserve monetary policy, Federal government tax policy and bank lending strategies all favored the consumer. Lending standards were relatively lax, interest rates reached new generational lows and tax rates declined, all of which improved the balance sheet and income statement of the consumer. This culminated in two events, the massive mortgage debt refinancing in the
4
middle of 2003 and the huge run-up in real-estate values over the past two years. The latter, along with loose lending standards, resulted in a significant acceleration in the amount of outstanding home-equity loans, which over that period of time increased by approximately 80%.
While the mortgage refinancing event greatly improved the income statement of the consumer through lower mortgage payments, the run-up in real-estate values and the resulting borrowing of that appreciation through home-equity loans counteracted the savings. The result is that the Federal Reserve U.S. Consumer Financial Obligations ratio, which peaked at 18.76% in December 2001, is currently back up to 18.36%.
There are two disturbing trends at play. First, the percentage of the new mortgage loans that are floating rate in nature, along with the floating-rate home-equity loans, are at the highest on record. These types of loans leave the consumer more susceptible to rising short-term interest rates than in the past. The second is the increase in the amount of debt issued to sub-prime borrowers. Currently $296 billion in publicly traded sub-prime mortgages is outstanding, of which $104 billion, or 35%, is floating rate and will reset in the next twelve months. In fact in 1998, 0.1% of sub-prime mortgages were interest-only floating rate loans versus 22% today. What has transpired is that the borrower who is least able to absorb the increased loan payment now has a very large percentage of loans subject to rising rates.
As a result of the fiscal and monetary policies undertaken over the past four years, consumer debt is at elevated levels and the credit quality of that marginal debt issued more recently appears to be suspect. The absolute level of debt is at an all-time high, with banks having the highest percentage of real-estate loans as a percent of total loans on record. While net worth continues to rise, it is being driven by appreciating real estate, which in our opinion may not be sustainable, as was the case with certain segments of the equity markets in late 1999 and early 2000.
The portfolio does not own any home-equity loan pools but does own a de-minimus amount of sub-prime-type debt in the form of two Green Tree bonds backed by manufactured-housing loans. Both Julian and I have analyzed all the portfolio's non-agency-backed mortgages for any poor credit trends. At this time we are very comfortable with the credit quality of all these bonds. That being said, we review each bond every month to determine if the high credit quality continues or if it is deteriorating. If we suspect any deterioration, we will eliminate the bonds from the portfolio.
With those closing comments, we thank you for your continued investment and support.
Respectfully submitted,

Robert L. Rodriguez, CFA
President and Chief Investment Officer

Thomas H. Atteberry
Vice President and Portfolio Manager
October 14, 2005
The discussion of Fund investments represents the views of the Fund's managers at the time of this report and are subject to change without notice. References to individual securities are for informational purposes only and should not be construed as recommendations to purchase or sell individual securities.
5
HISTORICAL PERFORMANCE
Change in Value of a $10,000 Investment in FPA New Income, Inc. vs. Lehman Brothers Government/Credit Index and Lipper Corporate Debt A Rated Fund Average from October 1, 1995 to September 30, 2005
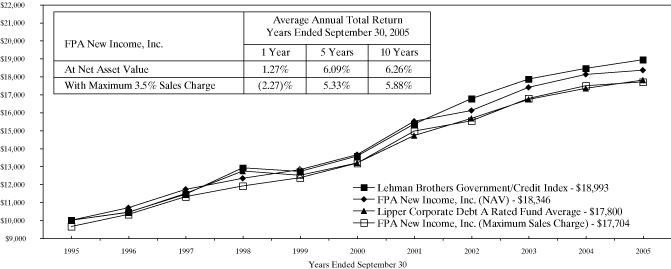
Past performance is not indicative of future performance. The Lehman Brothers Government/Credit Index is a broad-based unmanaged index of all government and corporate bonds that are investment grade with at least one year to maturity. The Lehman Brothers Government/Credit Index does not reflect any commissions or fees which would be incurred by an investor purchasing the securities it represents. The Lipper Corporate Debt A Rated Fund Average provides an additional comparison of how your Fund performed in relation to other mutual funds with similar objectives. The Lipper data does not include sales charges. The performance shown for FPA New Income, Inc., with an ending value of $17,704 reflects deduction of the current maximum sales charge of 3.5% of the offering price. In addition, since investors purchase shares of the Fund with varying sales charges depending primarily on volume purchased, the Fund's performance at net asset value (NAV) is also shown, as reflected by the ending value of $18,346. The performance of the Fund and of the Averages is computed on a total return basis which includes reinvestment of all distributions.
FORWARD LOOKING STATEMENT DISCLOSURE
As mutual fund managers, one of our responsibilities is to communicate with shareholders in an open and direct manner. Insofar as some of our opinions and comments in our letters to shareholders are based on current management expectations, they are considered "forward-looking statements" which may or may not be accurate over the long term. While we believe we have a reasonable basis for our comments and we have confidence in our opinions, actual results may differ materially from those we anticipate. You can identify forward-looking statements by words such as "believe," "expect," "may," "anticipate," and other similar expressions when discussing prospects for particular portfolio holdings and/or the markets, generally. We cannot, however, assure future results and disclaim any obligation to update or alter any forward-looking statements, whether as a result of new information, future events, or othe rwise. Further, information provided in this report should not be construed as a recommendation to purchase or sell any particular security.
6
PORTFOLIO SUMMARY
September 30, 2005
| Bonds & Debentures | | | | | | | 68.6 | % | |
| U.S. Agencies | | | 21.2 | % | | | | | |
| U.S. Government | | | 19.7 | % | | | | | |
| Mortgage-Backed | | | 11.5 | % | | | | | |
| Corporate | | | 10.8 | % | | | | | |
| Mortgage-Backed Pass-Through | | | 1.8 | % | | | | | |
| Convertible | | | 1.4 | % | | | | | |
| International | | | 1.1 | % | | | | | |
| Asset Backed | | | 0.7 | % | | | | | |
| Derivatives - Interest Only | | | 0.4 | % | | | | | |
| Preferred Stock | | | | | | | 0.3 | % | |
| Common Stock | | | | | | | 0.1 | % | |
| Short-Term Corporate Notes | | | | | | | 29.8 | % | |
| Other Assets and Liabilities, net | | | | | | | 1.2 | % | |
| Total Net Assets | | | | | | | 100.0 | % | |
MAJOR PORTFOLIO CHANGES
For the Six Months Ended September 30, 2005
(Unaudited)
| | | Principal Amount | |
| NET PURCHASES | | | |
| Non-Convertible Bonds & Debentures | | | |
| Federal Home Loan Bank - 4.5% 2007 (1) | | $ | 20,000,000 | | |
| Federal Home Loan Mortgage Corporation 2891 CL LA - 5% 2024 (1) | | $ | 22,746,197 | | |
| U.S. Treasury Notes - 3.875% 2007 (1) | | $ | 50,000,000 | | |
| NET SALES | | | |
| Non-Convertible Bonds & Debentures | | | |
| Federal Farm Credit Bank - 2.2925% 2005 (Floating) (2) | | $ | 70,000,000 | | |
| Federal Home Loan Bank - 2% 2007 (Step-up) (2) | | $ | 21,900,000 | | |
| Federal Home Loan Bank - 2% 2009 (Step-up) (2) | | $ | 22,500,000 | | |
| Federal Home Loan Mortgage Corporation 2553 CL DX - 4.5% 2022 (2) | | $ | 24,500,000 | | |
| Federal National Mortgage Association - 2% 2007 (Step-up) (2) | | $ | 22,800,000 | | |
| Federal National Mortgage Association - 2.22625% 2006 (Floating) (2) | | $ | 50,000,000 | | |
| JP Morgan Mortgage Trust 2005-S1 CL 2A2 - 8% 2035 (2) | | $ | 17,189,052 | | |
| Convertible Debenture | | | |
| I 2 Technologies, Inc. - 5.25% 2006 (2) | | $ | 18,900,000 | | |
(1) Indicates new commitment to portfolio
(2) Indicates elimination from portfolio
7
PORTFOLIO OF INVESTMENTS
September 30, 2005
| BONDS & DEBENTURES | | Principal
Amount | | Value | |
| U.S. AGENCIES SECURITIES - 21.2% | |
| Federal Agriculture Mortgage Corporation | |
| - 3.06% 2007 (Floating) | | $ | 26,100,000 | | | $ | 26,034,750 | | |
| Federal Farm Credit Bank | |
| - 3.61% 2006 (Floating) | | | 50,000,000 | | | | 49,975,000 | | |
| - 3.67% 2006 (Floating) | | | 71,500,000 | | | | 71,464,250 | | |
| Federal Home Loan Bank | |
| - 2% 2009 (Step-up on 4/15/06) | | | 21,695,000 | | | | 21,437,372 | | |
| - 2% 2009 (Step-up on 4/15/06) | | | 18,750,000 | | | | 18,533,203 | | |
| - 3.18% 2007 (Floating) | | | 24,650,000 | | | | 24,650,000 | | |
| - 3.61% 2007 (Floating) | | | 25,825,000 | | | | 25,773,350 | | |
| - 3.75% 2009 (Step-up on 11/22/05) | | | 29,275,000 | | | | 29,156,070 | | |
| - 3.75% 2009 (Step-up on 12/28/05) | | | 25,000,000 | | | | 24,950,000 | | |
| - 4% 2007 (Step-up on 3/29/06) | | | 10,230,000 | | | | 10,219,770 | | |
| | - | 4.5% 2007 | | | 20,000,000 | | | | 19,940,000 | | |
| Federal National Mortgage Association | |
| - 3.25% 2007 (Step-up on 12/21/05) | | | 20,055,000 | | | | 19,929,656 | | |
| - 3.58% 2006 (Floating) | | | 50,000,000 | | | | 49,975,000 | | |
| TOTAL U.S. AGENCIES SECURITIES | | | | | | $ | 392,038,421 | | |
| U.S. GOVERNMENT SECURITIES - 19.7% | |
| U.S.Treasury Inflation-Indexed Notes - 3.375% 2007 | | $ | 302,915,928 | | | $ | 313,375,994 | | |
| U.S.Treasury Notes - 3.875% 2007 | | | 50,000,000 | | | | 49,718,750 | | |
| TOTAL U.S. GOVERNMENT SECURITIES | | | | | | $ | 363,094,744 | | |
| MORTGAGE-BACKED SECURITIES - 11.5% | |
| BOAA 2003-6 CL 1NC2 - 8% 2033 | | $ | 2,528,303 | | | $ | 2,656,159 | | |
| Chase Mortgage Finance Trust 2003-S14 CL 2A4 - 7.5% 2034 | | | 15,343,290 | | | | 16,078,234 | | |
| Countrywide Mortgage Securities 2002-36 CL A20 - 5% 2033 | | | 1,202,430 | | | | 1,204,679 | | |
| Federal Home Loan Mortgage Corporation | |
| 1534 CL IA - 3.59% 2023 (Floating) | | | 828,034 | | | | 824,411 | | |
| 1552 CL I - 3.59% 2023 (Floating) | | | 1,250,162 | | | | 1,247,037 | | |
| 1669 CL HA - 3.74% 2023 (Floating) | | | 4,000,000 | | | | 3,948,124 | | |
| 1671 CL HA - 3.74% 2024 (Floating) | | | 3,347,711 | | | | 3,337,249 | | |
| 1673 CL HB - 3.74% 2024 (Floating) | | | 1,000,000 | | | | 1,010,625 | | |
| 1684 CL HA - 3.74% 2024 (Floating) | | | 4,000,000 | | | | 3,991,250 | | |
| 1634 CL PL - 3.84% 2023 (Floating) | | | 7,000,000 | | | | 6,995,625 | | |
| 2766 CL PT - 5% 2016 | | | 15,002,522 | | | | 15,021,274 | | |
| 2897 CL AB - 5% 2022 | | | 18,435,782 | | | | 18,453,112 | | |
| 2891 CL LA - 5% 2024 | | | 22,746,197 | | | | 22,824,216 | | |
| 2510 CL PV - 5.25% 2026 | | | 2,292,239 | | | | 2,289,016 | | |
8
PORTFOLIO OF INVESTMENTS
September 30, 2005
| BONDS & DEBENTURES - Continued | | Principal
Amount | | Value | |
| | 2619 CL YV - 5.5% 2011 | | | | 5,692,860 | | | | 5,710,649 | | |
| | 2525 CL BR - 5.5% 2023 | | | | 477,446 | | | | 477,594 | | |
| | 1804 CL C - 6% 2008 | | | | 1,717,658 | | | | 1,754,347 | | |
| | 1591 CL PV - 6.25% 2023 | | | | 7,598,004 | | | | 7,878,522 | | |
| | 2438 CL MF - 6.5% 2031 | | | | 15,916,582 | | | | 16,105,591 | | |
| | 2543 CL AD - 8.5% 2016 | | | | 190,037 | | | | 199,122 | | |
| | 2519 CL ED - 8.5% 2030 | | | | 709,023 | | | | 751,120 | | |
| | 2626 CL QM - 9% 2018 | | | | 3,336,999 | | | | 3,734,833 | | |
| | HM-A1 - 10.15% 2006 | | | | 5 | | | | 6 | | |
| Federal National Mortgage Association | |
| | - | 5.5% 2032 | | | 2,311,665 | | | | 2,333,337 | | |
| | - | 6% 2016 | | | 416,863 | | | | 423,991 | | |
| | - | 6.5% 2008 | | | 192,627 | | | | 196,961 | | |
| | - | 6.5% 2017 | | | 3,407,082 | | | | 3,542,820 | | |
| | - | 7% 2007 | | | 4,038,675 | | | | 4,157,311 | | |
| | 319 CL 18 - 8% 2032 | | | | 1,417,239 | | | | 1,527,961 | | |
| | - | 8% 2034 | | | 18,493,602 | | | | 19,071,526 | | |
| Government National Mortgage Association II | |
| | - | 7.5% 2029 | | | 3,772,884 | | | | 3,986,920 | | |
| | JP Morgan Mortgage Trust 2003-A2 - 4% 2033 | | | | 6,164,038 | | | | 6,114,727 | | |
| | Wachovia Asset Securitization, Inc. 2002-1 CL 2A1 - 6.25% 2033 | | | | 2,720,114 | | | | 2,723,514 | | |
| | Wells Fargo Mortgage Backed Securities Trust 2004-1 CL A19 - 5% 2034 | | | | 7,821,222 | | | | 7,827,792 | | |
| | Wells Fargo Mortgage Backed Securities Trust 2005-2 CL 1A2 - 8% 2035 | | | | 22,760,429 | | | | 23,855,775 | | |
| | TOTAL MORTGAGE-BACKED SECURITIES | | | | | | | $ | 212,255,430 | | |
| | CORPORATE BONDS & DEBENTURES - 10.8% | | | | |
| | Avnet Inc. - 8% 2006 | | | $ | 2,000,000 | | | $ | 2,065,000 | | |
| | Bayerische Landesbank - 3.51% 2009 (Floating)† | | | | 21,000,000 | | | | 20,380,500 | | |
| | Collins & Aikman Products Company - 10.75% 2011* | | | | 8,220,000 | | | | 3,534,600 | | |
| | Fifth Third Bancorp - 3.79% 2009 (Floating)† | | | | 50,000,000 | | | | 50,000,000 | | |
| | International Wire Group, Inc. - 10% 2011 | | | | 5,193,000 | | | | 5,141,070 | | |
| | Landesbank Baden-Wuerttemberg - 2.24% 2007† | | | | 23,500,000 | | | | 23,147,500 | | |
| | Metaldyne Corporation - 11% 2012 | | | | 19,980,000 | | | | 13,286,700 | | |
| | Northland Cable Company - 10.25% 2007 | | | | 8,645,000 | | | | 8,385,650 | | |
| | Qwest Communications International Inc. - 7.29% 2009 (Floating) | | | | 24,045,000 | | | | 23,895,921 | | |
| | Rabobank Nederland NV - 3.43% 2007 (Floating) | | | | 24,674,000 | | | | 24,546,781 | | |
| | Royal Bank of Canada - 3.80% 2007 (Floating) | | | | 24,651,000 | | | | 24,626,349 | | |
| | TOTAL CORPORATE BONDS & DEBENTURES | | | | | | | $ | 199,010,071 | | |
9
PORTFOLIO OF INVESTMENTS
September 30, 2005
| BONDS & DEBENTURES - Continued | | Principal
Amount | | Value | |
| MORTGAGE-BACKED PASS-THROUGH SECURITIES - 1.8% | |
| Federal National Mortgage Association | |
| | - | 5.5% 2014 | | $ | 6,563,946 | | | $ | 6,682,917 | | |
| | - | 6% 2011 | | | 2,703,820 | | | | 2,779,865 | | |
| | - | 6% 2012 | | | 12,162,433 | | | | 12,508,302 | | |
| | - | 7% 2030 | | | 1,035,068 | | | | 1,089,409 | | |
| | - | 7% 2031 | | | 407,585 | | | | 423,563 | | |
| | - | 7.5% 2016 | | | 164,761 | | | | 173,411 | | |
| | - | 7.5% 2016 | | | 29,144 | | | | 30,675 | | |
| | - | 7.5% 2028 | | | 1,845,737 | | | | 1,953,020 | | |
| | - | 7.5% 2029 | | | 556,488 | | | | 588,359 | | |
| | - | 7.5% 2029 | | | 503,522 | | | | 535,935 | | |
| | - | 8% 2016 | | | 63,112 | | | | 67,609 | | |
| Government National Mortgage Association | |
| | - | 7% 2028 | | | 1,013,235 | | | | 1,068,416 | | |
| | - | 7.5% 2023 | | | 25,530 | | | | 26,721 | | |
| | - | 8% 2030 | | | 254,372 | | | | 265,500 | | |
| | - | 8% 2030 | | | 445,720 | | | | 465,360 | | |
| | - | 8% 2031 | | | 290,003 | | | | 301,603 | | |
| Government National Mortgage Association II | |
| | - | 7% 2024 | | | 462,010 | | | | 479,424 | | |
| | - | 7% 2028 | | | 598,019 | | | | 620,763 | | |
| | - | 7% 2028 | | | 79,031 | | | | 82,811 | | |
| | - | 7.5% 2025 | | | 29,984 | | | | 31,802 | | |
| | - | 7.5% 2025 | | | 62,430 | | | | 66,137 | | |
| | - | 7.5% 2027 | | | 43,463 | | | | 46,030 | | |
| | - | 7.5% 2030 | | | 169,594 | | | | 179,133 | | |
| | - | 8% 2027 | | | 308,049 | | | | 325,920 | | |
| Government National Mortgage Association (MH) | |
| | - | 8.25% 2006-7 | | | 25,615 | | | | 26,277 | | |
| | - | 8.75% 2006 | | | 59,458 | | | | 60,833 | | |
| | - | 8.75% 2011 | | | 303,247 | | | | 318,064 | | |
| | - | 9% 2010 | | | 115,194 | | | | 120,571 | | |
| | - | 9% 2011 | | | 361,784 | | | | 378,669 | | |
| | - | 9.25% 2010-11 | | | 271,336 | | | | 284,591 | | |
| | - | 9.75% 2005 | | | 20,719 | | | | 20,774 | | |
| | - | 9.75% 2006 | | | 16,324 | | | | 16,403 | | |
| | - | 9.75% 2012-13 | | | 139,808 | | | | 147,076 | | |
| | Government National Mortgage Association (PL) - 10.25% 2017 | | | | 747,022 | | | | 760,095 | | |
| | TOTAL MORTGAGE-BACKED PASS-THROUGH SECURITIES | | | | | | | $ | 32,926,038 | | |
10
PORTFOLIO OF INVESTMENTS
September 30, 2005
| BONDS & DEBENTURES - Continued | | Shares or
Principal
Amount | | Value | |
| CONVERTIBLE BONDS & DEBENTURES - 1.4% | |
| | BEA Systems, Inc. - 4% 2006 | | | $ | 18,000,000 | | | $ | 17,775,000 | | |
| | Standard Motor Products, Inc. - 6.75% 2009 | | | | 8,960,000 | | | | 7,750,400 | | |
| | TOTAL CONVERTIBLE BONDS & DEBENTURES | | | | | | | $ | 25,525,400 | | |
| INTERNATIONAL SECURITY - 1.1% | |
| | France OATei - 3% 2012 | | | $ | 14,253,158 | | | $ | 19,712,202 | | |
| ASSET BACKED SECURITIES - 0.7% | |
| | CIT RV TRUST 1999-A CL A4 - 6.16% 2013 | | | $ | 2,975,448 | | | $ | 2,985,892 | | |
| Green Tree Financial Corporation | |
| | - | 7.77% 2029* | | | 5,500,000 | | | | 3,025,000 | | |
| | - | 8% 2028* | | | 2,769,535 | | | | 2,354,104 | | |
| | Truck Engine Receivables Master Trust 2000-1a - 4.72% 2006† | | | | 5,000,000 | | | | 5,011,720 | | |
| | TOTAL ASSET BACKED SECURITIES | | | | | | | $ | 13,376,716 | | |
| DERIVATIVE SECURITIES - 0.4% | |
| | INTEREST ONLY SECURITIES | | | | |
| Federal Home Loan Mortgage Corporation | |
| | 2522 CL PI - 5.5% 2018 | | | $ | 2,060,234 | | | $ | 57,944 | | |
| | 2558 CL JW - 5.5% 2022 | | | | 21,104,055 | | | | 2,980,948 | | |
| | 1694 CL L - 6.5% 2023 | | | | 125,581 | | | | 7,927 | | |
| | 217 | -6.5% 2032 | | | 3,896,461 | | | | 775,883 | | |
| Federal National Mortgage Association | |
| | 2003-64 CL XI - 5% 2033 | | | | 18,187,474 | | | | 3,330,581 | | |
| | 323 CL 1 - 5.5% 2032 | | | | 4,839,997 | | | | 918,087 | | |
| | 1994-17 CL JB - 6.5% 2009 | | | | 563,034 | | | | 43,987 | | |
| | TOTAL DERIVATIVE SECURITIES | | | | | | | $ | 8,115,357 | | |
| PREFERRED STOCK - 0.3% | |
| | Pennsylvania Real Estate Investment Trust | | | | 93,800 | | | $ | 5,393,500 | | |
| COMMON STOCK - 0.1% | |
| | International Wire Group, Inc.** | | | | 327,344 | | | $ | 2,209,572 | | |
| | TOTAL INVESTMENT SECURITIES - 69.0% (Cost $1,282,415,969) | | | | | | | $ | 1,273,657,451 | | |
11
PORTFOLIO OF INVESTMENTS
September 30, 2005
| | | Principal
Amount | | Value | |
| SHORT-TERM INVESTMENTS - 29.8% | |
| ChevronTexaco Funding Corporation - 3.5% 10/3/05 | | $ | 48,429,000 | | | $ | 48,419,583 | | |
| ABN Amro North America, Inc. - 3.58% 10/4/05 | | | 50,000,000 | | | | 49,985,083 | | |
| General Electric Capital Corporation - 3.65% 10/5/05 | | | 35,701,000 | | | | 35,686,521 | | |
| Federal Home Loan Bank Discount Note - 3.6% 10/7/05 | | | 58,000,000 | | | | 57,965,200 | | |
| General Electric Capital Services, Inc. - 3.63% 10/11/05 | | | 39,349,000 | | | | 39,309,323 | | |
| Shell Finance (U.K.) Ltd. - 3.58% 10/17/05 | | | 39,423,000 | | | | 39,360,274 | | |
| Shell Finance (U.K.) Ltd. - 3.6% 10/17/05 | | | 33,106,000 | | | | 33,053,031 | | |
| Minnesota Mining & Manufacturing Company - 3.63% 10/19/05 | | | 35,000,000 | | | | 34,936,475 | | |
| ChevronTexaco Funding Corporation - 3.59% 10/21/05 | | | 39,954,000 | | | | 39,874,314 | | |
| General Electric Capital Services, Inc. - 3.66% 10/25/05 | | | 45,450,000 | | | | 45,339,102 | | |
| Barclays U.S. Funding, Inc. - 3.725% 10/27/05 | | | 61,000,000 | | | | 60,835,893 | | |
| Toyota Motor Credit Corporation - 3.74% 11/3/05 | | | 40,000,000 | | | | 39,862,867 | | |
| Dupont (E.I.) De Nemours & Co. - 3.73% 11/7/05 | | | 25,000,000 | | | | 24,904,160 | | |
| TOTAL SHORT-TERM INVESTMENTS (Cost $549,531,826) | | | | | | $ | 549,531,826 | | |
| TOTAL INVESTMENTS - 98.8% (Cost $1,831,947,795) | | | | | | $ | 1,823,189,277 | | |
| Other assets and liabilities, net - 1.2% | | | | | | | 22,295,733 | | |
| TOTAL NET ASSETS - 100.0% | | | | | | $ | 1,845,485,010 | | |
* Non-income producing security, in default
** Non-income producing security
† Restricted security purchased without registration under the Securities Act of 1933 pursuant to Rule 144A, which generally may be resold only to certain institutional investors prior to registration. The Bayerische Landesbank 3.51% due 2009 was purchased on April 14, 2004 at $100; the Fifth Third Bancorp 3.79% due 2009 was purchased on November 23, 2004 at $100; the Landesbank Baden-Wuertemberg 2.24% due 2007 was purchased at $100; and the Truck Engine Receivables 4.72% due 2006 was purchased at $100. These restricted securities constituted 5.3% of total net assets at September 30, 2005.
See notes to financial statements.
12
STATEMENT OF ASSETS AND LIABILITIES
September 30, 2005
| ASSETS | |
| Investments at value: | |
Investments securities - at market value
(identified cost $1,282,415,969) | | $ | 1,273,657,451 | | | | | | |
Short-term investments - at amortized cost
(maturities 60 days or less) | | | 549,531,826 | | | $ | 1,823,189,277 | | |
| Cash | | | | | | | 699 | | |
| Receivable for: | |
| Investment securities sold | | $ | 16,583,938 | | | | | | |
| Interest | | | 7,949,754 | | | | | | |
| Capital Stock sold | | | 3,299,567 | | | | 27,833,259 | | |
| | | | | | | $ | 1,851,023,235 | | |
| LIABILITIES | |
| Payable for: | |
| Capital Stock repurchased | | $ | 4,597,912 | | | | | | |
| Advisory fees | | | 776,200 | | | | | | |
| Accrued expenses and other liabilities | | | 164,113 | | | | 5,538,225 | | |
| NET ASSETS | | | | | | $ | 1,845,485,010 | | |
| SUMMARY OF SHARHOLDERS' EQUITY | |
Capital Stock - par value $0.01 per share; authorized
400,000,000 shares; outstanding 167,239,062 shares | | | | | | $ | 1,672,391 | | |
| Additional Paid in Capital | | | | | | | 1,865,922,617 | | |
| Accumulated net realized loss on investments | | | | | | | (45,478,957 | ) | |
| Undistributed net investment income | | | | | | | 32,127,477 | | |
| Unrealized depreciation of investments | | | | | | | (8,758,518 | ) | |
| Net assets at September 30, 2005 | | | | | | $ | 1,845,485,010 | | |
NET ASSET VALUE, REDEMPTION PRICE AND
MAXIMUM OFFERING PRICE PER SHARE | |
Net asset value and redemption price per share
(net assets divided by shares outstanding) | | | | | | $ | 11.04 | | |
Maximum offering price per share
(100/96.5 of per share net asset value) | | | | | | $ | 11.44 | | |
See notes to financial statements.
13
STATEMENT OF OPERATIONS
For the Year Ended September 30, 2005
| INVESTMENT INCOME | |
| Interest | | | | | | $ | 85,639,724 | | |
| Dividends | | | | | | | 515,900 | | |
| | | | | | | $ | 86,155,624 | | |
| EXPENSES | |
| Advisory fees | | $ | 10,063,159 | | | | | | |
| Transfer agent fees and expenses | | | 1,312,906 | | | | | | |
| Reports to shareholders | | | 296,133 | | | | | | |
| Registration fees | | | 156,952 | | | | | | |
| Custodian fees and expenses | | | 145,461 | | | | | | |
| Insurance | | | 83,051 | | | | | | |
| Directors' fees and expenses | | | 40,235 | | | | | | |
| Audit fees | | | 32,240 | | | | | | |
| Legal fees | | | 16,046 | | | | | | |
| Other expenses | | | 7,611 | | | | 12,153,794 | | |
| Net investment income | | | | | | $ | 74,001,830 | | |
NET REALIZED AND UNREALIZED GAIN (LOSS)
ON INVESTMENTS | |
| Net realized loss on investments: | |
Proceeds from sales of investment securities (excluding
short-term investments with maturities of 60 days or less) | | $ | 848,205,980 | | | | | | |
| Cost of investment securities sold | | | 861,510,117 | | | | | | |
| Net realized loss on investments | | | | | | $ | (13,304,137 | ) | |
| Unrealized appreciation (depreciation) of investments: | |
| Unrealized appreciation at beginning of year | | $ | 28,783,584 | | | | | | |
| Unrealized depreciation at end of year | | | (8,758,518 | ) | | | | | |
| Change in unrealized appreciation (depreciation) of investments | | | | | | | (37,542,102) | | |
| Net realized and unrealized loss on investments | | | | | | $ | (50,846,239 | ) | |
| NET INCREASE IN NET ASSETS RESULTING FROM OPERATIONS | | | | | | $ | 23,155,591 | | |
See notes to financial statements.
14
STATEMENT OF CHANGES IN NET ASSETS
| | | For the Year Ended September 30, | |
| | | 2005 | | 2004 | |
| INCREASE (DECREASE) IN NET ASSETS | | | |
| Operations: | |
| Net investment income | | $ | 74,001,830 | | | | | | | $ | 60,077,052 | | | | | | |
| Net realized loss on investments | | | (13,304,137 | ) | | | | | | | (7,355,281 | ) | | | | | |
Change in unrealized appreciation
(depreciation) of investments | | | (37,542,102 | ) | | | | | | | 690,285 | | | | | | |
Increase in net assets resulting
from operations | | | | | | $ | 23,155,591 | | | | | | | $ | 53,412,056 | | |
Dividends to shareholders from net
investment income | | | | | | | (71,771,220 | ) | | | | | | | (52,090,881 | ) | |
| Capital Stock transactions: | |
| Proceeds from Capital Stock sold | | $ | 614,065,334 | | | | | | | $ | 1,090,872,412 | | | | | | |
Proceeds from shares issued to
shareholders upon reinvestment
of dividends | | | 51,768,817 | | | | | | | | 38,674,748 | | | | | | |
| Cost of Capital Stock repurchased* | | | (710,384,702 | ) | | | (44,550,551 | ) | | | (317,715,239 | ) | | | 811,831,921 | | |
| Total increase (decrease) in net assets | | | | | | $ | (93,166,180 | ) | | | | | | $ | 813,153,096 | | |
| NET ASSETS | | | |
| Beginning of year | | | | | | | 1,938,651,190 | | | | | | | | 1,125,498,094 | | |
| End of year | | | | | | $ | 1,845,485,010 | | | | | | | $ | 1,938,651,190 | | |
CHANGE IN CAPITAL STOCK
OUTSTANDING | | | |
| Shares of Capital Stock sold | | | | | | | 55,064,774 | | | | | | | | 96,300,078 | | |
Shares issued to shareholders upon
reinvestment of dividends | | | | | | | 4,667,261 | | | | | | | | 3,438,666 | | |
| Shares of Capital Stock repurchased | | | | | | | (64,037,416 | ) | | | | | | | (28,076,489 | ) | |
Increase (decrease) Capital
Stock outstanding | | | | | | | (4,305,381 | ) | | | | | | | 71,662,255 | | |
* Net of redemption fees of $170,485 and $127,707 for the years ended September 30, 2005 and 2004, respectively.
See notes to financial statements.
15
FINANCIAL HIGHLIGHTS
Selected Data for Each Share of Capital Stock Outstanding Throughout Each Year
| | | For the Year Ended September 30, | |
| | | 2005 | | 2004 | | 2003 | | 2002 | | 2001 | |
| Per share operating performance: | |
| Net asset value at beginning of year | | $ | 11.30 | | | $ | 11.27 | | | $ | 10.98 | | | $ | 11.17 | | | $ | 10.61 | | |
| Income from investment operations: | | | | | | | | | | | | | | | | | | | | | |
| Net investment income | | $ | 0.48 | | | $ | 0.43 | | | $ | 0.52 | | | $ | 0.54 | | | $ | 0.80 | | |
Net realized and unrealized gain (loss) on
investment securities | | | (0.34 | ) | | | 0.03 | | | | 0.33 | | | | (0.12 | ) | | | 0.57 | | |
| Total from investment operations | | $ | 0.14 | | | $ | 0.46 | | | $ | 0.85 | | | $ | 0.42 | | | $ | 1.37 | | |
| Less distributions: | | | | | | | | | | | | | | | | | | | | | |
| Dividends from net investment income | | $ | (0.40 | ) | | $ | (0.43 | ) | | $ | (0.56 | ) | | $ | (0.54 | ) | | $ | (0.73 | ) | |
| Distributions from net realized capital gains | | | - | | | | - | | | | - | | | | (0.07 | ) | | | (0.08 | ) | |
| Total distributions | | $ | (0.40 | ) | | $ | (0.43 | ) | | $ | (0.56 | ) | | $ | (0.61 | ) | | $ | (0.81 | ) | |
| Redemption fees | | | - | * | | | - | * | | | - | | | | - | | | | - | | |
| Net asset value at end of year | | $ | 11.04 | | | $ | 11.30 | | | $ | 11.27 | | | $ | 10.98 | | | $ | 11.17 | | |
| Total investment return** | | | 1.27 | % | | | 4.16 | % | | | 8.02 | % | | | 3.83 | % | | | 13.57 | % | |
| Ratios/supplemental data: | |
| Net assets at end of period (in $000's) | | | 1,845,485 | | | | 1,938,651 | | | | 1,125,498 | | | | 1,110,905 | | | | 697,384 | | |
| Ratio of expenses to average net assets | | | 0.61 | % | | | 0.60 | % | | | 0.61 | % | | | 0.58 | % | | | 0.59 | % | |
Ratio of net investment income to average
net assets | | | 3.69 | % | | | 3.77 | % | | | 4.69 | % | | | 5.06 | % | | | 6.49 | % | |
| Portfolio turnover rate | | | 42 | % | | | 62 | % | | | 52 | % | | | 28 | % | | | 22 | % | |
* Rounds to less than $0.01 per share.
** Return is based on net asset value per share, adjusted for reinvestment of distributions, and does not reflect deduction of the sales charge
See notes to financial statements.
16
NOTES TO FINANCIAL STATEMENTS
September 30, 2005
NOTE 1 - Significant Accounting Policies
The Fund is registered under the Investment Company Act of 1940 as a diversified, open-end, management investment company. The Fund's investment objective is to seek current income and long-term total return. The following is a summary of significant accounting policies consistently followed by the Fund in the preparation of its financial statements.
A. Security Valuation
Securities listed or traded on a national securities exchange are valued at the last sale price on the last business day of the year, or if there was not a sale that day, at the last bid price. Securities traded in the NASDAQ National Market System are valued at the NASDAQ Official Closing Price on the last business day of the year, or if there was not a sale that day, at the last bid price. Unlisted securities and securities listed on a national securities exchange for which the over-the-counter market more accurately reflects the securities' value in the judgment of the Fund's officers, are valued at the most recent bid price or other ascertainable market value. Short-term investments with maturities of 60 days or less are valued at amortized cost which approximates market value. Securities for which market quotations are not readily available are valued at fair value as determined in good faith by, or under the d irection of, the Board of Directors.
B. Securities Transactions and Related
Investment Income
Securities transactions are accounted for on the date the securities are purchased or sold. Dividend income and distributions to shareholders are recorded on the ex-dividend date. Interest income and expenses are recorded on an accrual basis. Market discounts and premiums on fixed income securities are amortized over the expected life of the securities. Realized gains or losses are based on the specific identification method.
C. Use of Estimates
The preparation of financial statements in conformity with accounting principles generally accepted in the United States requires management to make estimates and assumptions that affect the amounts reported. Actual results could differ from these estimates.
NOTE 2 - Purchases of Investment Securities
Cost of purchases of investment securities (excluding short-term investments with maturities of 60 days or less) aggregated $824,053,688 for the year ended September 30, 2005.
NOTE 3 - Advisory Fees and Other Affiliated Transactions
Pursuant to an Investment Advisory Agreement, advisory fees were paid by the Fund to First Pacific Advisors, Inc. (the "Adviser"). Under the terms of this agreement, the Fund pays the Adviser a monthly fee calculated at the annual rate of 0.5% of the average daily net assets of the Fund. The Agreement obligates the Adviser to reduce its fee to the extent necessary to reimburse the Fund for any annual expenses (exclusive of interest, taxes, the cost of any supplemental statistical and research information, and extraordinary expenses such as litigation) in excess of 11/2% of the first $15 million and 1% of the remaining average net assets of the Fund for the year.
For the year ended September 30, 2005, the Fund paid aggregate fees of $40,000 to all Directors who are not affiliated persons of the Adviser. Legal fees of $16,046 were for services rendered by O'Melveny & Myers LLP, counsel for the Fund. A Director of the Fund is a retired partner and a retired of counsel employee of that firm. Certain officers of the Fund are also officers of the Adviser and FPA Fund Distributors, Inc.
NOTE 4 - Federal Income Tax
No provision for federal income tax is required because the Fund has elected to be taxed as a "regulated investment company" under the Internal Revenue Code and intends to maintain this qualification and to distribute each year to its shareholders, in accordance with the minimum distribution requirements of the Code, all of its taxable net investment income and taxable net realized gains on investments.
Distributions paid to shareholders are based on net investment income and net realized gains determined on a tax reporting basis, which may differ from financial reporting. For federal income tax
17
NOTES TO FINANCIAL STATEMENTS
Continued
purposes, the components of distributable earnings at September 30, 2005, were as follows:
| Undistributed net investment income | | $ | 25,827,234 | | |
| Accumulated net realized losses | | $ | (25,530,726 | ) | |
| Post-October loss deferral | | $ | (19,948,231 | ) | |
Accumulated net realized losses can be carried forward to offset future gains. The ability to carry these losses forward expires as follows: $1,455,619 in 2011, $16,355,526 in 2012, and $7,719,581 in 2013.
The cost of investment securities at September 30, 2005 for federal income tax purposes was $1,276,115,726. Gross unrealized appreciation and depreciation for all securities at September 30, 2005 for federal income tax purposes was $21,554,623 and $24,012,948, respectively, resulting in net unrealized depreciation of $2,458,275.
During the year ended September 30, 2005, the Fund reclassified $10,030,604 of net amounts from undistributed net investment income to accumulated net loss, and $39,565 from undistributed net investment income to additional paid in capital, to align financial reporting with tax reporting.
NOTE 5 - Distributor
For the year ended September 30, 2005, FPA Fund Distributors, Inc. ("Distributor"), a wholly owned subsidiary of the Adviser, received $70,504 in net Fund share sales commissions after reallowance to other dealers. The Distributor pays its own overhead and general administrative expenses, the cost of supplemental sales literature, promotion and advertising.
NOTE 6 - Redemption Fees
A redemption fee of 2% applies to redemptions within 90 days of purchase for certain purchases made by persons eligible to purchase shares without an initial sales charge. For the year ended September 30, 2005, the Fund collected $170,485 in redemption fees, which amounted to less than $0.01 per share.
NOTE 7 - Distribution to Shareholders
On September 30, 2005, the Board of Directors declared a dividend from net investment income of $0.12 per share payable October 6, 2005 to shareholders of record on September 30, 2005. For financial statement purposes, this dividend was recorded on the ex-dividend date, October 3, 2005.
For tax purposes, all of the dividends paid during the fiscal years ended September 30, 2005 and 2004, were designated as ordinary income.
18
REPORT OF INDEPENDENT REGISTERED
PUBLIC ACCOUNTING FIRM
TO THE SHAREHOLDERS AND
BOARD OF DIRECTORS OF FPA NEW INCOME, INC.
We have audited the accompanying statement of assets and liabilities of FPA New Income, Inc. (the "Fund") including the portfolio of investments, as of September 30, 2005, the related statement of operations for the year then ended, the statements of changes in net assets for each of the two years in the period then ended, and financial highlights for each of the three years in the period then ended. These financial statements and financial highlights are the responsibility of the Fund's management. Our responsibility is to express an opinion on these financial statements and financial highlights based on our audits. The financial highlights of the Fund for each of the two years in the period ended September 30, 2002 were audited by other auditors whose report, dated November 11, 2002, expressed an unqualified opinion on those financial highlights.
We conducted our audits in accordance with standards of the Public Company Accounting Oversight Board (United States). Those standards require that we plan and perform the audit to obtain reasonable assurance about whether the financial statements and financial highlights are free of material misstatement. The Fund is not required to have, nor were we engaged to perform, an audit of its internal control over financial reporting. Our audits included consideration of internal control over financial reporting as a basis for designing audit procedures that are appropriate in the circumstances, but not for the purpose of expressing an opinion on the effectiveness of the Fund's internal control over financial reporting. Accordingly, we express no such opinion. An audit also includes examining, on a test basis, evidence supporting the amounts and disclosures in the financial statements, assessing the accounting principles used and significant estimates made by management, as well as evaluating the overall financial statement presentation. Our procedures included confirmation of securities owned as of September 30, 2005, by correspondence with the custodian. We believe that our audits provide a reasonable basis for our opinion.
In our opinion, the 2005 financial statements and financial highlights referred to above present fairly, in all material respects, the financial position of FPA New Income, Inc. as of September 30, 2005, the results of its operations for the year then ended, the changes in its net assets for each of the two years in the period then ended, and the financial highlights for each of the three years in the period then ended, in conformity with accounting principles generally accepted in the United States of America.

Los Angeles, California
November 14, 2005
19
SHAREHOLDER EXPENSE EXAMPLE
September 30, 2005
(Unaudited)
Fund Expenses
As a shareholder of the Fund, you incur two types of costs: (1) transaction costs, and (2) ongoing costs, including advisory and administrative fees; shareholder service fees; and other Fund expenses. The Example is intended to help you understand your ongoing costs (in dollars) of investing in the Fund and to compare these costs with the ongoing costs of investing in other mutual funds. The Example is based on an investment of $1,000 invested at the beginning of the year and held for the entire year.
Actual Expenses
The information in the table under the heading "Actual Performance" provides information about actual account values and actual expenses. You may use the information in this column, together with the amount you invested, to estimate the expenses that you paid over the period. Simply divide your account value by $1,000 (for example, an $8,600 account value divided by $1,000= 8.6), then multiply the result by the number in the first column in the row entitled "Expenses Paid During Period" to estimate the expenses you paid on your account during this period.
Hypothetical Example for Comparison Purposes
The information in the table under the heading "Hypothetical Performance (5% return before expenses)" provides information about hypothetical account values and hypothetical expenses based on the Fund's actual expense ratio and an assumed rate of return of 5% per year before expenses, which is not the Fund's actual return. The hypothetical account values and expenses may not be used to estimate the actual ending account balance or expenses you paid for the period. You may use this information to compare the ongoing costs of investing in the Fund and other funds. To do so, compare this 5% hypothetical example with the 5% hypothetical examples that appear in the shareholder reports of other funds.
Please note that the expenses shown in the table are meant to highlight your ongoing costs only and do not reflect any transactional costs. Therefore, the information under the heading "Hypothetical Performance (5% return before expenses)" is useful in comparing ongoing costs only, and will not help you determine the relative total costs of owning different funds. In addition, if these transactional costs were included, your costs would have been higher.
| | | Actual
Performance | | Hypothetical
Performance
(5% return
before
expenses) | |
Beginning Account Value
March 31, 2005 | | $ | 1,000.00 | | | $ | 1,000.00 | | |
Ending Account Value
September 30, 2005 | | $ | 1,012.70 | | | $ | 1,021.95 | | |
Expenses Paid During
Period* | | $ | 3.03 | | | $ | 3.05 | | |
* Expenses are equal to the Fund's annualized expense ratio of 0.60%, multiplied by the average account value over the period and prorated for the six-months ended September 30, 2005 (183/365 days).
RENEWAL OF INVESTMENT ADVISORY AGREEMENT
The Investment Advisory Agreement provides that it may be renewed from year to year by (i) the Board of Directors of the Fund or by the vote of a majority (as defined in the Investment Company Act of 1940) of the outstanding voting securities of the Fund, and (ii) by the vote of a majority of Directors who are not interested persons (as defined in the 1940 Act) of the Fund or of the Adviser cast in person at a meeting called for the purpose of voting on such approval. At a meeting of the Board of Directors held on November 8, 2004, the continuance of the advisory agreement through December 31, 2005, was approved by the Board of Directors and by a majority of the Directors who are not interested persons of the Fund or of the Adviser.
In determining whether to renew the advisory agreement, those Fund Directors who were not affiliated with the Adviser met separately to evaluate information provided by the Adviser in accordance with the 1940 Act and to determine their recommendation to the full Board of Directors. The Directors considered a variety of factors, including the quality of advisory, management and accounting services provided to the Fund, the fees and expenses borne by the Fund, the profitability of the Adviser and the investment performance of the Fund both on an absolute basis and as compared with a peer group of mutual funds. The Fund's advisory fee and expense ratio were also considered in light of the advisory fees and expense ratios of a peer group of mutual funds. The Directors noted the Fund's attractive long-term investment results and low-risk orientation and the quality and depth of experience of the Adviser and its investment and administrative personnel. Based upon its consideration of these and other relevant factors, the Directors concluded that the advisory fees and other expenses paid by the Fund are fair and that shareholders have received reasonable value in return for such fees and expenses.
20
DIRECTOR AND OFFICER INFORMATION
| Name, Age & Address | | Position(s)
With Fund/
Years Served | | Principal Occupation(s)
During the Past 5 Years | | Portfolios in
Fund Complex
Overseen | | Other Directorships | |
Willard H. Altman, Jr. – (70)*
11400 W. Olympic Blvd., #1200
Los Angeles, CA 90064 | | Director†
Years Served: 7 | | Retired. Formerly, until 1995, Partner of Ernst & Young LLP, a public accounting firm. | | | 6 | | | | |
|
Alfred E. Osborne, Jr. – (60)*
11400 W. Olympic Blvd., #1200
Los Angeles, CA 90064 | | Director†
Years Served: 6 | | Senior Associate Dean at The
John E. Anderson Graduate School of Management at UCLA. | | | 3 | | | Investment Company Institute, K2 Inc., Nordstrom, Inc., E* Capital Corporation, Equity Marketing Inc., and WM Group of Funds. | |
|
A. Robert Pisano – (62)*
11400 W. Olympic Blvd., #1200
Los Angeles, CA 90064 | | Director†
Years Served: 3 | | President and Chief Operating Officer of the Motion Picture Association of America, Inc. since October 2005. Formerly, until April 2005, National Executive Director and Chief Executive Officer of the Screen Actors Guild. | | | 4 | | | State Net, NetFlix, Resources Global Professionals, and The Motion Picture and Television Fund | |
|
Lawrence J. Sheehan – (73)*
11400 W. Olympic Blvd., #1200
Los Angeles, CA 90064 | | Director†
Years Served: 14 | | Retired. Formerly partner (1969 to 1994) and of counsel employee (1994-2002) of the firm of O'Melveny & Myers LLP, legal counsel to the Fund. | | | 5 | | | | |
|
Robert L. Rodriguez – (56)
11400 W. Olympic Blvd., #1200
Los Angeles, CA 90064 | | Director†
President & Chief Investment Officer
Years Served: 5 | | Principal and Chief Executive Officer of the Adviser. | | | 2 | | | First Pacific Advisors, Inc. and FPA Fund Distributors, Inc. | |
|
Thomas H. Atteberry (52)
11400 W. Olympic Blvd., #1200
Los Angeles, CA 90064 | | Vice President & Portfolio Manager
Years Served: 1 | | Vice President of the Adviser | | | | | | | |
|
Eric S. Ende – (61)
11400 W. Olympic Blvd., #1200
Los Angeles, CA 90064 | | Vice President
Years Served: 20 | | Senior Vice President of the Adviser. | | | 3 | | | | |
|
J. Richard Atwood – (45)
11400 W. Olympic Blvd., #1200
Los Angeles, CA 90064 | | Treasurer
Years Served: 8 | | Principal and Chief Operating Officer of the Adviser, President and Chief Executive Officer of FPA Fund Distributors, Inc. | | | | | | First Pacific Advisors, Inc. and FPA Fund Distributors, Inc. | |
|
Sherry Sasaki – (50)
11400 W. Olympic Blvd., #1200
Los Angeles, CA 90064 | | Secretary
Years Served: 21 | | Assistant Vice President and Secretary of the Advisor and Secretary of FPA Fund Distributors, Inc. | | | | | | | |
|
Christopher H. Thomas – (48)
11400 W. Olympic Blvd., #1200
Los Angeles, CA 90064 | | Chief Compliance Officer and Assistant Treasurer
Years Served: 10 | | Vice President and Controller of the Adviser and of FPA Fund Distributors, Inc. | | | | | | FPA Fund
Distributors, Inc. | |
|
† Directors serve until their resignation, removal or retirement.
* Audit Committee member
Additional information on the Directors is available in the Statement of Additional Information.
21
FPA NEW INCOME, INC.
INVESTMENT ADVISER
First Pacific Advisors, Inc.
11400 West Olympic Boulevard, Suite 1200
Los Angeles, California 90064
DISTRIBUTOR
FPA Fund Distributors, Inc.
11400 West Olympic Boulevard, Suite 1200
Los Angeles, California 90064
COUNSEL
O'Melveny & Myers LLP
Los Angeles, California
TICKER: FPNIX
CUSIP: 302544101
INDEPENDENT REGISTERED PUBLIC ACCOUNTING FIRM
Deloitte & Touche LLP
Los Angeles, California
CUSTODIAN & TRANSFER AGENT
State Street Bank and Trust Company
Boston, Massachusetts
SHAREHOLDER SERVICE AGENT
Boston Financial Data Services, Inc.
P.O. Box 8500
Boston, Massachusetts 02266-8500
(800) 638-3060
(617) 483-5000
This report has been prepared for the information of shareholders of FPA New Income, Inc., and is not authorized for distribution to prospective investors unless preceded or accompanied by a prospectus.
The Fund's complete proxy voting record for the 12 months ended June 30, 2005 is available without charge, upon request, by calling (800) 982-4372 and on the SEC's website at www.sec.gov.
The Fund's schedule of portfolio holdings, filed the second and fourth quarter on Form N-Q with the SEC, is available on the SEC's website at www.sec.gov. Form N-Q is available at the SEC's Public Reference Room in Washington, D.C., and information on the operations of the Public Reference Room may be obtained by calling (202) 942-8090. To obtain information on Form N-Q from the Fund, shareholders can call (800) 982-4372.
Item 2. Code of Ethics.
(a) The registrant has adopted a code of ethics that applies to the registrant’s senior executive and financial officers. Upon request, any person may obtain a copy of this code of ethics, without charge, by calling (800) 982-4372. A copy of the code of ethics is filed as an exhibit to this Form N-CSR.
(b) During the period covered by this report, there were not any amendments to the provisions of the code of ethics adopted in 2(a) above.
(c) During the period covered by this report, there were not any implicit or explicit waivers to the provisions of the code of ethics adopted in 2(a).
Item 3. Audit Committee Financial Expert.
The registrant’s board of directors has determined that Willard H. Altman, Jr., a member of the registrant’s audit committee and board of directors, is an “audit committee financial expert” and is “independent,” as those terms are defined in this Item. This designation will not increase the designee’s duties, obligations or liability as compared to his duties, obligations and liability as a member of the audit committee and of the board of directors. This designation does not affect the duties, obligations or liability of any other member of the audit committee or the board of directors.
Item 4. Principal Accountant Fees and Services.
| | | 2004 | | 2005 | |
(a) | Audit Fees | | $ | 27,000 | | $ | 31,620 | |
(b) | Audit Related Fees | | -0- | | -0- | |
(c) | Tax Fees | | $ | 5,250 | | $ | 5,765 | |
(d) | All Other Fees | | -0- | | -0- | |
(e)(1) Disclose the audit committee’s pre-approval policies and procedures described in paragraph (c)(7) of Rule 2-01 of Regulation S-X. The audit committee shall pre-approve all audit and permissible non-audit services that the committee considers compatible with maintaining the independent auditors’ independence. The pre-approval requirement will extend to all non-audit services provided to the registrant, the adviser, and any entity controlling, controlled by, or under common control with the adviser that provides ongoing services to the registrant, if the engagement relates directly to the operations and financial reporting of the registrant; provided, however, that an engagement of the registrant’s independent auditors to perform attest services for the registrant, the adviser or its affiliates required by generally accepted auditing standards to complete the examination of the registrant’s financial statements (such as an examination conducted
in accordance with Statement on Auditing Standards Number 70 issued by the American Institute of Certified Public Accountants), will be deem pre-approved if: (i) the registrant’s independent auditors inform the audit committee of the engagement, (ii) the registrant’s independent auditors advise the audit committee at least annually that the performance of this engagement will not impair the independent auditor’s independence with respect to the registrant, and (iii) the audit committee receives a copy of the independent auditor’s report prepared in connection with such services. The committee may delegate to one or more committee members the authority to review and pre-approve audit and permissible non-audit services. Actions taken under any such delegation will be reported to the full committee at its next meeting.
(e)(2) Disclose the percentage of services described in each of paragraphs (b) – (d) of this Item that were approved by the audit committee pursuant to paragraph (c)(7)(i)(C) of Rule 2-01 of Regulation S-X. 100% of the services provided to the registrant described in paragraphs (b) – (d) of this Item were pre-approved by the audit committee pursuant to paragraph (e)(1) of this Item. There were no services provided to the investment adviser or any entity controlling, controlled by or under common control with the adviser described in paragraphs (b) – (d) of this Item that were required to be pre-approved by the audit committee.
(f) If greater than 50%, disclose the percentage of hours expended on the principal accountant’s engagement to audit the registrant’s financial statements for the most recent fiscal year that were attributed to work performed by persons other than the principal accountant’s full-time, permanent employees. All services performed on the engagement to audit the registrant’s financial statements for the most recent fiscal year end were performed by the principal accountant’s full-time, permanent employees.
(g) Disclose the aggregate non-audit fees billed by the registrant’s accountant for services rendered to the registrant, and rendered to the registrant’s investment adviser (not including any sub-adviser whose role is primarily portfolio management and is subcontracted with or overseen by another investment adviser), and any entity controlling, controlled by, or under common control with the adviser that provides ongoing services to the registrant for each of the last two fiscal years of the registrant. None.
(h) Disclose whether the registrant’s audit committee of the board of directors has considered whether the provision of non-audit services that were rendered to the registrant’s investment adviser (not including any sub-adviser whose role is primarily portfolio management and is subcontracted with or overseen by another investment adviser), and any entity controlling, controlled by, or
under common control with the investment adviser that provides ongoing services to the registrant that were not pre-approved pursuant to paragraph (c)(7)(ii) of Rule 2-01 of Regulation S-X is compatible with maintaining the principal accountant’s independence. Not Applicable.
Item 5. Audit Committee of Listed Registrants.
The registrant has a separately-designated standing audit committee established in accordance with Section 3(a)(58)(A) of the Securities Exchange Act of 1934, consisting of all the independent directors of the registrant. The members of the audit committee are: Willard H. Altman, Jr., A. Robert Pisano, Alfred E. Osborne, Jr. and Lawrence J. Sheehan.
Item 6. Schedule of Investments. The schedule of investments is included as part of the report to stockholders filed under Item 1 of this Form.
Item 7. Disclosure of Proxy Voting Policies and Procedures for Closed-End Management Investment Companies. Not Applicable.
Item 8. Portfolio Managers of Closed-End Management Investment Companies. Not Applicable.
Item 9. Purchases of Equity Securities by Closed-End Management Investment Company and Affiliated Purchasers. Not Applicable.
Item 10. Submission of Matters to a Vote of Security Holders. There has been no material change to the procedures by which shareholders may recommend nominees to the registrant’s board of directors.
Item 11. Controls and Procedures.
(a) The principal executive officer and principal financial officer of the registrant have concluded that the registrant’s disclosure controls and procedures (as defined in Rule 30a-3(c) under the Investment Company Act of 1940) are effective based on their evaluation of the disclosure controls and procedures as of a date within 90 days of the filing date of this report.
(b) There have been no significant changes in the registrant’s internal controls over financial reporting (as defined in Rule 30a-3(d) under the Investment Company Act of 1940) that occurred during the registrant’s last fiscal half-year (the registrant’s second fiscal half-year in the case of an annual report) that has materially affected, or is reasonably likely to materially affect, the registrant’s internal controls over financial reporting.
Item 12. Exhibits.
(a)(1) Code of ethics as applies to the registrant’s officers and directors, as required to be disclosed under Item 2 of Form N-CSR. Attached hereto as Ex.99.CODE.ETH.
(a)(2) Separate certification for the registrant’s principal executive officer and principal financial officer, as required by Rule 30a-2(a) under the Investment Company Act of 1940. Attached hereto.
(a)(3) Not Applicable
(b) �� Separate certification for the registrant’s principal executive officer and principal financial officer, as required by Rule 30a-2(b) under the Investment Company Act of 1940. Attached hereto.
SIGNATURES
Pursuant to the Securities Exchange Act of 1934 and the Investment Company Act of 1940, the registrant has duly caused this report to be signed on its behalf by the undersigned, thereunto duly authorized.
FPA NEW INCOME, INC.
By: | /s/ ROBERT L. RODRIGUEZ | |
| Robert L. Rodriguez, President |
Date: December 2, 2005
Pursuant to the Securities Exchange Act of 1934 and the Investment Company Act of 1940, the registrant has duly caused this report to be signed on its behalf by the undersigned, thereunto duly authorized.
FPA NEW INCOME, INC.
By: | /s/ J. RICHARD ATWOOD | |
| J. Richard Atwood, Treasurer |
Date: December 2, 2005