UNITED STATES
SECURITIES AND EXCHANGE COMMISSION
Washington, D.C. 20549
FORM N-CSR
CERTIFIED SHAREHOLDER REPORT OF REGISTERED
MANAGEMENT INVESTMENT COMPANIES
Investment Company Act file number | 811-1735 |
|
FPA NEW INCOME, INC. |
(Exact name of registrant as specified in charter) |
|
11400 WEST OLYMPIC BLVD., SUITE 1200, LOS ANGELES, CALIFORNIA | | 90064 |
(Address of principal executive offices) | | (Zip code) |
|
J. RICHARD ATWOOD,
11400 WEST OLYMPIC BLVD., SUITE 1200, LOS ANGELES, CALIFORNIA 90064 |
(Name and address of agent for service) |
|
Registrant’s telephone number, including area code: | 310-473-0225 | |
|
Date of fiscal year end: | SEPTEMBER 30 | |
|
Date of reporting period: | SEPTEMBER 30, 2007 | |
| | | | | | | | |
Item 1. Report to Stockholders.
FPA New Income, Inc.
Annual Report
September 30, 2007

Distributor:
FPA FUND DISTRIBUTORS, INC.
11400 West Olympic Boulevard, Suite 1200
Los Angeles, California 90064
49170
LETTER TO SHAREHOLDERS
Dear Fellow Shareholders:
This Annual Report covers the fiscal year ended September 30, 2007. Your Fund's net asset value (NAV) per share closed at $11.03. During the fiscal year, your Fund paid four income dividends totaling $0.53. There were no capital gains distributions.
The following table shows the average annual total return for several different periods ended September 30 for the Fund and comparative indices. The data quoted represents past performance, and an investment in the Fund may fluctuate so that an investor's shares, when redeemed, may be worth more or less than their original cost.
| | | Periods Ended September 30, 2007 | |
| | | 1 Year | | 5 Years | | 10 Years | | 15 Years | | 20 Years | | FPA
Inception
7/1/1984 | |
New
Income
(NAV) | | | 5.36 | %* | | | 4.66 | %* | | | 5.60 | %* | | | 6.49 | %* | | | 7.96 | %* | | | 9.15 | %* | |
New
Income
(Sales
Charge) | | | 1.68 | %** | | | 3.92 | %** | | | 5.23 | %** | | | 6.23 | %** | | | 7.77 | %** | | | 8.98 | %** | |
Lipper
A-Rated
Average | | | 4.04 | % | | | 4.13 | % | | | 5.22 | % | | | 5.91 | % | | | 7.51 | % | | | NA | | |
Lehman
Govt/
Credit | | | 5.08 | % | | | 4.16 | % | | | 6.03 | % | | | 6.33 | % | | | 7.71 | % | | | 8.71 | % | |
The Fund's total rate of return for the fiscal year was 5.36%* versus 4.04% and 5.08% for the Lipper "A" Rated Bond Fund Average and Lehman Brothers Government/Corporate Bond Index, respectively. For the second half of the fiscal year, the total returns were: FPA New Income, Inc., 2.79%*; Lipper Average, 1.36%; and the Lehman Brothers Index, 2.51%. Finally, on a calendar year-to-date basis, the total returns were: FPA New Income, Inc., 4.21%*; the Lipper Average 2.74%; and the Lehman Brothers Index, 4.00%.
Comment on Morningstar's Lowering of Your Fund's Stewardship Grade
We feel compelled to comment on Morningstar's action to downgrade your Fund's stewardship grade. Morningstar recently changed its stewardship grading methodology and lowered your Fund's stewardship grade from "A" to "B." I want to assure you that we have done nothing to change how we manage the Fund or the principles that guide us. The protection and growth of your assets remain paramount in our thinking, as we have consistently stated. We strongly disagree with Morningstar's change and have communicated our displeasure with this action. I will briefly discuss why this was done and why we are of a different opinion. You may read our full response to Morningstar on our website at www.fpafunds.com. According to them, the two primary issues that led to this change are how they view our lack of performance-based compensation for fund managers and the absence of an independent chairman of the board of directors. In the first case, Morningstar wan ts to see that fund managers have a portion of their compensation subject to a relative market performance adjustment. They believe this helps to better align the interests of the manager with those of the shareholder. Morningstar's model is based on the manager being an employee of the management company, but does not adequately consider our company structure, where the managers of your Fund are owners of FPA. We believe that managers' ownership of FPA creates a strong, long-term incentive for stewardship and aligns the long-term interests of the managers with those of Fund shareholders. The second issue, independent chairmanship, has been addressed by your Fund's independent board members and subsequent to the issuance of Morningstar's grades they elected an independent chairman. The board has maintained its autonomy with more than 75% of its members independent outside directors, who bring impartial and objective skills to the oversight of your Fund. In all, FPA's management system has led to unprecedente d stability over the last 30 years, which is longer than Morningstar has existed. Along with the board, we will
* Does not reflect deduction of the sales charge which, if reflected, would reduce the performance shown
** Reflects deduction of the maximum sales charge of 3.5% of the offering price
1
continue to maintain our emphasis on strong stewardship and governance over the Fund, as we have since we took over its management almost 25 years ago.
Commentary
Your Fund outperformed both the Lipper "A" rated Bond Fund Average and the Lehman Brothers Government/Credit index for the six-month, fiscal year and calendar year-to-date periods ended September 30, 2007. We achieved this positive relative performance while taking considerably less credit risk and maturity risk. These comments also apply to the five-year measurement period as well. For the past five years, we have also maintained a portfolio average maturity and duration that have been materially less than those of the Lehman Index. We believe we have attained a very high risk-adjusted total return. The results of this strategy are reflected by your Fund's very low volatility relative to that of the Lehman Index as well as by its attractive relative total return.
Your Fund's duration, a measure of portfolio volatility, was 1.4 years as of September 30, 2007, which is up from 0.98 years at the beginning of this fiscal year. Between March and August of this fiscal year, we began to extend the average maturity and duration of your Fund. By June 30, the Fund's duration had risen to 1.68 years. By comparison, the Lehman Index's duration is 5.2 years. What this means is that your Fund's current duration would indicate that the portfolio's potential volatility would be approximately 73% less than the index's volatility. During the last five years, your Fund's average duration has ranged from barely 2 years to 0.53 years, which occurred on September 30, 2005. We have been unwilling to invest in longer-term bonds since we have been of the opinion that their potential return has been inadequate for the amount of volatility risk that must be accepted. On June 16, 2003, we wrote "Buyer's Strike," available on ou r website, which explains why we would not be a buyer of longer-term bonds. We considered longer-term Treasury bonds (typically ten-year maturities or more), with yields in the 3% range, to be nothing more than speculative securities since, in our opinion, they provided no investment value. They did not or would not provide a sufficient degree of protection from the potential risks of higher levels of future inflation or from the ever-increasing federal government's fiscal mismanagement. Since then, we now include the 4% range, because of the recently expanded entitlement liabilities created by the new prescription-drug benefits program. This new program was added without the federal government first reforming any of its existing and expanding entitlement programs. Furthermore, these new benefits were added while the country is currently engaged in fighting a war. In some ways, this reminds us of what took place in the 1960s when Medicar e was enacted at the same time we were engaged in another war. These long-term IOUs will eventually come back to exert a high price on a future generation of investors and citizens. We do not believe these low levels of yields provide adequate compensation for these risks.
You should realize that there will be periods when your bond Fund's total return will lag that of the other bond funds or the indexes since we are unwilling to accept the risks that these other managers seem willing to accept. As an example, this calendar year has been a tale of two different bond markets. From March 7 through June 12, the Merrill Lynch U.S. Corporate & Government Master Index's total return was a negative 2.18% while your Fund achieved a positive 0.64% return, a positive 282-basis-point performance differential. This took place because interest rates rose, as reflected in the rise from 4.49% to 5.30% by the ten-year Treasury bond's yield. Between June 12 and November 2, the Merrill Index achieved a 6.16% total return, as the ten-year Treasury bond yield fell from 5.30% to 4.32%. By comparison, your Fund produced a 3.34% total return, a negative 282-basis-point performance differential. Over this measurement period, your Fund's total return was 4.01% versus the 3.84% for the Merrill Index. The Fund achieved this return with less volatility and credit risk. The Fund's shorter duration protected its value from the negative effects of rising interest rates, while its shorter duration hindered its performance as interest
2
rates fell. During this period, longer-term bond yields rose to a level where they were barely attractive to us, if at all. We were willing to extend maturities out to the equivalent of three years with some purchases that had maturities as long as five years. Beyond this maturity level, the yield and risk were unacceptable to us.
For the past two years, we have been aggressively culling out securities that had credit, structure or sector risk. In particular, we eliminated a class of security, Alternative-A, that has recently come into question and is now considered one of the riskier sectors of the mortgage market. We suspected that there might be credit issues developing in this sector and therefore, we sold all of our holdings more than two years ago. With the recent disclosures of aggressive and unsound underwriting standards that took place in this sector, our decision has proven to be correct. At the time of their elimination, we took on the philosophy or strategy that we would no longer be like Baskin-Robbins with 31 flavors of debt investment. We wanted to become a new fixed-income ice cream store with only one flavor, vanilla. We were of the opinion that we were on the verge of a period of credit excess and that the growing variety and complexity of new types of debt securities would create problems in the fixed-income market. Only those securities that were more vanilla in flavor would be able to trade or even be evaluated and priced. We believe our conservative credit posture is finally being vindicated by the growing list of credit issues and financial service company asset impairment problems and charges.
On November 4, Citigroup Inc. announced a charge of as much as $11 billion to its earnings because securities, supported by subprime loans, were downgraded by the rating agencies. On a conference call, the chief financial officer indicated that for many of these securities it was difficult, if not impossible, to get market price evaluations and, therefore, they used pricing models that were negatively affected by the credit-rating agency downgrades. In their September 30, 2007 10-Q, they reported they had $134.8 billion of Level 3, mark to model assets, which compares to stockholders' equity of $127.1 billion. These are the most difficult and questionable securities to evaluate. We mention this example because of Citigroup's importance to the financial services industry. Their problems reflect the growing asset quality and pricing issues facing many financial institution s. In contrast to these reported problems, your Fund accounts for 80% of its holdings at mark to market prices with another 20% evaluated by a third-party pricing service. We have zero investments in the mark to model category — more on this later in this letter. Because of this, your Fund can be evaluated far more easily and accurately.
Your Fund has not and will not stretch for yield. It is at its highest weighted average credit quality ever, with AAA or higher rated securities representing nearly 91% of the Fund, with an additional 8% invested in AA securities. A record low 0.9% is invested in high-yield securities. Within these totals, we have included the underlying credit grades of the commercial paper securities that we own. Money-market and short-term U.S. Treasury securities represent 19%. Government/Agency securities total 71% and are also included in the 91% total. We do not own any subprime-related securities, collateralized debt obligations (CDOs), or any of the other alphabet soup names of securities that have been created with complex derivative structures. Beyond Treasury and Agency securities, we own mortgage-backed securities and some collateralized mortgage obligation bonds that are easily understandable. During these past two years, we have actively and a ggressively reduced the number of qualifying companies on our commercial paper approved buy list. As this list has grown shorter, we have increased our exposure to Treasury bills. We have not utilized any of the newly created commercial paper alternatives, such as structured investment vehicles (SIVs), that are now growing in disrepute. Our focus has been on preserving and protecting the capital you have entrusted to us.
In the March 2007 Shareholder Letter, we had an extensive discussion entitled, "Special Commentary." We discussed the growing risks in
3
several areas of the capital markets and went on to detail them. On June 28, I gave a speech before the Chartered Financial Analyst Society of Chicago entitled, "Absence of Fear," which you may read on our website, www.fpafunds.com. This is a more detailed discussion of what was covered in the Shareholder Letter. Since then, many of the potential risks identified have now become more widely understood. The collapse in loan originations and pricing in the subprime and Alt-A loan sectors along with questioning of security pricing and credit-rating models has been covered widely in the press. On October 12, the front page of the Wall Street Journal led with the story, "U.S. Investors Face an Age of Murky Pricing." A discussion of the difficulties and pitfalls of pricing highly complex securities is covered quite well. A brief discussion details the three different methodologies used to price securities: marking to market; marking to matrix; and marking to model. As Warren Buffett said, "They call it 'marking to market,' but it's really marking to myth." I refer to "marking to model" as "Imaginary Accounting." You imagine a price and then you account for it at that price. Many of these securities values are predicated on valuation models that were created by management. This is like having the fox guard the hen house. It is all legal but it does not give us great confidence in the viability or soundness in the balance sheets of many financial service companies. Many of these securities have become so complex that it is nearly impossible to accurately value them. It is all guess work.
I highlight these issues because, for several years, U.S. economic growth has been driven by high credit growth and the development of the structured finance industry. According to David Rosenberg, chief North American economist at Merrill Lynch, the ratio of total household debt to total disposable income has risen to 136% from 100% in 2000. During this six-year span, the consumer added as much debt as was added in the previous 40 years combined. The vast majority of this debt growth has been created outside of the banking system. Through the second quarter of this year, non-bank credit creation was $3.12 trillion while bank credit creation was $578 billion, according to MacroMavens. Between 2000 and 2006, it is estimated that total mortgage securitizations outstanding rose from $5.1 trillion to $10.4 trillion. Collateralized debt obligations — these take mortgage securitizations and pool them into another synthetic security — rose from approximately $99 billion to $562 billion for this same period. These numbers do not include collateralized lease obligations, structured investment vehicles, now the subject of intense concern, or the many other types of private credit transactions that have been creatively developed. Most of these securities do not come under the regulation of the banking system. The securitizations that are under the most stress are those that are dependent upon questionable borrowers, subprime for example, or have loans that have been underwritten with highly lax credit standards. Most of the structured finance issues revolve around housing-related securities, but we are of the opinion that questionable underwriting processes spread to all areas of the credit market.
On September 18, the Federal Reserve lowered the Fed Funds rate by 1/2 percent to 4.75%. The stock market took this as an all-clear sign that everything is going to be all right. Many "experts" are saying that the worst of the credit crisis is over and that 2008 will be just fine. We disagree! The ABX Indexes, indexes based on several asset-backed securitizations backed by subprime credit loans of different periods of issuance, have recently been hitting new lows compared to those that took place at the height of the August credit crisis. It took years for the excesses in the credit system to develop. To think a few weeks of market decli ne and a 1/2 point cut in the Fed Fund's rate will solve our large and varied credit issues seems to us to be a bit unrealistic. This credit crisis, unlike earlier ones which were a function of Fed policy actions that led to higher interest rates and a lessening in credit availability, had its genesis in unsound underwriting and aggressive credit creation that was accommodated by the credit-rating agencies' use of faulty models. The basic problem is that borrowers took on more debt than they could handle and the rating agencies had faulty
4
models that allowed large-scale debt sales to buyers who had little understanding of what the risks were of the particular security they were buying. All that counted was that there was an appropriate credit grade that allowed the buyer to purchase a structured finance security at a yield substantially higher than what could have been attained with a similarly rated corporate bond. These ratings have been shown to be quite faulty, with Moody's, Standard & Poor's and Fitch trying to get ahead of the situation by announcing a multitude of credit downgrades. Several of these downgrades entail securities rated as high as AAA that have now been reduced to as low as BB-. The pricing reaction to these downgrades could be as much as an 80% decline in value. In a word, incredible! They all have said that they have modified their models in light of new information. As the old saying goes, "Fool me once, shame on you. Fool me twice, shame on me." M any buyers worldwide were sold securities that were not what they thought they were. There was a scramble for yield, in a low interest-rate world, that allowed this mess to develop. To think that these buyers will return rapidly is, in our opinion, quite optimistic. It will take a revamping of the structured finance industry and a restructuring of the credit-rating agencies to re-establish confidence in the entire process. This will take time and, therefore, structured finance credit creation should shrink in size for the foreseeable future.
Should we be correct in this assessment, a smaller potential structured finance market will lead to a large number of layoffs from those companies that specialize in this area. Unless a multitude of financial institutions are willing to grow their balance sheets and increase their leverage ratios, particularly banks, it would seem that we are in for a rough spell, regarding credit availability and growth, and this should have negative implications for economic growth. A contraction in structured finance originations will likely prolong the housing slump by further depressing home construction, turnover and prices, resulting in a further erosion of consumer confidence and spending. A cleansing of the credit system should and will have to take place. At this time, we have seen no material cleansing of toxic investment securities within the capital market. If any structured loans have traded, they have been of the higher-quality credit ratings. We believe most holders have not been able to or willing to take the appropriate price discounts to move these troubled securities off their books. These comments apply to other areas of the credit market such as high-yield and leverage buyout loans. We do not believe these credit market issues will likely be resolved within the next twelve to eighteen months. Additional pain and fear must occur before this process can begin.
Outlook
In light of the above comments, we believe the odds of a 2008 recession have increased to at least 50% or more. Given the growing credit contraction, oil prices that are nearly $95 per barrel and the dollar setting new all-time lows versus a basket of currencies, future Fed policy actions may prove rather ineffective in dealing with these challenges. The Fed followed up its September 18 lowering of the Fed Funds rate by lowering it again by 25 basis points on October 31. The financial markets' reaction was far more muted this time than the first lowering, when equity markets rallied strongly and bond yields fell. We are of the opinion that the Fed will lower the Fed Funds rate into the 3.75% to 4% range next year, or lower, as housing, capital markets and consumer issues negatively affect economic and corporate earnings growth; however, the Fed will have to be measured in its response otherwise, Chairman Bernanke may receive the moniker "Gre enspan Lite," in essence, lowering interest rates to a level that potentially leads to another type of asset bubble. There has been a very negative reaction to these two Fed Funds rate reductions in the currency market, as reflected by the dollar's 4.2% decline versus the value of a basket of currencies. A sharp decline in the dollar's value has both positive and negative potential outcomes; however, we believe a sharp decline in the dollar poses destabilizing risks that are not being adequately reflected in the financial markets.
5
We view consensus corporate earnings growth expectations as being too high and believe that they will have to be lowered. Only recently have various types of financial services companies begun to recognize their problem loans and investments, with charges and provisions for future losses. Many of these stocks initially reacted favorably to these actions and especially after the first Fed Funds rate lowering. The belief was that these companies were getting their problems behind them. Again, we believe the consensus is being too optimistic. Generally, managements are always initially optimistic, until they have to face the grim reality of the situation, and this process should extend well into 2008. Since then, financial service stocks have given up most of their gains or they are setting new lows. We believe this is only the initial phase of a more protracted and difficult credit environment. We expect credit spreads to widen next year for s everal bond sectors. Should the perception grow that recession is increasingly likely next year, high-yield bond spreads should widen considerably further. They would have to more than double their current level before we would become seriously interested in the sector.
Given this negative view for economic growth and the growing credit crisis, shouldn't we be increasing the portfolio's average duration and maturity, in the event that yield levels fall more? Treasury bond yields have recently fallen dramatically, with yields below 4% for maturities of five years or less while the ten-year Treasury yields 4.32%. We see little, if any, value in any of these maturities and, therefore, we will not be deploying capital into any middle or longer-term maturities. We will wait for a more attractive and rewarding yield level. With those closing comments, Tom Atteberry will convey his thoughts to you.
Thomas H. Atteberry Commentary
The third quarter of 2007 was the age of discovery; however, unlike the more glorious one described in history books, this age dealt with who and what entities owned the poorly underwritten mortgage loans of the last several years, and how much money they borrowed to acquire this poor-quality asset. Just prior to the beginning of the quarter, it was two hedge funds at Bear Stearns Asset Management; in the middle of the quarter it was a regional bank in Germany's Irish subsidiary; and at the end of the quarter it was a previously little known off-balance-sheet vehicle called a SIV or Structured Investment Vehicle. So it went from a risk-taking investor (a hedge fund) to a risk-averse investor (a money-market fund that buys asset-backed commercial paper issued by a SIV). In more general terms, broad cross sections of investors have exposure to this questionable asset. One significant question raised during this financial age of discovery is, what is the price of these mortgage assets? This "price discovery" is still underway. To date, the results have not been pleasant, with the potential buyer of the bonds offering a much lower value than the seller feels their cherished asset is worth. This has resulted in very little trading of many of the riskier mortgage-backed and mortgage-related bonds during the quarter.
From a fundamental perspective, it is our view that this action by the Fed will not have a major positive impact on the housing and mortgage markets. The effects of much tighter underwriting standards have started to be felt, as evidenced by the drop in subprime issuance from approximately $175 billion to $75 billion in the second half of the year. Over the next 15 months approximately $50 billion in adjustable subprime mortgages will reset each month. This reset event will result in the monthly payment for these mortgages increasing by upwards of 20%. It is our view that such a reset has the potential to increase the delinquency and default rates for the underlying mortgage pools. This could result in more houses coming on the market for sale during a period of greatly diminished demand for new or existing houses. The bottom line is that we think this event will lead, at best, to flat housing prices but more likely declining house values be tween now and the end of 2008.
We have spent extensive time evaluating the mortgage-backed securities segment of the fixed-
6
income bond market and have concluded that a 10-15% decline in home prices can have a significant negative impact on the value of all but the most senior tranche of a CMO. The subordinated tranches of these CMOs may experience substantial reduction in the amount of principal that is returned to the investor. This is a lesson we learned very well during the early portion of this decade when we owned subordinated tranches of manufactured-housing loan securitizations. It is that experience and gained knowledge that has kept us out of the subprime portion of the mortgage market today. There are significant similarities in the underwriting standards and loan quality between both subprime mortgages and manufactured-housing loans.
Much has been commented on how subprime mortgage holders should have their loans modified in order to reduce or eliminate the negative impact that will result from their loans resetting once the fixed-rate period concludes. A recent survey revealed that of those loans originated in 2006 that were no- or low-documentation in nature, 60% of the borrowers may have misrepresented their income by a factor of 50%. Even with a modification of the loan terms, a misstatement of income of this magnitude will make the mortgage difficult to perform over a long period of time. Knowing this information also makes it difficult for the loan servicer, lender, or government entity to institute blanket programs designed to modify these loans.
The expansion of the subprime and housing problem, the age of "price discovery," the contraction in available mortgage lending money, and the significant amount of questionable or fraudulent loan documentation are just a few of the myriad problems facing the housing industry. It is our opinion that all the bad news and its impact on the market has not yet occurred. The biggest factor is how this will impact housing prices. If prices continue to fall, it will make refinancing and modifications difficult to execute. From an investor's perspective, clarity and confidence need to return to the market. For example, investors in money-market funds may not know that their fund invested in a SIV. In addition, the fund managers may not have any idea about the underlying holdings of the SIV it invested in, only that a rating agency rated it AAA. From a confidence perspective, inve stors appear to be suspect of the complexity of investment vehicles. They have fled those investments, as evidenced by lack of bids, for the comfort of the shorter-term Treasury market, which was demonstrated by the 84-basis-point rally in the two-year Treasury note over the past quarter.
With those closing comments, we thank you for your investment and support.
Respectfully submitted,

Robert L. Rodriguez, CFA
President and Chief Investment Officer

Thomas H. Atteberry
Vice President and Portfolio Manager
November 5, 2007
The discussion of Fund investments represents the views of the Fund's managers at the time of this report and are subject to change without notice. References to individual securities are for informational purposes only and should not be construed as recommendations to purchase or sell individual securities.
7
HISTORICAL PERFORMANCE
Change in Value of a $10,000 Investment in FPA New Income, Inc. vs. Lehman Brothers Government/Credit Index and Lipper Corporate Debt A Rated Fund Average from October 1, 1997 to September 30, 2007
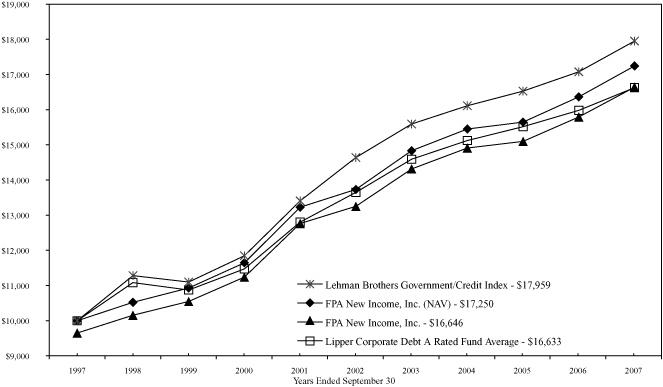
Past performance is not indicative of future performance. The Lehman Brothers Government/Credit Index is a broad-based unmanaged index of all government and corporate bonds that are investment grade with at least one year to maturity. The Lehman Brothers Government/Credit Index does not reflect any commissions or fees which would be incurred by an investor purchasing the securities it represents. The Lipper Corporate Debt A Rated Fund Average provides an additional comparison of how your Fund performed in relation to other mutual funds with similar objectives. The Lipper data does not include sales charges. The performance shown for FPA New Income, Inc., with an ending value of $16,646 reflects deduction of the current maximum sales charge of 3.5% of the offering price. In addition, since investors purchase shares of the Fund with varying sales charges depending primarily on volume purchased, the Fund's performance at net asset value (NAV) i s also shown, as reflected by the ending value of $17,250. The performance of the Fund and of the Averages is computed on a total return basis which includes reinvestment of all distributions.
FORWARD LOOKING STATEMENT DISCLOSURE
As mutual fund managers, one of our responsibilities is to communicate with shareholders in an open and direct manner. Insofar as some of our opinions and comments in our letters to shareholders are based on current management expectations, they are considered "forward-looking statements" which may or may not be accurate over the long term. While we believe we have a reasonable basis for our comments and we have confidence in our opinions, actual results may differ materially from those we anticipate. You can identify forward-looking statements by words such as "believe," "expect," "may," "anticipate," and other similar expressions when discussing prospects for particular portfolio holdings and/or the markets, generally. We cannot, however, assure future results and disclaim any obligation to update or alter any forward-looking statements, whether as a result of new information, future events, or otherwise. Further, information provided in t his report should not be construed as a recommendation to purchase or sell any particular security.
8
PORTFOLIO SUMMARY
September 30, 2007
| Bonds & Debentures | | | | | | | 84.4 | % | |
| U.S. Agencies | | | 29.1 | % | | | | | |
| Mortgage Pass-Through | | | 19.6 | % | | | | | |
| Mortgage-Backed | | | 18.1 | % | | | | | |
| Corporate | | | 6.1 | % | | | | | |
| U.S. Treasury | | | 5.9 | % | | | | | |
| Short-Term U.S. Treasury | | | 4.1 | % | | | | | |
| International | | | 1.2 | % | | | | | |
| Derivatives - Interest Only | | | 0.3 | % | | | | | |
| Short-Term Corporate Notes | | | | | | | 14.6 | % | |
| Other Assets and Liabilities, net | | | | | | | 1.0 | % | |
| Total Net Assets | | | | | | | 100.0 | % | |
MAJOR PORTFOLIO CHANGES
Six Months Ended September 30, 2007
(Unaudited)
| | | Shares or
Principal Amount | |
| NET PURCHASES | |
| Non-Convertible Bonds & Debentures | |
| Federal Farm Credit Bank — 5.5% 2012 (1) | | $ | 17,440,000 | | |
| Federal Home Loan Bank — 5.3% 2011 (1) | | $ | 17,000,000 | | |
| Federal Home Loan Mortgage Corporation 3241 CL DA — 5.5% 2034 (1) | | $ | 17,650,485 | | |
| Federal Home Loan Mortgage Corporation 3283 CL PA — 5.5% 2036 (1) | | $ | 25,345,724 | | |
| Federal Home Loan Mortgage Corporation 1G1939 — 5.938% 2037 (1) | | $ | 16,073,629 | | |
| Federal Home Loan Mortgage Corporation 3152 CL DB — 6% 2030 (1) | | $ | 23,067,000 | | |
| Federal Home Loan Mortgage Corporation G12661 — 6% 2017 (1) | | $ | 13,031,717 | | |
| Federal Home Loan Mortgage Corporation 3164 CL QV — 6.5% 2017 (1) | | $ | 16,802,019 | | |
| Federal National Mortgage Association 2007-42 CL YA — 5.5% 2036 (1) | | $ | 21,080,308 | | |
| Federal National Mortgage Association 256869 — 6% 2017 (1) | | $ | 18,950,506 | | |
| Federal National Mortgage Association 2005-112 CL NB — 6% 2030 (1) | | $ | 17,960,234 | | |
| Federal National Mortgage Association 2006-80 CL PD — 6% 2030 (1) | | $ | 15,764,000 | | |
| Toyota Motor Credit Corporation — 5.25% 2008 (1) | | $ | 50,000,000 | | |
| U.S.Treasury Note — 4.125% 2008 (1) | | $ | 20,000,000 | | |
| U.S.Treasury Note — 4.75% 2012 (1) | | $ | 17,500,000 | | |
| NET SALES | |
| Non-Convertible Bonds & Debentures | |
| Metaldyne Corporation — 11% 2012 (2) | | $ | 7,880,000 | | |
| Qwest Communications International, lnc. — 9.0575% 2009 | | $ | 8,015,000 | | |
| Federal Farm Credit Bank — 5.25% 2008 (2) | | $ | 12,595,000 | | |
| Federal Home Loan Bank — 5.125% 2008 | | $ | 17,000,000 | | |
| Preferred Stock | |
| Pennsylvania Real Estate Investment Trust (2) | | | 93,800 | shs. | |
(1) Indicates new commitment to portfolio
(2) Indicates elimination from portfolio
9
PORTFOLIO OF INVESTMENTS
September 30, 2007
| BONDS & DEBENTURES | | Principal
Amount | | Value | |
| U.S. AGENCIES SECURITIES — 29.1% | |
| Federal Agriculture Mortgage Corporation | |
| — 4.25% 2008 | | $ | 23,424,000 | | | $ | 23,339,205 | | |
| — 4.875% 2011* | | | 19,610,000 | | | | 19,780,999 | | |
| Federal Farm Credit Bank | |
| — 4.875% 2008 | | | 25,000,000 | | | | 25,077,500 | | |
| — 5% 2008 | | | 43,000,000 | | | | 43,245,100 | | |
| — 5.15% 2008 | | | 25,000,000 | | | | 25,029,750 | | |
| — 5.25% 2009 | | | 49,630,000 | | | | 50,250,375 | | |
| — 5.5% 2008 | | | 25,000,000 | | | | 25,142,500 | | |
| — 5.55% 2012 | | | 17,440,000 | | | | 17,811,821 | | |
| Federal Home Loan Bank | |
| — 3.5% 2009 | | | 15,000,000 | | | | 14,676,000 | | |
| — 4.75% 2009 | | | 75,000,000 | | | | 75,370,500 | | |
| — 5.125% 2008 | | | 8,000,000 | | | | 8,016,000 | | |
| — 5.25% 2009 | | | 135,780,000 | | | | 137,213,837 | | |
| — 5.3% 2011 | | | 17,000,000 | | | | 17,162,031 | | |
| Tennessee Valley Authority — 5.375% 2008 | | | 51,512,000 | | | | 51,978,828 | | |
| TOTAL U.S. AGENCIES SECURITIES | | | | | | $ | 534,094,446 | | |
| MORTGAGE PASS-THROUGH SECURITIES — 19.6% | |
| Federal Home Loan Mortgage Corporation | |
| M90825 — 3.5% 2008 | | $ | 3,360,739 | | | $ | 3,329,551 | | |
| M90828 — 3.5% 2008 | | | 4,998,302 | | | | 4,948,019 | | |
| M90830 — 3.5% 2008 | | | 3,844,704 | | | | 3,803,143 | | |
| 1G1939 — 5.938% 2037 | | | 16,073,629 | | | | 16,786,896 | | |
| 1Q0102 — 5.898% 2036 | | | 27,302,749 | | | | 27,481,923 | | |
| J03433 — 6% 2016 | | | 11,544,249 | | | | 11,823,851 | | |
| J04028 — 6% 2016 | | | 1,855,328 | | | | 1,886,590 | | |
| J02913 — 6% 2016 | | | 3,853,384 | | | | 3,913,593 | | |
| G12261 — 6% 2016 | | | 4,912,170 | | | | 4,988,923 | | |
| E02206 — 6% 2016. | | | 3,745,202 | | | | 3,792,541 | | |
| J03602 — 6% 2016 | | | 1,228,461 | | | | 1,247,656 | | |
| J03666 — 6% 2016 | | | 915,120 | | | | 929,419 | | |
| J03856 — 6% 2016 | | | 1,986,448 | | | | 2,017,486 | | |
| J04095 — 6% 2017 | | | 5,731,420 | | | | 5,827,765 | | |
| J04191 — 6% 2017 | | | 1,270,792 | | | | 1,290,648 | | |
| G12661 — 6% 2017 | | | 13,031,717 | | | | 13,235,338 | | |
| G12648 — 6% 2017 | | | 2,690,826 | | | | 2,732,870 | | |
| J04756 — 6% 2017 | | | 1,595,430 | | | | 1,620,359 | | |
| J04809 — 6% 2017 | | | 1,562,620 | | | | 1,587,036 | | |
| J04845 — 6% 2017 | | | 2,552,406 | | | | 2,592,287 | | |
10
PORTFOLIO OF INVESTMENTS
September 30, 2007
| BONDS & DEBENTURES — Continued | | Principal
Amount | | Value | |
| J05642 — 6% 2017 | | | 8,335,386 | | | | 8,454,832 | | |
| E02330 — 6% 2017 | | | 2,937,898 | | | | 2,983,803 | | |
| A26942 — 6.5% 2034 | | | 2,517,905 | | | | 2,562,069 | | |
| G08107 — 6.5% 2036 | | | 11,115,756 | | | | 11,331,124 | | |
| A43431 — 6.5% 2036 | | | 4,960,887 | | | | 5,055,454 | | |
| P21237 — 6.5% 2036 | | | 1,590,077 | | | | 1,625,536 | | |
| P50543 — 6.5% 2037 | | | 930,196 | | | | 950,902 | | |
| Federal National Mortgage Association | |
| 725492 — 5.5% 2014 | | | 3,267,964 | | | | 3,289,271 | | |
| 865963 — 5.956% 2036 | | | 15,741,532 | | | | 15,913,705 | | |
| 253997 — 6% 2011 | | | 1,244,670 | | | | 1,258,797 | | |
| 725258 — 6% 2012 | | | 6,152,878 | | | | 6,238,341 | | |
| 256266 — 6% 2016 | | | 5,768,384 | | | | 5,896,673 | | |
| 256385 — 6% 2016 | | | 1,167,942 | | | | 1,194,326 | | |
| 256502 — 6% 2016 | | | 2,514,958 | | | | 2,572,450 | | |
| 256547 — 6% 2016 | | | 17,329,307 | | | | 17,600,077 | | |
| 256560 — 6% 2017 | | | 17,333,313 | | | | 17,604,146 | | |
| 928002 — 6% 2017 | | | 2,055,406 | | | | 2,087,522 | | |
| 256632 — 6% 2017 | | | 5,875,088 | | | | 5,966,886 | | |
| 256683 — 6% 2017 | | | 11,191,744 | | | | 11,450,385 | | |
| 928100 — 6% 2017 | | | 1,538,537 | | | | 1,562,577 | | |
| 928128 — 6% 2017 | | | 1,739,086 | | | | 1,766,259 | | |
| 928249 — 6% 2017 | | | 2,406,253 | | | | 2,462,776 | | |
| 256743 — 6% 2017 | | | 4,348,266 | | | | 4,416,208 | | |
| 256838 — 6% 2017 | | | 313,190 | | | | 318,084 | | |
| 256794 — 6% 2017 | | | 8,434,546 | | | | 8,566,336 | | |
| 256869 — 6% 2017 | | | 18,950,506 | | | | 19,246,608 | | |
| 820812 — 6.5% 2035 | | | 1,705,466 | | | | 1,736,910 | | |
| 840325 — 6.5% 2035 | | | 3,255,400 | | | | 3,314,062 | | |
| 844274 — 6.5% 2035 | | | 4,887,271 | | | | 4,966,689 | | |
| 844613 — 6.5% 2035 | | | 3,622,815 | | | | 3,688,098 | | |
| 846597 — 6.5% 2035 | | | 3,471,745 | | | | 3,535,755 | | |
| 848420 — 6.5% 2035 | | | 8,054,797 | | | | 8,185,687 | | |
| 845365 — 6.5% 2036 | | | 11,826,879 | | | | 12,059,721 | | |
| 848270 — 6.5% 2036 | | | 1,471,668 | | | | 1,497,878 | | |
| 850655 — 6.5% 2036 | | | 6,953,476 | | | | 7,081,681 | | |
| 851095 — 6.5% 2036 | | | 5,766,068 | | | | 5,868,762 | | |
| 865176 — 6.5% 2036 | | | 9,594,251 | | | | 9,886,576 | | |
| 872740 — 6.5% 2036 | | | 714,999 | | | | 729,485 | | |
| 886320 — 6.5% 2036 | | | 578,930 | | | | 585,316 | | |
| 893835 — 6.5% 2036 | | | 1,378,554 | | | | 1,393,870 | | |
| 894362 — 6.5% 2036 | | | 2,025,340 | | | | 2,047,376 | | |
11
PORTFOLIO OF INVESTMENTS
September 30, 2007
| BONDS & DEBENTURES — Continued | | Principal
Amount | | Value | |
| 894363 — 6.5% 2036 | | | 1,476,071 | | | | 1,492,131 | | |
| 906417 — 6.5% 2036 | | | 2,656,092 | | | | 2,684,857 | | |
| 909540 — 6.5% 2037 | | | 2,232,195 | | | | 2,256,258 | | |
| 923306 — 6.5% 2037 | | | 2,336,777 | | | | 2,361,593 | | |
| 918264 — 6.5% 2037 | | | 3,803,105 | | | | 3,843,114 | | |
| 323282 — 7.5% 2028 | | | 1,181,794 | | | | 1,245,504 | | |
| TOTAL MORTGAGE-BACKED PASS-THROUGH SECURITIES | | | | | | $ | 358,672,364 | | |
| MORTGAGE-BACKED SECURITIES — 18.1% | |
| BOAA 2003-6 CL 1NC2 — 8% 2033 | | $ | 1,710,087 | | | $ | 1,777,422 | | |
| Chase MTG 2003-S14 CL 2A4 — 7.5% 2034 | | | 12,042,107 | | | | 12,501,212 | | |
| CWHL 2002-36 CL A20 — 5% 2033 | | | 435,129 | | | | 432,137 | | |
| Federal Home Loan Mortgage Corporation | |
| 1534 CL IA — 3.97% 2023 (Floating Rate Note) | | | 509,053 | | | | 486,146 | | |
| 1552 CL I — 3.97% 2023 (Floating Rate Note) | | | 812,733 | | | | 793,829 | | |
| 1669 CL HA — 4.12% 2023 (Floating Rate Note) | | | 1,523,173 | | | | 1,512,225 | | |
| 1671 CL HA — 4.12% 2024 (Floating Rate Note) | | | 3,347,711 | | | | 3,280,322 | | |
| 1673 CL HB — 4.12% 2024 (Floating Rate Note) | | | 1,000,000 | | | | 973,350 | | |
| 3003 CL KH — 5% 2034 | | | 13,791,670 | | | | 13,824,494 | | |
| 2796 CL BA — 5.5% 2029 | | | 6,283,551 | | | | 6,318,110 | | |
| 2805 CL AB — 5.5% 2030 | | | 5,654,091 | | | | 5,691,351 | | |
| 3241 CL DA — 5.5% 2034 | | | 17,650,485 | | | | 17,711,732 | | |
| 3283 CL PA — 5.5% 2036 | | | 25,345,724 | | | | 25,484,872 | | |
| 1804 CL C — 6% 2008 | | | 956,277 | | | | 960,657 | | |
| 3152 CL DB — 6% 2030 | | | 23,067,000 | | | | 23,816,677 | | |
| 1591 CL PV — 6.25% 2023 | | | 4,993,882 | | | | 5,075,033 | | |
| 3164 CL QV — 6.5% 2017 | | | 16,802,019 | | | | 17,391,602 | | |
| 2438 CL MF — 6.5% 2031 | | | 4,997,949 | | | | 5,019,815 | | |
| 2198 CL PS — 7% 2029 | | | 10,328,965 | | | | 10,667,884 | | |
| 2543 CL AD — 8.5% 2016 | | | 63,659 | | | | 64,918 | | |
| 2519 CL ED — 8.5% 2030 | | | 423,951 | | | | 452,195 | | |
| 2626 CL QM — 9% 2018 | | | 2,363,106 | | | | 2,631,171 | | |
| Federal National Mortgage Association | |
| 2003-102 CL EA — 5.5% 2032 | | | 2,054,611 | | | | 2,059,748 | | |
| 2007-42 CL YA — 5.5% 2036 | | | 21,080,308 | | | | 21,034,195 | | |
| 2006-61 CL LU — 6% 2013 | | | 8,926,086 | | | | 9,074,771 | | |
| 2006-66 CL VP — 6% 2015 | | | 17,339,612 | | | | 17,597,452 | | |
| 2003-12 CL AC — 6% 2016 | | | 200,596 | | | | 201,599 | | |
| 1999-24 CL BC — 6% 2029 | | | 1,786,683 | | | | 1,816,538 | | |
| 2005-112 CL NB — 6% 2030 | | | 17,960,234 | | | | 18,131,417 | | |
| 2006-80 CL PD — 6% 2030 | | | 15,764,000 | | | | 16,158,100 | | |
| 2006-69 CL PB — 6% 2032 | | | 7,835,000 | | | | 7,896,318 | | |
12
PORTFOLIO OF INVESTMENTS
September 30, 2007
| BONDS & DEBENTURES — Continued | | Principal
Amount | | Value | |
| 2007-16 CL AB — 6% 2035 | | | 27,936,491 | | | | 28,407,500 | | |
| 1995-13 CL C — 6.5% 2008 | | | 40,039 | | | | 40,170 | | |
| 2003-59 CL NP — 6.5% 2017 | | | 2,331,627 | | | | 2,407,918 | | |
| 2006-74 CL DA — 6.5% 2034 | | | 16,578,326 | | | | 16,841,590 | | |
| 1992-193 CL HD — 7% 2007 | | | 89,522 | | | | 89,319 | | |
| 319-18 — 8% 2032 | | | 889,178 | | | | 959,479 | | |
| 2004-W6 — 8% 2034 | | | 8,291,783 | | | | 8,514,625 | | |
| Government National Mortgage Association II | |
| 1999-47 — 7.5% 2029 | | | 2,086,464 | | | | 2,180,355 | | |
| JP Morgan MTG Trust 2003-A2 — 4% 2033 | | | 1,248,976 | | | | 1,248,976 | | |
| Wachovia Asset Securitization, Inc. 2002-1 CL 2A1 — 6.25% 2033 | | | 1,421,236 | | | | 1,416,176 | | |
| Wells Fargo Mortgage Backed Securities Tr. 2005-2 CL 1A2 — 8% 2035 | | | 17,465,490 | | | | 18,196,857 | | |
| TOTAL MORTGAGE-BACKED SECURITIES | | | | | | $ | 331,140,257 | | |
| CORPORATE BONDS & DEBENTURES — 6.1% | |
| Bayerische Landesbank — 4.08% 2009 (Floating Rate Note)* | | $ | 21,000,000 | | | $ | 20,764,380 | | |
| Qwest Communications International, Inc. — 9.0575% 2009 (Floating Rate Note) | | | 16,030,000 | | | | 16,110,150 | | |
| Rabobank Nederland NV — 4.795% 2007 (Floating Rate Note) | | | 24,674,000 | | | | 24,670,145 | | |
| Toyota Motor Credit Corporation — 5.25% 2008 | | | 50,000,000 | | | | 50,067,500 | | |
| TOTAL CORPORATE BONDS & DEBENTURES | | | | | | $ | 111,612,175 | | |
| U.S. TREASURY SECURITIES — 5.9% | |
| U.S.Treasury Inflation-Indexed Notes — 2.375% 2011 | | $ | 18,889,920 | | | $ | 18,991,748 | | |
| U.S.Treasury Note — 4.125% 2008 | | | 20,000,000 | | | | 19,993,750 | | |
| U.S.Treasury Note — 4.25% 2007 | | | 51,000,000 | | | | 51,015,937 | | |
| U.S.Treasury Note — 4.75% 2012 | | | 17,500,000 | | | | 17,882,813 | | |
| TOTAL U.S. TREASURY SECURITIES | | | | | | $ | 107,884,248 | | |
| SHORT-TERM U.S. TREASURY SECURITY — 4.1% | |
| U.S.Treasury Bill — 4.8% 2007 | | $ | 75,000,000 | | | $ | 74,781,060 | | |
| INTERNATIONAL SECURITY — 1.2% | |
| France OATei — 3% 2012 | | $ | 14,840,133 | | | $ | 22,138,584 | | |
| DERIVATIVE SECURITIES — 0.3% | |
| INTEREST ONLY SECURITIES | |
| Federal Home Loan Mortgage Corporation | |
| 2558 CL JW — 5.5% 2022 | | $ | 14,766,311 | | | $ | 2,378,760 | | |
| 1694 CL L — 6.5% 2023 | | | 19,888 | | | | 332 | | |
| 217 — 6.5% 2032 | | | 2,403,044 | | | | 634,554 | | |
13
PORTFOLIO OF INVESTMENTS
September 30, 2007
| BONDS & DEBENTURES — Continued | | Principal
Amount | | Value | |
| Federal National Mortgage Association | |
| 2003-64 CL XI — 5% 2033 | | | 14,110,990 | | | | 2,630,377 | | |
| 323 CL 1 — 5.5% 2032 | | | 3,373,106 | | | | 733,111 | | |
| 1994-17 CL JB — 6.5% 2009 | | | 140,910 | | | | 4,734 | | |
| TOTAL DERIVATIVE SECURITIES | | | | | | $ | 6,381,868 | | |
| TOTAL INVESTMENT SECURITIES — 84.4% (Cost $1,531,156,173) | | | | | | $ | 1,546,705,002 | | |
| SHORT-TERM CORPORATE NOTES — 14.6% | |
| General Electric Capital Corporation — 4.7% 10/01/07 | | $ | 48,455,000 | | | $ | 48,455,000 | | |
| American General Finance Corporation — 5.15% 10/02/07 | | | 52,068,000 | | | | 52,060,551 | | |
| ChevronTexaco Funding Corporation — 4.7% 10/04/07 | | | 53,772,000 | | | | 53,750,939 | | |
| General Electric Capital Services, Inc. — 4.68% 10/09/07 | | | 63,068,000 | | | | 63,002,409 | | |
| AIG Funding, Inc. — 4.82% 10/11/07 | | | 50,000,000 | | | | 49,933,056 | | |
| TOTAL SHORT-TERM CORPORATE NOTES (Cost $267,201,955) | | | | | | $ | 267,201,955 | | |
| TOTAL INVESTMENTS — 99.0% (Cost $1,798,358,128) | | | | | | $ | 1,813,906,957 | | |
| Other assets and liabilities, net — 1.0% | | | | | | | 18,123,140 | | |
| TOTAL NET ASSETS — 100.0% | | | | | | $ | 1,832,030,097 | | |
* Restricted security purchased without registration under the Securities Act of 1933 pursuant to Rule 144A, which generally may be resold only to certain institutional investors prior to registration. Federal Agricultural Mortgage Corporation 4.875% due 2011 was purchased at $97.45 on May 12, 2006. Bayerische Landesbank 4.08% due 2009 was purchased at $100 on April 14, 2004. These restricted securities constituted 2.2% of total net assets at September 30, 2007.
14
STATEMENT OF ASSETS AND LIABILITIES
September 30, 2007
| ASSETS | |
| Investments at value: | |
Investments securities — at market value
(identified cost $1,531,156,173) | | $ | 1,546,705,002 | | | | | | |
Short-term corporate notes — at amortized cost
(maturities 60 days or less) | | | 267,201,955 | | | $ | 1,813,906,957 | | |
| Cash | | | | | | | 594 | | |
| Receivable for: | |
| Investment securities sold | | $ | 20,000,000 | | | | | | |
| Interest | | | 14,805,007 | | | | | | |
| Capital stock sold | | | 5,811,482 | | | | 40,616,489 | | |
| | | | | | | $ | 1,854,524,040 | | |
| LIABILITIES | |
| Payable for: | |
| Investment securities purchased | | $ | 20,120,992 | | | | | | |
| Capital stock repurchased | | | 1,485,003 | | | | | | |
| Advisory fees | | | 742,088 | | | | | | |
| Accrued expenses and other liabilities | | | 145,860 | | | | 22,493,943 | | |
| NET ASSETS | | | | | | $ | 1,832,030,097 | | |
| SUMMARY OF SHAREHOLDERS' EQUITY | |
Capital Stock — par value $.01 per share; authorized
200,000,000 shares; outstanding 166,058,935 shares | | | | | | $ | 1,660,589 | | |
| Additional Paid in Capital | | | | | | | 1,853,326,079 | | |
| Accumulated net loss on investments | | | | | | | (64,819,496 | ) | |
| Undistributed net investment income | | | | | | | 26,314,096 | | |
| Unrealized appreciation of investments | | | | | | | 15,548,829 | | |
| NET ASSETS | | | | | | $ | 1,832,030,097 | | |
NET ASSET VALUE, REDEMPTION PRICE AND
MAXIMUM OFFERING PRICE PER SHARE | |
Net asset value and redemption price per share
(net assets divided by shares outstanding) | | | | | | $ | 11.03 | | |
Maximum offering price per share
(100/96.5 of per share net assets value) | | | | | | $ | 11.43 | | |
See notes to financial statements.
15
STATEMENT OF OPERATIONS
For the Year Ended September 30, 2007
| INVESTMENT INCOME | |
| Interest | | | | | | $ | 89,695,425 | | |
| Dividends | | | | | | | 457,144 | | |
| | | | | | | $ | 90,152,569 | | |
| EXPENSES | |
| Advisory fees | | $ | 9,103,697 | | | | | | |
| Transfer agent fees and expenses | | | 1,551,133 | | | | | | |
| Reports to shareholders | | | 265,933 | | | | | | |
| Custodian fees and expenses | | | 129,898 | | | | | | |
| Insurance | | | 65,223 | | | | | | |
| Directors' fees and expenses | | | 55,633 | | | | | | |
| Registration fees | | | 47,377 | | | | | | |
| Audit and tax services | | | 40,400 | | | | | | |
| Legal fees | | | 13,122 | | | | | | |
| Other expenses | | | 41,850 | | | | 11,314,266 | | |
| Net investment income | | | | | | $ | 78,838,303 | | |
| NET REALIZED AND UNREALIZED GAIN ON INVESTMENTS | |
| Net realized gain on investments: | |
Proceeds from sale of investment securities (excluding
short-term investments with maturities 60 days or less) | | $ | 868,483,858 | | | | | | |
| Cost of investment securities sold | | | 865,778,477 | | | | | | |
| Net realized gain on investments | | | | | | $ | 2,705,381 | | |
| Change in unrealized appreciation of investments: | |
| Unrealized appreciation at beginning of year | | $ | 1,248,298 | | | | | | |
| Unrealized appreciation at end of year | | | 15,548,829 | | | | | | |
| Change in unrealized appreciation of investments | | | | | | | 14,300,531 | | |
| Net realized and unrealized gain on investments | | | | | | $ | 17,005,912 | | |
| CHANGE IN NET ASSETS RESULTING FROM OPERATIONS | | | | | | $ | 95,844,215 | | |
See notes to financial statements.
16
STATEMENT OF CHANGES IN NET ASSETS
| | | For the Year Ended September 30, | |
| | | 2007 | | 2006 | |
| CHANGE IN NET ASSETS | |
| Operations: | |
| Net investment income | | $ | 78,838,303 | | | | | | | $ | 80,986,719 | | | | | | |
| Net realized gain (loss) on investments | | | 2,705,381 | | | | | | | | (13,074,435 | ) | | | | | |
Change in unrealized
appreciation of investments | | | 14,300,531 | | | | | | | | 10,006,816 | | | | | | |
Change in net assets resulting
from operations | | | | | | $ | 95,844,215 | | | | | | | $ | 77,919,100 | | |
Dividends to shareholders from net
investment income | | | | | | | (88,163,973 | ) | | | | | | | (86,445,915 | ) | |
| Capital Stock transactions: | |
| Proceeds from Capital Stock sold | | $ | 549,288,362 | | | | | | | $ | 559,770,838 | | | | | | |
Proceeds from shares issued to
shareholders upon reinvestment
of dividends | | | 56,178,017 | | | | | | | | 60,398,498 | | | | | | |
| Cost of Capital Stock repurchased* | | | (600,223,671 | ) | | | 5,242,708 | | | | (638,020,384 | ) | | | (17,851,048 | ) | |
| Total change in net assets | | | | | | $ | 12,922,950 | | | | | | | $ | (26,377,863 | ) | |
| NET ASSETS | |
Beginning of year, including undistributed
net investment income of $30,590,777
and $32,127,477 at September 30, 2006
and 2005, respectively | | | | | | | 1,819,107,147 | | | | | | | | 1,845,485,010 | | |
End of year, including
undistributed net investment income
of $26,314,096 and $30,590,777 at
September 30, 2007 and 2006,
respectively | | | | | | $ | 1,832,030,097 | | | | | | | $ | 1,819,107,147 | | |
CHANGE IN CAPITAL STOCK
OUTSTANDING | |
| Shares of Capital Stock sold | | | | | | | 50,350,612 | | | | | | | | 51,331,029 | | |
Shares issued to shareholders upon
reinvestment of dividends | | | | | | | 5,181,098 | | | | | | | | 5,568,455 | | |
| Shares of Capital Stock repurchased | | | | | | | (55,043,592 | ) | | | | | | | (58,567,729 | ) | |
| Change in Capital Stock outstanding | | | | | | | 488,118 | | | | | | | | (1,668,245 | ) | |
* Net of redemption fees of $107,287 and $45,166 for the years ended September 30, 2007 and 2006, respectively.
See notes to financial statements.
17
FINANCIAL HIGHLIGHTS
Selected Data for Each Share of Capital Stock Outstanding Throughout Each Year
| | | For the Year Ended September 30, | |
| | | 2007 | | 2006 | | 2005 | | 2004 | | 2003 | |
| Per share operating performance: | |
| Net asset value at beginning of year | | $ | 10.99 | | | $ | 11.04 | | | $ | 11.30 | | | $ | 11.27 | | | $ | 10.98 | | |
| Income from investment operations: | |
| Net investment income | | $ | 0.50 | | | $ | 0.53 | | | $ | 0.48 | | | $ | 0.43 | | | $ | 0.52 | | |
Net realized and unrealized gain (loss) on
investment securities | | | 0.07 | | | | (0.04 | ) | | | (0.34 | ) | | | 0.03 | | | | 0.33 | | |
| Total from investment operations | | $ | 0.57 | | | $ | 0.49 | | | $ | 0.14 | | | $ | 0.46 | | | $ | 0.85 | | |
| Less dividends from net investment income | | $ | (0.53 | ) | | $ | (0.54 | ) | | $ | (0.40 | ) | | $ | (0.43 | ) | | $ | (0.56 | ) | |
| Redemption fees | | | — | * | | | — | * | | | — | * | | | — | * | | | — | | |
| Net asset value at end of year | | $ | 11.03 | | | $ | 10.99 | | | $ | 11.04 | | | $ | 11.30 | | | $ | 11.27 | | |
| Total investment return** | | | 5.36 | % | | | 4.59 | % | | | 1.27 | % | | | 4.16 | % | | | 8.02 | % | |
| Ratios/supplemental data: | |
| Net assets at end of year (in $000's) | | $ | 1,832,030 | | | $ | 1,819,107 | | | $ | 1,845,485 | | | $ | 1,938,651 | | | $ | 1,125,498 | | |
| Ratio of expenses to average net assets | | | 0.62 | % | | | 0.62 | % | | | 0.61 | % | | | 0.60 | % | | | 0.61 | % | |
Ratio of net investment income to average
net assets | | | 4.31 | % | | | 4.68 | % | | | 3.69 | % | | | 3.77 | % | | | 4.69 | % | |
| Portfolio turnover rate | | | 53 | % | | | 60 | % | | | 42 | % | | | 62 | % | | | 52 | % | |
* Rounds to less than $0.01 per share.
** Return is based on net asset value per share, adjusted for reinvestment of distributions, and does not reflect deduction of the sales charge
See notes to financial statements.
18
NOTES TO FINANCIAL STATEMENTS
September 30, 2007
NOTE 1 — Significant Accounting Policies
The Fund is registered under the Investment Company Act of 1940 as a diversified, open-end, management investment company. The Fund's investment objective is to seek current income and long-term total return. The following is a summary of significant accounting policies consistently followed by the Fund in the preparation of its financial statements.
A. Security Valuation
Securities listed or traded on a national securities exchange are valued at the last sale price on the last business day of the year, or if there was not a sale that day, at the last bid price. Securities traded in the NASDAQ National Market System are valued at the NASDAQ Official Closing Price on the last business day of the year, or if there was not a sale that day, at the last bid price. Unlisted securities and securities listed on a national securities exchange for which the over-the-counter market more accurately reflects the securities' value in the judgment of the Fund's officers, are valued at the most recent bid price or other ascertainable market value. Short-term investments with maturities of 60 days or less are valued at amortized cost which approximates market value. Securities for which market quotations are not readily available are valued at fair value as determined in good faith by, or under the direction of, the Board of Directors.
B. Securities Transactions and Related
Investment Income
Securities transactions are accounted for on the date the securities are purchased or sold. Dividend income and distributions to shareholders are recorded on the ex-dividend date. Interest income and expenses are recorded on an accrual basis. Market discounts and premiums on fixed income securities are amortized over the expected life of the securities. Realized gains or losses are based on the specific identification method.
C. Use of Estimates
The preparation of financial statements in conformity with accounting principles generally accepted in the United States requires management to make estimates and assumptions that affect the amounts reported. Actual results could differ from these estimates.
NOTE 2 — Purchases of Investment Securities
Cost of purchases of investment securities (excluding short-term investments with maturities of 60 days or less) aggregated $906,462,290 for the year ended September 30, 2007.
NOTE 3 — Advisory Fees and Other Affiliated Transactions
Pursuant to an Investment Advisory Agreement, advisory fees were paid by the Fund to First Pacific Advisors, LLC (the "Adviser"). Under the terms of this agreement, the Fund pays the Adviser a monthly fee calculated at the annual rate of 0.5% of the average daily net assets of the Fund. The Agreement obligates the Adviser to reduce its fee to the extent necessary to reimburse the Fund for any annual expenses (exclusive of interest, taxes, the cost of any supplemental statistical and research information, and extraordinary expenses such as litigation) in excess of 11/2% of the first $15 million and 1% of the remaining average net assets o f the Fund for the year. On October 1, 2006, a new investment advisory firm, First Pacific Advisors, LLC, owned entirely by the former principals and key investment professionals of the prior advisor, commenced providing advisory services under a new investment advisory agreement approved by shareholders on May 1, 2006. The terms of this new investment advisory agreement are identical to the prior investment advisory agreement.
For the year ended September 30, 2007, the Fund paid aggregate fees of $55,000 to all Directors who are not interested persons of the Adviser. Certain officers of the Fund are also officers of the Adviser and FPA Fund Distributors, Inc.
NOTE 4 — Federal Income Tax
No provision for federal income tax is required because the Fund has elected to be taxed as a "regulated investment company" under the Internal Revenue Code and intends to maintain this qualification and to distribute each year to its shareholders, in accordance
19
NOTES TO FINANCIAL STATEMENTS
Continued
with the minimum distribution requirements of the Code, its taxable net investment income and taxable net realized gains on investments.
Distributions paid to shareholders are based on net investment income and net realized gains determined on a tax reporting basis, which may differ from financial reporting. For federal income tax purposes, the components of distributable earnings at September 30, 2007, were as follows:
| Undistributed net investment income | | $ | 24,570,930 | | |
Accumulated net realized losses of $62,795,038 can be carried forward to offset future gains. The ability to carry these losses forward expires as follows: $1,455,619 in 2011, $16,355,526 in 2012, $7,719,581 in 2013, $20,873,466 in 2014, and $16,390,846 in 2015. In addition, the Fund has elected to defer $2,104,146 of post-October losses until October 1, 2007.
The cost of investment securities at September 30, 2007 for federal income tax purposes was $1,529,413,007. Gross unrealized appreciation and depreciation for all securities at September 30, 2007 for federal income tax purposes was $21,450,246 and $4,158,251, respectively, resulting in net unrealized appreciation of $17,291,995. The Financial Accounting Standards Board ("FASB") has recently issued Interpretation No. 48, "Accounting for Uncertainty in Income Taxes — an Interpretation of FASB Statement No. 109 (the "Interpretation"), which applies to all registered investment companies, clarifies the accounting for uncertain tax positions. The Interpretation is effective for financial statements for fiscal years beginning after December 15, 2006. Management of the Fund completed their analysis of the Interpretation and estimates the adoption will have no significant i mpact on the financial statements.
During the year ended September 30, 2007, the Fund reclassified $5,048,989 of net amounts from accumulated net loss to undistributed net investment income to align financial reporting with tax reporting.
NOTE 5 — Distributor
For the year ended September 30, 2007, FPA Fund Distributors, Inc. ("Distributor"), a wholly owned subsidiary of the Adviser, received $25,310 in net Fund share sales commissions after reallowance to other dealers. The Distributor pays its own overhead and general administrative expenses, the cost of supplemental sales literature, promotion and advertising.
NOTE 6 — Redemption Fees
A redemption fee of 2% applies to redemptions within 90 days of purchase for certain purchases made by persons eligible to purchase shares without an initial sales charge. For the year ended September 30, 2007, the Fund collected $107,287 in redemption fees, which amounted to less than $0.01 per share.
NOTE 7 — Distribution to Shareholders
On September 28, 2007, the Board of Directors declared a dividend from net investment income of $0.13 per share payable October 4, 2007 to shareholders of record on September 28, 2007. For financial statement purposes, this dividend was recorded on the ex-dividend date, October 1, 2007.
For tax purposes, all of the dividends paid during the fiscal years ended September 30, 2007 and 2006, were designated as ordinary income.
20
REPORT OF INDEPENDENT REGISTERED
PUBLIC ACCOUNTING FIRM
TO THE SHAREHOLDERS AND
BOARD OF DIRECTORS OF FPA NEW INCOME, INC.
We have audited the accompanying statement of assets and liabilities of FPA New Income, Inc. (the "Fund"), including the portfolio of investments, as of September 30, 2007, the related statement of operations for the year then ended, the statements of changes in net assets for each of the two years in the period then ended, and financial highlights for each of the five years in the period then ended. These financial statements and financial highlights are the responsibility of the Fund's management. Our responsibility is to express an opinion on these financial statements and financial highlights based on our audits.
We conducted our audits in accordance with standards of the Public Company Accounting Oversight Board (United States). Those standards require that we plan and perform the audit to obtain reasonable assurance about whether the financial statements and financial highlights are free of material misstatement. The Fund is not required to have, nor were we engaged to perform, an audit of its internal control over financial reporting. Our audits included consideration of internal control over financial reporting as a basis for designing audit procedures that are appropriate in the circumstances, but not for the purpose of expressing an opinion on the effectiveness of the Fund's internal control over financial reporting. Accordingly, we express no such opinion. An audit also includes examining, on a test basis, evidence supporting the amounts and disclosures in the financial statements, assessing the accounting principles used and significant estim ates made by management, as well as evaluating the overall financial statement presentation. Our procedures included confirmation of securities owned as of September 30, 2007, by correspondence with the custodian and brokers. We believe that our audits provide a reasonable basis for our opinion.
In our opinion, the 2007 financial statements and financial highlights referred to above present fairly, in all material respects, the financial position of FPA New Income, Inc. as of September 30, 2007, the results of its operations for the year then ended, the changes in its net assets for each of the two years in the period then ended, and the financial highlights for each of the five years in the period then ended, in conformity with accounting principles generally accepted in the United States of America.

Los Angeles, California
November 13, 2007
21
SHAREHOLDER EXPENSE EXAMPLE
September 30, 2007
(Unaudited)
Fund Expenses
As a shareholder of the Fund, you incur two types of costs: (1) transaction costs, and (2) ongoing costs, including advisory and administrative fees; shareholder service fees; and other Fund expenses. The Example is intended to help you understand your ongoing costs (in dollars) of investing in the Fund and to compare these costs with the ongoing costs of investing in other mutual funds. The Example is based on an investment of $1,000 invested at the beginning of the year and held for the entire year.
Actual Expenses
The information in the table under the heading "Actual Performance" provides information about actual account values and actual expenses. You may use the information in this column, together with the amount you invested, to estimate the expenses that you paid over the period. Simply divide your account value by $1,000 (for example, an $8,600 account value divided by $1,000= 8.6), then multiply the result by the number in the first column in the row entitled "Expenses Paid During Period" to estimate the expenses you paid on your account during this period.
Hypothetical Example for Comparison Purposes
The information in the table under the heading "Hypothetical Performance (5% return before expenses)" provides information about hypothetical account values and hypothetical expenses based on the Fund's actual expense ratio and an assumed rate of return of 5% per year before expenses, which is not the Fund's actual return. The hypothetical account values and expenses may not be used to estimate the actual ending account balance or expenses you paid for the period. You may use this information to compare the ongoing costs of investing in the Fund and other funds. To do so, compare this 5% hypothetical example with the 5% hypothetical examples that appear in the shareholder reports of other funds.
Please note that the expenses shown in the table are meant to highlight your ongoing costs only and do not reflect any transactional costs. Therefore, the information under the heading "Hypothetical Performance (5% return before expenses)" is useful in comparing ongoing costs only, and will not help you determine the relative total costs of owning different funds. In addition, if these transactional costs were included, your costs would have been higher.
| | | Actual
Performance | | Hypothetical
Performance
(5% return
before
expenses) | |
Beginning Account Value
March 31, 2007 | | $ | 1,000.00 | | | $ | 1,000.00 | | |
Ending Account Value
September 30, 2007 | | $ | 1,027.90 | | | $ | 1,021.85 | | |
Expenses Paid During
Period* | | $ | 3.15 | | | $ | 3.15 | | |
* Expenses are equal to the Fund's annualized expense ratio of 0.62%, multiplied by the average account value over the period and prorated for the six-months ended September 30, 2007 (183/365 days).
22
DIRECTOR AND OFFICER INFORMATION
| Name, Age & Address | | Position(s)
With Fund/
Years Served | | Principal Occupation(s)
During the Past 5 Years | | Portfolios in
Fund Complex
Overseen | | Other Directorships | |
| Willard H. Altman, Jr. – (72)* | | Director and Chairman†
Years Served: 9 | | Retired. Formerly, until 1995, Partner of Ernst & Young LLP, a public accounting firm. | | | 6 | | | | |
|
| Alfred E. Osborne, Jr. – (62)* | | Director†
Years Served: 8 | | Senior Associate Dean of the John E. Anderson School of Management at UCLA. | | | 3 | | | Investment Company Institute, Wedbush, Inc., EMAK, and Heckmann Corporation. | |
|
| A. Robert Pisano – (64)* | | Director†
Years Served: 5 | | President and Chief Operating Officer of the Motion Picture Association of America, Inc. since 2005. Formerly, until 2005, National Executive Director and Chief Executive Officer of the Screen Actors Guild. | | | 5 | | | State Net, Resources Global Professionals and The Motion Picture and Television Fund. | |
|
| Patrick B. Purcell – (64)* | | Director†
Years Served: 1 | | Retired. Formerly Consultant from March 1998 to August 2000, and Executive Vice President, Chief Financial Officer and Chief Administrative Officer from 1989 to March 1998, of Paramount Pictures. | | | 3 | | | The Ocean Conservancy and The Motion Picture and Television Fund | |
|
| Lawrence J. Sheehan – (75)* | | Director†
Years Served: 16 | | Retired. Formerly partner (1969 to 1994) and of counsel employee (1994-2002) of the firm of O'Melveny & Myers LLP. | | | 6 | | | | |
|
| Robert L. Rodriguez – (58) | | Director†
President & Chief Investment Officer
Years Served: 7 | | Chief Executive Officer of the Adviser. | | | 2 | | | FPA Fund Distributors, Inc. | |
|
| Thomas H. Atteberry – (54) | | Vice President & Portfolio Manager
Years Served: 2 | | Partner of the Adviser. Formerly Vice President of First Pacific Advisors, Inc. from 1997 to 2006. | | | | | | | |
|
| Eric S. Ende – (63) | | Vice President
Years Served: 22 | | Partner of the Adviser. Formerly Senior Vice President of First Pacific Advisors, Inc. from 1983 to 2006. | | | 3 | | | | |
|
| J. Richard Atwood – (47) | | Treasurer
Years Served: 10 | | Chief Operating Officer of the Adviser. President and Chief Executive Officer of FPA Fund Distributors, Inc. | | | | | | FPA Fund Distributors, Inc. | |
|
| Christopher H. Thomas – (50) | | Chief Compliance Officer
Years Served: 12 | | Vice President and Chief Compliance Officer of the Adviser and Vice President of FPA Fund Distributors, Inc. | | | | | | FPA Fund Distributors, Inc. | |
|
| Sherry Sasaki – (52) | | Secretary
Years Served: 24 | | Assistant Vice President and Secretary of the Adviser and Secretary of FPA Fund Distributors, Inc. | | | | | | | |
|
| E. Lake Setzler – (40) | | Assistant Treasurer
Years Served: 1 | | Vice President and Controller of the Adviser since 2005. Formerly Chief Operating Officer of Inflective Asset Management, LLC (2004-2005) and Vice President of Transamerica Investment Management, LLC (2000-2004). | | | | | | | |
|
† Directors serve until their resignation, removal or retirement.
* Audit Committee member
Additional information on the Directors is available in the Statement of Additional Information. Each of the above listed individuals can be contacted at 11400 W. Olympic Blvd., Suite 1200, Los Angeles, CA 90064.
23
This page intentionally left blank.
This page intentionally left blank.
FPA NEW INCOME, INC.
INVESTMENT ADVISER
First Pacific Advisors, LLC
11400 West Olympic Boulevard, Suite 1200
Los Angeles, California 90064
DISTRIBUTOR
FPA Fund Distributors, Inc.
11400 West Olympic Boulevard, Suite 1200
Los Angeles, California 90064
COUNSEL
O'Melveny & Myers LLP
Los Angeles, California
TICKER: FPNIX
CUSIP: 302544101
INDEPENDENT REGISTERED PUBLIC ACCOUNTING FIRM
Deloitte & Touche LLP
Los Angeles, California
CUSTODIAN & TRANSFER AGENT
State Street Bank and Trust Company
Boston, Massachusetts
SHAREHOLDER SERVICE AGENT
Boston Financial Data Services, Inc.
P.O. Box 8500
Boston, Massachusetts 02266-8500
30 Dan Road
Canton, MA 02021-2809
(800) 638-3060
(617) 483-5000
This report has been prepared for the information of shareholders of FPA New Income, Inc., and is not authorized for distribution to prospective investors unless preceded or accompanied by a prospectus.
The Fund's complete proxy voting record for the 12 months ended June 30, 2007 is available without charge, upon request, by calling (800) 982-4372 and on the SEC's website at www.sec.gov.
The Fund's schedule of portfolio holdings, filed the first and third quarter of the Fund's fiscal year on Form N-Q with the SEC, is available on the SEC's website at www.sec.gov. Form N-Q is available at the SEC's Public Reference Room in Washington, D.C., and information on the operations of the Public Reference Room may be obtained by calling (202) 942-8090. To obtain information on Form N-Q from the Fund, shareholders can call (800) 982-4372.
Additional information about the Fund is available online at www.fpafunds.com. This information includes, among other things, holdings, top sectors and performance, and is updated on or about the 15th business day after the end of each quarter.
Item 2. Code of Ethics.
(a) The registrant has adopted a code of ethics that applies to the registrant’s principal executive and financial officers.
(b) Not Applicable
(c) During the period covered by this report, there were not any amendments to the provisions of the code of ethics adopted in 2(a) above.
(d) During the period covered by this report, there were not any implicit or explicit waivers to the provisions of the code of ethics adopted in 2(a).
(e) Not Applicable
(f) A copy of the registrant’s code of ethics is filed as an exhibit to this Form N-CSR. Upon request, any person may obtain a copy of this code of ethics, without charge, by calling (800) 982-4372.
Item 3. Audit Committee Financial Expert.
The registrant’s board of directors has determined that Willard H. Altman, Jr. and Patrick B. Purcell, each of whom is a member of the registrant’s audit committee and board of directors, is an “audit committee financial expert” and is “independent,” as those terms are defined in this Item. This designation will not increase the designees’ duties, obligations or liability as compared to each of their duties, obligations and liability as a member of the audit committee and of the board of directors. This designation does not affect the duties, obligations or liability of any other member of the audit committee or the board of directors.
Item 4. Principal Accountant Fees and Services.
| | | | 2006 | | 2007 | |
(a) | | Audit Fees | | $ | 34,200 | | $ | 35,500 | |
(b) | | Audit Related Fees | | -0- | | -0- | |
(c) | | Tax Fees | | $ | 6,200 | | $ | 6,450 | |
(d) | | All Other Fees | | -0- | | -0- | |
(e)(1) Disclose the audit committee’s pre-approval policies and procedures described in paragraph (c)(7) of Rule 2-01 of Regulation S-X. The audit committee shall pre-approve all audit and permissible non-audit services that the committee considers compatible with maintaining the independent auditors’ independence. The pre-approval requirement will extend to all non-audit services provided to the registrant, the adviser, and any entity controlling, controlled by, or under common control with the adviser that provides ongoing services to the registrant, if the
engagement relates directly to the operations and financial reporting of the registrant; provided, however, that an engagement of the registrant’s independent auditors to perform attest services for the registrant, the adviser or its affiliates required by generally accepted auditing standards to complete the examination of the registrant’s financial statements (such as an examination conducted in accordance with Statement on Auditing Standards Number 70 issued by the American Institute of Certified Public Accountants), will be deem pre-approved if: (i) the registrant’s independent auditors inform the audit committee of the engagement, (ii) the registrant’s independent auditors advise the audit committee at least annually that the performance of this engagement will not impair the independent auditor’s independence with respect to the registrant, and (iii) the audit committee receives a copy of the independent auditor’s report prepared in connection with such services. The committee may delegate to one or more committee members the authority to review and pre-approve audit and permissible non-audit services. Actions taken under any such delegation will be reported to the full committee at its next meeting.
(e)(2) Disclose the percentage of services described in each of paragraphs (b) – (d) of this Item that were approved by the audit committee pursuant to paragraph (c)(7)(i)(C) of Rule 2-01 of Regulation S-X. 100% of the services provided to the registrant described in paragraphs (b) – (d) of this Item were pre-approved by the audit committee pursuant to paragraph (e)(1) of this Item. There were no services provided to the investment adviser or any entity controlling, controlled by or under common control with the adviser described in paragraphs (b) – (d) of this Item that were required to be pre-approved by the audit committee.
(f) If greater than 50%, disclose the percentage of hours expended on the principal accountant’s engagement to audit the registrant’s financial statements for the most recent fiscal year that were attributed to work performed by persons other than the principal accountant’s full-time, permanent employees. All services performed on the engagement to audit the registrant’s financial statements for the most recent fiscal year end were performed by the principal accountant’s full-time, permanent employees.
(g) Disclose the aggregate non-audit fees billed by the registrant’s accountant for services rendered to the registrant, and rendered to the registrant’s investment adviser (not including any sub-adviser whose role is primarily portfolio management and is subcontracted with or overseen by another investment adviser), and any entity controlling, controlled by, or under common control with the adviser that provides ongoing services to the registrant for each of the last two fiscal years of the registrant. None.
(h) Disclose whether the registrant’s audit committee of the board of directors has considered whether the provision of non-audit services that were rendered to the registrant’s investment adviser (not including any sub-adviser whose role is primarily portfolio management and is subcontracted with or overseen by another investment adviser), and any entity controlling, controlled by, or under common control with the investment adviser that provides ongoing services to the registrant that were not pre-approved pursuant to paragraph (c)(7)(ii) of Rule 2-01 of Regulation S-X is compatible with maintaining the principal accountant’s independence. Not Applicable.
Item 5. Audit Committee of Listed Registrants. Not Applicable.
Item 6. Schedule of Investments. The schedule of investments is included as part of the report to stockholders filed under Item 1 of this Form.
Item 7. Disclosure of Proxy Voting Policies and Procedures for Closed-End Management Investment Companies. Not Applicable.
Item 8. Portfolio Managers of Closed-End Management Investment Companies. Not Applicable.
Item 9. Purchases of Equity Securities by Closed-End Management Investment Company and Affiliated Purchasers. Not Applicable.
Item 10. Submission of Matters to a Vote of Security Holders. There has been no material change to the procedures by which shareholders may recommend nominees to the registrant’s board of directors.
Item 11. Controls and Procedures.
(a) The principal executive officer and principal financial officer of the registrant have concluded that the registrant’s disclosure controls and procedures (as defined in Rule 30a-3(c) under the Investment Company Act of 1940) are effective based on their evaluation of the disclosure controls and procedures as of a date within 90 days of the filing date of this report.
(b) There have been no significant changes in the registrant’s internal controls over financial reporting (as defined in Rule 30a-3(d) under the Investment Company Act of 1940) that occurred during the second fiscal quarter of the period covered by this report that have materially affected, or is reasonably likely to materially affect, the registrant’s internal controls over financial reporting.
Item 12. Exhibits.
(a)(1) Code of ethics as applies to the registrant’s officers and directors, as required to be disclosed under Item 2 of Form N-CSR. Attached hereto as Ex.99.CODE.ETH.
(a)(2) Separate certification for the registrant’s principal executive officer and principal financial officer, as required by Rule 30a-2(a) under the Investment Company Act of 1940. Attached hereto.
(a)(3) Not Applicable
(b) Separate certification for the registrant’s principal executive officer and principal financial officer, as required by Rule 30a-2(b) under the Investment Company Act of 1940. Attached hereto.
SIGNATURES
Pursuant to the requirements of the Securities Exchange Act of 1934 and the Investment Company Act of 1940, the registrant has duly caused this report to be signed on its behalf by the undersigned, thereunto duly authorized.
FPA NEW INCOME, INC. | |
| |
| |
By: | /s/ ROBERT L. RODRIGUEZ | |
Robert L. Rodriguez, President | |
(Principal Executive Officer) | |
| |
Date: November 28, 2007 | |
| | | |
Pursuant to the requirements of the Securities Exchange Act of 1934 and the Investment Company Act of 1940, this report has been signed below by the following persons on behalf of the registrant and in the capacities and on the dates indicated.
FPA NEW INCOME, INC. | |
| |
| |
By: | /s/ ROBERT L. RODRIGUEZ | |
Robert L. Rodriguez, President | |
(Principal Executive Officer) | |
| |
Date: November 28, 2007 | |
| |
| |
By: | /s/ J. RICHARD ATWOOD | |
J. Richard Atwood, Treasurer | |
(Principal Financial Officer) | |
| |
Date: November 28, 2007 | |
| | | | |