UNITED STATES
SECURITIES AND EXCHANGE COMMISSION
Washington, D.C. 20549
FORM N-CSR
CERTIFIED SHAREHOLDER REPORT OF REGISTERED
MANAGEMENT INVESTMENT COMPANIES
Investment Company Act file number | 811-1735 |
|
FPA NEW INCOME, INC. |
(Exact name of registrant as specified in charter) |
|
11400 WEST OLYMPIC BLVD., SUITE 1200, LOS ANGELES, CALIFORNIA | | 90064 |
(Address of principal executive offices) | | (Zip code) |
|
J. RICHARD ATWOOD, 11400 WEST OLYMPIC BLVD., SUITE 1200, LOS ANGELES, CALIFORNIA 90064 |
(Name and address of agent for service) |
|
Registrant’s telephone number, including area code: | 310-473-0225 | |
|
Date of fiscal year end: | SEPTEMBER 30 | |
|
Date of reporting period: | SEPTEMBER 30, 2009 | |
| | | | | | | | | |
Item 1. Report to Stockholders.
FPA New Income, Inc.
Annual Report
September 30, 2009

Distributor:
FPA FUND DISTRIBUTORS, INC.
11400 West Olympic Boulevard, Suite 1200
Los Angeles, California 90064
52511
LETTER TO SHAREHOLDERS
Dear Fellow Shareholders:
This Annual Report covers the year ended September 30, 2009. Your Fund's net asset value (NAV) closed at $11.09. During the fiscal year, your Fund paid four income dividends totaling $0.405. There were no capital gains distributions.
The following table shows the average annual total return for several different periods ended on that date for the Fund and comparative indices of securities prices. The data quoted represents past performance, and an investment in the Fund may fluctuate so that an investor's shares when redeemed may be worth more or less than their original cost.
| | | Periods Ended September 30, 2009 | |
| | | 1 Year | | 5 Years | | 10 Years | | 15 Years | | 20 Years | | 25 Years | | 6/30/1984
Inception | |
| FPA New Income (NAV) | | | 4.03 | %* | | | 4.01 | %* | | | 5.58 | %* | | | 6.22 | %* | | | 7.19 | %* | | | 8.37 | %* | | | 8.77 | %* | |
FPA New Income
(Net of Sales Charge) | | | 0.39 | %** | | | 3.27 | %** | | | 5.20 | %** | | | 5.97 | %** | | | 7.00 | %** | | | 8.21 | %** | | | 8.61 | %** | |
Lipper A-Rated Bond
Fund Average | | | 11.47 | % | | | 3.47 | % | | | 5.25 | % | | | 6.07 | % | | | 6.62 | % | | | N/A | | | | NA | | |
| Barclays Govt/Credit Index | | | 11.46 | % | | | 4.92 | % | | | 6.32 | % | | | 6.80 | % | | | 7.20 | % | | | 8.30 | % | | | 8.56 | % | |
For the second half of the fiscal year, your Fund's return was 1.74%*, 13.37% for the Lipper Average and 6.09% for the Barclays Index. On a calendar year-to-date basis, total returns were: FPA New Income, Inc., 2.76%*; Lipper Average, 13.76%; and the Barclays Index, 4.74%.
Robert L. Rodriguez Final Fund Commentary
With these comments, the process commences of handing your Fund's leadership over to Tom Atteberry, who will assume this responsibility beginning January 1, 2010. As announced in the March 31, 2009 Letter to Shareholders, I will be stepping down from day-to-day active management of your Fund on December 31, 2009 to take a one-year sabbatical. I will return in 2011 to assist Tom as he leads your Fund. While I am away, I will retain my entire ownership in FPA as well as all of my investments in the FPA funds. I believe this will demonstrate to you my faith and confidence in your new lead manager and will help allay any concerns you might have. I thank all of you for having entrusted me, as well as the team, with a portion of your assets. I still find it amazing how investors, most of whom we have never met personally, have the confidence to convey their hard earned dollars to "strangers." We take our fiduciary role very seriously and have work ed conscientiously to never betray it.
It has been an honor and a privilege for me to have been your lead manager for more than twenty-five years. Throughout these years, we have focused on the strategy of "winning by not losing." Your Fund is the only fund that has not lost money in any calendar year for this entire period. Our goal has been one of creating a fund that would compare favorably to the benchmark indexes while having materially less volatility risk. In other words, we wanted our shareholders to have the luxury and benefit of being able to sleep at night with their investment in FPA New Income. Both the team and I have worked diligently to achieve this goal. We have always strived to maintain the highest standards of trust, reliability and integrity, which are core values at FPA. It has been our policy to be straightforward and candid in all our communications with you and to hold ourselves accountable for the decisions we make. I have seen too many times in my caree r, business and investment professionals attempting
* Does not reflect deduction of the sales charge which, if reflected, would reduce the performance shown.
** Reflects deduction of the maximum sales charge of 3.5% of the offering price.
1
to place the blame elsewhere for their mistakes. This negative attribute has been all too often demonstrated by our politicians and regulators as well, especially in this financial crisis. During a period when there have been many transgressions within and outside of the investment industry, FPA has stood for ethics and integrity.
I would like to convey a few comments about your new lead manager. I brought Tom into FPA to work with me on your Fund in 1997. Prior to coming to FPA, he had several years of investment experience both in fixed income and equity investing. In other words, your Fund will be led by a very senior and experienced investment professional. Our investment philosophy and styles are extremely close. Tom has been a material contributor to your Fund's long-term investment performance and he has been an excellent co-manager since 2004. I am very proud that both Tom and I were honored as co-recipients of the Morningstar 2008 Fixed Income Mutual Fund Manager of the Year award. Our focus on capital preservation protected your Fund throughout the worst financial crisis in the past 80 years. This did not happen by accident and risk control was paramount in our thinking, which has always been the case from the very first day I began managing your Fund. Tom w ill now have this responsibility, and you will be well served by his judgment and the team that supports him. I am also proud of the fact that FPA has created an environment where investment professionals can excel. We pride ourselves on the level of stability within our investment teams and employee ranks.
One final thought that brings me to the intensifying issue that we have written about several times before — the explosion in Treasury debt outstanding. Since September 30, 2008, Treasury debt has risen from $10 trillion to $11.9 trillion, a rate of $5 billion per day. There is no end in sight for this out of control debt growth, as reflected by federal government deficit forecasts, which we consider optimistic, that total between $7 and $9 trillion for the period 2010 to 2019. In our March 2009 Letter to Shareholders, we estimated that U.S. Treasury debt would swell to between $14.6 trillion and $16.6 trillion by the end of 2011. If we stay on this present trend, we should reach this range which, in our opinion, is outrageous and fiscally irresponsible. This insanity is not a Democratic Party or a Republican Party "thing." Both parties are responsible, but who is ultimately more responsible than these two parties? It is we, the citizen s, who keep re-electing these power-centered financially inept politicians and it will be our children and grandchildren who will have to "pay the piper." It is not right and is morally reprehensible that one generation would do this to another.
Our country is currently in this financial mess because consumers, corporations and government succumbed to the temptations of excessive spending, debt growth and risk taking. Just as any family or company can get into trouble with too much debt, so can a state or country. California is a perfect example of a state government that has been devoid of economic reality and totally irresponsible in its finances, with spending far exceeding revenue growth for years. Our federal government also exemplifies this unsound and unwise trend. Before new expenditure programs are created and laid upon preexisting ones, we should be demanding that federal, state and local governments get spending under control first. We cannot trust most politicians because they practice "bait and switch" tactics in proposing new programs. The true long-term program costs are always understated because new benefits are added subsequently that were not included in the origi nal optimistic cost estimates — Social Security, Medicare and Medicaid are perfect examples of this process, and the proposed new health care spending program, if passed, will likely follow this same course.
As a beginning, no new programs should be created until others have been eliminated to offset these costs in the year of origination. We should have government prove to us first that this new budgetary balance can be achieved and maintained. Once at approximate equilibrium, we can begin to focus on debt reduction through the process of expenditures growing at less than the rate of revenue growth. Most families know that before they can regain control of their finances, they first have to control their spending. If our elected officials cannot agree to meet this principle of fiscal discipline and be held accountable to it immediately, they should be ousted from office.
2
Most of our current elected representatives would fail this test. As is the case with any company or family that does not deal with its pre-existing debt first, and then proceeds to take on additional debt beyond its means to pay, foreclosure or possibly bankruptcy will likely result. The same goes for a country, unless it can continue issuing debt denominated in its own currency. In this case, it can expunge its debt through the process of printing money and, thus, it can create a monetary inflation that destroys the purchasing power of previously issued debt. Our lenders will not stand for this and current trends show that foreign central banks are beginning to shift their holdings from Treasury notes and bonds to much shorter-term Treasury bills. This is an ominous trend. At FPA, we began this process several years ago in our fixed income management accounts.
I urge all of you to convey to your elected representatives that this spending madness must stop. If it does not, we will eventually face a crisis that will be far worse than the one we are in now. This potential risk is in our thinking at FPA and we are making contingency plans, as we did for this current crisis, so that we may manage through it well and protect your investments. As a first generation American, I hope and pray that we make the difficult decisions rather than pass them on to the next generation.
I leave for my sabbatical knowing that the reputation of First Pacific Advisors, LLC is the highest ever and that its financial strength has never been greater. I thank you for the confidence that you have shown in me, as well as FPA, by your investment and I look forward to returning in 2011. The letter that follows reflects the thoughts and expectations of the Fund's "new" lead manager.
Thomas H. Atteberry Commentary
With Bob taking a well-deserved sabbatical for one year, Fund shareholders may have a concern that, going forward, the investment philosophy and strategy of their Fund may change. I have worked with Bob on the fixed income product at First Pacific Advisors for almost thirteen years. Prior to coming to FPA, I had over ten years investment experience in both the fixed income and equity markets. During the past thirteen years I have expanded and enhanced my investment knowledge from one of a very select few high-quality investment professionals. Bob is the only Morningstar recipient of both the Equity and Fixed Income Manager of the year awards. One of the characteristics in my investment experience that Bob found very useful for managing fixed income assets was knowledge and expertise in evaluating and investing in equity securities. The other critical building block to managing fixed income assets at FPA is a core belief in "Winning by Not Lo sing." Like Bob, I too abhor negative returns in fixed income and strive to first produce a positive absolute return for the portfolio.
The primary focus of the portfolio will continue to be individual security selection with an evaluation of the downside through solving for "What Can We Lose First" then evaluation of the upside possibilities. Only in this way can we continue to accomplish the twenty-five year plus positive absolute return record that has been established by the Fund first by Bob, then by Bob and me, and now for the next year by Julian Mann and me. Both Julian and I look forward to Bob's return in 2011 and his continued wise counsel.
First off, we want to update you on some of the themes and ideas we outlined in the March Letter to Shareholders.
In the March portfolio commentary we stated that Treasury note and bond yields were devoid of any investment merit. Since the end of the first quarter of 2009, increasing Treasury rates have resulted in poor investment returns. Across the board, rates are up, with the two-year Treasury increasing by 15 basis points, the three-year note is up 30 basis points, the five-year increased by 65 basis points and the seven-year note is 68 basis points higher. In each case as the maturity lengthened the yield increased. This represents a steepening yield curve
3
that is usually associated with rise in inflation fears. While up in yield, the ten-year Treasury only climbed 64 basis points and the thirty-year Treasury bond rose 51 basis points.
How did these higher rates play out from a total return perspective over the past six months? For the two- and 3-year maturity Treasury note the total return was 0.70%, positive but not great. Returns for longer maturity Treasury notes were negative, with the five-year down 1.21% and the thirty-year bond reporting a negative total return of 6.55%, per the Merrill Lynch Treasury Indices.
Despite rate increases during the second and third quarters, in our opinion, Treasury rates continue to be devoid of any investment merit. Keep in mind that the two-year Treasury note yields only 0.94%, the five-year note has a yield of 2.31% followed by a 3.31% yield on the ten-year Treasury note and finally the thirty-year bond has a 4.05% yield. None of these levels compensate an investor for the risk of rising rates, which could likely result in a negative total return.
Your portfolio is positioned to guard against the negative total return outcomes that have been evident for the past six months in intermediate and longer maturity bonds. This protection is demonstrated in the duration measurement, or sensitivity to changes in interest rates, which was 0.37 years at the end of March and today stands at 1.25 years. Until such time as we feel that the level of interest rates compensates us for the risk of an adverse outcome, the portfolio will not put capital at risk to this possible event.
How have other segments of the bond market fared over the past six months? Again, using the Merrill Lynch Indices, we can get a very solid sense of how investors have perceived risk. The table below illustrates the conclusion that the higher the perceived risk, the higher the return.
| Merrill Lynch Index Returns March 31 – September 30, 2009 | |
| Mortgage Bond Master Index | | | +2.93 | % | |
| CMO Master Index | | | +3.04 | % | |
| Asset Backed Security Master Index | | | +10.72 | % | |
| Investment Grade Corporate Master Index | | | +20.04 | % | |
| CMBS Master Index | | | +25.25 | % | |
| High Yield Master II Index | | | +41.44 | % | |
The total return over the past six months of the last two indices is quite striking. First, the Commercial Mortgage Backed Securities (CMBS) segment of the market is just entering its fundamental downturn. Delinquencies are rising, property values are declining, and the amount to be refinanced by 2013 is significant at $2 trillion. At a recent community banking conference several admissions from bankers were telling of the looming problem. First, one bank admitted that they sold some of their commercial mortgage loans at prices that were between 10% and 50% below the par value of the loan. Another institution with about 5% of its commercial loans currently delinquent reported that when it re-appraised the property on a delinquent loan the value had declined nearly 30%. This decline resulted in a loan to value of 100%. What was striking was that, when asked if this appraisal information was applied to the total commercial real estate loan boo k of the bank, the answer was no. Common sense would say that this bank's complete commercial loan portfolio probably has a loan to value of 90% or higher today.
According to data compiled by the Bank Credit Analyst, outside of the money center banks, approximately 41% of bank loans are commercial real estate. This number represents a little over $1 trillion. Currently defaults are at 5%, which if combined with a 50% severity to the loan could mean a $25 billion loss. With total equity of about $395 billion, the resulting decline of equity by 6.3% has the potential of causing significant further banking
4
system problems. An assumption that the defaults double as the situation worsens in not unreasonable. If so, the hit to the banks' equity could be a little over 12%. At this point this along with most projected outcomes is still just conjecture. However, if the risk of such an event is a reasonable outcome, it would not surprise us to see bank lending continue to be constrained until these institutions have more certainty as to what their loan losses could total. While these losses do not eliminate the entire bank's equity, the strain on the banking system is already evident. The FDIC had 416 banks on its problem list as of June, up from 305 at the end of March of this year. To date, 98 banks have failed. We anticipate that the bank failure rate will likely remain elevated for a protracted period of time.
As we have said in the past, a borrower must demonstrate the willingness and ability to repay a loan and the same holds true for the lender, they must exhibit the willingness and ability to lend. Right now the banks do not have the ability to lend and, with the Federal Reserve Bank Lending Survey still declining, it would appear bankers do not have the willingness to lend either.
Every three months the Federal Reserve Board undertakes "The Senior Loan Officer Opinion Survey of Bank Lending Practices." The last survey was done in July. Bank lending officers continue to tighten standards, albeit at a slower rate. In addition, banks continue to increase the rate on loans, which they do underwrite. Of all the loan categories, Commercial Real Estate Loans had the highest percentage of lenders tightening standards at 45% compared to other categories in the 25% to 35% range.
Another big gainer in the past six months has been the high-yield bond market. Default volume is up dramatically in 2009 with the combination of high-yield bonds and bank loans just over $142 billion according to data from JPMorgan. This is far greater than the previous peak in 2001-2002 of $127.6 billion. Keep in mind that 2003 forward represented a solid economic recovery and, while GDP data appears to be positive for the second half of 2009, we wonder if it will replicate that seen in the previous economic recovery.
The good news in the high-yield bond segment is that the pace of defaults has slowed since April of this year. JPMorgan's year-to-date new issue volume is $120 billion as of the first nine months of this year, which compares with $147.9 billion for all of 2007, the past peak. Of this amount 78% is refinancing. Of the lower-rated issuance 71% of this volume was used for refinancing. What has occurred is that money has been raised to push out maturities. The prices of bonds in the high-yield market continue to be at unsustainably elevated levels. Without a dramatic increase in revenues from these companies it is highly unlikely that they will be able to grow into their leveraged capital structures. It is our opinion that the day of reckoning has been pushed out or the companies have just "kicked the can down the road." According to Morgan Stanley's most current data as of the end of the second quarter of 2009, 42% of the high-yield universe ha d a leverage ratio of greater than six times. That is, debt is six times greater than a company's earnings before interest, taxes, depreciation and amortization, which is a common measurement of a company's ability to service its debt. This is significantly greater than in 2002, during the previous economic downturn.
Year to date $20.9 billion has been committed to high-yield bond funds by investors. While difficult to quantify completely it appears to us that two reasons permeate this trend. First investors continue to be fearful of equities as evidenced by the lack of inflows into equity funds at only $15 billion year to date. The idea is that bonds are less risky than stocks, so avoid stocks and buy bonds. The second reason is that investors are in search of yield (return), as money-market funds yield almost zero. The outflow from money-market funds has been $291.2 billion year to date. Historically, when investors stretch for yield in the bond market, the resulting outcome is not pleasant.
It is our contention that technical factors have driven up the prices of high-yield securities while the current fundamentals do not support these prices. The last instance of poor returns in the high-yield market occurred in 2002; the following year the Merrill Lynch High Yield Master Index II recovered with a 28.14% return,
5
which is much lower than today's 41.44% return. In our view, unless the economy recovers and grows like it did in 2003-2005, today's return overstates the market's actual recovery going forward. A far deeper economic downturn was 1990. In 1991 the Index returned 31.97%, followed by 17.44% in 1992 and 16.69% in 1993. We would argue that the downturn today is more severe than in 1989-1990 and 2000-2002. Evidence for this conclusion is found by total leverage in the economy as defined as a Total Debt to GDP of 220%-230% in 1989-90 compared to 375% today.
Economic Commentary
Over this decade the driver of economic growth in this country has been consumers. At the start of the decade they represented about 66% of the economy as defined by Real Consumer Expenditures as a percent of Real GDP. At the end of 2008 that percentage was 71%. At its low, this percentage was 50% in the early 1950s. In our opinion, it would seem unreasonable to assume that this percentage will increase, and as we will show shortly, it very well could decline back to the mid 60% range over time. How did we get to this level? How did the consumer become such a large percentage of the economy?
Every three years the Federal Reserve Bank undertakes a very extensive Survey of Consumer Finances (SCF). The last survey was done in mid-2007 at the peak of economic activity in this country. The results are very sobering. The following are some highlights from that survey.
First, how strong is the consumer's balance sheet?
Income
Class | | Percentile Population | | Consumption | | Avg
Income | | Avg
Net worth | | Avg
Debt | | Debt/
Income | |
| Low | | 0-40 | | | 40 | % | | | 12 | % | | $ | 18 | k | | $ | 120 | k | | | 24 | k | | | 133 | % | |
| Middle | | 40-90 | | | 50 | % | | | 46 | % | | $ | 56 | k | | $ | 356 | k | | | 115 | k | | | 205 | % | |
| Wealthy | | 90-100 | | | 10 | % | | | 42 | % | | $ | 261 | k | | $ | 3,316 | k | | | 302 | k | | | 115 | % | |
The first thing that stands out from this data is that debt to income for the middle class is substantially higher than the other two classes. A deeper look at the data is even more disturbing. In 2001 that ratio was about 130% while the lower and wealthy groups had a ratio of about 80%. The middle class's share of disposable income declined over this same period of time. All measures of debt for the middle class increased. Our conclusion is that this group of consumers borrowed to maintain a life style which they could not afford.
What other information about the middle class has the potential to impact the economy in a negative manner? If we include the low-income class, about 90% of the households have over 50% of their assets in real estate. This compares to only about 25% of assets in real estate for the wealthy. According to Stephanie Pomboy of MacroMavens, if one looks at the equity in homes that have a mortgage, that percentage has declined to 10.1% equity from about 32% at the beginning of the decade. This past summer, Karen Weaver at Deutsche Bank postulated that by the end of 2010 it is highly possible that almost 50% of homes with a mortgage will have a loan to value ratio of greater than 100% due to further declines in home prices, which compares with approximately 25% today. This could be devastating for both the middle- and low-income households. As the loan to value on a mortgage loan exceeds 100%, the seriously delinquent mortgage (mortgages at least t hree months late or that already have a foreclosure notice) rate accelerates. In the 10-Q for the second quarter of this year, FNMA reported that loans which it either owns or guarantees with a loan to value (LTV) of 100% to 110% were10.68% seriously delinquent and for those with an LTV of greater than 125%, 25.20% were seriously delinquent.
6
Cumulative defaults on homes with a value of less than $700,000 are now at almost 10%. According to FNMA their 2006 and 2007 vintage loans have serious delinquencies of over 9%. Looking at this data, we strongly believe that the price of housing will continue to decline, as these defaults have to be resolved, thereby resulting in further decline in the primary assets of the low- and middle-income consumer. Consequently, we expect to see less spending from these consumers; as in the past they tended to use the home as an ATM machine through home equity lines of credit (HELOCs). Year to date, the annual change in HELOC and Consumer Credit has approached zero, which compares with an annual growth of around $180 billion in 2008. The result is that consumer spending declined on an annual basis by over $725 billion.
From this information we are comfortable concluding that the low- and middle-income consumer as a group has limited or no ability to borrow and spend. This group will likely be in a protracted debt reduction mode accomplished by spending less than they make and using the difference to pay down debt. In addition, this cohort may shed primary assets as a means of reducing debt, thus keeping a lid on real estate price increases for the next several years.
Finally, a few comments regarding the situation with those in the top 10% of income percentile. Their debt to income levels, while now higher than at the beginning of the decade, are not overly burdensome if one uses a sustainable level of 100%. That being said, we should expect this group's spending habits to decline until such time as the debt to income ratio declines to this more sustainable number.
The looming problem for this 10% of households is the pending tax increases. The tax cuts implemented during the Bush presidency are set to unwind at the end of 2010. This will affect those making greater than $250,000. In addition, proposals from the present Congress and Administration point to increasing taxes on those households making more than $250,000. Consumption is a function of after-tax income. If we combine the wealthy and middle class, those two groups of households equal 88% of consumption. One group, because of over-leverage, and the other, because of higher taxes, will end up having less money to spend on consumption. This environment has led us to conclude that the economy is not on a sustainable recovery and that in 2010 we may likely experience another decline or at best a very slow growth trajectory.
Market Thoughts
Earlier we commented on our view that Treasury yields were devoid of investment merit. It is our contention that this thought applies not only to Treasury notes and bonds but is applicable to all high-quality bonds. As we stated, high-yield bond funds have seen investor inflows of a dramatic degree. This same inflow is even more prevalent when measuring all taxable bond mutual funds, with $213 billion being invested year to date. This level of inflow, when combined with the almost $2 trillion being spent by the Federal Reserve to buy mortgages, Treasuries and Agency bonds, along with the $800 billion plus of excess bank reserves that are not being lent out but instead invested in high-quality shorter-maturity bonds, results in all high-quality bond prices being driven up for technical reasons. So what would happen if longer-term high-quality bonds returned to the median valuation which has occurred over the past half century?
We undertook an analysis based on Treasury yields returning to their long-term median levels over the next five years and the spreads for other high-quality fixed income instruments reverting back to their longer-term yield level above the comparable Treasury over the same period of time. Once these yield levels were established, we calculated a total annual return over the five-year period.
The ten-year Treasury has a median yield over the past 52 years of 6.21%. The last time the ten-year note had that yield was in the second quarter of 2000. A twenty-year Treasury bond has a median yield over the same
7
period of 6.34% and is the level we will use for today's thirty-year Treasury. For a ten-year or longer "A"-rated corporate bond, whose median spread over a comparable Treasury bond since 1962 has been 134 basis points higher and equates to a 7.55% yield and for a twenty-year corporate, that median yield would be 7.68%. Data for spreads on Agency mortgage pools only goes back to 1989. During this period of time the thirty-year current coupon mortgage pool had a median spread of 157 basis points when compared to a ten-year Treasury, which makes its median yield 7.78%. For a fifteen-year Agency mortgage pool, the median spread over a ten-year Treasury has been 110 basis points, which equates to a 7.31% yield.
Using a five-year time horizon, what would the total annualized return for each of these bonds be if spreads and yield returned to long-term median levels?
| Security | | Annualized 5 Year Return | |
| 10-year Treasury Note | | | 0.93 | % | |
| 30-year Treasury Bond | | | -1.42 | % | |
| 10-year "A" Rated Corporate Bond | | | 3.65 | % | |
| 20-year "A" Rated Corporate Bond | | | 2.75 | % | |
| 30-year Current Coupon Agency Mortgage Pool | | | 1.00 | % | |
| 15-year Current Coupon Agency Mortgage Pool | | | 1.46 | % | |
Therefore we are concluding that the influx of money into the high-quality portion of the bond market has driven longer-maturity high-quality security prices to levels that do not represent good fundamental value and thus we are not participating in this portion of the bond market.
Treasury bonds have been in a long-term secular bull market and we may be starting a long-term secular bear market. In 1952 the ten-year Treasury had a yield of 2.5%. In 1981 that yield peaked at 15.8% and at the end of 2008 again reached a low of 2.11%. As of the end of the second quarter of this year the annual return for a constant maturity ten-year Treasury note over the past 25 years was 9.70%. As a comparison, over the same period of time the S&P 500 had an annual return of 10.13%. Not since 1932 has the return of these two assets been this close. It is highly unlikely that going forward a ten-year Treasury note's return will equal that of the S&P 500.
Again, using a five-year time horizon, we calculated what the ten-year Treasury yield would need to decline to in order to achieve a certain annualized return. If an investor wanted a 4% annualized return on the ten-year Treasury note for the next five years, at the end of that period the yield on the Treasury would need to be 2.11%. The last time the Treasury had that yield was in the fall of 2008 when there was a possibility that the financial system of this country could collapse. If an investor expected a 5% annualized return for the ten-year Treasury note, at the end of 5 years the yield would need to be 0.84%. This level approaches that of a ten year Japanese government bond during their economic collapse. In our view, both these events are not high probability outcomes. However, if these yields were to be achieved the resulting poor economic conditions would not treat either the equity, high-yield or high-quality corporate bond market s very well, and those areas in our view would experience poor returns.
So where does this leave us with positioning your portfolio to preserve capital and provide for an adequate return? We do not think that the current economic growth is sustainable, and over the next year that growth will likely recede. This would result in disappointment for investors in the high yield segment of the bond market. At that point we will feel more comfortable making investments in that area.
One event in the beginning of this year made high-yield investing even more treacherous than in the past and that is the change of how debt holders could be treated in bankruptcy. Bob Rodriguez wrote about how the rules of the game were changing in his March 2008 essay "Crossing the Rubicon." This past spring, in both the
8
General Motors and Chrysler bankruptcy cases, the senior secured creditors were forced to accept a lower recovery value on their debt amount than those of the junior or more subordinated creditors. This is in contrast to the traditional manner debt holder recoveries are treated in a bankruptcy. This change in how lenders can be treated in bankruptcy has made the hurdle for investing in the high-yield market higher. This new level of complexity has made us adjust our risk level upward in those companies where this type of scenario has a higher probability.
Your portfolio is positioned to take very limited risk toward rising interest rates. Purchases and existing holdings are in bonds with average lives or maturities of less than five years. With these short-term maturities, we feel confident we can maintain a positive return for the portfolio in a rising rate environment.
Over the past six months your portfolio has shifted its emphasis on which high-quality bonds it will continue to accumulate. At the end of March a little over 37% of the portfolio's assets were in mortgage bonds, either Agency mortgage pools or Collateralized Mortgage Obligations (CMOs) backed by Agency-backed mortgaged securities. At the end of September that allocation had declined to 32%. As we have discussed in the past, the portfolio had been accumulating 2003 vintage or older mortgage bonds that were being sold by banks as they tried to shrink their balance sheets. After the TARP program was fully implemented and the Treasury Department had concluded its grading of the nation's largest banks, this ongoing selling diminished. Further, the banks found themselves with excess reserves and little need to lend out those reserves so the banks started to once again buy short-maturity Agency mortgage bonds. Over the past six months banks have b ought roughly $133 billion in investment securities.
While not a direct buyer of the same securities, the $1.250 trillion Federal Reserve program to purchase Agency mortgage-backed securities has also lead to much tighter spreads on the yield of a mortgage bond versus a comparable Treasury. As the summer progressed, the attractiveness of Agency mortgage-backed bonds diminished. As a result we used these new higher valuations and demand as an opportunity to prune the portfolio of smaller holdings which were offering little value to the portfolio going forward. The remaining portfolio holdings continue to be heavily concentrated in 2003 vintage or older mortgage bonds with the highest in underwriting standards.
In contrast to our lack of interest in adding to the portfolio's Agency mortgage holding, we did accelerate its investment in the Agency debenture segment of the market. At the end of March 22.3% of the portfolio was invested in Agency debentures. As of September 30, that allocation had grown to 31.5%. The portfolio has been using a very specific bond structure which should give protection to the portfolio in the event of rising interest rates. These Agency step-up notes were detailed in the March Letter to Shareholders. As of the end of September, 24% of the portfolio was invested in this type of Agency security.
In July the portfolio started an acquisition of CIT Group debt. This purchase is the result of collaboration between the analysts of Steve Romick's FPA Crescent Fund and our FPA New Income team. The first decision that had to be made was to get comfortable that the valuation of the loans (assets) of CIT, when subjected to a very draconian downward valuation on these loans, were still in excess of the price we paid for the bonds. Next, we needed to get comfortable that if the company declared bankruptcy the resulting restructuring should be able to convey enough value to the bond holders so that the return was appropriate for that event risk. It should be noted that on November 1 the company filed a plan of bankruptcy reorganization with the courts in New York. At this point we continue to be comfortable that our analysis is solid and that the resulting return on these securities will be appropriate given the risk associated with the bankrupt cy proceeding.
The portfolio as of the end of September has a 7.75% allocation to Commercial Mortgage-Backed Securities (CMBS). Specifically the portfolio has 6.75% in GNMA Project loans which, due to the fact that these
9
bonds represent loans to government assisted housing and assisted living facilities, fall under the CMBS umbrella. Keep in mind that the GNMA Project Loan IO securities discussed in past shareholders letters are included in this total. Additionally, a little less than 2% are in project loan bonds that are not IOs but in bonds that have an average life of less than three years. The remainder of the allocation (about 1%) is in two CMBS securities issued by Washington Mutual in 2007. The underlying loans represent small commercial real estate loans located in the San Francisco, Los Angeles and New York City areas. The largest loan represents only 1.86% of the total pool. The loans are on small urban properties and are not subject to the problems associated with suburban locations which have declined in value due to lack of foot traffic because the surrounding residential subdivisions were never completed or are full of foreclosed properties. Ev en after we subjected these loans to unusually high default rates and severe loss rates, the bonds still produced a positive yield in excess of a corresponding Treasury yield given the discount purchase price.
Finally, with cash giving off almost zero return, it is our expectation to reduce the allocation to around the 15% to 20% level versus the 20% level or more seen during the past six months. However, we still feel that it is important for the portfolio to have sufficient liquidity to take advantage of solid long-term investment opportunities and not rely on the fragile liquidity of the capital market to supply us with that liquidity.
Respectfully submitted,

Robert L. Rodriguez
President and Chief Investment Officer

Thomas H. Atteberry
Vice President and Portfolio Manager
October 30, 2009
The discussion of Fund investments represents the views of the Fund's managers at the time of this report and are subject to change without notice. References to individual securities are for informational purposes only and should not be construed as recommendations to purchase or sell individual securities.
10
HISTORICAL PERFORMANCE
Change in Value of a $10,000 Investment in FPA New Income, Inc. vs. Barclays Government/Credit Index and Lipper Corporate Debt A Rated Fund Average from October 1, 1999 to September 30, 2009
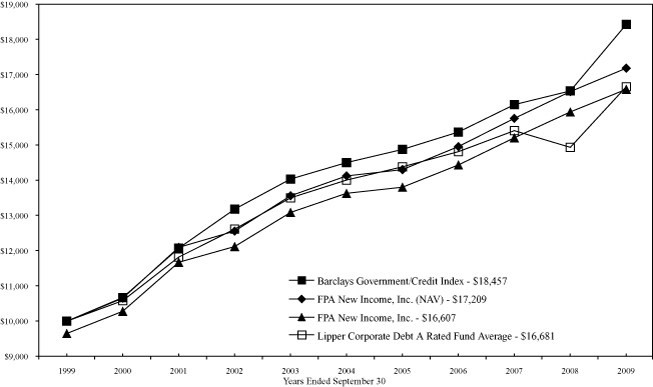
Past performance is not indicative of future performance. The Barclays Government/Credit Index is a broad-based unmanaged index of all government and corporate bonds that are investment grade with at least one year to maturity. The Barclays Government/Credit Index does not reflect any commissions or fees which would be incurred by an investor purchasing the securities it represents. The Lipper Corporate Debt A Rated Fund Average provides an additional comparison of how your Fund performed in relation to other mutual funds with similar objectives. The Lipper data does not include sales charges. The performance shown for FPA New Income, Inc., with an ending value of $16,607 reflects deduction of the current maximum sales charge of 3.5% of the offering price. In addition, since investors purchase shares of the Fund with varying sales charges depending primarily on volume purchased, the Fund's performance at net asset value (NAV) is also shown, as reflected by the ending value of $17,209. The performance of the Fund and of the Averages is computed on a total return basis which includes reinvestment of all distributions.
FORWARD LOOKING STATEMENT DISCLOSURE
As mutual fund managers, one of our responsibilities is to communicate with shareholders in an open and direct manner. Insofar as some of our opinions and comments in our letters to shareholders are based on current management expectations, they are considered "forward-looking statements" which may or may not be accurate over the long term. While we believe we have a reasonable basis for our comments and we have confidence in our opinions, actual results may differ materially from those we anticipate. You can identify forward-looking statements by words such as "believe," "expect," "may," "anticipate," and other similar expressions when discussing prospects for particular portfolio holdings and/or the markets, generally. We cannot, however, assure future results and disclaim any obligation to update or alter any forward-looking statements, whether as a result of new information, future events, or otherwise. Further, information provided in t his report should not be construed as a recommendation to purchase or sell any particular security.
11
PORTFOLIO SUMMARY
September 30, 2009
| Bonds & Debentures | | | | | | | 89.5 | % | |
| U.S. Agencies | | | 30.0 | % | | | | | |
| Mortgage-Backed | | | 22.4 | % | | | | | |
| Short-Term U.S. Treasury | | | 10.8 | % | | | | | |
| Mortgage Pass-Through | | | 8.7 | % | | | | | |
| U.S. Treasury | | | 6.6 | % | | | | | |
| Stripped Mortgage-Backed | | | 4.6 | % | | | | | |
| Commercial Mortgage-Backed | | | 2.8 | % | | | | | |
| Corporate | | | 2.4 | % | | | | | |
| Municipal | | | 1.2 | % | | | | | |
| Short-Term Investments | | | | | | | 10.9 | % | |
| Other Assets and Liabilities, net | | | | | | | (0.4 | )% | |
| Total Net Assets | | | | | | | 100.0 | % | |
MAJOR PORTFOLIO CHANGES
For the Six Months Ended September 30, 2009
| | | Principal
Amount | |
| NET PURCHASES | |
| Non-Convertible Bonds & Debentures | |
| Federal Home Loan Bank—2% 2014 (1) | | $ | 49,145,000 | | |
| Federal Home Loan Bank—2% 2014 (1) | | $ | 47,010,000 | | |
| Federal Home Loan Bank—2% 2014 (1) | | $ | 46,900,000 | | |
| Federal Home Loan Bank—2.25% 2014 (1) | | $ | 46,865,000 | | |
| Federal Home Loan Mortgage Corporation R005 CL AB—5.5% 2018 (1) | | $ | 45,107,580 | | |
| Federal National Mortgage Association—2% 2014 (1) | | $ | 48,840,000 | | |
| Washington Mutual CMS 2007-SL2 CL A—5.42451% 2049 (1) | | $ | 46,561,104 | | |
| NET SALES | |
| Non-Convertible Bonds & Debentures | |
| Federal Home Loan Mortgage Corporation—2.625% 2014 (2) | | $ | 35,220,000 | | |
| Federal Home Loan Mortgage Corporation—2.5% 2014 (2) | | $ | 26,380,000 | | |
| Federal Home Loan Mortgage Corporation—3% 2014 (2) | | $ | 27,000,000 | | |
| Federal National Mortgage Association—2% 2014 (2) | | $ | 27,230,000 | | |
| Federal National Mortgage Association—2.25% 2014 (2) | | $ | 25,870,000 | | |
| Federal National Mortgage Association—4.25% 2011 (2) | | $ | 24,120,000 | | |
(1) Indicates new commitment to portfolio
(2) Indicates elimination from portfolio
12
PORTFOLIO OF INVESTMENTS
September 30, 2009
| BONDS & DEBENTURES | | Principal
Amount | | Value | |
| U.S. AGENCIES SECURITIES — 30.0% | |
| Federal Farm Credit Bank | |
| —0.73625% 2011 (Floating) | | $ | 60,000,000 | | | $ | 60,288,000 | | |
| —5.55% 2012 | | | 17,440,000 | | | | 18,042,726 | | |
| Federal Agricultural Mortgage Corporation | |
| —3.875% 2011 | | | 25,700,000 | | | | 27,156,419 | | |
| —4.875% 2011+ | | | 44,665,000 | | | | 46,881,277 | | |
| —5.5% 2011+ | | | 19,600,000 | | | | 21,165,648 | | |
| Federal Home Loan Bank | |
| —0.75% 2011 | | | 36,740,000 | | | | 36,743,307 | | |
| —1.25% 2012 | | | 44,015,000 | | | | 44,175,655 | | |
| —1.25% 2012 | | | 40,415,000 | | | | 40,449,353 | | |
| —2% 2013 | | | 46,900,000 | | | | 46,999,897 | | |
| —2% 2014 | | | 47,010,000 | | | | 47,050,429 | | |
| —2% 2014 | | | 49,145,000 | | | | 49,259,016 | | |
| —2.25% 2014 | | | 46,865,000 | | | | 46,865,000 | | |
| —2.35% 2015 | | | 42,675,000 | | | | 42,896,910 | | |
| —3.5% 2009 | | | 15,000,000 | | | | 15,041,250 | | |
| —3.625% 2011 | | | 21,250,000 | | | | 21,290,800 | | |
| —5.3% 2011 | | | 17,000,000 | | | | 17,065,790 | | |
| Federal Home Loan Mortgage Corporation | |
| —1.5% 2012 | | | 33,500,000 | | | | 33,487,605 | | |
| —2% 2014 | | | 30,560,000 | | | | 30,701,798 | | |
| —2.25% 2014 | | | 32,940,000 | | | | 33,207,802 | | |
| —2.375% 2014 | | | 27,470,000 | | | | 27,630,425 | | |
| —2.375% 2015 | | | 42,255,000 | | | | 42,342,890 | | |
| —2.625% 2012 | | | 25,000,000 | | | | 25,124,000 | | |
| Federal National Mortgage Association | |
| —1% 2011 | | | 31,100,000 | | | | 31,141,052 | | |
| —1% 2013 | | | 21,250,000 | | | | 21,249,788 | | |
| —1% 2014 | | | 42,665,000 | | | | 43,124,929 | | |
| —1.25% 2011 | | | 40,225,000 | | | | 40,454,283 | | |
| —1.32% 2012 | | | 34,520,000 | | | | 34,550,723 | | |
| —1.75% 2014 | | | 34,490,000 | | | | 34,546,909 | | |
| —2% 2014 | | | 48,840,000 | | | | 48,919,609 | | |
| —2% 2014 | | | 30,225,000 | | | | 30,212,608 | | |
| —2% 2014 | | | 41,260,000 | | | | 41,328,079 | | |
| —2% 2014 | | | 44,019,000 | | | | 44,004,034 | | |
| TOTAL U.S. AGENCIES SECURITIES | | $ | 1,143,398,011 | | |
13
PORTFOLIO OF INVESTMENTS
September 30, 2009
| BONDS & DEBENTURES — Continued | | Principal
Amount | | Value | |
| MORTGAGE-BACKED SECURITIES — 22.4% | |
| Chase MTG 2003-S14 CL 2A4 — 7.5% 2034 | | $ | 8,421,227 | | | $ | 8,515,461 | | |
| Federal Home Loan Bank 0-0606 CL Y — 5.27% 2012 | | | 25,249,106 | | | | 26,581,249 | | |
| Federal Home Loan Mortgage Corporation | |
| 2630 CL KS — 4% 2017 | | | 27,350,000 | | | | 28,291,934 | | |
| 2786 CL JC — 4% 2018 | | | 6,248,829 | | | | 6,467,288 | | |
| 2869 CL JA — 4% 2034 | | | 27,102,874 | | | | 27,601,025 | | |
| 2877 WA — 4.25% 2034 | | | 28,650,157 | | | | 29,498,488 | | |
| 2706 CL UG — 4.5% 2016 | | | 11,688,159 | | | | 12,201,620 | | |
| 2677 CL LD — 4.5% 2017 | | | 21,107,609 | | | | 22,054,285 | | |
| 3439 CL AC — 4.5% 2022 | | | 39,123,968 | | | | 41,011,699 | | |
| 3080 CL MA — 5% 2018 | | | 14,967,753 | | | | 15,401,818 | | |
| 3285 CL LC — 5% 2025 | | | 40,686,125 | | | | 42,617,902 | | |
| 2780 CL MA — 5% 2030 | | | 11,768,534 | | | | 12,028,972 | | |
| 2736 CL MC — 5% 2032 | | | 27,315,000 | | | | 28,833,441 | | |
| 3003 CL KH — 5% 2034 | | | 4,141,150 | | | | 4,181,982 | | |
| 2494 CL CF — 5.5% 2017 | | | 17,018,412 | | | | 17,936,215 | | |
| 2503 CL B — 5.5% 2017 | | | 16,766,289 | | | | 17,673,345 | | |
| R005 CL AB — 5.5% 2018 | | | 45,107,580 | | | | 46,579,440 | | |
| 2792 CL PB — 5.5% 2027 | | | 13,311,603 | | | | 13,401,723 | | |
| 2542 CL PG — 5.5% 2031 | | | 22,108,613 | | | | 22,620,870 | | |
| 2903 CL UZ — 5.5% 2031 | | | 25,656,866 | | | | 26,654,662 | | |
| 2922 CL Z — 5.5% 2032 | | | 32,089,906 | | | | 33,361,308 | | |
| 3133 CL BD — 5.75% 2033 | | | 12,650,765 | | | | 13,046,987 | | |
| Federal National Mortgage Association | |
| 2004-90 CL GA — 4.35% 2034 | | | 18,585,264 | | | | 19,182,594 | | |
| 2003-35 CL MG — 4.5% 2015 | | | 7,037,862 | | | | 7,085,156 | | |
| 2509 CL CB — 5% 2017 | | | 17,102,210 | | | | 17,985,368 | | |
| 2002-83 CL HC — 5% 2017 | | | 10,800,000 | | | | 11,063,304 | | |
| 2008-77 CL DA — 5% 2023 | | | 19,567,129 | | | | 20,547,051 | | |
| 2004-60 CL LB — 5% 2034 | | | 29,520,280 | | | | 31,025,224 | | |
| 2005-4 CL E — 5% 2032 | | | 23,601,735 | | | | 24,530,699 | | |
| 2003-W17 CL 1A5 — 5.35% 2033 | | | 24,065,641 | | | | 25,067,494 | | |
| 2006-53 CL PA — 5.5% 2026 | | | 10,872,171 | | | | 11,120,600 | | |
| 2006-21 CL CA — 5.5% 2029 | | | 13,424,891 | | | | 13,941,078 | | |
| 2002-70 CL QG — 5.5% 2031 | | | 16,073,100 | | | | 16,473,320 | | |
| 2004-52 CL KA — 5.5% 2032 | | | 16,632,234 | | | | 17,043,715 | | |
| 2003-28 CL PG — 5.5% 2032 | | | 20,000,000 | | | | 20,981,800 | | |
| 2005-6 CL KA — 5.5% 2032 | | | 16,779,215 | | | | 17,178,225 | | |
| 2002-87 CL N — 5.5% 2032 | | | 11,412,148 | | | | 11,873,085 | | |
| 2003-12 CL AC — 6% 2016 | | | 28,159 | | | | 28,244 | | |
| 2005-118 CL ME — 6% 2032 | | | 27,130,000 | | | | 28,348,680 | | |
14
PORTFOLIO OF INVESTMENTS
September 30, 2009
| BONDS & DEBENTURES — Continued | | Principal
Amount | | Value | |
| 2007-16 CL AB — 6% 2035 | | $ | 20,596,262 | | | $ | 21,887,030 | | |
| 2004-W6 — 8% 2034 | | | 4,673,216 | | | | 4,710,882 | | |
| SASC 2002-RM1 CL A — 0.89625% 2037+ | | | 32,506,599 | | | | 26,939,844 | | |
| Wells Fargo Mortgage Backed Securities Tr. 2005-2 CL 1A2 — 8% 2035 | | | 10,629,747 | | | | 10,736,363 | | |
| TOTAL MORTGAGE-BACKED SECURITIES | | $ | 854,311,470 | | |
| U.S. TREASURY SECURITIES — SHORT TERM — 10.8% | |
| U.S. Treasury Bills | |
| —0.35074% 2009 | | $ | 90,000,000 | | | $ | 89,992,161 | | |
| —0.40087% 2009 | | | 60,000,000 | | | | 59,998,740 | | |
| —0.29061% 2010 | | | 200,000,000 | | | | 199,589,920 | | |
| —0.375% 2010 | | | 62,500,000 | | | | 62,262,619 | | |
| TOTAL U.S. TREASURY SECURITIES — SHORT TERM | | $ | 411,843,440 | | |
| MORTGAGE PASS-THROUGH SECURITIES — 8.7% | |
| Federal Home Loan Mortgage Corporation | |
| G11470 — 4.5% 2013 | | $ | 1,339,097 | | | $ | 1,400,053 | | |
| B18693 — 4.5% 2015 | | | 3,575,021 | | | | 3,763,139 | | |
| J03433 — 6% 2016 | | | 5,525,815 | | | | 5,907,815 | | |
| J04028 — 6% 2016 | | | 1,123,184 | | | | 1,192,574 | | |
| J02913 — 6% 2016 | | | 1,824,948 | | | | 1,948,187 | | |
| G12261 — 6% 2016 | | | 2,558,766 | | | | 2,713,188 | | |
| E02206 — 6% 2016 | | | 1,419,393 | | | | 1,511,171 | | |
| J03602 — 6% 2016 | | | 648,069 | | | | 692,585 | | |
| J03666 — 6% 2016 | | | 575,950 | | | | 615,282 | | |
| J03856 — 6% 2016 | | | 1,125,817 | | | | 1,203,588 | | |
| J04095 — 6% 2017 | | | 3,086,186 | | | | 3,277,005 | | |
| J04191 — 6% 2017 | | | 722,537 | | | | 772,450 | | |
| G12661 — 6% 2017 | | | 7,080,664 | | | | 7,516,975 | | |
| G12648 — 6% 2017 | | | 1,022,813 | | | | 1,086,023 | | |
| J04756 — 6% 2017 | | | 954,700 | | | | 1,023,295 | | |
| J04809 — 6% 2017 | | | 884,882 | | | | 947,762 | | |
| J04845 — 6% 2017 | | | 1,266,556 | | | | 1,356,165 | | |
| J05642 — 6% 2017 | | | 5,044,663 | | | | 5,362,931 | | |
| E02330 — 6% 2017 | | | 1,284,145 | | | | 1,366,638 | | |
| G12139 — 6.5% 2019 | | | 9,592,043 | | | | 10,109,726 | | |
| A26942 — 6.5% 2034 | | | 2,018,434 | | | | 2,157,827 | | |
| G08107 — 6.5% 2036 | | | 7,584,324 | | | | 8,125,617 | | |
| P50543 — 6.5% 2037 | | | 664,854 | | | | 712,072 | | |
| Federal National Mortgage Association | |
| 254681 — 4.5% 2013 | | | 929,615 | | | | 967,450 | | |
15
PORTFOLIO OF INVESTMENTS
September 30, 2009
| BONDS & DEBENTURES — Continued | | Principal
Amount | | Value | |
| 254758 — 4.5% 2013 | | $ | 15,610,773 | | | $ | 16,279,382 | | |
| 255175 — 4.5% 2014 | | | 1,789,609 | | | | 1,874,633 | | |
| 890123 — 4.5% 2016 | | | 16,620,410 | | | | 17,393,425 | | |
| 735453 — 5% 2019 | | | 22,008,257 | | | | 23,164,351 | | |
| 890122 — 5% 2021 | | | 17,670,631 | | | | 18,596,219 | | |
| 890083 — 5% 2021 | | | 22,548,571 | | | | 23,746,802 | | |
| 725492 — 5.5% 2014 | | | 1,669,224 | | | | 1,751,967 | | |
| 255356 — 5.5% 2014 | | | 5,212,096 | | | | 5,486,721 | | |
| 257100 — 5.5% 2018 | | | 4,953,990 | | | | 5,283,728 | | |
| 995327 — 5.5% 2019 | | | 8,236,972 | | | | 8,750,382 | | |
| 865963 — 5.904% 2036 | | | 11,118,566 | | | | 11,860,174 | | |
| 253997 — 6% 2011 | | | 406,534 | | | | 418,116 | | |
| 725258 — 6% 2012 | | | 2,457,459 | | | | 2,549,294 | | |
| 256266 — 6% 2016 | | | 3,102,242 | | | | 3,306,121 | | |
| 256385 — 6% 2016 | | | 612,787 | | | | 653,954 | | |
| 256502 — 6% 2016 | | | 1,322,951 | | | | 1,413,242 | | |
| 256547 — 6% 2016 | | | 9,877,889 | | | | 10,554,821 | | |
| 256560 — 6% 2017 | | | 9,767,722 | | | | 10,437,104 | | |
| 928002 — 6% 2017 | | | 1,121,658 | | | | 1,199,535 | | |
| 256632 — 6% 2017 | | | 3,167,491 | | | | 3,385,668 | | |
| 256683 — 6% 2017 | | | 6,066,253 | | | | 6,487,615 | | |
| 928100 — 6% 2017 | | | 1,070,690 | | | | 1,144,353 | | |
| 928128 — 6% 2017 | | | 889,853 | | | | 950,505 | | |
| 928249 — 6% 2017 | | | 1,490,927 | | | | 1,595,322 | | |
| 256743 — 6% 2017 | | | 2,481,482 | | | | 2,656,154 | | |
| 256838 — 6% 2017 | | | 186,482 | | | | 199,726 | | |
| 256794 — 6% 2017 | | | 5,352,031 | | | | 5,730,152 | | |
| 256869 — 6% 2017 | | | 11,345,919 | | | | 12,155,450 | | |
| 820812 — 6.5% 2035 | | | 761,131 | | | | 814,783 | | |
| 840325 — 6.5% 2035 | | | 2,434,379 | | | | 2,602,668 | | |
| 844274 — 6.5% 2035 | | | 4,074,712 | | | | 4,356,397 | | |
| 844613 — 6.5% 2035 | | | 2,601,275 | | | | 2,781,101 | | |
| 846597 — 6.5% 2035 | | | 2,274,488 | | | | 2,431,723 | | |
| 848420 — 6.5% 2035 | | | 6,452,322 | | | | 6,898,371 | | |
| 893835 — 6.5% 2036 | | | 844,956 | | | | 897,884 | | |
| 894362 — 6.5% 2036 | | | 1,328,997 | | | | 1,412,099 | | |
| 894363 — 6.5% 2036 | | | 1,098,117 | | | | 1,166,782 | | |
| 906417 — 6.5% 2036 | | | 2,233,949 | | | | 2,373,526 | | |
| 845365 — 6.5% 2036 | | | 8,176,238 | | | | 8,741,461 | | |
| 848270 — 6.5% 2036 | | | 1,202,654 | | | | 1,285,793 | | |
| 850655 — 6.5% 2036 | | | 5,184,579 | | | | 5,542,989 | | |
| 851095 — 6.5% 2036 | | | 4,232,192 | | | | 4,524,763 | | |
| 865176 — 6.5% 2036 | | | 7,108,392 | | | | 7,599,795 | | |
16
PORTFOLIO OF INVESTMENTS
September 30, 2009
| BONDS & DEBENTURES — Continued | | Principal
Amount | | Value | |
| 909540 — 6.5% 2037 | | $ | 1,200,059 | | | $ | 1,274,979 | | |
| 923306 — 6.5% 2037 | | | 1,231,462 | | | | 1,308,170 | | |
| 323282 — 7.5% 2028 | | | 835,119 | | | | 920,017 | | |
| Government National Mortgage Association 782281 — 6% 2023 | | | 11,683,151 | | | | 12,673,181 | | |
| TOTAL MORTGAGE PASS-THROUGH SECURITIES | | $ | 334,360,916 | | |
| U.S. TREASURY SECURITIES — 6.6% | |
| U.S.Treasury Inflation-Indexed Notes | |
| —0.875% 2010 | | $ | 177,387,832 | | | $ | 177,443,266 | | |
| —2% 2012 | | | 28,731,784 | | | | 29,759,843 | | |
| —2.375% 2011 | | | 19,530,360 | | | | 20,116,271 | | |
| —3.375% 2012 | | | 22,222,204 | | | | 23,624,981 | | |
| TOTAL U.S. TREASURY SECURITIES | | $ | 250,944,361 | | |
| STRIPPED MORTGAGE-BACKED SECURITIES — 4.6% | |
| INTEREST ONLY SECURITIES | |
| Federal Home Loan Mortgage Corporation | |
| 2558 CL JW — 5.5% 2022 | | $ | 8,426,312 | | | $ | 718,259 | | |
| 217 — 6.5% 2032 | | | 1,650,653 | | | | 339,935 | | |
| Federal National Mortgage Association 2003-64 CL XI — 5% 2033 | | | 9,997,697 | | | | 1,279,605 | | |
| Government National Mortgage Association | |
| 2005-9 — 0.71035% 2045 | | | 28,664,963 | | | | 1,001,840 | | |
| 2004-108 — 0.73393% 2044 | | | 39,346,989 | | | | 1,360,619 | | |
| 2006-5 — 0.75079% 2046 | | | 99,955,398 | | | | 4,172,138 | | |
| 2002-56 — 0.75867% 2042 | | | 1,246,419 | | | | 21,451 | | |
| 2006-15 — 0.81000% 2046 | | | 30,512,584 | | | | 1,240,642 | | |
| 2007-15 — 0.81683% 2047 | | | 185,133,012 | | | | 10,056,425 | | |
| 2004-10 — 0.83472% 2044 | | | 150,308,165 | | | | 4,250,715 | | |
| 2004-43 — 0.85108% 2044 | | | 149,507,102 | | | | 4,331,221 | | |
| 2005-90 — 0.85447% 2045 | | | 124,124,214 | | | | 4,948,832 | | |
| 2006-55 — 0.89708% 2046 | | | 110,576,371 | | | | 5,127,426 | | |
| 2005-50 — 0.90285% 2045 | | | 2,377,648 | | | | 102,643 | | |
| 2007-4 — 0.94186% 2047 | | | 57,585,077 | | | | 3,069,860 | | |
| 2007-34 — 0.95183% 2047 | | | 61,193,285 | | | | 3,393,780 | | |
| 2006-67 — 1.00242% 2046 | | | 76,295,932 | | | | 3,791,145 | | |
| 2008-48 — 1.00773% 2048 | | | 159,802,989 | | | | 7,644,975 | | |
| 2008-78 — 1.02341% 2048 | | | 145,503,474 | | | | 7,752,425 | | |
| 2008-92 — 1.0434% 2048 | | | 151,049,603 | | | | 8,955,731 | | |
| 2007-77 — 1.05496% 2047 | | | 213,513,097 | | | | 11,858,517 | | |
| 2007-55 — 1.06954% 2047 | | | 154,283,525 | | | | 8,732,448 | | |
| 2008-45 — 1.13912% 2048 | | | 164,313,348 | | | | 8,675,745 | | |
| 2009-60 — 1.14577% 2049 | | | 149,025,594 | | | | 8,808,903 | | |
17
PORTFOLIO OF INVESTMENTS
September 30, 2009
| BONDS & DEBENTURES — Continued | | Principal
Amount | | Value | |
| 2008-8 — 1.17979% 2047 | | $ | 204,764,390 | | | $ | 11,329,614 | | |
| 2008-24 — 1.22739% 2047 | | | 76,987,699 | | | | 4,523,027 | | |
| 2009-4 — 1.35134% 2049 | | | 158,806,706 | | | | 11,777,105 | | |
| 2009-49 — 1.40934% 2049 | | | 146,928,394 | | | | 10,089,573 | | |
| 2006-30 — 1.43406% 2046 | | | 25,878,270 | | | | 1,184,448 | | |
| 2009-71 — 1.73629% 2049 | | | 160,839,475 | | | | 13,166,319 | | |
| 2009-30 — 1.98241% 2049 | | | 126,567,852 | | | | 11,682,213 | | |
| PRINCIPAL ONLY SECURITY | |
| Federal Home Loan Mortgage Corporation 217 — 6.5% 2032 | | | 1,650,653 | | | | 1,425,240 | | |
| TOTAL STRIPPED MORTGAGE-BACKED SECURITIES | | $ | 176,812,819 | | |
| COMMERCIAL MORTGAGE-BACKED SECURITIES — 2.8% | |
| Government National Mortgage Association | |
| 2008-48 CL A — 3.725% 2029 | | $ | 18,424,190 | | | $ | 18,648,044 | | |
| 2004-6 CL C — 4.712% 2025 | | | 19,030,000 | | | | 19,885,018 | | |
| 2005-34 CL B — 4.739% 2029 | | | 19,000,000 | | | | 19,785,080 | | |
| 2004-51 CL B — 4.982% 2024 | | | 10,030,000 | | | | 10,498,000 | | |
| Washington Mutual CMS 2007-SL2 CL A | |
| —5.42451% 2049+ | | | 46,561,104 | | | | 26,510,961 | | |
| —6.11546% 2045+ | | | 12,041,571 | | | | 10,487,727 | | |
| TOTAL COMMERCIAL MORTGAGE BACKED SECURITIES | | $ | 105,814,830 | | |
| CORPORATE BONDS & DEBENTURES — 2.4% | |
| American Honda Finance Corporation — 2.95125% 2011 | | $ | 33,000,000 | | | $ | 33,000,000 | | |
| CIT Group Inc. — 0.70438% 2012 | | | 6,839,000 | | | | 4,552,107 | | |
| CIT Group Inc. — 5% 2014 | | | 1,870,000 | | | | 1,202,260 | | |
| CIT Group Inc. — 5% 2015 | | | 2,001,000 | | | | 1,250,605 | | |
| CIT Group Inc. — 5.125% 2014 | | | 3,366,000 | | | | 2,187,530 | | |
| CIT Group Inc. — 5.4% 2013 | | | 3,376,000 | | | | 2,210,605 | | |
| CIT Group Inc. — 5.8% 2011 | | | 224,000 | | | | 152,553 | | |
| CIT Group Inc. — 7.75% 2012 | | | 411,000 | | | | 260,340 | | |
| Delta Air Lines, Inc. — 7.111% 2011 | | | 6,711,000 | | | | 6,481,819 | | |
| Delta Air Lines, Inc. — 7.57% 2010 | | | 4,876,000 | | | | 4,827,727 | | |
| Michaels Stores, Inc. — 2.5% 2013 (Floating)+ | | | 6,410,010 | | | | 5,769,009 | | |
| Northwest Airlines, Inc. — 6.841% 2011 | | | 8,472,000 | | | | 8,206,403 | | |
| Toyota Motor Credit Corporation — 5.74% 2013 | | | 21,000,000 | | | | 20,799,240 | | |
| TOTAL CORPORATE BONDS & DEBENTURES | | $ | 90,900,198 | | |
| MUNICIPAL BOND — 1.2% | |
| Irvine Ranch WTR RF-2 California — 8.18% 2014 | | $ | 40,150,000 | | | $ | 44,867,625 | | |
| TOTAL INVESTMENT SECURITIES — 89.5% (Cost $3,387,651,927) | | $ | 3,413,253,670 | | |
18
PORTFOLIO OF INVESTMENTS
September 30, 2009
| BONDS & DEBENTURES — Continued | | Principal
Amount | | Value | |
| SHORT-TERM INVESTMENTS — 10.9% | |
| Toyota Motor Credit Corporation — 0.01% 10/01/09 | | $ | 19,565,000 | | | $ | 19,565,000 | | |
| Federal Home Loan Bank Discount Note — 0.12% 10/02/09 | | | 37,800,000 | | | | 37,799,874 | | |
| Chevron Funding Corporation — 0.14% 10/09/09 | | | 55,300,000 | | | | 55,298,280 | | |
| Federal Home Loan Bank Discount Note — 0.13% 10/14/09 | | | 43,760,000 | | | | 43,757,945 | | |
| Federal Home Loan Bank Discount Note — 0.12% 10/15/09 | | | 55,073,000 | | | | 55,070,430 | | |
| Chevron Funding Corporation — 0.1% 10/27/09 | | | 50,000,000 | | | | 49,996,389 | | |
| Federal Home Loan Bank Discount Note — 0.09% 11/09/09 | | | 60,175,000 | | | | 60,169,133 | | |
| Federal Home Loan Bank Discount Note — 0.11% 11/13/09 | | | 50,800,000 | | | | 50,793,325 | | |
| Federal Home Loan Bank Discount Note — 0.09% 11/16/09 | | | 44,724,000 | | | | 44,718,857 | | |
| TOTAL SHORT-TERM INVESTMENTS (Cost $417,169,233) | | $ | 417,169,233 | | |
| TOTAL INVESTMENTS — 100.4% (Cost $3,804,821,160) | | $ | 3,830,422,903 | | |
| Other assets and liabilities, net — (0.4)% | | | (16,955,026 | ) | |
| TOTAL NET ASSETS — 100.0% | | $ | 3,813,467,877 | | |
+ Restricted securities. These restricted securities constituted 3.6% of total net assets at September 30, 2009.
19
STATEMENT OF ASSETS AND LIABILITIES
September 30, 2009
| ASSETS | |
| Investments at value: | |
Investments securities-at market value
(identified cost $3,387,651,927) | | $ | 3,413,253,670 | | | | | | |
Short-term investments — at amortized cost
(maturities 60 days or less) | | | 417,169,233 | | | $ | 3,830,422,903 | | |
| Cash | | | | | | | 800 | | |
| Receivable for: | |
| Capital Stock sold | | $ | 29,695,942 | | | | | | |
| Interest | | | 14,957,602 | | | | 44,653,544 | | |
| | | | | | | $ | 3,875,077,247 | | |
| LIABILITIES | |
| Payable for: | |
| Investment securities purchased | | $ | 46,865,000 | | | | | | |
| Capital stock repurchased | | | 13,008,467 | | | | | | |
| Advisory fees | | | 1,552,933 | | | | | | |
| Accrued expenses and other liabilities | | | 182,970 | | | | 61,609,370 | | |
| NET ASSETS | | | | | | $ | 3,813,467,877 | | |
| SUMMARY OF SHAREHOLDERS' EQUITY | |
Capital Stock — par value $.01 per share; authorized
400,000,000 shares; outstanding 343,823,132 shares | | | | | | $ | 3,438,231 | | |
| Additional paid in capital | | | | | | | 3,809,124,114 | | |
| Accumulated net loss on investments | | | | | | | (58,571,083 | ) | |
| Undistributed net investment income | | | | | | | 33,874,872 | | |
| Unrealized appreciation of investments | | | | | | | 25,601,743 | | |
| Net assets at September 30, 2009 | | | | | | $ | 3,813,467,877 | | |
NET ASSET VALUE, REDEMPTION PRICE AND
MAXIMUM OFFERING PRICE PER SHARE | |
Net asset value and redemption price per share
(net assets divided by shares outstanding) | | | | | | $ | 11.09 | | |
Maximum offering price per share
(100/96.5 of per share net asset value) | | | | | | $ | 11.49 | | |
See notes to financial statements.
20
STATEMENT OF OPERATIONS
For the Year Ended September 30, 2009
| INVESTMENT INCOME | |
| Interest | | | | | | $ | 117,109,646 | | |
| EXPENSES — Note 4 | |
| Advisory fees | | $ | 15,092,317 | | | | | | |
| Transfer agent fees and expenses | | | 2,239,709 | | | | | | |
| Reports to shareholders | | | 344,719 | | | | | | |
| Custodian fees and expenses | | | 204,292 | | | | | | |
| Registration fees | | | 203,930 | | | | | | |
| Insurance | | | 126,214 | | | | | | |
| Directors' fees and expenses | | | 58,848 | | | | | | |
| Audit and tax services | | | 46,050 | | | | | | |
| Legal fees | | | 14,726 | | | | | | |
| Other expenses | | | 39,522 | | | | 18,370,327 | | |
| Net investment income | | | | | | $ | 98,739,319 | | |
| NET REALIZED AND UNREALIZED GAIN ON INVESTMENTS | |
| Net realized gain on investments: | |
Proceeds from sale of investment securities (excluding
short-term investments with maturities 60 days or less) | | $ | 1,987,790,683 | | | | | | |
| Cost of investment securities sold | | | 1,982,887,071 | | | | | | |
| Net realized gain on investments | | | | | | $ | 4,903,612 | | |
| Change in unrealized appreciation of investments: | |
| Unrealized appreciation at beginning of year | | $ | 10,026,222 | | | | | | |
| Unrealized appreciation at end of year | | | 25,601,743 | | | | | | |
| Change in unrealized appreciation of investments | | | | | | | 15,575,521 | | |
| Net realized and unrealized gain on investments | | | | | | $ | 20,479,133 | | |
| CHANGE IN NET ASSETS RESULTING FROM OPERATIONS | | | | | | $ | 119,218,452 | | |
See notes to financial statements.
21
STATEMENT OF CHANGES IN NET ASSETS
See notes to financial statements.
| | | For the Years Ended September 30, | |
| | | 2009 | | 2008 | |
| CHANGES IN NET ASSETS | |
| Operations: | |
| Net investment income | | $ | 98,739,319 | | | | | | | $ | 84,599,711 | | | | | | |
| Net realized gain on investments | | | 4,903,612 | | | | | | | | 11,400,248 | | | | | | |
Change in unrealized
appreciation of investments | | | 15,575,521 | | | | | | | | (5,522,607 | ) | | | | | |
Change in net assets resulting
from operations | | | | | | $ | 119,218,452 | | | | | | | $ | 90,477,352 | | |
Distributions to shareholders from
net investment income | | | | | | | (99,674,974 | ) | | | | | | | (86,158,727 | ) | |
| Capital stock transactions: | |
| Proceeds from capital stock sold | | $ | 2,630,632,211 | | | | | | | $ | 858,263,218 | | | | | | |
Proceeds from shares issued to
shareholders upon reinvestment
of dividends and distributions | | | 68,856,109 | | | | | | | | 52,694,704 | | | | | | |
| Cost of capital stock repurchased* | | | (1,091,702,315 | ) | | | 1,607,786,005 | | | | (561,168,250 | ) | | | 349,789,672 | | |
| Total change in net assets | | | | | | $ | 1,627,329,483 | | | | | | | $ | 354,108,297 | | |
| NET ASSETS | |
| Beginning of year | | | | | | | 2,186,138,394 | | | | | | | | 1,832,030,097 | | |
| End of year | | | | | | $ | 3,813,467,877 | | | | | | | $ | 2,186,138,394 | | |
CHANGE IN CAPITAL STOCK
OUTSTANDING | |
| Shares of capital stock sold | | | | | | | 238,978,610 | | | | | | | | 77,776,831 | �� | |
Shares issued to shareholders upon
reinvestment of dividends
and distributions | | | | | | | 6,281,367 | | | | | | | | 4,814,003 | | |
| Shares of capital stock repurchased | | | | | | | (99,187,934 | ) | | | | | | | (50,898,680 | ) | |
| Increase in capital stock outstanding | | | | | | | 146,072,043 | | | | | | | | 31,692,154 | | |
* Net of redemption fees of $302,273 and $127,807 for the years ended September 30, 2009, and 2008, respectively.
22
FINANCIAL HIGHLIGHTS
Selected Data for Each Share of Capital Stock Outstanding Throughout Each Year
| | | For the Year Ended September 30, | |
| | | 2009 | | 2008 | | 2007 | | 2006 | | 2005 | |
| Per share operating performance: | |
| Net asset value at beginning of year | | $ | 11.06 | | | $ | 11.03 | | | $ | 10.99 | | | $ | 11.04 | | | $ | 11.30 | | |
| Income from investment operations: | |
| Net investment income | | $ | 0.36 | | | $ | 0.47 | | | $ | 0.50 | | | $ | 0.53 | | | $ | 0.48 | | |
Net realized and unrealized gain (loss) on
investment securities | | | 0.08 | | | | 0.05 | | | | 0.07 | | | | (0.04 | ) | | | (0.34 | ) | |
| Total from investment operations | | $ | 0.44 | | | $ | 0.52 | | | $ | 0.57 | | | $ | 0.49 | | | $ | 0.14 | | |
| Less dividends from net investment income | | $ | (0.41 | ) | | $ | (0.49 | ) | | $ | (0.53 | ) | | $ | (0.54 | ) | | $ | (0.40 | ) | |
| Redemption fees | | | — | * | | | — | * | | | — | * | | | — | * | | | — | * | |
| Net asset value at end of year | | $ | 11.09 | | | $ | 11.06 | | | $ | 11.03 | | | $ | 10.99 | | | $ | 11.04 | | |
| Total investment return** | | | 4.03 | % | | | 4.84 | % | | | 5.36 | % | | | 4.59 | % | | | 1.27 | % | |
| Ratios/supplemental data: | |
| Net assets at end of year (in $000's) | | $ | 3,813,468 | | | $ | 2,186,138 | | | $ | 1,832,030 | | | $ | 1,819,107 | | | $ | 1,845,485 | | |
| Ratio of expenses to average net assets | | | 0.60 | % | | | 0.61 | % | | | 0.62 | % | | | 0.62 | % | | | 0.61 | % | |
Ratio of net investment income to average
net assets | | | 3.20 | % | | | 4.21 | % | | | 4.31 | % | | | 4.68 | % | | | 3.69 | % | |
| Portfolio turnover rate | | | 64 | % | | | 32 | % | | | 53 | % | | | 60 | % | | | 42 | % | |
* Rounds to less than $0.01 per share.
** Return is based on net asset value per share, adjusted for reinvestment of distributions, and does not reflect deduction of the sales charge
See notes to financial statements.
23
NOTES TO FINANCIAL STATEMENTS
September 30, 2009
NOTE 1 — Significant Accounting Policies
The Fund is registered under the Investment Company Act of 1940 as a diversified, open-end, management investment company. The Fund's investment objective is to seek current income and long-term total return. The following is a summary of significant accounting policies consistently followed by the Fund in the preparation of its financial statements.
A. Security Valuation
The Fund values securities pursuant to policies and procedures approved by the Board of Directors. Securities listed or traded on a national securities exchange are valued at the last sale price on the last business day of the year, or if there was not a sale that day, at the last bid price. Securities traded in the NASDAQ National Market System are valued at the NASDAQ Official Closing Price on the last business day of the year, or if there was not a sale that day, at the last bid price. Unlisted securities and securities listed on a national securities exchange for which the over-the-counter market more accurately reflects the securities' value in the judgment of the Fund's officers, are valued at the most recent bid price or other ascertainable market value. The Fund receives pricing information from independent pricing vendors that also use information provided by market makers or estimates of values obtained from data relating to securi ties with similar characteristics. Short-term investments with maturities of 60 days or less are valued at amortized cost which approximates market value. Securities for which market quotations are not readily available from the sources above are valued at fair value as determined in good faith by, or under the direction of, the Board of Directors.
B. Securities Transactions and Related Investment Income
Securities transactions are accounted for on the date the securities are purchased or sold. Dividend income and distributions to shareholders are recorded on the ex-dividend date. Interest income and expenses are recorded on an accrual basis. Market discounts and premiums on fixed income securities are amortized over the expected life of the securities. Realized gains or losses are based on the specific identification method.
C. Use of Estimates
The preparation of financial statements in conformity with accounting principles generally accepted in the United States requires management to make estimates and assumptions that affect the amounts reported. Actual results could differ from these estimates.
NOTE 2 — Risk Considerations
Investing in the Fund may involve certain risks including, but not limited to, those described below.
Market Risk: Because the values of the Fund's investments will fluctuate with market conditions, so will the value of your investment in the Fund. You could lose money on your investment in the Fund or the Fund could underperform other investments.
Interest Rate Risk: The values of, and the income generated by, most debt securities held by the Fund may be affected by changing interest rates and by changes in the effective maturities and credit ratings of these securities. For example, the values of debt securities in the Fund's portfolio generally will decline when interest rates rise and increase when interest rates fall. In addition, falling interest rates may cause an issuer to redeem, call or refinance a security before its stated maturity, which may result in the Fund having to reinvest the proceeds in lower yielding securities.
Mortgage-Backed and Other Asset-Backed Securities Risk: The values of some mortgaged-backed and other asset-backed securities may expose the Fund to a lower rate of return upon reinvestment of principal. When
24
NOTES TO FINANCIAL STATEMENTS
Continued
interest rates rise, the value of mortgage-related securities generally will decline; however, when interest rates are declining, the value of mortgage related-securities with prepayment features may not increase as much as other fixed income securities. The rate of prepayments on underlying mortgages will affect the price and volatility of a mortgage-related security, and may shorten or extend the effective maturity of the security beyond what was anticipated at the time of purchase. If an unanticipated rate of prepayment on underlying mortgages increases the effective maturity of a mortgage-related security, the volatility of the security can be expected to increase. The value of these securities may also fluctuate in response to the market's perception of the creditworthiness of the issuers. Additionally, although mortgages and mortgage-related securities are generally supported by some form of government or private guarantee and/or insur ance, there is no assurance that private guarantors or insurers will meet their obligations.
Stripped Mortgage-Backed Interest Only ("I/O") and Principal Only ("P/O") Securities: Stripped mortgage-backed securities are usually structured with two classes that receive different proportions of the interest and principal distributions on a pool of mortgage assets. In certain cases, one class will receive all of the interest payments on the underlying mortgages (the I/O class), while the other class will receive all of the principal payments (the P/O class). The Fund is currently has investments in I/O securities. The yield to maturity on IOs is sensitive to the rate of principal repayments (including prepayments) on the related underlying mortgage assets, and principal payments may have a material effect on yield to maturity. If the underlying mortgage assets experience greater than anticipated prepayments of principal, a Fund may not fully recoup its initial investment in I/Os.
Credit Risk: The values of any of the Fund's investments may also decline in response to events affecting the issuer or its credit rating. The lower rated debt securities in which the Fund may invest are considered speculative and are generally subject to greater volatility and risk of loss than investment grade securities, particularly in deteriorating economic conditions. The Fund invests a significant portion of its assets in securities of issuers that hold mortgage- and asset-backed securities and direct investments in securities backed by commercial and residential mortgage loans and other financial assets. The value and related income of these securities is sensitive to changes in economic conditions, including delinquencies and/or defaults. Though the Fund has not been adversely impacted, continuing shifts in the market's perception of credit quality on securities backed by commercial and residential mortgage loans and other financial assets may result in increased volatility of market price and periods of illiquidity that can negatively impact the valuation of certain securities held by the Fund.
NOTE 3 — Purchases of Investment Securities
Cost of purchases of investment securities (excluding short-term investments with maturities of 60 days or less) aggregated $3,453,213,817 for the year ended September 30, 2009.
NOTE 4 — Advisory Fees and Other Affiliated Transactions
Pursuant to an Investment Advisory Agreement, advisory fees were paid by the Fund to First Pacific Advisors, LLC (the "Adviser"). Under the terms of this agreement, the Fund pays the Adviser a monthly fee calculated at the annual rate of 0.5% of the average daily net assets of the Fund. The Agreement obligates the Adviser to reduce its fee to the extent necessary to reimburse the Fund for any annual expenses (exclusive of interest, taxes, the cost of any supplemental statistical and research information, and extraordinary expenses such as litigation) in excess of 11/2% of the first $15 million and 1% of the remaining average net assets o f the Fund for the year.
For the year ended September 30, 2009, the Fund paid aggregate fees of $58,848 to all Directors who are not interested persons of the Adviser. Certain officers of the Fund are also officers of the Adviser and FPA Fund Distributors, Inc.
25
NOTES TO FINANCIAL STATEMENTS
Continued
NOTE 5 — Federal Income Tax
No provision for federal income tax is required because the Fund has elected to be taxed as a "regulated investment company" under the Internal Revenue Code and intends to maintain this qualification and to distribute each year to its shareholders, in accordance with the minimum distribution requirements of the Code, all of its taxable net investment income and taxable net realized gains on investments.
Distributions paid to shareholders are based on net investment income and net realized gains determined on a tax reporting basis, which may differ from financial reporting. For federal income tax purposes, the components of distributable earnings at September 30, 2009, were as follows:
| Undistributed net investment income | | $ | 34,769,364 | | |
The tax status of dividends paid during fiscal years ended September 30, 2009 and 2008 were as follows:
| | | 2009 | | 2008 | |
| Dividends from ordinary income | | $ | 99,674,974 | | | $ | 86,158,727 | | |
Accumulated net realized losses of $57,051,296 can be carried forward to offset future gains. The ability to carry these losses forward expires as follows: $11,767,908 in 2012, $7,719,581 in 2013, $20,873,466 in 2014, $16,390,845 in 2015, and $299,496 in 2017.
The cost of investment securities at September 30, 2009 for federal income tax purposes was $3,388,546,419. Gross unrealized appreciation and depreciation for all securities at September 30, 2009 for federal income tax purposes was $40,699,303 and $15,992,052, respectively, resulting in net unrealized appreciation of $24,707,251. As of and during the year ended September 30, 2009, the Fund did not have any liability for unrecognized tax benefits. The Fund recognizes interest and penalties, if any, related to unrecognized tax benefits as income tax expense in the Statement of Operations. During the period, the Fund did not incur any interest or penalties. The Fund is not subject to examination by U.S. federal tax authorities for years ended before September 30, 2006 or by state tax authorities for years ended before September 30, 2005.
During the year ended September 30, 2009, the Fund reclassified $6,722,896 of net amounts from accumulated net loss to undistributed net investment income to align financial reporting with tax reporting.
NOTE 6 — Distributor
For the year ended September 30, 2009, FPA Fund Distributors, Inc. ("Distributor"), a wholly owned subsidiary of the Adviser, received $233,812 in net Fund share sales commissions after reallowance to other dealers. The Distributor pays its own overhead and general administrative expenses, the cost of supplemental sales literature, promotion and advertising.
NOTE 7 — Redemption Fees
A redemption fee of 2% applies to redemptions within 90 days of purchase for certain purchases made by persons eligible to purchase shares without an initial sales charge. For the year ended September 30, 2009, the Fund collected $302,273 in redemption fees, which amounted to less than $0.01 per share.
NOTE 8 — Distribution to Shareholders
On September 30, 2009, the Board of Directors declared a dividend from net investment income of $0.09 per share payable October 6, 2009 to shareholders of record on September 30, 2009. For financial statement purposes, this dividend was recorded on the ex-dividend date, October 1, 2009.
26
NOTES TO FINANCIAL STATEMENTS
Continued
NOTE 9 — Disclosure of Fair Value Measurements
The Fund classifies its assets based on three valuation methodologies. Level 1 investment securities are valued based on quoted market prices in active markets for identical assets. Level 2 investment securities are valued based on significant observable market inputs, such as quoted prices for similar assets and quoted prices in inactive markets or other market observable inputs. Level 3 investment securities are valued using significant unobservable inputs that reflect the Fund's determination of assumptions that market participants might reasonably use in valuing the assets. The valuation levels are not necessarily an indication of the risk associated with investing in those securities. The following table presents the valuation levels of the Fund's investments as of September 30, 2009:
| Investments | | Level 1 | | Level 2 | | Level 3 | | Total | |
| Bonds & Debentures | |
| U.S. Agencies | | | | | | $ | 1,143,398,011 | | | | — | | | $ | 1,143,398,011 | | |
| Mortgage-Backed | | | — | | | | 854,311,470 | | | | — | | | | 854,311,470 | | |
| Short-Term U.S. Treasury | | $ | 411,843,440 | | | | — | | | | — | | | | 411,843,440 | | |
| Mortgage Pass-Through | | | — | | | | 334,360,916 | | | | — | | | | 334,360,916 | | |
| U.S. Treasury | | | 250,944,361 | | | | — | | | | — | | | | 250,944,361 | | |
| Stripped Mortgage-Backed | | | — | | | | 176,812,819 | | | | — | | | | 176,812,819 | | |
| Commercial Mortgage-Backed | | | — | | | | 105,814,830 | | | | — | | | | 105,814,830 | | |
| Corporate | | | — | | | | 90,900,198 | | | | — | | | | 90,900,198 | | |
| Municipal | | | — | | | | 44,867,625 | | | | — | | | | 44,867,625 | | |
| Short-Term Investments | | | — | | | | 417,169,233 | | | | — | | | | 417,169,233 | | |
| Total Investments | | $ | 662,787,801 | | | $ | 3,167,635,102 | | | | — | | | $ | 3,830,422,903 | | |
NOTE 10 — Subsequent Events
As of November 13, 2009, the date the financial statements were available to be issued, no subsequent events or transactions had occurred that would have materially impacted the financial statements as presented.
27
REPORT OF INDEPENDENT REGISTERED
PUBLIC ACCOUNTING FIRM
TO THE SHAREHOLDERS AND
BOARD OF DIRECTORS OF FPA NEW INCOME, INC.
We have audited the accompanying statement of assets and liabilities of FPA New Income, Inc. (the "Fund"), including the portfolio of investments, as of September 30, 2009, the related statement of operations for the year then ended, the statements of changes in net assets for each of the two years in the period then ended, and financial highlights for each of the five years in the period then ended. These financial statements and financial highlights are the responsibility of the Fund's management. Our responsibility is to express an opinion on these financial statements and financial highlights based on our audits.
We conducted our audits in accordance with standards of the Public Company Accounting Oversight Board (United States). Those standards require that we plan and perform the audit to obtain reasonable assurance about whether the financial statements and financial highlights are free of material misstatement. The Fund is not required to have, nor were we engaged to perform, an audit of its internal control over financial reporting. Our audits included consideration of internal control over financial reporting as a basis for designing audit procedures that are appropriate in the circumstances, but not for the purpose of expressing an opinion on the effectiveness of the Fund's internal control over financial reporting. Accordingly, we express no such opinion. An audit also includes examining, on a test basis, evidence supporting the amounts and disclosures in the financial statements, assessing the accounting principles used and significant estim ates made by management, as well as evaluating the overall financial statement presentation. Our procedures included confirmation of securities owned as of September 30, 2009, by correspondence with the custodian and brokers. We believe that our audits provide a reasonable basis for our opinion.
In our opinion, the 2009 financial statements and financial highlights referred to above present fairly, in all material respects, the financial position of FPA New Income, Inc. as of September 30, 2009, the results of its operations for the year then ended, the changes in its net assets for each of the two years in the period then ended, and the financial highlights for each of the five years in the period then ended, in conformity with accounting principles generally accepted in the United States of America.

Los Angeles, California
November 13, 2009
28
RENEWAL OF THE INVESTMENT ADVISORY AGREEMENT
The following paragraphs summarize the material information and factors considered by the Board at a meeting held on August 4, 2009, as well as their conclusions relative to such factors.
Nature, Extent and Quality of Services. The Board considered information regarding the Adviser and its staffing in connection with the Fund, including the Fund's portfolio managers, the senior analysts supporting team, the scope of accounting, administrative, shareholder and other services supervised and provided by the Adviser, and the absence of any significant service problems reported to the Board. The Board noted the experience, length of service and the outstanding reputation of the Fund's Portfolio managers; Robert Rodriguez, who has managed the Fund since 1984, and Tom Atteberry, who has been with the Adviser since 1997. The Directors concluded that the nature, extent and quality of services provided by the Adviser have benefited and should continue to benefit the Fund and its shareholders.
Investment Performance. The Directors reviewed the overall investment performance of the Fund. They also received information from an independent consultant, Lipper Analytical Services, Inc. ("Lipper"), regarding the Fund's performance relative to a peer group of A-rated corporate debt value funds selected by Lipper (the "Peer Group"). The Directors noted the Fund's competitive long-term investment performance when compared to the Peer Group. They further concluded that the Adviser's continued management of the Fund should benefit the Fund and its shareholders.
Advisory Fees and Fund Expenses; Adviser Profitability; Economies of Scale and Sharing of Economies of Scale. The Directors were provided information by the Adviser to enable consideration of the Fund's advisory fees and total expense levels, as well as the overall profitability of the Adviser, the benefits to the Adviser from its relationship to the Fund, the extent to which economies of scale with respect to the management of the Fund, if any, would be realized, and whether the Fund is sharing, or will share, in those economies.
The Directors reviewed comparative information relative to fees and expenses for the mutual fund industry generally and for the Peer Group. The Directors noted that the Fund's fees and expenses were at the lower end of the range for the Peer Group. The Directors noted that the overall expense ratio of the Fund was also low when compared to the Peer Group. The Directors concluded that the overall fee rate was reasonable and fair to the Fund and its shareholders in light of the nature and quality of the services provided by the Adviser.
The Directors considered whether there have been economies of scale with respect to the management of the Fund, whether the Fund has appropriately benefited from any economies of scale, and whether the fee rate is reasonable in relation to the Fund's assets and any economies of scale that may exist. The Directors expressed concern that the fee rate does not have any breakpoints. The mutual fund industry has trended toward funds having breakpoints in the advisory fee structure as a means by which to share in economies of scale as a fund's assets grow; however, not all funds have breakpoints in their fee structures. The Adviser indicated its belief that additional breakpoints currently were not appropriate for the Fund and that no meaningful income and expense forecasts for its business could be prepared given uncertainties regarding the direction of the economy, rising inflation, increasing costs for personnel and systems, and growth (or not) in the Fund's assets, all of which could negatively impact the Adviser. The Directors noted that the Adviser had not increased the fee rate charged to the Fund despite the Adviser's claims of increases in the Adviser's internal costs of providing investment management services to the Fund, in part due to administrative burdens and expenses resulting from recent legislative and regulatory actions such as Sarbanes-Oxley. According to the Adviser, such increased costs have included significant investments in analysts who assist with the management of the Fund, additions to administrative personnel and systems that enhance the quality of services provided
29
RENEWAL OF THE INVESTMENT ADVISORY AGREEMENT
Continued
to the Fund and the establishment of a full-time Chief Compliance Officer and his assistant.
Conclusions. The Directors determined that the Fund continues to benefit from the services of a highly experienced portfolio management team that has produced competitive long-term returns. In addition, the Directors agreed that the Fund continues to receive high quality accounting, administrative, shareholder and other ancillary services from the Adviser. The Directors acknowledged that there is no uniform industry methodology to measure or apply economies of scale. The Directors determined that the Fund's expense ratio, the overall profitability of the Adviser, and the sharing of economies of scale with the Fund are fair and reasonable under the current circumstances. In reaching their conclusions, the Directors acknowledged that the fees and expenses of the Fund are clearly disclosed in the Fund's prospectus, in all reports to Fund shareholders and in industry research databases such as those maintained by Lipper and Morningstar, and that the Fund's shareholders have ready access to other funds with different strategies, fees and expenses and can redeem at any time if they feel the Adviser's services do not provide adequate value for the fees and expenses charged. The Directors also stated their intention to continue monitoring the factors relevant to the Adviser's compensation, such as changes in the Fund's asset levels, changes in portfolio management personnel and the cost and quality of the services provided by the Adviser to the Fund. On the basis of the foregoing, and without assigning particular weight to any single factor, the Directors determined to approve the continuation of the current advisory agreement for an additional one-year period through September 30, 2010.
30
SHAREHOLDER EXPENSE EXAMPLE
September 30, 2009
(Unaudited)
Fund Expenses
As a shareholder of the Fund, you incur two types of costs: (1) transaction costs, and (2) ongoing costs, including advisory and administrative fees; shareholder service fees; and other Fund expenses. The Example is intended to help you understand your ongoing costs (in dollars) of investing in the Fund and to compare these costs with the ongoing costs of investing in other mutual funds. The Example is based on an investment of $1,000 invested at the beginning of the year and held for the entire year.
Actual Expenses
The information in the table under the heading "Actual Performance" provides information about actual account values and actual expenses. You may use the information in this column, together with the amount you invested, to estimate the expenses that you paid over the period. Simply divide your account value by $1,000 (for example, an $8,600 account value divided by $1,000= 8.6), then multiply the result by the number in the first column in the row entitled "Expenses Paid During Period" to estimate the expenses you paid on your account during this period.
Hypothetical Example for Comparison Purposes
The information in the table under the heading "Hypothetical Performance (5% return before expenses)" provides information about hypothetical account values and hypothetical expenses based on the Fund's actual expense ratio and an assumed rate of return of 5% per year before expenses, which is not the Fund's actual return. The hypothetical account values and expenses may not be used to estimate the actual ending account balance or expenses you paid for the period. You may use this information to compare the ongoing costs of investing in the Fund and other funds. To do so, compare this 5% hypothetical example with the 5% hypothetical examples that appear in the shareholder reports of other funds.
Please note that the expenses shown in the table are meant to highlight your ongoing costs only and do not reflect any transactional costs. Therefore, the information under the heading "Hypothetical Performance (5% return before expenses)" is useful in comparing ongoing costs only, and will not help you determine the relative total costs of owning different funds. In addition, if these transactional costs were included, your costs would have been higher.
| | | Actual
Performance | | Hypothetical
Performance
(5% return
before
expenses) | |
Beginning Account Value
March 31, 2009 | | $ | 1,000.00 | | | $ | 1,000.00 | | |
Ending Account Value
September 30, 2009 | | $ | 1,017.40 | | | $ | 1,021.95 | | |
Expenses Paid During
Period* | | $ | 3.03 | | | $ | 3.05 | | |
* Expenses are equal to the Fund's annualized expense ratio of 0.60%, multiplied by the average account value over the period and prorated for the six-months ended September 30, 2009 (183/365 days).
31
DIRECTOR AND OFFICER INFORMATION
| Name, Age & Address | | Position(s)
With Fund/
Years Served | | Principal Occupation(s)
During the Past 5 Years | | Portfolios in
Fund Complex
Overseen | | Other Directorships | |
| Willard H. Altman, Jr. – (74)* | | Director and Chairman†
Years Served: 11 | | Retired. Formerly, until 1995, Partner of Ernst & Young LLP, a public accounting firm. | | | 6 | | | | |
|
| Thomas P. Merrick – (72)* | | Director†
Years Served: <1 | | Private Consultant. President of Strategic Planning Consultants for more than the past five years. Former Executive Committee Member and Vice President of Fluor Corporation, responsible for strategic planning, from 1984 to 1998. | | | 6 | | | | |
|
| Alfred E. Osborne, Jr. – (64)* | | Director†
Years Served: 10 | | Senior Associate Dean of the John E. Anderson School of Management at UCLA. | | | 3 | | | Investment Company Institute, Wedbush, Inc., Kaiser Aluminum Corporation, and Heckmann Corporation. | |
|
| Patrick B. Purcell – (66)* | | Director†
Years Served: 3 | | Retired. Formerly Consultant from March 1998 to August 2000, and Executive Vice President, Chief Financial Officer and Chief Administrative Officer from 1989 to March 1998, of Paramount Pictures. | | | 3 | | | The Ocean Conservancy and The Motion Picture and Television Fund | |
|
| Lawrence J. Sheehan – (77)* | | Director†
Years Served: 18 | | Retired. Formerly partner (1969 to 1994) and of counsel employee (1994-2002) of the firm of O'Melveny & Myers LLP. | | | 6 | | | | |
|
| Robert L. Rodriguez – (60) | | Director†
President & Chief Investment Officer
Years Served: 25 | | Chief Executive Officer of the Adviser. | | | 2 | | | FPA Fund Distributors, Inc. | |
|
| Thomas H. Atteberry – (56) | | Vice President & Portfolio Manager
Years Served: 4 | | Partner of the Adviser. Formerly Vice President of First Pacific Advisors, Inc. from 1997 to 2006. | | | | | | | |
|
| Eric S. Ende – (65) | | Vice President
Years Served: 24 | | Partner of the Adviser. Formerly Senior Vice President of First Pacific Advisors, Inc. from 1983 to 2006. | | | 3 | | | | |
|
| J. Richard Atwood – (49) | | Treasurer
Years Served: 12 | | Chief Operating Officer of the Adviser. President and Chief Executive Officer of FPA Fund Distributors, Inc. | | | | | | FPA Fund Distributors, Inc. | |
|
| Christopher H. Thomas – (52) | | Chief Compliance Officer
Years Served: 14 | | Vice President and Chief Compliance Officer of the Adviser and Vice President of FPA Fund Distributors, Inc. | | | | | | FPA Fund Distributors, Inc. | |
|
| Sherry Sasaki – (54) | | Secretary
Years Served: 26 | | Assistant Vice President and Secretary of the Adviser and Secretary of FPA Fund Distributors, Inc. | | | | | | | |
|
| E. Lake Setzler – (42) | | Assistant Treasurer
Years Served: 3 | | Vice President and Controller of the Adviser since 2005. Formerly Chief Operating Officer of Inflective Asset Management, LLC (2004-2005) and Vice President of Transamerica Investment Management, LLC (2000-2004). | | | | | | | |
|
† Directors serve until their resignation, removal or retirement.
* Audit Committee member
Additional information on the Directors is available in the Statement of Additional Information. Each of the above listed individuals can be contacted at 11400 W. Olympic Blvd., Suite 1200, Los Angeles, CA 90064.
32
FPA NEW INCOME, INC.
INVESTMENT ADVISER
First Pacific Advisors, LLC
11400 West Olympic Boulevard, Suite 1200
Los Angeles, California 90064
DISTRIBUTOR
FPA Fund Distributors, Inc.
11400 West Olympic Boulevard, Suite 1200
Los Angeles, California 90064
COUNSEL
O'Melveny & Myers LLP
Los Angeles, California
TICKER: FPNIX
CUSIP: 302544101
INDEPENDENT REGISTERED PUBLIC ACCOUNTING FIRM
Deloitte & Touche LLP
Los Angeles, California
CUSTODIAN & TRANSFER AGENT
State Street Bank and Trust Company
Boston, Massachusetts
SHAREHOLDER SERVICE AGENT
Boston Financial Data Services, Inc.
P.O. Box 8500
Boston, Massachusetts 02266-8500
30 Dan Road
Canton, MA 02021-2809
(800) 638-3060
(617) 483-5000
This report has been prepared for the information of shareholders of FPA New Income, Inc., and is not authorized for distribution to prospective investors unless preceded or accompanied by a prospectus.
The Fund's complete proxy voting record for the 12 months ended June 30, 2009 is available without charge, upon request, by calling (800) 982-4372 and on the SEC's website at www.sec.gov.
The Fund's schedule of portfolio holdings, filed the first and third quarter of the Fund's fiscal year on Form N-Q with the SEC, is available on the SEC's website at www.sec.gov. Form N-Q is available at the SEC's Public Reference Room in Washington, D.C., and information on the operations of the Public Reference Room may be obtained by calling (202) 942-8090. To obtain information on Form N-Q from the Fund, shareholders can call (800) 982-4372.
Additional information about the Fund is available online at www.fpafunds.com. This information includes, among other things, holdings, top sectors and performance, and is updated on or about the 15th business day after the end of each quarter.
Item 2. | Code of Ethics. |
| |
| (a) | The registrant has adopted a code of ethics that applies to the registrant’s principal executive and financial officers. |
| | |
| (b) | Not Applicable |
| | |
| (c) | During the period covered by this report, there were not any amendments to the provisions of the code of ethics adopted in 2(a) above. |
| | |
| (d) | During the period covered by this report, there were not any implicit or explicit waivers to the provisions of the code of ethics adopted in 2(a). |
| | |
| (e) | Not Applicable |
| | |
| (f) | A copy of the registrant’s code of ethics is filed as an exhibit to this Form N-CSR. Upon request, any person may obtain a copy of this code of ethics, without charge, by calling (800) 982-4372. |
| |
Item 3. | Audit Committee Financial Expert. |
| |
| The registrant’s board of directors has determined that Willard H. Altman, Jr. and Patrick B. Purcell, each of whom is a member of the registrant’s audit committee and board of directors, is an “audit committee financial expert” and is “independent,” as those terms are defined in this Item. This designation will not increase the designees’ duties, obligations or liability as compared to each of their duties, obligations and liability as a member of the audit committee and of the board of directors. This designation does not affect the duties, obligations or liability of any other member of the audit committee or the board of directors. |
| |
Item 4. | Principal Accountant Fees and Services. |
| | | 2008 | | 2009 | |
(a) | Audit Fees | | $ | 37,300 | | $ | 39,200 | |
(b) | Audit Related Fees | | -0- | | -0- | |
(c) | Tax Fees | | $ | 6,750 | | $ | 7,100 | |
(d) | All Other Fees | | -0- | | -0- | |
| (e)(1) | Disclose the audit committee’s pre-approval policies and procedures described in paragraph (c)(7) of Rule 2-01 of Regulation S-X. The audit committee shall pre-approve all audit and permissible non-audit services that the committee considers compatible with maintaining the independent auditors’ independence. The pre-approval requirement will extend to all non-audit services provided to the registrant, the adviser, and any entity controlling, controlled by, or under common control with the adviser that provides ongoing services to the registrant, if the |
| | engagement relates directly to the operations and financial reporting of the registrant; provided, however, that an engagement of the registrant’s independent auditors to perform attest services for the registrant, the adviser or its affiliates required by generally accepted auditing standards to complete the examination of the registrant’s financial statements (such as an examination conducted in accordance with Statement on Auditing Standards Number 70 issued by the American Institute of Certified Public Accountants), will be deem pre-approved if: (i) the registrant’s independent auditors inform the audit committee of the engagement, (ii) the registrant’s independent auditors advise the audit committee at least annually that the performance of this engagement will not impair the independent auditor’s independence with respect to the registrant, and (iii) the audit committee receives a copy of the independent auditor’s report prepared in connection with such services. The committee may delegate to one or more committee members the authority to review and pre-approve audit and permissible non-audit services. Actions taken under any such delegation will be reported to the full committee at its next meeting. |
| | |
| (e)(2) | Disclose the percentage of services described in each of paragraphs (b) – (d) of this Item that were approved by the audit committee pursuant to paragraph (c)(7)(i)(C) of Rule 2-01 of Regulation S-X. 100% of the services provided to the registrant described in paragraphs (b) – (d) of this Item were pre-approved by the audit committee pursuant to paragraph (e)(1) of this Item. There were no services provided to the investment adviser or any entity controlling, controlled by or under common control with the adviser described in paragraphs (b) – (d) of this Item that were required to be pre-approved by the audit committee. |
| | |
| (f) | If greater than 50%, disclose the percentage of hours expended on the principal accountant’s engagement to audit the registrant’s financial statements for the most recent fiscal year that were attributed to work performed by persons other than the principal accountant’s full-time, permanent employees. All services performed on the engagement to audit the registrant’s financial statements for the most recent fiscal year end were performed by the principal accountant’s full-time, permanent employees. |
| | |
| (g) | Disclose the aggregate non-audit fees billed by the registrant’s accountant for services rendered to the registrant, and rendered to the registrant’s investment adviser (not including any sub-adviser whose role is primarily portfolio management and is subcontracted with or overseen by another investment adviser), and any entity controlling, controlled by, or under common control with the adviser that provides ongoing services to the registrant for each of the last two fiscal years of the registrant. None. |
| (h) | Disclose whether the registrant’s audit committee of the board of directors has considered whether the provision of non-audit services that were rendered to the registrant’s investment adviser (not including any sub-adviser whose role is primarily portfolio management and is subcontracted with or overseen by another investment adviser), and any entity controlling, controlled by, or under common control with the investment adviser that provides ongoing services to the registrant that were not pre-approved pursuant to paragraph (c)(7)(ii) of Rule 2-01 of Regulation S-X is compatible with maintaining the principal accountant’s independence. Not Applicable. |
| |
Item 5. | Audit Committee of Listed Registrants. Not Applicable. |
| |
Item 6. | Schedule of Investments. The schedule of investments is included as part of the report to stockholders filed under Item 1 of this Form. |
| |
Item 7. | Disclosure of Proxy Voting Policies and Procedures for Closed-End Management Investment Companies. Not Applicable. |
| |
Item 8. | Portfolio Managers of Closed-End Management Investment Companies. Not Applicable. |
| |
Item 9. | Purchases of Equity Securities by Closed-End Management Investment Company and Affiliated Purchasers. Not Applicable. |
| |
Item 10. | Submission of Matters to a Vote of Security Holders. There has been no material change to the procedures by which shareholders may recommend nominees to the registrant’s board of directors. |
| |
Item 11. | Controls and Procedures. |
| | |
| (a) | The principal executive officer and principal financial officer of the registrant have concluded that the registrant’s disclosure controls and procedures (as defined in Rule 30a-3(c) under the Investment Company Act of 1940) are effective based on their evaluation of the disclosure controls and procedures as of a date within 90 days of the filing date of this report. |
| | |
| (b) | There have been no significant changes in the registrant’s internal controls over financial reporting (as defined in Rule 30a-3(d) under the Investment Company Act of 1940) that occurred during the second fiscal quarter of the period covered by this report that have materially affected, or is reasonably likely to materially affect, the registrant’s internal controls over financial reporting. |
Item 12. | Exhibits. |
| | |
| (a)(1) | Code of ethics as applies to the registrant’s officers and directors, as required to be disclosed under Item 2 of Form N-CSR. Attached hereto as Ex.99.CODE.ETH. |
| | |
| (a)(2) | Separate certification for the registrant’s principal executive officer and principal financial officer, as required by Rule 30a-2(a) under the Investment Company Act of 1940. Attached hereto. |
| | |
| (a)(3) | Not Applicable |
| | |
| (b) | Separate certification for the registrant’s principal executive officer and principal financial officer, as required by Rule 30a-2(b) under the Investment Company Act of 1940. Attached hereto. |
SIGNATURES
Pursuant to the requirements of the Securities Exchange Act of 1934 and the Investment Company Act of 1940, the registrant has duly caused this report to be signed on its behalf by the undersigned, thereunto duly authorized.
FPA NEW INCOME, INC.
By: | /s/ ROBERT L. RODRIGUEZ | |
Robert L. Rodriguez, President |
(Principal Executive Officer) |
Date: November 25, 2009
Pursuant to the requirements of the Securities Exchange Act of 1934 and the Investment Company Act of 1940, this report has been signed below by the following persons on behalf of the registrant and in the capacities and on the dates indicated.
FPA NEW INCOME, INC.
By: | /s/ ROBERT L. RODRIGUEZ | |
Robert L. Rodriguez, President |
(Principal Executive Officer) |
Date: November 25, 2009
By: | /s/ J. RICHARD ATWOOD | |
J. Richard Atwood, Treasurer |
(Principal Financial Officer) |
Date: November 25, 2009