UNITED STATES
SECURITIES AND EXCHANGE COMMISSION
Washington, D.C. 20549
FORM N-CSR
CERTIFIED SHAREHOLDER REPORT OF REGISTERED
MANAGEMENT INVESTMENT COMPANIES
Investment Company Act file number | 811-1735 |
|
FPA NEW INCOME, INC. |
(Exact name of registrant as specified in charter) |
|
11400 WEST OLYMPIC BLVD., SUITE 1200, LOS ANGELES, CALIFORNIA | | 90064 |
(Address of principal executive offices) | | (Zip code) |
|
J. RICHARD ATWOOD, 11400 WEST OLYMPIC BLVD., SUITE 1200, LOS ANGELES, CALIFORNIA 90064 |
(Name and address of agent for service) |
|
Registrant’s telephone number, including area code: | 310-473-0225 | |
|
Date of fiscal year end: | SEPTEMBER 30 | |
|
Date of reporting period: | SEPTEMBER 30, 2011 | |
| | | | | | | | | |
Item 1. Report to Stockholders.
FPA New Income, Inc.
Annual Report

Distributor:
FPA FUND DISTRIBUTORS, INC.
11400 West Olympic Boulevard, Suite 1200
Los Angeles, California 90064
IMPORTANT REMINDER:
Effective as of the close of business on November 4, 2011, UMB Fund Services, Inc. (UMBFS) officially replaced Boston Financial Data Services as the transfer agent for the FPA Funds. While many of the services UMBFS provides take place behind the scenes, we believe that changing providers will result in lower overall costs to the Funds while providing greater reporting and online capabilities. We hope that this change further enhances your experience with the FPA Funds. Please refer to the back cover of this report for the new contact information.
September 30, 2011
LETTER TO SHAREHOLDERS
Dear Fellow Shareholders:
This Annual Report covers the year ended September 30, 2011. Your Fund's net asset value (NAV) closed at $10.84. During the fiscal year, your Fund paid four income dividends totaling $0.465. There were no capital gains distributions.
The following table shows the average annual total return for several different periods ended on that date for the Fund and comparative indices of securities prices. The data quoted represents past performance, and an investment in the Fund may fluctuate so that an investor's shares when redeemed may be worth more or less than their original cost.
| | | Periods Ended September 30, 2011 | |
| | | 1 Year | | 5 Years | | 10 Years | | 15 Years | | 20 Years | | 25 Years | | 6/30/1984
Inception | |
| FPA New Income (NAV)* | | | 2.47 | % | | | 3.91 | % | | | 4.13 | % | | | 5.31 | % | | | 6.26 | % | | | 7.14 | % | | | 8.31 | % | |
FPA New Income
(Net of Sales Charge)** | | | -1.12 | % | | | 3.18 | % | | | 3.76 | % | | | 5.06 | % | | | 6.07 | % | | | 6.99 | % | | | 8.17 | % | |
Lipper A-Rated Bond
Fund Average | | | 4.11 | % | | | 5.51 | % | | | 5.29 | % | | | 5.78 | % | | | 6.46 | % | | | N/A | | | | N/A | | |
| Barclays Govt/Credit Index | | | 5.14 | % | | | 6.52 | % | | | 5.74 | % | | | 6.49 | % | | | 6.78 | % | | | 7.24 | % | | | 8.44 | % | |
The Fund continues to perform in line with our expectations. Our emphasis on high-quality, short-duration bonds led to our YTD return of 2.04%* through September 30, 2011 versus 5.34% for the Lipper Average and 7.47% for the Barclays Index. For the second half of the fiscal year, your Fund's return was 1.11%*, 4.37% for the Lipper Average and 7.17% for the Barclays Index.
As we have stated for quite some time it is our view that preservation of capital in the bond market is paramount today and the continuing economic and political uncertainty only focuses our resolve. That caution does not come without a price, and that is our willingness to underperform during short dramatic rallies in the prices of bonds like we experienced this past six months. By exercising our cautious approach, it is our expectation that over the long term the Fund will fare very well when compared to the Index. Further discussion of our reasoning and investment outlook, together with current investment opportunities, follows.
Performance
Over the last six months the shape of the yield curve has changed dramatically as well as the level of interest rates. The two year Treasury declined 58 basis points from a yield of 0.82% to 0.24%, and the ten year Treasury declined 155 basis points from a yield of 3.47% to 1.92%. The difference between the yield on the two year and ten year Treasury, shrinking from 265 basis points to 168 basis points, resulted in a "flattening" of the yield curve. With our focus on owning bonds with maturities of 5 years or less, our shorter maturity portfolio was not constructed to take advantage of this dramatic rally in interest rates given their already extremely low level. As we have discussed in our past commentaries, the duration of the Fund has been kept very short, ranging between 0.93 and 1.53 years, while the duration of the Barclays Government/Credit Index ranged between 5.50 and 6.04 years. This means that the Index was over 5 times as sensitive to changes in the level of interest rates as the Fund. The result was that while we produced a positive return of 1.11% over the past six months, the Index
* Does not reflect deduction of the sales charge which, if reflected, would reduce the performance shown.
** Reflects deduction of the maximum sales charge of 3.5% of the offering price.
1
rose 7.16%. Interestingly, the yield to worst of both are very similar with the Fund at a 2.16% yield to worst while the Index is 2.05%, so the Fund is providing a slightly better yield while taking far less interest rate risk.
Our holdings of 15 year amortization, 4% coupon, Agency mortgage pools bought at the end of 2010 and the beginning of 2011, were some of our best performers. Our GNMA Project Loan Interest Only Securities (IO) also performed well. The IO performance was not only driven by their longer duration, but the lowering of rates also resulted in some of the underlying loans being refinanced. A unique feature of these IO loans is that if they are refinanced the borrower pays a prepayment penalty, and that penalty is passed on in the form of an additional income payment to the IO security holder. Not every type of IO we hold performed as well. The Interest Only security holdings backed by 10 year amortization single family mortgage pools declined in price. The reason for this decline is that as mortgage rates declined, the prepayment speeds increased as some borrowers refinanced their loans, which reduces the monthly income stream to the IO holders. Unlike the project loan mortgages there are no prepayment penalties on the single family mortgage loans. Our view is that the remaining borrowers are less sensitive to refinancing their mortgages due to the already low level of rates and shorter time to pay off the loan, so we do not expect this to have a sustained negative impact on the Fund over the longer term.
Over the past six months, we made several changes to our sector allocations. We increased our allocation to single family mortgage Agency securities from 38% to 51%, asset-backed securities increased from 7% to 10%, and commercial mortgage-backed securities were increased from 7% to 9%. The biggest decline in allocation was to Agency debentures which were reduced from 6% to 2%. A discussion of some of these more significant portfolio shifts is discussed later. From a credit quality perspective, 96% of the Fund is currently rated AA or higher. However, within this category there was a significant shift in security classification. We have moved all of our U.S. Government and Agency-Backed securities into the AA-rated category as a result of S&P's downgrade of the Federal government this past August. In spite of this downgrade, we are cautious about relying too heavily on the rating agencies given their past missteps. We still view the credit quality of the U.S. as higher than the best AAA corporate security and we see less risk of a default by the U.S. Government. This view is supported primarily by the ability of the U.S. to tax and print money, and its position as the financial leader in the world. Finally, the Fund's exposure to interest rate risk declined as well, as the effective duration shortened to 0.9 years at September 30 from 1.5 years at the end of March.
Commentary
The U.S. budgetary issues continue to be one of the key factors affecting our economic and investment outlook. It is estimated that for its fiscal year ending 2011, U.S. Federal Government spending will represent a little over 25% of GDP. This is the highest level since 1945 when it was 41.5%. The current fiscal situation is summed up in the opening paragraph of the CBO Budget and Economic Outlook: An Update, dated August 2011.
"The United States is facing profound budgetary and economic challenges. At 8.5 percent of gross domestic product (GDP), the $1.3 trillion budget deficit that the Congressional Budget Office (CBO) projects for 2011 will be the third-largest shortfall in the past 65 years (exceeded only by the deficits of the preceding two years). This year's deficit stems in part from the long shadow cast on the U.S. economy by the financial crisis and the recent recession. Although economic output began to expand again two years ago, the pace of the recovery has been slow, and the economy remains in a severe slump. Recent turmoil in financial markets in the United States and overseas threatens to prolong the slump."
As witnessed by the debate over increasing the U.S. debt ceiling this past quarter the actions, or rather inability to act, of our leaders had a meaningful negative impact on the capital markets. This impact is reflected in last quarter's returns when the high yield sector of the bond market declined 6.06% (as measured by the Barclays U.S. Corporate High Yield Index) and the stock market declined 13.9% (as measured by the S&P 500 Index). This legislative mess combined with continued regulatory confines (Dodd- Frank etc.) materially protracts
2
the ability for our economy to recover in a manner that would give investors some certainty about the medium and longer term outlook for a fundamental economic recovery. Investors do not like uncertainty and will make investment decisions accordingly.
At best, economic data has been sending a mixed message about overall economic growth in the U.S. Using annualized quarter over quarter real GDP data as the measure of growth, it peaked at 3.9% in the first quarter of 2010 and currently sits at 1.3% as of the second quarter of 2011. The first reading of 3rd quarter growth arrives on October 27th, which according to the latest Bloomberg survey of economists is estimated to be up 2.1%. In the end, economic growth will ultimately be driven by job growth and income growth. Looking at the latest September figures for both job growth and income growth, the readings are not encouraging. While the U. S. economy added 103,000 nonfarm payroll jobs in the latest reading, after all the revisions the three month average is only 96,000 jobs which is shy of the 150,000-165,000 monthly jobs needed just to keep up with the growth of new entrants into the labor force. This partially explains why the unemployment rate continues to hover around 9.1%. Equally disturbing is that over the past twelve months the growth in average hourly earnings has been only 1.9% compared with inflation, as defined by the personal consumption expenditure deflator, which has increased by 2.9%. If income growth continues to lag inflation, investors should expect overall economic growth to be poor.
We feel that there are numerous events that will occur at the Federal level over the next 13 months that could significantly impact the long-term prospects for capital markets. We highlight five of these events that we believe are critical. Our country's future economic path may well hinge on the outcome. Each of these could be a quite a big "show". The only way we believe a positive change can take place is for our political and economic leaders ("actors") to act in our best interests to return our economy to the path to long term sustainable growth. The stage will be set inside the Federal Government, with a cast comprised of current and future leaders and decision makers of our country. This may unfold like a 5-act Shakespearean play — we just don't know whether we will be watching Twelfth Night (happily ever after) or Romeo and Juliet (not so happy). The uncertainty of how these events will be resolved and the future economic policies of our country, adds to our unwillingness to make long term capital commitments.
We think our Play could be set up as follows:
ACT I
Third Quarter 2011 — Passage of the 2012 Appropriations Bill
Act I has been in process since the summer. As of the end of the quarter, the Federal government is starting out fiscal 2012 operating under a 7 week continuing resolution or a stop gap funding until mid to late November. Why the continuing resolution? Well the same fight between the House of Representatives and the President over which programs should be funded and which ones should not is center stage in this Act. Expect all the major players to pose and strut across the stage exalting their opposing ideas as the solution to all our problems. Ideas such as: increase the taxes on the "wealthy" because they need to pay their" fair" share (someone please define "wealthy" and "fair") pitted against no new taxes as any increase will just retard any potential economic growth; or, there can be no changes to any of the entitlement programs versus if entitlement programs are not changed the systems will collapse. This just highlights a couple of the polarizing positions being debated.
ACT II
November 23, 2011 — The Super Committee Releases its Budget Cutting Recommendations
Act II will probably dovetail with Act I in what will be funded and what will be cut. President Obama is suggesting that the combined cuts and tax increases should be $3 billion not just the $1.5 billion that was outlined in Budget Control Act of 2011 which created the Joint Select Committee on Debt Reduction. As we watch this
3
act unfold, expect cameo appearances from lobbyist of all nature, current and past politicians and of course the President and his staff, each interjecting what they think is the best solution as it relates to their own special interest or self interest. This Super Committee needs to have a recommendation for $1.5 trillion in budget cuts over the next ten years by November 23rd. This recommendation cannot be amended and is subject only to an up or down vote by Congress before December 24rd. If there is neither a $1.5 trillion recommendation nor an "up" vote by Congress, then the Office of Management and Budget is required to institute $1.2 trillion in budget cuts over the next ten years with close to 50% coming from defense and the remainder from non-defense spending but with almost no cuts forced on Medicare or Medicaid.
Intermission
As with many plays, the early Acts introduce the characters, lay out the themes, and, if indeed a good play, grab the audience's attention. While our intermission comes early in the show, it's the only break we will get. It is during this intermission that we may see the audience's reaction to all the posturing and grandstanding. A good indicator of interest in the rest of the show may be how much they spend at the concession stand or whether they leave the show altogether.
ACT III
January 2012 to June 2012 — Primaries Solidify the Republican Presidential Candidate
Act III begins with the New Year as the Presidential primary races commence. On the Republican side this could be a long tedious Act, lasting up to six months, unless one candidate jumps quickly to the forefront. At this point it is just speculation as to who will emerge from this political cat fight. Also expect to find some comic relief during this Act, as candidates are liable to say almost anything to capture a vote. For example in August 2011, Candidate Bachmann said in Greenville South Carolina that "under President Bachmann, you will see gasoline come down below $2 a gallon again. That will happen." Really? On the other hand, given an unlikely change in policy direction by the current administration, we can only hope that at least the Republican side of the debate will offer the potential for sound, long-term, fiscal policy solutions. This could be just a prelude to Act V when some of those hopeful solutions can be more fully articulated, vetted, and then debated.
ACT IV
Summer 2012 — The Supreme Court Reviews the ObamaCare Mandate
Act IV, while short, has the potential to set up a huge issue for the protagonists to debate and discuss in Act V. The most obvious is whether the Supreme Court strikes down portions of the signature legislation of President Obama, his healthcare reform bill. But if the Supreme Courts upholds the law, it creates a greater urgency for Republicans to win the Presidency and have a chance to alter the composition of the Supreme Court. Regardless of the decision, this Act should be action-packed and emotionally charged — expect lots of drama.
ACT V
The Election
Act V culminates in the election in November. While the Republican candidate will have had the opportunity to debate, vet and articulate his/her position, expect the President to enter the Act in full regalia, posturing and articulating his view of the future. Do not expect much, if any, comic relief here — just a full-on debate complete with truths, lies and lots of mudslinging. Expect high emotions the key players should all be at their best the closer they move to the end of the Act. At this point the winner (or survivor) is not known. In fact, as yet we are unclear who the characters will be. Pay very close attention here as the number of actors and the ideas bantered about could prove exhausting.
4
As investors and citizens it will be hard to miss any of these Acts, so hurry up and take your seats. Even though the price of admission is "free," we think it might be time for us to become an active versus passive audience. The stakes in is drama are high.
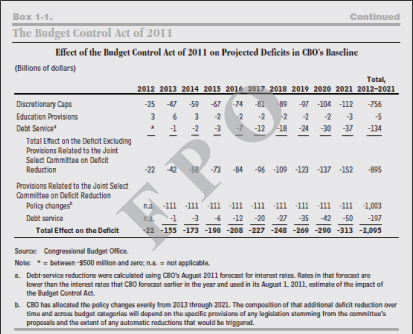
As with all things that come out of the Federal government, the devil's in the details. Will any of the plans put forth during the Acts I through V actually attack the current fiscal imbalances? Will it be "spend today and hope that someone else cuts something tomorrow", or will we get cuts today that actually reduce spending, and not just the growth in spending? Below is a table from the Congressional Budget Office August 24, 2011 Report: "Budget and Economic Outlook: An Update." The report outlines the spending reductions agreed to in the Budget Control Act of 2011. This is just one example of a "detail" that needs further examination to determine if the ideas presented do, in fact, work toward solving the deficit and fiscal problems of the U.S. Government. Note that in the first three years (2012-2014) the reductions account for only 14 percent of the total and the last three years (2019-2021) account for 46 percent of the total. While reduced spending sounds good, hoped-for spending reductions 7 to 10 years from now don't help us much today, let alone guarantee that a future Administration or Congress will follow through with those cuts.
5
So, as an Absolute Fixed-Income portfolio manager, why take so much time discussing the events of the next 13 months? You probably expect us to spend our commentary talking about GDP growth, inflation, yield to maturity, credit and interest rate risk, leaving the geopolitical issues to the news media, commentators, pundits, and scholars. Under normal circumstances that would usually be the case, but for now we believe that the influence of government policy on the economy may be the most important factor that we use to determine opportunities across the bond market.
Investment Outlook
Even before the recent rally in interest rates, the high quality segment of the market offered little value for long term investors. Using Treasuries to illustrate, the table below shows just how quickly an investor can end up with a negative return with just a modest rise in interest rates, whether you invest in the 2-year or the 30-year.
| Maturity | | Yield to Maturity
9/30/2011 | | Yield in 1 Year Equals
"0" Total Return | | Basis Point
Change | | Last Date at
"0" Return Yield | |
| 2 Year | | | 0.21 | % | | | 0.41 | % | | | + 0.21% | | | 7/28/2011 | |
| 3 Year | | | 0.33 | % | | | 0.51 | % | | | + 0.17% | | | 8/03/2011 | |
| 5 Year | | | 0.87 | % | | | 1.08 | % | | | + 0.22% | | | 8/08/2011 | |
| 7 Year | | | 1.38 | % | | | 1.62 | % | | | + 0.24% | | | 8/11/2011 | |
| 10 Year | | | 1.95 | % | | | 2.19 | % | | | + 0.25% | | | 8/26/2011 | |
| 30 Year | | | 3.25 | % | | | 3.43 | % | | | + 0.18% | | | 9/01/2011 | |
We have communicated in past conference calls and writings our focus on purchasing bonds in the 5 year and less maturity portion of the market. The chart below looks at a series of Bank of America/Merrill Lynch bond market indices and shows their sensitivity to changes in interest rates. These indices all have a maximum maturity of five years and focus on fixed rate securities. The sensitivity to changes in the level of interest rates is shown via a ratio between the modified duration of the index and its yield to worst. Note that duration measures the percentage change in principal value of the index for a 100 basis point (1.0%) change in the yield of the index. So if the yield is less than the duration for the index, the result of a 100 basis point increase in the yield will likely produce a negative total return. That is the yield earned is less than the principal value lost. As the chart shows, there is a dramatic difference between the yield and risk to rising rates for Treasuries and Agencies relative to the other areas of the bond market. All data is as of September 30, 2011.
| Index Name | | Modified
Duration | | Yield to
Worst | | Basis Point Rise
to "0" Return | |
| 1-5 Yr Maturity Treasuries | | 2.57 years | | | 0.45 | % | | | 18 | | |
| 1-5 Year Agency Notes | | 1.93 years | | | 0.56 | % | | | 19 | | |
| 0-5 Year Average Life Agency Mortgage | | 2.82 years | | | 2.08 | % | | | 74 | | |
| 0-5 Year A-AAA ABS | | 1.49 years | | | 1.20 | % | | | 81 | | |
| 1-5 Year AA-AAA Corporate | | 2.59 years | | | 2.16 | % | | | 83 | | |
| 1-5 Year Average Life Agency CMO | | 2.41 years | | | 2.16 | % | | | 90 | | |
| 1-5 Year AAA CMBS | | 2.74 years | | | 3.13 | % | | | 114 | | |
| 1-5 Year AA CMBS | | 3.39 years | | | 4.46 | % | | | 132 | | |
Over the past six months the Treasury component of the Fund has ranged between 20% and 33% of assets, peaking in July and decreasing to 20% by September. Maturities only go out to October 2012, with that sector's
6
duration just under 1 year. In spite of the risks illustrated by the first table above, with the current Federal Reserve policy stating there will be no change in the Fed Funds rate through mid 2013, we see less risk to rising interest rates in the shorter maturity portion of the yield curve. With that in mind and given the severely low rates earned on our most liquid investments, we have used this sector as a short-term, low-risk alternative while searching for longer maturity, more attractive investments.
We have found select opportunities in the 0-5 year average life Agency mortgage area, and the 0-5 year A-AAA ABS segment of the market place. We continue to maintain our allocation to the 1-5 year Agency CMOs and the 1-5 year AAA CMBS sector. Conversely, we allowed the Agency debenture holdings to either be called away or, if the maturity was in the 4-5 year range, they were sold.
The same is true for the corporate portion of the portfolio where both maturities and outright sales reduced the allocation from just over 10% to a little less than 3%. Over the past six months the spread over the comparable Treasury index for the corporate index listed above increased by 67%, with the majority of the increase occurring in August and September. Thus, by reducing this credit exposure, the Fund was able to avoid some of this correction.
We have been particularly active in executing on one of our investment themes over the past six months by continuing to buy Agency mortgage-backed securities consisting of high quality borrowers. These securities are backed by new 10 and 15 year amortizing mortgage loans which, by and large, are refinanced mortgages. The loan to value is less than 80% based on current appraisals of the home and the borrower has a very high credit score. Another characteristic we find attractive with the shorter amortization of these loans is that, in our opinion, these are more disciplined borrowers who are looking to increase their net worth and reduce overall debt via a faster loan pay-off. Our experience also tells us that these shorter amortizing loans are usually less sensitive to changes in interest rates. So, if rates do continue to decline the net effect of lowering the monthly payment which could be an inducement to refinance the loan again is diminished. This loan characteristic enables us to purchase a slightly higher coupon mortgage bond and receive a slightly higher yield.
Conclusion
Regardless of our "Play's" outcome, we believe there will be continued market volatility, and that volatility should be biased to rising rates. Unlike our equity managers at FPA who can take advantage of stock price volatility, erratic fluctuations in the bond market can lead to devastating capital destruction. Going forward, we expect to continue to concentrate on the high-quality, short-average-life bonds that have permeated our purchases for quite some time. With risk levels still very elevated as evidenced by our analysis of the market's sensitivity to change in the general level of interest rates, combined with the very poor economic growth prospects, it reaffirms our view that the best course of action is to have the Fund remain focused on preservation of capital rather than "overreaching" for extra income or capital appreciation.
Thank you for your continuing support.
Respectfully submitted,

Thomas H. Atteberry
Chief Executive Officer and Portfolio Manager
October 28, 2011
The discussion of Fund investments represents the views of the Fund's managers at the time of this report and are subject to change without notice. References to individual securities are for informational purposes only and should not be construed as recommendations to purchase or sell individual securities.
7
HISTORICAL PERFORMANCE
Change in Value of a $10,000 Investment in FPA New Income, Inc. vs. Lehman Brothers Government/Credit Index and Lipper Corporate Debt A Rated Fund Average from October 1, 2001 to September 30, 2011

Past performance is not indicative of future performance. The Lehman Brothers Government/Credit Index is a broad-based unmanaged index of all government and corporate bonds that are investment grade with at least one year to maturity. The Lehman Brothers Government/Credit Index does not reflect any commissions or fees which would be incurred by an investor purchasing the securities it represents. The Lipper Corporate Debt A Rated Fund Average provides an additional comparison of how your Fund performed in relation to other mutual funds with similar objectives. The Lipper data does not include sales charges. The performance shown for FPA New Income, Inc., with an ending value of $14,468 reflects deduction of the current maximum sales charge of 3.5% of the offering price. In addition, since investors purchase shares of the Fund with varying sales charges depending primarily on volume purchased, the Fund's performance at net asset value (NAV) is also shown, as reflected by the ending value of $14,992. The performance of the Fund and of the Averages is computed on a total return basis which includes reinvestment of all distributions.
FORWARD LOOKING STATEMENT DISCLOSURE
As mutual fund managers, one of our responsibilities is to communicate with shareholders in an open and direct manner. Insofar as some of our opinions and comments in our letters to shareholders are based on current management expectations, they are considered "forward-looking statements" which may or may not be accurate over the long term. While we believe we have a reasonable basis for our comments and we have confidence in our opinions, actual results may differ materially from those we anticipate. You can identify forward-looking statements by words such as "believe," "expect," "may," "anticipate," and other similar expressions when discussing prospects for particular portfolio holdings and/or the markets, generally. We cannot, however, assure future results and disclaim any obligation to update or alter any forward-looking statements, whether as a result of new information, future events, or otherwise. Further, information provided in this report should not be construed as a recommendation to purchase or sell any particular security.
8
PORTFOLIO SUMMARY
September 30, 2011 (unaudited)
| Bonds & Debentures | | | | | 102.1 | % | |
| Mortgage Pass-Through | | | 28.4 | % | | | | | |
| Mortgage-Backed | | | 19.8 | % | | | | | |
| U.S. Treasuries* | | | 17.2 | % | | | | | |
| Asset-Backed | | | 10.3 | % | | | | | |
| Stripped Mortgage-Backed | | | 9.7 | % | | | | | |
| Commercial Mortgage-Backed | | | 8.5 | % | | | | | |
| U.S. Treasuries — Short-Term* | | | 3.5 | % | | | | | |
| Corporate | | | 2.8 | % | | | | | |
| U.S. Agencies | | | 1.9 | % | | | | | |
| Short-Term Investments* | | | | | 3.8 | % | |
| Other Assets and Liabilities, net* | | | | | -5.9 | % | |
| Total Net Assets | | | | | 100.0 | % | |
| *Cash Plus Liquidity | | | | | 18.6 | % | |
MAJOR PORTFOLIO CHANGES
For the Six Months Ended September 30, 2011 (unaudited)
| | | Principal
Amount | |
| NET PURCHASES | |
| Government National Mortgage Association IO 2010-161 — 0.84026% 2050 | | $ | 166,809,945 | | |
| U.S. Treasury Note — 0.875% 2012 (1) | | $ | 150,000,000 | | |
| U.S. Treasury Note — 0.625% 2012 | | $ | 140,000,000 | | |
| U.S. Treasury Note — 0.375% 2012 (1) | | $ | 130,000,000 | | |
| U.S. Treasury Note — 0.375% 2012 (1) | | $ | 127,708,000 | | |
| NET SALES | |
| Federal Agricultural Mortgage Association — 3.875% 2011 (2) | | $ | 58,340,000 | | |
| First National Master Note Trust 2009-1A — 1.605% 2014 (2) | | $ | 62,020,000 | | |
| U.S. Treasury Note — 0.625% 2012 | | $ | 112,750,000 | | |
| U.S. Treasury Note — 1% 2012 (2) | | $ | 192,708,000 | | |
| U.S. Treasury Note — 0.75% 2012 (2) | | $ | 222,529,000 | | |
(1) Indicates new commitment to portfolio
(2) Indicates elimination from portfolio
9
PORTFOLIO OF INVESTMENTS
September 30, 2011
| BONDS & DEBENTURES | | Principal
Amount | | Value | |
| MORTGAGE PASS-THROUGH SECURITIES — 28.4% | | | |
| Federal Home Loan Mortgage Corporation | |
| 847526 — 2.502% 2034 | | $ | 8,235,443 | | | $ | 8,609,991 | | |
| 782629 — 2.509% 2035 | | | 1,204,186 | | | | 1,259,061 | | |
| 848215 — 2.609% 2038 | | | 4,967,936 | | | | 5,188,512 | | |
| E97666 — 4% 2018 | | | 16,326,264 | | | | 17,429,919 | | |
| J11574 — 4% 2020 | | | 18,821,273 | | | | 19,833,858 | | |
| G18305 — 4% 2024 | | | 17,822,602 | | | | 18,861,481 | | |
| G14025 — 4% 2025 | | | 46,039,635 | | | | 48,665,736 | | |
| J12397 — 4% 2025 | | | 29,082,001 | | | | 30,740,548 | | |
| G11470 — 4.5% 2013 | | | 428,013 | | | | 446,439 | | |
| B18693 — 4.5% 2015 | | | 1,649,503 | | | | 1,743,195 | | |
| J11204 — 4.5% 2019 | | | 12,763,832 | | | | 13,552,126 | | |
| E01322 — 5% 2018 | | | 14,134,560 | | | | 15,274,088 | | |
| G13091 — 5% 2018 | | | 7,191,747 | | | | 7,869,713 | | |
| E01642 — 5% 2019 | | | 8,444,664 | | | | 9,283,557 | | |
| G13812 — 5% 2020 | | | 23,057,041 | | | | 25,272,362 | | |
| G14187 — 5.5% 2020 | | | 31,221,087 | | | | 33,692,860 | | |
| G12139 — 6.5% 2019 | | | 3,828,717 | | | | 4,215,532 | | |
| A26942 — 6.5% 2034 | | | 1,005,841 | | | | 1,142,877 | | |
| P50543 — 6.5% 2037 | | | 356,047 | | | | 412,057 | | |
| G08107 — 6.5% 2036 | | | 4,787,715 | | | | 5,472,933 | | |
| Federal National Mortgage Association | |
| AD0705 — 2.429% 2040 | | | 9,136,258 | | | | 9,553,694 | | |
| 890328 — 3% 2020 | | | 34,911,307 | | | | 36,372,694 | | |
| 932108 — 4% 2019 | | | 16,833,970 | | | | 17,807,184 | | |
| MA0150 — 4% 2019 | | | 46,315,412 | | | | 48,697,877 | | |
| MA0203 — 4% 2019 | | | 28,546,712 | | | | 30,031,997 | | |
| MA0235 — 4% 2019 | | | 22,172,863 | | | | 23,454,732 | | |
| MA0267 — 4% 2019 | | | 18,797,223 | | | | 19,785,017 | | |
| MA0298 — 4% 2020 | | | 97,612,579 | | | | 103,255,806 | | |
| MA0322 — 4% 2020 | | | 29,965,523 | | | | 31,564,184 | | |
| MA0357 — 4% 2020 | | | 52,984,259 | | | | 55,810,969 | | |
| MA0430 — 4% 2020 | | | 9,639,024 | | | | 10,217,365 | | |
| AB1243 — 4% 2025 | | | 49,493,865 | | | | 52,214,543 | | |
| AA4552 — 4% 2024 | | | 1,849,369 | | | | 1,995,469 | | |
| AC8539 — 4% 2024 | | | 8,449,670 | | | | 9,113,645 | | |
| AE0307 — 4% 2025 | | | 7,784,813 | | | | 8,396,544 | | |
| AD9338 — 4% 2025 | | | 7,267,206 | | | | 7,665,158 | | |
| AH4841 — 4% 2026 | | | 34,707,676 | | | | 36,637,423 | | |
| 890123 — 4.5% 2016 | | | 5,466,125 | | | | 5,698,271 | | |
| 735494 — 4.5% 2020 | | | 30,263,898 | | | | 32,382,371 | | |
10
PORTFOLIO OF INVESTMENTS
September 30, 2011
| BONDS & DEBENTURES — Continued | | Principal
Amount | | Value | |
| AA8521 — 4.5% 2020 | | $ | 15,510,399 | | | $ | 16,648,862 | | |
| AA0905 — 4.5% 2021 | | | 8,782,946 | | | | 9,423,662 | | |
| 995756 — 5% 2018 | | | 22,446,878 | | | | 24,546,335 | | |
| 735453 — 5% 2019 | | | 11,784,613 | | | | 12,917,468 | | |
| AE0126 — 5% 2020 | | | 29,376,083 | | | | 31,904,482 | | |
| 995861 — 5% 2021 | | | 24,236,813 | | | | 26,509,499 | | |
| 890122 — 5% 2021 | | | 9,972,581 | | | | 10,926,458 | | |
| 890083 — 5% 2021 | | | 12,195,771 | | | | 13,339,368 | | |
| AE0792 — 5% 2026 | | | 22,073,510 | | | | 23,939,384 | | |
| 257100 — 5.5% 2018 | | | 2,465,762 | | | | 2,719,242 | | |
| 745500 — 5.5% 2018 | | | 17,579,735 | | | | 19,181,249 | | |
| 995327 — 5.5% 2019 | | | 4,936,067 | | | | 5,453,959 | | |
| 889318 — 5.5% 2020 | | | 19,281,512 | | | | 20,964,981 | | |
| 735521 — 5.5% 2020 | | | 9,362,061 | | | | 10,343,580 | | |
| 995284 — 5.5% 2020 | | | 22,004,673 | | | | 23,981,793 | | |
| 889069 — 5.5% 2021 | | | 17,983,793 | | | | 19,622,117 | | |
| AE0237 — 5.5% 2023 | | | 23,463,661 | | | | 25,733,066 | | |
| 865963 — 5.849% 2036 | | | 5,905,976 | | | | 6,282,600 | | |
| 745832 — 6% 2021 | | | 39,680,055 | | | | 43,134,204 | | |
| AD0951 — 6% 2021 | | | 21,867,083 | | | | 24,077,626 | | |
| 890225 — 6% 2023 | | | 22,322,069 | | | | 24,578,607 | | |
| 923306 — 6.5% 2037 | | | 640,975 | | | | 703,880 | | |
| 323282 — 7.5% 2028 | | | 528,610 | | | | 609,308 | | |
| Government National Mortgage Association | |
| 782281 — 6% 2023 | | | 7,460,250 | | | | 8,307,585 | | |
| TOTAL MORTGAGE PASS-THROUGH SECURITIES | | $ | 1,215,471,103 | | |
| MORTGAGE-BACKED SECURITIES — 19.8% | | | |
| Chase Mortgage 2003-S14 2A4 — 7.5% 2034 | | $ | 1,097,170 | | | $ | 1,103,665 | | |
| CMSI 2005-5 2A3 — 5% 2020 | | | 855,761 | | | | 874,245 | | |
| Federal Home Loan Bank | |
| 00-0606 Y — 5.27% 2012 | | | 13,642,078 | | | | 14,405,216 | | |
| I7-2014 1 — 5.34% 2014 | | | 32,162,683 | | | | 34,807,420 | | |
| VN-2015 A — 5.46% 2015 | | | 27,451,997 | | | | 30,555,171 | | |
| 00-0986 — 5.739% 2014 | | | 24,592,657 | | | | 26,980,604 | | |
| Federal Home Loan Mortgage Corporation | |
| 3829 CD — 3% 2024 | | | 11,165,939 | | | | 11,511,525 | | |
| 2630 KS — 4% 2017 | | | 9,531,656 | | | | 9,648,514 | | |
| 2786 JC — 4% 2018 | | | 2,049,996 | | | | 2,092,882 | | |
| 3806 AB — 4% 2023 | | | 33,635,631 | | | | 35,719,022 | | |
| 2869 JA — 4% 2034 | | | 13,487,407 | | | | 13,818,523 | | |
| 2877 WA — 4.25% 2034 | | | 12,903,932 | | | | 13,487,706 | | |
11
PORTFOLIO OF INVESTMENTS
September 30, 2011
| BONDS & DEBENTURES — Continued | | Principal
Amount | | Value | |
| 2706 UG — 4.5% 2016 | | $ | 5,272,128 | | | $ | 5,314,410 | | |
| 2578 AM — 4.5% 2016 | | | 8,987,387 | | | | 9,584,869 | | |
| 2677 LD — 4.5% 2017 | | | 10,021,509 | | | | 10,208,811 | | |
| 2914 LQ — 4.5% 2019 | | | 8,950,226 | | | | 9,322,824 | | |
| 3439 AC — 4.5% 2022 | | | 17,722,904 | | | | 18,522,384 | | |
| 2509 CB — 5% 2017 | | | 8,275,670 | | | | 8,767,659 | | |
| 2602 ET — 5% 2017 | | | 6,218,140 | | | | 6,463,073 | | |
| 3080 MA — 5% 2018 | | | 1,732,736 | | | | 1,741,850 | | |
| 2747 DX — 5% 2019 | | | 11,667,791 | | | | 12,688,023 | | |
| 3852 HA — 5% 2021 | | | 24,008,076 | | | | 25,886,228 | | |
| 3285 LC — 5% 2025 | | | 16,521,561 | | | | 17,244,545 | | |
| 2494 CF — 5.5% 2017 | | | 8,751,900 | | | | 9,419,057 | | |
| 2503 B —5.5% 2017 | | | 8,544,549 | | | | 9,146,854 | | |
| R005 AB — 5.5% 2018 | | | 13,701,046 | | | | 14,079,058 | | |
| 3808 BQ — 5.5% 2025 | | | 37,188,125 | | | | 41,161,676 | | |
| 3806 JB — 5.5% 2026 | | | 13,818,281 | | | | 15,359,019 | | |
| 3855 HQ — 5.5% 2026 | | | 21,316,613 | | | | 23,693,842 | | |
| 2542 PG — 5.5% 2031 | | | 3,849,752 | | | | 3,879,857 | | |
| 2903 UZ — 5.5% 2031 | | | 4,831,191 | | | | 4,891,581 | | |
| 2922 Z — 5.5% 2032 | | | 6,938,409 | | | | 7,127,758 | | |
| 2670 QG — 5.5% 2032 | | | 27,383,513 | | | | 28,564,290 | | |
| 3133 BD — 5.75% 2033 | | | 4,528,440 | | | | 4,684,354 | | |
| 3926 GP — 6% 2025 | | | 16,945,601 | | | | 18,682,525 | | |
| 3614 DY — 6% 2032 | | | 23,252,772 | | | | 26,051,941 | | |
| Federal National Mortgage Association | |
| 2009-68 KA — 3.75% 2022 | | | 6,548,769 | | | | 6,786,424 | | |
| 2011-67 EA — 4% 2021 | | | 56,853,592 | | | | 59,619,519 | | |
| 2009-70 NU — 4.25% 2019 | | | 19,168,317 | | | | 20,179,446 | | |
| 2004-90 GA — 4.35% 2034 | | | 10,331,062 | | | | 10,761,764 | | |
| 2003-24 PD — 5% 2018 | | | 9,020,973 | | | | 9,633,587 | | |
| 2009-77 DA — 5% 2023 | | | 10,028,982 | | | | 10,620,391 | | |
| 2005-4 E — 5% 2032 | | | 7,709,226 | | | | 7,906,120 | | |
| 2010-39 PL — 5% 2032 | | | 17,801,806 | | | | 19,121,098 | | |
| 2004-60 LB — 5% 2034 | | | 18,807,886 | | | | 20,510,188 | | |
| 2003-W17 1A5 — 5.35% 2033 | | | 9,283,037 | | | | 9,886,434 | | |
| 2011-19 WB — 5.5% 2018 | | | 21,103,568 | | | | 22,928,183 | | |
| 2009-116 PA — 5.5% 2024 | | | 12,400,421 | | | | 13,208,928 | | |
| 2006-21 CA — 5.5% 2029 | | | 5,834,999 | | | | 6,040,099 | | |
| 2002-70 QG — 5.5% 2031 | | | 2,044,995 | | | | 2,057,183 | | |
| 2004-52 KA — 5.5% 2032 | | | 872,157 | | | | 872,419 | | |
| 2003-28 PG — 5.5% 2032 | | | 8,121,211 | | | | 8,458,322 | | |
| 2005-6 KA — 5.5% 2032 | | | 869,739 | | | | 870,557 | | |
12
PORTFOLIO OF INVESTMENTS
September 30, 2011
| BONDS & DEBENTURES — Continued | | Principal
Amount | | Value | |
| 2002-87 N — 5.5% 2032 | | $ | 4,514,298 | | | $ | 4,639,118 | | |
| 2002-9 PC — 6% 2017 | | | 8,352,357 | | | | 9,070,242 | | |
| 2008-118 ME — 6% 2032 | | | 10,799,748 | | | | 10,879,234 | | |
| Stanwich Mortgage Loan Trust | |
| 2009-2 — 3.72354% 2049 + | | | 393,338 | | | | 174,957 | | |
| 2010-1 — 2.99043% 2047 + | | | 2,714,735 | | | | 1,373,113 | | |
| 2010-2 — 4.17318% 2057 + | | | 8,833,203 | | | | 4,435,151 | | |
| 2010-3 — 4.32963% 2038 + | | | 5,002,673 | | | | 2,499,335 | | |
| 2010-4 — 10.29848% 2049 + | | | 7,681,600 | | | | 3,589,612 | | |
| 2011-1 — 5.26337% 2039 +,* | | | 12,926,785 | | | | 6,817,961 | | |
| 2011-2 — 3.93588% 2050 +,* | | | 10,356,080 | | | | 5,542,615 | | |
| Structured Asset Securities Corp 2002-RM1 A — 0.89472% 2037 + | | | 23,768,476 | | | | 20,518,874 | | |
| Wells Fargo Mortgage-Backed Securities Trust 2006-5 2A1 — 5.25% 2021 | | | 18,073,888 | | | | 18,375,180 | | |
| TOTAL MORTGAGE-BACKED SECURITIES | | $ | 844,867,035 | | |
| U.S. TREASURY SECURITIES — 17.2% | | | |
| U.S. Treasury Notes | |
| —0.375% 2012 | | $ | 130,000,000 | | | $ | 130,239,200 | | |
| —0.375% 2012 | | | 127,708,000 | | | | 127,957,030 | | |
| —0.625% 2012 | | | 232,715,000 | | | | 233,596,990 | | |
| —0.625% 2012 | | | 125,000,000 | | | | 125,430,000 | | |
| —1.75% 2012 | | | 115,000,000 | | | | 116,562,850 | | |
| TOTAL U.S. TREASURY SECURITIES | | $ | 733,786,070 | | |
| ASSET-BACKED SECURITIES — 10.3% | | | |
| Cabela's Master Credit Card Trust | |
| 2006-3A A1 — 5.26% 2014 + | | $ | 38,995,000 | | | $ | 39,074,160 | | |
| 2006-3A B — 0.429% 2014 + | | | 10,090,000 | | | | 10,087,780 | | |
| Case New Holland Wholesale Master Note Trust | |
| 2009-1A A — 1.929% 2015 + | | | 13,900,000 | | | | 14,030,660 | | |
| Credit Acceptance Auto Loan Trust 2011-1 A — 2.61% 2019 + | | | 19,295,000 | | | | 19,290,674 | | |
| FIFC Premium Funding LLC 2009-A A — 1.679% 2014 + | | | 26,320,000 | | | | 26,890,354 | | |
| First National Master Note Trust 2009-3 A — 1.579% 2015 | | | 28,150,000 | | | | 28,335,508 | | |
| GE Capital Credit Card Master Note Trust 2009-2 A — 3.69% 2015 | | | 6,697,000 | | | | 6,840,986 | | |
| HFG HEALTHCO-4 LLC 2011-1A A — 2.4715% 2017 + | | | 16,552,000 | | | | 17,552,568 | | |
| MassMutual Asset Finance LLC | |
| 2011-AA A2 — 0.9% 2014 + | | | 22,420,000 | | | | 22,276,736 | | |
| 2009-AA — 2.37% 2013 + | | | 36,373,460 | | | | 36,722,645 | | |
| PFS Financing Corp. 2010-CA A — 1.629% 2014 + | | | 53,595,000 | | | | 55,374,890 | | |
| Prestige Auto Receivables Trust | |
| 2009-1A B — 10% 2013 + | | | 7,675,668 | | | | 8,190,322 | | |
| 2011-1A A2 — 1.25% 2014 + | | | 18,212,920 | | | | 18,170,302 | | |
13
PORTFOLIO OF INVESTMENTS
September 30, 2011
| BONDS & DEBENTURES — Continued | | Principal
Amount | | Value | |
| National Collegiate Student Loan Trust 2006-3 A2 — 0.34456% 2026 | | $ | 48,955,822 | | | $ | 48,007,303 | | |
| Santander Drive Auto Receivables Trust | |
| 2010-B A2 — 1.01% 2013 + | | | 26,717,800 | | | | 26,750,663 | | |
| 2011-3 A2 — 1.11% 2014 | | | 33,500,000 | | | | 33,500,000 | | |
| Station Place Securitization Trust 2010-1 A — 1.2305% 2042 + | | | 14,390,000 | | | | 14,390,000 | | |
| World Financial Network Credit Card Master Trust II | |
| 2010-1 — 4.16% 2017 + | | | 15,255,000 | | | | 15,606,628 | | |
| ASSET BACKED SECURITIES | | $ | 441,092,179 | | |
| STRIPPED MORTGAGE-BACKED SECURITIES — 9.7% | | | |
| PRINCIPAL ONLY SECURITIES | | | |
| Federal Home Loan Mortgage Corporation 217 — 6.5% 2032 | | $ | 1,055,537 | | | $ | 974,514 | | |
| INTEREST ONLY SECURITIES | | | |
| Federal Home Loan Mortgage Corporation | |
| 3714 TI — 2.25% 2015 | | | 115,567,771 | | | | 5,128,898 | | |
| 3706 AI — 3.5% 2020 | | | 32,451,337 | | | | 3,025,763 | | |
| 3722 AI — 3.5% 2020 | | | 28,734,135 | | | | 3,141,790 | | |
| 3735 AI — 3.5% 2020 | | | 14,536,608 | | | | 1,583,618 | | |
| 3755 AI — 3.5% 2020 | | | 26,750,483 | | | | 2,725,339 | | |
| 3760 KI — 3.5% 2020 | | | 25,012,892 | | | | 2,732,408 | | |
| 3753 CI — 3.5% 2020 | | | 5,787,213 | | | | 654,765 | | |
| 3874 DI — 3.5% 2020 | | | 24,980,649 | | | | 2,337,189 | | |
| 3893 DI — 3.5% 2020 | | | 18,256,374 | | | | 1,504,143 | | |
| 3909 KI — 3.5% 2021 | | | 11,426,108 | | | | 1,298,691 | | |
| 3874 BI — 3.5% 2021 | | | 13,267,948 | | | | 1,397,646 | | |
| 3784 BI — 3.5% 2021 | | | 16,008,860 | | | | 1,803,078 | | |
| 3893 BI — 3.5% 2021 | | | 11,030,809 | | | | 1,103,853 | | |
| 3778 GI — 3.5% 2024 | | | 13,255,769 | | | | 1,122,896 | | |
| 3854 GI — 3.5% 2024 | | | 16,407,563 | | | | 1,286,189 | | |
| 3763 NI — 3.5% 2025 | | | 9,285,372 | | | | 1,044,604 | | |
| 3852 YI — 3.5% 2025 | | | 42,220,973 | | | | 3,318,991 | | |
| 3904 QI — 3.5% 2025 | | | 11,300,000 | | | | 1,113,728 | | |
| 3909 UI — 3.5% 2025 | | | 26,003,181 | | | | 2,336,223 | | |
| 3904 NI — 3.5% 2026 | | | 20,612,731 | | | | 2,829,716 | | |
| 3930 AI — 3.5% 2026 | | | 21,428,571 | | | | 2,464,286 | | |
| 2558 JW — 5.5% 2022 | | | 2,954,825 | | | | 246,048 | | |
| 217 — 6.5% 2032 | | | 1,055,537 | | | | 222,571 | | |
| Federal National Mortgage Association | |
| 2010-91 MI — 2% 2013 | | | 64,887,069 | | | | 1,774,661 | | |
| 2010-95 MI — 2% 2013 | | | 55,776,466 | | | | 1,452,977 | | |
| 2011-88 BI — 3% 2020 | | | 11,018,306 | | | | 735,362 | | |
14
PORTFOLIO OF INVESTMENTS
September 30, 2011
| BONDS & DEBENTURES — Continued | | Principal
Amount | | Value | |
| 2010-145 BI — 3.5% 2020 | | $ | 16,767,670 | | | $ | 1,848,468 | | |
| 2010-124 AI — 3.5% 2020 | | | 20,455,329 | | | | 2,189,538 | | |
| 2010-128 LI — 3.5% 2020 | | | 39,155,964 | | | | 3,866,651 | | |
| 2011-75 BI — 3.5% 2020 | | | 18,673,121 | | | | 1,420,838 | | |
| 2011-104 DI — 3.5% 2021 | | | 55,771,681 | | | | 5,193,738 | | |
| 2010-104 CI — 3.5% 2021 | | | 35,436,476 | | | | 3,543,648 | | |
| 2010-137 BI — 3.5% 2024 | | | 15,963,058 | | | | 1,037,918 | | |
| 2011-80 KI — 3.5% 2025 | | | 24,231,653 | | | | 2,101,611 | | |
| 2011-75 AI — 3.5% 2025 | | | 51,651,085 | | | | 3,796,871 | | |
| 2011-66 BI — 3.5% 2025 | | | 9,051,264 | | | | 735,415 | | |
| 2011-67 CI — 3.5% 2025 | | | 12,053,161 | | | | 1,174,581 | | |
| 2011-101 IC — 3.5% 2026 | | | 120,057,527 | | | | 13,919,470 | | |
| 2011-101 EI — 3.5% 2026 | | | 42,857,142 | | | | 4,911,000 | | |
| 2011-101 IE — 3.5% 2026 | | | 40,851,048 | | | | 4,608,407 | | |
| 2011-104 IM — 3.5% 2026 | | | 36,571,275 | | | | 3,839,984 | | |
| 2010-89 LI — 4% 2020 | | | 32,534,988 | | | | 3,356,960 | | |
| 2010-104 CI — 4% 2020 | | | 13,840,628 | | | | 1,462,678 | | |
| 2011-67 EI — 4% 2021 | | | 37,069,308 | | | | 2,868,423 | | |
| 2003-64 XI — 5% 2033 | | | 4,529,384 | | | | 867,875 | | |
| Government National Mortgage Association | |
| 2002-56 — 0.32322% 2042 | | | 714,255 | | | | 3,307 | | |
| 2006-15 — 0.4710947267% 2046 | | | 29,300,724 | | | | 804,891 | | |
| 2004-43 — 0.48842% 2044 | | | 121,418,659 | | | | 2,608,073 | | |
| 2005-9 — 0.55333% 2045 | | | 26,454,837 | | | | 733,857 | | |
| 2008-48 — 0.55719% 2048 | | | 128,468,272 | | | | 4,254,869 | | |
| 2004-108 — 0.57454% 2044 | | | 30,825,512 | | | | 722,858 | | |
| 2004-10 — 0.56169% 2044 | | | 118,389,346 | | | | 1,772,288 | | |
| 2008-78 — 0.62498% 2048 | | | 107,204,090 | | | | 4,509,004 | | |
| 2006-30 — 0.62306% 2046 | | | 25,604,842 | | | | 962,742 | | |
| 2005-90 — 0.68747% 2045 | | | 102,002,225 | | | | 2,965,205 | | |
| 2006-5 — 0.67566% 2046 | | | 106,637,569 | | | | 3,417,734 | | |
| 2011-10 — 0.71368% 2045 | | | 123,572,281 | | | | 5,730,047 | | |
| 2007-4 — 0.74867% 2047 | | | 46,730,728 | | | | 1,928,110 | | |
| 2006-55 — 0.68104% 2046 | | | 99,440,248 | | | | 3,538,084 | | |
| 2007-15 — 0.79576% 2047 | | | 156,314,089 | | | | 7,207,643 | | |
| 2010-161 — 0.83944% 2050 | | | 298,862,940 | | | | 15,116,487 | | |
| 2008-45 — 0.8597% 2048 | | | 149,715,136 | | | | 5,421,185 | | |
| 2007-34 — 0.87373% 2047 | | | 56,417,514 | | | | 2,725,530 | | |
| 2010-18 — 0.88176% 2050 | | | 188,141,480 | | | | 9,728,796 | | |
| 2005-50 — 0.88558% 2045 | | | 2,060,073 | | | | 75,090 | | |
| 2010-123 — 0.89877% 2050 | | | 89,557,207 | | | | 5,409,255 | | |
| 2006-67 — 0.87585% 2046 | | | 75,511,146 | | | | 2,935,118 | | |
15
PORTFOLIO OF INVESTMENTS
September 30, 2011
| BONDS & DEBENTURES — Continued | | Principal
Amount | | Value | |
| 2007-55 — 0.94017% 2047 | | $ | 161,616,447 | | | $ | 7,482,841 | | |
| 2007-77 — 0.95957% 2047 | | | 184,418,749 | | | | 8,332,039 | | |
| 2008-92 — 0.97225% 2048 | | | 133,834,756 | | | | 6,829,588 | | |
| 2010-63 — 0.96779% 2050 | | | 95,514,735 | | | | 4,828,270 | | |
| 2011-6 — 1.04545% 2052 | | | 254,534,061 | | | | 16,152,731 | | |
| 2009-119 — 1.05023% 2049 | | | 340,919,274 | | | | 19,278,985 | | |
| 2008-8 — 1.08568% 2047 | | | 178,835,149 | | | | 7,412,717 | | |
| 2009-105 — 1.08889% 2049 | | | 159,436,107 | | | | 9,881,850 | | |
| 2008-24 — 1.11118% 2047 | | | 64,138,319 | | | | 2,867,624 | | |
| 2009-60 — 1.12898% 2049 | | | 151,436,875 | | | | 8,671,275 | | |
| 2009-86 — 1.12919% 2049 | | | 166,879,868 | | | | 9,532,178 | | |
| 2010-28 — 1.16534% 2050 | | | 166,076,598 | | | | 10,019,401 | | |
| 2011-120 — 1.18978% 2043 | | | 126,005,000 | | | | 15,730,937 | | |
| 2011-49 — 1.17592% 2045 | | | 96,687,943 | | | | 6,809,732 | | |
| 2010-49 — 1.1928% 2050 | | | 171,427,803 | | | | 10,505,096 | | |
| 2011-78 — 1.27334% 2046 | | | 97,915,682 | | | | 7,567,903 | | |
| 2011-16 — 1.28625% 2046 | | | 157,081,175 | | | | 11,110,351 | | |
| 2009-4 — 1.29692% 2049 | | | 157,450,436 | | | | 9,947,719 | | |
| 2009-49 — 1.3943% 2049 | | | 164,424,425 | | | | 10,929,292 | | |
| 2010-148 — 1.47523% 2052 | | | 91,679,158 | | | | 7,227,068 | | |
| 2009-71 — 1.80526% 2049 | | | 191,412,904 | | | | 14,331,084 | | |
| 2009-30 — 1.96664% 2049 | | | 130,655,744 | | | | 11,624,442 | | |
| Jefferies Structured Series 1634 — 3.5% 2031 | | | 21,428,571 | | | | 2,142,857 | | |
| TOTAL STRIPPED MORTGAGE-BACKED SECURITIES | | $ | 413,890,174 | | |
| COMMERCIAL MORTGAGE-BACKED SECURITIES — 8.5% | | | |
| Government National Mortgage Association | |
| 2011-49 AB — 2.8% 2034 | | $ | 41,958,341 | | | $ | 42,675,829 | | |
| 2008-45 A — 3.576% 2027 | | | 495,038 | | | | 496,786 | | |
| 2006-15 A — 3.727% 2027 | | | 6,321,640 | | | | 6,366,081 | | |
| 2006-68 A — 3.888% 2026 | | | 5,383,977 | | | | 5,442,824 | | |
| 2011-120 A — 3.9425% 2033 | | | 48,920,000 | | | | 51,409,050 | | |
| 2006-67 A — 3.947% 2030 | | | 3,493,629 | | | | 3,556,619 | | |
| 2004-108 A — 3.999% 2027 | | | 16,441,381 | | | | 16,817,231 | | |
| 2006-30 A — 4.175% 2028 | | | 19,409,070 | | | | 19,779,007 | | |
| 2006-51 A — 4.253% 2030 | | | 5,540,922 | | | | 5,701,941 | | |
| 2008-39 A — 4.5% 2023 | | | 8,514,431 | | | | 8,637,379 | | |
| 2005-52 C — 4.578% 2045 | | | 9,078,463 | | | | 9,442,782 | | |
| 2006-67 GA — 4.61628% 2034 | | | 21,211,417 | | | | 21,629,494 | | |
| 2004-78 C — 4.658% 2029 | | | 3,382,027 | | | | 3,471,820 | | |
| 2004-67 C — 4.712% 2025 | | | 831,444 | | | | 831,677 | | |
| 2005-34 B — 4.739% 2029 | | | 4,941,654 | | | | 4,966,856 | | |
16
PORTFOLIO OF INVESTMENTS
September 30, 2011
| BONDS & DEBENTURES — Continued | | Principal
Amount | | Value | |
| 2008-92 A — 4.771% 2027 | | $ | 5,876,307 | | | $ | 5,966,332 | | |
| 2007-69 B — 4.959% 2030 | | | 15,085,000 | | | | 15,722,190 | | |
| 2004-51 B — 4.982% 2024 | | | 660,100 | | | | 659,909 | | |
| 2004-60 C — 5.24% 2028 | | | 18,209,253 | | | | 18,622,603 | | |
| 2006-8 C — 5.313% 2036 | | | 34,952,499 | | | | 36,533,051 | | |
| 2008-59 B — 5.553% 2026 | | | 10,697,305 | | | | 10,973,509 | | |
| GS Mortgage Securities Corporation II | |
| 2007-EOP A1 — 1.14249% 2020 + | | | 6,871,725 | | | | 6,822,249 | | |
| 2007-EOP A2 — 1.31693% 2020 + | | | 12,600,000 | | | | 12,367,908 | | |
| LSTAR Commercial Mortgage Trust 2001-1 A — 3.9129% 2017 + | | | 15,804,915 | | | | 15,905,750 | | |
| WAMU Commercial Mortgage Securities Trust | |
| 2007-SL2 A — 5.31145% 2049 + | | | 39,322,119 | | | | 39,966,215 | | |
| TOTAL COMMERCIAL MORTGAGE-BACKED SECURITIES | | $ | 364,765,092 | | |
| U.S. TREASURY SECURITIES - SHORT TERM — 3.5% | | | |
| U.S. Treasury Notes — 0.875% 2012 | | $ | 150,000,000 | | | $ | 150,399,000 | | |
| CORPORATE BONDS & DEBENTURES — 2.8% | | | |
| Barclays Bank plc — 1.9% 2014 | | $ | 38,654,000 | | | $ | 36,479,326 | | |
| Continental Airlines Company | |
| —8.388% 2020 | | | 11,437,553 | | | | 11,281,431 | | |
| 1997-1 1A — 7.461% 2015 | | | 1,906,450 | | | | 1,875,718 | | |
| International Lease Finance Corporation — 0.59605% 2012 | | | 24,420,000 | | | | 23,326,716 | | |
| Omnicare Inc. — 6.875% 2015 | | | 969,000 | | | | 1,003,884 | | |
| Qwest Corporation | |
| —3.59711% 2013 | | | 7,139,000 | | | | 7,121,581 | | |
| —7.625% 2015 | | | 16,142,000 | | | | 17,304,547 | | |
| United Airlines, Inc. — 9.875% 2013 + | | | 21,034,000 | | | | 21,559,850 | | |
| TOTAL CORPORATE BONDS & DEBENTURES | | $ | 119,953,053 | | |
| U.S. AGENCY SECURITIES — 1.9% | | | |
| Federal National Mortgage Association — 0.4% 2012 | | $ | 81,090,000 | | | $ | 81,099,731 | | |
| TOTAL INVESTMENT SECURITIES — 102.1% (Cost $4,365,106,440) | | $ | 4,365,323,437 | | |
| SHORT-TERM INVESTMENTS — 3.8% (Cost $163,155,933) | | | |
| Chevron Corporation | |
| —0.05% 10/03/11 | | $ | 52,000,000 | | | $ | 51,999,856 | | |
| —0.03% 10/04/11 | | | 52,000,000 | | | | 51,999,783 | | |
| ExxonMobil Corporation — 0.03% 10/18/11 | | | 50,000,000 | | | | 49,999,292 | | |
17
PORTFOLIO OF INVESTMENTS
September 30, 2011
| BONDS & DEBENTURES — Continued | | Principal
Amount | | Value | |
| State Street Bank Repurchase Agreement | |
—0.01% 10/03/11 (Collateralized by $435,000 Principal Amount
U.S. Treasury Notes — 2.125% 2014) | | $ | 449,000 | | | $ | 449,000 | | |
—0.01% 10/03/11 (Collateralized by $8,940,000 Principal Amount
U.S. Treasury Notes — 1.375% 2018) | | | 8,708,000 | | | | 8,708,002 | | |
| | | $ | 163,155,933 | | |
| TOTAL INVESTMENTS — 105.9% (Cost $4,528,262,373) | | $ | 4,528,479,370 | | |
| Other assets and liabilities, net — (5.9)% | | | (252,279,781 | ) | |
| TOTAL NET ASSETS — 100.0% | | $ | 4,276,199,589 | | |
+ Restricted securities. These restricted securities constituted 10.9% of total net assets at September 30, 2011.
* These securities have been valued in good faith by the Board of Directors in accordance with the Fund's fair value procedures. These securities constituted 0.3% of total net assets at September 30, 2011.
See notes to financial statements.
18
STATEMENT OF ASSETS AND LIABILITIES
September 30, 2011
| ASSETS | |
| Investments at value: | |
Investments securities — at market value
(identified cost $4,365,106,440) | | $ | 4,365,323,437 | | | | | | |
Short-term investments — at amortized cost
(maturities 60 days or less) | | | 163,155,933 | | | $ | 4,528,479,370 | | |
| Cash | | | | | | | 392 | | |
| Receivable for: | |
| Capital Stock sold | | $ | 27,468,472 | | | | | | |
| Interest | | | 18,949,934 | | | | | | |
| Investment Securities sold | | | 14,498,363 | | | | 60,916,769 | | |
| | | | | $ | 4,589,396,531 | | |
| LIABILITIES | |
| Payable for: | |
| Investment securities purchased | | $ | 305,230,823 | | | | | | |
| Capital Stock repurchased | | | 5,902,247 | | | | | | |
| Advisory fees | | | 1,737,268 | | | | | | |
| Accrued expenses and other liabilities | | | 326,604 | | | | 313,196,942 | | |
| NET ASSETS | | | | | | $ | 4,276,199,589 | | |
| SUMMARY OF SHAREHOLDERS' EQUITY | |
Capital Stock — par value $.01 per share; authorized
500,000,000 shares; outstanding 394,514,860 shares | | | | $ | 3,945,149 | | |
| Additional Paid in Capital | | | | | 4,360,133,832 | | |
| Accumulated net realized losses on investments | | | | | (139,672,646 | ) | |
| Undistributed net investment income | | | | | 51,576,257 | | |
| Unrealized depreciation of investments | | | | | 216,997 | | |
| Net assets at September 30, 2011 | | | | $ | 4,276,199,589 | | |
NET ASSET VALUE, REDEMPTION PRICE AND
MAXIMUM OFFERING PRICE PER SHARE | |
Net asset value and redemption price per share
(net assets divided by shares outstanding) | | | | $ | 10.84 | | |
Maximum offering price per share
(100/96.5 of per share net asset value) | | | | $ | 11.23 | | |
See notes to financial statements.
19
STATEMENT OF OPERATIONS
For the Year Ended September 30, 2011
| INVESTMENT INCOME | |
| Interest | | | | | | $ | 173,662,611 | | |
| EXPENSES | |
| Advisory fees | | $ | 19,073,181 | | | | | | |
| Transfer agent fees and expenses | | | 2,506,507 | | | | | | |
| Reports to shareholders | | | 639,151 | | | | | | |
| Custodian fees and expenses | | | 242,664 | | | | | | |
| Registration fees | | | 164,049 | | | | | | |
| Insurance | | | 94,920 | | | | | | |
| Directors' fees and expenses | | | 85,154 | | | | | | |
| Audit and tax services | | | 49,900 | | | | | | |
| Legal fees | | | 30,449 | | | | | | |
| Other expenses | | | 72,947 | | | | 22,958,922 | | |
| Net investment income | | | | $ | 150,703,689 | | |
| NET REALIZED AND UNREALIZED LOSS ON INVESTMENTS | |
| Net realized loss on investments: | |
Proceeds from sale of investment securities (excluding
short-term investments with maturities 60 days or less) | | $ | 4,256,098,104 | | | | | | |
| Cost of investment securities sold | | | 4,299,874,835 | | | | | | |
| Net realized loss on investments | | | | | | $ | (43,776,731 | ) | |
| Unrealized appreciation of investments: | |
| Unrealized appreciation at beginning of year | | $ | 18,560,154 | | | | | | |
| Unrealized appreciation at end of year | | | 216,997 | | | | | | |
| Change in unrealized appreciation of investments | | | | | | | (18,343,157 | ) | |
| Net realized and unrealized loss on investments | | | | | | $ | (62,119,888 | ) | |
| NET CHANGE IN NET ASSETS RESULTING FROM OPERATIONS | | | | | | $ | 88,583,801 | | |
See notes to financial statements.
20
STATEMENT OF CHANGES IN NET ASSETS
| | | For the Years Ended September 30, | |
| | | 2011 | | 2010 | |
| CHANGES IN NET ASSETS | |
| Operations: | |
| Net investment income | | $ | 150,703,689 | | | | | | | $ | 118,702,770 | | | | | | |
Net realized gain (loss)
on investments | | | (43,776,731 | ) | | | | | | | 3,446,415 | | | | | | |
Change in unrealized
appreciation of investments | | | (18,343,157 | ) | | | | | | | (7,164,055 | ) | | | | | |
Change in net assets resulting
from operations | | | | | | $ | 88,583,801 | | | | | | | $ | 114,985,130 | | |
Distributions to shareholders from
net investment income | | | | | | | (162,104,999 | ) | | | | | | | (130,371,322 | ) | |
| Capital stock transactions: | |
| Proceeds from capital stock sold | | $ | 1,924,276,959 | | | | | | | $ | 1,719,869,415 | | | | | | |
Proceeds from shares issued to
shareholders upon reinvestment
of dividends and distributions | | | 125,649,634 | | | | | | | | 94,165,060 | | | | | | |
| Cost of capital stock repurchased* | | | (1,845,604,618 | ) | | | 204,321,975 | | | | (1,466,717,348 | ) | | | 347,317,127 | | |
| Total change in net assets | | | | | | $ | 130,800,777 | | | | | | | $ | 331,930,935 | | |
| NET ASSETS | |
| Beginning of year | | | | | | | 4,145,398,812 | | | | | | | | 3,813,467,877 | | |
| End of year | | | | | | $ | 4,276,199,589 | | | | | | | $ | 4,145,398,812 | | |
CHANGE IN CAPITAL STOCK
OUTSTANDING | |
| Shares of capital stock sold | | | | | | | 176,921,878 | | | | | | | | 156,179,682 | | |
Shares issued to shareholders upon
reinvestment of dividends
and distributions | | | | | | | 11,584,688 | | | | | | | | 8,580,977 | | |
| Shares of capital stock repurchased | | | | | | | (169,311,361 | ) | | | | | | | (133,264,136 | ) | |
| Increase in capital stock outstanding | | | | | | | 19,195,205 | | | | | | | | 31,496,523 | | |
* Net of redemption fees of $202,426 and $233,657 for the years ended September 30, 2011, and 2010, respectively.
See notes to financial statements.
21
FINANCIAL HIGHLIGHTS
Selected Data for Each Share of Capital Stock Outstanding Throughout Each Year
| | | For the Year Ended September 30, | |
| | | 2011 | | 2010 | | 2009 | | 2008 | | 2007 | |
| Per share operating performance: | |
| Net asset value at beginning of year | | $ | 11.04 | | | $ | 11.09 | | | $ | 11.06 | | | $ | 11.03 | | | $ | 10.99 | | |
| Income from investment operations: | |
| Net investment income | | $ | 0.43 | | | $ | 0.36 | | | $ | 0.36 | | | $ | 0.47 | | | $ | 0.50 | | |
Net realized and unrealized gain (loss) on
investment securities | | | (0.16 | ) | | | (0.04 | ) | | | 0.08 | | | | 0.05 | | | | 0.07 | | |
| Total from investment operations | | $ | 0.27 | | | $ | 0.32 | | | $ | 0.44 | | | $ | 0.52 | | | $ | 0.57 | | |
| Less dividends from net investment income | | $ | (0.47 | ) | | $ | (0.37 | ) | | $ | (0.41 | ) | | $ | (0.49 | ) | | $ | (0.53 | ) | |
| Redemption fees | | | — | * | | | — | * | | | — | * | | | — | * | | | — | * | |
| Net asset value at end of year | | $ | 10.84 | | | $ | 11.04 | | | $ | 11.09 | | | $ | 11.06 | | | $ | 11.03 | | |
| Total investment return** | | | 2.47 | % | | | 2.90 | % | | | 4.03 | % | | | 4.84 | % | | | 5.36 | % | |
| Ratios/supplemental data: | |
| Net assets at end of year (in $000's) | | $ | 4,276,200 | | | $ | 4,145,399 | | | $ | 3,813,468 | | | $ | 2,186,138 | | | $ | 1,832,030 | | |
| Ratio of expenses to average net assets | | | 0.60 | % | | | 0.60 | % | | | 0.60 | % | | | 0.61 | % | | | 0.62 | % | |
Ratio of net investment income to average
net assets | | | 3.94 | % | | | 2.98 | % | | | 3.20 | % | | | 4.21 | % | | | 4.31 | % | |
| Portfolio turnover rate | | | 117 | % | | | 78 | % | | | 64 | % | | | 32 | % | | | 53 | % | |
* Rounds to less than $0.01 per share.
** Return is based on net asset value per share, adjusted for reinvestment of distributions, and does not reflect deduction of the sales charge
See notes to financial statements.
22
NOTES TO FINANCIAL STATEMENTS
September 30, 2011
NOTE 1 — Significant Accounting Policies
The Fund is registered under the Investment Company Act of 1940 as a diversified, open-end, management investment company. The Fund's primary investment objective is to seek current income and long-term total return. The following is a summary of significant accounting policies consistently followed by the Fund in the preparation of its financial statements.
A. Security Valuation
The Fund's investments are reported at fair value as defined by accounting principles generally accepted in the United States of America. The Fund generally determines its net asset value as of approximately 4:00 p.m. New York time each day the New York Stock Exchange is open. Further discussion of valuation methods, inputs and classifications can be found under Note 8.
B. Securities Transactions and Related Investment Income
Securities transactions are accounted for on the date the securities are purchased or sold. Dividend income and distributions to shareholders are recorded on the ex-dividend date. Interest income and expenses are recorded on an accrual basis. Market discounts and premiums on fixed income securities are amortized over the expected life of the securities. Realized gains or losses are based on the specific identification method.
C. Use of Estimates
The preparation of financial statements in conformity with accounting principles generally accepted in the United States requires management to make estimates and assumptions that affect the amounts reported. Actual results could differ from these estimates.
NOTE 2 — Risk Considerations
Investing in the Fund may involve certain risks including, but not limited to, those described below.
Market Risk: Because the values of the Fund's investments will fluctuate with market conditions, so will the value of your investment in the Fund. You could lose money on your investment in the Fund or the Fund could underperform other investments.
Interest Rate Risk: The values of, and the income generated by, most debt securities held by the Fund may be affected by changing interest rates and by changes in the effective maturities and credit ratings of these securities. For example, the values of debt securities in the Fund's portfolio generally will decline when interest rates rise and increase when interest rates fall. In addition, falling interest rates may cause an issuer to redeem, call or refinance a security before its stated maturity, which may result in the Fund having to reinvest the proceeds in lower yielding securities.
Mortgage-Backed and Other Asset-Backed Securities Risk: The values of some mortgaged-backed and other asset-backed securities may expose the Fund to a lower rate of return upon reinvestment of principal. When interest rates rise, the value of mortgage-related securities generally will decline; however, when interest rates are declining, the value of mortgage related-securities with prepayment features may not increase as much as other fixed income securities. The rate of prepayments on underlying mortgages will affect the price and volatility of a mortgage-related security, and may shorten or extend the effective maturity of the security beyond what was anticipated at the time of purchase. If an unanticipated rate of prepayment on underlying mortgages increases the effective maturity of a mortgage-related security, the volatility of the security can be expected to increase. The value of these securities may also fluctuate in response to the market's perception of the creditworthiness of the issuers. Additionally, although mortgages and mortgage-related securities are generally supported by some form of government or private guarantee and/or insurance, there is no assurance that private guarantors or insurers will meet their obligations.
23
NOTES TO FINANCIAL STATEMENTS
Continued
Stripped Mortgage-Backed Interest Only ("I/O") and Principal Only ("P/O") Securities: Stripped mortgage-backed securities are usually structured with two classes that receive different proportions of the interest and principal distributions on a pool of mortgage assets. In certain cases, one class will receive all of the interest payments on the underlying mortgages (the I/O class), while the other class will receive all of the principal payments (the P/O class). The Fund currently has investments in I/O securities. The yield to maturity on IOs is sensitive to the rate of principal repayments (including prepayments) on the related underlying mortgage assets, and principal payments may have a material effect on yield to maturity. If the underlying mortgage assets experience greater than anticipated prepayments of principal, a Fund may not fully recoup its initial investment in I/Os.
Credit Risk: The values of any of the Fund's investments may also decline in response to events affecting the issuer or its credit rating. The lower rated debt securities in which the Fund may invest are considered speculative and are generally subject to greater volatility and risk of loss than investment grade securities, particularly in deteriorating economic conditions. The Fund invests a significant portion of its assets in securities of issuers that hold mortgage- and asset-backed securities and direct investments in securities backed by commercial and residential mortgage loans and other financial assets. The value and related income of these securities is sensitive to changes in economic conditions, including delinquencies and/or defaults. Though the Fund has not been adversely impacted, continuing shifts in the market's perception of credit quality on securities backed by commercial and residential mortgage loans and other financial assets may result in increased volatility of market price and periods of illiquidity that can negatively impact the valuation of certain securities held by the Fund.
NOTE 3 — Purchases of Investment Securities
Cost of purchases of investment securities (excluding short-term investments with maturities of 60 days or less) aggregated $4,608,674,750 for the year ended September 30, 2011.
NOTE 4 — Advisory Fees and Other Affiliated Transactions
Pursuant to an Investment Advisory Agreement, advisory fees were paid by the Fund to First Pacific Advisors, LLC (the "Adviser"). Under the terms of this agreement, the Fund pays the Adviser a monthly fee calculated at the annual rate of 0.5% of the average daily net assets of the Fund. The Agreement obligates the Adviser to reduce its fee to the extent necessary to reimburse the Fund for any annual expenses (exclusive of interest, taxes, the cost of any supplemental statistical and research information, and extraordinary expenses such as litigation) in excess of 11/2% of the first $15 million and 1% of the remaining average net assets of the Fund for the year.
For the year ended September 30, 2011, the Fund paid aggregate fees of $84,000 to all Directors who are not interested persons of the Adviser. Certain officers of the Fund are also officers of the Adviser and FPA Fund Distributors, Inc.
NOTE 5 — Federal Income Tax
No provision for federal income tax is required because the Fund has elected to be taxed as a "regulated investment company" under the Internal Revenue Code and intends to maintain this qualification and to distribute each year to its shareholders, in accordance with the minimum distribution requirements of the Code, all of its taxable net investment income and taxable net realized gains on investments.
Distributions paid to shareholders are based on net investment income and net realized gains determined on a tax reporting basis, which may differ from financial reporting. For federal income tax purposes, the components of distributable earnings at September 30, 2011, were as follows:
| Undistributed net investment income | | $ | 61,296,942 | | |
24
NOTES TO FINANCIAL STATEMENTS
Continued
The tax status of dividends paid during fiscal years ended September 30, 2011 and 2010 were as follows:
| | | 2011 | | 2010 | |
| Dividends from ordinary income | | $ | 162,104,999 | | | $ | 130,371,322 | | |
Accumulated net realized losses of $72,731,446 can be carried forward to offset future gains. The ability to carry these losses forward expires as follows: $11,767,908 in 2012, $7,719,581 in 2013, $20,873,466 in 2014, $16,390,845 in 2015, $299,496 in 2017, $3,661,716 in 2018 and $12,018,434 in 2019.
The cost of investment securities at September 30, 2011 for federal income tax purposes was $4,374,827,125. Gross unrealized appreciation and depreciation for all securities at September 30, 2011 for federal income tax purposes was $48,301,314 and $57,805,002, respectively, resulting in net unrealized depreciation of $9,503,688. As of and during the year ended September 30, 2011, the Fund did not have any liability for unrecognized tax benefits. The Fund recognizes interest and penalties, if any, related to unrecognized tax benefits as income tax expense in the Statement of Operations. During the period, the Fund did not incur any interest or penalties. The Fund is not subject to examination by U.S. federal tax authorities for years ended before September 30, 2008 or by state tax authorities for years ended before September 30, 2007.
During the year ended September 30, 2011, the Fund reclassified $27,533,450 of net amounts relating to market discount on securities sold plus losses recorded on paydowns from mortgage- and other asset-backed securities, from accumulated net realized losses on investments to undistributed net investment income to align financial reporting with tax reporting.
On December 22, 2010, The Regulated Investment Company Modernization Act of 2010 (the "Modernization Act") was enacted. The Modernization Act is the first major piece of legislation affecting Regulated Investment Companies ("RICs") since 1986 and it modernizes several of the federal income and excise tax provisions related to RICs. Some highlights of the enacted provisions are as follows: new capital losses may now be carried forward indefinitely, and retain the character of the original loss; several provisions are aimed at preventing disqualification of a RIC for "inadvertent" failures of the asset diversification and/or qualifying income tests; and, the Modernization Act exempts RICs from the preferential dividend rule, and repealed the 60-day designation requirement for certain types of pay-through income and gains. Except for the simplification provisions related to RIC qualification, the Modernization Act is effective for taxable years beginning after December 22, 2010.
NOTE 6 — Distributor
For the year ended September 30, 2011, FPA Fund Distributors, Inc. ("Distributor"), a wholly owned subsidiary of the Adviser, received $49,978 in net Fund share sales commissions after reallowance to other dealers. The Distributor pays its own overhead and general administrative expenses, the cost of supplemental sales literature, promotion and advertising.
NOTE 7 — Redemption Fees
A redemption fee of 2% applies to redemptions within 90 days of purchase for certain purchases made by persons eligible to purchase shares without an initial sales charge. For the year ended September 30, 2011, the Fund collected $202,426 in redemption fees, which amounted to less than $0.01 per share.
NOTE 8 — Disclosure of Fair Value Measurements
The Fund uses the following methods and inputs to establish the fair value of its assets and liabilities. Use of particular methods and inputs may vary over time based on availability and relevance as market and economic conditions evolve.
Equity securities are generally valued at the official closing price of, or the last reported sale price on, the exchange or market on which such securities are traded, as of the close of business on the day the securities are
25
NOTES TO FINANCIAL STATEMENTS
Continued
being valued or, lacking any sales, at the last available bid price. Prices for each security are taken from the principal exchange or market in which the security trades. Securities that are unlisted and fixed-income and convertible securities listed on a national securities exchange for which the over-the-counter market more accurately reflects the securities' value in the judgment of the Fund's officers, are valued at the most recent bid price. However, most fixed income securities are generally valued at prices obtained from pricing vendors. Vendors value such securities based on one or more of the following inputs: transactions, bids, offers quotations from dealers and trading systems, spreads and other relationships observed in the markets among comparable securities, benchmarks, underlying equity of the issuer, and proprietary pricing models such as cash flows, financial or collateral performance and other reference data (includes prepayments, defaults, collateral, credit enhancements, and interest rate volatility). Short-term corporate notes with maturities of 60 days or less are valued at amortized cost, which approximates market value.
Securities for which representative market quotations are not readily available or are considered unreliable by the Investment Adviser are valued as determined in good faith under guidelines adopted by authority of the Fund's Board of Directors. Various inputs may be reviewed in order to make a good faith determination of a security's value. These inputs include, but are not limited to, the type and cost of the security; contractual or legal restrictions on resale of the security; relevant financial or business developments of the issuer; actively traded similar or related securities; conversion or exchange rights on the security; related corporate actions; significant events occurring after the close of trading in the security; and changes in overall market conditions. Fair valuations and valuations of investments that are not actively trading involve judgment and may differ materially from valuations of investments that would have been used had greater market activity occurred.
The Fund classifies its assets based on three valuation methodologies. Level 1 investment securities are valued based on quoted market prices in active markets for identical assets. Level 2 investment securities are valued based on significant observable market inputs, such as quoted prices for similar assets and quoted prices in inactive markets or other market observable inputs as noted above including spreads, cash flows, financial performance, prepayments, defaults, collateral, credit enhancements, and interest rate volatility. Level 3 investment securities are valued using significant unobservable inputs that reflect the Fund's determination of assumptions that market participants might reasonably use in valuing the assets. These assumptions consider inputs such as proprietary pricing models, cash flows, prepayments, defaults, and collateral. The valuation levels are not necessarily an indication of the risk associated with investing in those securities. The following table presents the valuation levels of the Fund's investments as of September 30, 2011:
| Investments | | Level 1 | | Level 2 | | Level 3 | | Total | |
| Bonds & Debentures | |
| Mortgage Pass-Through | | | — | | | $ | 1,215,471,103 | | | | — | | | $ | 1,215,471,103 | | |
| Mortgage-Backed | | | — | | | | 799,915,417 | | | $ | 44,951,618 | | | | 844,867,035 | | |
| U.S. Treasuries | | | — | | | | 884,185,070 | | | | — | | | | 884,185,070 | | |
| Asset-Backed | | | — | | | | 441,092,179 | | | | — | | | | 441,092,179 | | |
| Stripped Mortgage-Backed | | | — | | | | 413,890,174 | | | | — | | | | 413,890,174 | | |
| Commercial Mortgage-Backed | | | — | | | | 364,765,092 | | | | — | | | | 364,765,092 | | |
| Corporate | | | — | | | | 119,953,053 | | | | — | | | | 119,953,053 | | |
| U.S. Agencies | | | — | | | | 81,099,731 | | | | — | | | | 81,099,731 | | |
| Short-Term Investments | | | — | | | | 163,155,933 | | | | — | | | | 163,155,933 | | |
| | | | — | | | $ | 4,483,527,752 | | | $ | 44,951,618 | | | $ | 4,528,479,370 | | |
26
NOTES TO FINANCIAL STATEMENTS
Continued
The following table summarizes the Fund's Level 3 investment securities and related transactions during the year ended September 30, 2011:
| Investments | | Beginning
Value at
September 30,
2010 | | Net Realized and
Unrealized Gains
(Losses) | | Net
Purchases
(Sales) | | Net
Transfers
In (Out)* | | Ending
Value at
September 30,
2011 | |
| Mortgage-Backed | | $ | 19,501,935 | | | $ | (1,710,230 | ) | | $ | 6,641,039 | | | $ | 20,518,874 | | | $ | 44,951,618 | | |
* Transfers of investments between different levels of the fair value hierarchy are recorded at market value as of the end of the reporting period. There were no significant transfers between Level 1 and Level 2 during the year ended September 30, 2011.
NOTE 9 — Distribution to Shareholders
On September 30, 2011, the Board of Directors declared a dividend from net investment income of $0.11 per share payable October 7, 2011 to shareholders of record on September 30, 2011. For financial statement purposes, this dividend was recorded on the ex-dividend date, October 3, 2011.
27
REPORT OF INDEPENDENT REGISTERED
PUBLIC ACCOUNTING FIRM
TO THE SHAREHOLDERS AND
BOARD OF DIRECTORS OF FPA NEW INCOME, INC.
We have audited the accompanying statement of assets and liabilities of FPA New Income, Inc. (the "Fund"), including the portfolio of investments, as of September 30, 2011, the related statement of operations for the year then ended, the statements of changes in net assets for each of the two years in the period then ended, and financial highlights for each of the five years in the period then ended. These financial statements and financial highlights are the responsibility of the Fund's management. Our responsibility is to express an opinion on these financial statements and financial highlights based on our audits.
We conducted our audits in accordance with standards of the Public Company Accounting Oversight Board (United States). Those standards require that we plan and perform the audit to obtain reasonable assurance about whether the financial statements and financial highlights are free of material misstatement. The Fund is not required to have, nor were we engaged to perform, an audit of its internal control over financial reporting. Our audits included consideration of internal control over financial reporting as a basis for designing audit procedures that are appropriate in the circumstances, but not for the purpose of expressing an opinion on the effectiveness of the Fund's internal control over financial reporting. Accordingly, we express no such opinion. An audit also includes examining, on a test basis, evidence supporting the amounts and disclosures in the financial statements, assessing the accounting principles used and significant estimates made by management, as well as evaluating the overall financial statement presentation. Our procedures included confirmation of securities owned as of September 30, 2011, by correspondence with the custodian and brokers, where replies were not received from brokers, we performed other auditing procedures. We believe that our audits provide a reasonable basis for our opinion.
In our opinion, the 2011 financial statements and financial highlights referred to above present fairly, in all material respects, the financial position of FPA New Income, Inc. as of September 30, 2011, the results of its operations for the year then ended, the changes in its net assets for each of the two years in the period then ended, and the financial highlights for each of the five years in the period then ended, in conformity with accounting principles generally accepted in the United States of America.

Los Angeles, California
November 18, 2011
28
RENEWAL OF THE INVESTMENT ADVISORY AGREEMENT
Approval of the Advisory Agreement. At a meeting of the Board of Directors held on August 2, 2011, the Directors approved the continuation of the advisory agreement between the Fund and the Adviser for an additional one-year period through September 30, 2012, on the recommendation of the Independent Directors who met in executive session on August 2, 2011 prior to the Board meeting to review and discuss the proposed continuation of the advisory agreement. The following paragraphs summarize the material information and factors considered by the Board and the Independent Directors as well as the Directors' conclusions relative to such factors.
Nature, Extent and Quality of Services. The Board and the Independent Directors considered information regarding the Adviser and its staffing in connection with the Fund, including the Fund's portfolio managers, the senior analysts supporting team, the scope of accounting, administrative, shareholder and other services supervised and provided by the Adviser, and the absence of any significant service problems reported to the Board. The Board and the Independent Directors noted the experience, length of service and the outstanding reputation of the Fund's portfolio managers: Tom Atteberry, who has been with the Adviser since 1997, Robert Rodriguez, who has managed the Fund since 1984, Julian W.H. Mann, who joined the Adviser in 2004, and Abhijeet Patwardhan, who joined the Adviser in 2010. The Board and the Independent Directors concluded that the nature, extent and quality of services provided by the Adviser have benefited and should continue to benefit the Fund and its shareholders.
Investment Performance. The Board and the Independent Directors reviewed the overall investment performance of the Fund. They also received information from an independent consultant, Lipper, a Thomson Reuters Company ("Lipper"), regarding the Fund's performance relative to a peer group of A-rated corporate debt value funds selected by Lipper (the "Peer Group"). The Independent Directors questioned the Fund's absolute investment results and its long-term investment performance when compared to the Peer Group. The Adviser reminded the Board of the Fund's investing style, as evidenced by the short duration of most of its portfolio securities, as well as the Fund's flexibility to invest in a variety of areas, both of which factors complicate Peer Group comparisons. The Board and the Independent Directors concluded that the Fund's investment results were satisfactory in light of the Funds objectives. They further concluded that the Adviser's continued management of the Fund should benefit the Fund and its shareholders.
Advisory Fees and Fund Expenses; Adviser Profitability; Economies of Scale and Sharing of Economies of Scale. The Board and the Independent Directors were provided information by the Adviser to enable consideration of the Fund's advisory fees and total expense levels, as well as the overall profitability of the Adviser, the benefits to the Adviser from its relationship to the Fund, the extent to which economies of scale with respect to the management of the Fund, if any, would be realized, and whether the Fund is sharing, or will share, in those economies.
The Board and the Independent Directors reviewed comparative information relative to fees and expenses for the mutual fund industry generally and for the Peer Group. The Board and the Independent Directors noted that the Fund's fees and expenses were at the lower end of the range for the Peer Group. The Board and the Independent Directors noted that the overall expense ratio of the Fund was also the low when compared to the Peer Group. The Board and the Independent Directors noted that overall expense ratio of the Fund was also low when compared to the Peer Group. The Board and the Independent Directors concluded that the overall fee rate was reasonable and fair to the Fund and its shareholders in light of the nature and quality of the services provided by the Adviser.
The Board and the Independent Directors considered whether there have been economies of scale with respect to the management of the Fund, whether the Fund has appropriately benefited from any
29
RENEWAL OF THE INVESTMENT ADVISORY AGREEMENT
Continued
economies of scale, and whether the fee rate is reasonable in relation to the Fund's assets and any economies of scale that may exist. The Independent Directors discussed the fact that the fee rate does not have any breakpoints. The mutual fund industry has trended toward funds having breakpoints in the advisory fee structure as a means by which to share in economies of scale as a fund's assets grow; however, not all funds have breakpoints in their fee structures. The Adviser indicated its belief that breakpoints currently were not appropriate for the Fund and that no meaningful income and expense forecasts for its business could be prepared given uncertainties regarding the direction of the economy, rising inflation, increasing costs for personnel and systems, and growth (or not) in the Fund's assets, all of which could negatively impact the Adviser. The Board and the Independent Directors noted that the Adviser had not increased the fee rate charged to the Fund despite the Adviser's claims of increases in the Adviser's internal costs of providing investment management services to the Fund, in part due to administrative burdens and expenses resulting from recent legislative and regulatory actions such as Sarbanes-Oxley. According to the Adviser, such increased costs have included a significant investment in analysts who assist with the management of the Fund, additions to administrative personnel and systems that enhance the quality of services provided to the Fund and the establishment of a full-time Chief Compliance Officer and his assistant.
Conclusions. The Board and the Independent Directors determined that the Fund continues to benefit from the services of a highly experienced portfolio management team that has produced competitive long-term returns. In addition, the Board and the Independent Directors agreed that the Fund continues to receive high quality accounting, administrative, shareholder and other ancillary services from the Adviser. The Board and the Independent Directors also determined that while there is no uniform industry methodology to measure or apply economies of scale, the Fund's expense ratio, the overall profitability of the Adviser, and the sharing of economies of scale with the Fund are fair and reasonable under the current circumstances. The Board and the Independent Directors also stated their intention to continue monitoring the factors relevant to the Adviser's compensation, such as changes in the Fund's asset levels, changes in portfolio management personnel and the cost and quality of the services provided by the Adviser to the Fund. On the basis of the foregoing, and without assigning particular weight to any single factor, the Board and the Independent Directors determined to approve the continuation of the current Advisory Agreement for another one-year period through September 30, 2012.
30
SHAREHOLDER EXPENSE EXAMPLE
September 30, 2011
(Unaudited)
Fund Expenses
As a shareholder of the Fund, you incur two types of costs: (1) transaction costs, and (2) ongoing costs, including advisory and administrative fees; shareholder service fees; and other Fund expenses. The Example is intended to help you understand your ongoing costs (in dollars) of investing in the Fund and to compare these costs with the ongoing costs of investing in other mutual funds. The Example is based on an investment of $1,000 invested at the beginning of the year and held for the entire year.
Actual Expenses
The information in the table under the heading "Actual Performance" provides information about actual account values and actual expenses. You may use the information in this column, together with the amount you invested, to estimate the expenses that you paid over the period. Simply divide your account value by $1,000 (for example, an $8,600 account value divided by $1,000= 8.6), then multiply the result by the number in the first column in the row entitled "Expenses Paid During Period" to estimate the expenses you paid on your account during this period.
Hypothetical Example for Comparison Purposes
The information in the table under the heading "Hypothetical Performance (5% return before expenses)" provides information about hypothetical account values and hypothetical expenses based on the Fund's actual expense ratio and an assumed rate of return of 5% per year before expenses, which is not the Fund's actual return. The hypothetical account values and expenses may not be used to estimate the actual ending account balance or expenses you paid for the period. You may use this information to compare the ongoing costs of investing in the Fund and other funds. To do so, compare this 5% hypothetical example with the 5% hypothetical examples that appear in the shareholder reports of other funds.
Please note that the expenses shown in the table are meant to highlight your ongoing costs only and do not reflect any transactional costs. Therefore, the information under the heading "Hypothetical Performance (5% return before expenses)" is useful in comparing ongoing costs only, and will not help you determine the relative total costs of owning different funds. In addition, if these transactional costs were included, your costs would have been higher.
| | | Actual
Performance | | Hypothetical
Performance
(5% return
before
expenses) | |
Beginning Account Value
March 31, 2011 | | $ | 1,000.00 | | | $ | 1,000.00 | | |
Ending Account Value
September 30, 2011 | | $ | 1,011.12 | | | $ | 1,022.06 | | |
Expenses Paid During
Period* | | $ | 2.92 | | | $ | 2.94 | | |
* Expenses are equal to the Fund's annualized expense ratio of 0.58%, multiplied by the average account value over the period and prorated for the six-months ended September 30, 2011 (183/365 days).
31
DIRECTOR AND OFFICER INFORMATION
| Name, Age & Address | | Position(s)
With Fund/
Years Served | | Principal Occupation(s)
During the Past 5 Years | | Portfolios in
Fund Complex
Overseen | | Other Directorships | |
| Willard H. Altman, Jr. – (76)* | | Director and Chairman†
Years Served: 13 | | Retired. Formerly, until 1995, Partner of Ernst & Young LLP, a public accounting firm. | | | 6 | | | | |
|
| Thomas P. Merrick – (74)* | | Director†
Years Served: 2 | | Private Consultant. President of Strategic Planning Consultants for more than the past five years. Former Executive Committee Member and Vice President of Fluor Corporation, responsible for strategic planning, from 1984 to 1998. | | | 6 | | | | |
|
| Alfred E. Osborne, Jr. – (66)* | | Director†
Years Served: 12 | | Senior Associate Dean of the John E. Anderson School of Management at UCLA. | | | 3 | | | Investment Directors Council, Wedbush, Inc., Kaiser Aluminum Corporation, and Heckmann Corporation. | |
|
| Patrick B. Purcell – (68)* | | Director†
Years Served: 5 | | Retired. Formerly Consultant from March 1998 to August 2000, and Executive Vice President, Chief Financial Officer and Chief Administrative Officer from 1989 to March 1998, of Paramount Pictures. | | | 4 | | | The Ocean Conservancy and The Motion Picture and Television Fund | |
|
| Allan M. Rudnick – (70)* | | Director†
Years Served: 1 | | Private Investor. Formerly, Co-Founder,
Chief Executive Officer, Chairman and
Chief Investment Officer of Kayne Anderson Rudnick Investment Management from 1989 to 2007 | | | 3 | | | California Council on Economic Education | |
|
| Robert L. Rodriguez – (62) | | Director†
Portfolio Manager
Years Served: 27 | | Chief Executive Officer of the Adviser. | | | 2 | | | FPA Fund Distributors, Inc. | |
|
| Thomas H. Atteberry – (58) | | Chief Executive Officer & Portfolio Manager
Years Served: 6 | | Partner of the Adviser. Formerly Vice President of First Pacific Advisors, Inc. from 1997 to 2006. | | | | | |
|
| Eric S. Ende – (67) | | Vice President
Years Served: 26 | | Partner of the Adviser. Formerly Senior Vice President of First Pacific Advisors, Inc. from 1983 to 2006. | | | 3 | | | | |
|
| J. Richard Atwood – (51) | | Treasurer
Years Served: 14 | | Chief Operating Officer of the Adviser. President and Chief Executive Officer of FPA Fund Distributors, Inc. | | | | FPA Fund Distributors, Inc. | |
|
| Christopher H. Thomas – (54) | | Chief Compliance Officer
Years Served: 16 | | Vice President and Chief Compliance Officer of the Adviser and Vice President of FPA Fund Distributors, Inc. | | | | FPA Fund Distributors, Inc. | |
|
| Sherry Sasaki – (56) | | Secretary
Years Served: 28 | | Assistant Vice President and Secretary of the Adviser and Secretary of FPA Fund Distributors, Inc. | | | | | |
|
| E. Lake Setzler – (44) | | Assistant Treasurer
Years Served: 5 | | Vice President and Controller of the Adviser since 2005. | | | | | |
|
† Directors serve until their resignation, removal or retirement.
* Audit Committee member
Additional information on the Directors is available in the Statement of Additional Information. Each of the above listed individuals can be contacted at 11400 W. Olympic Blvd., Suite 1200, Los Angeles, CA 90064.
32
FPA NEW INCOME, INC.
INVESTMENT ADVISER
First Pacific Advisors, LLC
11400 West Olympic Boulevard, Suite 1200
Los Angeles, California 90064
DISTRIBUTOR
FPA Fund Distributors, Inc.
11400 West Olympic Boulevard, Suite 1200
Los Angeles, California 90064
COUNSEL
O'Melveny & Myers LLP
Los Angeles, California
TICKER: FPNIX
CUSIP: 302544101
INDEPENDENT REGISTERED PUBLIC ACCOUNTING FIRM
Deloitte & Touche LLP
Los Angeles, California
CUSTODIAN
State Street Bank and Trust Company
Boston, Massachusetts
TRANSFER & SHAREHOLDER SERVICE AGENT
UMB Fund Services, Inc.
P.O. Box 2175
Milwaukee, WI 53201-2175
803 W. Michigan St., Ste. A
Milwaukee, WI 53233-2301
(800) 638-3060
This report has been prepared for the information of shareholders of FPA New Income, Inc., and is not authorized for distribution to prospective investors unless preceded or accompanied by a prospectus.
The Fund's complete proxy voting record for the 12 months ended June 30, 2011 is available without charge, upon request, by calling (800) 982-4372 and on the SEC's website at www.sec.gov.
The Fund's schedule of portfolio holdings, filed the first and third quarter of the Fund's fiscal year on Form N-Q with the SEC, is available on the SEC's website at www.sec.gov. Form N-Q is available at the SEC's Public Reference Room in Washington, D.C., and information on the operations of the Public Reference Room may be obtained by calling (202) 942-8090. To obtain information on Form N-Q from the Fund, shareholders can call (800) 982-4372.
Additional information about the Fund is available online at www.fpafunds.com. This information includes, among other things, holdings, top sectors and performance, and is updated on or about the 15th business day after the end of each quarter.
Item 2. | Code of Ethics. |
| |
| (a) | The registrant has adopted a code of ethics that applies to the registrant’s principal executive and financial officers. |
| | |
| (b) | Not Applicable |
| | |
| (c) | During the period covered by this report, there were not any amendments to the provisions of the code of ethics adopted in 2(a) above. |
| | |
| (d) | During the period covered by this report, there were not any implicit or explicit waivers to the provisions of the code of ethics adopted in 2(a). |
| | |
| (e) | Not Applicable |
| | |
| (f) | A copy of the registrant’s code of ethics is filed as an exhibit to this Form N-CSR. Upon request, any person may obtain a copy of this code of ethics, without charge, by calling (800) 982-4372. |
| |
Item 3. | Audit Committee Financial Expert. |
| |
| The registrant’s board of directors has determined that Willard H. Altman, Jr. and Patrick B. Purcell, each of whom is a member of the registrant’s audit committee and board of directors, is an “audit committee financial expert” and is “independent,” as those terms are defined in this Item. This designation will not increase the designees’ duties, obligations or liability as compared to each of their duties, obligations and liability as a member of the audit committee and of the board of directors. This designation does not affect the duties, obligations or liability of any other member of the audit committee or the board of directors. |
| |
Item 4. | Principal Accountant Fees and Services. |
| |
| | | | 2010 | | 2011 | |
| (a) | Audit Fees | | $ | 42,800 | | $ | 45,000 | |
| (b) | Audit Related Fees | | -0- | | -0- | |
| (c) | Tax Fees | | $ | 7,100 | | $ | 7,100 | |
| (d) | All Other Fees | | -0- | | -0- | |
| | |
| (e)(1) | Disclose the audit committee’s pre-approval policies and procedures described in paragraph (c)(7) of Rule 2-01 of Regulation S-X. The audit committee shall pre-approve all audit and permissible non-audit services that the committee considers compatible with maintaining the independent auditors’ independence. The pre-approval requirement will extend to all non-audit services provided to the registrant, the adviser, and any entity controlling, controlled by, or under common control with the adviser that provides ongoing services to the registrant, if the |
| | | | | | | | | | |
| | engagement relates directly to the operations and financial reporting of the registrant; provided, however, that an engagement of the registrant’s independent auditors to perform attest services for the registrant, the adviser or its affiliates required by generally accepted auditing standards to complete the examination of the registrant’s financial statements (such as an examination conducted in accordance with Statement on Auditing Standards Number 70 issued by the American Institute of Certified Public Accountants), will be deem pre-approved if: (i) the registrant’s independent auditors inform the audit committee of the engagement, (ii) the registrant’s independent auditors advise the audit committee at least annually that the performance of this engagement will not impair the independent auditor’s independence with respect to the registrant, and (iii) the audit committee receives a copy of the independent auditor’s report prepared in connection with such services. The committee may delegate to one or more committee members the authority to review and pre-approve audit and permissible non-audit services. Actions taken under any such delegation will be reported to the full committee at its next meeting. |
| | |
| (e)(2) | Disclose the percentage of services described in each of paragraphs (b) – (d) of this Item that were approved by the audit committee pursuant to paragraph (c)(7)(i)(C) of Rule 2-01 of Regulation S-X. 100% of the services provided to the registrant described in paragraphs (b) – (d) of this Item were pre-approved by the audit committee pursuant to paragraph (e)(1) of this Item. There were no services provided to the investment adviser or any entity controlling, controlled by or under common control with the adviser described in paragraphs (b) – (d) of this Item that were required to be pre-approved by the audit committee. |
| | |
| (f) | If greater than 50%, disclose the percentage of hours expended on the principal accountant’s engagement to audit the registrant’s financial statements for the most recent fiscal year that were attributed to work performed by persons other than the principal accountant’s full-time, permanent employees. All services performed on the engagement to audit the registrant’s financial statements for the most recent fiscal year end were performed by the principal accountant’s full-time, permanent employees. |
| | |
| (g) | Disclose the aggregate non-audit fees billed by the registrant’s accountant for services rendered to the registrant, and rendered to the registrant’s investment adviser (not including any sub-adviser whose role is primarily portfolio management and is subcontracted with or overseen by another investment adviser), and any entity controlling, controlled by, or under common control with the adviser that provides ongoing services to the registrant for each of the last two fiscal years of the registrant. None. |
| (h) | Disclose whether the registrant’s audit committee of the board of directors has considered whether the provision of non-audit services that were rendered to the registrant’s investment adviser (not including any sub-adviser whose role is primarily portfolio management and is subcontracted with or overseen by another investment adviser), and any entity controlling, controlled by, or under common control with the investment adviser that provides ongoing services to the registrant that were not pre-approved pursuant to paragraph (c)(7)(ii) of Rule 2-01 of Regulation S-X is compatible with maintaining the principal accountant’s independence. Not Applicable. |
| |
Item 5. | Audit Committee of Listed Registrants. Not Applicable. |
| |
Item 6. | Schedule of Investments. The schedule of investments is included as part of the report to stockholders filed under Item 1 of this Form. |
| |
Item 7. | Disclosure of Proxy Voting Policies and Procedures for Closed-End Management Investment Companies. Not Applicable. |
| |
Item 8. | Portfolio Managers of Closed-End Management Investment Companies. Not Applicable. |
| |
Item 9. | Purchases of Equity Securities by Closed-End Management Investment Company and Affiliated Purchasers. Not Applicable. |
| |
Item 10. | Submission of Matters to a Vote of Security Holders. There has been no material change to the procedures by which shareholders may recommend nominees to the registrant’s board of directors. |
| |
Item 11. | Controls and Procedures. |
| | |
| (a) | The principal executive officer and principal financial officer of the registrant have concluded that the registrant’s disclosure controls and procedures (as defined in Rule 30a-3(c) under the Investment Company Act of 1940) are effective based on their evaluation of the disclosure controls and procedures as of a date within 90 days of the filing date of this report. |
| | |
| (b) | There have been no significant changes in the registrant’s internal controls over financial reporting (as defined in Rule 30a-3(d) under the Investment Company Act of 1940) that occurred during the second fiscal quarter of the period covered by this report that have materially affected, or is reasonably likely to materially affect, the registrant’s internal controls over financial reporting. |
Item 12. | Exhibits. |
| | |
| (a)(1) | Code of ethics as applies to the registrant’s officers and directors, as required to be disclosed under Item 2 of Form N-CSR. Attached hereto as Ex.99.CODE.ETH. |
| | |
| (a)(2) | Separate certification for the registrant’s principal executive officer and principal financial officer, as required by Rule 30a-2(a) under the Investment Company Act of 1940. Attached hereto. |
| | |
| (a)(3) | Not Applicable |
| | |
| (b) | Separate certification for the registrant’s principal executive officer and principal financial officer, as required by Rule 30a-2(b) under the Investment Company Act of 1940. Attached hereto. |
SIGNATURES
Pursuant to the requirements of the Securities Exchange Act of 1934 and the Investment Company Act of 1940, the registrant has duly caused this report to be signed on its behalf by the undersigned, thereunto duly authorized.
FPA NEW INCOME, INC.
By: | /s/ THOMAS H. ATTEBERRY | |
Thomas H. Atteberry, Chief Executive Officer |
(Principal Executive Officer) |
Date: November 23, 2011
Pursuant to the requirements of the Securities Exchange Act of 1934 and the Investment Company Act of 1940, this report has been signed below by the following persons on behalf of the registrant and in the capacities and on the dates indicated.
FPA NEW INCOME, INC.
By: | /s/ THOMAS H. ATTEBERRY | |
Thomas H. Atteberry, Chief Executive Officer |
(Principal Executive Officer) |
Date: November 23, 2011
By: | /s/ J. RICHARD ATWOOD | |
J. Richard Atwood, Treasurer |
(Principal Financial Officer) |
Date: November 23, 2011