UNITED STATES
SECURITIES AND EXCHANGE COMMISSION
Washington, D.C. 20549
FORM N-CSR
CERTIFIED SHAREHOLDER REPORT OF REGISTERED
MANAGEMENT INVESTMENT COMPANIES
Investment Company Act file number | 811-1735 |
|
FPA NEW INCOME, INC. |
(Exact name of registrant as specified in charter) |
|
11400 WEST OLYMPIC BLVD., SUITE 1200, LOS ANGELES, CALIFORNIA | | 90064 |
(Address of principal executive offices) | | (Zip code) |
|
J. RICHARD ATWOOD, 11400 WEST OLYMPIC BLVD., SUITE 1200, LOS ANGELES, CALIFORNIA 90064 |
(Name and address of agent for service) |
|
Registrant’s telephone number, including area code: | 310-473-0225 | |
|
Date of fiscal year end: | SEPTEMBER 30 | |
|
Date of reporting period: | SEPTEMBER 30, 2013 | |
| | | | | | | | | |
Item 1. Report to Stockholders.

Distributor:
UMB DISTRIBUTION SERVICES, LLC
803 West Michigan Street
Milwaukee, Wisconsin 53233
FPA NEW INCOME, INC.
LETTER TO SHAREHOLDERS
Dear Fellow Shareholders:
This Annual Report covers the year ended September 30, 2013. Your Fund's net asset value (NAV) closed at $10.45. During the fiscal year, your Fund paid four income dividends totaling $0.32. There were no capital gains distributions.
The following table shows the average annual total return for several different periods ended on September 30, 2013 for the Fund and comparative indices of securities prices.
| | | Periods Ended September 30, 2013 | |
| | | 1 Year | | 5 Years | | 10 Years | | 15 Years | | 20 Years | | 25 Years | | 6/30/1984
Inception | |
FPA New Income (NAV) | | | 0.66 | % | | | 2.44 | % | | | 3.23 | % | | | 4.51 | % | | | 5.14 | % | | | 6.48 | % | | | 7.82 | % | |
Barclays U.S. Aggregate
Bond Index | | | (1.68 | )% | | | 5.41 | % | | | 4.59 | % | | | 5.27 | % | | | 5.75 | % | | | 6.86 | % | | | 8.01 | % | |
Consumer Price Index + 100
Basis Points | | | 2.01 | % | | | 2.34 | % | | | 3.38 | % | | | 3.43 | % | | | 3.43 | % | | | 3.73 | % | | | 3.85 | % | |
The Fund continues to perform in line with our expectations. Our emphasis on high-quality, short-duration bonds led to our year-to-date return of 0.47% through September 30, 2013 versus -1.89% for the Barclays U.S. Aggregate Bond Index and 1.96% for the CPI + 100. For the second half of the fiscal year, your Fund's return was -0.09%, -1.77% for the Barclays Index and 1.20% for the CPI + 100.
Past performance is no guarantee of future results and current performance may be higher or lower than the performance shown. This data represents past performance and investors should understand that investment returns and principal values fluctuate, so that when you redeem your investment may be worth more or less than its original cost. Current month-end performance data can be obtained by visiting the website at www.fpafunds.com or by calling toll-free, 1-800-982-4372. Information regarding the Fund's expense ratio and redemption fees can be found on pages 31 and 34.
Portfolio Commentary
The third quarter, while challenging from a portfolio management perspective, has been positive in at least a few regards. The rise in interest rates not only reminded investors that the timing of rising rates is often unpredictable (more on that below), it puts to rest the belief that the Federal Reserve has "everything under control." In addition, for those shareholders who have been with us over the past few years, while we have delivered positive, albeit modest, returns, we hope you have renewed appreciation for our disciplined investment process. We appreciate your confidence in our process as demonstrated by the inflows we have experienced the past few months, as some other fixed-income managers have faced substantial redemptions. We attribute this to the Fund's performance and that we have successfully communicated our strategy, aligning shareholder expectations for the bumpy road ahead.
The unpredictability of interest rate movements is often taken for granted, until it is not. Since 1940, rates have risen 1% or more over any consecutive 12 month period about 11% of the time (97 out of 872 rolling 12 month periods). Investors might suspect most of those periods occurred during the rising rate period from 1940-1982. Instead it turns out that nearly half of the rising interest rate periods (43 out of the 97) occurred during the bond bull market from 1982-2013. Instead of trying to guess which way rates are headed, we hope to replicate our past success by positioning the portfolio to maximize returns for each unit of risk assumed, consistent with our goals.
1
FPA NEW INCOME, INC.
LETTER TO SHAREHOLDERS (Continued)
Portfolio Activity
Our third-quarter activity report looks back to the second quarter as backdrop. In May and June, we implemented changes in the portfolio's exposure with particular emphasis on corporate credit with S&P credit rating equivalents of A or less. All told, we more than doubled the allocation to corporate credit (and increased the A-rated or less component by one-third). Our current corporate credit exposure is approximately 8%. Motivating our actions was a market sell-off in credit driven by an increase in Treasury yields. "Tapering talk" by the Federal Reserve concerning its Treasury and mortgage purchases spurred the significant liquidations from the fixed income segment of the mutual funds market. Our second quarter shareholder conference call addressed this event in detail. We explained our view that the market was over-reacting, and re-positioned the portfolio to take advantage of this anomaly.
Third quarter transactions focused on further reducing interest rate risk while continuing to take advantage of uncertainty in credit markets to optimize our exposure in that area. In the high quality segment, we sold 15-year amortization single-family mortgage pools. The portfolio's mortgage pool holdings are now all 10-year amortization loans. These proceeds were redeployed into securities backed by sub-prime auto loans with average lives of less than 1.5 years and credit enhancement that result in quality ratings ranging from AA and above. This segment of the Asset Backed Securities market sold off in the summer, providing us with an opportunity to receive very attractive yields for the average life. The effect of this swap is a further reduction of the risk posed by rising interest rates.
We further optimized the credit component by selling bonds maturing in 2-3 years and replacing them with bonds that mature in 3-5 years at more attractive yields. We also shifted from bank debt to callable bonds with similar maturity characteristics and an enhanced yield profile.
In light of the above highlighted changes, yield to worst1 and effective duration of the Fund's portfolio over the past six months can be summarized as follows:
| | 3/31/2013 | | 6/30/2013 | | 9/30/2013 | |
Effective Duration | | | 1.59 years | | | | 2.00 years | | | | 1.93 years | | |
Yield to Worst | | | 2.24 | % | | | 2.51 | % | | | 2.37 | % | |
Performance Details (six months)
The last six months have been challenging for fixed income portfolio managers and the value of looking at your downside risk first was paramount. The Fund's performance was mixed during this period. Within the Collateralized Mortgage Obligations (CMO2) portion of the portfolio we had two sectors that were positive in total return and two that were negative. The Interest Only (IO) securities did very well during this rising interest rate period. Our allocation to the short duration bonds backed by non-performing mortgage loans also contributed to the performance given that the returns of that investment are not driven by changes in interest rates, but rather by resolution of the default through modification or disposition of the home. On the negative side, our holdings of 30-year amortization jumbo conforming loans produced a negative return during the period. We constructed a bond that would perform well in a falling interest rate environment and counteract the underperformance that
1 Yield to worst is the lowest possible yield on a callable bond. As of September 30, 2013, SEC yield for FPA New Income Fund was 3.16%.
2 CMO is Collateralized Mortgage Obligation. It is a mortgage-backed, investment-grade bond that separates mortgage pools into different maturity classes.
2
FPA NEW INCOME, INC.
LETTER TO SHAREHOLDERS (Continued)
would occur in our IO holdings in that type of scenario. However, these bonds performed even worse than we expected when interest rates rose. The other area of underperformance came from our holdings of bonds backed by 30-year relocation mortgage loans. While these bonds reacted negatively to the increase in the yield of the 10-year Treasury, we are comfortable that from a structural perspective they remain short duration bonds. This is due to the nature of the bonds where, as the loans age, the borrower will be transferred to another location and thus pays off the loan. The bond's cash flow structure is such that it receives all principal and interest payments first before others in the securitization and will only have an average life of around 3 years if it performs as expected. To date, the bonds are on track for just such an average life.
While the CMO portion of the portfolio had its challenges, the corporate holdings did very well providing solid positive performance for the period. This area was the largest contributor to overall portfolio performance over the past six months. The Commercial Mortgage-Backed Securities (CMBS3) sector of the portfolio was also a positive contributor.
Market Outlook: U.S. Fiscal Policy Cast Adrift, Year by Year
The Presidential and Congressional elections of 2012 did not appreciably revamp the political landscape. Just as prior to the election, Congress remains split between a Republican House and a Democratic Senate and Presidency. One distinct change has been the President's approval rating, which dropped from 57% to 44% since the election, according to recent Gallup presidential approval ratings. 2013 was a prime moment for all parties to unite behind creating a long-term sustainable fiscal policy for the country. Instead, we arrived at the last week of the fiscal year with the parties unable to pass a budget for 2014 or settle on a debt plan, so the government temporarily shut down. Thus, the nation lurches from one short-term fix to another while uncertainty prevails. An illustration of the uncertainty (and of Congress's inability to compromise) is the fact that while the House of Representatives has passed budgets in 2010, 2011, and 2012, the Senate has neither ratified those budgets nor passed one of its own. Those years' only real achievement from a fiscal perspective was a partial revenue solution through an increase in the individual tax rates, and the re-establishment of the full social security withholding tax. This has helped to reduce the annual Federal deficit from over one trillion dollars to an estimated $642 billion this year (according to the Congressional Budget Office).
2014 is an election year for one third of the Senate and the entire House. Both sides are deeply determined that only their ideas will work and that the other side is evil. For this reason, we anticipate nothing in 2014 in the way of true compromise. Rather, each side will pound away on its public relations plan hoping to convince the electorate that their solutions are uniquely correct. The upshot: until the first Tuesday in November 2014, nothing permanent will be put in place. What's more, as the sides drift further from the middle, compromise becomes that much more difficult. Polarized America: The Dance of Ideology and Unequal Riches by Nolan McCarty, Keith T. Poole, and Howard Rosenthal (The MIT Press: 2008) examines Congressional voting patterns since 1879 and concludes that not since the end of the Civil War has Congress been as polarized as it is today.
2015 is probably the first potential year for a compromise in our fiscal policy plan, however this depends on the 2014 election result. If Democrats gain control of the House they would dominate the legislative process and implement their vision of the fiscal future. If 2009 and 2010 is any indication (Democrats controlled both houses of Congress and the Presidency), results may be mixed. The only major legislation was the Affordable
3 CMBS is Commercial Mortgage Backed Security. It is a mortgage-backed security backed by commercial mortgages rather than residential mortgages.
3
FPA NEW INCOME, INC.
LETTER TO SHAREHOLDERS (Continued)
Care Act which at this writing is encountering implementation difficulties. If Republicans remain in control of the House and gain control of the Senate it would then fall to the President to compromise. To date, those two sides have not worked very well together. For these reasons neither outcome bodes well, in our view, for a long-term solution. If politics remain as polarized as now, we see more reason to doubt a better outcome.
That brings us to 2016, the next presidential election. Because the incumbent cannot run, it's highly uncertain who will be the presidential candidates — from either political party. We expect nothing in the way of a long-term fiscal solution during the election process. That means the next solid opportunity for the Federal government to find a solution that incorporates spending and taxes is 2017.
What we therefore anticipate is a continuation of short-term fixes, uncertain long-term spending policy, tax policy and regulatory policy for the coming three and one-quarter years. Similarly, we believe the Federal debt will continue to rise, the debt-to-GDP4 ratio will increase, and continued sluggish growth is likely. Federal Reserve monetary policy could continue to attempt to counteract this fiscal policy uncertainty with a very accommodative stance via ZIRP (zero interest rate policy) and QE (quantitative easing).
How has the lack of a long-term fiscal solution manifested itself in the broader economy? We have commented in the past on employment growth, household wealth and wage growth. How have the actions of the Federal government impacted these areas? The Fed's QE policy, as we have repeatedly pointed out, aims at increasing asset prices in hopes that wealthier households will spend more, resulting in increased corporate revenue and earnings feeding back to higher asset prices, i.e., Fed Chairman Bernanke's so-called virtuous cycle. With GDP growth levels flat to down over the past three years, it seems that this stimulus has yet to kick in. We contend that the wealthiest 25% of households have benefited from this policy but the middle 50% have not. Why is that? Three major indicators lead us to conclude that the middle class has not participated in the virtuous cycle of employment growth, wage growth/income growth, and net worth.
First, while the reported unemployment rate has declined from a peak of 10% in November 2009 to 7.3% as of August 2013, the labor participation rate has also declined from 65% to 63.2%. Part-time employment remains at an elevated level considering that the recession ended more than three years ago. This is the slowest employment growth during an economic expansion since the end of World War II.
Second, incomes have not kept up with inflation. Median household income at year end 2012 was $51,017 compared to $55,627 at the end of 2007.
This contrasts with the third point — household net worth being at an all-time high. The major contributor here is the rise in housing prices over the past two years by about 13% on a national level, according to the Federal Housing Finance Agency. The rise in the S&P 5005 of 33.8% over the past two years contributed as well. Both items fall on the asset side of the wealth equation and skew in favor of wealthier households. On the liability side of the ledger, household debt has declined since the beginning of 2008. The bulk of this decline has come from a decline in mortgage debt by $1.3 trillion with credit card debt declining as well. Counteracting these two elements of debt is the expansion of student loan debt by over $527 billion since the beginning of 2009. The
4 GDP is the Gross Domestic Product, which is the total market value of all final goods and services produced in a country in a given year, equal to total consumer, investment and government spending, plus the value of exports, minus the value of imports.
5 S&P 500 Index includes a representative sample of 500 leading companies in leading industries of the U.S. economy. The index focuses on the large-cap segment of the market, with over 80% coverage of U.S. equities, but is also considered a proxy for the total market. These indices do not reflect any commissions or fees which would be incurred by an investor purchasing the stocks it represents. The performance of the Fund and of the indices is computed on a total return basis which includes reinvestment of all distributions. It is not possible to invest in an index.
4
FPA NEW INCOME, INC.
LETTER TO SHAREHOLDERS (Continued)
chart below from Stone & McCarthy Research Associates uses the latest Federal Reserve flow of funds data to illustrate how the combination of a decline in mortgage debt and increase in real estate assets has contributed heavily to the increase in household wealth.
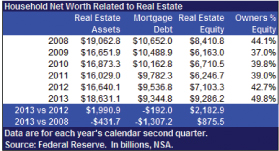
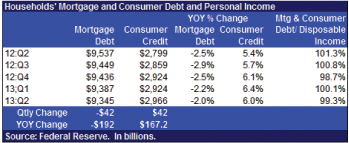
Whereas the mortgage component has been a positive contributor, non-mortgage consumer debt has increased, limiting the growth in household wealth as the data from the same Federal Reserve Flow of Funds data shows.
One other debt item, while still small, has started to reemerge in the past year: cash out refinancing. With house prices recovering, fewer households are underwater on their mortgages. At its peak, about 25% of households owed more on their homes than their houses were worth. Today, that percentage has fallen to around
5
FPA NEW INCOME, INC.
LETTER TO SHAREHOLDERS (Continued)
14.5%. The chart below using the Core Logic data from a recent Stone & McCarthy Research Associates report illustrates this dramatic change in negative equity.
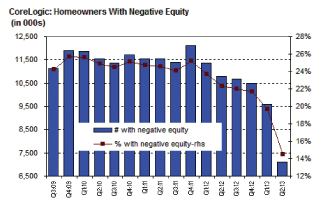
Combine this decline with the 30-year fixed mortgage rate at its lowest level in history and it is not surprising to see this type of refinance option reappear. Using data compiled by Federal Home Loan Mortgage Corporation (FHLMC) from second quarter of 2012, 12% of all their refinance loans were classified as cash out. One year later, that percentage increased to 15%.
What is emerging, in our view, is a household that may be borrowing to maintain a lifestyle or supplement what current income cannot provide. Dare we recall that this kind of activity by consumers pre-dated the last recession? The new borrowing, by the way, is not being provided by the private sector but through the government, either via student loan programs or federally guaranteed mortgages. Without government sponsorship we suspect there would be substantially less of this type of borrowing. The failure of fiscal policy to craft a long-term solution to the government's financial situation is a significant driver of the economy's inability to grow at a pace sufficient to create employment opportunities that, in turn, would allow middle class households to increase their standard of living.
Investors face a Treasury yield curve that is steep by historical standards. That is, the difference in yield between short maturity and long maturity bonds is quite large. As an example, over the past 60 years the median difference in yield between a 1-year maturity Treasury note and a 10-year Treasury note has been 0.84%. At the end of this quarter the yield spread stood at 2.54%. Real GDP for the same period increased at a median level of 3.1% but today is only growing at a 2.5% rate. The median unemployment rate has been 5.7% over the same 60-year period but today stands at 7.3%. These subpar outcomes are occurring at a time when total debt-to-GDP
6
FPA NEW INCOME, INC.
LETTER TO SHAREHOLDERS (Continued)
is at an elevated level. That is, the economy is highly levered but its growth is less robust than in the past. Without either an increase in growth or a reduction in debt, we believe the longer term outcome is worrisome. At some point, the Federal Government needs to step forward and put a long-term fiscal policy plan in place that will lead to better growth and smaller debt as a percentage of GDP. Unfortunately, for the reasons noted earlier, we fear that objective will not be achievable until 2017 at the earliest.
Path forward for portfolio
So, in this exceedingly uncertain environment, how have we acted to deploy capital? In 2009 we established the following criteria for the type of fixed income security that we felt would perform well in this type of environment. Four years later, these criteria still guide our screening process for the portfolio. We seek opportunities in securities with the following characteristics:
• Secured by an asset that is critical to the business or individual
• Have ability to accurately value the collateral asset
• Have a first lien on the asset
• Issuer/borrower has capital at risk
• Five year or less average life or maturity
We have found securities meeting these criteria primarily in the structured products portion of the bond market, specifically bonds backed by automobile loans, commercial insurance premiums, shipping containers, single family mortgages and commercial property mortgages. That is why our portfolio allocation to structured product securities is at historically high levels. Barring a significant change in yields, we continue to manage the portfolio to an effective duration of 1-2 years. From a quality perspective, a maximum of 20-25% of the portfolio will be A-rated and below. The investment team feels confident that through diligent research and execution we can continue to meet these criteria and meet our desired objectives.
Why the third quarter dividend?
The portfolio was able to declare a 12-cent dividend this quarter. The Fund's exposure to interest-only securities was approximately 13%. The rapid rise in both the 5-year and 10-year Treasuries over the quarter had a profound negative impact on the ability of mortgage borrowers to refinance their loans. This resulted in the prepayment speeds on these mortgages declining a significant amount. Thus, the stream of income produced by these interest-only securities was higher than previously experienced. From an accounting perspective, the Fund must amortize down the notional amount of the interest-only security over an estimated average life. This amortization offsets the income generated by the security. During the quarter, this amortization was diminished by the increase in interest rates and decline in refinancing activity. We expect that this is more of a one-time event and that the dividend rate will return to level more in line with that of the recent past.
In closing, we are proud to announce the addition of another professional to our team, Nazanin Pajoom. Nazanin has a double undergraduate degree from the University of California, Berkeley in computer science and electrical engineering, and currently she is obtaining a Masters degree in financial engineering from the University of Southern California this fall. She also spent some time working for Texas Instruments. Her primary role for the team will be to efficiently organize our portfolio analytical data, the financial information on all or our securitized product holdings, and assist in mining that data for prime investment opportunities and financial performance.
7
FPA NEW INCOME, INC.
LETTER TO SHAREHOLDERS (Continued)
On behalf of the entire FPA fixed-income team, we thank you for the continued trust that you place in us to preserve and prudently grow your capital.
Respectfully submitted,

Thomas H. Atteberry
Chief Executive Officer and Portfolio Manager
October 21, 2013
The discussion of Fund investments represents the views of the Fund's managers at the time of this report and is subject to change without notice. References to individual securities are for informational purposes only and should not be construed as recommendations to purchase or sell individual securities.
FORWARD LOOKING STATEMENT DISCLOSURE
As mutual fund managers, one of our responsibilities is to communicate with shareholders in an open and direct manner. Insofar as some of our opinions and comments in our letters to shareholders are based on current management expectations, they are considered "forward-looking statements" which may or may not be accurate over the long term. While we believe we have a reasonable basis for our comments and we have confidence in our opinions, actual results may differ materially from those we anticipate. You can identify forward-looking statements by words such as "believe," "expect," "may," "anticipate," and other similar expressions when discussing prospects for particular portfolio holdings and/or the markets, generally. We cannot, however, assure future results and disclaim any obligation to update or alter any forward-looking statements, whether as a result of new information, future events, or otherwise. Further, information provided in this report should not be construed as a recommendation to purchase or sell any particular security.
8
FPA NEW INCOME, INC.
HISTORICAL PERFORMANCE
(Unaudited)
Change in Value of a $10,000 Investment in FPA New Income, Inc. vs. Barclays U.S. Aggregate Index and Consumer Price Index + 100 Basis Points from October 1, 2003 to September 30, 2013
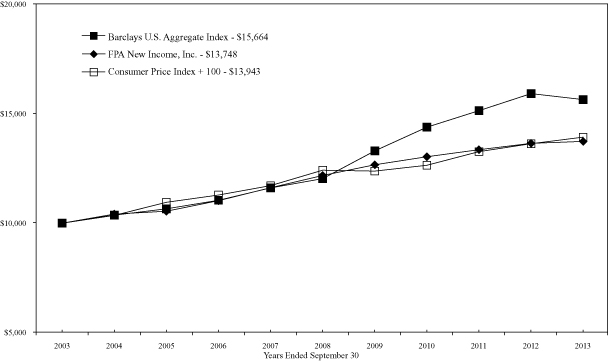
Past performance is not indicative of future performance. The Barclays U.S. Aggregate Bond Index a broad-based unmanaged composite of four major subindexes: U.S. Government Index; U.S. Credit Index; U.S. Mortgage-Backed Securities Index; and U.S. Asset-Backed Securities Index. The index holds investment quality bonds. The Consumer Price Index is an unmanaged index representing the rate of inflation of U.S. consumer prices as determined by the US Department of Labor Statistics. The performance of the Fund and of the Averages is computed on a total return basis which includes reinvestment of all distributions.
Past performance is no guarantee of future results and current performance may be higher or lower than the performance shown. This data represents past performance and investors should understand that investment returns and principal values fluctuate, so that when you redeem your investment may be worth more or less than its original cost. Current month-end performance data can be obtained by visiting the website at www.fpafunds.com or by calling toll-free, 1-800-982-4372. Information regarding the Fund's expense ratio and redemption fees can be found on pages 31 and 34.
The Prospectus details the Fund's objective and policies, sales charges, and other matters of interest to prospective investors. Please read the prospectus carefully before investing. The Prospectus may be obtained by visiting the website at www.fpafunds.com, by email at crm@fpafunds.com, toll-free by calling 1-800-982-4372 or by contacting the Fund in writing.
9
FPA NEW INCOME, INC.
PORTFOLIO SUMMARY
September 30, 2013 (Unaudited)
Bonds & Debentures | | | | | 96.5 | % | |
Commercial Mortgage-Backed | |
Agency Stripped | | | 10.3 | % | | | | | |
Non-Agency | | | 3.8 | % | | | | | |
Agency | | | 3.0 | % | | | | | |
Residential Mortgage-Backed | |
Agency Pool Fixed Rate | | | 11.7 | % | | | | | |
Agency Collateralized Mortgage
Obligation | | | 21.1 | % | | | | | |
Non-Agency Collateralized
Mortgage Obligation | | | 10.8 | % | | | | | |
Agency Stripped | | | 2.8 | % | | | | | |
Agency Pool Adjustable Rate | | | 0.0 | % | | | | | |
Asset-Backed | |
Auto | | | 6.1 | % | | | | | |
Other | | | 6.5 | % | | | | | |
U.S. Treasuries | | | 12.9 | % | | | | | |
Corporate | | | 5.2 | % | | | | | |
Corporate Bank Debt | | | 2.3 | % | | | | | |
Short-Term Investments | | | | | 4.1 | % | |
Other Assets and Liabilities, net | | | | | 0.6 | % | |
Net Assets | | | | | 100.0 | % | |
MAJOR PORTFOLIO CHANGES
For the Six Months Ended September 30, 2013
NET PURCHASES | |
| Bonds & Debentures | | Coupon
Rate (%) | | Maturity
Date | | Principal
Amount | |
U.S Treasury Note (1) | | | 0.2500 | | | 3/31/14 | | $ | 150,000,000 | | |
Credit Suisse Mortgage Trust 2013-6 1A1(1) | | | 2.5000 | | | 8/25/43 | | $ | 95,566,180 | | |
Federal National Mortgage Association 2013-66 CL JA (1) | | | 2.2500 | | | 7/25/43 | | $ | 81,331,693 | | |
U.S Treasury Note (1) | | | 0.2500 | | | 4/30/14 | | $ | 75,000,000 | | |
U.S Treasury Note (1) | | | 0.7500 | | | 12/15/13 | | $ | 75,000,000 | | |
U.S Treasury Note (1) | | | 1.8750 | | | 2/28/14 | | $ | 75,000,000 | | |
U.S Treasury Note (1) | | | 1.2500 | | | 3/15/14 | | $ | 70,000,000 | | |
Federal National Mortgage Association 2011-125 GE (1) | | | 2.5000 | | | 12/25/41 | | $ | 60,102,740 | | |
NET SALES | |
| Bonds & Debentures | | Coupon
Rate (%) | | Maturity
Date | | Principal
Amount | |
U.S Treasury Note (2) | | | 3.1250 | | | 8/31/13 | | $ | 180,000,000 | | |
Federal National Mortgage Association AB7141 (2) | | | 2.5000 | | | 12/1/27 | | $ | 60,825,073 | | |
U.S Treasury Note (2) | | | 3.1250 | | | 9/30/13 | | $ | 50,000,000 | | |
U.S Treasury Note (2) | | | 0.3750 | | | 7/31/13 | | $ | 50,000,000 | | |
(1) Indicates new commitment to portfolio
(2) Indicates elimination from portfolio
10
FPA NEW INCOME, INC.
PORTFOLIO OF INVESTMENTS
September 30, 2013
BONDS & DEBENTURES | | Coupon
Rate (%) | | Maturity
Date | | Principal
Amount | | Fair
Value | |
COMMERCIAL MORTGAGE-BACKED
SECURITIES AGENCY STRIPPED — 10.3% | | | |
Government National Mortgage Association | |
2002-56 | | | 0.0425 | | | 06/16/2042 | | $ | 277,174 | | | $ | 452 | | |
2004-10 | | | 0.0802 | | | 1/16/2044 | | | 44,746,968 | | | | 25,953 | | |
2008-45 | | | 0.1573 | | | 2/16/2048 | | | 41,971,874 | | | | 718,978 | | |
2010-63 | | | 0.2012 | | | 5/16/2050 | | | 44,704,489 | | | | 1,201,210 | | |
2010-18 | | | 0.2320 | | | 1/16/2050 | | | 63,911,647 | | | | 1,917,349 | | |
2008-48 | | | 0.2557 | | | 4/16/2048 | | | 20,798,695 | | | | 701,956 | | |
2009-119 | | | 0.3138 | | | 12/16/2049 | | | 118,799,909 | | | | 3,628,149 | | |
2006-30 | | | 0.3407 | | | 5/16/2046 | | | 12,038,972 | | | | 491,792 | | |
2004-43 | | | 0.3421 | | | 6/16/2044 | | | 52,476,724 | | | | 1,054,782 | | |
2008-24 | | | 0.3448 | | | 11/16/2047 | | | 17,847,958 | | | | 457,979 | | |
2008-8 | | | 0.3454 | | | 11/16/2047 | | | 38,938,035 | | | | 997,203 | | |
2011-10 | | | 0.3873 | | | 12/16/2045 | | | 84,208,029 | | | | 2,885,809 | | |
2005-9 | | | 0.3960 | | | 1/16/2045 | | | 8,808,213 | | | | 181,714 | | |
2006-55 | | | 0.4050 | | | 8/16/2046 | | | 38,161,796 | | | | 1,173,475 | | |
2007-77 | | | 0.4092 | | | 11/16/2047 | | | 56,227,291 | | | | 1,926,347 | | |
2008-78 | | | 0.4959 | | | 7/16/2048 | | | 23,870,680 | | | | 1,011,878 | | |
2009-105 | | | 0.5007 | | | 11/16/2049 | | | 36,190,563 | | | | 1,490,689 | | |
2013-72 | | | 0.5263 | | | 11/16/2047 | | | 546,296,767 | | | | 34,652,861 | | |
2004-108 | | | 0.5778 | | | 12/16/2044 | | | 19,463,830 | | | | 515,986 | | |
2010-49 | | | 0.5831 | | | 2/16/2050 | | | 81,330,838 | | | | 2,615,600 | | |
2009-86 | | | 0.5928 | | | 9/16/2049 | | | 71,109,224 | | | | 2,288,295 | | |
2008-92 | | | 0.6005 | | | 10/16/2048 | | | 50,681,019 | | | | 2,201,583 | | |
2013-35 | | | 0.6542 | | | 1/16/2053 | | | 365,841,024 | | | | 24,260,016 | | |
| 2010-161 IA | | | 0.6810 | | | 12/16/2050 | | | 241,354,420 | | | | 9,086,994 | | |
2010-28 | | | 0.7364 | | | 3/1/2050 | | | 83,900,716 | | | | 3,106,844 | | |
2013-7 | | | 0.7391 | | | 5/16/2053 | | | 132,452,409 | | | | 9,963,176 | | |
2011-6 | | | 0.7652 | | | 10/16/2052 | | | 211,580,926 | | | | 8,992,189 | | |
2009-4 | | | 0.7857 | | | 1/16/2049 | | | 51,123,501 | | | | 2,036,249 | | |
2010-123 | | | 0.8103 | | | 9/16/2050 | | | 61,748,085 | | | | 3,045,416 | | |
| 2011-64 IX | | | 0.8221 | | | 10/16/2044 | | | 73,774,279 | | | | 4,207,347 | | |
2009-49 | | | 0.8258 | | | 6/16/2049 | | | 53,276,012 | | | | 2,086,821 | | |
2013-29 | | | 0.8279 | | | 5/16/2053 | | | 129,044,398 | | | | 9,542,949 | | |
2012-125 | | | 0.8547 | | | 2/16/2053 | | | 205,124,650 | | | | 15,120,476 | | |
2009-60 | | | 0.8575 | | | 7/16/2049 | | | 83,091,743 | | | | 3,149,177 | | |
2012-112 | | | 0.8690 | | | 10/16/2053 | | | 476,776,948 | | | | 33,614,253 | | |
2012-100 | | | 0.8902 | | | 2/16/2053 | | | 156,950,441 | | | | 11,447,651 | | |
2013-1 | | | 0.9093 | | | 2/16/2054 | | | 141,007,182 | | | | 12,207,753 | | |
2013-80 | | | 0.9192 | | | 3/16/2052 | | | 65,398,058 | | | | 5,645,468 | | |
11
FPA NEW INCOME, INC.
PORTFOLIO OF INVESTMENTS (Continued)
September 30, 2013
BONDS & DEBENTURES — Continued | | Coupon
Rate (%) | | Maturity
Date | | Principal
Amount | | Fair
Value | |
2012-131 | | | 0.9269 | | | 2/16/2053 | | $ | 113,448,486 | | | $ | 9,636,439 | | |
2009-30 | | | 0.9292 | | | 3/16/2049 | | | 14,268,714 | | | | 722,140 | | |
2009-71 | | | 0.9406 | | | 7/16/2049 | | | 77,811,656 | | | | 2,717,183 | | |
2013-13 | | | 0.9457 | | | 7/16/2047 | | | 108,387,964 | | | | 7,878,439 | | |
2013-125 | | | 0.9534 | | | 10/16/2054 | | | 27,020,587 | | | | 1,669,310 | | |
2012-150 | | | 0.9536 | | | 11/16/2052 | | | 100,687,726 | | | | 8,217,750 | | |
2011-16 | | | 0.9617 | | | 9/16/2046 | | | 115,699,214 | | | | 6,210,734 | | |
2013-30 | | | 0.9859 | | | 9/16/2053 | | | 234,264,611 | | | | 18,534,641 | | |
2012-9 | | | 1.0144 | | | 11/16/2052 | | | 176,222,919 | | | | 18,447,015 | | |
2012-114 | | | 1.0303 | | | 1/16/2053 | | | 172,065,141 | | | | 16,265,111 | | |
2012-58 | | | 1.0312 | | | 1/16/2055 | | | 235,893,476 | | | | 19,442,340 | | |
2012-35 | | | 1.0332 | | | 11/16/2052 | | | 150,327,231 | | | | 10,943,898 | | |
2012-95 | | | 1.0397 | | | 2/16/2053 | | | 146,400,436 | | | | 12,446,262 | | |
2013-61 | | | 1.0457 | | | 5/16/2053 | | | 160,066,517 | | | | 12,896,335 | | |
2011-49 | | | 1.0479 | | | 4/16/2045 | | | 78,415,470 | | | | 4,396,756 | | |
2012-79 | | | 1.0505 | | | 3/16/2053 | | | 147,735,703 | | | | 11,758,285 | | |
2011-165 | | | 1.0565 | | | 10/16/2051 | | | 253,317,058 | | | | 14,388,409 | | |
2012-45 | | | 1.0640 | | | 4/16/2053 | | | 35,237,029 | | | | 2,845,989 | | |
2012-85 | | | 1.0679 | | | 9/16/2053 | | | 123,713,018 | | | | 10,629,324 | | |
2013-45 | | | 1.0774 | | | 12/16/2040 | | | 128,105,547 | | | | 9,023,973 | | |
2011-143 | | | 1.0918 | | | 4/16/2053 | | | 98,749,671 | | | | 14,226,865 | | |
2012-25 | | | 1.0959 | | | 8/16/2052 | | | 122,228,194 | | | | 9,005,077 | | |
| 2010-148 IX | | | 1.1133 | | | 10/16/2052 | | | 70,303,253 | | | | 4,004,473 | | |
2011-120 | | | 1.1384 | | | 12/16/2043 | | | 120,303,149 | | | | 14,228,253 | | |
| 2011-78 IX | | | 1.2147 | | | 8/16/2046 | | | 161,094,087 | | | | 10,535,553 | | |
2011-149 | | | 1.2287 | | | 10/16/2046 | | | 143,584,672 | | | | 11,195,297 | | |
2011-164 | | | 1.3458 | | | 4/16/2046 | | | 174,466,971 | | | | 12,095,795 | | |
| 2011-92 IX | | | 1.3714 | | | 11/16/2044 | | | 35,074,741 | | | | 2,584,307 | | |
2012-4 | | | 1.4934 | | | 5/16/2052 | | | 277,566,733 | | | | 20,732,126 | | |
TOTAL AGENCY STRIPPED | | | | $517,330,898 | |
NON-AGENCY — 3.8% | | | |
Banc of America Large Loan 2010-HLTN† | | | 2.4820 | | | 11/15/2015 | | $ | 15,362,803 | | | $ | 15,371,867 | | |
Del Coronado Trust 2013-HDMZ CL M† | | | 5.1830 | | | 3/15/2018 | | | 6,823,000 | | | | 6,853,530 | | |
GS Mortgage Securities Corporation II
2007-EOP A3† | | | 1.4563 | | | 3/6/2020 | | | 15,803,078 | | | | 15,810,822 | | |
JP Morgan Clearing Corporation
2011-FL1 MH† | | | 4.4720 | | | 7/15/2028 | | | 20,000,000 | | | | 19,706,600 | | |
Lehman Brothers Floating Rate Commercial
2007-LLFA F† | | | 1.1823 | | | 6/15/2022 | | | 12,924,000 | | | | 12,323,034 | | |
12
FPA NEW INCOME, INC.
PORTFOLIO OF INVESTMENTS (Continued)
September 30, 2013
BONDS & DEBENTURES — Continued | | Coupon
Rate (%) | | Maturity
Date | | Principal
Amount | | Fair
Value | |
LSTAR Commercial Mortgage Trust
2001-1 A† | | | 3.9129 | | | 7/25/2017 | | $ | 3,653,466 | | | $ | 3,683,278 | | |
Motel 6 Trust | |
| 2012-MTL6 D† | | | 3.7812 | | | 10/5/2017 | | | 37,033,000 | | | | 36,700,084 | | |
| 2012-MTL6 E† | | | 4.2743 | | | 10/5/2017 | | | 10,061,000 | | | | 9,695,659 | | |
Ores NPL LLC 2013-LV2 CL A† | | | 3.0810 | | | 9/25/2025 | | | 29,794,444 | | | | 29,803,382 | | |
RREF 2012 LT1 LLC 2013-LT2 CL A† | | | 2.8331 | | | 5/22/2028 | | | 17,007,818 | | | | 17,007,818 | | |
Starwood Commercial Mortgage Trust
2013-FV1 CL B† | | | 2.1819 | | | 8/11/2028 | | | 18,051,000 | | | | 18,067,607 | | |
Washington Mutual Commercial Mortgage
Series Trust 2007-SL2 CL A † | | | 5.4268 | | | 12/27/2049 | | | 8,326,062 | | | | 8,292,674 | | |
TOTAL NON-AGENCY | | | | $193,316,355 | |
AGENCY — 3.0% | | | |
Government National Mortgage Association | |
| 2012-22 CL AB | | | 1.6610 | | | 2/1/2026 | | $ | 7,121,734 | | | $ | 7,120,262 | | |
| 2011-49 CL AB | | | 2.8000 | | | 4/16/2034 | | | 28,026,623 | | | | 28,484,578 | | |
| 2009-49 CL B | | | 3.4360 | | | 6/16/2034 | | | 2,936 | | | | 2,935 | | |
| 2011-120 CL A | | | 3.9284 | | | 8/16/2033 | | | 43,227,684 | | | | 44,489,932 | | |
| 2007-12 CL A | | | 3.9570 | | | 6/16/2031 | | | 26,492 | | | | 26,498 | | |
| 2011-143 CL AB | | | 3.9739 | | | 3/16/2033 | | | 45,287,674 | | | | 46,616,867 | | |
| 2007-34 CL B | | | 4.5790 | | | 12/16/2031 | | | 13,284,909 | | | | 13,385,182 | | |
| 2007-75 CL B | | | 5.0548 | | | 3/16/2036 | | | 91,700 | | | | 91,821 | | |
| 2006-8 CL C | | | 5.3130 | | | 2/16/2036 | | | 10,334,467 | | | | 10,546,944 | | |
TOTAL AGENCY | | | | $150,765,019 | |
RESIDENTIAL MORTGAGE-BACKED
SECURITIES AGENCY POOL FIXED RATE
MORTGAGES — 11.7% | | | |
Federal Home Loan Mortgage Corporation | |
J18815 | | | 3.0000 | | | 4/1/2022 | | $ | 22,396,369 | | | $ | 23,356,089 | | |
J19188 | | | 3.0000 | | | 5/1/2022 | | | 19,095,092 | | | | 19,937,216 | | |
G14462 | | | 3.0000 | | | 5/1/2022 | | | 16,633,256 | | | | 17,205,675 | | |
J19459 | | | 3.0000 | | | 6/1/2022 | | | 17,623,000 | | | | 18,400,202 | | |
J12954 | | | 3.5000 | | | 9/1/2020 | | | 4,199,990 | | | | 4,454,635 | | |
J13919 | | | 3.5000 | | | 12/1/2020 | | | 23,903,819 | | | | 25,251,210 | | |
G14025 | | | 4.0000 | | | 12/1/2025 | | | 25,158,217 | | | | 26,766,330 | | |
J11204 | | | 4.5000 | | | 11/1/2019 | | | 6,253,710 | | | | 6,657,137 | | |
E01322 | | | 5.0000 | | | 3/1/2018 | | | 5,791,656 | | | | 6,150,970 | | |
G13091 | | | 5.0000 | | | 6/1/2018 | | | 2,728,840 | | | | 2,909,899 | | |
13
FPA NEW INCOME, INC.
PORTFOLIO OF INVESTMENTS (Continued)
September 30, 2013
BONDS & DEBENTURES — Continued | | Coupon
Rate (%) | | Maturity
Date | | Principal
Amount | | Fair
Value | |
E01642 | | | 5.0000 | | | 5/1/2019 | | $ | 4,102,927 | | | $ | 4,375,156 | | |
G13812 | | | 5.0000 | | | 12/1/2020 | | | 9,466,127 | | | | 10,094,205 | | |
G14187 | | | 5.5000 | | | 12/1/2020 | | | 15,902,661 | | | | 17,036,839 | | |
G12139 | | | 6.5000 | | | 9/1/2019 | | | 1,333,261 | | | | 1,364,766 | | |
A26942 | | | 6.5000 | | | 9/1/2034 | | | 632,907 | | | | 701,596 | | |
G08107 | | | 6.5000 | | | 1/1/2036 | | | 2,398,253 | | | | 2,659,759 | | |
P50543 | | | 6.5000 | | | 4/1/2037 | | | 144,135 | | | | 159,967 | | |
Federal National Mortgage Association | |
890429 | | | 3.0000 | | | 5/1/2022 | | | 43,399,051 | | | | 45,397,781 | | |
AP4062 | | | 3.0000 | | | 8/1/2022 | | | 30,065,195 | | | | 31,506,211 | | |
MA0629 | | | 3.5000 | | | 1/1/2021 | | | 47,987,714 | | | | 50,827,613 | | |
MA0905 | | | 3.5000 | | | 11/1/2021 | | | 14,695,040 | | | | 15,564,688 | | |
MA0989 | | | 3.5000 | | | 2/1/2022 | | | 40,602,570 | | | | 43,190,984 | | |
MA1019 | | | 3.5000 | | | 3/1/2022 | | | 43,123,395 | | | | 45,702,377 | | |
932433 | | | 4.0000 | | | 1/1/2020 | | | 876,620 | | | | 932,654 | | |
AA0905 | | | 4.5000 | | | 1/1/2021 | | | 3,550,435 | | | | 3,772,728 | | |
995756 | | | 5.0000 | | | 12/1/2018 | | | 9,827,973 | | | | 10,464,924 | | |
735453 | | | 5.0000 | | | 12/1/2019 | | | 5,251,681 | | | | 5,592,200 | | |
AE0126 | | | 5.0000 | | | 6/1/2020 | | | 13,355,240 | | | | 14,222,529 | | |
995861 | | | 5.0000 | | | 1/1/2021 | | | 10,803,315 | | | | 11,504,450 | | |
890122 | | | 5.0000 | | | 11/1/2021 | | | 4,949,362 | | | | 5,230,882 | | |
890083 | | | 5.0000 | | | 12/1/2021 | | | 5,477,693 | | | | 5,833,688 | | |
AE0792 | | | 5.0000 | | | 1/1/2026 | | | 10,125,130 | | | | 10,781,441 | | |
257100 | | | 5.5000 | | | 1/1/2018 | | | 972,514 | | | | 1,023,843 | | |
745500 | | | 5.5000 | | | 12/1/2018 | | | 7,319,422 | | | | 7,830,830 | | |
995327 | | | 5.5000 | | | 12/1/2019 | | | 2,513,950 | | | | 2,701,365 | | |
735521 | | | 5.5000 | | | 3/1/2020 | | | 4,495,036 | | | | 4,828,298 | | |
995284 | | | 5.5000 | | | 3/1/2020 | | | 9,046,418 | | | | 9,665,464 | | |
889318 | | | 5.5000 | | | 7/1/2020 | | | 9,165,253 | | | | 9,754,762 | | |
889069 | | | 5.5000 | | | 1/1/2021 | | | 8,497,854 | | | | 9,116,073 | | |
AE0237 | | | 5.5000 | | | 11/1/2023 | | | 10,246,539 | | | | 10,980,908 | | |
AD0951 | | | 6.0000 | | | 4/1/2021 | | | 9,703,130 | | | | 10,463,370 | | |
745832 | | | 6.0000 | | | 4/1/2021 | | | 18,034,982 | | | | 19,419,347 | | |
890225 | | | 6.0000 | | | 5/1/2023 | | | 9,561,083 | | | | 10,294,992 | | |
323282 | | | 7.5000 | | | 7/1/2028 | | | 365,041 | | | | 420,462 | | |
Government National Mortgage Association | |
782281 | | | 6.0000 | | | 3/15/2023 | | | 4,094,188 | | | | 4,489,693 | | |
TOTAL AGENCY POOL FIXED RATE
MORTGAGES | | | | $588,996,208 | |
14
FPA NEW INCOME, INC.
PORTFOLIO OF INVESTMENTS (Continued)
September 30, 2013
BONDS & DEBENTURES — Continued | | Coupon
Rate (%) | | Maturity
Date | | Principal
Amount | | Fair
Value | |
AGENCY COLLATERALIZED MORTGAGE
OBLIGATION — 21.1% | | | |
Federal Home Loan Bank | |
I7-2014 1 | | | 5.3400 | | | 3/20/2014 | | $ | 14,829,177 | | | $ | 15,122,646 | | |
00-0986 | | | 5.7390 | | | 7/20/2014 | | | 11,338,881 | | | | 11,737,556 | | |
Federal Home Loan Mortgage Corporation | |
| 4097 CL PB | | | 1.7500 | | | 11/15/2040 | | | 22,744,314 | | | | 21,739,334 | | |
| 4151 CL YU | | | 2.0000 | | | 1/15/2043 | | | 25,111,153 | | | | 22,538,573 | | |
| 4125 CL NA | | | 2.5000 | | | 4/15/2042 | | | 26,396,148 | | | | 24,002,809 | | |
| 4141 CL CK | | | 2.5000 | | | 12/15/2042 | | | 3,673,963 | | | | 3,328,012 | | |
| 4144 CL BY | | | 2.5000 | | | 12/15/2042 | | | 23,217,334 | | | | 21,068,535 | | |
| 4153 CL KP | | | 2.5000 | | | 1/15/2043 | | | 22,249,404 | | | | 20,384,394 | | |
| 3829 CL CD | | | 3.0000 | | | 8/15/2024 | | | 3,239,488 | | | | 3,304,634 | | |
| 3806 CL AB | | | 4.0000 | | | 2/15/2023 | | | 4,586,648 | | | | 4,641,550 | | |
| 2869 CL JA | | | 4.0000 | | | 4/15/2034 | | | 382,611 | | | | 384,681 | | |
| 3992 CL H | | | 4.0000 | | | 6/15/2036 | | | 192,404 | | | | 196,700 | | |
| 3877 CL EL | | | 4.0000 | | | 8/15/2038 | | | 8,227,125 | | | | 8,263,982 | | |
| 4088 CL LE | | | 4.0000 | | | 10/15/2040 | | | 16,411,297 | | | | 17,016,669 | | |
| 2877 CL WA | | | 4.2500 | | | 10/15/2034 | | | 3,260,037 | | | | 3,310,274 | | |
| 3578 CL AM | | | 4.5000 | | | 9/15/2016 | | | 3,325,063 | | | | 3,460,726 | | |
| 2914 CL JQ | | | 4.5000 | | | 5/15/2019 | | | 1,059,008 | | | | 1,067,332 | | |
| 3439 CL AC | | | 4.5000 | | | 4/15/2022 | | | 3,289,140 | | | | 3,327,426 | | |
| 3939 CL D | | | 4.5000 | | | 9/15/2041 | | | 3,377,137 | | | | 3,563,989 | | |
| 2509 CL CB | | | 5.0000 | | | 10/15/2017 | | | 3,229,045 | | | | 3,385,395 | | |
| 2602 CL ET | | | 5.0000 | | | 11/15/2017 | | | 365,424 | | | | 366,100 | | |
| 2747 CL DX | | | 5.0000 | | | 2/15/2019 | | | 6,172,416 | | | | 6,626,212 | | |
| 3852 CL HA | | | 5.0000 | | | 12/15/2021 | | | 10,796,359 | | | | 11,548,217 | | |
| 3285 CL LC | | | 5.0000 | | | 8/15/2025 | | | 106,822 | | | | 106,807 | | |
| 2494 CL CF | | | 5.5000 | | | 9/15/2017 | | | 3,459,370 | | | | 3,687,758 | | |
| 2503 CL B | | | 5.5000 | | | 9/15/2017 | | | 3,426,757 | | | | 3,616,908 | | |
| 3808 CL BQ | | | 5.5000 | | | 8/15/2025 | | | 11,357,413 | | | | 12,086,332 | | |
| 3806 CL JB | | | 5.5000 | | | 2/15/2026 | | | 5,276,621 | | | | 5,794,785 | | |
| 3855 CL HQ | | | 5.5000 | | | 2/15/2026 | | | 5,811,474 | | | | 6,235,072 | | |
| 3926 CL GP | | | 6.0000 | | | 8/15/2025 | | | 6,140,605 | | | | 6,490,251 | | |
| 3614 CL DY | | | 6.0000 | | | 1/15/2032 | | | 11,353,648 | | | | 12,588,471 | | |
Federal National Mortgage Association | |
| 2013-64 CL TA | | | 1.5000 | | | 5/1/2032 | | | 13,015,402 | | | | 12,537,268 | | |
| 2013-42 CL QC | | | 1.5000 | | | 5/25/2033 | | | 32,989,100 | | | | 32,247,195 | | |
| 2013-64 CL TZ | | | 1.5000 | | | 3/25/2042 | | | 1,936,716 | | | | 1,927,517 | | |
| 2013-6 CL TA | | | 1.5000 | | | 1/25/2043 | | | 51,961,187 | | | | 50,270,230 | | |
| 2013-30 CL JA | | | 1.5000 | | | 4/25/2043 | | | 20,119,450 | | | | 18,305,696 | | |
15
FPA NEW INCOME, INC.
PORTFOLIO OF INVESTMENTS (Continued)
September 30, 2013
BONDS & DEBENTURES — Continued | | Coupon
Rate (%) | | Maturity
Date | | Principal
Amount | | Fair
Value | |
| 2013-30 CL CA | | | 1.5000 | | | 4/25/2043 | | $ | 30,712,000 | | | $ | 28,129,155 | | |
| 2013-66 CL JA | | | 2.2500 | | | 7/25/2043 | | | 81,331,693 | | | | 80,657,185 | | |
| 2011-125 GE | | | 2.5000 | | | 12/25/2041 | | | 60,102,740 | | | | 59,086,451 | | |
| 2011-110 BH | | | 3.0000 | | | 10/25/2041 | | | 3,561,950 | | | | 3,575,252 | | |
| 2012-73 CL JB | | | 3.5000 | | | 1/25/2042 | | | 41,711,139 | | | | 43,513,039 | | |
| 2012-8 CL LE | | | 3.5000 | | | 2/25/2042 | | | 39,230,993 | | | | 40,923,088 | | |
| 2012-26 CL ME | | | 3.5000 | | | 3/25/2042 | | | 55,605,339 | | | | 57,991,737 | | |
| 2012-41 CL LB | | | 3.5000 | | | 4/25/2042 | | | 51,252,771 | | | | 53,491,215 | | |
| 2012-48 CL MB | | | 3.5000 | | | 5/25/2042 | | | 49,998,080 | | | | 52,136,288 | | |
| 2012-117 CL AD | | | 3.5000 | | | 10/25/2042 | | | 67,816,414 | | | | 70,157,749 | | |
| 2009-68 KA | | | 3.7500 | | | 11/25/2022 | | | 226,245 | | | | 226,535 | | |
| 2011-67 CL EA | | | 4.0000 | | | 7/25/2021 | | | 22,890,914 | | | | 24,182,419 | | |
| 2011-89 CL H | | | 4.0000 | | | 10/25/2038 | | | 3,629,894 | | | | 3,634,648 | | |
| 2011-27 CL JQ | | | 4.0000 | | | 9/25/2039 | | | 15,564,997 | | | | 16,176,135 | | |
| 2012-95 CL AB | | | 4.0000 | | | 11/25/2040 | | | 9,172,475 | | | | 9,382,305 | | |
| 2012-78 CL PA | | | 4.0000 | | | 8/25/2041 | | | 15,066,420 | | | | 15,803,771 | | |
| 2012-97 CL MA | | | 4.0000 | | | 10/25/2041 | | | 12,202,182 | | | | 12,605,211 | | |
| 2012-81 CL Q | | | 4.0000 | | | 8/25/2042 | | | 10,148,060 | | | | 10,619,524 | | |
| 2009-70 CL NU | | | 4.2500 | | | 8/25/2019 | | | 8,115,939 | | | | 8,498,930 | | |
| 2004-90 -CL GA | | | 4.3500 | | | 3/25/2034 | | | 3,180,046 | | | | 3,247,717 | | |
| 2012-67 CL PB | | | 4.5000 | | | 6/1/2027 | | | 11,697,621 | | | | 12,146,693 | | |
| 2012-40 CL GC | | | 4.5000 | | | 12/25/2040 | | | 8,278,635 | | | | 8,553,072 | | |
| 2012-102 CL PA | | | 4.5000 | | | 3/25/2041 | | | 15,311,451 | | | | 16,071,175 | | |
| 2011-148 CL PB | | | 4.5000 | | | 12/25/2041 | | | 9,624,660 | | | | 10,258,768 | | |
| 2003-24 -CL PD | | | 5.0000 | | | 4/25/2018 | | | 3,828,235 | | | | 4,051,459 | | |
| 2008-77 CL DA | | | 5.0000 | | | 4/25/2023 | | | 3,868,419 | | | | 4,036,231 | | |
| 2010-39 CL PL | | | 5.0000 | | | 10/25/2032 | | | 3,975,410 | | | | 4,086,602 | | |
| 2004-60 CL LB | | | 5.0000 | | | 4/25/2034 | | | 10,156,709 | | | | 11,109,916 | | |
| 2003-W17 CL 1A5 | | | 5.3500 | | | 8/25/2033 | | | 3,722,314 | | | | 3,811,314 | | |
| 2011-19 CL WB | | | 5.5000 | | | 10/25/2018 | | | 8,773,359 | | | | 9,458,120 | | |
| 2009-116 CL PA | | | 5.5000 | | | 4/25/2024 | | | 5,347,701 | | | | 5,611,877 | | |
| 2002-9 CL PC | | | 6.0000 | | | 3/25/2017 | | | 3,410,715 | | | | 3,608,843 | | |
TOTAL AGENCY COLLATERALIZED
MORTGAGE OBLIGATION | | | | $1,063,122,460 | |
NON-AGENCY COLLATERALIZED
MORTGAGE OBLIGATION — 10.8% | | | |
Bayview Opportunity Master Fund Trust | |
| 2012-4NPL CL A† | | | 3.4747 | | | 7/28/2032 | | $ | 4,093,175 | | | $ | 4,098,414 | | |
| 2013-2RPL CL A† | | | 3.4721 | | | 3/28/2016 | | | 7,612,372 | | | | 7,464,685 | | |
| 2013-4RPL CL A† | | | 4.4583 | | | 7/28/2018 | | | 22,843,184 | | | | 22,830,250 | | |
16
FPA NEW INCOME, INC.
PORTFOLIO OF INVESTMENTS (Continued)
September 30, 2013
BONDS & DEBENTURES — Continued | | Coupon
Rate (%) | | Maturity
Date | | Principal
Amount | | Fair
Value | |
| 2013-13NP CL A† | | | 3.7210 | | | 6/28/2033 | | $ | 13,653,327 | | | $ | 13,322,234 | | |
| 2013-14NP CL A† | | | 4.2130 | | | 8/28/2033 | | | 33,915,959 | | | | 33,831,169 | | |
Citicorp Mortgage Securities Inc.
2005-5 CL 2A3 | | | 5.0000 | | | 8/25/2020 | | | 238,117 | | | | 242,237 | | |
Credit Suisse Mortgage Trust 2013-6 1A1† | | | 2.5000 | | | 8/25/2043 | | | 95,566,180 | | | | 93,901,054 | | |
JP Morgan Mortgage Trust 2013-1 CL 2A2† | | | 2.5000 | | | 3/1/2043 | | | 40,690,798 | | | | 39,480,442 | | |
Normandy Mortgage Loan Trust 2013-NPL3 A† | | | 4.9486 | | | 9/16/2043 | | | 35,972,832 | | | | 35,972,832 | | |
Riverview HECM Trust 2007-1 CL A† | | | 0.6000 | | | 5/25/2047 | | | 38,992,864 | | | | 34,976,209 | | |
Sequoia Mortgage Trust | |
| 2013-2 A1 | | | 1.8740 | | | 2/17/2043 | | | 45,622,751 | | | | 42,970,701 | | |
| 2012-1 A1 | | | 2.8650 | | | 1/25/2042 | | | 9,303,549 | | | | 9,209,574 | | |
Stanwich Mortgage Loan Trust Series | |
| 2009-2 A†,* | | | 2.1892 | | | 2/15/2049 | | | 586,046 | | | | 262,080 | | |
| 2010-1 A†,* | | | 1.2897 | | | 9/15/2047 | | | 880,919 | | | | 445,569 | | |
| 2010-2 A†,* | | | 7.5851 | | | 2/28/2057 | | | 4,583,691 | | | | 2,311,097 | | |
| 2010-3 A†,* | | | 1.3103 | | | 7/31/2038 | | | 2,690,006 | | | | 1,345,810 | | |
| 2010-4 A†,* | | | 1.0254 | | | 8/31/2049 | | | 3,217,029 | | | | 1,503,318 | | |
| 2011-1 A†,* | | | 3.8944 | | | 6/30/2039 | | | 5,481,452 | | | | 2,891,077 | | |
| 2011-2 A†,* | | | 2.8890 | | | 9/15/2050 | | | 3,547,404 | | | | 1,898,585 | | |
| 2012-NPL4 CL A† | | | 2.9814 | | | 10/15/2042 | | | 15,624,648 | | | | 15,643,057 | | |
| 2012-NPL5 CL A† | | | 2.9814 | | | 10/16/2042 | | | 32,410,724 | | | | 32,433,408 | | |
| 2013-NPL1 CL A† | | | 2.9814 | | | 2/16/2043 | | | 40,345,388 | | | | 40,448,470 | | |
| 2013-NPL2 CL A† | | | 3.2282 | | | 4/16/2059 | | | 41,900,648 | | | | 41,502,592 | | |
Vericrest Opportunity Loan Transferee | |
| 2012-NL2A A1† | | | 2.4871 | | | 2/25/2052 | | | 10,375,142 | | | | 10,344,120 | | |
| 2012-NL3A A† | | | 2.7344 | | | 11/25/2060 | | | 20,983,534 | | | | 21,024,120 | | |
| 2013-1A A† | | | 3.1049 | | | 11/25/2050 | | | 7,156,995 | | | | 7,162,721 | | |
| 2013-3A A † | | | 3.2216 | | | 5/27/2053 | | | 16,151,455 | | | | 15,844,595 | | |
VRPL 2012-RP3A CL AI† | | | 3.4747 | | | 11/27/2017 | | | 2,505,275 | | | | 2,510,379 | | |
Wells Fargo Mortgage-Backed Securities Trust
2006-5 2A1 | | | 5.2500 | | | 4/25/2021 | | | 7,555,574 | | | | 7,703,437 | | |
TOTAL NON-AGENCY COLLATERALIZED
MORTGAGE OBLIGATION | | | | $543,574,236 | |
AGENCY STRIPPED — 2.8% | | | |
PRINCIPAL ONLY SECURITIES | | | |
Federal Home Loan Mortgage
Corporation 217 | | | 6.5000 | | | 1/1/2032 | | $ | 561,400 | | | $ | 516,883 | | |
17
FPA NEW INCOME, INC.
PORTFOLIO OF INVESTMENTS (Continued)
September 30, 2013
BONDS & DEBENTURES — Continued | | Coupon
Rate (%) | | Maturity
Date | | Principal
Amount | | Fair
Value | |
INTEREST ONLY SECURITIES | | | |
Federal Home Loan Mortgage Corporation | |
| 3714 TI | | | 2.2500 | | | 8/15/2015 | | $ | 48,337,268 | | | $ | 1,517,534 | | |
| 3935 LI | | | 3.0000 | | | 10/15/2021 | | | 7,567,587 | | | | 623,541 | | |
| 3948 AI | | | 3.0000 | | | 10/15/2021 | | | 9,489,414 | | | | 740,364 | | |
| 3956 KI | | | 3.0000 | | | 11/15/2021 | | | 21,236,696 | | | | 1,919,581 | | |
| 3968 AI | | | 3.0000 | | | 12/15/2021 | | | 7,991,172 | | | | 726,921 | | |
| 3992 OI | | | 3.0000 | | | 1/15/2022 | | | 6,318,332 | | | | 578,834 | | |
| 3994 EI | | | 3.0000 | | | 2/15/2022 | | | 13,891,899 | | | | 1,280,241 | | |
| 3998 KI | | | 3.0000 | | | 11/15/2026 | | | 22,805,182 | | | | 2,570,199 | | |
| 3994 AI | | | 3.0000 | | | 2/1/2027 | | | 14,735,925 | | | | 1,351,579 | | |
| 4100 EI | | | 3.0000 | | | 8/15/2027 | | | 105,851,690 | | | | 13,135,570 | | |
| 3706 AI | | | 3.5000 | | | 7/15/2020 | | | 11,895,538 | | | | 692,535 | | |
| 3722 AI | | | 3.5000 | | | 9/15/2020 | | | 14,127,338 | | | | 1,248,321 | | |
| 3735 AI | | | 3.5000 | | | 10/15/2020 | | | 6,716,509 | | | | 618,819 | | |
| 3874 DI | | | 3.5000 | | | 10/15/2020 | | | 12,139,108 | | | | 853,843 | | |
| 3893 DI | | | 3.5000 | | | 10/15/2020 | | | 8,660,725 | | | | 616,342 | | |
| 3753 CI | | | 3.5000 | | | 11/15/2020 | | | 3,100,484 | | | | 298,123 | | |
| 3755 AI | | | 3.5000 | | | 11/15/2020 | | | 12,656,927 | | | | 1,169,706 | | |
| 3760 KI | | | 3.5000 | | | 11/15/2020 | | | 10,382,012 | | | | 849,465 | | |
| 3784 BI | | | 3.5000 | | | 1/15/2021 | | | 8,451,095 | | | | 829,562 | | |
| 3874 BI | | | 3.5000 | | | 6/15/2021 | | | 7,075,827 | | | | 697,283 | | |
| 3893 BI | | | 3.5000 | | | 7/15/2021 | | | 5,848,693 | | | | 557,666 | | |
| 3909 KI | | | 3.5000 | | | 7/15/2021 | | | 5,216,501 | | | | 497,724 | | |
| 3938 IO | | | 3.5000 | | | 10/15/2021 | | | 35,381,296 | | | | 3,559,698 | | |
| 3778 GI | | | 3.5000 | | | 6/15/2024 | | | 6,526,500 | | | | 563,755 | | |
| 3854 GI | | | 3.5000 | | | 11/15/2024 | | | 5,081,338 | | | | 283,106 | | |
| 3852 YI | | | 3.5000 | | | 3/15/2025 | | | 17,071,558 | | | | 1,228,667 | | |
| 3763 NI | | | 3.5000 | | | 5/15/2025 | | | 5,445,981 | | | | 478,772 | | |
| 3904 QI | | | 3.5000 | | | 5/15/2025 | | | 5,883,508 | | | | 453,637 | | |
| 3909 UI | | | 3.5000 | | | 8/15/2025 | | | 9,467,097 | | | | 650,358 | | |
| 3904 NI | | | 3.5000 | | | 8/15/2026 | | | 11,959,859 | | | | 1,413,588 | | |
| 3930 AI | | | 3.5000 | | | 9/15/2026 | | | 15,167,714 | | | | 2,376,512 | | |
| 4018 AI | | | 3.5000 | | | 3/15/2027 | | | 26,737,985 | | | | 3,926,051 | | |
| 3684 CI | | | 4.5000 | | | 8/15/2024 | | | 32,327,603 | | | | 3,397,812 | | |
| 3917 AI | | | 4.5000 | | | 7/15/2026 | | | 44,798,494 | | | | 6,298,776 | | |
217 | | | 6.5000 | | | 1/1/2032 | | | 540,569 | | | | 103,848 | | |
Federal National Mortgage Association | |
| 2011-88 BI | | | 3.0000 | | | 11/25/2020 | | | 5,347,748 | | | | 331,100 | | |
| 2011-141 EI | | | 3.0000 | | | 7/25/2021 | | | 21,541,285 | | | | 1,714,908 | | |
| 2012-8 TI | | | 3.0000 | | | 10/25/2021 | | | 10,011,351 | | | | 795,378 | | |
18
FPA NEW INCOME, INC.
PORTFOLIO OF INVESTMENTS (Continued)
September 30, 2013
BONDS & DEBENTURES — Continued | | Coupon
Rate (%) | | Maturity
Date | | Principal
Amount | | Fair
Value | |
| 2011-113 GI | | | 3.0000 | | | 11/25/2021 | | $ | 9,622,483 | | | $ | 765,448 | | |
| 2011-129 AI | | | 3.0000 | | | 12/25/2021 | | | 12,943,337 | | | | 1,094,188 | | |
| 2012-8 UI | | | 3.0000 | | | 12/25/2021 | | | 31,304,971 | | | | 2,532,297 | | |
| 2011-137 AI | | | 3.0000 | | | 1/25/2022 | | | 17,043,399 | | | | 1,413,818 | | |
| 2011-138 IG | | | 3.0000 | | | 1/25/2022 | | | 19,796,641 | | | | 1,753,925 | | |
2011-145 | | | 3.0000 | | | 1/25/2022 | | | 26,296,278 | | | | 2,198,316 | | |
| 2012-78 AI | | | 3.0000 | | | 2/25/2022 | | | 16,114,973 | | | | 1,301,581 | | |
| 2012-23 IA | | | 3.0000 | | | 3/25/2022 | | | 11,881,961 | | | | 1,055,690 | | |
| 2012-32 AI | | | 3.0000 | | | 4/25/2022 | | | 19,191,641 | | | | 1,734,028 | | |
| 2012-53 CI | | | 3.0000 | | | 5/25/2022 | | | 29,541,410 | | | | 2,694,321 | | |
| 2012-147 CL AI | | | 3.0000 | | | 10/25/2027 | | | 38,635,335 | | | | 4,874,419 | | |
| 2012-145 CL DI | | | 3.0000 | | | 1/25/2028 | | | 21,132,464 | | | | 2,623,841 | | |
| 2012-149 CL CI | | | 3.0000 | | | 1/25/2028 | | | 56,898,585 | | | | 6,998,793 | | |
| 2010-128 LI | | | 3.5000 | | | 11/25/2020 | | | 16,574,223 | | | | 1,430,878 | | |
| 2011-75 BI | | | 3.5000 | | | 11/25/2020 | | | 9,240,473 | | | | 735,452 | | |
| 2011-78 LI | | | 3.5000 | | | 11/25/2020 | | | 23,372,397 | | | | 1,776,347 | | |
| 2010-145 BI | | | 3.5000 | | | 12/25/2020 | | | 8,163,602 | | | | 741,455 | | |
| 2011-61 BI | | | 3.5000 | | | 7/25/2021 | | | 6,917,232 | | | | 702,304 | | |
| 2011-66 QI | | | 3.5000 | | | 7/25/2021 | | | 12,138,302 | | | | 1,151,638 | | |
| 2010-104 CI | | | 3.5000 | | | 10/25/2021 | | | 20,504,447 | | | | 1,973,660 | | |
| 2011-104 DI | | | 3.5000 | | | 10/25/2021 | | | 34,727,659 | | | | 3,216,813 | | |
| 2011-110 AI | | | 3.5000 | | | 11/25/2021 | | | 14,712,166 | | | | 1,395,634 | | |
| 2011-118 IC | | | 3.5000 | | | 11/25/2021 | | | 38,201,941 | | | | 3,747,714 | | |
| 2011-125 DI | | | 3.5000 | | | 12/25/2021 | | | 26,469,291 | | | | 2,668,192 | | |
| 2011-143 MI | | | 3.5000 | | | 1/25/2022 | | | 11,308,526 | | | | 1,018,077 | | |
| 2012-2 MI | | | 3.5000 | | | 2/25/2022 | | | 16,654,565 | | | | 1,745,625 | | |
| 2010-137 BI | | | 3.5000 | | | 2/25/2024 | | | 6,211,249 | | | | 381,001 | | |
| 2010-135 DI | | | 3.5000 | | | 4/25/2024 | | | 12,661,621 | | | | 883,249 | | |
| 2011-75 AI | | | 3.5000 | | | 1/25/2025 | | | 23,250,948 | | | | 1,565,112 | | |
| 2011-66 BI | | | 3.5000 | | | 3/25/2025 | | | 2,963,930 | | | | 163,541 | | |
| 2011-80 KI | | | 3.5000 | | | 4/25/2025 | | | 12,026,008 | | | | 1,061,441 | | |
| 2011-67 CI | | | 3.5000 | | | 8/25/2025 | | | 5,737,275 | | | | 518,902 | | |
| 2011-22 IC | | | 3.5000 | | | 12/25/2025 | | | 11,199,514 | | | | 1,411,348 | | |
| 2011-101 EI | | | 3.5000 | | | 10/25/2026 | | | 24,311,659 | | | | 3,465,527 | | |
| 2011-69 TI | | | 4.0000 | | | 5/25/2020 | | | 8,800,026 | | | | 680,488 | | |
| 2010-89 LI | | | 4.0000 | | | 8/25/2020 | | | 13,383,251 | | | | 1,244,265 | | |
| 2010-104 CI | | | 4.0000 | | | 9/25/2020 | | | 5,998,565 | | | | 563,086 | | |
| 2011-67 EI | | | 4.0000 | | | 7/25/2021 | | | 14,925,184 | | | | 1,370,081 | | |
| 2012-148 CL AI | | | 4.0000 | | | 1/25/2028 | | | 33,725,124 | | | | 4,755,367 | | |
| 2010-110 IH | | | 4.5000 | | | 10/25/2018 | | | 16,689,348 | | | | 1,433,734 | | |
| 2009-70 IN | | | 4.5000 | | | 8/25/2019 | | | 24,302,915 | | | | 1,757,611 | | |
19
FPA NEW INCOME, INC.
PORTFOLIO OF INVESTMENTS (Continued)
September 30, 2013
BONDS & DEBENTURES — Continued | | Coupon
Rate (%) | | Maturity
Date | | Principal
Amount | | Fair
Value | |
| 2008-15 JI | | | 4.5000 | | | 6/25/2022 | | $ | 5,630,425 | | | $ | 249,847 | | |
2010-114 | | | 5.0000 | | | 4/25/2018 | | | 22,156,866 | | | | 1,837,695 | | |
2010-30 | | | 5.0000 | | | 5/25/2018 | | | 8,948,389 | | | | 672,899 | | |
| 2003-64 XI | | | 5.0000 | | | 7/25/2033 | | | 1,586,280 | | | | 346,474 | | |
TOTAL AGENCY STRIPPED | | | | $139,172,724 | |
AGENCY POOL ADJUSTABLE RATE
MORTGAGES — 0.0% | | | |
Federal National Mortgage Association 865963 | | | 2.5290 | | | 3/1/2036 | | $ | 2,331,881 | | | $ | 2,456,194 | | |
ASSET-BACKED SECURITIES | | | |
AUTO — 6.1% | | | |
AmeriCredit Automobile Receivables Trust | |
| 2010-1 C | | | 5.1900 | | | 8/17/2015 | | $ | 2,149,333 | | | $ | 2,187,419 | | |
| 2010-2 D | | | 6.2400 | | | 6/8/2016 | | | 6,990,000 | | | | 7,279,106 | | |
| 2010-3 C | | | 3.3400 | | | 4/8/2016 | | | 4,993,000 | | | | 5,097,634 | | |
| 2010-3 D | | | 4.9800 | | | 1/8/2018 | | | 13,735,000 | | | | 14,429,716 | | |
| 2011-1 B | | | 2.1900 | | | 2/8/2016 | | | 6,197,000 | | | | 6,230,795 | | |
| 2011-2 C | | | 3.1900 | | | 10/8/2016 | | | 8,580,000 | | | | 8,784,633 | | |
| 2011-4 B | | | 2.2600 | | | 9/8/2016 | | | 7,952,000 | | | | 8,048,614 | | |
| 2013-1 A2† | | | 0.4900 | | | 6/8/2016 | | | 31,101,049 | | | | 31,076,694 | | |
| 2013-2 A2 | | | 0.5300 | | | 11/8/2016 | | | 23,386,000 | | | | 23,384,239 | | |
| 2013-4 A2 | | | 0.7400 | | | 11/8/2016 | | | 48,087,000 | | | | 48,103,071 | | |
Credit Acceptance Auto Loan Trust 2012-1A B† | | | 3.1200 | | | 3/16/2020 | | | 4,500,000 | | | | 4,552,871 | | |
DT Auto Owner Trust | |
| 2012-2A B† | | | 1.8500 | | | 4/17/2017 | | | 7,352,000 | | | | 7,365,090 | | |
| 2012-2A B† | | | 1.7800 | | | 6/15/2017 | | | 9,548,000 | | | | 9,547,405 | | |
Exeter Automobile Receivables Trust
2013-2A A† | | | 1.4960 | | | 11/15/2017 | | | 34,000,000 | | | | 33,999,881 | | |
Prestige Automobile Receivables Trust
2013-1A A2† | | | 1.0900 | | | 2/15/2018 | | | 14,246,378 | | | | 14,251,847 | | |
Santander Drive Auto Receivables Trust | |
| 2011-4 A2 | | | 1.3700 | | | 3/15/2015 | | | 5,181 | | | | 5,183 | | |
| 2012-1 A2 | | | 1.2500 | | | 4/15/2015 | | | 1,042,353 | | | | 1,043,270 | | |
| 2012-3 A3 | | | 1.0800 | | | 4/15/2016 | | | 3,790,000 | | | | 3,797,699 | | |
| 2012-4 A3 | | | 1.0400 | | | 8/15/2016 | | | 7,157,000 | | | | 7,179,511 | | |
| 2012-6 A2 | | | 0.4700 | | | 9/15/2015 | | | 33,019,213 | | | | 33,003,195 | | |
| 2013-1 A2 | | | 0.4800 | | | 2/16/2016 | | | 10,623,838 | | | | 10,618,404 | | |
| 2013-3 A2 | | | 0.5500 | | | 9/15/2016 | | | 5,432,000 | | | | 5,423,961 | | |
20
FPA NEW INCOME, INC.
PORTFOLIO OF INVESTMENTS (Continued)
September 30, 2013
BONDS & DEBENTURES — Continued | | Coupon
Rate (%) | | Maturity
Date | | Principal
Amount | | Fair
Value | |
Westlake Automobile Receivables Trust
2013-1A A1† | | | 0.5500 | | | 10/15/2014 | | $ | 20,135,000 | | | $ | 20,135,201 | | |
TOTAL ASSET-BACKED
SECURITIES-AUTO | | | | $305,545,439 | |
ASSET-BACKED SECURITIES-OTHER — 6.5% | | | |
Beacon Container Finance LLC 2012-1A A† | | | 3.7200 | | | 9/20/2022 | | $ | 9,573,187 | | | $ | 9,691,616 | | |
CLI Funding LLC | |
| 2011-2A CL A† | | | 4.9400 | | | 10/18/2026 | | | 20,314,610 | | | | 20,417,694 | | |
| 2012-1A † | | | 4.2100 | | | 12/18/2022 | | | 43,629,975 | | | | 44,639,573 | | |
Cronos Containers Program | |
| 2011-1A† | | | 4.9400 | | | 11/18/2021 | | | 14,230,417 | | | | 14,346,822 | | |
| 2012-2A A† | | | 3.8100 | | | 9/18/2027 | | | 30,533,399 | | | | 31,014,153 | | |
Global Tower Partners Acquisition Partners† | | | 4.7040 | | | 5/15/2018 | | | 15,981,000 | | | | 15,301,648 | | |
HFG HEALTHCO-4 LLC 2011-1A A† | | | 2.4321 | | | 6/2/2017 | | | 16,552,000 | | | | 16,800,280 | | |
Insite Issuer LLC† | | | 8.5950 | | | 8/15/2043 | | | 11,613,000 | | | | 11,613,000 | | |
MMAF Equipment Finance LLC 2013-AA A2† | | | 0.6900 | | | 5/9/2016 | | | 20,656,000 | | | | 20,657,886 | | |
PFS Financing Corpation | |
| 2011-BA A† | | | 1.6823 | | | 10/17/2016 | | | 4,710,000 | | | | 4,749,005 | | |
| 2011-BA B† | | | 2.4323 | | | 10/17/2016 | | | 4,000,000 | | | | 4,008,318 | | |
Panhandle-Plains Student Finance Corp
2001-1 CL A2 | | | 2.2900 | | | 12/1/2031 | | | 5,900,000 | | | | 5,811,500 | | |
Progresso Receivables Funding I LLC
2013-A CL A† | | | 4.0000 | | | 7/9/2018 | | | 14,984,000 | | | | 14,909,080 | | |
Global SC Finance SRL 2012-1A CL A† | | | 4.1100 | | | 7/17/2027 | | | 9,482,583 | | | | 9,576,555 | | |
Store Master Funding LLC 2012-1A CLA† | | | 5.7700 | | | 8/20/2042 | | | 16,986,804 | | | | 17,365,440 | | |
TAL Advantage LLC | |
| 2006-1A† | | | 0.3700 | | | 4/20/2021 | | | 11,883,333 | | | | 11,598,371 | | |
| 2011-1A A† | | | 4.6000 | | | 1/20/2021 | | | 3,205,400 | | | | 3,235,370 | | |
Textainer Marine Containers Ltd 2012-1A A† | | | 4.2100 | | | 4/15/2027 | | | 14,884,358 | | | | 15,113,546 | | |
Triton Container Finance LLC 2006-1A† | | | 4.2100 | | | 5/14/2027 | | | 6,733,133 | | | | 6,820,933 | | |
Unison Ground Lease Fund† | | | 5.7800 | | | 3/16/2020 | | | 10,932,000 | | | | 10,590,657 | | |
Unison Ground Lease Fund† | | | 6.2680 | | | 3/16/2020 | | | 3,768,000 | | | | 3,715,964 | | |
Unison Ground Lease Fund† | | | 9.5220 | | | 4/15/2020 | | | 19,600,000 | | | | 22,235,024 | | |
WCP Issuer LLC 2013-1 CL B† | | | 6.6570 | | | 8/15/2020 | | | 15,347,000 | | | | 14,901,937 | | |
TOTAL ASSET-BACKED SECURITIES | | | | $329,114,372 | |
U.S. TREASURY SECURITIES — 12.9% | | | |
U.S Treasury Note | | | 0.2500 | | | 1/31/2014 | | $ | 50,000,000 | | | $ | 50,035,645 | | |
U.S Treasury Note | | | 0.2500 | | | 3/31/2014 | | | 150,000,000 | | | | 150,139,890 | | |
21
FPA NEW INCOME, INC.
PORTFOLIO OF INVESTMENTS (Continued)
September 30, 2013
BONDS & DEBENTURES — Continued | | Coupon
Rate (%) | | Maturity
Date | | Principal
Amount | | Fair
Value | |
U.S Treasury Note | | | 0.2500 | | | 4/30/2014 | | $ | 75,000,000 | | | $ | 75,076,170 | | |
U.S Treasury Note | | | 0.7500 | | | 12/15/2013 | | | 75,000,000 | | | | 75,108,398 | | |
U.S Treasury Note | | | 1.0000 | | | 1/15/2014 | | | 50,000,000 | | | | 50,138,915 | | |
U.S Treasury Note | | | 1.0000 | | | 5/15/2014 | | | 50,000,000 | | | | 50,283,935 | | |
U.S Treasury Note | | | 1.2500 | | | 3/15/2014 | | | 70,000,000 | | | | 70,380,079 | | |
U.S Treasury Note | | | 1.7500 | | | 3/31/2014 | | | 50,000,000 | | | | 50,419,920 | | |
U.S Treasury Note | | | 1.8750 | | | 2/28/2014 | | | 75,000,000 | | | | 75,565,800 | | |
TOTAL U.S. TREASURY SECURITIES | | | | $647,148,752 | |
CORPORATE BONDS & DEBENTURES — 5.2% | | | |
Boart Longyear Management Pty Ltd† | | | 10.0000 | | | 10/1/2018 | | $ | 21,104,000 | | | $ | 21,473,320 | | |
British Airways plc † | | | 5.6250 | | | 6/20/2020 | | | 8,375,000 | | | | 8,500,625 | | |
Continental Airlines Company | |
| 1997-1 1A | | | 7.4610 | | | 4/1/2015 | | | 796,692 | | | | 797,688 | | |
2000-1 | | | 8.3880 | | | 11/1/2020 | | | 8,298,611 | | | | 8,665,409 | | |
Delta Airlines | |
| 2012-1B† | | | 6.8750 | | | 5/7/2019 | | | 2,238,662 | | | | 2,344,998 | | |
N671US† | | | 7.5000 | | | 9/15/2020 | | | 18,935,837 | | | | 18,935,837 | | |
Fidelity National Information Services | | | 7.8750 | | | 7/15/2020 | | | 14,162,000 | | | | 15,690,248 | | |
HD Supply Inc. | | | 8.1250 | | | 4/15/2019 | | | 43,314,000 | | | | 47,970,255 | | |
Lease Air Trust | |
| 2012 A1† | | | 6.7500 | | | 4/25/2016 | | | 23,357,917 | | | | 23,357,917 | | |
| 2012 A2† | | | 6.7500 | | | 4/25/2016 | | | 3,730,312 | | | | 3,739,637 | | |
Nielsen Finance LLC Co. | | | 7.7500 | | | 10/15/2018 | | | 35,780,000 | | | | 38,821,300 | | |
Northwest Airlines | |
| 1999-2 B | | | 7.9500 | | | 9/1/2016 | | | 5,627,092 | | | | 5,978,785 | | |
| 1999-2 C | | | 8.3040 | | | 9/1/2019 | | | 8,254,799 | | | | 8,450,850 | | |
| 2000-1 G | | | 7.1500 | | | 10/1/2020 | | | 19,613,564 | | | | 20,398,107 | | |
US Airways PT Trust | |
| 1998-1B | | | 7.3500 | | | 7/30/2019 | | | 8,842,272 | | | | 9,273,333 | | |
| 1998-1C | | | 6.8200 | | | 1/30/2016 | | | 28,949,725 | | | | 28,225,982 | | |
TOTAL CORPORATE BONDS &
DEBENTURES | | | | $262,624,291 | |
CORPORATE BANK DEBT — 2.3% | | | |
Emdeon Term Loan BL0979577† | | | 3.7500 | | | 11/2/2018 | | $ | 16,517,602 | | | $ | 16,517,106 | | |
Kar Auction Services Term Loan BL095302† | | | 3.7500 | | | 5/18/2017 | | | 14,543,166 | | | | 14,552,474 | | |
La Frontera Generation Term Loan B† | | | 4.5000 | | | 9/30/2020 | | | 32,154,000 | | | | 32,173,292 | | |
Nielsen Finance LLC Term Loan LN 284932† | | | 2.3932 | | | 5/1/2016 | | | 11,714,063 | | | | 11,742,879 | | |
22
FPA NEW INCOME, INC.
PORTFOLIO OF INVESTMENTS (Continued)
September 30, 2013
BONDS & DEBENTURES — Continued | | Coupon
Rate (%) | | Maturity
Date | | Principal
Amount | | Fair
Value | |
OCI Beaumont LLC | |
Term Loan B1† | | | 6.2500 | | | 8/20/2019 | | $ | 7,633,264 | | | $ | 7,643,569 | | |
Term Loan B2† | | | 6.2500 | | | 8/20/2019 | | | 14,350,536 | | | | 14,369,909 | | |
Toys R Us Property Term Loan† | | | 6.0000 | | | 8/21/2019 | | | 16,426,000 | | | | 16,289,500 | | |
TOTAL CORPORATE BANK DEBT | | | | $113,288,729 | |
TOTAL INVESTMENT SECURITIES — 96.5%
(Cost $4,924,467,717) | | | | $4,856,455,677 | |
SHORT-TERM INVESTMENTS — 4.1%
(Cost $204,959,940) | |
Exxon Mobil Corporation | | | 0.0400 | | | 10/7/2013 | | $ | 50,000,000 | | | $ | 49,999,667 | | |
Exxon Mobil Corporation | | | 0.0400 | | | 10/10/2013 | | | 51,870,000 | | | | 51,869,481 | | |
General Electric Company | | | 0.0300 | | | 10/1/2013 | | | 53,091,000 | | | | 53,091,000 | | |
Toyota Motor Credit Corporation | | | 0.0500 | | | 10/4/2013 | | | 50,000,000 | | | | 49,999,792 | | |
TOTAL SHORT-TERM INVESTMENTS | | | | $204,959,940 | |
TOTAL INVESTMENTS — 100.6%
(Cost $5,129,427,657) | | | | $5,061,415,617 | |
Other assets and liabilities, net — (0.6)% | | | | (28,848,238) | |
TOTAL NET ASSETS — 100.0% | | | | $5,032,567,379 | |
* These securities have been valued in good faith under policies adopted by authority of the Board of Directors in accordance with the Fund's fair value procedures. These securities constituted 0.2% of total net assets at September 30, 2013
† Restricted securities. These restricted securities constituted 25.85% of total net assets at September 30, 2013, most of which are considered liquid by the Adviser. These securities are not registered and may not be sold to the public. There are legal and/or contractual restrictions on resale. The Fund does not have the right to demand that such securities be registered. The values of these securities are determined by valuations provided by pricing services, brokers, dealers, market makers, or in good faith under policies adopted by authority of the Fund's Board of Directors.
23
FPA NEW INCOME, INC.
PORTFOLIO OF INVESTMENTS — RESTRICTED SECURITIES
September 30, 2013
Issuer | | Acquisition
Date (s) | | Cost | | Fair
Value | | Fair
Value as a %
of Net Assets | |
Banc of America Large Loan
2010-HLTN | | 11/15/12 | | $ | 15,348,401 | | | $ | 15,371,867 | | | | 0.31 | % | |
Del Coronado Trust
2013-HDMZ CL M | | 4/1/13 | | | 6,840,058 | | | | 6,853,530 | | | | 0.14 | % | |
GS Mortgage Securities Corporation II
2007-EOP A3 | | 10/21/11, 12/5/11,
1/13/12 | | | 15,544,164 | | | | 15,810,822 | | | | 0.31 | % | |
JP Morgan Clearing Corporation
2011-FL1 MH | | 12/14/11 | | | 19,300,000 | | | | 19,706,600 | | | | 0.39 | % | |
Lehman Brothers Floating Rate
Commercial 2007-LLFA F | | 2/8/13 | | | 12,213,180 | | | | 12,323,034 | | | | 0.24 | % | |
LSTAR Commercial Mortgage Trust
2001-1 A | | 6/23/11 | | | 3,654,551 | | | | 3,683,278 | | | | 0.07 | % | |
Motel 6 Trust 2012-MTL6 D | | 11/2/12, 3/12/13,
3/14/13 | | | 37,118,870 | | | | 36,700,084 | | | | 0.73 | % | |
Motel 6 Trust 2012-MTL6 E | | 11/2/12 | | | 10,060,970 | | | | 9,695,659 | | | | 0.19 | % | |
Ores NPL LLC 2013-LV2 CL A | | 8/9/13 | | | 29,794,444 | | | | 29,803,382 | | | | 0.59 | % | |
RREF 2012 LT1 LLC 2013-LT2 CL A | | 3/20/13 | | | 17,007,804 | | | | 17,007,818 | | | | 0.34 | % | |
Starwood Commercial Mortgage Trust
2013-FV1 CL B | | 7/30/13 | | | 18,051,000 | | | | 18,067,607 | | | | 0.36 | % | |
Washington Mutual Commercial
Mortgage Series Trust
2007-SL2 CL A | | 5/22/09, 9/22/11,
2/29/12 | | | 4,736,407 | | | | 8,292,674 | | | | 0.16 | % | |
Bayview Opportunity Master Fund Trust
2012-4NPL CL A | | 9/7/12 | | | 4,093,174 | | | | 4,098,414 | | | | 0.08 | % | |
Bayview Opportunity Master Fund Trust
2013-2RPL CL A | | 4/11/13 | | | 7,612,371 | | | | 7,464,685 | | | | 0.15 | % | |
Bayview Opportunity Master Fund Trust
2013-4RPL CL A | | 8/9/13 | | | 22,843,184 | | | | 22,830,250 | | | | 0.45 | % | |
Bayview Opportunity Master Fund Trust
2013-13NP CL A | | 6/10/13 | | | 13,653,327 | | | | 13,322,234 | | | | 0.26 | % | |
Bayview Opportunity Master Fund Trust
2013-14NP CL A | | 7/24/13 | | | 33,915,959 | | | | 33,831,169 | | | | 0.67 | % | |
Credit Suisse Mortgage Trust
2013-6 1A1 | | 7/26/13 | | | 93,177,025 | | | | 93,901,054 | | | | 1.87 | % | |
JP Morgan Mortgage Trust
2013-1 CL 2A2 | | 3/25/13 | | | 41,369,949 | | | | 39,480,442 | | | | 0.78 | % | |
Normandy Mortgage Loan Trust
2013-NPL3 A | | 8/28/13 | | | 35,972,832 | | | | 35,972,832 | | | | 0.71 | % | |
Riverview HECM Trust 2007-1 CL A | | 1/9/13 | | | 35,483,507 | | | | 34,976,209 | | | | 0.69 | % | |
24
FPA NEW INCOME, INC.
PORTFOLIO OF INVESTMENTS — RESTRICTED SECURITIES
(Continued)
September 30, 2013
Issuer | | Acquisition
Date (s) | | Cost | | Fair
Value | | Fair
Value as a %
of Net Assets | |
Stanwich Mortgage Loan Trust Series
2009-2 A | | 9/22/11 | | $ | 260,289 | | | $ | 262,080 | | | | 0.01 | % | |
Stanwich Mortgage Loan Trust Series
2010-1 A | | 4/22/2010, 9/22/11 | | | 370,956 | | | | 445,569 | | | | 0.01 | % | |
Stanwich Mortgage Loan Trust Series
2010-2 A | | 5/21/2010, 9/22/11 | | | 2,347,211 | | | | 2,311,097 | | | | 0.05 | % | |
Stanwich Mortgage Loan Trust Series
2010-3 A | | 6/2/2010, 9/22/11 | | | 1,125,080 | | | | 1,345,810 | | | | 0.03 | % | |
Stanwich Mortgage Loan Trust Series
2010-4 A | | 8/4/2010, 9/22/11 | | | 1,497,930 | | | | 1,503,318 | | | | 0.03 | % | |
Stanwich Mortgage Loan Trust Series
2011-1 A | | 5/10/2011, 9/22/11 | | | 2,524,355 | | | | 2,891,077 | | | | 0.06 | % | |
Stanwich Mortgage Loan Trust Series
2011-2 A† | | 6/10/2011, 9/22/11 | | | 1,350,372 | | | | 1,898,585 | | | | 0.04 | % | |
Stanwich Mortgage Loan Trust Series
2012-NPL4 CL A | | 9/24/12 | | | 15,624,648 | | | | 15,643,057 | | | | 0.31 | % | |
Stanwich Mortgage Loan Trust Series
2012-NPL5 CL A | | 11/5/12, 11/20/12,
3/12/13 | | | 32,440,241 | | | | 32,433,408 | | | | 0.64 | % | |
Stanwich Mortgage Loan Trust Series
2013-NPL1 CL A | | 2/15/13 | | | 40,344,080 | | | | 40,448,470 | | | | 0.80 | % | |
Stanwich Mortgage Loan Trust Series
2013-NPL2 CL A | | 5/31/13 | | | 41,900,648 | | | | 41,502,592 | | | | 0.82 | % | |
Vericrest Opportunity Loan Transferee
2012-NL2A A1 | | 9/14/12, 10/16/12 | | | 10,381,510 | | | | 10,344,120 | | | | 0.21 | % | |
Vericrest Opportunity Loan Transferee
2012-NL3A A | | 11/15/12, 2/12/13 | | | 20,990,386 | | | | 21,024,120 | | | | 0.42 | % | |
Vericrest Opportunity Loan Transferee
2013-1A A | | 1/18/13 | | | 7,156,995 | | | | 7,162,721 | | | | 0.14 | % | |
Vericrest Opportunity Loan Transferee
2013-3A A | | 5/9/2013,
8/29/2013 | | | 16,000,823 | | | | 15,844,595 | | | | 0.31 | % | |
VRPL 2012-RP3A CL AI | | 11/16/12 | | | 2,505,270 | | | | 2,510,379 | | | | 0.05 | % | |
AmeriCredit Automobile Receivables
Trust 2013-1 A2 | | 1/15/13 | | | 31,100,023 | | | | 31,076,694 | | | | 0.62 | % | |
Credit Acceptance Auto Loan Trust
2012-1A B | | 3/22/12 | | | 4,499,265 | | | | 4,552,871 | | | | 0.09 | % | |
DT Auto Owner Trust 2012-2A B | | 7/17/12 | | | 7,351,623 | | | | 7,365,090 | | | | 0.15 | % | |
DT Auto Owner Trust 2012-2A B | | 9/17/13 | | | 9,547,310 | | | | 9,547,405 | | | | 0.19 | % | |
Exeter Automobile Receivables Trust
2013-2A A | | 9/11/13 | | | 33,999,541 | | | | 33,999,881 | | | | 0.68 | % | |
25
FPA NEW INCOME, INC.
PORTFOLIO OF INVESTMENTS — RESTRICTED SECURITIES
(Continued)
September 30, 2013
Issuer | | Acquisition
Date (s) | | Cost | | Fair
Value | | Fair
Value as a %
of Net Assets | |
Prestige Automobile Receivables Trust
2013-1A A2 | | 8/27/13 | | $ | 14,248,604 | | | $ | 14,251,847 | | | | 0.28 | % | |
Westlake Automobile Receivables Trust
2013-1A A1 | | 9/18/13 | | | 20,135,000 | | | | 20,135,201 | | | | 0.40 | % | |
Beacon Container Finance LLC
2012-1A A | | 9/25/12 | | | 9,544,395 | | | | 9,691,616 | | | | 0.19 | % | |
CLI Funding LLC 2011-2A CL A | | 1/9/13 | | | 20,684,029 | | | | 20,417,694 | | | | 0.41 | % | |
CLI Funding LLC 2012-1A | | 6/14/12 | | | 43,624,569 | | | | 44,639,573 | | | | 0.89 | % | |
Cronos Containers Program 2011-1A | | 1/9/13 | | | 14,367,922 | | | | 14,346,822 | | | | 0.29 | % | |
Cronos Containers Program 2012-2A A | | 9/20/12, 11/1/12 | | | 30,787,655 | | | | 31,014,153 | | | | 0.62 | % | |
Global Tower Partners Acquisition
Partners | | 4/17/13 | | | 15,981,000 | | | | 15,301,648 | | | | 0.30 | % | |
HFG HEALTHCO-4 LLC 2011-1A A | | 5/26/2011, 9/22/11 | | | 16,577,140 | | | | 16,800,280 | | | | 0.33 | % | |
Insite Issuer LLC | | 8/19/13 | | | 11,613,000 | | | | 11,613,000 | | | | 0.23 | % | |
MMAF Equipment Finance LLC
2013-AA A2 | | 8/7/13 | | | 20,653,837 | | | | 20,657,886 | | | | 0.41 | % | |
PFS Financing Corpation 2011-BA A | | 9/27/13 | | | 4,749,005 | | | | 4,749,005 | | | | 0.09 | % | |
PFS Financing Corpation 2011-BA B | | 11/3/11 | | | 4,000,000 | | | | 4,008,318 | | | | 0.08 | % | |
Progresso Receivables Funding I LLC
2013-A CL A | | 6/14/13 | | | 14,984,000 | | | | 14,909,080 | | | | 0.30 | % | |
Global SC Finance SRL 2012-1A CL A | | 7/25/12 | | | 9,480,703 | | | | 9,576,555 | | | | 0.19 | % | |
Store Master Funding LLC
2012-1A CLA | | 8/31/12 | | | 16,933,057 | | | | 17,365,440 | | | | 0.35 | % | |
TAL Advantage LLC 2006-1A | | 6/28/12, 7/16/12,
7/31/12, 8/7/12,
9/11/12, 10/10/12 | | | 11,535,138 | | | | 11,598,371 | | | | 0.23% | | |
TAL Advantage LLC 2011-1A A | | 1/31/13 | | | 3,335,619 | | | | 3,235,370 | | | | 0.06 | % | |
Textainer Marine Containers Ltd
2012-1A A | | 1/18/13 | | | 15,364,030 | | | | 15,113,546 | | | | 0.30 | % | |
Triton Container Finance LLC
2006-1A | | 4/17/13 | | | 6,971,949 | | | | 6,820,933 | | | | 0.14 | % | |
Unison Ground Lease Fund | | 3/12/13 | | | 10,782,695 | | | | 10,590,657 | | | | 0.21 | % | |
Unison Ground Lease Fund | | 3/12/13 | | | 3,768,000 | | | | 3,715,964 | | | | 0.07 | % | |
Unison Ground Lease Fund | | 12/13/12 | | | 24,059,000 | | | | 22,235,024 | | | | 0.44 | % | |
WCP Issuer LLC 2013-1 CL B | | 8/1/13 | | | 15,347,000 | | | | 14,901,937 | | | | 0.30 | % | |
Boart Longyear Management Pty Ltd | | 9/20/13 | | | 21,104,000 | | | | 21,473,320 | | | | 0.43 | % | |
British Airways plc | | 6/25/13 | | | 8,375,000 | | | | 8,500,625 | | | | 0.17 | % | |
Delta Airlines 2012-1B | | 6/27/12 | | | 2,238,662 | | | | 2,344,998 | | | | 0.05 | % | |
Delta Airlines N671US | | 8/16/12 | | | 18,935,837 | | | | 18,935,837 | | | | 0.38 | % | |
Lease Air Trust 2012 A1 | | 12/17/12 | | | 23,357,916 | | | | 23,357,917 | | | | 0.46 | % | |
Lease Air Trust 2012 A2 | | 9/4/13 | | | 3,739,637 | | | | 3,739,637 | | | | 0.07 | % | |
26
FPA NEW INCOME, INC.
PORTFOLIO OF INVESTMENTS — RESTRICTED SECURITIES
(Continued)
September 30, 2013
Issuer | | Acquisition
Date (s) | | Cost | | Fair
Value | | Fair
Value as a %
of Net Assets | |
Emdeon Term Loan BL0979577
| | 4/9/2013,
4/18/2013,
4/23/2013 | | $ | 16,587,067 | | | $ | 16,517,106 | | | | 0.33 | % | |
Kar Auction Services Term Loan
BL095302
| | 3/8/2013, 8/7/2013,
9/10/2013,
9/25/2013 | | | 14,610,533 | | | | 14,552,474 | | | | 0.29% | | |
La Frontera Generation Term Loan B
| | 5/9/2013,
5/15/2013,
5/22/2013 | | | 32,108,921 | | | | 32,173,292 | | | | 0.64% | | |
OCI Beaumont LLC Term Loan B1
| | 8/13/2013,
9/24/2013,
9/25/2013 | | | 7,551,451 | | | | 7,643,569 | | | | 0.15% | | |
OCI Beaumont LLC Term Loan B2
| | 8/13/2013,
9/24/2013,
9/25/2013 | | | 14,196,722 | | | | 14,369,909 | | | | 0.29% | | |
Toys R Us Property Term Loan | | 7/31/13 | | | 16,261,754 | | | | 16,289,500 | | | | 0.32 | % | |
TOTAL RESTRICTED SECURITIES | | | | $ | 1,299,704,580 | | | $ | 1,300,894,687 | | | | 25.85 | % | |
See notes to financial statements
27
FPA NEW INCOME, INC.
STATEMENT OF ASSETS AND LIABILITIES
September 30, 2013
ASSETS | |
Investments at value: | |
Investments securities — at fair value
(identified cost $4,924,467,717) | | $ | 4,856,455,677 | | | | | | |
Short-term investments — at amortized cost
(maturities 60 days or less) | | | 204,959,940 | | | $ | 5,061,415,617 | | |
Cash | | | | | | | 20,241 | | |
Receivable for: | |
Interest | | $ | 22,646,029 | | | | | | |
Capital Stock sold | | | 11,332,894 | | | | 33,978,923 | | |
| | | | | $ | 5,095,414,781 | | |
LIABILITIES | |
Payable for: | |
Investment securities purchased | | $ | 49,087,975 | | | | | | |
Capital Stock repurchased | | | 11,398,178 | | | | | | |
Advisory fees | | | 2,048,259 | | | | | | |
Accrued expenses and other liabilities | | | 312,990 | | | | 62,847,402 | | |
NET ASSETS | | | | $ | 5,032,567,379 | | |
SUMMARY OF SHAREHOLDERS' EQUITY | |
Capital Stock — par value $0.01 per share; authorized
600,000,000 shares; outstanding 481,490,856 shares | | | | $ | 4,814,909 | | |
Additional Paid in Capital | | | | | 5,264,850,694 | | |
Accumulated net realized losses on investments | | | | | (214,051,662 | ) | |
Undistributed net investment income | | | | | 44,965,478 | | |
Unrealized depreciation of investments | | | | | (68,012,040 | ) | |
NET ASSETS | | | | $ | 5,032,567,379 | | |
NET ASSET VALUE
Offering and redemption price per share | | | | $ | 10.45 | | |
See notes to financial statements.
28
FPA NEW INCOME, INC.
STATEMENT OF OPERATIONS
For the Year Ended September 30, 2013
INVESTMENT INCOME | |
Interest | | | | | | $ | 164,366,000 | | |
| | | | | | | $ | 164,366,000 | | |
EXPENSES | |
Advisory fees | | $ | 24,794,809 | | | | | | |
Transfer agent fees and expenses | | | 2,544,209 | | | | | | |
Custodian fees and expenses | | | 325,818 | | | | | | |
Registration fees | | | 321,502 | | | | | | |
Reports to shareholders | | | 247,519 | | | | | | |
Directors' fees and expenses | | | 127,168 | | | | | | |
Audit fees | | | 57,850 | | | | | | |
Legal fees | | | 40,609 | | | | | | |
Tax | | | 800 | | | | | | |
Other expenses | | | 140,366 | | | | 28,600,650 | | |
Net investment income | | | | $ | 135,765,350 | | |
NET REALIZED AND UNREALIZED LOSS ON INVESTMENTS | |
Net realized loss on investments: | |
Proceeds from sale of investment securities (excluding
short-term investments with maturities 60 days or less) | | $ | 3,805,857,767 | | | | | | |
| Cost of investment securities sold | | | 3,832,343,872 | | | | | | |
Net realized loss on investments | | | | | | $ | (26,486,105 | ) | |
Unrealized depreciation of investments: | |
Unrealized appreciation at beginning of year | | $ | 7,588,502 | | | | | | |
| Unrealized depreciation at end of year | | | (68,012,040 | ) | | | | | |
Change in unrealized appreciation of investments | | | | | | | (75,600,542 | ) | |
Net realized and unrealized loss on investments | | | | | | $ | (102,086,647 | ) | |
NET CHANGE IN NET ASSETS RESULTING FROM OPERATIONS | | | | | | $ | 33,678,703 | | |
See notes to financial statements.
29
FPA NEW INCOME, INC.
STATEMENT OF CHANGES IN NET ASSETS
| | | For the Year Ended
September 30, 2013 | | For the Year Ended
September 30, 2012 | |
INCREASE IN NET ASSETS | |
Operations: | |
Net investment income | | $ | 135,765,350 | | | | | | | $ | 99,013,676 | | | | | | |
| Net realized loss on investments | | | (26,486,105 | ) | | | | | | | (3,386,509 | ) | | | | | |
Change in unrealized
appreciation of investments | | | (75,600,542 | ) | | | | | | | 7,371,505 | | | | | | |
Change in net assets resulting
from operations | | | | | | $ | 33,678,703 | | | | | | | $ | 102,998,672 | | |
Distributions to shareholders from
net investment income | | | | | | | (149,351,776 | ) | | | | | | | (156,031,919 | ) | |
Capital Stock transactions: | |
Proceeds from capital stock sold | | $ | 2,091,317,496 | | | | | | | $ | 2,319,494,537 | | | | | | |
Proceeds from shares issued to
shareholders upon reinvestment
of dividends and distributions | | | 115,048,142 | | | | | | | | 115,035,888 | | | | | | |
| Cost of Capital Stock repurchased* | | | (2,149,805,799 | ) | | | 56,559,839 | | | | (1,566,016,154 | ) | | | 868,514,271 | | |
Total change in net assets | | | | | | $ | (59,113,234 | ) | | | | | | $ | 815,481,024 | | |
NET ASSETS | |
Beginning of period | | | | | | | 5,091,680,613 | | | | | | | | 4,276,199,589 | | |
End of period | | | | | | $ | 5,032,567,379 | | | | | | | $ | 5,091,680,613 | | |
CHANGE IN CAPITAL STOCK
OUTSTANDING | |
Shares of Capital Stock sold | | | | | | | 198,339,785 | | | | | | | | 217,206,681 | | |
Shares issued to shareholders upon
reinvestment of dividends
and distributions | | | | | | | 10,913,447 | | | | | | | | 10,792,801 | | |
Shares of Capital Stock repurchased | | | | | | | (203,499,236 | ) | | | | | | | (146,777,482 | ) | |
Increase in Capital Stock outstanding | | | | | | | 5,753,996 | | | | | | | | 81,222,000 | | |
* Net of redemption fees of $846,642 and $699,948 for the years ended September 30, 2013, and September 30, 2012, respectively.
See notes to financial statements.
30
FPA NEW INCOME, INC.
FINANCIAL HIGHLIGHTS
Selected Data for Each Share of Capital Stock Outstanding Throughout Each Year
| | | For the Year Ended September 30, | |
| | | 2013 | | 2012 | | 2011 | | 2010 | | 2009 | |
Per share operating performance: | |
Net asset value at beginning of year | | $ | 10.70 | | | $ | 10.84 | | | $ | 11.04 | | | $ | 11.09 | | | $ | 11.06 | | |
Income from investment operations: | |
Net investment income | | $ | 0.28 | | | $ | 0.27 | | | $ | 0.43 | | | $ | 0.36 | | | $ | 0.36 | | |
Net realized and unrealized gain (loss)
on investment securities | | | (0.21 | ) | | | (0.04 | ) | | | (0.16 | ) | | | (0.04 | ) | | | 0.08 | | |
Total from investment operations | | $ | 0.07 | | | $ | 0.23 | | | $ | 0.27 | | | $ | 0.32 | | | $ | 0.44 | | |
Less dividends from net investment
income | | $ | (0.32 | ) | | $ | (0.37 | ) | | $ | (0.47 | ) | | $ | (0.37 | ) | | $ | (0.41 | ) | |
Redemption fees | | | — | * | | | — | * | | | — | * | | | — | * | | | — | * | |
Net asset value at end of year | | $ | 10.45 | | | $ | 10.70 | | | $ | 10.84 | | | $ | 11.04 | | | $ | 11.09 | | |
| Total investment return** | | | 0.66 | % | | | 2.18 | % | | | 2.47 | % | | | 2.90 | % | | | 4.03 | % | |
Ratios/supplemental data: | |
Net assets at end of period (in $000's) | | $ | 5,032,567 | | | $ | 5,091,681 | | | $ | 4,276,200 | | | $ | 4,145,399 | | | $ | 3,813,468 | | |
Ratio of expenses to average net assets | | | 0.58 | % | | | 0.57 | % | | | 0.60 | % | | | 0.60 | % | | | 0.60 | % | |
Ratio of net investment income to
average net assets | | | 2.74 | % | | | 2.21 | % | | | 3.94 | % | | | 2.98 | % | | | 3.20 | % | |
| Portfolio turnover rate | | | 84 | % | | | 77 | % | | | 117 | % | | | 78 | % | | | 64 | % | |
* Rounds to less than $0.01 per share.
** Return is based on net asset value per share, adjusted for reinvestment of distributions, and does not reflect deduction of the sales charge.
See notes to financial statements.
31
FPA NEW INCOME, INC.
NOTES TO FINANCIAL STATEMENTS
September 30, 2013
NOTE 1 — Significant Accounting Policies
The Fund is registered under the Investment Company Act of 1940 as a diversified, open-end, management investment company. The Fund's primary investment objective is to seek current income and long-term total return. The following is a summary of significant accounting policies consistently followed by the Fund in the preparation of its financial statements.
A. Security Valuation
The Fund's investments are reported at fair value as defined by accounting principles generally accepted in the United States of America. The Fund generally determines its net asset value as of approximately 4:00 p.m. New York time each day the New York Stock Exchange is open. Further discussion of valuation methods, inputs and classifications can be found under Note 7.
B. Securities Transactions and Related Investment Income
Securities transactions are accounted for on the date the securities are purchased or sold. Dividend income and distributions to shareholders are recorded on the ex-dividend date. Interest income and expenses are recorded on an accrual basis. Market discounts and premiums on fixed income securities are amortized over the expected life of the securities. Realized gains or losses are based on the specific identification method.
C. Use of Estimates
The preparation of financial statements in conformity with accounting principles generally accepted in the United States requires management to make estimates and assumptions that affect the amounts reported. Actual results could differ from these estimates.
NOTE 2 — Risk Considerations
Investing in the Fund may involve certain risks including, but not limited to, those described below.
Market Risk: Because the values of the Fund's investments will fluctuate with market conditions, so will the value of your investment in the Fund. You could lose money on your investment in the Fund or the Fund could underperform other investments.
Interest Rate Risk: The values of, and the income generated by, most debt securities held by the Fund may be affected by changing interest rates and by changes in the effective maturities and credit ratings of these securities. For example, the values of debt securities in the Fund's portfolio generally will decline when interest rates rise and increase when interest rates fall. In addition, falling interest rates may cause an issuer to redeem, call or refinance a security before its stated maturity, which may result in the Fund having to reinvest the proceeds in lower-yielding securities.
Mortgage-Backed and Other Asset-Backed Securities Risk: The values of some mortgage-backed and other asset-backed securities may expose the Fund to a lower rate of return upon reinvestment of principal. When interest rates rise, the value of mortgage-related securities generally will decline; however, when interest rates are declining, the value of mortgage related-securities with prepayment features may not increase as much as other fixed income securities. The rate of prepayments on underlying mortgages will affect the price and volatility of a mortgage-related security, and may shorten or extend the effective maturity of the security beyond what was anticipated at the time of purchase. If an unanticipated rate of prepayment on underlying mortgages increases the effective maturity of a mortgage-related security, the volatility of the security can be expected to increase. The value of these securities may also fluctuate in response to the market's perception of the creditworthiness of the issuers. Additionally, although mortgages and mortgage-related securities are generally supported by some form
32
FPA NEW INCOME, INC.
NOTES TO FINANCIAL STATEMENTS
Continued
of government or private guarantee and/or insurance, there is no assurance that private guarantors or insurers will meet their obligations.
Stripped Mortgage-Backed Interest Only ("I/O") and Principal Only ("P/O") Securities: Stripped mortgage-backed securities are usually structured with two classes that receive different proportions of the interest and principal distributions on a pool of mortgage assets. In certain cases, one class will receive all of the interest payments on the underlying mortgages (the I/O class), while the other class will receive all of the principal payments (the P/O class). The Fund currently has investments in I/O securities. The yield to maturity on IOs is sensitive to the rate of principal repayments (including prepayments) on the related underlying mortgage assets, and principal payments may have a material effect on yield-to-maturity. If the underlying mortgage assets experience greater than anticipated prepayments of principal, a Fund may not fully recoup its initial investment in I/Os.
Credit Risk: Debt securities are subject to credit risk, meaning that the issuer of the debt security may default or fail to make timely payments of principal or interest. The values of any of the Fund's investments may also decline in response to events affecting the issuer or its credit rating. The lower-rated debt securities in which the Fund may invest are considered speculative and are generally subject to greater volatility and risk of loss than investment grade securities, particularly in deteriorating economic conditions. The Fund invests a significant portion of its assets in securities of issuers that hold mortgage- and asset-backed securities and direct investments in securities backed by commercial and residential mortgage loans and other financial assets. The value and related income of these securities is sensitive to changes in economic conditions, including delinquencies and/or defaults. Continuing shifts in the market's perception of credit quality on securities backed by commercial and residential mortgage loans and other financial assets may result in increased volatility of market price and periods of illiquidity that can negatively impact the valuation of certain securities held by the Fund.
Repurchase Agreements: Repurchase agreements permit the Fund to maintain liquidity and earn income over periods of time as short as overnight. Repurchase agreements held by the Fund are fully collateralized by U.S. Government securities, or securities issued by U.S. Government agencies, or securities that are within the three highest credit categories assigned by established rating agencies (Aaa, Aa, or A by Moody's or AAA, AA or A by Standard & Poor's) or, if not rated by Moody's or Standard & Poor's, are of equivalent investment quality as determined by the Adviser. Such collateral is in the possession of the Fund's custodian. The collateral is evaluated daily to ensure its market value equals or exceeds the current market value of the repurchase agreements including accrued interest. In the event of default on the obligation to repurchase, the Fund has the right to liquidate the collateral and apply the proceeds in satisfaction of the obligation.
NOTE 3 — Purchases of Investment Securities
Cost of purchases of investment securities (excluding short-term investments with maturities of 60 days or less) aggregated $3,783,220,488 for the year ended September 30, 2013.
NOTE 4 — Advisory Fees and Other Affiliated Transactions
Pursuant to an Investment Advisory Agreement (the "Agreement"), advisory fees were paid by the Fund to First Pacific Advisors, LLC (the "Adviser"). Under the terms of this Agreement, the Fund pays the Adviser a monthly fee calculated at the annual rate of 0.5% of the average daily net assets of the Fund. The Agreement obligates the Adviser to reduce its fee to the extent necessary to reimburse the Fund for any annual expenses (exclusive of interest, taxes, the cost of any supplemental statistical and research information, and extraordinary expenses such as litigation) in excess of 11/2% of the first $15 million and 1% of the remaining average net assets of the Fund for the year.
33
FPA NEW INCOME, INC.
NOTES TO FINANCIAL STATEMENTS
Continued
For the year ended September 30, 2013, the Fund paid aggregate fees of $126,423 to all Directors who are not interested persons of the Adviser. Certain officers of the Fund are also officers of the Adviser.
NOTE 5 — Federal Income Tax
No provision for federal income tax is required because the Fund has elected to be taxed as a "regulated investment company" under the Internal Revenue Code and intends to maintain this qualification and to distribute each year to its shareholders, in accordance with the distribution requirements of the Code, all of its taxable net investment income and taxable net realized gains on investments.
Distributions paid to shareholders are based on net investment income and net realized gains determined on a tax reporting basis, which may differ from financial reporting. For federal income tax purposes, the components of distributable earnings at September 30, 2013, were as follows:
Undistributed net investment income | | $ | 58,749,554 | | |
The tax status of dividends paid during fiscal years ended September 30, 2013 and 2012 were as follows:
| | 2013 | | 2012 | |
Dividends from ordinary income | | $ | 149,351,776 | | | $ | 156,031,919 | | |
The Fund utilizes the provisions of federal income tax laws that provide for the carryforward of capital losses for prior years, offsetting such losses against any future realized capital gains. Under the Regulated Investment Company Act of 2010 (the "Act"), net capital losses recognized for fiscal years beginning after December 22, 2010 may be carried forward indefinitely, and their character is retained as short-term and/or long-term losses. Previously, net capital losses were carried forward for eight years and treated as short-term losses. As a transition rule, the Act requires that post-enactment net capital losses be used before pre-enactment net capital losses.
As of September 30, 2013, the post enactment accumulated losses were $95,873,097, and the pre-enactment capital loss carryforwards were $51,915,965. The ability to carry these pre-enactment losses forward expires as follows: $20,873,466 in 2014; $16,390,845 in 2015; $299,496 in 2017; $3,661,716 in 2018; $10,690,442 in 2019.
The cost of investment securities at September 30, 2013 for federal income tax purposes was $4,938,251,793. Gross unrealized appreciation and depreciation for all securities at September 30, 2013 for federal income tax purposes was $48,473,889 and $130,270,005, respectively, resulting in net unrealized depreciation of $81,796,116. As of and during the year ended September 30, 2013, the Fund did not have any liability for unrecognized tax benefits. The Fund recognizes interest and penalties, if any, related to unrecognized tax benefits as income tax expense in the Statement of Operations. During the year, the Fund did not incur any interest or penalties. The Fund is not subject to examination by U.S. federal tax authorities for years ended before September 30, 2010 or by state tax authorities for years ended before September 30, 2009.
During the year ended September 30, 2013, the Fund reclassified $44,198,526 of net amounts relating to market discount on securities sold, and paydowns from mortgage- and other asset-backed securities, from undistributed net investment income to accumulated net realized losses on investments to align financial reporting with tax reporting. Accumulated capital losses of $7,719,581 were reclassified to Additional Paid-in Capital because the ability to carry them forward expired.
34
FPA NEW INCOME, INC.
NOTES TO FINANCIAL STATEMENTS
Continued
NOTE 6 — Redemption Fees
A redemption fee of 2% applies to redemptions within 90 days of purchase for certain purchases made by persons eligible to purchase shares without an initial sales charge. For the year ended September 30, 2013, the Fund collected $846,642 in redemption fees, which amounted to less than $0.01 per share.
NOTE 7 — Disclosure of Fair Value Measurements
The Fund uses the following methods and inputs to establish the fair value of its assets and liabilities. Use of particular methods and inputs may vary over time based on availability and relevance as market and economic conditions evolve.
Equity securities are generally valued each day at the official closing price of, or the last reported sale price on, the exchange or market on which such securities principally are traded, as of the close of business on that day. If there have been no sales that day, equity securities are generally valued at the last available bid price. Securities that are unlisted and fixed-income and convertible securities listed on a national securities exchange for which the over-the-counter market more accurately reflects the securities' value in the judgment of the Fund's officers, are valued at the most recent bid price. However, most fixed income securities are generally valued at prices obtained from pricing vendors. Vendors value such securities based on one or more of the following inputs: transactions, bids, offers quotations from dealers and trading systems, spreads and other relationships observed in the markets among comparable securities, benchmarks, underlying equity of the issuer, and proprietary pricing models such as cash flows, financial or collateral performance and other reference data (includes prepayments, defaults, collateral, credit enhancements, and interest rate volatility). Short-term corporate notes with maturities of 60 days or less at time of purchase are valued at amortized cost, which approximates fair value.
Securities for which representative market quotations are not readily available or are considered unreliable by the Adviser are valued as determined in good faith under procedures adopted by authority of the Fund's Board of Directors. Various inputs may be reviewed in order to make a good faith determination of a security's value. These inputs include, but are not limited to, the type and cost of the security; contractual or legal restrictions on resale of the security; relevant financial or business developments of the issuer; actively traded similar or related securities; method of comparables to evaluate whether an asset is fairly valued in relation to similar securities; conversion or exchange rights on the security; related corporate actions; significant events occurring after the close of trading in the security; and changes in overall market conditions. Fair valuations and valuations of investments that are not actively trading involve judgment and may differ materially from valuations of investments that would have been used had greater market activity occurred.
The Fund classifies its assets based on three valuation methodologies. Level 1 investment securities are valued based on quoted market prices in active markets for identical assets. Level 2 investment securities are valued based on significant observable market inputs, such as quoted prices for similar assets and quoted prices in inactive markets or other market observable inputs as noted above including spreads, cash flows, financial performance, prepayments, defaults, collateral, credit enhancements, and interest rate volatility. Level 3 investment securities are valued using significant unobservable inputs that reflect the Fund's determination of assumptions that market participants might reasonably use in valuing the assets. These assumptions consider inputs such as proprietary pricing models, cash flows, prepayments, defaults, and collateral. The valuation levels are not necessarily an
35
FPA NEW INCOME, INC.
NOTES TO FINANCIAL STATEMENTS
Continued
indication of the risk associated with investing in those securities. The following table presents the valuation levels of the Fund's investments as of September 30, 2013:
Investments | | Level 1 | | Level 2 | | Level 3 | | Total | |
Bonds & Debentures | |
Commercial Mortgage-Backed | |
Agency Stripped | | | — | | | $ | 517,330,898 | | | | — | | | $ | 517,330,898 | | |
Non-Agency | | | — | | | | 193,316,355 | | | | — | | | | 193,316,355 | | |
Agency | | | — | | | | 150,765,019 | | | | — | | | | 150,765,019 | | |
Residential Mortgage-Backed | |
Agency Pool Fixed Rate | | | — | | | | 588,996,208 | | | | — | | | | 588,996,208 | | |
Agency Collateralized Mortgage Obligation | | | — | | | | 1,063,122,460 | | | | — | | | | 1,063,122,460 | | |
Non-Agency Collateralized Mortgage Obligation | | | — | | | | 532,916,700 | | | $ | 10,657,536 | | | | 543,574,236 | | |
Agency Stripped | | | — | | | | 139,172,724 | | | | — | | | | 139,172,724 | | |
Agency Pool Adjustable Rate Mortgages | | | — | | | | 2,456,194 | | | | — | | | | 2,456,194 | | |
Asset-Backed Securities | |
Auto | | | — | | | | 305,545,439 | | | | — | | | | 305,545,439 | | |
Other | | | — | | | | 329,114,372 | | | | — | | | | 329,114,372 | | |
U.S. Treasuries | | | — | | | | 647,148,752 | | | | — | | | | 647,148,752 | | |
Corporate Bonds and Debentures | | | — | | | | 262,624,291 | | | | — | | | | 262,624,291 | | |
Corporate Bank Debt | | | — | | | | 113,288,729 | | | | — | | | | 113,288,729 | | |
Short-Term Investments | | | — | | | | 204,959,940 | | | | — | | | | 204,959,940 | | |
Total Investments | | | — | | | $ | 5,050,758,081 | | | $ | 10,657,536 | | | $ | 5,061,415,617 | | |
The following table summarizes the Fund's Level 3 investment securities and related transactions during the period ended September 30, 2013:
| Investment | | Beginning
Value at
September 30,
2012 | | Net Realized and
Unrealized Gains
(Losses)* | | Purchases | | (Sales) | | Gross
Transfers
In (Out) | | Ending
Value at
September 30,
2013 | | Net Change
in Unrealized
Appreciation
(Depreciation)
related to
Investments held
at September 30,
2013 | |
Non-Agency
Collateralized
Mortgage
Obligation | | $ | 15,766,285 | | | $ | 4,824,601 | | | $ | 274,933 | | | $ | (10,208,283 | ) | | $ | — | | | $ | 10,657,536 | | | $ | — | | |
* Net realized and unrealized gains (losses) are included in the related amounts in the statement of operations.
Level 3 Valuation Process: Investments classified within Level 3 of the fair value hierarchy are valued by the Adviser in good faith under procedures adopted by authority of the Fund's Board of Directors. The Adviser employs various methods to determine fair valuations including regular review of key inputs and assumptions,
36
FPA NEW INCOME, INC.
NOTES TO FINANCIAL STATEMENTS
Continued
and review of related market activity, if any. However, there are generally no observable trade activities in these securities. The Adviser reports to the Board of Directors at their regularly scheduled quarterly meetings, or more often if warranted. The report includes a summary of the results of the process, the key inputs and assumptions noted, and any changes to the inputs and assumptions used. When appropriate, the Adviser will recommend changes to the procedures and process employed. The value determined for an investment using the fair value procedures may differ significantly from the value realized upon the sale of such investment.
Transfers of investments between different levels of the fair value hierarchy are recorded at market value as of the end of the reporting period. There were no transfers between Level 1, 2, or 3 during the year ended September 30, 2013.
The following table summarizes the quantitative inputs and assumptions used for items categorized as items categorized as Level 3 of the fair value hierarchy as of September 30, 2013:
| Financial Assets | | Fair Value at
September 30, 2013 | | Valuation
Technique(s) | | Unobservable
Inputs | | Price/Range | |
Non-Agency
Collateralized
Mortgage Obligation | | $ | 10,657,536
| | | Methods of
Comparables/Consensus
Pricing* | | Quotes/Prices
| | $ | 49.40-$58.26
| | |
| | | | | | | Discount | | | 1.1 | %-16.9% (6.1%) | |
* The Methods of Comparables/Consensus Pricing valuation technique for Level 3 securities involves gathering observable and unobservable data related to securities that exhibit characteristics that are comparable to that of the Level 3 security, and using such information as an input into the valuation of the Level 3 security. Such observable and unobservable data may include offered quotes (prices offered to the Fund by potential buyers in the market), broker quotes, and vendor prices for the comparable securities.
NOTE 8 — Distribution to Shareholders
On September 30, 2013, the Board of Directors declared a dividend from net investment income of $0.12 per share payable October 2, 2013 to shareholders of record on September 30, 2013. For financial statement purposes, this dividend was recorded on the ex-dividend date, October 1, 2013.
37
FPA NEW INCOME, INC.
REPORT OF INDEPENDENT REGISTERED
PUBLIC ACCOUNTING FIRM
TO THE SHAREHOLDERS AND
BOARD OF DIRECTORS OF FPA NEW INCOME, INC.
We have audited the accompanying statement of assets and liabilities of FPA New Income, Inc. (the "Fund"), including the portfolio of investments, as of September 30, 2013, the related statement of operations for the year then ended, the statements of changes in net assets for each of the two years in the period then ended, and the financial highlights for each of the five years in the period then ended. These financial statements and financial highlights are the responsibility of the Fund's management. Our responsibility is to express an opinion on these financial statements and financial highlights based on our audits.
We conducted our audits in accordance with the standards of the Public Company Accounting Oversight Board (United States). Those standards require that we plan and perform the audit to obtain reasonable assurance about whether the financial statements and financial highlights are free of material misstatement. The Fund is not required to have, nor were we engaged to perform, an audit of its internal control over financial reporting. Our audits included consideration of internal control over financial reporting as a basis for designing audit procedures that are appropriate in the circumstances, but not for the purpose of expressing an opinion on the effectiveness of the Fund's internal control over financial reporting. Accordingly, we express no such opinion. An audit also includes examining, on a test basis, evidence supporting the amounts and disclosures in the financial statements, assessing the accounting principles used and significant estimates made by management, as well as evaluating the overall financial statement presentation. Our procedures included confirmation of securities owned as of September 30, 2013, by correspondence with the custodian and brokers, where replies were not received from brokers, we performed other auditing procedures. We believe that our audits provide a reasonable basis for our opinion.
In our opinion, such financial statements and financial highlights referred to above present fairly, in all material respects, the financial position of FPA New Income, Inc. as of September 30, 2013, the results of its operations for the year then ended, the changes in its net assets for each of the two years in the period then ended, and the financial highlights for each of the five years in the period then ended, in conformity with accounting principles generally accepted in the United States of America.

Los Angeles, California
November 19, 2013
38
FPA NEW INCOME, INC.
APPROVAL OF INVESTMENT ADVISORY AGREEMENT
(Unaudited)
Approval of the Advisory Agreement. At a meeting of the Board of Directors held on August 5, 2013, the Directors approved the continuation of the advisory agreement between the Fund and the Adviser for an additional one-year period through September 30, 2014, on the recommendation of the Independent Directors who met in executive session on August 5, 2013 prior to the Board meeting to review and discuss the proposed continuation of the advisory agreement. The following paragraphs summarize the material information and factors considered by the Board and the Independent Directors as well as the Directors' conclusions relative to such factors.
Nature, Extent and Quality of Services. The Board and the Independent Directors considered information regarding the Adviser and its staffing in connection with the Fund, including the Fund's portfolio managers, the senior analysts supporting team, the scope of accounting, administrative, shareholder and other services supervised and provided by the Adviser, and the absence of any significant service problems reported to the Board. The Board and the Independent Directors noted the experience, length of service and the outstanding reputation of the Fund's portfolio managers: Tom Atteberry, who has been with the Adviser since 1997, Robert Rodriguez, who has managed the Fund since 1984, Julian W. H. Mann, who joined the Adviser in 2004, Abhijeet V. Patwardhan, who joined the Adviser in 2010, Melinda J. Newman, who joined the Adviser in 2013, and Nazanin Pajoom, who joined the Adviser in 2013. The Board and the Independent Directors concluded that the nature, extent and quality of services provided by the Adviser have benefited and should continue to benefit the Fund and its shareholders.
Investment Performance. The Board and the Independent Directors reviewed the overall investment performance of the Fund. They also received information from an independent consultant, Morningstar Associates, LLC ("Morningstar"), regarding the Fund's performance relative to a peer group of bond funds selected by Morningstar (the "Peer Group"). The Board and the Independent Directors considered the Adviser's representation that the Fund's investment style, as evidenced by the short-term duration of most of its portfolio securities, as well as the Fund's flexibility to invest in a variety of areas, complicated Peer Group comparisons in that the Fund is managed in a more conservative style than the typical fixed income fund and the funds in the Peer Group. The Board and the Independent Directors noted the Fund's absolute investment results and its long-term investment performance when compared to the Peer Group. The Board and the Independent Directors determined that the Fund's investment results were satisfactory in light of the Fund's objectives and concluded that the Adviser's continued management of the Fund should benefit the Fund and its shareholders.
Advisory Fees and Fund Expenses; Adviser Profitability; Economies of Scale and Sharing of Economies of Scale. The Board and the Independent Directors were provided information by the Adviser to enable consideration of the Fund's advisory fees and total expense levels, as well as the overall profitability of the Adviser, the benefits to the Adviser from its relationship to the Fund, the extent to which economies of scale with respect to the management of the Fund, if any, would be realized, and whether the Fund is sharing, or will share, in those economies.
The Board and the Independent Directors reviewed comparative information relative to fees and expenses for the Fund and for the Peer Group. The Board and the Independent Directors noted that the Fund's advisory fee and its overall expense ratio each was at approximately the median of that of the Peer Group. The Board and the Independent Directors compared the Fund's advisory fee with the advisory fees charged by the Adviser to other clients. The Board and the Independent Directors noted that where the fees paid by the Adviser's other clients were lower, the differences reflected the differences in services provided by the Adviser to those clients. The Board and the Independent Directors considered other actual and potential benefits to the Adviser from managing the Fund, including the acquisition and use of research services with commissions generated by the Fund, in concluding that the contractual advisory and other fees are fair and reasonable for the Fund. The Board and the
39
FPA NEW INCOME, INC.
APPROVAL OF INVESTMENT ADVISORY AGREEMENT (Continued)
(Unaudited)
Independent Directors concluded that the continued payment of advisory fees and expenses by the Fund to the Adviser was fair and reasonable and should continue to benefit the Fund and its shareholders.
The Board and the Independent Directors considered whether there have been economies of scale with respect to the management of the Fund, whether the Fund has appropriately benefited from any economies of scale, and whether the fee rate is reasonable in relation to the Fund's assets and any economies of scale that may exist. The Independent Directors discussed the fact that the fee rate does not have any breakpoints. They considered that many mutual funds have breakpoints in the advisory fee structure as a means by which to share in the benefits of potential economies of scale as a fund's assets grow. They also considered that not all funds have breakpoints in their fee structures and that breakpoints are not the exclusive means of sharing potential economies of scale. The Board and the Independent Directors considered the Adviser's statement that it believes that breakpoints currently were not appropriate for the Fund given the ongoing investments the Adviser is making in its business for the benefit of the Fund, uncertainties regarding the direction of the economy, rising inflation, increasing costs for personnel and systems, and growth or contraction in the Fund's assets, all of which could negatively impact the Adviser.
The Board and the Independent Directors considered the Adviser's representation that its internal costs of providing investment management services to the Fund have increased significantly in recent years as a result of a number of factors, including the Adviser's substantial investment in additional professional resources and staffing. The Board and the Independent Directors considered information regarding the Adviser's representation that such increased costs have also included a significant investment in the analysts who assist with the management of the Fund, and additions to administrative personnel and systems that enhance the quality of services provided to the Fund. The Board and the Independent Directors concluded that the Fund is benefitting from the ongoing investments made by the Adviser in its team of personnel serving the Fund and in its service infrastructure, and that in light of these investments, breakpoints in the Fund's advisory fee structure were not warranted at current asset levels.
Conclusions. The Board and the Independent Directors determined that the Fund continues to benefit from the services of a highly experienced portfolio management team that has produced satisfactory long-term returns. In addition, the Board and the Independent Directors agreed that the Fund continues to receive high-quality accounting, administrative, shareholder and other ancillary services from the Adviser. The Board and the Independent Directors concluded that the current advisory fee rate is reasonable and fair to the Fund and its shareholders in light of the nature and quality of the services provided by the Adviser and the Adviser's profitability and costs. The Board and the Independent Directors also stated their intention to continue monitoring the factors relevant to the Adviser's compensation, such as changes in the Fund's asset levels, changes in portfolio management personnel and the cost and quality of the services provided by the Adviser to the Fund. On the basis of the foregoing, and without assigning particular weight to any single factor, none of which was dispositive, the Board and the Independent Directors concluded that it would be in the best interests of the Fund to continue to be advised and managed by the Adviser and determined to approve the continuation of the current Advisory Agreement for another one-year period through September 30, 2014.
40
FPA NEW INCOME, INC.
SHAREHOLDER EXPENSE EXAMPLE
September 30, 2013
(Unaudited)
Fund Expenses
As a shareholder of the Fund, you incur two types of costs: (1) transaction costs, and (2) ongoing costs, including advisory and administrative fees; shareholder service fees; and other Fund expenses. The Example is intended to help you understand your ongoing costs (in dollars) of investing in the Fund and to compare these costs with the ongoing costs of investing in other mutual funds. The Example is based on an investment of $1,000 invested at the beginning of the year and held for the entire year.
Actual Expenses
The information in the table under the heading "Actual Performance" provides information about actual account values and actual expenses. You may use the information in this column, together with the amount you invested, to estimate the expenses that you paid over the period. Simply divide your account value by $1,000 (for example, an $8,600 account value divided by $1,000= 8.6), then multiply the result by the number in the first column in the row entitled "Expenses Paid During Period" to estimate the expenses you paid on your account during this period.
Hypothetical Example for Comparison Purposes
The information in the table under the heading "Hypothetical Performance (5% return before expenses)" provides information about hypothetical account values and hypothetical expenses based on the Fund's actual expense ratio and an assumed rate of return of 5% per year before expenses, which is not the Fund's actual return. The hypothetical account values and expenses may not be used to estimate the
actual ending account balance or expenses you paid for the period. You may use this information to compare the ongoing costs of investing in the Fund and other funds. To do so, compare this 5% hypothetical example with the 5% hypothetical examples that appear in the shareholder reports of other funds.
Please note that the expenses shown in the table are meant to highlight your ongoing costs only and do not reflect any transactional costs. Therefore, the information under the heading "Hypothetical Performance (5% return before expenses)" is useful in comparing ongoing costs only, and will not help you determine the relative total costs of owning different funds. In addition, if these transactional costs were included, your costs would have been higher.
| | | Actual
Performance | | Hypothetical
Performance
(5% return
before
expenses) | |
Beginning Account Value
March 31, 2013 | | $ | 1,000.00 | | | $ | 1,000.00 | | |
Ending Account Value
September 30, 2013 | | $ | 999.10 | | | $ | 1,022.06 | | |
Expenses Paid During
Period* | | $ | 2.91 | | | $ | 2.94 | | |
* Expenses are equal to the Fund's annualized expense ratio of 0.58%, multiplied by the average account value over the period and prorated for the six-months ended September 30, 2013 (183/365 days).
41
FPA NEW INCOME, INC.
DIRECTOR AND OFFICER INFORMATION
| Name, Age & Address | | Position(s)
With Fund/
Years Served | | Principal Occupation(s)
During the Past 5 Years | | Portfolios in
Fund Complex
Overseen | | Other Directorships | |
Allan M. Rudnick – (72)* | | Director and Chairman†
Years Served: 1 | | Private Investor. Formerly, Co-Founder,
Chief Executive Officer, Chairman and
Chief Investment Officer of Kayne Anderson Rudnick Investment Management from 1989 to 2007 | | | 7 | | | | |
Thomas P. Merrick – (76)* | | Director†
Years Served: 5 | | Private Consultant. President of Strategic Planning Consultants for more than the past five years. Former Executive Committee Member and Vice President of Fluor Corporation, responsible for strategic planning, from 1984 to 1998. | | | 7 | | | | |
Alfred E. Osborne, Jr. – (68)* | | Director†
Years Served: 14 | | Senior Associate Dean of the John E. Anderson School of Management at UCLA. | | | 7 | | | Wedbush, Inc., Heckmann Corporation, and Kaiser Aluminum Inc. | |
A. Robert Pisano – (70)* | | Director†
Years Served: 1 | | Retired. Formerly President and Chief Operating Officer of the Motion Picture Association of America, Inc. from 2005 to 2011. | | | 7 | | | Resources connection and The Motion Picture and Television Fund | |
Patrick B. Purcell – (70)* | | Director†
Years Served: 7 | | Retired. Formerly Executive Vice President, Chief Financial Officer and Chief Administrative Officer of Paramount Pictures from 1983 to 1998. | | | 7 | | | The Motion Picture and Television Fund | |
Robert L. Rodriguez – (64) | | Director†
Portfolio Manager
Years Served: 29 | | Chief Executive Officer of the Adviser. | | | 2 | | | | |
Thomas H. Atteberry – (60) | | Chief Executive Officer & Portfolio Manager
Years Served: 8 | | Partner of the Adviser. | | | | | |
Eric S. Ende – (69) | | Vice President
Years Served: 28 | | Partner of the Adviser. | | | 3 | | | | |
J. Richard Atwood – (53) | | Treasurer
Years Served: 16 | | Chief Operating Officer of the Adviser. | | | | | |
Christopher H. Thomas – (56) | | Chief Compliance Officer
Years Served: 18 | | Vice President and Chief Compliance Officer of the Adviser. | | | | | |
42
FPA NEW INCOME, INC.
DIRECTOR AND OFFICER INFORMATION
Continued
| Name, Age & Address | | Position(s)
With Fund/
Years Served | | Principal Occupation(s)
During the Past 5 Years | | Portfolios in
Fund Complex
Overseen | | Other Directorships | |
Sherry Sasaki – (58) | | Secretary
Years Served: 30 | | Assistant Vice President and Secretary of the Adviser. | | | | | |
E. Lake Setzler – (46) | | Assistant Treasurer
Years Served: 7 | | Senior Vice President and Controller of the Adviser. | | | | | |
Michael P. Gomez – (28) | | Assistant Vice President
Years Served: 1 | | Assistant Vice President of the Adviser since 2010. Formerly In-Charge Associate of PricewaterhouseCoopers from 2007 to 2010. | | | | | |
† Directors serve until their resignation, removal or retirement.
* Audit Committee member
Additional information on the Directors is available in the Statement of Additional Information. Each of the above listed individuals can be contacted at 11400 W. Olympic Blvd., Suite 1200, Los Angeles, CA 90064.
43
INVESTMENT ADVISER
First Pacific Advisors, LLC
11400 West Olympic Boulevard, Suite 1200
Los Angeles, California 90064
DISTRIBUTOR
UMB Distribution Services, LLC
803 West Michigan Street
Milwaukee, Wisconsin 53233
LEGAL COUNSEL
K&L Gates LLP
San Francisco, California
TICKER: FPNIX
CUSIP: 302544101
INDEPENDENT REGISTERED PUBLIC ACCOUNTING FIRM
Deloitte & Touche LLP
Los Angeles, California
CUSTODIAN
State Street Bank and Trust Company
Boston, Massachusetts
TRANSFER & SHAREHOLDER SERVICE AGENT
UMB Fund Services, Inc.
P.O. Box 2175
Milwaukee, WI 53201-2175
803 W. Michigan St.
Milwaukee, WI 53233-2301
(800) 638-3060
This report has been prepared for the information of shareholders of FPA New Income, Inc., and is not authorized for distribution to prospective investors unless preceded or accompanied by a prospectus.
The Fund's complete proxy voting record for the 12 months ended June 30, 2013 is available without charge, upon request, by calling (800) 982-4372 and on the SEC's website at www.sec.gov.
The Fund's schedule of portfolio holdings, filed the first and third quarter of the Fund's fiscal year on Form N-Q with the SEC, is available on the SEC's website at www.sec.gov. Form N-Q is available at the SEC's Public Reference Room in Washington, D.C., and information on the operations of the Public Reference Room may be obtained by calling (202) 942-8090. To obtain information on Form N-Q from the Fund, shareholders can call (800) 982-4372.
Additional information about the Fund is available online at www.fpafunds.com. This information includes, among other things, holdings, top sectors and performance, and is updated on or about the 15th business day after the end of each quarter.
Item 2. | Code of Ethics. |
| |
| (a) | The registrant has adopted a code of ethics that applies to the registrant’s principal executive and financial officers. |
| | |
| (b) | Not Applicable |
| | |
| (c) | During the period covered by this report, there were not any amendments to the provisions of the code of ethics adopted in 2(a) above. |
| | |
| (d) | During the period covered by this report, there were not any implicit or explicit waivers to the provisions of the code of ethics adopted in 2(a). |
| | |
| (e) | Not Applicable |
| | |
| (f) | A copy of the registrant’s code of ethics is filed as an exhibit to this Form N-CSR. Upon request, any person may obtain a copy of this code of ethics, without charge, by calling (800) 982-4372. |
| |
Item 3. | Audit Committee Financial Expert. |
| |
| The registrant’s board of directors has determined that Patrick B. Purcell, a member of the registrant’s audit committee and board of directors, is an “audit committee financial expert” and is “independent,” as those terms are defined in this Item. This designation will not increase the designees’ duties, obligations or liability as compared to each of their duties, obligations and liability as a member of the audit committee and of the board of directors. This designation does not affect the duties, obligations or liability of any other member of the audit committee or the board of directors. |
| |
Item 4. | Principal Accountant Fees and Services. |
| |
| | | | 2012 | | 2013 | |
| (a) | Audit Fees | | $ | 50,000 | | $ | 50,000 | |
| (b) | Audit Related Fees | | -0- | | -0- | |
| (c) | Tax Fees | | $ | 7,860 | | $ | 8,000 | |
| (d) | All Other Fees | | -0- | | -0- | |
| | |
| (e)(1) | Disclose the audit committee’s pre-approval policies and procedures described in paragraph (c)(7) of Rule 2-01 of Regulation S-X. The audit committee shall pre-approve all audit and permissible non-audit services that the committee considers compatible with maintaining the independent auditors’ independence. The pre-approval requirement will extend to all non-audit services provided to the registrant, the adviser, and any entity controlling, controlled by, or under common control with the adviser that provides ongoing services to the registrant, if the |
| | | | | | | | | | |
| | engagement relates directly to the operations and financial reporting of the registrant; provided, however, that an engagement of the registrant’s independent auditors to perform attest services for the registrant, the adviser or its affiliates required by generally accepted auditing standards to complete the examination of the registrant’s financial statements (such as an examination conducted in accordance with Statement on Auditing Standards Number 70 issued by the American Institute of Certified Public Accountants), will be deem pre-approved if: (i) the registrant’s independent auditors inform the audit committee of the engagement, (ii) the registrant’s independent auditors advise the audit committee at least annually that the performance of this engagement will not impair the independent auditor’s independence with respect to the registrant, and (iii) the audit committee receives a copy of the independent auditor’s report prepared in connection with such services. The committee may delegate to one or more committee members the authority to review and pre-approve audit and permissible non-audit services. Actions taken under any such delegation will be reported to the full committee at its next meeting. |
| | |
| (e)(2) | Disclose the percentage of services described in each of paragraphs (b) – (d) of this Item that were approved by the audit committee pursuant to paragraph (c)(7)(i)(C) of Rule 2-01 of Regulation S-X. 100% of the services provided to the registrant described in paragraphs (b) – (d) of this Item were pre-approved by the audit committee pursuant to paragraph (e)(1) of this Item. There were no services provided to the investment adviser or any entity controlling, controlled by or under common control with the adviser described in paragraphs (b) – (d) of this Item that were required to be pre-approved by the audit committee. |
| | |
| (f) | If greater than 50%, disclose the percentage of hours expended on the principal accountant’s engagement to audit the registrant’s financial statements for the most recent fiscal year that were attributed to work performed by persons other than the principal accountant’s full-time, permanent employees. All services performed on the engagement to audit the registrant’s financial statements for the most recent fiscal year end were performed by the principal accountant’s full-time, permanent employees. |
| | |
| (g) | Disclose the aggregate non-audit fees billed by the registrant’s accountant for services rendered to the registrant, and rendered to the registrant’s investment adviser (not including any sub-adviser whose role is primarily portfolio management and is subcontracted with or overseen by another investment adviser), and any entity controlling, controlled by, or under common control with the adviser that provides ongoing services to the registrant for each of the last two fiscal years of the registrant. None. |
| (h) | Disclose whether the registrant’s audit committee of the board of directors has considered whether the provision of non-audit services that were rendered to the registrant’s investment adviser (not including any sub-adviser whose role is primarily portfolio management and is subcontracted with or overseen by another investment adviser), and any entity controlling, controlled by, or under common control with the investment adviser that provides ongoing services to the registrant that were not pre-approved pursuant to paragraph (c)(7)(ii) of Rule 2-01 of Regulation S-X is compatible with maintaining the principal accountant’s independence. Not Applicable. |
| |
Item 5. | Audit Committee of Listed Registrants. Not Applicable. |
| |
Item 6. | Schedule of Investments. The schedule of investments is included as part of the report to stockholders filed under Item 1 of this Form. |
| |
Item 7. | Disclosure of Proxy Voting Policies and Procedures for Closed-End Management Investment Companies. Not Applicable. |
| |
Item 8. | Portfolio Managers of Closed-End Management Investment Companies. Not Applicable. |
| |
Item 9. | Purchases of Equity Securities by Closed-End Management Investment Company and Affiliated Purchasers. Not Applicable. |
| |
Item 10. | Submission of Matters to a Vote of Security Holders. There has been no material change to the procedures by which shareholders may recommend nominees to the registrant’s board of directors. |
| |
Item 11. | Controls and Procedures. |
| | |
| (a) | The principal executive officer and principal financial officer of the registrant have concluded that the registrant’s disclosure controls and procedures (as defined in Rule 30a-3(c) under the Investment Company Act of 1940) are effective based on their evaluation of the disclosure controls and procedures as of a date within 90 days of the filing date of this report. |
| | |
| (b) | There have been no significant changes in the registrant’s internal controls over financial reporting (as defined in Rule 30a-3(d) under the Investment Company Act of 1940) that occurred during the second fiscal quarter of the period covered by this report that have materially affected, or is reasonably likely to materially affect, the registrant’s internal controls over financial reporting. |
Item 12. | Exhibits. |
| | |
| (a)(1) | Code of ethics as applies to the registrant’s officers and directors, as required to be disclosed under Item 2 of Form N-CSR. Attached hereto as Ex.99.CODE.ETH. |
| | |
| (a)(2) | Separate certification for the registrant’s principal executive officer and principal financial officer, as required by Rule 30a-2(a) under the Investment Company Act of 1940. Attached hereto. |
| | |
| (a)(3) | Not Applicable |
| | |
| (b) | Separate certification for the registrant’s principal executive officer and principal financial officer, as required by Rule 30a-2(b) under the Investment Company Act of 1940. Attached hereto. |
SIGNATURES
Pursuant to the requirements of the Securities Exchange Act of 1934 and the Investment Company Act of 1940, the registrant has duly caused this report to be signed on its behalf by the undersigned, thereunto duly authorized.
FPA NEW INCOME, INC.
By: | /s/ THOMAS H. ATTEBERRY | |
Thomas H. Atteberry, Chief Executive Officer |
(Principal Executive Officer) |
Date: November 21, 2013
Pursuant to the requirements of the Securities Exchange Act of 1934 and the Investment Company Act of 1940, this report has been signed below by the following persons on behalf of the registrant and in the capacities and on the dates indicated.
FPA NEW INCOME, INC.
By: | /s/ THOMAS H. ATTEBERRY | |
Thomas H. Atteberry, Chief Executive Officer |
(Principal Executive Officer) |
Date: November 21, 2013
By: | /s/ J. RICHARD ATWOOD | |
J. Richard Atwood, Treasurer |
(Principal Financial Officer) |
Date: November 21, 2013