UNITED STATES
SECURITIES AND EXCHANGE COMMISSION
Washington, D.C. 20549
FORM N-CSR
CERTIFIED SHAREHOLDER REPORT OF REGISTERED
MANAGEMENT INVESTMENT COMPANIES
Investment Company Act file number | 811-1735 |
|
FPA NEW INCOME, INC. |
(Exact name of registrant as specified in charter) |
|
11601 WILSHIRE BLVD., STE. 1200 LOS ANGELES, CALIFORNIA | | 90025 |
(Address of principal executive offices) | | (Zip code) |
|
(Name and Address of Agent for Service) | Copy to: |
| |
J. RICHARD ATWOOD, PRESIDENT FPA NEW INCOME, INC. 11601 WILSHIRE BLVD., STE. 1200 LOS ANGELES, CALIFORNIA 90025 | MARK D. PERLOW, ESQ. DECHERT LLP ONE BUSH STREET, STE. 1600 SAN FRANCISCO, CA 94104 |
|
Registrant’s telephone number, including area code: | (310) 473-0225 | |
|
Date of fiscal year end: | September 30 | |
|
Date of reporting period: | September 30, 2016 | |
| | | | | | | | | |
Item 1: Report to Shareholders.

Distributor:
UMB DISTRIBUTION SERVICES, LLC
235 West Galena Street
Milwaukee, Wisconsin 53212
FPA NEW INCOME, INC.
LETTER TO SHAREHOLDERS
Dear Fellow Shareholders,
FPA New Income (the "Fund") had a total return of 0.75% in the third quarter of 2016 and a return of 1.52% for one year ending September 30, 2016.
As many of you know, the Fund operates on a fiscal year that ends on September 30. Therefore, as has been our practice, we are including the Fund's results for the full fiscal year in this quarter's letter.
As of September 30, the portfolio had a yield-to-worst1 of 2.58% and an effective duration2 of 1.30 years. The yield-to-worst decreased in comparison to the second quarter due to an increase in the price for the portfolio's credit-sensitive holdings (defined as investments rated BBB+ or lower). The credit-sensitive holdings in the portfolio continued to decrease from 17.9% of the portfolio as of June 30, 2016 to 17.6% at the end of the third quarter, driven by amortization of existing holdings and sales of corporate bonds and bank debt, partially offset by new investments. Cash decreased during the quarter from 7.93% of the portfolio as of June 30, 2016 to 6.81% as of September 30.
Portfolio Commentary
Portfolio Performance
Fiscal Year 2016
The largest contribution to the Fund's performance came from our asset-backed security3 holdings with the sub-prime automobile holdings being the key driver in this sector. Other areas that contributed positively over the year were corporate bonds, bank debt portion and collateralized mortgage obligation portion of the portfolio, specifically bonds backed by either non-performing or re-performing mortgages.
The Fund's largest detractor from the fiscal year performance was its allocation to GNMA project loan interest-only securities. The income earned from those investments did not fully offset the principal losses caused by amortization and widening interest rate spreads over the last year. While the single-family mortgage interest-only securities as a whole made a small positive contribution to performance, those bonds backed by 15-year amortization agency single-family mortgages had a negative effect on the overall portfolio due to the decline in intermediate-maturity treasury rates. Declining rates lead to refinancing increases, in turn negatively affecting the performance of the Fund's interest-only securities.
Third Quarter 2016
Over the past quarter, the Fund's corporate credit segment was the largest contributor to performance, boosted primarily by metals and mining and energy sector bonds. The recovery in the price of oil and in mineral commodities was the key driver of this performance.
1 Yield-to-worst is the lowest possible yield on a callable bond. As of September 30, 2016, the SEC yield was 2.82%. This calculation begins with the Fund's dividend payments for the last 30 days, subtracts Fund expenses and uses this number to estimate your returns for a year. The SEC yield is based on the price of the Fund at the beginning of the month. The income yield stated here reflects prospective data and thus assumes payments collected by the Fund may fluctuate.
2 Duration is a measure of the sensitivity of the price (the value of principal) of a fixed-income investment to a change in interest rates.
3 Asset backed securities are financial securities backed by a loan, lease or receivables against assets other than real estate and mortgage-backed securities.
1
FPA NEW INCOME, INC.
LETTER TO SHAREHOLDERS
(Continued)
Bonds backed by non-performing mortgages as well as the asset-backed securities with the sub-prime automobile holdings also contributed positively to the Fund's performance.
The only negative contribution to the third quarter performance came from the GNMA project loan interest only securities. These bonds were negatively impacted by a rise in the yield of the five-year treasury and an increase in the spread between these bonds and the five-year treasury.
Portfolio Positioning
The table below shows the change in allocation to various sectors over the third quarter and compared to a year ago.
| Sector | | % Portfolio
9/30/2016 | | % Portfolio
6/30/2016 | | % Portfolio
9/30/2015 | |
ABS | | | 44.65 | % | | | 43.22 | % | | | 38.39 | % | |
Mortgage Backed (CMO4) | | | 13.38 | % | | | 14.90 | % | | | 20.13 | % | |
Stripped Mortgage-backed | | | 13.74 | % | | | 12.70 | % | | | 11.48 | % | |
Corporate | | | 6.61 | % | | | 5.86 | % | | | 9.67 | % | |
Cash and equivalents | | | 6.81 | % | | | 7.93 | % | | | 7.78 | % | |
CMBS5 | | | 5.15 | % | | | 5.73 | % | | | 5.81 | % | |
Mortgage Pass-through | | | 3.82 | % | | | 4.01 | % | | | 5.55 | % | |
U.S. Treasury | | | 5.37 | % | | | 5.20 | % | | | 0.00 | % | |
Municipal | | | 0.47 | % | | | 0.45 | % | | | 1.19 | % | |
Total | | | 100 | % | | | 100 | % | | | 100 | % | |
Over both periods, holdings of single-family mortgages continued to decline in both the mortgage-backed and mortgage pass-through areas. This decline was primarily driven by the amortization of principal. We did not find an opportunity to add to our holdings of bonds backed by non-performing mortgages, simply due to the unattractive return profile relative to the risk. We continue to find attractive purchase opportunities in GNMA project loan interest-only bonds, predominantly in 2015 and 2016 vintage bonds. On the other hand, during our continuous reevaluation of all the Fund's holdings, we found that several of our GNMA project loan interest-only holdings, issued prior to 2013, no longer passed our interest rate stress test for sensitivity to a 100 basis points increase in interest rates over 12-month period. As a result, we sold these positions.
The corporate holdings increased slightly during the quarter as a result of some new bank debt investments, while down year-over-year due to sales and calls of existing bonds and bank debt. Consistent with our concerns regarding the credit markets, we have focused our corporate investments on bank debt that is secured at what we believe to be reasonable leverage levels and that has adequate structural protections such as covenants. In combination with attractive pricing, we believe that these bank debt investments offer a compelling return profile relative to the credit risk, in stark contrast to the investments available elsewhere in corporate credit markets.
Within the asset-backed portion of the portfolio, we continue to be active purchasers of bonds in the sub-prime auto sector and in other niche areas in the high-quality portion of the market (defined as investments rated A- or higher).
4 Collateralized mortgage obligations are mortgage-backed bonds that separate mortgage pools into different maturity classes.
5 Commercial mortgage backed securities are securities backed by commercial mortgages rather than residential mortgages.
2
FPA NEW INCOME, INC.
LETTER TO SHAREHOLDERS
(Continued)
Finally, the Fund's cash and equivalents declined slightly as a result of investment activity.
Fund announcement
As mentioned in June 30, 2016 commentary, July 11 marked the 32nd anniversary of our management of the FPA New Income, Inc. The investment strategy that began in 1984 with just approximately $4 million in assets and a single analyst has grown to include a team of six seasoned professionals overseeing $6.3 billion in assets today, including $5.0 billion in the Fund.
Much has changed in 32 years, but two things have not changed: (1) our value-oriented investment discipline, and (2) our objective of achieving a long-term real return while providing an absolute positive return in a 12-month period. As we enter the 33rd year of managing the Fund, we have achieved a positive return every calendar year.
Critical to achieving this performance is maintaining a high quality portfolio. As a reminder to our investors, the Fund must have at least 75% of its assets in high quality investments, and may have up to 25% of its assets in credit investments. Since its creation, the Fund's guidelines have categorized investments rated AA- or higher as 'high quality,' and investments rated A+ or lower as credit investments. The demarcation of the portfolio at AA- was driven by a desire to distinguish between bonds whose performance is driven by macroeconomic factors and bonds whose performance is driven by credit factors.
As the research team's expertise deepened and broadened to cover more sectors of the bond market, our fundamental analysis has led us to the realization that the ratings standards we had previously adhered to merited review. With the culmination of a research process that has been underway for many years, we concluded that single-A rated bonds are also appropriate for the high quality portion of the portfolio.
We employ a bottom-up research process on every investment. That detailed process found that the performance of single-A bonds more closely resembles that of AA rated bonds than the performance of lower rated bonds. In fact, our research revealed that historically, the losses and price volatility of single-A rated bonds have been similar to AA rated bonds.
These findings resulted in our reevaluating the ratings constraint in the Fund's guidelines. After much discussion and testing, we decided to change the Fund's guideline to include A- or higher rated investments in the high quality portion of the portfolio. We concluded that the change in the ratings threshold would improve our ability to achieve our long-term investment objectives while preserving the Fund's character as a high quality, low volatility, conservative fixed income vehicle. Importantly, this change was made with an eye toward the future. Given the current lack of attractive investment opportunities, we do not currently expect to meaningfully increase the Fund's exposure to single-A rated bonds in the short term.
In this time of heightened risk, we are best served by preserving capital in preparation for a better investing environment in the future. Consistent with our philosophy of investors first, rather than taking on extra risk and potentially exposing our investors' capital to losses in pursuit of higher yields, this historically low yield environment has led us to reduce the Fund's expenses. Effective June 1, we capped the Fund's total expenses at 49 basis points. We will review this expense cap on an annual basis, and it will remain in place until the fixed income markets improve enough to warrant a change.
3
FPA NEW INCOME, INC.
LETTER TO SHAREHOLDERS
(Continued)
Market Commentary
We have been managing fixed income assets in a consistent strategy for over 32 years. Over this period of time we have periodically been asked how our unique approach is being utilized by our clients. As a quick refresher that approach is centered on two objectives.
• A positive absolute return in a 12-month period
• A return greater than the consumer price index plus 100 basis points over a five-year period.
With these two goals driving our investment decision process, we feel the value of this approach has never been greater given today's unprecedented fixed income market conditions.
U.S. Treasury yields, once again, near record lows we felt it prudent to examine key aspects of the bond market and highlight how we have positioned the Fund in light of this. The 10-year Treasury note's yield has fallen from 3% in 2014 to less than 1.4% earlier this year. We have long-discussed the risks these low rates create for the bond market. As a result "core" bond funds — those funds that have similar yield and duration characteristics to the Bloomberg Barclays U.S. Aggregate Bond Index (the "Index") — find themselves in a particularly precarious position.
Investors might utilize core bond funds to achieve one or both of the following roles in a portfolio:
- Add a less volatile source of income and return to a portfolio.
- Reduce overall portfolio volatility through the use of an asset class that does not have a strong positive correlation to equities or other equity like investments.
In light of current bond market conditions, below we examine our concerns with the ability of core bond funds to fulfill these roles. We also introduce FPA New Income as a potentially attractive investment alternative for meeting these two objectives.
Currently, investors in core bond funds are receiving historically low yields while also taking on historically high levels of interest rate risk. The chart below shows the ratio of yield per year of duration which measures the Index's ability to withstand rising interest rates and credit spreads. A lower ratio means that the Index is more exposed to losses if interest rates and/or credit spreads were to rise.
4
FPA NEW INCOME, INC.
LETTER TO SHAREHOLDERS
(Continued)
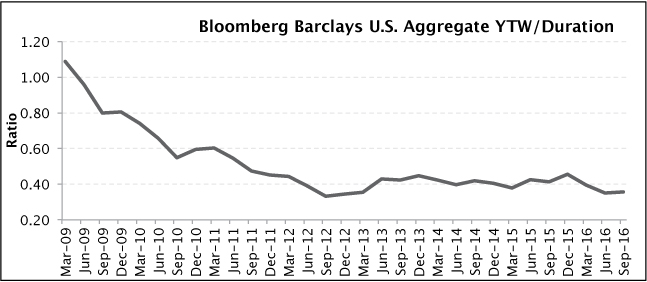
Source: Barclays.
Over the past several years, the Index has generated attractive returns. However, these returns have resulted mostly from price appreciation (yields falling) rather than from income. 2012 was the most recent time that interest rates or yields neared today's levels. Subsequently, in 2013, yields began to rise, resulting in losses, large drawdowns, and higher volatility for the Index. The table below compares the performance of the Index from July 2012 when 10-Year Treasury rates were at the lowest point since the inception of QE6 through 12/31/13 which marked the post-QE high in rates. Also shown is the performance of FPA New Income over this time period:
| | % Return
7/24/12-1/1/14 | | Max
Drawdown7
7/22/12-1/4/14 | | Standard
Deviation7
7/22/12-1/4/14 | |
Bloomberg Barclays U.S. Aggregate Index | | | -1.62 | | | | -4.52 | | | | 3.30 | | |
FPA New Income | | | 1.52 | | | | -1.14 | | | | 0.96 | | |
Source: Morningstar Direct.
During those 15 months, the Index experienced a loss that erased more than three years of income. Should another retracement occur today, it would not be a surprise to see the Index post similar losses again. Thus, we question whether the Index is well suited today as a low volatility source of income and return. In contrast, during the 2012-2013 periods, FPA New Income produced a positive return with a smaller drawdown and much lower volatility.
6 QE (Quantitative easing) is an unconventional monetary policy in which a central bank purchases government securities or other securities from the market in order to lower interest rates and increase the money supply.
7 Closest time periods to 7/24/12-1/1/14 are chosen based on available data. Only weekly data is available. Maximum Drawdown is the maximum loss from a peak to a trough of a portfolio, before a new peak is attained. Standard Deviation is a measure of the dispersion of a set of data from its mean.
5
FPA NEW INCOME, INC.
LETTER TO SHAREHOLDERS
(Continued)
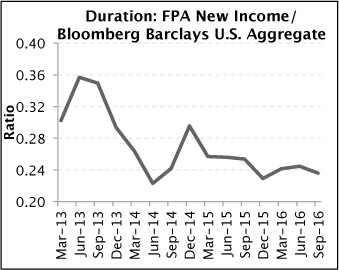
Indeed, FPA New Income may be in an even better position today to deliver attractive absolute and risk-adjusted returns than it was at the beginning of 2013. As of September 30, 2016, the Fund had a 32% greater yield-to-worst than the Index while taking on just 24% of the interest rate risk. These advantages over the Index are at or near three-year highs.
Source: FPA, Bloomberg.
| Risk/reward (as of 9/30/16) | | Yield-to-worst (%) | | Effective
duration (yrs) | | YTW/Duration | |
FPA New Income | | | 2.58 | | | | 1.30 | | | | 1.98 | | |
Bloomberg Barclays U.S. Aggregate Index | | | 1.96 | | | | 5.51 | | | | 0.36 | | |
Bloomberg Barclays U.S. Aggregate 1-3 Year Index | | | 1.07 | | | | 1.91 | | | | 0.56 | | |
Source: FPA, Bloomberg. Past performance does not guarantee future results.
Notwithstanding the foregoing, some investors may own core bond funds because of a view that the U.S. may follow Japan and Europe into zero or negative yield territory. It is possible that bond yields could decline even further if, for example, the economy goes into a recession or deflation fears reemerge. However, unless one assigns a high probability to that outcome, core bond funds, in our opinion, now look more like deflation protection with a negative skew8 than an actual investment.
Alternatively, some investors may own core funds not because of their investment merit but because of their attribute of being less correlated to and less volatile than other investments. For example, core bond funds have typically had a negative correlation to major equity markets during major selloffs. However, the negative
8 By negative skew we mean a relatively high probability of small, incremental gains, offset by a modest probability of steep losses that can wipe out weeks or months of gains in short order.
6
FPA NEW INCOME, INC.
LETTER TO SHAREHOLDERS
(Continued)
correlation feature of the Index has predictably decreased along with the Index's yield. While we do not manage FPA New Income for short-term performance, its longer-term performance has exhibited a low or negative correlation to the S&P 500 Index, similar to the Bloomberg Barclays U.S. Aggregate Bond Index.
Correlation to S&P 500 over rolling 12-month periods
| January 2007-August 2016 | | Low or negative
correlation
(<20%) | | Negative
correlation (<0) | |
Bloomberg Barclays U.S. Aggregate Index | | | 80 | % | | | 57 | % | |
FPA New Income | | | 74 | % | | | 50 | % | |
Bloomberg Barclays U.S. Aggregate 1-3 Year Index | | | 55 | % | | | 40 | % | |
Source: Morningstar Direct.
In conclusion, upon analyzing the investment characteristics of core bond funds, we believe it is prudent for investors to consider reducing exposure to interest rate risk within the context of their "core" bond holdings. In this environment, unless investors are trying to protect against a tail event, FPA New Income may well serve as an attractive "core" in the portfolio, as it has historically offered more yield than the Index with significantly less interest rate risk while serving as effective portfolio ballast.
We thank you for your continued support and we continue to work diligently to maintain your trust.
Respectfully submitted,

Thomas H. Atteberry
Portfolio Manager

Abhijeet Patwardhan
Portfolio Manager
October 2016
7
FPA NEW INCOME, INC.
LETTER TO SHAREHOLDERS
(Continued)
Performance data quoted in this letter represents past performance and neither indicates nor guarantees future performance. The discussions of Fund investments represent the views of the Fund's managers at the time of this report and are subject to change without notice. References to individual securities are for informational purposes only and should not be construed as recommendations to purchase or sell individual securities.
FUND RISKS
Investments in mutual funds carry risks and investors may lose principal value. Stock markets are volatile and can decline significantly in response to adverse issuer, political, regulatory, market, or economic developments. The funds may purchase foreign securities which are subject to interest rate, currency exchange rate, economic and political risks: this may be enhanced when investing in emerging markets. The securities of smaller, less well-known companies can be more volatile than those of larger companies. The return of principal in a bond fund is not guaranteed. Bond funds have the same issuer, interest rate, inflation and credit risks that are associated with underlying bonds owned by the fund. Lower rated bonds, convertible securities and other types of debt obligations involve greater risks than higher rated bonds. Mortgage securities and collateralized mortgage obligations (CMOs) are subject to prepayment risk and the risk of default on the underlying mortgages or other assets; derivatives may increase volatility. High yield securities can be volatile and subject to much higher instances of default.
FORWARD LOOKING STATEMENT DISCLOSURE
As mutual fund managers, one of our responsibilities is to communicate with shareholders in an open and direct manner. Insofar as some of our opinions and comments in our letters to shareholders are based on our current expectations, they are considered "forward-looking statements" which may or may not prove to be accurate over the long term. While we believe we have a reasonable basis for our comments and we have confidence in our opinions, actual results may differ materially from those we anticipate. You can identify forward-looking statements by words such as "believe," "expect," "may," "anticipate," and other similar expressions when discussing prospects for particular portfolio holdings and/or the markets, generally. We cannot, however, assure future results and disclaim any obligation to update or alter any forward-looking statements, whether as a result of new information, future events, or otherwise. Further, information provided in this report should not be construed as a recommendation to purchase or sell any particular security.
8
FPA NEW INCOME, INC.
HISTORICAL PERFORMANCE
(Unaudited)
Change in Value of a $10,000 Investment in FPA New Income, Inc. vs. Barclays U.S. Aggregate Index and Consumer Price Index + 100 Basis Points from October 1, 2006 to September 30, 2016
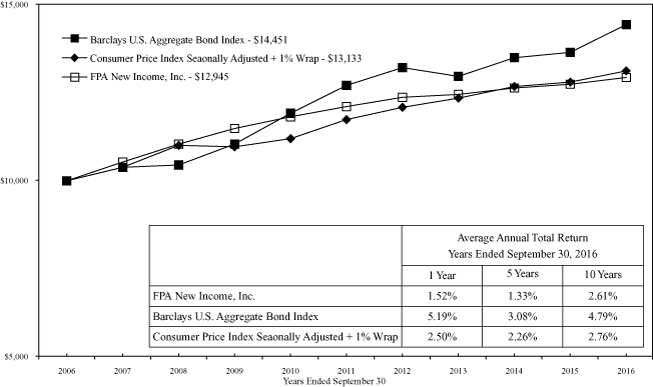
Past performance is not indicative of future performance. The Barclays U.S. Aggregate Bond Index a broad-based unmanaged composite of four major subindexes: U.S. Government Index; U.S. Credit Index; U.S. Mortgage-Backed Securities Index; and U.S. Asset-Backed Securities Index. The index holds investment quality bonds. The Consumer Price Index is an unmanaged index representing the rate of inflation of U.S. consumer prices as determined by the US Department of Labor Statistics. The performance of the Fund and of the Averages is computed on a total return basis which includes reinvestment of all distributions.
Past performance is no guarantee of future results, and current performance may be higher or lower than the performance shown. This data represents past performance, and investors should understand that investment returns and principal values fluctuate, so that when you redeem your investment it may be worth more or less than its original cost. Current month-end performance data can be obtained by visiting the website at www.fpafunds.com or by calling toll-free, 1-800-982-4372. Information regarding the Fund's expense ratio and redemption fees can be found on pages 41 and 45.
The Prospectus details the Fund's objective and policies, charges, and other matters of interest to prospective investors. Please read the prospectus carefully before investing. The Prospectus may be obtained by visiting the website at www.fpafunds.com, by email at crm@fpafunds.com, toll-free by calling 1-800-982-4372 or by contacting the Fund in writing.
9
FPA NEW INCOME, INC.
PORTFOLIO SUMMARY
September 30, 2016
Bonds & Debentures | | | | | 98.0 | % | |
Asset-Backed Securities | | | 44.6 | % | | | | | |
Commercial Mortgage-Backed Securities | | | 18.1 | % | | | | | |
Residential Mortgage-Backed Securities | | | 18.0 | % | | | | | |
U.S. Treasuries | | | 10.2 | % | | | | | |
Corporate Bonds & Notes | | | 4.0 | % | | | | | |
Corporate Bank Debt | | | 2.6 | % | | | | | |
Municipals | | | 0.5 | % | | | | | |
Short-term Investments | | | | | 2.9 | % | |
Other Assets And Liabilities, Net | | | | | (0.9 | )% | |
Net Assets | | | | | 100.0 | % | |
10
FPA NEW INCOME, INC.
PORTFOLIO OF INVESTMENTS
September 30, 2016
BONDS & DEBENTURES | | Principal
Amount | | Fair
Value | |
COMMERCIAL MORTGAGE-BACKED SECURITIES — 18.1% | |
AGENCY — 0.2% | |
Government National Mortgage Association | |
| 2013-55 A — 1.317% 5/16/2034 | | $ | 721,311 | | | $ | 719,545 | | |
| 2012-2 A — 1.862% 6/16/2031 | | | 2,623,982 | | | | 2,629,079 | | |
| 2011-49 A — 2.45% 7/16/2038 | | | 1,766,545 | | | | 1,777,499 | | |
| 2010-155 B — 2.525% 6/16/2039 | | | 2,710,514 | | | | 2,729,859 | | |
| 2011-143 AB — 3.866% 3/16/2033@ | | | 4,334,302 | | | | 4,343,708 | | |
| 2010-148 AC — 7.00% 12/16/2050@ | | | 137,546 | | | | 144,180 | | |
| | | $ | 12,343,870 | | |
AGENCY STRIPPED — 13.0% | |
Government National Mortgage Association | |
| 2004-10 IO — 0.00% 1/16/2044@ | | $ | 11,927,585 | | | $ | 119 | | |
| 2010-49 IO — 0.00% 2/16/2050@ | | | 20,462,909 | | | | 266,018 | | |
| 2002-56 IO — 0.043% 6/16/2042@ | | | 46,656 | | | | 66 | | |
| 2009-119 IO — 0.053% 12/16/2049@ | | | 25,052,489 | | | | 407,604 | | |
| 2011-10 IO — 0.076% 12/16/2045@ | | | 47,023,270 | | | | 674,784 | | |
| 2009-105 IO — 0.165% 11/16/2049@ | | | 10,912,213 | | | | 181,688 | | |
| 2009-86 IO — 0.21% 10/16/2049@ | | | 35,880,455 | | | | 512,732 | | |
| 2008-8 IO — 0.233% 11/16/2047@ | | | 17,473,881 | | | | 196,581 | | |
| 2010-28 IO — 0.25% 3/16/2050@ | | | 16,863,041 | | | | 321,915 | | |
| 2009-60 IO — 0.253% 6/16/2049@ | | | 8,812,092 | | | | 230,612 | | |
| 2009-71 IO — 0.259% 7/16/2049@ | | | 3,419,990 | | | | 58,071 | | |
| 2009-4 IO — 0.445% 1/16/2049@ | | | 4,147,813 | | | | 73,831 | | |
| 2013-7 IO — 0.445% 5/16/2053@ | | | 288,903,606 | | | | 11,520,609 | | |
| 2007-77 IO — 0.461% 11/16/2047@ | | | 28,909,382 | | | | 562,288 | | |
| 2009-49 IO — 0.47% 6/16/2049@ | | | 14,470,763 | | | | 327,329 | | |
| 2008-24 IO — 0.497% 11/16/2047@ | | | 2,916,908 | | | | 59,709 | | |
| 2012-125 IO — 0.503% 2/16/2053@ | | | 88,824,971 | | | | 3,414,441 | | |
| 2013-72 IO — 0.514% 11/16/2047@ | | | 453,882,099 | | | | 19,069,539 | | |
| 2005-9 IO — 0.55% 1/16/2045@ | | | 3,233,289 | | | | 22,956 | | |
| 2012-45 IO — 0.561% 4/16/2053@ | | | 21,228,219 | | | | 800,087 | | |
| 2013-29 IO — 0.57% 5/16/2053@ | | | 102,034,112 | | | | 4,399,537 | | |
| 2010-123 IO — 0.595% 9/16/2050@ | | | 29,268,687 | | | | 842,938 | | |
| 2009-30 IO — 0.62% 3/16/2049@ | | | 8,002,872 | | | | 256,732 | | |
| 2015-104 IO — 0.653% 5/16/2055@ | | | 174,194,812 | | | | 9,381,471 | | |
| 2008-45 IO — 0.669% 2/16/2048@ | | | 6,403,702 | | | | 124,296 | | |
| 2012-95 IO — 0.732% 2/16/2053@ | | | 121,102,619 | | | | 6,149,845 | | |
| 2012-131 IO — 0.743% 2/16/2053@ | | | 80,497,671 | | | | 3,725,843 | | |
| 2014-120 IO — 0.759% 4/16/2056@ | | | 66,910,145 | | | | 3,659,650 | | |
| 2004-43 IO — 0.765% 6/16/2044@ | | | 17,397,545 | | | | 493,046 | | |
11
FPA NEW INCOME, INC.
PORTFOLIO OF INVESTMENTS (Continued)
September 30, 2016
BONDS & DEBENTURES — Continued | | Principal
Amount | | Fair
Value | |
| 2012-25 IO — 0.767% 8/16/2052@ | | $ | 124,250,958 | | | $ | 5,083,330 | | |
| 2013-63 IO — 0.769% 9/16/2051@ | | | 24,416,608 | | | | 1,351,755 | | |
| 2012-4 IO — 0.774% 5/16/2052@ | | | 165,685,572 | | | | 4,905,039 | | |
| 2014-157 IO — 0.784% 5/16/2055@ | | | 191,684,707 | | | | 11,343,959 | | |
| 2012-150 IO — 0.789% 11/16/2052@ | | | 83,913,889 | | | | 4,805,799 | | |
| 2008-48 IO — 0.812% 4/16/2048@ | | | 10,261,291 | | | | 275,926 | | |
| 2012-58 IO — 0.815% 2/16/2053@ | | | 249,710,430 | | | | 12,493,013 | | |
| 2011-165 IO — 0.832% 10/16/2051@ | | | 184,234,327 | | | | 5,941,557 | | |
| 2011-147 IO — 0.836% 10/16/2044@ | | | 54,826,032 | | | | 1,702,348 | | |
| 2008-92 IO — 0.842% 10/16/2048@ | | | 23,280,358 | | | | 754,051 | | |
| 2014-138 IO — 0.85% 4/16/2056@ | | | 30,869,128 | | | | 1,888,499 | | |
| 2012-79 IO — 0.857% 3/16/2053@ | | | 160,279,313 | | | | 8,316,894 | | |
| 2013-1 IO — 0.857% 2/16/2054@ | | | 127,600,560 | | | | 7,805,888 | | |
| 2012-85 IO — 0.859% 9/16/2052@ | | | 166,606,601 | | | | 9,102,752 | | |
| 2013-125 IO — 0.859% 10/16/2054@ | | | 24,729,376 | | | | 1,207,160 | | |
| 2014-164 IO — 0.862% 1/16/2056@ | | | 332,419,771 | | | | 20,397,942 | | |
| 2013-80 IO — 0.865% 3/16/2052@ | | | 59,421,637 | | | | 3,845,780 | | |
| 2014-77 IO — 0.873% 12/16/2047@ | | | 84,021,943 | | | | 4,988,458 | | |
| 2012-114 IO — 0.874% 1/16/2053@ | | | 55,730,561 | | | | 3,590,982 | | |
| 2006-55 IO — 0.876% 8/16/2046@ | | | 14,742,798 | | | | 265,518 | | |
| 2015-86 — 0.89% 5/16/2052@ | | | 82,258,378 | | | | 5,504,813 | | |
| 2013-45 IO — 0.891% 12/16/2053@ | | | 95,348,816 | | | | 4,448,108 | | |
| 2014-135 IO — 0.893% 1/16/2056@ | | | 349,842,754 | | | | 22,155,717 | | |
| 2013-13 IO — 0.91% 7/16/2047@ | | | 138,238,100 | | | | 7,399,222 | | |
| 2014-28 IO — 0.922% 10/16/2054@ | | | 73,201,593 | | | | 4,653,162 | | |
| 2015-47 IO — 0.927% 10/16/2056@ | | | 217,176,546 | | | | 16,192,966 | | |
| 2013-30 IO — 0.951% 9/16/2053@ | | | 212,298,984 | | | | 12,408,175 | | |
| 2011-143 IO — 0.952% 4/16/2053@ | | | 65,844,608 | | | | 5,223,453 | | |
| 2014-175 IO — 0.953% 4/16/2056@ | | | 281,110,458 | | | | 20,084,892 | | |
| 2013-61 IO — 0.955% 5/16/2053@ | | | 142,024,536 | | | | 8,289,475 | | |
| 2015-7 IO — 0.957% 1/16/2057@ | | | 22,180,265 | | | | 1,601,322 | | |
| 2014-110 IO — 0.969% 1/16/2057@ | | | 106,095,231 | | | | 8,311,744 | | |
| 2015-128 IO — 0.977% 12/16/2056@ | | | 221,574,352 | | | | 16,373,237 | | |
| 2015-160 IO — 0.981% 1/16/2056@ | | | 285,816,476 | | | | 21,246,139 | | |
| 2012-53 — 0.984% 3/16/2047@ | | | 99,315,231 | | | | 5,067,599 | | |
| 2015-19 IO — 0.99% 1/16/2057@ | | | 167,362,049 | | | | 13,040,081 | | |
| 2014-153 IO — 0.997% 4/16/2056@ | | | 290,171,542 | | | | 21,439,150 | | |
| 2015-41 IO — 1.003% 9/16/2056@ | | | 74,529,729 | | | | 5,343,670 | | |
| 2015-169 IO — 1.004% 7/16/2057@ | | | 253,870,279 | | | | 21,166,485 | | |
| 2015-150 IO — 1.005% 9/16/2057@ | | | 275,181,301 | | | | 23,446,438 | | |
12
FPA NEW INCOME, INC.
PORTFOLIO OF INVESTMENTS (Continued)
September 30, 2016
BONDS & DEBENTURES — Continued | | Principal
Amount | | Fair
Value | |
| 2015-101 IO — 1.01% 3/16/2052@ | | $ | 215,463,517 | | | $ | 15,310,062 | | |
| 2014-187 IO — 1.01% 5/16/2056@ | | | 251,527,584 | | | | 18,775,805 | | |
| 2016-34 — 1.016% 1/16/2058@ | | | 230,038,193 | | | | 18,939,067 | | |
| 2016-65 — 1.016% 1/16/2058@ | | | 252,796,962 | | | | 21,038,800 | | |
| 2016-45 — 1.017% 2/16/2058@ | | | 134,912,947 | | | | 10,808,173 | | |
| 2015-114 IO — 1.044% 3/15/2057@ | | | 193,191,867 | | | | 13,745,427 | | |
| 2016-106 — 1.068% 9/16/2058@,†† | | | 277,922,467 | | | | 24,719,119 | | |
| 2015-108 IO — 1.097% 10/16/2056@ | | | 59,416,566 | | | | 4,798,957 | | |
| 2016-85 — 1.123% 3/16/2057@ | | | 166,444,490 | | | | 14,515,208 | | |
| 2016-119 — 1.127% 4/16/2058@ | | | 411,700,000 | | | | 36,138,491 | | |
| 2016-125 — 1.15% 12/16/2057@ | | | 158,670,000 | | | | 14,106,366 | | |
| 2016-67 — 1.168% 7/16/2057@ | | | 124,233,591 | | | | 10,659,180 | | |
| 2016-94 — 1.17% 12/16/2057@ | | | 223,658,730 | | | | 19,708,942 | | |
| 2008-78 IO — 1.24% 7/16/2048@ | | | 1,403,232 | | | | 41,844 | | |
| 2014-49 IO — 1.29% 8/16/2054@ | | | 137,130,353 | | | | 10,528,416 | | |
| 2004-108 IO — 1.364% 12/16/2044@ | | | 4,760,797 | | | | 250,513 | | |
| 2006-30 IO — 2.156% 5/16/2046@ | | | 1,693,153 | | | | 45,698 | | |
| | | $ | 655,326,903 | | |
NON-AGENCY — 4.9% | |
A10 Securitization LLC
2016-1 A1 — 2.42% 3/15/2035** | | $ | 10,128,000 | | | $ | 10,172,219 | | |
A10 Securitiztion LLC
2013-2 A — 2.62% 11/15/2027** | | | 3,583,130 | | | | 3,578,600 | | |
Bear Stearns Commercial Mortgage Securities Trust | |
| 2005-PWR7 B — 5.214% 2/11/2041@ | | | 6,424,980 | | | | 6,422,410 | | |
| 2007-PW17 A1A — 5.65% 6/11/2050@ | | | 13,987,477 | | | | 14,370,691 | | |
Citigroup Commercial Mortgage Trust
2006-C4 B — 6.191% 3/15/2049@ | | | 7,489,224 | | | | 7,468,362 | | |
COMM Mortgage Trust | |
| 2012-9W57 A — 2.365% 2/10/2029** | | | 53,551,000 | | | | 53,651,467 | | |
| 2014-FL5 C — 2.674% 10/15/2031**,@ | | | 8,240,000 | | | | 7,944,781 | | |
JP Morgan Chase Commercial Mortgage Securities Trust
2013-WT A — 2.804% 2/16/2025** | | | 17,309,948 | | | | 17,346,075 | | |
Morgan Stanley Capital I Trust
2006-HQ9 D — 5.862% 7/12/2044@ | | | 9,865,000 | | | | 9,811,755 | | |
Ores LLC
2014-LV3 B — 6.00% 3/27/2024** | | | 49,969,000 | | | | 49,969,000 | | |
Rialto Capital Management LLC
2014-LT5 B — 5.00% 5/15/2024**,†† | | | 7,412,000 | | | | 7,412,000 | | |
Rialto Real Estate Fund LP | |
| 2015-LT7 B — 5.071% 12/25/2032**,†† | | | 17,716,000 | | | | 17,361,680 | | |
13
FPA NEW INCOME, INC.
PORTFOLIO OF INVESTMENTS (Continued)
September 30, 2016
BONDS & DEBENTURES — Continued | | Principal
Amount | | Fair
Value | |
| 2014-LT6 B — 5.486% 9/15/2024** | | $ | 8,921,737 | | | $ | 8,914,596 | | |
VFC LLC
2014-2 B — 5.50% 7/20/2030** | | | 3,854,739 | | | | 3,854,586 | | |
Wachovia Bank Commercial Mortgage Trust Series
2007-C34 A3 — 5.678% 5/15/2046 | | | 29,289,812 | | | | 29,804,478 | | |
| | | $ | 248,082,700 | | |
TOTAL COMMERICAL MORTGAGE-BACKED SECURITIES
(Cost $993,248,050) | | $ | 915,753,473 | | |
RESIDENTIAL MORTGAGE-BACKED SECURITIES — 18.0% | |
AGENCY COLLATERALIZED MORTGAGE OBLIGATION — 2.5% | |
Federal Home Loan Mortgage Corporation | |
| 3782 PA — 2.75% 11/15/2028 | | $ | 4,321,459 | | | $ | 4,374,981 | | |
| 2809 UC — 4.00% 6/15/2019 | | | 216,358 | | | | 221,154 | | |
| 3957 BV — 4.00% 10/15/2029 | | | 2,078,869 | | | | 2,102,472 | | |
| 2990 TD — 4.00% 5/15/2035 | | | 27,827 | | | | 28,545 | | |
| 3992 H — 4.00% 6/15/2036 | | | 18,322 | | | | 18,347 | | |
| 3796 KN — 4.00% 6/15/2037 | | | 15,774,961 | | | | 16,169,342 | | |
| 3986 P — 4.00% 3/15/2039 | | | 102,221 | | | | 103,047 | | |
| 2614 BY — 4.50% 5/15/2018 | | | 429,870 | | | | 439,369 | | |
| 2645 BY — 4.50% 7/15/2018 | | | 94,892 | | | | 96,843 | | |
| 2649 AN — 4.50% 7/15/2018 | | | 908,045 | | | | 928,443 | | |
| 2656 PE — 4.50% 7/15/2018 | | | 182,526 | | | | 186,765 | | |
| 2930 KT — 4.50% 2/15/2020 | | | 583,804 | | | | 600,645 | | |
| 2995 JK — 4.50% 6/15/2020 | | | 658,601 | | | | 674,380 | | |
| 3271 TB — 4.50% 2/15/2022 | | | 2,086,532 | | | | 2,145,466 | | |
| 3969 MP — 4.50% 4/15/2039 | | | 31,026 | | | | 31,399 | | |
| 2509 CB — 5.00% 10/15/2017 | | | 381,063 | | | | 386,809 | | |
| 2568 XD — 5.00% 2/15/2018 | | | 119,211 | | | | 121,564 | | |
| 3852 HA — 5.00% 12/15/2021 | | | 3,197,172 | | | | 3,337,144 | | |
| 2494 CF — 5.50% 9/15/2017 | | | 321,109 | | | | 326,465 | | |
| 2503 B — 5.50% 9/15/2017 | | | 292,952 | | | | 297,575 | | |
| 3808 BQ — 5.50% 8/15/2025 | | | 3,127,593 | | | | 3,230,710 | | |
| 3806 JB — 5.50% 2/15/2026 | | | 2,354,499 | | | | 2,563,061 | | |
| 3855 HQ — 5.50% 2/15/2026 | | | 1,940,821 | | | | 2,031,166 | | |
| 2453 BD — 6.00% 5/15/2017 | | | 74,014 | | | | 74,853 | | |
Federal National Mortgage Association | |
| 2012-117 DA — 1.50% 12/25/2039 | | | 4,431,653 | | | | 4,413,297 | | |
| 2013-30 CA — 1.50% 4/25/2043 | | | 17,247,006 | | | | 16,550,396 | | |
| 2014-80 GD — 2.00% 2/25/2042 | | | 33,500,360 | | | | 33,695,925 | | |
| 2010-83 AH — 2.50% 11/25/2018 | | | 547,838 | | | | 552,578 | | |
14
FPA NEW INCOME, INC.
PORTFOLIO OF INVESTMENTS (Continued)
September 30, 2016
BONDS & DEBENTURES — Continued | | Principal
Amount | | Fair
Value | |
| 2010-32 CL — 3.75% 8/25/2018 | | $ | 233,191 | | | $ | 237,246 | | |
| 2003-128 NG — 4.00% 1/25/2019 | | | 121,546 | | | | 124,236 | | |
| 2004-7 JK — 4.00% 2/25/2019 | | | 1,036,562 | | | | 1,057,903 | | |
| 2008-18 MD — 4.00% 3/25/2019 | | | 273,461 | | | | 279,071 | | |
| 2004-76 CL — 4.00% 10/25/2019 | | | 273,920 | | | | 279,700 | | |
| 2009-31 A — 4.00% 2/25/2024 | | | 112,781 | | | | 114,266 | | |
| 2009-76 MA — 4.00% 9/25/2024 | | | 234,136 | | | | 237,619 | | |
| 2011-113 NE — 4.00% 3/25/2040 | | | 2,773,322 | | | | 2,828,176 | | |
| 2012-95 AB — 4.00% 11/25/2040 | | | 2,283,501 | | | | 2,300,880 | | |
| 2009-70 NU — 4.25% 8/25/2019 | | | 1,505,346 | | | | 1,537,094 | | |
| 2003-30 HW — 4.50% 4/25/2018 | | | 182,269 | | | | 185,562 | | |
| 2008-40 KA — 4.50% 10/25/2018 | | | 122,131 | | | | 122,695 | | |
| 2008-18 NB — 4.50% 5/25/2020 | | | 560,594 | | | | 571,663 | | |
| 2008-55 JL — 4.50% 7/25/2023 | | | 2,856,872 | | | | 2,976,074 | | |
| 2008-59 KB — 4.50% 7/25/2023 | | | 1,395,483 | | | | 1,430,291 | | |
| 2008-40 KA — 4.50% 8/25/2023 | | | 408,927 | | | | 423,508 | | |
| 2011-7 PA — 4.50% 10/25/2039 | | | 125,536 | | | | 126,898 | | |
| 2012-40 GC — 4.50% 12/25/2040 | | | 3,168,175 | | | | 3,216,626 | | |
| 2012-67 PB — 4.50% 12/25/2040 | | | 3,369,786 | | | | 3,424,107 | | |
| 2002-74 PE — 5.00% 11/25/2017 | | | 130,830 | | | | 132,788 | | |
| 2003-24 PD — 5.00% 4/25/2018 | | | 616,058 | | | | 629,500 | | |
| 2003-46 BG — 5.00% 6/25/2018 | | | 576,639 | | | | 589,754 | | |
| 2004-60 LB — 5.00% 4/25/2034 | | | 4,128,140 | | | | 4,406,500 | | |
| 2011-19 WB — 5.50% 10/25/2018 | | | 1,776,893 | | | | 1,831,728 | | |
| 2009-116 A — 5.50% 4/25/2024 | | | 128,856 | | | | 128,829 | | |
| 2002-9 PC — 6.00% 3/25/2017 | | | 96,087 | | | | 96,720 | | |
| | | $ | 124,992,175 | | |
AGENCY POOL ADJUSTABLE RATE — 0.0% | |
Federal National Mortgage Association
865963 — 2.779% 3/1/2036@ | | $ | 1,710,178 | | | $ | 1,806,033 | | |
AGENCY POOL FIXED RATE — 3.8% | |
Federal Home Loan Mortgage Corporation | |
| G15139 — 4.50% 6/1/2019 | | $ | 350,269 | | | $ | 362,754 | | |
| P60959 — 4.50% 9/1/2020 | | | 786,644 | | | | 809,118 | | |
| G14030 — 4.50% 12/1/2020 | | | 350,524 | | | | 366,815 | | |
| G15169 — 4.50% 9/1/2026 | | | 7,046,109 | | | | 7,391,270 | | |
| G15272 — 4.50% 9/1/2026 | | | 7,769,880 | | | | 8,118,879 | | |
| G15875 — 4.50% 9/1/2026 | | | 8,285,844 | | | | 8,830,741 | | |
| G18056 — 5.00% 6/1/2020 | | | 526,254 | | | | 553,380 | | |
| G13812 — 5.00% 12/1/2020 | | | 2,150,205 | | | | 2,205,638 | | |
| G15036 — 5.00% 6/1/2024 | | | 7,793,007 | | | | 8,140,345 | | |
15
FPA NEW INCOME, INC.
PORTFOLIO OF INVESTMENTS (Continued)
September 30, 2016
BONDS & DEBENTURES — Continued | | Principal
Amount | | Fair
Value | |
| G13667 — 5.00% 8/1/2024 | | $ | 282,158 | | | $ | 300,375 | | |
| G15435 — 5.00% 11/1/2024 | | | 13,523,280 | | | | 14,202,985 | | |
| G15173 — 5.00% 6/1/2026 | | | 5,852,390 | | | | 6,140,042 | | |
| G15407 — 5.00% 6/1/2026 | | | 6,958,286 | | | | 7,452,436 | | |
| G15874 — 5.00% 6/1/2026 | | | 4,010,726 | | | | 4,207,862 | | |
| G12400 — 5.50% 11/1/2016 | | | 318 | | | | 318 | | |
| G12730 — 5.50% 7/1/2017 | | | 3,166 | | | | 3,207 | | |
| G12829 — 5.50% 10/1/2017 | | | 4,044 | | | | 4,110 | | |
| G14187 — 5.50% 12/1/2020 | | | 4,418,276 | | | | 4,597,481 | | |
| J01270 — 5.50% 2/1/2021 | | | 101,240 | | | | 108,121 | | |
| G14035 — 5.50% 12/1/2021 | | | 367,191 | | | | 390,390 | | |
| G15230 — 5.50% 12/1/2024 | | | 9,811,184 | | | | 10,330,235 | | |
| G15458 — 5.50% 12/1/2024 | | | 1,346,839 | | | | 1,445,010 | | |
| G14460 — 6.00% 1/1/2024 | | | 573,618 | | | | 619,552 | | |
| G12139 — 6.50% 9/1/2019 | | | 74,342 | | | | 75,292 | | |
| P50543 — 6.50% 4/1/2037 | | | 72,318 | | | | 79,814 | | |
Federal National Mortgage Association | |
| 254906 — 4.50% 10/1/2018 | | | 237,942 | | | | 244,460 | | |
| 255547 — 4.50% 1/1/2020 | | | 86,430 | | | | 89,938 | | |
| MA0323 — 4.50% 2/1/2020 | | | 325,363 | | | | 337,694 | | |
| MA0358 — 4.50% 3/1/2020 | | | 177,191 | | | | 184,050 | | |
| MA0419 — 4.50% 5/1/2020 | | | 313,819 | | | | 326,212 | | |
| AL6725 — 4.50% 9/1/2020 | | | 3,804,048 | | | | 3,933,955 | | |
| 735920 — 4.50% 10/1/2020 | | | 78,953 | | | | 82,443 | | |
| 995158 — 4.50% 12/1/2020 | | | 137,164 | | | | 143,597 | | |
| 889531 — 4.50% 5/1/2022 | | | 49,098 | | | | 51,314 | | |
| AL6212 — 4.50% 1/1/2027 | | | 9,011,088 | | | | 9,330,492 | | |
| AE0126 — 5.00% 6/1/2020 | | | 7,609,916 | | | | 7,869,109 | | |
| 310097 — 5.00% 10/1/2020 | | | 590,238 | | | | 603,861 | | |
| AE0792 — 5.00% 12/1/2020 | | | 1,908,918 | | | | 1,975,826 | | |
| AE0314 — 5.00% 8/1/2021 | | | 12,778,683 | | | | 13,248,367 | | |
| AD0285 — 5.00% 9/1/2022 | | | 915,290 | | | | 967,001 | | |
| AE0812 — 5.00% 7/1/2025 | | | 2,144,488 | | | | 2,242,659 | | |
| AL5764 — 5.00% 9/1/2025 | | | 7,370,600 | | | | 7,716,706 | | |
| AL6798 — 5.00% 9/1/2025 | | | 11,054,264 | | | | 11,489,490 | | |
| AL4056 — 5.00% 6/1/2026 | | | 8,613,713 | | | | 9,034,924 | | |
| 257100 — 5.50% 1/1/2018 | | | 161,451 | | | | 167,175 | | |
| 745500 — 5.50% 12/1/2018 | | | 925,190 | | | | 946,259 | | |
| 745119 — 5.50% 12/1/2019 | | | 2,684,683 | | | | 2,811,104 | | |
| 995284 — 5.50% 3/1/2020 | | | 695,657 | | | | 705,104 | | |
| 745190 — 5.50% 6/1/2020 | | | 162,066 | | | | 166,023 | | |
16
FPA NEW INCOME, INC.
PORTFOLIO OF INVESTMENTS (Continued)
September 30, 2016
BONDS & DEBENTURES — Continued | | Principal
Amount | | Fair
Value | |
| 889318 — 5.50% 7/1/2020 | | $ | 1,927,556 | | | $ | 2,020,021 | | |
| 745749 — 5.50% 3/1/2021 | | | 256,107 | | | | 271,771 | | |
| AL5867 — 5.50% 8/1/2023 | | | 1,575,451 | | | | 1,646,184 | | |
| AE0237 — 5.50% 11/1/2023 | | | 1,482,963 | | | | 1,554,338 | | |
| AL5812 — 5.50% 5/1/2025 | | | 6,352,329 | | | | 6,651,523 | | |
| AL0471 — 5.50% 7/1/2025 | | | 247,822 | | | | 268,009 | | |
| AL4433 — 5.50% 9/1/2025 | | | 2,141,593 | | | | 2,290,169 | | |
| AL4901 — 5.50% 9/1/2025 | | | 2,971,639 | | | | 3,153,416 | | |
| 735439 — 6.00% 9/1/2019 | | | 221,090 | | | | 228,615 | | |
| 745238 — 6.00% 12/1/2020 | | | 695,171 | | | | 722,710 | | |
| 745832 — 6.00% 4/1/2021 | | | 3,875,795 | | | | 4,060,671 | | |
| AD0951 — 6.00% 12/1/2021 | | | 1,716,609 | | | | 1,814,438 | | |
| AL0294 — 6.00% 10/1/2022 | | | 131,492 | | | | 142,418 | | |
| 890225 — 6.00% 5/1/2023 | | | 1,188,747 | | | | 1,276,608 | | |
| 890403 — 6.00% 5/1/2023 | | | 1,345,410 | | | | 1,407,307 | | |
| 725951 — 7.50% 8/1/2017 | | | 3,498 | | | | 3,550 | | |
Government National Mortgage Association
782281 — 6.00% 3/15/2023 | | | 1,673,575 | | | | 1,826,771 | | |
| | | $ | 190,742,452 | | |
AGENCY STRIPPED — 0.8% | |
Federal Home Loan Mortgage Corporation | |
| 217 PO — 0.00% 1/1/2032@@@ | | $ | 296,761 | | | $ | 281,048 | | |
| 4138 AI — 2.50% 11/15/2022 | | | 3,351,744 | | | | 181,954 | | |
| 3935 LI — 3.00% 10/15/2021 | | | 3,073,013 | | | | 169,728 | | |
| 3948 AI — 3.00% 10/15/2021 | | | 4,046,608 | | | | 205,932 | | |
| 3956 KI — 3.00% 11/15/2021 | | | 8,694,914 | | | | 517,400 | | |
| 3968 AI — 3.00% 12/15/2021 | | | 3,251,140 | | | | 192,221 | | |
| 3992 OI — 3.00% 1/15/2022 | | | 2,680,620 | | | | 157,487 | | |
| 3994 AI — 3.00% 2/15/2022 | | | 6,301,830 | | | | 379,803 | | |
| 3994 EI — 3.00% 2/15/2022 | | | 5,981,839 | | | | 355,850 | | |
| 3998 KI — 3.00% 11/15/2026 | | | 12,760,408 | | | | 993,801 | | |
| 4100 EI — 3.00% 8/15/2027 | | | 62,140,600 | | | | 5,585,352 | | |
| 3706 AI — 3.50% 7/15/2020 | | | 1,345,327 | | | | 12,706 | | |
| 3722 AI — 3.50% 9/15/2020 | | | 4,745,531 | | | | 264,788 | | |
| 3735 AI — 3.50% 10/15/2020 | | | 2,258,068 | | | | 125,424 | | |
| 3874 DI — 3.50% 10/15/2020 | | | 3,081,795 | | | | 86,913 | | |
| 3893 DI — 3.50% 10/15/2020 | | | 2,138,552 | | | | 54,571 | | |
| 3753 CI — 3.50% 11/15/2020 | | | 1,153,317 | | | | 62,989 | | |
| 3755 AI — 3.50% 11/15/2020 | | | 4,457,494 | | | | 252,946 | | |
| 3760 KI — 3.50% 11/15/2020 | | | 3,371,820 | | | | 192,340 | | |
| 3784 BI — 3.50% 1/15/2021 | | | 3,081,448 | | | | 176,546 | | |
17
FPA NEW INCOME, INC.
PORTFOLIO OF INVESTMENTS (Continued)
September 30, 2016
BONDS & DEBENTURES — Continued | | Principal
Amount | | Fair
Value | |
| 3874 BI — 3.50% 6/15/2021 | | $ | 2,708,440 | | | $ | 168,611 | | |
| 3893 BI — 3.50% 7/15/2021 | | | 2,326,403 | | | | 145,609 | | |
| 3909 KI — 3.50% 7/15/2021 | | | 1,940,886 | | | | 126,646 | | |
| 3938 IO — 3.50% 10/15/2021 | | | 13,657,221 | | | | 885,941 | | |
| 3778 GI — 3.50% 6/15/2024 | | | 2,336,518 | | | | 79,875 | | |
| 3854 GI — 3.50% 11/15/2024 | | | 979,398 | | | | 15,546 | | |
| 3852 YI — 3.50% 3/15/2025 | | | 4,594,948 | | | | 175,082 | | |
| 3763 NI — 3.50% 5/15/2025 | | | 2,619,503 | | | | 175,982 | | |
| 3904 QI — 3.50% 5/15/2025 | | | 2,475,563 | | | | 116,548 | | |
| 3909 UI — 3.50% 8/15/2025 | | | 3,346,372 | | | | 134,594 | | |
| 3904 NI — 3.50% 8/15/2026 | | | 6,515,650 | | | | 621,079 | | |
| 3930 AI — 3.50% 9/15/2026 | | | 8,627,219 | | | | 876,261 | | |
| 4018 AI — 3.50% 3/15/2027 | | | 14,035,723 | | | | 1,421,110 | | |
| 4479 NI — 4.50% 11/15/2019 | | | 2,175,085 | | | | 83,469 | | |
| 3684 CI — 4.50% 8/15/2024 | | | 10,684,819 | | | | 649,810 | | |
| 3609 LI — 4.50% 12/15/2024 | | | 3,582,864 | | | | 157,537 | | |
| 3917 AI — 4.50% 7/15/2026 | | | 20,672,769 | | | | 2,287,719 | | |
| 3636 IO — 5.00% 11/15/2018 | | | 5,728,301 | | | | 171,063 | | |
| 217 IO — 6.50% 1/1/2032 | | | 285,749 | | | | 64,224 | | |
Federal National Mortgage Association | |
| 2011-88 BI — 3.00% 11/25/2020 | | | 1,309,446 | | | | 29,554 | | |
| 2011-141 EI — 3.00% 7/25/2021 | | | 7,478,478 | | | | 300,372 | | |
| 2012-8 TI — 3.00% 10/25/2021 | | | 3,975,092 | | | | 226,304 | | |
| 2011-113 GI — 3.00% 11/25/2021 | | | 3,820,689 | | | | 219,140 | | |
| 2011-129 AI — 3.00% 12/25/2021 | | | 5,269,755 | | | | 306,868 | | |
| 2012-8 UI — 3.00% 12/25/2021 | | | 12,872,063 | | | | 746,742 | | |
| 2011-137 AI — 3.00% 1/25/2022 | | | 7,278,880 | | | | 426,856 | | |
| 2011-138 IG — 3.00% 1/25/2022 | | | 8,669,864 | | | | 521,894 | | |
| 2011-145 IO — 3.00% 1/25/2022 | | | 10,617,818 | | | | 625,070 | | |
| 2012-78 AI — 3.00% 2/25/2022 | | | 5,796,159 | | | | 261,766 | | |
| 2012-23 IA — 3.00% 3/25/2022 | | | 5,028,901 | | | | 302,131 | | |
| 2012-32 AI — 3.00% 4/25/2022 | | | 8,358,476 | | | | 508,408 | | |
| 2012-53 CI — 3.00% 5/25/2022 | | | 12,942,272 | | | | 803,045 | | |
| 2012-147 AI — 3.00% 10/25/2027 | | | 23,018,285 | | | | 1,871,262 | | |
| 2012-145 DI — 3.00% 1/25/2028 | | | 13,242,333 | | | | 1,165,736 | | |
| 2012-149 CI — 3.00% 1/25/2028 | | | 33,966,727 | | | | 2,938,251 | | |
| 2010-128 LI — 3.50% 11/25/2020 | | | 5,492,790 | | | | 309,421 | | |
| 2011-75 BI — 3.50% 11/25/2020 | | | 2,053,007 | | | | 50,746 | | |
| 2011-78 IA — 3.50% 11/25/2020 | | | 5,556,479 | | | | 138,072 | | |
| 2010-145 BI — 3.50% 12/25/2020 | | | 2,843,148 | | | | 162,375 | | |
| 2011-61 BI — 3.50% 7/25/2021 | | | 2,677,518 | | | | 167,830 | | |
18
FPA NEW INCOME, INC.
PORTFOLIO OF INVESTMENTS (Continued)
September 30, 2016
BONDS & DEBENTURES — Continued | | Principal
Amount | | Fair
Value | |
| 2011-66 QI — 3.50% 7/25/2021 | | $ | 4,488,449 | | | $ | 287,353 | | |
| 2011-104 CI — 3.50% 10/25/2021 | | | 7,807,704 | | | | 503,516 | | |
| 2011-104 DI — 3.50% 10/25/2021 | | | 13,026,481 | | | | 794,076 | | |
| 2011-110 AI — 3.50% 11/25/2021 | | | 5,446,585 | | | | 344,154 | | |
| 2011-118 IC — 3.50% 11/25/2021 | | | 15,423,860 | | | | 1,003,486 | | |
| 2011-125 DI — 3.50% 12/25/2021 | | | 10,556,120 | | | | 704,705 | | |
| 2011-143 MI — 3.50% 1/25/2022 | | | 3,978,200 | | | | 229,961 | | |
| 2012-2 MI — 3.50% 2/25/2022 | | | 6,384,363 | | | | 433,536 | | |
| 2010-137 BI — 3.50% 2/25/2024 | | | 1,406,766 | | | | 24,481 | | |
| 2010-135 DI — 3.50% 4/25/2024 | | | 3,684,366 | | | | 91,471 | | |
| 2011-75 AI — 3.50% 1/25/2025 | | | 7,958,505 | | | | 249,837 | | |
| 2011-66 BI — 3.50% 3/25/2025 | | | 788,192 | | | | 18,934 | | |
| 2011-80 KI — 3.50% 4/25/2025 | | | 4,242,245 | | | | 167,024 | | |
| 2011-67 CI — 3.50% 8/25/2025 | | | 2,455,231 | | | | 132,827 | | |
| 2011-22 IC — 3.50% 12/25/2025 | | | 5,078,981 | | | | 423,455 | | |
| 2011-101 EI — 3.50% 10/25/2026 | | | 12,896,320 | | | | 1,205,388 | | |
| 2011-69 TI — 4.00% 5/25/2020 | | | 1,834,988 | | | | 57,678 | | |
| 2010-89 LI — 4.00% 8/25/2020 | | | 3,935,779 | | | | 213,033 | | |
| 2010-104 CI — 4.00% 9/25/2020 | | | 1,769,781 | | | | 96,801 | | |
| 2011-67 EI — 4.00% 7/25/2021 | | | 4,283,535 | | | | 226,473 | | |
| 2010-110 IH — 4.50% 10/25/2018 | | | 3,629,867 | | | | 128,672 | | |
| 2009-70 IN — 4.50% 8/25/2019 | | | 4,507,711 | | | | 141,323 | | |
| 2010-114 CI — 5.00% 4/25/2018 | | | 3,565,590 | | | | 104,239 | | |
| 2010-30 IO — 5.00% 8/25/2018 | | | 1,712,578 | | | | 60,271 | | |
| 2010-25 NI — 5.00% 3/25/2025 | | | 636,277 | | | | 32,647 | | |
| 2003-64 XI — 5.00% 7/25/2033 | | | 765,174 | | | | 143,982 | | |
| | | $ | 38,507,671 | | |
NON-AGENCY COLLATERALIZED MORTGAGE OBLIGATION — 10.9% | |
BCAP LLC Trust
2010-RR8 2A6 — 2.237% 11/26/2036**,@ | | $ | 6,351,687 | | | $ | 6,300,568 | | |
Citicorp Mortgage Securities REMIC Pass-Through Certificates Trust Series
2005-5 2A3 — 5.00% 8/25/2020 | | | 81,214 | | | | 80,990 | | |
Citigroup Mortgage Loan Trust, Inc.
2014-A A — 4.00% 1/25/2035**,@ | | | 15,487,078 | | | | 16,121,136 | | |
Credit Suisse Mortgage Trust Series
2010-9R 1A4 — 3.75% 8/27/2037** | | | 21,378,000 | | | | 21,428,617 | | |
Nationstar HECM Loan Trust | |
| 2016-3A A — 2.013% 8/25/2026**,†† | | | 3,533,190 | | | | 3,536,016 | | |
| 2015-2A A — 2.883% 11/25/2025**,†† | | | 3,686,366 | | | | 3,687,840 | | |
| 2016-1A A — 2.981% 2/25/2026**,†† | | | 6,700,224 | | | | 6,694,730 | | |
19
FPA NEW INCOME, INC.
PORTFOLIO OF INVESTMENTS (Continued)
September 30, 2016
BONDS & DEBENTURES — Continued | | Principal
Amount | | Fair
Value | |
Nomura Resecuritization Trust
2016-1R 3A1 — 5.00% 9/28/2036**,@ | | $ | 7,177,103 | | | $ | 7,487,654 | | |
RiverView HECM Trust
2007-1 A — 1.18% 5/25/2047**,@ | | | 28,487,341 | | | | 25,175,973 | | |
RMAT LLC
2015-PR1 A1 — 4.826% 6/25/2035**,@@ | | | 23,501,953 | | | | 23,308,086 | | |
Sequoia Mortgage Trust
2012-1 1A1 — 2.865% 1/25/2042@ | | | 3,090,582 | | | | 3,125,390 | | |
Stanwich Mortgage Loan Trust Series | |
| 2011-2 A — 0.03% 9/15/2050**,††,@ | | | 1,096,773 | | | | 586,998 | | |
| 2010-3 A — 0.338% 7/31/2038**,††,@ | | | 690,488 | | | | 345,451 | | |
| 2011-1 A — 0.704% 8/15/2050**,††,@ | | | 1,449,612 | | | | 764,567 | | |
| 2009-2 A — 0.945% 2/15/2049**,††,@ | | | 99,859 | | | | 44,657 | | |
| 2010-1 A — 1.166% 9/30/2047**,††,@ | | | 246,480 | | | | 124,670 | | |
| 2010-4 A — 1.472% 8/31/2049**,††,@ | | | 837,025 | | | | 422,698 | | |
| 2010-2 A — 1.623% 2/28/2057**,††,@ | | | 1,400,077 | | | | 705,919 | | |
Sunset Mortgage Loan Co. LLC | |
| 2014-NPL1 A — 3.228% 8/16/2044**,@@ | | | 5,416,685 | | | | 5,404,875 | | |
| 2014-NPL2 A — 3.721% 11/16/2044**,@@ | | | 16,039,656 | | | | 15,973,002 | | |
| 2015-NPL1 A — 4.459% 9/18/2045**,@@ | | | 22,585,164 | | | | 22,678,371 | | |
Towd Point Mortgage Trust | |
| 2016-3 A1 — 2.25% 8/25/2055**,@ | | | 30,355,060 | | | | 30,429,982 | | |
| 2015-1 AES — 3.00% 10/25/2053** | | | 33,790,989 | | | | 34,560,619 | | |
| 2015-2 1A1 — 3.25% 11/25/2060**,@ | | | 44,765,603 | | | | 45,990,918 | | |
| 2015-4 A1 — 3.50% 4/25/2055**,@ | | | 28,404,476 | | | | 29,358,094 | | |
| 2015-2 2A1 — 3.75% 11/25/2057**,@ | | | 37,008,136 | | | | 38,384,539 | | |
VOLT XL LLC
2015-NP14 A1 — 4.375% 11/27/2045**,@@ | | | 27,699,574 | | | | 27,965,504 | | |
VOLT XXV LLC
2015-NPL8 A1 — 3.50% 6/26/2045**,@@ | | | 29,013,175 | | | | 29,048,382 | | |
VOLT XXVII LLC
2014-NPL7 A1 — 3.375% 8/27/2057**,@@ | | | 29,742,382 | | | | 29,735,788 | | |
VOLT XXXI LLC
2015-NPL2 A1 — 3.375% 2/25/2055**,@@ | | | 1,408,122 | | | | 1,406,482 | | |
VOLT XXXIII LLC
2015-NPL5 A1 — 3.50% 3/25/2055**,@@ | | | 37,498,904 | | | | 37,516,277 | | |
VOLT XXXIV LLC
2015-NPL7 A1 — 3.25% 2/25/2055**,@@ | | | 24,348,536 | | | | 24,273,155 | | |
VOLT XXXIX LLC
2015-NP13 A1 — 4.125% 10/25/2045**,@@ | | | 372,201 | | | | 375,132 | | |
20
FPA NEW INCOME, INC.
PORTFOLIO OF INVESTMENTS (Continued)
September 30, 2016
BONDS & DEBENTURES — Continued | | Principal
Amount | | Fair
Value | |
VOLT XXXV LLC
2015-NPL9 A1 — 3.50% 6/26/2045**,@@ | | $ | 18,900,333 | | | $ | 18,900,319 | | |
VOLT XXXVI LLC
2015-NP10 A1 — 3.625% 7/25/2045**,@@ | | | 17,045,013 | | | | 17,068,893 | | |
VOLT XXXVIII LLC
2015-NP12 A1 — 3.875% 9/25/2045**,@@ | | | 21,372,290 | | | | 21,456,223 | | |
| | | $ | 550,468,515 | | |
TOTAL RESIDENTIAL MORTGAGE-BACKED SECURITIES
(Cost $879,872,461) | | $ | 906,516,846 | | |
ASSET-BACKED SECURITIES — 44.6% | |
AUTO — 20.8% | |
Ally Auto Receivables Trust
2015-1 A3 — 1.39% 9/16/2019 | | $ | 25,000,000 | | | $ | 25,047,882 | | |
AmeriCredit Automobile Receivables Trust | |
| 2014-2 A3 — 0.94% 2/8/2019 | | | 4,418,776 | | | | 4,411,421 | | |
| 2013-3 B — 1.58% 9/10/2018 | | | 2,450,281 | | | | 2,451,658 | | |
| 2014-2 B — 1.60% 7/8/2019 | | | 1,485,000 | | | | 1,485,444 | | |
| 2013-4 B — 1.66% 9/10/2018 | | | 6,636,190 | | | | 6,636,037 | | |
| 2014-1 B — 1.68% 7/8/2019 | | | 1,468,000 | | | | 1,470,615 | | |
| 2012-5 C — 1.69% 11/8/2018 | | | 4,623,469 | | | | 4,626,803 | | |
| 2015-2 B — 1.82% 7/8/2020 | | | 6,678,000 | | | | 6,659,151 | | |
| 2014-3 B — 1.92% 11/8/2019 | | | 13,383,000 | | | | 13,437,996 | | |
| 2012-4 C — 1.93% 8/8/2018 | | | 1,392,020 | | | | 1,393,671 | | |
| 2015-3 B — 2.08% 9/8/2020 | | | 19,000,000 | | | | 19,080,761 | | |
| 2015-4 B — 2.11% 1/8/2021 | | | 28,000,000 | | | | 28,225,389 | | |
| 2013-5 C — 2.29% 11/8/2019 | | | 2,312,000 | | | | 2,327,883 | | |
| 2013-3 C — 2.38% 6/10/2019 | | | 986,000 | | | | 993,769 | | |
| 2015-1 C — 2.51% 1/8/2021 | | | 1,727,000 | | | | 1,740,541 | | |
| 2012-3 D — 3.03% 7/9/2018 | | | 26,019,503 | | | | 26,059,948 | | |
California Republic Auto Receivables Trust
2013-2 A2 — 1.23% 3/15/2019 | | | 3,717,304 | | | | 3,716,366 | | |
Capital Auto Receivables Asset Trust
2014-2 A3 — 1.26% 5/21/2018 | | | 3,553,748 | | | | 3,552,107 | | |
| 2014-1 A3 — 1.32% 6/20/2018 | | | 4,107,659 | | | | 4,107,865 | | |
| 2016-3 A3 — 1.54% 8/20/2020 | | | 9,410,000 | | | | 9,412,405 | | |
| 2015-2 A3 — 1.73% 9/20/2019 | | | 35,877,000 | | | | 35,957,103 | | |
| 2014-3 A4 — 1.83% 4/22/2019 | | | 9,382,000 | | | | 9,429,752 | | |
| 2014-1 B — 2.22% 1/22/2019 | | | 8,337,000 | | | | 8,371,067 | | |
| 2013-4 C — 2.67% 2/20/2019 | | | 3,845,000 | | | | 3,867,717 | | |
21
FPA NEW INCOME, INC.
PORTFOLIO OF INVESTMENTS (Continued)
September 30, 2016
BONDS & DEBENTURES — Continued | | Principal
Amount | | Fair
Value | |
Credit Acceptance Auto Loan Trust | |
| 2014-1A A — 1.55% 10/15/2021** | | $ | 3,498,043 | | | $ | 3,495,855 | | |
| 2014-2A A — 1.88% 3/15/2022** | | | 22,476,000 | | | | 22,482,361 | | |
| 2015-1A A — 2.00% 7/15/2022** | | | 2,755,000 | | | | 2,753,470 | | |
| 2014-1A B — 2.29% 4/15/2022** | | | 12,076,000 | | | | 12,034,735 | | |
| 2016-2A A — 2.42% 11/15/2023** | | | 9,956,000 | | | | 9,986,757 | | |
| 2015-1A B — 2.61% 1/17/2023** | | | 3,160,000 | | | | 3,142,653 | | |
| 2014-2A B — 2.67% 9/15/2022** | | | 11,719,000 | | | | 11,729,184 | | |
| 2015-2A B — 3.04% 8/15/2023** | | | 27,401,000 | | | | 27,532,064 | | |
| 2016-2A B — 3.18% 5/15/2024** | | | 22,937,000 | | | | 22,988,113 | | |
| 2015-2A C — 3.76% 2/15/2024** | | | 550,000 | | | | 553,013 | | |
DT Auto Owner Trust | |
| 2016-2A A — 1.73% 8/15/2019** | | | 6,553,229 | | | | 6,544,823 | | |
| 2015-1A B — 1.88% 4/15/2019** | | | 2,601,973 | | | | 2,602,727 | | |
| 2015-2A B — 1.88% 5/15/2019** | | | 29,672,000 | | | | 29,625,611 | | |
| 2016-4A B — 2.02% 8/17/2020**,†† | | | 13,677,000 | | | | 13,672,192 | | |
| 2015-3A B — 2.46% 11/15/2019** | | | 27,649,000 | | | | 27,731,275 | | |
| 2016-2A B — 2.92% 5/15/2020** | | | 5,392,000 | | | | 5,391,593 | | |
First Investors Auto Owner Trust | |
| 2015-1A A2 — 1.21% 4/15/2019** | | | 2,686,493 | | | | 2,685,844 | | |
| 2014-1A A3 — 1.49% 1/15/2020** | | | 4,354,081 | | | | 4,351,297 | | |
| 2016-2A A2 — 1.87% 11/15/2021** | | | 5,514,000 | | | | 5,518,783 | | |
| 2016-1A A2 — 2.26% 4/15/2021** | | | 16,653,000 | | | | 16,740,665 | | |
| 2015-2A A2 — 2.28% 9/15/2021** | | | 16,556,000 | | | | 16,575,448 | | |
| 2015-2A B — 2.75% 9/15/2021** | | | 4,443,000 | | | | 4,475,186 | | |
Ford Credit Auto Owner Trust | |
| 2012-C B — 1.27% 12/15/2017 | | | 2,075,166 | | | | 2,075,547 | | |
| 2013-A C — 1.36% 10/15/2018 | | | 5,700,000 | | | | 5,695,020 | | |
GM Financial Automobile Leasing Trust
2016-3 C — 2.38% 5/20/2020 | | | 7,768,000 | | | | 7,776,182 | | |
Honda Auto Receivables Owner Trust
2015-2 A3 — 1.04% 2/21/2019 | | | 36,050,000 | | | | 36,011,253 | | |
Hyundai Auto Lease Securitization Trust
2014-B A4 — 1.26% 9/17/2018** | | | 3,126,000 | | | | 3,128,116 | | |
Porsche Innovative Lease Owner Trust
2014-1 A4 — 1.26% 9/21/2020** | | | 15,253,000 | | | | 15,264,655 | | |
Prestige Auto Receivables Trust | |
| 2013-1A A3 — 1.33% 5/15/2019** | | | 137,329 | | | | 137,338 | | |
| 2014-1A A3 — 1.52% 4/15/2020** | | | 13,862,118 | | | | 13,854,807 | | |
| 2015-1 A3 — 1.53% 2/15/2021** | | | 17,143,000 | | | | 17,119,461 | | |
| 2016-1A A3 — 1.99% 6/15/2020** | | | 7,917,000 | | | | 7,940,061 | | |
| 2015-1 B — 2.04% 4/15/2021** | | | 10,395,000 | | | | 10,400,386 | | |
22
FPA NEW INCOME, INC.
PORTFOLIO OF INVESTMENTS (Continued)
September 30, 2016
BONDS & DEBENTURES — Continued | | Principal
Amount | | Fair
Value | |
Santander Drive Auto Receivables Trust | |
| 2015-2 A3 — 1.22% 4/15/2019 | | $ | 53,386,000 | | | $ | 53,363,274 | | |
| 2015-1 A3 — 1.27% 2/15/2019 | | | 5,291,088 | | | | 5,288,917 | | |
| 2014-3 B — 1.45% 5/15/2019 | | | 442,879 | | | | 442,948 | | |
| 2015-3 A3 — 1.49% 6/17/2019 | | | 22,275,000 | | | | 22,285,010 | | |
| 2016-2 A3 — 1.56% 5/15/2020 | | | 12,436,000 | | | | 12,415,525 | | |
| 2015-4 A3 — 1.58% 9/16/2019 | | | 30,414,000 | | | | 30,439,019 | | |
| 2014-1 B — 1.59% 10/15/2018 | | | 2,249,329 | | | | 2,249,852 | | |
| 2014-2 B — 1.62% 2/15/2019 | | | 7,611,359 | | | | 7,615,063 | | |
| 2014-5 B — 1.76% 9/16/2019 | | | 9,233,000 | | | | 9,239,489 | | |
| 2013-3 C — 1.81% 4/15/2019 | | | 21,635,783 | | | | 21,667,678 | | |
| 2014-4 B — 1.82% 5/15/2019 | | | 7,720,416 | | | | 7,732,243 | | |
| 2015-2 B — 1.83% 1/15/2020 | | | 3,322,000 | | | | 3,328,717 | | |
| 2013-2 C — 1.95% 3/15/2019 | | | 1,973,326 | | | | 1,976,958 | | |
| 2015-5 B — 1.96% 5/15/2020 | | | 44,367,000 | | | | 44,280,027 | | |
| 2015-1 B — 1.97% 11/15/2019 | | | 22,904,000 | | | | 22,948,819 | | |
| 2015-3 B — 2.07% 4/15/2020 | | | 26,274,000 | | | | 26,415,958 | | |
| 2014-2 C — 2.33% 11/15/2019 | | | 7,874,000 | | | | 7,919,957 | | |
| 2015-1 C — 2.57% 4/15/2021 | | | 9,270,000 | | | | 9,352,727 | | |
| 2014-4 C — 2.60% 11/16/2020 | | | 16,794,000 | | | | 16,971,563 | | |
| 2013-5 D — 2.73% 10/15/2019 | | | 16,422,000 | | | | 16,659,160 | | |
| 2014-2 D — 2.76% 2/18/2020 | | | 8,332,000 | | | | 8,455,491 | | |
| 2013-4 C — 3.25% 1/15/2020 | | | 1,223,419 | | | | 1,231,444 | | |
| 2012-5 D — 3.30% 9/17/2018 | | | 4,680,000 | | | | 4,716,112 | | |
| 2012-3 D — 3.64% 5/15/2018 | | | 29,010,708 | | | | 29,147,221 | | |
Westlake Automobile Receivables Trust | |
| 2015-1A A2 — 1.17% 3/15/2018** | | | 1,648,260 | | | | 1,647,993 | | |
| 2015-1A B — 1.68% 11/16/2020** | | | 18,501,000 | | | | 18,493,344 | | |
| 2014-1A C — 1.70% 11/15/2019** | | | 124,706 | | | | 124,649 | | |
| 2015-2A B — 1.83% 1/15/2021** | | | 15,900,000 | | | | 15,905,668 | | |
| 2015-3A B — 2.21% 5/17/2021** | | | 23,804,000 | | | | 23,883,382 | | |
| 2015-1A C — 2.29% 11/16/2020** | | | 550,000 | | | | 551,023 | | |
| 2015-2A C — 2.45% 1/15/2021** | | | 550,000 | | | | 550,097 | | |
| 2015-3A C — 3.05% 5/17/2021** | | | 550,000 | | | | 554,062 | | |
World Omni Automobile Lease Securitization Trust | |
| 2015-A A4 — 1.73% 12/15/2020 | | | 15,000,000 | | | | 15,101,004 | | |
| 2015-A B — 1.94% 12/15/2020 | | | 12,350,000 | | | | 12,388,732 | | |
| | | $ | 1,051,822,952 | | |
CREDIT CARD — 6.2% | |
Cabela's Credit Card Master Note Trust | |
| 2012-2A A1 — 1.45% 6/15/2020** | | $ | 54,446,000 | | | $ | 54,505,210 | | |
| 2012-1A A1 — 1.63% 2/18/2020** | | | 14,610,000 | | | | 14,623,245 | | |
23
FPA NEW INCOME, INC.
PORTFOLIO OF INVESTMENTS (Continued)
September 30, 2016
BONDS & DEBENTURES — Continued | | Principal
Amount | | Fair
Value | |
| 2016-1 A1 — 1.78% 6/15/2022 | | $ | 51,561,000 | | | $ | 51,981,119 | | |
| 2011-4A A1 — 1.90% 10/15/2019** | | | 31,487,000 | | | | 31,497,016 | | |
Capital One Multi-Asset Execution Trust
2014-A2 A2 — 1.26% 1/15/2020 | | | 56,017,000 | | | | 56,089,144 | | |
Golden Credit Card Trust
2012-2A A1 — 1.77% 1/15/2019** | | | 31,192,000 | | | | 31,255,775 | | |
Synchrony Credit Card Master Note Trust | |
| 2012-6 A — 1.36% 8/17/2020 | | | 57,633,000 | | | | 57,740,290 | | |
| 2012-3 B — 1.524% 3/15/2020@ | | | 15,486,918 | | | | 15,531,276 | | |
| | | $ | 313,223,075 | | |
OTHER — 17.6% | |
Apidos CLO XI
2012-11A A — 2.069% 1/17/2023**,@ | | $ | 23,627,000 | | | $ | 23,637,585 | | |
ARI Fleet Lease Trust | |
| 2015-A A2 — 1.11% 11/15/2018** | | | 17,469,386 | | | | 17,444,838 | | |
| 2016-A A2 — 1.82% 7/15/2024** | | | 24,574,000 | | | | 24,655,070 | | |
Ascentium Equipment Receivables LLC
2015-2A B — 2.62% 12/10/2019** | | | 4,102,000 | | | | 4,111,040 | | |
Ascentium Equipment Receivables Trust
2016-1A A2 — 1.75% 11/13/2018** | | | 1,143,000 | | | | 1,146,145 | | |
Beacon Container Finance LLC
2012-1A A — 3.72% 9/20/2027** | | | 376,883 | | | | 372,677 | | |
Black Diamond CLO, Ltd.
2013-1A A1 — 2.129% 2/6/2026**,@ | | | 17,966,000 | | | | 17,966,054 | | |
CCG Receivables Trust | |
| 2014-1 A2 — 1.06% 11/15/2021** | | | 5,716,658 | | | | 5,710,127 | | |
| 2015-1 A2 — 1.46% 11/14/2018** | | | 21,745,278 | | | | 21,716,877 | | |
Cent CLO 19, Ltd.
2013-19A A1A — 2.082% 10/29/2025**,@ | | | 16,376,000 | | | | 16,367,452 | | |
Cerberus Onshore II CLO-2 LLC | |
| 2014-1A A — 2.528% 10/15/2023**,@ | | | 5,373,560 | | | | 5,371,497 | | |
| 2014-1A B — 2.975% 10/15/2023**,@ | | | 6,612,000 | | | | 6,610,995 | | |
Chesapeake Funding II LLC | |
| 2016-2A A1 — 1.88% 6/15/2028** | | | 29,535,000 | | | | 29,487,136 | | |
| 2016-1A A1 — 2.11% 3/15/2028** | | | 34,501,000 | | | | 34,560,238 | | |
Chesapeake Funding LLC
2014-1A A — 0.939% 3/7/2026**,@ | | | 22,197,290 | | | | 22,191,663 | | |
CIFC Funding 2013-III, Ltd.
2013-3A A1A — 2.045% 10/24/2025**,@ | | | 14,567,000 | | | | 14,552,200 | | |
Conn's Receivables Funding LLC | |
| 2016-A A — 4.68% 4/16/2018** | | | 10,707,489 | | | | 10,738,639 | | |
| 2016-A B — 8.96% 8/15/2018** | | | 28,435,000 | | | | 28,473,245 | | |
24
FPA NEW INCOME, INC.
PORTFOLIO OF INVESTMENTS (Continued)
September 30, 2016
BONDS & DEBENTURES — Continued | | Principal
Amount | | Fair
Value | |
Dell Equipment Finance Trust
2016-1 A1 — 0.85% 7/24/2017** | | $ | 44,460,025 | | | $ | 44,438,786 | | |
Enterprise Fleet Financing LLC | |
| 2014-1 A2 — 0.87% 9/20/2019** | | | 6,495,180 | | | | 6,488,615 | | |
| 2014-2 A2 — 1.05% 3/20/2020** | | | 19,132,094 | | | | 19,080,135 | | |
| 2013-2 A3 — 1.51% 3/20/2019** | | | 15,658,817 | | | | 15,657,711 | | |
| 2015-2 A2 — 1.59% 2/22/2021** | | | 47,382,409 | | | | 47,404,404 | | |
| 2016-2 A2 — 1.74% 2/22/2022** | | | 18,592,000 | | | | 18,538,602 | | |
Grayson CLO, Ltd.
2006-1A A1B — 1.117% 11/1/2021**,@ | | | 8,678,000 | | | | 8,512,172 | | |
GreatAmerica Leasing Receivables Funding LLC Series
2015-1 A2 — 1.12% 6/20/2017** | | | 1,568,831 | | | | 1,569,258 | | |
Hertz Fleet Lease Funding LP
2016-1 A2 — 1.96% 4/10/2030** | | | 21,046,000 | | | | 21,060,814 | | |
| InSite Issuer LLC — 8.595% 8/15/2043**,†† | | | 12,001,000 | | | | 12,472,159 | | |
John Deere Owner Trust
2013-B A4 — 1.39% 12/16/2019 | | | 13,312,000 | | | | 13,316,730 | | |
Leaf Receivables Funding 11 LLC
2016-1 A2 — 1.72% 7/15/2018**,†† | | | 17,599,000 | | | | 17,614,487 | | |
MMAF Equipment Finance LLC | |
| 2015-AA A2 — 0.96% 9/18/2017** | | | 8,411,594 | | | | 8,408,911 | | |
| 2013-AA A3 — 1.03% 12/11/2017** | | | 5,512,985 | | | | 5,513,343 | | |
| 2012-AA A4 — 1.35% 10/10/2018** | | | 958,119 | | | | 958,065 | | |
| 2013-AA A4 — 1.68% 5/11/2020** | | | 14,450,000 | | | | 14,481,598 | | |
NRZ Advance Receivables Trust Advance Receivables Backed | |
| 2016-T1 AT1 — 2.751% 6/15/2049** | | | 28,937,000 | | | | 28,936,951 | | |
| 2015-T4 AT4 — 3.196% 11/15/2047** | | | 7,715,000 | | | | 7,792,150 | | |
Ocwen Master Advance Receivables Trust
2016-T1 AT1 — 2.521% 8/17/2048** | | | 51,028,000 | | | | 50,948,269 | | |
Oportun Funding III LLC
2016-B A — 3.69% 7/8/2021** | | | 10,122,000 | | | | 10,085,449 | | |
Panhandle-Plains Student Finance Corporation
2001-1 A2 — 2.027% 12/1/2031††,@ | | | 7,800,000 | | | | 7,751,250 | | |
PFS Financing Corporation | |
| 2014-AA A — 1.124% 2/15/2019**,@ | | | 33,029,000 | | | | 33,002,712 | | |
| 2014-BA A — 1.124% 10/15/2019**,@ | | | 33,006,000 | | | | 32,876,907 | | |
| 2015-AA A — 1.144% 4/15/2020**,@ | | | 29,100,000 | | | | 28,899,725 | | |
| 2015-AA B — 1.424% 4/15/2020**,@ | | | 500,000 | | | | 492,997 | | |
| 2016-A A — 1.724% 2/18/2020**,@ | | | 57,776,000 | | | | 57,855,390 | | |
STORE Master Funding LLC
2012-1A A — 5.77% 8/20/2042** | | | 470,009 | | | | 490,328 | | |
Telos CLO, Ltd.
2013-4A A — 1.979% 7/17/2024**,@ | | | 7,956,000 | | | | 7,937,948 | | |
25
FPA NEW INCOME, INC.
PORTFOLIO OF INVESTMENTS (Continued)
September 30, 2016
BONDS & DEBENTURES — Continued | | Principal
Amount | | Fair
Value | |
THL Credit Wind River CLO, Ltd.
2013-2A A2A — 2.119% 1/18/2026**,@ | | $ | 6,300,000 | | | $ | 6,300,000 | | |
Unison Ground Lease Funding LLC | |
| 2013-1 B — 5.78% 3/15/2043**,†† | | | 10,932,000 | | | | 10,706,035 | | |
| 2013-2 B — 6.268% 3/15/2043** | | | 3,768,000 | | | | 3,543,804 | | |
| 2010-1-2 — 9.522% 4/15/2040** | | | 19,600,000 | | | | 21,490,616 | | |
Volvo Financial Equipment LLC Series
2013-1A B — 1.24% 8/15/2019** | | | 1,500,000 | | | | 1,498,692 | | |
WCP ISSUER LLC
2013-1 B — 6.657% 8/15/2043**,†† | | | 15,000,000 | | | | 15,434,700 | | |
Westwood CDO II, Ltd.
2007-2A A2 — 1.065% 4/25/2022**,@ | | | 5,083,000 | | | | 5,012,097 | | |
Wheels SPV 2 LLC | |
| 2014-1A A2 — 0.84% 3/20/2023** | | | 3,848,235 | | | | 3,845,642 | | |
| 2015-1A A2 — 1.27% 4/22/2024** | | | 13,254,462 | | | | 13,262,368 | | |
| | | $ | 888,793,298 | | |
| TOTAL ASSET-BACKED SECURITIES (Cost $2,255,081,151) | | $ | 2,253,839,325 | | |
CORPORATE BONDS & NOTES — 4.0% | |
CONSUMER, CYCLICAL — 1.4% | |
| Algeco Scotsman Global Finance plc — 8.50% 10/15/2018** | | $ | 44,326,000 | | | $ | 40,061,839 | | |
Continental Airlines
2000-1 Class B Pass Through Trust — 8.388% 5/1/2022 | | | 192,780 | | | | 193,378 | | |
Northwest Airlines
1999-2 Class C Pass Through Trust — 8.304% 9/1/2010†† | | | 21,163,608 | | | | 11,005,076 | | |
Northwest Airlines
2000-1 Class G Pass Through Trust — 7.15% 4/1/2021 | | | 9,710,511 | | | | 10,360,144 | | |
US Airways
1998-1B Pass Through Trust — 7.35% 7/30/2019 | | | 3,780,561 | | | | 3,827,818 | | |
US Airways
1998-1C Pass Through Trust — 6.82% 1/30/2019†† | | | 4,094,185 | | | | 1,760,500 | | |
US Airways
1999-1C Pass Through Trust — 7.96% 7/20/2019†† | | | 8,010,451 | | | | 5,367,002 | | |
| | | $ | 72,575,757 | | |
DIVERSIFIED — 0.7% | |
| Boart Longyear Management Pty, Ltd. — 10.00% 10/1/2018** | | $ | 51,802,000 | | | $ | 35,743,380 | | |
ENERGY — 1.0% | |
| Atwood Oceanics, Inc. — 6.50% 2/1/2020 | | $ | 63,487,000 | | | $ | 49,678,578 | | |
26
FPA NEW INCOME, INC.
PORTFOLIO OF INVESTMENTS (Continued)
September 30, 2016
BONDS & DEBENTURES — Continued | | Principal
Amount | | Fair
Value | |
FINANCIAL — 0.5% | |
| Berkshire Hathaway Finance Corporation — 1.077% 8/15/2019@ | | $ | 12,753,000 | | | $ | 12,770,843 | | |
| N671US Trust — 7.50% 9/15/2020**,†† | | | 11,080,403 | | | | 11,302,011 | | |
| | | $ | 24,072,854 | | |
INDUSTRIAL — 0.4% | |
Air 2 US | |
| — 8.027% 10/1/2020** | | $ | 4,771,472 | | | $ | 4,986,188 | | |
| — 10.127% 10/1/2020**,†† | | | 39,258,228 | | | | 13,347,798 | | |
| | | $ | 18,333,986 | | |
| TOTAL CORPORATE BONDS & NOTES (Cost $235,633,189) | | $ | 200,404,555 | | |
CORPORATE BANK DEBT — 2.6% | |
| ACCTL — 6.25% 5/16/2022††,** | | $ | 19,478,000 | | | $ | 19,476,247 | | |
MBFODDTL — 2.00% 3/31/2017††,** | | | 4,800,000 | | | | 75,552 | | |
MBFOTL — 5.25% 11/20/2021††,** | | | 26,963,340 | | | | 27,118,110 | | |
MBLODDTL — 2.00% 3/31/2017††,** | | | 2,550,000 | | | | 57,630 | | |
MBLOTL — 8.00% 11/20/2021††,** | | | 14,546,875 | | | | 14,730,165 | | |
| Nielsen Fin LLC Term Loan B 1 — 2.917% 5/30/2017** | | | 1,870,000 | | | | 1,870,000 | | |
| OCI Beaumont LLC Term Loan B — 7.39% 8/20/2019** | | | 26,108,509 | | | | 25,263,115 | | |
| OTGDDTL — 1.00% 8/23/2021**,†† | | | 1,950,000 | | | | 37,148 | | |
| OTGTL — 9.50% 8/23/2021††,** | | | 19,970,000 | | | | 19,951,029 | | |
| Xplornet Communications, Inc. Term Loan B — 7.56% 9/9/2021††,** | | | 24,697,000 | | | | 24,868,644 | | |
| TOTAL CORPORATE BANK DEBT (Cost $132,296,534) | | $ | 133,447,640 | | |
MUNICIPALS — 0.5% | |
Wayne County | |
| GO, (TXBL-NTS), — 4.25% 12/1/2018†† | | $ | 8,062,000 | | | $ | 8,062,000 | | |
| GO, (TXBL), — 5.75% 12/1/2017†† | | | 15,768,000 | | | | 15,807,420 | | |
| TOTAL MUNICIPALS (Cost $23,784,677) | | $ | 23,869,420 | | |
U.S. TREASURIES — 10.2% | |
U.S. Treasury Notes | |
| — 0.50% 11/30/2016 | | $ | 42,500,000 | | | $ | 42,511,879 | | |
| — 0.625% 12/15/2016 | | | 30,000,000 | | | | 30,020,547 | | |
| — 0.875% 1/31/2017 | | | 50,000,000 | | | | 50,078,375 | | |
| — 1.00% 10/31/2016 | | | 80,000,000 | | | | 80,034,376 | | |
| — 1.00% 12/15/2017 | | | 70,843,000 | | | | 71,085,850 | | |
| — 1.375% 8/31/2020 | | | 114,135,000 | | | | 115,542,923 | | |
| — 1.375% 10/31/2020 | | | 34,456,000 | | | | 34,862,550 | | |
27
FPA NEW INCOME, INC.
PORTFOLIO OF INVESTMENTS (Continued)
September 30, 2016
BONDS & DEBENTURES — Continued | | Principal
Amount | | Fair
Value | |
| — 1.875% 10/31/2017 | | $ | 49,075,000 | | | $ | 49,689,203 | | |
| — 2.75% 11/30/2016 | | | 40,000,000 | | | | 40,151,300 | | |
| TOTAL U.S. TREASURIES (Cost $512,842,561) | | $ | 513,977,003 | | |
| TOTAL BONDS & DEBENTURES — 98.0% (Cost $5,032,758,623) | | $ | 4,947,808,262 | | |
| TOTAL INVESTMENT SECURITIES — 98.0% (Cost $5,032,758,623) | | $ | 4,947,808,262 | | |
SHORT-TERM INVESTMENTS — 2.9% | |
State Street Bank Repurchase Agreement — 0.03% 10/3/2016
(Dated 09/30/2016, repurchase price of $146,380,366, collateralized by
$124,825,000, principal amount U.S. Treasury Note — 3.000-8.500%
2020-2045, fair value $149,319,064) | | $ | 146,380,000 | | | $ | 146,380,000 | | |
| TOTAL SHORT-TERM INVESTMENTS (Cost $146,380,000) | | $ | 146,380,000 | | |
| TOTAL INVESTMENTS — 100.9% (Cost $5,179,138,623) | | $ | 5,094,188,262 | | |
| Other Assets and Liabilities, net — (0.9)% | | | (45,578,635 | ) | |
| NET ASSETS — 100.0% | | $ | 5,048,609,627 | | |
@ Variable/Floating Rate Security — Interest rate changes on these instruments are based on changes in a designated base rate. The rates shown are those in effect on September 30, 2016.
** Restricted securities. These restricted securities constituted 46.51% of total net assets at September 30, 2016, most of which are considered liquid by the Adviser. These securities are not registered and may not be sold to the public. There are legal and/or contractual restrictions on resale. The Fund does not have the right to demand that such securities be registered. The values of these securities are determined by valuations provided by pricing services, brokers, dealers, market makers, or in good faith under policies adopted by authority of the Fund's Board of Directors.
†† These securities have been valued in good faith under policies adopted by authority of the Board of Director in accordance with the Fund's fair value procedures. These securities constituted 6.28% of total net assets at September 30, 2016.
@@@ Zero coupon bond. Coupon amount represents effective yield to maturity.
@@ Step Coupon — Coupon rate increases in increments to maturity. Rate disclosed is as of September 30, 2016.
See accompanying Notes to Financial Statements.
28
FPA NEW INCOME, INC.
PORTFOLIO OF INVESTMENTS — RESTRICTED SECURITIES
September 30, 2016
Issuer | | Acquisition
Date (s) | | Cost | | Fair
Value | | Fair
Value as a %
of Net Assets | |
A10 Securitization LLC
2016-1 A1 | | 5/19/2016 | | $ | 10,126,985 | | | $ | 10,172,219 | | | | 0.20 | % | |
A10 Securitiztion LLC 2013-2 A | | 10/30/2013 | | | 3,582,621 | | | | 3,578,600 | | | | 0.07 | % | |
ACCTL | | 9/19/2016 | | | 19,284,309 | | | | 19,476,247 | | | | 0.39 | % | |
ARI Fleet Lease Trust 2016-A A2 | | 2/17/2016 | | | 24,572,261 | | | | 24,655,070 | | | | 0.49 | % | |
ARI Fleet Lease Trust 2015-A A2
| | 4/15/2015,
7/20/2015,
3/11/2016,
3/18/2016 | | | 17,450,043 | | | | 17,444,838 | | | | 0.35 | % | |
Air 2 US
| | 7/24/2014,
8/22/2014,
2/12/2015 | | | 9,396,338 | | | | 13,347,798 | | | | 0.26 | % | |
Air 2 US
| | 7/1/2014,
10/27/2014 | | | 5,064,065 | | | | 4,986,188 | | | | 0.10 | % | |
Algeco Scotsman Global Finance plc
| | 9/4/2014,
9/9/2014,
9/15/2014,
9/22/2014,
9/26/2014,
9/29/2014,
10/2/2014,
10/14/2014,
10/15/2014,
11/13/2014,
11/19/2014,
11/20/2014,
11/21/2014,
12/1/2014,
12/3/2014,
12/8/2014,
12/10/2014,
4/29/2015,
7/31/2015,
8/12/2015 | | | 44,716,674 | | | | 40,061,839 | | | | 0.79 | % | |
Apidos CLO XI 2012-11A A | | 9/28/2016 | | | 23,656,534 | | | | 23,637,585 | | | | 0.47 | % | |
Ascentium Equipment
Receivables LLC 2015-2A B | | 2/18/2016 | | | 4,089,097 | | | | 4,111,040 | | | | 0.08 | % | |
Ascentium Equipment
Receivables Trust 2016-1A A2 | | 4/18/2016 | | | 1,142,978 | | | | 1,146,145 | | | | 0.02 | % | |
BCAP LLC Trust 2010-RR8 2A6 | | 12/8/2015 | | | 6,316,852 | | | | 6,300,568 | | | | 0.12 | % | |
Beacon Container Finance LLC
2012-1A A
| | 9/25/2012,
5/1/2014 | | |
383,330 | | | |
372,677 | | | | 0.01 | % | |
29
FPA NEW INCOME, INC.
PORTFOLIO OF INVESTMENTS — RESTRICTED SECURITIES
(Continued)
September 30, 2016
Issuer | | Acquisition
Date (s) | | Cost | | Fair
Value | | Fair
Value as a %
of Net Assets | |
Black Diamond CLO, Ltd.
2013-1A A1 9/16/2016,
| | 9/30/2016 | | $ | 17,988,427 | | | $ | 17,966,054 | | | | 0.36 | % | |
Boart Longyear
Management Pty, Ltd.
| | 9/20/2013,
9/24/2014,
10/6/2014,
10/24/2014,
11/13/2014,
11/21/2014,
12/5/2014,
12/10/2014,
2/20/2015,
3/2/2015 | | | 52,713,673 | | | | 35,743,380 | | | | 0.71 | % | |
CCG Receivables Trust 2015-1 A2 | | 9/9/2015 | | | 21,743,920 | | | | 21,716,877 | | | | 0.43 | % | |
CCG Receivables Trust 2014-1 A2
| | 5/6/2014,
3/31/15,
4/1/2015,
6/16/2015,
8/12/2015 | | | 5,710,535 | | | | 5,710,127 | | | | 0.11 | % | |
CIFC Funding 2013-III, Ltd.
2013-3A A1A | | 9/14/2016 | | | 14,576,074 | | | | 14,552,200 | | | | 0.29 | % | |
COMM Mortgage Trust
2012-9W57 A | | 5/7/2015 | | | 54,488,885 | | | | 53,651,467 | | | | 1.06 | % | |
COMM Mortgage Trust 2014-FL5 C | | 9/15/2016 | | | 7,941,781 | | | | 7,944,781 | | | | 0.16 | % | |
Cabela's Credit Card Master Note
Trust 2012-2A A1
| | 3/11/2015,
4/15/2015,
6/19/2015,
11/17/2015 | | | 54,604,242 | | | | 54,505,210 | | | | 1.08 | % | |
Cabela's Credit Card Master Note
Trust 2011-4A A1
| | 3/11/2015,
3/30/2015 | | | 31,764,801 | | | | 31,497,016 | | | | 0.62 | % | |
Cabela's Credit Card Master Note
Trust 2012-1A A1
| | 3/19/2015,
5/19/2015,
3/4/2016 | | | 14,687,732 | | | | 14,623,245 | | | | 0.29 | % | |
Cent CLO 19, Ltd. 2013-19A A1A | | 9/15/2016 | | | 16,367,836 | | | | 16,367,452 | | | | 0.32 | % | |
Cerberus Onshore II CLO-2 LLC
2014-1A B | | 11/20/2014 | | | 6,566,569 | | | | 6,610,995 | | | | 0.13 | % | |
Cerberus Onshore II CLO-2 LLC
2014-1A A
| | 11/20/2014,
2/12/2015 | | | 5,373,666 | | | | 5,371,497 | | | | 0.11 | % | |
30
FPA NEW INCOME, INC.
PORTFOLIO OF INVESTMENTS — RESTRICTED SECURITIES
(Continued)
September 30, 2016
Issuer | | Acquisition
Date (s) | | Cost | | Fair
Value | | Fair
Value as a %
of Net Assets | |
Chesapeake Funding II LLC
2016-1A A1 | | 3/24/2016 | | $ | 34,496,166 | | | $ | 34,560,238 | | | | 0.68 | % | |
Chesapeake Funding II LLC
2016-2A A1 | | 6/14/2016 | | | 29,533,487 | | | | 29,487,136 | | | | 0.58 | % | |
Chesapeake Funding LLC
2014-1A A
| | 3/4/2014,
10/22/2015 | | |
22,179,434 | | | |
22,191,663 | | | | 0.44 | % | |
Citigroup Mortgage Loan Trust, Inc.
2014-A A
| | 2/24/2014,
7/28/2015 | | |
15,995,098 | | | |
16,121,136 | | | | 0.32 | % | |
Conn's Receivables Funding LLC
2016-A B | | 3/11/2016 | | | 28,433,507 | | | | 28,473,245 | | | | 0.56 | % | |
Conn's Receivables Funding LLC
2016-A A | | 3/11/2016 | | | 10,707,489 | | | | 10,738,639 | | | | 0.21 | % | |
Credit Acceptance Auto Loan Trust
2015-2A B | | 8/12/2015 | | | 27,414,056 | | | | 27,532,064 | | | | 0.55 | % | |
Credit Acceptance Auto Loan Trust
2016-2A B | | 5/4/2016 | | | 22,931,363 | | | | 22,988,113 | | | | 0.46 | % | |
Credit Acceptance Auto Loan Trust
2014-2A A
| | 3/2/2015,
7/29/2015,
8/6/2015 | | | 22,491,781 | | | | 22,482,361 | | | | 0.45 | % | |
Credit Acceptance Auto Loan Trust
2014-1A B | | 6/16/2015 | | | 12,063,958 | | | | 12,034,735 | | | | 0.24 | % | |
Credit Acceptance Auto Loan Trust
2014-2A B | | 9/18/2014,
7/30/2015 | | | 11,732,534 | | | | 11,729,184 | | | | 0.23 | % | |
Credit Acceptance Auto Loan Trust
2016-2A A | | 5/4/2016,
6/22/2016 | | | 9,965,891 | | | | 9,986,757 | | | | 0.20 | % | |
Credit Acceptance Auto Loan Trust
2014-1A A
| | 8/6/2015,
8/12/2015,
10/23/2015 | | | 3,488,793 | | | | 3,495,855 | | | | 0.07 | % | |
Credit Acceptance Auto Loan Trust
2015-1A B | | 7/31/2015 | | | 3,161,270 | | | | 3,142,653 | | | | 0.06 | % | |
Credit Acceptance Auto Loan Trust
2015-1A A | | 10/23/2015 | | | 2,761,638 | | | | 2,753,470 | | | | 0.05 | % | |
Credit Acceptance Auto Loan Trust
2015-2A C | | 8/12/2015 | | | 549,994 | | | | 553,013 | | | | 0.01 | % | |
Credit Suisse Mortgage Trust Series
2010-9R 1A4 | | 2/10/2016 | | | 21,685,938 | | | | 21,428,617 | | | | 0.42 | % | |
DT Auto Owner Trust 2015-2A B | | 6/10/2015 | | | 29,670,059 | | | | 29,625,611 | | | | 0.59 | % | |
31
FPA NEW INCOME, INC.
PORTFOLIO OF INVESTMENTS — RESTRICTED SECURITIES
(Continued)
September 30, 2016
Issuer | | Acquisition
Date (s) | | Cost | | Fair
Value | | Fair
Value as a %
of Net Assets | |
DT Auto Owner Trust 2015-3A B | | 10/7/2015 | | $ | 27,645,737 | | | $ | 27,731,275 | | | | 0.55 | % | |
DT Auto Owner Trust 2016-4A B | | 9/28/2016 | | | 13,676,204 | | | | 13,672,192 | | | | 0.27 | % | |
DT Auto Owner Trust 2016-2A A | | 4/6/2016 | | | 6,553,042 | | | | 6,544,823 | | | | 0.13 | % | |
DT Auto Owner Trust 2016-2A B | | 4/6/2016 | | | 5,391,899 | | | | 5,391,593 | | | | 0.11 | % | |
DT Auto Owner Trust 2015-1A B
| | 5/13/2015,
7/22/2015 | | | 2,608,721 | | | | 2,602,727 | | | | 0.05 | % | |
Dell Equipment Finance Trust
2016-1 A1 | | 7/12/2016 | | | 44,460,025 | | | | 44,438,786 | | | | 0.88 | % | |
Enterprise Fleet Financing LLC
2015-2 A2 | | 7/22/2015 | | | 47,379,299 | | | | 47,404,404 | | | | 0.94 | % | |
Enterprise Fleet Financing LLC
2014-2 A2
| | 8/26/2014,
3/25/2015,
4/28/2015,
5/28/2015,
2/17/2016 | | | 19,126,218 | | | | 19,080,135 | | | | 0.38 | % | |
Enterprise Fleet Financing LLC
2016-2 A2 | | 7/12/2016 | | | 18,590,805 | | | | 18,538,602 | | | | 0.37 | % | |
Enterprise Fleet Financing LLC
2013-2 A3 | | 8/4/2015 | | | 15,644,503 | | | | 15,657,711 | | | | 0.31 | % | |
Enterprise Fleet Financing LLC
2014-1 A2 | | 5/7/2015 | | | 6,491,351 | | | | 6,488,615 | | | | 0.13 | % | |
First Investors Auto Owner Trust
2016-1A A2 | | 2/10/2016 | | | 16,653,000 | | | | 16,740,665 | | | | 0.33 | % | |
First Investors Auto Owner Trust
2015-2A A2 | | 8/18/2015 | | | 16,582,495 | | | | 16,575,448 | | | | 0.33 | % | |
First Investors Auto Owner Trust
2016-2A A2 | | 9/12/2016 | | | 5,513,643 | | | | 5,518,783 | | | | 0.11 | % | |
First Investors Auto Owner Trust
2015-2A B | | 8/18/2015 | | | 4,442,637 | | | | 4,475,186 | | | | 0.09 | % | |
First Investors Auto Owner Trust
2014-1A A3 | | 4/3/2014 | | | 4,353,550 | | | | 4,351,297 | | | | 0.09 | % | |
First Investors Auto Owner Trust
2015-1A A2 | | 4/16/2015 | | | 2,686,453 | | | | 2,685,844 | | | | 0.05 | % | |
Golden Credit Card Trust
2012-2A A1
| | 4/23/2015,
5/4/2015 | | | 31,422,779 | | | | 31,255,775 | | | | 0.62 | % | |
Grayson CLO, Ltd. 2006-1A A1B | | 9/8/2016 | | | 8,510,365 | | | | 8,512,172 | | | | 0.17 | % | |
GreatAmerica Leasing Receivables
Funding LLC Series 2015-1 A2 | | 2/26/2016 | | | 1,568,015 | | | | 1,569,258 | | | | 0.03 | % | |
Hertz Fleet Lease Funding LP
2016-1 A2 | | 4/13/2016 | | | 21,045,628 | | | | 21,060,814 | | | | 0.42 | % | |
32
FPA NEW INCOME, INC.
PORTFOLIO OF INVESTMENTS — RESTRICTED SECURITIES
(Continued)
September 30, 2016
Issuer | | Acquisition
Date (s) | | Cost | | Fair
Value | | Fair
Value as a %
of Net Assets | |
Hyundai Auto Lease Securitization
Trust 2014-B A4 | | 4/20/2015 | | $ | 3,132,883 | | | $ | 3,128,116 | | | | 0.06 | % | |
InSite Issuer LLC
| | 8/19/2013,
2/12/2015,
10/20/2015 | | | 12,025,787 | | | | 12,472,159 | | | | 0.25 | % | |
JP Morgan Chase Commercial
Mortgage Securities Trust
2013-WT A
| | 11/16/2015,
11/18/2015 | | | 17,523,935 | | | | 17,346,075 | | | | 0.34 | % | |
Leaf Receivables Funding 11 LLC
2016-1 A2 | | 5/18/2016 | | | 17,598,290 | | | | 17,614,487 | | | | 0.35 | % | |
MBFODDTL
| | 3/16/2016,
7/12/2016 | | | — | | | | 75,552 | | | | 0.00 | % | |
MBFOTL
| | 3/16/2016,
6/27/2016,
7/12/2016 | | | 26,309,999 | | | | 27,118,110 | | | | 0.54 | % | |
MBLODDTL
| | 3/16/2016,
7/12/2016 | | | — | | | | 57,630 | | | | 0.00 | % | |
MBLOTL
| | 3/16/2016,
6/27/2016,
7/12/2016 | | | 14,397,891 | | | | 14,730,165 | | | | 0.29 | % | |
MMAF Equipment Finance LLC
2013-AA A4 | | 6/15/2016 | | | 14,536,067 | | | | 14,481,598 | | | | 0.29 | % | |
MMAF Equipment Finance LLC
2015-AA A2 | | 5/5/2015 | | | 8,411,298 | | | | 8,408,911 | | | | 0.17 | % | |
MMAF Equipment Finance LLC
2013-AA A3
| | 3/26/2015,
5/1/2015,
6/5/2015 | | | 5,515,798 | | | | 5,513,343 | | | | 0.11 | % | |
MMAF Equipment Finance LLC
2012-AA A4 | | 6/5/2015 | | | 959,357 | | | | 958,065 | | | | 0.02 | % | |
N671US Trust | | 8/16/2012 | | | 11,080,403 | | | | 11,302,011 | | | | 0.22 | % | |
NRZ Advance Receivables Trust
Advance Receivables Backed
2016-T1 AT1 | | 6/23/2016 | | | 28,937,000 | | | | 28,936,951 | | | | 0.57 | % | |
NRZ Advance Receivables Trust
Advance Receivables Backed
2015-T4 AT4 | | 7/11/2016 | | | 7,806,246 | | | | 7,792,150 | | | | 0.15 | % | |
Nationstar HECM Loan Trust
2016-1A A | | 2/25/2016 | | | 6,700,224 | | | | 6,694,730 | | | | 0.13 | % | |
Nationstar HECM Loan Trust
2015-2A A | | 11/19/2015 | | | 3,686,366 | | | | 3,687,840 | | | | 0.07 | % | |
33
FPA NEW INCOME, INC.
PORTFOLIO OF INVESTMENTS — RESTRICTED SECURITIES
(Continued)
September 30, 2016
Issuer | | Acquisition
Date (s) | | Cost | | Fair
Value | | Fair
Value as a %
of Net Assets | |
Nationstar HECM Loan Trust
2016-3A A 8/11/2016,
| | 9/25/2016 | | $ | 3,533,190 | | | $ | 3,536,016 | | | | 0.07 | % | |
Nielsen Fin LLC Term Loan B 1 | | 8/1/2016 | | | 1,870,018 | | | | 1,870,000 | | | | 0.04 | % | |
Nomura Resecuritization Trust
2016-1R 3A1 | | 5/5/2016 | | | 7,496,639 | | | | 7,487,654 | | | | 0.15 | % | |
OCI Beaumont LLC Term Loan B
| | 3/26/2014,
4/2/2014,
4/9/2014,
6/16/2015,
6/30/2015,
8/18/2015,
8/21/2015,
8/27/2015,
8/28/2015,
9/30/2015 | | | 26,356,210 | | | | 25,263,115 | | | | 0.50 | % | |
OTGDDTL | | 8/26/2016 | | | — | | | | 37,148 | | | | 0.00 | % | |
OTGTL | | 8/26/2016 | | | 19,576,822 | | | | 19,951,029 | | | | 0.40 | % | |
Ocwen Master Advance Receivables
Trust 2016-T1 AT1 | | 8/3/2016 | | | 51,028,000 | | | | 50,948,269 | | | | 1.01 | % | |
Oportun Funding III LLC 2016-B A | | 6/22/2016 | | | 10,120,986 | | | | 10,085,449 | | | | 0.20 | % | |
Ores LLC 2014-LV3 B
| | 3/21/2014,
2/12/2015 | | | 49,870,996 | | | | 49,969,000 | | | | 0.99 | % | |
PFS Financing Corporation 2016-A A | | 2/9/2016 | | | 57,782,954 | | | | 57,855,390 | | | | 1.15 | % | |
PFS Financing Corporation
2014-AA A
| | 2/4/2014,
4/24/2015,
7/28/2015,
10/27/2015 | | | 33,014,534 | | | | 33,002,712 | | | | 0.65 | % | |
PFS Financing Corporation
2014-BA A
| | 2/18/2015,
6/15/2015,
10/23/2015,
11/17/2015 | | | 32,884,027 | | | | 32,876,907 | | | | 0.65 | % | |
PFS Financing Corporation
2015-AA A
| | 4/8/2015,
7/30/2015 | | | 29,096,828 | | | | 28,899,725 | | | | 0.57 | % | |
PFS Financing Corporation
2015-AA B | | 4/8/2015 | | | 500,000 | | | | 492,997 | | | | 0.01 | % | |
Porsche Innovative Lease Owner
Trust 2014-1 A4 | | 3/2/2015 | | | 15,256,017 | | | | 15,264,655 | | | | 0.30 | % | |
34
FPA NEW INCOME, INC.
PORTFOLIO OF INVESTMENTS — RESTRICTED SECURITIES
(Continued)
September 30, 2016
Issuer | | Acquisition
Date (s) | | Cost | | Fair
Value | | Fair
Value as a %
of Net Assets | |
Prestige Auto Receivables
Trust 2015-1 A3 3/18/2015,
| | 5/29/2015 | | $ | 17,143,301 | | | $ | 17,119,461 | | | | 0.34 | % | |
Prestige Auto Receivables
Trust 2014-1A A3
| | 3/18/2014,
11/5/2015 | | | 13,860,903 | | | | 13,854,807 | | | | 0.27 | % | |
Prestige Auto Receivables Trust
2015-1 B | | 3/18/2015 | | | 10,394,503 | | | | 10,400,386 | | | | 0.21 | % | |
Prestige Auto Receivables Trust
2016-1A A3 | | 3/16/2016 | | | 7,917,000 | | | | 7,940,061 | | | | 0.16 | % | |
Prestige Auto Receivables Trust
2013-1A A3 | | 9/12/2014 | | | 137,643 | | | | 137,338 | | | | 0.00 | % | |
RMAT LLC 2015-PR1 A1 | | 6/23/2015 | | | 23,501,953 | | | | 23,308,086 | | | | 0.46 | % | |
Rialto Capital Management LLC
2014-LT5 B | | 11/20/2014 | | | 7,427,560 | | | | 7,412,000 | | | | 0.15 | % | |
Rialto Real Estate Fund LP
2015-LT7 B | | 6/15/2015 | | | 17,716,000 | | | | 17,361,680 | | | | 0.34 | % | |
Rialto Real Estate Fund LP
2014-LT6 B
| | 9/17/2014,
2/12/2015 | | | 8,922,812 | | | | 8,914,596 | | | | 0.18 | % | |
RiverView HECM Trust 2007-1 A
| | 1/9/2013,
2/12/2015 | | | 26,250,487 | | | | 25,175,973 | | | | 0.50 | % | |
STORE Master Funding LLC
2012-1A A | | 8/31/2012 | | | 468,706 | | | | 490,328 | | | | 0.01 | % | |
Stanwich Mortgage Loan Trust
Series 2011-1 A
| | 5/10/2011,
9/22/2011 | | | 765,547 | | | | 764,567 | | | | 0.02 | % | |
Stanwich Mortgage Loan Trust
Series 2010-2 A
| | 5/21/2010,
9/22/2011 | | | 740,052 | | | | 705,919 | | | | 0.01 | % | |
Stanwich Mortgage Loan Trust
Series 2011-2 A
| | 6/10/2011,
9/22/2011 | | | 590,544 | | | | 586,998 | | | | 0.01 | % | |
Stanwich Mortgage Loan Trust
Series 2010-4 A
| | 8/4/2010,
9/22/2011 | | | 391,738 | | | | 422,698 | | | | 0.01 | % | |
Stanwich Mortgage Loan Trust
Series 2010-3 A
| | 6/2/2010,
9/22/2011 | | | 335,158 | | | | 345,451 | | | | 0.01 | % | |
Stanwich Mortgage Loan Trust
Series 2010-1 A
| | 4/22/2010,
9/22/2011 | | | 129,352 | | | | 124,670 | | | | 0.00 | % | |
35
FPA NEW INCOME, INC.
PORTFOLIO OF INVESTMENTS — RESTRICTED SECURITIES
(Continued)
September 30, 2016
Issuer | | Acquisition
Date (s) | | Cost | | Fair
Value | | Fair
Value as a %
of Net Assets | |
Stanwich Mortgage Loan Trust
Series 2009-2 A 9/22/2011,
| | 7/1/2013 | | $ | 44,593 | | | $ | 44,657 | | | | 0.00 | % | |
Sunset Mortgage Loan Co. LLC
2015-NPL1 A | | 10/2/2015 | | | 22,585,164 | | | | 22,678,371 | | | | 0.45 | % | |
Sunset Mortgage Loan Co. LLC
2014-NPL2 A | | 11/25/2014 | | | 16,039,656 | | | | 15,973,002 | | | | 0.32 | % | |
Sunset Mortgage Loan Co. LLC
2014-NPL1 A
| | 8/21/2014,
2/12/2015 | | | 5,400,675 | | | | 5,404,875 | | | | 0.11 | % | |
THL Credit Wind River CLO, Ltd.
2013-2A A2A | | 9/12/2016 | | | 6,312,546 | | | | 6,300,000 | | | | 0.12 | % | |
Telos CLO, Ltd. 2013-4A A | | 8/29/2016 | | | 7,916,539 | | | | 7,937,948 | | | | 0.16 | % | |
Towd Point Mortgage Trust
2015-2 1A1 | | 5/28/2015 | | | 45,382,908 | | | | 45,990,918 | | | | 0.91 | % | |
Towd Point Mortgage Trust
2015-2 2A1 | | 6/10/2015 | | | 37,892,687 | | | | 38,384,539 | | | | 0.76 | % | |
Towd Point Mortgage Trust
2015-1 AES
| | 11/4/2015,
12/9/2015 | | | 33,949,969 | | | | 34,560,619 | | | | 0.68 | % | |
Towd Point Mortgage Trust
2016-3 A1 | | 7/22/2016 | | | 30,311,592 | | | | 30,429,982 | | | | 0.60 | % | |
Towd Point Mortgage Trust
2015-4 A1 | | 9/25/2015 | | | 28,935,886 | | | | 29,358,094 | | | | 0.58 | % | |
Unison Ground Lease Funding LLC
2010-1-2 | | 12/13/2012,
2/12/2015 | | | 22,884,867 | | | | 21,490,616 | | | | 0.43 | % | |
Unison Ground Lease Funding LLC
2013-1 B
| | 3/12/2013,
7/16/2013,
2/12/2015 | | | 10,826,882 | | | | 10,706,035 | | | | 0.21 | % | |
Unison Ground Lease Funding LLC
2013-2 B
| | 3/12/2013,
2/12/2015 | | | 3,767,008 | | | | 3,543,804 | | | | 0.07 | % | |
VFC LLC 2014-2 B | | 7/9/2014 | | | 3,851,294 | | | | 3,854,586 | | | | 0.08 | % | |
VOLT XL LLC 2015-NP14 A1 | | 12/8/2015 | | | 27,677,730 | | | | 27,965,504 | | | | 0.55 | % | |
VOLT XXV LLC 2015-NPL8 A1 | | 6/17/2015 | | | 28,981,883 | | | | 29,048,382 | | | | 0.58 | % | |
VOLT XXVII LLC 2014-NPL7 A1 | | 10/24/2014 | | | 29,701,505 | | | | 29,735,788 | | | | 0.59 | % | |
VOLT XXXI LLC 2015-NPL2 A1 | | 1/20/2016 | | | 1,380,631 | | | | 1,406,482 | | | | 0.03 | % | |
VOLT XXXIII LLC 2015-NPL5 A1
| | 3/13/2015,
1/13/2016 | | | 37,422,393 | | | | 37,516,277 | | | | 0.74 | % | |
VOLT XXXIV LLC 2015-NPL7 A1 | | 4/24/2015 | | | 24,323,521 | | | | 24,273,155 | | | | 0.48 | % | |
36
FPA NEW INCOME, INC.
PORTFOLIO OF INVESTMENTS — RESTRICTED SECURITIES
(Continued)
September 30, 2016
Issuer | | Acquisition
Date (s) | | Cost | | Fair
Value | | Fair
Value as a %
of Net Assets | |
VOLT XXXIX LLC 2015-NP13 A1 | | 10/22/2015 | | $ | 371,861 | | | $ | 375,132 | | | | 0.01 | % | |
VOLT XXXV LLC 2015-NPL9 A1 | | 6/26/2015 | | | 18,882,730 | | | | 18,900,319 | | | | 0.37 | % | |
VOLT XXXVI LLC 2015-NP10 A1 | | 7/10/2015 | | | 17,027,921 | | | | 17,068,893 | | | | 0.34 | % | |
VOLT XXXVIII LLC 2015-NP12 A1 | | 9/11/2015 | | | 21,354,745 | | | | 21,456,223 | | | | 0.42 | % | |
Volvo Financial Equipment LLC
Series 2013-1A B | | 6/11/2015 | | | 1,495,556 | | | | 1,498,692 | | | | 0.03 | % | |
WCP ISSUER LLC 2013-1 B
| | 8/1/2013,
2/12/2015 | | | 15,000,000 | | | | 15,434,700 | | | | 0.31 | % | |
Westlake Automobile Receivables
Trust 2015-3A B | | 10/9/2015 | | | 23,800,923 | | | | 23,883,382 | | | | 0.47 | % | |
Westlake Automobile Receivables
Trust 2015-1A B | | 3/4/2015,
5/29/2015 | | | 18,510,951 | | | | 18,493,344 | | | | 0.37 | % | |
Westlake Automobile Receivables
Trust 2015-2A B | | 6/18/2015 | | | 15,898,691 | | | | 15,905,668 | | | | 0.32 | % | |
Westlake Automobile Receivables
Trust 2015-1A A2 | | 3/4/2015,
4/27/2015 | | | 1,648,474 | | | | 1,647,993 | | | | 0.03 | % | |
Westlake Automobile Receivables
Trust 2015-3A C | | 10/9/2015 | | | 549,927 | | | | 554,062 | | | | 0.01 | % | |
Westlake Automobile Receivables
Trust 2015-1A C | | 3/4/2015 | | | 549,928 | | | | 551,023 | | | | 0.01 | % | |
Westlake Automobile Receivables
Trust 2015-2A C | | 6/18/2015 | | | 549,978 | | | | 550,097 | | | | 0.01 | % | |
Westlake Automobile Receivables
Trust 2014-1A C | | 5/20/2014 | | | 124,695 | | | | 124,649 | | | | 0.00 | % | |
Westwood CDO II, Ltd. 2007-2A A2 | | 8/3/2016 | | | 5,002,430 | | | | 5,012,097 | | | | 0.10 | % | |
Wheels SPV 2 LLC 2015-1A A2
| | 6/2/2015,
6/10/2015 | | | 13,253,104 | | | | 13,262,368 | | | | 0.26 | % | |
Wheels SPV 2 LLC 2014-1A A2
| | 5/13/2014,
2/18/2015,
3/27/2015,
5/18/2015 | | | 3,846,701 | | | | 3,845,642 | | | | 0.08 | % | |
Xplornet Communications, Inc.
Term Loan B
| | 9/6/2016,
9/8/2016,
9/20/2016 | | | 24,501,285 | | | | 24,868,644 | | | | 0.49 | % | |
TOTAL RESTRICTED SECURITIES | | | | $ | 2,365,580,906 | | | $ | 2,348,131,250 | | | | 46.51 | % | |
See accompanying Notes to Financial Statements.
37
FPA NEW INCOME, INC.
STATEMENT OF ASSETS AND LIABILITIES
September 30, 2016
ASSETS | |
Investment securities — at fair value (identified cost $5,032,758,623) | | $ | 4,947,808,262 | | |
Short-term investments — at amortized cost (maturities 60 days or less) | | | 146,380,000 | | |
Cash | | | 175 | | |
Receivable for: | |
Interest | | | 23,414,590 | | |
Capital Stock sold | | | 4,984,130 | | |
Investment securities sold | | | 2,079,042 | | |
Prepaid expenses and other assets | | | 552 | | |
Total assets | | | 5,124,666,751 | | |
LIABILITIES | |
Payable for: | |
Investment securities purchased | | | 64,689,504 | | |
Capital Stock repurchased | | | 8,973,407 | | |
Advisory fees | | | 1,512,858 | | |
Accrued expenses and other liabilities | | | 881,355 | | |
Total liabilities | | | 76,057,124 | | |
NET ASSETS | | $ | 5,048,609,627 | | |
SUMMARY OF SHAREHOLDERS' EQUITY | |
Capital Stock — par value $0.01 per share; authorized
600,000,000 shares; outstanding 501,757,983 shares | | $ | 5,017,580 | | |
| Additional Paid-in Capital | | | 5,454,200,016 | | |
| Accumulated net realized loss on investments | | | (344,450,317 | ) | |
| Undistributed net investment income | | | 18,792,708 | | |
Net unrealized depreciation | | | (84,950,361 | ) | |
NET ASSETS | | $ | 5,048,609,627 | | |
NET ASSET VALUE | |
Offering and redemption price per share | | $ | 10.06 | | |
See accompanying Notes to Financial Statements.
38
FPA NEW INCOME, INC.
STATEMENT OF OPERATIONS
For the Year Ended September 30, 2016
INVESTMENT INCOME | |
Interest | | $ | 131,004,263 | | |
EXPENSES | |
Advisory fees | | | 26,721,827 | | |
Transfer agent fees and expenses | | | 2,351,958 | | |
Reports to shareholders | | | 569,519 | | |
Legal fees | | | 307,038 | | |
Administrative services fees | | | 277,105 | | |
Director fees and expenses | | | 264,062 | | |
Professional fees | | | 249,183 | | |
| Custodian fees | | | 198,621 | | |
Filing fees | | | 149,468 | | |
Audit and tax services fees | | | 86,161 | | |
Other | | | 52,036 | | |
| Total expenses | | | 31,226,978 | | |
| Reimbursement from Adviser | | | (1,608,154 | ) | |
Net expenses | | | 29,618,824 | | |
Net investment income | | | 101,385,439 | | |
NET REALIZED AND UNREALIZED GAIN (LOSS) | |
Net realized gain (loss) on: | |
Investments | | | (62,080,983 | ) | |
Net change in unrealized appreciation (depreciation) of: | |
Investments | | | 40,170,259 | | |
Net realized and unrealized loss | | | (21,910,724 | ) | |
NET INCREASE IN NET ASSETS RESULTING FROM OPERATIONS | | $ | 79,474,715 | | |
See accompanying Notes to Financial Statements.
39
FPA NEW INCOME, INC.
STATEMENTS OF CHANGES IN NET ASSETS
| | | Year Ended
September 30, 2016 | | Year Ended
September 30, 2015 | |
INCREASE (DECREASE) IN NET ASSETS | |
Operations: | |
Net investment income | | $ | 101,385,439 | | | $ | 85,409,621 | | |
Net realized gain (loss) | | | (62,080,983 | ) | | | 3,339,184 | | |
Net change in unrealized appreciation (depreciation) | | | 40,170,259 | | | | (40,891,517 | ) | |
Net increase in net assets resulting from operations | | | 79,474,715 | | | | 47,857,288 | | |
Distributions to shareholders from: | |
Net investment income | | | (92,044,210 | ) | | | (136,904,248 | ) | |
Total distributions | | | (92,044,210 | ) | | | (136,904,248 | ) | |
Capital Stock transactions: | |
Proceeds from Capital Stock sold | | | 1,437,172,413 | | | | 2,026,439,200 | | |
Proceeds from shares issued to shareholders upon
reinvestment of dividends and distributions | | | 79,183,886 | | | | 115,599,394 | | |
Cost of Capital Stock repurchased | | | (2,091,695,469 | )* | | | (2,246,338,789 | )* | |
Net decrease from Capital Stock transactions | | | (575,339,170 | ) | | | (104,300,195 | ) | |
Total change in net assets | | | (587,908,665 | ) | | | (193,347,155 | ) | |
NET ASSETS | |
Beginning of Year | | | 5,636,518,292 | | | | 5,829,865,447 | | |
End of Year | | $ | 5,048,609,627 | | | $ | 5,636,518,292 | | |
CHANGE IN CAPITAL STOCK OUTSTANDING | |
Shares of Capital Stock sold | | | 143,835,897 | | | | 199,792,625 | | |
Shares issued to shareholders upon reinvestment of
dividends and distributions | | | 7,933,898 | | | | 11,417,117 | | |
Shares of Capital Stock repurchased | | | (209,364,243 | ) | | | (221,452,886 | ) | |
Change in Capital Stock outstanding | | | (57,594,448 | ) | | | (10,243,144 | ) | |
* Net of redemption fees of $548,198 and $477,919 for the year ended September 30, 2016 and year ended September 30, 2015, respectively.
See accompanying Notes to Financial Statements.
40
FPA NEW INCOME, INC.
FINANCIAL HIGHLIGHTS
Selected Data for Each Share of Capital Stock Outstanding Throughout Each Year
| | | Year Ended September 30, | |
| | | 2016 | | 2015 | | 2014 | | 2013 | | 2012 | |
Per share operating performance: | |
Net asset value at beginning of year | | $ | 10.08 | | | $ | 10.24 | | | $ | 10.45 | | | $ | 10.70 | | | $ | 10.84 | | |
Income from investment operations: | |
Net investment income* | | | 0.19 | | | | 0.15 | | | | 0.30 | | | | 0.28 | | | | 0.27 | | |
Net realized and unrealized loss on
investment securities | | | (0.04 | ) | | | (0.06 | ) | | | (0.15 | ) | | | (0.21 | ) | | | (0.04 | ) | |
Total from investment operations | | $ | 0.15 | | | $ | 0.09 | | | $ | 0.15 | | | $ | 0.07 | | | $ | 0.23 | | |
Less distributions: | |
Dividends from net investment income | | | (0.17 | ) | | | (0.25 | ) | | | (0.36 | ) | | | (0.32 | ) | | | (0.37 | ) | |
Redemption fees | | | — | ** | | | — | ** | | | — | ** | | | — | ** | | | — | ** | |
Net asset value at end of year | | $ | 10.06 | | | $ | 10.08 | | | $ | 10.24 | | | $ | 10.45 | | | $ | 10.70 | | |
Total investment return*** | | | 1.52 | % | | | 0.84 | % | | | 1.47 | % | | | 0.66 | % | | | 2.18 | % | |
Ratios/supplemental data: | |
Net assets, end of year (in $000's) | | $ | 5,048,610 | | | $ | 5,636,518 | | | $ | 5,829,865 | | | $ | 5,032,567 | | | $ | 5,091,681 | | |
Ratio of expenses of average net assets: | |
Before reimbursement from Adviser | | | 0.58 | % | | | 0.58 | % | | | 0.56 | % | | | 0.58 | % | | | 0.57 | % | |
After reimbursement from Adviser | | | 0.55 | % | | | N/A | | | | N/A | | | | N/A | | | | N/A | | |
Ratio of net investment income to
average net assets: | |
Before reimbursement from Adviser | | | 1.87 | % | | | 1.50 | % | | | 2.59 | % | | | 2.74 | % | | | 2.21 | % | |
After reimbursement from Adviser | | | 1.90 | % | | | N/A | | | | N/A | | | | N/A | | | | N/A | | |
| Portfolio turnover rate | | | 44 | % | | | 64 | %**** | | | 97 | % | | | 84 | % | | | 77 | % | |
* Per share amount is based on average shares outstanding.
** Rounds to less than $0.01 per share.
*** Return is based on net asset value per share, adjusted for reinvestment of distributions.
**** This amount was previously reported as 29% in the September 30, 2015 Annual Report and has been revised to correct an error in the calculation method.
See accompanying Notes to Financial Statements.
41
FPA NEW INCOME, INC.
NOTES TO FINANCIAL STATEMENTS
September 30, 2016
NOTE 1 — Significant Accounting Policies
FPA New Income, Inc. (the "Fund") is registered under the Investment Company Act of 1940, as a diversified, open-end, management investment company. The Fund's investment objective is to seek current income and long-term total return. Capital preservation is also a consideration. The Fund qualifies as an investment company pursuant to Financial Accounting Standard Board (FASB) Accounting Standards Codification (ASC) No. 946, Financial Services — Investment Companies. The following is a summary of significant accounting policies consistently followed by the Fund in the preparation of its financial statements.
A. Security Valuation
The Fund's investments are reported at fair value as defined by accounting principles generally accepted in the United States of America, ("U.S. GAAP"). The Fund generally determines its net asset value as of approximately 4:00 p.m. New York time each day the New York Stock Exchange is open. Further discussion of valuation methods, inputs and classifications can be found under Disclosure of Fair Value Measurements.
B. Securities Transactions and Related Investment Income
Securities transactions are accounted for on the date the securities are purchased or sold. Dividend income and distributions to shareholders are recorded on the ex-dividend date. Interest income and expenses are recorded on an accrual basis. Market discounts and premiums on fixed income securities are amortized over the expected life of the securities. Realized gains or losses are based on the specific identification method.
C. Use of Estimates
The preparation of the financial statements in accordance with U.S. GAAP requires management to make estimates and assumptions that affect the amounts reported. Actual results could differ from those estimates.
NOTE 2 — Risk Considerations
Investing in the Fund may involve certain risks including, but not limited to, those described below.
Market Risk: Because the values of the Fund's investments will fluctuate with market conditions, so will the value of your investment in the Fund. You could lose money on your investment in the Fund or the Fund could underperform other investments.
Interest Rate Risk: The values of, and the income generated by, most debt securities held by the Fund may be affected by changing interest rates and by changes in the effective maturities and credit rating of these securities. For example, the value of debt securities in the Fund's portfolio generally will decline when interest rates rise and increase when interest rates fall. In addition, falling interest rates may cause an issuer to redeem, call or refinance a security before its stated maturity, which may result in the Fund having to reinvest the proceeds in lower yielding securities.
Mortgage-Backed and Other Asset-Backed Securities Risk: The values of some mortgage-backed and other asset-backed securities may expose the Fund to a lower rate of return upon reinvestment of principal. When interest rates rise, the value of mortgage-related securities generally will decline; however, when interest rates are declining, the value of mortgage related-securities with prepayment features may not increase as much as other fixed income securities. The rate of prepayments on underlying mortgages will affect the price and volatility of a mortgage-related security, and may shorten or extend the effective maturity of the security beyond what was
42
FPA NEW INCOME, INC.
NOTES TO FINANCIAL STATEMENTS
Continued
anticipated at the time of purchase. If an unanticipated rate of prepayment on underlying mortgages increases the effective maturity of a mortgage-related security, the volatility of the security can be expected to increase. The value of these securities may also fluctuate in response to the market's perception of the creditworthiness of the issuers. Additionally, although mortgages and mortgage-related securities are generally supported by some form of government or private guarantee and/or insurance, there is no assurance that private guarantors or insurers will meet their obligations.
Stripped Mortgage-Backed Interest Only ("I/O") and Principal Only ("P/O") Securities: Stripped mortgage backed securities are usually structured with two classes that receive different proportions of the interest and principal distributions on a pool of mortgage assets. In certain cases, one class will receive all of the interest payments on the underlying mortgages (the I/O class), while the other class will receive all of the principal payments (the P/O class). The Fund currently has investments in I/O and P/O securities. The yield to maturity on IOs is sensitive to the rate of principal repayments (including prepayments) on the related underlying mortgage assets, and principal payments may have a material effect on yield-to-maturity. If the underlying mortgage assets experience greater than anticipated prepayments of principal, a Fund may not fully recoup its initial investment in I/Os.
Credit Risk: Debt securities are subject to credit risk, meaning that the issuer of the debt security may default or fail to make timely payments of principal or interest. The values of any of the Fund's investments may also decline in response to events affecting the issuer or its credit rating. The lower rated debt securities in which the Fund may invest are considered speculative and are generally subject to greater volatility and risk of loss than investment grade securities, particularly in deteriorating economic conditions. The Fund invests a significant portion of its assets in securities of issuers that hold mortgage-and asset-backed securities and direct investments in securities backed by commercial and residential mortgage loans and other financial assets. The value and related income of these securities is sensitive to changes in economic conditions, including delinquencies and/or defaults. Continuing shifts in the market's perception of credit quality on securities backed by commercial and residential mortgage loans and other financial assets may result in increased volatility of market price and periods of illiquidity that can negatively impact the valuation of certain securities held by the Fund.
Repurchase Agreements: Repurchase agreements permit the Fund to maintain liquidity and earn income over periods of time as short as overnight. Repurchase agreements held by the Fund are fully collateralized by U.S. Government securities, or securities issued by U.S. Government agencies, or securities that are within the three highest credit categories assigned by established rating agencies (Aaa, Aa, or A by Moody's or AAA, AA or A by Standard & Poor's) or, if not rated by Moody's or Standard & Poor's, are of equivalent investment quality as determined by the Adviser. Such collateral is in the possession of the Fund's custodian. The collateral is evaluated daily to ensure its market value equals or exceeds the current market value of the repurchase agreements including accrued interest. In the event of default on the obligation to repurchase, the Fund has the right to liquidate the collateral and apply the proceeds in satisfaction of the obligation.
The Fund may enter into repurchase agreements, under the terms of a Master Repurchase Agreement ("MRA"). The MRA permits the Fund, under certain circumstances including an event of default (such as bankruptcy or insolvency), to offset payables and/or receivables under the MRA with collateral held and/or posted to the counterparty and create one single net payment due to or from the Fund. However, bankruptcy or insolvency laws of a particular jurisdiction may impose restrictions on or prohibitions against such a right of offset in the event of a MRA counterparty's bankruptcy or insolvency. Pursuant to the terms of the MRA, the Fund receives securities as collateral with a market value in excess of the repurchase price to be received by the Fund upon the
43
FPA NEW INCOME, INC.
NOTES TO FINANCIAL STATEMENTS
Continued
maturity of the repurchase transaction. Upon a bankruptcy or insolvency of the MRA counterparty, the Fund recognizes a liability with respect to such excess collateral to reflect the Fund's obligation under bankruptcy law to return the excess to the counterparty. Repurchase agreements outstanding at the end of the period are listed in the Fund's Portfolio of Investments.
NOTE 3 — Purchases and Sales of Investment Securities
Cost of purchases of investment securities (excluding short-term investments) aggregated $2,132,977,047 for the year ended September 30, 2016. The proceeds and cost of securities sold resulting in net realized losses of $62,080,983 aggregated $2,472,156,417 and $2,534,237,400, respectively, for the year ended September 30, 2016. Realized gains or losses are based on the specific identification method.
NOTE 4 — Advisory Fees and Other Affiliated Transactions
Pursuant to an Investment Advisory Agreement (the "Agreement"), advisory fees were paid by the Fund to First Pacific Advisors, LLC (the "Adviser"). Under the terms of this Agreement, the Fund pays the Adviser a monthly fee calculated at the annual rate of 0.5% of the Fund's average daily net assets. In addition, the Adviser contractually agreed to reimburse expenses in excess of 0.49% of the average net assets of the Fund (excluding brokerage fees and commissions, interest, taxes, shareholder service fees, fees and expenses of other funds in which the Fund invests, and extraordinary expenses) through May 31, 2017. The Agreement obligates the Adviser to reduce its fee to the extent necessary to reimburse the Fund for any annual expenses (exclusive of interest, taxes, the cost of any supplemental statistical and research information, and extraordinary expenses such as litigation) in excess of 11/2% of the first $15 million and 1% of the remaining average net assets of the Fund for the year.
For the year ended September 30, 2016, the Fund paid aggregate fees and expenses of $264,062 to all Directors who are not affiliated persons of the Adviser. Certain officers of the Fund are also officers of the Adviser.
NOTE 5 — Federal Income Tax
No provision for federal income tax is required because the Fund has elected to be taxed as a "regulated investment company" under the Internal Revenue Code (the "Code") and intends to maintain this qualification and to distribute each year to its shareholders, in accordance with the minimum distribution requirements of the Code, its taxable net investment income and taxable net realized gains on investments.
Distributions paid to shareholders are based on net investment income and net realized gains determined on a tax reporting basis, which may differ from financial reporting. For federal income tax purposes, the Fund had the following components of distributable earnings at September 30, 2016:
Undistributed Ordinary Income | | $ | 32,131,549 | | |
The tax status of distributions paid during the fiscal years ended September 30, 2016 and 2015 were as follows:
| | | 2016 | | 2015 | |
Dividends from ordinary income | | $ | 92,044,210 | | | $ | 136,904,248 | | |
The Fund utilizes the provisions of federal income tax laws that provide for the carryforward of capital losses for prior years, offsetting such losses against any future realized capital gains. Under the Regulated Investment
44
FPA NEW INCOME, INC.
NOTES TO FINANCIAL STATEMENTS
Continued
Company Act of 2010 (the "Act"), net capital losses recognized for fiscal years beginning after December 22, 2010 may be carried forward indefinitely, and their character is retained as short-term and/or long-term losses.
Previously, net capital losses were carried forward for eight years and treated as short-term losses. As a transition rule, the Act requires that post-enactment net capital losses be used before pre-enactment net capital losses.
As of September 30, 2016, the post enactment accumulated losses were $329,795,250, and the pre-enactment capital loss carryforwards were $14,651,655. The ability to carry these pre-enactment losses forward expires as follows: $299,496 in 2017; $3,661,716 in 2018; $10,690,443 in 2019.
The cost of investment securities held at September 30, 2016, was $5,046,100,875 for federal income tax purposes. Gross unrealized appreciation and depreciation for all investments (excluding short-term investments) at September 30, 2016, for federal income tax purposes was $44,817,110 and $143,109,723, respectively resulting in net unrealized depreciation of $98,292,613. The Fund recognizes interest and penalties, if any, related to unrecognized tax benefits as income tax expense in the Statement of Operations. During the year, the Fund did not incur any interest or penalties. The Fund is not subject to examination by U.S. federal tax authorities for years ended on or before September 30, 2012 or by state tax authorities for years ended on or before September 30, 2011.
During the year ended September 30, 2016, the Fund reclassified $18,977,849 from Net Investment Loss to Paid in Capital, and $14,054,471 from Accumulated Realized Gain to Paid in Capital, to align financial reporting with tax reporting. The permanent book/tax differences arose principally from differing book/tax treatment of market discount accretion of securities and paydowns from mortgage-backed and other asset-backed securities. Net assets were not affected by these reclassifications.
NOTE 6 — Redemption Fees
A redemption fee of 2% applies to redemptions within 90 days of purchase. For the year ended September 30, 2016, the Fund collected $548,198 in redemption fees. The impact of these fees is less than $0.01 per share.
NOTE 7 — Disclosure of Fair Value Measurements
The Fund uses the following methods and inputs to establish the fair value of its assets and liabilities. Use of particular methods and inputs may vary over time based on availability and relevance as market and economic conditions evolve.
Equity securities are generally valued each day at the official closing price of, or the last reported sale price on, the exchange or market on which such securities principally are traded, as of the close of business on that day. If there have been no sales that day, equity securities are generally valued at the last available bid price. Securities that are unlisted and fixed-income and convertible securities listed on a national securities exchange for which the over-the-counter ("OTC") market more accurately reflects the securities' value in the judgment of the Fund's officers, are valued at the most recent bid price. However, most fixed income securities are generally valued at prices obtained from pricing vendors and brokers. Vendors value such securities based on one or more of the following inputs: transactions, bids, offers quotations from dealers and trading systems, spreads and other relationships observed in the markets among comparable securities, benchmarks, underlying equity of the issuer, and proprietary pricing models such as cash flows, financial or collateral performance and other reference data (includes prepayments, defaults, collateral, credit enhancements, and interest rate volatility). Short-term corporate notes with maturities of 60 days or less at the time of purchase are valued at amortized cost.
45
FPA NEW INCOME, INC.
NOTES TO FINANCIAL STATEMENTS
Continued
Securities for which representative market quotations are not readily available or are considered unreliable by the Adviser are valued as determined in good faith under procedures adopted by the authority of the Fund's Board of Directors. Various inputs may be reviewed in order to make a good faith determination of a security's value. These inputs include, but are not limited to, the type and cost of the security; contractual or legal restrictions on resale of the security; relevant financial or business developments of the issuer; actively traded similar or related securities; conversion or exchange rights on the security; related corporate actions; significant events occurring after the close of trading in the security; and changes in overall market conditions. Fair valuations and valuations of investments that are not actively trading involve judgment and may differ materially from valuations of investments that would have been used had greater market activity occurred.
The Fund classifies its assets based on three valuation methodologies. Level 1 values are based on quoted market prices in active markets for identical assets. Level 2 values are based on significant observable market inputs, such as quoted prices for similar assets and quoted prices in inactive markets or other market observable inputs as noted above including spreads, cash flows, financial performance, prepayments, defaults, collateral, credit enhancements, and interest rate volatility. Level 3 values are based on significant unobservable inputs that reflect the Fund's determination of assumptions that market participants might reasonably use in valuing the assets. These assumptions consider inputs such as proprietary pricing models, cash flows, prepayments, defaults, and collateral. The valuation levels are not necessarily an indication of the risk associated with investing in those securities. The following table presents the valuation levels of the Fund's investments as of September 30, 2016:
Investments | | Level 1 | | Level 2 | | Level 3 | | Total | |
Commercial Mortgage-Backed Securities | |
Agency | | | — | | | $ | 12,343,870 | | | | — | | | $ | 12,343,870 | | |
Agency Stripped | | | — | | | | 630,607,784 | | | $ | 24,719,119 | | | | 655,326,903 | | |
Non-Agency | | | — | | | | 223,309,020 | | | | 24,773,680 | | | | 248,082,700 | | |
Residential Mortgage-Backed Securities | |
Agency Collateralized Mortgage Obligation | | | — | | | | 124,992,175 | | | | — | | | | 124,992,175 | | |
Agency Pool Adjustable Rate | | | — | | | | 1,806,033 | | | | — | | | | 1,806,033 | | |
Agency Pool Fixed Rate | | | — | | | | 190,742,452 | | | | — | | | | 190,742,452 | | |
Agency Stripped | | | — | | | | 38,507,671 | | | | — | | | | 38,507,671 | | |
Non-Agency Collateralized Mortgage Obligation | | | — | | | | 533,554,969 | | | | 16,913,546 | | | | 550,468,515 | | |
Asset-Backed Securities | |
Auto | | | — | | | | 1,038,150,760 | | | | 13,672,192 | | | | 1,051,822,952 | | |
Credit Card | | | — | | | | 313,223,075 | | | | — | | | | 313,223,075 | | |
Other | | | — | | | | 824,814,667 | | | | 63,978,631 | | | | 888,793,298 | | |
Corporate Bonds & Notes | | | — | | | | 157,622,168 | | | | 42,782,387 | | | | 200,404,555 | | |
Corporate Bank Debt | | | — | | | | 27,133,115 | | | | 106,314,525 | | | | 133,447,640 | | |
Municipals | | | — | | | | — | | | | 23,869,420 | | | | 23,869,420 | | |
U.S. Treasuries | | | — | | | | 513,977,003 | | | | — | | | | 513,977,003 | | |
Short-Term Investment | | | — | | | | 146,380,000 | | | | — | | | | 146,380,000 | | |
| | | | — | | | $ | 4,777,164,762 | | | $ | 317,023,500 | | | $ | 5,094,188,262 | | |
46
FPA NEW INCOME, INC.
NOTES TO FINANCIAL STATEMENTS
Continued
The following table summarizes the Fund's Level 3 investment securities and related transactions during the year ended September 30, 2016:
| Investments | | Beginning
Value at
September 30,
2015 | | Net Realized and
Unrealized Gains
(Losses)* | | Purchases | | (Sales) | | Transfers In | | Transfers Out | | Ending
Value at
September 30,
2016 | | Net Change
in Unrealized
Appreciation
(Depreciation)
related to
Investments held
at September 30,
2016 | |
Commercial
Mortgage-
Backed
Securities
Agency
Stripped | | $ | 28,480,709 | | | $ | (2,958,045 | ) | | $ | 24,951,162 | | | | — | | | | — | | | $ | (25,754,707 | ) | | $ | 24,719,119 | | | $ | (32,748 | ) | |
Commercial
Mortgage-
Backed
Securities
Non-Agency | | | 25,090,940 | | | | (317,260 | ) | | | — | | | | — | | | | — | | | | — | | | | 24,773,680 | | | | (315,621 | ) | |
Residential
Mortgage-
Backed
Non-Agency
Collateralized
Mortgage
Obligation | | | 69,224,818 | | | | 1,074,117 | | | | 21,436,980 | | | $ | (24,008,052 | ) | | | — | | | | (50,814,317 | ) | | | 16,913,546 | | | | (11,082 | ) | |
Asset-Backed
Securities
Auto | | | — | | | | (4,012 | ) | | | 13,676,204 | | | | — | | | | — | | | | — | | | | 13,672,192 | | | | (4,012 | ) | |
Asset-Backed
Securities –
Other | | | 59,788,560 | | | | (655,918 | ) | | | 17,702,109 | | | | (12,856,120 | ) | | | — | | | | — | | | | 63,978,631 | | | | (583,662 | ) | |
Corporate
Bonds &
Notes | | | 39,674,941 | | | | (370,183 | ) | | | 1,155,403 | | | | (20,196,514 | ) | | $ | 22,518,740 | | | | — | | | | 42,782,387 | | | | (2,069,184 | ) | |
Corporate
Bank Debt | | | — | | | | 2,339,562 | | | | 104,489,748 | | | | (514,785 | ) | | | — | | | | — | | | | 106,314,525 | | | | 2,244,218 | | |
Municipals | | | 67,157,764 | | | | 185,926 | | | | 27,204,730 | | | | (70,679,000 | ) | | | — | | | | — | | | | 23,869,420 | | | | 105,320 | | |
| | $ | 289,417,733 | | | $ | (705,814 | ) | | $ | 210,616,336 | | | $ | (128,254,471 | ) | | $ | 22,518,740 | | | $ | (76,569,024 | ) | | $ | 317,023,500 | | | $ | (666,771 | ) | |
* Net realized and unrealized gains (losses) are included in the related amounts in the statement of operations.
Level 3 Valuation Process: Investments classified within Level 3 of the fair value hierarchy are valued by the Adviser in good faith under procedures adopted by authority of the Fund's Board of Directors. The Adviser employs various methods to determine fair valuations including regular review of key inputs and assumptions, and review of related market activity, if any. However, there are generally no observable trade activities in these
47
FPA NEW INCOME, INC.
NOTES TO FINANCIAL STATEMENTS
Continued
securities. The Adviser reports to the Board of Directors at their regularly scheduled quarterly meetings, or more often if warranted. The report includes a summary of the results of the process, the key inputs and assumptions noted, and any changes to the inputs and assumptions used. When appropriate, the Adviser will recommend changes to the procedures and process employed. The value determined for an investment using the fair value procedures may differ significantly from the value realized upon the sale of such investment.
Transfers of investments between different levels of the fair value hierarchy are recorded at market value as of the end of the reporting period. There were no transfers between Level 1 and 2. There were net transfers of $54,050,284 out of Level 3 into Level 2 during the year ended September 30, 2016. The transfers are a result of changes in pricing vendor coverage of the securities during the period and a change in observable inputs.
The following table summarizes the quantitative inputs and assumptions used for items categorized as items categorized as Level 3 of the fair value hierarchy as of September 30, 2016:
| Financial Assets | | Fair Value at
September 30, 2016 | | Valuation
Technique(s) | | Unobservable
Inputs | | Price/Range | |
Commercial
Mortgage-Backed
Securities
Agency Stripped
Non-Agency | | $24,719,119
$24,773,680 | |
Third-Party Broker Quote*
Third-Party Broker Quote* | |
Quotes/Prices
Quotes/Prices | | $8.89
$98.00-$100.00 | |
Residential
Mortgage-Backed
Non-agency CMO
| | $13,918,587
$2,994,959
| |
Third-Party Broker Quote*
Pricing Model**
| |
Quotes/Prices
Prices
Discount | | $99.92-$100.08
$41.94-$59.58 ($50.28)
0.0%-9.09% (3.0%) | |
Asset-Backed Securities
Auto
Other | | $13,672,192
$63,978,631 | |
Third-Party Broker Quote*
Third-Party Broker Quote* | |
Quotes/Prices
Quotes/Prices | | $99.96
$97.93-$103.93 | |
Corporate Bonds
and Notes | | $42,782,387 | |
Third-Party Broker Quote* | |
Quotes/Prices | | $34.00-$102.00 | |
Corporate Bank Debt
| | $170,330
$106,144,195 | | Pricing Model ***
Pricing Vendor | | Reference prices
Prices | | $99.91-$101.26
$99.91-$101.26 | |
Municipals | | $23,869,420 | | Third-Party Broker Quote* | | Quotes/Prices | | $100.00-$100.25 | |
* The Third-Party Broker Quote technique involves obtaining an independent third-party broker quote for the security.
** The Pricing Model technique for Level 3 securities involves preparing a proprietary broker price opinion (BPO) model using valuation information provided by the loan servicer based on local market resources and sales trends published by the National Association of Realtors, and a broker, and then applying an appropriate discount to that valuation. The discount reflects market conditions such as lack of liquidity of the investment, the costs associated with foreclosure and liquidation, the historical performance of the loan pool and the characteristics of the remaining loans including whether or not the loans are performing.
*** The Pricing Model technique for Level 3 securities involves calculating the difference between the fair value of the funded portion of the securitiy and the price at which the Fund is committed to fund the unfunded committment.
48
FPA NEW INCOME, INC.
NOTES TO FINANCIAL STATEMENTS
Continued
NOTE 8 — Distribution to Shareholders
On October 3, 2016, the Fund declared a dividend from net investment income of $0.06 per share payable October 4, 2016 to shareholders of record on September 30, 2016. For financial statement purposes, this dividend was recorded on the ex-dividend date, October 3, 2016.
NOTE 9 — Collateral Requirements
FASB Accounting Standards Update No. 2011-11, Disclosures about Offsetting Assets and Liabilities requires disclosures to make financial statements that are prepared under U.S. GAAP more comparable to those prepared under International Financial Reporting Standards. Under this guidance the Fund discloses both gross and net information about instruments and transactions eligible for offset such as instruments and transactions subject to an agreement similar to a master netting arrangement. In addition, the Fund discloses collateral received and posted in connection with master netting agreements or similar arrangements.
The following table presents the Fund's repurchase agreements by counterparty net of amounts available for offset under an ISDA Master agreement or similar agreements and net of the related collateral received or pledged by the Fund as of September 30, 2016, are as follows:
Counterparty | | Gross Assets
in the Statement of
Assets and Liabilities | | Collateral
Received | | Assets (Liabilities)
Available for Offset | | Net Amount
of Assets* | |
State Street Bank
and Trust Company | | $ | 146,380,000 | | | $ | 146,380,000 | ** | | | — | | | | — | | |
* Represents the net amount receivable from the counterparty in the event of default.
** Collateral with a value of $149,319,064 has been received in connection with a master repurchase agreement. Excess of collateral received from the individual master repurchase agreement is not shown for financial reporting purposes.
49
FPA NEW INCOME, INC.
REPORT OF INDEPENDENT REGISTERED
PUBLIC ACCOUNTING FIRM
TO THE SHAREHOLDERS AND
BOARD OF DIRECTORS OF FPA NEW INCOME, INC.
We have audited the accompanying statement of assets and liabilities of FPA New Income, Inc. (the "Fund"), including the portfolio of investments, as of September 30, 2016, the related statement of operations for the year then ended, the statements of changes in net assets for each of the two years in the period then ended, and the financial highlights for each of the five years in the period then ended. These financial statements and financial highlights are the responsibility of the Fund's management. Our responsibility is to express an opinion on these financial statements and financial highlights based on our audits.
We conducted our audits in accordance with the standards of the Public Company Accounting Oversight Board (United States). Those standards require that we plan and perform the audit to obtain reasonable assurance about whether the financial statements and financial highlights are free of material misstatement. The Fund is not required to have, nor were we engaged to perform, an audit of its internal control over financial reporting. Our audits included consideration of internal control over financial reporting as a basis for designing audit procedures that are appropriate in the circumstances, but not for the purpose of expressing an opinion on the effectiveness of the Fund's internal control over financial reporting. Accordingly, we express no such opinion. An audit also includes examining, on a test basis, evidence supporting the amounts and disclosures in the financial statements, assessing the accounting principles used and significant estimates made by management, as well as evaluating the overall financial statement presentation. Our procedures included confirmation of securities owned as of September 30, 2016, by correspondence with the custodian and brokers, where replies were not received from brokers, we performed other auditing procedures. We believe that our audits provide a reasonable basis for our opinion.
In our opinion, such financial statements and financial highlights referred to above present fairly, in all material respects, the financial position of FPA New Income, Inc. as of September 30, 2016, the results of its operations for the year then ended, the changes in its net assets for each of the two years in the period then ended, and the financial highlights for each of the five years in the period then ended, in conformity with accounting principles generally accepted in the United States of America.
Los Angeles, California
November 18, 2016
50
FPA NEW INCOME, INC.
APPROVAL OF INVESTMENT ADVISORY AGREEMENT
(Unaudited)
Approval of the Advisory Agreement. At a meeting of the Board of Directors held on August 8, 2016, the Directors approved the continuation of the advisory agreement between the Fund and the Adviser for an additional one-year period through September 30, 2017, on the recommendation of the Independent Directors, who met in executive session on August 8, 2016 prior to the Board meeting to review and discuss the proposed continuation of the advisory agreement. The following paragraphs summarize the material information and factors considered by the Board and the Independent Directors, as well as the Directors' conclusions relative to such factors.
Nature, Extent and Quality of Services. The Board and the Independent Directors considered information provided by the Adviser in response to their requests, as well as information provided throughout the year regarding the Adviser and its staffing in connection with the Fund, including the Fund's portfolio managers, the senior analysts supporting team, the scope of services supervised and provided by the Adviser, and the absence of any significant service problems reported to the Board. The Board and the Independent Directors noted the experience, length of service and the outstanding reputation of the Fund's portfolio managers: Tom Atteberry, who has been with the Adviser since 1997, and Abhijeet V. Patwardhan, who joined the Adviser in 2010. The portfolio managers are supported by a team of analysts; Julian W. H. Mann, who joined the Adviser in 2004, Nazanin Pajoom, who joined the Adviser in 2013, Joe Choi, who joined the Adviser in 2014, and Prakash Gopinath, who joined the Adviser in 2015. Robert Rodriguez continues to serve in an advisory capacity since 2010. After discussion, the Board and the Independent Directors concluded that the nature, extent and quality of services provided by the Adviser have benefited and should continue to benefit the Fund and its shareholders.
Investment Performance. The Board and the Independent Directors reviewed the overall investment performance of the Fund. The Directors also received information from an independent consultant, Morningstar, regarding the Fund's performance relative to a peer group of alternative credit focus funds selected by Morningstar (the "Peer Group"). The Board and the Independent Directors considered the Adviser's representation that the Fund's investment style, as evidenced by the short-term duration of most of its portfolio securities, as well as the Fund's flexibility to invest in a variety of areas, complicated Peer Group comparisons in that the Fund is managed in a more conservative style than the typical fixed income fund and the funds in the Peer Group. The Board and the Independent Directors noted the Fund's absolute investment results and its long-term investment performance when compared to the Peer Group. The Board and the Independent Directors noted the Fund performed the same as its Peer Group for the three- and 10-year periods ending March 31, 2016, underperformed its Peer Group for the one- and five-year periods ending March 31, 2016 and underperformed the Fund's benchmark, Barclays Capital U.S. Aggregate Index, for the one-, three-, five- and ten-year periods ending March 31, 2016. They also noted that Morningstar has continued to give the Fund a "Bronze" Analyst Rating. After discussion, the Board and the Independent Directors determined that the Fund's investment results were satisfactory in light of the Fund's objectives and concluded that the Adviser's continued management of the Fund should benefit the Fund and its shareholders.
Advisory Fees and Fund Expenses; Comparison with Peer Group and Institutional Fees. The Board and the Independent Directors considered information provided by the Adviser regarding the Fund's advisory fees and total expense levels. The Board and the Independent Directors reviewed comparative information regarding fees and expenses for the Peer Group. The Board and the Independent Directors noted that the Fund's advisory fee was slightly above the average of the Peer Group and its overall expense ratio was at the low end of the Peer Group. In addition, the Directors noted that the fee rate charged to the Fund is higher than institutional accounts managed in a similar style by the portfolio managers but considered the Adviser's discussion of the differences between the services provided by the Adviser to the Fund and those provided by the Adviser to the
51
FPA NEW INCOME, INC.
APPROVAL OF INVESTMENT ADVISORY AGREEMENT
Continued (Unaudited)
institutional accounts. The Board and the Independent Directors concluded that the continued payment of advisory fees and expenses by the Fund to the Adviser was fair and reasonable and should continue to benefit the Fund and its shareholders.
Adviser Profitability and Costs. The Board and the Independent Directors considered information provided by the Adviser regarding the Adviser's costs in providing services to the Fund, the profitability of the Adviser and the benefits to the Adviser from its relationship to the Fund. They reviewed and considered the Adviser's representations regarding its assumptions and methods of allocating certain costs, such as personnel costs, which constitute the Adviser's largest operating cost, over-head and trading costs with respect to the provision of investment advisory services. Although the Board was not provided with information relating to individuals' compensation levels or amounts, the Independent Directors discussed with the Adviser the process through which individuals' compensation is determined and then reviewed by the management committee of the Adviser, as well as the Adviser's methods for determining that the compensation levels are at appropriate levels to attract and retain the personnel necessary to provide high quality professional investment advice. In evaluating the Adviser's profitability, they considered a portion of the compensation of the Adviser's principals that could be deemed a form of profit, and they excluded certain distribution and marketing-related expenses. The Board and the Independent Directors recognized that the Adviser is entitled under the law to earn a reasonable level of profits for the services that it provides to the Fund. The Board and the Independent Directors concluded that the Adviser's level of profitability from its relationship with the Fund did not indicate that the Adviser's compensation was unreasonable or excessive.
Economies of Scale and Sharing of Economies of Scale. The Board and the Independent Directors considered whether there have been economies of scale with respect to the management of the Fund, whether the Fund has appropriately benefited from any economies of scale, and whether the fee rate is reasonable in relation to the Fund's asset levels and any economies of scale that may exist. The Board and the Independent Directors considered the Adviser's representation that its internal costs of providing investment management services to the Fund have significantly increased in recent years as a result of a number of factors, including the Adviser's substantial investment in additional professional resources and staffing. The Board and the Independent Directors considered quantitative and qualitative information regarding the Adviser's representation that it has also made significant investments in: (1) the two portfolio managers, four analysts, traders and other investment personnel who assist with the management of the Fund; (2) as well as investing in new compliance, operations, and administrative personnel; (3) in information technology, portfolio accounting and trading systems; and (4) in office space, each of which enhances the quality of services provided to the Fund. The Board and the Independent Directors also considered that the Adviser had foregone the reimbursement for providing financial services that it had previously received from the Fund. The Board and the Independent Directors also considered the Adviser's willingness to close funds to new investors when it believed that a fund may have limited capacity to grow or that it otherwise would benefit fund shareholders.
The Board and the Independent Directors recognized that the advisory fee rate schedule for the Fund does not have breakpoints. They considered that many mutual funds have breakpoints in the advisory fee structure as a means by which to share in the benefits of potential economies of scale as a fund's assets grow. They also considered that not all funds have breakpoints in their fee structures and that breakpoints are not the exclusive means of sharing potential economies of scale. The Board and the Independent Directors considered the Adviser's statement that it believes that breakpoints currently remain inappropriate for the Fund given the ongoing investments the Adviser is making in its business for the benefit of the Fund, uncertainties regarding the direction
52
FPA NEW INCOME, INC.
APPROVAL OF INVESTMENT ADVISORY AGREEMENT
Continued (Unaudited)
of the economy, rising inflation, increasing costs for personnel and systems, and growth or contraction in the Fund's assets, all of which could negatively impact the profitability of the Adviser. The Board and the Independent Directors also noted that the Adviser has contractually agreed to reimburse the Fund for Total Annual Fund Operating Expenses in excess of 0.49% of the average daily net assets of the Fund (excluding brokerage fees and commissions, interest, taxes, shareholder service fees, fees and expenses of other funds in which the Fund invests, and extraordinary expenses) through May 31, 2017. The Board and the Independent Directors concluded that the Fund is benefitting from the ongoing investments made by the Adviser in its team of personnel serving the Fund and in the Adviser's service infrastructure, and that in light of these investments, the addition of breakpoints in the Fund's advisory fee structure was not warranted at current asset levels.
Ancillary Benefits. The Board and the Independent Directors considered other actual and potential benefits to the Adviser from managing the Fund, including the acquisition and use of research services with commissions generated by the Fund, in concluding that the contractual advisory and other fees are fair and reasonable for the Fund. They noted that the Adviser does not have any affiliates that benefit from the Adviser's relationship to the Fund.
Conclusions. The Board and the Independent Directors determined that the Fund continues to benefit from the services of the Adviser's highly experienced portfolio management team, which has produced satisfactory long-term returns. In addition, the Board and the Independent Directors agreed that the Fund continues to receive high quality services from the Adviser. The Board and the Independent Directors concluded that the current advisory fee rate is reasonable and fair to the Fund and its shareholders in light of the nature and quality of the services provided by the Adviser and the Adviser's profitability and costs. The Board and the Independent Directors also stated their intention to continue monitoring the factors relevant to the Adviser's compensation, such as changes in the Fund's asset levels, changes in portfolio management personnel and the cost and quality of the services provided by the Adviser to the Fund. On the basis of the foregoing, and without assigning particular weight to any single factor, none of which was dispositive, the Board and the Independent Directors concluded that it would be in the best interests of the Fund to continue to be advised and managed by the Adviser and determined to approve the continuation of the current Advisory Agreement for another one-year period through September 30, 2017.
53
FPA NEW INCOME, INC.
RESULTS OF THE SPECIAL MEETING
(Unaudited)
Results of the Special Meeting of Shareholders:
The Special Meeting of Shareholders was held on May 9, 2016 in Los Angeles, California. The voting results for the proposal considered at the Special Meeting of Shareholders is as follows:
Election of Directors. The shareholders of the Fund elected J. Richard Atwood, Mark L. Lipson, Alfred E. Osborne, Jr., A. Robert Pisano, Patrick B. Purcell, Robert L. Rodriguez and Allan M. Rudnick to serve on the Board of Directors.
FPA New Income, Inc. | | Total Shares Voted For: | | Total Shares Withheld: | |
J. Richard Atwood | | | 447,964,167 | | | | 2,716,595 | | |
Mark L. Lipson | | | 447,967,723 | | | | 2,713,039 | | |
Alfred E. Osborne, Jr. | | | 447,578,877 | | | | 3,101,885 | | |
A. Robert Pisano | | | 447,494,237 | | | | 3,186,525 | | |
Patrick B. Purcell | | | 447,631,181 | | | | 3,049,581 | | |
Robert L. Rodriguez | | | 420,881,988 | | | | 29,798,774 | | |
Allan M. Rudnick | | | 447,618,708 | | | | 3,062,054 | | |
54
FPA NEW INCOME, INC.
SHAREHOLDER EXPENSE EXAMPLE
September 30, 2016 (Unaudited)
Fund Expenses
Mutual fund shareholders generally incur two types of costs: (1) transaction costs, and (2) ongoing costs, including advisory and administrative fees; shareholder service fees; and other Fund expenses. The Example is intended to help you understand your ongoing costs (in dollars) of investing in the Fund and to compare these costs with the ongoing costs of investing in other mutual funds. The Example is based on an investment of $1,000 invested at the beginning of the year and held for the entire year.
Actual Expenses
The information in the table under the heading "Actual Performance" provides information about actual account values and actual expenses. You may use the information in this column, together with the amount you invested, to estimate the expenses that you paid over the period. Simply divide your account value by $1,000 (for example, an $8,600 account value divided by $1,000= 8.6), then multiply the result by the number in the first column in the row entitled "Expenses Paid During Period" to estimate the expenses you paid on your account during this period.
Hypothetical Example for Comparison Purposes
The information in the table under the heading "Hypothetical Performance (5% return before expenses)" provides information about hypothetical account values and hypothetical expenses based on the Fund's actual expense ratio and an assumed rate of return of 5% per year before expenses, which is not the Fund's actual return. The hypothetical account values and expenses may not be used to estimate the actual ending account balance or expenses you paid for the period. You may use this information to compare the ongoing costs of investing in the Fund
and other funds. To do so, compare this 5% hypothetical example with the 5% hypothetical examples that appear in the shareholder reports of other funds.
Please note that the expenses shown in the table are meant to highlight your ongoing costs only and do not reflect any transactional costs. Therefore, the information under the heading "Hypothetical Performance (5% return before expenses)" is useful in comparing ongoing costs only, and will not help you determine the relative total costs of owning different funds. In addition, if these transactional costs were included, your costs would have been higher. Even though the Fund does not charge transaction fees, if you purchase shares through a broker, the broker may charge you a fee. You should evaluate other mutual funds' transaction fees and any applicable broker fees to assess the total cost of ownership for comparison purposes.
| | | Actual
Performance | | Hypothetical
Performance
(5% return
before
expenses) | |
Beginning Account Value
March 31, 2016 | | $ | 1,000.00 | | | $ | 1,000.00 | | |
Ending Account Value
September 30, 2016 | | $ | 1,015.60 | | | $ | 1,022.41 | | |
Expenses Paid During
Period* | | $ | 2.61 | | | $ | 2.62 | | |
* Expenses are equal to the Fund's annualized expense ratio of 0.52%, multiplied by the average account value over the period and prorated for the six-months ended September 30, 2016 (183/366 days).
55
FPA NEW INCOME, INC.
DIRECTOR AND OFFICER INFORMATION
(Unaudited)
Name and
Year of Birth | | Position(s)
With Fund
Years Served | | Principal Occupation(s)
During the Past 5 Years | | Portfolios in
Fund Complex
Overseen | | Other
Directorships | |
Allan M. Rudnick – 1940† | | Director and Chairman*
Years Served: 4 | | Private Investor. Formerly, Co-Founder, Chief Executive Officer, Chairman and Chief Investment Officer of Kayne Anderson Rudnick Investment Management from 1989 to 2007. | | | 7 | | | | |
Sandra Brown – 1955† | | Director*
Years Served: <1 | | Consultant. Formerly Chair of the Board, CEO and President of Transmerica Financial Advisers, Inc., and Chair of the Board and President of Transamerica Securities Sales Corp. from 1999 to 2009. | | | 7 | | | | |
Mark L. Lipson – 1949† | | Director*
Years Served: 1 | | Consultant. ML2Advisors, LLC. Former member of the Management Committee and Western Region Head at Bessemer Trust Company from 2007 to 2014. | | | 7 | | | | |
Alfred E. Osborne, Jr. – 1944† | | Director*
Years Served: 17 | | Senior Associate Dean of the John E. Anderson School of Management at UCLA. | | | 7 | | | Wedbush, Inc., Nuverra Environmental Solutions, Inc., and Kaiser Aluminun, Inc. | |
A. Robert Pisano – 1943† | | Director*
Years Served: 4 | | Consultant. Formerly President and Chief Operating Officer of the Motion Picture Association of America, Inc. from 2005 to 2011. | | | 7 | | | Entertainment Partners, Resources Global Professionals | |
Patrick B. Purcell – 1943† | | Director*
Years Served: 10 | | Retired. Formerly Executive Vice President, Chief Financial and Administrative Officer of Paramount Pictures from 1983 to 1998. | | | 7 | | | | |
Robert L. Rodriguez – 1948 | | Director*
Years Served: 32 | | Partner of the Adviser. | | | 2 | | | | |
J. Richard Atwood – 1960 | | Director* and President
Years Served: 19 | | Managing Partner of the Adviser. | | | 7 | | | | |
Thomas H. Atteberry – 1953 | | Portfolio Manager Years Served: 11 | | Partner of the Adviser. | | | | | |
Abhijeet Patwardhan – 1979 | | Portfolio Manager Years Served: 1 | | Managing Director (since 2015) and a Director of Research (since 2015) of the Adviser. Formerly Senior Vice President (2014 to 2015) and Vice President (2010 to 2013) of the Adviser. | | | | | |
56
FPA NEW INCOME, INC.
DIRECTOR AND OFFICER INFORMATION
(Unaudited) Continued
Name and
Year of Birth | | Position(s)
With Fund
Years Served | | Principal Occupation(s)
During the Past 5 Years | | Portfolios in
Fund Complex
Overseen | | Other
Directorships | |
Leora R. Weiner – 1970 | | Chief Compliance Officer
Years Served: 2 | | Managing Director and General Counsel of the Adviser since 2014. Formerly Managing Director, General Counsel and Chief Compliance Officer of Tradewinds Global Investors, LLC from 2008 to 2014. | | | | | |
E. Lake Setzler – 1967 | | Treasurer
Years Served: 10 | | Senior Vice President and Controller of the Adviser. | | | | | |
Francine S. Hayes – 1967 | | Secretary
Years Served: 1 | | Vice President and Senior Counsel of State Street Bank and Trust Company | | | | | |
* Directors serve until their resignation, removal or retirement.
† Audit Committee member
The Statement of Additional Information includes additional information about the Directors and is available, without charge, upon request by calling (800) 982-4372.
57
FPA NEW INCOME, INC.
(Unaudited)
INVESTMENT ADVISER
First Pacific Advisors, LLC
11601 Wilshire Boulevard, Suite 1200
Los Angeles, CA 90025
TRANSFER & SHAREHOLDER
SERVICE AGENT
UMB Fund Services, Inc.
P.O. Box 2175
Milwaukee, WI 53201-2175
or
235 West Galena Street
Milwaukee, WI 53212-3948
(800) 638-3060
CUSTODIAN AND ADMINISTRATOR
State Street Bank and Trust Company
Boston, Massachusetts
TICKER: FPNIX
CUSIP: 302544101
DISTRIBUTOR
UMB Distribution Services, LLC
235 West Galena Street
Milwaukee, Wisconsin 53212-3948
LEGAL COUNSEL
Dechert LLP
San Francisco, California
INDEPENDENT REGISTERED PUBLIC ACCOUNTING FIRM
Deloitte & Touche LLP
Los Angeles, California
This report has been prepared for the information of shareholders of FPA NEW INCOME, INC., and is not authorized for distribution to prospective investors unless preceded or accompanied by an effective prospectus.
The Fund's complete proxy voting record for the 12 months ended June 30, 2016 is available without charge, upon request by calling (800) 982-4372 and on the SEC's website at www.sec.gov.
The Fund's schedule of portfolio holdings, filed the first and third quarter of the Fund's fiscal year on Form N-Q with the SEC, is available on the SEC's website at www.sec.gov. Form N-Q is available at the SEC's Public Reference Room in Washington, D.C., and information on the operations of the Public Reference Room may be obtained by calling (202) 551-8090. To obtain Form N-Q from the Fund, shareholders can call (800) 982-4372.
Additional information about the Fund is available online at www.fpafunds.com. This information includes, among other things, holdings, top sectors, and performance, and is updated on or about the 15th business day after the end of each quarter.
Item 2. Code of Ethics.
(a) The registrant has adopted a code of ethics that applies to the registrant’s principal executive and financial officers.
(b) Not applicable.
(c) The registrant has made no material changes to its code of ethics.
(d) During the period covered by this report, there were not any implicit or explicit waivers to the provisions of the code of ethics adopted in 2(a).
(e) Not applicable.
(f) A copy of the registrant’s code of ethics is filed as an exhibit to this Form N-CSR.
Item 3. Audit Committee Financial Expert.
The registrant’s board of directors has determined that Patrick B. Purcell, who is a member of the registrant’s audit committee and board of directors, is an “audit committee financial expert” and is “independent,” as those terms are defined in Item 3(a)(2) of Form N-CSR. This designation will not increase the designee’s duties, obligations or liability as compared to his duties, obligations or liability as a member of the audit committee and of the board of directors. This designation does not affect the duties, obligations or liability of any other member of the audit committee or the board of directors.
Item 4. Principal Accountant Fees and Services.
| | | | 2015 | | 2016 | |
(a) | | Audit Fees | | $ | 66,800 | | $ | 69,138 | |
(b) | | Audit Related Fees | | $ | -0- | | $ | -0- | |
(c) | | Tax Fees(1) | | $ | 8,800 | | $ | 9,108 | |
(d) | | All Other Fees | | $ | -0- | | $ | -0- | |
(1)Fees with respect of preparation of tax returns.
(e)(1) The audit committee shall pre-approve all audit and permissible non-audit services that the committee considers compatible with maintaining the independent auditors’ independence. The pre-approval requirement will extend to all non-audit services provided to the registrant, the adviser, and any entity controlling, controlled by, or under common control with the adviser that provides ongoing services to the registrant, if the engagement relates directly to the operations and financial reporting of the registrant; provided, however, that an engagement of the registrant’s independent auditors to perform attest services for the registrant, the adviser or its affiliates required by generally accepted auditing standards to complete the examination of the registrant’s financial statements (such as an examination conducted in accordance with Statement on Auditing Standards Number 70 issued by the American Institute of Certified Public Accountants), will be deem pre-approved if:
(i) the registrant’s independent auditors inform the audit committee of the engagement,
(ii) the registrant’s independent auditors advise the audit committee at least annually that the performance of this engagement will not impair the independent auditor’s independence with respect to the registrant, and
(iii) the audit committee receives a copy of the independent auditor’s report prepared in connection with such services.
The committee may delegate to one or more committee members the authority to review and pre-approve audit and permissible non-audit services. Actions taken under any such delegation will be reported to the full committee at its next meeting.
(e)(2) 100% of the services provided to the registrant described in paragraphs (b) — (d) of this Item were pre-approved by the audit committee pursuant to paragraph (e)(1) of this Item. There were no services provided to the investment adviser or any entity controlling, controlled by or under common control with the adviser described in paragraphs (b) — (d) of this Item that were required to be pre-approved by the audit committee.
(f) All services performed on the engagement to audit the registrant’s financial statements for the most recent fiscal year end were performed by the principal accountant’s full-time, permanent employees.
(g) None.
(h) Not applicable.
Item 5. Audit Committee of Listed Registrants.
Not applicable.
Item 6. Investments.
(a) Schedule of Investments is included as a part of the report to shareholders filed under Item 1 of this Form N-CSR.
(b) Not applicable.
Item 7. Disclosure of Proxy Voting Policies and Procedures for Closed-End Management Investment Companies.
Not applicable.
Item 8. Portfolio Managers of Closed-End Management Investment Companies.
Not applicable.
Item 9. Purchases of Equity Securities by Closed-End Management Investment Company and Affiliated Purchasers.
Not applicable.
Item 10. Submission of Matters to a Vote of Security Holders.
There have been no material changes to the procedures by which the shareholders may recommend nominees to the registrant’s board of directors.
Item 11. Controls and Procedures.
(a) The principal executive officer and principal financial officer of the registrant have concluded that the registrant’s disclosure controls and procedures (as defined in Rule 30a-3(c) under the Investment Company Act of 1940) are effective based on their evaluation of the disclosure controls and procedures as of a date within 90 days of the filing date of this report.
(b) There have been no significant changes in the registrant’s internal controls over financial reporting (as defined in Rule 30a-3(d) under the Investment Company Act of 1940) that occurred during the registrant’s second fiscal quarter of the period covered by this report that have materially affected, or is reasonably likely to materially affect, the registrant’s internal controls over financial reporting.
Item 12. Exhibits.
(a)(1) Code of ethics as applies to the registrant’s principal executive and financial officers is attached hereto.
(a)(2) The certifications required by Rule 30a-2(a) under the Investment Company Act of 1940 are attached hereto.
(a)(3) Not applicable.
(b) The certifications required by Rule 30a-2(b) under the Investment Company Act of 1940 and Section 906 of the Sarbanes-Oxley Act of 2002 are attached hereto.
SIGNATURES
Pursuant to the requirements of the Securities Exchange Act of 1934 and the Investment Company Act of 1940, the registrant has duly caused this report to be signed on its behalf by the undersigned, thereunto duly authorized.
FPA NEW INCOME, INC. | |
| |
| |
By: | /s/ J. Richard Atwood | |
| J. Richard Atwood | |
| President (principal executive officer) | |
| | |
Date: | December 5, 2016 | |
Pursuant to the requirements of the Securities Exchange Act of 1934 and the Investment Company Act of 1940, this report has been signed below by the following persons on behalf of the registrant and in the capacities and on the dates indicated.
By: | /s/ J. Richard Atwood | |
| J. Richard Atwood | |
| President (principal executive officer) | |
| | |
Date: | December 5, 2016 | |
| | |
| | |
By: | /s/ E. Lake Setzler III | |
| E. Lake Setzler III | |
| Treasurer (principal financial officer) | |
| | |
Date: | December 5, 2016 | |