UNITED STATES
SECURITIES AND EXCHANGE COMMISSION
Washington, D.C. 20549
FORM N-CSR
CERTIFIED SHAREHOLDER REPORT OF REGISTERED
MANAGEMENT INVESTMENT COMPANIES
Investment Company Act file number | 811-1735 |
|
FPA NEW INCOME, INC. |
(Exact name of registrant as specified in charter) |
|
11601 WILSHIRE BLVD., SUITE 1200, LOS ANGELES, CALIFORNIA | | 90025 |
(Address of principal executive offices) | | (Zip code) |
|
J. RICHARD ATWOOD, 11601 WILSHIRE BLVD., SUITE 1200, LOS ANGELES, CALIFORNIA 90025 |
(Name and address of agent for service) |
|
Registrant’s telephone number, including area code: | 310-473-0225 | |
|
Date of fiscal year end: | SEPTEMBER 30 | |
|
Date of reporting period: | SEPTEMBER 30, 2014 | |
| | | | | | | | | |
Item 1. Report to Stockholders.

Distributor:
UMB DISTRIBUTION SERVICES, LLC
235 West Galena Street
Milwaukee, Wisconsin 53212
FPA NEW INCOME, INC.
LETTER TO SHAREHOLDERS
Dear Fellow Shareholders:
This Annual Report covers the year ended September 30, 2014. Your Fund's net asset value (NAV) closed at $10.24. During the fiscal year, your Fund paid four income dividends totaling $0.36. There were no capital gains distributions.
The following table shows the average annual total return for several different periods ended on September 30, 2014 for the Fund and comparative indices of securities prices.
| | | Periods Ended September 30, 2014 | |
| | | 1 Year | | 5 Years | | 10 Years | | 15 Years | | 20 Years | | 7/11/1984
Inception | |
FPA New Income | | | 1.47 | % | | | 1.93 | % | | | 2.97 | % | | | 4.35 | % | | | 5.13 | % | | | 7.54 | % | |
Barclays U.S. Aggregate Bond Index | | | 3.96 | % | | | 4.12 | % | | | 4.62 | % | | | 5.57 | % | | | 6.13 | % | | | 7.88 | % | |
Consumer Price Index + 100
Basis Points | | | 2.59 | % | | | 2.96 | % | | | 3.30 | % | | | 3.37 | % | | | 3.38 | % | | | N/A | | |
The Fund continues to perform in line with our expectations. Our emphasis on high-quality, short-duration bonds led to our year-to-date return of 1.27% through September 30, 2014 versus 4.10% for the Barclays U.S. Aggregate Bond Index and 2.06% for the CPI + 100. For the second half of the fiscal year, your Fund's return was 0.68%, 2.21% for the Barclays Index and 1.34% for the CPI + 100.
Past performance is no guarantee of future results, and current performance may be higher or lower than the performance shown. This data represents past performance, and investors should understand that investment returns and principal values fluctuate, so that when you redeem your investment may be worth more or less than its original cost. Current month-end performance data can be obtained by visiting the website at www.fpafunds.com or by calling toll-free, 1-800-982-4372. Information regarding the Fund's expense ratio and redemption fees can be found on pages 44 and 48.
Portfolio Commentary
During the past quarter the Fund appreciated 0.10%, roughly in line with the Barclays U.S. Aggregate Bond Index return of 0.17%.We were pleased with our risk-adjusted performance during the quarter, as we captured about 60% of the Index's return while only taking on ~20% of the interest rate risk (as measured by duration).
Performance from a sector perspective was primarily driven by the holdings of asset backed securities1 (ABS) with the equipment segment doing very well followed by the automobile loan-backed securities. The collateralized mortgage obligation2 (CMO) holdings exhibited mixed results with the agency backed principal and interest securities producing a negative return, while the non-agency-backed securities and interest-only securities providing positive returns. The portfolio's agency mortgage pools also contributed positively to returns. The commercial mortgage backed securities3 (CMBS) returns continue to be driven by the GNMA Project Loan
1 Asset-backed securities are bonds or notes backed by assets.
2 Collateralized mortgage obligations are mortgage-backed bonds that separate mortgage pools into different maturity classes.
3 Commercial mortgage backed securities are securities backed by commercial mortgages rather than residential mortgages.
1
FPA NEW INCOME, INC.
LETTER TO SHAREHOLDERS (Continued)
Interest Only securities. The portfolio's corporate bond holdings had a more difficult time during the quarter and were a small detractor from performance.
Portfolio Activity
We continue to look at investment opportunities across multiple sectors of the bond market. In our view the bond market is still exhibiting a skewed risk/return profile, with risk being too large. The investment characteristics of bonds we find attractive remain similar to what we have pursued over the past twelve months. Specifically we have added to the shorter automobile loan backed ABS bonds, along with other types of ABS bonds. Within the single family mortgage sector of the market, bonds or pools backed by seasoned 15-year agency backed mortgage loans are our preferred area of interest. Within the CMBS portion of the market we are still able to periodically accumulate GNMA Project Loan Interest Only securities. The high yield corporate segment of the portfolio has been active during the quarter. Many of the bonds purchased a little over a year ago that were callable did in fact get called. However, with the high yield market experiencing some difficulty, we were able to re-deploy that capital into attractive callable high yield bonds and keep the same level of allocation to high yield corporate bonds as in the previous quarter. Allocation to other sectors has remained stable over the past quarter.
The profile of the portfolio did not change dramatically over the quarter as there was little movement in either domestic investment grade yields or inflation expectations. Our duration increased from 1.25 to 1.36 while our yield-to-worst4 increased from 1.85 to 2.02.
A Note About the Recent Dividend Payment
The FPA New Income's distribution was $0.05 this quarter, which was less than the $0.07-$0.08 range in prior quarters for a number of reasons:
• The amortization of the notional amount of all our interest only securities increased, and given a general reduction in our exposure to this sector, the resulting income for the quarter was reduced.
• Over the past three months, the amount of prepayment penalties received from our GNMA Project Loan Interest Only securities declined.
• Lastly, new investments in the "high quality" portion of the portfolio have been generating somewhat lower yields than those owned previously and, though yielding more than the money market investments they replaced, have not been held long enough to make a significant difference to our total income for the quarter.
Market Commentary
3 Ds: Deflation, Default, and Devaluation
Lombard Street Research, a London-based economic research organization, recently discussed their view for how a developed economy might deal with excess debt resulting from the financial crisis. They call it the 3 Ds: deflation, default, and devaluation. So how are the United States, Europe and Japan graded against the 3 Ds?
4 Yield to worst is the lowest possible yield on a callable bond. As of September 30, 2014, the SEC yield was 2.23%. This calculation begins with the Fund's dividend payments for the last 30 days, subtracts Fund expenses and uses this number to estimate your returns for a year. The SEC yield is based on the price of the Fund at the beginning of the month. The income yield stated here reflects prospective data and thus assumes payments collected by the Fund may fluctuate.
2
FPA NEW INCOME, INC.
LETTER TO SHAREHOLDERS (Continued)
United States
Inflation in the U.S. over the past six years has averaged 1.6% compared to a 2.8% average over the past 30 years. Consumer spending which is a primary driver of demand, has not pushed inflation upwards, evidenced by the Unadjusted Retail Sales Total reported by the U.S. Census Bureau which increased by 2.9% annually over the past six years versus a 3.8% annual increase over the past 30 years. Concurrently, the Federal Government ran a substantial deficit of almost 10% of nominal GDP in fiscal year 2009 declining to an estimated 2.9% in fiscal year 2014. This resulted in a deflationary underpinning to the economy.
Default and debt repayment by the consumer sector has been very pronounced over the past six years. The table below from the Federal Reserve Bank 2013 Survey of Consumer Finance illustrates this point.
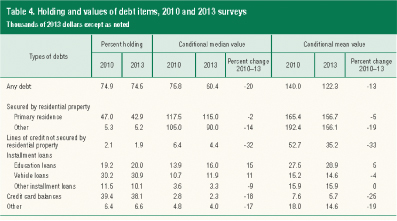
Source: Federal Reserve Bank
The amount of debt held by households measured either by median or mean declined from 2010 to 2013. The same is true for secured debt, whether primary residence or other. The median level of student loan debt increased, as did loans against a vehicle. Both of these data points are not a surprise. Of note is the percentage of households surveyed that reported primary resident debt decline due to the decline in the percentage of households that own a home.
3
FPA NEW INCOME, INC.
LETTER TO SHAREHOLDERS (Continued)
The following chart from the same survey shows the change in the household balance sheet and income statement as it relates to leverage and ability to service the debt outstanding.
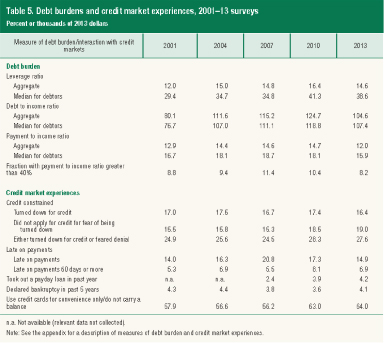
Source: Federal Reserve Bank
The amount of leverage on the household balance sheet declined slightly over the past three years, as illustrated by the leverage ratio declining from 41.3% in 2010 to 38.6% in 2013. However, it is still elevated when compared to the survey periods 2001, 2004, and 2007. The payment-to-income ratio has declined as well due to the Fed Zero Interest Rate Policy (ZIRP) and Quantitative Easing (QE) and is at the lowest level for any of the survey periods. The number of households reporting late payments has declined with the overall group declining close to the level experienced in the 2001 survey, and the 60-day or more late payment group declining back to the 2004 level. Finally, the percent of households that do not carry a balance on their credit card is at the highest level of any period reported. This data indicates a stronger financial position for the household portion of the economy. This reduction of debt and improvement in the balance sheet and income statement of U.S.
4
FPA NEW INCOME, INC.
LETTER TO SHAREHOLDERS (Continued)
households is a solid contributing factor to the slower retail sales growth and inflation outlined under the first "D" deflation.
As for devaluation, if we look at the U.S. Dollar Spot Index5 going back six years, the index averaged 80.3, which represents its value at the beginning and the end of the time period from 10/1/08-6/30/14. During that time period the value has ranged within +/-10% of the average. Beginning in the third quarter 2014, the index has appreciated by approximately 7%.
Overall the U.S. economy has done fairly well with the 3 "D's" and as a result its prospects for growth going forward have improved. This is one of the factors that leads us to believe that the shape of the Treasury yield curve may likely change from its current very steep shape (short rates significantly lower than long term rates) to a flatter configuration (short rates much closer to the level of longer term interest rates).
Europe and Japan
What about Europe and Japan? We can summarize their situation as follows. Deflation has been a long-term problem in Japan. In Europe deflation has been more acute with the region's CPI declining from about 3% a few years ago to the latest measurement of 0.3%. Both regions continue to be highly levered as measured by government debt to GDP with Japan at approximately 226% and the levels in Europe for the countries such as Greece, Spain, and Italy being higher today than when the Greek debt crisis occurred several years ago. As for currency devaluation, in both Japan and Europe changes have occurred in a fairly dramatic fashion. In Japan the yen has declined by about 40% since the announcement of the huge quantitative easing program, which achieved the stated objective of currency devaluation. Europe too has just recently experienced currency devaluation, as the region's economy has lurched closer to another recession.
So how may this impact the U.S. bond market and how we deploy capital? The table below shows the difference in yield for a Japanese government bond, a German government bond, and a U.S. Treasury as of 9/30/2014.
Country | | 5-Year Maturity | | 10-Year Maturity | |
United States | | | 1.76 | % | | | 2.49 | % | |
France | | | 0.33 | % | | | 1.28 | % | |
Germany | | | 0.15 | % | | | 0.95 | % | |
Japan | | | 0.17 | % | | | 0.53 | % | |
Source: Bloomberg
There is a significant incentive for an investor in those countries to take capital and buy a U.S. Treasury for additional yield (assuming U.S. inflation remains muted). This capital may also find our stock and credit markets more attractive given the U.S.'s better growth prospects. A strengthening dollar combined with the prospects of households having more disposable income could cause the U.S. economy to be stronger in 2015 than 2014. The result is that risk assets may continue to be highly valued and that some of the flattening of the yield curve we expect could come from longer maturity Treasury yields either declining or, if the Fed starts raising rates, increasing at a slower rate than previous periods of the Fed raising rates.
5 A measure of the value of the U.S. dollar relative to the majority of its most significant trading partners.
5
FPA NEW INCOME, INC.
LETTER TO SHAREHOLDERS (Continued)
A Lesson Learned
Investing is not always about celebrating success. Though we try very hard to avoid it, sometimes mistakes happen. We strive to give our investors as much transparency as possible about our process, both good and bad. In that vein, we have never been shy about acknowledging our errors and we will do so again here. Discussing mistakes is an exercise in introspection that helps us (and our clients) become better investors. The following is a topic we had previously discussed during our Q3 2013 webcast.
In the fourth quarter of 2012, the yield curve looked much different than it looks today. The chart below compares the yield curve as of September 30, 2012 to the yield curve as of September 30, 2014.
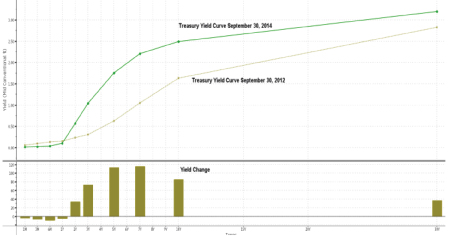
Source: Bloomberg
At the beginning of Q3 2012, the 10-year Treasury yield was 1.63%, off of a recent multi-year low of 1.39%. In the midst of the Federal Reserve's quantitative easing program, before the word "taper" had ever been muttered, we were concerned about a sustained period of extremely low rates (a so called "Japan Scenario") and the implications that such a rate environment could have on our portfolio.
A significant portion of our portfolio was comprised of agency mortgage bonds that were priced at a premium. When interest rates are low, borrowers have an incentive to refinance debt at a lower interest rate. Prepayments of principal (whether via refinancing or housing turnover) are punitive for premium bonds because they result in a loss of the premium.
To address the risk of low rates reducing the return on our premium holdings via brisk refinancing activity, we searched for investments that might provide some upside to the portfolio in a protracted low interest rate environment. Working within the constraints of our investment guidelines, our search led us to an investment in CMO support bonds that were priced at a discount to par. Our thesis was that low rates would lead to greater
6
FPA NEW INCOME, INC.
LETTER TO SHAREHOLDERS (Continued)
refinancing activity, which, for a discount bond, is a good outcome because we would capture the discount quickly, and thereby enhance the return.
Two elements were necessary to make this investment work. First, buying a discount priced bond necessitated buying a support bond. Support bonds are riskier because principal payments could be redirected to other bonds (and away from our investment) in the event that prepayment activity is slow which extends the bond's average life.
To mitigate the risk of slow prepayment activity, the other necessary element was collateral that is conducive to fast prepayment speeds. We specified high credit quality jumbo borrowers with low indebtedness. The premise in specifying this particular collateral was that these borrowers have multiple options available to them in terms of creating potential prepayment events for our bonds. Also, residing in California, these borrowers also tend to exhibit greater housing turnover that leads to a prepayment event. As such, even in a rising interest rate environment, we would have expected these borrowers to prepay faster than a typical borrower.
Our error came in how we specified this collateral. We had specified average criteria — average FICO6, average loan-to-value, etc. When the collateral arrived, although the averages met our specifications, the distribution around the averages was not consistent with the borrower profile we were targeting. (Going forward we will specify our distribution preference in addition to our average criteria.) For example, we requested a specific average debt-to-income ratio. The average debt-to-income ratio for the loans that we received was consistent with the average but the pool of loans was comprised of a broad distribution of high debt-to-income ratio loans and low debt-to-income ratio loans rather than a tight cluster of loans around the average. As a result, while on average, our borrowers should have been able to easily refinance their loans, that average borrower did not actually exist in our loan pool. In reality, we had a large number of borrowers whose debt-to-income ratio was high enough that they had limited financing options.
Due to this skewed loan distribution, when interest rates rose during 2013, our borrowers no longer had an incentive to refinance their loans because they could not refinance at a lower rate. This lack of refinancing incentive was expected. However, the other elements that we thought would mitigate slowing prepayment speeds (i.e., the high quality borrower) did not exist as we had expected. Consequently, these bonds exhibited extremely slow prepayment speeds. Due to the aforementioned structural features of the bonds that redirected principal payments away from the bonds when prepayment speeds slowed, these bonds experienced a significant extension in weighted average life. The increase in weighted average life led to a significant decline in price.
Seeing no prospect for prepayment speeds on these bonds to increase meaningfully and persistently, and a poor risk/reward profile even after they declined in price, we sold these bonds during the third quarter. The good news is that, consistent with our risk management process, we purposely limited the portfolio's exposure to this investment. Our total exposure to these bonds represented approximately at 2% at time of purchase and 1.5% of the portfolio as of June 30, 2014. We sold these bonds at an average holding period loss of approximately 7.6% versus the price at which we owned the bonds as of June 30, 2014 and an average holding period loss of approximately 12% since the time of the investment in December 2012. Due to the small position size, the investment had an approximate 11 basis point negative impact on the Fund's return in Q3 2014.
This investment reinforced important investment practices we know well including: mind the details and weigh upside versus downside. This investment also reinforced the value of our disciplined risk management
6 A type of credit score that makes up a substantial portion of the credit report that lenders use to assess an applicant's credit risk and whether to extend a loan. FICO is an acronym for the Fair Isaac Corporation, the creators of the FICO score.
7
FPA NEW INCOME, INC.
LETTER TO SHAREHOLDERS (Continued)
process. Despite the best analysis, mistakes can happen. These mistakes have been rare for us and we have been able to rely on our disciplined approach to risk management to minimize the negative impact to performance.
You Ain't Seen Nothin' Yet
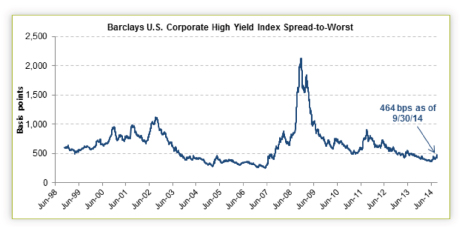
In our 2Q 2014 commentary, we speculated that excess liquidity in the financial markets had lulled credit investors into an imprudent state of complacency. That reversed itself recently as volatility returned to the high yield market during this recent quarter. The Barclays U.S. Corporate High Yield Index lost 1.9% during the quarter, the first quarterly loss since the "taper tantrum-inspired" downturn in the 3Q 2013. Spread-to-worst7 for the index widened over 90 basis points to 464 bps, and yield-to-worst widened to 6.1% from 4.9% at the end of 2Q 2014. The main drivers for poor performance were outflows from the asset class, coupled with a continued robust new issue calendar and the inability of investment banks to absorb inventory in a time of market stress.
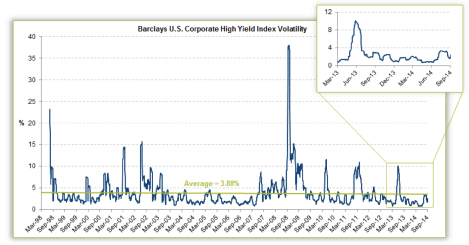
Source: Barclays
7 Spread-to-Worst: the difference in overall returns between two different classes of securities, or returns from the same class, but different representative securities.
8
FPA NEW INCOME, INC.
LETTER TO SHAREHOLDERS (Continued)
Source: Barclays
Redemptions for open-end high yield mutual funds8 were $22.7 billion (7% of average assets under management during the quarter), the heaviest outflow for any quarter recorded by Morningstar. Concurrent with these heavy redemptions, the new issue calendar in the high yield market was extensive in September 2014, with $44 billion of new deals priced.
Further, bank capital market trading departments have decreased their inventory of corporate bonds quite significantly since the financial crisis, which has hampered their ability to act as shock absorbers for the market when outflows occur. Since late 2011, primary dealer inventory of corporate and non-agency mortgage bonds9 has consistently been below 1% of the total market outstanding10. Inventory as a percentage of the overall market has decreased significantly from prior years, when it ranged between 1-3% of the market. Given changes to regulatory capital requirements and other regulations, we do not expect inventory levels to be restored to former levels.
8 High yield mutual funds invest primarily in high paying bonds with a lower credit rating than investment-grade corporate bonds, Treasury bonds and municipal bonds.
9 Federal Reserve Bank of New York primary dealer inventory data
10 Total market outstanding data according to SIFMA
9
FPA NEW INCOME, INC.
LETTER TO SHAREHOLDERS (Continued)
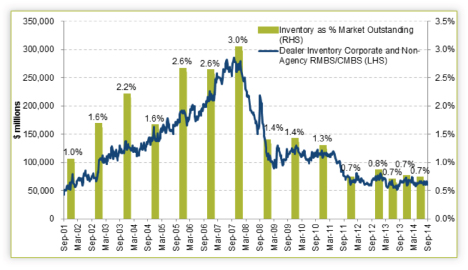
Source: Federal Reserve Bank of New York primary dealer inventory, total market outstanding data according to SIFMA
Despite the recent increase in spreads and volatility, we remain cautious in our outlook for the high yield and leveraged loan markets. A massive amount of capital has been deployed in this area over the last few years as the Fed's unusually accommodative monetary policy has driven investors further out on the risk spectrum. As we approach the curtailment of central bank securities purchases and a potential increase in short-term interest rates, it is possible that the proportion of assets allocated to riskier credit investments could normalize.
The FPA New Income corporate credit portfolio has been small (10% of assets) and structured with an extremely short duration relative to the market for some time now, as potential returns in the high yield market have been insufficient to compensate investors adequately for the interest rate and credit risk inherent in the asset class. This posture helped to insulate us from most of the pain suffered in the high yield market this past quarter, although the corporate portfolio did suffer a very modest loss during the period. We intend to remain defensive in our positioning until valuation improves. Even after the recent sell-off, high yield valuations still appear rich. We believe our shorter duration corporate portfolio is likely to generate returns slightly below the overall high yield market11 over the next three years if the market remains in an abnormal environment, with tighter than average high yield spreads and low interest rates, while shielding investors from the negative impact of rising interest rates should credit markets normalize.
11 Using the Barclays U.S. Corporate High Yield Index as a proxy.
10
FPA NEW INCOME, INC.
LETTER TO SHAREHOLDERS (Continued)
Conclusion
We continue to construct the portfolio in a matter that allows us to deploy capital in a marketplace that may be starting to take on characteristics that are different from the past 6 years. We think having a nimble and flexible portfolio as well as limiting areas of risk until valuations become more attractive is paramount if we are to achieve our goals. We diligently investigate all areas of the bond market looking for opportunities that have the potential to achieve a positive total return in a twelve-month period and, over the long-term, achieve a return that is in excess of CPI plus 100 basis points.
We thank you for your continued confidence and support.
Respectfully submitted,

Thomas H. Atteberry
Chief Executive Officer and Portfolio Manager
October 23, 2014
The discussion of Fund investments represents the views of the Fund's managers at the time of this report and is subject to change without notice. References to individual securities are for informational purposes only and should not be construed as recommendations to purchase or sell individual securities.
11
FPA NEW INCOME, INC.
LETTER TO SHAREHOLDERS (Continued)
FORWARD LOOKING STATEMENT DISCLOSURE
As mutual fund managers, one of our responsibilities is to communicate with shareholders in an open and direct manner. Insofar as some of our opinions and comments in our letters to shareholders are based on current management expectations, they are considered "forward-looking statements" which may or may not be accurate over the long term. While we believe we have a reasonable basis for our comments and we have confidence in our opinions, actual results may differ materially from those we anticipate. You can identify forward-looking statements by words such as "believe," "expect," "may," "anticipate," and other similar expressions when discussing prospects for particular portfolio holdings and/or the markets, generally. We cannot, however, assure future results and disclaim any obligation to update or alter any forward-looking statements, whether as a result of new information, future events, or otherwise. Further, information provided in this report should not be construed as a recommendation to purchase or sell any particular security.
12
FPA NEW INCOME, INC.
HISTORICAL PERFORMANCE
(Unaudited)
Change in Value of a $10,000 Investment in FPA New Income, Inc. vs. Barclays U.S. Aggregate Index and Consumer Price Index + 100 Basis Points from October 1, 2004 to September 30, 2014
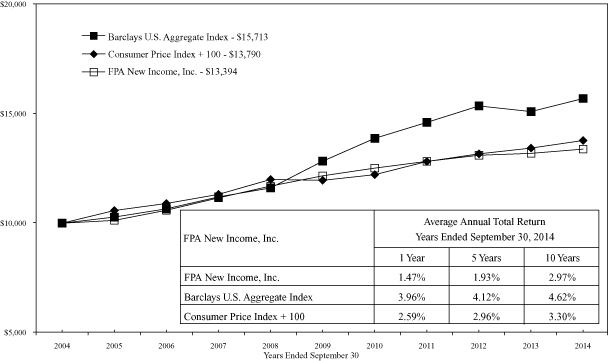
Past performance is not indicative of future performance. The Barclays U.S. Aggregate Bond Index is a broad-based unmanaged composite of four major subindexes: U.S. Government Index; U.S. Credit Index; U.S. Mortgage-Backed Securities Index; and U.S. Asset-Backed Securities Index. The index holds investment-quality bonds. The Consumer Price Index is an unmanaged index representing the rate of inflation of U.S. consumer prices as determined by the US Department of Labor Statistics. The performance of the Fund and of the Averages is computed on a total return basis which includes reinvestment of all distributions.
Past performance is no guarantee of future results, and current performance may be higher or lower than the performance shown. This data represents past performance, and investors should understand that investment returns and principal values fluctuate, so that when you redeem your investment it may be worth more or less than its original cost. Current month-end performance data can be obtained by visiting the website at www.fpafunds.com or by calling toll-free, 1-800-982-4372. Information regarding the Fund's expense ratio and redemption fees can be found on pages 44 and 48.
The Prospectus details the Fund's objective and policies, charges, and other matters of interest to prospective investors. Please read the prospectus carefully before investing. The Prospectus may be obtained by visiting the website at www.fpafunds.com, by email at crm@fpafunds.com, toll-free by calling 1-800-982-4372 or by contacting the Fund in writing.
13
FPA NEW INCOME, INC.
PORTFOLIO SUMMARY
September 30, 2014 (Unaudited)
Bonds & Debentures | | | | | 97.7 | % | |
Commercial Mortgage-Backed | |
Agency Stripped | | | 7.7 | % | | | | | |
Non-Agency | | | 5.5 | % | | | | | |
Agency | | | 1.8 | % | | | | | |
Residential Mortgage-Backed | |
Agency Pool Fixed Rate | | | 6.3 | % | | | | | |
Agency Collateralized Mortgage
Obligation | | | 16.7 | % | | | | | |
Non-Agency Collateralized
Mortgage Obligation | | | 6.9 | % | | | | | |
Agency Stripped | | | 1.7 | % | | | | | |
Agency Pool Adjustable Rate | | | 0.0 | % | | | | | |
Asset-Backed | |
Auto | | | 27.1 | % | | | | | |
Other | | | 8.7 | % | | | | | |
U.S. Treasuries | | | 5.1 | % | | | | | |
Corporate | | | 7.8 | % | | | | | |
Corporate Bank Debt | | | 2.4 | % | | | | | |
Short-Term Investments | | | | | 3.5 | % | |
Other Assets and Liabilities, net | | | | | (1.2 | )% | |
Net Assets | | | | | 100.0 | % | |
MAJOR PORTFOLIO CHANGES
For the Six Months Ended September 30, 2014
(Unaudited)
NET PURCHASES | |
| | Coupon
Rate (%) | | Maturity
Date | | Principal
Amount | |
STRU RB-5918 AD (1) | | | 2.5000 | | | 10/15/2024 | | $ | 130,745,525 | | |
U.S Treasury Note (1) | | | 0.0089 | | | 4/30/2016 | | $ | 100,000,000 | | |
Reynolds Group Issuer LLC (1) | | | 7.8750 | | | 8/15/2019 | | $ | 71,081,000 | | |
U.S Treasury Note (1) | | | 2.3750 | | | 2/28/2015 | | $ | 65,000,000 | | |
Nissan Auto Lease Trust 2013-A A3 | | | 0.6100 | | | 4/15/2016 | | $ | 64,363,000 | | |
AmeriCredit Automobile Receivables Trust 2012-4 A3 (1) | | | 0.6700 | | | 6/8/2017 | | $ | 57,082,481 | | |
Sunset Mortgage Loan Company 2014-NPL-1 A (1) | | | 3.2282 | | | 8/16/2044 | | $ | 54,945,555 | | |
Everest ACQ LLC / Finance | | | 6.8750 | | | 5/1/2019 | | $ | 56,439,000 | | |
Santander Drive Auto Receivables Trust 2013-2 A3 (1) | | | 0.7000 | | | 9/15/2017 | | $ | 54,591,885 | | |
Ford Credit Auto Trust 2013-A A3 (1) | | | 0.5500 | | | 7/15/2017 | | $ | 52,352,795 | | |
14
FPA NEW INCOME, INC.
MAJOR PORTFOLIO CHANGES (Continued)
For the Six Months Ended September 30, 2014
(Unaudited)
NET SALES | |
| | Coupon
Rate (%) | | Maturity
Date | | Principal
Amount | |
JP Morgan Mortgage Trust 2013-1 CL 2A2 (2) | | | 2.5000 | | | 3/1/2043 | | $ | 37,837,917 | | |
U.S Treasury Note (2) | | | 0.1250 | | | 7/31/2014 | | $ | 38,000,000 | | |
Sequoia Mortgage Trust 2013-2 A1 (2) | | | 1.8740 | | | 2/17/2043 | | $ | 43,618,780 | | |
Federal National Mortgage Association 2013-6 CL TA (2) | | | 1.5000 | | | 1/25/2043 | | $ | 46,851,435 | | |
Nielsen Finance LLC Co. (2) | | | 7.7500 | | | 10/15/2018 | | $ | 51,409,000 | | |
CARDS II TR 2012-4A A (2) | | | 0.6050 | | | 9/15/2017 | | $ | 75,000,000 | | |
U.S Treasury Note (2) | | | 1.0000 | | | 5/15/2014 | | $ | 110,000,000 | | |
U.S Treasury Note (2) | | | 2.6250 | | | 7/31/2014 | | $ | 168,000,000 | | |
U.S Treasury Note (2) | | | 2.6250 | | | 6/30/2014 | | $ | 193,000,000 | | |
U.S Treasury Note (2) | | | 2.3750 | | | 8/31/2014 | | $ | 193,000,000 | | |
(1) Indicates new commitment to portfolio
(2) Indicates elimination from portfolio
15
FPA NEW INCOME, INC.
PORTFOLIO OF INVESTMENTS
September 30, 2014
BONDS & DEBENTURES | | Coupon
Rate (%) | | Maturity
Date | | Principal
Amount | | Fair
Value | |
COMMERCIAL MORTGAGE-BACKED SECURITIES
AGENCY STRIPPED — 7.7% | | | |
Government National Mortgage Association | |
2004-10 | | | 0.0000 | | | 1/16/44 | | $ | 17,966,525 | | | $ | 180 | | |
2002-56 | | | 0.0425 | | | 6/16/42 | | | 214,637 | | | | 337 | | |
2010-18 | | | 0.1160 | | | 1/16/50 | | | 56,373,857 | | | | 1,304,491 | | |
2011-10 | | | 0.1213 | | | 12/16/45 | | | 69,494,571 | | | | 1,783,926 | | |
2009-119 | | | 0.1370 | | | 12/16/49 | | | 90,702,539 | | | | 1,973,687 | | |
2010-63 | | | 0.1740 | | | 5/16/50 | | | 42,521,588 | | | | 885,299 | | |
2011-6 | | | 0.2839 | | | 10/16/52 | | | 165,979,760 | | | | 4,189,329 | | |
2008-24 | | | 0.2934 | | | 11/16/47 | | | 10,067,949 | | | | 205,386 | | |
2008-8 | | | 0.3194 | | | 11/16/47 | | | 28,209,326 | | | | 621,734 | | |
2009-71 | | | 0.3234 | | | 7/16/49 | | | 49,380,651 | | | | 1,151,557 | | |
2008-45 | | | 0.3443 | | | 2/16/48 | | | 18,829,142 | | | | 394,282 | | |
2007-77 | | | 0.3738 | | | 11/16/47 | | | 49,719,556 | | | | 1,593,512 | | |
2009-86 | | | 0.3792 | | | 9/16/49 | | | 61,704,146 | | | | 1,472,261 | | |
| 2010-148 IX | | | 0.4079 | | | 10/16/52 | | | 54,420,656 | | | | 1,922,682 | | |
2009-49 | | | 0.4213 | | | 6/16/49 | | | 28,488,666 | | | | 842,980 | | |
2005-9 | | | 0.4466 | | | 1/16/45 | | | 5,393,686 | | | | 115,910 | | |
2010-49 | | | 0.4630 | | | 2/16/50 | | | 75,094,160 | | | | 1,837,554 | | |
2009-105 | | | 0.4949 | | | 11/16/49 | | | 35,877,629 | | | | 1,326,755 | | |
| 2011-64 IX | | | 0.5127 | | | 10/16/44 | | | 59,661,321 | | | | 2,817,208 | | |
2009-60 | | | 0.5220 | | | 7/16/49 | | | 57,636,318 | | | | 1,568,861 | | |
2013-72 | | | 0.5269 | | | 11/16/47 | | | 535,741,397 | | | | 30,800,844 | | |
2004-43 | | | 0.5449 | | | 6/16/44 | | | 39,707,119 | | | | 953,368 | | |
2004-108 | | | 0.5623 | | | 12/16/44 | | | 14,548,230 | | | | 346,102 | | |
2011-16 | | | 0.6120 | | | 9/16/46 | | | 95,344,648 | | | | 3,916,758 | | |
2008-48 | | | 0.6153 | | | 4/16/48 | | | 13,874,530 | | | | 542,078 | | |
2013-35 | | | 0.6556 | | | 1/16/53 | | | 358,441,159 | | | | 21,293,054 | | |
| 2010-161 IA | | | 0.6664 | | | 12/16/50 | | | 237,608,862 | | | | 7,567,842 | | |
2008-92 | | | 0.6696 | | | 10/16/48 | | | 41,988,960 | | | | 1,797,547 | | |
2006-55 | | | 0.6812 | | | 8/16/46 | | | 22,286,161 | | | | 846,428 | | |
2010-28 | | | 0.7208 | | | 3/16/50 | | | 82,702,994 | | | | 2,651,458 | | |
2013-7 | | | 0.7464 | | | 5/16/53 | | | 366,535,056 | | | | 24,975,112 | | |
2008-78 | | | 0.7552 | | | 7/16/48 | | | 11,767,212 | | | | 585,772 | | |
2009-4 | | | 0.7717 | | | 1/16/49 | | | 34,470,084 | | | | 1,437,747 | | |
2010-123 | | | 0.8014 | | | 9/16/50 | | | 60,108,120 | | | | 2,635,140 | | |
2014-120 | | | 0.8170 | | | 4/16/56 | | | 74,894,848 | | | | 4,980,470 | | |
2013-29 | | | 0.8307 | | | 5/16/53 | | | 125,798,609 | | | | 8,435,388 | | |
2012-35 | | | 0.8596 | | | 11/16/52 | | | 129,059,948 | | | | 7,509,714 | | |
2009-30 | | | 0.8690 | | | 3/16/49 | | | 12,639,014 | | | | 555,106 | | |
16
FPA NEW INCOME, INC.
PORTFOLIO OF INVESTMENTS (Continued)
September 30, 2014
BONDS & DEBENTURES — Continued | | Coupon
Rate (%) | | Maturity
Date | | Principal
Amount | | Fair
Value | |
2006-30 | | | 0.8932 | | | 5/16/46 | | $ | 4,892,297 | | | $ | 323,625 | | |
2013-1 | | | 0.9123 | | | 2/16/54 | | | 138,475,091 | | | | 10,938,258 | | |
2014-88 | | | 0.9199 | | | 3/16/55 | | | 228,497,887 | | | | 16,224,195 | | |
2013-80 | | | 0.9207 | | | 3/16/52 | | | 64,228,946 | | | | 5,170,469 | | |
2012-9 | | | 0.9208 | | | 11/16/52 | | | 167,594,803 | | | | 15,229,340 | | |
2012-131 | | | 0.9241 | | | 2/16/53 | | | 111,066,522 | | | | 8,650,616 | | |
2011-49 | | | 0.9243 | | | 4/16/45 | | | 69,829,176 | | | | 3,239,375 | | |
2014-138 | | | 0.9322 | | | 4/16/56 | | | 38,650,000 | | | | 2,987,003 | | |
2013-125 | | | 0.9456 | | | 10/16/54 | | | 26,751,292 | | | | 1,523,689 | | |
2013-13 | | | 0.9461 | | | 7/16/47 | | | 106,522,934 | | | | 7,117,138 | | |
2012-150 | | | 0.9609 | | | 11/16/52 | | | 97,183,383 | | | | 7,337,170 | | |
| 2011-78 IX | | | 0.9628 | | | 8/16/46 | | | 118,816,595 | | | | 6,315,102 | | |
2012-45 | | | 0.9638 | | | 4/16/53 | | | 33,859,887 | | | | 2,398,401 | | |
2012-95 | | | 0.9804 | | | 2/16/53 | | | 149,355,440 | | | | 11,644,542 | | |
2013-30 | | | 0.9818 | | | 9/16/53 | | | 229,532,029 | | | | 16,612,472 | | |
2011-165 | | | 0.9822 | | | 10/16/51 | | | 230,361,748 | | | | 11,522,695 | | |
2014-135 | | | 0.9859 | | | 1/16/56 | | | 290,505,000 | | | | 22,381,522 | | |
2014-110 | | | 1.0090 | | | 1/16/57 | | | 57,912,558 | | | | 5,157,519 | | |
2012-58 | | | 1.0109 | | | 1/16/55 | | | 229,956,902 | | | | 17,101,895 | | |
2012-79 | | | 1.0179 | | | 3/16/53 | | | 143,350,201 | | | | 10,169,263 | | |
2012-25 | | | 1.0428 | | | 8/16/52 | | | 115,363,945 | | | | 7,437,202 | | |
2013-61 | | | 1.0460 | | | 5/16/53 | | | 157,047,463 | | | | 11,635,772 | | |
2012-85 | | | 1.0481 | | | 9/16/52 | | | 120,044,095 | | | | 9,071,792 | | |
2011-143 | | | 1.0554 | | | 4/16/53 | | | 92,458,464 | | | | 11,571,177 | | |
2013-45 | | | 1.0643 | | | 12/26/53 | | | 124,167,636 | | | | 7,918,679 | | |
2011-120 | | | 1.0801 | | | 12/16/43 | | | 112,275,323 | | | | 11,458,819 | | |
2011-164 | | | 1.1193 | | | 4/16/46 | | | 159,916,569 | | | | 9,574,205 | | |
| 2011-92 IX | | | 1.1245 | | | 11/16/44 | | | 31,461,155 | | | | 2,002,503 | | |
2011-149 | | | 1.1642 | | | 10/16/46 | | | 76,055,800 | | | | 5,706,467 | | |
2012-4 | | | 1.1691 | | | 5/16/52 | | | 226,338,862 | | | | 13,008,464 | | |
2014-28 | | | 1.1969 | | | 10/16/54 | | | 113,259,408 | | | | 10,080,438 | | |
2014-49 | | | 1.3588 | | | 8/16/54 | | | 173,689,056 | | | | 16,417,176 | | |
TOTAL AGENCY STRIPPED | | | | $ | 445,764,842 | | |
NON-AGENCY — 5.5% | | | |
A10 Securitization 2013-2 A† | | | 2.6000 | | | 11/15/27 | | $ | 11,574,950 | | | $ | 11,584,211 | | |
Citigroup Commercial Mortgage Trust | |
| 2007-FL3A B† | | | 0.3236 | | | 4/15/22 | | | 440,933 | | | | 439,402 | | |
| 2007-FL3A C† | | | 0.3636 | | | 4/15/22 | | | 546,612 | | | | 543,787 | | |
| 2007-FL3A D† | | | 0.4036 | | | 4/15/22 | | | 361,447 | | | | 359,577 | | |
| 2007-FL3A E† | | | 0.4536 | | | 4/15/22 | | | 413,082 | | | | 409,873 | | |
17
FPA NEW INCOME, INC.
PORTFOLIO OF INVESTMENTS (Continued)
September 30, 2014
BONDS & DEBENTURES — Continued | | Coupon
Rate (%) | | Maturity
Date | | Principal
Amount | | Fair
Value | |
COMM Mortgage Trust 2013-RIA4 A2† | | | 6.0000 | | | 11/27/28 | | $ | 12,099,500 | | | $ | 11,753,254 | | |
Credit Suisse Mortgage Trust | |
| 2007-TF2A A3† | | | 0.4236 | | | 4/15/22 | | | 33,454,106 | | | | 33,324,763 | | |
| 2007-TF2A B† | | | 0.5036 | | | 4/15/22 | | | 401,000 | | | | 394,269 | | |
Del Coronado Trust 2013-HDMZ CL M† | | | 5.1550 | | | 3/15/18 | | | 9,299,000 | | | | 9,325,047 | | |
Lehman Brothers Floating Rate
Commercial 2007-LLFA F† | | | 1.1536 | | | 6/15/22 | | | 6,269,144 | | | | 6,068,469 | | |
Monty Parent Issuer LLC | |
| 2013-LTR1 A† | | | 3.4700 | | | 11/20/28 | | | 6,860,204 | | | | 6,866,317 | | |
| 2013-LTR1 B† | | | 4.2500 | | | 11/20/28 | | | 16,757,956 | | | | 16,757,822 | | |
Motel 6 Trust | |
| 2012-MTL6 D† | | | 3.7812 | | | 10/5/25 | | | 37,663,000 | | | | 37,539,514 | | |
| 2012-MTL6 E† | | | 4.2743 | | | 10/5/25 | | | 10,061,000 | | | | 9,728,606 | | |
Ores NPL LLC | |
| 2014-LV3 CL A† | | | 3.0000 | | | 3/27/24 | | | 15,012,072 | | | | 15,013,267 | | |
| 2013-LV2 CL A† | | | 3.0810 | | | 9/25/25 | | | 16,448,314 | | | | 16,441,065 | | |
| 2014-LV3 CL B† | | | 6.0000 | | | 3/27/24 | | | 47,419,000 | | | | 47,378,039 | | |
Rialto Real Estate Fund LP | |
| 2014-LT6 CL A† | | | 2.7500 | | | 9/15/24 | | | 7,221,000 | | | | 7,174,825 | | |
| 2014-LT5 CL A† | | | 2.8500 | | | 5/15/24 | | | 8,569,231 | | | | 8,570,654 | | |
| 2014-LT6 CL B† | | | 5.4860 | | | 9/15/24 | | | 9,457,000 | | | | 9,532,830 | | |
Starwood Commercial Mortgage Trust
2013-FV1 CL B† | | | 2.1540 | | | 8/11/28 | | | 18,051,000 | | | | 18,052,847 | | |
Sunset Mortgage Loan Company
2014-NPL-1 A† | | | 3.2282 | | | 8/16/44 | | | 54,945,555 | | | | 54,966,742 | | |
TOTAL NON-AGENCY | | | | $ | 322,225,180 | | |
AGENCY — 1.8% | | | |
Government National Mortgage Association | |
| 2012-22 CL AB | | | 1.6610 | | | 3/16/33 | | $ | 4,953,211 | | | $ | 4,951,973 | | |
| 2011-49 CL AB | | | 2.8000 | | | 1/16/34 | | | 21,550,948 | | | | 21,849,860 | | |
| 2011-120 CL A | | | 3.8984 | | | 8/16/33 | | | 35,324,543 | | | | 36,223,906 | | |
| 2011-143 CL AB | | | 3.9394 | | | 3/16/33 | | | 37,435,872 | | | | 38,388,241 | | |
TOTAL AGENCY | | | | $ | 101,413,980 | | |
18
FPA NEW INCOME, INC.
PORTFOLIO OF INVESTMENTS (Continued)
September 30, 2014
BONDS & DEBENTURES — Continued | | Coupon
Rate (%) | | Maturity
Date | | Principal
Amount | | Fair
Value | |
RESIDENTIAL MORTGAGE-BACKED SECURITIES
AGENCY POOL FIXED RATE MORTGAGES — 6.3% | |
Federal Home Loan Mortgage Corporation | |
E01305 | | | 4.5000 | | | 12/1/17 | | $ | 38,356 | | | $ | 40,447 | | |
E01304 | | | 4.5000 | | | 1/1/18 | | | 59,339 | | | | 62,573 | | |
E01489 | | | 4.5000 | | | 11/1/18 | | | 3,498,495 | | | | 3,689,135 | | |
G11657 | | | 4.5000 | | | 12/1/18 | | | 430,261 | | | | 453,707 | | |
255227 | | | 4.5000 | | | 5/1/19 | | | 1,117,145 | | | | 1,181,031 | | |
E01641 | | | 4.5000 | | | 5/1/19 | | | 210,941 | | | | 222,468 | | |
E01653 | | | 4.5000 | | | 6/1/19 | | | 420,388 | | | | 443,633 | | |
J11204 | | | 4.5000 | | | 11/1/19 | | | 4,317,409 | | | | 4,564,624 | | |
G11712 | | | 4.5000 | | | 7/1/20 | | | 430,601 | | | | 456,693 | | |
P60959 | | | 4.5000 | | | 9/1/20 | | | 2,487,592 | | | | 2,612,593 | | |
G11772 | | | 4.5000 | | | 9/1/20 | | | 412,249 | | | | 437,853 | | |
G15110 | | | 4.5000 | | | 8/1/25 | | | 4,596,002 | | | | 4,871,848 | | |
G15169 | | | 4.5000 | | | 9/1/26 | | | 16,345,504 | | | | 17,390,949 | | |
G13812 | | | 5.0000 | | | 12/1/20 | | | 6,172,841 | | | | 6,517,471 | | |
G15036 | | | 5.0000 | | | 6/1/24 | | | 25,120,464 | | | | 26,747,117 | | |
G15173 | | | 5.0000 | | | 6/1/26 | | | 16,073,015 | | | | 17,183,964 | | |
G12400 | | | 5.5000 | | | 11/1/16 | | | 156,144 | | | | 161,954 | | |
G12730 | | | 5.5000 | | | 7/1/17 | | | 25,436 | | | | 26,682 | | |
G12829 | | | 5.5000 | | | 10/1/17 | | | 22,012 | | | | 23,149 | | |
G11397 | | | 5.5000 | | | 3/1/18 | | | 94,253 | | | | 99,589 | | |
G11684 | | | 5.5000 | | | 12/1/18 | | | 214,646 | | | | 226,270 | | |
G11632 | | | 5.5000 | | | 9/1/19 | | | 3,703,431 | | | | 3,958,229 | | |
G12339 | | | 5.5000 | | | 10/1/20 | | | 510,642 | | | | 548,881 | | |
G14187 | | | 5.5000 | | | 12/1/20 | | | 11,049,802 | | | | 11,827,045 | | |
G13774 | | | 5.5000 | | | 12/1/20 | | | 512,476 | | | | 547,372 | | |
J01270 | | | 5.5000 | | | 2/1/21 | | | 179,696 | | | | 193,778 | | |
G13353 | | | 5.5000 | | | 3/1/21 | | | 1,480,130 | | | | 1,585,804 | | |
G12393 | | | 5.5000 | | | 10/1/21 | | | 335,053 | | | | 361,487 | | |
G14178 | | | 5.5000 | | | 7/1/22 | | | 1,535,805 | | | | 1,651,910 | | |
G15037 | | | 5.5000 | | | 12/1/24 | | | 9,947,162 | | | | 10,673,338 | | |
G14979 | | | 5.5000 | | | 12/1/24 | | | 1,507,406 | | | | 1,622,707 | | |
G14830 | | | 5.5000 | | | 12/1/24 | | | 4,862,290 | | | | 5,253,766 | | |
G12139 | | | 6.5000 | | | 9/1/19 | | | 712,498 | | | | 743,506 | | |
A26942 | | | 6.5000 | | | 9/1/34 | | | 615,545 | | | | 701,173 | | |
G08107 | | | 6.5000 | | | 1/1/36 | | | 1,675,177 | | | | 1,907,307 | | |
P50543 | | | 6.5000 | | | 4/1/37 | | | 141,792 | | | | 155,273 | | |
19
FPA NEW INCOME, INC.
PORTFOLIO OF INVESTMENTS (Continued)
September 30, 2014
BONDS & DEBENTURES — Continued | | Coupon
Rate (%) | | Maturity
Date | | Principal
Amount | | Fair
Value | |
Federal National Mortgage Association | |
745278 | | | 4.5000 | | | 6/1/19 | | $ | 2,861,965 | | | $ | 3,025,634 | | |
725609 | | | 4.5000 | | | 7/1/19 | | | 994,621 | | | | 1,051,501 | | |
725792 | | | 4.5000 | | | 8/1/19 | | | 6,262,546 | | | | 6,620,685 | | |
MA0358 | | | 4.5000 | | | 3/1/20 | | | 456,563 | | | | 482,673 | | |
MA0419 | | | 4.5000 | | | 5/1/20 | | | 708,004 | | | | 748,493 | | |
745181 | | | 4.5000 | | | 11/1/20 | | | 482,617 | | | | 512,363 | | |
AA0905 | | | 4.5000 | | | 1/1/21 | | | 2,465,289 | | | | 2,610,816 | | |
995321 | | | 4.5000 | | | 12/1/21 | | | 322,220 | | | | 343,423 | | |
889531 | | | 4.5000 | | | 5/1/22 | | | 113,699 | | | | 120,705 | | |
254907 | | | 5.0000 | | | 10/1/18 | | | 262,018 | | | | 277,876 | | |
995756 | | | 5.0000 | | | 12/1/18 | | | 6,392,272 | | | | 6,773,443 | | |
AL5252 | | | 5.0000 | | | 4/1/19 | | | 2,050,273 | | | | 2,161,909 | | |
745387 | | | 5.0000 | | | 4/1/19 | | | 502,693 | | | | 534,530 | | |
735660 | | | 5.0000 | | | 6/1/20 | | | 271,677 | | | | 291,361 | | |
AE0126 | | | 5.0000 | | | 6/1/20 | | | 9,117,933 | | | | 9,669,112 | | |
310097 | | | 5.0000 | | | 10/1/20 | | | 2,211,369 | | | | 2,334,084 | | |
995861 | | | 5.0000 | | | 1/1/21 | | | 7,080,562 | | | | 7,503,342 | | |
888104 | | | 5.0000 | | | 5/1/21 | | | 160,209 | | | | 171,444 | | |
AE0314 | | | 5.0000 | | | 8/1/21 | | | 37,493,105 | | | | 39,832,847 | | |
890185 | | | 5.0000 | | | 10/1/21 | | | 1,989,657 | | | | 2,143,987 | | |
890083 | | | 5.0000 | | | 12/1/21 | | | 3,610,381 | | | | 3,826,246 | | |
AL5656 | | | 5.0000 | | | 9/1/25 | | | 2,568,522 | | | | 2,751,452 | | |
AL5764 | | | 5.0000 | | | 9/1/25 | | | 18,504,336 | | | | 19,802,362 | | |
AE0792 | | | 5.0000 | | | 1/1/26 | | | 7,004,476 | | | | 7,430,208 | | |
AL4056 | | | 5.0000 | | | 6/1/26 | | | 20,891,123 | | | | 22,485,225 | | |
257100 | | | 5.5000 | | | 1/1/18 | | | 624,281 | | | | 662,424 | | |
745500 | | | 5.5000 | | | 12/1/18 | | | 4,501,227 | | | | 4,788,090 | | |
995284 | | | 5.5000 | | | 3/1/20 | | | 5,249,261 | | | | 5,581,644 | | |
889318 | | | 5.5000 | | | 7/1/20 | | | 6,091,477 | | | | 6,485,169 | | |
AE0237 | | | 5.5000 | | | 11/1/23 | | | 6,339,086 | | | | 6,746,182 | | |
AL5812 | | | 5.5000 | | | 5/1/25 | | | 18,354,110 | | | | 19,607,246 | | |
AL4433 | | | 5.5000 | | | 9/1/25 | | | 5,092,943 | | | | 5,494,270 | | |
AL4901 | | | 5.5000 | | | 9/1/25 | | | 9,171,649 | | | | 9,830,894 | | |
735439 | | | 6.0000 | | | 9/1/19 | | | 1,164,461 | | | | 1,231,824 | | |
745832 | | | 6.0000 | | | 4/1/21 | | | 15,307,857 | | | | 16,323,074 | | |
AD0951 | | | 6.0000 | | | 12/1/21 | | | 6,085,439 | | | | 6,522,496 | | |
AL0294 | | | 6.0000 | | | 10/1/22 | | | 306,296 | | | | 332,846 | | |
890225 | | | 6.0000 | | | 5/1/23 | | | 5,626,641 | | | | 6,024,782 | | |
725951 | | | 7.5000 | | | 8/1/17 | | | 54,644 | | | | 57,239 | | |
323282 | | | 7.5000 | | | 7/1/28 | | | 315,456 | | | | 356,655 | | |
20
FPA NEW INCOME, INC.
PORTFOLIO OF INVESTMENTS (Continued)
September 30, 2014
BONDS & DEBENTURES — Continued | | Coupon
Rate (%) | | Maturity
Date | | Principal
Amount | | Fair
Value | |
Government National Mortgage Association | |
782281 | | | 6.0000 | | | 3/15/23 | | $ | 3,239,207 | | | $ | 3,538,686 | | |
TOTAL AGENCY POOL FIXED RATE
MORTGAGES | | | | $ | 366,234,568 | | |
AGENCY COLLATERALIZED
MORTGAGE OBLIGATION — 16.7% | | | |
Federal Home Loan Mortgage Corporation | |
| 3818 CL HA | | | 1.5000 | | | 1/15/18 | | $ | 6,252,613 | | | $ | 6,319,312 | | |
| 4350 CL CA | | | 2.0000 | | | 10/15/19 | | | 42,394,692 | | | | 43,170,303 | | |
| 4351 CL GA | | | 2.0000 | | | 11/15/19 | | | 30,546,234 | | | | 31,085,958 | | |
| 3711 CL AD | | | 2.5000 | | | 8/15/23 | | | 284,970 | | | | 289,017 | | |
STRU RB-5918 AD | | | 2.5000 | | | 10/15/24 | | | 130,745,525 | | | | 133,850,731 | | |
| 3825 CL AB | | | 3.0000 | | | 8/15/20 | | | 781,922 | | | | 809,078 | | |
| 2634 CL CI | | | 3.0000 | | | 2/15/23 | | | 51,991 | | | | 52,802 | | |
| 3829 CL CD | | | 3.0000 | | | 8/15/24 | | | 1,695,180 | | | | 1,725,388 | | |
| 2809 CL UC | | | 4.0000 | | | 6/15/19 | | | 620,266 | | | | 652,979 | | |
| 3806 CL AB | | | 4.0000 | | | 2/15/23 | | | 732,605 | | | | 734,751 | | |
| 3625 CL AJ | | | 4.0000 | | | 3/15/23 | | | 81,932 | | | | 82,369 | | |
| 2990 CL TD | | | 4.0000 | | | 5/15/35 | | | 90,940 | | | | 94,592 | | |
| 3992 CL H | | | 4.0000 | | | 6/15/36 | | | 172,757 | | | | 176,769 | | |
| 3986 CL P | | | 4.0000 | | | 3/15/39 | | | 429,699 | | | | 444,625 | | |
| 4088 CL LE | | | 4.0000 | | | 10/15/40 | | | 13,023,450 | | | | 13,524,270 | | |
| 2877 CL WA | | | 4.2500 | | | 10/15/34 | | | 498,628 | | | | 499,640 | | |
| 3578 CL AM | | | 4.5000 | | | 9/15/16 | | | 1,641,715 | | | | 1,683,874 | | |
| 2614 CL BY | | | 4.5000 | | | 5/15/18 | | | 1,720,127 | | | | 1,809,431 | | |
| 2645 CL BY | | | 4.5000 | | | 7/15/18 | | | 345,764 | | | | 363,141 | | |
| 2656 CL PE | | | 4.5000 | | | 7/15/18 | | | 687,486 | | | | 724,074 | | |
| 2694 CL AN | | | 4.5000 | | | 7/15/18 | | | 3,078,224 | | | | 3,247,722 | | |
| 2885 CL DX | | | 4.5000 | | | 11/15/19 | | | 9,766,998 | | | | 10,346,883 | | |
| 3271 CL TB | | | 4.5000 | | | 11/15/19 | | | 5,836,529 | | | | 6,187,781 | | |
| 2900 CL PC | | | 4.5000 | | | 12/15/19 | | | 5,705,654 | | | | 6,039,543 | | |
| 2930 CL KT | | | 4.5000 | | | 2/15/20 | | | 1,588,484 | | | | 1,684,441 | | |
| 2995 CL JK | | | 4.5000 | | | 6/15/20 | | | 2,069,938 | | | | 2,186,237 | | |
| 3969 CL MP | | | 4.5000 | | | 4/15/39 | | | 157,426 | | | | 165,047 | | |
| 3939 CL D | | | 4.5000 | | | 9/15/41 | | | 2,799,569 | | | | 2,969,380 | | |
| 2509 CL CB | | | 5.0000 | | | 10/15/17 | | | 1,989,296 | | | | 2,079,332 | | |
| 2568 CL XD | | | 5.0000 | | | 2/15/18 | | | 488,380 | | | | 515,392 | | |
| 2747 CL DX | | | 5.0000 | | | 2/15/19 | | | 4,092,710 | | | | 4,338,068 | | |
| 3852 CL HA | | | 5.0000 | | | 12/15/21 | | | 7,580,879 | | | | 8,106,461 | | |
| 2494 CL CF | | | 5.5000 | | | 9/15/17 | | | 2,069,046 | | | | 2,182,740 | | |
21
FPA NEW INCOME, INC.
PORTFOLIO OF INVESTMENTS (Continued)
September 30, 2014
BONDS & DEBENTURES — Continued | | Coupon
Rate (%) | | Maturity
Date | | Principal
Amount | | Fair
Value | |
| 2503 CL B | | | 5.5000 | | | 9/15/17 | | $ | 2,014,836 | | | $ | 2,112,213 | | |
| 3808 CL BQ | | | 5.5000 | | | 8/15/25 | | | 7,931,885 | | | | 8,402,801 | | |
| 3806 CL JB | | | 5.5000 | | | 2/15/26 | | | 4,137,928 | | | | 4,519,156 | | |
| 3855 CL HQ | | | 5.5000 | | | 2/15/26 | | | 4,234,000 | | | | 4,525,002 | | |
| 2453 CL BD | | | 6.0000 | | | 5/15/17 | | | 614,810 | | | | 648,306 | | |
| 3926 CL GP | | | 6.0000 | | | 8/15/25 | | | 4,460,077 | | | | 4,664,483 | | |
| 3614 CL DY | | | 6.0000 | | | 1/15/32 | | | 8,918,488 | | | | 9,881,417 | | |
Federal National Mortgage Association | |
| 2013-64 CL TZ | | | 1.5000 | | | 3/25/42 | | | 1,895,176 | | | | 1,881,171 | | |
| 2013-30 CL CA | | | 1.5000 | | | 4/25/43 | | | 25,755,610 | | | | 24,954,675 | | |
| 2013-30 CL JA | | | 1.5000 | | | 4/25/43 | | | 18,135,148 | | | | 17,531,743 | | |
| 2013-66 CL JA | | | 2.2500 | | | 7/25/43 | | | 73,715,779 | | | | 74,575,106 | | |
| 2010-83 CL AH | | | 2.5000 | | | 11/25/18 | | | 1,851,086 | | | | 1,900,368 | | |
| 2011-125 GE | | | 2.5000 | | | 12/25/41 | | | 51,434,508 | | | | 51,137,237 | | |
| 2012-73 CL JB | | | 3.5000 | | | 1/25/42 | | | 35,966,398 | | | | 37,736,106 | | |
| 2012-8 CL LE | | | 3.5000 | | | 2/25/42 | | | 34,616,988 | | | | 36,319,289 | | |
| 2012-26 CL ME | | | 3.5000 | | | 3/25/42 | | | 45,856,499 | | | | 48,111,529 | | |
| 2012-41 CL LB | | | 3.5000 | | | 4/25/42 | | | 43,050,138 | | | | 45,168,652 | | |
| 2012-48 CL MB | | | 3.5000 | | | 5/25/42 | | | 42,084,654 | | | | 44,153,544 | | |
| 2012-117 CL AD | | | 3.5000 | | | 10/25/42 | | | 65,672,461 | | | | 68,336,306 | | |
| 2013-112 CL WA | | | 3.5000 | | | 2/25/43 | | | 43,735,906 | | | | 45,161,308 | | |
| 2003-128 CL NG | | | 4.0000 | | | 1/25/19 | | | 399,837 | | | | 419,830 | | |
| 2004-7 CL JK | | | 4.0000 | | | 2/25/19 | | | 3,448,892 | | | | 3,619,663 | | |
| 2008-15 CL JM | | | 4.0000 | | | 2/25/19 | | | 69,738 | | | | 70,632 | | |
| 2008-18 CL MD | | | 4.0000 | | | 3/25/19 | | | 811,637 | | | | 851,422 | | |
| 2011-67 CL EA | | | 4.0000 | | | 7/25/21 | | | 15,974,017 | | | | 16,815,528 | | |
| 2009-31 CL A | | | 4.0000 | | | 2/25/24 | | | 401,182 | | | | 420,315 | | |
| 2009-76 CL MA | | | 4.0000 | | | 9/25/24 | | | 1,074,956 | | | | 1,117,140 | | |
| 2012-95 CL AB | | | 4.0000 | | | 11/25/40 | | | 7,108,647 | | | | 7,273,453 | | |
| 2014-39 CL MA | | | 4.0000 | | | 8/25/42 | | | 12,064,016 | | | | 12,567,046 | | |
| 2014-1 CL DA | | | 4.0000 | | | 6/25/43 | | | 11,449,051 | | | | 11,953,302 | | |
| 2009-70 CL NU | | | 4.2500 | | | 8/25/19 | | | 5,292,772 | | | | 5,544,602 | | |
| 2004-90 -CL GA | | | 4.3500 | | | 3/25/34 | | | 998,406 | | | | 1,011,066 | | |
| 2003-30 CL HW | | | 4.5000 | | | 4/25/18 | | | 662,830 | | | | 697,116 | | |
| 2003-92 CL HP | | | 4.5000 | | | 9/25/18 | | | 8,539,309 | | | | 9,016,426 | | |
| 2008-40 CL KA | | | 4.5000 | | | 10/25/18 | | | 1,196,185 | | | | 1,247,426 | | |
| 2008-18 CL NB | | | 4.5000 | | | 5/25/20 | | | 2,031,320 | | | | 2,132,445 | | |
| 2008-59 CL KB | | | 4.5000 | | | 7/25/23 | | | 4,163,484 | | | | 4,400,720 | | |
| 2011-7 CL PA | | | 4.5000 | | | 10/25/39 | | | 493,926 | | | | 511,899 | | |
| 2012-40 CL GC | | | 4.5000 | | | 12/25/40 | | | 6,114,195 | | | | 6,296,297 | | |
| 2012-67 CL PB | | | 4.5000 | | | 12/25/40 | | | 9,613,092 | | | | 10,020,111 | | |
22
FPA NEW INCOME, INC.
PORTFOLIO OF INVESTMENTS (Continued)
September 30, 2014
BONDS & DEBENTURES — Continued | | Coupon
Rate (%) | | Maturity
Date | | Principal
Amount | | Fair
Value | |
| 2011-148 CL PB | | | 4.5000 | | | 12/25/41 | | $ | 7,839,113 | | | $ | 8,363,328 | | |
| 2002-74 CL PE | | | 5.0000 | | | 11/25/17 | | | 672,169 | | | | 706,379 | | |
| 2003-24 -CL PD | | | 5.0000 | | | 4/25/18 | | | 2,437,947 | | | | 2,571,864 | | |
| 2003-97 CL CA | | | 5.0000 | | | 10/25/18 | | | 15,356,978 | | | | 16,329,833 | | |
| 2008-77 CL DA | | | 5.0000 | | | 4/25/23 | | | 2,100,071 | | | | 2,167,840 | | |
| 2005-26 CL G | | | 5.0000 | | | 6/25/32 | | | 81,540 | | | | 82,311 | | |
| 2010-39 CL PL | | | 5.0000 | | | 10/25/32 | | | 1,748,290 | | | | 1,773,168 | | |
| 2004-60 CL LB | | | 5.0000 | | | 4/25/34 | | | 7,653,644 | | | | 8,268,614 | | |
| 2014-2 CL MC | | | 5.0000 | | | 3/25/42 | | | 5,461,171 | | | | 5,833,524 | | |
| 2003-W17 CL 1A5 | | | 5.3500 | | | 8/25/33 | | | 1,204,986 | | | | 1,207,806 | | |
| 2011-19 CL WB | | | 5.5000 | | | 10/25/18 | | | 5,862,725 | | | | 6,252,479 | | |
| 2009-116 CL PA | | | 5.5000 | | | 4/25/24 | | | 3,167,684 | | | | 3,273,675 | | |
| 2002-9 CL PC | | | 6.0000 | | | 3/25/17 | | | 1,907,467 | | | | 2,000,094 | | |
TOTAL AGENCY COLLATERALIZED
MORTGAGE OBLIGATION | | | | $ | 974,679,897 | | |
NON-AGENCY COLLATERALIZED
MORTGAGE OBLIGATION — 6.9% | | | |
Bayview Opportunity Master Fund Trust | |
| 2013-13NP CL A† | | | 3.7210 | | | 6/28/33 | | $ | 7,149,851 | | | $ | 7,126,006 | | |
| 2014-20NP CL A† | | | 3.7210 | | | 8/28/44 | | | 250,000 | | | | 252,004 | | |
| 2012-4NR2 CL A† | | | 3.9496 | | | 1/28/34 | | | 5,723,606 | | | | 5,701,984 | | |
| 2013-14NP CL A† | | | 4.2130 | | | 8/28/33 | | | 18,078,163 | | | | 18,134,581 | | |
| 2013-4RPL CL A† | | | 4.4583 | | | 7/28/18 | | | 1,354,999 | | | | 1,357,783 | | |
Citicorp Mortgage Securities Inc.
2005-5 CL 2A3 | | | 5.0000 | | | 8/25/20 | | | 159,585 | | | | 163,899 | | |
Citigroup Mortgage Loan Trust Inc.
2014-A A | | | 4.0000 | | | 1/1/35 | | | 26,237,206 | | | | 27,046,364 | | |
Credit Suisse Mortgage Trust | |
| 2013-6 1A1† | | | 2.5000 | | | 7/25/28 | | | 85,747,762 | | | | 84,514,966 | | |
| 2006-C5 A3 | | | 5.3110 | | | 12/15/39 | | | 25,045,000 | | | | 26,706,703 | | |
Normandy Mortgage Loan Trust
2013-NPL3 A† | | | 4.9486 | | | 9/16/43 | | | 33,584,416 | | | | 33,534,039 | | |
Riverview HECM Trust 2007-1 CL A† | | | 0.6100 | | | 5/25/47 | | | 34,187,471 | | | | 30,012,155 | | |
Sequoia Mortgage Trust 2012-1 1A1 | | | 2.8650 | | | 1/25/42 | | | 6,031,012 | | | | 5,962,072 | | |
Stanwich Mortgage Loan Trust Series | |
| 2009-2 A†,* | | | 11.2093 | | | 2/15/49 | | | 352,665 | | | | 157,712 | | |
| 2010-1 A†,* | | | 27.9270 | | | 9/15/47 | | | 660,818 | | | | 334,242 | | |
| 2010-2 A†,* | | | 15.6747 | | | 2/28/57 | | | 3,327,766 | | | | 1,677,860 | | |
| 2010-3 A†,* | | | 24.6244 | | | 7/31/38 | | | 2,067,249 | | | | 1,034,245 | | |
| 2010-4 A†,* | | | 0.0000 | | | 8/31/49 | | | 2,784,093 | | | | 1,405,967 | | |
23
FPA NEW INCOME, INC.
PORTFOLIO OF INVESTMENTS (Continued)
September 30, 2014
BONDS & DEBENTURES — Continued | | Coupon
Rate (%) | | Maturity
Date | | Principal
Amount | | Fair
Value | |
| 2011-1 A†,* | | | 2.9596 | | | 8/15/50 | | $ | 4,195,764 | | | $ | 2,212,968 | | |
| 2011-2 A†,* | | | 0.0000 | | | 9/15/50 | | | 2,874,505 | | | | 1,538,447 | | |
| 2012-NPL4 CL A† | | | 2.9814 | | | 10/15/42 | | | 3,773,416 | | | | 3,771,210 | | |
| 2013-NPL1 CL A† | | | 2.9814 | | | 2/16/43 | | | 16,235,871 | | | | 16,295,875 | | |
| 2013-NPL2 CL A† | | | 3.2282 | | | 4/16/59 | | | 34,568,992 | | | | 34,568,957 | | |
Truman Capital Mortgage Loan Trust | |
| 2014-NPL3 A1† | | | 3.1250 | | | 4/25/53 | | | 8,647,000 | | | | 8,612,412 | | |
| 2014-NPL2 A1† | | | 3.1250 | | | 6/25/54 | | | 8,723,000 | | | | 8,679,027 | | |
US Residential Opportunity Fund Trust
2014-4A† | | | 3.4656 | | | 3/25/34 | | | 7,105,137 | | | | 7,128,583 | | |
Vericrest Opportunity Loan Transferee | |
| 2014-NPL4 A1† | | | 3.1250 | | | 4/24/54 | | | 43,082,021 | | | | 42,976,875 | | |
| 2014-NPL3 A1† | | | 3.2500 | | | 11/25/53 | | | 10,919,819 | | | | 10,965,043 | | |
| 2014-NPL1 A1† | | | 3.6250 | | | 10/27/53 | | | 7,619,568 | | | | 7,626,557 | | |
| 2014-NPL2 A1† | | | 3.6250 | | | 11/25/53 | | | 9,607,845 | | | | 9,631,864 | | |
Wells Fargo Mortgage-Backed Securities Trust
2006-5 2A1 | | | 5.2500 | | | 4/25/21 | | | 5,374,092 | | | | 5,422,243 | | |
TOTAL NON-AGENCY COLLATERALIZED
MORTGAGE OBLIGATION | | | | $ | 404,552,643 | | |
AGENCY STRIPPED SECURITIES — 1.7%
PRINCIPAL ONLY | | | |
Federal Home Loan Mortgage
Corporation 217 | | | 0.0000 | | | 1/1/32 | | $ | 436,939 | | | $ | 401,081 | | |
INTEREST ONLY | | | |
Federal Home Loan Mortgage Corporation | |
| 3714 TI | | | 2.2500 | | | 8/15/15 | | $ | 33,417,779 | | | $ | 571,685 | | |
| 3935 LI | | | 3.0000 | | | 10/15/21 | | | 6,058,574 | | | | 483,295 | | |
| 3948 AI | | | 3.0000 | | | 10/15/21 | | | 7,527,484 | | | | 589,553 | | |
| 3956 KI | | | 3.0000 | | | 11/15/21 | | | 16,428,403 | | | | 1,369,575 | | |
| 3968 AI | | | 3.0000 | | | 12/15/21 | | | 6,223,143 | | | | 523,170 | | |
| 3992 OI | | | 3.0000 | | | 1/15/22 | | | 4,920,144 | | | | 401,246 | | |
| 3994 AI | | | 3.0000 | | | 2/15/22 | | | 11,712,250 | | | | 1,006,039 | | |
| 3994 EI | | | 3.0000 | | | 2/15/22 | | | 11,228,161 | | | | 968,565 | | |
| 3998 KI | | | 3.0000 | | | 11/15/26 | | | 19,896,758 | | | | 2,291,774 | | |
| 4100 EI | | | 3.0000 | | | 8/15/27 | | | 92,012,373 | | | | 11,228,896 | | |
| 3706 AI | | | 3.5000 | | | 7/15/20 | | | 8,058,609 | | | | 407,418 | | |
| 3722 AI | | | 3.5000 | | | 9/15/20 | | | 10,497,161 | | | | 829,960 | | |
| 3735 AI | | | 3.5000 | | | 10/15/20 | | | 4,981,888 | | | | 411,754 | | |
24
FPA NEW INCOME, INC.
PORTFOLIO OF INVESTMENTS (Continued)
September 30, 2014
BONDS & DEBENTURES — Continued | | Coupon
Rate (%) | | Maturity
Date | | Principal
Amount | | Fair
Value | |
| 3874 DI | | | 3.5000 | | | 10/15/20 | | $ | 8,541,525 | | | $ | 499,951 | | |
| 3893 DI | | | 3.5000 | | | 10/15/20 | | | 6,344,846 | | | | 378,374 | | |
| 3753 CI | | | 3.5000 | | | 11/15/20 | | | 2,350,782 | | | | 197,050 | | |
| 3755 AI | | | 3.5000 | | | 11/15/20 | | | 9,467,837 | | | | 780,991 | | |
| 3760 KI | | | 3.5000 | | | 11/15/20 | | | 7,479,859 | | | | 578,488 | | |
| 3784 BI | | | 3.5000 | | | 1/15/21 | | | 6,333,877 | | | | 533,904 | | |
| 3874 BI | | | 3.5000 | | | 6/15/21 | | | 5,341,092 | | | | 468,729 | | |
| 3893 BI | | | 3.5000 | | | 7/15/21 | | | 4,598,006 | | | | 410,558 | | |
| 3909 KI | | | 3.5000 | | | 7/15/21 | | | 3,965,312 | | | | 351,986 | | |
| 3938 IO | | | 3.5000 | | | 10/15/21 | | | 27,316,961 | | | | 2,502,193 | | |
| 3778 GI | | | 3.5000 | | | 6/15/24 | | | 5,046,531 | | | | 366,799 | | |
| 3854 GI | | | 3.5000 | | | 11/15/24 | | | 3,598,613 | | | | 189,640 | | |
| 3852 YI | | | 3.5000 | | | 3/15/25 | | | 12,267,225 | | | | 867,218 | | |
| 3763 NI | | | 3.5000 | | | 5/15/25 | | | 4,298,497 | | | | 395,965 | | |
| 3904 QI | | | 3.5000 | | | 5/15/25 | | | 4,611,828 | | | | 392,063 | | |
| 3909 UI | | | 3.5000 | | | 8/15/25 | | | 7,275,237 | | | | 568,119 | | |
| 3904 NI | | | 3.5000 | | | 8/15/26 | | | 9,928,345 | | | | 1,311,188 | | |
| 3930 AI | | | 3.5000 | | | 9/15/26 | | | 12,785,210 | | | | 1,764,548 | | |
| 4018 AI | | | 3.5000 | | | 3/15/27 | | | 22,172,695 | | | | 2,806,318 | | |
| 3684 CI | | | 4.5000 | | | 8/15/24 | | | 24,426,017 | | | | 2,392,091 | | |
| 3917 AI | | | 4.5000 | | | 7/15/26 | | | 35,694,434 | | | | 4,907,903 | | |
| 3636 IO | | | 5.0000 | | | 11/15/18 | | | 23,030,091 | | | | 1,541,655 | | |
217 | | | 6.5000 | | | 1/1/32 | | | 420,726 | | | | 92,114 | | |
Federal National Mortgage Association | |
| 2011-88 BI | | | 3.0000 | | | 11/25/20 | | | 3,816,847 | | | | 204,381 | | |
| 2011-141 EI | | | 3.0000 | | | 7/25/21 | | | 16,439,287 | | | | 1,153,571 | | |
| 2012-8 TI | | | 3.0000 | | | 10/25/21 | | | 7,690,056 | | | | 606,107 | | |
| 2011-113 GI | | | 3.0000 | | | 11/25/21 | | | 7,391,354 | | | | 583,074 | | |
| 2011-129 AI | | | 3.0000 | | | 12/25/21 | | | 10,117,117 | | | | 820,409 | | |
| 2012-8 UI | | | 3.0000 | | | 12/25/21 | | | 24,702,709 | | | | 2,025,753 | | |
| 2011-137 AI | | | 3.0000 | | | 1/25/22 | | | 13,202,352 | | | | 1,051,190 | | |
| 2011-138 IG | | | 3.0000 | | | 1/25/22 | | | 15,866,628 | | | | 1,320,370 | | |
| 2011-145 IO | | | 3.0000 | | | 1/25/22 | | | 20,649,576 | | | | 1,737,664 | | |
| 2012-78 AI | | | 3.0000 | | | 2/25/22 | | | 12,371,299 | | | | 891,807 | | |
| 2012-23 IA | | | 3.0000 | | | 3/25/22 | | | 9,390,512 | | | | 776,625 | | |
| 2012-32 AI | | | 3.0000 | | | 4/25/22 | | | 15,347,604 | | | | 1,291,383 | | |
| 2012-53 CI | | | 3.0000 | | | 5/25/22 | | | 23,550,460 | | | | 2,000,098 | | |
| 2012-147 AI | | | 3.0000 | | | 10/25/27 | | | 33,959,542 | | | | 4,249,116 | | |
| 2012-145 DI | | | 3.0000 | | | 1/25/28 | | | 18,674,164 | | | | 2,365,415 | | |
| 2012-149 CI | | | 3.0000 | | | 1/25/28 | | | 49,758,395 | | | | 6,267,025 | | |
| 2010-128 LI | | | 3.5000 | | | 11/25/20 | | | 12,009,072 | | | | 925,452 | | |
25
FPA NEW INCOME, INC.
PORTFOLIO OF INVESTMENTS (Continued)
September 30, 2014
BONDS & DEBENTURES — Continued | | Coupon
Rate (%) | | Maturity
Date | | Principal
Amount | | Fair
Value | |
| 2011-75 BI | | | 3.5000 | | | 11/25/20 | | $ | 6,399,899 | | | $ | 375,435 | | |
| 2011-78 LI | | | 3.5000 | | | 11/25/20 | | | 16,751,094 | | | | 931,701 | | |
| 2010-145 BI | | | 3.5000 | | | 12/25/20 | | | 6,094,560 | | | | 514,217 | | |
| 2011-61 BI | | | 3.5000 | | | 7/25/21 | | | 5,274,544 | | | | 474,371 | | |
| 2011-66 QI | | | 3.5000 | | | 7/25/21 | | | 9,194,031 | | | | 827,116 | | |
| 2010-104 CI | | | 3.5000 | | | 10/25/21 | | | 15,747,908 | | | | 1,413,753 | | |
| 2011-104 DI | | | 3.5000 | | | 10/25/21 | | | 26,331,886 | | | | 2,290,205 | | |
| 2011-110 AI | | | 3.5000 | | | 11/25/21 | | | 11,050,295 | | | | 960,734 | | |
| 2011-118 IC | | | 3.5000 | | | 11/25/21 | | | 29,016,560 | | | | 2,612,326 | | |
| 2011-125 DI | | | 3.5000 | | | 12/25/21 | | | 20,483,588 | | | | 1,883,728 | | |
| 2011-143 MI | | | 3.5000 | | | 1/25/22 | | | 8,442,246 | | | | 711,382 | | |
| 2012-2 MI | | | 3.5000 | | | 2/25/22 | | | 12,608,363 | | | | 1,203,231 | | |
| 2010-137 BI | | | 3.5000 | | | 2/25/24 | | | 4,422,149 | | | | 240,996 | | |
| 2010-135 DI | | | 3.5000 | | | 4/25/24 | | | 9,574,596 | | | | 615,466 | | |
| 2011-75 AI | | | 3.5000 | | | 1/25/25 | | | 18,076,429 | | | | 1,299,334 | | |
| 2011-66 BI | | | 3.5000 | | | 3/25/25 | | | 2,203,248 | | | | 136,656 | | |
| 2011-80 KI | | | 3.5000 | | | 4/25/25 | | | 9,375,003 | | | | 755,160 | | |
| 2011-67 CI | | | 3.5000 | | | 8/25/25 | | | 4,608,673 | | | | 427,564 | | |
| 2011-22 IC | | | 3.5000 | | | 12/25/25 | | | 9,080,578 | | | | 1,001,845 | | |
| 2011-101 EI | | | 3.5000 | | | 10/25/26 | | | 20,111,049 | | | | 2,618,247 | | |
| 2011-69 TI | | | 4.0000 | | | 5/25/20 | | | 5,967,768 | | | | 362,918 | | |
| 2010-89 LI | | | 4.0000 | | | 8/25/20 | | | 9,453,295 | | | | 776,627 | | |
| 2010-104 CI | | | 4.0000 | | | 9/25/20 | | | 4,143,455 | | | | 339,716 | | |
| 2011-67 EI | | | 4.0000 | | | 7/25/21 | | | 10,390,270 | | | | 811,610 | | |
| 2010-110 IH | | | 4.5000 | | | 10/25/18 | | | 11,229,556 | | | | 794,088 | | |
| 2009-70 IN | | | 4.5000 | | | 8/25/19 | | | 15,849,032 | | | | 988,865 | | |
| 2008-15 JI | | | 4.5000 | | | 6/25/22 | | | 2,730,316 | | | | 77,889 | | |
| 2010-114 CI | | | 5.0000 | | | 4/25/18 | | | 14,110,229 | | | | 955,292 | | |
2010-30 | | | 5.0000 | | | 8/25/18 | | | 5,827,247 | | | | 414,250 | | |
| 2003-64 XI | | | 5.0000 | | | 7/25/33 | | | 1,199,004 | | | | 193,952 | | |
TOTAL AGENCY STRIPPED | | | | $ | 101,059,970 | | |
AGENCY POOL ADJUSTABLE RATE
MORTGAGES — 0.0% | | | |
Federal National Mortgage Association 865963 | | | 2.2980 | | | 3/1/36 | | $ | 2,065,162 | | | $ | 2,202,578 | | |
ASSET-BACKED SECURITIES
AUTO — 27.1% | | | |
Ally Auto Receivables Trust 2012-1 B | |
| 2012-SN1 A4 | | | 0.7000 | | | 12/21/15 | | $ | 22,500,000 | | | $ | 22,517,069 | | |
26
FPA NEW INCOME, INC.
PORTFOLIO OF INVESTMENTS (Continued)
September 30, 2014
BONDS & DEBENTURES — Continued | | Coupon
Rate (%) | | Maturity
Date | | Principal
Amount | | Fair
Value | |
| 2012-SN1 A3 | | | 0.7200 | | | 8/20/15 | | $ | 6,296,132 | | | $ | 6,303,353 | | |
| 2012-1 B | | | 1.8400 | | | 11/15/16 | | | 8,666,000 | | | | 8,713,666 | | |
American Credit Acceptance Receivables | |
| 2014-1 A† | | | 1.1400 | | | 3/12/18 | | | 3,515,179 | | | | 3,517,486 | | |
| 2013-2 A | | | 1.3200 | | | 2/15/17 | | | 675,459 | | | | 676,540 | | |
| 2014-2 A† | | | 1.3900 | | | 10/10/17 | | | 9,387,034 | | | | 9,377,936 | | |
AmeriCredit Automobile Receivables Trust | |
| 2013-2 A2 | | | 0.5300 | | | 11/8/16 | | | 11,150,268 | | | | 11,152,293 | | |
| 2014-1 A2 | | | 0.5700 | | | 6/8/17 | | | 44,721,951 | | | | 44,695,686 | | |
| 2013-1 A3 | | | 0.6100 | | | 10/10/17 | | | 1,588,000 | | | | 1,586,954 | | |
| 2012-5 A3 | | | 0.6200 | | | 6/8/17 | | | 907,113 | | | | 907,462 | | |
| 2013-1 A2† | | | 0.6300 | | | 6/8/16 | | | 1,199,860 | | | | 1,199,862 | | |
| 2014-3 A2A | | | 0.6400 | | | 4/9/18 | | | 45,000,000 | | | | 44,999,136 | | |
| 2013-2 A3 | | | 0.6500 | | | 12/8/17 | | | 18,477,000 | | | | 18,480,396 | | |
| 2012-4 A3 | | | 0.6700 | | | 6/8/17 | | | 57,082,481 | | | | 57,113,215 | | |
| 2013-4 A2 | | | 0.7400 | | | 11/8/16 | | | 23,641,480 | | | | 23,656,112 | | |
| 2013-4 A3 | | | 0.9600 | | | 4/9/18 | | | 8,314,000 | | | | 8,329,637 | | |
| 2013-3 B | | | 1.5800 | | | 9/10/18 | | | 5,024,000 | | | | 5,045,160 | | |
| 2013-4 B | | | 1.6600 | | | 9/10/18 | | | 90,000 | | | | 90,346 | | |
| 2012-5 C | | | 1.6900 | | | 11/8/18 | | | 14,140,000 | | | | 14,211,852 | | |
| 2012-1 B | | | 1.7300 | | | 2/8/17 | | | 2,000,000 | | | | 2,005,324 | | |
| 2011-4 B | | | 2.2600 | | | 9/8/16 | | | 5,170,805 | | | | 5,181,799 | | |
| 2012-3 C | | | 2.4200 | | | 5/8/18 | | | 1,650,000 | | | | 1,677,517 | | |
| 2012-2 C | | | 2.6400 | | | 10/10/17 | | | 4,893,000 | | | | 4,979,402 | | |
| 2012-1 C | | | 2.6700 | | | 1/8/18 | | | 2,371,000 | | | | 2,407,473 | | |
| 2011-3 C | | | 2.8600 | | | 1/9/17 | | | 3,000,000 | | | | 3,023,802 | | |
| 2012-3 D | | | 3.0300 | | | 7/9/18 | | | 24,856,000 | | | | 25,555,033 | | |
| 2011-4 C | | | 3.0800 | | | 7/10/17 | | | 225,000 | | | | 228,219 | | |
| 2011-2 C | | | 3.1900 | | | 10/12/16 | | | 6,222,799 | | | | 6,270,216 | | |
| 2010-3 C | | | 3.3400 | | | 4/8/16 | | | 2,459,159 | | | | 2,473,602 | | |
| 2012-1 D | | | 4.7200 | | | 3/8/18 | | | 8,891,000 | | | | 9,311,370 | | |
| 2010-3 D | | | 4.9800 | | | 1/8/18 | | | 13,735,000 | | | | 14,259,952 | | |
BMW Vehicle Lease Trust 2014-1 A2 | | | 0.4500 | | | 3/21/16 | | | 21,453,000 | | | | 21,445,858 | | |
California Republic Auto Receivables Trust
2013-2 A2 | | | 1.2300 | | | 3/15/19 | | | 15,927,909 | | | | 15,982,088 | | |
Capital Auto Receivables Asset Trust | |
| 2013-1 A3 | | | 0.7900 | | | 6/20/17 | | | 3,345,000 | | | | 3,347,648 | | |
| 2013-4 A2 | | | 0.8500 | | | 2/21/17 | | | 6,750,000 | | | | 6,761,841 | | |
Credit Acceptance Auto Loan Trust | |
| 2014-2A B† | | | 2.6700 | | | 9/15/22 | | | 8,639,000 | | | | 8,637,732 | | |
| 2012-1A B† | | | 3.1200 | | | 3/16/20 | | | 4,500,000 | | | | 4,548,875 | | |
27
FPA NEW INCOME, INC.
PORTFOLIO OF INVESTMENTS (Continued)
September 30, 2014
BONDS & DEBENTURES — Continued | | Coupon
Rate (%) | | Maturity
Date | | Principal
Amount | | Fair
Value | |
Carmax Auto Owner Trust | |
| 2014-1 A2 | | | 0.4700 | | | 2/15/17 | | $ | 36,376,650 | | | $ | 36,387,716 | | |
| 2012-3 A3 | | | 0.5200 | | | 7/17/17 | | | 21,491,316 | | | | 21,492,880 | | |
| 2014-2 A2 | | | 0.7400 | | | 4/17/17 | | | 40,571,000 | | | | 40,560,865 | | |
DT Auto Owner Trust | |
| 2014-1A A† | | | 0.6600 | | | 7/17/17 | | | 1,728,597 | | | | 1,728,589 | | |
| 2014-2A A1† | | | 0.8300 | | | 8/15/17 | | | 10,588,172 | | | | 10,584,864 | | |
| 2014-1A B† | | | 1.4300 | | | 3/15/18 | | | 5,730,000 | | | | 5,742,484 | | |
| 2014-2A B† | | | 1.6400 | | | 4/16/18 | | | 8,474,000 | | | | 8,465,986 | | |
| 2013-2A B† | | | 1.7800 | | | 6/15/17 | | | 9,548,000 | | | | 9,595,576 | | |
Enterprise Fleet Financing LLC | |
| 2012-2 A2† | | | 0.7200 | | | 4/20/18 | | | 5,820,906 | | | | 5,824,259 | | |
| 2014-2 A2† | | | 1.0500 | | | 3/20/20 | | | 2,500,000 | | | | 2,495,720 | | |
Exeter Automobile Receivables Trust 2013-2A A | |
| 2014-2A A† | | | 1.0600 | | | 8/15/18 | | | 8,734,584 | | | | 8,720,344 | | |
| 2014-1A A† | | | 1.2900 | | | 5/15/18 | | | 30,147,341 | | | | 30,202,046 | | |
| 2013-2A A† | | | 1.4900 | | | 11/15/17 | | | 14,981,756 | | | | 15,031,929 | | |
Fifth Third Auto Trust | |
| 2014-1 A1 | | | 0.2000 | | | 3/16/15 | | | 1,033,356 | | | | 1,033,342 | | |
| 2014-1 A2 | | | 0.4600 | | | 8/15/16 | | | 42,380,000 | | | | 42,392,659 | | |
First Investors Auto Owner Trust | |
| 2014-1A A2† | | | 0.8000 | | | 2/15/18 | | | 4,434,996 | | | | 4,433,584 | | |
| 2014-2A A2† | | | 0.8600 | | | 8/15/18 | | | 22,500,000 | | | | 22,471,799 | | |
| 2013-3A A2† | | | 0.8900 | | | 9/15/17 | | | 4,328,288 | | | | 4,332,279 | | |
| 2014-1A A3† | | | 1.4900 | | | 1/15/20 | | | 9,500,000 | | | | 9,501,422 | | |
Ford Credit Auto Lease Trust 2013-A A3 | | | 0.6000 | | | 3/15/16 | | | 39,425,377 | | | | 39,451,409 | | |
Ford Credit Auto Trust 2013-A A3 | | | 0.5500 | | | 7/15/17 | | | 52,352,795 | | | | 52,354,894 | | |
GE Equipment Transportation LLC
2012-1 A3 | | | 0.9900 | | | 11/23/15 | | | 21,659 | | | | 21,664 | | |
Honda Auto Receivables Owner Trust | |
| 2014-1 A1 | | | 0.1900 | | | 3/23/15 | | | 5,953,275 | | | | 5,952,928 | | |
| 2014-2 A2 | | | 0.3900 | | | 9/19/16 | | | 25,376,000 | | | | 25,364,078 | | |
| 2014-1 A2 | | | 0.4100 | | | 8/22/16 | | | 42,000,000 | | | | 41,987,224 | | |
| 2014-B A2 | | | 0.4400 | | | 2/15/17 | | | 44,090,000 | | | | 44,071,923 | | |
| 2011-2 A4 | | | 1.5500 | | | 8/18/17 | | | 2,993,622 | | | | 2,994,023 | | |
Hyundai Auto Receivables Trust | |
| 2014-B A1 | | | 0.1800 | | | 5/15/15 | | | 2,687,351 | | | | 2,687,077 | | |
| 2012-C A4 | | | 0.7300 | | | 6/15/18 | | | 500,000 | | | | 500,345 | | |
Mercedes-Benz Auto Lease | |
| 2014-A A2A | | | 0.4800 | | | 6/15/16 | | | 47,197,000 | | | | 47,190,463 | | |
| 2013 A A3 | | | 0.5900 | | | 2/15/16 | | | 28,903,000 | | | | 28,917,148 | | |
28
FPA NEW INCOME, INC.
PORTFOLIO OF INVESTMENTS (Continued)
September 30, 2014
BONDS & DEBENTURES — Continued | | Coupon
Rate (%) | | Maturity
Date | | Principal
Amount | | Fair
Value | |
Nissan Auto Lease Trust | |
| 2013-A A2A | | | 0.4500 | | | 9/15/15 | | $ | 79,993 | | | $ | 80,001 | | |
| 2013-A A3 | | | 0.6100 | | | 4/15/16 | | | 64,363,000 | | | | 64,403,394 | | |
Prestige Automobile Receivables Trust | |
| 2014-1A A2† | | | 0.9700 | | | 3/15/18 | | | 14,663,673 | | | | 14,649,678 | | |
| 2012-1 B | | | 1.0900 | | | 2/15/18 | | | 3,855,000 | | | | 3,912,650 | | |
| 2013-1A A2† | | | 1.0900 | | | 2/15/18 | | | 9,870,369 | | | | 9,882,942 | | |
| 2013-1A A3 | | | 1.3300 | | | 5/15/19 | | | 4,625,000 | | | | 4,629,131 | | |
| 2014-1A A3† | | | 1.5200 | | | 4/15/20 | | | 17,250,000 | | | | 17,187,222 | | |
Porsche Financial Auto Securitization
2014-1 A2† | | | 0.3800 | | | 9/23/16 | | | 40,666,000 | | | | 40,658,700 | | |
Santander Drive Auto Receivables Trust | |
| 2014-3 A2A | | | 0.5400 | | | 8/15/17 | | | 17,167,000 | | | | 17,159,845 | | |
| 2013-3 A2 | | | 0.5500 | | | 9/15/16 | | | 4,989,297 | | | | 4,989,902 | | |
| 2013-1 A3 | | | 0.6200 | | | 6/15/17 | | | 30,909,932 | | | | 30,917,258 | | |
| 2013-5 A2A | | | 0.6400 | | | 4/17/17 | | | 15,014,465 | | | | 15,020,311 | | |
| 2014-1 A2A | | | 0.6600 | | | 7/17/17 | | | 20,177,886 | | | | 20,184,225 | | |
| 2014-4 A2A | | | 0.6700 | | | 1/16/18 | | | 43,174,000 | | | | 43,173,763 | | |
| 2013-2 A3 | | | 0.7000 | | | 9/15/17 | | | 54,591,885 | | | | 54,622,156 | | |
| 2013-3 A3 | | | 0.7000 | | | 10/16/17 | | | 6,031,000 | | | | 6,034,745 | | |
| 2014-2 A2A | | | 0.7500 | | | 8/15/17 | | | 28,700,000 | | | | 28,688,187 | | |
| 2014-1 A3 | | | 0.8700 | | | 1/16/18 | | | 19,425,000 | | | | 19,442,875 | | |
| 2013-4 A2 | | | 0.8900 | | | 9/15/16 | | | 736,512 | | | | 736,813 | | |
| 2012-4 A3 | | | 1.0400 | | | 8/15/16 | | | 706,018 | | | | 706,161 | | |
| 2013-1 B | | | 1.1600 | | | 1/15/19 | | | 3,570,000 | | | | 3,573,899 | | |
| 2012-AA B | | | 1.2100 | | | 10/16/17 | | | 17,943,000 | | | | 17,984,335 | | |
| 2012-6 B | | | 1.3300 | | | 5/15/17 | | | 21,788,000 | | | | 21,832,160 | | |
| 2013-5 B | | | 1.5500 | | | 10/15/18 | | | 17,165,000 | | | | 17,233,754 | | |
| 2014-1 B | | | 1.5900 | | | 10/15/18 | | | 5,460,000 | | | | 5,473,332 | | |
| 2012-3 B | | | 1.9400 | | | 12/15/16 | | | 3,521,290 | | | | 3,531,786 | | |
| 2013-4 B | | | 2.1600 | | | 1/15/20 | | | 4,218,000 | | | | 4,283,661 | | |
| 2012-3 D | | | 3.6400 | | | 5/15/18 | | | 32,352,000 | | | | 33,524,737 | | |
Toyota Auto Receivable Owner Trust
2014-A A3 | | | 0.6700 | | | 12/15/17 | | | 35,000,000 | | | | 34,926,119 | | |
VFC LLC | |
| 2014-2 A† | | | 2.7500 | | | 7/20/30 | | | 8,392,913 | | | | 8,393,261 | | |
| 2014-2 B† | | | 5.5000 | | | 7/20/30 | | | 6,185,000 | | | | 6,178,961 | | |
Volkswagen Auto Loan Enhanced Trust
2013-1 A2 | | | 0.3700 | | | 1/20/16 | | | 4,172,235 | | | | 4,172,652 | | |
Wheels SPV LLC | |
| 2014-1A A1† | | | 0.2400 | | | 5/20/15 | | | 8,078,727 | | | | 8,078,898 | | |
29
FPA NEW INCOME, INC.
PORTFOLIO OF INVESTMENTS (Continued)
September 30, 2014
BONDS & DEBENTURES — Continued | | Coupon
Rate (%) | | Maturity
Date | | Principal
Amount | | Fair
Value | |
| 2014-1A A2† | | | 0.8700 | | | 3/20/23 | | $ | 11,860,000 | | | $ | 11,819,801 | | |
Westlake Automobile Receivables Trust | |
| 2014-1A A2† | | | 1.2000 | | | 5/15/17 | | | 2,000,000 | | | | 1,999,009 | | |
| 2014-1A B† | | | 1.2400 | | | 11/15/19 | | | 4,500,000 | | | | 4,493,408 | | |
| 2014-1A C† | | | 2.2100 | | | 11/15/19 | | | 500,000 | | | | 499,248 | | |
TOTAL ASSET-BACKED
SECURITIES-AUTO | | | | $ | 1,578,242,411 | | |
ASSET-BACKED SECURITIES-OTHER — 8.7% | | | |
BEACON 2012-1A A† | | | 3.7200 | | | 9/20/27 | | $ | 500,690 | | | $ | 507,330 | | |
CCG Receivables Trust | |
| 2014-1 A1† | | | 0.2700 | | | 5/14/15 | | | 2,112,517 | | | | 2,112,559 | | |
| 2014-1 A2† | | | 1.4400 | | | 11/14/21 | | | 8,476,000 | | | | 8,454,155 | | |
Cabela's Master Credit Card Trust
2010-2A A1† | | | 2.2900 | | | 9/17/18 | | | 7,560,000 | | | | 7,679,586 | | |
CLI Funding LLC 2012 1A† | | | 4.2100 | | | 6/18/27 | | | 37,839,396 | | | | 37,544,249 | | |
Chesapeake Funding LLC† | | | 0.5761 | | | 3/7/26 | | | 29,025,000 | | | | 29,025,929 | | |
GE Capital Credit Card Master Note Trust
2010-1 A | | | 3.6900 | | | 3/15/18 | | | 63,545,000 | | | | 64,486,133 | | |
Global Tower Partners Acquisition Partners† | | | 4.7040 | | | 5/15/18 | | | 15,981,000 | | | | 16,139,212 | | |
HFG HEALTHCO-4 LLC 2011-1A A† | | | 2.4061 | | | 6/2/17 | | | 16,552,000 | | | | 16,806,884 | | |
HLSS Servicer Advance Receivables Back | |
| 2014-T1 AT1† | | | 1.2437 | | | 1/17/45 | | | 19,425,000 | | | | 19,444,922 | | |
| 2013-T1 A2† | | | 1.4953 | | | 1/16/46 | | | 24,512,000 | | | | 24,512,000 | | |
| 2013-T2 B2† | | | 1.4953 | | | 5/16/44 | | | 8,050,000 | | | | 8,050,000 | | |
| 2013-T1 B2† | | | 1.7436 | | | 1/16/46 | | | 5,750,000 | | | | 5,735,812 | | |
| 2013-T5 BT5† | | | 2.2761 | | | 8/15/46 | | | 9,300,000 | | | | 9,298,747 | | |
| 2012-T2 B2† | | | 2.4800 | | | 10/15/45 | | | 14,078,000 | | | | 14,163,458 | | |
Insite Issuer LLC† | | | 8.5950 | | | 8/15/20 | | | 11,613,000 | | | | 12,527,845 | | |
Kubota Credit Owner Trust 2014-1A† | | | 0.9100 | | | 2/15/17 | | | 6,269,000 | | | | 6,263,010 | | |
MMAF Equipment Finance LLC | |
| 2013-AA A2† | | | 0.6900 | | | 5/9/16 | | | 22,386,160 | | | | 22,399,540 | | |
| 2012-AA A3† | | | 0.9400 | | | 8/10/16 | | | 13,446,219 | | | | 13,467,071 | | |
Navistar Financial Dealer Note Master
2013-1 A† | | | 0.8245 | | | 1/25/18 | | | 10,000,000 | | | | 10,013,725 | | |
PFS Financing Corporation | |
| 2013-B A† | | | 0.6536 | | | 4/17/17 | | | 35,160,000 | | | | 35,169,455 | | |
| 2014-AA A† | | | 0.7536 | | | 2/15/19 | | | 26,000,000 | | | | 26,008,055 | | |
| 2012-BA B† | | | 0.8536 | | | 10/17/16 | | | 22,445,000 | | | | 22,447,990 | | |
| 2011-BA A† | | | 1.6536 | | | 10/17/16 | | | 9,010,000 | | | | 9,005,353 | | |
| 2011-BA B† | | | 2.4036 | | | 10/17/16 | | | 4,000,000 | | | | 3,995,319 | | |
30
FPA NEW INCOME, INC.
PORTFOLIO OF INVESTMENTS (Continued)
September 30, 2014
BONDS & DEBENTURES — Continued | | Coupon
Rate (%) | | Maturity
Date | | Principal
Amount | | Fair
Value | |
Panhandle-Plains Student Finance Corp
2001-1 CL A2 | | | 2.2900 | | | 12/1/31 | | $ | 5,900,000 | | | $ | 5,811,500 | | |
Progresso Receivables Funding I LLC | |
| 2014-A CL A† | | | 3.5000 | | | 7/8/19 | | | 10,139,000 | | | | 10,139,000 | | |
| 2013-A CL A† | | | 4.0000 | | | 7/9/18 | | | 14,984,000 | | | | 15,096,380 | | |
Store Master Funding LLC 2012-1A CLA† | | | 5.7700 | | | 8/20/42 | | | 485,539 | | | | 530,636 | | |
Unison Ground Lease Fund† | | | 5.7800 | | | 3/16/20 | | | 10,932,000 | | | | 11,126,530 | | |
Unison Ground Lease Fund† | | | 6.2680 | | | 3/16/20 | | | 3,768,000 | | | | 3,704,019 | | |
Unison Ground Lease Fund† | | | 9.5220 | | | 4/15/20 | | | 19,600,000 | | | | 21,878,892 | | |
WCP Issuer LLC 2013-1 CL B† | | | 6.6570 | | | 8/15/20 | | | 15,347,000 | | | | 16,418,378 | | |
TOTAL ASSET-BACKED
SECURITIES-OTHER | | | | $ | 509,963,674 | | |
U.S. TREASURY SECURITIES — 5.1% | | | |
U.S Treasury Note (Floating) | | | 0.0089 | | | 4/30/16 | | $ | 100,000,000 | | | $ | 100,050,950 | | |
U.S Treasury Note (Floating) | | | 0.0900 | | | 7/31/16 | | | 20,000,000 | | | | 20,011,144 | | |
U.S Treasury Note | | | 0.2500 | | | 10/31/14 | | | 23,000,000 | | | | 23,003,818 | | |
U.S Treasury Note | | | 0.2500 | | | 1/15/15 | | | 45,000,000 | | | | 45,027,027 | | |
U.S Treasury Note | | | 0.2500 | | | 1/31/15 | | | 15,000,000 | | | | 15,010,181 | | |
U.S Treasury Note | | | 2.1250 | | | 11/30/14 | | | 10,000,000 | | | | 10,034,131 | | |
U.S Treasury Note | | | 2.3750 | | | 10/31/14 | | | 20,000,000 | | | | 20,037,598 | | |
U.S Treasury Note | | | 2.3750 | | | 2/28/15 | | | 65,000,000 | | | | 65,623,974 | | |
TOTAL U.S. TREASURY SECURITIES | | | | $ | 298,798,823 | | |
CORPORATE BONDS & DEBENTURES — 7.8% | | | |
AIR 2 U.S.† | | | 8.0270 | | | 10/1/19 | | $ | 9,676,783 | | | $ | 10,456,974 | | |
AIR 2 U.S.† | | | 10.1270 | | | 10/1/20 | | | 38,387,816 | | | | 9,481,790 | | |
Algeco Scotsman Global Finance† | | | 8.5000 | | | 10/15/18 | | | 16,202,000 | | | | 16,728,565 | | |
Boart Longyear Management Pty Ltd† | | | 10.0000 | | | 10/1/18 | | | 21,584,000 | | | | 22,663,200 | | |
Continental Airlines Company | |
| 1997-1 1A | | | 7.4610 | | | 10/1/16 | | | 220,678 | | | | 225,919 | | |
2000-1 | | | 8.3880 | | | 11/1/20 | | | 5,597,620 | | | | 5,821,524 | | |
Delta Airlines N671US† | | | 7.5000 | | | 9/15/20 | | | 16,510,515 | | | | 16,551,792 | | |
Everest ACQ LLC / Finance | | | 6.8750 | | | 5/1/19 | | | 56,439,000 | | | | 58,837,658 | | |
HD Supply Inc. | | | 8.1250 | | | 4/15/19 | | | 41,529,000 | | | | 44,697,663 | | |
HD Supply Inc. | | | 11.0000 | | | 4/15/20 | | | 36,787,000 | | | | 41,753,245 | | |
Northwest Airlines | |
| 2000-1 G | | | 7.1500 | | | 4/1/21 | | | 16,641,146 | | | | 17,702,019 | | |
| 1999-2 B | | | 7.9500 | | | 9/1/16 | | | 2,563,265 | | | | 2,729,877 | | |
| 1999-2 C | | | 8.3040 | | | 9/1/19 | | | 8,270,380 | | | | 6,326,841 | | |
Reynolds Group Issuer LLC | | | 7.8750 | | | 8/15/19 | | | 71,081,000 | | | | 75,260,563 | | |
31
FPA NEW INCOME, INC.
PORTFOLIO OF INVESTMENTS (Continued)
September 30, 2014
BONDS & DEBENTURES — Continued | | Coupon
Rate (%) | | Maturity
Date | | Principal
Amount | | Fair
Value | |
Shell International Finance BV | | | 3.1000 | | | 6/28/15 | | $ | 21,579,000 | | | $ | 22,012,798 | | |
Thompson Creek Metals Co Inc. | | | 9.7500 | | | 12/1/17 | | | 36,635,000 | | | | 39,840,563 | | |
US Airways PT Trust | |
| 1998-1C | | | 6.8200 | | | 1/30/16 | | | 16,060,647 | | | | 15,719,359 | | |
| 1998-1B | | | 7.3500 | | | 7/30/19 | | | 6,603,952 | | | | 7,057,974 | | |
| 1999-1C | | | 7.9600 | | | 1/20/18 | | | 4,845,320 | | | | 4,857,433 | | |
Walmart Stores Inc. | | | 2.8750 | | | 4/1/15 | | | 1,875,000 | | | | 1,898,847 | | |
Zayo Group, LLC | | | 8.1250 | | | 1/1/20 | | | 30,495,000 | | | | 32,629,650 | | |
TOTAL CORPORATE BONDS &
DEBENTURES | | | | $ | 453,254,254 | | |
CORPORATE BANK DEBT — 2.4% | | | |
Kar Auction Services Term Loan B1† | | | 2.7500 | | | 9/28/17 | | $ | 14,803,368 | | | $ | 14,685,237 | | |
La Frontera Generation Term Loan B† | | | 4.5000 | | | 9/30/20 | | | 29,735,460 | | | | 29,305,485 | | |
OCI Beaumont LLC Term Loan B1† | | | 5.0000 | | | 8/20/19 | | | 17,723,524 | | | | 17,836,600 | | |
OSG International Term Loan B† | | | 4.9000 | | | 3/7/19 | | | 25,894,000 | | | | 25,902,286 | | |
Scientific Games International Term Loan B2† | | | 5.5800 | | | 8/1/21 | | | 30,286,000 | | | | 29,646,057 | | |
Toys R Us Property Term Loan B† | | | 6.0000 | | | 8/21/19 | | | 25,348,620 | | | | 24,444,688 | | |
TOTAL CORPORATE BANK DEBT | | | | $ | 141,820,353 | | |
TOTAL INVESTMENT SECURITIES — 97.7%
(Cost $5,784,442,276) | | | | $ | 5,700,213,173 | | |
SHORT-TERM INVESTMENTS — 3.5%
(Cost $201,124,358) | | | |
Exxon Mobil Corporation | | | 0.0600 | | | 10/3/14 | | $ | 50,000,000 | | | $ | 49,999,833 | | |
Exxon Mobil Corporation | | | 0.0500 | | | 10/14/14 | | | 30,000,000 | | | | 29,999,458 | | |
GE Company | | | 0.0600 | | | 10/30/14 | | | 40,000,000 | | | | 39,998,067 | | |
32
FPA NEW INCOME, INC.
PORTFOLIO OF INVESTMENTS (Continued)
September 30, 2014
SHORT-TERM INVESTMENTS — Continued | | Coupon
Rate (%) | | Maturity
Date | | Principal
Amount | | Fair
Value | |
State Street Bank Repurchase
Agreement — 0.00% 10/01/14
(Dated 09/30/14, repurchase price of
$81,127,000, collateralized by $87,235,000
principal amount U.S. Treasury Notes —
2.875% 2043, fair value $82,764,206) | | | 0.0000 | | | 10/1/14 | | $ | 81,127,000 | | | $ | 81,127,000 | | |
TOTAL SHORT-TERM INVESTMENTS | | | | $ | 201,124,358 | | |
TOTAL INVESTMENTS — 101.2%
(Cost $5,985,566,634) | | | | $ | 5,901,337,531 | | |
Other assets and liabilities, net — (1.2)% | | | | | (71,472,084 | ) | |
TOTAL NET ASSETS — 100.0% | | | | $ | 5,829,865,447 | | |
* These securities have been valued in good faith under policies adopted by authority of the Board of Directors in accordance with the Fund's fair value procedures. These securities constituted 0.1% of total net assets at September 30, 2014
† Restricted securities. These restricted securities constituted 27.60% of total net assets at September 30, 2014, most of which are considered liquid by the Adviser. These securities are not registered and may not be sold to the public. There are legal and/or contractual restrictions on resale. The Fund does not have the right to demand that such securities be registered. The values of these securities are determined by valuations provided by pricing services, brokers, dealers, market makers, or in good faith under policies adopted by authority of the Fund's Board of Directors.
33
FPA NEW INCOME, INC.
PORTFOLIO OF INVESTMENTS—RESTRICTED SECURITIES
(Continued)
September 30, 2014
Issuer | | Acquisition
Date (s) | | Cost | | Fair
Value | | Fair
Value as a %
of Net Assets | |
A10 Securitization 2013-2 A | | 10/30/2013,
7/31/2014 | | $ | 11,572,843 | | | $ | 11,584,211 | | | | 0.20 | % | |
Citigroup Commercial Mortgage
Trust 2007-FL3A B | | 1/28/2014 | | | 432,115 | | | | 439,402 | | | | 0.01 | % | |
Citigroup Commercial Mortgage
Trust 2007-FL3A C | | 1/28/2014 | | | 531,580 | | | | 543,787 | | | | 0.01 | % | |
Citigroup Commercial Mortgage
Trust 2007-FL3A D | | 1/28/2014 | | | 351,055 | | | | 359,577 | | | | 0.01 | % | |
Citigroup Commercial Mortgage
Trust 2007-FL3A E | | 1/28/2014 | | | 400,302 | | | | 409,873 | | | | 0.01 | % | |
COMM Mortgage Trust
2013-RIA4 A2 | | 11/18/2013 | | | 11,753,254 | | | | 11,753,254 | | | | 0.20 | % | |
Credit Suisse Mortgage Trust
2007-TF2A B | | 1/29/2014 | | | 386,213 | | | | 394,269 | | | | 0.01 | % | |
Credit Suisse Mortgage Trust
2007-TF2A A3 | | 1/29/2014,
1/30/2014 | | | 32,471,392 | | | | 33,324,763 | | | | 0.57 | % | |
Del Coronado Trust
2013-HDMZ CL M | | 4/1/2013,
11/13/2013 | | | 9,327,664 | | | | 9,325,047 | | | | 0.16 | % | |
Lehman Brothers Floating Rate
Commercial 2007-LLFA F | | 2/8/2013,
5/5/2014,
7/14/2014 | | | 5,924,341 | | | | 6,068,469 | | | | 0.10 | % | |
Monty Parent Issuer LLC
2013-LTR1 A | | 11/14/2013 | | | 6,859,731 | | | | 6,866,317 | | | | 0.12 | % | |
Monty Parent Issuer LLC
2013-LTR1 B | | 11/14/2013 | | | 16,704,356 | | | | 16,757,822 | | | | 0.29 | % | |
Motel 6 Trust 2012-MTL6 D | | 11/2/2012,
3/12/2013,
3/14/2013,
7/30/2014 | | | 37,754,776 | | | | 37,539,514 | | | | 0.64 | % | |
Motel 6 Trust 2012-MTL6 E | | 11/2/2012 | | | 10,060,970 | | | | 9,728,606 | | | | 0.17 | % | |
Ores NPL LLC 2014-LV3 CL A | | 3/21/2014 | | | 15,012,073 | | | | 15,013,267 | | | | 0.26 | % | |
Ores NPL LLC 2013-LV2 CL A | | 8/9/2013 | | | 16,448,315 | | | | 16,441,065 | | | | 0.28 | % | |
Ores NPL LLC 2014-LV3 CL B | | 3/21/2014 | | | 47,289,925 | | | | 47,378,039 | | | | 0.81 | % | |
Rialto Real Estate Fund LP
2014-LT6 CL A | | 9/17/2014 | | | 7,221,000 | | | | 7,174,825 | | | | 0.12 | % | |
Rialto Real Estate Fund LP
2014-LT5 CL A | | 4/25/2014 | | | 8,569,232 | | | | 8,570,654 | | | | 0.15 | % | |
Rialto Real Estate Fund LP
2014-LT6 CL B | | 9/17/2014 | | | 9,456,915 | | | | 9,532,830 | | | | 0.16 | % | |
34
FPA NEW INCOME, INC.
PORTFOLIO OF INVESTMENTS—RESTRICTED SECURITIES
(Continued)
September 30, 2014
Issuer | | Acquisition
Date (s) | | Cost | | Fair
Value | | Fair
Value as a %
of Net Assets | |
Starwood Commercial Mortgage Trust
2013-FV1 CL B | | 7/30/2013 | | $ | 18,051,000 | | | $ | 18,052,847 | | | | 0.31 | % | |
Sunset Mortgage Loan Company
2014-NPL-1 A | | 8/21/2014 | | | 54,945,555 | | | | 54,966,742 | | | | 0.94 | % | |
Bayview Opportunity Master Fund
Trust 2013-13NP CL A | | 6/10/2013 | | | 7,149,851 | | | | 7,126,006 | | | | 0.12 | % | |
Bayview Opportunity Master Fund
Trust 2014-20NP CL A | | 8/19/2014 | | | 250,000 | | | | 252,004 | | | | 0.00 | % | |
Bayview Opportunity Master Fund
Trust 2012-4NR2 CL A | | 1/17/2014 | | | 5,723,607 | | | | 5,701,984 | | | | 0.10 | % | |
Bayview Opportunity Master Fund
Trust 2013-14NP CL A | | 7/24/2013 | | | 18,078,163 | | | | 18,134,581 | | | | 0.31 | % | |
Bayview Opportunity Master Fund
Trust 2013-4RPL CL A | | 8/9/2013 | | | 1,354,997 | | | | 1,357,783 | | | | 0.02 | % | |
Credit Suisse Mortgage Trust
2013-6 1A1 | | 7/26/2013 | | | 83,604,068 | | | | 84,514,966 | | | | 1.45 | % | |
Normandy Mortgage Loan Trust
2013-NPL3 A | | 8/28/2013 | | | 33,584,415 | | | | 33,534,039 | | | | 0.58 | % | |
Riverview HECM Trust 2007-1 CL A | | 1/9/2013 | | | 31,110,599 | | | | 30,012,155 | | | | 0.51 | % | |
Stanwich Mortgage Loan Trust Series
2009-2 A | | 9/22/2011,
7/1/2013 | | | 156,454 | | | | 157,712 | | | | 0.00 | % | |
Stanwich Mortgage Loan Trust Series
2010-1 A | | 4/22/2010,
9/22/2011 | | | 255,583 | | | | 334,242 | | | | 0.01 | % | |
Stanwich Mortgage Loan Trust
Series 2010-2 A | | 5/21/2010,
9/22/2011 | | | 1,697,357 | | | | 1,677,860 | | | | 0.03 | % | |
Stanwich Mortgage Loan Trust Series
2010-3 A | | 6/2/2010,
9/22/2011 | | | 833,833 | | | | 1,034,245 | | | | 0.02 | % | |
Stanwich Mortgage Loan Trust Series
2010-4 A | | 8/4/2010,
9/22/2011 | | | 1,296,404 | | | | 1,405,967 | | | | 0.02 | % | |
Stanwich Mortgage Loan Trust Series
2011-1 A | | 5/10/2011,
9/22/2011 | | | 1,797,709 | | | | 2,212,968 | | | | 0.04 | % | |
Stanwich Mortgage Loan Trust Series
2011-2 A† | | 6/10/2011,
9/22/2011 | | | 990,233 | | | | 1,538,447 | | | | 0.03 | % | |
35
FPA NEW INCOME, INC.
PORTFOLIO OF INVESTMENTS—RESTRICTED SECURITIES
(Continued)
September 30, 2014
Issuer | | Acquisition
Date (s) | | Cost | | Fair
Value | | Fair
Value as a %
of Net Assets | |
Stanwich Mortgage Loan Trust Series
2012-NPL4 CL A | | 9/24/2012 | | $ | 3,773,416 | | | $ | 3,771,210 | | | | 0.06 | % | |
Stanwich Mortgage Loan Trust Series
2013-NPL1 CL A | | 2/15/2013,
8/21/2013 | | | 16,235,282 | | | | 16,295,875 | | | | 0.28 | % | |
Stanwich Mortgage Loan Trust Series
2013-NPL2 CL A | | 5/31/2013 | | | 34,568,990 | | | | 34,568,957 | | | | 0.59 | % | |
US Residential Opportunity Fund
Trust 2014-4A | | 3/14/2014 | | | 7,105,137 | | | | 7,128,583 | | | | 0.12 | % | |
Vericrest Opportunity Loan Transferee
2014-NPL4 A1 | | 6/20/2014 | | | 43,020,262 | | | | 42,976,875 | | | | 0.74 | % | |
Vericrest Opportunity Loan Transferee
2014-NPL3 A1 | | 3/14/2014 | | | 10,919,819 | | | | 10,965,043 | | | | 0.19 | % | |
Vericrest Opportunity Loan Transferee
2014-NPL1 A1 | | 2/20/2014 | | | 7,619,567 | | | | 7,626,557 | | | | 0.13 | % | |
Vericrest Opportunity Loan Transferee
2014-NPL2 A1 | | 2/20/2014 | | | 9,607,846 | | | | 9,631,864 | | | | 0.17 | % | |
American Credit Acceptance
Receivables 2014-1 A | | 1/7/2014 | | | 3,515,009 | | | | 3,517,486 | | | | 0.06 | % | |
American Credit Acceptance
Receivables 2014-2 A | | 4/15/2014 | | | 9,386,648 | | | | 9,377,936 | | | | 0.16 | % | |
AmeriCredit Automobile
Receivables Trust 2013-1 A2 | | 1/15/2013 | | | 1,199,820 | | | | 1,199,862 | | | | 0.02 | % | |
Credit Acceptance Auto Loan Trust
2014-2A B | | 9/18/2014 | | | 8,637,455 | | | | 8,637,732 | | | | 0.15 | % | |
Credit Acceptance Auto Loan Trust
2012-1A B | | 3/22/2012 | | | 4,499,265 | | | | 4,548,875 | | | | 0.08 | % | |
DT Auto Owner Trust 2014-1A A | | 8/28/2014 | | | 1,728,597 | | | | 1,728,589 | | | | 0.03 | % | |
DT Auto Owner Trust 2014-2A A1 | | 4/9/2014 | | | 10,587,795 | | | | 10,584,864 | | | | 0.18 | % | |
DT Auto Owner Trust 2014-1A B | | 1/14/2014 | | | 5,729,040 | | | | 5,742,484 | | | | 0.10 | % | |
DT Auto Owner Trust 2014-2A B | | 4/9/2014 | | | 8,473,053 | | | | 8,465,986 | | | | 0.15 | % | |
DT Auto Owner Trust 2012-2A B | | 9/17/2013 | | | 9,547,310 | | | | 9,595,576 | | | | 0.16 | % | |
Enterprise Fleet Financing LLC
2012-2 A2 | | 8/26/2014 | | | 5,825,453 | | | | 5,824,259 | | | | 0.10 | % | |
Enterprise Fleet Financing LLC
2014-2 A2 | | 8/26/2014 | | | 2,496,875 | | | | 2,495,720 | | | | 0.04 | % | |
Exeter Automobile Receivables Trust
2014-2A A | | 5/20/2014 | | | 8,734,240 | | | | 8,720,344 | | | | 0.15 | % | |
Exeter Automobile Receivables Trust
2014-1A A | | 1/29/2014,
5/2/2014 | | | 30,144,673 | | | | 30,202,046 | | | | 0.52 | % | |
36
FPA NEW INCOME, INC.
PORTFOLIO OF INVESTMENTS—RESTRICTED SECURITIES
(Continued)
September 30, 2014
Issuer | | Acquisition
Date (s) | | Cost | | Fair
Value | | Fair
Value as a %
of Net Assets | |
Exeter Automobile Receivables Trust
2013-2A A | | 9/11/2013 | | $ | 14,981,554 | | | $ | 15,031,929 | | | | 0.26 | % | |
First Investors Auto Owner Trust
2014-1A A2 | | 8/28/2014 | | | 4,435,343 | | | | 4,433,584 | | | | 0.08 | % | |
First Investors Auto Owner Trust
2014-2A A2 | | 8/6/2014 | | | 22,498,598 | | | | 22,471,799 | | | | 0.39 | % | |
First Investors Auto Owner Trust
2013-3A A2 | | 11/6/2013 | | | 4,327,976 | | | | 4,332,279 | | | | 0.07 | % | |
First Investors Auto Owner Trust
2014-1A A3 | | 4/3/2014 | | | 9,497,992 | | | | 9,501,422 | | | | 0.16 | % | |
Prestige Automobile Receivables
Trust 2014-1A A2 | | 3/18/2014 | | | 14,661,929 | | | | 14,649,678 | | | | 0.25 | % | |
Prestige Automobile Receivables
Trust 2013-1A A2 | | 8/27/2013,
10/10/2013 | | | 9,877,860 | | | | 9,882,942 | | | | 0.17 | % | |
Prestige Automobile Receivables
Trust 2014-1A A3 | | 3/18/2014 | | | 17,249,017 | | | | 17,187,222 | | | | 0.29 | % | |
Porsche Financial Auto
Securitization 2014-1 A2† | | 5/14/2014 | | | 40,665,313 | | | | 40,658,700 | | | | 0.70 | % | |
VFC LLC 2014-2 A | | 7/9/2014 | | | 8,392,913 | | | | 8,393,261 | | | | 0.14 | % | |
VFC LLC 2014-2 B | | 7/9/2014 | | | 6,178,828 | | | | 6,178,961 | | | | 0.11 | % | |
Wheels SPV LLC 2014-1A A1 | | 5/13/2014 | | | 8,078,726 | | | | 8,078,898 | | | | 0.14 | % | |
Wheels SPV LLC 2014-1A A2 | | 5/13/2014 | | | 11,859,245 | | | | 11,819,801 | | | | 0.20 | % | |
Westlake Automobile Receivables
Trust 2014-1A A2 | | 5/20/2014 | | | 1,999,857 | | | | 1,999,009 | | | | 0.03 | % | |
Westlake Automobile Receivables
Trust 2014-1A B | | 5/20/2014 | | | 4,499,870 | | | | 4,493,408 | | | | 0.08 | % | |
Westlake Automobile Receivables
Trust 2014-1A C | | 5/20/2014 | | | 499,931 | | | | 499,248 | | | | 0.01 | % | |
BEACON 2012-1A A | | 5/1/2014 | | | 511,016 | | | | 507,330 | | | | 0.01 | % | |
CCG Receivables Trust 2014-1 A1 | | 5/6/2014 | | | 2,112,518 | | | | 2,112,559 | | | | 0.04 | % | |
CCG Receivables Trust 2014-1 A2 | | 5/6/2014 | | | 8,475,258 | | | | 8,454,155 | | | | 0.15 | % | |
Cabela's Master Credit Card
Trust 2010-2A A1 | | 5/22/2014 | | | 7,734,825 | | | | 7,679,586 | | | | 0.13 | % | |
CLI Funding LLC 2012-1A | | 6/14/2012 | | | 37,834,708 | | | | 37,544,249 | | | | 0.64 | % | |
Chesapeake Funding LLC | | 3/4/2014 | | | 29,025,000 | | | | 29,025,929 | | | | 0.50 | % | |
Global Tower Partners
Acquisition Partners | | 4/17/2013 | | | 15,981,000 | | | | 16,139,212 | | | | 0.28 | % | |
HFG HEALTHCO-4 LLC
2011-1A A | | 5/26/2011,
9/22/2011 | | | 16,577,140 | | | | 16,806,884 | | | | 0.29 | % | |
37
FPA NEW INCOME, INC.
PORTFOLIO OF INVESTMENTS—RESTRICTED SECURITIES
(Continued)
September 30, 2014
Issuer | | Acquisition
Date (s) | | Cost | | Fair
Value | | Fair
Value as a %
of Net Assets | |
HLSS Servicer Advance Receivables
Back 2014-T1 AT1 | | 1/14/2014 | | $ | 19,424,986 | | | $ | 19,444,922 | | | | 0.33 | % | |
HLSS Servicer Advance Receivables
Back 2013-T2 B2 | | 2/14/2014 | | | 8,042,453 | | | | 8,050,000 | | | | 0.14 | % | |
HLSS Servicer Advance Receivables
Back 2013-T1 A2 | | 2/12/2014,
2/13/2014 | | | 24,541,782 | | | | 24,512,000 | | | | 0.42 | % | |
HLSS Servicer Advance Receivables
Back 2013-T1 B2 | | 2/14/2014 | | | 5,746,406 | | | | 5,735,812 | | | | 0.10 | % | |
HLSS Servicer Advance Receivables
Back 2013-T5 BT5 | | 2/12/2014 | | | 9,333,422 | | | | 9,298,747 | | | | 0.16 | % | |
HLSS Servicer Advance Receivables
Back 2012-T2 B2 | | 2/13/2014,
2/14/2014 | | | 14,266,672 | | | | 14,163,458 | | | | 0.24 | % | |
Insite Issuer LLC | | 8/19/2013 | | | 11,613,000 | | | | 12,527,845 | | | | 0.21 | % | |
Kubota Credit Owner Trust 2014-1A | | 4/15/2014 | | | 6,268,437 | | | | 6,263,010 | | | | 0.11 | % | |
MMAF Equipment Finance LLC
2013-AA A2 | | 8/7/2013,
5/1/2014 | | | 22,392,079 | | | | 22,399,540 | | | | 0.38 | % | |
MMAF Equipment Finance LLC
2012-AA A3 | | 4/28/2014 | | | 13,475,107 | | | | 13,467,071 | | | | 0.23 | % | |
Navistar Financial Dealer Note
Master 2013-1 A | | 9/16/2014 | | | 10,007,813 | | | | 10,013,725 | | | | 0.17 | % | |
PFS Financing Corporation 2013-B A 1/31/2014,
7/16/2014,
8/15/2014, | |
9/5/2014 | | | 35,181,788 | | | | 35,169,455 | | | | 0.60 | % | |
PFS Financing Corporation 2014-AA A | | 2/4/2014 | | | 26,000,000 | | | | 26,008,055 | | | | 0.45 | % | |
PFS Financing Corporation 2012-BA B 10/10/2013,
1/31/2014,
3/4/2014,
5/22/2014, | |
8/15/2014 | | | 22,486,535 | | | | 22,447,990 | | | | 0.39 | % | |
PFS Financing Corporation 2011-BA A | | 9/27/2013,
4/2/2014 | | | 9,075,544 | | | | 9,005,353 | | | | 0.15 | % | |
PFS Financing Corporation 2011-BA B | | 11/3/2011 | | | 4,000,000 | | | | 3,995,319 | | | | 0.07 | % | |
Progresso Receivables Funding I LLC
2014-A CL A | | 6/18/2014 | | | 10,139,000 | | | | 10,139,000 | | | | 0.17 | % | |
Progresso Receivables Funding I LLC
2013-A CL A | | 6/14/2013 | | | 14,984,000 | | | | 15,096,380 | | | | 0.26 | % | |
38
FPA NEW INCOME, INC.
PORTFOLIO OF INVESTMENTS—RESTRICTED SECURITIES
(Continued)
September 30, 2014
Issuer | | Acquisition
Date (s) | | Cost | | Fair
Value | | Fair
Value as a %
of Net Assets | |
Store Master Funding LLC
2012-1A CLA | | 8/31/2012 | | $ | 484,002 | | | $ | 530,636 | | | | 0.01 | % | |
Truman Capital Mortgage Loan Trust
2014-NPL3 A1 | | 9/9/2014 | | | 8,636,871 | | | | 8,612,412 | | | | 0.15 | % | |
Truman Capital Mortgage Loan Trust
2014-NPL2 A1 | | 9/9/2014 | | | 8,713,885 | | | | 8,679,027 | | | | 0.15 | % | |
Unison Ground Lease Fund | | 3/12/2013,
7/16/2013 | | | 10,782,695 | | | | 11,126,530 | | | | 0.19 | % | |
Unison Ground Lease Fund | | 3/12/2013 | | | 3,768,000 | | | | 3,704,019 | | | | 0.06 | % | |
Unison Ground Lease Fund | | 12/13/2012 | | | 24,059,000 | | | | 21,878,892 | | | | 0.38 | % | |
WCP Issuer LLC 2013-1 CL B | | 8/1/2013 | | | 15,347,000 | | | | 16,418,378 | | | | 0.28 | % | |
AIR 2 U.S. | | 7/1/2014 | | | 10,547,694 | | | | 10,456,974 | | | | 0.18 | % | |
AIR 2 U.S. | | 7/24/2014,
8/22/2014 | | | 9,184,767 | | | | 9,481,790 | | | | 0.16 | % | |
Algeco Scotsman Global Finance 9/4/2014,
9/9/2014,
9/15/2014,
9/22/2014,
9/26/2014, | |
9/29/2014 | | | 16,768,481 | | | | 16,728,565 | | | | 0.29 | % | |
Boart Longyear Management Pty Ltd | | 9/20/2013,
9/24/2014 | | | 21,609,800 | | | | 22,663,200 | | | | 0.39 | % | |
Delta Airlines N671US | | 8/16/2012 | | | 16,510,515 | | | | 16,551,792 | | | | 0.28 | % | |
Kar Auction Services Term Loan B1 | | 3/7/2014 | | | 14,803,386 | | | | 14,685,237 | | | | 0.25 | % | |
La Frontera Generation Term Loan B 5/9/2013,
5/15/2013,
5/22/2013, | |
5/23/2013 | | | 29,747,378 | | | | 29,305,485 | | | | 0.50 | % | |
OCI Beaumont LLC Term Loan B1 3/26/2014,
4/2/2014, | |
4/9/2014 | | | 17,734,935 | | | | 17,836,600 | | | | 0.31 | % | |
OSG International Term Loan B 7/7/2014,
7/8/2014,
7/25/2014,
8/15/2014, | |
9/24/2014 | | | 25,966,395 | | | | 25,902,286 | | | | 0.44 | % | |
Scientific Games International
Term Loan B2 | | 9/17/2014,
9/24/2014 | | | 30,015,795 | | | | 29,646,057 | | | | 0.51 | % | |
39
FPA NEW INCOME, INC.
PORTFOLIO OF INVESTMENTS—RESTRICTED SECURITIES
(Continued)
September 30, 2014
Issuer | | Acquisition
Date (s) | | Cost | | Fair
Value | | Fair
Value as a %
of Net Assets | |
Toys R Us Property Term Loan 7/31/2013,
10/17/2013,
12/4/2013, | |
12/18/2013 | | $ | 24,901,204 | | | $ | 24,444,688 | | | | 0.42 | % | |
TOTAL RESTRICTED SECURITIES | | | | $ | 1,607,280,676 | | | $ | 1,609,099,157 | | | | 27.60 | % | |
See notes to financial statements.
40
FPA NEW INCOME, INC.
STATEMENT OF ASSETS AND LIABILITIES
September 30, 2014
ASSETS | |
Investments at value: | |
Investment securities — at fair value
(identified cost $5,784,442,276) | | $ | 5,700,213,173 | | | | | | |
Short-term investments — at amortized cost
(maturities 60 days or less) | | | 201,124,358 | | | $ | 5,901,337,531 | | |
Cash | | | | | | | 965 | | |
Receivable for: | |
Interest | | $ | 26,046,712 | | | | | | |
Investment securities sold | | | 71,017,355 | | | | | | |
Capital Stock sold | | | 23,005,354 | | | | 120,069,421 | | |
| | | | | | | $ | 6,021,407,917 | | |
LIABILITIES | |
Payable for: | |
Investment securities purchased | | $ | 181,884,719 | | | | | | |
Capital Stock repurchased | | | 6,950,568 | | | | | | |
Advisory fees | | | 2,372,383 | | | | | | |
Accrued expenses and other liabilities | | | 334,800 | | | | 191,542,470 | | |
NET ASSETS | | | | | | $ | 5,829,865,447 | | |
SUMMARY OF SHAREHOLDERS' EQUITY | |
Capital Stock — par value $.01 per share; authorized
600,000,000 shares; outstanding 569,595,575 shares | | | | | | $ | 5,695,956 | | |
Additional Paid in Capital | | | | | | | 6,149,836,112 | | |
Accumulated net realized losses on investments | | | | | | | (259,335,608 | ) | |
Undistributed net investment income | | | | | | | 17,898,090 | | |
Unrealized depreciation of investments | | | | | | | (84,229,103 | ) | |
NET ASSETS | | | | | | $ | 5,829,865,447 | | |
NET ASSET VALUE
Offering and redemption price per share | | | | | | $ | 10.24 | | |
See notes to financial statements.
41
FPA NEW INCOME, INC.
STATEMENT OF OPERATIONS
For the Year Ended September 30, 2014
INVESTMENT INCOME | |
Interest | | | | | | $ | 171,023,947 | | |
EXPENSES | |
Advisory fees | | $ | 26,935,182 | | | | | | |
Transfer agent fees and expenses | | | 2,588,354 | | | | | | |
Custodian fees and expenses | | | 336,132 | | | | | | |
Reports to shareholders | | | 249,692 | | | | | | |
Directors' fees and expenses | | | 184,389 | | | | | | |
Registration fees | | | 182,397 | | | | | | |
Audit and tax services fees | | | 58,000 | | | | | | |
Legal fees | | | 21,519 | | | | | | |
Other expenses | | | 57,783 | | | | 30,613,448 | | |
Net investment income | | | | $ | 140,410,499 | | |
NET REALIZED AND UNREALIZED LOSS ON INVESTMENTS | |
Net realized loss on investments: | |
Proceeds from sale of investment securities (excluding
short-term investments with maturities 60 days or less) | | $ | 5,025,796,991 | | | | | | |
| Cost of investment securities sold | | | 5,076,772,616 | | | | | | |
Net realized loss on investments | | | | | | $ | (50,975,625 | ) | |
Unrealized depreciation of investments: | |
Unrealized depreciation at beginning of year | | $ | (68,012,040 | ) | | | | | |
Unrealized depreciation at end of year | | | (84,229,103 | ) | | | | | |
Change in unrealized depreciation of investments | | | | | | | (16,217,063 | ) | |
Net realized and unrealized loss on investments | | | | | | $ | (67,192,688 | ) | |
CHANGE NET ASSETS RESULTING FROM OPERATIONS | | | | | | $ | 73,217,811 | | |
See notes to financial statements.
42
FPA NEW INCOME, INC.
STATEMENT OF CHANGES IN NET ASSETS
| | | For the Year Ended
September 30, 2014 | | For the Year Ended
September 30, 2013 | |
CHANGES IN NET ASSETS | |
Operations: | |
Net investment income | | $ | 140,410,499 | | | | | | | $ | 135,765,350 | | | | | | |
Net realized loss on investments | | | (50,975,625 | ) | | | | | | | (26,486,105 | ) | | | | | |
Change in unrealized
depreciation of investments | | | (16,217,063 | ) | | | | | | | (75,600,542 | ) | | | | | |
Change in net assets resulting
from operations | | | | | | $ | 73,217,811 | | | | | | | $ | 33,678,703 | | |
Distributions to shareholders from
net investment income | | | | | | | (182,659,674 | ) | | | | | | | (149,351,776 | ) | |
Capital Stock transactions: | |
Proceeds from Capital Stock sold | | $ | 2,661,056,738 | | | | | | | $ | 2,091,317,496 | | | | | | |
Proceeds from shares issued to
shareholders upon reinvestment
of dividends and distributions | | | 147,373,658 | | | | | | | | 115,048,142 | | | | | | |
Cost of Capital Stock repurchased* | | | (1,901,690,465 | ) | | | 906,739,931 | | | | (2,149,805,799 | ) | | | 56,559,839 | | |
Total change in net assets | | | | | | $ | 797,298,068 | | | | | | | $ | (59,113,234 | ) | |
NET ASSETS | |
Beginning of year | | | | | | | 5,032,567,379 | | | | | | | | 5,091,680,613 | | |
End of year | | | | | | $ | 5,829,865,447 | | | | | | | $ | 5,032,567,379 | | |
CHANGE IN CAPITAL STOCK
OUTSTANDING | |
Shares of Capital Stock sold | | | | | | | 258,440,070 | | | | | | | | 198,339,785 | | |
Shares issued to shareholders upon
reinvestment of dividends
and distributions | | | | | | | 14,341,031 | | | | | | | | 10,913,447 | | |
Shares of Capital Stock repurchased | | | | | | | (184,676,382 | ) | | | | | | | (203,499,236 | ) | |
Change in Capital Stock outstanding | | | | | | | 88,104,719 | | | | | | | | 5,753,996 | | |
* Net of redemption fees of $780,788 and $846,642 for the years ended September 30, 2014 and 2013, respectively.
See notes to financial statements.
43
FPA NEW INCOME, INC.
FINANCIAL HIGHLIGHTS
Selected Data for Each Share of Capital Stock Outstanding Throughout Each Year
| | | For the Year Ended September 30, | |
| | | 2014 | | 2013 | | 2012 | | 2011 | | 2010 | |
Per share operating performance: | |
Net asset value at beginning of year | | $ | 10.45 | | | $ | 10.70 | | | $ | 10.84 | | | $ | 11.04 | | | $ | 11.09 | | |
Income from investment operations: | |
Net investment income | | $ | 0.30 | | | $ | 0.28 | | | $ | 0.27 | | | $ | 0.43 | | | $ | 0.36 | | |
Net realized and unrealized gain (loss)
on investment securities | | | (0.15 | ) | | | (0.21 | ) | | | (0.04 | ) | | | (0.16 | ) | | | (0.04 | ) | |
Total from investment operations | | $ | 0.15 | | | $ | 0.07 | | | $ | 0.23 | | | $ | 0.27 | | | $ | 0.32 | | |
Less dividends from net investment
income | | $ | (0.36 | ) | | $ | (0.32 | ) | | $ | (0.37 | ) | | $ | (0.47 | ) | | $ | (0.37 | ) | |
Redemption fees | | | — | * | | | — | * | | | — | * | | | — | * | | | — | * | |
Net asset value at end of year | | $ | 10.24 | | | $ | 10.45 | | | $ | 10.70 | | | $ | 10.84 | | | $ | 11.04 | | |
Total investment return** | | | 1.47 | % | | | 0.66 | % | | | 2.18 | % | | | 2.47 | % | | | 2.90 | % | |
Ratios/supplemental data: | |
Net assets at end of period (in $000's) | | $ | 5,829,865 | | | $ | 5,032,567 | | | $ | 5,091,681 | | | $ | 4,276,200 | | | $ | 4,145,399 | | |
Ratio of expenses to average net assets | | | 0.56 | % | | | 0.58 | % | | | 0.57 | % | | | 0.60 | % | | | 0.60 | % | |
Ratio of net investment income to
average net assets | | | 2.59 | % | | | 2.74 | % | | | 2.21 | % | | | 3.94 | % | | | 2.98 | % | |
Portfolio turnover rate | | | 97 | % | | | 84 | % | | | 77 | % | | | 117 | % | | | 78 | % | |
* Rounds to less than $0.01 per share.
** Return is based on net asset value per share, adjusted for reinvestment of distributions, and does not reflect deduction of the sales charge.
See notes to financial statements.
44
FPA NEW INCOME, INC.
NOTES TO FINANCIAL STATEMENTS
September 30, 2014
NOTE 1 — Significant Accounting Policies
The Fund is registered under the Investment Company Act of 1940 as a diversified, open-end, management investment company. The Fund's primary investment objective is to seek current income and long-term total return. The Fund qualifies as an investment company pursuant to Financial Accounting Standard Board (FASB) Accounting Standards Codification (ASC) No. 946, Financial Services — Investment Companies. The following is a summary of significant accounting policies consistently followed by the Fund in the preparation of its financial statements.
A. Security Valuation
The Fund's investments are reported at fair value as defined by accounting principles generally accepted in the United States of America. The Fund generally determines its net asset value as of approximately 4:00 p.m. New York time each day the New York Stock Exchange is open. Further discussion of valuation methods, inputs and classifications can be found under Note 7.
B. Securities Transactions and Related Investment Income
Securities transactions are accounted for on the date the securities are purchased or sold. Dividend income and distributions to shareholders are recorded on the ex-dividend date. Interest income and expenses are recorded on an accrual basis. Market discounts and premiums on fixed income securities are amortized over the expected life of the securities. Realized gains or losses are based on the specific identification method.
C. Use of Estimates
The preparation of financial statements in conformity with accounting principles generally accepted in the United States requires management to make estimates and assumptions that affect the amounts reported. Actual results could differ from these estimates.
NOTE 2 — Risk Considerations
Investing in the Fund may involve certain risks including, but not limited to, those described below.
Market Risk: Because the values of the Fund's investments will fluctuate with market conditions, so will the value of your investment in the Fund. You could lose money on your investment in the Fund or the Fund could underperform other investments.
Interest Rate Risk: The values of, and the income generated by, most debt securities held by the Fund may be affected by changing interest rates and by changes in the effective maturities and credit ratings of these securities. For example, the values of debt securities in the Fund's portfolio generally will decline when interest rates rise and increase when interest rates fall. In addition, falling interest rates may cause an issuer to redeem, call or refinance a security before its stated maturity, which may result in the Fund having to reinvest the proceeds in lower-yielding securities.
Mortgage-Backed and Other Asset-Backed Securities Risk: The values of some mortgage-backed and other asset-backed securities may expose the Fund to a lower rate of return upon reinvestment of principal. When interest rates rise, the value of mortgage-related securities generally will decline; however, when interest rates are declining, the value of mortgage related-securities with prepayment features may not increase as much as other fixed income securities. The rate of prepayments on underlying mortgages will affect the price and volatility of a mortgage-related security, and may shorten or extend the effective maturity of the security beyond what was anticipated at the time of purchase. If an unanticipated rate of prepayment on underlying mortgages increases the effective maturity of a mortgage-related security, the volatility of the security can be expected to increase. The
45
FPA NEW INCOME, INC.
NOTES TO FINANCIAL STATEMENTS
Continued
value of these securities may also fluctuate in response to the market's perception of the creditworthiness of the issuers. Additionally, although mortgages and mortgage-related securities are generally supported by some form of government or private guarantee and/or insurance, there is no assurance that private guarantors or insurers will meet their obligations.
Stripped Mortgage-Backed Interest Only ("I/O") and Principal Only ("P/O") Securities: Stripped mortgage-backed securities are usually structured with two classes that receive different proportions of the interest and principal distributions on a pool of mortgage assets. In certain cases, one class will receive all of the interest payments on the underlying mortgages (the I/O class), while the other class will receive all of the principal payments (the P/O class). The Fund currently has investments in I/O securities. The yield to maturity on IOs is sensitive to the rate of principal repayments (including prepayments) on the related underlying mortgage assets, and principal payments may have a material effect on yield-to-maturity. If the underlying mortgage assets experience greater than anticipated prepayments of principal, a Fund may not fully recoup its initial investment in I/Os.
Credit Risk: Debt securities are subject to credit risk, meaning that the issuer of the debt security may default or fail to make timely payments of principal or interest. The values of any of the Fund's investments may also decline in response to events affecting the issuer or its credit rating. The lower-rated debt securities in which the Fund may invest are considered speculative and are generally subject to greater volatility and risk of loss than investment grade securities, particularly in deteriorating economic conditions. The Fund invests a significant portion of its assets in securities of issuers that hold mortgage- and asset-backed securities and direct investments in securities backed by commercial and residential mortgage loans and other financial assets. The value and related income of these securities is sensitive to changes in economic conditions, including delinquencies and/or defaults. Continuing shifts in the market's perception of credit quality on securities backed by commercial and residential mortgage loans and other financial assets may result in increased volatility of market price and periods of illiquidity that can negatively impact the valuation of certain securities held by the Fund.
Repurchase Agreements: Repurchase agreements permit the Fund to maintain liquidity and earn income over periods of time as short as overnight. Repurchase agreements held by the Fund are fully collateralized by U.S. Government securities, or securities issued by U.S. Government agencies, or securities that are within the three highest credit categories assigned by established rating agencies (Aaa, Aa, or A by Moody's or AAA, AA or A by Standard & Poor's) or, if not rated by Moody's or Standard & Poor's, are of equivalent investment quality as determined by the Adviser. Such collateral is in the possession of the Fund's custodian. The collateral is evaluated daily to ensure its market value equals or exceeds the current market value of the repurchase agreements including accrued interest. In the event of default on the obligation to repurchase, the Fund has the right to liquidate the collateral and apply the proceeds in satisfaction of the obligation.
The Fund may enter into repurchase agreements, under the terms of a Master Repurchase Agreement ("MRA"). The MRA permits the Fund, under certain circumstances including an event of default (such as bankruptcy or insolvency), to offset payables and/or receivables under the MRA with collateral held and/or posted to the counterparty and create one single net payment due to or from the Fund. However, bankruptcy or insolvency laws of a particular jurisdiction may impose restrictions on or prohibitions against such a right of offset in the event of a MRA counterparty's bankruptcy or insolvency. Pursuant to the terms of the MRA, the Fund receives securities as collateral with a market value in excess of the repurchase price to be received by the Fund upon the maturity of the repurchase transaction. Upon a bankruptcy or insolvency of the MRA counterparty, the Fund recognizes a liability with respect to such excess collateral to reflect the Fund's obligation under bankruptcy law to return the excess to the counterparty. Repurchase agreements outstanding at the end of the period are listed in the Fund's Portfolio of Investments.
46
FPA NEW INCOME, INC.
NOTES TO FINANCIAL STATEMENTS
Continued
NOTE 3 — Purchases of Investment Securities
Cost of purchases of investment securities (excluding short-term investments with maturities of 60 days or less) aggregated $5,936,747,175 for the year ended September 30, 2014.
NOTE 4 — Advisory Fees and Other Affiliated Transactions
Pursuant to an Investment Advisory Agreement (the "Agreement"), advisory fees were paid by the Fund to First Pacific Advisors, LLC (the "Adviser"). Under the terms of this Agreement, the Fund pays the Adviser a monthly fee calculated at the annual rate of 0.5% of the average daily net assets of the Fund. The Agreement obligates the Adviser to reduce its fee to the extent necessary to reimburse the Fund for any annual expenses (exclusive of interest, taxes, the cost of any supplemental statistical and research information, and extraordinary expenses such as litigation) in excess of 11/2% of the first $15 million and 1% of the remaining average net assets of the Fund for the year.
For the year ended September 30, 2014, the Fund paid aggregate fees of $184,000 to all Directors who are not interested persons of the Adviser. Certain officers of the Fund are also officers of the Adviser.
NOTE 5 — Federal Income Tax
No provision for federal income tax is required because the Fund has elected to be taxed as a "regulated investment company" under the Internal Revenue Code and intends to maintain this qualification and to distribute each year to its shareholders, in accordance with the distribution requirements of the Code, all of its taxable net investment income and taxable net realized gains on investments.
Distributions paid to shareholders are based on net investment income and net realized gains determined on a tax reporting basis, which may differ from financial reporting. For federal income tax purposes, the components of distributable earnings at September 30, 2014, were as follows:
Undistributed net investment income | | $ | 30,305,239 | | |
The tax status of dividends paid during fiscal years ended September 30, 2014 and 2013 were as follows:
| | | 2014 | | 2013 | |
Dividends from ordinary income | | $ | 182,659,675 | | | $ | 149,351,776 | | |
The Fund utilizes the provisions of federal income tax laws that provide for the carryforward of capital losses for prior years, offsetting such losses against any future realized capital gains. Under the Regulated Investment Company Act of 2010 (the "Act"), net capital losses recognized for fiscal years beginning after December 22, 2010 may be carried forward indefinitely, and their character is retained as short-term and/or long-term losses. Previously, net capital losses were carried forward for eight years and treated as short-term losses. As a transition rule, the Act requires that post-enactment net capital losses be used before pre-enactment net capital losses.
As of September 30, 2014, the post enactment accumulated losses were $162,351,142, and the pre-enactment capital loss carryforwards were $31,042,499. The ability to carry these pre-enactment losses forward expires as follows: $16,390,845 in 2015; $299,496 in 2017; $3,661,716 in 2018; $10,690,442 in 2019.
The cost of investment securities at September 30, 2014 for federal income tax purposes was $5,797,345,606. Gross unrealized appreciation and depreciation for all securities at September 30, 2014 for federal income tax purposes was $16,865,229 and $113,997,662, respectively, resulting in net unrealized depreciation of $97,132,433. As of and during the year ended September 30, 2014, the Fund did not have any liability for unrecognized tax benefits. The Fund recognizes interest and penalties, if any, related to unrecognized tax benefits as income tax
47
FPA NEW INCOME, INC.
NOTES TO FINANCIAL STATEMENTS
Continued
expense in the Statement of Operations. During the year, the Fund did not incur any interest or penalties. The Fund is not subject to examination by U.S. federal tax authorities for years ended before September 30, 2011 or by state tax authorities for years ended before September 30, 2010.
During the year ended September 30, 2014, the Fund reclassified $15,181,787 of net amounts relating to market discount on securities sold, and paydowns from mortgage- and other asset-backed securities, from undistributed net investment income to accumulated net realized losses on investments to align financial reporting with tax reporting. Accumulated capital losses of $20,873,466 were reclassified to Additional Paid-in Capital because the ability to carry them forward expired.
NOTE 6 — Redemption Fees
A redemption fee of 2% applies to redemptions within 90 days of purchase for certain purchases made by persons eligible to purchase shares without an initial sales charge. For the year ended September 30, 2014, the Fund collected $780,788 in redemption fees, which amounted to less than $0.01 per share.
NOTE 7 — Disclosure of Fair Value Measurements
The Fund uses the following methods and inputs to establish the fair value of its assets and liabilities. Use of particular methods and inputs may vary over time based on availability and relevance as market and economic conditions evolve.
Equity securities are generally valued each day at the official closing price of, or the last reported sale price on, the exchange or market on which such securities principally are traded, as of the close of business on that day. If there have been no sales that day, equity securities are generally valued at the last available bid price. Securities that are unlisted and fixed-income and convertible securities listed on a national securities exchange for which the over-the-counter market more accurately reflects the securities' value in the judgment of the Fund's officers, are valued at the most recent bid price. However, most fixed income securities are generally valued at prices obtained from pricing vendors. Vendors value such securities based on one or more of the following inputs: transactions, bids, offers quotations from dealers and trading systems, spreads and other relationships observed in the markets among comparable securities, benchmarks, underlying equity of the issuer, and proprietary pricing models such as cash flows, financial or collateral performance and other reference data (includes prepayments, defaults, collateral, credit enhancements, and interest rate volatility). Short-term corporate notes with maturities of 60 days or less at time of purchase are valued at amortized cost, which approximates fair value.
Securities for which representative market quotations are not readily available or are considered unreliable by the Adviser are valued as determined in good faith under procedures adopted by authority of the Fund's Board of Directors. Various inputs may be reviewed in order to make a good faith determination of a security's value. These inputs include, but are not limited to, the type and cost of the security; contractual or legal restrictions on resale of the security; relevant financial or business developments of the issuer; actively traded similar or related securities; method of comparables to evaluate whether an asset is fairly valued in relation to similar securities; conversion or exchange rights on the security; related corporate actions; significant events occurring after the close of trading in the security; and changes in overall market conditions. Fair valuations and valuations of investments that are not actively trading involve judgment and may differ materially from valuations of investments that would have been used had greater market activity occurred.
The Fund classifies its assets based on three valuation methodologies. Level 1 investment securities are valued based on quoted market prices in active markets for identical assets. Level 2 investment securities are valued based on significant observable market inputs, such as quoted prices for similar assets and quoted prices in inactive markets or other market observable inputs as noted above including spreads, cash flows, financial performance,
48
FPA NEW INCOME, INC.
NOTES TO FINANCIAL STATEMENTS
Continued
prepayments, defaults, collateral, credit enhancements, and interest rate volatility. Level 3 investment securities are valued using significant unobservable inputs that reflect the Fund's determination of assumptions that market participants might reasonably use in valuing the assets. These assumptions consider inputs such as proprietary pricing models, cash flows, prepayments, defaults, and collateral. The valuation levels are not necessarily an indication of the risk associated with investing in those securities. The following table presents the valuation levels of the Fund's investments as of September 30, 2014:
Investments | | Level 1 | | Level 2 | | Level 3 | | Total | |
Bonds & Debentures | |
Commercial Mortgage-Backed | |
Agency Stripped | | | — | | | $ | 445,764,842 | | | | — | | | $ | 445,764,842 | | |
Non-Agency | | | — | | | | 310,471,926 | | | $ | 11,753,254 | | | | 322,225,180 | | |
Agency | | | — | | | | 101,413,980 | | | | — | | | | 101,413,980 | | |
Residential Mortgage-Backed | |
Agency Pool Fixed Rate | | | — | | | | 366,234,568 | | | | — | | | | 366,234,568 | | |
Agency Collateralized Mortgage Obligation | | | — | | | | 840,829,166 | | | | 133,850,731 | | | | 974,679,897 | | |
Non-Agency Collateralized Mortgage Obligation | | | — | | | | 345,365,724 | | | | 59,186,919 | | | | 404,552,643 | | |
Agency Stripped | | | — | | | | 101,059,970 | | | | — | | | | 101,059,970 | | |
Agency Pool Adjustable Rate Mortgages | | | — | | | | 2,202,578 | | | | — | | | | 2,202,578 | | |
Asset-Backed Securities | |
Auto | | | — | | | | 1,578,242,411 | | | | — | | | | 1,578,242,411 | | |
Other | | | — | | | | 438,844,041 | | | | 71,119,633 | | | | 509,963,674 | | |
U.S. Treasuries | | | — | | | | 298,798,823 | | | | — | | | | 298,798,823 | | |
Corporate Bonds and Debentures | | | — | | | | 418,163,954 | | | | 35,090,300 | | | | 453,254,254 | | |
Corporate Bank Debt | | | — | | | | 141,820,353 | | | | — | | | | 141,820,353 | | |
Short-Term Investments | | | — | | | | 201,124,358 | | | | — | | | | 201,124,358 | | |
Total Investments | | | — | | | $ | 5,590,336,694 | | | $ | 311,000,837 | | | $ | 5,901,337,531 | | |
The following table summarizes the Fund's Level 3 investment securities and related transactions during the year ended September 30, 2014:
| Investment | | Beginning
Value at
September 30,
2013 | | Net Realized and
Unrealized Gains
(Losses) | | Purchases | | (Sales) | | Gross
Transfers
In (Out) | | Ending
Value at
September 30,
2014 | | Net Change
in Unrealized
Appreciation
(Depreciation)
related to
Investments held
at September 30,
2014 | |
Commercial Mortgage-Backed
Non-Agency | | | — | | | | — | | | $ | 11,753,254 | | | | — | | | | — | | | $ | 11,753,254 | | | | — | | |
Residential Mortgage-Backed
Agency Collateralized
Mortage Obligation | | | — | | | $ | 20,429 | | | | 133,830,302 | | | | — | | | | — | | | | 133,850,731 | | | $ | 20,429 | | |
49
FPA NEW INCOME, INC.
NOTES TO FINANCIAL STATEMENTS
Continued
| Investment (continued) | | Beginning
Value at
September 30,
2013 | | Net Realized and
Unrealized Gains
(Losses) | | Purchases | | (Sales) | | Gross
Transfers
In (Out) | | Ending
Value at
September 30,
2014 | | Net Change
in Unrealized
Appreciation
(Depreciation)
related to
Investments held
at September 30,
2014 | |
Residential Mortgage-Backed
Non-Agency Collateralized
Mortgage Obligation | | $ | 10,657,536 | | | $ | 2,368,275 | | | $ | 17,350,756 | | | $ | (4,723,687 | ) | | $ | 33,534,039 | | | $ | 59,186,919 | | | $ | 42,833 | | |
Asset-Backed
Securities-Other | | | — | | | | — | | | | 10,139,000 | | | | — | | | | 60,980,633 | | | | 71,119,633 | | | | 3,154,458 | | |
Corporate Bonds and Debentures | | | — | | | | 297,023 | | | | 9,184,767 | | | | — | | | | 25,608,510 | | | | 35,090,300 | | | | (1,838,393 | ) | |
| | $ | 10,657,536 | | | $ | 2,685,727 | | | $ | 182,258,079 | | | $ | (4,723,687 | ) | | $ | 120,123,182 | | | $ | 311,000,837 | | | $ | 1,379,327 | | |
Level 3 Valuation Process: Investments classified within Level 3 of the fair value hierarchy are valued by the Adviser in good faith under procedures adopted by authority of the Fund's Board of Directors. The Adviser employs various methods to determine fair valuations including regular review of key inputs and assumptions, and review of related market activity, if any. However, there are generally no observable trade activities in these securities. The Adviser reports to the Board of Directors at their regularly scheduled quarterly meetings, or more often if warranted. The report includes a summary of the results of the process, the key inputs and assumptions noted, and any changes to the inputs and assumptions used. When appropriate, the Adviser will recommend changes to the procedures and process employed. The value determined for an investment using the fair value procedures may differ significantly from the value realized upon the sale of such investment.
Transfers of investments between different levels of the fair value hierarchy are recorded at market value as of the end of the reporting period. There were no transfers between Level 1 and 2. There were transfers of $120,123,182 into Level 3 during the year ended September 30, 2014. The transfers in are largely a result of a change in the number of brokers providing daily quotes and a change in the availability of observable inputs.
The following table summarizes the quantitative inputs and assumptions used for items categorized as items categorized as Level 3 of the fair value hierarchy as of September 30, 2014:
| Financial Assets | | Fair Value at
September 30, 2014 | | Valuation
Technique(s) | | Unobservable
Inputs | | Price/Range | |
Commercial
Mortgage-Backed
Non-Agency | | $ | 11,753,254
| | | Third-Party Broker Quote*
| | Quotes/Prices
| | $ | 97.14
| | |
Residential
Mortgage-Backed
Agency
Collateralized
Mortgage Obligation | | $ | 133,850,731
| | | Third-Party Broker Quote*
| | Quotes/Prices
| | $ | 102.375
| | |
Residential
Mortgage-Backed
Non-Agency
Collateralized | | $ | 8,361,441
| | | Pricing Model**
| | Prices
Discount
| | $ | 44.72-$53.52
5.7%-17.0% (7.9%)
| ($50.36) | |
Mortgage Obligation | | $ | 50,825,478 | | | Third-Party Broker Quote* | | Quotes/Prices | | $ | 99.50-$99.85 | (99.65) | |
50
FPA NEW INCOME, INC.
NOTES TO FINANCIAL STATEMENTS
Continued
Financial Assets | | Fair Value at
September 30, 2014 | | Valuation
Technique(s) | | Unobservable
Inputs | | Price/Range | |
Asset-Backed
Securities-Other | | $ | 71,119,633
| | | Third-Party Broker Quote*
| | Quotes/Prices
| | $ | 98.50-$107.88
| (102.65) | |
Corporate Bonds
and Debentures | | $ | 35,090,300
| | | Third-Party Broker Quote*
| | Quotes/Prices
| | $ | 24.70-$106.50
| (76.99) | |
* The Third-Party Broker Quote technique involves obtaining an independent third-party broker quote for the security.
** The Pricing Model technique for Level 3 securities involves preparing a proprietary broker price opinion (BPO) model using valuation information provided by the loan servicer based on local market resources and sales trends published by the National Association of Realtors, and a broker, and then applying an appropriate discount to that valuation. The discount reflects market conditions such as lack of liquidity of the investment, the costs associated with foreclosure and liquidation, the historical performance of the loan pool and the characteristics of the remaining loans including whether or not the loans are performing.
NOTE 8 — Distribution to Shareholders
On September 30, 2014, the Board of Directors declared a dividend from net investment income of $0.05 per share payable October 2, 2014 to shareholders of record on September 30, 2014. For financial statement purposes, this dividend was recorded on the ex-dividend date, October 1, 2014.
NOTE 9 — Collateral Requirements
The Fund has implemented the disclosure requirements pursuant to FASB Accounting Standards Update No. 2011-11, Disclosures about Offsetting Assets and Liabilities, that requires disclosures to make financial statements that are prepared under U.S. GAAP more comparable to those prepared under International Financial Reporting Standards. Under this guidance the Fund discloses both gross and net information about instruments and transactions eligible for offset such as instruments and transactions subject to an agreement similar to a master netting arrangement. In addition, the Fund discloses collateral received and posted in connection with master netting agreements or similar arrangements.
The following table presents the Fund's repurchase agreements by counterparty net of amounts available for offset under an ISDA Master agreement or similar agreements and net of the related collateral received or pledged by the Fund as of September 30, 2014, are as follows:
| Counterparty | | Gross Assets
in the Statement of
Assets and Liabilities | | Collateral
Received | | Assets (Liabilities)
Available for Offset | | Net Amount
of Assets* | |
State Street Bank
and Trust Company | | $ | 81,127,000 | | | $ | 81,127,000 | ** | | | — | | | | — | | |
* Represents the net amount receivable from the counterparty in the event of default.
** Collateral with a value of $82,764,206 has been received in connection with a master repurchase agreement. Excess of collateral received from the individual master repurchase agreement is not shown for financial reporting purposes.
51
FPA NEW INCOME, INC.
REPORT OF INDEPENDENT REGISTERED
PUBLIC ACCOUNTING FIRM
TO THE SHAREHOLDERS AND
BOARD OF DIRECTORS OF FPA NEW INCOME, INC.
We have audited the accompanying statement of assets and liabilities of FPA New Income, Inc. (the "Fund"), including the portfolio of investments, as of September 30, 2014, the related statement of operations for the year then ended, the statements of changes in net assets for each of the two years in the period then ended, and the financial highlights for each of the five years in the period then ended. These financial statements and financial highlights are the responsibility of the Fund's management. Our responsibility is to express an opinion on these financial statements and financial highlights based on our audits.
We conducted our audits in accordance with the standards of the Public Company Accounting Oversight Board (United States). Those standards require that we plan and perform the audit to obtain reasonable assurance about whether the financial statements and financial highlights are free of material misstatement. The Fund is not required to have, nor were we engaged to perform, an audit of its internal control over financial reporting. Our audits included consideration of internal control over financial reporting as a basis for designing audit procedures that are appropriate in the circumstances, but not for the purpose of expressing an opinion on the effectiveness of the Fund's internal control over financial reporting. Accordingly, we express no such opinion. An audit also includes examining, on a test basis, evidence supporting the amounts and disclosures in the financial statements, assessing the accounting principles used and significant estimates made by management, as well as evaluating the overall financial statement presentation. Our procedures included confirmation of securities owned as of September 30, 2014, by correspondence with the custodian and brokers, where replies were not received from brokers, we performed other auditing procedures. We believe that our audits provide a reasonable basis for our opinion.
In our opinion, such financial statements and financial highlights referred to above present fairly, in all material respects, the financial position of FPA New Income, Inc. as of September 30, 2014, the results of its operations for the year then ended, the changes in its net assets for each of the two years in the period then ended, and the financial highlights for each of the five years in the period then ended, in conformity with accounting principles generally accepted in the United States of America.
Los Angeles, California
November 18, 2014
52
FPA NEW INCOME, INC.
APPROVAL OF INVESTMENT ADVISORY AGREEMENT
(Unaudited)
Approval of the Advisory Agreement. At a meeting of the Board of Directors held on August 11, 2014, the Directors approved the continuation of the advisory agreement between the Fund and the Adviser for an additional one-year period through September 30, 2015, on the recommendation of the Independent Directors, who met in executive session on August 11, 2014 prior to the Board meeting to review and discuss the proposed continuation of the advisory agreement. The following paragraphs summarize the material information and factors considered by the Board and the Independent Directors, as well as the Directors' conclusions relative to such factors.
Nature, Extent and Quality of Services. The Board and the Independent Directors considered information provided by the Adviser in response to their requests, as well as information provided throughout the year regarding the Adviser and its staffing in connection with the Fund, including the Fund's portfolio manager, the senior analysts supporting team, the scope of accounting, administrative, shareholder and other services supervised and provided by the Adviser, and the absence of any significant service problems reported to the Board. The Board and the Independent Directors noted the experience, length of service and the outstanding reputation of the Fund's portfolio managers: Tom Atteberry, who has been with the Adviser since 1997, Robert Rodriguez, who serves in an advisory capacity since 2010, Julian W. H. Mann, who joined the Adviser in 2004, Abhijeet V. Patwardhan, who joined the Adviser in 2010, Melinda J. Newman, who joined the Adviser in 2013, Nazanin Pajoom, who joined the Adviser in 2013, and Joe Choi, who joined the Adviser in 2014. The Board and the Independent Directors concluded that the nature, extent and quality of services provided by the Adviser have benefited and should continue to benefit the Fund and its shareholders.
Investment Performance. The Board and the Independent Directors reviewed the overall investment performance of the Fund. The Directors also received information from an independent consultant, Lipper, regarding the Fund's performance relative to a peer group of alternative credit focus funds selected by Lipper (the "Peer Group"). The Board and the Independent Directors considered the Adviser's representation that the Fund's investment style, as evidenced by the short-term duration of most of its portfolio securities, as well as the Fund's flexibility to invest in a variety of areas, complicated Peer Group comparisons in that the Fund is managed in a more conservative style than the typical fixed income fund and the funds in the Peer Group. The Board and the Independent Directors noted the Fund's absolute investment results and its long-term investment performance when compared to the Peer Group. They also noted that Morningstar gave the Fund a "Silver" Analyst Rating. The Board and the Independent Directors determined that the Fund's investment results were satisfactory in light of the Fund's objectives and concluded that the Adviser's continued management of the Fund should benefit the Fund and its shareholders.
Advisory Fees and Fund Expenses; Comparison with Peer Group and Institutional Fees. The Board and the Independent Directors considered information provided by the Adviser regarding the Fund's advisory fees and total expense levels. The Board and the Independent Directors reviewed comparative information regarding fees and expenses for the Peer Group. The Board and the Independent Directors noted that the Fund's advisory fee and its overall expense ratio each was at the low end of the Peer Group. The Directors also noted that many funds in the universe charge fees for outside administration and similar services in addition to the advisory fee and considered that the Adviser did not charge additional fees to the Fund for such services. In addition, the Directors noted that the fee rate charged to the Fund is higher than institutional accounts managed in a similar style by the portfolio manager but considered the Adviser's discussion of the differences between the services provided by the Adviser to the Fund and those provided by the Adviser to the institutional accounts. The Board and the Independent Directors concluded that the continued payment of advisory fees and expenses by the Fund to the Adviser was fair and reasonable and should continue to benefit the Fund and its shareholders.
53
FPA NEW INCOME, INC.
APPROVAL OF INVESTMENT ADVISORY AGREEMENT (Continued)
(Unaudited)
Adviser Profitability and Costs. The Board and the Independent Directors considered information provided by the Adviser regarding the Adviser's costs in providing services to the Fund, the profitability of the Adviser and the benefits to the Adviser from its relationship to the Fund. They reviewed and considered the Adviser's representations regarding its assumptions and methods of allocating certain costs, such as personnel costs, which constitute the Adviser's largest operating cost, with respect to the provision of investment advisory and financial services. Although the Board was not provided with information relating to individuals' compensation levels or amounts, the Independent Directors discussed with the Adviser the process through which individuals' compensation is determined and then reviewed by the management committee of the Adviser, as well as the Adviser's methods for determining that the compensation levels are at appropriate levels to attract and retain the personnel necessary to provide high quality professional investment advice. In evaluating the Adviser's profitability, they considered a portion of the compensation of the Adviser's principals that could be deemed a form of profit, and they excluded certain distribution and marketing-related expenses. The Board and the Independent Directors recognized that the Adviser is entitled under the law to earn a reasonable level of profits for the services that it provides to the Fund. The Board and the Independent Directors concluded that the Adviser's level of profitability from its relationship with the Fund did not indicate that the Adviser's compensation was unreasonable or excessive.
Economies of Scale and Sharing of Economies of Scale. The Board and the Independent Directors considered whether there have been economies of scale with respect to the management of the Fund, whether the Fund has appropriately benefited from any economies of scale, and whether the fee rate is reasonable in relation to the Fund's asset levels and any economies of scale that may exist. The Board and the Independent Directors considered the Adviser's representation that its internal costs of providing investment management services to the Fund have increased significantly in recent years as a result of a number of factors, including the Adviser's substantial investment in additional professional resources and staffing. The Board and the Independent Directors considered quantitative and qualitative information regarding the Adviser's representation that it has also made significant investments in the five analysts, traders and other investment personnel who assist with the management of the Fund, in new compliance, operations, and administrative personnel, in information technology and portfolio accounting and trading systems, and in office space, each of which enhances the quality of services provided to the Fund. The Board and the Independent Directors also considered the Adviser's willingness to close funds to new investors when it believed that a fund may have limited capacity to grow or that it otherwise would benefit fund shareholders.
The Board and the Independent Directors recognized that the advisory fee rate schedule for the Fund does not have breakpoints. They considered that many mutual funds have breakpoints in the advisory fee structure as a means by which to share in the benefits of potential economies of scale as a fund's assets grow. They also considered that not all funds have breakpoints in their fee structures and that breakpoints are not the exclusive means of sharing potential economies of scale. The Board and the Independent Directors considered the Adviser's statement that it believes that breakpoints currently remain inappropriate for the Fund given the ongoing investments the Adviser is making in its business for the benefit of the Fund, uncertainties regarding the direction of the economy, rising inflation, increasing costs for personnel and systems, and growth or contraction in the Fund's assets, all of which could negatively impact the Adviser. The Board and the Independent Directors concluded that the Fund is benefitting from the ongoing investments made by the Adviser in its team of personnel serving the Fund and in its service infrastructure, and that in light of these investments, the addition of breakpoints in the Fund's advisory fee structure was not warranted at current asset levels.
54
FPA NEW INCOME, INC.
APPROVAL OF INVESTMENT ADVISORY AGREEMENT (Continued)
(Unaudited)
Ancillary Benefits. The Board and the Independent Directors considered other actual and potential benefits to the Adviser from managing the Fund, including the acquisition and use of research services with commissions generated by the Fund, in concluding that the contractual advisory and other fees are fair and reasonable for the Fund. They noted that the Adviser does not have any affiliates that benefit from the Adviser's relationship to the Fund.
Conclusions. The Board and the Independent Directors determined that the Fund continues to benefit from the services of a highly experienced portfolio management team, which has produced satisfactory long-term returns. In addition, the Board and the Independent Directors agreed that the Fund continues to receive high quality accounting, administrative, shareholder and other ancillary services from the Adviser. The Board and the Independent Directors concluded that the current advisory fee rate is reasonable and fair to the Fund and its shareholders in light of the nature and quality of the services provided by the Adviser and the Adviser's profitability and costs. The Board and the Independent Directors also stated their intention to continue monitoring the factors relevant to the Adviser's compensation, such as changes in the Fund's asset levels, changes in portfolio management personnel and the cost and quality of the services provided by the Adviser to the Fund. On the basis of the foregoing, and without assigning particular weight to any single factor, none of which was dispositive, the Board and the Independent Directors concluded that it would be in the best interests of the Fund to continue to be advised and managed by the Adviser and determined to approve the continuation of the current Advisory Agreement for another one-year period through September 30, 2015.
55
FPA NEW INCOME, INC.
SHAREHOLDER EXPENSE EXAMPLE
September 30, 2014
(Unaudited)
Fund Expenses
As a shareholder of the Fund, you incur two types of costs: (1) transaction costs, and (2) ongoing costs, including advisory and administrative fees; shareholder service fees; and other Fund expenses. The Example is intended to help you understand your ongoing costs (in dollars) of investing in the Fund and to compare these costs with the ongoing costs of investing in other mutual funds. The Example is based on an investment of $1,000 invested at the beginning of the year and held for the entire year.
Actual Expenses
The information in the table under the heading "Actual Performance" provides information about actual account values and actual expenses. You may use the information in this column, together with the amount you invested, to estimate the expenses that you paid over the period. Simply divide your account value by $1,000 (for example, an $8,600 account value divided by $1,000= 8.6), then multiply the result by the number in the first column in the row entitled "Expenses Paid During Period" to estimate the expenses you paid on your account during this period.
Hypothetical Example for Comparison Purposes
The information in the table under the heading "Hypothetical Performance (5% return before expenses)" provides information about hypothetical account values and hypothetical expenses based on the Fund's actual expense ratio and an assumed rate of return of 5% per year before expenses, which is not the Fund's actual return. The hypothetical account values and expenses may not be used to estimate the
actual ending account balance or expenses you paid for the period. You may use this information to compare the ongoing costs of investing in the Fund and other funds. To do so, compare this 5% hypothetical example with the 5% hypothetical examples that appear in the shareholder reports of other funds.
Please note that the expenses shown in the table are meant to highlight your ongoing costs only and do not reflect any transactional costs. Therefore, the information under the heading "Hypothetical Performance (5% return before expenses)" is useful in comparing ongoing costs only, and will not help you determine the relative total costs of owning different funds. In addition, if these transactional costs were included, your costs would have been higher.
| | | Actual
Performance | | Hypothetical
Performance
(5% return
before
expenses) | |
Beginning Account Value
March 31, 2014 | | $ | 1,000.00 | | | $ | 1,000.00 | | |
Ending Account Value
September 30, 2014 | | $ | 1,014.70 | | | $ | 1,022.16 | | |
Expenses Paid During
Period* | | $ | 2.83 | | | $ | 2.84 | | |
* Expenses are equal to the Fund's annualized expense ratio of 0.56%, multiplied by the average account value over the period and prorated for the six-months ended September 30, 2014 (183/365 days).
56
FPA NEW INCOME, INC.
DIRECTOR AND OFFICER INFORMATION
| Name, Age & Address | | Position(s)
With Fund/
Years Served | | Principal Occupation(s)
During the Past 5 Years | | Portfolios in
Fund Complex
Overseen | | Other Directorships | |
Allan M. Rudnick – (73)* | | Director and Chairman†
Years Served: 2 | | Private Investor. Co-Founder, formerly
Chief Executive Officer, Chairman and
Chief Investment Officer of Kayne Anderson Rudnick Investment Management from 1989 to 2007 | | | 7 | | | | |
Thomas P. Merrick – (77)* | | Director†
Years Served: 6 | | Private Consultant. President of Strategic Planning Consultants for more than the past five years. Former Executive Committee Member and Vice President of Fluor Corporation, responsible for strategic planning, from 1984 to 1998. | | | 7 | | | | |
Alfred E. Osborne, Jr. – (69)* | | Director†
Years Served: 15 | | Senior Associate Dean of the John E. Anderson School of Management at UCLA. | | | 7 | | | Wedbush, Inc., Nuverra Environmental Solutions, Inc., and Kaiser Aluminum Inc. | |
A. Robert Pisano – (71)* | | Director†
Years Served: 2 | | Retired. Formerly President and Chief Operating Officer of the Motion Picture Association of America, Inc. from 2005 to 2011. | | | 7 | | | Entertainment Partners, Resources Global Professionals and The Motion Picture and Television Fund | |
Patrick B. Purcell – (71)* | | Director†
Years Served: 8 | | Retired. Formerly Executive Vice President, Chief Financial Officer and Chief Administrative Officer of Paramount Pictures from 1983 to 1998. | | | 7 | | | The Motion Picture and Television Fund | |
Robert L. Rodriguez – (65) | | Director†
Portfolio Manager
Years Served: 30 | | Managing Partner of the Adviser. | | | 2 | | | | |
Thomas H. Atteberry – (61) | | Chief Executive Officer & Portfolio Manager
Years Served: 9 | | Partner of the Adviser. | | | | | |
J. Richard Atwood – (54) | | Treasurer
Years Served: 17 | | Managing Partner of the Adviser. | | | | | |
Leora R. Weiner – (43) | | Chief Compliance Officer
Years Served: <1 | | Managing Director, General Counsel and Chief Compliance Officer of the Adviser since 2014. Formerly Managing Director, General Counsel and Chief Compliance Officer of Tradewinds Global Investors, LLC from 2008-2014. | | | | | |
Sherry Sasaki – (59) | | Secretary
Years Served: 31 | | Assistant Vice President and Secretary of the Adviser. | | | | | |
57
FPA NEW INCOME, INC.
DIRECTOR AND OFFICER INFORMATION
Continued
| Name, Age & Address | | Position(s)
With Fund/
Years Served | | Principal Occupation(s)
During the Past 5 Years | | Portfolios in
Fund Complex
Overseen | | Other Directorships | |
E. Lake Setzler – (47) | | Assistant Treasurer
Years Served: 8 | | Senior Vice President and Controller of the Adviser. | | | | | |
Michael P. Gomez – (29) | | Assistant Vice President
Years Served: 2 | | Assistant Vice President of the Adviser since 2010. Formerly In-Charge Associate of PricewaterhouseCoopers from 2007 to 2010. | | | | | |
† Directors serve until their resignation, removal or retirement.
* Audit Committee member
Additional information on the Directors is available in the Statement of Additional Information. Each of the above listed individuals can be contacted at 11601 Wilshire Blvd., Suite 1200, Los Angeles, CA 90025.
58
INVESTMENT ADVISER
First Pacific Advisors, LLC
11601 Wilshire Boulevard, Suite 1200
Los Angeles, California 90025
DISTRIBUTOR
UMB Distribution Services, LLC
235 West Galena Street
Milwaukee, Wisconsin 53212
LEGAL COUNSEL
K&L Gates LLP
San Francisco, California
TICKER: FPNIX
CUSIP: 302544101
INDEPENDENT REGISTERED PUBLIC ACCOUNTING FIRM
Deloitte & Touche LLP
Los Angeles, California
CUSTODIAN
State Street Bank and Trust Company
Boston, Massachusetts
TRANSFER & SHAREHOLDER SERVICE AGENT
UMB Fund Services, Inc.
P.O. Box 2175
Milwaukee, WI 53201-2175
235 West Galena Street
Milwaukee, WI 53212
(800) 638-3060
This report has been prepared for the information of shareholders of FPA New Income, Inc., and is not authorized for distribution to prospective investors unless preceded or accompanied by a prospectus.
The Fund's complete proxy voting record for the 12 months ended June 30, 2014 is available without charge, upon request, by calling (800) 982-4372 and on the SEC's website at www.sec.gov.
The Fund's schedule of portfolio holdings, filed the first and third quarter of the Fund's fiscal year on Form N-Q with the SEC, is available on the SEC's website at www.sec.gov. Form N-Q is available at the SEC's Public Reference Room in Washington, D.C., and information on the operations of the Public Reference Room may be obtained by calling (202) 551-8090. To obtain information on Form N-Q from the Fund, shareholders can call (800) 982-4372.
Additional information about the Fund is available online at www.fpafunds.com. This information includes, among other items, holdings, top sectors and performance, and is updated on or about the 15th business day after the end of each quarter.
Item 2. | Code of Ethics. |
| |
| (a) | The registrant has adopted a code of ethics that applies to the registrant’s principal executive and financial officers. |
| | |
| (b) | Not Applicable |
| | |
| (c) | During the period covered by this report, there were not any amendments to the provisions of the code of ethics adopted in 2(a) above. |
| | |
| (d) | During the period covered by this report, there were not any implicit or explicit waivers to the provisions of the code of ethics adopted in 2(a). |
| | |
| (e) | Not Applicable |
| | |
| (f) | A copy of the registrant’s code of ethics is filed as an exhibit to this Form N-CSR. Upon request, any person may obtain a copy of this code of ethics, without charge, by calling (800) 982-4372. |
| |
Item 3. | Audit Committee Financial Expert. |
| |
| The registrant’s board of directors has determined that Patrick B. Purcell, a member of the registrant’s audit committee and board of directors, is an “audit committee financial expert” and is “independent,” as those terms are defined in this Item. This designation will not increase the designee’s duties, obligations or liability as compared to his duties, obligations and liability as a member of the audit committee and of the board of directors. This designation does not affect the duties, obligations or liability of any other member of the audit committee or the board of directors. |
| |
Item 4. | Principal Accountant Fees and Services. |
| |
| | | | 2013 | | 2014 | |
| (a) | Audit Fees | | $ | 50,000 | | $ | 52,000 | |
| (b) | Audit Related Fees | | -0- | | -0- | |
| (c) | Tax Fees | | $ | 8,000 | | $ | 8,400 | |
| (d) | All Other Fees | | -0- | | -0- | |
| | |
| (e)(1) | Disclose the audit committee’s pre-approval policies and procedures described in paragraph (c)(7) of Rule 2-01 of Regulation S-X. The audit committee shall pre-approve all audit and permissible non-audit services that the committee considers compatible with maintaining the independent auditors’ independence. The pre-approval requirement will extend to all non-audit services provided to the registrant, the adviser, and any entity controlling, controlled by, or under common control with the adviser that provides ongoing services to the registrant, if the |
| | | | | | | | | | |
| | engagement relates directly to the operations and financial reporting of the registrant; provided, however, that an engagement of the registrant’s independent auditors to perform attest services for the registrant, the adviser or its affiliates required by generally accepted auditing standards to complete the examination of the registrant’s financial statements (such as an examination conducted in accordance with Statement on Standards for Attestation Engagements Number 16, or a successor statement, issued by the American Institute of Certified Public Accountants), will be deem pre-approved if: (i) the registrant’s independent auditors inform the audit committee of the engagement, (ii) the registrant’s independent auditors advise the audit committee at least annually that the performance of this engagement will not impair the independent auditor’s independence with respect to the registrant, and (iii) the audit committee receives a copy of the independent auditor’s report prepared in connection with such services. The committee may delegate to one or more committee members the authority to review and pre-approve audit and permissible non-audit services. Actions taken under any such delegation will be reported to the full committee at its next meeting. |
| | |
| (e)(2) | Disclose the percentage of services described in each of paragraphs (b) – (d) of this Item that were approved by the audit committee pursuant to paragraph (c)(7)(i)(C) of Rule 2-01 of Regulation S-X. 100% of the services provided to the registrant described in paragraphs (b) – (d) of this Item were pre-approved by the audit committee pursuant to paragraph (e)(1) of this Item. There were no services provided to the investment adviser or any entity controlling, controlled by or under common control with the adviser described in paragraphs (b) – (d) of this Item that were required to be pre-approved by the audit committee. |
| | |
| (f) | If greater than 50%, disclose the percentage of hours expended on the principal accountant’s engagement to audit the registrant’s financial statements for the most recent fiscal year that were attributed to work performed by persons other than the principal accountant’s full-time, permanent employees. All services performed on the engagement to audit the registrant’s financial statements for the most recent fiscal year end were performed by the principal accountant’s full-time, permanent employees. |
| | |
| (g) | Disclose the aggregate non-audit fees billed by the registrant’s accountant for services rendered to the registrant, and rendered to the registrant’s investment adviser (not including any sub-adviser whose role is primarily portfolio management and is subcontracted with or overseen by another investment adviser), and any entity controlling, controlled by, or under common control with the adviser that provides ongoing services to the registrant for each of the last two fiscal years of the registrant. None. |
| (h) | Disclose whether the registrant’s audit committee of the board of directors has considered whether the provision of non-audit services that were rendered to the registrant’s investment adviser (not including any sub-adviser whose role is primarily portfolio management and is subcontracted with or overseen by another investment adviser), and any entity controlling, controlled by, or under common control with the investment adviser that provides ongoing services to the registrant that were not pre-approved pursuant to paragraph (c)(7)(ii) of Rule 2-01 of Regulation S-X is compatible with maintaining the principal accountant’s independence. Not Applicable. |
| |
Item 5. | Audit Committee of Listed Registrants. Not Applicable. |
| |
Item 6. | Schedule of Investments. The schedule of investments is included as part of the report to stockholders filed under Item 1 of this Form. |
| |
Item 7. | Disclosure of Proxy Voting Policies and Procedures for Closed-End Management Investment Companies. Not Applicable. |
| |
Item 8. | Portfolio Managers of Closed-End Management Investment Companies. Not Applicable. |
| |
Item 9. | Purchases of Equity Securities by Closed-End Management Investment Company and Affiliated Purchasers. Not Applicable. |
| |
Item 10. | Submission of Matters to a Vote of Security Holders. There has been no material change to the procedures by which shareholders may recommend nominees to the registrant’s board of directors. |
| |
Item 11. | Controls and Procedures. |
| | |
| (a) | The principal executive officer and principal financial officer of the registrant have concluded that the registrant’s disclosure controls and procedures (as defined in Rule 30a-3(c) under the Investment Company Act of 1940) are effective based on their evaluation of the disclosure controls and procedures as of a date within 90 days of the filing date of this report. |
| | |
| (b) | There have been no significant changes in the registrant’s internal controls over financial reporting (as defined in Rule 30a-3(d) under the Investment Company Act of 1940) that occurred during the second fiscal quarter of the period covered by this report that have materially affected, or is reasonably likely to materially affect, the registrant’s internal controls over financial reporting. |
Item 12. | Exhibits. |
| | |
| (a)(1) | Code of ethics as applies to the registrant’s officers and directors, as required to be disclosed under Item 2 of Form N-CSR. Attached hereto as Ex.99.CODE.ETH. |
| | |
| (a)(2) | Separate certification for the registrant’s principal executive officer and principal financial officer, as required by Rule 30a-2(a) under the Investment Company Act of 1940. Attached hereto. |
| | |
| (a)(3) | Not Applicable |
| | |
| (b) | Separate certification for the registrant’s principal executive officer and principal financial officer, as required by Rule 30a-2(b) under the Investment Company Act of 1940. Attached hereto. |
SIGNATURES
Pursuant to the requirements of the Securities Exchange Act of 1934 and the Investment Company Act of 1940, the registrant has duly caused this report to be signed on its behalf by the undersigned, thereunto duly authorized.
FPA NEW INCOME, INC.
By: | /s/ J. Richard Atwood | |
J. Richard Atwood, Treasurer |
(Principal Executive Officer) |
Date: November 21, 2014
Pursuant to the requirements of the Securities Exchange Act of 1934 and the Investment Company Act of 1940, this report has been signed below by the following persons on behalf of the registrant and in the capacities and on the dates indicated.
FPA NEW INCOME, INC.
By: | /s/ J. Richard Atwood | |
J. Richard Atwood, Treasurer |
(Principal Executive Officer) |
Date: November 21, 2014
By: | /s/ E. Lake Setzler III | |
E. Lake Setzler III, Assistant Treasurer |
(Principal Financial Officer) |
Date: November 21, 2014