UNITED STATES
SECURITIES AND EXCHANGE COMMISSION
Washington, D.C. 20549
FORM N-CSR
CERTIFIED SHAREHOLDER REPORT OF REGISTERED
MANAGEMENT INVESTMENT COMPANIES
Investment Company Act file number | 811-1735 |
|
FPA NEW INCOME, INC. |
(Exact name of registrant as specified in charter) |
|
11601 WILSHIRE BLVD., STE. 1200 LOS ANGELES, CALIFORNIA | | 90025 |
(Address of principal executive offices) | | (Zip code) |
|
(Name and Address of Agent for Service) | Copy to: |
| |
J. RICHARD ATWOOD, PRESIDENT FPA NEW INCOME, INC. 11601 WILSHIRE BLVD., STE. 1200 LOS ANGELES, CALIFORNIA 90025 | MARK D. PERLOW, ESQ. DECHERT LLP ONE BUSH STREET, STE. 1600 SAN FRANCISCO, CA 94104 |
|
Registrant’s telephone number, including area code: | (310) 473-0225 | |
|
Date of fiscal year end: | September 30 | |
|
Date of reporting period: | September 30, 2017 | |
| | | | | | | | | |
Item 1: Report to Shareholders.

Distributor:
UMB DISTRIBUTION SERVICES, LLC
235 West Galena Street
Milwaukee, Wisconsin 53212
FPA NEW INCOME, INC.
LETTER TO SHAREHOLDERS
Dear Shareholders:
FPA New Income, Inc. (the "Fund") had a total return of 1.01% in the third quarter of 2017 and a total return of 2.58% for the trailing 12 months.
As of June 30, the portfolio had a yield-to-worst1 of 2.67% and an effective duration2 of 1.49 years. The Treasury yield curve continued to flatten in the third quarter, with meaningfully higher yields for maturities up to three years, smaller yield increases in five- to 10-year maturities and a de minimis increase in the 30-year Treasury yield. Credit spreads continued to compress across both high quality and credit assets, resulting in fewer attractive investment opportunities. The portfolio's credit sensitive holdings decreased slightly to 11.5% for the period, compared to 12.1% on June 30. We remain cautious about credit risk, while seeking opportunities to extend the portfolio's duration as rates allow.
Portfolio Attribution
Fiscal Year 2017 (10/1/16-9/30/17)
The largest contributors to performance were corporate bonds and bank debt, led by price appreciation of our energy and metals and mining investments. The second-and third-largest contributors to performance were asset-backed securities (ABS) backed by auto loans and Collateralized Loan Obligations (CLOs), with the return on both stemming primarily from coupon return.
The largest detractors from performance were interest-only agency mortgage bonds, which decreased in price as a result of rising interest rates over the past 12 months. The short remaining life of these bonds' underlying mortgages makes the prepayment speed insensitive to changes in interest rates, thereby creating positive duration. We largely exited this investment during the year. The second-largest detractors from performance were our longer maturity Treasury notes (the average maturity was approximately 2.7 years as of the end of the quarter), which decreased in price as a result of rising interest rates.
Third Quarter 2017
The largest contributors to performance were corporate bonds and bank debt, led by our metals and mining investment, which increased in value following the completion of the issuer's restructuring. The second- and third-largest contributors to performance were GNMA project loan interest-only bonds and Collateralized Loan Obligations (CLOs). Both were driven by coupon return.
There were no meaningful detractors from performance.
1 Yield-to-worst is the lowest possible yield that can be received on a bond without the issuer actually defaulting. It does not represent the yield that an investor should expect to receive. As of September 30, 2017, the SEC yield was 2.58%. This yield figure reflects the theoretical income that a bond portfolio would generate, including dividends and interest, during the period after deducting the Fund's expenses for the period (but excluding any fee waivers). The Fund's actual net earnings for a given period under generally accepted accounting principles may differ from this standardized yield. The SEC yield is expressed as an annual percentage based on the price of the Fund at the beginning of the month.
2 Duration is a measure of the sensitivity of the price (the value of principal) of a fixed-income investment to a change in interest rates.
1
FPA NEW INCOME, INC.
LETTER TO SHAREHOLDERS
(Continued)
Portfolio Activity
The table below shows the change in portfolio allocations for the third quarter compared to the second:
Sector | | % Portfolio
9/30/2017 | | % Portfolio
6/30/2017 | |
ABS | | | 53.0 | % | | | 54.7 | % | |
Mortgage Backed (CMO3) | | | 9.7 | % | | | 13.6 | % | |
Stripped Mortgage-backed | | | 8.1 | % | | | 8.9 | % | |
Corporate | | | 7.4 | % | | | 6.2 | % | |
Cash and equivalents | | | 10.5 | % | | | 6.9 | % | |
CMBS4 | | | 3.8 | % | | | 3.4 | % | |
Mortgage Pass-through | | | 2.6 | % | | | 3.2 | % | |
U.S. Treasury | | | 4.8 | % | | | 3.0 | % | |
Municipal | | | 0.1 | % | | | 0.1 | % | |
Total | | | 100 | % | | | 100 | % | |
Yield-to-worst | | | 2.67 | % | | | 2.71 | % | |
Duration (years) | | | 1.49 | | | | 1.54 | | |
Average Life (years) | | | 1.77 | | | | 1.88 | | |
Our ABS holdings decreased during the quarter due to amortization and the maturity of existing positions, but the decline was partially offset by additions to our auto ABS, CLO and insurance premium finance holdings. Investments in Mortgage Backed (CMO) bonds decreased primarily due to sales of existing agency relocation mortgage bonds and the amortization of bonds backed by non-performing residential mortgages. As credit spreads decreased during the quarter, we sold certain of our high-quality relocation bonds after their price increased to the point where they no longer offered enough yield relative to the duration. The exposure to Stripped Mortgage Backed bonds decreased as we sold GNMA project loan interest-only bonds whose prospective return profiles were no longer attractive. Notwithstanding the expensive market for credit investments, we were able to find a few attractive investments in corporate bank debt and bonds, which slightly increased our exposure to corporates during the quarter.
In general, given the available opportunities in the market, we have had more success finding attractive credit investments in bank debt versus high yield. Bank debt has higher seniority and better structural protections, which enhance the margin of safety5 as appropriate for the available return. Finally, with respect to notable changes in exposures, our U.S. Treasury bond exposure increased as higher Treasury rates allowed us to buy two-year Treasury notes at a yield that compensates for the duration risk. As credits continued to tighten this quarter, it was challenging to find attractive new investment opportunities. We made some purchases during the quarter,
3 Collateralized mortgage obligations are mortgage-backed bonds that separate mortgage pools into different maturity classes.
4 Commercial mortgage backed securities are securities backed by commercial mortgages rather than residential mortgages.
5 Margin of safety is a principle of investing in which an investor only purchases securities when the market price is significantly below its intrinsic value. In other words, when market price is significantly below your estimation of the intrinsic value, the difference is the margin of safety. This difference allows an investment to be made with minimal downside risk.
2
FPA NEW INCOME, INC.
LETTER TO SHAREHOLDERS
(Continued)
but uninvested cash from amortization and maturities of existing positions increased the portfolio's cash and cash equivalents at the end of the quarter.
Market Commentary
This summer marked the 50th anniversary of the "Summer of Love," when an estimated 100,000 baby boomers descended on San Francisco's Haight Ashbury neighborhood to celebrate the new counterculture of being hippies (or flower children). Investors seem to be commemorating the anniversary by spreading their love throughout the capital markets — to bonds, credit, stocks and, in a nod to San Francisco, to FAANG (Facebook, Apple, Amazon, Netflix and Google).
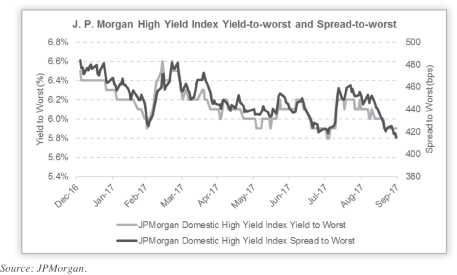
With so much love going around, fixed income markets — in all forms — are expensive. Everywhere we look, we find lower spreads and, thus, less compensation for the risk of short-term mark-to-market price movements (i.e., duration risk) and/or the risk of permanent loss of capital. As we said last quarter, high-quality bond spreads are low and trending lower. Likewise, in the credit market, the spread on high-yield bonds continues to narrow. The JPMorgan Domestic High Yield Index reached a new low in spread for 2017, and is close to the low in yield-to-worst, as shown below.
3
FPA NEW INCOME, INC.
LETTER TO SHAREHOLDERS
(Continued)
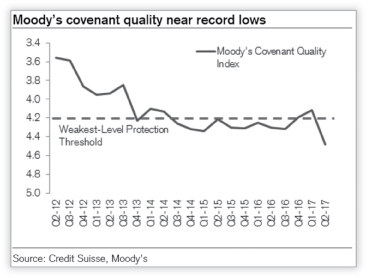
Yet at the same time that bonds are more expensive (i.e., yields are lower), the quality of what one can buy is going down, as evidenced by weaker investor protections in high-yield bond covenants (see chart below).
Narrow spreads pose a challenge and limit investment opportunities. Our exposure to credit (which we measure as anything rated BBB+ or lower) was little changed in the third quarter. The Fund's credit exposure has decreased from 17.6% of the portfolio to 11.5% over the past year because the expensive market is making it difficult to find compelling investments. We do find the occasional interesting idea, but without cheaper valuations it is difficult to see our credit exposure changing meaningfully in the near term. As a result, the bulk of the portfolio's capital has been redeployed toward high quality, less credit sensitive investments.
Despite the exuberance in the market, as with that magical event in 1967, not everything is as rosy as it seems. Washington has stumbled on the legislative front, hampered by political infighting and a twice-failed attempt to repeal and replace the Affordable Care Act. While President Trump has struggled to move his agenda through the legislative process, it appears that he can at least move markets. Every move in bond prices seems to be driven by his tweets and pronouncements. In fact, that may explain many of the changes in Treasury rates over the past few weeks and months.
Indeed, in the latest market-moving announcement, President Trump introduced a framework for reform of both personal and corporate income taxes. The president and his advisors say this reform will spread love to both the middle class and corporate America, but not to the wealthy. While on the surface this would appear to be a positive for many, it has a potential negative side as well. If enacted, it would be the first time in U.S. history that the federal government sought to use fiscal policy to stimulate the economy following nine years of economic expansion and when the unemployment rate is less than 4.5%. Given that fiscal policy stimulus is typically enacted when the economy is in poor shape, doing it under the economic backdrop outlined above creates the possibility of at least a transitory increase in economic activity that could result in higher inflation. At the same time, this potential increase in inflation would come as Treasury rates and credit spreads are still near their historical lows, introducing historically high duration risk into the market. This situation creates the potential for
4
FPA NEW INCOME, INC.
LETTER TO SHAREHOLDERS
(Continued)
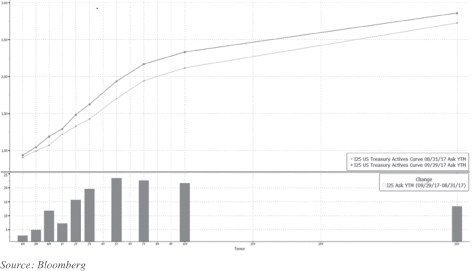
a dramatic increase in interest rates, which could cause mark-to-market problems for a significant percentage of fixed income investors. Whether, and in what form, the president and Congress can enact the stimulus remains to be seen. However, we believe that higher Treasury rates over the past few weeks (as shown below), suggests that the market expects something to materialize.
Meanwhile, we believe that the Federal Reserve will be spreading less love to borrowers (but more love to savers). The Fed has determined that it is time to further tighten monetary policy, and it plans to do so notwithstanding the fact that inflation still has not consistently stayed at or above the Fed's inflation target of 2%. On Sept. 20, the Federal Reserve formally announced its plan for Quantitative Tightening (QT). Starting Oct. 1, the Fed will reduce the reinvestment of its maturing Treasuries and agency mortgages by $10 billion per month. Previously, the Fed had been reinvesting 100% of maturities each month. Over time, the Fed will reduce its reinvestment by $50 billion per month, a figure that's in line with what we outlined in our Q2 2017 market commentary. This announcement comes at the same time that the future of the Federal Reserve's analytical framework for monetary policy is increasingly uncertain. Federal Reserve Chair Janet Yellen's reappointment is in doubt, Vice Chairman Stanley Fischer has resigned, and other board seats are still vacant. New appointees with different views could take the Fed in a new direction or abandon existing policies.
With so many uncertainties, we see a lot of interest rate risk. Could the president's fiscal stimulus package be the catalyst that changes the inflation equation? Could fiscal stimulus in combination with QT drive rates higher? We see no value in speculating. What we care about is whether we are compensated enough in case such an event occurs. As it relates to long duration bonds, we are not.
With valuations stretched, it is paramount that we stay focused on executing our investment strategy in a way that protects your (and our) capital from permanent or temporary capital loss. As such, we continue to lean toward short-duration, high-quality investments while selectively investing in credit where the risk versus reward is appealing.
We are excited to announce that joining us in this effort is a new member of our team, Ryan Taylor. Ryan possesses all of the qualities we look for. He has a strong background in credit investing, and importantly, he
5
FPA NEW INCOME, INC.
LETTER TO SHAREHOLDERS
(Continued)
employs his skills with an absolute return mindset. Ryan will work alongside our colleagues, Joe Choi and Prakash Gopinath, to scour the market for credit investments, whether they are in structured product, corporate or any other form.
We thank you for your continued support and we continue to work diligently to maintain your trust.
Respectfully submitted,

Thomas H. Atteberry
Portfolio Manager

Abhijeet Patwardhan
Portfolio Manager
October 2017
6
FPA NEW INCOME, INC.
LETTER TO SHAREHOLDERS
(Continued)
The discussions of Fund investments represent the views of the Fund's managers at the time of this report and are subject to change without notice. References to individual securities are for informational purposes only and should not be construed as recommendations to purchase or sell individual securities.
FUND RISKS
Investments in mutual funds carry risks and investors may lose principal value. Stock markets are volatile and can decline significantly in response to adverse issuer, political, regulatory, market, or economic developments. The funds may purchase foreign securities which are subject to interest rate, currency exchange rate, economic and political risks: this may be enhanced when investing in emerging markets. The securities of smaller, less well-known companies can be more volatile than those of larger companies. The return of principal in a bond fund is not guaranteed. Bond funds have the same issuer, interest rate, inflation and credit risks that are associated with underlying bonds owned by the fund. Lower rated bonds, convertible securities and other types of debt obligations involve greater risks than higher rated bonds. Mortgage securities and collateralized mortgage obligations (CMOs) are subject to prepayment risk and the risk of default on the underlying mortgages or other assets; derivatives may increase volatility. High yield securities can be volatile and subject to much higher instances of default.
FORWARD LOOKING STATEMENT DISCLOSURE
As mutual fund managers, one of our responsibilities is to communicate with shareholders in an open and direct manner. Insofar as some of our opinions and comments in our letters to shareholders are based on our current expectations, they are considered "forward-looking statements" which may or may not prove to be accurate over the long term. While we believe we have a reasonable basis for our comments and we have confidence in our opinions, actual results may differ materially from those we anticipate. You can identify forward-looking statements by words such as "believe," "expect," "may," "anticipate," and other similar expressions when discussing prospects for particular portfolio holdings and/or the markets, generally. We cannot, however, assure future results and disclaim any obligation to update or alter any forward-looking statements, whether as a result of new information, future events, or otherwise. Further, information provided in this report should not be construed as a recommendation to purchase or sell any particular security.
7
FPA NEW INCOME, INC.
HISTORICAL PERFORMANCE
(Unaudited)
Change in Value of a $10,000 Investment in FPA New Income, Inc. vs. Barclays U.S. Aggregate Index and Consumer Price Index + 100 Basis Points from October 1, 2007 to September 30, 2017
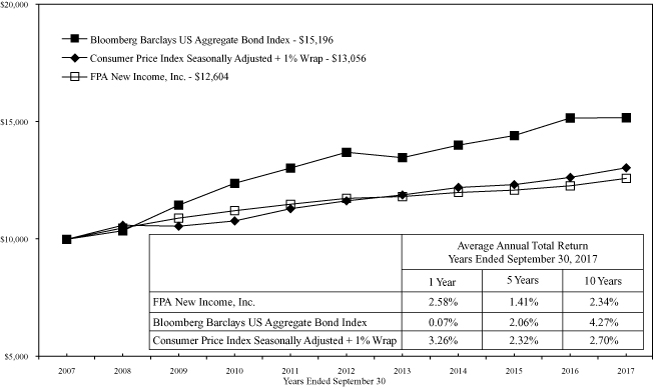
Past performance is not indicative of future performance. The Barclays U.S. Aggregate Bond Index a broad-based unmanaged composite of four major subindexes: U.S. Government Index; U.S. Credit Index; U.S. Mortgage-Backed Securities Index; and U.S. Asset-Backed Securities Index. The index holds investment quality bonds. The Consumer Price Index is an unmanaged index representing the rate of inflation of U.S. consumer prices as determined by the US Department of Labor Statistics. The performance of the Fund and of the Averages is computed on a total return basis which includes reinvestment of all distributions.
Past performance is no guarantee of future results, and current performance may be higher or lower than the performance shown. This data represents past performance, and investors should understand that investment returns and principal values fluctuate, so that when you redeem your investment it may be worth more or less than its original cost. Current month-end performance data can be obtained by visiting the website at ww.fpafunds.com or by calling toll-free, 1-800-982-4372. Information regarding the Fund's expense ratio and redemption fees can be found on pages 38 and 42.
The Prospectus details the Fund's objective and policies, charges, and other matters of interest to prospective investors. Please read the prospectus carefully before investing. The Prospectus may be obtained by visiting the website at www.fpafunds.com, by email at crm@fpafunds.com, toll-free by calling 1-800-982-4372 or by contacting the Fund in writing.
8
FPA NEW INCOME, INC.
PORTFOLIO SUMMARY
September 30, 2017
Common Stocks | | | 0.1 | % | |
Industrials | | | 0.1 | % | |
Bonds & Debentures | | | 99.5 | % | |
Asset-Backed Securities | | | 53.0 | % | |
U.S. Treasuries | | | 14.9 | % | |
Residential Mortgage-Backed Securities | | | 12.3 | % | |
Commercial Mortgage-Backed Securities | | | 11.9 | % | |
Corporate Bank Debt | | | 4.4 | % | |
Corporate Bonds & Notes | | | 2.9 | % | |
Municipals | | | 0.1 | % | |
Short-term Investments | | | 0.9 | % | |
Other Assets And Liabilities, Net | | | (0.5 | )% | |
Net Assets | | | 100.0 | % | |
9
FPA NEW INCOME, INC.
PORTFOLIO OF INVESTMENTS
September 30, 2017
COMMON STOCK — 0.1% | | Shares or
Principal
Amount | | Fair
Value | |
INDUSTRIALS — 0.1% | |
Boart Longyear Ltd.* (Cost $630,347) | | | 261,407,903 | | | $ | 5,126,208 | | |
BONDS & DEBENTURES | |
COMMERCIAL MORTGAGE-BACKED SECURITIES — 11.9% | |
AGENCY— 0.0% | |
Government National Mortgage Association 2013-55 A — 1.317% 5/16/2034 | | $ | 433,512 | | | $ | 430,771 | | |
Government National Mortgage Association 2012-2 A — 1.862% 6/16/2031 | | | 527,372 | | | | 527,017 | | |
Government National Mortgage Association 2011-49 A — 2.45% 7/16/2038 | | | 692,279 | | | | 692,346 | | |
Government National Mortgage Association 2010-148 AC — 7.00% 12/16/2050@ | | | 53,969 | | | | 54,991 | | |
| | | $ | 1,705,125 | | |
AGENCY STRIPPED — 8.1% | |
Government National Mortgage Association 2004-10 IO — 0.00% 1/16/2044@ | | $ | 9,438,606 | | | $ | 21 | | |
Government National Mortgage Association 2002-56 IO — 0.043% 6/16/2042@ | | | 27,351 | | | | 36 | | |
Government National Mortgage Association 2009-119 IO — 0.105% 12/16/2049@ | | | 13,943,044 | | | | 129,853 | | |
Government National Mortgage Association 2009-105 IO — 0.165% 11/16/2049@ | | | 10,699,307 | | | | 85,587 | | |
Government National Mortgage Association 2009-71 IO — 0.26% 7/16/2049@ | | | 3,332,376 | | | | 50,658 | | |
Government National Mortgage Association 2012-45 IO — 0.325% 4/16/2053@ | | | 17,681,254 | | | | 469,853 | | |
Government National Mortgage Association 2008-8 IO — 0.349% 11/16/2047@ | | | 11,630,383 | | | | 92,723 | | |
Government National Mortgage Association 2009-49 IO — 0.383% 6/16/2049@ | | | 12,002,459 | | | | 146,233 | | |
Government National Mortgage Association 2009-4 IO — 0.39% 1/16/2049@ | | | 3,008,585 | | | | 56,515 | | |
Government National Mortgage Association 2009-86 IO — 0.397% 10/16/2049@ | | | 21,856,060 | | | | 262,893 | | |
Government National Mortgage Association 2012-125 IO — 0.413% 2/16/2053@ | | | 80,658,551 | | | | 2,405,383 | | |
Government National Mortgage Association 2005-9 IO — 0.451% 1/16/2045@ | | | 2,547,341 | | | | 28,538 | | |
Government National Mortgage Association 2007-77 IO — 0.486% 11/16/2047@ | | | 27,590,936 | | | | 483,261 | | |
Government National Mortgage Association 2009-60 IO — 0.508% 6/16/2049@ | | | 7,243,678 | | | | 76,263 | | |
Government National Mortgage Association 2011-165 IO — 0.581% 10/16/2051@ | | | 134,102,232 | | | | 2,686,644 | | |
Government National Mortgage Association 2009-30 IO — 0.613% 3/16/2049@ | | | 7,866,067 | | | | 254,920 | | |
Government National Mortgage Association 2010-123 IO — 0.646% 9/16/2050@ | | | 7,799,791 | | | | 172,522 | | |
Government National Mortgage Association 2008-24 IO — 0.652% 11/16/2047@ | | | 1,836,203 | | | | 25,408 | | |
Government National Mortgage Association 2014-157 IO — 0.657% 5/16/2055@ | | | 161,137,193 | | | | 7,668,342 | | |
Government National Mortgage Association 2008-45 IO — 0.67% 2/16/2048@ | | | 2,657,235 | | | | 18,685 | | |
Government National Mortgage Association 2012-25 IO — 0.706% 8/16/2052@ | | | 114,401,214 | | | | 3,689,805 | | |
Government National Mortgage Association 2013-45 IO — 0.715% 12/16/2053@ | | | 78,676,060 | | | | 2,668,574 | | |
Government National Mortgage Association 2004-43 IO — 0.726% 6/16/2044@ | | | 14,471,431 | | | | 194,003 | | |
Government National Mortgage Association 2012-58 IO — 0.73% 2/16/2053@ | | | 229,712,582 | | | | 8,796,407 | | |
Government National Mortgage Association 2012-150 IO — 0.748% 11/16/2052@ | | | 77,170,512 | | | | 3,730,747 | | |
Government National Mortgage Association 2015-41 IO — 0.756% 9/16/2056@ | | | 47,772,814 | | | | 2,844,838 | | |
Government National Mortgage Association 2014-138 IO — 0.762% 4/16/2056@ | | | 25,665,223 | | | | 1,318,702 | | |
Government National Mortgage Association 2015-86 IO — 0.773% 5/16/2052@ | | | 72,562,529 | | | | 4,111,712 | | |
Government National Mortgage Association 2013-63 IO — 0.777% 9/16/2051@ | | | 73,819,387 | | | | 3,745,426 | | |
Government National Mortgage Association 2013-125 IO — 0.78% 10/16/2054@ | | | 22,953,787 | | | | 922,403 | | |
Government National Mortgage Association 2013-13 IO — 0.783% 7/16/2047@ | | | 107,090,968 | | | | 4,893,982 | | |
Government National Mortgage Association 2014-164 IO — 0.801% 1/16/2056@ | | | 293,658,683 | | | | 15,164,329 | | |
Government National Mortgage Association 2012-79 IO — 0.803% 3/16/2053@ | | | 149,645,550 | | | | 6,391,511 | | |
Government National Mortgage Association 2012-114 IO — 0.811% 1/16/2053@ | | | 52,729,520 | | | | 2,971,430 | | |
10
FPA NEW INCOME, INC.
PORTFOLIO OF INVESTMENTS (Continued)
September 30, 2017
BONDS & DEBENTURES — Continued | | Principal
Amount | | Fair
Value | |
Government National Mortgage Association 2014-77 IO — 0.823% 12/16/2047@ | | $ | 65,233,322 | | | $ | 3,195,148 | | |
Government National Mortgage Association 2014-153 IO — 0.825% 4/16/2056@ | | | 239,059,874 | | | | 14,056,242 | | |
Government National Mortgage Association 2015-47 IO — 0.83% 10/16/2056@ | | | 192,121,399 | | | | 11,952,007 | | |
Government National Mortgage Association 2014-135 IO — 0.835% 1/16/2056@ | | | 317,955,644 | | | | 17,137,205 | | |
Government National Mortgage Association 2014-110 IO — 0.84% 1/16/2057@ | | | 79,478,895 | | | | 5,149,366 | | |
Government National Mortgage Association 2014-175 IO — 0.848% 4/16/2056@ | | | 233,034,774 | | | | 13,928,232 | | |
Government National Mortgage Association 2015-7 IO — 0.876% 1/16/2057@ | | | 20,277,026 | | | | 1,264,419 | | |
Government National Mortgage Association 2015-101 IO — 0.879% 3/16/2052@ | | | 178,133,026 | | | | 10,528,072 | | |
Government National Mortgage Association 2015-19 IO — 0.879% 1/16/2057@ | | | 121,870,042 | | | | 8,058,047 | | |
Government National Mortgage Association 2008-92 IO — 0.881% 10/16/2048@ | | | 21,523,626 | | | | 371,321 | | |
Government National Mortgage Association 2006-55 IO — 0.915% 8/16/2046@ | | | 8,664,223 | | | | 32,597 | | |
Government National Mortgage Association 2014-187 IO — 0.932% 5/16/2056@ | | | 227,885,819 | | | | 14,482,736 | | |
Government National Mortgage Association 2015-169 IO — 0.939% 7/16/2057@ | | | 232,537,568 | | | | 16,842,184 | | |
Government National Mortgage Association 2015-128 IO — 0.946% 12/16/2056@ | | | 208,618,434 | | | | 13,486,598 | | |
Government National Mortgage Association 2015-160 IO — 0.956% 1/16/2056@ | | | 269,429,385 | | | | 17,621,355 | | |
Government National Mortgage Association 2008-48 IO — 0.957% 4/16/2048@ | | | 10,112,724 | | | | 180,437 | | |
Government National Mortgage Association 2012-53 IO — 0.958% 3/16/2047@ | | | 85,362,592 | | | | 4,012,759 | | |
Government National Mortgage Association 2015-150 IO — 0.966% 9/16/2057@ | | | 256,050,116 | | | | 19,274,659 | | |
Government National Mortgage Association 2015-114 IO — 0.968% 3/15/2057@ | | | 170,381,999 | | | | 10,465,919 | | |
Government National Mortgage Association 2016-45 IO — 1.004% 2/16/2058@ | | | 133,062,669 | | | | 9,903,894 | | |
Government National Mortgage Association 2016-34 IO — 1.007% 1/16/2058@ | | | 224,876,217 | | | | 16,584,464 | | |
Government National Mortgage Association 2016-65 IO — 1.009% 1/16/2058@ | | | 248,120,298 | | | | 18,649,913 | | |
Government National Mortgage Association 2015-108 IO — 1.035% 10/16/2056@ | | | 43,017,121 | | | | 2,909,226 | | |
Government National Mortgage Association 2016-125 IO — 1.064% 12/16/2057@ | | | 141,490,859 | | | | 11,252,584 | | |
Government National Mortgage Association 2016-106 IO — 1.069% 9/16/2058@ | | | 274,406,781 | | | | 22,744,974 | | |
Government National Mortgage Association 2016-85 IO — 1.121% 3/16/2057@ | | | 163,312,410 | | | | 13,320,266 | | |
Government National Mortgage Association 2016-119 IO — 1.126% 4/16/2058@ | | | 406,030,945 | | | | 33,178,413 | | |
Government National Mortgage Association 2016-67 IO — 1.166% 7/16/2057@ | | | 122,375,602 | | | | 9,776,611 | | |
Government National Mortgage Association 2016-94 IO — 1.17% 12/16/2057@ | | | 220,654,897 | | | | 18,382,142 | | |
Government National Mortgage Association 2004-108 IO — 1.265% 12/16/2044@ | | | 1,259,801 | | | | 65 | | |
Government National Mortgage Association 2006-30 IO — 2.299% 5/16/2046@ | | | 1,263,785 | | | | 7,805 | | |
| | | $ | 415,307,867 | | |
NON-AGENCY — 3.8% | |
A10 Term Asset Financing LLC 2017-1A A1FX — 2.34% 3/15/2036**,†† | | $ | 17,639,000 | | | $ | 17,649,124 | | |
A10 Term Asset Financing LLC 2016-1 A1 — 2.42% 3/15/2035** | | | 5,607,609 | | | | 5,589,408 | | |
Aventura Mall Trust M 2013-AVM A — 3.867% 12/5/2032**,@ | | | 25,142,000 | | | | 26,124,587 | | |
Bear Stearns Commercial Mortgage Securities Trust
2005-PWR7 B — 5.214% 2/11/2041@ | | | 5,302,421 | | | | 5,301,885 | | |
Citigroup Commercial Mortgage Trust
2006-C4 B — 6.25% 3/15/2049@ | | | 2,809,433 | | | | 2,810,725 | | |
COMM Mortgage Trust
2014-FL5 B, 1M LIBOR + 2.150% — 3.384% 10/15/2031**,@ | | | 12,720,000 | | | | 12,698,431 | | |
COMM Mortgage Trust
2014-FL5 C, 1M LIBOR + 2.150% — 3.384% 10/15/2031**,@ | | | 8,240,000 | | | | 8,063,460 | | |
Credit Suisse Commercial Mortgage Trust Series
2016-MFF E, 1M LIBOR + 6.000% — 7.234% 11/15/2033**,@ | | | 30,398,000 | | | | 30,550,127 | | |
11
FPA NEW INCOME, INC.
PORTFOLIO OF INVESTMENTS (Continued)
September 30, 2017
BONDS & DEBENTURES — Continued | | Principal
Amount | | Fair
Value | |
JP Morgan Chase Commercial Mortgage Securities Trust
2010-C1 A3 — 5.058% 6/15/2043** | | $ | 7,277,000 | | | $ | 7,759,364 | | |
Latitude Management Real Estate Capital
2016-CRE2 A, 1M LIBOR + 1.700% — 2.936% 11/24/2031**,@,†† | | | 16,735,000 | | | | 16,902,350 | | |
Morgan Stanley Capital I Trust 2006-HQ9 D — 5.862% 7/12/2044@ | | | 7,920,327 | | | | 7,944,790 | | |
Ores NPL LLC 2014-LV3 B — 6.00% 3/27/2024** | | | 21,506,144 | | | | 21,525,566 | | |
Rialto Capital Management LLC 2014-LT5 B — 5.00% 5/15/2024** | | | 1,538,980 | | | | 1,537,663 | | |
Rialto Real Estate Fund LP 2015-LT7 B — 5.071% 12/25/2032** | | | 16,642,256 | | | | 16,629,471 | | |
SCG Trust 2013-SRP1 AJ, 1M LIBOR + 1.950% — 3.427% 11/15/2026**,@ | | | 14,152,000 | | | | 14,099,106 | | |
| | | $ | 195,186,057 | | |
| TOTAL COMMERICAL MORTGAGE-BACKED SECURITIES (Cost $659,466,426) | | $ | 612,199,049 | | |
RESIDENTIAL MORTGAGE-BACKED SECURITIES — 12.3% | |
AGENCY COLLATERALIZED MORTGAGE OBLIGATION — 4.4% | |
Federal Home Loan Mortgage Corporation 2809 UC — 4.00% 6/15/2019 | | $ | 88,020 | | | $ | 88,893 | | |
Federal Home Loan Mortgage Corporation 3957 BV — 4.00% 10/15/2029 | | | 445,182 | | | | 445,981 | | |
Federal Home Loan Mortgage Corporation 2990 TD — 4.00% 5/15/2035 | | | 12,389 | | | | 12,557 | | |
Federal Home Loan Mortgage Corporation 2614 BY — 4.50% 5/15/2018 | | | 119,854 | | | | 120,778 | | |
Federal Home Loan Mortgage Corporation 2645 BY — 4.50% 7/15/2018 | | | 27,473 | | | | 27,666 | | |
Federal Home Loan Mortgage Corporation 2649 AN — 4.50% 7/15/2018 | | | 301,163 | | | | 303,635 | | |
Federal Home Loan Mortgage Corporation 2656 PE — 4.50% 7/15/2018 | | | 54,305 | | | | 54,742 | | |
Federal Home Loan Mortgage Corporation 2568 XD — 5.00% 2/15/2018 | | | 24,271 | | | | 24,391 | | |
Federal National Mortgage Association 2012-117 DA — 1.50% 12/25/2039 | | | 2,819,822 | | | | 2,754,791 | | |
Federal National Mortgage Association 2014-80 GD — 2.00% 2/25/2042 | | | 25,765,977 | | | | 25,552,849 | | |
Federal National Mortgage Association 2017-16 JA — 3.00% 2/25/2043 | | | 32,215,744 | | | | 32,758,151 | | |
Federal National Mortgage Association 2016-104 QA — 3.00% 11/25/2043 | | | 48,511,727 | | | | 49,250,755 | | |
Federal National Mortgage Association 2017-15 DA — 3.00% 12/25/2044 | | | 23,922,983 | | | | 24,285,244 | | |
Federal National Mortgage Association 2017-45 KD — 3.50% 2/25/2044 | | | 21,957,619 | | | | 22,627,276 | | |
Federal National Mortgage Association 2017-52 KC — 3.50% 4/25/2044 | | | 21,414,540 | | | | 22,078,477 | | |
Federal National Mortgage Association 2017-59 DC — 3.50% 5/25/2044 | | | 31,565,842 | | | | 32,548,786 | | |
Federal National Mortgage Association 2003-128 NG — 4.00% 1/25/2019 | | | 41,925 | | | | 42,277 | | |
Federal National Mortgage Association 2004-7 JK — 4.00% 2/25/2019 | | | 352,638 | | | | 355,355 | | |
Federal National Mortgage Association 2008-18 MD — 4.00% 3/25/2019 | | | 99,016 | | | | 99,838 | | |
Federal National Mortgage Association 2004-76 CL — 4.00% 10/25/2019 | | | 96,055 | | | | 96,854 | | |
Federal National Mortgage Association 2009-76 MA — 4.00% 9/25/2024 | | | 46,132 | | | | 46,556 | | |
Federal National Mortgage Association 2011-113 NE — 4.00% 3/25/2040 | | | 973,922 | | | | 981,398 | | |
Federal National Mortgage Association 2012-95 AB — 4.00% 11/25/2040 | | | 560,037 | | | | 563,659 | | |
Federal National Mortgage Association 2009-70 NU — 4.25% 8/25/2019 | | | 440,607 | | | | 443,075 | | |
Federal National Mortgage Association 2003-30 HW — 4.50% 4/25/2018 | | | 37,845 | | | | 38,032 | | |
Federal National Mortgage Association 2008-18 NB — 4.50% 5/25/2020 | | | 137,377 | | | | 138,308 | | |
Federal National Mortgage Association 2011-7 PA — 4.50% 10/25/2039 | | | 44,216 | | | | 44,437 | | |
Federal National Mortgage Association 2012-40 GC — 4.50% 12/25/2040 | | | 1,778,713 | | | | 1,820,671 | | |
Federal National Mortgage Association 2012-67 PB — 4.50% 12/25/2040 | | | 1,760,745 | | | | 1,780,382 | | |
Federal National Mortgage Association 2002-74 PE — 5.00% 11/25/2017 | | | 2,394 | | | | 2,393 | | |
Federal National Mortgage Association 2003-24 PD — 5.00% 4/25/2018 | | | 119,033 | | | | 119,627 | | |
12
FPA NEW INCOME, INC.
PORTFOLIO OF INVESTMENTS (Continued)
September 30, 2017
BONDS & DEBENTURES — Continued | | Principal
Amount | | Fair
Value | |
Federal National Mortgage Association 2003-46 BG — 5.00% 6/25/2018 | | $ | 143,181 | | | $ | 144,127 | | |
Federal National Mortgage Association 2004-60 LB — 5.00% 4/25/2034 | | | 2,902,853 | | | | 3,055,547 | | |
Federal National Mortgage Association 2011-19 WB — 5.50% 10/25/2018 | | | 652,337 | | | | 659,669 | | |
| | | $ | 223,367,177 | | |
AGENCY POOL ADJUSTABLE RATE — 0.0% | |
Federal National Mortgage Association
865963, 12M USD LIBOR + 1.725% — 3.445% 3/1/2036@ | | $ | 975,680 | | | $ | 1,021,031 | | |
AGENCY POOL FIXED RATE — 2.6% | |
Federal Home Loan Mortgage Corporation J24941 — 2.00% 8/1/2023 | | $ | 3,539,076 | | | $ | 3,536,592 | | |
Federal Home Loan Mortgage Corporation G15139 — 4.50% 6/1/2019 | | | 157,376 | | | | 159,848 | | |
Federal Home Loan Mortgage Corporation P60959 — 4.50% 9/1/2020 | | | 281,039 | | | | 283,259 | | |
Federal Home Loan Mortgage Corporation G14030 — 4.50% 12/1/2020 | | | 207,565 | | | | 212,951 | | |
Federal Home Loan Mortgage Corporation G15169 — 4.50% 9/1/2026 | | | 4,067,489 | | | | 4,206,426 | | |
Federal Home Loan Mortgage Corporation G15272 — 4.50% 9/1/2026 | | | 3,968,485 | | | | 4,065,758 | | |
Federal Home Loan Mortgage Corporation G15875 — 4.50% 9/1/2026 | | | 4,997,022 | | | | 5,182,340 | | |
Federal Home Loan Mortgage Corporation G18056 — 5.00% 6/1/2020 | | | 306,290 | | | | 315,775 | | |
Federal Home Loan Mortgage Corporation G13812 — 5.00% 12/1/2020 | | | 980,397 | | | | 1,006,873 | | |
Federal Home Loan Mortgage Corporation G15036 — 5.00% 6/1/2024 | | | 3,340,839 | | | | 3,421,636 | | |
Federal Home Loan Mortgage Corporation G13667 — 5.00% 8/1/2024 | | | 187,931 | | | | 196,461 | | |
Federal Home Loan Mortgage Corporation G15435 — 5.00% 11/1/2024 | | | 7,539,429 | | | | 7,755,696 | | |
Federal Home Loan Mortgage Corporation G15173 — 5.00% 6/1/2026 | | | 2,829,253 | | | | 2,906,135 | | |
Federal Home Loan Mortgage Corporation G15407 — 5.00% 6/1/2026 | | | 4,499,182 | | | | 4,734,565 | | |
Federal Home Loan Mortgage Corporation G15874 — 5.00% 6/1/2026 | | | 2,192,715 | | | | 2,256,179 | | |
Federal Home Loan Mortgage Corporation G12829 — 5.50% 10/1/2017 | | | 226 | | | | 226 | | |
Federal Home Loan Mortgage Corporation G14187 — 5.50% 12/1/2020 | | | 2,158,685 | | | | 2,211,417 | | |
Federal Home Loan Mortgage Corporation J01270 — 5.50% 2/1/2021 | | | 67,519 | | | | 70,569 | | |
Federal Home Loan Mortgage Corporation G14035 — 5.50% 12/1/2021 | | | 228,012 | | | | 237,594 | | |
Federal Home Loan Mortgage Corporation G15230 — 5.50% 12/1/2024 | | | 5,444,503 | | | | 5,650,418 | | |
Federal Home Loan Mortgage Corporation G15458 — 5.50% 12/1/2024 | | | 876,879 | | | | 924,407 | | |
Federal Home Loan Mortgage Corporation G14460 — 6.00% 1/1/2024 | | | 374,150 | | | | 396,220 | | |
Federal Home Loan Mortgage Corporation G12139 — 6.50% 9/1/2019 | | | 499 | | | | 499 | | |
Federal Home Loan Mortgage Corporation P50543 — 6.50% 4/1/2037 | | | 70,842 | | | | 73,454 | | |
Federal National Mortgage Association AB6251 — 2.00% 9/1/2022 | | | 706,705 | | | | 706,478 | | |
Federal National Mortgage Association AB7515 — 2.00% 1/1/2023 | | | 367,747 | | | | 367,434 | | |
Federal National Mortgage Association MA1502 — 2.50% 7/1/2023 | | | 34,044,896 | | | | 34,504,965 | | |
Federal National Mortgage Association AA4546 — 4.00% 5/1/2024 | | | 1,210,214 | | | | 1,265,494 | | |
Federal National Mortgage Association AL5956 — 4.00% 5/1/2027 | | | 1,232,823 | | | | 1,290,130 | | |
Federal National Mortgage Association 254906 — 4.50% 10/1/2018 | | | 85,813 | | | | 86,669 | | |
Federal National Mortgage Association 255547 — 4.50% 1/1/2020 | | | 47,435 | | | | 48,465 | | |
Federal National Mortgage Association MA0323 — 4.50% 2/1/2020 | | | 163,583 | | | | 166,311 | | |
Federal National Mortgage Association MA0358 — 4.50% 3/1/2020 | | | 97,923 | | | | 100,031 | | |
Federal National Mortgage Association MA0419 — 4.50% 5/1/2020 | | | 172,985 | | | | 177,256 | | |
Federal National Mortgage Association AL6725 — 4.50% 9/1/2020 | | | 1,811,245 | | | | 1,841,177 | | |
Federal National Mortgage Association 735920 — 4.50% 10/1/2020 | | | 45,285 | | | | 46,398 | | |
Federal National Mortgage Association 995158 — 4.50% 12/1/2020 | | | 82,397 | | | | 84,774 | | |
Federal National Mortgage Association 889531 — 4.50% 5/1/2022 | | | 29,839 | | | | 30,608 | | |
13
FPA NEW INCOME, INC.
PORTFOLIO OF INVESTMENTS (Continued)
September 30, 2017
BONDS & DEBENTURES — Continued | | Principal
Amount | | Fair
Value | |
Federal National Mortgage Association AL6212 — 4.50% 1/1/2027 | | $ | 4,301,710 | | | $ | 4,380,672 | | |
Federal National Mortgage Association AE0126 — 5.00% 6/1/2020 | | | 3,424,798 | | | | 3,504,087 | | |
Federal National Mortgage Association 310097 — 5.00% 10/1/2020 | | | 136,990 | | | | 138,167 | | |
Federal National Mortgage Association AE0792 — 5.00% 12/1/2020 | | | 938,877 | | | | 961,194 | | |
Federal National Mortgage Association AE0314 — 5.00% 8/1/2021 | | | 5,206,341 | | | | 5,298,897 | | |
Federal National Mortgage Association AD0285 — 5.00% 9/1/2022 | | | 559,377 | | | | 580,222 | | |
Federal National Mortgage Association AE0812 — 5.00% 7/1/2025 | | | 1,124,141 | | | | 1,152,902 | | |
Federal National Mortgage Association AL5764 — 5.00% 9/1/2025 | | | 3,773,070 | | | | 3,870,376 | | |
Federal National Mortgage Association AL6798 — 5.00% 9/1/2025 | | | 4,458,870 | | | | 4,545,603 | | |
Federal National Mortgage Association AL4056 — 5.00% 6/1/2026 | | | 4,847,953 | | | | 5,017,586 | | |
Federal National Mortgage Association 257100 — 5.50% 1/1/2018 | | | 18,135 | | | | 18,155 | | |
Federal National Mortgage Association 745500 — 5.50% 12/1/2018 | | | 122,727 | | | | 123,538 | | |
Federal National Mortgage Association 745119 — 5.50% 12/1/2019 | | | 1,357,092 | | | | 1,389,257 | | |
Federal National Mortgage Association 995284 — 5.50% 3/1/2020 | | | 22,371 | | | | 22,416 | | |
Federal National Mortgage Association 745190 — 5.50% 6/1/2020 | | | 28,086 | | | | 28,272 | | |
Federal National Mortgage Association 889318 — 5.50% 7/1/2020 | | | 764,688 | | | | 781,163 | | |
Federal National Mortgage Association 745749 — 5.50% 3/1/2021 | | | 161,271 | | | | 167,837 | | |
Federal National Mortgage Association AL5867 — 5.50% 8/1/2023 | | | 686,066 | | | | 702,741 | | |
Federal National Mortgage Association AE0237 — 5.50% 11/1/2023 | | | 604,870 | | | | 620,379 | | |
Federal National Mortgage Association AL5812 — 5.50% 5/1/2025 | | | 2,792,149 | | | | 2,865,709 | | |
Federal National Mortgage Association AL0471 — 5.50% 7/1/2025 | | | 161,659 | | | | 171,889 | | |
Federal National Mortgage Association AL4433 — 5.50% 9/1/2025 | | | 1,262,019 | | | | 1,329,028 | | |
Federal National Mortgage Association AL4901 — 5.50% 9/1/2025 | | | 1,560,414 | | | | 1,617,602 | | |
Federal National Mortgage Association 735439 — 6.00% 9/1/2019 | | | 55,971 | | | | 57,475 | | |
Federal National Mortgage Association 745238 — 6.00% 12/1/2020 | | | 234,250 | | | | 240,036 | | |
Federal National Mortgage Association 745832 — 6.00% 4/1/2021 | | | 1,800,719 | | | | 1,869,857 | | |
Federal National Mortgage Association AD0951 — 6.00% 12/1/2021 | | | 869,873 | | | | 909,441 | | |
Federal National Mortgage Association AL0294 — 6.00% 10/1/2022 | | | 86,018 | | | | 91,311 | | |
Federal National Mortgage Association 890225 — 6.00% 5/1/2023 | | | 801,246 | | | | 852,065 | | |
Federal National Mortgage Association 890403 — 6.00% 5/1/2023 | | | 475,794 | | | | 491,201 | | |
Government National Mortgage Association 782281 — 6.00% 3/15/2023 | | | 1,205,289 | | | | 1,287,789 | | |
| | | $ | 135,608,355 | | |
AGENCY STRIPPED — 0.0% | |
Federal Home Loan Mortgage Corporation 217 PO — 0.00% 1/1/2032@@@ | | $ | 216,819 | | | $ | 196,305 | | |
Federal Home Loan Mortgage Corporation 3763 NI — 3.50% 5/15/2025 | | | 1,963,172 | | | | 135,319 | | |
Federal Home Loan Mortgage Corporation 3917 AI — 4.50% 7/15/2026 | | | 14,929,416 | | | | 1,400,435 | | |
Federal Home Loan Mortgage Corporation 217 IO — 6.50% 1/1/2032 | | | 208,773 | | | | 49,088 | | |
Federal National Mortgage Association 2010-137 BI — 3.50% 2/25/2024 | | | 237,964 | | | | 703 | | |
Federal National Mortgage Association 2011-66 BI — 3.50% 3/25/2025 | | | 262,543 | | | | 2,718 | | |
Federal National Mortgage Association 2010-25 NI — 5.00% 3/25/2025 | | | 299,031 | | | | 11,052 | | |
Federal National Mortgage Association 2003-64 XI — 5.00% 7/25/2033 | | | 599,944 | | | | 109,853 | | |
| | | $ | 1,905,473 | | |
14
FPA NEW INCOME, INC.
PORTFOLIO OF INVESTMENTS (Continued)
September 30, 2017
BONDS & DEBENTURES — Continued | | Principal
Amount | | Fair
Value | |
NON-AGENCY COLLATERALIZED MORTGAGE OBLIGATION — 5.3% | |
BCAP LLC Trust 2010-RR8 2A6 — 2.754% 11/26/2036**,@ | | $ | 971,947 | | | $ | 969,581 | | |
Citicorp Mortgage Securities REMIC Pass-Through Certificates Trust Series
2005-5 2A3 — 5.00% 8/25/2020 | | | 48,910 | | | | 49,404 | | |
Citigroup Mortgage Loan Trust, Inc. 2014-A A — 4.00% 1/25/2035**,@ | | | 10,629,262 | | | | 10,972,160 | | |
Credit Suisse Mortgage Trust Series 2010-9R 1A4 — 3.75% 8/27/2037** | | | 25,425 | | | | 25,376 | | |
Nationstar HECM Loan Trust 2016-3A A — 2.013% 8/25/2026** | | | 1,896,758 | | | | 1,921,138 | | |
Nationstar HECM Loan Trust 2017-2A A1 — 2.038% 9/25/2027**,@,†† | | | 12,528,000 | | | | 12,528,000 | | |
Nationstar HECM Loan Trust 2017-2A M1 — 2.815% 9/25/2027**,@,†† | | | 12,184,000 | | | | 12,184,000 | | |
Nomura Resecuritization Trust 2016-1R 3A1 — 5.00% 9/28/2036**,@ | | | 5,923,880 | | | | 6,111,580 | | |
RiverView HECM Trust
2007-1 A, 1 year Treasury + 0.500% — 1.817% 5/25/2047**,@ | | | 25,657,611 | | | | 21,512,239 | | |
Stanwich Mortgage Loan Trust Series 2010-3 A — 0.00% 7/31/2038**,@,†† | | | 545,075 | | | | 272,701 | | |
Stanwich Mortgage Loan Trust Series 2011-2 A — 0.00% 9/15/2050**,@,†† | | | 806,632 | | | | 431,713 | | |
Stanwich Mortgage Loan Trust Series 2011-1 A — 0.192% 8/15/2050**,@,†† | | | 771,910 | | | | 407,128 | | |
Stanwich Mortgage Loan Trust Series 2009-2 A — 0.472% 2/15/2049**,@,†† | | | 57,563 | | | | 25,742 | | |
Stanwich Mortgage Loan Trust Series 2010-2 A — 1.005% 2/28/2057**,@,†† | | | 920,261 | | | | 463,995 | | |
Stanwich Mortgage Loan Trust Series 2010-1 A — 1.069% 9/30/2047**,@,†† | | | 230,722 | | | | 116,699 | | |
Stanwich Mortgage Loan Trust Series 2010-4 A — 1.78% 8/31/2049**,@,†† | | | 473,758 | | | | 239,248 | | |
Sunset Mortgage Loan Co. LLC 2015-NPL1 A — 4.459% 9/18/2045**,@@ | | | 9,841,257 | | | | 9,939,036 | | |
Towd Point Mortgage Trust 2016-3 A1 — 2.25% 4/25/2056**,@ | | | 22,959,408 | | | | 22,830,691 | | |
Towd Point Mortgage Trust 2015-1 AES — 3.00% 10/25/2053**,@ | | | 25,033,738 | | | | 25,270,787 | | |
Towd Point Mortgage Trust 2015-2 1A1 — 3.25% 11/25/2060**,@ | | | 35,117,879 | | | | 35,741,984 | | |
Towd Point Mortgage Trust 2015-4 A1 — 3.50% 4/25/2055**,@ | | | 31,925,051 | | | | 32,561,359 | | |
Towd Point Mortgage Trust 2015-2 2A1 — 3.75% 11/25/2057**,@ | | | 27,559,319 | | | | 28,216,964 | | |
VOLT XL LLC 2015-NP14 A1 — 4.375% 11/27/2045**,@@ | | | 14,425,896 | | | | 14,437,969 | | |
VOLT XXV LLC 2015-NPL8 A1 — 3.50% 6/26/2045**,@@ | | | 22,236,690 | | | | 22,244,108 | | |
VOLT XXXVIII LLC 2015-NP12 A1 — 3.875% 9/25/2045**,@@ | | | 11,903,687 | | | | 11,910,021 | | |
| | | $ | 271,383,623 | | |
| TOTAL RESIDENTIAL MORTGAGE-BACKED SECURITIES (Cost $635,302,945) | | $ | 633,285,659 | | |
ASSET-BACKED SECURITIES — 53.0% | |
AUTO — 17.8% | |
Ally Auto Receivables Trust 2015-1 A3 — 1.39% 9/16/2019 | | $ | 12,281,943 | | | $ | 12,277,737 | | |
Ally Auto Receivables Trust 2017-1 B — 2.35% 3/15/2022 | | | 3,743,000 | | | | 3,735,812 | | |
Ally Auto Receivables Trust 2017-1 C — 2.48% 5/16/2022 | | | 7,059,000 | | | | 7,049,352 | | |
AmeriCredit Automobile Receivables Trust 2014-2 B — 1.60% 7/8/2019 | | | 615,105 | | | | 615,145 | | |
AmeriCredit Automobile Receivables Trust 2014-1 B — 1.68% 7/8/2019 | | | 63,693 | | | | 63,695 | | |
AmeriCredit Automobile Receivables Trust 2015-2 B — 1.82% 7/8/2020 | | | 6,678,000 | | | | 6,680,959 | | |
AmeriCredit Automobile Receivables Trust 2014-3 B — 1.92% 11/8/2019 | | | 10,560,770 | | | | 10,566,041 | | |
AmeriCredit Automobile Receivables Trust 2015-3 B — 2.08% 9/8/2020 | | | 19,000,000 | | | | 19,053,909 | | |
AmeriCredit Automobile Receivables Trust 2015-4 B — 2.11% 1/8/2021 | | | 28,000,000 | | | | 28,037,058 | | |
AmeriCredit Automobile Receivables Trust 2013-5 C — 2.29% 11/8/2019 | | | 1,441,506 | | | | 1,442,675 | | |
AmeriCredit Automobile Receivables Trust 2013-3 C — 2.38% 6/10/2019 | | | 177,641 | | | | 177,652 | | |
AmeriCredit Automobile Receivables Trust 2015-1 C — 2.51% 1/8/2021 | | | 1,727,000 | | | | 1,739,039 | | |
15
FPA NEW INCOME, INC.
PORTFOLIO OF INVESTMENTS (Continued)
September 30, 2017
BONDS & DEBENTURES — Continued | | Principal
Amount | | Fair
Value | |
AmeriCredit Automobile Receivables Trust 2017-1 C — 2.71% 8/18/2022 | | $ | 7,547,000 | | | $ | 7,560,020 | | |
BMW Vehicle Lease Trust 2017-1 A4 — 2.18% 6/22/2020 | | | 18,527,000 | | | | 18,579,696 | | |
California Republic Auto Receivables Trust 2013-2 A2 — 1.23% 3/15/2019 | | | 255,480 | | | | 255,444 | | |
Capital Auto Receivables Asset Trust 2016-3 A3 — 1.54% 8/20/2020 | | | 9,410,000 | | | | 9,399,291 | | |
Capital Auto Receivables Asset Trust 2015-2 A3 — 1.73% 9/20/2019 | | | 29,993,612 | | | | 30,018,653 | | |
Capital Auto Receivables Asset Trust 2014-3 A4 — 1.83% 4/22/2019 | | | 4,575,862 | | | | 4,577,413 | | |
Capital Auto Receivables Asset Trust 2013-4 C — 2.67% 2/20/2019 | | | 1,093,029 | | | | 1,093,697 | | |
Capital Auto Receivables Asset Trust 2016-1 B — 2.67% 12/21/2020 | | | 4,211,000 | | | | 4,236,250 | | |
Credit Acceptance Auto Loan Trust 2015-1A A — 2.00% 7/15/2022** | | | 488,485 | | | | 488,616 | | |
Credit Acceptance Auto Loan Trust 2016-2A A — 2.42% 11/15/2023** | | | 9,956,000 | | | | 9,995,301 | | |
Credit Acceptance Auto Loan Trust 2017-2A A — 2.55% 2/17/2026** | | | 50,778,000 | | | | 50,733,960 | | |
Credit Acceptance Auto Loan Trust 2015-1A B — 2.61% 1/17/2023** | | | 3,160,000 | | | | 3,164,376 | | |
Credit Acceptance Auto Loan Trust 2014-2A B — 2.67% 9/15/2022** | | | 7,204,672 | | | | 7,205,879 | | |
Credit Acceptance Auto Loan Trust 2016-3A B — 2.94% 10/15/2024** | | | 20,626,000 | | | | 20,669,851 | | |
Credit Acceptance Auto Loan Trust 2015-2A B — 3.04% 8/15/2023** | | | 27,401,000 | | | | 27,608,009 | | |
Credit Acceptance Auto Loan Trust 2016-2A B — 3.18% 5/15/2024** | | | 22,937,000 | | | | 23,087,997 | | |
Credit Acceptance Auto Loan Trust 2016-3A C — 3.60% 4/15/2025** | | | 12,661,000 | | | | 12,758,369 | | |
Credit Acceptance Auto Loan Trust 2015-2A C — 3.76% 2/15/2024** | | | 550,000 | | | | 556,121 | | |
DT Auto Owner Trust 2016-4A B — 2.02% 8/17/2020** | | | 13,677,000 | | | | 13,655,533 | | |
DT Auto Owner Trust 2015-3A B — 2.46% 11/15/2019** | | | 5,379,779 | | | | 5,381,123 | | |
DT Auto Owner Trust 2017-1A C — 2.70% 11/15/2022** | | | 18,717,000 | | | | 18,711,245 | | |
DT Auto Owner Trust 2016-2A B — 2.92% 5/15/2020** | | | 4,606,782 | | | | 4,613,593 | | |
Exeter Automobile Receivables Trust 2016-3A A — 1.84% 11/16/2020** | | | 12,315,527 | | | | 12,280,297 | | |
Exeter Automobile Receivables Trust 2017-1A B — 3.00% 12/15/2021** | | | 8,763,000 | | | | 8,772,879 | | |
First Investors Auto Owner Trust 2016-2A A2 — 1.87% 11/15/2021** | | | 5,514,000 | | | | 5,502,207 | | |
First Investors Auto Owner Trust 2016-1A A2 — 2.26% 4/15/2021** | | | 16,653,000 | | | | 16,679,876 | | |
First Investors Auto Owner Trust 2015-2A A2 — 2.28% 9/15/2021** | | | 16,556,000 | | | | 16,584,438 | | |
First Investors Auto Owner Trust 2017-1A B — 2.67% 4/17/2023** | | | 4,126,000 | | | | 4,124,598 | | |
First Investors Auto Owner Trust 2015-2A B — 2.75% 9/15/2021** | | | 4,443,000 | | | | 4,445,655 | | |
First Investors Auto Owner Trust 2017-1A C — 2.95% 4/17/2023** | | | 8,149,000 | | | | 8,152,934 | | |
GM Financial Automobile Leasing Trust 2016-3 C — 2.38% 5/20/2020 | | | 7,768,000 | | | | 7,750,023 | | |
GM Financial Automobile Leasing Trust 2017-2 B — 2.43% 6/21/2021 | | | 22,240,000 | | | | 22,145,080 | | |
GM Financial Automobile Leasing Trust 2017-1 B — 2.48% 8/20/2020 | | | 6,027,000 | | | | 6,047,506 | | |
GM Financial Automobile Leasing Trust 2017-1 C — 2.74% 8/20/2020 | | | 21,903,000 | | | | 21,927,538 | | |
GM Financial Automobile Leasing Trust 2017-2 C — 2.84% 6/21/2021 | | | 3,750,000 | | | | 3,735,332 | | |
Honda Auto Receivables Owner Trust 2015-2 A3 — 1.04% 2/21/2019 | | | 11,651,242 | | | | 11,639,015 | | |
Hyundai Auto Lease Securitization Trust 2016-C B — 1.86% 5/17/2021** | | | 13,264,000 | | | | 13,170,100 | | |
Nissan Auto Lease Trust 2017-A A3 — 1.91% 4/15/2020 | | | 21,315,000 | | | | 21,327,962 | | |
Prestige Auto Receivables Trust 2015-1 A3 — 1.53% 2/15/2021** | | | 4,120,775 | | | | 4,120,056 | | |
Prestige Auto Receivables Trust 2016-1A A3 — 1.99% 6/15/2020** | | | 7,917,000 | | | | 7,926,674 | | |
Prestige Auto Receivables Trust 2015-1 B — 2.04% 4/15/2021** | | | 10,395,000 | | | | 10,403,463 | | |
Prestige Auto Receivables Trust 2016-2A B — 2.19% 11/15/2022** | | | 25,223,000 | | | | 25,073,776 | | |
Prestige Auto Receivables Trust 2017-1A B — 2.39% 5/16/2022** | | | 12,040,000 | | | | 11,973,106 | | |
Prestige Auto Receivables Trust 2017-1A C — 2.81% 1/17/2023** | | | 30,214,000 | | | | 30,304,313 | | |
Prestige Auto Receivables Trust 2016-2A C — 2.88% 11/15/2022** | | | 12,327,000 | | | | 12,378,889 | | |
Santander Drive Auto Receivables Trust 2016-2 A3 — 1.56% 5/15/2020 | | | 12,350,144 | | | | 12,349,807 | | |
Santander Drive Auto Receivables Trust 2013-3 C — 1.81% 4/15/2019 | | | 75,819 | | | | 75,820 | | |
Santander Drive Auto Receivables Trust 2015-2 B — 1.83% 1/15/2020 | | | 1,067,930 | | | | 1,068,329 | | |
16
FPA NEW INCOME, INC.
PORTFOLIO OF INVESTMENTS (Continued)
September 30, 2017
BONDS & DEBENTURES — Continued | | Principal
Amount | | Fair
Value | |
Santander Drive Auto Receivables Trust 2015-5 B — 1.96% 5/15/2020 | | $ | 36,741,982 | | | $ | 36,722,961 | | |
Santander Drive Auto Receivables Trust 2015-1 B — 1.97% 11/15/2019 | | | 2,190,695 | | | | 2,191,032 | | |
Santander Drive Auto Receivables Trust 2015-3 B — 2.07% 4/15/2020 | | | 14,404,580 | | | | 14,418,195 | | |
Santander Drive Auto Receivables Trust 2017-3 B — 2.19% 3/15/2022 | | | 30,359,000 | | | | 30,260,585 | | |
Santander Drive Auto Receivables Trust 2014-2 C — 2.33% 11/15/2019 | | | 3,944,327 | | | | 3,952,368 | | |
Santander Drive Auto Receivables Trust 2015-1 C — 2.57% 4/15/2021 | | | 9,270,000 | | | | 9,308,948 | | |
Santander Drive Auto Receivables Trust 2017-1 C — 2.58% 5/16/2022 | | | 7,621,000 | | | | 7,608,454 | | |
Santander Drive Auto Receivables Trust 2014-4 C — 2.60% 11/16/2020 | | | 11,427,463 | | | | 11,468,747 | | |
Santander Drive Auto Receivables Trust 2016-2 C — 2.66% 11/15/2021 | | | 4,882,000 | | | | 4,920,392 | | |
Santander Drive Auto Receivables Trust 2013-5 D — 2.73% 10/15/2019 | | | 16,422,000 | | | | 16,518,957 | | |
Santander Drive Auto Receivables Trust 2014-2 D — 2.76% 2/18/2020 | | | 8,332,000 | | | | 8,389,169 | | |
Santander Drive Auto Receivables Trust 2017-2 C — 2.79% 8/15/2022 | | | 12,325,000 | | | | 12,359,320 | | |
Santander Drive Auto Receivables Trust 2013-4 C — 3.25% 1/15/2020 | | | 97,968 | | | | 98,036 | | |
Westlake Automobile Receivables Trust 2015-3A B — 2.21% 5/17/2021** | | | 13,009,089 | | | | 13,010,680 | | |
Westlake Automobile Receivables Trust 2015-1A C — 2.29% 11/16/2020** | | | 207,617 | | | | 207,747 | | |
Westlake Automobile Receivables Trust 2015-2A C — 2.45% 1/15/2021** | | | 441,689 | | | | 441,931 | | |
Westlake Automobile Receivables Trust 2016-3A C — 2.46% 1/18/2022** | | | 19,575,000 | | | | 19,492,938 | | |
Westlake Automobile Receivables Trust 2017-1A C — 2.70% 10/17/2022** | | | 11,439,000 | | | | 11,482,349 | | |
Westlake Automobile Receivables Trust 2015-3A C — 3.05% 5/17/2021** | | | 550,000 | | | | 551,086 | | |
World Omni Automobile Lease Securitization Trust 2015-A A4 — 1.73% 12/15/2020 | | | 15,000,000 | | | | 15,008,797 | | |
World Omni Automobile Lease Securitization Trust 2015-A B — 1.94% 12/15/2020 | | | 12,350,000 | | | | 12,349,433 | | |
World Omni Automobile Lease Securitization Trust 2017-A A4 — 2.32% 8/15/2022 | | | 5,473,000 | | | | 5,479,116 | | |
World Omni Automobile Lease Securitization Trust 2017-A B — 2.48% 8/15/2022 | | | 10,102,000 | | | | 10,114,099 | | |
| | | $ | 912,104,524 | | |
COLLATERALIZED LOAN OBLIGATION — 14.0% | |
Adams Mill CLO Ltd. 2014-1A B2R — 3.35% 7/15/2026** | | $ | 8,136,000 | | | $ | 8,087,688 | | |
Black Diamond CLO Ltd.
2014-1A A1R, 3M USD LIBOR + 1.150% — 2.454% 10/17/2026**,@ | | | 33,585,000 | | | | 33,672,758 | | |
BlueMountain CLO Ltd. 2013-4A — 3.36% 4/15/2025** | | | 8,598,000 | | | | 8,614,353 | | |
Cerberus Loan Funding XVIII LP
2017-1A A, 3M USD LIBOR + 1.750% — 3.054% 4/15/2027**,@ | | | 42,107,000 | | | | 42,156,686 | | |
Cerberus Onshore II CLO-2 LLC
2014-1A A, 3M USD LIBOR + 1.900% — 3.204% 10/15/2023**,@ | | | 941,905 | | | | 942,029 | | |
Cerberus Onshore II CLO-2 LLC
2014-1A B, 3M USD LIBOR + 2.700% — 4.004% 10/15/2023**,@ | | | 6,612,000 | | | | 6,612,840 | | |
CIFC Funding 2013-III Ltd. 2013-3A A2BR — 3.40% 10/24/2025** | | | 6,498,000 | | | | 6,509,924 | | |
CIFC Funding 2013-IV Ltd. 2013-4A A2R — 2.72% 11/27/2024** | | | 14,822,000 | | | | 14,843,848 | | |
Elm Trust 2016-1A A2 — 4.163% 6/20/2025** | | | 13,183,000 | | | | 13,463,139 | | |
Flagship VII Ltd. 2013-7A A2R — 2.70% 1/20/2026** | | | 17,551,000 | | | | 17,574,466 | | |
Fortress Credit Opportunities III CLO LP
2014-3A A1TR, 3M USD LIBOR + 1.650% — 2.953% 4/28/2026**,@ | | | 48,830,000 | | | | 48,942,309 | | |
Fortress Credit Opportunities III CLO LP
2014-3A DR, 3M USD LIBOR + 4.100% — 5.403% 4/28/2026**,@ | | | 8,143,000 | | | | 8,189,106 | | |
Fortress Credit Opportunities V CLO Ltd.
2014-5A A1FR — 3.40% 10/15/2026** | | | 25,265,000 | | | | 25,282,054 | | |
Fortress Credit Opportunities V CLO Ltd.
2014-5A A2R — 3.75% 10/15/2026** | | | 6,584,000 | | | | 6,566,822 | | |
17
FPA NEW INCOME, INC.
PORTFOLIO OF INVESTMENTS (Continued)
September 30, 2017
BONDS & DEBENTURES — Continued | | Principal
Amount | | Fair
Value | |
Fortress Credit Opportunities VII CLO, Ltd.
2016-7I E, 3M USD LIBOR + 7.490% — 8.81% 12/15/2028@ | | $ | 20,895,000 | | | $ | 21,012,430 | | |
Halcyon Loan Advisors Funding,
3M USD LIBOR + 1.100% — 2.413% 10/22/2025**,@ | | | 18,450,000 | | | | 18,459,631 | | |
ICG US CLO Ltd. 2014-3A A1BR — 2.97% 1/25/2027** | | | 34,490,000 | | | | 34,526,801 | | |
Jamestown CLO III Ltd. 2013-3A A1BR — 2.753% 1/15/2026** | | | 16,675,000 | | | | 16,694,110 | | |
MidOcean Credit CLO I
2012-1A A2R, 3M USD LIBOR + 2.500% — 3.804% 1/15/2024**,@ | | | 18,780,000 | | | | 18,882,426 | | |
Nelder Grove CLO Ltd. 2014-1A AFR — 3.00% 8/28/2026** | | | 7,465,000 | | | | 7,497,264 | | |
NewMark Capital Funding CLO, Ltd. 2014-2A AFR — 3.077% 6/30/2026** | | | 5,750,000 | | | | 5,775,495 | | |
NewMark Capital Funding CLO, Ltd. 2014-2A BFR — 3.669% 6/30/2026** | | | 10,199,000 | | | | 10,247,557 | | |
Northwoods Capital X Ltd. 2013-10A A2R — 2.649% 11/4/2025** | | | 29,490,000 | | | | 29,451,103 | | |
Northwoods Capital X Ltd. 2013-10A B2R — 3.442% 11/4/2025** | | | 4,000,000 | | | | 4,007,020 | | |
Oaktree CLO Ltd. 2014-2A A1BR — 2.953% 10/20/2026** | | | 10,752,000 | | | | 10,797,051 | | |
Ocean Trails CLO V 2014-5A C2R — 4.70% 10/13/2026** | | | 6,814,000 | | | | 6,888,259 | | |
OHA Loan Funding LLC 2014-1A A2R — 2.95% 10/20/2026** | | | 20,832,000 | | | | 20,843,208 | | |
Peaks CLO 1, Ltd.
2014-1A C, 3M USD LIBOR + 3.500% — 4.804% 6/15/2026**,@ | | | 12,077,000 | | | | 12,079,029 | | |
Peaks CLO, 1 Ltd.
2014-1A A, 3M USD LIBOR + 1.750% — 3.054% 6/15/2026**,@ | | | 31,573,000 | | | | 31,610,824 | | |
Saranac CLO II Ltd.
2014-2A A2, 3M USD LIBOR + 1.750% — 3.066% 2/20/2025**,@ | | | 11,720,000 | | | | 11,741,166 | | |
Saranac CLO II Ltd.
2014-2A B, 3M USD LIBOR + 2.050% — 3.366% 2/20/2025**,@ | | | 3,750,000 | | | | 3,764,089 | | |
Senior Credit Fund SPV LLC 2016-1A — 3.033% 12/19/2025†† | | | 34,234,000 | | | | 34,278,504 | | |
Silvermore CLO Ltd., 3M USD LIBOR + 1.170% — 2.485% 5/15/2026**,@ | | | 24,974,259 | | | | 24,973,984 | | |
Symphony CLO XII Ltd. 2013-12A B2R — 3.50% 10/15/2025** | | | 15,800,000 | | | | 15,824,664 | | |
Telos CLO
2013-3A AR, 3M USD LIBOR + 1.300% — 2.571% 7/17/2026**,@ | | | 17,353,000 | | | | 17,352,531 | | |
Telos CLO
2013-3A BR, 3M USD LIBOR + 2.000% — 3.271% 7/17/2026**,@ | | | 20,644,000 | | | | 20,643,381 | | |
Telos CLO, Ltd.
2014-5A A, 3M USD LIBOR + 1.550% — 2.854% 4/17/2025**,@ | | | 31,420,000 | | | | 31,564,343 | | |
Washington Mill CLO Ltd. 2014-1A A2R — 2.90% 4/20/2026** | | | 8,859,000 | | | | 8,882,166 | | |
Washington Mill CLO Ltd. 2014-1A B2R — 3.60% 4/20/2026** | | | 11,052,000 | | | | 11,090,185 | | |
West CLO Ltd. 2013-1A A1BR — 2.745% 11/7/2025** | | | 27,181,000 | | | | 27,199,945 | | |
West CLO Ltd. 2013-1A A2BR — 3.393% 11/7/2025** | | | 12,780,000 | | | | 12,800,601 | | |
Zais CLO 2 Ltd. 2014-2A A1BR — 2.92% 7/25/2026** | | | 6,979,000 | | | | 7,006,016 | | |
| | | $ | 717,351,805 | | |
CREDIT CARD — 3.6% | |
Cabela's Credit Card Master Note Trust 2016-1 A1 — 1.78% 6/15/2022 | | $ | 51,561,000 | | | $ | 51,433,727 | | |
Capital One Multi-Asset Execution Trust 2016-A6 A6 — 1.82% 9/15/2022 | | | 38,371,000 | | | | 38,354,888 | | |
Capital One Multi-Asset Execution Trust 2017-A1 A1 — 2.00% 1/17/2023 | | | 48,839,000 | | | | 48,980,462 | | |
Discover Card Execution Note Trust 2014-A4 A4 — 2.12% 12/15/2021 | | | 42,672,000 | | | | 42,906,568 | | |
Synchrony Credit Card Master Note Trust 2016-3 B — 1.91% 9/15/2022 | | | 3,847,000 | | | | 3,820,061 | | |
| | | $ | 185,495,706 | | |
18
FPA NEW INCOME, INC.
PORTFOLIO OF INVESTMENTS (Continued)
September 30, 2017
BONDS & DEBENTURES — Continued | | Principal
Amount | | Fair
Value | |
EQUIPMENT — 8.8% | |
ARI Fleet Lease Trust 2015-A A2 — 1.11% 11/15/2018** | | $ | 3,446,057 | | | $ | 3,443,629 | | |
ARI Fleet Lease Trust 2016-A A2 — 1.82% 7/15/2024** | | | 12,780,337 | | | | 12,786,422 | | |
Ascentium Equipment Receivables LLC 2015-2A B — 2.62% 12/10/2019** | | | 4,102,000 | | | | 4,106,839 | | |
Ascentium Equipment Receivables Trust 2016-1A A2 — 1.75% 11/13/2018** | | | 326,633 | | | | 326,631 | | |
Avis Budget Rental Car Funding AESOP LLC 2014-2A A — 2.50% 2/20/2021** | | | 6,084,000 | | | | 6,096,274 | | |
Avis Budget Rental Car Funding AESOP LLC 2015-1A A — 2.50% 7/20/2021** | | | 48,498,000 | | | | 48,368,292 | | |
Avis Budget Rental Car Funding AESOP LLC 2015-2A A — 2.63% 12/20/2021** | | | 22,566,000 | | | | 22,551,161 | | |
CCG Receivables Trust 2015-1 A2 — 1.46% 11/14/2018** | | | 4,038,980 | | | | 4,035,448 | | |
Chesapeake Funding II LLC 2016-2A A1 — 1.88% 6/15/2028** | | | 25,004,414 | | | | 25,009,175 | | |
Chesapeake Funding II LLC 2016-1A A1 — 2.11% 3/15/2028** | | | 25,469,876 | | | | 25,527,415 | | |
Coinstar Funding LLC Series 2017-1A A2 — 5.216% 4/25/2047** | | | 8,403,938 | | | | 8,713,616 | | |
Enterprise Fleet Financing LLC 2014-2 A2 — 1.05% 3/20/2020** | | | 674,410 | | | | 674,215 | | |
Enterprise Fleet Financing LLC 2015-2 A2 — 1.59% 2/22/2021** | | | 20,357,302 | | | | 20,342,317 | | |
Enterprise Fleet Financing LLC 2016-2 A2 — 1.74% 2/22/2022** | | | 15,342,898 | | | | 15,325,045 | | |
Enterprise Fleet Financing LLC 2017-2 A2 — 1.97% 1/20/2023** | | | 14,450,000 | | | | 14,441,024 | | |
Enterprise Fleet Financing LLC 2017-1 A3 — 2.60% 7/20/2022** | | | 9,453,000 | | | | 9,549,099 | | |
GreatAmerica Leasing Receivables Funding LLC Series
2017-1 A4 — 2.36% 1/20/2023** | | | 6,562,000 | | | | 6,548,020 | | |
GreatAmerica Leasing Receivables Funding LLC Series
2017-1 C — 2.89% 1/22/2024** | | | 2,609,000 | | | | 2,604,205 | | |
Hertz Fleet Lease Funding LP 2016-1 A2 — 1.96% 4/10/2030** | | | 18,366,911 | | | | 18,334,178 | | |
Hertz Fleet Lease Funding LP 2017-1 A2 — 2.13% 4/10/2031** | | | 20,226,000 | | | | 20,212,192 | | |
Leaf Receivables Funding 12 LLC 2017-1 A3 — 2.07% 8/15/2020**,†† | | | 7,553,000 | | | | 7,542,380 | | |
Leaf Receivables Funding 12 LLC 2017-1 A4 — 2.43% 7/15/2021**,†† | | | 5,552,000 | | | | 5,542,029 | | |
NextGear Floorplan Master Owner Trust 2015-2A A — 2.38% 10/15/2020** | | | 10,000,000 | | | | 10,040,765 | | |
NextGear Floorplan Master Owner Trust 2017-1A A2 — 2.54% 4/18/2022** | | | 22,933,000 | | | | 22,881,155 | | |
Prop Series 2017-1A — 5.30% 3/15/2042†† | | | 38,879,747 | | | | 39,307,424 | | |
Verizon Owner Trust 2016-2A A — 1.68% 5/20/2021** | | | 8,830,000 | | | | 8,795,884 | | |
Verizon Owner Trust 2017-2A A — 1.92% 12/20/2021** | | | 26,369,000 | | | | 26,341,953 | | |
Verizon Owner Trust 2017-2A B — 2.22% 12/20/2021** | | | 24,047,000 | | | | 23,921,234 | | |
Verizon Owner Trust 2017-1A B — 2.45% 9/20/2021** | | | 33,682,000 | | | | 33,832,521 | | |
Volvo Financial Equipment LLC Series 2017-1A A4 — 2.21% 11/15/2021** | | | 5,916,000 | | | | 5,907,189 | | |
| | | $ | 453,107,731 | | |
OTHER — 8.8% | |
InSite Issuer LLC — 8.595% 8/15/2020**,†† | | $ | 12,001,000 | | | $ | 12,827,789 | | |
MMAF Equipment Finance LLC 2013-AA A4 — 1.68% 5/11/2020** | | | 6,502,141 | | | | 6,504,925 | | |
New Residential Advance Receivables Trust
2015-ON1 2016-T4 AT4 — 3.107% 12/15/2050**,†† | | | 50,294,000 | | | | 50,485,620 | | |
New Residential Advance Receivables Trust Advance Receivables Backed
2016-T1 AT1 — 2.751% 6/15/2049** | | | 16,005,500 | | | | 15,909,467 | | |
New Residential Advance Receivables Trust Advance Receivables Backed Notes
2016-T2 AT2 — 2.575% 10/15/2049** | | | 50,834,000 | | | | 50,450,834 | | |
New Residential Advance Receivables Trust Advance Receivables Backed Notes
2017-T1 AT1 — 3.214% 2/15/2051**,†† | | | 46,789,000 | | | | 47,042,128 | | |
Ocwen Master Advance Receivables Trust
2017-T1 AT1 — 2.499% 9/15/2048**,†† | | | 4,566,000 | | | | 4,566,000 | | |
19
FPA NEW INCOME, INC.
PORTFOLIO OF INVESTMENTS (Continued)
September 30, 2017
BONDS & DEBENTURES — Continued | | Principal
Amount | | Fair
Value | |
Ocwen Master Advance Receivables Trust
2016-T1 AT1 — 2.521% 8/17/2048** | | $ | 51,028,000 | | | $ | 50,948,269 | | |
Oportun Funding III LLC 2016-B A — 3.69% 7/8/2021** | | | 10,122,000 | | | | 10,129,810 | | |
Oportun Funding IV LLC 2016-C A — 3.28% 11/8/2021** | | | 9,739,000 | | | | 9,674,025 | | |
Panhandle-Plains Student Finance Corporation
2001-1 A2 — 2.735% 12/1/2031††,@ | | | 5,500,000 | | | | 5,465,625 | | |
PFS Financing Corp. 2016-BA A — 1.87% 10/15/2021** | | | 3,481,000 | | | | 3,454,250 | | |
PFS Financing Corp. 2017-BA A2 — 2.22% 7/15/2022** | | | 22,038,000 | | | | 22,032,252 | | |
PFS Financing Corp. 2017-BA B — 2.57% 7/15/2022** | | | 7,305,000 | | | | 7,303,817 | | |
PFS Financing Corporation
2014-BA A, 1M LIBOR + 0.600% — 1.834% 10/15/2019**,@ | | | 33,006,000 | | | | 33,048,264 | | |
PFS Financing Corporation
2015-AA A, 1M LIBOR + 0.620% — 1.854% 4/15/2020**,@ | | | 29,100,000 | | | | 29,132,138 | | |
PFS Financing Corporation
2015-AA B, 1M LIBOR + 0.900% — 2.127% 4/15/2020**,@ | | | 500,000 | | | | 497,960 | | |
PFS Financing Corporation
2016-A A, 1M LIBOR + 1.200% — 2.434% 2/18/2020**,@ | | | 57,776,000 | | | | 57,989,165 | | |
Unison Ground Lease Funding LLC 2013-1 B — 5.78% 3/15/2020**,†† | | | 10,932,000 | | | | 10,853,598 | | |
Unison Ground Lease Funding LLC 2013-2 B — 6.268% 3/15/2020** | | | 3,768,000 | | | | 3,521,305 | | |
WCP ISSUER LLC 2013-1 B — 6.657% 8/15/2020**,†† | | | 15,000,000 | | | | 15,526,222 | | |
Wheels SPV 2 LLC 2015-1A A2 — 1.27% 4/22/2024** | | | 3,684,038 | | | | 3,680,818 | | |
| | | $ | 451,044,281 | | |
| TOTAL ASSET-BACKED SECURITIES (Cost $2,715,134,608) | | $ | 2,719,104,047 | | |
CORPORATE BONDS & NOTES — 2.9% | |
BASIC MATERIALS — 1.0% | |
PT Boart Longyear Management Pty Ltd.
PIK, 10.00% Cash or 12.00% PIK — 10.00% 12/31/2022 | | $ | 57,655,626 | | | $ | 50,052,290 | | |
CONSUMER, CYCLICAL — 0.4% | |
Northwest Airlines 1999-2 Class C Pass Through Trust — 8.304% 9/1/2010†† | | $ | 17,800,245 | | | $ | 6,630,591 | | |
Northwest Airlines 2000-1 Class G Pass Through Trust — 7.15% 10/1/2019 | | | 8,533,852 | | | | 8,960,545 | | |
US Airways 1998-1B Pass Through Trust — 7.35% 1/30/2018 | | | 3,780,561 | | | | 3,740,487 | | |
US Airways 1998-1C Pass Through Trust — 6.82% 1/30/2019†† | | | 2,362,334 | | | | 7,890 | | |
US Airways 1999-1C Pass Through Trust — 7.96% 1/20/2018†† | | | 4,341,206 | | | | 1,534,616 | | |
Continental Airlines 2000-1 Class B Pass Through Trust — 8.388% 11/1/2020 | | | 2,510 | | | | 2,825 | | |
| | | $ | 20,876,954 | | |
CONSUMER, NON-CYCLICAL — 0.1% | |
StoneMor Partners LP / Cornerstone Family Services of West Virginia
Subsidiary — 7.875% 6/1/2021 | | $ | 6,282,000 | | | $ | 6,030,720 | | |
ENERGY — 0.2% | |
PHI, Inc. — 5.25% 3/15/2019 | | $ | 11,499,000 | | | $ | 11,182,778 | | |
20
FPA NEW INCOME, INC.
PORTFOLIO OF INVESTMENTS (Continued)
September 30, 2017
BONDS & DEBENTURES — Continued | | Principal
Amount | | Fair
Value | |
FINANCIAL — 0.4% | |
N671US Trust — 7.50% 9/15/2020**,†† | | $ | 8,045,244 | | | $ | 8,065,357 | | |
Berkshire Hathaway Finance Corporation,
3M USD LIBOR + 0.260% — 1.575% 8/15/2019@ | | | 12,753,000 | | | | 12,796,644 | | |
| | | $ | 20,862,001 | | |
INDUSTRIAL — 0.3% | |
Air 2 US — 8.027% 10/1/2019** | | $ | 2,669,437 | | | $ | 2,751,189 | | |
Air 2 US — 10.127% 10/1/2020**,†† | | | 39,258,228 | | | | 9,814,557 | | |
| | | $ | 12,565,746 | | |
TECHNOLOGY — 0.5% | |
Apple, Inc. — 1.90% 2/7/2020 | | $ | 25,563,000 | | | $ | 25,647,969 | | |
| TOTAL CORPORATE BONDS & NOTES (Cost $165,591,591) | | $ | 147,218,458 | | |
CORPORATE BANK DEBT — 4.4% | |
ACCTL2, 3M LIBOR + 4.75% — 6.06% 7/28/2023††,**,@ | | $ | 19,235,053 | | | $ | 19,235,053 | | |
ACCTL2, Prime + 3.75% — 8.00% 7/28/2023††,**,@ | | | 48,532 | | | | 48,532 | | |
Authentic Brands TL 2L, 3M LIBOR + 7.75% — 9.075% 9/26/2025**,@ | | | 5,049,000 | | | | 5,086,868 | | |
Boart Longyear Management Pty Ltd TL — 10.00% Cash or
11.00% PIK 10/23/2020**,@ | | | 4,022,120 | | | | 3,861,838 | | |
Intelsat Jackson Holding SA, 3M LIBOR + 2.75% — 4.07% 6/30/2019**,@ | | | 25,972,703 | | | | 25,883,357 | | |
Internap Corp. TL 1L, 3M LIBOR + 7.00% — 8.24% 4/3/2022**,@ | | | 11,500,000 | | | | 11,586,250 | | |
Logix Holding Co. LLC TL 1L — 2.87% 7/17/2024**,@ | | | 11,707,000 | | | | 11,756,286 | | |
MB1LTL, 1M LIBOR + 5.00% — 6.24% 11/30/2022††,**,@ | | | 26,388,519 | | | | 26,482,462 | | |
MB1LDDTL, 1M LIBOR + 2.26% — 2.33% 12/2/2022††,** | | | 2,307,601 | | | | 8,215 | | |
MB2LTL, 1M LIBOR + 9.25% — 10.49% 11/30/2023††,**,@ | | | 6,816,000 | | | | 6,813,069 | | |
OTGDDTL, 1.00% — 1.00% 8/26/2021††,** | | | 780,000 | | | | 21,450 | | |
| OTGTL, 2M LIBOR + 8.50% — 9.77% 8/26/2021††,**,@ | | | 1,033,500 | | | | 1,041,251 | | |
OTGTL 3M LIBOR + 8.50% — 9.77% 8/26/2021††,**,@ | | | 20,106,500 | | | | 20,257,299 | | |
SDTL, 3M LIBOR + 6.00% — 7.33% 12/22/2021††,**,@ | | | 13,855,250 | | | | 13,872,569 | | |
Sears Roebuck Acceptance Corp. TL, 3M LIBOR + 4.50% — 5.74% 6/30/2018**,@ | | | 19,928,573 | | | | 19,679,466 | | |
Xplornet Communications Inc. TL-B 1L,
3M LIBOR + 4.75% — 7.56% 9/9/2021**,@ | | | 39,396,447 | | | | 39,667,495 | | |
ZW1L, 3M LIBOR + 5.00% — 6.32% 11/17/2022††,**,@ | | | 13,527,775 | | | | 13,544,685 | | |
ZW2L, 3M LIBOR + 9.00% — 10.314% 11/17/2023††,**,@ | | | 4,870,000 | | | | 4,863,913 | | |
| TOTAL CORPORATE BANK DEBT (Cost $221,182,353) | | $ | 223,710,058 | | |
MUNICIPALS — 0.1% | |
Wayne County GO, (TXBL-NTS), — 4.25% 12/1/2018 (Cost $4,387,000) | | $ | 4,387,000 | | | $ | 4,419,376 | | |
U.S. TREASURIES — 14.9% | |
U.S. Treasury Notes — 0.75% 10/31/2017 | | $ | 35,000,000 | | | $ | 34,987,694 | | |
U.S. Treasury Notes — 1.875% 10/31/2017 | | | 10,000,000 | | | | 10,004,297 | | |
U.S. Treasury Notes — 0.875% 11/15/2017 | | | 10,000,000 | | | | 9,997,852 | | |
21
FPA NEW INCOME, INC.
PORTFOLIO OF INVESTMENTS (Continued)
September 30, 2017
BONDS & DEBENTURES — Continued | | Principal
Amount | | Fair
Value | |
U.S. Treasury Notes — 4.25% 11/15/2017 | | $ | 29,450,000 | | | $ | 29,559,286 | | |
U.S. Treasury Notes — 0.875% 11/30/2017 | | | 60,000,000 | | | | 59,977,734 | | |
U.S. Treasury Notes — 1.00% 12/15/2017 | | | 100,843,000 | | | | 100,837,091 | | |
U.S. Treasury Notes — 2.625% 1/31/2018 | | | 90,000,000 | | | | 90,427,149 | | |
| U.S. Treasury Notes — 0.75% 2/28/2018 | | | 90,000,000 | | | | 89,841,798 | | |
U.S. Treasury Notes — 0.75% 3/31/2018 | | | 90,000,000 | | | | 89,783,793 | | |
U.S. Treasury Notes — 1.375% 1/15/2020 | | | 99,363,000 | | | | 99,004,965 | | |
U.S. Treasury Notes — 1.375% 8/31/2020 | | | 114,135,000 | | | | 113,315,146 | | |
U.S. Treasury Notes — 1.375% 10/31/2020 | | | 34,456,000 | | | | 34,159,461 | | |
| TOTAL U.S. TREASURIES (Cost $763,979,466) | | $ | 761,896,266 | | |
| TOTAL BONDS & DEBENTURES — 99.5% (Cost $5,165,044,389) | | $ | 5,101,832,913 | | |
| TOTAL INVESTMENT SECURITIES — 99.6% (Cost $5,165,674,736) | | $ | 5,106,959,121 | | |
SHORT-TERM INVESTMENTS — 0.9% | |
State Street Bank Repurchase Agreement — 0.12% 10/2/2017 | |
(Dated 09/29/2017, repurchase price of $46,301,463, collateralized by
$46,515,000 principal amount U.S. Treasury Notes — 2.25% 2024,
fair value $47,227,331) | | $ | 46,301,000 | | | $ | 46,301,000 | | |
| TOTAL SHORT-TERM INVESTMENTS (Cost $46,301,000) | | $ | 46,301,000 | | |
| TOTAL INVESTMENTS — 100.5% (Cost $5,211,975,736) | | $ | 5,153,260,121 | | |
Other Assets and Liabilities, net — (0.5)% | | | (27,827,501 | ) | |
NET ASSETS — 100.0% | | $ | 5,125,432,620 | | |
* Non-income producing security.
@ Variable/Floating Rate Security — The rate shown is based on the latest available information as of September 30, 2017. For Senior Loan Notes, the rate shown may represent a weighted average interest rate. Certain variable rate securities are not based on a published reference rate and spread but are determined by the issuer or agent and are based on current market conditions. These securities do not indicate a reference rate and spread in their description.
** Restricted securities. These restricted securities constituted 51.74% of total net assets at September 30, 2017, most of which are considered liquid by the Adviser. These securities are not registered and may not be sold to the public. There are legal and/or contractual restrictions on resale. The Fund does not have the right to demand that such securities be registered. The values of these securities are determined by valuations provided by pricing services, brokers, dealers, market makers, or in good faith under policies adopted by authority of the Fund's Board of Directors.
†† These securities have been valued in good faith under policies adopted by authority of the Board of Director in accordance with the Fund's fair value procedures. These securities constituted 8.33% of total net assets at September 30, 2017.
@@@ Zero coupon bond. Coupon amount represents effective yield to maturity.
@@ Step Coupon — Coupon rate increases in increments to maturity. Rate disclosed is as of September 30, 2017.
See accompanying Notes to Financial Statements.
22
FPA NEW INCOME, INC.
PORTFOLIO OF INVESTMENTS —
RESTRICTED SECURITIES
September 30, 2017
Issuer | | Acquisition
Date(s) | |
Cost | | Fair
Value | | Fair Value
as a % of
Net Assets | |
A10 Term Asset
Financing LLC 2017-1A A1FX
2.34% 3/15/2036 | | 8/8/2017 | | $ | 17,636,777 | | | $ | 17,649,124 | | | | 0.34 | % | |
A10 Term Asset
Financing LLC 2016-1 A1
2.42% 3/15/2035 | | 5/19/2016 | | | 5,607,071 | | | | 5,589,408 | | | | 0.11 | % | |
ACCTL2, 3M LIBOR +4.75% —
6.06% 7/28/2013 | | 9/19/2016 | | | 19,071,790 | | | | 19,235,053 | | | | 0.38% | | |
ACCTL2, Prime +3.75% — 8.00%
7/28/2013 | | 9/19/2016 | | | 48,120 | | | | 48,532 | | | | 0.00% | | |
ARI Fleet Lease Trust 2016-A A2
1.82% 7/15/2024 | | 2/17/2016 | | | 12,779,542 | | | | 12,786,422 | | | | 0.25 | % | |
ARI Fleet Lease Trust 2015-A A2
1.11% 11/15/2018
| | 4/15/2015,
7/20/2015,
3/11/2016,
3/18/2016 | | | 3,444,027 | | | | 3,443,629 | | | | 0.07 | % | |
Adams Mill CLO Ltd. 2014-1A B2R
3.35% 7/15/2026 | | 6/23/2017 | | | 8,136,000 | | | | 8,087,688 | | | | 0.16 | % | |
Air 2 US 10.127% 10/1/2020 | | 7/24/2014, 8/22/2014,
2/12/2015 | | | 9,396,339 | | | | 9,814,557 | | | | 0.19 | % | |
Air 2 US 8.027% 10/1/2019 | | 7/1/2014, 10/27/2014 | | | 2,795,914 | | | | 2,751,189 | | | | 0.05 | % | |
Ascentium Equipment
Receivables LLC 2015-2A B
2.62% 12/10/2019 | | 2/18/2016 | | | 4,093,020 | | | | 4,106,839 | | | | 0.08 | % | |
Ascentium Equipment
Receivables Trust 2016-1A A2
1.75% 11/13/2018 | | 4/18/2016 | | | 326,629 | | | | 326,631 | | | | 0.01 | % | |
Authentic Brands TL 2L,
1M LIBOR + 7.75% — 9.075%
9/26/2025 | | 9/26/2017 | | | 5,011,133 | | | | 5,086,868 | | | | 0.10 | % | |
Aventura Mall Trust M 2013-AVM A
3.867% 12/5/2032
| | 9/20/2017,
9/21/2017,
9/21/2017,
9/27/2017,
9/28/2017 | | | 26,214,366 | | | | 26,124,587 | | | | 0.51 | % | |
Avis Budget Rental Car
Funding AESOP LLC 2015-1A A
2.50% 7/20/2021 | | 2/22/2017, 3/13/2017 | | | 48,363,698 | | | | 48,368,292 | | | | 0.94 | % | |
Avis Budget Rental Car
Funding AESOP LLC 2015-2A A
2.63% 12/20/2021 | | 1/31/2017, 3/8/2017,
3/13/2017 | | | 22,499,648 | | | | 22,551,161 | | | | 0.44 | % | |
23
FPA NEW INCOME, INC.
PORTFOLIO OF INVESTMENTS —
RESTRICTED SECURITIES
(Continued)
September 30, 2017
Issuer | | Acquisition
Date(s) | |
Cost | | Fair
Value | | Fair Value
as a % of
Net Assets | |
Avis Budget Rental Car
Funding AESOP LLC 2014-2A A
2.50% 2/20/2021 | | 1/31/2017 | | $ | 6,094,025 | | | $ | 6,096,274 | | | | 0.12 | % | |
BCAP LLC Trust 2010-RR8 2A6
2.754% 11/26/2036 | | 12/8/2015 | | | 967,155 | | | | 969,581 | | | | 0.02 | % | |
Black Diamond CLO Ltd.
2014-1A A1R
2.454% 10/17/2026 | | 7/12/2017 | | | 33,585,000 | | | | 33,672,758 | | | | 0.66 | % | |
BlueMountain CLO Ltd. 2013-4A
3.36% 4/15/2025 | | 3/31/2017 | | | 8,598,000 | | | | 8,614,353 | | | | 0.17 | % | |
Boart Longyear Management
Pty Ltd TL 10.00% Cash or
11.00% PIK 10/23/2020 | | 9/1/2017 | | | 3,866,068 | | | | 3,861,838 | | | | 0.08 | % | |
CCG Receivables Trust
2015-1 A2 1.46% 11/14/2018 | | 9/9/2015 | | | 4,038,845 | | | | 4,035,448 | | | | 0.08 | % | |
CIFC Funding 2013-III Ltd.
2013-3A A2BR
3.40% 10/24/2025 | | 3/10/2017 | | | 6,498,000 | | | | 6,509,924 | | | | 0.13 | % | |
CIFC Funding 2013-IV Ltd.
2013-4A A2R
2.72% 11/27/2024 | | 2/15/2017 | | | 14,822,000 | | | | 14,843,848 | | | | 0.29 | % | |
COMM Mortgage Trust
2014-FL5 B
3.384% 10/15/2031 | | 11/29/2016 | | | 12,669,454 | | | | 12,698,431 | | | | 0.25 | % | |
COMM Mortgage Trust
2014-FL5 C
3.384% 10/15/2031 | | 9/15/2016 | | | 7,952,873 | | | | 8,063,460 | | | | 0.16 | % | |
Cerberus Loan Funding
XVIII LP 2017-1A A
3.054% 4/15/2027 | | 3/30/2017 | | | 42,107,000 | | | | 42,156,686 | | | | 0.82 | % | |
Cerberus Onshore II
CLO-2 LLC 2014-1A B
4.004% 10/15/2023 | | 11/20/2014 | | | 6,571,423 | | | | 6,612,840 | | | | 0.13 | % | |
Cerberus Onshore II
CLO-2 LLC 2014-1A A
3.204% 10/15/2023 | | 11/20/2014, 2/12/2015 | | | 941,909 | | | | 942,029 | | | | 0.02 | % | |
Chesapeake Funding II LLC
2016-1A A1
2.11% 3/15/2028 | | 3/24/2016 | | | 25,466,585 | | | | 25,527,415 | | | | 0.50 | % | |
Chesapeake Funding II LLC
2016-2A A1
1.88% 6/15/2028 | | 6/14/2016 | | | 25,003,232 | | | | 25,009,175 | | | | 0.49 | % | |
24
FPA NEW INCOME, INC.
PORTFOLIO OF INVESTMENTS —
RESTRICTED SECURITIES
(Continued)
September 30, 2017
Issuer | | Acquisition
Date(s) | |
Cost | | Fair
Value | | Fair Value
as a % of
Net Assets | |
Citigroup Mortgage Loan
Trust, Inc. 2014-A A
4.00% 1/25/2035 | | 2/24/2014, 7/28/2015 | | $ | 10,964,452 | | | $ | 10,972,160 | | | | 0.21 | % | |
Coinstar Funding LLC Series
2017-1A A2 5.216% 4/25/2047 | | 5/4/2017, 7/25/2017 | | | 8,403,938 | | | | 8,713,616 | | | | 0.17 | % | |
Credit Acceptance Auto Loan
Trust 2017-2A A
2.55% 2/17/2026 | | 6/20/2017, 7/10/2017 | | | 50,779,328 | | | | 50,733,960 | | | | 0.99 | % | |
Credit Acceptance Auto Loan
Trust 2015-2A B
3.04% 8/15/2023 | | 6/20/2016 | | | 27,412,315 | | | | 27,608,009 | | | | 0.54 | % | |
Credit Acceptance Auto Loan
Trust 2016-2A B
3.18% 5/15/2024 | | 5/4/2016 | | | 22,932,028 | | | | 23,087,997 | | | | 0.45 | % | |
Credit Acceptance Auto Loan
Trust 2016-3A B
2.94% 10/15/2024 | | 10/19/2016 | | | 20,649,786 | | | | 20,669,851 | | | | 0.40 | % | |
Credit Acceptance Auto Loan
Trust 2016-3A C
3.60% 4/15/2025 | | 10/19/2016 | | | 12,658,865 | | | | 12,758,369 | | | | 0.25 | % | |
Credit Acceptance Auto Loan
Trust 2016-2A A
2.42% 11/15/2023 | | 5/4/2016, 6/22/2016 | | | 9,964,599 | | | | 9,995,301 | | | | 0.19 | % | |
Credit Acceptance Auto Loan
Trust 2014-2A B
2.67% 9/15/2022 | | 9/18/2014, 7/30/2015 | | | 7,211,683 | | | | 7,205,879 | | | | 0.14 | % | |
Credit Acceptance Auto Loan
Trust 2015-1A B
2.61% 1/17/2023 | | 7/31/2015 | | | 3,161,081 | | | | 3,164,376 | | | | 0.06 | % | |
Credit Acceptance Auto Loan
Trust 2015-2A C
3.76% 2/15/2024 | | 8/12/2015 | | | 550,000 | | | | 556,121 | | | | 0.01 | % | |
Credit Acceptance Auto Loan
Trust 2015-1A A
2.00% 7/15/2022 | | 6/20/2016 | | | 489,468 | | | | 488,616 | | | | 0.01 | % | |
Credit Suisse Commercial
Mortgage Trust Series
2016-MFF E
7.234% 11/15/2033 | | 11/04/2016, 12/20/2016 | | | 30,398,000 | | | | 30,550,127 | | | | 0.60 | % | |
Credit Suisse Mortgage
Trust Series 2010-9R 1A4
3.75% 8/27/2037 | | 2/10/2016 | | | 25,780 | | | | 25,376 | | | | 0.00 | % | |
25
FPA NEW INCOME, INC.
PORTFOLIO OF INVESTMENTS —
RESTRICTED SECURITIES
(Continued)
September 30, 2017
Issuer | | Acquisition
Date(s) | |
Cost | | Fair
Value | | Fair Value
as a % of
Net Assets | |
DT Auto Owner Trust 2017-1A C
2.70% 11/15/2022 | | 2/6/2017 | | $ | 18,720,448 | | | $ | 18,711,245 | | | | 0.37 | % | |
DT Auto Owner Trust 2016-4A B
2.02% 8/17/2020 | | 9/28/2016 | | | 13,676,403 | | | | 13,655,533 | | | | 0.27 | % | |
DT Auto Owner Trust 2015-3A B
2.46% 11/15/2019 | | 10/07/2015 | | | 5,379,342 | | | | 5,381,123 | | | | 0.10 | % | |
DT Auto Owner Trust 2016-2A B
2.92% 5/15/2020 | | 4/6/2016 | | | 4,606,718 | | | | 4,613,593 | | | | 0.09 | % | |
Elm Trust 2016-1A A2
4.163% 6/20/2025 | | 12/08/2016,
1/3/2017 | | | 13,182,776 | | | | 13,463,139 | | | | 0.26 | % | |
Enterprise Fleet
Financing LLC 2015-2 A2
1.59% 2/22/2021 | | 7/22/2015 | | | 20,356,262 | | | | 20,342,317 | | | | 0.40 | % | |
Enterprise Fleet
Financing LLC 2016-2 A2
1.74% 2/22/2022 | | 7/12/2016 | | | 15,342,088 | | | | 15,325,045 | | | | 0.30 | % | |
Enterprise Fleet
Financing LLC 2017-2 A2
1.97% 1/20/2023 | | 6/20/2017 | | | 14,449,283 | | | | 14,441,024 | | | | 0.28 | % | |
Enterprise Fleet
Financing LLC 2017-1 A3
2.60% 7/20/2022 | | 1/24/2017 | | | 9,450,913 | | | | 9,549,099 | | | | 0.19 | % | |
Enterprise Fleet
Financing LLC 2014-2 A2
1.05% 3/20/2020
| | 8/26/2014,
3/25/2015,
4/28/2015,
5/28/2015,
2/17/2016 | | | 674,261 | | | | 674,215 | | | | 0.01 | % | |
Exeter Automobile Receivables
Trust 2016-3A A 1.84% 11/16/2020 | | 10/3/2016 | | | 12,314,896 | | | | 12,280,297 | | | | 0.24 | % | |
Exeter Automobile Receivables
Trust 2017-1A B 3.00% 12/15/2021 | | 1/30/2017,
1/30/2017,
1/30/2017 | | | 8,761,283 | | | | 8,772,879 | | | | 0.17 | % | |
First Investors Auto Owner
Trust 2016-1A A2
2.26% 4/15/2021 | | 2/10/2016 | | | 16,653,000 | | | | 16,679,876 | | | | 0.33 | % | |
First Investors Auto Owner
Trust 2015-2A A2
2.28% 9/15/2021 | | 6/10/2016 | | | 16,577,367 | | | | 16,584,438 | | | | 0.32 | % | |
26
FPA NEW INCOME, INC.
PORTFOLIO OF INVESTMENTS —
RESTRICTED SECURITIES
(Continued)
September 30, 2017
Issuer | | Acquisition
Date(s) | |
Cost | | Fair
Value | | Fair Value
as a % of
Net Assets | |
First Investors Auto Owner
Trust 2017-1A C
2.95% 4/17/2023 | | 2/14/2017 | | $ | 8,147,908 | | | $ | 8,152,934 | | | | 0.16 | % | |
First Investors Auto Owner
Trust 2016-2A A2
1.87% 11/15/2021 | | 9/12/2016 | | | 5,513,709 | | | | 5,502,207 | | | | 0.11 | % | |
First Investors Auto Owner
Trust 2015-2A B
2.75% 9/15/2021 | | 8/18/2015 | | | 4,442,706 | | | | 4,445,655 | | | | 0.09 | % | |
First Investors Auto Owner
Trust 2017-1A B
2.67% 4/17/2023 | | 2/14/2017, 2/21/2017 | | | 4,126,159 | | | | 4,124,598 | | | | 0.08 | % | |
Flagship VII Ltd. 2013-7A A2R
2.70% 1/20/2026 | | 3/22/2017 | | | 17,551,000 | | | | 17,574,466 | | | | 0.34 | % | |
Fortress Credit Opportunities III
CLO LP 2014-3A A1TR
2.953% 4/28/2026 | | 3/22/2017 | | | 48,830,000 | | | | 48,942,309 | | | | 0.95 | % | |
Fortress Credit Opportunities III
CLO LP 2014-3A DR
5.403% 4/28/2026 | | 8/3/2017 | | | 8,176,747 | | | | 8,189,106 | | | | 0.16 | % | |
Fortress Credit Opportunities V
CLO Ltd. 2014-5A A1FR
3.40% 10/15/2026 | | 3/28/2017 | | | 25,265,000 | | | | 25,282,054 | | | | 0.49 | % | |
Fortress Credit Opportunities V
CLO Ltd. 2014-5A A2R
3.75% 10/15/2026 | | 3/28/2017 | | | 6,584,000 | | | | 6,566,822 | | | | 0.13 | % | |
GreatAmerica Leasing Receivables
Funding LLC Series 2017-1 A4
2.36% 1/20/2023 | | 2/7/2017 | | | 6,561,738 | | | | 6,548,020 | | | | 0.13 | % | |
GreatAmerica Leasing Receivables
Funding LLC Series 2017-1 C
2.89% 1/22/2024 | | 2/7/2017 | | | 2,608,866 | | | | 2,604,205 | | | | 0.05 | % | |
Halcyon Loan Advisors Funding
2.413% 10/22/2025 | | 6/30/2017 | | | 18,450,000 | | | | 18,459,631 | | | | 0.36 | % | |
Hertz Fleet Lease
Funding LP 2017-1 A2
2.13% 4/10/2031 | | 4/18/2017 | | | 20,223,594 | | | | 20,212,192 | | | | 0.39 | % | |
Hertz Fleet Lease
Funding LP 2016-1 A2
1.96% 4/10/2030 | | 4/13/2016 | | | 18,366,608 | | | | 18,334,178 | | | | 0.36 | % | |
Hyundai Auto Lease
Securitization Trust 2016-C B
1.86% 5/17/2021 | | 1/10/2017 | | | 13,192,554 | | | | 13,170,100 | | | | 0.26 | % | |
27
FPA NEW INCOME, INC.
PORTFOLIO OF INVESTMENTS —
RESTRICTED SECURITIES
(Continued)
September 30, 2017
Issuer | | Acquisition
Date(s) | |
Cost | | Fair
Value | | Fair Value
as a % of
Net Assets | |
ICG US CLO Ltd. 2014-3A A1BR
2.97% 1/25/2027 | | 4/27/2017 | | $ | 34,490,000 | | | $ | 34,526,801 | | | | 0.67 | % | |
InSite Issuer LLC
8.595% 8/15/2020 | | 8/19/2013,
2/12/2015,
10/20/2015 | | | 12,025,507 | | | | 12,827,789 | | | | 0.25 | % | |
Intelsat Jackson Holding
SA 3M LIBOR + 2.75% —
4.07% 6/30/2019 | | 4/3/2017 | | | 25,737,096 | | | | 25,883,357 | | | | 0.50 | % | |
Internap Corp. TL 1L,
1M LIBOR + 7.00% —
8.24% 4/3/2022 | | 3/9/2017 | | | 11,339,860 | | | | 11,586,250 | | | | 0.23 | % | |
JP Morgan Chase Commercial
Mortgage Securities Trust
2010-C1 A3
5.058% 6/15/2043 | | 9/15/2017 | | | 7,767,014 | | | | 7,759,364 | | | | 0.15 | % | |
Jamestown CLO III Ltd.
2013-3A A1BR
2.753% 1/15/2026 | | 5/2/2017 | | | 16,675,000 | | | | 16,694,110 | | | | 0.33 | % | |
Latitude Management
Real Estate Capital
2016-CRE2 A
2.936% 11/24/2031 | | 10/21/2016 | | | 16,790,514 | | | | 16,902,350 | | | | 0.33 | % | |
Leaf Receivables
Funding 12 LLC 2017-1 A3
2.07% 8/15/2020 | | 5/17/2017 | | | 7,551,526 | | | | 7,542,380 | | | | 0.15 | % | |
Leaf Receivables
Funding 12 LLC 2017-1 A4
2.43% 7/15/2021 | | 5/17/2017 | | | 5,551,156 | | | | 5,542,029 | | | | 0.11 | % | |
Logix Holding Co. LLC TL 1L
2.87% 7/17/2024 | | 8/11/2017 | | | 11,589,930 | | | | 11,756,286 | | | | 0.23 | % | |
MB1LTL, 1M LIBOR + 5.00% —
6.24% 11/30/2022 | | 8/29/2017 | | | 26,136,120 | | | | 26,482,462 | | | | 0.52 | % | |
MB1LDDTL, 1M LIBOR + 2.26% —
2.33% 12/2/2022 | | 12/2/2016 | | | 0 | | | | 8,215 | | | | 0.00 | % | |
MB2LTL, 1M LIBOR + 9.25% —
10.49% 11/30/2023 | | 12/2/2016 | | | 6,722,421 | | | | 6,813,069 | | | | 0.13 | % | |
MMAF Equipment
Finance LLC 2013-AA A4
1.68% 5/11/2020 | | 6/15/2016 | | | 6,530,338 | | | | 6,504,925 | | | | 0.13 | % | |
MidOcean Credit
CLO I 2012-1A A2R
3.804% 1/15/2024 | | 1/18/2017 | | | 18,976,730 | | | | 18,882,426 | | | | 0.37 | % | |
N671US Trust 7.50% 9/15/2020 | | 8/16/2012 | | | 8,045,244 | | | | 8,065,357 | | | | 0.16 | % | |
28
FPA NEW INCOME, INC.
PORTFOLIO OF INVESTMENTS —
RESTRICTED SECURITIES
(Continued)
September 30, 2017
Issuer | | Acquisition
Date(s) | |
Cost | | Fair
Value | | Fair Value
as a % of
Net Assets | |
Nationstar HECM Loan Trust
2017-2A A1 2.038% 9/25/2027 | | 9/26/2017 | | $ | 12,528,000 | | | $ | 12,528,000 | | | | 0.24 | % | |
Nationstar HECM Loan Trust
2017-2A M1 2.815% 9/25/2027 | | 9/26/2017 | | | 12,184,000 | | | | 12,184,000 | | | | 0.24 | % | |
Nationstar HECM Loan Trust
2016-3A A 2.013% 8/25/2026 | | 8/11/2016, 9/25/2016 | | | 1,896,758 | | | | 1,921,138 | | | | 0.04 | % | |
Nelder Grove CLO Ltd.
2014-1A AFR
3.00% 8/28/2026 | | 2/8/2017 | | | 7,465,000 | | | | 7,497,264 | | | | 0.15 | % | |
New Residential Advance
Receivables Trust
2015-ON1 2016-T4 AT4
3.107% 12/15/2050 | | 11/22/2016 | | | 50,294,000 | | | | 50,485,620 | | | | 0.98 | % | |
New Residential Advance
Receivables Trust
Advance Receivables
Backed 2016-T1 AT1
2.751% 6/15/2049 | | 6/23/2016 | | | 16,002,892 | | | | 15,909,467 | | | | 0.31 | % | |
New Residential Advance
Receivables Trust
Advance Receivables
Backed Notes 2016-T2 AT2
2.575% 10/15/2049 | | 10/14/2016 | | | 50,834,000 | | | | 50,450,834 | | | | 0.98 | % | |
New Residential Advance
Receivables Trust
Advance Receivables
Backed Notes 2017-T1 AT1
3.214% 2/15/2051 | | 2/1/2017 | | | 46,789,000 | | | | 47,042,128 | | | | 0.92 | % | |
NewMark Capital Funding
CLO, Ltd. 2014-2A BFR
3.669% 6/30/2026 | | 3/2/2017 | | | 10,199,000 | | | | 10,247,557 | | | | 0.20 | % | |
NewMark Capital Funding
CLO, Ltd. 2014-2A AFR
3.077% 6/30/2026 | | 3/2/2017 | | | 5,750,000 | | | | 5,775,495 | | | | 0.11 | % | |
NextGear Floorplan Master
Owner Trust 2017-1A A2
2.54% 4/18/2022 | | 4/24/2017 | | | 22,931,513 | | | | 22,881,155 | | | | 0.45 | % | |
NextGear Floorplan Master
Owner Trust 2015-2A A
2.38% 10/15/2020 | | 2/1/2017 | | | 10,053,444 | | | | 10,040,765 | | | | 0.20 | % | |
Nomura Resecuritization
Trust 2016-1R 3A1
5.00% 9/28/2036 | | 5/5/2016 | | | 6,179,438 | | | | 6,111,580 | | | | 0.12 | % | |
29
FPA NEW INCOME, INC.
PORTFOLIO OF INVESTMENTS —
RESTRICTED SECURITIES
(Continued)
September 30, 2017
Issuer | | Acquisition
Date(s) | |
Cost | | Fair
Value | | Fair Value
as a % of
Net Assets | |
Northwoods Capital X Ltd.
2013-10A A2R
2.649% 11/4/2025 | | 3/29/2017 | | $ | 29,490,000 | | | $ | 29,451,103 | | | | 0.57 | % | |
Northwoods Capital X Ltd.
2013-10A B2R
3.442% 11/4/2025 | | 3/29/2017 | | | 4,000,000 | | | | 4,007,020 | | | | 0.08 | % | |
OHA Loan Funding LLC
2014-1A A2R
2.95% 10/20/2026 | | 3/9/2017 | | | 20,832,000 | | | | 20,843,208 | | | | 0.41 | % | |
Oaktree CLO Ltd. 2014-2A A1BR
2.953% 10/20/2026 | | 2/17/2017 | | | 10,752,000 | | | | 10,797,051 | | | | 0.21 | % | |
Ocean Trails CLO V 2014-5A C2R
4.70% 10/13/2026 | | 3/9/2017 | | | 6,814,000 | | | | 6,888,259 | | | | 0.13 | % | |
Ocwen Master Advance Receivables
Trust 2016-T1 AT1
2.521% 8/17/2048 | | 8/3/2016 | | | 51,028,000 | | | | 50,948,269 | | | | 0.99 | % | |
Ocwen Master Advance Receivables
Trust 2017-T1 AT1
2.499% 9/15/2048 | | 9/8/2017 | | | 4,566,000 | | | | 4,566,000 | | | | 0.09 | % | |
Oportun Funding III LLC 2016-B A
3.69% 7/8/2021 | | 6/22/2016 | | | 10,121,184 | | | | 10,129,810 | | | | 0.20 | % | |
Oportun Funding IV LLC 2016-C A
3.28% 11/8/2021 | | 10/14/2016 | | | 9,738,574 | | | | 9,674,025 | | | | 0.19 | % | |
Ores NPL LLC 2014-LV3 B
6.00% 3/27/2024 | | 3/21/2014, 2/12/2015 | | | 21,468,559 | | | | 21,525,566 | | | | 0.42 | % | |
OTGDDTL 1.00% 8/26/2021 | | 8/26/2016 | | | 0 | | | | 21,450 | | | | 0.00 | % | |
OTGTL, 1M LIBOR + 8.50% —
9.771% 8/26/2021 | | 8/26/2016 | | | 20,812,685 | | | | 21,298,550 | | | | 0.42 | % | |
PFS Financing Corp. 2017-BA A2
2.22% 7/15/2022 | | 8/1/2017 | | | 22,034,555 | | | | 22,032,252 | | | | 0.43 | % | |
PFS Financing Corp. 2017-BA B
2.57% 7/15/2022 | | 8/1/2017 | | | 7,304,560 | | | | 7,303,817 | | | | 0.14 | % | |
PFS Financing Corp. 2016-BA A
1.87% 10/15/2021 | | 8/15/2017 | | | 3,465,540 | | | | 3,454,250 | | | | 0.07 | % | |
PFS Financing Corporation
2016-A A 2.434% 2/18/2020 | | 2/09/2016 | | | 57,780,017 | | | | 57,989,165 | | | | 1.13 | % | |
PFS Financing Corporation
2014-BA A 1.834% 10/15/2019 | | 2/18/2015,
6/15/2015,
10/23/2015,
11/17/2015 | | | 32,918,114 | | | | 33,048,264 | | | | 0.64 | % | |
PFS Financing Corporation
2015-AA A 1.854% 4/15/2020 | | 4/8/2015, 7/30/2015 | | | 29,097,528 | | | | 29,132,138 | | | | 0.57 | % | |
30
FPA NEW INCOME, INC.
PORTFOLIO OF INVESTMENTS —
RESTRICTED SECURITIES
(Continued)
September 30, 2017
Issuer | | Acquisition
Date(s) | |
Cost | | Fair
Value | | Fair Value
as a % of
Net Assets | |
PFS Financing Corporation
2015-AA B 2.127% 4/15/2020 | | 4/8/2015 | | $ | 500,000 | | | $ | 497,960 | | | | 0.01 | % | |
Peaks CLO 1, Ltd. 2014-1A C
4.804% 6/15/2026 | | 12/07/2016 | | | 11,858,951 | | | | 12,079,029 | | | | 0.24 | % | |
Peaks CLO, 1 Ltd. 2014-1A A
3.054% 6/15/2026 | | 6/28/2017 | | | 31,603,901 | | | | 31,610,824 | | | | 0.62 | % | |
Prestige Auto Receivables Trust
2017-1A C 2.81% 1/17/2023 | | 8/16/2017, 9/28/2017 | | | 30,217,017 | | | | 30,304,313 | | | | 0.59 | % | |
Prestige Auto Receivables Trust
2016-2A B 2.19% 11/15/2022 | | 10/21/2016 | | | 25,219,295 | | | | 25,073,776 | | | | 0.49 | % | |
Prestige Auto Receivables Trust
2016-2A C 2.88% 11/15/2022 | | 10/21/2016 | | | 12,331,264 | | | | 12,378,889 | | | | 0.24 | % | |
Prestige Auto Receivables Trust
2017-1A B 2.39% 5/16/2022 | | 8/16/2017 | | | 12,039,125 | | | | 11,973,106 | | | | 0.23 | % | |
Prestige Auto Receivables Trust
2015-1 B 2.04% 4/15/2021 | | 3/18/2015 | | | 10,394,609 | | | | 10,403,463 | | | | 0.20 | % | |
Prestige Auto Receivables Trust
2016-1A A3 1.99% 6/15/2020 | | 3/16/2016 | | | 7,917,000 | | | | 7,926,674 | | | | 0.15 | % | |
Prestige Auto Receivables Trust
2015-1 A3 1.53% 2/15/2021 | | 3/18/2015, 5/29/2015 | | | 4,120,831 | | | | 4,120,056 | | | | 0.08 | % | |
Rialto Capital Management LLC
2014-LT5 B 5.00% 5/15/2024 | | 11/20/2014 | | | 1,541,853 | | | | 1,537,663 | | | | 0.03 | % | |
Rialto Real Estate Fund LP
2015-LT7 B 5.071% 12/25/2032 | | 6/15/2015 | | | 16,642,256 | | | | 16,629,471 | | | | 0.32 | % | |
RiverView HECM Trust 2007-1 A
1.817% 5/25/2047 | | 1/9/2013, 2/12/2015 | | | 23,679,596 | | | | 21,512,239 | | | | 0.42 | % | |
SCG Trust 2013-SRP1 AJ
3.427% 11/15/2026 | | 12/7/2016 | | | 14,083,427 | | | | 14,099,106 | | | | 0.28 | % | |
Saranac CLO II Ltd. 2014-2A A2
3.066% 2/20/2025 | | 4/17/2017 | | | 11,740,831 | | | | 11,741,166 | | | | 0.23 | % | |
Saranac CLO II Ltd. 2014-2A B
3.366% 2/20/2025 | | 3/8/2017 | | | 3,760,183 | | | | 3,764,089 | | | | 0.07 | % | |
SDTL, 1M LIBOR + 6.00% — 7.33%
12/22/2021 | | 12/22/2016 | | | 13,615,635 | | | | 13,872,569 | | | | 0.27 | % | |
Sears Roebuck Acceptance Corp. TL,
3M LIBOR + 4.50% — 5.74%
6/30/2018 | | 8/1/2017 | | | 19,741,461 | | | | 19,679,466 | | | | 0.38 | % | |
Silvermore Clo Ltd. 2.485% 5/15/2026 | | 6/30/2017 | | | 24,974,259 | | | | 24,973,984 | | | | 0.49 | % | |
Stanwich Mortgage Loan Trust
Series 2010-2 A
1.005% 2/28/2057 | | 5/21/2010, 9/22/2011 | | | 486,431 | | | | 463,995 | | | | 0.01 | % | |
Stanwich Mortgage Loan Trust
Series 2011-2 A 9/15/2050 | | 6/10/2011, 9/22/2011 | | | 434,321 | | | | 431,713 | | | | 0.01 | % | |
31
FPA NEW INCOME, INC.
PORTFOLIO OF INVESTMENTS —
RESTRICTED SECURITIES
(Continued)
September 30, 2017
Issuer | | Acquisition
Date(s) | |
Cost | | Fair
Value | | Fair Value
as a % of
Net Assets | |
Stanwich Mortgage Loan Trust
Series 2011-1 A
.192% 8/15/2050 | | 5/10/2011, 9/22/2011 | | $ | 407,650 | | | $ | 407,128 | | | | 0.01 | % | |
Stanwich Mortgage Loan Trust
Series 2010-3 A 7/31/2038 | | 6/02/2010, 9/22/2011 | | | 269,502 | | | | 272,701 | | | | 0.01 | % | |
Stanwich Mortgage Loan Trust
Series 2010-4 A
1.78% 8/31/2049 | | 8/04/2010, 9/22/2011 | | | 221,724 | | | | 239,248 | | | | 0.00 | % | |
Stanwich Mortgage Loan Trust
Series 2010-1 A
1.069% 9/30/2047 | | 4/22/2010, 9/22/2011 | | | 121,082 | | | | 116,699 | | | | 0.00 | % | |
Stanwich Mortgage Loan Trust
Series 2009-2 A
.472% 2/15/2049 | | 9/22/2011, 7/01/2013 | | | 25,705 | | | | 25,742 | | | | 0.00 | % | |
Sunset Mortgage Loan Co. LLC
2015-NPL1 A
4.459% 9/18/2045 | | 10/2/2015 | | | 9,841,257 | | | | 9,939,036 | | | | 0.19 | % | |
Symphony CLO XII Ltd.
2013-12A B2R
3.50% 10/15/2025 | | 4/3/2017 | | | 15,800,000 | | | | 15,824,664 | | | | 0.31 | % | |
Telos CLO, Ltd. 2014-5A A
2.854% 4/17/2025 | | 11/1/2016 | | | 31,434,159 | | | | 31,564,343 | | | | 0.62 | % | |
Telos Clo 2013-3A BR
3.271% 7/17/2026 | | 7/14/2017 | | | 20,644,000 | | | | 20,643,381 | | | | 0.40 | % | |
Telos Clo 2013-3A AR
2.571% 7/17/2026 | | 7/13/2017 | | | 17,353,000 | | | | 17,352,531 | | | | 0.34 | % | |
Towd Point Mortgage Trust
2015-2 1A1 3.25% 11/25/2060 | | 5/28/2015 | | | 35,597,065 | | | | 35,741,984 | | | | 0.70 | % | |
Towd Point Mortgage Trust
2015-4 A1 3.50% 4/25/2055 | | 9/25/2015 | | | 32,512,601 | | | | 32,561,359 | | | | 0.64 | % | |
Towd Point Mortgage Trust
2015-2 2A1 3.75% 11/25/2057 | | 6/10/2015 | | | 28,214,285 | | | | 28,216,964 | | | | 0.55 | % | |
Towd Point Mortgage Trust
2015-1 AES 3.00% 10/25/2053 | | 11/4/2015, 12/9/2015 | | | 25,149,749 | | | | 25,270,787 | | | | 0.49 | % | |
Towd Point Mortgage Trust
2016-3 A1 2.25% 4/25/2056 | | 7/22/2016 | | | 22,927,057 | | | | 22,830,691 | | | | 0.45 | % | |
Unison Ground Lease Funding LLC
2013-1 B 5.78% 3/15/2020 | | 3/12/2013, 7/16/2013,
2/12/2015 | | | 10,828,513 | | | | 10,853,598 | | | | 0.21 | % | |
Unison Ground Lease Funding LLC
2013-2 B 6.268% 3/15/2020 | | 3/12/2013, 2/12/2015 | | | 3,767,023 | | | | 3,521,305 | | | | 0.07 | % | |
VOLT XL LLC
2015-NP14 A1
4.375% 11/27/2045 | | 12/8/2015 | | | 14,414,717 | | | | 14,437,969 | | | | 0.28 | % | |
32
FPA NEW INCOME, INC.
PORTFOLIO OF INVESTMENTS —
RESTRICTED SECURITIES
(Continued)
September 30, 2017
Issuer | | Acquisition
Date(s) | |
Cost | | Fair
Value | | Fair Value
as a % of
Net Assets | |
VOLT XXV LLC
2015-NPL8 A1
3.50% 6/26/2045 | | 6/17/2015 | | $ | 22,213,199 | | | $ | 22,244,108 | | | | 0.43 | % | |
VOLT XXXVIII LLC
2015-NP12 A1
3.875% 9/25/2045 | | 9/11/2015 | | | 11,894,101 | | | | 11,910,021 | | | | 0.23 | % | |
Verizon Owner Trust
2017-1A B
2.45% 9/20/2021 | | 3/7/2017 | | | 33,677,628 | | | | 33,832,521 | | | | 0.66 | % | |
Verizon Owner Trust
2017-2A A
1.92% 12/20/2021 | | 6/13/2017 | | | 26,365,202 | | | | 26,341,953 | | | | 0.51 | % | |
Verizon Owner Trust
2017-2A B
2.22% 12/20/2021 | | 6/13/2017 | | | 24,041,063 | | | | 23,921,234 | | | | 0.47 | % | |
Verizon Owner Trust
2016-2A A
1.68% 5/20/2021 | | 3/8/2017 | | | 8,781,840 | | | | 8,795,884 | | | | 0.17 | % | |
Volvo Financial Equipment LLC
Series 2017-1A A4
2.21% 11/15/2021 | | 2/13/2017 | | | 5,915,870 | | | | 5,907,189 | | | | 0.12 | % | |
WCP ISSUER LLC
2013-1 B
6.657% 8/15/2020 | | 8/1/2013, 2/12/2015 | | | 15,000,000 | | | | 15,526,222 | | | | 0.30 | % | |
Washington Mill CLO Ltd.
2014-1A B2R 3.60% 4/20/2026 | | 2/24/2014 | | | 11,052,000 | | | | 11,090,185 | | | | 0.22% | | |
Washington Mill CLO Ltd.
2014-1A A2R 2.90% 4/20/2026 | | 2/24/2014 | | | 8,859,000 | | | | 8,882,166 | | | | 0.17% | | |
West CLO Ltd.
2013-1A A1BR 2.745% 11/7/2025 | | 4/28/2017 | | | 27,181,000 | | | | 27,199,945 | | | | 0.53% | | |
West CLO Ltd.
2013-1A A2BR 3.393% 11/7/2025 | | 4/28/2017 | | | 12,780,000 | | | | 12,800,601 | | | | 0.25% | | |
Westlake Automobile Receivables
Trust 2016-3A C
2.46% 1/18/2022 | | 10/14/2016 | | | 19,573,830 | | | | 19,492,938 | | | | 0.38 | % | |
Westlake Automobile
Receivables Trust
2015-3A B
2.21% 5/17/2021 | | 10/9/2015 | | | 13,007,757 | | | | 13,010,680 | | | | 0.25 | % | |
Westlake Automobile Receivables
Trust 2017-1A C
2.70% 10/17/2022 | | 3/9/2017 | | | 11,438,413 | | | | 11,482,349 | | | | 0.22 | % | |
33
FPA NEW INCOME, INC.
PORTFOLIO OF INVESTMENTS —
RESTRICTED SECURITIES
(Continued)
September 30, 2017
Issuer | | Acquisition
Date(s) | |
Cost | | Fair
Value | | Fair Value
as a % of
Net Assets | |
Westlake Automobile Receivables
Trust 2015-3A C
3.05% 5/17/2021 | | 10/9/2015 | | $ | 549,942 | | | $ | 551,086 | | | | 0.01 | % | |
Westlake Automobile Receivables
Trust 2015-2A C
2.45% 1/15/2021 | | 6/18/2015 | | | 441,675 | | | | 441,931 | | | | 0.01 | % | |
Westlake Automobile Receivables
Trust 2015-1A C
2.29% 11/16/2020 | | 3/4/2015 | | | 207,596 | | | | 207,747 | | | | 0.00 | % | |
Wheels SPV 2 LLC 2015-1A A2
1.27% 4/22/2024 | | 6/2/2015, 6/10/2015 | | | 3,683,708 | | | | 3,680,818 | | | | 0.07 | % | |
Xplornet Communications Inc.
TL-B 1L, 3M LIBOR + 4.75% —
7.56% 9/9/2021 | | 9/6/2016 | | | 39,277,251 | | | | 39,667,495 | | | | 0.77 | % | |
ZW1L, 3M LIBOR + 5.00% — 6.32%
11/17/2022 | | 11/17/2016 | | | 13,409,257 | | | | 13,544,685 | | | | 0.26% | | |
ZW2L, 3M LIBOR + 9.00% —
10.314% 11/17/2023 | | 11/17/2016 | | | 4,803,528 | | | | 4,863,913 | | | | 0.09% | | |
Zais CLO 2 Ltd. 2014-2A A1BR
2.92% 7/25/2026 | | 4/11/2017 | | | 6,979,000 | | | | 7,006,016 | | | | 0.14 | % | |
TOTAL RESTRICTED SECURITIES | | | | $ | 2,652,577,825 | | | $ | 2,651,953,836 | | | | 51.74 | % | |
See accompanying Notes to Financial Statements.
34
FPA NEW INCOME, INC.
STATEMENT OF ASSETS AND LIABILITIES
September 30, 2017
ASSETS | |
Investment securities — at fair value (identified cost $5,165,674,736) | | $ | 5,106,959,121 | | |
Short-term investments — at amortized cost (maturities 60 days or less) | | | 46,301,000 | | |
Cash | | | 637 | | |
Receivable for: | |
Interest | | | 18,589,580 | | |
Capital Stock sold | | | 5,172,852 | | |
Investment securities sold | | | 183,551 | | |
Prepaid expenses and other assets | | | 4,818 | | |
Total assets | | | 5,177,211,559 | | |
LIABILITIES | |
Payable for: | |
Investment securities purchased | | | 44,241,895 | | |
Capital Stock repurchased | | | 4,849,551 | | |
Advisory fees | | | 1,772,009 | | |
Accrued expenses and other liabilities | | | 915,484 | | |
Total liabilities | | | 51,778,939 | | |
NET ASSETS | | $ | 5,125,432,620 | | |
SUMMARY OF SHAREHOLDERS' EQUITY | |
Capital Stock — par value $0.01 per share; authorized 600,000,000 shares;
outstanding 509,926,050 shares | | $ | 5,099,261 | | |
| Additional Paid-in Capital | | | 5,520,885,643 | | |
| Accumulated net realized loss on investments | | | (378,489,166 | ) | |
| Undistributed net investment income | | | 36,652,498 | | |
| Net unrealized depreciation | | | (58,715,616 | ) | |
NET ASSETS | | $ | 5,125,432,620 | | |
NET ASSET VALUE | |
Offering and redemption price per share | | $ | 10.05 | | |
See accompanying Notes to Financial Statements.
35
FPA NEW INCOME, INC.
STATEMENT OF OPERATIONS
For the Year Ended September 30, 2017
INVESTMENT INCOME | |
Interest | | $ | 151,932,199 | | |
EXPENSES | |
Advisory fees | | | 24,990,217 | | |
Transfer agent fees and expenses | | | 2,081,229 | | |
Reports to shareholders | | | 673,945 | | |
Legal fees | | | 344,592 | | |
Director fees and expenses | | | 289,624 | | |
Administrative services fees | | | 256,599 | | |
Professional fees | | | 231,871 | | |
Filing fees | | | 188,640 | | |
Custodian fees | | | 166,341 | | |
Audit and tax services fees | | | 74,672 | | |
Other | | | 56,921 | | |
Total expenses | | | 29,354,651 | | |
Reimbursement from Adviser | | | (4,863,437 | ) | |
Net expenses | | | 24,491,214 | | |
Net investment income | | | 127,440,985 | | |
NET REALIZED AND UNREALIZED GAIN (LOSS) | |
Net realized gain (loss) on: | |
Investments | | | (26,740,143 | ) | |
Net change in unrealized appreciation (depreciation) of: | |
Investments | | | 26,234,746 | | |
Net realized and unrealized loss | | | (505,397 | ) | |
NET INCREASE IN NET ASSETS RESULTING FROM OPERATIONS | | $ | 126,935,588 | | |
See accompanying Notes to Financial Statements.
36
FPA NEW INCOME, INC.
STATEMENTS OF CHANGES IN NET ASSETS
| | | Year Ended
September 30, 2017 | | Year Ended
September 30, 2016 | |
INCREASE (DECREASE) IN NET ASSETS | |
Operations: | |
Net investment income | | $ | 127,440,985 | | | $ | 101,385,439 | | |
Net realized loss | | | (26,740,143 | ) | | | (62,080,983 | ) | |
Net change in unrealized appreciation | | | 26,234,746 | | | | 40,170,259 | | |
Net increase in net assets resulting from operations | | | 126,935,588 | | | | 79,474,715 | | |
Distributions to shareholders from: | |
Net investment income | | | (131,897,900 | ) | | | (92,044,210 | ) | |
Total distributions | | | (131,897,900 | ) | | | (92,044,210 | ) | |
Capital Stock transactions: | |
Proceeds from Capital Stock sold | | | 1,530,257,559 | | | | 1,437,172,413 | | |
Proceeds from shares issued to shareholders upon reinvestment of
dividends and distributions | | | 114,661,800 | | | | 79,183,886 | | |
Cost of Capital Stock repurchased | | | (1,563,134,054 | )* | | | (2,091,695,469 | )* | |
Net increase (decrease) from Capital Stock transactions | | | 81,785,305 | | | | (575,339,170 | ) | |
Total change in net assets | | | 76,822,993 | | | | (587,908,665 | ) | |
NET ASSETS | |
Beginning of Year | | | 5,048,609,627 | | | | 5,636,518,292 | | |
End of Year | | $ | 5,125,432,620 | | | $ | 5,048,609,627 | | |
CHANGE IN CAPITAL STOCK OUTSTANDING | |
Shares of Capital Stock sold | | | 152,993,751 | | | | 143,835,897 | | |
Shares issued to shareholders upon reinvestment of
dividends and distributions | | | 11,505,156 | | | | 7,933,898 | | |
Shares of Capital Stock repurchased | | | (156,330,840 | ) | | | (209,364,243 | ) | |
Change in Capital Stock outstanding | | | 8,168,067 | | | | (57,594,448 | ) | |
* Net of redemption fees of $140,140 and $548,198 for the year ended September 30, 2017 and year ended September 30, 2016, respectively.
See accompanying Notes to Financial Statements.
37
FPA NEW INCOME, INC.
FINANCIAL HIGHLIGHTS
Selected Data for Each Share of Capital Stock Outstanding Throughout Each Year
| | | Year Ended September 30, | |
| | | 2017 | | 2016 | | 2015 | | 2014 | | 2013 | |
Per share operating performance: | |
Net asset value at beginning of year | | $ | 10.06 | | | $ | 10.08 | | | $ | 10.24 | | | $ | 10.45 | | | $ | 10.70 | | |
Income from investment operations: | |
| Net investment income* | | | 0.25 | | | | 0.19 | | | | 0.15 | | | | 0.30 | | | | 0.28 | | |
Net realized and unrealized gain (loss)
on investment securities | | | 0.01 | | | | (0.04 | ) | | | (0.06 | ) | | | (0.15 | ) | | | (0.21 | ) | |
| Total from investment operations | | | 0.26 | | | | 0.15 | | | | 0.09 | | | | 0.15 | | | | 0.07 | | |
Less distributions: | |
| Dividends from net investment income | | | (0.27 | ) | | | (0.17 | ) | | | (0.25 | ) | | | (0.36 | ) | | | (0.32 | ) | |
Redemption fees | | | — | ** | | | — | ** | | | — | ** | | | — | ** | | | — | ** | |
Net asset value at end of year | | $ | 10.05 | | | $ | 10.06 | | | $ | 10.08 | | | $ | 10.24 | | | $ | 10.45 | | |
Total investment return*** | | | 2.58 | % | | | 1.52 | % | | | 0.84 | % | | | 1.47 | % | | | 0.66 | % | |
Ratios/supplemental data: | |
Net assets, end of year (in $000's) | | $ | 5,125,433 | | | $ | 5,048,610 | | | $ | 5,636,518 | | | $ | 5,829,865 | | | $ | 5,032,567 | | |
Ratio of expenses of average net assets: | |
Before reimbursement from Adviser | | | 0.59 | % | | | 0.58 | % | | | 0.58 | % | | | 0.56 | % | | | 0.58 | % | |
After reimbursement from Adviser | | | 0.49 | % | | | 0.55 | % | | | N/A | | | | N/A | | | | N/A | | |
Ratio of net investment income to
average net assets: | |
Before reimbursement from Adviser | | | 2.45 | % | | | 1.87 | % | | | 1.50 | % | | | 2.59 | % | | | 2.74 | % | |
After reimbursement from Adviser | | | 2.55 | % | | | 1.90 | % | | | N/A | | | | N/A | | | | N/A | | |
Portfolio turnover rate | | | 59 | % | | | 44 | % | | | 64 | % | | | 97 | % | | | 84 | % | |
* Per share amount is based on average shares outstanding.
** Rounds to less than $0.01 per share.
*** Return is based on net asset value per share, adjusted for reinvestment of distributions, and does not reflect deduction of the sales charge.
See accompanying Notes to Financial Statements.
38
FPA NEW INCOME, INC.
NOTES TO FINANCIAL STATEMENTS
September 30, 2017
NOTE 1 — Significant Accounting Policies
FPA New Income, Inc. (the "Fund") is registered under the Investment Company Act of 1940, as a diversified, open-end, management investment company. The Fund's primary investment objective is to seek current income and long-term total return. Capital preservation is also a consideration. The Fund qualifies as an investment company pursuant to Financial Accounting Standard Board (FASB) Accounting Standards Codification (ASC) No. 946, Financial Services — Investment Companies. The following is a summary of significant accounting policies consistently followed by the Fund in the preparation of its financial statements.
A. Security Valuation
The Fund's investments are reported at fair value as defined by accounting principles generally accepted in the United States of America, ("U.S. GAAP"). The Fund generally determines its net asset value as of approximately 4:00 p.m. New York time each day the New York Stock Exchange is open. Further discussion of valuation methods, inputs and classifications can be found under Disclosure of Fair Value Measurements.
B. Securities Transactions and Related Investment Income
Securities transactions are accounted for on the date the securities are purchased or sold. Dividend income and distributions to shareholders are recorded on the ex-dividend date. Interest income and expenses are recorded on an accrual basis. Market discounts and premiums on fixed income securities are amortized over the expected life of the securities. Realized gains or losses are based on the specific identification method.
C. Use of Estimates
The preparation of the financial statements in accordance with U.S. GAAP requires management to make estimates and assumptions that affect the amounts reported. Actual results could differ from those estimates.
D. Recent Accounting Pronouncements
In March 2017, the FASB issued Accounting Standards (ASU) No. Update 2017-08, Receivables — Nonrefundable Fees and Other Costs (Subtopic 310-20). The amendments in this update shorten the amortization period for certain callable debt securities held at a premium. Specifically, the amendments require the premium to be amortized to the earliest call date. The amendments do not require an accounting change for securities held at a discount; the discount continues to be amortized to maturity. For public entities this update will be effective for fiscal years beginning after December 15, 2018, and for interim periods within those fiscal years. The Adviser is currently evaluating the impact of this new guidance on the Funds' financial statements.
NOTE 2 — Risk Considerations
Investing in the Fund may involve certain risks including, but not limited to, those described below.
Market Risk: Because the values of the Fund's investments will fluctuate with market conditions, so will the value of your investment in the Fund. You could lose money on your investment in the Fund or the Fund could underperform other investments.
Interest Rate Risk: The values of, and the income generated by, most debt securities held by the Fund may be affected by changing interest rates and by changes in the effective maturities and credit rating of these securities. For example, the value of debt securities in the Fund's portfolio generally will decline when interest rates rise and increase when interest rates fall. In addition, falling interest rates may cause an issuer to redeem, call or refinance a security before its stated maturity, which may result in the Fund having to reinvest the proceeds in lower yielding securities.
39
FPA NEW INCOME, INC.
NOTES TO FINANCIAL STATEMENTS
Continued
Mortgage-Backed and Other Asset-Backed Securities Risk: The values of some mortgage-backed and other asset-backed securities may expose the Fund to a lower rate of return upon reinvestment of principal. When interest rates rise, the value of mortgage-related securities generally will decline; however, when interest rates are declining, the value of mortgage related-securities with prepayment features may not increase as much as other fixed income securities. The rate of prepayments on underlying mortgages will affect the price and volatility of a mortgage-related security, and may shorten or extend the effective maturity of the security beyond what was anticipated at the time of purchase. If an unanticipated rate of prepayment on underlying mortgages increases the effective maturity of a mortgage-related security, the volatility of the security can be expected to increase. The value of these securities may also fluctuate in response to the market's perception of the creditworthiness of the issuers. Additionally, although mortgages and mortgage-related securities are generally supported by some form of government or private guarantee and/or insurance, there is no assurance that private guarantors or insurers will meet their obligations.
Stripped Mortgage-Backed Interest Only ("I/O") and Principal Only ("P/O") Securities: Stripped mortgage backed securities are usually structured with two classes that receive different proportions of the interest and principal distributions on a pool of mortgage assets. In certain cases, one class will receive all of the interest payments on the underlying mortgages (the I/O class), while the other class will receive all of the principal payments (the P/O class). The Fund currently has investments in I/O and P/O securities. The yield to maturity on IOs is sensitive to the rate of principal repayments (including prepayments) on the related underlying mortgage assets, and principal payments may have a material effect on yield-to-maturity. If the underlying mortgage assets experience greater than anticipated prepayments of principal, a Fund may not fully recoup its initial investment in I/Os.
Credit Risk: Debt securities are subject to credit risk, meaning that the issuer of the debt security may default or fail to make timely payments of principal or interest. The values of any of the Fund's investments may also decline in response to events affecting the issuer or its credit rating. The lower rated debt securities in which the Fund may invest are considered speculative and are generally subject to greater volatility and risk of loss than investment grade securities, particularly in deteriorating economic conditions. The Fund invests a significant portion of its assets in securities of issuers that hold mortgage-and asset-backed securities and direct investments in securities backed by commercial and residential mortgage loans and other financial assets. The value and related income of these securities is sensitive to changes in economic conditions, including delinquencies and/or defaults. Continuing shifts in the market's perception of credit quality on securities backed by commercial and residential mortgage loans and other financial assets may result in increased volatility of market price and periods of illiquidity that can negatively impact the valuation of certain securities held by the Fund.
Repurchase Agreements: Repurchase agreements permit the Fund to maintain liquidity and earn income over periods of time as short as overnight. Repurchase agreements held by the Fund are fully collateralized by U.S. Government securities, or securities issued by U.S. Government agencies, or securities that are within the three highest credit categories assigned by established rating agencies (Aaa, Aa, or A by Moody's or AAA, AA or A by Standard & Poor's) or, if not rated by Moody's or Standard & Poor's, are of equivalent investment quality as determined by the Adviser. Such collateral is in the possession of the Fund's custodian. The collateral is evaluated daily to ensure its market value equals or exceeds the current market value of the repurchase agreements including accrued interest. In the event of default on the obligation to repurchase, the Fund has the right to liquidate the collateral and apply the proceeds in satisfaction of the obligation.
The Fund may enter into repurchase agreements, under the terms of a Master Repurchase Agreement ("MRA"). The MRA permits the Fund, under certain circumstances including an event of default (such as bankruptcy or insolvency), to offset payables and/or receivables under the MRA with collateral held and/or posted to the counterparty and create one single net payment due to or from the Fund. However, bankruptcy or insolvency laws of a particular jurisdiction may impose restrictions on or prohibitions against such a right of offset in the
40
FPA NEW INCOME, INC.
NOTES TO FINANCIAL STATEMENTS
Continued
event of a MRA counterparty's bankruptcy or insolvency. Pursuant to the terms of the MRA, the Fund receives securities as collateral with a market value in excess of the repurchase price to be received by the Fund upon the maturity of the repurchase transaction. Upon a bankruptcy or insolvency of the MRA counterparty, the Fund recognizes a liability with respect to such excess collateral to reflect the Fund's obligation under bankruptcy law to return the excess to the counterparty. Repurchase agreements outstanding at the end of the period are listed in the Fund's Portfolio of Investments.
NOTE 3 — Purchases and Sales of Investment Securities
Cost of purchases of investment securities (excluding short-term investments) aggregated $2,748,486,914 for the year ended September 30, 2017. The proceeds and cost of securities sold resulting in net realized losses of $26,740,143 aggregated $2,754,986,650 and $2,781,726,793, respectively, for the year ended September 30, 2017. Realized gains or losses are based on the specific identification method.
NOTE 4 — Advisory Fees and Other Affiliated Transactions
Pursuant to an Investment Advisory Agreement (the "Agreement"), advisory fees were paid by the Fund to First Pacific Advisors, LLC (the "Adviser"). Under the terms of this Agreement, the Fund pays the Adviser a monthly fee calculated at the annual rate of 0.5% of the Fund's average daily net assets. In addition, the adviser contractually agreed to reimburse expenses in excess of 0.49% of the average net assets of the Fund (excluding brokerage fees and commissions, interest, taxes, shareholder service fees, fees and expenses of other funds in which the Fund invests, and extraordinary expenses) through January 31, 2018.
For the year ended September 30, 2017, the Fund paid aggregate fees and expenses of $289,624 to all Directors who are not affiliated persons of the Adviser. Certain officers of the Fund are also officers of the Adviser.
NOTE 5 — Federal Income Tax
No provision for federal income tax is required because the Fund has elected to be taxed as a "regulated investment company" under the Internal Revenue Code (the "Code") and intends to maintain this qualification and to distribute each year to its shareholders, in accordance with the minimum distribution requirements of the Code, its taxable net investment income and taxable net realized gains on investments.
Distributions paid to shareholders are based on net investment income and net realized gains determined on a tax reporting basis, which may differ from financial reporting. For federal income tax purposes, the Fund had the following components of distributable earnings at September 30, 2017:
Undistributed Ordinary Income | | $ | 37,292,865 | | |
The tax status of distributions paid during the fiscal years ended September 30, 2017 and 2016 were as follows:
| | | 2017 | | 2016 | |
Dividends from ordinary income | | $ | 131,897,900 | | | $ | 92,044,210 | | |
The Fund utilizes the provisions of federal income tax laws that provide for the carryforward of capital losses for prior years, offsetting such losses against any future realized capital gains. Under the Regulated Investment Company Act of 2010 (the "Act"), net capital losses recognized for fiscal years beginning after December 22, 2010 may be carried forward indefinitely, and their character is retained as short-term and/or long-term losses. Previously, net capital losses were carried forward for eight years and treated as short-term losses. As a transition rule, the Act requires that post-enactment net capital losses be used before pre-enactment net capital losses.
41
FPA NEW INCOME, INC.
NOTES TO FINANCIAL STATEMENTS
Continued
As of September 30, 2017, the post enactment accumulated losses were $364,135,874, and the pre-enactment capital loss carryforwards were $14,352,159. The ability to carry these pre-enactment losses forward expires as follows: $3,661,716 in 2018 and $10,690,443 in 2019.
The cost of investment securities held at September 30, 2017, was $5,166,316,236 for federal income tax purposes. Gross unrealized appreciation and depreciation for all investments (excluding short-term investments) at September 30, 2017, for federal income tax purposes was $20,668,316 and $80,025,431, respectively resulting in net unrealized depreciation of $59,357,115. As of and during the year ended September 30, 2017, the Fund did not have any liability for unrecognized tax benefits. The Fund recognizes interest and penalties, if any, related to unrecognized tax benefits as income tax expense in the Statement of Operations. During the year, the Fund did not incur any interest or penalties. The Fund is not subject to examination by U.S. federal tax authorities for years ended on or before September 30, 2012 or by state tax authorities for years ended on or before September 30, 2011.
During the year ended September 30, 2017, the Fund reclassified $22,316,705 from Net Investment Loss to Paid in Capital, and $7,298,706 from Accumulated Realized Gain to Paid in Capital, to align financial reporting with tax reporting. The permanent book/tax differences arose principally from differing book/tax treatment of market discount accretion of securities and paydowns from mortgage-backed and other asset-backed securities.
NOTE 6 — Redemption Fees
Effective June 26, 2017, the Board of Directors of the Fund approved the removal of the 2% redemption fee. Prior to that date, a redemption fee of 2% applied to redemptions within 90 days of purchase. For the year ended September 30, 2017, the Fund collected $140,140 in redemption fees. The impact of these fees is less than $0.01 per share.
NOTE 7 — Disclosure of Fair Value Measurements
The Fund uses the following methods and inputs to establish the fair value of its assets and liabilities. Use of particular methods and inputs may vary over time based on availability and relevance as market and economic conditions evolve.
Equity securities are generally valued each day at the official closing price of, or the last reported sale price on, the exchange or market on which such securities principally are traded, as of the close of business on that day. If there have been no sales that day, equity securities are generally valued at the last available bid price. Securities that are unlisted and fixed-income and convertible securities listed on a national securities exchange for which the over-the-counter (OTC) market more accurately reflects the securities' value in the judgment of the Fund's officers, are valued at the most recent bid price. However, most fixed income securities are generally valued at prices obtained from pricing vendors and brokers. Vendors value such securities based on one or more of the following inputs: transactions, bids, offers quotations from dealers and trading systems, spreads and other relationships observed in the markets among comparable securities, benchmarks, underlying equity of the issuer, and proprietary pricing models such as cash flows, financial or collateral performance and other reference data (includes prepayments, defaults, collateral, credit enhancements, and interest rate volatility). Short-term corporate notes with maturities of 60 days or less at the time of purchase are valued at amortized cost.
Securities for which representative market quotations are not readily available or are considered unreliable by the Adviser are valued as determined in good faith under procedures adopted by the authority of the Fund's Board of Directors. Various inputs may be reviewed in order to make a good faith determination of a security's value. These inputs include, but are not limited to, the type and cost of the security; contractual or legal restrictions on resale of the security; relevant financial or business developments of the issuer; actively traded similar or related securities; conversion or exchange rights on the security; related corporate actions; significant events
42
FPA NEW INCOME, INC.
NOTES TO FINANCIAL STATEMENTS
Continued
occurring after the close of trading in the security; and changes in overall market conditions. Fair valuations and valuations of investments that are not actively trading involve judgment and may differ materially from valuations of investments that would have been used had greater market activity occurred.
The Fund classifies its assets based on three valuation methodologies. Level 1 values are based on quoted market prices in active markets for identical assets. Level 2 values are based on significant observable market inputs, such as quoted prices for similar assets and quoted prices in inactive markets or other market observable inputs as noted above including spreads, cash flows, financial performance, prepayments, defaults, collateral, credit enhancements, and interest rate volatility. Level 3 values are based on significant unobservable inputs that reflect the Fund's determination of assumptions that market participants might reasonably use in valuing the assets. These assumptions consider inputs such as proprietary pricing models, cash flows, prepayments, defaults, and collateral. The valuation levels are not necessarily an indication of the risk associated with investing in those securities. The valuation levels are not necessarily an indication of the risk associated with investing in those securities. The following table presents the valuation levels of the Fund's investments as of September 30, 2017:
Investments | | Level 1 | | Level 2 | | Level 3 | | Total | |
Common Stock | |
Industrials | | $ | 5,126,208 | | | | — | | | | — | | | $ | 5,126,208 | | |
Commercial Mortgage-Backed Securities | |
Agency | | | — | | | $ | 1,705,125 | | | | — | | | | 1,705,125 | | |
Agency Stripped | | | — | | | | 415,307,867 | | | | — | | | | 415,307,867 | | |
Non-Agency | | | — | | | | 160,634,583 | | | $ | 34,551,474 | | | | 195,186,057 | | |
Residential Mortgage-Backed Securities | |
Agency Collateralized Mortgage Obligation | | | — | | | | 223,367,177 | | | | — | | | | 223,367,177 | | |
Agency Pool Adjustable Rate | | | — | | | | 1,021,031 | | | | — | | | | 1,021,031 | | |
Agency Pool Fixed Rate | | | — | | | | 135,608,355 | | | | — | | | | 135,608,355 | | |
Agency Stripped | | | — | | | | 1,905,473 | | | | — | | | | 1,905,473 | | |
Non-Agency Collateralized Mortgage
Obligation | | | — | | | | 244,714,397 | | | | 26,669,226 | | | | 271,383,623 | | |
Asset-Backed Securities | |
Auto | | | — | | | | 912,104,524 | | | | — | | | | 912,104,524 | | |
Collateralized Loan Obligation | | | — | | | | 683,073,301 | | | | 34,278,504 | | | | 717,351,805 | | |
Credit Card | | | — | | | | 185,495,706 | | | | — | | | | 185,495,706 | | |
Equipment | | | — | | | | 400,715,898 | | | | 52,391,833 | | | | 453,107,731 | | |
Other | | | — | | | | 304,277,299 | | | | 146,766,982 | | | | 451,044,281 | | |
Corporate Bonds & Notes | | | — | | | | 121,165,447 | | | | 26,053,011 | | | | 147,218,458 | | |
Corporate Bank Debt | | | — | | | | 117,521,560 | | | | 106,188,498 | | | | 223,710,058 | | |
Municipals | | | — | | | | 4,419,376 | | | | — | | | | 4,419,376 | | |
U.S. Treasuries | | | — | | | | 761,896,266 | | | | — | | | | 761,896,266 | | |
Short-Term Investment | | | — | | | | 46,301,000 | | | | — | | | | 46,301,000 | | |
| | | $ | 5,126,208 | | | $ | 4,721,234,385 | | | $ | 426,899,528 | | | $ | 5,153,260,121 | | |
43
FPA NEW INCOME, INC.
NOTES TO FINANCIAL STATEMENTS
Continued
The following table summarizes the Fund's Level 3 investment securities and related transactions during the year ended September 30, 2017:
Investment | | Beginning
Value at
September 30,
2016 | | Net Realized
and
Unrealized
Gains
(Losses)* | | Purchases | | (Sales) | | Gross
Transfers
In | | Gross
Transfers
(Out) | | Ending
Value at
September 30,
2017 | | Net Change
in Unrealized
Appreciation
(Depreciation)
related to
Investments
held at
September 30,
2017 | |
Commercial Mortgage-
Backed Agency
Stripped | | $ | 24,719,119 | | | $ | (1,974,145 | ) | | | — | | | | — | | | | — | | | $ | (22,744,974 | ) | | | — | | | | — | | |
Commercial Mortgage-
Backed Securities
Non-Agency | | | 24,773,680 | | | | 464,046 | | | $ | 34,427,647 | | | $ | (6,946,765 | ) | | | — | | | | (18,167,134 | ) | | $ | 34,551,474 | | | $ | 124,183 | | |
Residential Mortgage-
Backed Non-Agency
Collateralized
Mortgage Obligation | | | 16,913,546 | | | | 64,627 | | | | 24,711,994 | | | | (13,099,802 | ) | | | — | | | | (1,921,139 | ) | | | 26,669,226 | | | | (7,165 | ) | |
Asset-Backed Securities
Auto | | | 13,672,192 | | | | (16,659 | ) | | | — | | | | — | | | | — | | | | (13,655,533 | ) | | | — | | | | — | | |
Asset-Backed Securities
Collateralized
Loan Obligations | | | — | | | | 130,089 | | | | 34,148,415 | | | | — | | | | — | | | | — | | | | 34,278,504 | | | | 123,541 | | |
Asset-Backed Securities
Equipment | | | — | | | | 434,142 | | | | 54,134,944 | | | | (2,177,253 | ) | | | — | | | | — | | | | 52,391,833 | | | | 432,337 | | |
Other Asset-Backed
Securities | | | 63,978,631 | | | | 1,038,623 | | | | 101,648,728 | | | | (19,899,000 | ) | | | — | | | | — | | | | 146,766,982 | | | | 1,029,714 | | |
Corporate Bonds & Notes | | | 42,782,387 | | | | (4,940,204 | ) | | | — | | | | (11,789,172 | ) | | | — | | | | — | | | | 26,053,011 | | | | (6,012,584 | ) | |
Corporate Bank Debt | | | 106,314,525 | | | | 797,025 | | | | 105,624,316 | | | | (66,879,873 | ) | | | — | | | | (39,667,495 | ) | | | 106,188,498 | | | | 1,157,590 | | |
Municipals | | | 23,869,420 | | | | 55,781 | | | | — | | | | (19,505,825 | ) | | | — | | | | (4,419,376 | ) | | | — | | | | — | | |
| | | $ | 317,023,500 | | | $ | (3,946,675 | ) | | $ | 354,696,044 | | | $ | (140,297,690 | ) | | | — | | | $ | (100,575,651 | ) | | $ | 426,899,528 | | | $ | (3,152,384 | ) | |
* Net realized and unrealized gains (losses) are included in the related amounts in the statement of operations.
Level 3 Valuation Process: Investments classified within Level 3 of the fair value hierarchy are valued by the Adviser in good faith under procedures adopted by authority of the Fund's Board of Directors. The Adviser employs various methods to determine fair valuations including regular review of key inputs and assumptions, and review of related market activity, if any. However, there are generally no observable trade activities in these securities. The Adviser reports to the Board of Directors at their regularly scheduled quarterly meetings, or more often if warranted. The report includes a summary of the results of the process, the key inputs and assumptions noted, and any changes to the inputs and assumptions used. When appropriate, the Adviser will recommend changes to the procedures and process employed. The value determined for an investment using the fair value procedures may differ significantly from the value realized upon the sale of such investment.
44
FPA NEW INCOME, INC.
NOTES TO FINANCIAL STATEMENTS
Continued
Transfers of investments between different levels of the fair value hierarchy are recorded at market value as of the end of the reporting period. There were no transfers between Level 1 and 2.
There were transfers of $100,575,651 out of Level 3 into Level 2 during the year ended September 30, 2017. The transfers are a result of change in pricing vendor commencing coverage and pricing of the securities during the period and a change in observable inputs.
The following table summarizes the quantitative inputs and assumptions used for items categorized as items categorized as Level 3 of the fair value hierarchy as of September 30, 2017:
Financial Assets | | Fair Value at
September 30,
2017 | | Valuation
Technique(s) | | Unobservable
Inputs | | Price/Range | |
Commercial Mortgage-Backed
Securities Non-Agency | | $ | 34,551,474 | | | Third-Party
Broker Quote* | | Quotes/Prices | | | $100.06-$101.00 | | |
Residential Mortgage-Backed
Non-Agency CMO | | $ | 24,712,000 | | | Third-Party
Broker Quote* | | Quotes/Prices | | | $100.00 | | |
| | | $ | 1,957,226 | | | Pricing Model** | | Prices | | | $41.88-$62.31 ($50.70) | | |
| | | | | | | Discount | | | 0.0%-16.2% (1.37%) | | |
Asset-Backed Securities
Collateralized Loan Obligation | | $ | 34,278,504 | | | Third-Party
Broker Quote* | | Quotes/Prices | | | $100.13 | | |
Equipment | | $ | 52,391,833 | | | Third-Party | | Quotes/Prices | | | $99.82-$101.10 | | |
| | | | | Broker Quote* | | | | | |
Other | | $ | 146,766,982 | | | Third-Party | | Quotes/Prices | | | $99.28-$106.89 | | |
| | | | | Broker Quote* | | | | | |
Corporate Bonds & Notes | | $ | 26,053,011 | | | Third-Party
Broker Quote* | | Quotes/Prices | | | $0.33-$100.25 | | |
Corporate Bank Debt | | $ | 106,158,833 | | | Pricing Vendor | | Prices | | | $99.88-$100.75 | | |
| | | $ | 29,665 | | | Pricing Model*** | | Reference prices | | | $100.36-$100.75 | | |
* The Third-Party Broker Quote technique involves obtaining an independent third-party broker quote for the security.
** The Pricing Model technique for Level 3 securities involves preparing a proprietary broker price opinion (BPO) model using valuation information provided by the loan servicer based on local market resources and sales trends published by the National Association of Realtors, and a broker, and then applying an appropriate discount to that valuation. The discount reflects market conditions such as lack of liquidity of the investment, the costs associated with foreclosure and liquidation, the historical performance of the loan pool and the characteristics of the remaining loans including whether or not the loans are performing.
*** The Pricing Model technique for Level 3 securities involves calculating the difference between the fair value of the funded portion of the security and the price at which the Fund is committed to fund the unfunded commitment.
NOTE 8 — Distribution to Shareholders
On October 2, 2017, the Fund declared a dividend from net investment income of $0.075 per share payable October 3, 2017 to shareholders of record on September 29, 2017. For financial statement purposes, this dividend was recorded on the ex-dividend date, October 2, 2017.
45
FPA NEW INCOME, INC.
NOTES TO FINANCIAL STATEMENTS
Continued
NOTE 9 — Collateral Requirements
FASB Accounting Standards Update No. 2011-11, Disclosures about Offsetting Assets and Liabilities, requires disclosures to make financial statements that are prepared under U.S. GAAP more comparable to those prepared under International Financial Reporting Standards. Under this guidance the Fund discloses both gross and net information about instruments and transactions eligible for offset such as instruments and transactions subject to an agreement similar to a master netting arrangement. In addition, the Fund discloses collateral received and posted in connection with master netting agreements or similar arrangements.
The following table presents the Fund's repurchase agreements by counterparty net of amounts available for offset under an ISDA Master agreement or similar agreements and net of the related collateral received or pledged by the Fund as of September 30, 2017, are as follows:
Counterparty | | Gross Assets
in the Statement of
Assets and Liabilities | | Collateral
Received | | Assets (Liabilities)
Available for Offset | | Net Amount
of Assets* | |
State Street Bank
and Trust Company | | $ | 46,301,000 | | | $ | 46,301,000 | ** | | | — | | | | — | | |
* Represents the net amount receivable from the counterparty in the event of default.
** Collateral with a value of $47,227,331 has been received in connection with a master repurchase agreement. Excess of collateral received from the individual master repurchase agreement is not shown for financial reporting purposes.
46
FPA NEW INCOME, INC.
REPORT OF INDEPENDENT REGISTERED
PUBLIC ACCOUNTING FIRM
TO THE SHAREHOLDERS AND
BOARD OF DIRECTORS OF FPA NEW INCOME, INC.
We have audited the accompanying statement of assets and liabilities of FPA New Income, Inc. (the "Fund"), including the portfolio of investments, as of September 30, 2017, the related statement of operations for the year then ended, the statements of changes in net assets for each of the two years in the period then ended, and the financial highlights for each of the five years in the period then ended. These financial statements and financial highlights are the responsibility of the Fund's management. Our responsibility is to express an opinion on these financial statements and financial highlights based on our audits.
We conducted our audits in accordance with the standards of the Public Company Accounting Oversight Board (United States). Those standards require that we plan and perform the audit to obtain reasonable assurance about whether the financial statements and financial highlights are free of material misstatement. The Fund is not required to have, nor were we engaged to perform, an audit of its internal control over financial reporting. Our audits included consideration of internal control over financial reporting as a basis for designing audit procedures that are appropriate in the circumstances, but not for the purpose of expressing an opinion on the effectiveness of the Fund's internal control over financial reporting. Accordingly, we express no such opinion. An audit also includes examining, on a test basis, evidence supporting the amounts and disclosures in the financial statements, assessing the accounting principles used and significant estimates made by management, as well as evaluating the overall financial statement presentation. Our procedures included confirmation of securities owned as of September 30, 2017, by correspondence with the custodian, brokers and agent banks, where replies were not received from brokers and agent banks, we performed other auditing procedures. We believe that our audits provide a reasonable basis for our opinion.
In our opinion, such financial statements and financial highlights referred to above present fairly, in all material respects, the financial position of FPA New Income, Inc. as of September 30, 2017, the results of its operations for the year then ended, the changes in its net assets for each of the two years in the period then ended, and the financial highlights for each of the five years in the period then ended, in conformity with accounting principles generally accepted in the United States of America.
Los Angeles, California
November 20, 2017
47
FPA NEW INCOME FUND, INC.
SHAREHOLDER EXPENSE EXAMPLE
September 30, 2017 (Unaudited)
Fund Expenses
Mutual fund shareholders generally incur two types of costs: (1) transaction costs, and (2) ongoing costs, including advisory and administrative fees; shareholder service fees; and other Fund expenses. The Example is intended to help you understand your ongoing costs (in dollars) of investing in the Fund and to compare these costs with the ongoing costs of investing in other mutual funds. The Example is based on an investment of $1,000 invested at the beginning of the year and held for the entire year.
Actual Expenses
The information in the table under the heading "Actual Performance" provides information about actual account values and actual expenses. You may use the information in this column, together with the amount you invested, to estimate the expenses that you paid over the period. Simply divide your account value by $1,000 (for example, an $8,600 account value divided by $1,000 = 8.6), then multiply the result by the number in the first column in the row entitled "Expenses Paid During Period" to estimate the expenses you paid on your account during this period.
Hypothetical Example for Comparison Purposes
The information in the table under the heading "Hypothetical Performance (5% return before expenses)" provides information about hypothetical account values and hypothetical expenses based on the Fund's actual expense ratio and an assumed rate of return of 5% per year before expenses, which is not the Fund's actual return. The hypothetical account values and expenses may not be used to estimate the actual ending account balance or expenses you paid for the period. You may use this information to
compare the ongoing costs of investing in the Fund and other funds. To do so, compare this 5% hypothetical example with the 5% hypothetical examples that appear in the shareholder reports of other funds.
Please note that the expenses shown in the table are meant to highlight your ongoing costs only and do not reflect any transactional costs. Therefore, the information under the heading "Hypothetical Performance (5% return before expenses)" is useful in comparing ongoing costs only, and will not help you determine the relative total costs of owning different funds. In addition, if these transactional costs were included, your costs would have been higher. Even though the Fund does not charge transaction fees, if you purchase shares through a broker, the broker may charge you a fee. You should evaluate other mutual funds' transaction fees and any applicable broker fees to assess the total cost of ownership for comparison purposes.
| | | Actual
Performance | | Hypothetical
Performance
(5% return
before
expenses) | |
Beginning Account Value
March 31, 2017 | | $ | 1,000.00 | | | $ | 1,000.00 | | |
Ending Account Value
September 30, 2017 | | $ | 1,016.10 | | | $ | 1,022.61 | | |
Expenses Paid During
Period* | | $ | 2.48 | | | $ | 2.48 | | |
* Expenses are equal to the Fund's annualized expense ratio of 0.49%, multiplied by the average account value over the period and prorated for the six-months ended September 30, 2017 (183/365 days).
48
FPA NEW INCOME, INC.
APPROVAL OF INVESTMENT ADVISORY AGREEMENT
(Unaudited)
Approval of the Advisory Agreement. At a meeting of the Board of Directors held on August 14, 2017, the Directors approved the continuation of the advisory agreement between the Fund and the Adviser for an additional one-year period through September 30, 2018, on the recommendation of the Independent Directors, who met in executive session on August 14, 2017 prior to the Board meeting to review and discuss the proposed continuation of the advisory agreement. The following paragraphs summarize the material information and factors considered by the Board and the Independent Directors, as well as the Directors' conclusions relative to such factors.
Nature, Extent and Quality of Services. The Board and the Independent Directors considered information provided by the Adviser in response to their requests, as well as information provided throughout the year regarding the Adviser and its staffing in connection with the Fund, including the Fund's portfolio managers, the senior analysts supporting team, the scope of services supervised and provided by the Adviser, and the absence of any significant service problems reported to the Board. The Board and the Independent Directors noted the experience, length of service and the outstanding reputation of the Fund's portfolio managers: Tom Atteberry, who has been with the Adviser since 1997 and has served as portfolio manager since 2004 and Abhijeet V. Patwardhan, who joined the Adviser in 2010 and has served as portfolio manager since 2015. After discussion, the Board and the Independent Directors concluded that the nature, extent and quality of services provided by the Adviser have benefited and should continue to benefit the Fund and its shareholders.
Investment Performance. The Board and the Independent Directors reviewed the overall investment performance of the Fund. The Directors also received information from an independent consultant, Morningstar, regarding the Fund's performance relative to a peer group of alternative credit focus funds selected by Morningstar (the "Peer Group"). The Board and the Independent Directors considered the Adviser's representation that the Fund's investment style, as evidenced by the short-term duration of most of its portfolio securities, as well as the Fund's flexibility to invest in a variety of areas, complicated Peer Group comparisons in that the Fund is managed in a more conservative style than the typical fixed income fund and the funds in the Peer Group. The Board and the Independent Directors noted the Fund's absolute investment results and its long-term investment performance when compared to the Peer Group. The Board and the Independent Directors noted the Fund outperformed its Peer Group median for the one- and three-year periods ending March 31, 2017, and underperformed its Peer Group for the five- and ten-year periods ending March 31, 2017. The Board and the Independent Directors also noted that the Fund outperformed the Fund's benchmark, Barclays Capital U.S. Aggregate Index, for the one-year period ending March 31, 2017 and underperformed for the three-, five- and ten-year periods ending March 31, 2017. They also noted that Morningstar has continued to give the Fund a "Bronze" Analyst Rating. After discussion, the Board and the Independent Directors determined that the Fund's investment results were reasonable in light of the Fund's objectives and concluded that the Adviser's continued management of the Fund should benefit the Fund and its shareholders.
Advisory Fees and Fund Expenses; Comparison with Peer Group and Institutional Fees. The Board and the Independent Directors considered information provided by the Adviser regarding the Fund's advisory fees and total expense levels. The Board and the Independent Directors reviewed comparative information regarding fees and expenses for the Peer Group. The Board and the Independent Directors noted that the Fund's advisory fee was slightly above the average of the Peer Group and its overall expense ratio was equal to that of the Peer Group. In addition, the Directors noted that the fee rate charged to the Fund is higher than institutional accounts managed in a similar style by the portfolio managers but considered the Adviser's discussion of the differences between the services provided by the Adviser to the Fund and those provided by the Adviser to the
49
FPA NEW INCOME, INC.
APPROVAL OF INVESTMENT ADVISORY AGREEMENT
(Unaudited) Continued
institutional accounts. The Board and the Independent Directors concluded that the continued payment of advisory fees and expenses by the Fund to the Adviser was fair and reasonable and should continue to benefit the Fund and its shareholders.
Adviser Profitability and Costs. The Board and the Independent Directors considered information provided by the Adviser regarding the Adviser's costs in providing services to the Fund, the profitability of the Adviser and the benefits to the Adviser from its relationship to the Fund. They reviewed and considered the Adviser's representations regarding its assumptions and methods of allocating certain costs, such as personnel costs, which constitute the Adviser's largest operating cost, over-head and trading costs with respect to the provision of investment advisory services. The Independent Directors discussed with the Adviser the general process through which individuals' compensation is determined and then reviewed by the management committee of the Adviser, as well as the Adviser's methods for determining that the compensation levels are at appropriate levels to attract and retain the personnel necessary to provide high quality professional investment advice. In evaluating the Adviser's profitability, they excluded certain distribution and marketing-related expenses. The Board and the Independent Directors recognized that the Adviser is entitled under the law to earn a reasonable level of profits for the services that it provides to the Fund. The Board and the Independent Directors concluded that the Adviser's level of profitability from its relationship with the Fund did not indicate that the Adviser's compensation was unreasonable or excessive.
Economies of Scale and Sharing of Economies of Scale. The Board and the Independent Directors considered whether there have been economies of scale with respect to the management of the Fund, whether the Fund has appropriately benefited from any economies of scale, and whether the fee rate is reasonable in relation to the Fund's asset levels and any economies of scale that may exist. The Board and the Independent Directors considered the Adviser's representation that its internal costs of providing investment management services to the Fund have significantly increased in recent years as a result of a number of factors, including the Adviser's substantial investment in additional professional resources and staffing. The Board and the Independent Directors considered quantitative and qualitative information regarding the Adviser's representation that it has also made significant investments in: (1) the two portfolio managers, four analysts, traders and other investment personnel who assist with the management of the Fund; (2) new compliance, operations, and administrative personnel; (3) information technology, portfolio accounting and trading systems; and (4) office space, each of which enhances the quality of services provided to the Fund. The Board and the Independent Directors also considered the Adviser's willingness to close funds to new investors when it believed that a fund may have limited capacity to grow or that it otherwise would benefit fund shareholders.
The Board and the Independent Directors recognized that the advisory fee rate schedule for the Fund does not have breakpoints. They considered that many mutual funds have breakpoints in the advisory fee structure as a means by which to share in the benefits of potential economies of scale as a fund's assets grow. They also considered that not all funds have breakpoints in their fee structures and that breakpoints are not the exclusive means of sharing potential economies of scale. The Board and the Independent Directors considered the Adviser's statement that it believes that breakpoints currently remain inappropriate for the Fund given the ongoing investments the Adviser is making in its business for the benefit of the Fund, uncertainties regarding the direction of the economy, rising inflation, increasing costs for personnel and systems, and growth or contraction in the Fund's assets, all of which could negatively impact the profitability of the Adviser. The Board and the Independent Directors also noted that the Adviser has contractually agreed to reimburse the Fund for Total Annual Fund
50
FPA NEW INCOME, INC.
APPROVAL OF INVESTMENT ADVISORY AGREEMENT
(Unaudited) Continued
Operating Expenses in excess of 0.49% of the average daily net assets of the Fund (excluding brokerage fees and commissions, interest, taxes, shareholder service fees, fees and expenses of other funds in which the Fund invests, and extraordinary expenses) through January 31, 2018. The Board and the Independent Directors concluded that the Fund is benefitting from the ongoing investments made by the Adviser in its team of personnel serving the Fund and in the Adviser's service infrastructure, and that in light of these investments, the addition of breakpoints in the Fund's advisory fee structure was not warranted at current asset levels.
Ancillary Benefits. The Board and the Independent Directors considered other actual and potential benefits to the Adviser from managing the Fund, including the acquisition and use of research services with commissions generated by the Fund, in concluding that the contractual advisory and other fees are fair and reasonable for the Fund. They noted that the Adviser does not have any affiliates that benefit from the Adviser's relationship to the Fund.
Conclusions. The Board and the Independent Directors determined that the Fund continues to benefit from the services of the Adviser's highly experienced portfolio management team, which has produced reasonable long-term returns. In addition, the Board and the Independent Directors agreed that the Fund continues to receive high quality services from the Adviser. The Board and the Independent Directors concluded that the current advisory fee rate is reasonable and fair to the Fund and its shareholders in light of the nature and quality of the services provided by the Adviser and the Adviser's profitability and costs. The Board and the Independent Directors also noted their intention to continue monitoring the factors relevant to the Adviser's compensation, such as changes in the Fund's asset levels, changes in portfolio management personnel and the cost and quality of the services provided by the Adviser to the Fund. On the basis of the foregoing, and without assigning particular weight to any single factor, none of which was dispositive, the Board and the Independent Directors concluded that it would be in the best interests of the Fund to continue to be advised and managed by the Adviser and determined to approve the continuation of the current Advisory Agreement for another one-year period through September 30, 2018.
51
FPA NEW INCOME, INC.
DIRECTOR AND OFFICER INFORMATION
(Unaudited)
Name, Address(1)
and Year of Birth | | Position(s)
With Fund
Years Served | | Principal Occupation(s)
During the Past 5 Years | | Portfolios in
Fund Complex
Overseen | | Other
Directorships
During the
Past 5 Years | |
Independent Directors | | | | | | | | | |
Allan M. Rudnick – 1940† | | Director and Chairman*
Years Served: 5 | | Private Investor. Formerly Co-Founder, Chief Executive Officer, Chairman and Chief Investment Officer of Kayne Anderson Rudnick Investment Management from 1989 to 2007. | | | 7 | | | | |
Sandra Brown – 1955† | | Director*
Years Served: 1 | | Consultant. Formerly CEO and President of Transamerica Financial Advisers, Inc., 1999 to 2009; President, Transamerica Securities Sales Corp. 1998 to 2009; VP, Bank of America Mutual Fund Administration 1990 to 1998. | | | 7 | | | | |
Mark L. Lipson – 1949† | | Director*
Years Served: 2 | | Consultant. ML2Advisors, LLC. Formerly Managing Director, Bessemer Trust (2007-2014) and US Trust (2003-2006); Founder, Chairman and CEO of the Northstar Mutual Funds (1993-2001). | | | 7 | | | | |
Alfred E. Osborne, Jr. – 1944† | | Director*
Years Served: 18 | | Senior Associate Dean of the John E. Anderson School of Management at UCLA. | | | 7 | | | Wedbush, Inc., Nuverra Environmental Solutions, Inc., and Kaiser Aluminun, Inc. | |
A. Robert Pisano – 1943† | | Director*
Years Served: 5 | | Consultant. Formerly President and Chief Operating Officer of the Motion Picture Association of America, Inc. from 2005 to 2011. | | | 7 | | | Entertainment Partners and Resources Global Professionals. | |
Patrick B. Purcell – 1943† | | Director*
Years Served: 11 | | Retired. Formerly Executive Vice President, Chief Financial and Administrative Officer of Paramount Pictures from 1983 to 1998. | | | 7 | | | | |
Interested Director(2) | | | | | | | | | |
J. Richard Atwood – 1960 | | Director* and President
Years Served: 20 | | Managing Partner of the Adviser. | | | 7 | | | | |
52
FPA NEW INCOME, INC.
DIRECTOR AND OFFICER INFORMATION
(Unaudited) Continued
Name, Address(1)
and Year of Birth | | Position(s)
With Fund
Years Served | | Principal Occupation(s)
During the Past 5 Years | | Portfolios in
Fund Complex
Overseen | | Other
Directorships
During the
Past 5 Years | |
Officers | | | | | | | | | |
Thomas H. Atteberry – 1953 | | Portfolio Manager
Years Served: 12 | | Partner of the Adviser. | | | | | |
Abhijeet Patwardhan – 1979 | | Portfolio Manager
Years Served: 2 | | Managing Director (since 2015) and a Director of Research (since 2015) of the Adviser. Formerly Senior Vice President (2014 to 2015) and Vice President (2010 to 2013) of the Adviser. | | | | | |
David C. Lebisky – 1972 | | Chief Compliance Officer
Years Served: <1 | | President of Lebisky Compliance Consulting LLC (since October 2015). Consultant, Duff & Phelps Compliance Consulting (since 2016). Senior Consultant, Freeh Group International Solutions, LLC (a global risk management firm) (since 2015). Formerly, Director of Regulatory Administration, Scotia Institutional Investments US, LP (2010 to 2014). | | | | | |
E. Lake Setzler – 1967 | | Treasurer
Years Served: 11 | | Senior Vice President and Controller of the Adviser. | | | | | |
Francine S. Hayes – 1967 | | Secretary
Years Served: 2 | | Vice President and Senior Counsel of State Street Bank and Trust Company | | | | | |
(1) The address for each Director and each Officer (except Ms. Hayes) is 11601 Wilshire Boulevard, Suite 1200, Los Angeles, California 90025. Ms. Hayes' address is State Street Bank and Trust Company, One Lincoln Street, Boston, Massachusetts 02111.
(2) "Interested person" within the meaning of the 1940 Act by virtue of his affiliation with the Fund's Adviser.
* Directors serve until their resignation, removal or retirement.
† Audit Committee member
The Statement of Additional Information includes additional information about the Directors and is available, without charge, upon request by calling (800) 982-4372.
53
FPA NEW INCOME FUND, INC.
(Unaudited)
INVESTMENT ADVISER
First Pacific Advisors, LLC
11601 Wilshire Boulevard, Suite 1200
Los Angeles, CA 90025
TRANSFER & SHAREHOLDER SERVICE AGENT
UMB Fund Services, Inc.
P.O. Box 2175
Milwaukee, WI 53201-2175
or
235 West Galena Street
Milwaukee, WI 53212-3948
(800) 638-3060
CUSTODIAN AND ADMINISTRATOR
State Street Bank and Trust Company
Boston, Massachusetts
TICKER: FPNIX
CUSIP: 302544101
DISTRIBUTOR
UMB Distribution Services, LLC
235 West Galena Street
Milwaukee, Wisconsin 53212-3948
LEGAL COUNSEL
Dechert LLP
San Francisco, California
INDEPENDENT REGISTERED PUBLIC ACCOUNTING FIRM
Deloitte & Touche LLP
Los Angeles, California
This report has been prepared for the information of shareholders of FPA NEW INCOME, INC., and is not authorized for distribution to prospective investors unless preceded or accompanied by an effective prospectus. The financial information included in this report has been taken from the records of the Fund without examination by independent auditors.
The Fund's complete proxy voting record for the 12 months ended June 30, 2017 is available without charge, upon request by calling (800) 982-4372 and on the SEC's website at www.sec.gov.
The Fund's schedule of portfolio holdings, filed the first and third quarter of the Fund's fiscal year on Form N-Q with the SEC, is available on the SEC's website at www.sec.gov. Form N-Q is available at the SEC's Public Reference Room in Washington, D.C., and information on the operations of the Public Reference Room may be obtained by calling (202) 551-8090. To obtain Form N-Q from the Fund, shareholders can call (800) 982-4372.
Additional information about the Fund is available online at www.fpafunds.com. This information includes, among other things, holdings, top sectors, and performance, and is updated on or about the 15th business day after the end of each quarter.
Item 2. Code of Ethics.
(a) The registrant has adopted a code of ethics that applies to the registrant’s principal executive and financial officers.
(b) Not applicable.
(c) During the period covered by this report, there were no amendments to the provisions of the code of ethics adopted in 2(a) above.
(d) During the period covered by this report, there were not any implicit or explicit waivers to the provisions of the code of ethics adopted in 2(a).
(e) Not applicable.
(f) A copy of the registrant’s code of ethics is filed as an exhibit to this Form N-CSR.
Item 3. Audit Committee Financial Expert.
The registrant’s board of directors has determined that Patrick B. Purcell, who is a member of the registrant’s audit committee and board of directors, is an “audit committee financial expert” and is “independent,” as those terms are defined in this Item. This designation will not increase the designee’s duties, obligations or liability as compared to his duties, obligations or liability as a member of the audit committee and of the board of directors. This designation does not affect the duties, obligations or liability of any other member of the audit committee or the board of directors.
Item 4. Principal Accountant Fees and Services.
| | | 2016 | | 2017 | |
(a) | Audit Fees | | $ | 69,138 | | $ | 70,866 | |
(b) | Audit Related Fees | | $ | -0- | | $ | -0- | |
(c) | Tax Fees(1) | | $ | 9,108 | | $ | 9,336 | |
(d) | All Other Fees | | $ | -0- | | $ | -0- | |
(1) Tax Fees are for preparation of the Fund’s tax return(s).
(e)(1) The audit committee shall pre-approve all audit and permissible non-audit services that the committee considers compatible with maintaining the independent auditors’ independence. The pre-approval requirement will extend to all non-audit services provided to the registrant, the adviser, and any entity controlling, controlled by, or under common control with the adviser that provides ongoing services to the registrant, if the engagement relates directly to the operations and financial reporting of the registrant; provided, however, that an engagement of the registrant’s independent auditors to perform attest services for the registrant, the adviser or its affiliates required by generally accepted auditing standards to complete the examination of the registrant’s financial statements (such as an examination conducted in accordance with Statement on Standards for Attestation Engagements Number 16, or a Successor Statement, issued by the American Institute of Certified Public Accountants), will be deem pre-approved if:
(i) the registrant’s independent auditors inform the audit committee of the engagement,
(ii) the registrant’s independent auditors advise the audit committee at least annually that the performance of this engagement will not impair the independent auditor’s independence with respect to the registrant, and
(iii) the audit committee receives a copy of the independent auditor’s report prepared in connection with such services. The committee may delegate to one or more committee members the authority to review and pre-approve audit and permissible non-audit services. Actions taken under any such delegation will be reported to the full committee at its next meeting.
(e)(2) 0% of the services provided to the registrant described in paragraphs b—d of this Item were approved by the Audit Committee pursuant to paragraph (c)(7)(i)(C) of Rule 2-01 of Regulation S-X. There were no services provided to the investment adviser or any entity controlling, controlled by or under common control with the adviser described in paragraphs (b) — (d) of this Item that were required to be pre-approved by the audit committee.
(f) All services performed on the engagement to audit the registrant’s financial statements for the most recent fiscal year end were performed by the principal accountant’s full-time, permanent employees.
(g) �� None.
(h) Not applicable.
Item 5. Audit Committee of Listed Registrants.
Not applicable.
Item 6. Investments.
(a) Schedule of Investments is included as a part of the report to shareholders filed under Item 1 of this Form N-CSR.
(b) Not applicable.
Item 7. Disclosure of Proxy Voting Policies and Procedures for Closed-End Management Investment Companies.
Not applicable.
Item 8. Portfolio Managers of Closed-End Management Investment Companies.
Not applicable.
Item 9. Purchases of Equity Securities by Closed-End Management Investment Company and Affiliated Purchasers.
Not applicable.
Item 10. Submission of Matters to a Vote of Security Holders.
There have been no material changes to the procedures by which the shareholders may recommend nominees to the registrant’s board of directors.
Item 11. Controls and Procedures.
(a) The principal executive officer and principal financial officer of the registrant have concluded that the registrant’s disclosure controls and procedures (as defined in Rule 30a-3(c) under the Investment Company Act of 1940) are effective based on their evaluation of the disclosure controls and procedures as of a date within 90 days of the filing date of this report.
(b) There have been no significant changes in the registrant’s internal controls over financial reporting (as defined in Rule 30a-3(d) under the Investment Company Act of 1940) that occurred during the registrant’s second fiscal quarter of the period covered by this report that have materially affected, or is reasonably likely to materially affect, the registrant’s internal controls over financial reporting.
Item 12. Disclosure of Securities Lending Activities for Closed-End Management Investment Companies.
Not applicable.
Item 13. Exhibits.
(a)(1) Code of ethics as applies to the registrant’s principal executive and financial officers is attached hereto.
(a)(2) The certifications required by Rule 30a-2(a) under the Investment Company Act of 1940 are attached hereto.
(a)(3) Not applicable.
(b) The certifications required by Rule 30a-2(b) under the Investment Company Act of 1940 and Section 906 of the Sarbanes-Oxley Act of 2002 are attached hereto.
SIGNATURES
Pursuant to the requirements of the Securities Exchange Act of 1934 and the Investment Company Act of 1940, the registrant has duly caused this report to be signed on its behalf by the undersigned, thereunto duly authorized.
FPA NEW INCOME, INC. | |
| |
| | |
By: | /s/ J. Richard Atwood | |
| J. Richard Atwood | |
| President (principal executive officer) | |
| | |
Date: | December 7, 2017 | |
Pursuant to the requirements of the Securities Exchange Act of 1934 and the Investment Company Act of 1940, this report has been signed below by the following persons on behalf of the registrant and in the capacities and on the dates indicated.
By: | /s/ J. Richard Atwood | |
| J. Richard Atwood | |
| President (principal executive officer) | |
| | |
Date: | December 7, 2017 | |
| | |
| | |
By: | /s/ E. Lake Setzler III | |
| E. Lake Setzler III | |
| Treasurer (principal financial officer) | |
| | |
Date: | December 7, 2017 | |