UNITED STATES
SECURITIES AND EXCHANGE COMMISSION
Washington, D.C. 20549
FORM N-CSR
CERTIFIED SHAREHOLDER REPORT OF REGISTERED
MANAGEMENT INVESTMENT COMPANIES
Investment Company Act file number: 811-01735
fpa NEW Income, inc.
(Exact name of registrant as specified in charter)
11601 WILSHIRE BLVD., STE. 1200
LOS ANGELES, CALIFORNIA 90025
(Address of principal executive offices)(Zip code)
| (Name and Address of Agent for Service) | Copy to: |
J. RICHARD ATWOOD, PRESIDENT FPA NEW INCOME, INC. 11601 WILSHIRE BLVD., STE. 1200 LOS ANGELES, CALIFORNIA 90025 | MARK D. PERLOW, ESQ. DECHERT LLP ONE BUSH STREET, STE. 1600 SAN FRANCISCO, CA 94104 |
Registrant’s telephone number, including area code: (310) 473-0225
Date of fiscal year end: September 30
Date of reporting period: September 30, 2020
Item 1: Report to Shareholders.

Distributor:
UMB DISTRIBUTION SERVICES, LLC
235 West Galena Street
Milwaukee, Wisconsin 53212
Beginning on January 1, 2021, as permitted by regulations adopted by the Securities and Exchange Commission, we intend to no longer mail paper copies of the Fund's shareholder reports, unless you specifically request paper copies of the reports from the Fund or from your financial intermediary, such as a broker-dealer or bank. Instead, the reports will be made available on the FPA Funds website (fpa.com/funds), and you will be notified by mail each time a report is posted and provided with a website link to access the report. If you already elected to receive shareholder reports electronically, you will not be affected by this change and you need not take any action. If you prefer to receive shareholder reports and other communications electronically, you may update your mailing preferences with your financial intermediary, or enroll in e-delivery at fpa.com (for accounts held directly with the Fund).
You may elect to continue to receive paper copies of all future reports free of charge. If you invest through a financial intermediary, you may contact your financial intermediary to request that you continue to receive paper copies of your shareholder reports. If you invest directly with the Fund, you may inform the Fund that you wish to continue receiving paper copies of your shareholder reports by contacting us at (800) 638-3060. Your election to receive reports in paper will apply to all funds held with the FPA Funds or through your financial intermediary.
FPA NEW INCOME, INC.
LETTER TO SHAREHOLDERS
INTRODUCTION
Dear Fellow Shareholders,
FPA New Income, Inc. (the "Fund") returned 0.71% in the third quarter of 2020 and 1.96% year-to-date.
As of September 30, 2020, the portfolio had a yield-to-worst1 of 1.65% and an effective duration of 1.30 years. Continuing a trend since the pandemic-related selloff in March of this year, yields declined during the quarter across much of the fixed income market, predominantly driven by lower spreads (as the change in Treasury yields was negligible). Despite progress toward a vaccine and therapies for COVID-19 over the past few months, the imminent arrival of an effective and widely disseminated treatment for COVID-19 is not a certainty (although market prices suggest otherwise). Accordingly, the long-term impact of COVID-19 on the economy and asset values remains unclear. This lack of certainty, combined with low interest rates and elevated prices creates a challenging investment environment and leads us to focus on short duration, high-quality bonds (rated single-A or higher) and specific types of credit investments (investments rated BBB or lower). To hedge against a macroeconomic 'failure to launch' — such as weaker-than-expected economic growth and/or weaker-than-expected inflation — we invested in five-year maturity Treasury bonds. The Fund's credit exposure (investments rated BBB or lower) increased from 5.6% on June 30, 2020 to 6.2% as of September 30, 2020.2 Cash and equivalents decreased from 14.2% of the portfolio as of June 30 to 4.7% at September 30.
To help optimize returns for the Fund's existing shareholders, effective as of the close of business on July 31, 2020, the Fund voluntarily closed to new investors and, effective July 1, 2020, FPA implemented a temporary expense waiver (the "Temporary Waiver"), which reduced the Fund's expense ratio to mitigate the effect of the Fund's temporary elevated cash holding. Please see the announcement for more details. On Oct. 2, 2020, FPA removed the Temporary Waiver because we have reduced cash and equivalents to a level we believe is more appropriate in the current market environment and which we believe can be maintained for the near future. Please see the announcement for more details.
Portfolio Attribution3
The largest contributors to performance during the third quarter were corporate loans, asset-backed securities (ABS) backed by auto loans or leases, and ABS backed by equipment. Following a significant increase in spreads and a decline in prices in the first quarter of 2020, spreads decreased significantly during the second quarter, leading to price appreciation across much of the fixed income market, a trend that continued in the third
1 Yield to Worst ("YTW") is presented gross of fees and reflects the lowest possible yield on a callable bond without the issuer defaulting. It does not represent the yield an investor should expect to receive. As of September 30, 2020, the Fund's subsidized/unsubsidized 30-day SEC standardized yield ("SEC Yield") was 1.98%/1.86% respectively. The SEC Yield calculation is an annualized measure of the Fund's dividend and interest payments for the last 30 days, less the Fund expenses. Subsidized yield reflects fee waivers and/or expense reimbursements during the period. Without waivers and/or reimbursements, yields would be reduced. Unsubsidized yield does not adjust for any fee waivers and/or expense reimbursements in effect. The SEC Yield calculation shows investors what they would earn in yield over the course of a 12-month period if the fund continued earning the same rate for the rest of the year.
2 Includes bonds representing 72 basis points (bps) of the portfolio that were downgraded to BBB during this quarter.
3 This information is not a recommendation for a specific security or sector and these securities/sectors may not be in the Fund at the time you receive this report. The information provided does not reflect all positions or sectors purchased, sold or recommended by FPA during the quarter. The portfolio holdings as of the most recent quarter-end may be obtained at www.fpa.com.
Past performance is no guarantee, nor is it indicative, of future results.
1
FPA NEW INCOME, INC.
LETTER TO SHAREHOLDERS
(Continued)
quarter. The three largest contributors this quarter all benefited from this price appreciation. In addition, the corporate loan holdings benefited from repayment of a few investments that were priced below par.
The only detractors from performance during the quarter were five-year maturity Treasury bonds, a newly instituted position designed to serve as a hedge for the overall portfolio. At the sector level, there were no other meaningful detractors from performance, though there were individual bonds in some sectors that immaterially detracted from performance.
Portfolio Activity
The table below shows the Fund's exposures as of June 30, 2020 compared to September 30, 2020:
| Sector | | % Portfolio
9/30/2020 | | % Portfolio
6/30/2020 | | Change (bps*) | |
ABS | | | 67.6 | | | | 61.9 | | | | 564 | | |
Mortgage Backed (CMO)4 | | | 7.6 | | | | 7.3 | | | | 29 | | |
Stripped Mortgage-backed | | | 1.9 | | | | 2.5 | | | | -55 | | |
Corporate | | | 4.1 | | | | 5.2 | | | | -114 | | |
CMBS4 | | | 8.3 | | | | 7.5 | | | | 82 | | |
Mortgage Pass-through | | | 0.2 | | | | 0.2 | | | | -5 | | |
U.S. Treasury | | | 4.6 | | | | 0.0 | | | | 462 | | |
Agencies | | | 1.0 | | | | 1.2 | | | | -12 | | |
Cash and equivalents | | | 4.7 | | | | 14.2 | | | | -952 | | |
Total | | | 100.0 | % | | | 100.0 | % | | | | | |
Yield-to-worst5 | | | 1.65 | % | | | 2.06 | % | | | -40 | | |
Effective Duration (years) | | | 1.30 | | | | 1.14 | | | | 0.17 | | |
Average Life (years) | | | 1.78 | | | | 1.47 | | | | 0.31 | | |
* Except effective duration and average life. Due to rounding, the numbers presented above may not add up precisely to the totals provided.
Declining spreads combined with slightly lower Treasury yields during the quarter reduced overall yields across much of the fixed income market.
4 Collateralized mortgage obligations ("CMO") are mortgage-backed bonds that separate mortgage pools into different maturity classes. Commercial mortgage-backed securities ("CMBS") are securities backed by commercial mortgages rather than residential mortgages.
5 Yield to Worst ("YTW") is presented gross of fees and reflects the lowest possible yield on a callable bond without the issuer defaulting. It does not represent the yield an investor should expect to receive. As of September 30, 2020, the Fund's subsidized/unsubsidized 30-day SEC standardized yield ("SEC Yield") was 1.98%/1.86% respectively. The SEC Yield calculation is an annualized measure of the Fund's dividend and interest payments for the last 30 days, less the Fund expenses. Subsidized yield reflects fee waivers and/or expense reimbursements during the period. Without waivers and/or reimbursements, yields would be reduced. Unsubsidized yield does not adjust for any fee waivers and/or expense reimbursements in effect. The SEC Yield calculation shows investors what they would earn in yield over the course of a 12-month period if the fund continued earning the same rate for the rest of the year.
Past performance is no guarantee, nor is it indicative, of future results.
2
FPA NEW INCOME, INC.
LETTER TO SHAREHOLDERS
(Continued)
Yield Curve

Chart data as of the dates shown. Source: Bloomberg.
Many segments of the high-quality bond market now trade at spreads that are lower than pre-COVID-19 levels. The chart and table below show spreads in high-quality structured products, where we find the most attractive risk-adjusted return (in comparison to investment-grade corporate bonds, agency mortgages or other high-quality investments):
3
FPA NEW INCOME, INC.
LETTER TO SHAREHOLDERS
(Continued)
ABS Spreads

| Spread to worst (bps) | | 12/26/2019 | | 2020
Peak Spread | | 10/1/2020 | |
AAA 3 yr Credit Cards | | | 26 | | | | 200 | | | | 13 | | |
AAA 3 yr. Prime Auto ABS | | | 33 | | | | 200 | | | | 26 | | |
AAA 2 yr Subprime Auto ABS | | | 44 | | | | 250 | | | | 30 | | |
AAA 3 yr. Ag/Heavy Equipment ABS | | | 53 | | | | 300 | | | | 39 | | |
AAA 5 yr CMBS | | | 62 | | | | 300 | | | | 67 | | |
US 3.0 CLO Secondary Spreads AAA | | | 120 | | | | 400 | | | | 134 | | |
Source: JP Morgan. Chart data from December 26, 2019 through October 1, 2020.
Notably, the market for collateralized loan obligations (CLOs) is one of the few segments where spreads have still not fully recovered to pre-COVID-19 levels, which is why we directed much our investment activity there during the quarter. The CLO exposure increased from 10% of the portfolio as of June 30 to 19% as of September 30.
We stated in a recent commentary that crises often create attractive investments due to a combination of better protection for investors and better return profiles. This year's COVID-19 crisis has been no different. Newly created CLOs include better protection for investors in the form of additional credit support to guard against losses in the underlying corporate loan collateral. Further, the underlying loan portfolios in these new CLOs are often of higher quality (and are therefore considered less risky). Our CLO investment activity was focused on AAA bonds issued by managers who have a track record and investment approach that we believe
4
FPA NEW INCOME, INC.
LETTER TO SHAREHOLDERS
(Continued)
will limit the risk of permanent impairment of our bonds. Should these managers fail to invest in a manner consistent with their history, the significant protection built into AAA bonds should protect the bonds from permanent losses of capital, even in a high default and loss scenario.
The relatively higher CLO spreads highlighted above should translate into higher yields. Moreover, due to risk-free rates near zero,6 the flatness of the yield curve between three months and three years and coupon floors on CLOs,7 the yield opportunity cost of buying floating rate CLOs versus a fixed rate alternative is insignificant. On the other hand, if short-term interest rates rise, the coupon on CLOs should adjust accordingly, helping to maintain the value of those bonds versus fixed rate bonds, all things being equal. The tradeoff is that the limited call protection on CLOs may result in less price appreciation if rates decline.8
Beyond CLOs, we made other high-quality investments in ABS backed by prime or subprime auto loans or leases, equipment, servicer advances, or insurance premium loans; commercial mortgage-backed securities; and residential mortgage-backed securities backed by inactive reverse mortgages.
6 In this case, risk-free rates refer to yields on Treasury bonds maturing in zero to three years.
7 A coupon floor is the minimum coupon rate on a floating rate security.
8 Floating rate bond coupons increase and decrease based on increases and decreases, respectively, in the reference interest rate. Some floating rate bonds have a coupon floor whereby the coupon rate is equal to the greater of the coupon rate defined by the coupon floor and the reference interest rate-based coupon rate. Depending on the magnitude of a decline in the reference interest rate, the floating rate coupon on a bond with a coupon floor might not decline if the reference interest rate-based coupon rate is less than the coupon floor. If a bond's coupon rate equals the coupon floor, then the bond starts to behave like a fixed rate bond whereby a decline in market yields causes the bond's price to rise. However, bonds that are callable often do not appreciate in price much beyond the call price. Callable bonds are bonds that are able to be redeemed by the bond issuer. Some bonds have call protection which is a provision that prohibits the issuer from redeeming the bond for a specified period of time and, once that period expires, the issuer may redeem the bond at a specified price (the call price). Bonds often do not appreciate in price much beyond the call price because bond investors are wary of the loss associated with paying a price above the call price then subsequently having the bond redeemed at the call price. All things being equal, bonds with longer call protection periods and higher call prices have more potential price appreciation when market yields decline. Conversely, bonds with shorter call protection periods and call prices equal to par, like some CLOs, have less potential price appreciation.
5
FPA NEW INCOME, INC.
LETTER TO SHAREHOLDERS
(Continued)
In credit markets, spreads declined during the quarter but remain higher than they were at the start of the year. However, spreads are now applied to much lower risk-free rates versus the beginning of the year, resulting in overall yields in high-yield bonds and loans that are comparable to pre-COVID-19 yields, as shown below:
Bloomberg Barclays U.S. High Yield Bond Index

| | 12/31/2019 | | 2020
Peak Spread | | 10/1/2020 | |
Spread (bps) | | | 357 | | | | 1,123 | | | | 540 | | |
YTW | | | 5.19 | % | | | 11.69 | % | | | 5.69 | % | |
Source: Bloomberg Barclays. Chart data from December 31, 2019 through October 1, 2020.
6
FPA NEW INCOME, INC.
LETTER TO SHAREHOLDERS
(Continued)
Credit Suisse Leveraged Loan Index
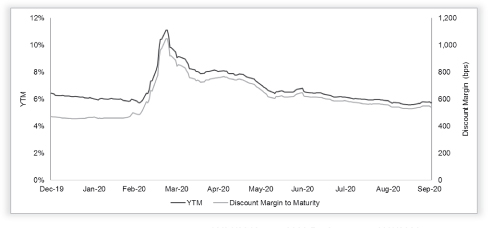
| | 12/31/2019 | | 2020
Peak Spread | | 10/1/2020 | |
Discount Margin to Maturity (bps) | | | 471 | | | | 1,047 | | | | 542 | | |
YTM | | | 6.43 | % | | | 11.10 | % | | | 5.73 | % | |
Chart data from December 31, 2019 through October 1, 2020. Source: Bloomberg Barclays.
To paraphrase our comments from last quarter, there is a disconnect between bond prices and the uncertainty in the world. It was true three months ago and it is still true today that long-term economic growth and asset prices depend on the effectiveness of a COVID-19 vaccine or treatment and the availability of either. Undoubtedly, substantial progress has been made toward a vaccine and new treatments — but we still don't have enough clarity on their timing and effectiveness. That means there are still significant questions about which borrowers (corporate, consumer or government) will have the wherewithal to repay debt. Our view is that investors should be compensated for the risk of nonpayment of debt on an absolute basis. Thus, while relative value investors may see an attractive high-yield market in a "there-is-no-alternative" world, we see little value in high-yield bonds and other similarly rated debt. Consequently, to the extent that we are investing in credit, those investments have been directed toward situations where we believe there is a significant margin of safety. Those investments have also generally been short in duration to provide protection against an increase in spreads and yields that may arise due to an increase in actual or expected defaults. As one might imagine, such investments are not plentiful in today's world, but this past quarter we identified a few in corporate bank debt and structured products bonds backed by non-performing residential or commercial loans.
7
FPA NEW INCOME, INC.
LETTER TO SHAREHOLDERS
(Continued)
Due to significant worldwide economic uncertainty, during this past quarter we hedged the portfolio. The high-quality investments described above were largely consistent with our oft-described duration stress test, which seeks to identify bonds that we expect will generate at least a breakeven return over 12 months (assuming that yields rise by 100 basis points during that 12-month period). As yields decline, this stress test directs us toward shorter duration bonds. The shorter duration is beneficial if interest rates rise, which can occur due to some combination of an increase in inflation, real interest rates and spreads. As it relates to inflation and real interest rates, the Federal Reserve has pledged to keep monetary policy accommodative until inflation averages 2% over time, per the Federal Reserve's new average inflation targeting framework. Rising inflation should lead to higher nominal yields and, theoretically, eventually higher real yields — and both would contribute to lower bond prices.
However, despite the Federal Reserve's wishes, higher inflation is not a certainty. There is a very real possibility that meaningful inflation will fail to materialize due to lackluster long-term economic growth. That lackluster growth could be caused by society's inability to control COVID-19, for example, the debt overhang and unproductive capital allocation of a central bank-supported post-COVID-19 economy or unproductive fiscal stimulus. In response, the Federal Reserve could push monetary policy to new bounds, including past the zero bound of interest rates. Current commentary from the Federal Reserve suggests that it is not seriously contemplating negative interest rate policy. However, there is nothing stopping the market from pushing yields on bonds into negative territory in anticipation of a move in that direction by the Federal Reserve. Alternatively, the Federal Reserve could pursue other measures that suppress bond yields. All else constant, such outcomes would be positive for bonds in the near term since lower yields would lead to price appreciation. However, the short duration bonds in our portfolio would see limited benefit.
To gain exposure to more price appreciation if yields decline, we instituted a hedge via an investment in five-year Treasury bonds. As of the end of the quarter, that position represented 4.6% of the portfolio. If yields decline further, we expect these Treasury bonds will experience much greater price appreciation than the bonds in the rest of the portfolio (which have an average duration of approximately one year). We chose five-year maturity bonds and sized this Treasury position so it will meaningfully contribute to returns in the event that interest rates decline, but if rates rise, they should still position the portfolio to produce a positive total return over 12 months. Finally, Treasuries have the added benefit of being among the most liquid investments in the world, so we can quickly adjust the hedge as market conditions change. That said, like many hedges, this hedge has a cost, so we recognize that these Treasury bonds could periodically detract from performance as interest rates move.
Market Commentary
In many ways, today's market is unprecedented. The 10-year US Treasury yield recently hit its lowest point in more than 230 years, and the yield on the 2-year US Treasury also reached a new all-time low this year since they started tracking it in 1976 (see the following charts). But this isn't the first time we've dealt with historically low interest rates.
8
FPA NEW INCOME, INC.
LETTER TO SHAREHOLDERS
(Continued)
10-Year US Treasury Yield (%)
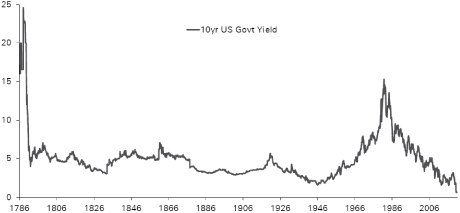
Source: Deutsche Bank. Data Source: Global Financial Data, Deutsche Bank
Chart data covers the period January 1786 to September 30, 2020.
Yields are spliced together from various government borrowings through history before the Treasury market was established
9
FPA NEW INCOME, INC.
LETTER TO SHAREHOLDERS
(Continued)
2-Year US Treasury Yield (%)

Source: Bloomberg. Chart data from June 1, 1976 through September 30, 2020.
The new all-time low yield on the 2-year Treasury was 0.13% on Sept. 30, 2020. That beats a record low established just eight years ago, at the end of September 2012, when the yield on the 2-year Treasury was 0.23%. At a high level, it appears that today's environment is similar to where we were in late 2012.
But there are differences too, of course. One is the shape of the yield curve. In 2012, the yield curve was much steeper than it is today (see the following chart).
10
FPA NEW INCOME, INC.
LETTER TO SHAREHOLDERS
(Continued)
Yield Curve
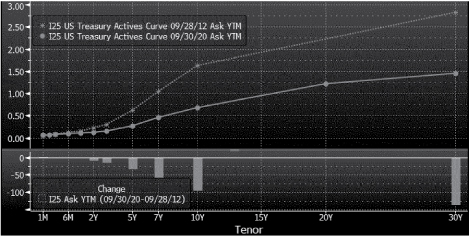
Chart data as of the dates shown. Source: Bloomberg.
The difference in steepness stems from the difference in inflation expectations. The chart below shows the implied inflation rate over five years starting five years from each date on the chart (i.e., the 5-year forward, 5-year breakeven inflation).
11
FPA NEW INCOME, INC.
LETTER TO SHAREHOLDERS
(Continued)
5y5y Inflation Swaps9

Chart data period September 30, 2012 through September 30, 2020. Source: Bloomberg.
Inflation expectations were much higher in 2012 than they are today. Consequently, long-term real interest rates were higher eight years ago than they are today, as reflected below by the real yield on 10-year Treasury Inflation Protected Securities (TIPS).
9 5y5y inflation swap is the measure of expected inflation of the five-year period that begins five years from today.
12
FPA NEW INCOME, INC.
LETTER TO SHAREHOLDERS
(Continued)
10-Year TIPS
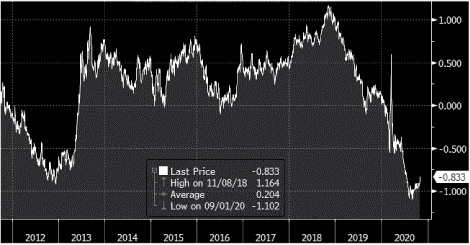
Chart data period September 30, 2012 through September 30, 2020. Source: Bloomberg
In the period following the Great Financial Crisis starting in 2010, the Federal Reserve undertook what was then a novel approach of buying Treasuries and agency mortgages in a bid to stimulate economic growth and generate higher inflation. Something similar is playing out today. The Federal Reserve is using its playbook from the Great Financial Crisis and applying it to the current COVID-19 crisis but with much greater magnitude and at a much faster pace. Just a few months into the COVID-19 crisis, Federal Reserve purchases of Treasuries and mortgages had already grown to exceed the balance sheet expansion that took many years to amass following the Great Financial Crisis. This time, however, the Federal Reserve took the additional step of adjusting its inflation objective. In the past, 2% inflation was the ceiling, but now the Federal Reserve says it will allow inflation to exceed 2% to achieve an average of 2% over some undefined period.10
This comparison to the past is relevant for anyone wondering if we can produce an attractive return in a historically low interest rate environment. The charts below show that we've done it before. The first graph shows the rolling three-year returns of the Fund versus the Bloomberg Barclays US Aggregate Bond Index and the Bloomberg Barclays US Aggregate 1-3 Year Bond Index. The second graph shows the Fund's performance over a rolling five-year period versus the same indices.
10 Source: Federal Reserve, August 27, 2020, https://www.federalreserve.gov/newsevents/pressreleases/monetary20200827a.htm
13
FPA NEW INCOME, INC.
LETTER TO SHAREHOLDERS
(Continued)
Rolling 3-Year Return11

Chart data period September 30, 2012 through September 30, 2020. Source: Morningstar, Bloomberg Barclays.
11 Comparison to indices are for illustrative purposes only. The Fund does not include outperformance of any index in its investment objectives. Past performance is no guarantee, not is it indicative, of future results.
14
FPA NEW INCOME, INC.
LETTER TO SHAREHOLDERS
(Continued)
Rolling 5-Year Return12
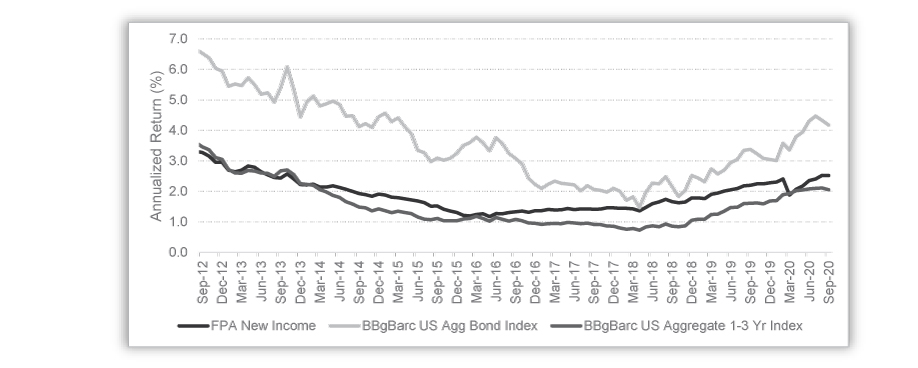
Chart data period September 30, 2012 through September 30, 2020. Source: Morningstar, Bloomberg Barclays.
We recognize that no two markets are the same, and that there are differences between 2012 and today. Still, the charts above show that in the eight years since the last time interest rates reached historical lows, the Fund has generally provided a better return than the Bloomberg Barclays US Aggregate 1-3 Year Bond Index and, in some instances, the Bloomberg Barclays US Aggregate Bond Index as well, when comparing the rolling 3-year and 5-year annualized returns. That kind of performance requires patience and is not necessarily achieved over a few quarters or a year, but rather over longer horizons. It also requires discipline and consistent adherence to a tried and true investment philosophy. Today's environment is more challenging than it was in 2012 because the yield curve is flatter, which means that even if one wanted to take on additional duration risk, there is very little compensation for doing so. Having said that, the steeper yield curve in 2012 did not ultimately matter at the time because, as evidenced by our short duration in 2012, we did not need to utilize the yield curve steepness back then to aid the Fund's performance.
Looking ahead, we are cautiously optimistic about the Fund's positioning. The sharp decline in yields and spreads in the market have left the indices noted in the paragraph above with a lower yield-to-worst than the Fund. (See table below). Consequently, with a shorter duration than the indices, the Fund has a much better yield/duration profile, which we believe leaves the Fund well positioned in the short-term if interest rates or credit spreads rise modestly.
12 Comparison to indices are for illustrative purposes only. The Fund does not include outperformance of any index in its investment objectives. Past performance is no guarantee, not is it indicative, of future results.
15
FPA NEW INCOME, INC.
LETTER TO SHAREHOLDERS
(Continued)
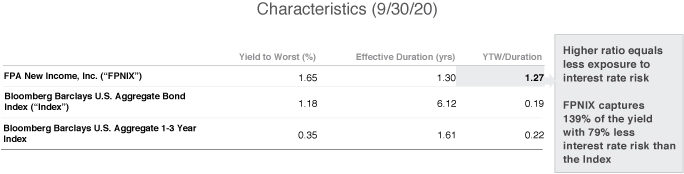
Source: Factset, Bloomberg Barclays. Yield to Worst ("YTW") is presented gross of fees and expenses and reflects the lowest possible yield on a callable bond without the issuer defaulting. It does not represent the yield an investor should expect to receive. As of September 30, 2020, the FPNIX subsidized/unsubsidized 30-day standardized SEC yield ("SEC Yield") was 1.98%/1.86% respectively. The SEC Yield calculation is an annualized measure of the Fund's dividend and interest payments for the last 30 days, less the Fund expenses. Subsidized yield reflects fee waivers and/or expense reimbursements during the period. Without waivers and/or reimbursements, yields would be reduced. Unsubsidized yield does not adjust for any fee waivers and/or expense reimbursements in effect. The SEC Yield calculation shows investors what they would earn in yield over the course of a 12-month period if the fund continued earning the same rate for the rest of the year.
Comparison to the Bloomberg Barclays U.S. Aggregate Bond Index and the Bloomberg Barclays U.S. Aggregate 1-3 Year Index is for illustrative purposes only. FPNIX does not include outperformance of any index or benchmark in their investment objectives. An investor cannot invest directly in an index. Past performance is no guarantee, nor it is indicative, of future results. Please refer to the end of the presentation for important disclosures and Glossary of Terms.
In closing, we find ourselves in somewhat familiar territory. While it's not the optimum investment environment, we have lived through historically low interest rates before and we have learned how to act and what to expect. We don't yet know exactly what types of investments will be the source of future performance but, because of our investment discipline, we do know what they look like.
The fixed income team thanks you for your continued support and the trust which you place in us with your hard-earned savings. Just like before, we will get through this difficult fixed-income environment.
Thank you for your continued trust and support.
Respectfully submitted,


Thomas H. Atteberry Abhijeet Patwardhan
Portfolio Manager Portfolio Manager
October 2020
16
FPA NEW INCOME, INC.
LETTER TO SHAREHOLDERS
(Continued)
Appendix:
Attribution and Portfolio Activity for the Twelve Months Ending September 30, 2020
Portfolio Attribution
For the period September 30, 2019 through September 30, 2020:
Largest contributors to performance:
• Asset-backed securities (ABS) backed by auto loans
• Asset-backed securities (ABS) backed by equipment
• Non-agency mortgage-backed securities
Largest detractors from performance:
• GNMA project loan interest only bonds were the only meaningful detractors from performance
Portfolio Activity
| Sector | | % Portfolio
9/30/2020 | | % Portfolio
9/30/2019 | | Change (bps*) | |
ABS | | | 67.6 | | | | 51.1 | | | | 1,642 | | |
Mortgage Backed (CMO)13 | | | 7.6 | | | | 9.5 | | | | -186 | | |
Stripped Mortgage-backed | | | 1.9 | | | | 3.0 | | | | -105 | | |
Corporate | | | 4.1 | | | | 5.4 | | | | -132 | | |
CMBS4 | | | 8.3 | | | | 6.0 | | | | 232 | | |
Mortgage Pass-through | | | 0.2 | | | | 13.0 | | | | -1,282 | | |
U.S. Treasury | | | 4.6 | | | | 6.8 | | | | -215 | | |
Agencies | | | 1.0 | | | | 1.2 | | | | -16 | | |
Cash and equivalents | | | 4.7 | | | | 4.0 | | | | 61 | | |
Total | | | 100.0 | % | | | 100.0 | % | | | | | |
Yield-to-worst14 | | | 1.65 | % | | | 2.63 | % | | | -97 | | |
Effective Duration (years) | | | 1.30 | | | | 1.75 | | | | -0.44 | | |
Average Life (years) | | | 1.78 | | | | 2.15 | | | | -0.37 | | |
* Except effective duration and average life. Due to rounding, the numbers presented above may not add up precisely to the totals provided.
13 Collateralized mortgage obligations ("CMO") are mortgage-backed bonds that separate mortgage pools into different maturity classes. Commercial mortgage-backed securities ("CMBS") are securities backed by commercial mortgages rather than residential mortgages.
14 Yield to Worst ("YTW") is presented gross of fees and reflects the lowest possible yield on a callable bond without the issuer defaulting. It does not represent the yield an investor should expect to receive. As of September 30, 2020, the Fund's subsidized/unsubsidized 30-day SEC standardized yield ("SEC Yield") was 1.98%/1.86% respectively. The SEC Yield calculation is an annualized measure of the Fund's dividend and interest payments for the last 30 days, less the Fund expenses. Subsidized yield reflects fee waivers and/or expense reimbursements during the period. Without waivers and/or reimbursements, yields would be reduced. Unsubsidized yield does not adjust for any fee waivers and/or expense reimbursements in effect. The SEC Yield calculation shows investors what they would earn in yield over the course of a 12-month period if the fund continued earning the same rate for the rest of the year.
Past performance is no guarantee, nor is it indicative, of future results.
17
FPA NEW INCOME, INC.
LETTER TO SHAREHOLDERS
(Continued)
Important Disclosures
This update is for informational and discussion purposes only and does not constitute, and should not be construed as, an offer or solicitation for the purchase or sale of any securities, products or services discussed, and neither does it provide investment advice. Any such offer or solicitation shall only be made pursuant to the Fund's Prospectus, which supersedes the information contained herein in its entirety.
The views expressed herein, and any forward-looking statements, are as of the date of the publication and are those of the portfolio management team and are subject to change without notice. Future events or results may vary significantly from those expressed and are subject to change at any time in response to changing circumstances and industry developments. This information and data has been prepared from sources believed reliable, but the accuracy and completeness of the information cannot be guaranteed and is not a complete summary or statement of all available data. You should not construe the contents of this document as legal, tax, accounting, investment or other advice or recommendations.
Thomas Atteberry and Abhijeet Patwardhan have been portfolio managers for the Fund since November 2004 and November 2015, respectively, and manage the Fund in a manner that is substantially similar to the prior portfolio manager, Robert Rodriguez. Mr. Rodriguez ceased serving as the Fund's portfolio manager effective December 2009.
Portfolio composition will change due to ongoing management of the Fund. References to individual securities or sectors are for informational purposes only and should not be construed as recommendations by the Fund, the portfolio managers, the Adviser, or the distributor. It should not be assumed that future investments will be profitable or will equal the performance of the security or sector examples discussed. The portfolio holdings as of the most recent quarter-end may be obtained at www.fpa.com.
The statements made herein may be forward-looking and/or based on current expectations, projections, and/or information currently available. Actual results may differ from those anticipated. The portfolio managers and/or FPA cannot assure future results and disclaims any obligation to update or alter any statistical data and/or references thereto, as well as any forward-looking statements, whether as a result of new information, future events, or otherwise. Such statements may or may not be accurate over the long-term.
Investments, including investments in mutual funds, carry risks and investors may lose principal value. Capital markets are volatile and can decline significantly in response to adverse issuer, political, regulatory, market, or economic developments. The Fund may purchase foreign securities, including American Depository Receipts (ADRs) and other depository receipts, which are subject to interest rate, currency exchange rate, economic and political risks; this may be enhanced when investing in emerging markets. Foreign investments, especially those of companies in emerging markets, can be riskier, less liquid, harder to value, and more volatile than investments in the United States. The securities of smaller, less well-known companies can be more volatile than those of larger companies.
The return of principal in a bond fund is not guaranteed. Bond funds have the same issuer, interest rate, inflation and credit risks that are associated with underlying bonds owned by the Fund. Lower rated bonds, convertible securities and other types of debt obligations involve greater risks than higher rated bonds.
Interest rate risk is the risk that when interest rates go up, the value of fixed income securities, such as bonds, typically go down and investors may lose principal value. Credit risk is the risk of loss of principal due to the issuer's failure to repay a loan. Generally, the lower the quality rating of a security, the greater the risk that the issuer will fail to pay interest fully and return principal in a timely manner. If an issuer defaults the security may lose some or all of its value.
18
FPA NEW INCOME, INC.
LETTER TO SHAREHOLDERS
(Continued)
Mortgage securities and collateralized mortgage obligations (CMOs) are subject to prepayment risk and the risk of default on the underlying mortgages or other assets; such derivatives may increase volatility. Convertible securities are generally not investment grade and are subject to greater credit risk than higher-rated investments. High yield securities can be volatile and subject to much higher instances of default.
Value style investing presents the risk that the holdings or securities may never reach their full market value because the market fails to recognize what the portfolio management team considers the true business value or because the portfolio management team has misjudged those values. In addition, value style investing may fall out of favor and underperform growth or other styles of investing during given periods.
The ratings agencies that provide ratings are Standard and Poor's, Moody's, and Fitch. Credit ratings range from AAA (highest) to D (lowest). Bonds rated BBB or above are considered investment grade. Credit ratings of BB and below are lower-rated securities (junk bonds). High-yielding, non-investment grade bonds (junk bonds) involve higher risks than investment grade bonds. Bonds with credit ratings of CCC or below have high default risk.
Please refer to the Fund's Prospectus for a complete overview of the primary risks associated with the Fund.
The Fund is not authorized for distribution unless preceded or accompanied by a current prospectus. The prospectus can be accessed at: https://fpa.com/request-funds-literature.
Index / Benchmark Definitions
Comparison to any index is for illustrative purposes only and should not be relied upon as a fully accurate measure of comparison. The Fund will be less diversified than the indices noted herein, and may hold non-index securities or securities that are not comparable to those contained in an index. Indices will hold positions that are not within the Fund's investment strategy. Indices are unmanaged, do not reflect any commissions, fees or expenses which would be incurred by an investor purchasing the underlying securities. The Fund does not include outperformance of any index or benchmark in its investment objectives. Investors cannot invest directly in an index.
Bloomberg Barclays US Aggregate Bond Index provides a measure of the performance of the U.S. investment grade bonds market, which includes investment grade U.S. Government bonds, investment grade corporate bonds, mortgage pass-through securities and asset-backed securities that are publicly offered for sale in the United States. The securities in the Index must have at least 1 year remaining in maturity. In addition, the securities must be denominated in U.S. dollars and must be fixed rate, nonconvertible, and taxable.
Bloomberg Barclays US Aggregate 1-3 Year Index provides a measure of the performance of the U.S. investment grade bonds market, which includes investment grade U.S. Government bonds, investment grade corporate bonds, mortgage pass-through securities and asset-backed securities that are publicly offered for sale in the United States. The securities in the Index must have a remaining maturity of 1 to 3 years. In addition, the securities must be denominated in U.S. dollars and must be fixed rate, nonconvertible, and taxable.
Bloomberg Barclays U.S. High Yield Index measures the market of USD-denominated, non-investment grade, fixed-rate, taxable corporate bonds.
Bloomberg Barclays BB U.S. High Yield Index ex. Energy measures the market of USD-denominated, non-investment grade, fixed-rate, taxable corporate bonds rated BB excluding energy sector.
19
FPA NEW INCOME, INC.
LETTER TO SHAREHOLDERS
(Continued)
Credit Suisse Leveraged Loan Index is designed to mirror the investable universe of U.S. dollar institutional leveraged loans, including U.S. and international borrowers.
The Consumer Price Index (CPI) is an unmanaged index representing the rate of the inflation of U.S. consumer prices as determined by the U.S. Department of Labor Statistics. There can be no guarantee that the CPI will reflect the exact level of inflation at any given time. This index reflects non-seasonally adjusted returns.
CPI + 100 bps is the measure of the CPI plus an additional 100 basis points.
Basis Point (bps) is equal to one hundredth of one percent, or 0.01%. 100 basis points = 1%.
Corporate holdings include bank debt, corporate bonds and common stock.
A discount margin to maturity is the average expected return of a floating-rate security (typically a bond) that's earned in addition to the index underlying, or reference rate of, the security. The size of the discount margin depends on the price of the floating- or variable-rate security.
Effective Duration (years) is the duration calculation for bonds with embedded options. Effective duration takes into account that expected cash flows will fluctuate as interest rates change.
Margin of Safety is a principle of investing in which an investor purchases securities when they believe the market price is significantly below its estimated intrinsic value. In other words, when the market price of a security is, in an investor's view, significantly below their estimation of the intrinsic value, the difference is the margin of safety. Using the margin of safety principle may help to reduce downside risk. Note, determining a company's "true" worth or intrinsic value is highly subjective. There is no guarantee that the methods used to evaluate intrinsic value will be accurate or precise or that an investment made using this principle will be successful.
Repo (Repurchase Agreement) is a form of short-term borrowing for dealers in government securities.
Spread to worst (bps) measures the dispersion of returns between the best and worst performing security in a given market, usually bond markets, or between returns from different markets.
Weighted Average Life (years) is the average length of time that each dollar of unpaid principal on a loan, a mortgage or an amortizing bond remains outstanding.
Yield to Maturity is the rate of return anticipated on a bond if held until the end of its lifetime. YTM is considered a long-term bond yield expressed as an annual rate. The YTM calculation takes into account the bond's current market price, par value, coupon interest rate and time to maturity. It is also assumed that all coupon payments are reinvested at the same rate as the bond's current yield.
©2020 Morningstar, Inc. All Rights Reserved. The information contained herein: (1) is proprietary to Morningstar and/or its content providers; (2) may not be copied or distributed; and (3) is not warranted by Morningstar to be accurate, complete or timely. Neither Morningstar nor its content providers are responsible for any damages or losses arising from any use of this information. Past performance is no guarantee of future results.
The FPA Funds are distributed by UMB Distribution Services, LLC, 235 W. Galena Street, Milwaukee, WI, 53212.
20
FPA NEW INCOME, INC.
LETTER TO SHAREHOLDERS
(Continued)
The discussions of Fund investments represent the views of the Fund's managers at the time of this report and are subject to change without notice. References to individual securities are for informational purposes only and should not be construed as recommendations to purchase or sell individual securities.
FUND RISKS
Investments in mutual funds carry risks and investors may lose principal value. Stock markets are volatile and can decline significantly in response to adverse issuer, political, regulatory, market, or economic developments. The funds may purchase foreign securities which are subject to interest rate, currency exchange rate, economic and political risks: this may be enhanced when investing in emerging markets. The securities of smaller, less well-known companies can be more volatile than those of larger companies. The return of principal in a bond fund is not guaranteed. Bond funds have the same issuer, interest rate, inflation and credit risks that are associated with underlying bonds owned by the fund. Lower rated bonds, convertible securities and other types of debt obligations involve greater risks than higher rated bonds. Mortgage securities and collateralized mortgage obligations (CMOs) are subject to prepayment risk and the risk of default on the underlying mortgages or other assets; derivatives may increase volatility. High yield securities can be volatile and subject to much higher instances of default.
FORWARD LOOKING STATEMENT DISCLOSURE
As mutual fund managers, one of our responsibilities is to communicate with shareholders in an open and direct manner. Insofar as some of our opinions and comments in our letters to shareholders are based on our current expectations, they are considered "forward-looking statements" which may or may not prove to be accurate over the long term. While we believe we have a reasonable basis for our comments and we have confidence in our opinions, actual results may differ materially from those we anticipate. You can identify forward-looking statements by words such as "believe," "expect," "may," "anticipate," and other similar expressions when discussing prospects for particular portfolio holdings and/or the markets, generally. We cannot, however, assure future results and disclaim any obligation to update or alter any forward-looking statements, whether as a result of new information, future events, or otherwise. Further, information provided in this report should not be construed as a recommendation to purchase or sell any particular security.
21
FPA NEW INCOME, INC.
HISTORICAL PERFORMANCE
(Unaudited)
Change in Value of a $10,000 Investment in FPA New Income, Inc. vs. Barclays U.S. Aggregate Index and Consumer Price Index + 100 Basis Points from October 1, 2010 to September 30, 2020
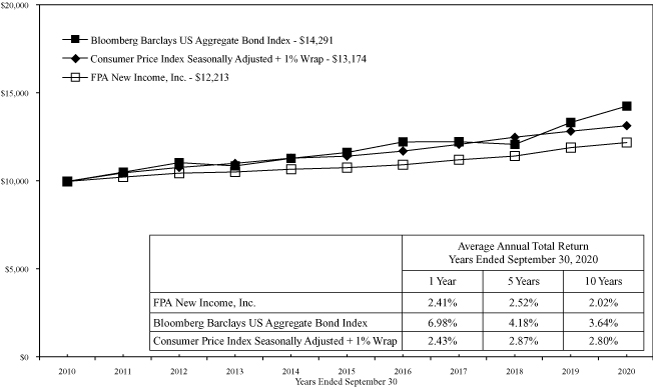
Past performance is not indicative of future performance. The Barclays U.S. Aggregate Bond Index a broad-based unmanaged composite of four major subindexes: U.S. Government Index; U.S. Credit Index; U.S. Mortgage-Backed Securities Index; and U.S. Asset-Backed Securities Index. The index holds investment quality bonds. The Consumer Price Index is an unmanaged index representing the rate of inflation of U.S. consumer prices as determined by the US Department of Labor Statistics. The performance of the Fund and of the Averages is computed on a total return basis which includes reinvestment of all distributions.
Past performance is no guarantee of future results, and current performance may be higher or lower than the performance shown. This data represents past performance, and investors should understand that investment returns and principal values fluctuate, so that when you redeem your investment it may be worth more or less than its original cost. Current month-end performance data can be obtained by visiting the website at www.fpa.com or by calling toll-free, 1-800-982-4372. Information regarding the Fund's expense ratio and redemption fees can be found on page 50.
The Prospectus details the Fund's objective and policies, charges, and other matters of interest to prospective investors. Please read the prospectus carefully before investing. The Prospectus may be obtained by visiting the website at www.fpa.com, by email at crm@fpa.com, toll-free by calling 1-800-982-4372 or by contacting the Fund in writing.
22
FPA NEW INCOME, INC.
PORTFOLIO SUMMARY
September 30, 2020
Common Stocks | | | | | | | 0.3 | % | |
Energy | | | 0.3 | % | | | | | |
Industrials | | | 0.0 | % | | | | | |
Bonds & Debentures | | | | | | | 103.3 | % | |
Asset-Backed Securities | | | 67.8 | % | | | | | |
U.S. Treasuries | | | 13.0 | % | | | | | |
Commercial Mortgage-Backed Securities | | | 10.3 | % | | | | | |
Residential Mortgage-Backed Securities | | | 8.5 | % | | | | | |
Corporate Bank Debt | | | 2.5 | % | | | | | |
Corporate Bonds & Notes | | | 1.2 | % | | | | | |
Short-term Investments | | | | | | | 1.0 | % | |
Other Assets And Liabilities, Net | | | | | | | (4.6 | )% | |
Net Assets | | | | | 100.0 | % | |
23
FPA NEW INCOME, INC.
PORTFOLIO OF INVESTMENTS
September 30, 2020
COMMON STOCKS | | Shares or
Principal
Amount | | Fair
Value | |
ENERGY — 0.3% | |
PHI Group, Inc.(a)(b)(c)(d) | | | 1,203,928 | | | $ | 8,728,478 | | |
PHI Group, Inc., Restricted(a)(b)(c)(d) | | | 2,602,492 | | | | 18,868,067 | | |
| | | $ | 27,596,545 | | |
INDUSTRIALS — 0.0% | |
Boart Longyear Ltd.(c) | | | 874,320 | | | $ | 244,230 | | |
| TOTAL COMMON STOCKS — 0.3% (Cost $31,764,951) | | $ | 27,840,775 | | |
BONDS & DEBENTURES | |
COMMERCIAL MORTGAGE-BACKED SECURITIES — 10.3% | |
AGENCY — 1.7% | |
Federal Home Loan Mortgage Corp. K042 A1 — 2.267% 6/25/2024 | | $ | 13,112,276 | | | $ | 13,554,249 | | |
Federal Home Loan Mortgage Corp. K024 A2 — 2.573% 9/25/2022 | | | 5,758,105 | | | | 5,956,013 | | |
Government National Mortgage Association 2020-110 MA —
2.500% 3/16/2037 | | | 45,804,155 | | | | 46,486,028 | | |
Government National Mortgage Association 2014-169 A —
2.600% 11/16/2042 | | | 2,398,902 | | | | 2,427,917 | | |
Government National Mortgage Association 2015-21 A —
2.600% 11/16/2042 | | | 1,837,453 | | | | 1,848,725 | | |
Government National Mortgage Association 2014-148 A —
2.650% 11/16/2043 | | | 9,961,527 | | | | 10,102,217 | | |
Government National Mortgage Association 2019-39 A —
3.100% 5/16/2059 | | | 64,395,724 | | | | 66,386,447 | | |
Government National Mortgage Association 2010-148 AC —
7.000% 12/16/2050(e) | | | 19,456 | | | | 19,826 | | |
| | | $ | 146,781,422 | | |
AGENCY STRIPPED — 2.0% | |
Government National Mortgage Association 2012-45 IO —
0.000% 4/16/2053(e) | | $ | 7,229,446 | | | $ | 19,719 | | |
Government National Mortgage Association 2012-125 IO —
0.263% 2/16/2053(e) | | | 60,938,479 | | | | 684,333 | | |
Government National Mortgage Association 2012-25 IO —
0.294% 8/16/2052(e) | | | 59,629,639 | | | | 558,569 | | |
Government National Mortgage Association 2013-45 IO —
0.463% 12/16/2053(e) | | | 56,084,936 | | | | 703,944 | | |
Government National Mortgage Association 2015-101 IO —
0.471% 3/16/2052(e) | | | 68,306,630 | | | | 1,891,896 | | |
24
FPA NEW INCOME, INC.
PORTFOLIO OF INVESTMENTS (Continued)
September 30, 2020
BONDS & DEBENTURES — Continued | | Principal
Amount | | Fair
Value | |
Government National Mortgage Association 2014-157 IO —
0.505% 5/16/2055(e) | | $ | 101,830,624 | | | $ | 2,693,053 | | |
Government National Mortgage Association 2012-58 IO —
0.526% 2/16/2053(e) | | | 124,689,983 | | | | 1,350,866 | | |
Government National Mortgage Association 2013-125 IO —
0.527% 10/16/2054(e) | | | 16,811,422 | | | | 339,611 | | |
Government National Mortgage Association 2015-41 IO —
0.537% 9/16/2056(e) | | | 27,150,576 | | | | 901,092 | | |
Government National Mortgage Association 2012-79 IO —
0.538% 3/16/2053(e) | | | 89,862,315 | | | | 1,392,444 | | |
Government National Mortgage Association 2014-153 IO —
0.547% 4/16/2056(e) | | | 106,234,174 | | | | 3,500,150 | | |
Government National Mortgage Association 2015-86 IO —
0.620% 5/16/2052(e) | | | 47,872,269 | | | | 1,648,745 | | |
Government National Mortgage Association 2014-110 IO —
0.628% 1/16/2057(e) | | | 52,934,218 | | | | 1,895,236 | | |
Government National Mortgage Association 2012-150 IO —
0.659% 11/16/2052(e) | | | 58,975,894 | | | | 1,307,885 | | |
Government National Mortgage Association 2014-77 IO —
0.688% 12/16/2047(e) | | | 37,938,186 | | | | 1,040,292 | | |
Government National Mortgage Association 2012-114 IO —
0.710% 1/16/2053(e) | | | 33,710,865 | | | | 771,119 | | |
Government National Mortgage Association 2014-135 IO —
0.710% 1/16/2056(e) | | | 202,557,882 | | | | 6,135,802 | | |
Government National Mortgage Association 2014-138 IO —
0.718% 4/16/2056(e) | | | 24,502,001 | | | | 918,965 | | |
Government National Mortgage Association 2015-19 IO —
0.718% 1/16/2057(e) | | | 69,658,162 | | | | 2,763,862 | | |
Government National Mortgage Association 2015-7 IO —
0.722% 1/16/2057(e) | | | 48,727,428 | | | | 1,996,017 | | |
Government National Mortgage Association 2014-175 IO —
0.724% 4/16/2056(e) | | | 161,327,363 | | | | 6,253,323 | | |
Government National Mortgage Association 2014-187 IO —
0.739% 5/16/2056(e) | | | 111,962,374 | | | | 4,332,127 | | |
Government National Mortgage Association 2014-164 IO —
0.743% 1/16/2056(e) | | | 207,788,699 | | | | 7,248,771 | | |
Government National Mortgage Association 2015-47 IO —
0.782% 10/16/2056(e) | | | 125,366,333 | | | | 5,208,908 | | |
Government National Mortgage Association 2015-108 IO —
0.791% 10/16/2056(e) | | | 23,938,316 | | | | 1,009,311 | | |
25
FPA NEW INCOME, INC.
PORTFOLIO OF INVESTMENTS (Continued)
September 30, 2020
BONDS & DEBENTURES — Continued | | Principal
Amount | | Fair
Value | |
Government National Mortgage Association 2015-114 IO —
0.795% 3/15/2057(e) | | $ | 114,219,534 | | | $ | 4,541,277 | | |
Government National Mortgage Association 2015-160 IO —
0.857% 1/16/2056(e) | | | 199,137,507 | | | | 8,787,440 | | |
Government National Mortgage Association 2015-128 IO —
0.871% 12/16/2056(e) | | | 161,535,335 | | | | 7,269,187 | | |
Government National Mortgage Association 2015-150 IO —
0.872% 9/16/2057(e) | | | 121,422,461 | | | | 5,514,377 | | |
Government National Mortgage Association 2015-169 IO —
0.893% 7/16/2057(e) | | | 167,157,085 | | | | 8,142,522 | | |
Government National Mortgage Association 2016-125 IO —
0.952% 12/16/2057(e) | | | 105,837,270 | | | | 5,994,422 | | |
Government National Mortgage Association 2016-106 IO —
1.000% 9/16/2058(e) | | | 211,271,619 | | | | 13,021,959 | | |
Government National Mortgage Association 2016-65 IO —
1.015% 1/16/2058(e) | | | 129,294,268 | | | | 7,503,968 | | |
Government National Mortgage Association 2020-42 IO —
1.056% 3/16/2062(e) | | | 210,824,513 | | | | 18,566,767 | | |
Government National Mortgage Association 2020-75, VRN —
1.165% 2/16/2062(e) | | | 182,998,095 | | | | 16,177,947 | | |
Government National Mortgage Association 2020-71, VRN —
1.206% 1/16/2062(e) | | | 92,049,978 | | | | 8,430,498 | | |
Government National Mortgage Association 2020-43, VRN —
1.357% 11/16/2061(e) | | | 75,409,480 | | | | 7,272,038 | | |
| | | $ | 167,788,442 | | |
NON-AGENCY — 6.6% | |
A10 Bridge Asset Financing LLC 2020-C A — 2.021% 8/15/2040(f) | | $ | 28,818,000 | | | $ | 28,818,784 | | |
Bear Stearns Commercial Mortgage Securities Trust 2005-PWR7 B —
5.214% 2/11/2041(e) | | | 2,033,452 | | | | 2,033,267 | | |
Citigroup Commercial Mortgage Trust 2012-GC8 AAB —
2.608% 9/10/2045 | | | 1,961,542 | | | | 1,987,200 | | |
Citigroup Commercial Mortgage Trust 2012-GC8 A4 —
3.024% 9/10/2045 | | | 4,148,778 | | | | 4,261,626 | | |
Citigroup Commercial Mortgage Trust 2017-C4 A2 —
3.190% 10/12/2050 | | | 18,524,000 | | | | 19,214,780 | | |
COMM Mortgage Trust 2014-FL5 B, 1M LIBOR + 2.150% —
1.548% 10/15/2031(e)(f) | | | 607,738 | | | | 573,737 | | |
COMM Mortgage Trust 2014-FL5 C, 1M LIBOR + 2.150% —
1.548% 10/15/2031(e)(f) | | | 8,340,000 | | | | 7,392,314 | | |
26
FPA NEW INCOME, INC.
PORTFOLIO OF INVESTMENTS (Continued)
September 30, 2020
BONDS & DEBENTURES — Continued | | Principal
Amount | | Fair
Value | |
COMM Mortgage Trust 2012-CR5 A3 — 2.540% 12/10/2045 | | $ | 11,090,000 | | | $ | 11,365,475 | | |
COMM Mortgage Trust 2013-LC6 A4 — 2.941% 1/10/2046 | | | 10,015,221 | | | | 10,395,263 | | |
COMM Mortgage Trust 2012-CR2 A4 — 3.147% 8/15/2045 | | | 15,941,000 | | | | 16,434,535 | | |
CoreVest American Finance Trust 2018-1 A — 3.804% 6/15/2051(f) | | | 30,882,045 | | | | 32,348,945 | | |
DBUBS Mortgage Trust 2011-LC2A A4 — 4.537% 7/10/2044(f) | | | 40,736,174 | | | | 41,314,631 | | |
GS Mortgage Securities Corp. Trust 2012-ALOH A —
3.551% 4/10/2034(f) | | | 21,003,000 | | | | 21,076,926 | | |
GS Mortgage Securities Trust 2012-GCJ7 A4 — 3.377% 5/10/2045 | | | 1,646,545 | | | | 1,663,993 | | |
GS Mortgage Securities Trust 2012-GC6 A3 — 3.482% 1/10/2045 | | | 23,215,325 | | | | 23,678,687 | | |
J.P. Morgan Chase Commercial Mortgage Securities Trust 2016-WIKI A —
2.798% 10/5/2031(f) | | | 22,137,000 | | | | 22,003,080 | | |
JP Morgan Chase Commercial Mortgage Securities Trust 2012-C8 A3 —
2.829% 10/15/2045 | | | 159,716 | | | | 164,510 | | |
JP Morgan Chase Commercial Mortgage Securities Trust C
2012-HSBC A — 3.093% 7/5/2032(f) | | | 46,713,286 | | | | 47,652,746 | | |
JPMBB Commercial Mortgage Securities Trust 2015-C30 ASB —
3.559% 7/15/2048 | | | 6,973,822 | | | | 7,386,110 | | |
Morgan Stanley Bank of America Merrill Lynch Trust 2012-C6 A4 —
2.858% 11/15/2045 | | | 4,025,945 | | | | 4,129,039 | | |
Morgan Stanley Capital I Trust 2011-C3 A4 — 4.118% 7/15/2049 | | | 4,186,592 | | | | 4,215,980 | | |
Morgan Stanley Capital I Trust P 2014-MP C, VRN —
3.816% 8/11/2033(e)(f) | | | 2,400,000 | | | | 2,443,050 | | |
UBS Commercial Mortgage Trust 2012-C1 A3 — 3.400% 5/10/2045 | | | 15,240,541 | | | | 15,622,908 | | |
UBS-Barclays Commercial Mortgage Trust 2012-C4 A4 —
2.792% 12/10/2045 | | | 20,486,000 | | | | 20,927,551 | | |
UBS-Barclays Commercial Mortgage Trust 2012-C3 A4 —
3.091% 8/10/2049 | | | 10,807,248 | | | | 11,185,598 | | |
VCC Trust 2020-MC1 A, VRN — 4.500% 6/25/2045(e)(f) | | | 15,471,332 | | | | 15,249,190 | | |
VNDO E Mortgage Trust 2012-6AVE A — 2.996% 11/15/2030(f) | | | 5,604,681 | | | | 5,748,845 | | |
VNDO E Mortgage Trust 2012-6AVE B — 3.298% 11/15/2030(f) | | | 13,266,000 | | | | 13,658,258 | | |
Wells Fargo Commercial Mortgage Trust 2019-C51 A1 —
2.276% 6/15/2052 | | | 9,489,318 | | | | 9,690,069 | | |
Wells Fargo Commercial Mortgage Trust 2012-LC5 A3 —
2.918% 10/15/2045 | | | 36,898,092 | | | | 38,087,185 | | |
WFRBS Commercial Mortgage Trust 2012-C8 AFL, 1M USD
LIBOR + 1.000%, FRN — 1.151% 8/15/2045(e)(f) | | | 802,730 | | | | 803,803 | | |
WFRBS Commercial Mortgage Trust 2012-C9 A3 — 2.870% 11/15/2045 | | | 12,538,749 | | | | 12,939,822 | | |
WFRBS Commercial Mortgage Trust 2012-C8 A3 — 3.001% 8/15/2045 | | | 64,706,000 | | | | 66,246,210 | | |
WFRBS Commercial Mortgage Trust 2013-C11 A4 — 3.037% 3/15/2045 | | | 12,250,000 | | | | 12,668,165 | | |
WFRBS Commercial Mortgage Trust 2013-C11 A5 — 3.071% 3/15/2045 | | | 7,610,000 | | | | 7,903,996 | | |
27
FPA NEW INCOME, INC.
PORTFOLIO OF INVESTMENTS (Continued)
September 30, 2020
BONDS & DEBENTURES — Continued | | Principal
Amount | | Fair
Value | |
WFRBS Commercial Mortgage Trust 2013-UBS1 A3 —
3.591% 3/15/2046 | | $ | 30,588,000 | | | $ | 30,703,234 | | |
| | | $ | 571,989,512 | | |
TOTAL COMMERICAL MORTGAGE-BACKED SECURITIES
(Cost $927,802,885) | | $ | 886,559,376 | | |
RESIDENTIAL MORTGAGE-BACKED SECURITIES — 8.5% | |
AGENCY COLLATERALIZED MORTGAGE OBLIGATION — 1.3% | |
Federal Home Loan Mortgage Corp. 4170 QE — 2.000% 5/15/2032 | | $ | 1,705,715 | | | $ | 1,743,921 | | |
Federal Home Loan Mortgage Corp. 3979 HD — 2.500% 12/15/2026 | | | 1,606,215 | | | | 1,646,996 | | |
Federal Home Loan Mortgage Corp. 4304 DA — 2.500% 1/15/2027 | | | 617,087 | | | | 634,247 | | |
Federal Home Loan Mortgage Corp. 4010 DE — 2.500% 2/15/2027 | | | 1,904,329 | | | | 1,950,772 | | |
Federal Home Loan Mortgage Corp. 3914 MA — 3.000% 6/15/2026 | | | 1,313,453 | | | | 1,367,918 | | |
Federal Home Loan Mortgage Corp. 4297 CA — 3.000% 12/15/2030 | | | 2,072,092 | | | | 2,115,309 | | |
Federal Home Loan Mortgage Corp. 4664 TA — 3.000% 9/15/2037 | | | 945,266 | | | | 946,155 | | |
Federal Home Loan Mortgage Corp. 4504 DN — 3.000% 10/15/2040 | | | 5,779,998 | | | | 5,849,192 | | |
Federal Home Loan Mortgage Corp. 3862 MB — 3.500% 5/15/2026 | | | 10,955,341 | | | | 11,453,110 | | |
Federal Home Loan Mortgage Corp. 3828 VE — 4.500% 1/15/2024 | | | 700,473 | | | | 741,349 | | |
Federal Home Loan Mortgage Corp. 4387 VA — 3.000% 2/15/2026 | | | 396,426 | | | | 409,665 | | |
Federal Home Loan Mortgage Corp. 4395 NT — 4.500% 7/15/2026 | | | 5,020,522 | | | | 5,318,142 | | |
Federal National Mortgage Association 2014-21 ED —
2.250% 4/25/2029 | | | 404,049 | | | | 412,785 | | |
Federal National Mortgage Association 2013-135 KM —
2.500% 3/25/2028 | | | 938,559 | | | | 960,502 | | |
Federal National Mortgage Association 2017-30 G —
3.000% 7/25/2040 | | | 5,596,786 | | | | 5,714,894 | | |
Federal National Mortgage Association 2013-93 PJ —
3.000% 7/25/2042 | | | 1,368,705 | | | | 1,426,412 | | |
Federal National Mortgage Association 2017-16 JA —
3.000% 2/25/2043 | | | 10,173,747 | | | | 10,292,120 | | |
Federal National Mortgage Association 2018-16 HA —
3.000% 7/25/2043 | | | 13,387,942 | | | | 13,686,896 | | |
Federal National Mortgage Association 2011-98 VE —
3.500% 6/25/2026 | | | 5,780,304 | | | | 5,791,654 | | |
Federal National Mortgage Association 2011-80 KB —
3.500% 8/25/2026 | | | 8,631,232 | | | | 9,001,616 | | |
Federal National Mortgage Association 2012-144 PD —
3.500% 4/25/2042 | | | 2,746,817 | | | | 2,919,322 | | |
28
FPA NEW INCOME, INC.
PORTFOLIO OF INVESTMENTS (Continued)
September 30, 2020
BONDS & DEBENTURES — Continued | | Principal
Amount | | Fair
Value | |
Federal National Mortgage Association 2017-45 KD —
3.500% 2/25/2044 | | $ | 7,047,295 | | | $ | 7,164,702 | | |
Federal National Mortgage Association 2017-52 KC —
3.500% 4/25/2044 | | | 5,436,280 | | | | 5,502,395 | | |
Federal National Mortgage Association 2017-59 DC —
3.500% 5/25/2044 | | | 10,193,393 | | | | 10,339,428 | | |
Federal National Mortgage Association 2012-40 GC —
4.500% 12/25/2040 | | | 274,087 | | | | 275,376 | | |
Federal National Mortgage Association 2010-43 MK —
5.500% 5/25/2040 | | | 1,156,020 | | | | 1,279,676 | | |
| | | $ | 108,944,554 | | |
AGENCY POOL ADJUSTABLE RATE — 0.0% | |
Federal National Mortgage Association 865963,
12M USD LIBOR + 1.755% — 3.836% 3/1/2036(e) | | $ | 383,039 | | | $ | 403,287 | | |
AGENCY POOL FIXED RATE — 0.2% | |
Federal Home Loan Mortgage Corp. G15169 — 4.500% 9/1/2026 | | $ | 979,561 | | | $ | 1,038,414 | | |
Federal Home Loan Mortgage Corp. G15272 — 4.500% 9/1/2026 | | | 351,739 | | | | 367,251 | | |
Federal Home Loan Mortgage Corp. G15875 — 4.500% 9/1/2026 | | | 1,371,745 | | | | 1,444,243 | | |
Federal Home Loan Mortgage Corp. G15036 — 5.000% 6/1/2024 | | | 139,990 | | | | 143,872 | | |
Federal Home Loan Mortgage Corp. G13667 — 5.000% 8/1/2024 | | | 25,057 | | | | 25,624 | | |
Federal Home Loan Mortgage Corp. G15173 — 5.000% 6/1/2026 | | | 214,477 | | | | 221,184 | | |
Federal Home Loan Mortgage Corp. G15407 — 5.000% 6/1/2026 | | | 1,037,572 | | | | 1,079,842 | | |
Federal Home Loan Mortgage Corp. J01270 — 5.500% 2/1/2021 | | | 2,012 | | | | 2,022 | | |
Federal Home Loan Mortgage Corp. G15230 — 5.500% 12/1/2024 | | | 557,825 | | | | 577,661 | | |
Federal Home Loan Mortgage Corp. G15458 — 5.500% 12/1/2024 | | | 149,836 | | | | 155,283 | | |
Federal Home Loan Mortgage Corp. G14460 — 6.000% 1/1/2024 | | | 46,621 | | | | 48,120 | | |
Federal National Mortgage Association FM1102 — 4.000% 3/1/2031 | | | 6,717,977 | | | | 7,129,330 | | |
Federal National Mortgage Association AL4056 — 5.000% 6/1/2026 | | | 617,989 | | | | 637,196 | | |
Federal National Mortgage Association AL5867 — 5.500% 8/1/2023 | | | 44,983 | | | | 46,188 | | |
Federal National Mortgage Association AL0471 — 5.500% 7/1/2025 | | | 41,371 | | | | 43,371 | | |
Federal National Mortgage Association AL4433 — 5.500% 9/1/2025 | | | 201,397 | | | | 207,480 | | |
Federal National Mortgage Association AL4901 — 5.500% 9/1/2025 | | | 149,716 | | | | 154,893 | | |
Federal National Mortgage Association AD0951 — 6.000% 12/1/2021 | | | 52,838 | | | | 53,511 | | |
Federal National Mortgage Association AL0294 — 6.000% 10/1/2022 | | | 14,379 | | | | 14,793 | | |
Federal National Mortgage Association 890225 — 6.000% 5/1/2023 | | | 122,336 | | | | 126,222 | | |
Government National Mortgage Association 782281 —
6.000% 3/15/2023 | | | 266,957 | | | | 276,946 | | |
| | | $ | 13,793,446 | | |
29
FPA NEW INCOME, INC.
PORTFOLIO OF INVESTMENTS (Continued)
September 30, 2020
BONDS & DEBENTURES — Continued | | Principal
Amount | | Fair
Value | |
AGENCY STRIPPED — 1.0% | |
Federal Home Loan Mortgage Corp. 217 PO — 0.000% 1/1/2032(g) | | $ | 135,281 | | | $ | 123,693 | | |
Federal Home Loan Mortgage Corp. 3763 NI — 3.500% 5/15/2025 | | | 460,550 | | | | 9,489 | | |
Federal Home Loan Mortgage Corp. 3917 AI — 4.500% 7/15/2026 | | | 4,531,136 | | | | 198,410 | | |
Federal Home Loan Mortgage Corp. 217 IO — 6.500% 1/1/2032 | | | 130,261 | | | | 28,271 | | |
Federal National Mortgage Association 2010-25 NI —
5.000% 3/25/2025 | | | 1,528 | | | | 37 | | |
Federal National Mortgage Association 2003-64 XI —
5.000% 7/25/2033 | | | 365,580 | | | | 58,658 | | |
Resolution Funding Corp. — 0.000% 10/15/2020(g) | | | 89,328,000 | | | | 89,321,479 | | |
| | | $ | 89,740,037 | | |
NON-AGENCY — 0.3% | |
PRPM 2020-3 LLC — 2.857% 9/25/2025(a)(f)(h) | | $ | 30,252,000 | | | $ | 30,251,492 | | |
NON-AGENCY COLLATERALIZED MORTGAGE OBLIGATION — 5.7% | |
Bravo Residential Funding Trust 2019-1 A1C — 3.500% 3/25/2058(f) | | $ | 24,528,129 | | | $ | 25,205,434 | | |
CIM Trust 2017-7 A, VRN — 3.000% 4/25/2057(e)(f) | | | 16,807,939 | | | | 17,285,284 | | |
CIM Trust 2018-R3 A1, VRN — 5.000% 12/25/2057(e)(f) | | | 43,389,793 | | | | 45,855,609 | | |
Citigroup Mortgage Loan Trust, Inc. 2014-A A —
4.000% 1/25/2035(e)(f) | | | 5,223,609 | | | | 5,447,208 | | |
Finance of America HECM Buyout 2020-HB2 A, VRN —
1.710% 7/25/2030(e)(f) | | | 56,151,222 | | | | 56,254,754 | | |
Finance of America HECM Buyout 2020-HB1 M1, VRN —
2.105% 2/25/2030(e)(f) | | | 10,431,000 | | | | 10,497,414 | | |
Finance of America HECM Buyout 2019-AB1 A —
2.656% 12/27/2049(f) | | | 16,733,836 | | | | 16,727,328 | | |
Mill City Mortgage Loan Trust 2018-2 A1, VRN —
3.500% 5/25/2058(e)(f) | | | 29,583,573 | | | | 30,807,617 | | |
Nationstar HECM Loan Trust 2020-1A A1, VRN —
1.269% 9/25/2030(a)(e)(f) | | | 35,838,000 | | | | 35,838,000 | | |
Nationstar HECM Loan Trust 2020-1A M1, VRN —
1.472% 9/25/2030(a)(e)(f) | | | 9,981,000 | | | | 9,981,000 | | |
Nationstar HECM Loan Trust 2020-1A M2, VRN —
1.972% 9/25/2030(a)(e)(f) | | | 8,928,000 | | | | 8,928,000 | | |
Nationstar HECM Loan Trust 2019-2A M1, VRN —
2.359% 11/26/2029(a)(e)(f) | | | 7,922,000 | | | | 7,904,413 | | |
Nationstar HECM Loan Trust 2019-1A M1, VRN —
2.664% 6/25/2029(e)(f) | | | 10,270,000 | | | | 10,328,350 | | |
Nomura Resecuritization Trust 2016-1R 3A1 — 5.000% 9/28/2036(e)(f) | | | 2,485,561 | | | | 2,531,438 | | |
30
FPA NEW INCOME, INC.
PORTFOLIO OF INVESTMENTS (Continued)
September 30, 2020
BONDS & DEBENTURES — Continued | | Principal
Amount | | Fair
Value | |
RCO V Mortgage LLC 2020-1 A1 — 3.105% 9/25/2025(f)(h) | | $ | 15,136,000 | | | $ | 15,095,019 | | |
Towd Point Mortgage Trust 2016-3 A1 — 2.250% 4/25/2056(e)(f) | | | 8,182,858 | | | | 8,264,028 | | |
Towd Point Mortgage Trust 2015-1 AES — 3.000% 10/25/2053(e)(f) | | | 491,141 | | | | 491,366 | | |
Towd Point Mortgage Trust 2018-1 A1, VRN — 3.000% 1/25/2058(e)(f) | | | 23,451,158 | | | | 24,335,898 | | |
Towd Point Mortgage Trust 2018-2 A1, VRN — 3.250% 3/25/2058(e)(f) | | | 55,975,755 | | | | 59,498,556 | | |
Towd Point Mortgage Trust 2018-5 A1A, VRN —
3.250% 7/25/2058(e)(f) | | | 39,533,962 | | | | 41,326,179 | | |
Towd Point Mortgage Trust 2015-2 1A1 — 3.250% 11/25/2060(e)(f) | | | 8,091,216 | | | | 8,167,497 | | |
Towd Point Mortgage Trust 2015-4 A1 — 3.500% 4/25/2055(e)(f) | | | 7,467,018 | | | | 7,528,130 | | |
Towd Point Mortgage Trust 2015-2 2A1 — 3.750% 11/25/2057(e)(f) | | | 3,168,801 | | | | 3,187,604 | | |
Towd Point Mortgage Trust 2018-6 A1A, VRN —
3.750% 3/25/2058(e)(f) | | | 39,300,699 | | | | 41,536,300 | | |
| | | $ | 493,022,426 | | |
TOTAL RESIDENTIAL MORTGAGE-BACKED SECURITIES
(Cost $721,390,568) | | $ | 736,155,242 | | |
ASSET-BACKED SECURITIES — 67.8% | |
AUTO — 22.1% | |
Ally Auto Receivables Trust 2019-3 A3 — 1.930% 5/15/2024 | | $ | 70,270,000 | | | $ | 71,618,896 | | |
Ally Auto Receivables Trust 2017-3 A4 — 2.010% 3/15/2022 | | | 1,470,502 | | | | 1,474,868 | | |
Ally Auto Receivables Trust 2017-1 B — 2.350% 3/15/2022 | | | 3,758,000 | | | | 3,758,376 | | |
Ally Auto Receivables Trust 2017-1 C — 2.480% 5/16/2022 | | | 7,059,000 | | | | 7,059,706 | | |
American Credit Acceptance Receivables Trust 2020-3 A —
0.620% 10/13/2023(f) | | | 12,930,734 | | | | 12,930,864 | | |
American Credit Acceptance Receivables Trust 2020-3 B —
1.150% 8/13/2024(f) | | | 10,301,000 | | | | 10,432,642 | | |
AmeriCredit Automobile Receivables Trust 2017-4 A3 —
2.040% 7/18/2022 | | | 953,729 | | | | 954,469 | | |
AmeriCredit Automobile Receivables Trust 2017-1 C —
2.710% 8/18/2022 | | | 6,836,971 | | | | 6,888,640 | | |
ARI Fleet Lease Trust 2018-B A2 — 3.220% 8/16/2027(f) | | | 2,008,798 | | | | 2,030,701 | | |
BMW Vehicle Lease Trust 2018-1 A3 — 3.260% 7/20/2021 | | | 2,477,210 | | | | 2,489,062 | | |
BMW Vehicle Owner Trust 2019-A A3 — 1.920% 1/25/2024 | | | 32,758,000 | | | | 33,354,182 | | |
CarMax Auto Owner Trust 2020-2 A1 — 1.252% 5/17/2021 | | | 3,790,853 | | | | 3,792,393 | | |
CarMax Auto Owner Trust 2017-4 A3 — 2.110% 10/17/2022 | | | 3,175,088 | | | | 3,193,732 | | |
CarMax Auto Owner Trust 2019-3 A3 — 2.180% 8/15/2024 | | | 48,284,000 | | | | 49,602,013 | | |
CarMax Auto Owner Trust 2018-1 A3 — 2.480% 11/15/2022 | | | 9,806,831 | | | | 9,895,877 | | |
CarMax Auto Owner Trust 2018-2 A3 — 2.980% 1/17/2023 | | | 15,246,640 | | | | 15,465,883 | | |
31
FPA NEW INCOME, INC.
PORTFOLIO OF INVESTMENTS (Continued)
September 30, 2020
BONDS & DEBENTURES — Continued | | Principal
Amount | | Fair
Value | |
CarMax Auto Owner Trust 2018-2 A4 — 3.160% 7/17/2023 | | $ | 6,059,000 | | | $ | 6,292,280 | | |
CarMax Auto Owner Trust 2019-1 A4 — 3.260% 8/15/2024 | | | 24,353,000 | | | | 25,804,035 | | |
CarMax Auto Owner Trust 2019-1 B — 3.450% 11/15/2024 | | | 13,090,000 | | | | 13,786,070 | | |
CarMax Auto Owner Trust 2018-4 A4 — 3.480% 2/15/2024 | | | 22,031,000 | | | | 23,231,084 | | |
Credit Acceptance Auto Loan Trust 2017-3A A — 2.650% 6/15/2026(f) | | | 281,635 | | | | 281,707 | | |
Credit Acceptance Auto Loan Trust 2017-3A B — 3.210% 8/17/2026(f) | | | 36,562,000 | | | | 36,571,481 | | |
Drive Auto Receivables Trust 2020-2 A3 — 0.830% 5/15/2024 | | | 8,250,000 | | | | 8,272,873 | | |
DT Auto Owner Trust 2020-3A B — 0.910% 12/16/2024(f) | | | 11,570,000 | | | | 11,562,762 | | |
DT Auto Owner Trust 2020-2A A — 1.140% 1/16/2024(f) | | | 8,214,053 | | | | 8,217,593 | | |
DT Auto Owner Trust 2020-3A C — 1.470% 6/15/2026(f) | | | 6,384,000 | | | | 6,401,946 | | |
DT Auto Owner Trust 2020-2A B — 2.080% 3/16/2026(f) | | | 3,939,000 | | | | 4,023,463 | | |
Exeter Automobile Receivables Trust 2020-3A B — 0.790% 9/16/2024 | | | 16,529,000 | | | | 16,512,312 | | |
Exeter Automobile Receivables Trust 2020-2A A — 1.130% 8/15/2023(f) | | | 9,679,995 | | | | 9,707,842 | | |
Exeter Automobile Receivables Trust 2020-3A C — 1.320% 7/15/2025 | | | 5,903,000 | | | | 5,915,101 | | |
Exeter Automobile Receivables Trust 2020-2A B — 2.080% 7/15/2024(f) | | | 10,545,000 | | | | 10,693,755 | | |
First Investors Auto Owner Trust 2017-1A C — 2.950% 4/17/2023(f) | | | 7,944,407 | | | | 7,992,669 | | |
Flagship Credit Auto Trust 2020-3 A — 0.700% 4/15/2025(f) | | | 16,227,253 | | | | 16,260,040 | | |
Ford Credit Auto Lease Trust 2020-B A2A — 0.500% 12/15/2022 | | | 20,000,000 | | | | 20,002,494 | | |
Ford Credit Auto Lease Trust 2020-B A3 — 0.620% 8/15/2023 | | | 32,703,000 | | | | 32,842,737 | | |
Ford Credit Auto Lease Trust 2020-B C — 1.700% 2/15/2025 | | | 12,523,000 | | | | 12,516,363 | | |
Ford Credit Auto Lease Trust 2020-A A4 — 1.880% 5/15/2023 | | | 16,674,000 | | | | 17,059,658 | | |
Ford Credit Auto Lease Trust 2019-B B — 2.360% 1/15/2023 | | | 32,914,000 | | | | 32,933,683 | | |
Ford Credit Auto Owner Trust 2020-B A2 — 0.500% 2/15/2023 | | | 36,400,000 | | | | 36,451,666 | | |
Ford Credit Auto Owner Trust 2020-A A2 — 1.030% 10/15/2022 | | | 3,747,787 | | | | 3,760,272 | | |
Ford Credit Auto Owner Trust 2019-C A3 — 1.870% 3/15/2024 | | | 30,639,000 | | | | 31,334,009 | | |
GM Financial Automobile Leasing Trust 2020-2 A2A —
0.710% 10/20/2022 | | | 5,750,000 | | | | 5,766,466 | | |
GM Financial Automobile Leasing Trust 2020-1 B —
1.840% 12/20/2023 | | | 13,417,000 | | | | 13,548,763 | | |
GM Financial Automobile Leasing Trust 2019-3 A4 —
2.030% 7/20/2023 | | | 5,929,000 | | | | 6,032,074 | | |
GM Financial Automobile Leasing Trust 2019-3 B —
2.160% 7/20/2023 | | | 21,492,000 | | | | 21,699,572 | | |
GM Financial Automobile Leasing Trust 2019-2 B —
2.890% 3/20/2023 | | | 12,206,000 | | | | 12,436,985 | | |
GM Financial Automobile Leasing Trust 2019-1 B —
3.370% 12/20/2022 | | | 43,632,000 | | | | 44,545,008 | | |
Honda Auto Receivables Owner Trust 2020-2 A2 —
0.740% 11/15/2022 | | | 10,197,000 | | | | 10,224,406 | | |
32
FPA NEW INCOME, INC.
PORTFOLIO OF INVESTMENTS (Continued)
September 30, 2020
BONDS & DEBENTURES — Continued | | Principal
Amount | | Fair
Value | |
Honda Auto Receivables Owner Trust 2020-1 A3 —
1.610% 4/22/2024 | | $ | 51,001,000 | | | $ | 52,200,268 | | |
Honda Auto Receivables Owner Trust 2019-3 A3 — 1.780% 8/15/2023 | | | 33,626,000 | | | | 34,228,763 | | |
Honda Auto Receivables Owner Trust 2019-4 A3 — 1.830% 1/18/2024 | | | 32,441,000 | | | | 33,177,450 | | |
Honda Auto Receivables Owner Trust 2019-2 A4 — 2.540% 3/21/2025 | | | 21,573,000 | | | | 22,517,041 | | |
Honda Auto Receivables Owner Trust 2018-1 A4 — 2.780% 5/15/2024 | | | 37,617,000 | | | | 38,381,385 | | |
Honda Auto Receivables Owner Trust 2019-1 A4 — 2.900% 6/18/2024 | | | 14,962,000 | | | | 15,585,142 | | |
Hyundai Auto Lease Securitization Trust 2020-A A4 —
2.000% 12/15/2023(f) | | | 8,740,000 | | | | 8,963,529 | | |
Hyundai Auto Lease Securitization Trust 2019-B A4 —
2.030% 6/15/2023(f) | | | 10,870,000 | | | | 11,092,160 | | |
Hyundai Auto Lease Securitization Trust 2020-A B —
2.120% 5/15/2024(f) | | | 7,377,000 | | | | 7,577,741 | | |
Hyundai Auto Lease Securitization Trust 2019-B B —
2.130% 11/15/2023(f) | | | 41,387,000 | | | | 41,228,765 | | |
Hyundai Auto Lease Securitization Trust 2018-A A4 —
2.890% 3/15/2022(f) | | | 6,932,576 | | | | 6,938,398 | | |
Hyundai Auto Lease Securitization Trust 2019-A A2 —
2.920% 7/15/2021(f) | | | 993,120 | | | | 994,026 | | |
Hyundai Auto Lease Securitization Trust 2019-A B —
3.250% 10/16/2023(f) | | | 12,636,000 | | | | 12,755,564 | | |
Hyundai Auto Receivables Trust 2020-A A1 — 1.198% 5/17/2021 | | | 3,182,403 | | | | 3,184,523 | | |
Hyundai Auto Receivables Trust 2019-A A4 — 2.710% 5/15/2025 | | | 22,000,000 | | | | 22,954,589 | | |
Hyundai Auto Receivables Trust 2018-A A4 — 2.940% 6/17/2024 | | | 27,125,000 | | | | 27,789,565 | | |
Mercedes-Benz Auto Lease Trust 2020-A A2 — 1.820% 3/15/2022 | | | 569,614 | | | | 572,136 | | |
Mercedes-Benz Auto Lease Trust 2020-A A3 — 1.840% 12/15/2022 | | | 1,865,000 | | | | 1,894,233 | | |
Mercedes-Benz Auto Lease Trust 2020-A A4 — 1.880% 9/15/2025 | | | 21,440,000 | | | | 21,894,127 | | |
Mercedes-Benz Auto Lease Trust 2019-B A4 — 2.050% 8/15/2025 | | | 20,719,000 | | | | 21,163,342 | | |
Mercedes-Benz Auto Receivables Trust 2019-1 A3 —
1.940% 3/15/2024 | | | 48,937,000 | | | | 50,019,736 | | |
Mercedes-Benz Auto Receivables Trust 2018-1 A4 —
3.150% 10/15/2024 | | | 32,591,000 | | | | 34,035,707 | | |
Nissan Auto Lease Trust 2020-A A3 — 1.840% 1/17/2023 | | | 2,311,000 | | | | 2,350,577 | | |
Nissan Auto Lease Trust 2020-A A4 — 1.880% 4/15/2025 | | | 25,925,000 | | | | 26,429,469 | | |
Nissan Auto Lease Trust 2019-B A4 — 2.290% 4/15/2025 | | | 21,027,000 | | | | 21,457,866 | | |
Nissan Auto Lease Trust 2019-A A2 — 2.710% 7/15/2021 | | | 656,994 | | | | 657,951 | | |
Nissan Auto Receivables Owner Trust 2020-A A1 — 0.978% 4/15/2021 | | | 1,698,601 | | | | 1,699,023 | | |
Nissan Auto Receivables Owner Trust 2019-C A3 — 1.930% 7/15/2024 | | | 35,456,000 | | | | 36,322,140 | | |
Nissan Auto Receivables Owner Trust 2019-B A3 — 2.500% 11/15/2023 | | | 710,000 | | | | 727,570 | | |
Nissan Auto Receivables Owner Trust 2018-A A3 — 2.650% 5/16/2022 | | | 10,711,777 | | | | 10,781,164 | | |
33
FPA NEW INCOME, INC.
PORTFOLIO OF INVESTMENTS (Continued)
September 30, 2020
BONDS & DEBENTURES — Continued | | Principal
Amount | | Fair
Value | |
Nissan Auto Receivables Owner Trust 2019-A A3 — 2.900% 10/16/2023 | | $ | 5,864,000 | | | $ | 6,002,861 | | |
Nissan Auto Receivables Owner Trust 2018-B A4 — 3.160% 12/16/2024 | | | 27,408,000 | | | | 28,029,827 | | |
Prestige Auto Receivables Trust 2019-1A B — 2.530% 1/16/2024(f) | | | 17,546,000 | | | | 17,804,696 | | |
Prestige Auto Receivables Trust 2017-1A C — 2.810% 1/17/2023(f) | | | 28,857,790 | | | | 28,787,213 | | |
Santander Consumer Auto Receivables Trust 2020-AA A — 1.
370% 10/15/2024(f) | | | 6,673,528 | | | | 6,736,777 | | |
Santander Drive Auto Receivables Trust 2020-2 A3 — 0.670% 4/15/2024 | | | 8,404,000 | | | | 8,428,822 | | |
Santander Drive Auto Receivables Trust 2020-3 B — 0.690% 3/17/2025 | | | 27,048,000 | | | | 27,040,805 | | |
Santander Drive Auto Receivables Trust 2020-2 B — 0.960% 11/15/2024 | | | 7,802,000 | | | | 7,815,515 | | |
Toyota Auto Receivables Owner Trust 2020-B A1 — 1.141% 5/17/2021 | | | 2,746,921 | | | | 2,747,716 | | |
Toyota Auto Receivables Owner Trust 2020-A A3 — 1.660% 5/15/2024 | | | 55,845,000 | | | | 57,056,652 | | |
Toyota Auto Receivables Owner Trust 2019-C A3 — 1.910% 9/15/2023 | | | 37,055,000 | | | | 37,753,635 | | |
Toyota Auto Receivables Owner Trust 2019-D A3 — 1.920% 1/16/2024 | | | 34,225,000 | | | | 35,029,681 | | |
Volkswagen Auto Lease Trust 2019-A A4 — 2.020% 8/20/2024 | | | 16,152,000 | | | | 16,476,689 | | |
Volkswagen Auto Loan Enhanced Trust 2020-1 A2A —
0.930% 12/20/2022 | | | 11,760,000 | | | | 11,803,053 | | |
Volkswagen Auto Loan Enhanced Trust 2018-1 A4 — 3.150% 7/22/2024 | | | 8,455,000 | | | | 8,724,462 | | |
Westlake Automobile Receivables Trust 2020-2A B —
1.320% 7/15/2025(f) | | | 12,743,000 | | | | 12,884,105 | | |
Westlake Automobile Receivables Trust 2020-1A B —
1.940% 4/15/2025(f) | | | 62,080,000 | | | | 62,340,513 | | |
Westlake Automobile Receivables Trust 2018-1A C —
2.920% 5/15/2023(f) | | | 259,425 | | | | 259,451 | | |
World Omni Auto Receivables Trust 2020-B A2A — 0.550% 7/17/2023 | | | 23,500,000 | | | | 23,514,187 | | |
World Omni Auto Receivables Trust 2019-C A3 — 1.960% 12/16/2024 | | | 40,212,000 | | | | 41,102,909 | | |
World Omni Auto Receivables Trust 2018-A A3 — 2.500% 4/17/2023 | | | 17,401,717 | | | | 17,615,630 | | |
World Omni Auto Receivables Trust 2018-A B — 2.890% 4/15/2025 | | | 4,865,000 | | | | 4,912,859 | | |
World Omni Auto Receivables Trust 2018-B A4 — 3.030% 6/17/2024 | | | 1,982,000 | | | | 2,061,705 | | |
World Omni Auto Receivables Trust 2019-A A3 — 3.040% 5/15/2024 | | | 30,746,000 | | | | 31,480,580 | | |
World Omni Auto Receivables Trust 2019-A B — 3.340% 6/16/2025 | | | 10,560,000 | | | | 11,172,262 | | |
World Omni Automobile Lease Securitization Trust 2020-A A3 —
1.700% 1/17/2023 | | | 41,597,000 | | | | 42,450,749 | | |
World Omni Automobile Lease Securitization Trust 2019-B A4 —
2.070% 2/18/2025 | | | 21,951,000 | | | | 22,014,981 | | |
World Omni Automobile Lease Securitization Trust 2019-B B —
2.130% 2/18/2025 | | | 12,293,000 | | | | 12,122,191 | | |
World Omni Automobile Lease Securitization Trust 2018-B B —
3.430% 3/15/2024 | | | 11,060,000 | | | | 11,257,062 | | |
| | | $ | 1,912,625,011 | | |
34
FPA NEW INCOME, INC.
PORTFOLIO OF INVESTMENTS (Continued)
September 30, 2020
BONDS & DEBENTURES — Continued | | Principal
Amount | | Fair
Value | |
COLLATERALIZED LOAN OBLIGATION — 18.1% | |
Adams Mill CLO Ltd. 2014-1A B2R — 3.350% 7/15/2026(f) | | $ | 8,136,000 | | | $ | 8,140,174 | | |
AGL CLO 7 Ltd. 2020-7A A1, 3M USD LIBOR + 1.800%, FRN —
2.050% 7/15/2031(e)(f) | | | 65,825,000 | | | | 65,975,871 | | |
AGL Core CLO 8 Ltd. 2020-8A A1, 3M USD LIBOR + 1.500%, FRN —
1.000% 10/20/2031(e)(f) | | | 73,646,000 | | | | 73,646,000 | | |
AIMCO CLO Series 2015-AA AR, 3M USD LIBOR + 0.850%, FRN —
1.125% 1/15/2028(e)(f) | | | 35,167,195 | | | | 34,946,204 | | |
Anchorage Capital CLO 16 Ltd. 2020-16A A,
3M USD LIBOR + 1.400%, FRN — 1.000% 10/20/2031(e)(f) | | | 53,792,000 | | | | 53,792,000 | | |
B&M CLO Ltd. 2014-1A A2R, 3M USD LIBOR + 1.600% —
1.871% 4/16/2026(e)(f) | | | 12,409,000 | | | | 12,350,318 | | |
Barings CLO Ltd. 2018-III 2018-3A A1,
3M USD LIBOR + 0.950%, FRN — 1.222% 7/20/2029(e)(f) | | | 29,662,000 | | | | 29,466,735 | | |
Battalion CLO 18 Ltd. 2020-18A A1,
3M USD LIBOR + 1.800%, FRN — 1.000% 10/15/2032(e)(f) | | | 33,271,000 | | | | 33,357,638 | | |
Black Diamond CLO Ltd. 2014-1A A1R, 3M USD LIBOR +
1.150% — 1.423% 10/17/2026(e)(f) | | | 1,248,793 | | | | 1,248,526 | | |
California Street CLO XII Ltd. 2013-12A B2RA,
3M USD LIBOR + 1.400%, FRN — 1.000% 10/15/2025(e)(f) | | | 29,250,000 | | | | 29,250,000 | | |
California Street CLO XII Ltd. 2013-12A B2RB —
1.629% 10/15/2025(f) | | | 10,750,000 | | | | 10,750,000 | | |
California Street CLO XII Ltd. 2013-12A B2R —
3.389% 10/15/2025(f) | | | 15,800,000 | | | | 15,809,069 | | |
Cerberus Corporate Credit Solutions Fund,
3M USD LIBOR + 1.530% — 1.805% 10/15/2030(e)(f) | | | 13,879,000 | | | | 13,374,137 | | |
Cerberus Loan Funding XVIII LP 2017-1A A,
3M USD LIBOR + 1.750% — 2.025% 4/15/2027(e)(f) | | | 23,102,691 | | | | 23,056,716 | | |
Cerberus Loan Funding XXI LP 2017-4A A,
3M USD LIBOR + 1.450% — 1.725% 10/15/2027(e)(f) | | | 29,142,279 | | | | 28,966,464 | | |
Cerberus Loan Funding XXVIII LP 2020-1A A,
3M USD LIBOR + 1.850%, FRN — 1.000% 10/15/2031(e)(f) | | | 70,979,000 | | | | 70,979,000 | | |
CVP CLO Ltd. 2017-1A A, 3M USD LIBOR + 1.340%, FRN —
1.612% 7/20/2030(e)(f) | | | 24,473,000 | | | | 24,246,209 | | |
Elm Trust 2020-3A A2 — 2.954% 8/20/2029(f) | | | 11,435,000 | | | | 11,496,330 | | |
Elm Trust 2018-2A A2 — 4.605% 10/20/2027(f) | | | 22,693,000 | | | | 22,685,225 | | |
Fortress Credit Opportunities, 3M USD LIBOR + 2.250% —
2.518% 7/15/2028(e)(f) | | | 62,423,000 | | | | 62,441,540 | | |
Fortress Credit Opportunities IX CLO Ltd. 2017-9A A1T,
3M USD LIBOR + 1.550% — 1.830% 11/15/2029(e)(f) | | | 64,117,000 | | | | 63,700,624 | | |
35
FPA NEW INCOME, INC.
PORTFOLIO OF INVESTMENTS (Continued)
September 30, 2020
BONDS & DEBENTURES — Continued | | Principal
Amount | | Fair
Value | |
Fortress Credit Opportunities IX CLO Ltd. 2017-9A AFR2 —
2.530% 11/15/2029(a)(f) | | $ | 8,159,000 | | | $ | 8,171,238 | | |
Fortress Credit Opportunities IX CLO Ltd. 2017-9A E,
3M USD LIBOR + 7.250% — 7.530% 11/15/2029(e)(f) | | | 12,772,000 | | | | 10,803,643 | | |
Fortress Credit Opportunities VII CLO Ltd. 2016-7I E,
3M USD LIBOR + 7.490% — 7.740% 12/15/2028(e) | | | 20,977,000 | | | | 18,357,413 | | |
Golub Capital BDC CLO 4 LLC 2020-1A A1,
3M USD LIBOR + 2.350%, FRN — 2.554% 11/5/2032(e)(f) | | | 64,944,000 | | | | 64,942,441 | | |
Golub Capital Partners CLO Ltd. 2020-49A A1,
3M USD LIBOR + 2.500% — 2.779% 7/20/2032(e)(f) | | | 28,251,000 | | | | 28,249,559 | | |
Halcyon Loan Advisors Funding Ltd. 2015-3A A1R,
3M USD LIBOR + 0.900% — 1.172% 10/18/2027(e)(f) | | | 29,218,496 | | | | 28,994,244 | | |
Halcyon Loan Advisors Funding Ltd. 2015-1A AR,
3M USD LIBOR + 0.920% — 1.192% 4/20/2027(e)(f) | | | 23,464,071 | | | | 23,331,663 | | |
Halcyon Loan Advisors Funding Ltd. 2014-3A AR,
3M USD LIBOR + 1.100% — 1.358% 10/22/2025(e)(f) | | | 3,609,672 | | | | 3,599,811 | | |
Hercules Capital Funding Trust 2018-1A A — 4.605% 11/22/2027(f) | | | 21,762,000 | | | | 21,953,965 | | |
Hercules Capital Funding Trust 2019-1A A — 4.703% 2/20/2028(f) | | | 47,606,000 | | | | 48,031,398 | | |
Ivy Hill Middle Market Credit Fund VII Ltd. 7A AR,
3M USD LIBOR + 1.530% — 1.802% 10/20/2029(e)(f) | | | 7,430,000 | | | | 7,255,804 | | |
Ivy Hill Middle Market Credit Fund X Ltd. 10A A1AR,
3M USD LIBOR + 1.250% — 1.522% 7/18/2030(e)(f) | | | 26,085,000 | | | | 25,161,174 | | |
Nassau Ltd. 2017-IA A1AS, 3M USD LIBOR + 1.150%, FRN —
1.425% 10/15/2029(e)(f) | | | 24,398,000 | | | | 24,084,632 | | |
Ocean Trails CLO IX 2020-9A A1, 3M USD LIBOR + 1.870%, FRN —
2.153% 10/15/2029(e)(f) | | | 4,750,000 | | | | 4,738,804 | | |
Ocean Trails CLO X 2020-10A A1, 3M USD LIBOR + 1.550%, FRN —
1.000% 10/15/2031(e)(f) | | | 54,186,000 | | | | 54,185,946 | | |
Saranac CLO III Ltd. 2014-3A ALR, 3M USD LIBOR + 1.100% —
1.906% 6/22/2030(e)(f) | | | 25,908,457 | | | | 25,798,554 | | |
Silvermore CLO Ltd. 2014-1A A1R, 3M USD LIBOR + 1.170% —
1.450% 5/15/2026(e)(f) | | | 8,121,171 | | | | 8,091,375 | | |
Sound Point CLO XVII Ltd. 2017-3A A1A,
3M USD LIBOR + 1.220%, FRN — 1.492% 10/20/2030(e)(f) | | | 2,685,000 | | | | 2,642,574 | | |
Sound Point CLO XVII Ltd. 2017-3A A1B,
3M USD LIBOR + 1.220%, FRN — 1.492% 10/20/2030(e)(f) | | | 3,435,000 | | | | 3,380,724 | | |
Stratus CLO Ltd. 2020-2A A, 3M USD LIBOR + 1.300%, FRN —
1.568% 10/15/2028(e)(f) | | | 43,805,000 | | | | 43,711,432 | | |
Telos CLO Ltd. 2014-5A A1R, 3M USD LIBOR + 0.950% —
1.223% 4/17/2028(e)(f) | | | 30,065,081 | | | | 29,790,917 | | |
36
FPA NEW INCOME, INC.
PORTFOLIO OF INVESTMENTS (Continued)
September 30, 2020
BONDS & DEBENTURES — Continued | | Principal
Amount | | Fair
Value | |
Telos CLO Ltd. 2013-3A AR, 3M USD LIBOR + 1.300% —
1.573% 7/17/2026(e)(f) | | $ | 10,401,435 | | | $ | 10,373,330 | | |
Telos CLO Ltd. 2013-3A BR, 3M USD LIBOR + 2.000% —
2.273% 7/17/2026(e)(f) | | | 20,894,000 | | | | 20,786,375 | | |
THL Credit Wind River CLO Ltd. 2016-1A AR,
3M USD LIBOR + 1.050% — 1.325% 7/15/2028(e)(f) | | | 27,873,000 | | | | 27,705,316 | | |
TICP CLO III-2 Ltd. 2018-3R A, 3M USD LIBOR + 0.840%, FRN —
1.112% 4/20/2028(e)(f) | | | 7,656,538 | | | | 7,591,978 | | |
VCO CLO LLC 2018-1A A, 3M USD LIBOR + 1.500% —
1.772% 7/20/2030(e)(f) | | | 26,138,047 | | | | 25,741,873 | | |
Venture XX CLO Ltd. 2015-20A AR, 3M USD LIBOR + 0.820%, FRN —
1.095% 4/15/2027(e)(f) | | | 20,378,747 | | | | 20,241,231 | | |
Venture XXV CLO Ltd. 2016-25A AR, 3M USD LIBOR + 1.230% —
1.502% 4/20/2029(e)(f) | | | 35,216,000 | | | | 35,022,171 | | |
Vericrest Opportunity Loan Transferee LLC 2014-NPL4 A1 —
3.967% 4/25/2050(f)(h) | | | 9,694,310 | | | | 9,766,954 | | |
Wellfleet CLO Ltd. 2016-1A AR, 3M USD LIBOR + 0.910% —
1.182% 4/20/2028(e)(f) | | | 25,128,355 | | | | 24,879,208 | | |
West CLO Ltd. 2014-2A A1BR — 2.724% 1/16/2027(f) | | | 2,799,909 | | | | 2,800,900 | | |
Whitebox CLO II Ltd. 2020-2A A1, 3M USD LIBOR + 1.750%, FRN —
1.992% 10/24/2031(e)(f) | | | 61,457,000 | | | | 61,490,187 | | |
Woodmont Trust, 3M USD LIBOR + 2.000% —
1.000% 10/18/2032(a)(e)(f) | | | 82,754,000 | | | | 82,754,000 | | |
Zais CLO 14 Ltd. 2020-14A A1A, 3M USD LIBOR + 1.400%, FRN —
2.380% 4/15/2032(e)(f) | | | 52,951,000 | | | | 52,643,831 | | |
Zais CLO 2 Ltd. 2014-2A A1BR — 2.920% 7/25/2026(f) | | | 503,777 | | | | 503,933 | | |
Zais CLO 7 LLC 2017-2A A, 3M USD LIBOR + 1.290%, FRN —
1.565% 4/15/2030(e)(f) | | | 15,426,307 | | | | 15,179,749 | | |
| | $ | 1,572,437,127 | | |
CREDIT CARD — 4.9% | |
American Express Credit Account Master Trust 2017-6 B —
2.200% 5/15/2023 | | $ | 39,998,000 | | | $ | 40,012,159 | | |
American Express Credit Account Master Trust 2019-2 A —
2.670% 11/15/2024 | | | 16,863,000 | | | | 17,499,273 | | |
American Express Credit Account Master Trust 2019-1 A —
2.870% 10/15/2024 | | | 79,915,000 | | | | 83,007,591 | | |
American Express Credit Account Master Trust 2018-8 A —
3.180% 4/15/2024 | | | 35,343,000 | | | | 36,330,833 | | |
Barclays Dryrock Issuance Trust 2019-1 A — 1.960% 5/15/2025 | | | 57,546,000 | | | | 59,143,155 | | |
37
FPA NEW INCOME, INC.
PORTFOLIO OF INVESTMENTS (Continued)
September 30, 2020
BONDS & DEBENTURES — Continued | | Principal
Amount | | Fair
Value | |
Capital One Multi-Asset Execution Trust 2019-A2 A2 —
1.720% 8/15/2024 | | $ | 2,495,000 | | | $ | 2,563,111 | | |
Discover Card Execution Note Trust 2019-A1 A1 — 3.040% 7/15/2024 | | | 8,877,000 | | | | 9,197,010 | | |
Golden Credit Card Trust 2018-1A A — 2.620% 1/15/2023(f) | | | 32,022,000 | | | | 32,243,201 | | |
Synchrony Card Funding LLC 2019-A2 A — 2.340% 6/15/2025 | | | 64,171,000 | | | | 66,207,601 | | |
Synchrony Card Funding LLC 2019-A1 A — 2.950% 3/15/2025 | | | 19,862,000 | | | | 20,538,921 | | |
Synchrony Card Issuance Trust 2018-A1 A1 — 3.380% 9/15/2024 | | | 57,741,000 | | | | 59,420,980 | | |
| | | $ | 426,163,835 | | |
EQUIPMENT — 14.7% | |
ARI Fleet Lease Trust 2019-A A2A — 2.410% 11/15/2027(f) | | $ | 17,169,048 | | | $ | 17,393,622 | | |
ARI Fleet Lease Trust 2018-A A3 — 2.840% 10/15/2026(f) | | | 13,974,000 | | | | 14,210,629 | | |
ARI Fleet Lease Trust 2018-B A3 — 3.430% 8/16/2027(f) | | | 3,824,000 | | | | 3,957,066 | | |
Ascentium Equipment Receivables 2019-2A A3 — 2.190% 11/10/2026(f) | | | 50,532,000 | | | | 51,407,805 | | |
Ascentium Equipment Receivables Trust 2017-2A A3 —
2.310% 12/10/2021(f) | | | 5,020,032 | | | | 5,052,672 | | |
Avis Budget Rental Car Funding AESOP LLC 2015-2A A —
2.630% 12/20/2021(f) | | | 11,333,000 | | | | 11,359,566 | | |
Avis Budget Rental Car Funding AESOP LLC 2017-2A A —
2.970% 3/20/2024(f) | | | 8,580,000 | | | | 8,853,040 | | |
Avis Budget Rental Car Funding AESOP LLC 2019-1A A —
3.450% 3/20/2023(f) | | | 13,010,000 | | | | 13,313,046 | | |
CCG Receivables Trust 2020-1 A2 — 0.540% 12/14/2027(f) | | | 19,746,000 | | | | 19,746,559 | | |
CCG Receivables Trust 2018-1 A2 — 2.500% 6/16/2025(f) | | | 1,820,493 | | | | 1,824,871 | | |
Chesapeake Funding II LLC 2019-2A A1 — 1.950% 9/15/2031(f) | | | 36,467,360 | | | | 36,977,976 | | |
Chesapeake Funding II LLC 2017-4A A1 — 2.120% 11/15/2029(f) | | | 7,044,608 | | | | 7,096,003 | | |
Chesapeake Funding II LLC 2018-1A A1 — 3.040% 4/15/2030(f) | | | 471,114 | | | | 481,417 | | |
Chesapeake Funding II LLC 2018-2A A1 — 3.230% 8/15/2030(f) | | | 1,342,216 | | | | 1,361,671 | | |
Coinstar Funding LLC Series 2017-1A A2 — 5.216% 4/25/2047(f) | | | 12,409,155 | | | | 11,623,440 | | |
Daimler Trucks Retail Trust 2020-1 A3 — 1.220% 9/15/2023 | | | 3,000,000 | | | | 3,032,862 | | |
Daimler Trucks Retail Trust 2019-1 A4 — 2.790% 5/15/2025(f) | | | 23,397,000 | | | | 23,528,723 | | |
Dell Equipment Finance Trust 2019-2 A3 — 1.910% 10/22/2024(f) | | | 17,299,000 | | | | 17,502,187 | | |
Dell Equipment Finance Trust 2019-2 A2 — 1.950% 12/22/2021(f) | | | 1,438,386 | | | | 1,446,932 | | |
Dell Equipment Finance Trust 2020-1 A1 — 1.983% 5/21/2021(f) | | | 13,844,944 | | | | 13,890,733 | | |
Dell Equipment Finance Trust 2019-2 B — 2.060% 10/22/2024(f) | | | 21,992,000 | | | | 22,034,106 | | |
Dell Equipment Finance Trust 2020-1 A2 — 2.260% 6/22/2022(f) | | | 3,000,000 | | | | 3,048,994 | | |
Dell Equipment Finance Trust 2019-1 A2 — 2.780% 8/23/2021(f) | | | 658,177 | | | | 660,504 | | |
Dell Equipment Finance Trust 2019-1 A3 — 2.830% 3/22/2024(f) | | | 400,000 | | | | 407,751 | | |
Dell Equipment Finance Trust 2019-1 B — 2.940% 3/22/2024(f) | | | 27,810,000 | | | | 28,407,000 | | |
Dell Equipment Finance Trust 2018-1 A3 — 3.180% 6/22/2023(f) | | | 1,691,350 | | | | 1,701,000 | | |
38
FPA NEW INCOME, INC.
PORTFOLIO OF INVESTMENTS (Continued)
September 30, 2020
BONDS & DEBENTURES — Continued | | Principal
Amount | | Fair
Value | |
Dell Equipment Finance Trust 2018-2 A3 — 3.370% 10/22/2023(f) | | $ | 1,678,214 | | | $ | 1,694,151 | | |
Enterprise Fleet Financing LLC 2020-1 A2 — 1.780% 12/22/2025(f) | | | 33,551,000 | | | | 34,060,932 | | |
Enterprise Fleet Financing LLC 2019-3 A2 — 2.060% 5/20/2025(f) | | | 780,483 | | | | 794,142 | | |
Enterprise Fleet Financing LLC 2017-3 A2 — 2.130% 5/22/2023(f) | | | 644,481 | | | | 645,079 | | |
Enterprise Fleet Financing LLC 2017-2 A3 — 2.220% 1/20/2023(f) | | | 16,500,154 | | | | 16,501,804 | | |
Enterprise Fleet Financing LLC 2019-2 A2 — 2.290% 2/20/2025(f) | | | 38,190,392 | | | | 38,870,521 | | |
Enterprise Fleet Financing LLC 2019-1 A2 — 2.980% 10/20/2024(f) | | | 2,240,906 | | | | 2,277,570 | | |
GreatAmerica Leasing Receivables Funding LLC 2019-1 A4 —
3.210% 2/18/2025(f) | | | 10,720,000 | | | | 11,056,278 | | |
GreatAmerica Leasing Receivables Funding LLC Series 2020-1 A2 —
1.760% 6/15/2022(f) | | | 1,530,000 | | | | 1,539,761 | | |
GreatAmerica Leasing Receivables Funding LLC Series 2020-1 A3 —
1.760% 8/15/2023(f) | | | 19,348,000 | | | | 19,519,752 | | |
GreatAmerica Leasing Receivables Funding LLC Series 2017-1 A4 —
2.360% 1/20/2023(f) | | | 1,865,866 | | | | 1,869,508 | | |
GreatAmerica Leasing Receivables Funding LLC Series 2018-1 A4 —
2.830% 6/17/2024(f) | | | 8,631,000 | | | | 8,784,925 | | |
GreatAmerica Leasing Receivables Funding LLC Series 2017-1 C —
2.890% 1/22/2024(f) | | | 2,609,000 | | | | 2,620,967 | | |
GreatAmerica Leasing Receivables Funding LLC Series 2018-1 B —
2.990% 6/17/2024(f) | | | 920,000 | | | | 919,802 | | |
Hertz Fleet Lease Funding LP 2018-1 A2 — 3.230% 5/10/2032(f) | | | 8,006,493 | | | | 8,043,766 | | |
HPEFS Equipment Trust 2020-2A A2 — 0.650% 7/22/2030(f) | | | 61,830,000 | | | | 61,855,474 | | |
HPEFS Equipment Trust 2020-2A B — 1.200% 7/22/2030(f) | | | 11,900,000 | | | | 11,906,350 | | |
HPEFS Equipment Trust 2020-1A A1 — 1.683% 3/9/2021(f) | | | 519,961 | | | | 520,433 | | |
HPEFS Equipment Trust 2020-1A B — 1.890% 2/20/2030(f) | | | 13,617,000 | | | | 13,817,056 | | |
HPEFS Equipment Trust 2019-1A A2 — 2.190% 9/20/2029(f) | | | 7,595,725 | | | | 7,639,290 | | |
HPEFS Equipment Trust 2019-1A B — 2.320% 9/20/2029(f) | | | 6,292,000 | | | | 6,253,387 | | |
John Deere Owner Trust 2019-B A3 — 2.210% 12/15/2023 | | | 15,542,000 | | | | 15,909,466 | | |
John Deere Owner Trust 2019-A A3 — 2.910% 7/17/2023 | | | 880,000 | | | | 899,675 | | |
John Deere Owner Trust 2018-A A4 — 2.910% 1/15/2025 | | | 24,496,000 | | | | 24,936,269 | | |
John Deere Owner Trust 2019 A A4 — 3.000% 1/15/2026 | | | 13,310,000 | | | | 13,929,187 | | |
John Deere Owner Trust 2018-B A4 — 3.230% 6/16/2025 | | | 26,991,000 | | | | 27,986,938 | | |
Kubota Credit Owner Trust 2020-1A A1 — 1.500% 5/17/2021(f) | | | 2,543,518 | | | | 2,543,935 | | |
Kubota Credit Owner Trust 2018-1A A3 — 3.100% 8/15/2022(f) | | | 27,067,624 | | | | 27,431,045 | | |
Kubota Credit Owner Trust 2018-1A A4 — 3.210% 1/15/2025(f) | | | 12,034,000 | | | | 12,441,969 | | |
MMAF Equipment Finance LLC 2017-B A4 — 2.410% 11/15/2024(f) | | | 16,545,000 | | | | 16,925,623 | | |
MMAF Equipment Finance LLC 2020-A A2 — 0.740% 4/9/2024(f) | | | 7,150,000 | | | | 7,171,640 | | |
MMAF Equipment Finance LLC 2017-B A3 — 2.210% 10/17/2022(f) | | | 7,342,703 | | | | 7,398,060 | | |
MMAF Equipment Finance LLC 2019 A A3 — 2.840% 11/13/2023(f) | | | 23,174,000 | | | | 23,875,971 | | |
39
FPA NEW INCOME, INC.
PORTFOLIO OF INVESTMENTS (Continued)
September 30, 2020
BONDS & DEBENTURES — Continued | | Principal
Amount | | Fair
Value | |
NextGear Floorplan Master Owner Trust 2019-2A A2 —
2.070% 10/15/2024(f) | | $ | 29,251,000 | | | $ | 28,946,257 | | |
NextGear Floorplan Master Owner Trust 2017-2A B —
3.020% 10/17/2022(f) | | | 20,252,000 | | | | 20,254,025 | | |
NextGear Floorplan Master Owner Trust 2019-1A A2 —
3.210% 2/15/2024(f) | | | 15,798,000 | | | | 16,368,344 | | |
NextGear Floorplan Master Owner Trust 2018-1A A2 —
3.220% 2/15/2023(f) | | | 12,191,000 | | | | 12,306,361 | | |
NextGear Floorplan Master Owner Trust 2018-2A A2 —
3.690% 10/15/2023(f) | | | 21,126,000 | | | | 21,667,426 | | |
Prop Series 2017-1A — 5.300% 3/15/2042(a) | | | 20,247,597 | | | | 15,995,601 | | |
Verizon Owner Trust 2019 A A1A — 2.930% 9/20/2023 | | | 47,492,000 | | | | 48,662,982 | | |
Verizon Owner Trust 2019 A B — 3.020% 9/20/2023 | | | 18,870,000 | | | | 19,441,514 | | |
Verizon Owner Trust 2019-C A1A — 1.940% 4/22/2024 | | | 79,492,000 | | | | 81,353,512 | | |
Verizon Owner Trust 2017-3A A1A — 2.060% 4/20/2022(f) | | | 2,110,655 | | | | 2,114,114 | | |
Verizon Owner Trust 2019-C B — 2.060% 4/22/2024 | | | 42,152,000 | | | | 42,891,182 | | |
Verizon Owner Trust 2017-3A B — 2.380% 4/20/2022(f) | | | 19,491,000 | | | | 19,590,145 | | |
Verizon Owner Trust 2019-B B — 2.400% 12/20/2023 | | | 42,076,000 | | | | 43,253,833 | | |
Verizon Owner Trust 2018-1A B — 3.050% 9/20/2022(f) | | | 24,278,000 | | | | 24,717,570 | | |
Verizon Owner Trust 2018-A A1A — 3.230% 4/20/2023 | | | 5,183,000 | | | | 5,264,693 | | |
Verizon Owner Trust 2018-A B — 3.380% 4/20/2023 | | | 26,414,000 | | | | 27,312,691 | | |
Volvo Financial Equipment LLC Series 2019-2A A3 —
2.040% 11/15/2023(f) | | | 2,720,000 | | | | 2,773,383 | | |
Volvo Financial Equipment LLC Series 2017-1A A4 —
2.210% 11/15/2021(f) | | | 2,859,874 | | | | 2,868,170 | | |
Volvo Financial Equipment LLC Series 2018-1A A3 —
2.540% 2/15/2022(f) | | | 13,913,101 | | | | 13,984,007 | | |
Volvo Financial Equipment LLC Series 2019-1A A4 —
3.130% 11/15/2023(f) | | | 17,060,000 | | | | 17,722,102 | | |
Wheels SPV 2 LLC 2019-1A A3 — 2.350% 5/22/2028(f) | | | 32,817,000 | | | | 33,768,283 | | |
Wheels SPV 2 LLC 2018-1A A3 — 3.240% 4/20/2027(f) | | | 12,759,000 | | | | 13,019,083 | | |
| | | $ | 1,267,236,179 | | |
OTHER — 8.0% | |
CBAM Ltd. 2017-3A A, 3M USD LIBOR + 1.230%, FRN —
1.503% 10/17/2029(e)(f) | | $ | 49,072,000 | | | $ | 48,830,418 | | |
Laurel Road Prime Student Loan Trust 2020-A A1FX —
0.720% 11/25/2050(f) | | | 8,950,000 | | | | 8,950,890 | | |
LCM XX LP 20A AR, 3M USD LIBOR + 1.040%, FRN —
1.312% 10/20/2027(e)(f) | | | 7,850,000 | | | | 7,773,455 | | |
40
FPA NEW INCOME, INC.
PORTFOLIO OF INVESTMENTS (Continued)
September 30, 2020
BONDS & DEBENTURES — Continued | | Principal
Amount | | Fair
Value | |
Magnetite XVI Ltd. 2015-16A AR, 3M USD LIBOR + 0.800%, FRN —
1.072% 1/18/2028(e)(f) | | $ | 10,488,493 | | | $ | 10,406,505 | | |
Navistar Financial Dealer Note Master Trust 2020-1 A,
1M USD LIBOR + 0.950%, FRN — 1.098% 7/25/2025(e)(f) | | | 62,562,000 | | | | 62,776,425 | | |
New Residential Mortgage LLC 2018-FNT1 A — 3.610% 5/25/2023(f) | | | 19,433,362 | | | | 19,438,376 | | |
New Residential Mortgage LLC 2018-FNT2 A — 3.790% 7/25/2054(f) | | | 23,732,786 | | | | 23,741,439 | | |
NRZ Excess Spread-Collateralized Notes Series 2018-PLS1 A —
3.193% 1/25/2023(f) | | | 8,739,872 | | | | 8,739,659 | | |
NRZ Excess Spread-Collateralized Notes Series 2018-PLS2 A —
3.265% 2/25/2023(f) | | | 10,101,215 | | | | 10,101,519 | | |
Octagon Investment Partners 35 Ltd. 2018-1A A1A, FRN —
1.332% 1/20/2031(e)(f) | | | 44,563,000 | | | | 43,950,660 | | |
Ocwen Master Advance Receivables Trust 2020-T1 AT1 —
1.278% 8/15/2052(f) | | | 69,290,000 | | | | 69,544,280 | | |
Palmer Square Loan Funding Ltd. 2018-4A A1,
3M USD LIBOR + 0.900%, FRN — 1.180% 11/15/2026(e)(f) | | | 2,998,589 | | | | 2,985,881 | | |
Parliament Funding II Ltd. 2020-1A A,
3M USD LIBOR + 2.450%, FRN — 2.764% 8/12/2030(e)(f) | | | 35,532,000 | | | | 35,549,517 | | |
PFS Financing Corp. 2020-F A — 0.930% 8/15/2024(f) | | | 15,785,000 | | | | 15,813,208 | | |
PFS Financing Corp. 2020-B A — 1.210% 6/15/2024(f) | | | 21,014,000 | | | | 21,231,844 | | |
PFS Financing Corp. 2020-F B — 1.420% 8/15/2024(f) | | | 4,352,000 | | | | 4,341,515 | | |
PFS Financing Corp. 2020-B B — 1.710% 6/15/2024(f) | | | 5,831,000 | | | | 5,919,920 | | |
PFS Financing Corp. 2017-D A — 2.400% 10/17/2022(f) | | | 16,852,000 | | | | 16,867,622 | | |
PFS Financing Corp. 2017-D B — 2.740% 10/17/2022(f) | | | 7,798,000 | | | | 7,801,764 | | |
PFS Financing Corp. 2019-A A2 — 2.860% 4/15/2024(f) | | | 20,397,000 | | | | 20,921,898 | | |
PFS Financing Corp. 2018-B A — 2.890% 2/15/2023(f) | | | 28,944,000 | | | | 29,215,087 | | |
PFS Financing Corp. 2018-B B — 3.080% 2/15/2023(f) | | | 7,809,000 | | | | 7,864,241 | | |
PFS Financing Corp. 2019-A B — 3.130% 4/15/2024(f) | | | 4,897,000 | | | | 5,004,457 | | |
PFS Financing Corp. 2018-D A — 3.190% 4/17/2023(f) | | | 66,056,000 | | | | 67,044,554 | | |
PFS Financing Corp. 2018-D B — 3.450% 4/17/2023(f) | | | 17,375,000 | | | | 17,623,205 | | |
PFS Financing Corp. 2018-F A — 3.520% 10/15/2023(f) | | | 35,679,000 | | | | 36,769,215 | | |
PFS Financing Corp. 2018-F B — 3.770% 10/15/2023(f) | | | 5,641,000 | | | | 5,780,040 | | |
SpringCastle America Funding LLC 2020-AA A —
1.970% 9/25/2037(f) | | | 40,640,000 | | | | 41,075,819 | | |
TVEST 2020A LLC 2020-A A — 4.500% 7/15/2032(f) | | | 16,688,713 | | | | 16,699,576 | | |
VCAT LLC 2020-NPL1 A1 — 3.671% 8/25/2050(f)(h) | | | 17,291,826 | | | | 17,290,082 | | |
| | | $ | 690,053,071 | | |
| TOTAL ASSET-BACKED SECURITIES (Cost $5,821,508,313) | | $ | 5,868,515,223 | | |
41
FPA NEW INCOME, INC.
PORTFOLIO OF INVESTMENTS (Continued)
September 30, 2020
BONDS & DEBENTURES — Continued | | Principal
Amount | | Fair
Value | |
CORPORATE BONDS & NOTES — 1.2% | |
BASIC MATERIALS — 0.7% | |
PT Boart Longyear Management Pty Ltd. PIK, 10.00%
Cash or 12.00% PIK — 10.000% 12/31/2022 | | $ | 71,635,618 | | | $ | 57,308,494 | | |
CONSUMER, CYCLICAL — 0.0% | |
Continental Airlines 2000-1 Class B Pass Through Trust —
8.388% 5/1/2022 | | $ | 2,523 | | | $ | 2,619 | | |
CONSUMER, NON-CYCLICAL — 0.5% | |
StoneMor Partners LP / Cornerstone Family Services of West Virginia
Subsidiary PIK — 11.500% 6/30/2024 | | $ | 46,851,306 | | | $ | 46,265,665 | | |
| TOTAL CORPORATE BONDS & NOTES (Cost $117,141,807) | | $ | 103,576,778 | | |
CORPORATE BANK DEBT — 2.5% | |
ABG Intermediate Holding 2 LLC, 3M USD LIBOR + 3.500% —
4.500% 9/27/2024(b)(e) | | $ | 8,149,099 | | | $ | 7,965,745 | | |
Asurion LLC, 1M USD LIBOR + 3.000% —
3.146% 11/3/2024 11/3/2024(b)(e) | | | 10,689,000 | | | | 10,501,943 | | |
Boart Longyear Management Pty Ltd. TL, 10.00% Cash or 11.00%
PIK — 11.000% 10/23/2020(b) | | | 5,312,806 | | | | 5,160,381 | | |
Cincinnati Bell, Inc., 1M USD LIBOR + 3.250% —
4.250% 10/2/2024(b)(e) | | | 12,030,338 | | | | 12,017,466 | | |
Frontier Communications Corp., 1M USD LIBOR + 2.000% —
5.250% 2/27/2024(b)(e)(i) | | | 15,806,789 | | | | 11,386,197 | | |
General Nutrition Centers, Inc., 1M USD LIBOR + 9.000% —
10.000% 12/23/2020(b)(e) | | | 40,877,000 | | | | 39,855,075 | | |
JC Penney Corp., Inc., 3M USD LIBOR + 4.250% —
5.250% 6/23/2023(b)(e) | | | 27,218,577 | | | | 8,369,712 | | |
JC Penney Corp., Inc., 1M USD LIBOR + 11.750% —
13.000% 11/16/2020(b)(e)(f) | | | 5,204,024 | | | | 6,609,111 | | |
Logix Holding Co. LLC, 1M USD LIBOR + 5.750% —
6.750% 12/22/2024(b)(e) | | | 13,946,573 | | | | 12,830,847 | | |
MB2LTL, 3M USD LIBOR + 9.250% — 10.250% 6/2/2023(a)(b)(e) | | | 6,816,000 | | | | 6,771,287 | | |
McDermott Super Senior Exit Lc — 4.750% 6/30/2024(a)(b)(d)(i) | | | 16,770,000 | | | | (1,341,600 | ) | |
Mediaco Holding, Inc. Class A, 1M USD LIBOR + 7.500% —
8.400% 11/25/2024(a)(b)(d)(e) | | | 12,190,000 | | | | 10,880,002 | | |
OTGTL, 3M USD LIBOR + 8.500% — 10.000% 8/26/2021(a)(b)(e) | | | 25,509,068 | | | | 22,824,493 | | |
42
FPA NEW INCOME, INC.
PORTFOLIO OF INVESTMENTS (Continued)
September 30, 2020
BONDS & DEBENTURES — Continued | | Principal
Amount | | Fair
Value | |
Polyconcept North America Holdings, Inc., 3M USD LIBOR + 4.500% —
5.500% 8/16/2023(b)(e) | | $ | 24,488,236 | | | $ | 19,957,913 | | |
Tech Data Corp. ABL Term LOAN, 1M USD LIBOR + 3.500% —
3.645% 6/30/2025(b)(e) | | | 8,611,000 | | | | 8,628,911 | | |
Windstream Services LLC, 1M USD LIBOR —
1.000% 9/21/2027(b)(e) | | | 13,474,000 | | | | 12,968,725 | | |
ZW1L, 2M USD LIBOR + 5.000% — 6.000% 11/16/2022(a)(b)(e) | | | 14,508,375 | | | | 14,398,111 | | |
ZW2L, 3M USD LIBOR + 9.000% — 10.000% 11/16/2023(a)(b)(e) | | | 3,274,418 | | | | 3,235,813 | | |
| TOTAL CORPORATE BANK DEBT (Cost $239,985,632) | | $ | 213,020,132 | | |
U.S. TREASURIES — 13.0% | |
U.S. Treasury Bills — 0.082% 10/13/2020(g) | | $ | 56,741,000 | | | $ | 56,739,610 | | |
U.S. Treasury Bills — 0.077% 10/20/2020(g) | | | 253,782,000 | | | | 253,769,768 | | |
U.S. Treasury Bills — 0.075% 10/27/2020(g) | | | 272,566,000 | | | | 272,551,200 | | |
U.S. Treasury Bills — 0.096% 11/3/2020(g) | | | 139,843,000 | | | | 139,831,183 | | |
U.S. Treasury Notes — 0.250% 9/30/2025 | | | 400,000,000 | | | | 399,469,640 | | |
| TOTAL U.S. TREASURIES (Cost $1,122,862,330) | | $ | 1,122,361,401 | | |
| TOTAL BONDS & DEBENTURES — 103.3% (Cost $8,950,691,535) | | $ | 8,930,188,152 | | |
TOTAL INVESTMENT SECURITIES — 103.6%
(Cost $8,982,456,486) | | $ | 8,958,028,927 | | |
SHORT-TERM INVESTMENTS — 1.0% | |
State Street Bank Repurchase Agreement — 0.00% 10/1/2020
(Dated 09/30/2020, repurchase price of $89,255,000, collateralized by
$91,020,000 principal amount U.S. Treasury Notes — 0.125% 2022,
fair value $91,040,177) | | $ | 89,255,000 | | | $ | 89,255,000 | | |
| TOTAL SHORT-TERM INVESTMENTS (Cost $89,255,000) | | $ | 89,255,000 | | |
| TOTAL INVESTMENTS — 104.6% (Cost $9,071,711,486) | | $ | 9,047,283,927 | | |
Other Assets and Liabilities, net — (4.6)% | | | | | (400,375,308 | ) | |
NET ASSETS — 100.0% | | $ | 8,646,908,619 | | |
43
FPA NEW INCOME, INC.
PORTFOLIO OF INVESTMENTS (Continued)
September 30, 2020
(a) Investments categorized as a significant unobservable input (Level 3) (See Note 6 of the Notes to Financial Statements).
(b) Restricted securities. These restricted securities constituted 2.78% of total net assets at September 30, 2020, most of which are considered liquid by the Adviser. These securities are not registered and may not be sold to the public. There are legal and/or contractual restrictions on resale. The Fund does not have the right to demand that such securities be registered. The values of these securities are determined by valuations provided by pricing services, brokers, dealers, market makers, or in good faith under policies adopted by authority of the Fund's Board of Directors.
(c) Non-income producing security.
(d) These securities have been valued in good faith under policies adopted by authority of the Board of Trustees in accordance with the Fund's fair value procedures. These securities constituted 0.43% of total net assets at September 30, 2020.
(e) Variable/Floating Rate Security — The rate shown is based on the latest available information as of September 30, 2020. For Corporate Bank Debt, the rate shown may represent a weighted average interest rate. Certain variable rate securities are not based on a published rate and spread but are determined by the issuer or agent and are based on current market conditions. These securities do not indicate a reference rate and spread in their description.
(f) Security exempt from registration under Rule 144A of the Securities Act of 1933. These securities may be resold in transactions exempt from registration, typically only to qualified institutional buyers. Unless otherwise indicated, these securities are not considered to be illiquid.
(g) Zero coupon bond. Coupon amount represents effective yield to maturity.
(h) Step Coupon — Coupon rate increases in increments to maturity. Rate disclosed is as of September 30, 2020.
(i) All or a portion of this holding is subject to unfunded loan commitments. The stated interest rate reflects the weighted average of the reference rate and spread for the funded portion, if any, and the commitment fees on the portion of the loan that is unfunded. See Note 8.
44
FPA NEW INCOME, INC.
PORTFOLIO OF INVESTMENTS — RESTRICTED SECURITIES
September 30, 2020
Issuer | | Acquisition
Date (s) | | Cost | | Fair Value | | Fair
Value as a %
of Net Assets | |
ABG Intermediate Holding
2 LLC, 3M USD LIBOR +
3.500% — 4.500% 9/27/2024 | | 3/6/2020, 3/12/2020 | | $ | 7,715,456 | | | $ | 7,965,745 | | | | 0.09 | % | |
Asurion LLC, 1M USD
LIBOR + 3.000% —
3.146% 11/3/2024 | | 9/29/2020, 9/25/2020,
9/28/2020, 9/29/2020 | | | 10,525,178 | | | | 10,501,943 | | | | 0.12 | % | |
Boart Longyear Management
Pty Ltd. TL, 10.00% Cash or
11.00% PIK — 11.000%
10/23/2020 | | 6/29/2018, 9/1/2017,
12/31/2018, 1/11/2019,
3/29/2019, 6/28/2019,
9/30/2019, 12/31/2019,
9/29/2018, 3/31/2020,
6/30/2020, 9/30/2020 | | | 5,309,191 | | | | 5,160,381 | | | | 0.06 | % | |
Cincinnati Bell, Inc., 1M USD
LIBOR + 3.250% — 4.250%
10/2/2024 | | 7/31/2020, 8/03/2020,
8/04/2020, 9/28/2020,
9/29/2020, 9/30/2020 | | | 12,038,510 | | | | 12,017,466 | | | | 0.14 | % | |
Frontier Communications Corp.,
1M USD LIBOR + 2.000% —
5.250% 2/27/2024 | | 8/14/2020, 12/10/2019 | | | 11,262,346 | | | | 11,386,197 | | | | 0.13 | % | |
General Nutrition Centers, Inc.,
1M USD LIBOR + 9.000% —
10.000% 12/23/2020 | | 3/12/2020, 12/21/2018,
12/11/2019, 12/4/2019 | | | 40,757,629 | | | | 39,855,075 | | | | 0.46 | % | |
JC Penney Corp., Inc., 3M USD
LIBOR + 4.250% — 5.250%
6/23/2023 | | 11/19/2018, 10/6/2017,
10/5/2017, 11/27/2018,
5/29/2019, 1/11/2019,
2/8/2019, 3/11/2019,
10/11/2017 | | | 25,806,205 | | | | 8,369,712 | | | | 0.10 | % | |
JC Penney Corp., Inc., 1M USD
LIBOR + 11.750% —
13.000% 11/16/2020 | | 06/08/2020 | | | 5,204,024 | | | | 6,609,111 | | | | 0.08 | % | |
Logix Holding Co. LLC,
1M USD LIBOR +
5.750% — 6.750%
12/22/2024 | | 8/11/2017, 6/18/2019 | | | 13,879,287 | | | | 12,830,847 | | | | 0.15 | % | |
MB2LTL, 3M USD LIBOR +
9.250% — 10.250% 6/2/2023 | | 12/2/2016, 1/31/2017 | | | 6,760,601 | | | | 6,771,287 | | | | 0.08 | % | |
McDermott Super Senior
Exit Lc — 4.750% 6/30/2024 | | 2/28/2020 | | | (148,087 | ) | | | (1,341,600 | ) | | | (0.02 | %) | |
Mediaco Holding, Inc. Class A,
1M USD LIBOR +
7.500% — 8.400% 11/25/2024 | | 12/18/2019, 11/25/2019,
12/12/2019, 12/13/2019,
8/27/2020 | | | 12,085,279 | | | | 10,880,002 | | | | 0.12 | % | |
45
FPA NEW INCOME, INC.
PORTFOLIO OF INVESTMENTS — RESTRICTED SECURITIES (Continued)
September 30, 2020
Issuer | | Acquisition
Date (s) | | Cost | | Fair Value | | Fair
Value as a %
of Net Assets | |
OTGTL, 3M USD LIBOR +
8.500% — 10.000% 8/26/2021 | | 8/17/2018, 10/10/2018,
1/26/2018, 7/13/2018,
6/13/2018, 5/15/2018,
5/9/2018, 8/26/2016,
11/30/2017, 8/30/2017,
5/26/2017, 3/8/2018,
2/28/2017, 6/14/2017 | | $ | 25,381,034 | | | $ | 22,824,493 | | | | 0.26 | % | |
PHI Group, Inc. | | 08/19/2019 | | | 9,504,696 | | | | 8,728,478 | | | | 0.10 | % | |
PHI Group, Inc., Restricted | | 08/19/2019 | | | 21,626,709 | | | | 18,868,067 | | | | 0.22 | % | |
Polyconcept North America
Holdings, Inc., 3M USD
LIBOR + 4.500% —
5.500% 8/16/2023 | | 9/30/2020, 11/18/2019 | | | 24,293,334 | | | | 19,957,913 | | | | 0.23 | % | |
Tech Data Corp. ABL Term
LOAN, 1M USD LIBOR +
3.500% — 3.645% 6/30/2025 | | 6/26/2020 | | | 8,487,535 | | | | 8,628,911 | | | | 0.10 | % | |
Windstream Services LLC,
1M USD LIBOR —
1.000% 9/21/2027 | | 8/11/2020 | | | 12,935,040 | | | | 12,968,725 | | | | 0.15 | % | |
ZW1L, 2M USD LIBOR +
5.000% — 6.000% 11/16/2022 | | 11/17/2016, 9/30/2020,
12/10/2019 | | | 14,446,040 | | | | 14,398,111 | | | | 0.17 | % | |
ZW2L, 3M USD LIBOR +
9.000% — 10.000% 11/16/2023 | | 12/10/2019, 11/17/2016 | | | 3,247,029 | | | | 3,235,813 | | | | 0.04 | % | |
TOTAL RESTRICTED
SECURITIES | | | | $ | 271,117,036 | | | $ | 240,616,677 | | | | 2.78 | % | |
See accompanying Notes to Financial Statements.
46
FPA NEW INCOME, INC.
STATEMENT OF ASSETS AND LIABILITIES
September 30, 2020
ASSETS | |
Investment securities — at fair value (identified cost $8,982,456,486) | | $ | 8,958,028,927 | | |
Short-term investments — repurchase agreements | | | 89,255,000 | | |
Due from broker | | | 2,830,000 | | |
Cash | | | 1,751,037 | | |
Receivable for: | |
Capital Stock sold | | | 74,114,716 | | |
Interest | | | 17,282,782 | | |
Investment securities sold | | | 42,619 | | |
Prepaid expenses and other assets | | | 4,401 | | |
Total assets | | | 9,143,309,482 | | |
LIABILITIES | |
Payable for: | |
Investment securities purchased | | | 486,270,964 | | |
Capital Stock repurchased | | | 6,978,488 | | |
Advisory fees | | | 2,589,666 | | |
Distributions from net investment income | | | 54 | | |
Accrued expenses and other liabilities | | | 561,691 | | |
Total liabilities | | | 496,400,863 | | |
NET ASSETS | | $ | 8,646,908,619 | | |
SUMMARY OF SHAREHOLDERS' EQUITY | |
Capital Stock — par value $0.01 per share; authorized 1,000,000,000 shares;
outstanding 864,273,129 shares | | $ | 8,642,731 | | |
| Additional Paid-in Capital | | | 9,055,657,334 | | |
| Distributable earnings | | | (417,391,446 | ) | |
NET ASSETS | | $ | 8,646,908,619 | | |
NET ASSET VALUE | |
Offering and redemption price per share | | $ | 10.00 | | |
See accompanying Notes to Financial Statements.
47
FPA NEW INCOME, INC.
STATEMENT OF OPERATIONS
For the Year Ended September 30, 2020
INVESTMENT INCOME | |
Interest | | $ | 215,781,625 | | |
EXPENSES | |
Advisory fees | | | 38,272,496 | | |
Transfer agent fees and expenses | | | 3,300,802 | | |
Filing fees | | | 458,009 | | |
Administrative services fees | | | 405,993 | | |
Reports to shareholders | | | 375,503 | | |
Other professional fees | | | 371,108 | | |
Director fees and expenses | | | 252,747 | | |
Custodian fees | | | 223,403 | | |
Legal fees | | | 119,607 | | |
Audit and tax services fees | | | 48,809 | | |
Other | | | 60,536 | | |
Total expenses | | | 43,889,013 | | |
Reimbursement from Adviser | | | (6,024,968 | ) | |
Net expenses | | | 37,864,045 | | |
Net investment income | | | 177,917,580 | | |
NET REALIZED AND UNREALIZED APPRECIATION (DEPRECIATION) | |
Net realized gain (loss) on: | |
Investments | | | 48,161,567 | | |
Net change in unrealized appreciation (depreciation) of: | |
Investments | | | (49,349,614 | ) | |
Net realized and unrealized loss | | | (1,188,047 | ) | |
NET INCREASE IN NET ASSETS RESULTING FROM OPERATIONS | | $ | 176,729,533 | | |
See accompanying Notes to Financial Statements.
48
FPA NEW INCOME, INC.
STATEMENTS OF CHANGES IN NET ASSETS
| | | Year Ended
September 30, 2020 | | Year Ended
September 30, 2019 | |
INCREASE (DECREASE) IN NET ASSETS | |
Operations: | |
Net investment income | | $ | 177,917,580 | | | $ | 183,793,779 | | |
Net realized gain (loss) | | | 48,161,567 | | | | (47,606,856 | ) | |
Net change in unrealized appreciation (depreciation) | | | (49,349,614 | ) | | | 139,208,490 | | |
Net increase in net assets resulting from operations | | | 176,729,533 | | | | 275,395,413 | | |
Distributions to shareholders | | | (182,547,346 | ) | | | (224,500,483 | ) | |
Capital Stock transactions: | |
Proceeds from Capital Stock sold | | | 4,296,352,338 | | | | 3,391,626,872 | | |
Proceeds from shares issued to shareholders upon reinvestment of
dividends and distributions | | | 161,454,134 | | | | 197,443,145 | | |
Cost of Capital Stock repurchased | | | (3,132,483,801 | ) | | | (2,017,185,013 | ) | |
Net increase from Capital Stock transactions | | | 1,325,322,671 | | | | 1,571,885,004 | | |
Total change in net assets | | | 1,319,504,858 | | | | 1,622,779,934 | | |
NET ASSETS | |
Beginning of Year | | | 7,327,403,761 | | | | 5,704,623,827 | | |
End of Year | | $ | 8,646,908,619 | | | $ | 7,327,403,761 | | |
CHANGE IN CAPITAL STOCK OUTSTANDING | |
Shares of Capital Stock sold | | | 430,585,641 | | | | 341,922,692 | | |
Shares issued to shareholders upon reinvestment of
dividends and distributions | | | 16,215,609 | | | | 19,920,545 | | |
Shares of Capital Stock repurchased | | | (315,133,932 | ) | | | (203,171,906 | ) | |
Change in Capital Stock outstanding | | | 131,667,318 | | | | 158,671,331 | | |
See accompanying Notes to Financial Statements.
49
FPA NEW INCOME, INC.
FINANCIAL HIGHLIGHTS
Selected Data for Each Share of Capital Stock Outstanding Throughout Each Year
| | | Year Ended September 30, | |
| | | 2020 | | 2019 | | 2018 | | 2017 | | 2016 | |
Per share operating performance: | |
Net asset value at beginning of year | | $ | 10.00 | | | $ | 9.94 | | | $ | 10.05 | | | $ | 10.06 | | | $ | 10.08 | | |
Income from investment operations: | |
Net investment income(a) | | | 0.23 | | | | 0.28 | | | | 0.29 | | | | 0.25 | | | | 0.19 | | |
Net realized and unrealized gain (loss)
on investment securities | | | 0.01 | (b) | | | 0.13 | | | | (0.18 | ) | | | 0.01 | | | | (0.04 | ) | |
Total from investment operations | | | 0.24 | | | | 0.41 | | | | 0.11 | | | | 0.26 | | | | 0.15 | | |
Less distributions: | |
Dividends from net investment income | | | (0.24 | ) | | | (0.35 | ) | | | (0.22 | ) | | | (0.27 | ) | | | (0.17 | ) | |
Redemption fees | | | — | | | | — | | | | — | | | | — | (c) | | | — | (c) | |
Net asset value at end of year | | $ | 10.00 | | | $ | 10.00 | | | $ | 9.94 | | | $ | 10.05 | | | $ | 10.06 | | |
Total investment return(d) | | | 2.41 | % | | | 4.20 | % | | | 1.91 | % | | | 2.58 | % | | | 1.52 | % | |
Ratios/supplemental data: | |
Net assets, end of year (in $000's) | | $ | 8,646,909 | | | $ | 7,327,404 | | | $ | 5,704,624 | | | $ | 5,125,433 | | | $ | 5,048,610 | | |
Ratio of expenses to average net assets: | |
Before reimbursement from Adviser | | | 0.57 | % | | | 0.57 | % | | | 0.58 | % | | | 0.59 | % | | | 0.58 | % | |
After reimbursement from Adviser | | | 0.49 | %(e) | | | 0.50 | % | | | 0.49 | % | | | 0.49 | % | | | 0.55 | % | |
Ratio of net investment income to average
net assets: | |
Before reimbursement from Adviser | | | 2.24 | % | | | 2.73 | % | | | 2.88 | % | | | 2.45 | % | | | 1.87 | % | |
After reimbursement from Adviser | | | 2.32 | % | | | 2.80 | % | | | 2.96 | % | | | 2.55 | % | | | 1.90 | % | |
Portfolio turnover rate | | | 54 | % | | | 25 | % | | | 29 | % | | | 59 | % | | | 44 | % | |
(a) Per share amount is based on average shares outstanding.
(b) Due to timing of sales and repurchase of capital shares, the net realized and unrealized gain (loss) per share is not in accordance with the Fund's change in net realized and unrealized gain (loss) on investment transactions for the period.
(c) Rounds to less than $0.01 per share.
(d) Return is based on net asset value per share, adjusted for reinvestment of distributions, and does not reflect deduction of the sales charge.
(e) Includes voluntary fee waiver which reduced the ratio of expenses to average net assets after reimbursement from Adviser by 0.01%.
See accompanying Notes to Financial Statements.
50
FPA NEW INCOME, INC.
NOTES TO FINANCIAL STATEMENTS
September 30, 2020
NOTE 1 — Significant Accounting Policies
FPA New Income, Inc. (the "Fund") is registered under the Investment Company Act of 1940, as a diversified, open-end, management investment company. The Fund's primary investment objective is to seek current income and long-term total return. Capital preservation is also a consideration. The Fund qualifies as an investment company pursuant to Financial Accounting Standard Board (FASB) Accounting Standards Codification (ASC) No. 946, Financial Services — Investment Companies. The following is a summary of significant accounting policies consistently followed by the Fund in the preparation of its financial statements.
A. Security Valuation
The Fund's investments are reported at fair value as defined by accounting principles generally accepted in the United States of America, ("U.S. GAAP"). The Fund generally determines its net asset value as of approximately 4:00 p.m. New York time each day the New York Stock Exchange is open. Further discussion of valuation methods, inputs and classifications can be found under Disclosure of Fair Value Measurements.
B. Securities Transactions and Related Investment Income
Securities transactions are accounted for on the date the securities are purchased or sold. Dividend income and distributions to shareholders are recorded on the ex-dividend date. Interest income and expenses are recorded on an accrual basis. Market discounts and premiums on fixed income securities are amortized over the expected life of the securities. Realized gains or losses are based on the specific identification method.
C. Use of Estimates
The preparation of the financial statements in accordance with U.S. GAAP requires management to make estimates and assumptions that affect the amounts reported. Actual results could differ from those estimates.
D. Recent Accounting Pronouncements
In August 2018, the Financial Accounting Standards Board (FASB) issued Accounting Standards Update (ASU) No. 2018-13, Fair Value Measurement (Topic 820) — Disclosure Framework — Changes to the Disclosure Requirements for Fair Value Measurement. The amendments eliminate certain disclosure requirements for fair value measurements for all entities, requires public entities to disclose certain new information and modifies some disclosure requirements. The new guidance is effective for all entities for fiscal years beginning after December 15, 2019 and for interim periods within those fiscal years. An entity is permitted to early adopt either the entire standard or only the provisions that eliminate or modify requirements. The Adviser is currently evaluating the impact of this new guidance on the Fund's financial statements.
E. Due from broker represents cash, foreign currencies, and margin balances held at financial institutions as well as net unrealized appreciation or depreciation on foreign currency balances. The due from broker balance may be restricted to the extent that they serve as deposits for certain marketable securities (for example, unfunded commitments for loans purchased). The Fund is subject to credit risk to the extent any broker with which it conducts business is unable to fulfill contractual obligations on its behalf. As considered necessary, the Fund reviews the credit standing of financial institutions with which it has funds on deposit and does not anticipate any losses from these counter-parties. As of September 30, 2020 due from broker consisted of $2,830,000 in cash restricted for use to the unfunded commitments of loans purchased.
51
FPA NEW INCOME, INC.
NOTES TO FINANCIAL STATEMENTS (Continued)
NOTE 2 — Risk Considerations
Investing in the Fund may involve certain risks including, but not limited to, those described below.
Market Risk: Because the values of the Fund's investments will fluctuate with market conditions, so will the value of your investment in the Fund. You could lose money on your investment in the Fund or the Fund could underperform other investments.
Interest Rate and Credit Risk: The values of, and the income generated by, most debt securities held by the Fund may be affected by changing interest rates and by changes in the effective maturities and credit rating of these securities. For example, the value of debt securities in the Fund's portfolio generally will decline when interest rates rise and increase when interest rates fall. In addition, falling interest rates may cause an issuer to redeem, call or refinance a security before its stated maturity, which may result in the Fund having to reinvest the proceeds in lower yielding securities.
Mortgage-Backed and Other Asset-Backed Securities Risk: The values of some mortgage-backed and other asset-backed securities may expose the Fund to a lower rate of return upon reinvestment of principal. When interest rates rise, the value of mortgage-related securities generally will decline; however, when interest rates are declining, the value of mortgage related-securities with prepayment features may not increase as much as other fixed income securities. The rate of prepayments on underlying mortgages will affect the price and volatility of a mortgage-related security, and may shorten or extend the effective maturity of the security beyond what was anticipated at the time of purchase. If an unanticipated rate of prepayment on underlying mortgages increases the effective maturity of a mortgage-related security, the volatility of the security can be expected to increase. The value of these securities may also fluctuate in response to the market's perception of the creditworthiness of the issuers. Additionally, although mortgages and mortgage-related securities are generally supported by some form of government or private guarantee and/or insurance, there is no assurance that private guarantors or insurers will meet their obligations.
Stripped Mortgage-Backed Interest Only ("I/O") and Principal Only ("P/O") Securities: Stripped mortgage backed securities are usually structured with two classes that receive different proportions of the interest and principal distributions on a pool of mortgage assets. In certain cases, one class will receive all of the interest payments on the underlying mortgages (the I/O class), while the other class will receive all of the principal payments (the P/O class). The Fund currently has investments in I/O and P/O securities. The yield to maturity on I/Os is sensitive to the rate of principal repayments (including prepayments) on the related underlying mortgage assets, and principal payments may have a material effect on yield-to-maturity. If the underlying mortgage assets experience greater than anticipated prepayments of principal, a Fund may not fully recoup its initial investment in I/Os.
Credit Risk: Debt securities are subject to credit risk, meaning that the issuer of the debt security may default or fail to make timely payments of principal or interest. The values of any of the Fund's investments may also decline in response to events affecting the issuer or its credit rating. The lower rated debt securities in which the Fund may invest are considered speculative and are generally subject to greater volatility and risk of loss than investment grade securities, particularly in deteriorating economic conditions. The Fund invests a significant portion of its assets in securities of issuers that hold mortgage-and asset-backed securities and direct investments in securities backed by commercial and residential mortgage loans and other financial assets. The value and related income of these securities is sensitive to changes in economic conditions, including delinquencies and/or defaults. Continuing shifts in the market's perception of credit quality on securities backed by commercial and residential mortgage loans and other financial assets may result in increased volatility of market price and periods of illiquidity that can negatively impact the valuation of certain securities held by the Fund.
52
FPA NEW INCOME, INC.
NOTES TO FINANCIAL STATEMENTS (Continued)
Repurchase Agreements: Repurchase agreements permit the Fund to maintain liquidity and earn income over periods of time as short as overnight. Repurchase agreements held by the Fund are fully collateralized by U.S. Government securities, or securities issued by U.S. Government agencies, or securities that are within the three highest credit categories assigned by established rating agencies (Aaa, Aa, or A by Moody's or AAA, AA or A by Standard & Poor's) or, if not rated by Moody's or Standard & Poor's, are of equivalent investment quality as determined by the Adviser. Such collateral is in the possession of the Fund's custodian. The collateral is evaluated daily to ensure its fair value equals or exceeds the current fair value of the repurchase agreements including accrued interest. In the event of default on the obligation to repurchase, the Fund has the right to liquidate the collateral and apply the proceeds in satisfaction of the obligation.
The Fund may enter into repurchase agreements, under the terms of a Master Repurchase Agreement ("MRA"). The MRA permits the Fund, under certain circumstances including an event of default (such as bankruptcy or insolvency), to offset payables and/or receivables under the MRA with collateral held and/or posted to the counterparty and create one single net payment due to or from the Fund. However, bankruptcy or insolvency laws of a particular jurisdiction may impose restrictions on or prohibitions against such a right of offset in the event of a MRA counterparty's bankruptcy or insolvency. Pursuant to the terms of the MRA, the Fund receives securities as collateral with a fair value in excess of the repurchase price to be received by the Fund upon the maturity of the repurchase transaction. Upon a bankruptcy or insolvency of the MRA counterparty, the Fund recognizes a liability with respect to such excess collateral to reflect the Fund's obligation under bankruptcy law to return the excess to the counterparty. Repurchase agreements outstanding at the end of the period are listed in the Fund's Portfolio of Investments.
Many countries have experienced outbreaks of infectious illnesses in recent decades, including swine flu, avian influenza, SARS and, more recently, COVID-19. The global outbreak of COVID-19 in early 2020 has resulted in various disruptions, including travel and border restrictions, quarantines, supply chain disruptions, lower consumer demand and general market uncertainty. The effects of COVID-19 have and may continue to adversely affect the global economy, financial markets and the economies of certain nations and individual issuers, any of which may negatively impact the Fund and its holdings. Similar consequences could arise as a result of the spread of other infectious diseases.
NOTE 3 — Purchases and Sales of Investment Securities
Cost of purchases of investment securities (excluding short-term investments) aggregated $ 6,306,013,337 for the year ended September 30, 2020. The proceeds and cost of securities sold resulting in net realized gains of $48,161,567 aggregated $3,756,229,225 and $3,708,067,658, respectively, for the year ended September 30, 2020. Realized gains or losses are based on the specific identification method.
NOTE 4 — Advisory Fees and Other Affiliated Transactions
Pursuant to an Investment Advisory Agreement (the "Agreement"), advisory fees were paid by the Fund to First Pacific Advisors, LP (the "Adviser"). Under the terms of this Agreement, the Fund pays the Adviser a monthly fee calculated at the annual rate of 0.50% of the Fund's average daily net assets. In addition, the adviser contractually agreed to reimburse expenses in excess of 0.50% of the average net assets of the Fund (excluding brokerage fees and commissions, interest, taxes, shareholder service fees, fees and expenses of other funds in which the Fund invests, and extraordinary expenses) through January 31, 2021. The Agreement obligates the Adviser to reduce its fee to the extent necessary to reimburse the Fund for any annual expenses (exclusive of interest, taxes, the cost of any supplemental statistical and research information, and extraordinary expenses such as litigation) in excess of 1.5% of the first $15 million and 1% of the remaining average net assets of the Fund for the year. From July 1, 2020 through October 2, 2020 the Advisor voluntarily waived advisory fees to limit expenses in excess of 0.48% of the average net assets of the Fund.
53
FPA NEW INCOME, INC.
NOTES TO FINANCIAL STATEMENTS (Continued)
For the year ended September 30, 2020, the Fund paid aggregate fees and expenses of $252,747 to all Directors who are not affiliated persons of the Adviser. Certain officers of the Fund are also officers of the Adviser.
NOTE 5 — Federal Income Tax
No provision for federal income tax is required because the Fund has elected to be taxed as a "regulated investment company" under the Internal Revenue Code (the "Code") and intends to maintain this qualification and to distribute each year to its shareholders, in accordance with the minimum distribution requirements of the Code, its taxable net investment income and taxable net realized gains on investments.
Distributions paid to shareholders are based on net investment income and net realized gains determined on a tax reporting basis, which may differ from financial reporting. For federal income tax purposes, the Fund had the following components of distributable earnings at September 30, 2020:
Unrealized Depreciation | | $ | (24,369,591 | ) | |
Undistributed Ordinary Income | | | 700,154 | | |
Capital Loss Carryover | | | (393,722,009 | ) | |
The tax status of distributions paid during the fiscal years ended September 30, 2020 and 2019 were as follows:
| | | 2020 | | 2019 | |
Dividends from ordinary income | | $ | 182,547,346 | | | $ | 224,500,483 | | |
The Fund utilizes the provisions of federal income tax laws that provide for the carryforward of capital losses for prior years, offsetting such losses against any future realized capital gains. Under the Regulated Investment Company Act of 2010 (the "Act"), net capital losses recognized for fiscal years beginning after December 22, 2010 may be carried forward indefinitely, and their character is retained as short-term and/or long-term losses.
As of September 30, 2020, the fund had $93,350,662 of short-term capital losses and $300,371,347 of long-term capital losses available to offset possible future capital gains.
The cost of investment securities held at September 30, 2020, was $8,982,398,518 for federal income tax purposes. Gross unrealized appreciation and depreciation for all investments (excluding short-term investments) at September 30, 2020, for federal income tax purposes was $87,796,151 and $112,165,742, respectively resulting in net unrealized depreciation of $24,369,591. As of and during the year ended September 30, 2020, the Fund did not have any liability for unrecognized tax benefits. The Fund recognizes interest and penalties, if any, related to unrecognized tax benefits as income tax expense in the Statement of Operations. During the year, the Fund did not incur any interest or penalties. The statute of limitations remains open for the last 3 years, once a return is filed. No examinations are in progress at this time.
During the year ended September 30, 2020, the Fund reclassified $1,235 to Distributable earnings from Paid in Capital. The permanent book/tax differences arose principally from differing book/tax treatment of market discount accretion of securities, Net assets were not affected by these reclassifications.
54
FPA NEW INCOME, INC.
NOTES TO FINANCIAL STATEMENTS (Continued)
NOTE 6 — Disclosure of Fair Value Measurements
The Fund uses the following methods and inputs to establish the fair value of its assets and liabilities. Use of particular methods and inputs may vary over time based on availability and relevance as market and economic conditions evolve.
Equity securities are generally valued each day at the official closing price of, or the last reported sale price on, the exchange or market on which such securities principally are traded, as of the close of business on that day. If there have been no sales that day, equity securities are generally valued at the last available bid price. Securities that are unlisted and fixed-income and convertible securities listed on a national securities exchange for which the over-the-counter ("OTC") market more accurately reflects the securities' value in the judgment of the Fund's officers, are valued at the most recent bid price. However, most fixed income securities are generally valued at prices obtained from pricing vendors and brokers. Vendors value such securities based on one or more of the following inputs: transactions, bids, offers quotations from dealers and trading systems, spreads and other relationships observed in the markets among comparable securities, benchmarks, underlying equity of the issuer, and proprietary pricing models such as cash flows, financial or collateral performance and other reference data (includes prepayments, defaults, collateral, credit enhancements, and interest rate volatility). Short-term corporate notes with maturities of 60 days or less at the time of purchase are valued at amortized cost.
Securities for which representative market quotations are not readily available or are considered unreliable by the Adviser are valued as determined in good faith under procedures adopted by the authority of the Fund's Board of Directors. Various inputs may be reviewed in order to make a good faith determination of a security's value. These inputs include, but are not limited to, the type and cost of the security; contractual or legal restrictions on resale of the security; relevant financial or business developments of the issuer; actively traded similar or related securities; conversion or exchange rights on the security; related corporate actions; significant events occurring after the close of trading in the security; and changes in overall market conditions. Fair valuations and valuations of investments that are not actively trading involve judgment and may differ materially from valuations of investments that would have been used had greater market activity occurred.
The Fund classifies its assets based on three valuation methodologies. Level 1 values are based on quoted market prices in active markets for identical assets. Level 2 values are based on significant observable market inputs, such as quoted prices for similar assets and quoted prices in inactive markets or other market observable inputs as noted above including spreads, cash flows, financial performance, prepayments, defaults, collateral, credit enhancements, and interest rate volatility. Level 3 values are based on significant unobservable inputs that reflect the Fund's determination of assumptions that market participants might reasonably use in valuing the assets. These assumptions consider inputs such as proprietary pricing models, cash flows, prepayments, defaults, and collateral. The valuation levels are not necessarily an indication of the risk associated with investing in those securities. The following table presents the valuation levels of the Fund's investments as of September 30, 2020:
Investments | | Level 1 | | Level 2 | | Level 3 | | Total | |
Common Stocks | |
Energy | | | — | | | | — | | | $ | 27,596,545 | | | $ | 27,596,545 | | |
Industrials | | $ | 244,230 | | | | — | | | | — | | | | 244,230 | | |
Commercial Mortgage-Backed Securities | |
Agency | | | — | | | $ | 146,781,422 | | | | — | | | | 146,781,422 | | |
Agency Stripped | | | — | | | | 167,788,442 | | | | — | | | | 167,788,442 | | |
Non-Agency | | | — | | | | 571,989,512 | | | | — | | | | 571,989,512 | | |
55
FPA NEW INCOME, INC.
NOTES TO FINANCIAL STATEMENTS (Continued)
Investments | | Level 1 | | Level 2 | | Level 3 | | Total | |
Residential Mortgage-Backed Securities | |
Agency Collateralized Mortgage Obligation | | | — | | | $ | 108,944,554 | | | | — | | | $ | 108,944,554 | | |
Agency Pool Adjustable Rate | | | — | | | | 403,287 | | | | — | | | | 403,287 | | |
Agency Pool Fixed Rate | | | — | | | | 13,793,446 | | | | — | | | | 13,793,446 | | |
Agency Stripped | | | — | | | | 89,740,037 | | | | — | | | | 89,740,037 | | |
Non-Agency | | | — | | | | — | | | $ | 30,251,492 | | | | 30,251,492 | | |
Non-Agency Collateralized Mortgage
Obligation | | | — | | | | 430,371,013 | | | | 62,651,413 | | | | 493,022,426 | | |
Asset-Backed Securities | |
Auto | | | — | | | | 1,912,625,011 | | | | — | | | | 1,912,625,011 | | |
Collateralized Loan Obligation | | | — | | | | 1,481,511,889 | | | | 90,925,238 | | | | 1,572,437,127 | | |
Credit Card | | | — | | | | 426,163,835 | | | | — | | | | 426,163,835 | | |
Equipment | | | — | | | | 1,251,240,578 | | | | 15,995,601 | | | | 1,267,236,179 | | |
Other | | | — | | | | 690,053,071 | | | | — | | | | 690,053,071 | | |
Corporate Bonds & Notes | | | — | | | | 103,576,778 | | | | — | | | | 103,576,778 | | |
Corporate Bank Debt | | | — | | | | 156,252,026 | | | | 56,768,106 | | | | 213,020,132 | | |
U.S. Treasuries | | | — | | | | 1,122,361,401 | | | | — | | | | 1,122,361,401 | | |
Short-Term Investment | | | — | | | | 89,255,000 | | | | — | | | | 89,255,000 | | |
| | | $ | 244,230 | | | $ | 8,762,851,302 | | | $ | 284,188,395 | | | $ | 9,047,283,927 | | |
The following table summarizes the Fund's Level 3 investment securities and related transactions during the year ended September 30, 2020:
Investments | | Beginning
Value at
September 30,
2019 | | Net Realized and
Unrealized Gains
(Losses)* | | Purchases | | (Sales) | | Gross
Transfers
In/(Out) | | Ending
Value at
September 30,
2020 | | Net Change
in Unrealized
Appreciation
(Depreciation)
related to
Investments held
at September 30,
2020 | |
Common Stocks | | $ | 31,631,350 | | | $ | (4,034,805 | ) | | | — | | | | — | | | | — | | | $ | 27,596,545 | | | $ | (4,034,805 | ) | |
Residential Mortgage-
Backed Securities
Non-Agency
Collateralized
Mortgage Obligation | | | — | | | | (17,512 | ) | | $ | 62,668,925 | | | | — | | | | — | | | | 62,651,413 | | | | (17,587 | ) | |
Residential Mortgage-
Backed Non-Agency | | | — | | | | — | | | | 30,251,492 | | | | — | | | | — | | | | 30,251,492 | | | | — | | |
Asset-Backed Securities
Collateralized Loan
Obligation | | | — | | | | 12,238 | | | | 90,913,000 | | | | — | | | | — | | | | 90,925,238 | | | | 12,238 | | |
Asset-Backed Securities
Equipment | | | 22,765,958 | | | | (3,879,137 | ) | | | — | | | $ | (2,891,220 | ) | | | — | | | | 15,995,601 | | | | (3,881,092 | ) | |
56
FPA NEW INCOME, INC.
NOTES TO FINANCIAL STATEMENTS (Continued)
Investments | | Beginning
Value at
September 30,
2019 | | Net Realized and
Unrealized Gains
(Losses)* | | Purchases | | (Sales) | | Gross
Transfers
In/(Out) | | Ending
Value at
September 30,
2020 | | Net Change
in Unrealized
Appreciation
(Depreciation)
related to
Investments held
at September 30,
2020 | |
Corporate Bank Debt | | $ | 76,885,246 | | | $ | (5,147,333 | ) | | $ | 14,041,724 | | | $ | (29,011,531 | ) | | | — | | | $ | 56,768,106 | | | $ | (5,484,016 | ) | |
| | | $ | 131,282,554 | | | $ | (13,066,549 | ) | | $ | 197,875,141 | | | $ | (31,902,751 | ) | | | — | | | $ | 284,188,395 | | | $ | (13,405,262 | ) | |
* Net realized and unrealized gains (losses) are included in the related amounts in the statement of operations.
Level 3 Valuation Process: Investments classified within Level 3 of the fair value hierarchy are valued by the Adviser in good faith under procedures adopted by authority of the Fund's Board of Directors. The Adviser employs various methods to determine fair valuations including regular review of key inputs and assumptions, and review of related market activity, if any. However, there are generally no observable trade activities in these securities. The Adviser reports to the Board of Directors at their regularly scheduled quarterly meetings, or more often if warranted. The report includes a summary of the results of the process, the key inputs and assumptions noted, and any changes to the inputs and assumptions used. When appropriate, the Adviser will recommend changes to the procedures and process employed. The value determined for an investment using the fair value procedures may differ significantly from the value realized upon the sale of such investment.
Transfers of investments between different levels of the fair value hierarchy are recorded at fair value as of the end of the reporting period. There were no transfers between Level 1 and 2.
The following table summarizes the quantitative inputs and assumptions used for items categorized as items categorized as Level 3 of the fair value hierarchy as of September 30, 2020:
| Financial Assets | | Fair Value at
September 30, 2020 | | Valuation Technique(s) | | Unobservable
Inputs | | Price/Range | |
Common Stocks | | $ | 27,596,545 | | | Recent Trade Activity (a) | | Quotes/Prices | | $ | 7.25 | | |
Residential Mortgage-Backed
Securities — Non-Agency | | $ | 30,251,492 | | | Third-Party Broker Quote (b) | | Quotes/Prices | | $ | 100.00 | | |
Residential Mortgage-Backed
Securities — Non-Agency
Collateralized Mortgage
Obligation | | $ | 62,651,413 | | | Third-Party Broker Quote (b) | | Quotes/Prices | | $ | 99.78-$100.00 | | |
Asset-Backed Securities —
Collateralized Loan
Obligation | | $ | 8,171,238 | | | Third-Party Broker Quote (b) | | Quotes/Prices | | $ | 100.15 | | |
| | | | | $ | 82,754,000 | | | Recent Trade Activity (e) | | Cost | | $ | 100.00 | | |
Asset-Backed Securities —
Equipment | | $ | 15,995,601 | | | Third-Party Broker Quote (b) | | Quotes/Prices | | $ | 79.00 | | |
Corporate Bank Debt | | $ | 47,229,704 | | | Pricing Vendor | | Prices | | $ | 89.48-$99.34 | | |
| | | | | $ | (1,341,600 | ) | | Pricing Model (c) | | Quotes/Prices | | $ | 92.00 | | |
| | $ | 10,880,002 | | | Pricing Model (d) | | Amortized Cost | | $ | 89.25 | | |
| | | | | | Liqudity Discount | | | 10 | % | |
(a) The fair value is based on recent trade activity obtained from market makers in the security.
(b) The Third Party Broker Quote technique involves obtaining an independent third-party broker quote for the security.
(c) The Pricing Model technique for Level 3 securities involves recently quoted funding prices of the security.
57
FPA NEW INCOME, INC.
NOTES TO FINANCIAL STATEMENTS (Continued)
(d) The Pricing Model technique for Level 3 securities involves amortized cost and the application of a discount for lack of liquidity. The discount reflects the current market expectation of discount needed in order to effect a transaction in a timely manner.
(e) The significant unobservable inputs used in the fair value measurement are based on the most recent trade executed by the Fund.
NOTE 7 — Collateral Requirements
FASB Accounting Standards Update No. 2011-11, Disclosures about Offsetting Assets and Liabilities, requires disclosures to make financial statements that are prepared under U.S. GAAP more comparable to those prepared under International Financial Reporting Standards. Under this guidance the Fund discloses both gross and net information about instruments and transactions eligible for offset such as instruments and transactions subject to an agreement similar to a master netting arrangement. In addition, the Fund discloses collateral received and posted in connection with master netting agreements or similar arrangements.
The following table presents the Fund's repurchase agreements by counterparty net of amounts available for offset under an ISDA Master agreement or similar agreements and net of the related collateral received or pledged by the Fund as of September 30, 2020, are as follows:
| | | | | Gross Amounts Not Offset in the
Statement of Assets and Liabilities | | | |
Counterparty | | Gross Assets
(Liabilities)
in the Statement of
Assets and Liabilities | | Collateral
(Received)
Pledged | | Assets (Liabilities)
Available for Offset | | Net Amount
of Assets
(Liabilities)* | |
State Street Bank and
Trust Company: | |
Repurchase Agreements | | $ | 89,255,000 | | | $ | (89,255,000 | )** | | | — | | | | — | | |
* Represents the net amount receivable from the counterparty in the event of default.
** Collateral with a value of $91,040,177 has been received in connection with a master repurchase agreement. Excess of collateral received from the individual master repurchase agreement is not shown for financial reporting purposes.
NOTE 8 — Commitments
For the year ended September 30, 2020, the Fund was liable for the following unfunded commitments:
Security | | Unfunded
Commitment | |
Frontier Communications Corp., 1M USD LIBOR + 2.000% — 5.250% 2/27/2024 | | $ | 4,223,007 | | |
McDermott Super Senior Exit Lc — 4.750% 6/30/2024 | | | 16,770,000 | | |
58
FPA NEW INCOME, INC.
REPORT OF INDEPENDENT REGISTERED
PUBLIC ACCOUNTING FIRM
TO THE SHAREHOLDERS AND
BOARD OF DIRECTORS OF FPA NEW INCOME, INC.
Opinion on the Financial Statements
We have audited the accompanying statement of assets and liabilities of FPA New Income, Inc. (the "Fund"), including the portfolio of investments, as of September 30, 2020, and the related statement of operations for the year then ended, the statement of changes in net assets for each of the two years in the period then ended, and the financial highlights for each of the three years in the period then ended and the related notes (collectively referred to as the "financial statements"). The financial highlights for the years ended September 30, 2016 and September 30, 2017 were audited by another independent registered public accounting firm whose report, dated November 20, 2017, expressed an unqualified opinion on those financial highlights. In our opinion, the financial statements present fairly, in all material respects, the financial position of the Fund at September 30, 2020, the results of its operations for the year then ended, the changes in its net assets for each of the two years in the period then ended, and its financial highlights for each of the three years in the period then ended, in conformity with U.S. generally accepted accounting principles.
Basis for Opinion
These financial statements are the responsibility of the Fund's management. Our responsibility is to express an opinion on the Fund's financial statements based on our audits. We are a public accounting firm registered with the Public Company Accounting Oversight Board (United States) ("PCAOB") and are required to be independent with respect to the Fund in accordance with the U.S. federal securities laws and the applicable rules and regulations of the Securities and Exchange Commission and the PCAOB.
We conducted our audits in accordance with the standards of the PCAOB. Those standards require that we plan and perform the audit to obtain reasonable assurance about whether the financial statements are free of material misstatement, whether due to error or fraud. The Fund is not required to have, nor were we engaged to perform, an audit of the Fund's internal control over financial reporting. As part of our audits, we are required to obtain an understanding of internal control over financial reporting, but not for the purpose of expressing an opinion on the effectiveness of the Fund's internal control over financial reporting. Accordingly, we express no such opinion.
Our audits included performing procedures to assess the risks of material misstatement of the financial statements, whether due to error or fraud, and performing procedures that respond to those risks. Such procedures included examining, on a test basis, evidence regarding the amounts and disclosures in the financial statements. Our procedures included confirmation of securities owned as of September 30, 2020, by correspondence with the custodian and brokers or by other appropriate auditing procedures where replies from brokers were not received. Our audits also included evaluating the accounting principles used and significant estimates made by management, as well as evaluating the overall presentation of the financial statements. We believe that our audits provide a reasonable basis for our opinion.

We have served as the auditor of one or more investment companies in the FPA family of funds since 2018.
Los Angeles, CA
November 24, 2020
59
FPA NEW INCOME, INC.
SHAREHOLDER EXPENSE EXAMPLE
September 30, 2020 (Unaudited)
Fund Expenses
Mutual fund shareholders generally incur two types of costs: (1) transaction costs, and (2) ongoing costs, including advisory and administrative fees; shareholder service fees; and other Fund expenses. The Example is intended to help you understand your ongoing costs (in dollars) of investing in the Fund and to compare these costs with the ongoing costs of investing in other mutual funds. The Example is based on an investment of $1,000 invested at the beginning of the year and held for the entire year.
Actual Expenses
The information in the table under the heading "Actual Performance" provides information about actual account values and actual expenses. You may use the information in this column, together with the amount you invested, to estimate the expenses that you paid over the period. Simply divide your account value by $1,000 (for example, an $8,600 account value divided by $1,000 = 8.6), then multiply the result by the number in the first column in the row entitled "Expenses Paid During Period" to estimate the expenses you paid on your account during this period.
Hypothetical Example for Comparison Purposes
The information in the table under the heading "Hypothetical Performance (5% return before expenses)" provides information about hypothetical account values and hypothetical expenses based on the Fund's actual expense ratio and an assumed rate of return of 5% per year before expenses, which is not the Fund's actual return. The hypothetical account values and expenses may not be used to estimate the actual ending account balance or expenses you paid for the period. You may use this information to
compare the ongoing costs of investing in the Fund and other funds. To do so, compare this 5% hypothetical example with the 5% hypothetical examples that appear in the shareholder reports of other funds.
Please note that the expenses shown in the table are meant to highlight your ongoing costs only and do not reflect any transactional costs. Therefore, the information under the heading "Hypothetical Performance (5% return before expenses)" is useful in comparing ongoing costs only, and will not help you determine the relative total costs of owning different funds. In addition, if these transactional costs were included, your costs would have been higher. Even though the Fund does not charge transaction fees, if you purchase shares through a broker, the broker may charge you a fee. You should evaluate other mutual funds' transaction fees and any applicable broker fees to assess the total cost of ownership for comparison purposes.
| | | Actual
Performance | | Hypothetical
Performance
(5% return
before
expenses) | |
Beginning Account Value
March 31, 2020 | | $ | 1,000.00 | | | $ | 1,000.00 | | |
Ending Account Value
September 30, 2020 | | $ | 1,033.90 | | | $ | 1,022.56 | | |
Expenses Paid During
Period* | | $ | 2.49 | | | $ | 2.47 | | |
* Expenses are equal to the Fund's annualized expense ratio of 0.49%, multiplied by the average account value over the period and prorated for the six-months ended September 30, 2020 (183/366 days).
60
FPA NEW INCOME, INC.
APPROVAL OF INVESTMENT ADVISORY AGREEMENT
(Unaudited)
Approval of the Advisory Agreement. At a meeting of the Board of Directors held on August 10, 2020, the Directors approved the continuation of the advisory agreement between the Fund and the Adviser (the "Advisory Agreement") for an additional one-year period through September 30, 2021, on the recommendation of the Independent Directors, who met in executive session on August 10, 2020 prior to the Board meeting to review and discuss the proposed continuation of the Advisory Agreement. The Board had also met on July 13, 2020, with the Independent Directors meeting separately prior to the Meeting in executive session with the management of the Adviser and then separately with independent counsel to evaluate the renewal of the Advisory Agreement. Prior to their July 13 meeting, the Independent Directors, through their independent counsel, had requested and received extensive materials prepared in connection with the review of the Advisory Agreements. The materials provided a broad range of information regarding the Fund, including a description of, among other matters, the terms of the Advisory Agreement; the services provided by the Adviser; the experience of the relevant investment personnel; the Fund's performance in absolute terms and as compared to the performance of peers and appropriate benchmark(s); the fees and expenses of the Fund in absolute terms and as compared to peers; and the profitability of the Adviser from serving as adviser to the Fund. Following their review at the July 13 meeting, the Independent Directors requested (through their independent counsel) and received supplemental information and responses to a number of questions relating to the materials provided by the Adviser.
In addition to the executive sessions, the Boards, acting directly or through their committees, met regularly throughout the year and received information on a variety of topics that were relevant to its annual consideration of the renewal of each Advisory Agreement including, among other matters, Fund investment performance, compliance, risk management, liquidity, valuation, trade execution, service provider oversight and other matters relating to Fund operations. The Independent Directors also had met with management of the Adviser (including key investment personnel) at their quarterly meetings as well as with management at other times between the quarterly meetings throughout the year. The materials specifically provided in connection with the annual review of the Advisory Agreements supplement the information received throughout the year.
At their regular Board meetings and executive sessions, the Independent Directors were also advised by independent legal counsel. In addition to the materials provided by the Adviser, the Independent Directors received a legal memorandum from independent counsel that outlined, among other matters: the duties of the Independent Directors and relevant requirements under the 1940 Act; the general principles under state law relevant to considering the approval of advisory contracts; an adviser's fiduciary duty with respect to advisory agreements and compensation; the standards used by courts in determining whether investment advisers and investment company boards of trustees have fulfilled their duties; and factors to be considered by the Independent Directors when voting on advisory agreements. During both executive sessions, independent legal counsel reviewed with Independent Directors these duties, standards and factors summarized in the legal memorandum described above. The following paragraphs summarize the material information and factors considered by the Board and the Independent Directors, as well as the Directors' conclusions relative to such factors.
Nature, Extent and Quality of Services. The Board and the Independent Directors considered information provided by the Adviser in response to their requests, as well as information provided throughout the year regarding: the Adviser and its staffing in connection with the Fund, including the Fund's portfolio managers and the senior analysts supporting them; the scope of services supervised and provided by the Adviser; and the absence of any significant service problems reported to the Board. The Board and the Independent Directors noted the experience, length of service and the outstanding reputation of the Fund's portfolio managers: Tom
61
FPA NEW INCOME, INC.
APPROVAL OF INVESTMENT ADVISORY AGREEMENT (Continued)
(Unaudited)
Atteberry, who has been with the Adviser since 1997 and has served as portfolio manager since 2004 and Abhijeet V. Patwardhan, who joined the Adviser in 2010 and has served as portfolio manager since 2015. After discussion, the Board and the Independent Directors concluded that the nature, extent and quality of services provided by the Adviser have benefited and should continue to benefit the Fund and its shareholders.
Investment Performance. The Board and the Independent Directors reviewed the overall investment performance of the Fund. The Directors also received information from an independent consultant, Broadridge, regarding the Fund's performance relative to a peer group of alternative credit focus funds selected by Broadridge (the "Peer Group"). The Board and the Independent Directors considered the Adviser's representation that the Fund's investment style, as evidenced by the short-term duration of most of its portfolio securities, as well as the Fund's flexibility to invest in a variety of areas, complicated Peer Group comparisons in that the Fund is managed in a more conservative style than the typical fixed income fund and the funds in the Peer Group. The Board and the Independent Directors noted the Fund's absolute investment results and its long-term investment performance when compared to the Peer Group. The Board and the Independent Directors noted the Fund outperformed its Peer Group median for the one-, three-, and five-year periods ending March 31, 2020, and underperformed its Peer Group for the ten-year periods ending March 31, 2020. The Board and the Independent Directors also noted that the Fund underperformed the comparative Barclays Capital U.S. Aggregate Index for the one-, three-, five-, and ten-year periods ending March 31, 2020. They also noted that Morningstar has continued to give the Fund a "Bronze" Analyst Rating. After discussion, the Board and the Independent Directors determined that the Fund's investment results were reasonable in light of the Fund's objectives and concluded that the Adviser's continued management of the Fund should benefit the Fund and its shareholders.
Advisory Fees and Fund Expenses; Comparison with Peer Group and Institutional Fees. The Board and the Independent Directors considered information provided by the Adviser regarding the Fund's advisory fees and total expense levels. The Board and the Independent Directors reviewed comparative information regarding fees and expenses for the Peer Group. The Board and the Independent Directors noted that the Fund's advisory fee was slightly above the Peer Group median and its overall net expense ratio was equal to that of the Peer Group median. In addition, the Directors noted that the fee rate charged to the Fund is higher than institutional accounts managed in a similar style by the portfolio managers but considered the Adviser's discussion of the differences between the services provided by the Adviser to the Fund and those provided by the Adviser to the institutional accounts. The Board and the Independent Directors concluded that the continued payment of advisory fees and expenses by the Fund to the Adviser was fair and reasonable and should continue to benefit the Fund and its shareholders.
Adviser Profitability and Costs. The Board and the Independent Directors considered information provided by the Adviser regarding the Adviser's costs in providing services to the Fund, the profitability of the Adviser and the benefits to the Adviser from its relationship to the Fund. They reviewed and considered the Adviser's representations regarding its assumptions and methods of allocating certain costs, such as personnel costs, which constitute the Adviser's largest operating cost, overhead and trading costs with respect to the provision of investment advisory services. The Independent Directors discussed with the Adviser the general process through which individuals' compensation is determined and then reviewed by the management committee of the Adviser, as well as the Adviser's methods for determining that its compensation levels are set at appropriate levels to attract and retain the personnel necessary to provide high quality professional investment advice. In evaluating the Adviser's profitability, they excluded certain distribution and marketing-related expenses. The Board and the
62
FPA NEW INCOME, INC.
APPROVAL OF INVESTMENT ADVISORY AGREEMENT (Continued)
(Unaudited)
Independent Directors recognized that the Adviser is entitled under the law to earn a reasonable level of profits for the services that it provides to the Fund. The Board and the Independent Directors concluded that the Adviser's level of profitability from its relationship with the Fund did not indicate that the Adviser's compensation was unreasonable or excessive.
Economies of Scale and Sharing of Economies of Scale. The Board and the Independent Directors considered whether there have been economies of scale with respect to the management of the Fund, whether the Fund has appropriately benefited from any economies of scale, and whether the fee rate is reasonable in relation to the Fund's asset levels and any economies of scale that may exist. The Board and the Independent Directors considered the Adviser's representation that its internal costs of providing investment management services to the Fund have significantly increased in recent years as a result of a number of factors, including the Adviser's substantial investment in additional professional resources and staffing. The Board and the Independent Directors considered both quantitative and qualitative information regarding the Adviser's representation that it has also made significant investments in: (1) the two portfolio managers, five analysts, traders and other investment personnel who assist with the management of the Fund; (2) new compliance, operations, and administrative personnel; (3) information technology, portfolio accounting and trading systems; and (4) office space, each of which enhances the quality of services provided to the Fund. The Board and the Independent Directors also considered the Adviser's willingness to close funds to new investors when it believed that a fund may have limited capacity to grow or that it otherwise would benefit fund shareholders. The Board noted that the Fund does not charge sales loads..
The Board and the Independent Directors recognized that the advisory fee rate schedule for the Fund does not have breakpoints. They considered that many mutual funds have breakpoints in the advisory fee structure as a means by which to share in the benefits of potential economies of scale as a fund's assets grow. They also considered that not all funds have breakpoints in their fee structures and that breakpoints are not the exclusive means of sharing potential economies of scale. The Board and the Independent Directors considered the Adviser's statement that it believes that breakpoints currently remain inappropriate for the Fund given the ongoing investments the Adviser is making in its business for the benefit of the Fund, uncertainties regarding the direction of the economy, rising inflation, increasing costs for personnel and systems, and growth or contraction in the Fund's assets, all of which could negatively impact the profitability of the Adviser. The Board and the Independent Directors also noted that the Adviser has contractually agreed to reimburse the Fund for Total Annual Fund Operating Expenses in excess of 0.50% of the average daily net assets of the Fund (excluding brokerage fees and commissions, interest, taxes, shareholder service fees, fees and expenses of other funds in which the Fund invests, and extraordinary expenses) through January 31, 2021. The Board and the Independent Directors concluded that the Fund is benefitting from the ongoing investments made by the Adviser in its team of personnel serving the Fund and in the Adviser's service infrastructure, and that in light of these investments, the addition of breakpoints in the Fund's advisory fee structure was not warranted at current asset levels.
Ancillary Benefits. The Board and the Independent Directors considered other actual and potential benefits to the Adviser from managing the Fund, including the acquisition and use of research services with commissions generated by the Fund, in concluding that the contractual advisory and other fees are fair and reasonable for the Fund. They noted that the Adviser does not have any affiliates that benefit from the Adviser's relationship to the Fund..
63
FPA NEW INCOME, INC.
APPROVAL OF INVESTMENT ADVISORY AGREEMENT (Continued)
(Unaudited)
Conclusions. The Board and the Independent Directors determined that the Fund continues to benefit from the services of the Adviser's highly experienced portfolio management team, which has produced reasonable long-term returns. In addition, the Board and the Independent Directors agreed that the Fund continues to receive high quality services from the Adviser. The Board and the Independent Directors concluded that the current advisory fee rate is reasonable and fair to the Fund and its shareholders in light of the nature and quality of the services provided by the Adviser and the Adviser's profitability and costs. The Board and the Independent Directors also noted their intention to continue monitoring the factors relevant to the Adviser's compensation, such as changes in the Fund's asset levels, changes in portfolio management personnel and the cost and quality of the services provided by the Adviser to the Fund. On the basis of the foregoing, and without assigning particular weight to any single factor, none of which was dispositive, the Board and the Independent Directors concluded that it would be in the best interests of the Fund to continue to be advised and managed by the Adviser and determined to approve the continuation of the current Advisory Agreement for another one-year period through September 30, 2021.
64
FPA NEW INCOME, INC.
PRIVACY POLICY
The following is the privacy notice of the mutual funds managed by First Pacific Advisors, LP ("FPA", and the mutual funds, the "FPA Funds" ). A complete list of funds is provided below.
The FPA Funds take privacy seriously and consider privacy to be a fundamental aspect of its relationships with its former, prospective and current investors. The FPA Funds are committed to maintaining the confidentiality, integrity and security of its former, current, and prospective investors' non-public personal information and other personal information. This privacy policy describes our privacy practices surrounding the collection and sharing of non-public personal information and other personal information of current, former and prospective investors and visitors to websites maintained by the FPA Funds.
Obtaining Personal Data. While providing investors and/or prospective investors (collectively, "investors") with products and services, the FPA Funds, and certain service providers, such as the FPA Fund's Transfer Agents and/or Administrators, may obtain personal data about such investors, which may come directly from the investor or their intermediaries from sources such as: (i) account applications, subscription agreements and other forms, (ii) written, electronic or verbal correspondence, (iii) investor transactions, (iv) an investor's brokerage or financial advisory firm, financial advisor or consultant, and/or (v) from information captured on applicable websites, including information you may voluntarily provide when you subscribe to receive FPA's quarterly updates or request us to mail you information about the FPA Funds. In addition, the FPA Funds may collect additional personal data from different sources, such as affiliates or their service providers; public websites or other publicly available sources such as government records; or from credit reporting agencies, sanctions screening databases, or from sources designed to detect and prevent fraud.
The personal data collected about an investor may include: (i) identifiers and similar information such as the investor's name, address, tax identification number, birth date, driver's license number, and potentially email address and phone number (if provided); (ii) certain information protected under other federal or state law, like an investor's signature or bank account information; (iii) characteristics of protected classifications under federal or state law, like gender or marital status; (iv) commercial information like an investment selection, beneficiary information, or transaction and account history with the FPA Funds; (v) internet or other electronic network activity like interactions with the FPA website; (vi) professional or employment-related information like an investor's occupation and job title; and (vii) inferences drawn from the other categories to build a profile on an investor to, for example, gauge an investor's potential interest in investing in new funds or products.
Respecting Your Privacy. The FPA Funds do not disclose any personal data provided by investors or gathered by the FPA Funds to third parties, except as required or permitted by law or as necessary for such third parties to perform their agreements with respect to the FPA Funds. Non-affiliated companies may from time to time be used to provide certain services, such as maintaining investor accounts, preparing and mailing prospectuses, reports, account statements and other information, and gathering shareholder proxies. The FPA Funds may also provide an investor's personal data and account information to the investor's respective custodian, brokerage or financial advisory firm and/or financial advisor or consultant.
Sharing Information with Third Parties. The FPA Funds reserve the right to report or disclose personal data or account information to third parties in circumstances where the FPA Funds believe in good faith that disclosure is required or permitted under law, to cooperate with regulators or law enforcement authorities, to protect their rights or property, or upon reasonable request by the FPA Funds in which an investor has invested. In addition, the FPA Funds may disclose information about an investor or an investor's accounts to a third party at the investor's request or direction or with the consent of the investor.
65
FPA NEW INCOME, INC.
PRIVACY POLICY
(Continued)
Procedures to Safeguard Private Information. The FPA Funds will take reasonable steps and use security measures appropriate to the nature of the information and that comply with applicable laws to protect investors' personal data against unauthorized access and exfiltration, acquisition, theft, or disclosure. In addition to this policy, the FPA Funds have implemented internal procedures that are designed to help guard investors' personal data. Given the nature of information security, there is no guarantee that such safeguards will always be successful.
Information Collected Automatically from Websites. When you visit a website maintained by the FPA Funds, those sites may collect certain information about that visit through automated tools, including cookies. Cookies are bits of data that a website sends to a web browser on a visitor's computer. Websites maintained by the FPA Funds use cookies and other tools to operate the websites and collect analytics information about your visit to our websites, including the number of visitors to a website and the webpages visited. These tools may be provided by third party analytics providers. The analytics information collected does not identify a particular individual visitor or user. You can change your cookie preferences by changing the setting on your web browser to delete or reject cookies. If you delete or reject cookies, some website pages may not function properly. The FPA Funds website does not respond to "do not track" signals.
Links to Other Websites. This privacy policy only addresses the use and disclosure of personal data in conjunction with your use of websites maintained by the FPA Funds. These websites may contain links to other websites. If we create such a link, we will let you know when you are leaving the FPA website. These third-party websites may collect information, including personal data, from you. Please be aware that we are not responsible for the privacy practices or the content of third-party websites. We disclaim liability for any information, materials, products or services offered at any of the third-party sites linked to websites maintained by the FPA Funds. The availability of a link to another party's website is provided as a convenience, but it does not constitute an endorsement or sponsorship of any third party or their products, and does not create an affiliation or partnership between FPA and any third party. You should also be aware that third parties have different privacy policies than FPA and may have different information security practices. We encourage you to read the privacy statements provided by other websites before you provide personal data to them.
Changes to the Privacy Policy. From time to time, the FPA Funds may update or revise this privacy policy. If there are changes to the terms of this privacy policy, documents containing the revised policy on the relevant website will be updated.
FPA Funds. FPA Capital Fund, Inc., FPA Crescent Fund, FPA New Income, Inc., FPA Flexible Fixed Income Fund, FPA U.S. Value Fund, Inc., FPA Queens Road Value Fund, FPA Queens Road Small Cap Value Fund, and Source Capital, Inc.
Revised: November 2020
66
FPA NEW INCOME, INC.
DIRECTOR AND OFFICER INFORMATION
(Unaudited)
Sandra Brown, Mark L. Lipson, Alfred E. Osborne, Jr., A. Robert Pisano, and Patrick B. Purcell are all Directors of the Fund who are not "interested persons" of the Fund, as that term is defined in the 1940 Act (collectively, the "Independent Directors"). Directors serve until their resignation, removal or retirement. The Statement of Additional Information includes additional information about the Directors and is available, without charge, upon request by calling (800) 982-4372.
Name, Address(1)
and Year of Birth | | Position(s)
Held with
the Fund | | Year First
Elected as
Director of
the Fund | | Principal Occupation(s)
During the
Past Five Years | | Number of
FPA Funds
Overseen
by Director | | Other
Directorships
Held by Director
During the Past
Five Years | |
Independent Directors | |
Sandra Brown,
1955 | | Director | | 2016 | | Consultant (since 2009). Formerly, CEO and President of Transamerica Financial Advisers, Inc. (1999-2009); President, Transamerica Securities Sales Corp. (1998-2009); Vice President, Bank of America Mutual Fund Administration (1990-1998). Director/Trustee of FPA Capital, Inc., FPA Funds Trust, FPA New Income, Inc., FPA Paramount Fund, Inc., FPA U.S. Value Fund, Inc. and Source Capital, Inc. (since October 2016). | | 8 | | None | |
Mark L. Lipson,
1949 | | Director & Chairman | | 2015 | | Registered Investment Adviser, ML2 Advisors, LLC (since 2014). Formerly Managing Director, Bessemer Trust (2007-2014) and US Trust (2003-2006); Chairman and CEO of the Northstar Mutual Funds (1993-2001); and President and CEO of the National Mutual Funds (1988-1993). Director/Trustee of FPA Capital, Inc., FPA Funds Trust, FPA New Income, Inc., FPA Paramount Fund, Inc., FPA U.S. Value Fund, Inc. and Source Capital, Inc. (since October 2015). | | 8 | | None | |
Alfred E. Osborne, Jr.,
1944 | | Director | | 1999 | | Senior Associate Dean, (since July 2003), Interim Dean (July 2018-June 2019), Professor and Faculty Director Price Center for Entrepreneurship and Innovation at the John E. Anderson School of Management at UCLA. Dr. Osborne has been at UCLA since 1972. Director/Trustee of FPA Capital Fund, Inc. and FPA New Income, Inc. (since 1999), of FPA Funds Trust (since 2002), of FPA Paramount Fund, Inc., FPA U.S. Value Fund, Inc. and Source Capital, Inc. (since 2013). | | 8 | | Kaiser Aluminum and Wedbush Capital | |
67
FPA NEW INCOME, INC.
DIRECTOR AND OFFICER INFORMATION (Continued)
(Unaudited)
Name, Address(1)
and Year of Birth | | Position(s)
Held with
the Fund | | Year First
Elected as
Director of
the Fund | | Principal Occupation(s)
During the
Past Five Years | | Number of
FPA Funds
Overseen
by Director | | Other
Directorships
Held by Director
During the Past
Five Years | |
A. Robert Pisano,
1943 | | Director | | 2013 | | Consultant (since 2012). Formerly, President and Chief Operating Officer of The Motion Picture Association of America, Inc. (October 2005-2011). Formerly, National Executive Director and Chief Executive Officer of The Screen Actors Guild (2001-2005). Director/Trustee of FPA Paramount Fund, Inc. and FPA U.S. Value Fund, Inc. (since 2012), and of FPA Capital, Inc., FPA Funds Trust, FPA New Income, Inc. and Source Capital, Inc. (since 2013). | | 8 | | Resources Global Professionals | |
Patrick B. Purcell,
1943 | | Director | | 2006 | | Retired (since 2000). Formerly, Consultant to Paramount Pictures 1998-2000; Executive Vice President, Chief Financial and Administrative Officer of Paramount Pictures (1983-1998). Director/Trustee of FPA Capital, Inc., FPA Funds Trust and FPA New Income, Inc. (since 2006), of Source Capital, Inc. (since 2010), of FPA U.S. Value Fund, Inc. and FPA Paramount Fund, Inc. (since 2012). | | 8 | | None | |
"Interested" Director(2) | |
J. Richard Atwood,
1960 | | Director | | 2016 | | Director and President of FPA GP, Inc., the General Partner of the Adviser (since October 2018). Director/Trustee of each FPA Fund (since 2016). President of each FPA Fund (since 2015). Formerly, Managing Partner of FPA (2006-2018). Formerly, until 2015, Treasurer of each FPA Fund for more than the past five years. | | 8 | | None | |
(1) The address of each Director is 11601 Wilshire Boulevard, Suite 1200, Los Angeles, California 90025.
(2) "Interested person" within the meaning of the 1940 Act by virtue of their affiliation with the Fund's Adviser.
68
FPA NEW INCOME, INC.
DIRECTOR AND OFFICER INFORMATION (Continued)
(Unaudited)
Officers of the Fund. Officers of the Fund are elected annually by the Board.
Name, Address(1)
and Year of Birth | | Position
with Fund | | Year First
Elected as
Officer of the
Fund | | Principal Occupation(s)
During the Past Five Years | |
Thomas. H. Atteberry,
1953 | | Vice President and Portfolio Manager | | 2004 | | Partner of FPA. Formerly Chief Executive Officer of FPA New Income (until February 2015). Vice president and Portfolio Manager of FPA New Income (since 2004). | |
Abhijeet Patwardhan,
1979 | | Vice President and Portfolio Manager | | 2015 | | Partner (since January 2017) and a Director of Research (since April 2015) of FPA; Managing Director of FPA from November 2015 to January 2017, Senior Vice President of FPA from January 2014 to November 2015; Analyst and Vice President of FPA from June 2010 to December 2013. Vice President and Portfolio Manager of FPA Flexible Fixed Income Fund (since December 2018). | |
J. Richard Atwood,
1960 | | President | | 1997 | | Director and President of FPA GP, Inc., the General Partner of FPA (since October 2018). Director/Trustee of each FPA Fund (since May 2016). President of each FPA Fund (since February 2015). Formerly, Managing Partner of FPA (2006-2018). Formerly, until February 2015, Treasurer of each FPA Fund for more than the past five years. | |
Karen E. Richards,
1969 | | Chief Compliance Officer | | 2019 | | Chief Compliance Officer of FPA (since August 2018). Formerly, Deputy Chief Compliance Officer of First Republic Investment Management, LLC (from February 2016 to March 2018), and Vice President, Senior Compliance Officer of Pacific Investment Management Company (from June 2010 to January 2016). | |
E. Lake Setzler III,
1967 | | Treasurer | | 2006 | | Senior Vice President (since January 2013) and Controller of FPA; and Treasurer of each FPA Fund (since February 2015). Formerly, until February 2015, Assistant Treasurer of each FPA Fund (February 2006 to February 2015). | |
Rebecca D. Gilding,
1979 | | Secretary | | 2019 | | Vice President and Counsel, State Street Bank and Trust Company (since April 2016). Formerly, Assistant Vice President and Associate Counsel, Brown Brothers Harriman & Co. (September 2013 to April 2016). | |
(1) The address for each Officer (except Ms. Gilding) is 11601 Wilshire Boulevard, Suite 1200, Los Angeles, California 90025. Ms. Gilding address is State Street Bank and Trust Company, One Lincoln Street, Boston, Massachusetts 02111.
69
FPA NEW INCOME, INC.
(Unaudited)
INVESTMENT ADVISER
First Pacific Advisors, LP
11601 Wilshire Boulevard, Suite 1200
Los Angeles, CA 90025
TRANSFER & SHAREHOLDER SERVICE AGENT
UMB Fund Services, Inc.
P.O. Box 2175
Milwaukee, WI 53201-2175
or
235 West Galena Street
Milwaukee, WI 53212-3948
(800) 638-3060
CUSTODIAN AND ADMINISTRATOR
State Street Bank and Trust Company
One Lincoln Street
Boston, Massachusetts 02111
TICKER SYMBOL: FPNIX
CUSIP: 302544101
DISTRIBUTOR
UMB Distribution Services, LLC
235 West Galena Street
Milwaukee, Wisconsin 53212-3948
LEGAL COUNSEL
Dechert LLP
One Bush Street, Suite 1600
San Francisco, California 94104
INDEPENDENT REGISTERED PUBLIC ACCOUNTING FIRM
Ernst & Young LLP
725 South Figueroa Street
Los Angeles, California 90017
This report has been prepared for the information of shareholders of FPA NEW INCOME, INC., and is not authorized for distribution to prospective investors unless preceded or accompanied by an effective prospectus.
A description of the policies and procedures that the Adviser uses to vote proxies related to the Fund's portfolio securities is set forth in the Fund's Statement of Additional Information which is available without charge, upon request, on the Fund's website at www.fpa.com or by calling (800) 982-4372 and on the Securities and Exchange Commission's website at www.sec.gov.
The Fund's complete proxy voting record for the 12 months ended June 30, 2020 is available without charge, upon request by calling (800) 982-4372 and on the SEC's website at www.sec.gov.
The Fund's schedule of portfolio holdings, filed the first and third quarter of the Fund's fiscal year on Form N-PORT with the SEC, is available on the SEC's website at www.sec.gov.
Additional information about the Fund is available online at www.fpa.com. This information includes, among other things, holdings, top sectors, and performance, and is updated on or about the 15th business day after the end of each quarter.
Item 2. Code of Ethics.
| (a) | The registrant has adopted a code of ethics that applies to the registrant’s principal executive and financial officers. |
| | |
| (c) | During the period covered by this report, there were no amendments to the provisions of the code of ethics adopted in 2(a) above. |
| | |
| (d) | During the period covered by this report, there were not any implicit or explicit waivers to the provisions of the code of ethics adopted in 2(a). |
| | |
| (f) | A copy of the registrant’s code of ethics is filed as an exhibit to this Form N-CSR. |
Item 3. Audit Committee Financial Expert.
The registrant’s board of directors has determined that Patrick B. Purcell, who is a member of the registrant’s audit committee and board of directors, is an “audit committee financial expert” and is “independent,” as those terms are defined in this Item. This designation will not increase the designee’s duties, obligations or liability as compared to his duties, obligations or liability as a member of the audit committee and of the board of directors. This designation does not affect the duties, obligations or liability of any other member of the audit committee or the board of directors.
Item 4. Principal Accountant Fees and Services.
| | | 2019 | | | 2020 | |
| (a) | Audit Fees | | $ | 34,800 | | | $ | 35,500 | |
| (b) | Audit Related Fees | | $ | -0- | | | $ | -0- | |
| (c) | Tax Fees(1) | | $ | 6,500 | | | $ | 6,600 | |
| (d) | All Other Fees | | $ | -0- | | | $ | -0- | |
(1) Tax Fees are for the preparation of the Fund’s tax return(s).
| (e)(1) | The audit committee shall pre-approve all audit and permissible non-audit services that the committee considers compatible with maintaining the independent auditors’ independence. The pre-approval requirement will extend to all non-audit services provided to the registrant, the adviser, and any entity controlling, controlled by, or under common control with the adviser that provides ongoing services to the registrant, if the engagement relates directly to the operations and financial reporting of the registrant; provided, however, that an engagement of the registrant’s independent auditors to perform attest services for the registrant, the adviser or its affiliates required by generally accepted auditing standards to complete the examination of the registrant’s financial statements (such as an examination conducted in accordance with Statement on Standards for Attestation Engagements Number 16, or a Successor Statement, issued by the American Institute of Certified Public Accountants), will be deem pre-approved if: |
| (i) | the registrant’s independent auditors inform the audit committee of the engagement, |
| | | |
| (ii) | the registrant’s independent auditors advise the audit committee at least annually that the performance of this engagement will not impair the independent auditor’s independence with respect to the registrant, and |
| | | |
| (iii) | the audit committee receives a copy of the independent auditor’s report prepared in connection with such services. The committee may delegate to one or more committee members the authority to review and pre-approve audit and permissible non-audit services. Actions taken under any such delegation will be reported to the full committee at its next meeting. |
| (e)(2) | 0% of the services provided to the registrant described in paragraphs b—d of this Item were approved by the Audit Committee pursuant to paragraph (c)(7)(i)(C) of Rule 2-01 of Regulation S-X. There were no services provided to the investment adviser or any entity controlling, controlled by or under common control with the adviser described in paragraphs (b) — (d) of this Item that were required to be pre-approved by the audit committee. |
| (f) | For the fiscal year ended September 30, 2020, if greater than 50%, specify the percentage of hours spent on the audit of the registrant's financial statements for the most recent fiscal year that were attributed to work performed by persons who are not full-time, permanent employees of the principal accountant Ernst & Young LLP (“EY”). According to EY, such amount was below 50%; therefore disclosure item not applicable to this filing. |
| (g) | For the fiscal years ended September 30, 2019 and September 30, 2020, the aggregate non-audit fees billed by EY for services rendered to the investment advisor were $41,250 and $43,500, respectively. |
| (h) | The registrant's Audit Committee has considered whether the provision of non-audit services that were rendered to the registrant's investment advisor, which were not pre-approved (not requiring pre-approval), is compatible with maintaining EY's independence. |
Item 5. Audit Committee of Listed Registrants.
Not applicable.
Item 6. Investments.
| (a) | Schedule of Investments is included as a part of the report to shareholders filed under Item 1 of this Form N-CSR. |
| | |
| (b) | Not applicable. |
Item 7. Disclosure of Proxy Voting Policies and Procedures for Closed-End Management Investment Companies.
Not applicable.
Item 8. Portfolio Managers of Closed-End Management Investment Companies.
Not applicable.
Item 9. Purchases of Equity Securities by Closed-End Management Investment Company and Affiliated Purchasers.
Not applicable.
Item 10. Submission of Matters to a Vote of Security Holders.
There have been no material changes to the procedures by which the shareholders may recommend nominees to the registrant’s board of directors.
Item 11. Controls and Procedures.
| (a) | The principal executive officer and principal financial officer of the registrant have concluded that the registrant’s disclosure controls and procedures (as defined in Rule 30a-3(c) under the Investment Company Act of 1940) are effective based on their evaluation of the disclosure controls and procedures as of a date within 90 days of the filing date of this report. |
| (b) | There have been no significant changes in the registrant’s internal controls over financial reporting (as defined in Rule 30a-3(d) under the Investment Company Act of 1940) that occurred during the registrant’s second fiscal quarter of the period covered by this report that have materially affected, or is reasonably likely to materially affect, the registrant’s internal controls over financial reporting. |
Item 12. Disclosure of Securities Lending Activities for Closed-End Management Investment Companies
Not applicable.
Item 13. Exhibits.
SIGNATURES
Pursuant to the requirements of the Securities Exchange Act of 1934 and the Investment Company Act of 1940, the registrant has duly caused this report to be signed on its behalf by the undersigned, thereunto duly authorized.
FPA NEW INCOME, INC.
| By: | /s/ J. Richard Atwood | |
| | J. Richard Atwood | |
| | President (principal executive officer) | |
Date: December 7, 2020
Pursuant to the requirements of the Securities Exchange Act of 1934 and the Investment Company Act of 1940, this report has been signed below by the following persons on behalf of the registrant and in the capacities and on the dates indicated.
| By: | /s/ J. Richard Atwood | |
| | J. Richard Atwood | |
| | President (principal executive officer) | |
Date: December 7, 2020
| By: | /s/ E. Lake Setzler III | |
| | E. Lake Setzler III | |
| | Treasurer (principal financial officer) | |
Date: December 7, 2020