UNITED STATES
SECURITIES AND EXCHANGE COMMISSION
Washington, D.C. 20549
FORM N-CSR
CERTIFIED SHAREHOLDER REPORT OF REGISTERED
MANAGEMENT INVESTMENT COMPANIES
Investment Company Act file number | 811-01735 |
|
FPA NEW INCOME, INC. |
(Exact name of registrant as specified in charter) |
|
11601 WILSHIRE BLVD., STE. 1200 LOS ANGELES, CALIFORNIA | | 90025 |
(Address of principal executive offices) | | (Zip code) |
|
(Name and address of agent for service) J. RICHARD ATWOOD, PRESIDENT FPA NEW INCOME, INC. 11601 WILSHIRE BLVD., STE. 1200 LOS ANGELES, CALIFORNIA 90025 | Copy to: MARK D. PERLOW, ESQ. DECHERT LLP ONE BUSH STREET, STE. 1600 SAN FRANCISCO, CA 94104 |
|
Registrant’s telephone number, including area code: | (310) 473-0225 | |
|
Date of fiscal year end: | September 30 | |
|
Date of reporting period: | September 30, 2019 | |
| | | | | | | | | |
Item 1: Report to Shareholders.

Distributor:
UMB DISTRIBUTION SERVICES, LLC
235 West Galena Street
Milwaukee, Wisconsin 53212
Beginning on January 1, 2021, as permitted by regulations adopted by the Securities and Exchange Commission, we intend to no longer mail paper copies of the Fund's shareholder reports, unless you specifically request paper copies of the reports from the Fund or from your financial intermediary, such as a broker-dealer or bank. Instead, the reports will be made available on the FPA Funds website (fpa.com/funds), and you will be notified by mail each time a report is posted and provided with a website link to access the report. If you already elected to receive shareholder reports electronically, you will not be affected by this change and you need not take any action. If you prefer to receive shareholder reports and other communications electronically, you may update your mailing preferences with your financial intermediary, or enroll in e-delivery at fpa.com (for accounts held directly with the Fund).
You may elect to continue to receive paper copies of all future reports free of charge. If you invest through a financial intermediary, you may contact your financial intermediary to request that you continue to receive paper copies of your shareholder reports. If you invest directly with the Fund, you may inform the Fund that you wish to continue receiving paper copies of your shareholder reports by contacting us at (800) 638-3060. Your election to receive reports in paper will apply to all funds held with the FPA Funds or through your financial intermediary.
FPA NEW INCOME, INC.
LETTER TO SHAREHOLDERS
Dear Fellow Shareholders,
FPA New Income, Inc. (the "Fund") returned 0.83% in the third quarter of 2019 and 3.35% year-to-date.
As of September 30, the portfolio had a yield-to-worst of 2.63% and an effective duration of 1.75 years.1 The yield curve,2 as measured by the difference between 10-year and 3-month Treasuries, remains inverted and became slightly more so during the quarter despite two 25-basis-point (bps) interest rate cuts by the Federal Reserve as growing recession concerns overwhelmed the Fed's efforts to ease monetary policy. Overall, Treasury yields declined during the quarter, including a decrease of 15 bps for two- to three-year maturities, the target duration of the Fund. Lower rates slightly shorten the duration of our investment opportunity set going forward. High-yield and other credit investments (defined as investments rated BBB or lower) remain expensive. However, we deployed a small amount of capital within credit, increasing the portfolio's credit exposure to 5.8% on September 30, up from 5.2% on June 30. Cash and equivalents were 4.0% of the portfolio as of September 30 versus 8.4% at June 30.
Portfolio Attribution3
The largest and third-largest contributors to performance during the third quarter were equipment asset-backed securities (ABS) and ABS backed by auto loans (mostly prime-quality loans), respectively. The return on both derived mostly from coupon payments, with both also benefiting somewhat from higher prices amid lower Treasury yields and spreads. Notably, equipment and auto loan ABS were large contributors to performance because they are relatively large holdings in the portfolio, not because of a particularly large total return on the investments. The second-largest contributors to performance were corporate bank debt and bonds (predominantly rated BBB or lower) due to a combination of coupon payments and fundamental performance-driven price changes.
1 Yield-to-worst is the lowest possible yield that can be received on a bond without the issuer defaulting. It does not represent the yield that an investor should expect to receive, gross of management fees and expenses. As of September 30, 2019, the Fund's subsidized/unsubsidized 30-Day SEC Standardized Yield ("SEC Yield") was 2.59%/2.46% respectively. The SEC Yield calculation ia an annualized measure of the Fund's dividend and interest payments for the last 30 days, less the Fund expenses. Subsidized yield reflects fee waivers and/or expense reimbursements during the period. Without waivers and/or reimbursements, yields would be reduced. Unsubsidized yield does not adjust for any fee waivers and/or expense reimbursements in effect. The SEC Yield calculation is based on the price of the Fund at the beginning of the month. The SEC Yield calculation shows investors what they would earn in yield over the course of a 12-month period if the fund continued earning the same rate for the rest of the year. Duration is a measure of the sensitivity of the price (the value of principal) of a fixed-income investment to a change in interest rates.
2 A yield curve is a line that plots the interest rates, at a set point in time, of bonds having equal credit quality but differing maturity dates. An inverted yield curve means the short-term yields were higher than the long-term yields.
3 See appendix for additional information pertaining to attribution for the fiscal year ending September 30, 2019. Top contributors and detractors to the Fund's performance are based on contribution to return for the periods noted. This information is not a recommendation for a specific security or sector and these securities/sectors may not be in the Fund at the time you receive this report. The information provided does not reflect all positions purchased, sold or recommended by FPA during the quarter. A copy of the methodology used and a list of every sector's contribution to the overall Fund's performance during the quarter is available by contacting FPA at crm@fpa.com. The portfolio holdings as of the most recent quarter-end may be obtained at www.fpa.com.
Past performance is no guarantee, nor is it indicative, of future returns.
1
FPA NEW INCOME, INC.
LETTER TO SHAREHOLDERS
(Continued)
From a sector standpoint, there were no meaningful detractors from performance during the quarter. However, within our corporate holdings, our investment in an energy-related company called PHI, Inc. ("PHI") detracted from performance. We have referenced PHI in the past and provide more background on this investment below.
Portfolio Activity4
The table below shows the portfolio's exposures as of September 30, 2019 compared to June 30, 2019:
| | | % Portfolio
9/30/2019 | | % Portfolio
6/30/2019 | | Quarter/Quarter
Change (bps)5 | |
ABS | | | 51.2 | % | | | 47.9 | % | | | 330 | | |
Mortgage Backed (CMO6) | | | 9.5 | % | | | 10.6 | % | | | -110 | | |
Stripped Mortgage-backed | | | 3.0 | % | | | 3.2 | % | | | -20 | | |
Corporate | | | 5.3 | % | | | 4.8 | % | | | 50 | | |
CMBS7 | | | 6.0 | % | | | 5.1 | % | | | 90 | | |
Mortgage Pass-through | | | 13.0 | % | | | 13.8 | % | | | -80 | | |
U.S. Treasury | | | 6.8 | % | | | 5.0 | % | | | 180 | | |
U.S. Agency | | | 1.2 | % | | | 1.2 | % | | | 0 | | |
Cash and equivalents | | | 4.0 | % | | | 8.4 | % | | | -440 | | |
Total | | | 100.0 | % | | | 100.0 | % | | | | | |
Yield-to-worst8 | | | 2.63 | % | | | 2.63 | % | | | 0 | | |
Effective Duration (years) | | | 1.75 | | | | 1.69 | | | | 0.06 | | |
Average Life9 (years) | | | 2.15 | | | | 2.08 | | | | 0.07 | | |
As shown in the chart below, Treasury yields declined during the quarter as a result of the two Federal Reserve interest rate cuts and because of growing recession concerns that drove yields lower elsewhere on the Treasury curve.
4 Portfolio composition will change due to ongoing management of the Fund.
5 Change in basis points (bps), except for effective duration and average life, which represents the change in years.
6 Collateralized mortgage obligations ("CMO") are mortgage-backed bonds that separate mortgage pools into different maturity classes.
7 Commercial mortgage-backed securities ("CMBS") are securities backed by commercial mortgages rather than residential mortgages.
8 Please refer to Footnote 1 for important information regarding Yield-to-Worst and SEC Yield.
9 The Average Life (years) is the average length of time that each dollar of unpaid principal on a loan, a mortgage or an amortizing bond remains outstanding.
Past performance is no guarantee, nor is it indicative, of future returns.
2
FPA NEW INCOME, INC.
LETTER TO SHAREHOLDERS
(Continued)
Treasury Yield Curves
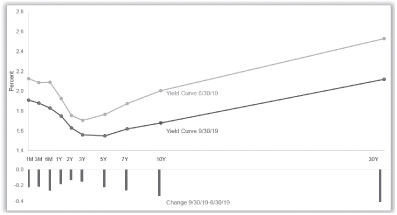
Source: Bloomberg. The yield curve for each period reflects Yield to Maturity (YTM). YTM is the rate of return anticipated on a bond if held until the end of its lifetime. YTM is considered a long-term bond yield expressed as an annual rate. The YTM calculation takes into account the bond's current market price, par value, coupon rate and time to maturity. It is also assumed that all coupon payments are reinvested at the same rate as the bond's current yield.
As described in more detail below, we see the market discerning among the tiers of risk. However, using the Bloomberg Barclays High Yield Index as a proxy, we also see that the overall price of risk was essentially unchanged during the quarter as the spread on that index decreased from 407 bps to 402 bps.
In short, from our perspective, nothing has changed: Credit, defined as investments rated BBB or lower, is expensive and we see value in extending duration as much as we can, subject to the limits of our duration test — a point of view that we have held for the past several quarters. Our duration test strives to identify the longest duration bonds that we expect will produce a breakeven total return over 12 months if yields rise by 100 bps during that timeframe. As outlined in more detail in our Q2 2019 commentary, actively managing and extending the duration in line with our duration test increases the portfolio's yield and reduces reinvestment risk. It also gives us short-term total return upside optionality if interest rates decline, while protecting the portfolio against the downside of short-term increases in market yields.
In line with this perspective, most of our investments during the quarter were high-quality bonds (rated A or higher) with an average duration of 2.25 years. These investments included ABS backed by prime-quality auto loans, Treasuries, equipment ABS, credit card ABS and non-agency CMBS. The purchases were funded using cash and equivalents, amortization and maturities of existing investments and the proceeds of sales of short-duration holdings, mostly within auto, credit card and equipment ABS. In total, this activity extended the Fund's
3
FPA NEW INCOME, INC.
LETTER TO SHAREHOLDERS
(Continued)
overall duration from 1.69 years to 1.75 years and increased the duration on our high-quality fixed rate holdings, which represented 88% of the portfolio at quarter-end, from 1.85 to 1.93 years.
Though credit overall is expensive, we sometimes find attractive investments. This quarter, we added to existing corporate bank debt positions and initiated two new bank debt positions. These investments are emblematic of the investments that make sense to us in this market — they are secured with significant collateral coverage and are in industries that are out of favor (such as retail lately).
Reflection on an Investment
For the past year, the Fund's investment in PHI has detracted from returns. Our assessment of the Company's value suggests that we should have had a positive outcome, but, because the former CEO made what we believe to be a series of bad decisions, the investment has not performed as expected. Nevertheless, we are holding onto the investment because we believe current prices understate its value. Along the way, the episode reminded us of a valuable lesson.
PHI is an owner and operator of helicopters that are used in two lines of business: emergency air medical transportation and offshore oil and gas transportation. We began investing in PHI's unsecured bonds in June 2017. Our investment thesis was that some combination of: 1) a large balance of cash and short-term investments, 2) the enterprise value of the two business units, and 3) the liquidation value of the Company's owned helicopters, provided sufficient value to support the repayment of the bonds.
For any debt investment, the borrower's ability to pay is necessary but not sufficient. The borrower should also have the willingness to pay. When we made the investment in PHI, we felt there was a willingness to pay because we believed the former CEO's interests were aligned with ours. The former CEO owned 20% of the economic value of the common stock, controlled the Company via his ownership of voting shares and, from what we could gather, had a significant portion of his net worth tied up in the stock. The former CEO had also historically reinvested in the business while taking out little in the form of dividends. Based on these data points, we assumed the former CEO would want to preserve his equity value by repaying the bonds.
Subsequent to the Fund's investment, the former CEO made decisions that in hindsight we should have recognized as signs of an unwillingness to repay the bonds, notably forsaking multiple opportunities to repay them. We made repeated attempts to work with PHI to address the bond maturity. But, we speculate that because of greed and/or misguided assumptions about his likelihood of success, the former CEO opted to not repay the debts of the company and, in March 2019, pursued that strategy further in bankruptcy court.
Bankruptcy-related expenses destroyed millions of dollars, but the former CEO's gambit did not work. Bondholders and other unsecured creditors ended up owning 100% of PHI's equity in exchange for extinguishing their claims against PHI.10 Moreover, bondholders (including the Fund) received the right to invest additional capital in exchange for equity at an attractive valuation, a right which we exercised. Lastly, the board of directors was replaced and the CEO retired.
Based on the September 30, 2019 net asset value of the Fund, our investment in PHI represented approximately 0.4% of the Fund. We think the investment is worth more than that, which is why we are retaining it.
10 Prior to dilution for management's equity and warrants to pre-petition equity holders. Overall with other accounts, FPA owns 14% of the equity prior to dilution as of September 30, 2019.
4
FPA NEW INCOME, INC.
LETTER TO SHAREHOLDERS
(Continued)
It's clear now that we misread the former CEO and gave him too much credit for being a good steward of capital. As bond investors, it is tempting to say that management is not as important as asset value, especially when the loan-to-value ratio is low and the margin of safety is high. Sometimes that is true. In situations like PHI, where our investment was unsecured and the margin of safety was not as high, management matters a lot. We may not have been able to identify the former CEO as a bad actor at the outset, but, looking back, we think we could have done a better job of scrutinizing his behavior over time and acted accordingly.
What is less clear is how this situation will ultimately play out. Our goal now is to maximize the value of this investment and the return on that capital, given the forward-looking risks. While we think it is possible to get our invested capital back, we will not pursue that path at the expense of underutilizing the capital we have invested.
In our offices, we have a wall where we maintain a list of lessons learned. PHI is the newest addition to this list. Though the story is still unfolding, regardless of the outcome, an important principle of investing was reinforced: Be vigilant about good management.
Market Commentary
The last two weeks of September revealed a problem in the financial plumbing of the U.S. banking system. Just before September 15, 2019, there was a very large demand for money in the financial system. That demand came from Treasury buyers who had to pay for a large issuance of Treasury bonds by the Federal government and corporations and other tax payers who needed money to make quarterly tax payments to the IRS. For this type of short-term need, investors typically tap the $1 trillion market for overnight repurchase agreements, or repos. A repo is a short-term loan typically collateralized by government securities. In today's market that loan should bear interest at a rate of 2%-2.25% but, on the days in question, a shortage of lenders (i.e., supply of money) pushed the rate to 9%+ for some borrowers.
On the surface, it seems like the market should be flush with cash. The U.S. banking system has about $1.4 trillion in excess reserves,11 an amount that ostensibly gave the Federal Reserve comfort that the banking system had excess liquidity. For the reasons outlined below, however, that liquidity has proven to be illusory:
• It is estimated that upwards of 50% of those excess reserves are housed in four systemically important financial institutions. That means market liquidity is dictated by the decisions and the situational idiosyncrasies of the few, rather than the decisions of many.
• Interest on excess reserves (IOER), which is the interest rate the Federal Reserve offers to banks on their excess reserves, is 1.7%. That makes it worthwhile for some would-be lenders to keep their money with the Fed rather than make it available to the market.
• New bank regulations such as Dodd Frank and Basel III mandating specified amounts of high-quality liquid assets (HQLA) sop up excess reserves because these reserves count as HQLA. That further limits the availability of money to the market. The result is that the estimated $1 trillion in excess reserves are in fact not excess — they may be needed to fulfill these new regulatory requirements.
To add liquidity and address the mismatch between supply and demand for money, the Federal Reserve Bank created overnight and term repo facilities as a short-term fix. As a long-term fix, there are three options: 1) ease bank regulations; 2) create a permanent repo facility; or 3) use quantitative easing (QE)12 to create more
11 Source: The Federal Reserve as of 9/18/2019.
12 Quantitative Easing (QE) is an unconventional monetary policy in which a central bank purchases government securities or other securities from the market in order to lower interest rates and increase the money supply.
5
FPA NEW INCOME, INC.
LETTER TO SHAREHOLDERS
(Continued)
excess reserves. Option 1 seems like a long shot (at least in the near term), so the Federal Reserve (the "Fed") is left with options 2 and 3. The Fed recently chose option 3. However, in an attempt to avoid impacting asset prices and to dispel the perception that the central bank is funding the government through bond purchases, Federal Reserve Chairman Jerome Powell clarified that the Fed would purchase Treasury bills. He also went to great lengths to explain that this tool was not a reengagement of QE but just a means to inject short-term liquidity into the financial system. As a side note, by purchasing Treasury Bills, the Fed may also help steepen the yield curve.13 Conversely, if the Fed purchased longer maturity Treasury notes or bonds it could make it harder to steepen the yield curve.
Despite over 10 years of economic expansion and a multi-trillion-dollar QE program, the financial system still seems fragile in certain areas. This is surprising given all that has been done to make the financial system supposedly resilient to financial shocks. Are we at a point where the central bank is permanently involved as a primary provider of liquidity to the system because the system itself can't provide it at a reasonable price? Further, if the financial system has periods of illiquidity now during times of solid economic activity, what will happen if/when the economy takes a downturn and there is a significant repricing of credit risk? This situation — and the seeming passivity of the Fed — does not give us comfort. The reasons for the surge in demand for money (e.g., Treasury bond purchases and tax payments) are not surprising events, and in fact, had been identified in advance by multiple market participants. The tax payments happen every quarter and the size and timing of the Treasury auction settlement has been known for some time given the visibility of large fiscal deficits, yet the Fed appeared unprepared for the spike in repo rates. In fact, the repo facility announcement had to be delayed because of technical problems in implementing the facility. We see these problems as warning signs of potential future liquidity problems. Therefore, we strive to have sufficient liquidity to weather the liquidity shortage that could occur during the next economic downturn.
In March of 2018, we wrote a special commentary entitled, "Rare Bond Market Conditions Set Up Complacent Investors for Subpar Returns," in which we discussed the risks to the credit markets associated with flat yield curves, narrow credit spreads and low yields on credit securities. Eighteen months later, that situation still exists and it makes us nervous. We may not be alone in that concern.
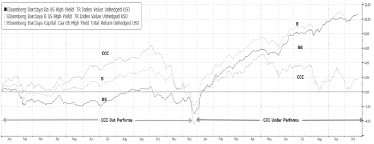
The graph below shows the returns for the BB, B and CCC components of the Bloomberg Barclays High-Yield Index since December 31, 2017 through October 24, 2019.
13 A steepening yield curve typically indicates that investors expect rising inflation and stronger economic growth.
6
FPA NEW INCOME, INC.
LETTER TO SHAREHOLDERS
(Continued)
Source: Bloomberg. Chart data from 12/31/17-10/24/19. High Yield (HY) refers to high paying bonds with a lower credit rating (typically rated BB and below) than investment-grade corporate bonds, Treasury bonds and municipal bonds. Because of the higher risk of default, these bonds pay a higher yield than investment grade bonds.
Up until the final month of 2018, the CCC component was the best performer. Since the beginning of 2019, the CCC cohort has lagged the others. In the last several months, the performance of the BB portion of the index surpassed that of the single B component. Since December 31, 2017 through October 24, 2019, the return on the CCC portion of the index has been only 1.82%. These are indications that investors are favoring higher quality high-yield bonds. That supports the idea that when a flat yield curve persists, credit securities start to falter.
Per Standard & Poor's, a CCC-rated bond is defined as "an obligation ... currently vulnerable to nonpayment and is dependent upon favorable business, financial, and economic conditions for the obligor to meet its financial commitments on the obligation. In the event of adverse business, financial, or economic conditions, the obligor is not likely to have the capacity to meet its financial commitments on the obligation." The CCC-rated segment of the high-yield market needs a growing economy to assist in supporting its highly levered capital structure as well as a very active and robust capital market to refinance its debt. Yet the future availability of that critical capital is unclear. High-yield bond issuance is up this year versus last year, supported by inflows into high-yield mutual funds and ETFs.14 Leveraged loan issuance is down this year versus last year because of outflows from leveraged loan mutual funds and ETFs as well as lower issuance of collateralized loan obligations (CLOs),15 which are a large source of loan demand. The robust growth in demand for risk assets that was seen in the past appears to be in question, with investors exhibiting some caution towards credit and its inherent risk. If the lower tiers of the high-yield market continue to deteriorate, there is a potential for further difficulties in the CCC segment of the market and perhaps elsewhere.
Today's low yields and low spreads offer little compensation to investors for what is, in this economic and political climate, heightened risk of permanent impairment of capital. Yet, when rates and the compensation for credit risk are low, investors tend to abandon discipline in the quest to make money, lending on egregiously lenient terms to borrowers with untested business models at hopeful valuations for inadequate returns. We prefer to avoid the dross and exercise patience, protecting capital until we believe valuations are more attractive.
Thank you for your continued trust and support.
Respectfully submitted,

Thomas H. Atteberry
Portfolio Manager

Abhijeet Patwardhan
Portfolio Manager
October 2019
14 Source: Credit Suisse.
15 Source: Credit Suisse.
7
FPA NEW INCOME, INC.
LETTER TO SHAREHOLDERS
(Continued)
Appendix: Attribution and activity for the fiscal year ending Sept. 30, 2019
Portfolio Attribution
Largest contributors to performance:
• Agency mortgage pools
• Asset-backed securities (ABS) backed by equipment
• Asset-backed securities (ABS) backed by auto loans
Largest detractors from performance:
• Corporate bank debt and bonds were the only detractors from performance.
Portfolio Activity
| | | % Portfolio
9/30/2019 | | % Portfolio
9/30/2018 | | Year/Year
Change (bps)16 | |
ABS | | | 51.2 | % | | | 54.0 | % | | | -280 | | |
Mortgage Backed (CMO) | | | 9.5 | % | | | 12.9 | % | | | -340 | | |
Stripped Mortgage-backed | | | 3.0 | % | | | 4.3 | % | | | -130 | | |
Corporate | | | 4.9 | % | | | 6.0 | % | | | -110 | | |
CMBS | | | 6.0 | % | | | 3.7 | % | | | 230 | | |
Mortgage Pass-through | | | 13.0 | % | | | 10.7 | % | | | 230 | | |
U.S. Treasury | | | 6.8 | % | | | 4.9 | % | | | 190 | | |
U.S. Agency | | | 1.2 | % | | | 0.0 | % | | | 120 | | |
Cash and equivalents | | | 4.0 | % | | | 3.5 | % | | | 50 | | |
Total | | | 100.0 | % | | | 100.0 | % | | | | | |
Yield-to-worst17 | | | 2.63 | % | | | 3.82 | % | | | -119 | | |
Effective Duration (years) | | | 1.75 | | | | 1.77 | | | | -0.02 | | |
Average Life (years) | | | 2.15 | | | | 2.31 | | | | -0.16 | | |
16 Change in basis points (bps), except for effective duration and average life, which represents the change in years. Portfolio composition will change due to ongoing management of the Fund.
17 Please refer to Footnote 1 for important information regarding Yield-to-Worst and SEC Yield.
8
FPA NEW INCOME, INC.
LETTER TO SHAREHOLDERS
(Continued)
Important Disclosures
Past performance is no guarantee of future results and current performance may be higher or lower than the performance shown. This data represents past performance and investors should understand that investment returns and principal values fluctuate, so that when you redeem your investment it may be worth more or less than its original cost. Current month-end performance data, which may be higher or lower than the performance data quoted, may be obtained at www.fpa.com or by calling toll-free, 1-800-982-4372.
You should consider the Fund's investment objectives, risks, and charges and expenses carefully before you invest. The Prospectus details the Fund's objective and policies, charges, and other matters of interest to the prospective investor. Please read this Prospectus carefully before investing. The Prospectus may be obtained by visiting the website at www.fpa.com, by email at crm@fpa.com, toll-free by calling 1-800-982-4372 or by contacting the Fund in writing.
The views expressed herein and any forward-looking statements are as of the date of the publication and are those of the portfolio management team. Future events or results may vary significantly from those expressed and are subject to change at any time in response to changing circumstances and industry developments. This information and data has been prepared from sources believed reliable, but the accuracy and completeness of the information cannot be guaranteed and is not a complete summary or statement of all available data.
Portfolio composition will change due to ongoing management of the Fund. References to individual securities are for informational purposes only and should not be construed as recommendations by the Fund, the portfolio managers, the Adviser, or the Distributor. It should not be assumed that future investments will be profitable or will equal the performance of the security examples discussed. The portfolio holdings as of the most recent quarter-end may be obtained at www.fpa.com.
Investments in mutual funds carry risks and investors may lose principal value. Capital markets are volatile and can decline significantly in response to adverse issuer, political, regulatory, market, or economic developments. The Fund may purchase foreign securities, which are subject to interest rate, currency exchange rate, economic and political risks; this may be enhanced when investing in emerging markets. The securities of smaller, less well-known companies can be more volatile than those of larger companies.
The return of principal in a bond fund is not guaranteed. Bond funds have the same issuer, interest rate, inflation and credit risks that are associated with underlying bonds owned by the Fund. Lower rated bonds, convertible securities and other types of debt obligations involve greater risks than higher rated bonds.
Interest rate risk is the risk that when interest rates go up, the value of fixed income securities, such as bonds, typically go down and investors may lose principal value. Credit risk is the risk of loss of principal due to the issuer's failure to repay a loan. Generally, the lower the quality rating of a security, the greater the risk that the issuer will fail to pay interest fully and return principal in a timely manner. If an issuer defaults the security may lose some or all of its value.
Mortgage securities and collateralized mortgage obligations (CMOs) are subject to prepayment risk and the risk of default on the underlying mortgages or other assets; such derivatives may increase volatility. Convertible securities are generally not investment grade and are subject to greater credit risk than higher-rated investments. High yield securities can be volatile and subject to much higher instances of default.
Value style investing presents the risk that the holdings or securities may never reach their full market value because the market fails to recognize what the portfolio management team considers the true business
9
FPA NEW INCOME, INC.
LETTER TO SHAREHOLDERS
(Continued)
value or because the portfolio management team has misjudged those values. In addition, value style investing may fall out of favor and underperform growth or other styles of investing during given periods.
Portfolio composition will change due to ongoing management of the fund. References to individual securities are for informational purposes only and should not be construed as recommendations by the Fund, the Adviser, or the portfolio managers.
Index / Benchmark Definitions
Comparison to any index is for illustrative purposes only and should not be relied upon as a fully accurate measure of comparison. The Fund will be less diversified than the indices noted herein, and may hold non-index securities or securities that are not comparable to those contained in an index. Indices will hold positions that are not within the Fund's investment strategy. Indices are unmanaged, do not reflect any commissions or fees which would be incurred by an investor purchasing the underlying securities. Investors cannot invest directly in an index.
Bloomberg Barclays Aggregate Index provides a measure of the performance of the U.S. investment grade bonds market, which includes investment grade U.S. Government bonds, investment grade corporate bonds, mortgage pass-through securities and asset-backed securities that are publicly offered for sale in the United States. The securities in the Index must have at least 1 year remaining in maturity. In addition, the securities must be denominated in U.S. dollars and must be fixed rate, nonconvertible, and taxable.
Bloomberg Barclays Aggregate 1-3 Year Index provides a measure of the performance of the U.S. investment grade bonds market, which includes investment grade U.S. Government bonds, investment grade corporate bonds, mortgage pass-through securities and asset-backed securities that are publicly offered for sale in the United States. The securities in the Index must have a remaining maturity of 1 to 3 years. In addition, the securities must be denominated in U.S. dollars and must be fixed rate, nonconvertible, and taxable.
The Consumer Price Index (CPI) is an unmanaged index representing the rate of the inflation of U.S. consumer prices as determined by the U.S. Department of Labor Statistics. The CPI is presented to illustrate the Fund's purchasing power against changes in the prices of goods as opposed to a benchmark, which is used to compare the Fund's performance. There can be no guarantee that the CPI will reflect the exact level of inflation at any given time.
10
FPA NEW INCOME, INC.
HISTORICAL PERFORMANCE
(Unaudited)
Change in Value of a $10,000 Investment in FPA New Income, Inc. vs. Barclays U.S. Aggregate Index and Consumer Price Index + 100 Basis Points from October 1, 2009 to September 30, 2019
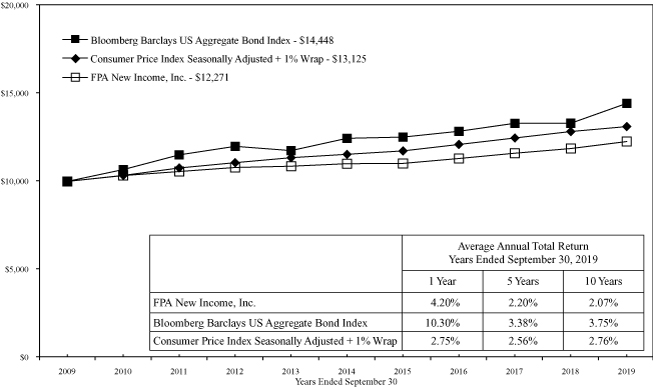
Past performance is not indicative of future performance. The Barclays U.S. Aggregate Bond Index a broad-based unmanaged composite of four major subindexes: U.S. Government Index; U.S. Credit Index; U.S. Mortgage-Backed Securities Index; and U.S. Asset-Backed Securities Index. The index holds investment quality bonds. The Consumer Price Index is an unmanaged index representing the rate of inflation of U.S. consumer prices as determined by the US Department of Labor Statistics. The performance of the Fund and of the Averages is computed on a total return basis which includes reinvestment of all distributions.
Past performance is no guarantee of future results, and current performance may be higher or lower than the performance shown. This data represents past performance, and investors should understand that investment returns and principal values fluctuate, so that when you redeem your investment it may be worth more or less than its original cost. Current month-end performance data can be obtained by visiting the website at www.fpa.com or by calling toll-free, 1-800-982-4372. Information regarding the Fund's expense ratio and redemption fees can be found on page 35.
The Prospectus details the Fund's objective and policies, charges, and other matters of interest to prospective investors. Please read the prospectus carefully before investing. The Prospectus may be obtained by visiting the website at www.fpa.com, by email at crm@fpa.com, toll-free by calling 1-800-982-4372 or by contacting the Fund in writing.
11
FPA NEW INCOME, INC.
PORTFOLIO SUMMARY
September 30, 2019
Common Stocks | | | | | | | 0.4 | % | |
Energy | | | 0.4 | % | | | | | |
Industrials | | | 0.0 | % | | | | | |
Bonds & Debentures | | | | | | | 99.4 | % | |
Asset-Backed Securities | | | 51.1 | % | | | | | |
Residential Mortgage-Backed Securities | | | 23.7 | % | | | | | |
U.S. Treasuries | | | 10.7 | % | | | | | |
Commercial Mortgage-Backed Securities | | | 9.0 | % | | | | | |
Corporate Bank Debt | | | 3.1 | % | | | | | |
Corporate Bonds & Notes | | | 1.8 | % | | | | | |
Short-term Investments | | | | | | | 0.2 | % | |
Other Assets And Liabilities, Net | | | | | | | 0.0 | % | |
Net Assets | | | | | 100.0 | % | |
12
FPA NEW INCOME, INC.
PORTFOLIO OF INVESTMENTS
September 30, 2019
COMMON STOCKS | | Shares or
Principal
Amount | | Fair
Value | |
ENERGY — 0.4% | |
| PHI Group, Inc.(a)(b)(g) | | | 2,602,492 | | | $ | 21,626,709 | | |
| PHI Group, Inc., Restricted(a)(b)(g) | | | 1,203,928 | | | | 10,004,641 | | |
| | | $ | 31,631,350 | | |
INDUSTRIALS — 0.0% | |
Boart Longyear Ltd.(c) | | | 262,296,050 | | | $ | 1,150,739 | | |
| TOTAL COMMON STOCKS — 0.4% (Cost $31,764,951) | | $ | 32,782,089 | | |
BONDS & DEBENTURES | |
COMMERCIAL MORTGAGE-BACKED SECURITIES — 9.0% | |
AGENCY — 0.9% | |
Federal Home Loan Mortgage Corp. K042 A1 — 2.267% 6/25/2024 | | $ | 16,124,247 | | | $ | 16,218,961 | | |
Federal Home Loan Mortgage Corp. K024 A2 — 2.573% 9/25/2022 | | | 5,758,105 | | | | 5,851,230 | | |
Government National Mortgage Association 2009-119 IO —
0.105% 12/16/2049(d) | | | 13,504,993 | | | | 92,935 | | |
Government National Mortgage Association 2014-175 IO —
0.789% 4/16/2056(d) | | | 202,777,679 | | | | 9,831,169 | | |
Government National Mortgage Association 2016-125 IO —
1.038% 12/16/2057(d) | | | 129,009,299 | | | | 9,540,405 | | |
Government National Mortgage Association 2013-55 A —
1.317% 5/16/2034 | | | 193,982 | | | | 192,900 | | |
Government National Mortgage Association 2014-169 A —
2.60% 11/16/2042 | | | 3,757,808 | | | | 3,766,832 | | |
Government National Mortgage Association 2015-21 A —
2.60% 11/16/2042 | | | 6,800,413 | | | | 6,818,827 | | |
Government National Mortgage Association 2014-148 A —
2.65% 11/16/2043 | | | 11,329,267 | | | | 11,346,050 | | |
Government National Mortgage Association 2010-148 AC —
7.00% 12/16/2050(d) | | | 22,958 | | | | 23,248 | | |
| | | $ | 63,682,557 | | |
AGENCY STRIPPED — 4.0% | |
Government National Mortgage Association 2004-10 IO —
0.000% 1/16/2044(d) | | $ | 3,974,720 | | | $ | 4 | | |
Government National Mortgage Association 2012-45 IO —
0.003% 4/16/2053(d) | | | 9,110,917 | | | | 50,876 | | |
Government National Mortgage Association 2002-56 IO —
0.043% 6/16/2042(d) | | | 16,818 | | | | 17 | | |
13
FPA NEW INCOME, INC.
PORTFOLIO OF INVESTMENTS (Continued)
September 30, 2019
BONDS & DEBENTURES — Continued | | Principal
Amount | | Fair
Value | |
Government National Mortgage Association 2009-105 IO —
0.183% 11/16/2049(d) | | $ | 4,937,099 | | | $ | 21,174 | | |
Government National Mortgage Association 2009-86 IO —
0.248% 10/16/2049(d) | | | 11,472,303 | | | | 65,531 | | |
Government National Mortgage Association 2009-71 IO —
0.263% 7/16/2049(d) | | | 3,156,760 | | | | 24,700 | | |
Government National Mortgage Association 2008-8 IO —
0.321% 11/16/2047(d) | | | 4,631,232 | | | | 20,351 | | |
Government National Mortgage Association 2009-49 IO —
0.351% 6/16/2049(d) | | | 7,939,494 | | | | 71,265 | | |
Government National Mortgage Association 2012-125 IO —
0.387% 2/16/2053(d) | | | 70,271,763 | | | | 1,710,843 | | |
Government National Mortgage Association 2009-4 IO —
0.390% 1/16/2049(d) | | | 2,818,468 | | | | 20,912 | | |
Government National Mortgage Association 2012-25 IO —
0.437% 8/16/2052(d) | | | 73,839,562 | | | | 1,100,697 | | |
Government National Mortgage Association 2005-9 IO —
0.509% 1/16/2045(d) | | | 1,071,284 | | | | 3,573 | | |
Government National Mortgage Association 2009-60 IO —
0.509% 6/16/2049(d) | | | 7,007,967 | | | | 61,414 | | |
Government National Mortgage Association 2010-123 IO —
0.511% 9/16/2050(d) | | | 6,247,293 | | | | 96,440 | | |
Government National Mortgage Association 2007-77 IO —
0.565% 11/16/2047(d) | | | 21,018,423 | | | | 249,312 | | |
Government National Mortgage Association 2009-30 IO —
0.570% 3/16/2049(d) | | | 5,131,847 | | | | 138,054 | | |
Government National Mortgage Association 2013-45 IO —
0.598% 12/16/2053(d) | | | 64,560,594 | | | | 1,233,094 | | |
Government National Mortgage Association 2008-24 IO —
0.600% 11/16/2047(d) | | | 317,901 | | | | 2,068 | | |
Government National Mortgage Association 2015-41 IO —
0.622% 9/16/2056(d) | | | 32,631,220 | | | | 1,366,387 | | |
Government National Mortgage Association 2014-157 IO —
0.645% 5/16/2055(d) | | | 136,682,658 | | | | 5,184,496 | | |
Government National Mortgage Association 2012-79 IO —
0.665% 3/16/2053(d) | | | 114,707,625 | | | | 3,247,178 | | |
Government National Mortgage Association 2013-125 IO —
0.678% 10/16/2054(d) | | | 19,776,777 | | | | 651,396 | | |
Government National Mortgage Association 2012-58 IO —
0.695% 2/16/2053(d) | | | 208,008,076 | | | | 5,372,100 | | |
14
FPA NEW INCOME, INC.
PORTFOLIO OF INVESTMENTS (Continued)
September 30, 2019
BONDS & DEBENTURES — Continued | | Principal
Amount | | Fair
Value | |
Government National Mortgage Association 2012-150 IO —
0.705% 11/16/2052(d) | | $ | 67,285,026 | | | $ | 2,435,361 | | |
Government National Mortgage Association 2014-77 IO —
0.721% 12/16/2047(d) | | | 48,816,828 | | | | 1,742,487 | | |
Government National Mortgage Association 2014-110 IO —
0.740% 1/16/2057(d) | | | 66,867,117 | | | | 3,123,430 | | |
Government National Mortgage Association 2014-138 IO —
0.741% 4/16/2056(d) | | | 28,865,448 | | | | 1,323,368 | | |
Government National Mortgage Association 2004-43 IO —
0.743% 6/16/2044(d) | | | 9,558,352 | | | | 119,570 | | |
Government National Mortgage Association 2015-86 IO —
0.762% 5/16/2052(d) | | | 67,323,118 | | | | 3,179,866 | | |
Government National Mortgage Association 2012-114 IO —
0.768% 1/16/2053(d) | | | 45,449,993 | | | | 2,006,635 | | |
Government National Mortgage Association 2015-19 IO —
0.768% 1/16/2057(d) | | | 89,046,087 | | | | 4,515,100 | | |
Government National Mortgage Association 2014-153 IO —
0.786% 4/16/2056(d) | | | 205,506,125 | | | | 9,652,787 | | |
Government National Mortgage Association 2015-7 IO —
0.788% 1/16/2057(d) | | | 55,437,667 | | | | 3,044,249 | | |
Government National Mortgage Association 2014-164 IO —
0.799% 1/16/2056(d) | | | 234,937,803 | | | | 10,281,607 | | |
Government National Mortgage Association 2014-135 IO —
0.809% 1/16/2056(d) | | | 280,521,883 | | | | 13,820,416 | | |
Government National Mortgage Association 2015-101 IO —
0.824% 3/16/2052(d) | | | 151,584,659 | | | | 7,277,170 | | |
Government National Mortgage Association 2014-187 IO —
0.826% 5/16/2056(d) | | | 162,004,252 | | | | 7,921,020 | | |
Government National Mortgage Association 2015-47 IO —
0.846% 10/16/2056(d) | | | 157,251,999 | | | | 7,829,954 | | |
Government National Mortgage Association 2008-45 IO —
0.851% 2/16/2048(d) | | | 2,605,529 | | | | 4,790 | | |
Government National Mortgage Association 2006-55 IO —
0.855% 8/16/2046(d) | | | 6,686,748 | | | | 70,882 | | |
Government National Mortgage Association 2012-53 IO —
0.922% 3/16/2047(d) | | | 52,347,742 | | | | 1,775,714 | | |
Government National Mortgage Association 2015-108 IO —
0.923% 10/16/2056(d) | | | 31,040,239 | | | | 1,647,780 | | |
Government National Mortgage Association 2015-169 IO —
0.924% 7/16/2057(d) | | | 221,691,060 | | | | 13,296,875 | | |
15
FPA NEW INCOME, INC.
PORTFOLIO OF INVESTMENTS (Continued)
September 30, 2019
BONDS & DEBENTURES — Continued | | Principal
Amount | | Fair
Value | |
Government National Mortgage Association 2015-150 IO —
0.932% 9/16/2057(d) | | $ | 215,775,557 | | | $ | 13,496,696 | | |
Government National Mortgage Association 2015-114 IO —
0.935% 3/15/2057(d) | | | 156,559,785 | | | | 9,029,899 | | |
Government National Mortgage Association 2015-128 IO —
0.937% 12/16/2056(d) | | | 196,798,809 | | | | 10,672,793 | | |
Government National Mortgage Association 2015-160 IO —
0.946% 1/16/2056(d) | | | 249,045,580 | | | | 15,011,546 | | |
Government National Mortgage Association 2008-48 IO —
0.968% 4/16/2048(d) | | | 8,784,443 | | | | 125,817 | | |
Government National Mortgage Association 2016-65 IO —
0.999% 1/16/2058(d) | | | 238,494,082 | | | | 17,791,205 | | |
Government National Mortgage Association 2016-106 IO —
1.031% 9/16/2058(d) | | | 237,603,319 | | | | 17,046,399 | | |
Government National Mortgage Association 2008-92 IO —
1.190% 10/16/2048(d) | | | 12,301,020 | | | | 113,697 | | |
Government National Mortgage Association 2004-108 IO —
1.925% 12/16/2044(d) | | | 389,047 | | | | 2,938 | | |
Government National Mortgage Association 2006-30 IO —
2.392% 5/16/2046(d) | | | 858,248 | | | | 9,382 | | |
Government National Mortgage Association 2015-41 AF, VRN —
3.064% 9/16/2056(d) | | | 19,402,565 | | | | 20,103,155 | | |
Government National Mortgage Association 2019 39 A —
3.10% 5/16/2059 | | | 68,383,576 | | | | 69,445,846 | | |
Government National Mortgage Association 2011-9 C, VRN —
3.499% 9/16/2041(d) | | | 4,728,695 | | | | 4,785,352 | | |
| | | $ | 293,395,668 | | |
NON-AGENCY — 4.1% | |
Aventura Mall Trust 2013-AVM A — 3.867% 12/5/2032(d)(e) | | $ | 37,824,000 | | | $ | 38,219,231 | | |
Bear Stearns Commercial Mortgage Securities Trust 2005-PWR7 B —
5.214% 2/11/2041(d) | | | 4,592,265 | | | | 4,607,995 | | |
Citigroup Commercial Mortgage Trust 2012-GC8 A4 —
3.024% 9/10/2045 | | | 4,209,542 | | | | 4,307,287 | | |
Citigroup Commercial Mortgage Trust 2017-C4 A2 —
3.19% 10/12/2050 | | | 18,524,000 | | | | 19,032,993 | | |
COMM Mortgage Trust 2013-LC6 A4 —
2.941% 1/10/2046 | | | 3,497,000 | | | | 3,578,614 | | |
COMM Mortgage Trust 2014-FL5 B, 1M LIBOR + 2.150% —
3.582% 10/15/2031(d)(e) | | | 838,370 | | | | 837,073 | | |
16
FPA NEW INCOME, INC.
PORTFOLIO OF INVESTMENTS (Continued)
September 30, 2019
BONDS & DEBENTURES — Continued | | Principal
Amount | | Fair
Value | |
COMM Mortgage Trust 2014-FL5 C, 1M LIBOR + 2.150% —
3.582% 10/15/2031(d)(e) | | $ | 8,340,000 | | | $ | 8,303,669 | | |
DBUBS Mortgage Trust 2011-LC2A A4 — 4.537% 7/10/2044(e) | | | 44,816,836 | | | | 45,978,851 | | |
GS Mortgage Securities Corp. Trust 2012-ALOH A —
3.551% 4/10/2034(e) | | | 17,403,000 | | | | 17,899,085 | | |
J.P. Morgan Chase Commercial Mortgage Securities Trust 2016-WIKI A —
2.798% 10/5/2031(e) | | | 7,922,000 | | | | 7,999,609 | | |
J.P. Morgan Chase Commercial Mortgage Securities Trust 2010-C1 A3 —
5.058% 6/15/2043(e) | | | 7,277,000 | | | | 7,362,014 | | |
J.P. Morgan Chase Commercial Mortgage Securities Trust 2012-HSBC A —
3.093% 7/5/2032(e) | | | 10,030,028 | | | | 10,307,022 | | |
JPMBB Commercial Mortgage Securities Trust 2015-C30 ASB —
3.559% 7/15/2048 | | | 7,605,000 | | | | 7,891,509 | | |
Latitude Management Real Estate Capita 2016-CRE2 A,
1M LIBOR + 1.700% — 4.181% 11/24/2031(d)(e) | | | 6,265,304 | | | | 6,272,613 | | |
OBP Depositor LLC Trust 2010-OBP A — 4.646% 7/15/2045(e) | | | 4,000,000 | | | | 4,023,616 | | |
UBS Commercial Mortgage Trust 2012-C1 A3 — 3.40% 5/10/2045 | | | 6,120,458 | | | | 6,267,123 | | |
Wells Fargo Commercial Mortgage Trust 2019-C51 A1 —
2.276% 6/15/2052 | | | 11,247,473 | | | | 11,279,530 | | |
Wells Fargo Commercial Mortgage Trust 2015-C26 A2 —
2.663% 2/15/2048 | | | 4,800,694 | | | | 4,795,204 | | |
Wells Fargo Commercial Mortgage Trust 2012-LC5 A3 —
2.918% 10/15/2045 | | | 34,211,085 | | | | 34,890,370 | | |
WFRBS Commercial Mortgage Trust 2012-C9 A3 —
2.87% 11/15/2045 | | | 3,388,875 | | | | 3,459,669 | | |
WFRBS Commercial Mortgage Trust 2012-C8 A3 — 3.001% 8/15/2045 | | | 21,510,000 | | | | 21,946,414 | | |
WFRBS Commercial Mortgage Trust 2013-UBS1 A3 —
3.591% 3/15/2046 | | | 30,588,000 | | | | 30,979,912 | | |
| | | $ | 300,239,403 | | |
TOTAL COMMERICAL MORTGAGE-BACKED SECURITIES
(Cost $690,855,195) | | $ | 657,317,628 | | |
RESIDENTIAL MORTGAGE-BACKED SECURITIES — 23.7% | |
AGENCY COLLATERALIZED MORTGAGE OBLIGATION — 2.9% | |
Federal Home Loan Mortgage Corp. 4170 QE — 2.00% 5/15/2032 | | $ | 1,504,578 | | | $ | 1,488,844 | | |
Federal Home Loan Mortgage Corp. 3979 HD — 2.50% 12/15/2026 | | | 2,364,047 | | | | 2,382,521 | | |
Federal Home Loan Mortgage Corp. 4304 DA — 2.50% 1/15/2027 | | | 892,300 | | | | 901,615 | | |
Federal Home Loan Mortgage Corp. 4010 DE — 2.50% 2/15/2027 | | | 2,785,785 | | | | 2,814,812 | | |
Federal Home Loan Mortgage Corp. 3914 MA — 3.00% 6/15/2026 | | | 1,890,257 | | | | 1,934,521 | | |
17
FPA NEW INCOME, INC.
PORTFOLIO OF INVESTMENTS (Continued)
September 30, 2019
BONDS & DEBENTURES — Continued | | Principal
Amount | | Fair
Value | |
Federal Home Loan Mortgage Corp. 4297 CA — 3.00% 12/15/2030 | | $ | 3,295,246 | | | $ | 3,351,986 | | |
Federal Home Loan Mortgage Corp. 4664 TA — 3.00% 9/15/2037 | | | 5,478,451 | | | | 5,562,714 | | |
Federal Home Loan Mortgage Corp. 4504 DN — 3.00% 10/15/2040 | | | 10,846,117 | | | | 11,032,100 | | |
Federal Home Loan Mortgage Corp. 3862 MB — 3.50% 5/15/2026 | | | 15,929,494 | | | | 16,436,759 | | |
Federal Home Loan Mortgage Corp. 3828 VE — 4.50% 1/15/2024 | | | 895,150 | | | | 942,446 | | |
Federal Home Loan Mortgage Corp. 4395 NT — 4.50% 7/15/2026 | | | 7,503,529 | | | | 7,855,276 | | |
Federal National Mortgage Association 2014-80 GD — 2.00% 2/25/2042 | | | 15,638,936 | | | | 15,525,147 | | |
Federal National Mortgage Association 2014-21 ED — 2.25% 4/25/2029 | | | 630,059 | | | | 625,517 | | |
Federal National Mortgage Association 2013-135 KM — 2.50% 3/25/2028 | | | 1,403,436 | | | | 1,416,717 | | |
Federal National Mortgage Association 4387 VA — 3.00% 2/15/2026 | | | 463,802 | | | | 470,203 | | |
Federal National Mortgage Association 2017-30 G — 3.00% 7/25/2040 | | | 8,485,373 | | | | 8,662,529 | | |
Federal National Mortgage Association 2013-93 PJ — 3.00% 7/25/2042 | | | 1,788,754 | | | | 1,834,019 | | |
Federal National Mortgage Association 2017-16 JA — 3.00% 2/25/2043 | | | 20,942,060 | | | | 21,243,921 | | |
Federal National Mortgage Association 2018-16 HA — 3.00% 7/25/2043 | | | 21,314,568 | | | | 21,517,858 | | |
Federal National Mortgage Association 2011-98 VE — 3.50% 6/25/2026 | | | 13,677,000 | | | | 13,842,334 | | |
Federal National Mortgage Association 2011-80 KB — 3.50% 8/25/2026 | | | 12,542,635 | | | | 12,772,478 | | |
Federal National Mortgage Association 2012-144 PD — 3.50% 4/25/2042 | | | 3,893,726 | | | | 3,984,064 | | |
Federal National Mortgage Association 2017-45 KD — 3.50% 2/25/2044 | | | 14,928,856 | | | | 15,114,202 | | |
Federal National Mortgage Association 2017-52 KC — 3.50% 4/25/2044 | | | 15,751,788 | | | | 15,953,673 | | |
Federal National Mortgage Association 2017-59 DC — 3.50% 5/25/2044 | | | 21,369,166 | | | | 21,631,094 | | |
Federal National Mortgage Association 2012-95 AB — 4.00% 11/25/2040 | | | 56,119 | | | | 56,252 | | |
Federal National Mortgage Association 2012-40 GC — 4.50% 12/25/2040 | | | 928,407 | | | | 949,619 | | |
Federal National Mortgage Association 2012-67 PB — 4.50% 12/25/2040 | | | 437,911 | | | | 439,368 | | |
Federal National Mortgage Association 2004-60 LB — 5.00% 4/25/2034 | | | 1,178,583 | | | | 1,209,239 | | |
Federal National Mortgage Association 2010 43 MK — 5.50% 5/25/2040 | | | 1,656,331 | | | | 1,793,957 | | |
| | | $ | 213,745,785 | | |
AGENCY POOL ADJUSTABLE RATE — 0.0% | |
Federal National Mortgage Association 865963,
12M USD LIBOR + 1.705% — 4.78% 3/1/2036(d) | | $ | 545,653 | | | $ | 569,638 | | |
AGENCY POOL FIXED RATE — 13.0% | |
Federal Home Loan Mortgage Corp. J24941 — 2.00% 8/1/2023 | | $ | 1,679,225 | | | $ | 1,677,198 | | |
Federal Home Loan Mortgage Corp. J20834 — 2.50% 10/1/2027 | | | 1,100,338 | | | | 1,115,812 | | |
Federal Home Loan Mortgage Corp. J21434 — 2.50% 12/1/2027 | | | 17,499,167 | | | | 17,723,380 | | |
Federal Home Loan Mortgage Corp. E04232 — 2.50% 2/1/2028 | | | 3,080,816 | | | | 3,125,104 | | |
Federal Home Loan Mortgage Corp. E04360 — 2.50% 4/1/2028 | | | 2,243,357 | | | | 2,275,605 | | |
Federal Home Loan Mortgage Corp. G16178 — 2.50% 11/1/2028 | | | 20,238,232 | | | | 20,560,785 | | |
Federal Home Loan Mortgage Corp. G16618 — 2.50% 1/1/2030 | | | 33,656,794 | | | | 34,088,031 | | |
Federal Home Loan Mortgage Corp. J16678 — 3.00% 9/1/2026 | | | 4,197,214 | | | | 4,300,736 | | |
Federal Home Loan Mortgage Corp. J17544 — 3.00% 12/1/2026 | | | 6,113,570 | | | | 6,283,462 | | |
18
FPA NEW INCOME, INC.
PORTFOLIO OF INVESTMENTS (Continued)
September 30, 2019
BONDS & DEBENTURES — Continued | | Principal
Amount | | Fair
Value | |
Federal Home Loan Mortgage Corp. J17774 — 3.00% 1/1/2027 | | $ | 1,215,495 | | | $ | 1,244,715 | | |
Federal Home Loan Mortgage Corp. G16406 — 3.00% 1/1/2028 | | | 18,942,120 | | | | 19,397,477 | | |
Federal Home Loan Mortgage Corp. G16476 — 3.00% 4/1/2028 | | | 27,307,586 | | | | 27,972,578 | | |
Federal Home Loan Mortgage Corp. G16620 — 3.00% 8/1/2028 | | | 8,165,017 | | | | 8,363,850 | | |
Federal Home Loan Mortgage Corp. G16478 — 3.00% 5/1/2030 | | | 26,472,093 | | | | 27,108,467 | | |
Federal Home Loan Mortgage Corp. G16592 — 3.00% 2/1/2032 | | | 15,473,416 | | | | 15,859,894 | | |
Federal Home Loan Mortgage Corp. G16473 — 3.50% 1/1/2028 | | | 30,582,584 | | | | 31,686,659 | | |
Federal Home Loan Mortgage Corp. G16613 — 3.50% 8/1/2028 | | | 7,900,190 | | | | 8,187,867 | | |
Federal Home Loan Mortgage Corp. V62149 — 3.50% 9/1/2028 | | | 5,692,701 | | | | 5,899,995 | | |
Federal Home Loan Mortgage Corp. J26472 — 3.50% 11/1/2028 | | | 6,729,453 | | | | 7,014,455 | | |
Federal Home Loan Mortgage Corp. G15169 — 4.50% 9/1/2026 | | | 1,396,675 | | | | 1,457,179 | | |
Federal Home Loan Mortgage Corp. G15272 — 4.50% 9/1/2026 | | | 669,497 | | | | 689,431 | | |
Federal Home Loan Mortgage Corp. G15875 — 4.50% 9/1/2026 | | | 2,085,090 | | | | 2,169,543 | | |
Federal Home Loan Mortgage Corp. G15036 — 5.00% 6/1/2024 | | | 611,543 | | | | 622,316 | | |
Federal Home Loan Mortgage Corp. G13667 — 5.00% 8/1/2024 | | | 61,888 | | | | 63,309 | | |
Federal Home Loan Mortgage Corp. G15173 — 5.00% 6/1/2026 | | | 511,041 | | | | 522,742 | | |
Federal Home Loan Mortgage Corp. G15407 — 5.00% 6/1/2026 | | | 1,811,415 | | | | 1,876,367 | | |
Federal Home Loan Mortgage Corp. J01270 — 5.50% 2/1/2021 | | | 15,986 | | | | 16,235 | | |
Federal Home Loan Mortgage Corp. G15230 — 5.50% 12/1/2024 | | | 1,234,058 | | | | 1,269,540 | | |
Federal Home Loan Mortgage Corp. G15458 — 5.50% 12/1/2024 | | | 300,449 | | | | 310,586 | | |
Federal Home Loan Mortgage Corp. G14460 — 6.00% 1/1/2024 | | | 113,889 | | | | 117,673 | | |
Federal Home Loan Mortgage Corporation J16662 — 3.00% 9/1/2026 | | | 1,564,884 | | | | 1,601,525 | | |
Federal Home Loan Mortgage Corporation J17197 — 3.00% 11/1/2026 | | | 2,722,000 | | | | 2,787,435 | | |
Federal Home Loan Mortgage Corporation ZK3908 — 3.00% 2/1/2027 | | | 943,096 | | | | 965,260 | | |
Federal Home Loan Mortgage Corporation ZK3970 — 3.00% 3/1/2027 | | | 781,097 | | | | 799,453 | | |
Federal Home Loan Mortgage Corporation G15418 — 3.00% 11/1/2027 | | | 1,592,836 | | | | 1,634,114 | | |
Federal National Mortgage Association AB6251 — 2.00% 9/1/2022 | | | 288,771 | | | | 288,110 | | |
Federal National Mortgage Association AB7515 — 2.00% 1/1/2023 | | | 184,506 | | | | 184,124 | | |
Federal National Mortgage Association AQ7281 — 2.00% 12/1/2027 | | | 1,030,880 | | | | 1,031,743 | | |
Federal National Mortgage Association BM4743 — 2.00% 8/1/2030 | | | 38,686,122 | | | | 38,718,537 | | |
Federal National Mortgage Association MA2449 — 2.50% 11/1/2025 | | | 10,369,554 | | | | 10,483,950 | | |
Federal National Mortgage Association AL1366 — 2.50% 2/1/2027 | | | 4,412,665 | | | | 4,462,724 | | |
Federal National Mortgage Association AB4720 — 2.50% 3/1/2027 | | | 4,120,650 | | | | 4,167,396 | | |
Federal National Mortgage Association AK7393 — 2.50% 3/1/2027 | | | 1,837,752 | | | | 1,858,600 | | |
Federal National Mortgage Association AK7766 — 2.50% 3/1/2027 | | | 6,712,329 | | | | 6,788,476 | | |
Federal National Mortgage Association AB6192 — 2.50% 9/1/2027 | | | 1,754,964 | | | | 1,777,616 | | |
Federal National Mortgage Association AR6882 — 2.50% 2/1/2028 | | | 3,239,699 | | | | 3,287,588 | | |
Federal National Mortgage Association BM4406 — 2.50% 9/1/2028 | | | 13,732,982 | | | | 13,923,106 | | |
Federal National Mortgage Association BM5514 — 2.50% 2/1/2029 | | | 38,865,244 | | | | 39,342,583 | | |
Federal National Mortgage Association BM4386 — 2.50% 8/1/2030 | | | 13,052,254 | | | | 13,212,560 | | |
19
FPA NEW INCOME, INC.
PORTFOLIO OF INVESTMENTS (Continued)
September 30, 2019
BONDS & DEBENTURES — Continued | | Principal
Amount | | Fair
Value | |
Federal National Mortgage Association BM1595 — 2.50% 3/1/2031 | | $ | 2,123,400 | | | $ | 2,149,479 | | |
Federal National Mortgage Association MA2726 — 3.00% 8/1/2026 | | | 2,958,529 | | | | 3,028,982 | | |
Federal National Mortgage Association AJ6973 — 3.00% 11/1/2026 | | | 1,490,789 | | | | 1,525,824 | | |
Federal National Mortgage Association AJ9387 — 3.00% 12/1/2026 | | | 773,502 | | | | 791,680 | | |
Federal National Mortgage Association AU3826 — 3.00% 12/1/2026 | | | 21,619,976 | | | | 22,114,554 | | |
Federal National Mortgage Association MA0953 — 3.00% 1/1/2027 | | | 3,700,270 | | | | 3,787,230 | | |
Federal National Mortgage Association AL1345 — 3.00% 2/1/2027 | | | 1,402,185 | | | | 1,435,138 | | |
Federal National Mortgage Association AB4673 — 3.00% 3/1/2027 | | | 1,533,402 | | | | 1,571,355 | | |
Federal National Mortgage Association AK9467 — 3.00% 3/1/2027 | | | 1,621,686 | | | | 1,659,798 | | |
Federal National Mortgage Association AL5254 — 3.00% 11/1/2027 | | | 2,040,984 | | | | 2,088,949 | | |
Federal National Mortgage Association AL3458 — 3.00% 5/1/2028 | | | 32,470,537 | | | | 33,264,069 | | |
Federal National Mortgage Association AL3773 — 3.00% 6/1/2028 | | | 2,465,838 | | | | 2,529,952 | | |
Federal National Mortgage Association AL5638 — 3.00% 6/1/2028 | | | 1,169,574 | | | | 1,197,061 | | |
Federal National Mortgage Association AL4693 — 3.00% 8/1/2028 | | | 1,349,943 | | | | 1,381,668 | | |
Federal National Mortgage Association MA3480 — 3.00% 8/1/2028 | | | 5,773,209 | | | | 5,910,689 | | |
Federal National Mortgage Association AU6681 — 3.00% 9/1/2028 | | | 13,533,005 | | | | 13,880,648 | | |
Federal National Mortgage Association AU6682 — 3.00% 9/1/2028 | | | 67,663,013 | | | | 69,401,174 | | |
Federal National Mortgage Association MA3485 — 3.00% 9/1/2028 | | | 2,836,128 | | | | 2,903,666 | | |
Federal National Mortgage Association 890837 — 3.00% 10/1/2028 | | | 16,152,524 | | | | 16,547,267 | | |
Federal National Mortgage Association BM4485 — 3.00% 9/1/2030 | | | 45,050,338 | | | | 46,151,301 | | |
Federal National Mortgage Association BM3539 — 3.00% 10/1/2030 | | | 32,334,944 | | | | 33,185,790 | | |
Federal National Mortgage Association BM4536 — 3.00% 8/1/2031 | | | 48,119,844 | | | | 49,355,970 | | |
Federal National Mortgage Association BM3973 — 3.00% 4/1/2032 | | | 50,269,970 | | | | 51,561,330 | | |
Federal National Mortgage Association AB1940 — 3.50% 12/1/2025 | | | 1,630,216 | | | | 1,686,668 | | |
Federal National Mortgage Association AJ1758 — 3.50% 9/1/2026 | | | 2,882,493 | | | | 2,984,112 | | |
Federal National Mortgage Association AL4229 — 3.50% 2/1/2027 | | | 20,877,304 | | | | 21,613,311 | | |
Federal National Mortgage Association MA3075 — 3.50% 7/1/2027 | | | 26,415,859 | | | | 27,355,376 | | |
Federal National Mortgage Association MA3132 — 3.50% 9/1/2027 | | | 5,768,140 | | | | 5,973,291 | | |
Federal National Mortgage Association AL4237 — 3.50% 10/1/2027 | | | 17,330,464 | | | | 17,957,678 | | |
Federal National Mortgage Association MA3251 — 3.50% 1/1/2028 | | | 7,039,323 | | | | 7,289,687 | | |
Federal National Mortgage Association MA3321 — 3.50% 3/1/2028 | | | 4,364,302 | | | | 4,520,889 | | |
Federal National Mortgage Association CA1631 — 3.50% 10/1/2028 | | | 7,103,507 | | | | 7,356,153 | | |
Federal National Mortgage Association MA3514 — 3.50% 11/1/2028 | | | 18,839,556 | | | | 19,515,499 | | |
Federal National Mortgage Association MA3542 — 3.50% 12/1/2028 | | | 17,377,325 | | | | 18,000,804 | | |
Federal National Mortgage Association AL9783 — 3.50% 2/1/2029 | | | 18,867,320 | | | | 19,538,363 | | |
Federal National Mortgage Association BM1231 — 3.50% 11/1/2031 | | | 14,349,169 | | | | 14,895,390 | | |
Federal National Mortgage Association AL5956 — 4.00% 5/1/2027 | | | 649,044 | | | | 676,943 | | |
Federal National Mortgage Association FM1102 — 4.00% 3/1/2031 | | | 9,504,054 | | | | 9,918,526 | | |
Federal National Mortgage Association AL4056 — 5.00% 6/1/2026 | | | 1,393,093 | | | | 1,430,169 | | |
Federal National Mortgage Association AL5867 — 5.50% 8/1/2023 | | | 81,849 | | | | 83,777 | | |
20
FPA NEW INCOME, INC.
PORTFOLIO OF INVESTMENTS (Continued)
September 30, 2019
BONDS & DEBENTURES — Continued | | Principal
Amount | | Fair
Value | |
Federal National Mortgage Association AL0471 — 5.50% 7/1/2025 | | $ | 69,742 | | | $ | 72,761 | | |
Federal National Mortgage Association AL4433 — 5.50% 9/1/2025 | | | 467,099 | | | | 480,640 | | |
Federal National Mortgage Association AL4901 — 5.50% 9/1/2025 | | | 428,586 | | | | 439,655 | | |
Federal National Mortgage Association AD0951 — 6.00% 12/1/2021 | | | 183,011 | | | | 185,381 | | |
Federal National Mortgage Association AL0294 — 6.00% 10/1/2022 | | | 30,852 | | | | 31,857 | | |
Federal National Mortgage Association 890225 — 6.00% 5/1/2023 | | | 267,487 | | | | 273,739 | | |
Government National Mortgage Association 782281 — 6.00% 3/15/2023 | | | 573,840 | | | | 595,872 | | |
| | | $ | 950,616,006 | | |
AGENCY STRIPPED — 1.2% | |
Federal Home Loan Mortgage Corp. 217 PO — 0.00% 1/1/2032(f) | | $ | 159,546 | | | $ | 147,974 | | |
Federal Home Loan Mortgage Corp. 3763 NI — 3.50% 5/15/2025 | | | 924,924 | | | | 38,146 | | |
Federal Home Loan Mortgage Corp. 3917 AI — 4.50% 7/15/2026 | | | 7,366,942 | | | | 475,160 | | |
Federal Home Loan Mortgage Corp. 217 IO — 6.50% 1/1/2032 | | | 153,626 | | | | 35,021 | | |
Federal National Mortgage Association 2010-25 NI — 5.00% 3/25/2025 | | | 19,560 | | | | 302 | | |
Federal National Mortgage Association 2003-64 XI — 5.00% 7/25/2033 | | | 423,805 | | | | 74,929 | | |
Resolution Funding Corp. — 0.00% 10/15/2020(f) | | | 89,328,000 | | | | 87,614,948 | | |
| | | $ | 88,386,480 | | |
NON-AGENCY COLLATERALIZED MORTGAGE OBLIGATION — 6.6% | |
BRAVO Residential Funding Trust 2019-1 A1C — 3.50% 3/25/2058(e) | | $ | 35,507,429 | | | $ | 35,770,682 | | |
CIM Trust 2017-7 A, VRN — 3.00% 4/25/2057(d)(e) | | | 23,169,202 | | | | 23,314,032 | | |
CIM Trust 2018-R3 A1, VRN — 5.00% 12/25/2057(d)(e) | | | 55,552,238 | | | | 57,725,908 | | |
Citicorp Mortgage Securities REMIC Pass-Through Certificates
Trust Series 2005-5 2A3 — 5.00% 8/25/2020 | | | 8,724 | | | | 8,813 | | |
Citigroup Mortgage Loan Trust, Inc. 2014-A A — 4.00% 1/25/2035(d)(e) | | | 7,199,912 | | | | 7,365,643 | | |
Finance of America Structured Securities Trust 2018-HB1 M1, VRN —
3.774% 9/25/2028(d)(e) | | | 15,845,000 | | | | 16,072,645 | | |
Mill City Mortgage Loan Trust 2018-2 A1, VRN — 3.50% 5/25/2058(d)(e) | | | 38,478,201 | | | | 39,251,774 | | |
Mill City Mortgage Loan Trust 2018-3 A1, VRN — 3.50% 8/25/2058(d)(e) | | | 22,647,285 | | | | 23,299,097 | | |
Nationstar HECM Loan Trust 2019-1A M1, VRN —
2.664% 6/25/2029(d)(e) | | | 10,270,000 | | | | 10,316,985 | | |
Nationstar HECM Loan Trust 2018-2A M1, VRN —
3.552% 7/25/2028(d)(e) | | | 8,381,000 | | | | 8,487,355 | | |
Nomura Resecuritization Trust 2016-1R 3A1 — 5.00% 9/28/2036(d)(e) | | | 3,501,381 | | | | 3,588,206 | | |
Towd Point Mortgage Trust 2016-3 A1 — 2.25% 4/25/2056(d)(e) | | | 12,859,732 | | | | 12,786,431 | | |
Towd Point Mortgage Trust 2015-1 AES — 3.00% 10/25/2053(d)(e) | | | 7,337,332 | | | | 7,335,864 | | |
Towd Point Mortgage Trust 2018-1 A1, VRN — 3.00% 1/25/2058(d)(e) | | | 28,888,795 | | | | 29,251,442 | | |
Towd Point Mortgage Trust 2018-2 A1, VRN — 3.25% 3/25/2058(d)(e) | | | 58,696,013 | | | | 59,646,889 | | |
Towd Point Mortgage Trust 2018-5 A1A, VRN — 3.25% 7/25/2058(d)(e) | | | 48,468,928 | | | | 49,370,450 | | |
Towd Point Mortgage Trust 2015-2 1A1 — 3.25% 11/25/2060(d)(e) | | | 17,837,881 | | | | 17,985,936 | | |
Towd Point Mortgage Trust 2015-4 A1 — 3.50% 4/25/2055(d)(e) | | | 17,599,823 | | | | 17,719,501 | | |
21
FPA NEW INCOME, INC.
PORTFOLIO OF INVESTMENTS (Continued)
September 30, 2019
BONDS & DEBENTURES — Continued | | Principal
Amount | | Fair
Value | |
Towd Point Mortgage Trust 2015-2 2A1 — 3.75% 11/25/2057(d)(e) | | $ | 10,627,477 | | | $ | 10,693,367 | | |
Towd Point Mortgage Trust 2018-6 A1A, VRN — 3.75% 3/25/2058(d)(e) | | | 49,387,864 | | | | 50,849,744 | | |
| | | $ | 480,840,764 | | |
TOTAL RESIDENTIAL MORTGAGE-BACKED SECURITIES
(Cost $1,702,284,211) | | $ | 1,734,158,673 | | |
ASSET-BACKED SECURITIES — 51.1% | |
AUTO — 17.8% | |
Ally Auto Receivables Trust 2019-3 A3 — 1.93% 5/15/2024 | | $ | 70,270,000 | | | $ | 70,305,128 | | |
Ally Auto Receivables Trust 2017-1 B — 2.35% 3/15/2022 | | | 3,758,000 | | | | 3,753,555 | | |
Ally Auto Receivables Trust 2017-1 C — 2.48% 5/16/2022 | | | 7,059,000 | | | | 7,057,241 | | |
AmeriCredit Automobile Receivables Trust 2017-4 A3 — 2.04% 7/18/2022 | | | 12,806,467 | | | | 12,797,338 | | |
AmeriCredit Automobile Receivables Trust 2017-1 C — 2.71% 8/18/2022 | | | 7,547,000 | | | | 7,606,922 | | |
BMW Vehicle Lease Trust 2017-2 A4 — 2.19% 3/22/2021 | | | 9,585,000 | | | | 9,588,579 | | |
BMW Vehicle Owner Trust 2019-A A3 — 1.92% 1/25/2024 | | | 32,758,000 | | | | 32,769,174 | | |
CarMax Auto Owner Trust 2017-4 A3 — 2.11% 10/17/2022 | | | 8,714,000 | | | | 8,720,225 | | |
Carmax Auto Owner Trust 2019-3 A3 — 2.18% 8/15/2024 | | | 41,843,000 | | | | 41,953,298 | | |
CarMax Auto Owner Trust 2018-1 A3 — 2.48% 11/15/2022 | | | 18,953,000 | | | | 19,012,937 | | |
CarMax Auto Owner Trust 2018-2 A3 — 2.98% 1/17/2023 | | | 22,270,000 | | | | 22,528,597 | | |
CarMax Auto Owner Trust 2018-2 A4 — 3.16% 7/17/2023 | | | 6,059,000 | | | | 6,209,004 | | |
CarMax Auto Owner Trust 2019-1 A4 — 3.26% 8/15/2024 | | | 24,353,000 | | | | 25,143,990 | | |
CarMax Auto Owner Trust 2019-1 B — 3.45% 11/15/2024 | | | 13,090,000 | | | | 13,545,687 | | |
CarMax Auto Owner Trust 2018-4 A4 — 3.48% 2/15/2024 | | | 22,031,000 | | | | 22,981,426 | | |
Credit Acceptance Auto Loan Trust 2017-2A A — 2.55% 2/17/2026(e) | | | 36,246,970 | | | | 36,281,263 | | |
Credit Acceptance Auto Loan Trust 2017-3A A — 2.65% 6/15/2026(e) | | | 17,185,000 | | | | 17,228,085 | | |
Credit Acceptance Auto Loan Trust 2016-3A B — 2.94% 10/15/2024(e) | | | 14,745,374 | | | | 14,756,837 | | |
Credit Acceptance Auto Loan Trust 2017-3A B — 3.21% 8/17/2026(e) | | | 36,562,000 | | | | 36,955,166 | | |
First Investors Auto Owner Trust 2017-1A B — 2.67% 4/17/2023(e) | | | 4,174,000 | | | | 4,178,660 | | |
First Investors Auto Owner Trust 2017-1A C — 2.95% 4/17/2023(e) | | | 8,149,000 | | | | 8,164,152 | | |
Ford Credit Auto Lease Trust 2019-B B — 2.36% 1/15/2023 | | | 32,914,000 | | | | 33,064,424 | | |
GM Financial Automobile Leasing Trust 2019-3 A4 — 2.03% 7/20/2023 | | | 5,929,000 | | | | 5,921,864 | | |
GM Financial Automobile Leasing Trust 2019-3 B — 2.16% 7/20/2023 | | | 21,492,000 | | | | 21,461,329 | | |
GM Financial Automobile Leasing Trust 2017-2 B — 2.43% 6/21/2021 | | | 22,329,000 | | | | 22,333,642 | | |
GM Financial Automobile Leasing Trust 2018-1 A4 — 2.68% 12/20/2021 | | | 15,743,000 | | | | 15,800,147 | | |
GM Financial Automobile Leasing Trust 2017-2 C — 2.84% 6/21/2021 | | | 3,750,000 | | | | 3,757,335 | | |
GM Financial Automobile Leasing Trust 2019-2 B — 2.89% 3/20/2023 | | | 12,206,000 | | | | 12,365,280 | | |
GM Financial Automobile Leasing Trust 2019-1 B — 3.37% 12/20/2022 | | | 43,632,000 | | | | 44,495,159 | | |
Honda Auto Receivables Owner Trust 2019-3 A3 — 1.78% 8/15/2023 | | | 33,626,000 | | | | 33,531,740 | | |
22
FPA NEW INCOME, INC.
PORTFOLIO OF INVESTMENTS (Continued)
September 30, 2019
BONDS & DEBENTURES — Continued | | Principal
Amount | | Fair
Value | |
Honda Auto Receivables Owner Trust 2019-2 A4 — 2.54% 3/21/2025 | | $ | 21,573,000 | | | $ | 21,926,128 | | |
Honda Auto Receivables Owner Trust 2018-1I A4 — 2.78% 5/15/2024 | | | 37,617,000 | | | | 38,141,911 | | |
Honda Auto Receivables Owner Trust 2019-1 A4 — 2.90% 6/18/2024 | | | 14,962,000 | | | | 15,317,752 | | |
Hyundai Auto Lease Securitization Trust 2019-B A4 —
2.03% 6/15/2023(e) | | | 10,870,000 | | | | 10,856,357 | | |
Hyundai Auto Lease Securitization Trust 2019-B B —
2.13% 11/15/2023(e) | | | 41,387,000 | | | | 41,322,056 | | |
Hyundai Auto Lease Securitization Trust 2017-C A4 —
2.21% 9/15/2021(e) | | | 10,394,000 | | | | 10,396,462 | | |
Hyundai Auto Lease Securitization Trust 2018-A A4 —
2.89% 3/15/2022(e) | | | 23,622,000 | | | | 23,780,241 | | |
Hyundai Auto Lease Securitization Trust 2019-A B —
3.25% 10/16/2023(e) | | | 12,636,000 | | | | 12,845,077 | | |
Hyundai Auto Receivables Trust 2019-A A4 — 2.71% 5/15/2025 | | | 22,000,000 | | | | 22,469,066 | | |
Hyundai Auto Receivables Trust 2018-A A4 — 2.94% 6/17/2024 | | | 27,125,000 | | | | 27,681,624 | | |
Mercedes-Benz Auto Lease Trust 2018-A A4 — 2.51% 10/16/2023 | | | 6,318,000 | | | | 6,331,220 | | |
Mercedes-Benz Auto Receivables Trust 2019-1 A3 — 1.94% 3/15/2024 | | | 48,937,000 | | | | 48,957,666 | | |
Mercedes-Benz Auto Receivables Trust 2018-1 A4 — 3.15% 10/15/2024 | | | 32,591,000 | | | | 33,549,498 | | |
Nissan Auto Lease Trust 2017-B A4 — 2.17% 12/15/2021 | | | 11,332,000 | | | | 11,330,114 | | |
Nissan Auto Lease Trust — 2.29% 4/15/2025 | | | 21,027,000 | | | | 21,127,389 | | |
Nissan Auto Receivables Owner Trust 2018-A A3 — 2.65% 5/16/2022 | | | 27,120,000 | | | | 27,247,350 | | |
Nissan Auto Receivables Owner Trust 2019-A A3 — 2.90% 10/16/2023 | | | 5,864,000 | | | | 5,960,542 | | |
Nissan Auto Receivables Owner Trust 2018-B A4 — 3.16% 12/16/2024 | | | 27,408,000 | | | | 28,275,126 | | |
Prestige Auto Receivables Trust 2017-1A B — 2.39% 5/16/2022(e) | | | 12,205,000 | | | | 12,200,978 | | |
Prestige Auto Receivables Trust 2019-1A B — 2.53% 1/16/2024(e) | | | 17,546,000 | | | | 17,638,868 | | |
Prestige Auto Receivables Trust 2017-1A C — 2.81% 1/17/2023(e) | | | 30,628,000 | | | | 30,657,051 | | |
Prestige Auto Receivables Trust 2016-2A C — 2.88% 11/15/2022(e) | | | 12,327,000 | | | | 12,351,205 | | |
Santander Drive Auto Receivables Trust 2017-1 C — 2.58% 5/16/2022 | | | 5,532,485 | | | | 5,535,676 | | |
Santander Drive Auto Receivables Trust 2016-2 C — 2.66% 11/15/2021 | | | 1,886,623 | | | | 1,888,038 | | |
Santander Drive Auto Receivables Trust 2017-2 C — 2.79% 8/15/2022 | | | 10,382,086 | | | | 10,398,316 | | |
Toyota Auto Receivables Owner Trust 2019-C A3 — 1.91% 9/15/2023 | | | 37,055,000 | | | | 37,006,625 | | |
Westlake Automobile Receivables Trust 2018-1A C — 2.92% 5/15/2023(e) | | | 12,425,000 | | | | 12,460,620 | | |
World Omni Auto Receivables Trust 2018-A A3 — 2.50% 4/17/2023 | | | 31,463,000 | | | | 31,594,968 | | |
World Omni Auto Receivables Trust 2018-A B — 2.89% 4/15/2025 | | | 4,865,000 | | | | 4,944,060 | | |
World Omni Auto Receivables Trust 2018-B A4 — 3.03% 6/17/2024 | | | 1,982,000 | | | | 2,032,071 | | |
World Omni Auto Receivables Trust 2019-A A3 — 3.04% 5/15/2024 | | | 30,746,000 | | | | 31,310,361 | | |
World Omni Auto Receivables Trust 2019-A B — 3.34% 6/16/2025 | | | 10,560,000 | | | | 10,947,509 | | |
World Omni Automobile Lease Securitization Trust 2019-B A4 —
2.07% 2/18/2025 | | | 21,951,000 | | | | 21,943,642 | | |
23
FPA NEW INCOME, INC.
PORTFOLIO OF INVESTMENTS (Continued)
September 30, 2019
BONDS & DEBENTURES — Continued | | Principal
Amount | | Fair
Value | |
World Omni Automobile Lease Securitization Trust 2019-B B —
2.13% 2/18/2025 | | $ | 12,293,000 | | | $ | 12,287,682 | | |
World Omni Automobile Lease Securitization Trust 2017-A A4 —
2.32% 8/15/2022 | | | 5,495,000 | | | | 5,495,819 | | |
World Omni Automobile Lease Securitization Trust 2017-A B —
2.48% 8/15/2022 | | | 10,143,000 | | | | 10,134,205 | | |
World Omni Automobile Lease Securitization Trust 2018-B B —
3.43% 3/15/2024 | | | 11,060,000 | | | | 11,267,448 | | |
| | | $ | 1,303,878,905 | | |
COLLATERALIZED LOAN OBLIGATION — 8.9% | |
Adams Mill CLO Ltd. 2014-1A B2R — 3.35% 7/15/2026(e) | | $ | 8,136,000 | | | $ | 8,219,085 | | |
B&M CLO Ltd. 2014-1A A2R, FRN — 3.922% 4/16/2026(d)(e) | | | 12,409,000 | | | | 12,410,365 | | |
Black Diamond CLO Ltd. 2014-1A A1R, 3M USD LIBOR + 1.150% —
3.453% 10/17/2026(d)(e) | | | 24,117,407 | | | | 24,125,197 | | |
Cerberus Loan Funding XVIII LP 2017-1A A,
3M USD LIBOR + 1.750% — 4.537% 4/15/2027(d)(e) | | | 39,334,526 | | | | 39,349,080 | | |
Cerberus Loan Funding XXI LP 2017-4A A, FRN —
3.753% 10/15/2027(d)(e) | | | 38,840,000 | | | | 38,830,756 | | |
Elm Trust 2016-1A A2 — 4.163% 6/20/2025(e) | | | 3,593,791 | | | | 3,609,055 | | |
Elm Trust 2018-2A A2 — 4.605% 10/20/2027(e) | | | 22,693,000 | | | | 23,072,062 | | |
Fortress Credit Opportunities IX CLO Ltd. 2017-9A A1T, FRN —
3.708% 11/15/2029(d)(e) | | | 36,720,000 | | | | 36,524,870 | | |
Fortress Credit Opportunities IX CLO Ltd. 2017-9A E, FRN —
9.408% 11/15/2029(d)(e) | | | 12,772,000 | | | | 12,109,261 | | |
Fortress Credit Opportunities VII CLO, Ltd. 2016-7I E,
3M USD LIBOR + 7.490% — 9.609% 12/15/2028(d) | | | 20,977,000 | | | | 20,068,906 | | |
Halcyon Loan Advisors Funding Ltd. 2015-3A A1R,
3M USD LIBOR + 0.90% — 3.20% 10/18/2027(d)(e) | | | 43,913,000 | | | | 43,912,912 | | |
Halcyon Loan Advisors Funding Ltd. 2015-1A AR, FRN —
3.198% 4/20/2027(d)(e) | | | 42,064,482 | | | | 42,032,471 | | |
Halcyon Loan Advisors Funding Ltd. 2014-3A AR,
3M USD LIBOR + 1.100% — 3.378% 10/22/2025(d)(e) | | | 10,398,130 | | | | 10,399,201 | | |
Hercules Capital Funding Trust 2018-1A A — 4.605% 11/22/2027(e) | | | 21,762,000 | | | | 22,041,326 | | |
Hercules Capital Funding Trust 2019-1A A — 4.703% 2/20/2028(e) | | | 47,606,000 | | | | 48,369,481 | | |
Ivy Hill Middle Market Credit Fund VII Ltd. — 3.55% 7/18/2030(d)(e) | | | 26,085,000 | | | | 25,682,195 | | |
Ivy Hill Middle Market Credit Fund VII Ltd. 7A AR, FRN —
3.808% 10/20/2029(d)(e) | | | 7,430,000 | | | | 7,422,771 | | |
Saranac CLO III Ltd. 2014-3A ALR, FRN — 3.259% 6/22/2030(d)(e) | | | 26,217,000 | | | | 26,173,008 | | |
Silvermore CLO Ltd. 2014-1A A1R, 3M USD LIBOR + 1.170% —
3.328% 5/15/2026(d)(e) | | | 14,758,913 | | | | 14,769,584 | | |
24
FPA NEW INCOME, INC.
PORTFOLIO OF INVESTMENTS (Continued)
September 30, 2019
BONDS & DEBENTURES — Continued | | Principal
Amount | | Fair
Value | |
Symphony CLO XII Ltd. 2013-12A B2R — 3.389% 10/15/2025(e) | | $ | 15,800,000 | | | $ | 15,904,912 | | |
Telos CLO 2013-3A AR, 3M USD LIBOR + 1.300% —
3.603% 7/17/2026(d)(e) | | | 23,124,000 | | | | 23,134,082 | | |
Telos CLO 2013-3A BR, 3M USD LIBOR + 2.000% —
4.303% 7/17/2026(d)(e) | | | 20,894,000 | | | | 20,858,021 | | |
Telos CLO Ltd. 2014-5A A1R, FRN — 3.253% 4/17/2028(d)(e) | | | 32,022,000 | | | | 31,920,618 | | |
THL Credit Wind River CLO Ltd. 2016-1A AR, FRN —
3.353% 7/15/2028(d)(e) | | | 27,873,000 | | | | 27,812,070 | | |
VCO CLO LLC 2018-1A A, FRN — 3.778% 7/20/2030(d)(e) | | | 26,276,000 | | | | 26,281,570 | | |
Wellfleet CLO Ltd. 2016-1A AR, FRN — 3.188% 4/20/2028(d)(e) | | | 26,029,000 | | | | 25,941,204 | | |
West CLO Ltd. 2014-2A A1BR — 2.724% 1/16/2027(e) | | | 6,795,526 | | | | 6,797,456 | | |
West CLO Ltd. 2013-1A A2BR — 3.393% 11/7/2025(e) | | | 10,887,654 | | | | 10,918,335 | | |
Zais CLO 2 Ltd. 2014-2A A1BR — 2.92% 7/25/2026(e) | | | 3,663,345 | | | | 3,662,796 | | |
| | | $ | 652,352,650 | | |
CREDIT CARD — 4.5% | |
American Express Credit Account Master Trust 2017-6 B —
2.20% 5/15/2023 | | $ | 39,998,000 | | | $ | 40,024,591 | | |
American Express Credit Account Master Trust 2019-2 A —
2.67% 11/15/2024 | | | 16,863,000 | | | | 17,212,932 | | |
American Express Credit Account Master Trust 2019-1 A —
2.87% 10/15/2024 | | | 15,004,000 | | | | 15,365,049 | | |
Barclays Dryrock Issuance Trust 2019-1 A — 1.96% 5/15/2025 | | | 57,546,000 | | | | 57,559,034 | | |
Capital One Multi-Asset Execution Trust 2017-A1 A1 — 2.00% 1/17/2023 | | | 49,036,000 | | | | 49,020,951 | | |
Golden Credit Card Trust 2018-1A A — 2.62% 1/15/2023(e) | | | 32,022,000 | | | | 32,278,000 | | |
Synchrony Card Funding LLC 2019-A2 A — 2.34% 6/15/2025 | | | 63,891,000 | | | | 64,433,569 | | |
Synchrony Card Issuance Trust 2018-A1 A1 — 3.38% 9/15/2024 | | | 56,311,000 | | | | 57,779,095 | | |
| | | $ | 333,673,221 | | |
EQUIPMENT — 15.5% | |
ARI Fleet Lease Trust 2019-A A2A — 2.41% 11/15/2027(e) | | $ | 23,167,000 | | | $ | 23,304,559 | | |
ARI Fleet Lease Trust 2018-A A3 — 2.84% 10/15/2026(e) | | | 13,974,000 | | | | 14,094,847 | | |
Ascentium Equipment Receivables Trust 2017-2A A3 —
2.31% 12/10/2021(e) | | | 11,172,000 | | | | 11,187,621 | | |
Ascentium Equipment Receivables Trust 2019-1A A3 —
2.83% 5/12/2025(e) | | | 58,897,000 | | | | 60,043,889 | | |
Avis Budget Rental Car Funding AESOP LLC 2014-2A A —
2.50% 2/20/2021(e) | | | 5,153,333 | | | | 5,155,211 | | |
Avis Budget Rental Car Funding AESOP LLC 2015-1A A —
2.50% 7/20/2021(e) | | | 48,657,000 | | | | 48,694,510 | | |
Avis Budget Rental Car Funding AESOP LLC 2015-2A A —
2.63% 12/20/2021(e) | | | 22,666,000 | | | | 22,734,716 | | |
25
FPA NEW INCOME, INC.
PORTFOLIO OF INVESTMENTS (Continued)
September 30, 2019
BONDS & DEBENTURES — Continued | | Principal
Amount | | Fair
Value | |
Avis Budget Rental Car Funding AESOP LLC 2017-2A A —
2.97% 3/20/2024(e) | | $ | 8,580,000 | | | $ | 8,766,033 | | |
Avis Budget Rental Car Funding AESOP LLC 2019-1A A —
3.45% 3/20/2023(e) | | | 13,010,000 | | | | 13,365,994 | | |
CCG Receivables Trust 2018-1 A2 — 2.50% 6/16/2025(e) | | | 7,506,256 | | | | 7,525,105 | | |
Chesapeake Funding II LLC 2019-2A A1 — 1.95% 9/15/2031(e) | | | 51,877,000 | | | | 51,752,028 | | |
Chesapeake Funding II LLC 2017-4A A1 — 2.12% 11/15/2029(e) | | | 15,818,565 | | | | 15,811,945 | | |
Coinstar Funding LLC Series 2017-1A A2 — 5.216% 4/25/2047(e) | | | 8,268,673 | | | | 8,540,379 | | |
Daimler Trucks Retail Trust 2019-1 A4 — 2.79% 5/15/2025(e) | | | 23,397,000 | | | | 23,672,254 | | |
Dell Equipment Finance Trust 2017-2 A3 — 2.19% 10/24/2022(e) | | | 4,644,531 | | | | 4,644,420 | | |
Dell Equipment Finance Trust 2019-1 B — 2.94% 3/22/2024(e) | | | 27,810,000 | | | | 28,285,429 | | |
Enterprise Fleet Financing LLC 2017-2 A2 — 1.97% 1/20/2023(e) | | | 4,899,097 | | | | 4,894,487 | | |
Enterprise Fleet Financing LLC 2017-3 A2 — 2.13% 5/22/2023(e) | | | 8,430,391 | | | | 8,424,610 | | |
Enterprise Fleet Financing LLC 2017-2 A3 — 2.22% 1/20/2023(e) | | | 23,511,000 | | | | 23,524,025 | | |
Enterprise Fleet Financing LLC 2019-2 A2 — 2.29% 2/20/2025(e) | | | 46,144,000 | | | | 46,277,836 | | |
Enterprise Fleet Financing LLC 2017-1 A3 — 2.60% 7/20/2022(e) | | | 9,653,000 | | | | 9,672,626 | | |
GreatAmerica Leasing Receivables Funding LLC 2019-1 A4 —
3.21% 2/18/2025(e) | | | 10,720,000 | | | | 11,028,802 | | |
GreatAmerica Leasing Receivables Funding LLC Series 2017-1 A4 —
2.36% 1/20/2023(e) | | | 6,662,000 | | | | 6,664,238 | | |
GreatAmerica Leasing Receivables Funding LLC Series 2018-1 A4 —
2.83% 6/17/2024(e) | | | 8,631,000 | | | | 8,719,221 | | |
GreatAmerica Leasing Receivables Funding LLC Series 2017-1 C —
2.89% 1/22/2024(e) | | | 2,609,000 | | | | 2,619,237 | | |
GreatAmerica Leasing Receivables Funding LLC Series 2018-1 B —
2.99% 6/17/2024(e) | | | 920,000 | | | | 934,008 | | |
Hertz Fleet Lease Funding LP 2018-1 A2 — 3.23% 5/10/2032(e) | | | 15,370,514 | | | | 15,480,677 | | |
HPEFS Equipment Trust 2019-1A B — 2.32% 9/20/2029(e) | | | 6,292,000 | | | | 6,296,649 | | |
John Deere Owner Trust 2019-B A3 — 2.21% 12/15/2023 | | | 15,542,000 | | | | 15,638,340 | | |
John Deere Owner Trust 2018-A A4 — 2.91% 1/15/2025 | | | 24,496,000 | | | | 24,775,999 | | |
John Deere Owner Trust 2019 A A4 — 3.00% 1/15/2026 | | | 13,310,000 | | | | 13,698,982 | | |
John Deere Owner Trust 2018-B A4 — 3.23% 6/16/2025 | | | 26,991,000 | | | | 27,723,606 | | |
Kubota Credit Owner Trust 2018-1A A3 — 3.10% 8/15/2022(e) | | | 41,762,000 | | | | 42,243,712 | | |
Kubota Credit Owner Trust 2018-1A A4 — 3.21% 1/15/2025(e) | | | 6,709,000 | | | | 6,888,615 | | |
MMAF Equipment Finance LLC 2017-B A4 — 2.41% 11/15/2024(e) | | | 16,545,000 | | | | 16,670,964 | | |
MMAF Equipment Finance LLC 2017-B A3 — 2.21% 10/17/2022(e) | | | 18,606,411 | | | | 18,611,648 | | |
MMAF Equipment Finance LLC 2019 A A3 — 2.84% 11/13/2023(e) | | | 23,174,000 | | | | 23,550,281 | | |
NextGear Floorplan Master Owner Trust 2017-1A A2 —
2.54% 4/18/2022(e) | | | 22,933,000 | | | | 22,952,842 | | |
26
FPA NEW INCOME, INC.
PORTFOLIO OF INVESTMENTS (Continued)
September 30, 2019
BONDS & DEBENTURES — Continued | | Principal
Amount | | Fair
Value | |
NextGear Floorplan Master Owner Trust 2017-2A B —
3.02% 10/17/2022(e) | | $ | 20,252,000 | | | $ | 20,375,705 | | |
NextGear Floorplan Master Owner Trust 2018-1A A2 —
3.22% 2/15/2023(e) | | | 12,191,000 | | | | 12,345,666 | | |
Prop Series 2017-1A — 5.30% 3/15/2042(b) | | | 23,138,817 | | | | 22,765,958 | | |
Verizon Owner Trust 2019 A A1A — 2.93% 9/20/2023 | | | 36,729,000 | | | | 37,411,458 | | |
Verizon Owner Trust 2019 A B — 3.02% 9/20/2023 | | | 18,870,000 | | | | 19,362,764 | | |
Verizon Owner Trust 2017-2A A — 1.92% 12/20/2021(e) | | | 18,622,340 | | | | 18,605,492 | | |
Verizon Owner Trust 2017-3A A1A — 2.06% 4/20/2022(e) | | | 20,678,000 | | | | 20,676,629 | | |
Verizon Owner Trust 2017-2A B — 2.22% 12/20/2021(e) | | | 24,147,000 | | | | 24,144,469 | | |
Verizon Owner Trust 2017-3A B — 2.38% 4/20/2022(e) | | | 19,491,000 | | | | 19,528,900 | | |
Verizon Owner Trust 2019-B B — 2.40% 12/20/2023 | | | 42,076,000 | | | | 42,426,081 | | |
Verizon Owner Trust 2017-1A B — 2.45% 9/20/2021(e) | | | 33,818,000 | | | | 33,858,254 | | |
Verizon Owner Trust 2018-1A B — 3.05% 9/20/2022(e) | | | 24,278,000 | | | | 24,573,548 | | |
Verizon Owner Trust 2018-A B — 3.38% 4/20/2023 | | | 26,414,000 | | | | 27,210,686 | | |
Volvo Financial Equipment LLC Series 2017-1A A4 —
2.21% 11/15/2021(e) | | | 5,966,000 | | | | 5,965,922 | | |
Volvo Financial Equipment LLC Series 2018-1A A3 —
2.54% 2/15/2022(e) | | | 40,208,000 | | | | 40,328,733 | | |
Volvo Financial Equipment LLC Series 2019-1A A4 —
3.13% 11/15/2023(e) | | | 17,060,000 | | | | 17,525,056 | | |
Wheels SPV 2 LLC 2019-1A A3 — 2.35% 5/22/2028(e) | | | 32,817,000 | | | | 32,999,298 | | |
Wheels SPV 2 LLC 2018-1A A3 — 3.24% 4/20/2027(e) | | | 12,759,000 | | | | 12,987,543 | | |
| | | $ | 1,137,962,507 | | |
OTHER — 4.4% | |
Conn Funding II LP 2017-B B — 4.52% 4/15/2021(e) | | $ | 672,325 | | | $ | 672,882 | | |
New Residential Advance Receivables Trust Advance Receivables Backed
2019-T3 AT3 — 2.512% 10/20/2052(e) | | | 31,615,000 | | | | 31,680,829 | | |
New Residential Mortgage LLC 2018-FNT1 A — 3.61% 5/25/2023(e) | | | 24,371,852 | | | | 24,356,619 | | |
New Residential Mortgage LLC 2018-FNT2 A — 3.79% 7/25/2054(e) | | | 29,718,051 | | | | 29,699,477 | | |
NRZ Excess Spread-Collateralized Notes Series 2018-PLS1 A —
3.193% 1/25/2023(e) | | | 11,790,090 | | | | 11,782,721 | | |
NRZ Excess Spread-Collateralized Notes Series 2018-PLS2 A —
3.265% 2/25/2023(e) | | | 13,364,306 | | | | 13,355,954 | | |
PFS Financing Corp. 2017-BA A2 — 2.22% 7/15/2022(e) | | | 22,138,000 | | | | 22,129,408 | | |
PFS Financing Corp. 2017-D A — 2.40% 10/17/2022(e) | | | 16,852,000 | | | | 16,870,679 | | |
PFS Financing Corp. 2017-BA B — 2.57% 7/15/2022(e) | | | 7,305,000 | | | | 7,284,258 | | |
PFS Financing Corp. 2017-D B — 2.74% 10/17/2022(e) | | | 7,798,000 | | | | 7,790,653 | | |
PFS Financing Corp. 2019-A A2 — 2.86% 4/15/2024(e) | | | 20,397,000 | | | | 20,786,050 | | |
PFS Financing Corp. 2018-B A — 2.89% 2/15/2023(e) | | | 28,344,000 | | | | 28,609,654 | | |
27
FPA NEW INCOME, INC.
PORTFOLIO OF INVESTMENTS (Continued)
September 30, 2019
BONDS & DEBENTURES — Continued | | Principal
Amount | | Fair
Value | |
PFS Financing Corp. 2018-B B — 3.08% 2/15/2023(e) | | $ | 7,809,000 | | | $ | 7,867,213 | | |
PFS Financing Corp. 2019-A B — 3.13% 4/15/2024(e) | | | 4,897,000 | | | | 4,992,381 | | |
PFS Financing Corp. 2018-D A — 3.19% 4/17/2023(e) | | | 35,001,000 | | | | 35,526,533 | | |
PFS Financing Corp. 2018-D B — 3.45% 4/17/2023(e) | | | 17,375,000 | | | | 17,589,079 | | |
PFS Financing Corp. 2018-F A — 3.52% 10/15/2023(e) | | | 31,951,000 | | | | 32,436,700 | | |
PFS Financing Corp. 2018-F B — 3.77% 10/15/2023(e) | | | 5,641,000 | | | | 5,741,989 | | |
| | | $ | 319,173,079 | | |
| TOTAL ASSET-BACKED SECURITIES (Cost $3,722,292,747) | | $ | 3,747,040,362 | | |
CORPORATE BONDS & NOTES — 1.8% | |
BASIC MATERIALS — 0.9% | |
PT Boart Longyear Management Pty Ltd.
PIK, 10.00% Cash or 12.00% PIK — 10.00% 12/31/2022 | | $ | 67,602,030 | | | $ | 65,742,974 | | |
COMMUNICATIONS — 0.2% | |
Cisco Systems, Inc. — 2.45% 6/15/2020 | | $ | 19,864,000 | | | $ | 19,934,517 | | |
CONSUMER, CYCLICAL — 0.0% | |
Continental Airlines 2000-1 Class B Pass Through Trust —
8.388% 5/1/2022 | | $ | 2,523 | | | $ | 2,765 | | |
CONSUMER, NON-CYCLICAL — 0.6% | |
StoneMor Partners LP / Cornerstone Family Services of West Virginia
Subsidiary — 11.50% 6/30/2024(e) | | $ | 44,039,419 | | | $ | 43,158,630 | | |
ENERGY — 0.1% | |
Bristow Group, Inc. — 8.75% 3/1/2023(e) | | $ | 4,067,000 | | | $ | 4,005,995 | | |
INDUSTRIAL — 0.0% | |
Air 2 U.S. — 8.027% 10/1/2020(e) | | $ | 133,950 | | | $ | 133,950 | | |
TECHNOLOGY — 0.0% | |
Oracle Corp. — 3.875% 7/15/2020 | | $ | 842,000 | | | $ | 853,922 | | |
| TOTAL CORPORATE BONDS & NOTES (Cost $134,332,517) | | $ | 133,832,753 | | |
28
FPA NEW INCOME, INC.
PORTFOLIO OF INVESTMENTS (Continued)
September 30, 2019
BONDS & DEBENTURES — Continued | | Principal
Amount | | Fair
Value | |
CORPORATE BANK DEBT — 3.1% | |
ABG Intermediate Holdings 2 LLC, 1M USD LIBOR + 7.750% —
9.794% 9/29/2025(a)(d) | | $ | 28,974,986 | | | $ | 28,878,499 | | |
Barneys New York Inc., 1M USD LIBOR + 8.000% —
10.100% 3/31/2020(a)(b)(d)(g) | | | 9,223,790 | | | | 9,150,719 | | |
Boart Longyear Management Pty Ltd TL, 10.000% Cash or 11.000%
PIK — 11.00% 10/23/2020(a) | | | 4,624,690 | | | | 4,615,117 | | |
Del Friscos Rstrant Group, Inc., 1M USD LIBOR + 5.500% —
7.554% 12/31/2019(a)(b)(d)(g) | | | 8,507,000 | | | | 8,507,000 | | |
General Nutrition Centers, Inc., 1M USD LIBOR + 7.000% —
9.050% 12/31/2022(a)(d) | | | 19,406,000 | | | | 19,406,000 | | |
JC Penney Corp., Inc., 3M USD LIBOR + 4.250% —
6.394% 6/23/2023(a)(d) | | | 33,052,349 | | | | 28,755,544 | | |
Logix Holding Co. LLC TL 1L, 1M USD LIBOR + 5.750% —
7.794% 12/22/2024(a)(d) | | | 14,096,134 | | | | 14,058,921 | | |
MB2LTL, 2M USD LIBOR + 9.250% — 11.340% 11/30/2023(a)(b)(d) | | | 6,816,000 | | | | 6,829,427 | | |
OTGTL, 3M USD LIBOR + 7.000% — 9.261% 8/23/2021(a)(b)(d) | | | 25,573,000 | | | | 25,597,294 | | |
| SDTL, 1M USD LIBOR + 4.500% — 6.544% 11/22/2011(a)(b)(d) | | | 10,508,411 | | | | 10,409,411 | | |
Transform SR Holdings LLC Term Loan B, 1M USD LIBOR + 7.250% —
9.296% 2/12/2024(a)(d) | | | 28,872,000 | | | | 28,944,180 | | |
Xplornet Communication, Inc., 3M USD LIBOR + 4.000% —
6.104% 9/9/2021(a)(d) | | | 28,792,419 | | | | 28,543,364 | | |
ZW1L, 3M USD LIBOR + 5.000% — 7.260% 11/16/2022(a)(b)(d) | | | 13,255,175 | | | | 13,276,251 | | |
ZW2L, 3M USD LIBOR + 9.000% — 11.280% 11/16/2023(a)(b)(d) | | | 3,090,236 | | | | 3,115,144 | | |
| TOTAL CORPORATE BANK DEBT (Cost $232,038,194) | | $ | 230,086,871 | | |
U.S. TREASURIES — 10.7% | |
U.S. Treasury Bills — 2.025% 10/8/2019 | | $ | 81,285,000 | | | $ | 81,257,664 | | |
U.S. Treasury Bills — 1.939% 10/15/2019 | | | 100,819,000 | | | | 100,751,058 | | |
U.S. Treasury Bills — 1.859% 10/22/2019 | | | 105,123,000 | | | | 105,012,495 | | |
U.S. Treasury Notes — 1.75% 4/30/2022 | | | 247,624,000 | | | | 248,569,577 | | |
U.S. Treasury Notes — 1.875% 4/30/2022 | | | 245,900,000 | | | | 247,564,251 | | |
| TOTAL U.S. TREASURIES (Cost $779,883,551) | | $ | 783,155,045 | | |
| TOTAL BONDS & DEBENTURES — 99.4% (Cost $7,261,686,415) | | $ | 7,285,591,332 | | |
| TOTAL INVESTMENT SECURITIES — 99.8% (Cost $7,293,451,366) | | $ | 7,318,373,421 | | |
29
FPA NEW INCOME, INC.
PORTFOLIO OF INVESTMENTS (Continued)
September 30, 2019
SHORT-TERM INVESTMENTS — 0.2% | | Principal
Amount | | Fair
Value | |
State Street Bank Repurchase Agreement — 0.25% 10/1/2019 | |
(Dated 09/30/2019, repurchase price of $11,109,077, collateralized by
$11,225,000 principal amount U.S. Treasury Notes — 1.750% 2022,
fair value $11,333,074) | | $ | 11,109,000 | | | $ | 11,109,000 | | |
| TOTAL SHORT-TERM INVESTMENTS (Cost $11,109,000) | | $ | 11,109,000 | | |
| TOTAL INVESTMENTS — 100.0% (Cost $7,304,560,366) | | $ | 7,329,482,421 | | |
Other assets and liabilities, net — 0.0% | | | (2,078,660 | ) | |
NET ASSETS — 100.0% | | $ | 7,327,403,761 | | |
(a) Restricted securities. These restricted securities constituted 3.57% of total net assets at September 30, 2019, most of which are considered liquid by the Adviser. These securities are not registered and may not be sold to the public. There are legal and/or contractual restrictions on resale. The Fund does not have the right to demand that such securities be registered. The values of these securities are determined by valuations provided by pricing services, brokers, dealers, market makers, or in good faith under policies adopted by authority of the Fund's Board of Directors.
(b) Investments valued using significant unobservable inputs (Level 3) (See Note 6 of the Notes to Financial Statements).
(c) Non-income producing security.
(d) Variable/Floating Rate Security — The rate shown is based on the latest available information as of September 30, 2019. For Corporate Bank Debt, the rate shown may represent a weighted average interest rate. Certain variable rate securities are not based on a published rate and spread but are determined by the issuer or agent and are based on current market conditions. These securities do not indicate a reference rate and spread in their description.
(e) Security exempt from registration under Rule 144A of the Securities Act of 1933. These securities may be resold in transactions exempt from registration, typically only to qualified institutional buyers. Unless otherwise indicated, these securities are not considered to be illiquid.
(f) Zero coupon bond. Coupon amount represents effective yield to maturity.
(g) These securities have been valued in good faith under policies adopted by authority of the Board of Directors in accordance with the Fund's fair value procedures. These securities constituted 0.67% of total net assets at September 30, 2019.
30
FPA NEW INCOME, INC.
PORTFOLIO OF INVESTMENTS — RESTRICTED SECURITIES
September 30, 2019
Issuer | | Acquisition
Date (s) | | Cost | | Fair Value | | Fair
Value as a %
of Net Assets | |
ABG Intermediate Holdings
2 LLC, 1M USD LIBOR +
7.750 — 9.794% 9/29/2025
| | 9/26/2017, 4/11/2018,
6/21/2018, 6/25/2018,
7/3/2018, 11/2/2018,
12/3/2018, 1/11/2019,
2/12/2019, 5/29/2019,
9/20/2019, 9/27/2019 | | $ | 28,925,163 | | | $ | 28,878,499 | | | | 0.39 | % | |
Barneys New York Inc.,
1M USD LIBOR + 8.000% —
10.100% 3/31/2020 | | 8/14/2019 | | | 9,150,576 | | | | 9,150,719 | | | | 0.13 | % | |
Boart Longyear Management
Pty Ltd TL, 10.000% Cash or
11.000% PIK — 11.000%
10/23/2020 | | 3/29/2018, 9/29/2019,
12/31/2018, 1/11/2019,
3/29/2019, 6/28/2019 | | | 4,563,293 | | | | 4,615,117 | | | | 0.06 | % | |
Del Friscos Rstrant Group, Inc.,
1M USD LIBOR + 5.500% —
7.554% 12/31/2019 | | 9/27/2019 | | | 8,507,010 | | | | 8,507,000 | | | | 0.12 | % | |
General Nutrition Centers, Inc.,
1M USD LIBOR + 7.000% —
9.050% 12/31/2022 | | 12/21/2018 | | | 19,406,000 | | | | 19,406,000 | | | | 0.26 | % | |
JC Penney Corp., Inc., 3M USD
LIBOR + 4.250% — 6.394%
6/23/2023
| | 10/4/2017, 10/5/2017,
10/6/2017, 10/11/2017,
11/19/2018, 11/27/2018,
1/11/2019, 2/8/2019,
3/11/2019, 5/29/2019, | | | 30,993,621 | | | | 28,755,544 | | | | 0.39 | % | |
Logix Holding Co. LLC TL 1L,
1M USD LIBOR + 5.750% —
7.794% 12/22/2024 | | 8/11/2017, 1/11/2019,
6/18/2019, 6/19/2019,
9/30/2019 | | | 14,012,784 | | | | 14,058,921 | | | | 0.19 | % | |
MB2LTL, 2M USD LIBOR +
9.250% — 11.340%
11/30/2023 | | 12/2/2016, 1/31/2017 | | | 6,746,534 | | | | 6,829,427 | | | | 0.09 | % | |
OTGTL, 3M USD LIBOR +
7.000% — 9.261% 8/23/2021 | | 8/26/2016, 11/30/2017,
1/26/2018, 3/8/2018,
5/9/2018, 5/15/2018,
6/13/2018, 7/13/2018,
8/17/2018, 10/10/2018 | | | 25,352,145 | | | | 25,597,294 | | | | 0.35 | % | |
PHI Group, Inc. | | 8/19/2019 | | | 21,538,047 | | | | 21,626,709 | | | | 0.30 | % | |
PHI Group, Inc., Restricted | | 9/4/2019 | | | 9,593,358 | | | | 10,004,641 | | | | 0.14 | % | |
31
FPA NEW INCOME, INC.
PORTFOLIO OF INVESTMENTS — RESTRICTED SECURITIES (Continued)
September 30, 2019
Issuer | | Acquisition
Date (s) | | Cost | | Fair Value | | Fair
Value as a %
of Net Assets | |
SDTL, 1M USD LIBOR +
4.500 — 6.544%, 11/22/2021
1M USD LIBOR + 4.500 —
6.544% | | 8/26/2016,12/22/2016,
11/30/2017, 1/26/2018,
3/8/2018, 5/9/2018,
5/15/2018, 7/13/2018,
8/17/2018, 9/30/2019
| | $ | 10,407,597 | | | $ | 10,409,411 | | | | 0.14 | % | |
Transform SR Holdings LLC
Term Loan B, 1M USD
LIBOR + 7.250% —
9.296% 2/12/2024 | | 2/11/2019, 2/19/2019,
8/2/2019, 9/5/2019,
9/11/2019 | | | 28,987,088 | | | | 28,944,180 | | | | 0.40 | % | |
Xplornet Communication, Inc.,
3M USD LIBOR + 4.000% —
6.104% 9/9/2021 | | 1/11/2019, 6/13/2019,
6/28/2019, 9/24/2019 | | | 28,747,170 | | | | 28,543,364 | | | | 0.39 | % | |
ZW1L, 3M USD LIBOR +
5.000% — 7.260% 11/16/2022 | | 11/17/2016, 4/30/2019 | | | 13,180,111 | | | | 13,276,251 | | | | 0.18 | % | |
ZW2L, 3M USD LIBOR +
9.000% — 11.280% 11/16/2023 | | 11/17/2016, 4/22/2019 | | | 3,059,101 | | | | 3,115,144 | | | | 0.04 | % | |
TOTAL RESTRICTED
SECURITIES | | | | $ | 263,169,598 | | | $ | 261,718,221 | | | | 3.57 | % | |
See accompanying Notes to Financial Statements.
32
FPA NEW INCOME, INC.
STATEMENT OF ASSETS AND LIABILITIES
September 30, 2019
ASSETS | |
Investment securities — at fair value (identified cost $7,293,451,366) | | $ | 7,318,373,421 | | |
Short-term investments — at amortized cost (maturities 60 days or less) | | | 11,109,000 | | |
| Cash | | | 2,252,660 | | |
Receivable for: | |
| Interest | | | 22,855,598 | | |
Capital Stock sold | | | 6,170,222 | | |
Prepaid expenses and other assets | | | 15,591 | | |
Total assets | | | 7,360,776,492 | | |
LIABILITIES | |
Payable for: | |
Investment securities purchased | | | 26,414,139 | | |
Capital Stock repurchased | | | 3,965,361 | | |
Advisory fees | | | 2,179,021 | | |
Accrued expenses and other liabilities | | | 814,210 | | |
Total liabilities | | | 33,372,731 | | |
NET ASSETS | | $ | 7,327,403,761 | | |
SUMMARY OF SHAREHOLDERS' EQUITY | |
Capital Stock — par value $0.01 per share; authorized 1,000,000,000 shares;
outstanding 732,605,811 shares | | $ | 7,326,058 | | |
| Additional Paid-in Capital | | | 7,731,652,571 | | |
| Distributable earnings | | | (411,574,868 | ) | |
NET ASSETS | | $ | 7,327,403,761 | | |
NET ASSET VALUE | |
Offering and redemption price per share | | $ | 10.00 | | |
See accompanying Notes to Financial Statements.
33
FPA NEW INCOME, INC.
STATEMENT OF OPERATIONS
For the Year Ended September 30, 2019
INVESTMENT INCOME | |
Dividends | | $ | 569 | | |
Interest | | | 216,390,483 | | |
Total investment income | | | 216,391,052 | | |
EXPENSES | |
Advisory fees | | | 32,820,141 | | |
Transfer agent fees and expenses | | | 2,869,537 | | |
Administrative services fees | | | 345,822 | | |
Reports to shareholders | | | 325,991 | | |
Other professional fees | | | 312,979 | | |
Director fees and expenses | | | 288,865 | | |
Custodian fees | | | 217,443 | | |
Filing fees | | | 202,978 | | |
Legal fees | | | 59,447 | | |
Audit and tax services fees | | | 44,704 | | |
Other | | | 56,981 | | |
Total expenses | | | 37,544,888 | | |
Reimbursement from Adviser | | | (4,947,615 | ) | |
Net expenses | | | 32,597,273 | | |
Net investment income | | | 183,793,779 | | |
NET REALIZED AND UNREALIZED APPRECIATION (DEPRECIATION) | |
Net realized gain (loss) on: | |
Investments | | | (47,606,856 | ) | |
Net change in unrealized appreciation (depreciation) of: | |
Investments | | | 139,208,490 | | |
Net realized and unrealized gain | | | 91,601,634 | | |
NET INCREASE IN NET ASSETS RESULTING FROM OPERATIONS | | $ | 275,395,413 | | |
See accompanying Notes to Financial Statements.
34
FPA NEW INCOME, INC.
STATEMENTS OF CHANGES IN NET ASSETS
| | | Year Ended
September 30, 2019 | | Year Ended
September 30, 2018 | |
INCREASE (DECREASE) IN NET ASSETS | |
Operations: | |
Net investment income | | $ | 183,793,779 | | | $ | 159,357,741 | | |
Net realized loss | | | (47,606,856 | ) | | | (2,863,146 | ) | |
Net change in unrealized appreciation (depreciation) | | | 139,208,490 | | | | (55,570,820 | ) | |
Net increase in net assets resulting from operations | | | 275,395,413 | | | | 100,923,775 | | |
Distributions to shareholders | | | (224,500,483 | ) | | | (158,423,878 | ) | |
Capital Stock transactions: | |
Proceeds from Capital Stock sold | | | 3,391,626,872 | | | | 1,928,497,160 | | |
Proceeds from shares issued to shareholders upon reinvestment of
dividends and distributions | | | 197,443,145 | | | | 140,658,458 | | |
Cost of Capital Stock repurchased | | | (2,017,185,013 | ) | | | (1,432,464,308 | ) | |
Net increase from Capital Stock transactions | | | 1,571,885,004 | | | | 636,691,310 | | |
Total change in net assets | | | 1,622,779,934 | | | | 579,191,207 | | |
NET ASSETS | |
Beginning of Year | | | 5,704,623,827 | | | | 5,125,432,620 | | |
End of Year | | $ | 7,327,403,761 | | | $ | 5,704,623,827 | | |
CHANGE IN CAPITAL STOCK OUTSTANDING | |
Shares of Capital Stock sold | | | 341,922,692 | | | | 193,790,432 | | |
Shares issued to shareholders upon reinvestment of
dividends and distributions | | | 19,920,545 | | | | 14,159,602 | | |
Shares of Capital Stock repurchased | | | (203,171,906 | ) | | | (143,941,604 | ) | |
Change in Capital Stock outstanding | | | 158,671,331 | | | | 64,008,430 | | |
See accompanying Notes to Financial Statements.
35
FPA NEW INCOME, INC.
FINANCIAL HIGHLIGHTS
Selected Data for Each Share of Capital Stock Outstanding Throughout Each Year
| | | Year Ended September 30, | |
| | | 2019 | | 2018 | | 2017 | | 2016 | | 2015 | |
Per share operating performance: | |
Net asset value at beginning of year | | $ | 9.94 | | | $ | 10.05 | | | $ | 10.06 | | | $ | 10.08 | | | $ | 10.24 | | |
Income from investment operations: | |
Net investment income* | | | 0.28 | | | | 0.29 | | | | 0.25 | | | | 0.19 | | | | 0.15 | | |
Net realized and unrealized gain (loss)
on investment securities | | | 0.13 | | | | (0.18 | ) | | | 0.01 | | | | (0.04 | ) | | | (0.06 | ) | |
Total from investment operations | | | 0.41 | | | | 0.11 | | | | 0.26 | | | | 0.15 | | | | 0.09 | | |
Less distributions: | |
Dividends from net investment income | | | (0.35 | ) | | | (0.22 | ) | | | (0.27 | ) | | | (0.17 | ) | | | (0.25 | ) | |
Redemption fees | | | — | | | | — | | | | — | ** | | | — | ** | | | — | ** | |
Net asset value at end of year | | $ | 10.00 | | | $ | 9.94 | | | $ | 10.05 | | | $ | 10.06 | | | $ | 10.08 | | |
Total investment return*** | | | 4.20 | % | | | 1.91 | % | | | 2.58 | % | | | 1.52 | % | | | 0.84 | % | |
Ratios/supplement data: | |
Net assets, end of year (in $000's) | | $ | 7,327,404 | | | $ | 5,704,624 | | | $ | 5,125,433 | | | $ | 5,048,610 | | | $ | 5,636,518 | | |
Ratio of expenses to average net assets: | |
Before reimbursement from Adviser | | | 0.57 | % | | | 0.58 | % | | | 0.59 | % | | | 0.58 | % | | | 0.58 | % | |
After reimbursement from Adviser | | | 0.50 | % | | | 0.49 | % | | | 0.49 | % | | | 0.55 | % | | | N/A | | |
Ratio of net investment income to average
net assets: | |
| Before reimbursement from Adviser | | | 2.73 | % | | | 2.88 | % | | | 2.45 | % | | | 1.87 | % | | | 1.50 | % | |
After reimbursement from Adviser | | | 2.80 | % | | | 2.96 | % | | | 2.55 | % | | | 1.90 | % | | | N/A | | |
Portfolio turnover rate | | | 25 | % | | | 29 | % | | | 59 | % | | | 44 | % | | | 64 | % | |
* Per share amount is based on average shares outstanding.
** Rounds to less than $0.01 per share.
*** Return is based on net asset value per share, adjusted for reinvestment of distributions, and does not reflect deduction of the sales charge.
See accompanying Notes to Financial Statements.
36
FPA NEW INCOME, INC.
NOTES TO FINANCIAL STATEMENTS
September 30, 2019
NOTE 1 — Significant Accounting Policies
FPA New Income, Inc. (the "Fund") is registered under the Investment Company Act of 1940, as a diversified, open-end, management investment company. The Fund's primary investment objective is to seek current income and long-term total return. Capital preservation is also a consideration. The Fund qualifies as an investment company pursuant to Financial Accounting Standard Board (FASB) Accounting Standards Codification (ASC) No. 946, Financial Services — Investment Companies. The following is a summary of significant accounting policies consistently followed by the Fund in the preparation of its financial statements.
A. Security Valuation
The Fund's investments are reported at fair value as defined by accounting principles generally accepted in the United States of America, ("U.S. GAAP"). The Fund generally determines its net asset value as of approximately 4:00 p.m. New York time each day the New York Stock Exchange is open. Further discussion of valuation methods, inputs and classifications can be found under Disclosure of Fair Value Measurements.
B. Securities Transactions and Related Investment Income
Securities transactions are accounted for on the date the securities are purchased or sold. Dividend income and distributions to shareholders are recorded on the ex-dividend date. Interest income and expenses are recorded on an accrual basis. Market discounts and premiums on fixed income securities are amortized over the expected life of the securities. Realized gains or losses are based on the specific identification method.
C. Use of Estimates
The preparation of the financial statements in accordance with U.S. GAAP requires management to make estimates and assumptions that affect the amounts reported. Actual results could differ from those estimates.
D. Recent Accounting Pronouncements
In August 2018, the Financial Accounting Standards Board (FASB) issued Accounting Standards Update (ASU) No. 2018-13, Fair Value Measurement (Topic 820) — Disclosure Framework — Changes to the Disclosure Requirements for Fair Value Measurement. The amendments eliminate certain disclosure requirements for fair value measurements for all entities, requires public entities to disclose certain new information and modifies some disclosure requirements. The new guidance is effective for all entities for fiscal years beginning after December 15, 2019 and for interim periods within those fiscal years. An entity is permitted to early adopt either the entire standard or only the provisions that eliminate or modify requirements. The Adviser is currently evaluating the impact of this new guidance on the Fund's financial statements.
NOTE 2 — Risk Considerations
Investing in the Fund may involve certain risks including, but not limited to, those described below.
Market Risk: Because the values of the Fund's investments will fluctuate with market conditions, so will the value of your investment in the Fund. You could lose money on your investment in the Fund or the Fund could underperform other investments.
Interest Rate and Credit Risk: The values of, and the income generated by, most debt securities held by the Fund may be affected by changing interest rates and by changes in the effective maturities and credit rating of these securities. For example, the value of debt securities in the Fund's portfolio generally will decline when
37
FPA NEW INCOME, INC.
NOTES TO FINANCIAL STATEMENTS (Continued)
interest rates rise and increase when interest rates fall. In addition, falling interest rates may cause an issuer to redeem, call or refinance a security before its stated maturity, which may result in the Fund having to reinvest the proceeds in lower yielding securities.
Mortgage-Backed and Other Asset-Backed Securities Risk: The values of some mortgage-backed and other asset-backed securities may expose the Fund to a lower rate of return upon reinvestment of principal. When interest rates rise, the value of mortgage-related securities generally will decline; however, when interest rates are declining, the value of mortgage related-securities with prepayment features may not increase as much as other fixed income securities. The rate of prepayments on underlying mortgages will affect the price and volatility of a mortgage-related security, and may shorten or extend the effective maturity of the security beyond what was anticipated at the time of purchase. If an unanticipated rate of prepayment on underlying mortgages increases the effective maturity of a mortgage-related security, the volatility of the security can be expected to increase. The value of these securities may also fluctuate in response to the market's perception of the creditworthiness of the issuers. Additionally, although mortgages and mortgage-related securities are generally supported by some form of government or private guarantee and/or insurance, there is no assurance that private guarantors or insurers will meet their obligations.
Stripped Mortgage-Backed Interest Only ("I/O") and Principal Only ("P/O") Securities: Stripped mortgage backed securities are usually structured with two classes that receive different proportions of the interest and principal distributions on a pool of mortgage assets. In certain cases, one class will receive all of the interest payments on the underlying mortgages (the I/O class), while the other class will receive all of the principal payments (the P/O class). The Fund currently has investments in I/O and P/O securities. The yield to maturity on I/Os is sensitive to the rate of principal repayments (including prepayments) on the related underlying mortgage assets, and principal payments may have a material effect on yield-to-maturity. If the underlying mortgage assets experience greater than anticipated prepayments of principal, a Fund may not fully recoup its initial investment in I/Os.
Credit Risk: Debt securities are subject to credit risk, meaning that the issuer of the debt security may default or fail to make timely payments of principal or interest. The values of any of the Fund's investments may also decline in response to events affecting the issuer or its credit rating. The lower rated debt securities in which the Fund may invest are considered speculative and are generally subject to greater volatility and risk of loss than investment grade securities, particularly in deteriorating economic conditions. The Fund invests a significant portion of its assets in securities of issuers that hold mortgage and asset-backed securities and direct investments in securities backed by commercial and residential mortgage loans and other financial assets. The value and related income of these securities is sensitive to changes in economic conditions, including delinquencies and/or defaults. Continuing shifts in the market's perception of credit quality on securities backed by commercial and residential mortgage loans and other financial assets may result in increased volatility of market price and periods of illiquidity that can negatively impact the valuation of certain securities held by the Fund.
Repurchase Agreements: Repurchase agreements permit the Fund to maintain liquidity and earn income over periods of time as short as overnight. Repurchase agreements held by the Fund are fully collateralized by U.S. Government securities, or securities issued by U.S. Government agencies, or securities that are within the three highest credit categories assigned by established rating agencies (Aaa, Aa, or A by Moody's or AAA, AA or A by Standard & Poor's) or, if not rated by Moody's or Standard & Poor's, are of equivalent investment quality as determined by the Adviser. Such collateral is in the possession of the Fund's custodian. The collateral is evaluated daily to ensure its fair value equals or exceeds the current fair value of the repurchase agreements including accrued interest. In the event of default on the obligation to repurchase, the Fund has the right to liquidate the collateral and apply the proceeds in satisfaction of the obligation.
38
FPA NEW INCOME, INC.
NOTES TO FINANCIAL STATEMENTS (Continued)
The Fund may enter into repurchase agreements, under the terms of a Master Repurchase Agreement ("MRA"). The MRA permits the Fund, under certain circumstances including an event of default (such as bankruptcy or insolvency), to offset payables and/or receivables under the MRA with collateral held and/or posted to the counterparty and create one single net payment due to or from the Fund. However, bankruptcy or insolvency laws of a particular jurisdiction may impose restrictions on or prohibitions against such a right of offset in the event of a MRA counterparty's bankruptcy or insolvency. Pursuant to the terms of the MRA, the Fund receives securities as collateral with a fair value in excess of the repurchase price to be received by the Fund upon the maturity of the repurchase transaction. Upon a bankruptcy or insolvency of the MRA counterparty, the Fund recognizes a liability with respect to such excess collateral to reflect the Fund's obligation under bankruptcy law to return the excess to the counterparty. Repurchase agreements outstanding at the end of the period are listed in the Fund's Portfolio of Investments.
NOTE 3 — Purchases and Sales of Investment Securities
Cost of purchases of investment securities (excluding short-term investments) aggregated $3,622,576,332 for the year ended September 30, 2019. The proceeds and cost of securities sold resulting in net realized losses of $47,606,856 aggregated $1,516,092,719 and $1,563,699,575, respectively, for the year ended September 30, 2019. Realized gains or losses are based on the specific identification method.
NOTE 4 — Advisory Fees and Other Affiliated Transactions
Pursuant to an Investment Advisory Agreement (the "Agreement"), advisory fees were paid by the Fund to First Pacific Advisors, LP (the "Adviser"). Under the terms of this Agreement, the Fund pays the Adviser a monthly fee calculated at the annual rate of 0.5% of the Fund's average daily net assets. In addition, the adviser contractually agreed to reimburse expenses in excess of 0.50% of the average net assets of the Fund (excluding brokerage fees and commissions, interest, taxes, shareholder service fees, fees and expenses of other funds in which the Fund invests, and extraordinary expenses) through January 31, 2020. The Agreement obligates the Adviser to reduce its fee to the extent necessary to reimburse the Fund for any annual expenses (exclusive of interest, taxes, the cost of any supplemental statistical and research information, and extraordinary expenses such as litigation) in excess of 1.5% of the first $15 million and 1% of the remaining average net assets of the Fund for the year.
For the year ended September 30, 2019, the Fund paid aggregate fees and expenses of $288,865 to all Directors who are not affiliated persons of the Adviser. Certain officers of the Fund are also officers of the Adviser.
NOTE 5 — Federal Income Tax
No provision for federal income tax is required because the Fund has elected to be taxed as a "regulated investment company" under the Internal Revenue Code (the "Code") and intends to maintain this qualification and to distribute each year to its shareholders, in accordance with the minimum distribution requirements of the Code, its taxable net investment income and taxable net realized gains on investments.
Distributions paid to shareholders are based on net investment income and net realized gains determined on a tax reporting basis, which may differ from financial reporting. For federal income tax purposes, the Fund had the following components of distributable earnings at September 30, 2019:
Undistributed Ordinary Income | | $ | 2,319,836 | | |
39
FPA NEW INCOME, INC.
NOTES TO FINANCIAL STATEMENTS (Continued)
The tax status of distributions paid during the fiscal years ended September 30, 2019 and 2018 were as follows:
| | | 2019 | | 2018 | |
Dividends from ordinary income | | $ | 224,500,483 | | | $ | 158,423,878 | | |
The Fund utilizes the provisions of federal income tax laws that provide for the carryforward of capital losses for prior years, offsetting such losses against any future realized capital gains. Under the Regulated Investment Company Act of 2010 (the "Act"), net capital losses recognized for fiscal years beginning after December 22, 2010 may be carried forward indefinitely, and their character is retained as short-term and/or long-term losses. Previously, net capital losses were carried forward for eight years and treated as short-term losses. As a transition rule, the Act requires that post-enactment net capital losses be used before pre-enactment net capital losses.
As of September 30, 2019, the fund had $120,043,491 of post-enactment short-term capital losses and $318,601,761 of post-enactment long-term capital losses available to offset possible future capital gains. The pre-enactment capital loss carryforward of $10,690,443 expired on September 30, 2019.
The cost of investment securities held at September 30, 2019, was $7,293,622,873 for federal income tax purposes. Gross unrealized appreciation and depreciation for all investment at September 30, 2019, for federal income tax purposes was $76,892,370 and $52,141,822, respectively resulting in net unrealized appreciation of $24,750,548. As of and during the year ended September 30, 2019, the Fund did not have any liability for unrecognized tax benefits. The Fund recognizes interest and penalties, if any, related to unrecognized tax benefits as income tax expense in the Statement of Operations. During the year, the Fund did not incur any interest or penalties. The statute of limitations remains open for the last 3 years, once a return is filed. No examinations are in progress at this time.
During the year ended September 30, 2019, the Fund reclassified $(10,722,172) from Distributable earnings to Paid in Capital. The permanent book/tax differences arose principally from differing book/tax treatment of market discount accretion of securities, paydowns from mortgage-backed and other asset-backed securities, bond basis adjustments, and expiring capital loss carryforwards. Net assets were not affected by these reclassifications.
NOTE 6 — Disclosure of Fair Value Measurements
The Fund uses the following methods and inputs to establish the fair value of its assets and liabilities. Use of particular methods and inputs may vary over time based on availability and relevance as market and economic conditions evolve.
Equity securities are generally valued each day at the official closing price of, or the last reported sale price on, the exchange or market on which such securities principally are traded, as of the close of business on that day. If there have been no sales that day, equity securities are generally valued at the last available bid price. Securities that are unlisted and fixed-income and convertible securities listed on a national securities exchange for which the over-the-counter ("OTC") market more accurately reflects the securities' value in the judgment of the Fund's officers, are valued at the most recent bid price. However, most fixed income securities are generally valued at prices obtained from pricing vendors and brokers. Vendors value such securities based on one or more of the following inputs: transactions, bids, offers quotations from dealers and trading systems, spreads and other relationships observed in the markets among comparable securities, benchmarks, underlying equity of the issuer, and proprietary pricing models such as cash flows, financial or collateral performance and other reference data (includes prepayments, defaults, collateral, credit enhancements, and interest rate volatility). Short-term corporate notes with maturities of 60 days or less at the time of purchase are valued at amortized cost.
40
FPA NEW INCOME, INC.
NOTES TO FINANCIAL STATEMENTS (Continued)
Securities for which representative market quotations are not readily available or are considered unreliable by the Adviser are valued as determined in good faith under procedures adopted by the authority of the Fund's Board of Directors. Various inputs may be reviewed in order to make a good faith determination of a security's value. These inputs include, but are not limited to, the type and cost of the security; contractual or legal restrictions on resale of the security; relevant financial or business developments of the issuer; actively traded similar or related securities; conversion or exchange rights on the security; related corporate actions; significant events occurring after the close of trading in the security; and changes in overall market conditions. Fair valuations and valuations of investments that are not actively trading involve judgment and may differ materially from valuations of investments that would have been used had greater market activity occurred.
The Fund classifies its assets based on three valuation methodologies. Level 1 values are based on quoted market prices in active markets for identical assets. Level 2 values are based on significant observable market inputs, such as quoted prices for similar assets and quoted prices in inactive markets or other market observable inputs as noted above including spreads, cash flows, financial performance, prepayments, defaults, collateral, credit enhancements, and interest rate volatility. Level 3 values are based on significant unobservable inputs that reflect the Fund's determination of assumptions that market participants might reasonably use in valuing the assets. These assumptions consider inputs such as proprietary pricing models, cash flows, prepayments, defaults, and collateral. The valuation levels are not necessarily an indication of the risk associated with investing in those securities. The following table presents the valuation levels of the Fund's investments as of September 30, 2019:
Investments | | Level 1 | | Level 2 | | Level 3 | | Total | |
Common Stocks | |
Energy | | | — | | | | — | | | $ | 31,631,350 | | | $ | 31,631,350 | | |
Industrials | | $ | 1,150,739 | | | | — | | | | — | | | | 1,150,739 | | |
Commercial Mortgage-Backed Securities | |
Agency | | | — | | | $ | 63,682,557 | | | | — | | | | 63,682,557 | | |
Agency Stripped | | | — | | | | 293,395,668 | | | | — | | | | 293,395,668 | | |
Non-Agency | | | — | | | | 300,239,403 | | | | — | | | | 300,239,403 | | |
Residential Mortgage-Backed Securities | |
Agency Collateralized Mortgage Obligation | | | — | | | | 213,745,785 | | | | — | | | | 213,745,785 | | |
Agency Pool Adjustable Rate | | | — | | | | 569,638 | | | | — | | | | 569,638 | | |
Agency Pool Fixed Rate | | | — | | | | 950,616,006 | | | | — | | | | 950,616,006 | | |
Agency Stripped | | | — | | | | 88,386,480 | | | | — | | | | 88,386,480 | | |
Non-Agency Collateralized Mortgage
Obligation | | | — | | | | 480,840,764 | | | | — | | | | 480,840,764 | | |
Asset-Backed Securities | |
Auto | | | — | | | | 1,303,878,905 | | | | — | | | | 1,303,878,905 | | |
Collateralized Loan Obligation | | | — | | | | 652,352,650 | | | | — | | | | 652,352,650 | | |
Credit Card | | | — | | | | 333,673,221 | | | | — | | | | 333,673,221 | | |
Equipment | | | — | | | | 1,115,196,549 | | | | 22,765,958 | | | | 1,137,962,507 | | |
Other | | | — | | | | 319,173,079 | | | | — | | | | 319,173,079 | | |
41
FPA NEW INCOME, INC.
NOTES TO FINANCIAL STATEMENTS (Continued)
Investments | | Level 1 | | Level 2 | | Level 3 | | Total | |
Corporate Bonds & Notes | | | — | | | $ | 133,832,753 | | | | — | | | $ | 133,832,753 | | |
Corporate Bank Debt | | | — | | | | 153,201,625 | | | $ | 76,885,246 | | | | 230,086,871 | | |
U.S. Treasuries | | | — | | | | 783,155,045 | | | | — | | | | 783,155,045 | | |
Short-Term Investment | | | — | | | | 11,109,000 | | | | — | | | | 11,109,000 | | |
| | | $ | 1,150,739 | | | $ | 7,197,049,128 | | | $ | 131,282,554 | | | $ | 7,329,482,421 | | |
The following table summarizes the Fund's Level 3 investment securities and related transactions during the year ended September 30, 2019:
Investments | | Beginning
Value at
September 30,
2018 | | Net Realized and
Unrealized Gains
(Losses)* | | Purchases | | (Sales) | | Gross
Transfers
In/(Out) | | Ending
Value at
September 30,
2019 | | Net Change
in Unrealized
Appreciation
(Depreciation)
related to
Investments held
at September 30,
2019 | |
Common Stocks | | | — | | | $ | 499,946 | | | $ | 31,131,404 | | | | — | | | | — | | | $ | 31,631,350 | | | $ | 499,946 | | |
Residential Mortgage-
Backed Securities
Non-Agency
Collateralized
Mortgage Obligation | | $ | 400,727 | | | | 137,692 | | | | — | | | $ | (538,419 | ) | | | — | | | | — | | | | — | | |
Asset-Backed Securities
Collateralized Loan
Obligations | | | 60,193,015 | | | | (377,099 | ) | | | 236,279 | | | | (34,370,000 | ) | | $ | (25,682,195 | ) | | | — | | | | — | | |
Asset-Backed Securities
Equipment | | | 33,758,225 | | | | 160,105 | | | | 131,100 | | | | (11,283,472 | ) | | | — | | | | 22,765,958 | | | | 153,259 | | |
Other Asset-Backed
Securities | | | 43,059,404 | | | | (601,386 | ) | | | 272,475 | | | | (42,730,493 | ) | | | — | | | | — | | | | — | | |
Corporate Bonds & Notes | | | 10,677,335 | | | | (3,777,806 | ) | | | 25,932 | | | | (6,925,461 | ) | | | — | | | | — | | | | — | | |
Corporate Bank Debt | | | 63,585,396 | | | | (197,688 | ) | | | 31,766,451 | | | | (18,268,913 | ) | | | — | | | | 76,885,246 | | | | (435,181 | ) | |
| | | $ | 211,674,102 | | | $ | (4,156,236 | ) | | $ | 63,563,641 | | | $ | (114,116,758 | ) | | $ | (25,682,195 | ) | | $ | 131,282,554 | | | $ | 218,024 | | |
* Net realized and unrealized gains (losses) are included in the related amounts in the statement of operations.
Level 3 Valuation Process: Investments classified within Level 3 of the fair value hierarchy are valued by the Adviser in good faith under procedures adopted by authority of the Fund's Board of Directors. The Adviser employs various methods to determine fair valuations including regular review of key inputs and assumptions, and review of related market activity, if any. However, there are generally no observable trade activities in these securities. The Adviser reports to the Board of Directors at their regularly scheduled quarterly meetings, or more often if warranted. The report includes a summary of the results of the process, the key inputs and assumptions noted, and any changes to the inputs and assumptions used. When appropriate, the Adviser will recommend changes to the procedures and process employed. The value determined for an investment using the fair value procedures may differ significantly from the value realized upon the sale of such investment.
42
FPA NEW INCOME, INC.
NOTES TO FINANCIAL STATEMENTS (Continued)
Transfers of investments between different levels of the fair value hierarchy are recorded at fair value as of the end of the reporting period. There were no transfers between Level 1 and 2.
There were transfers of $25,682,195 out of Level 3 into Level 2 during the year ended September 30, 2019. The transfers are a result of change in pricing vendor commencing coverage and pricing of the securities during the period and a change in observable inputs.
The following table summarizes the quantitative inputs and assumptions used for items categorized as items categorized as Level 3 of the fair value hierarchy as of September 30, 2019:
Financial Assets | | Fair Value at
September 30, 2019 | | Valuation Technique(s) | | Unobservable
Inputs | | Price/Range | |
Common Stocks | | $ | 31,631,350 | | | Restricted Assets (a) | | Quotes/Prices | | $ | 8.31 | | |
Asset-Backed Securities —
Equipment | | $ | 22,765,958 | | | Third-Party Broker Quote (b) | | Quotes/Prices | | $ | 98.39 | | |
Corporate Bank Debt | | $ | 59,227,527 | | | Pricing Vendor | | Prices | | $ | 99.06-$100.81 | | |
| | | $ | 17,657,719 | | | Most Recent Capitalization (Funding) (c) | | Cost | | $ | 99.21-$100.00 | | |
(a) The fair value of the investment is measured at the intrinsic value of previously held bonds exchanged for new equity via company reorganization.
(b) The Third Party Broker Quote technique involves obtaining an independent third-party broker quote for the security.
(c) The significant unobservable inputs used in the fair value measurment are based on the most recent funding. If the financial condition of the underlying assets were to deteriorate, or if the market comparables were to fall, the value of this investment could be lower.
NOTE 7 — Collateral Requirements
FASB Accounting Standards Update No. 2011-11, Disclosures about Offsetting Assets and Liabilities, requires disclosures to make financial statements that are prepared under U.S. GAAP more comparable to those prepared under International Financial Reporting Standards. Under this guidance the Fund discloses both gross and net information about instruments and transactions eligible for offset such as instruments and transactions subject to an agreement similar to a master netting arrangement. In addition, the Fund discloses collateral received and posted in connection with master netting agreements or similar arrangements.
The following table presents the Fund's repurchase agreements by counterparty net of amounts available for offset under an ISDA Master agreement or similar agreements and net of the related collateral received or pledged by the Fund as of September 30, 2019, are as follows:
| | | | | Gross Amounts Not Offset in the
Statement of Assets and Liabilities | | | |
Counterparty | | Gross Assets
(Liabilities)
in the Statement of
Assets and Liabilities | | Collateral
(Received) | | Assets (Liabilities)
Available for Offset | | Net Amount
of Assets
(Liabilities)* | |
State Street Bank and
Trust Company: | |
Repurchases Agreement | | $ | 11,109,000 | | | $ | (11,109,000 | )** | | | — | | | | — | | |
* Represents the net amount receivable from the counterparty in the event of default.
** Collateral with a value of $11,333,074 has been received in connection with a master repurchase agreement. Excess of collateral received from the individual master repurchase agreement is not shown for financial reporting purposes.
43
FPA NEW INCOME, INC.
REPORT OF INDEPENDENT REGISTERED
PUBLIC ACCOUNTING FIRM
TO THE SHAREHOLDERS AND
BOARD OF DIRECTORS OF FPA NEW INCOME, INC.
Opinion on the Financial Statements
We have audited the accompanying statement of assets and liabilities of FPA New Income, Inc. (the "Fund"), including the portfolio of investments, as of September 30, 2019, the related statement of operations for the year then ended, and the statement of changes in net assets and the financial highlights for each of the two years in the period then ended and the related notes (collectively referred to as the "financial statements"). The financial highlights for the years ended September 30, 2015, September 30, 2016, and September 30, 2017 were audited by another independent registered public accounting firm whose report, dated November 20, 2017, expressed an unqualified opinion on those financial highlights. In our opinion, the financial statements present fairly, in all material respects, the financial position of the Fund at September 30, 2019, the results of its operations for the year then ended, and the changes in its net assets and its financial highlights for each of the two years in the period then ended, in conformity with U.S. generally accepted accounting principles.
Basis for Opinion
These financial statements are the responsibility of the Fund's management. Our responsibility is to express an opinion on the Fund's financial statements based on our audits. We are a public accounting firm registered with the Public Company Accounting Oversight Board (United States) ("PCAOB") and are required to be independent with respect to the Fund in accordance with the U.S. federal securities laws and the applicable rules and regulations of the Securities and Exchange Commission and the PCAOB.
We conducted our audits in accordance with the standards of the PCAOB. Those standards require that we plan and perform the audit to obtain reasonable assurance about whether the financial statements are free of material misstatement, whether due to error or fraud. The Fund is not required to have, nor were we engaged to perform, an audit of the Fund's internal control over financial reporting. As part of our audits, we are required to obtain an understanding of internal control over financial reporting, but not for the purpose of expressing an opinion on the effectiveness of the Fund's internal control over financial reporting. Accordingly, we express no such opinion.
Our audits included performing procedures to assess the risks of material misstatement of the financial statements, whether due to error or fraud, and performing procedures that respond to those risks. Such procedures included examining, on a test basis, evidence regarding the amounts and disclosures in the financial statements. Our procedures included confirmation of securities owned as of September 30, 2019, by correspondence with the custodian and brokers or by other appropriate auditing procedures where replies from brokers were not received. Our audits also included evaluating the accounting principles used and significant estimates made by management, as well as evaluating the overall presentation of the financial statements. We believe that our audits provide a reasonable basis for our opinion.

We have served as the auditor of the Fund since 2018.
Los Angeles, CA
November 20, 2019
44
FPA NEW INCOME, INC.
SHAREHOLDER EXPENSE EXAMPLE
September 30, 2019 (Unaudited)
Fund Expenses
Mutual fund shareholders generally incur two types of costs: (1) transaction costs, and (2) ongoing costs, including advisory and administrative fees; shareholder service fees; and other Fund expenses. The Example is intended to help you understand your ongoing costs (in dollars) of investing in the Fund and to compare these costs with the ongoing costs of investing in other mutual funds. The Example is based on an investment of $1,000 invested at the beginning of the year and held for the entire year.
Actual Expenses
The information in the table under the heading "Actual Performance" provides information about actual account values and actual expenses. You may use the information in this column, together with the amount you invested, to estimate the expenses that you paid over the period. Simply divide your account value by $1,000 (for example, an $8,600 account value divided by $1,000 = 8.6), then multiply the result by the number in the first column in the row entitled "Expenses Paid During Period" to estimate the expenses you paid on your account during this period.
Hypothetical Example for Comparison Purposes
The information in the table under the heading "Hypothetical Performance (5% return before expenses)" provides information about hypothetical account values and hypothetical expenses based on the Fund's actual expense ratio and an assumed rate of return of 5% per year before expenses, which is not the Fund's actual return. The hypothetical account values and expenses may not be used to estimate the actual ending account balance or expenses you paid for the period. You may use this information to
compare the ongoing costs of investing in the Fund and other funds. To do so, compare this 5% hypothetical example with the 5% hypothetical examples that appear in the shareholder reports of other funds.
Please note that the expenses shown in the table are meant to highlight your ongoing costs only and do not reflect any transactional costs. Therefore, the information under the heading "Hypothetical Performance (5% return before expenses)" is useful in comparing ongoing costs only, and will not help you determine the relative total costs of owning different funds. In addition, if these transactional costs were included, your costs would have been higher. Even though the Fund does not charge transaction fees, if you purchase shares through a broker, the broker may charge you a fee. You should evaluate other mutual funds' transaction fees and any applicable broker fees to assess the total cost of ownership for comparison purposes.
| | | Actual
Performance | | Hypothetical
Performance
(5% return
before
expenses) | |
Beginning Account Value
March 31, 2019 | | $ | 1,000.00 | | | $ | 1,000.00 | | |
Ending Account Value
September 30, 2019 | | $ | 1,021.80 | | | $ | 1,022.55 | | |
Expenses Paid During
Period* | | $ | 2.54 | | | $ | 2.55 | | |
* Expenses are equal to the Fund's annualized expense ratio of 0.50%, multiplied by the average account value over the period and prorated for the six-months ended September 30, 2019 (183/365 days).
45
FPA NEW INCOME, INC.
APPROVAL OF INVESTMENT ADVISORY AGREEMENT
(Unaudited)
Approval of the Advisory Agreement. At a meeting of the Board of Directors held on August 12, 2019, the Directors approved the continuation of the advisory agreement between the Fund and the Adviser (the "Advisory Agreement") for an additional one-year period through September 30, 2020, on the recommendation of the Independent Directors, who met in executive session on August 12, 2019 prior to the Board meeting to review and discuss the proposed continuation of the Advisory Agreement. The Board had also met on July 8, 2019, with the Independent Directors meeting separately prior to the Meeting in executive session with the management of the Adviser and then separately with independent counsel to evaluate the renewal of the Advisory Agreement. Prior to their July 8 meeting, the Independent Directors, through their independent counsel, had requested and received extensive materials prepared in connection with the review of the Advisory Agreements. The materials provided a broad range of information regarding the Fund, including a description of, among other matters, the terms of the Advisory Agreement; the services provided by the Adviser; the experience of the relevant investment personnel; the Fund's performance in absolute terms and as compared to the performance of peers and appropriate benchmark(s); the fees and expenses of the Fund in absolute terms and as compared to peers; and the profitability of the Adviser from serving as adviser to the Fund. Following their review at the July 8 meeting, the Independent Directors requested (through their independent counsel) and received supplemental information and responses to a number of questions relating to the materials provided by the Adviser.
In addition, the Board met regularly throughout the year and received information on a variety of topics that were relevant to its annual consideration of the renewal of the Advisory Agreement including, among other matters, Fund investment performance, compliance, risk management, liquidity, valuation, trade execution and other matters relating to Fund operations. The Independent Directors also had met with management of the Adviser (including key investment personnel) at their quarterly meetings as well as with management at other times between the quarterly meetings throughout the year. The materials specifically provided in connection with the annual review of the Advisory Agreement supplement the information received throughout the year.
At their regular Board meetings and executive sessions, the Independent Directors were also assisted by independent legal counsel. In addition to the materials provided by the Adviser, the Independent Directors received a legal memorandum from independent counsel that outlined, among other matters: the duties of the Independent Directors and relevant requirements under the 1940 Act; the general principles under state law relevant to considering the approval of advisory contracts; an adviser's fiduciary duty with respect to advisory agreements and compensation; the standards used by courts in determining whether investment advisers and investment company boards of trustees have fulfilled their duties; and factors to be considered by the Independent Directors when voting on advisory agreements. During executive session, independent legal counsel reviewed with the Independent Directors these duties, standards and factors summarized in the legal memorandum described above. The following paragraphs summarize the material information and factors considered by the Board and the Independent Directors, as well as the Directors' conclusions relative to such factors.
Nature, Extent and Quality of Services. The Board and the Independent Directors considered information provided by the Adviser in response to their requests, as well as information provided throughout the year regarding: the Adviser and its staffing in connection with the Fund, including the Fund's portfolio managers and the senior analysts supporting them; the scope of services supervised and provided by the Adviser; and the absence of any significant service problems reported to the Board. The Board and the Independent Directors noted the experience, length of service and the outstanding reputation of the Fund's portfolio managers: Tom Atteberry, who has been with the Adviser since 1997 and has served as portfolio manager since 2004 and Abhijeet V. Patwardhan, who joined the Adviser in 2010 and has served as portfolio manager since 2015. After discussion,
46
FPA NEW INCOME, INC.
APPROVAL OF INVESTMENT ADVISORY AGREEMENT (Continued)
(Unaudited)
the Board and the Independent Directors concluded that the nature, extent and quality of services provided by the Adviser have benefited and should continue to benefit the Fund and its shareholders.
Investment Performance. The Board and the Independent Directors reviewed the overall investment performance of the Fund. The Directors also received information from an independent consultant, Broadridge, regarding the Fund's performance relative to a peer group of alternative credit focus funds selected by Broadridge (the "Peer Group"). The Board and the Independent Directors considered the Adviser's representation that the Fund's investment style, as evidenced by the short-term duration of most of its portfolio securities, as well as the Fund's flexibility to invest in a variety of areas, complicated Peer Group comparisons in that the Fund is managed in a more conservative style than the typical fixed income fund and the funds in the Peer Group. The Board and the Independent Directors noted the Fund's absolute investment results and its long-term investment performance when compared to the Peer Group. The Board and the Independent Directors noted the Fund outperformed its Peer Group median for the three- and five-year periods ending March 31, 2019, and underperformed its Peer Group for the one- and ten-year periods ending March 31, 2019. The Board and the Independent Directors also noted that the Fund outperformed the Fund's benchmark, Barclays Capital U.S. Aggregate Index, for the three-year period ending March 31, 2019 and underperformed for the one-, five- and ten-year periods ending March 31, 2019. They also noted that Broadridge has continued to give the Fund a "Bronze" Analyst Rating. After discussion, the Board and the Independent Directors determined that the Fund's investment results were reasonable in light of the Fund's objectives and concluded that the Adviser's continued management of the Fund should benefit the Fund and its shareholders.
Advisory Fees and Fund Expenses; Comparison with Peer Group and Institutional Fees. The Board and the Independent Directors considered information provided by the Adviser regarding the Fund's advisory fees and total expense levels. The Board and the Independent Directors reviewed comparative information regarding fees and expenses for the Peer Group. The Board and the Independent Directors noted that the Fund's advisory fee was slightly above the average of the Peer Group and its overall expense ratio was equal to that of the Peer Group. In addition, the Directors noted that the fee rate charged to the Fund is higher than institutional accounts managed in a similar style by the portfolio managers but considered the Adviser's discussion of the differences between the services provided by the Adviser to the Fund and those provided by the Adviser to the institutional accounts. The Board and the Independent Directors concluded that the continued payment of advisory fees and expenses by the Fund to the Adviser was fair and reasonable and should continue to benefit the Fund and its shareholders.
Adviser Profitability and Costs. The Board and the Independent Directors considered information provided by the Adviser regarding the Adviser's costs in providing services to the Fund, the profitability of the Adviser and the benefits to the Adviser from its relationship to the Fund. They reviewed and considered the Adviser's representations regarding its assumptions and methods of allocating certain costs, such as personnel costs, which constitute the Adviser's largest operating cost, overhead and trading costs with respect to the provision of investment advisory services. The Independent Directors discussed with the Adviser the general process through which individuals' compensation is determined and then reviewed by the management committee of the Adviser, as well as the Adviser's methods for determining that its compensation levels are set at appropriate levels to attract and retain the personnel necessary to provide high quality professional investment advice. In evaluating the Adviser's profitability, they excluded certain distribution and marketing-related expenses. The Board and the Independent Directors recognized that the Adviser is entitled under the law to earn a reasonable level of profits for the services that it provides to the Fund. The Board and the Independent Directors concluded that the Adviser's
47
FPA NEW INCOME, INC.
APPROVAL OF INVESTMENT ADVISORY AGREEMENT (Continued)
(Unaudited)
level of profitability from its relationship with the Fund did not indicate that the Adviser's compensation was unreasonable or excessive.
Economies of Scale and Sharing of Economies of Scale. The Board and the Independent Directors considered whether there have been economies of scale with respect to the management of the Fund, whether the Fund has appropriately benefited from any economies of scale, and whether the fee rate is reasonable in relation to the Fund's asset levels and any economies of scale that may exist. The Board and the Independent Directors considered the Adviser's representation that its internal costs of providing investment management services to the Fund have significantly increased in recent years as a result of a number of factors, including the Adviser's substantial investment in additional professional resources and staffing. The Board and the Independent Directors considered both quantitative and qualitative information regarding the Adviser's representation that it has also made significant investments in: (1) the two portfolio managers, five analysts, traders and other investment personnel who assist with the management of the Fund; (2) new compliance, operations, and administrative personnel; (3) information technology, portfolio accounting and trading systems; and (4) office space, each of which enhances the quality of services provided to the Fund. The Board and the Independent Directors also considered the Adviser's willingness to close funds to new investors when it believed that a fund may have limited capacity to grow or that it otherwise would benefit fund shareholders.
The Board and the Independent Directors recognized that the advisory fee rate schedule for the Fund does not have breakpoints. They considered that many mutual funds have breakpoints in the advisory fee structure as a means by which to share in the benefits of potential economies of scale as a fund's assets grow. They also considered that not all funds have breakpoints in their fee structures and that breakpoints are not the exclusive means of sharing potential economies of scale. The Board and the Independent Directors considered the Adviser's statement that it believes that breakpoints currently remain inappropriate for the Fund given the ongoing investments the Adviser is making in its business for the benefit of the Fund, uncertainties regarding the direction of the economy, rising inflation, increasing costs for personnel and systems, and growth or contraction in the Fund's assets, all of which could negatively impact the profitability of the Adviser. The Board and the Independent Directors also noted that the Adviser has contractually agreed to reimburse the Fund for Total Annual Fund Operating Expenses in excess of 0.50% of the average daily net assets of the Fund (excluding brokerage fees and commissions, interest, taxes, shareholder service fees, fees and expenses of other funds in which the Fund invests, and extraordinary expenses) through January 31, 2020. The Board and the Independent Directors concluded that the Fund is benefitting from the ongoing investments made by the Adviser in its team of personnel serving the Fund and in the Adviser's service infrastructure, and that in light of these investments, the addition of breakpoints in the Fund's advisory fee structure was not warranted at current asset levels.
Ancillary Benefits. The Board and the Independent Directors considered other actual and potential benefits to the Adviser from managing the Fund, including the acquisition and use of research services with commissions generated by the Fund, in concluding that the contractual advisory and other fees are fair and reasonable for the Fund. They noted that the Adviser does not have any affiliates that benefit from the Adviser's relationship to the Fund.
Conclusions. The Board and the Independent Directors determined that the Fund continues to benefit from the services of the Adviser's highly experienced portfolio management team, which has produced reasonable long-term returns. In addition, the Board and the Independent Directors agreed that the Fund continues to receive high quality services from the Adviser. The Board and the Independent Directors concluded that the current advisory fee rate is reasonable and fair to the Fund and its shareholders in light of the nature and quality of the services provided by the Adviser and the Adviser's profitability and costs. The Board and the Independent
48
FPA NEW INCOME, INC.
APPROVAL OF INVESTMENT ADVISORY AGREEMENT (Continued)
(Unaudited)
Directors also noted their intention to continue monitoring the factors relevant to the Adviser's compensation, such as changes in the Fund's asset levels, changes in portfolio management personnel and the cost and quality of the services provided by the Adviser to the Fund. On the basis of the foregoing, and without assigning particular weight to any single factor, none of which was dispositive, the Board and the Independent Directors concluded that it would be in the best interests of the Fund to continue to be advised and managed by the Adviser and determined to approve the continuation of the current Advisory Agreement for another one-year period through September 30, 2020.
49
FPA NEW INCOME, INC.
PRIVACY POLICY
The FPA Funds consider customer privacy to be an essential part of their investor relationships and are committed to maintaining the confidentiality, integrity and security of their current, prospective and former investors' non-public personal information. The FPA Funds have developed policies that are designed to protect this confidentiality, while permitting investor needs to be served.
Obtaining Personal Information. While providing investors with products and services, the FPA Funds, and certain service providers, such as the FPA Fund's Transfer Agents and/or Administrators, may obtain non-public personal information about investors, which may come from sources such as (i) account applications, subscription agreements and other forms, (ii) written, electronic or verbal correspondence, (iii) investor transactions, (iv) an investor's brokerage or financial advisory firm, financial advisor or consultant, and/or (v) from information captured on applicable websites. The non-public personal information that may be collected from investors may include the investor's name, address, tax identification number, birth date, investment selection, beneficiary information, and possibly the investor's personal bank account information and/or email address if the investor has provided that information, as well as the investor's transaction and account history with the FPA Funds.
Respecting Your Privacy. The FPA Funds do not disclose any non-public personal information provided by investors or gathered by the FPA Funds to third parties, except as required or permitted by law or as necessary for such third parties to perform their agreements with respect to the FPA Funds. Non-affiliated companies may from time to time be used to provide certain services, such as maintaining investor accounts, preparing and mailing prospectuses, reports, account statements and other information, and gathering shareholder proxies. In many instances, the investors will be clients of a third party, but the FPA Funds may also provide an investor's personal and account information to the investor's respective brokerage or financial advisory firm and/or financial advisor or consultant.
Sharing Information with Third Parties. The FPA Funds reserve the right to report or disclose personal or account information to third parties in circumstances where the FPA Funds believe in good faith that disclosure is required or permitted under law, to cooperate with regulators or law enforcement authorities, to protect their rights or property, or upon reasonable request by the FPA Funds in which an investor has invested. In addition, the FPA Funds may disclose information about an investor or an investor's accounts to a third party at the investor's request or with the consent of the investor.
Procedures to Safeguard Private Information. The FPA Funds are committed to their obligation to safeguard investor non-public personal information. In addition to this policy, the FPA Funds have implemented procedures that are designed to limit access to an investor's non-public personal information to internal personnel who require the information to complete tasks, such as processing transactions, maintaining client accounts or otherwise providing services the investor requested. Physical, electronic and procedural safeguards are in place to guard an investor's non-public personal information.
Information Collected from Websites. Websites maintained by the FPA Funds or its service providers may use a variety of technologies to collect information that helps the FPA Funds and their service providers understand how the website is used. Information collected from your web browser (including small files stored on your device that are commonly referred to as "cookies") allow the websites to recognize your web browser and help to personalize and improve your user experience and enhance navigation of the website. If you are a registered user of the FPA Funds' and/or their service providers' website, the FPA Funds, their service providers, or third party firms engaged by the FPA Funds and/or their service providers, may collect or share information submitted by you, which may include personally identifiable information. You can change your cookie preferences by
50
FPA NEW INCOME, INC.
PRIVACY POLICY
(Continued)
changing the setting on your web browser to delete or reject cookies. If you delete or reject cookies, some website pages may not function properly. The FPA Funds do not look for web browser "do not track" requests.
Changes to the Privacy Policy. From time to time, the FPA Funds may update or revise this privacy policy. If there are changes to the terms of this privacy policy, documents containing the revised policy on the relevant website will be updated.
FPA Funds. FPA Capital Fund, Inc., FPA Crescent Fund, FPA International Value Fund, FPA New Income, Inc., FPA Flexible Fixed Income Fund, FPA Paramount Fund, Inc., FPA U.S. Value Fund, Inc., Source Capital, Inc.
Revised: January 2019
51
FPA NEW INCOME, INC.
DIRECTOR AND OFFICER INFORMATION
(Unaudited)
Sandra Brown, Mark L. Lipson, Alfred E. Osborne, Jr., A. Robert Pisano, and Patrick B. Purcell are all Directors of the Fund who are not "interested persons" of the Fund, as that term is defined in the 1940 Act (collectively, the "Independent Directors"). Directors serve until their resignation, removal or retirement. The Statement of Additional Information includes additional information about the Directors and is available, without charge, upon request by calling (800) 982-4372.
Name, Address(1)
and Year of Birth | | Position(s)
Held with
the Fund | | Year First
Elected as
Director of
the Fund | | Principal Occupation(s)
During the
Past Five Years | | Number of
FPA Funds
Overseen
by Director | | Other
Directorships
Held by Director
During the Past
Five Years | |
Independent Directors | |
Sandra Brown,
1955 | | Director | | | 2016 | | | Consultant (since 2009). Formerly, CEO and President of Transamerica Financial Advisers, Inc. (1999-2009); President, Transamerica Securities Sales Corp. (1998-2009); Vice President, Bank of America Mutual Fund Administration (1990-1998). Director/Trustee of FPA Capital, Inc., FPA Funds Trust, FPA New Income, Inc., FPA Paramount Fund, Inc., FPA U.S. Value Fund, Inc. and Source Capital, Inc. (since October 2016). | | | 8 | | | None | |
Mark L. Lipson,
1949 | | Director & Chairman | | | 2015 | | | Registered Investment Adviser, ML2 Advisors, LLC (since 2014). Formerly Managing Director, Bessemer Trust (2007-2014) and US Trust (2003-2006); Chairman and CEO of the Northstar Mutual Funds (1993-2001); and President and CEO of the National Mutual Funds (1988-1993). Director/Trustee of FPA Capital, Inc., FPA Funds Trust, FPA New Income, Inc., FPA Paramount Fund, Inc., FPA U.S. Value Fund, Inc. and Source Capital, Inc. (since October 2015). | | | 8 | | | None | |
Alfred E. Osborne, Jr.,
1944 | | Director | | | 1999 | | | Senior Associate Dean (since July 2019), Professor and Faculty Director (since July 2018), Interim Dean (July 2018-June 2019), Price Center for Entrepreneurship and Innovation at the John E. Anderson School of Management at UCLA. Dr. Osborne has been at UCLA since 1972. Director/Trustee of FPA Capital Fund, Inc. and FPA New Income, Inc. (since 1999), of FPA Funds Trust (since 2002), of FPA Paramount Fund, Inc., FPA U.S. Value Fund, Inc. and Source Capital, Inc. (since 2013). | | | 8 | | | Kaiser Aluminum, and Wedbush, Inc. | |
52
FPA NEW INCOME, INC.
DIRECTOR AND OFFICER INFORMATION (Continued)
(Unaudited)
Name, Address(1)
and Year of Birth | | Position(s)
Held with
the Fund | | Year First
Elected as
Director of
the Fund | | Principal Occupation(s)
During the
Past Five Years | | Number of
FPA Funds
Overseen
by Director | | Other
Directorships
Held by Director
During the Past
Five Years | |
A. Robert Pisano,
1943 | | Director | | | 2013 | | | Consultant (since 2012). Formerly, President and Chief Operating Officer of The Motion Picture Association of America, Inc. (October 2005-2011). Formerly, National Executive Director and Chief Executive Officer of The Screen Actors Guild (2001-2005). Director/Trustee of FPA Paramount Fund, Inc. and FPA U.S. Value Fund, Inc. (since 2012), and of FPA Capital, Inc., FPA Funds Trust, FPA New Income, Inc. and Source Capital, Inc. (since 2013). | | | 8 | | | Resources Global Professionals | |
Patrick B. Purcell,
1943 | | Director | | | 2006 | | | Retired (since 2000). Formerly, Consultant to Paramount Pictures 1998-2000; Executive Vice President, Chief Financial and Administrative Officer of Paramount Pictures (1983-1998). Director/Trustee of FPA Capital, Inc., FPA Funds Trust and FPA New Income, Inc. (since 2006), of Source Capital, Inc. (since 2010), of FPA U.S. Value Fund, Inc. and FPA Paramount Fund, Inc. (since 2012). | | | 8 | | | None | |
"Interested" Director(2) | |
J. Richard Atwood,
1960 | | Director | | | 2016 | | | Director and President of FPA GP, Inc., the General Partner of the Adviser (since October 2018). Director/Trustee of each FPA Fund (since 2016). President of each FPA Fund (since 2015). Formerly, Managing Partner of FPA (2006-2018). Formerly, until 2015, Treasurer of each FPA Fund for more than the past five years. | | | 8 | | | None | |
(1) The address of each Director is 11601 Wilshire Boulevard, Suite 1200, Los Angeles, California 90025.
(2) "Interested person" within the meaning of the 1940 Act by virtue of their affiliation with the Fund's Adviser.
53
FPA NEW INCOME, INC.
DIRECTOR AND OFFICER INFORMATION (Continued)
(Unaudited)
Officers of the Fund. Officers of the Fund are elected annually by the Board.
Name, Address(1)
and Year of Birth | | Position
with Fund | | Year First
Elected as
Officer of the
Fund | | Principal Occupation(s)
During the Past Five Years | |
Thomas. H. Atteberry,
1953 | | Vice President and Portfolio Manager | | | 2004 | | | Partner of FPA. Formerly Chief Executive Officer of the FPA New Income (until February 2015). Vice President and Portfolio Manager of FPA New Income (since 2004). | |
Abhijeet Patwardhan,
1979 | | Vice President and Portfolio Manager | | | 2015 | | | Partner (since January 2017) and a Director of Research (since April 2015) of FPA; Managing Director of FPA from November 2015 to January 2017, Senior Vice President of FPA from January 2014 to November 2015; Analyst and Vice President of FPA from June 2010 to December 2013. Vice President and Portfolio Manager of FPA Flexible Fixed Income Fund (since December 2018). | |
J. Richard Atwood,
1960 | | President | | | 1997 | | | Director and President of FPA GP, Inc., the General Partner of FPA (since October 2018). Director/Trustee of each FPA Fund (since May 2016). President of each FPA Fund (since February 2015). Formerly, Managing Partner of FPA (2006-2018). Formerly, until February 2015, Treasurer of each FPA Fund for more than the past five years. | |
Karen E. Richards,
1969 | | Chief Compliance Officer | | | 2019 | | | Chief Compliance Officer of FPA (since August 2018). Formerly, Deputy Chief Compliance Officer of First Republic Investment Management, LLC (from February 2016 to March 2018), and Vice President, Senior Compliance Officer of Pacific Investment Management Company (from June 2010 to January 2016). | |
E. Lake Setzler III,
1967 | | Treasurer | | | 2006 | | | Senior Vice President (since January 2013) and Controller of FPA; and Treasurer of each FPA Fund (since February 2015). Formerly, until February 2015, Assistant Treasurer of each FPA Fund (February 2006 to February 2015). | |
Rebecca D. Gilding,
1979 | | Secretary | | | 2019 | | | Vice President and Counsel, State Street Bank and Trust Company (since April 2016). Formerly, Assistant Vice President and Associate Counsel, Brown Brothers Harriman & Co. (September 2013 to April 2016). | |
(1) The address for each Officer (except Ms. Gilding) is 11601 Wilshire Boulevard, Suite 1200, Los Angeles, California 90025. Ms. Gilding's address is State Street Bank and Trust Company, One Lincoln Street, Boston, Massachusetts 02111.
54
FPA NEW INCOME, INC.
(Unaudited)
INVESTMENT ADVISER
First Pacific Advisors, LP
11601 Wilshire Boulevard, Suite 1200
Los Angeles, CA 90025
TRANSFER & SHAREHOLDER SERVICE AGENT
UMB Fund Services, Inc.
P.O. Box 2175
Milwaukee, WI 53201-2175
or
235 West Galena Street
Milwaukee, WI 53212-3948
(800) 638-3060
CUSTODIAN AND ADMINISTRATOR
State Street Bank and Trust Company
One Lincoln Street
Boston, Massachusetts 02111
TICKER SYMBOL: FPNIX
CUSIP: 302544101
DISTRIBUTOR
UMB Distribution Services, LLC
235 West Galena Street
Milwaukee, Wisconsin 53212-3948
LEGAL COUNSEL
Dechert LLP
One Bush Street, Suite 1600
San Francisco, California 94104
INDEPENDENT REGISTERED PUBLIC ACCOUNTING FIRM
Ernst & Young LLP
725 South Figueroa Street
Los Angeles, California 90017
This report has been prepared for the information of shareholders of FPA NEW INCOME, INC., and is not authorized for distribution to prospective investors unless preceded or accompanied by an effective prospectus.
A description of the policies and procedures that the Adviser uses to vote proxies related to the Fund's portfolio securities is set forth in the Fund's Statement of Additional Information which is available without charge, upon request, on the Fund's website at www.fpa.com or by calling (800) 982-4372 and on the Securities and Exchange Commission's website at www.sec.gov.
The Fund's complete proxy voting record for the 12 months ended June 30, 2019 is available without charge, upon request by calling (800) 982-4372 and on the SEC's website at www.sec.gov.
The Fund's schedule of portfolio holdings, filed the first and third quarter of the Fund's fiscal year on Form N-Q with the SEC, is available on the SEC's website at www.sec.gov. To obtain Form N-Q from the Fund, shareholders can call (800) 982-4372.
Additional information about the Fund is available online at www.fpa.com. This information includes, among other things, holdings, top sectors, and performance, and is updated on or about the 15th business day after the end of each quarter.
Item 2. Code of Ethics.
(a) The registrant has adopted a code of ethics that applies to the registrant’s principal executive and financial officers.
(b) Not applicable.
(c) During the period covered by this report, there were no amendments to the provisions of the code of ethics adopted in 2(a) above.
(d) During the period covered by this report, there were not any implicit or explicit waivers to the provisions of the code of ethics adopted in 2(a).
(e) Not applicable.
(f) A copy of the registrant’s code of ethics is filed as an exhibit to this Form N-CSR.
Item 3. Audit Committee Financial Expert.
The registrant’s board of directors has determined that Patrick B. Purcell, who is a member of the registrant’s audit committee and board of directors, is an “audit committee financial expert” and is “independent,” as those terms are defined in this Item. This designation will not increase the designee’s duties, obligations or liability as compared to his duties, obligations or liability as a member of the audit committee and of the board of directors. This designation does not affect the duties, obligations or liability of any other member of the audit committee or the board of directors.
Item 4. Principal Accountant Fees and Services.
| | 2018 | | 2019 | |
(a) Audit Fees | | $ | 34,300 | | $ | 34,800 | |
(b) Audit Related Fees | | $ | -0- | | $ | -0- | |
(c) Tax Fees(1) | | $ | 6,400 | | $ | 6,500 | |
(d) All Other Fees | | $ | -0- | | $ | -0- | |
(1) Tax Fees are for the preparation of the Fund’s tax return(s).
(e)(1) The audit committee shall pre-approve all audit and permissible non-audit services that the committee considers compatible with maintaining the independent auditors’ independence. The pre-approval requirement will extend to all non-audit services provided to the registrant, the adviser, and any entity controlling, controlled by, or under common control with the adviser that provides ongoing services to the registrant, if the engagement relates directly to the operations and financial reporting of the registrant; provided, however, that an engagement of the registrant’s independent auditors to perform attest services for the registrant, the adviser or its affiliates required by generally accepted auditing standards to complete the examination of the registrant’s financial statements (such as an examination conducted in accordance with Statement on Standards for Attestation Engagements Number 16, or a Successor Statement, issued by the American Institute of Certified Public Accountants), will be deem pre-approved if:
(i) the registrant’s independent auditors inform the audit committee of the engagement,
(ii) the registrant’s independent auditors advise the audit committee at least annually that the performance of this engagement will not impair the independent auditor’s independence with respect to the registrant, and
(iii) the audit committee receives a copy of the independent auditor’s report prepared in connection with such services. The committee may delegate to one or more committee members the authority to review and pre-approve audit and permissible non-audit services. Actions taken under any such delegation will be reported to the full committee at its next meeting.
(e)(2) 0% of the services provided to the registrant described in paragraphs b—d of this Item were approved by the Audit Committee pursuant to paragraph (c)(7)(i)(C) of Rule 2-01 of Regulation S-X. There were no services provided to the investment adviser or any entity controlling, controlled by or under common control with the adviser described in paragraphs (b) — (d) of this Item that were required to be pre-approved by the audit committee.
(f) For the fiscal year ended September 30, 2019, if greater than 50%, specify the percentage of hours spent on the audit of the registrant’s financial statements for the most recent fiscal year that were attributed to work performed by persons who are not full-time, permanent employees of the principal accountant Ernst & Young LLP (“EY”). According to EY, such amount was below 50%; therefore disclosure item not applicable to this filing.
(g) For the fiscal years ended September 30, 2019 and September 30, 2018 ,the aggregate non-audit fees billed by EY for services rendered to the investment advisor were $41,250 and $38,500, respectively.
(h) The registrant’s Audit Committee has considered whether the provision of non-audit services that were rendered to the registrant’s investment advisor, which were not pre-approved (not requiring pre-approval), is compatible with maintaining EY’s independence.
Item 5. Audit Committee of Listed Registrants.
Not applicable.
Item 6. Investments.
(a) Schedule of Investments is included as a part of the report to shareholders filed under Item 1 of this Form N-CSR.
(b) Not applicable.
Item 7. Disclosure of Proxy Voting Policies and Procedures for Closed-End Management Investment Companies.
Not applicable.
Item 8. Portfolio Managers of Closed-End Management Investment Companies.
Not applicable.
Item 9. Purchases of Equity Securities by Closed-End Management Investment Company and Affiliated Purchasers.
Not applicable.
Item 10. Submission of Matters to a Vote of Security Holders.
There have been no material changes to the procedures by which the shareholders may recommend nominees to the registrant’s board of directors.
Item 11. Controls and Procedures.
(a) The principal executive officer and principal financial officer of the registrant have concluded that the registrant’s disclosure controls and procedures (as defined in Rule 30a-3(c) under the Investment Company Act of 1940) are effective based on their evaluation of the disclosure controls and procedures as of a date within 90 days of the filing date of this report.
(b) There have been no significant changes in the registrant’s internal controls over financial reporting (as defined in Rule 30a-3(d) under the Investment Company Act of 1940) that occurred during the registrant’s second fiscal quarter of the period covered by this report that have materially affected, or is reasonably likely to materially affect, the registrant’s internal controls over financial reporting.
Item 12. Disclosure of Securities Lending Activities for Closed-End Management Investment Companies
Not applicable.
Item 13. Exhibits.
(a)(1) Code of ethics as applies to the registrant’s principal executive and financial officers is attached hereto.
(a)(2) The certifications required by Rule 30a-2(a) under the Investment Company Act of 1940 are attached hereto.
(a)(3) Not applicable.
(a)(4) Not applicable.
(b) The certifications required by Rule 30a-2(b) under the Investment Company Act of 1940 and Section 906 of the Sarbanes-Oxley Act of 2002 are attached hereto.
SIGNATURES
Pursuant to the requirements of the Securities Exchange Act of 1934 and the Investment Company Act of 1940, the registrant has duly caused this report to be signed on its behalf by the undersigned, thereunto duly authorized.
FPA NEW INCOME, INC. | |
| | |
By: | /s/ J. Richard Atwood | |
| J. Richard Atwood | |
| President (principal executive officer) | |
| | |
Date: December 6, 2019 | |
Pursuant to the requirements of the Securities Exchange Act of 1934 and the Investment Company Act of 1940, this report has been signed below by the following persons on behalf of the registrant and in the capacities and on the dates indicated.
By: | /s/ J. Richard Atwood | |
| J. Richard Atwood | |
| President (principal executive officer) | |
| | |
Date: December 6, 2019 | |
| | |
By: | /s/ E. Lake Setzler III | |
| E. Lake Setzler III | |
| Treasurer (principal financial officer) | |
| | |
Date: December 6, 2019 | |