UNITED STATES
SECURITIES AND EXCHANGE COMMISSION
Washington, D.C. 20549
FORM N-CSR
CERTIFIED SHAREHOLDER REPORT OF REGISTERED
MANAGEMENT INVESTMENT COMPANIES
Investment Company Act file number | 811-1735 |
|
FPA NEW INCOME, INC. |
(Exact name of registrant as specified in charter) |
|
11400 WEST OLYMPIC BLVD., SUITE 1200, LOS ANGELES, CALIFORNIA | | 90064 |
(Address of principal executive offices) | | (Zip code) |
|
J. RICHARD ATWOOD, 11400 WEST OLYMPIC BLVD., SUITE 1200, LOS ANGELES, CALIFORNIA 90064 |
(Name and address of agent for service) |
|
Registrant’s telephone number, including area code: | 310-473-0225 | |
|
Date of fiscal year end: | SEPTEMBER 30 | |
|
Date of reporting period: | SEPTEMBER 30, 2012 | |
| | | | | | | | | |
Item 1. Report to Stockholders.

Distributor:
UMB DISTRIBUTION SERVICES, LLC
803 West Michigan Street
Milwaukee, Wisconsin 53233
FPA NEW INCOME, INC.
LETTER TO SHAREHOLDERS
Dear Fellow Shareholders:
This Annual Report covers the year ended September 30, 2012. Your Fund's net asset value (NAV) closed at $10.70. During the fiscal year, your Fund paid four income dividends totaling $0.37. There were no capital gains distributions.
The following table shows the average annual total return for several different periods ended on that date for the Fund and comparative indices of securities prices.
We believe that it is appropriate at this time to modify the benchmarks we have historically used for the Fund. The first is the Barclays U.S. Aggregate Bond Index which we believe is preferable to the Barclays Government/Credit Index as the Fund's primary benchmark for at least two reasons. The Barclays U.S. Aggregate Bond Index is more representative of the securities the Fund purchases than the Barclays Government/Credit Index. Specifically, the Fund has both currently and historically held a significant percentage of assets in mortgage-backed securities, and these securities are included in the Barclays U.S. Aggregate Bond Index but not in the Barclays Government/Credit Index. In addition, the Barclays U.S. Aggregate Bond Index is a more commonly used index to measure performance relative to the U.S. dollar-denominated investment grade fixed-rate taxable bond market. The second is the Consumer Price Index + 100 Basis Points which we believe is an appropriate secondary benchmark given one of the Fund's long-term goals of achieving returns above the rate of inflation. The Barclays Government/Credit Index is shown below for reference purposes only. More detailed descriptions of both of these new benchmarks is included on page 8.
| | Periods Ended September 30, 2012 | |
| | 1 Year | | 5 Years | | 10 Years | | 15 Years | | 20 Years | | 25 Years | | 6/30/1984
Inception | |
FPA New Income (NAV)* | | | 2.18 | % | | | 3.28 | % | | | 3.97 | % | | | 4.82 | % | | | 5.67 | % | | | 7.01 | % | | | 8.09 | % | |
FPA New Income
(Net of Sales Charge)** | | | -1.40 | % | | | 2.54 | % | | | 3.60 | % | | | 4.57 | % | | | 5.49 | % | | | 6.86 | % | | | 7.95 | % | |
Barclays U.S. Aggregate
Bond Index | | | 5.16 | % | | | 6.53 | % | | | 5.32 | % | | | 6.15 | % | | | 6.34 | % | | | 7.47 | % | | | 8.37 | % | |
Consumer Price Index + 100
Basis Points | | | 2.73 | % | | | 3.08 | % | | | 3.50 | % | | | 3.45 | % | | | 3.52 | % | | | 3.88 | % | | | 3.90 | % | |
Barclays Government/
Credit Index | | | 5.66 | % | | | 6.63 | % | | | 5.39 | % | | | 6.23 | % | | | 6.41 | % | | | 7.49 | % | | | 8.34 | % | |
The Fund continues to perform in line with our expectations. Our emphasis on high-quality, short-duration bonds led to our YTD return of 1.99%* through September 30, 2012 versus 3.99% for the Barclays Index and 2.58% for the CPI + 100. For the second half of the fiscal year, your Fund's return was 1.51%*, 3.68% for the Barclays Index and 1.40% for the CPI + 100.
* Does not reflect deduction of the sales charge which, if reflected, would reduce the performance shown.
** Reflects deduction of the maximum sales charge of 3.5% of the offering price.
Past performance is no guarantee of future results and current performance may be higher or lower than the performance shown. This data represents past performance and investors should understand that investment returns and principal values fluctuate, so that when you redeem your investment may be worth more or less than its original cost. Current month-end performance data can be obtained by visiting the website at www.fpafunds.com or by calling toll-free, 1-800-982-4372. Information regarding the Fund's expense ratio and redemption fees can be found on pages 26 and 30.
1
FPA NEW INCOME, INC.
LETTER TO SHAREHOLDERS (Continued)
To Boldly Go Where No Man Has Gone Before
What was unquestionably a cool tag line for a fantasy outer-space television series may not be suited for the Chairman of the Federal Reserve Bank of the United States and his monetary policy. The newest Quantitative Easing (QE) program was announced on September 12. The Fed announced that above and beyond Operation Twist, it would buy $40 billion of mortgage pools, monthly, for an indefinite period of time — tempting us to rename the central bank's policy direction "The Starship Infinity". Let's examine how the Fed's aggressive intervention is playing out in the markets and its impact on the portfolio.
Over the past six months, Treasury rates have declined: the two-year by 8 basis points; the five-year by 44 basis points; the ten-year by 60 basis points; and the thirty-year by 51 basis points. Within the market's corporate bond segment, the lower the credit quality, the larger the decline in yield spread over the corresponding Treasury. This indicates investors are reaching for yield, given that economic activity has moderated during this same period of time. Looking at mortgages, the spread declined over the past six months with almost all the decline coming after the Fed announced its major mortgage purchase plan.
Portfolio1 Performance
The portfolio maintained an effective duration over the past six months between 1.2 and 1.5 years, while the Barclays Aggregate Bond Index2 had a range of 4.7 to 4.9 years. This characteristic was the primary driver of under performance in the period. On average, the Fund had a little over 7.5% invested in securities rated "A" or below, while the index had approximately 21%. So with spreads for lower quality bonds declining, the portfolio was, again, less sensitive to these market changes.
Over the past six months, the Fund had a total return of 1.51% compared to that of the Barclays Aggregate Bond Index return of 3.68%. Our duration risk was between 26% and 31% and our credit exposure was on average 36% of the index, compared with a return that represents 41% of the index. In short, we took less risk in terms of both interest rate and credit quality, while getting a proportionally increased return.
The portfolio continues to generate income well in excess of the index — 2.16% versus 1.61% for the index3. This will benefit us in both flat and rising interest rate environments but it only provides a modest advantage in a falling interest rate environment such as that of the past six months.
There are several areas where our specific security selection paid off. The shipping container backed ABS bonds turned in very solid performance over the past six months with the 5-year average life bonds returning 4% to 5% while the approximately 2-year average life bonds returned between 0.5% and 2%.
The 10-year and 15-year amortization mortgage pools performed respectably as well. The worst performance came from our older (2-year) vintage mortgage interest-only holdings which had negative returns, the result of reacting to lower yield on 5- and 10-year Treasuries.
1 The portfolio holdings as the most recent quarter end may be obtained at http://www.fpafunds.com/docs/fpa-new-income-fund-information/new-income-12-09.pdf?sfvrsn=2.
2 The Barclays Capital Aggregate Bond Index is a broad based index and a market capitalization-weighted index and is often used to represent investment grade bonds being traded in the United States.
3 As of September 30, 2012, the SEC yield was 2.45%. This calculation begins with the Fund's dividend payments for the last 30 days, subtracts Fund expenses and uses this number to estimate your returns for a year. The SEC yield is based on the price of the Fund at the beginning of the month. The income yield stated here reflects prospective data and thus assumes payments collected by the Fund may fluctuate.
2
FPA NEW INCOME, INC.
LETTER TO SHAREHOLDERS (Continued)
Portfolio Activity
The Fund reduced its cash stake from approximately 6.9% to 2.2% over the past six months. The mortgage and asset-backed sectors continued to be the sectors with the most capital committed. Within the mortgage space, two specific areas represented the lion's share of investment.
First are agency mortgage pools consisting of 10-year and some 15-year mortgages. The pools have either 2.5% or 3% coupons, meaning that the underlying borrower pays between 3.0% and 3.5% on their loans. The borrower's position (we've outlined them in previous communication) mitigates some of the re-finance risk that has been in the mortgage market for quite some time. We believe the range of yields from these mortgage pools to remain low around 1% to 1.5% with the average life range being 3.3 to 4.2 years.
While our strategy for the agency mortgage pools has focused solely on shorter amortizing mortgages, we have found one 30-year mortgage area that we felt offered value due to a specific re-finance constraint. In the fall of last year, Congress decreased the maximum loan amount that FNMA/FHLMC could guarantee to $729,750 from $625,500. This means that borrowers with a $625,000 loan have very limited re-finance options given that the jumbo non-conforming loan market from a securitization aspect is almost nonexistent. Over the past six months, we committed almost 5% of the portfolio to collateralized mortgages obligations (CMOs) in which 25% to 40% of the loans fit into this jumbo category. The loans have interest rates between 4% and 4.5%. Under a range of stress conditions it is our expectation that the yield on these holdings should range between 0.30% for an approximately 1.4 year average life to 2.25% for a 3.5 year average life.
Within the asset-backed sector, bonds backed by shipping containers commanded the bulk of our investment. These shipping containers are leased to global shipping concerns. The containers range from simple 20x40 foot dry boxes to refrigerated containers for food and specialty containers used for electronics and various types of liquids from chemicals to wine. Over the past six months, we have accumulated over a 3% allocation, with a mix of 2-year average life bonds with expected yields in the 2% to 2.5% range, and 5-year average life bonds with an expected yield range of 3.85% to 4.25%.
Finally, the portfolio continues to add to its GNMA project loan interest-only holdings and we expect yield levels on these securities to be around 5% with an average life of 5.5 to 6 years.
Commentary
Beyond announcing its mortgage buying plan, the Fed also stipulated that the Fed Funds rate would remain between 0% and 0.25% until the middle of 2015 (versus late 2014). Given that more than 45% of the Fund is invested in agency-backed mortgage product, how will this affect our holdings?
To answer this rather massive question, let's place the Fed's planned purchases into the context of the total market. In addition to the newly mandated $40 billion in monthly mortgage purchases, the Fed will also reinvest monthly principal and interest cash flow from its existing mortgage holdings of around $25 to $40 billion per month. This will lead to combined monthly purchases of $65 to $80 billion in mortgage bonds for the medium term.
On the issuance side, the next six months may see gross issuance of FNMA, FHLMC and GNMA mortgage product to the tune of $107 to $124 billion, according to JP Morgan. This means that the U.S. government will be purchasing between 52% and 75% of the gross issuance monthly — a statistic that gives us great pause.
Stratifying further by segment, the table below shows the average issuances of 30-year FNMA/FHLMC and GNMA, and 15-year FNMA/FHLMC product over the last three months and then projects the Fed's prospective purchases in each segment. Since October of 2011, the Fed has announced that the principal and
3
FPA NEW INCOME, INC.
LETTER TO SHAREHOLDERS (Continued)
interest cash flow from current holdings would be invested in additional mortgage securities, the breakdown of purchases have been approximately 74% to FNMA/FHLMC 20-30 year product, 16% to GNMA 30-year product and 10% to FNMA/FHLMC 10-15 year product. If this allocation continues, the range of purchases could be approximately:
| | Issuance | | Fed Purchase | | Net to Public | | Percent | |
FNMA/FHLMC 20-30 Year | | $65 Billion | | $48-59 Billion | | $6-$17 Billion | | | 9 | %-26% | |
GNMA 30 Year | | $29 Billion | | $10-$13 Billion | | $16-$19 Billion | | | 55 | %-65% | |
FNMA/FHLMC 10-15 Year | | $22 Billion | | $7-$8 Billion | | $14-$15 Billion | | | 64 | %-69% | |
Why is the Fed making these purchases? Why mortgage-backed securities?
Let's try to understand the Fed's objective here. The public announcement indicates that the new asset purchase program aims to improve both economic growth and better employment. Now how would that work?
Central to the 'QE Infinity' strategy is the lowering of 30-year borrowing rates. That tactic is meant to translate to i) a boost in home sales and ii) the refinancing of existing loans with the excess cash plowed back into the economy. Those two outcomes, were they to come about, would undoubtedly benefit GDP growth and employment.
The Federal Reserve may also want to persuade banks to own fewer mortgages in their portfolio and make more loans. This may be accomplished by driving the price of shorter maturity mortgage pools such as 10-15 year amortization mortgage to levels that make them uneconomic for banks to purchase.
If the Fed's purchases continue in the same percentage mix as last year's, the chart indicates that the mortgages pools available to the public backed by 20-30 year mortgages will be constrained. Given this small amount available for private purchase it would be reasonable to assume that they would shift purchases to the 10-15 year portion of the market.
We see several obstacles that could mitigate the Fed's ability to drive down mortgage rates:
• The number of people employed in the mortgage servicing business has declined from a peak of about 500,000 to the current level estimated of 275,000. This creates a near-term capacity issue.
• More than 50% of mortgage servicing is concentrated in five companies and they may not be as interested in growing market share.
• Increased regulation has made mortgage servicing a less profitable business.
• Finally, FNMA and FHLMC have both announced increases in their mortgage guarantee fees. It is expected that these fee increases will be passed on to the consumer.
Will the Fed's purchases really increase consumers' cash?
Let's consider today's borrower. For Joe Normal to purchase a new home, he needs both a willingness and ability to borrow money. The "ability" translates to a 20% down payment. That's become tougher in an environment in which the average household income has declined from $50,303 (2008) to $50,054 (2011) according to the U.S. Census Bureau's American Community Survey. In addition, new graduates are entering adult life saddled with student-loan debt. The "willingness" to borrow translates to confidence that jobs and house prices will both remain stable. Housing does seem to have stabilized, as prices have increased over the past twelve months. Median sales price of existing homes has edged up from $171,200 (Aug 2011) to $188,700 (Aug 2012) according to the National Association of Realtors. In totality, however, the current economic environment does not appear to be super-conducive to a significantly large uptick in home purchases.
4
FPA NEW INCOME, INC.
LETTER TO SHAREHOLDERS (Continued)
Let's turn to the realm of loan refinancing. Do lower rates save that much for the 30-year mortgage borrower? Over the past five years, according to the Mortgage Bankers Association, the average size of a mortgage refinancing has been $222,700. The average refinancing rate for 2012 is 3.85% (the national 30-year mortgage rate on average for 2012 according to Bankrate.com). In addition, according to FHLMC the average change in mortgage rate from old to new rate in 2012 is 0.72%. Armed with this information we can get a sense of what the average home owner stands to save if rates on mortgages were to decline. Assuming a current monthly payment of $1,041, if the borrower refinances after a 0.72% decline in the mortgage rate, then his new rate would be 3.13%. At that new interest rate his monthly payment would be $952, a savings of $89/month. Given closing costs involved in refinancing a mortgage, this savings does not appear to be of sufficient magnitude to result in a dramatic surge in consumer spending (the hope or expectation of Chairman Bernanke). Projected onto a more macro scale, JP Morgan estimates that if all 30-year mortgage borrowers could get a 3% rate, a 100 basis point decline in mortgage rates would save borrowers $50 billion. That sounds like a lot of money, but in a $15 trillion economy it is de minimus (about 0.3% of GDP) and this assumes that 100% of that savings is spent rather than saved.
Expected impact on the Fund's portfolio
Your Fund's holdings are split between agency mortgage pools and collateralized mortgage obligations (CMOs). The potential impact will be mostly felt in the mortgage pool segment which matches what the Fed is buying. Our holdings are concentrated in the 3% and 3.5% coupon range, which will not be of direct interest to the Fed as they will need to find enough size monthly and that would mean focusing on the current production coupon of 2.5%. That said, we expect an impact in the 3% coupon as well. Near term, it should be a positive for the Fund as prices increase. Over the intermediate term, however, the principal and interest cash flow we are generating from our mortgage holdings may not be reinvested in the same sector as the high price and lower yield, in our opinion, will not represent adequate value when compared to the potential interest rate and inflation risk.
As we have discussed in prior commentaries, the asset-backed security (ABS) sector is one area of secured bonds we find attractive. Expect us to continue to exploit opportunities there. One example is our continued accumulation of ABS securities backed by various types of shipping containers. As of the end of the quarter, the allocation has grown to over 3%. We continue to analyze other types of assets for opportunities; however, the correct bond structure and amount available has not yet presented itself.
Within the commercial mortgage backed security (CMBS) portion of the market, we continue to accumulate GNMA project loan interest-only bonds. We also seek bonds backed by assets that are unique in some respects and difficult to replace.
Within the corporate bond universe, bonds secured by airplanes are attractive because we believe they offer a better risk/reward profile than other secured corporate bonds, and yield more than many unsecured corporate bonds. Another area in the secured portion of the bond market that offers potential is the bank loan area. Our investment team is giving both of the above serious analytical focus. We apply the same criteria as with the other secured bonds we have purchased: maturity of five years or less, assets critical to the business, assets we can reasonably value, and proven managements and business models.
Taking into account all these market opportunities, we believe that over time we can systematically reduce our mortgage holdings and find replacements in investments that could provide similar yields. We carry forth our strict discipline in analyzing opportunities with a keen eye toward capital preservation, with income and capital appreciation currently playing subordinate roles.
5
FPA NEW INCOME, INC.
LETTER TO SHAREHOLDERS (Continued)
Economic outlook & QE objectives
It has been well published in the investment community that the current economic recovery is the weakest since the Great Depression, which explains why many have labeled it the Great Recession. As described above, the latest QE initiative is designed to lower mortgage rates and drive up asset prices. There is also the idea of moving investors out of lower risk assets into higher risk assets. QE aims to move asset prices higher, so that investors, feeling wealthier, loosen their purse strings thus spurring faster economic growth, which in turn increases earnings and drives up equity prices. The goal, to use Chairman Bernanke's own words (first set forth in a November 2010 Washington Post editorial concurrent to QE1), is to create a "virtuous cycle".
While asset prices have gone up, the commensurate spending/economic growth/higher employment has not kicked in to the same degree. Okay, why not?
Stock mutual funds continue to see net outflows by investors. Over the past twelve months, net withdrawals are approximately $140.6 billion4. The top 20% of households hold the lion's share of the total households' financial assets. When looking at the median household it continues to experience inflation at 2% and nominal wage growth only 1.8%. We continue to expect the consumer to be constrained as long as costs are rising faster than income. So far the prior QE efforts have increased some asset prices but failed to move employment numbers. If you combine those out of work with those who have stopped looking for work, the unemployment percentage is the same as 2009, so the outcome of all the prior QE asset purchases has netted very little in putting more people to work. So why would we think this latest effort will have a different one?
Is the Fed at loggerheads with U.S. consumers?
Bernanke's policy, at its core, is designed to reward or benefit borrowers and punish lender/savers. If only the borrower had access to cheaper financing, asserts this hypothesis, he would borrow and spend more. The problem here is that the primary borrower is a household and there is no compelling evidence that American households are primed to take on more debt; but that to the contrary, they wish to wind down debt and boost savings. This makes innate sense if only due to demography, reference the aging of U.S. baby boomers. As populations near retirement, goals shift to quelling financial risk through conservative investing and debt reduction. Among the plethora of data5 in support of this trend we note:
• The rate of personal savings in this country has increased from 2.6% at the end of 2007 to 3.7% today.
• Mortgage debt at the household level has declined by 10% and revolving debt (credit cards) has declined by 16% over the past four plus years.
• Net issuance of less than 30-year-maturity loans, especially 10- and 15-year maturity loans, is up significantly in the past five years.
In today's interest-rate environment a borrower can refinance an existing 30-year mortgage into a 15-year mortgage, or an existing 15-year mortgage into a 10-year amortizing mortgage, and the net result can be a monthly payment that is much unchanged; however, given the quicker amortization the homeowner's equity in the home and net worth increases faster, and their outstanding debt decreases faster. With the Fed's objective in rather stark conflict with that of the American consumer, we are not surprised that the hoped for positive impact from the Fed interventions has fallen short.
* * *
4 Source: Investment Company Institute
5 Source: St. Louis Federal Reserve Bank
6
FPA NEW INCOME, INC.
LETTER TO SHAREHOLDERS (Continued)
We now ask that you buckle up for some time travel — a quick hop from outer space to Elizabethan England. Remember our September 2011 commentary that framed the period until November 2012 as a five-act Shakespearian play? Well, we're now deep into act five — the presidential election. With no clear-cut projected winner for the presidency, nor an indication which party will control the Senate, we won't have outcomes — or a gauge on the impact on fiscal policy and the capital markets — before our next Commentary is published. Please stay tuned for the next episode of "The Starship Infinity".
In the meantime, "Live Long and Prosper!"
As ever, we at FPA thank you for your continued trust placed in our investment team and strategy through your investment in FPA New Income, Inc.
Respectfully submitted,

Thomas H. Atteberry
Chief Executive Officer and Portfolio Manager
October 15, 2012
The discussion of Fund investments represents the views of the Fund's managers at the time of this report and is subject to change without notice. References to individual securities are for informational purposes only and should not be construed as recommendations to purchase or sell individual securities.
FORWARD LOOKING STATEMENT DISCLOSURE
As mutual fund managers, one of our responsibilities is to communicate with shareholders in an open and direct manner. Insofar as some of our opinions and comments in our letters to shareholders are based on current management expectations, they are considered "forward-looking statements" which may or may not be accurate over the long term. While we believe we have a reasonable basis for our comments and we have confidence in our opinions, actual results may differ materially from those we anticipate. You can identify forward-looking statements by words such as "believe," "expect," "may," "anticipate," and other similar expressions when discussing prospects for particular portfolio holdings and/or the markets, generally. We cannot, however, assure future results and disclaim any obligation to update or alter any forward-looking statements, whether as a result of new information, future events, or otherwise. Further, information provided in this report should not be construed as a recommendation to purchase or sell any particular security.
7
FPA NEW INCOME, INC.
HISTORICAL PERFORMANCE
(Unaudited)
Change in Value of a $10,000 Investment in FPA New Income, Inc. vs. Barclays U.S. Aggregate Index and Consumer Price Index + 100 Basis Points from October 1, 2002 to September 30, 2012
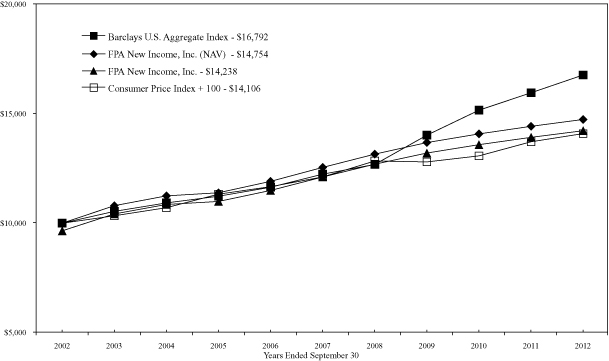
Past performance is not indicative of future performance. The Barclays U.S. Aggregate Bond Index a broad-based unmanaged composite of four major subindexes: U.S. Government Index; U.S. Credit Index; U.S. Mortgage-Backed Securities Index; and U.S. Asset-Backed Securities Index. The index holds investment quality bonds. The Consumer Price Index is an unmanaged index representing the rate of inflation of U.S. consumer prices as determined by the US Department of Labor Statistics.The Barclays Government/Credit Index is a broad-based unmanaged index of all government and corporate bonds that are investment grade with at least one year to maturity. The performance shown for FPA New Income, Inc., with an ending value of $14,238 reflects deduction of the current maximum sales charge of 3.5% of the offering price. In addition, since investors purchase shares of the Fund with varying sales charges depending primarily on volume purchased, the Fund's performance at net asset value (NAV) is also shown, as reflected by the ending value of $14,754. The performance of the Fund and of the Averages is computed on a total return basis which includes reinvestment of all distributions.
Past performance is no guarantee of future results and current performance may be higher or lower than the performance shown. This data represents past performance and investors should understand that investment returns and principal values fluctuate, so that when you redeem your investment may be worth more or less than its original cost. Current month-end performance data can be obtained by visiting the website at www.fpafunds.com or by calling toll-free, 1-800-982-4372. Information regarding the Fund's expense ratio and redemption fees can be found on pages 26 and 30.
The Prospectus details the Fund's objective and policies, sales charges, and other matters of interest to prospective investors. Please read the prospectus carefully before investing. The Prospectus may be obtained by visiting the website at www.fpafunds.com, by email at crm@fpafunds.com, toll-free by calling 1-800-982-4372 or by contacting the Fund in writing.
8
FPA NEW INCOME, INC.
PORTFOLIO SUMMARY
September 30, 2012
(Unaudited)
Bonds & Debentures | | | | | 97.8 | % | |
Mortgage Pass-Through | | | 24.9 | % | | | | | |
Mortgage-Backed | | | 23.4 | % | | | | | |
Commercial Mortgage-Backed | | | 13.3 | % | | | | | |
Stripped Mortgage-Backed | | | 13.2 | % | | | | | |
Asset-Backed | | | 10.7 | % | | | | | |
U.S. Treasuries* | | | 9.5 | % | | | | | |
Corporate | | | 2.1 | % | | | | | |
U.S. Agencies | | | 0.7 | % | | | | | |
Short-Term Investments* | | | | | 2.6 | % | |
Other Assets and Liabilities, net* | | | | | -0.4 | % | |
Total Net Assets | | | | | 100.0 | % | |
*Cash Plus Liquidity | | | | | 11.7 | % | |
MAJOR PORTFOLIO CHANGES
For the Six Months Ended September 30, 2012
(Unaudited)
| | Principal
Amount | |
NET PURCHASES | | | |
Federal Home Loan Mortgage Corporation 4100 EI (Interest only) — 3% 2027 (1) | | $ | 132,673,600 | | |
Government National Mortgage Association (Interest only) | |
| 2012-112 — 0.8626% 2053 (1) | | $ | 485,005,000 | | |
| 2012-100 — 0.88492% 2053 (1) | | $ | 159,590,056 | | |
| 2012-114 — 1.0244% 2053 (1) | | $ | 175,230,000 | | |
| 2012-58 — 1.02936% 2055 (1) | | $ | 239,680,596 | | |
| 2012-95 — 1.04669% 2056 (1) | | $ | 149,343,332 | | |
| 2012-79 — 1.05061% 2053 (1) | | $ | 150,372,960 | | |
U.S. Treasury Notes | |
| — 0.5% 2013 (1) | | $ | 90,000,000 | | |
| — 0.625% 2013 (1) | | $ | 120,000,000 | | |
| — 2.5% 2013 (1) | | $ | 200,950,000 | | |
NET SALES | | | |
Government National Mortgage Association 2008-45 (Interest only) — 0.49089% 2048 | | $ | 51,993,902 | | |
U.S. Treasury Notes | |
| — 0.375% 2012 (2) | | $ | 50,000,000 | | |
| — 4.25% 2012 (2) | | $ | 75,000,000 | | |
(1) Indicates new commitment to portfolio
(2) Indicates elimination from portfolio
9
FPA NEW INCOME, INC.
PORTFOLIO OF INVESTMENTS
September 30, 2012
BONDS & DEBENTURES | | Principal
Amount | | Fair
Value | |
MORTGAGE PASS-THROUGH SECURITIES — 24.9% | | | |
Federal Home Loan Mortgage Corporation | |
| 848215 — 2.358% 2038 | | $ | 4,408,070 | | | $ | 4,719,059 | | |
| 847526 — 2.37% 2034 | | | 7,336,436 | | | | 7,864,366 | | |
| 782629 — 2.384% 2035 | | | 1,167,060 | | | | 1,253,247 | | |
J20415 — 2.5% 2022 | | | 19,523,541 | | | | 20,569,881 | | |
G14462 — 3% 2022 | | | 20,826,575 | | | | 21,992,376 | | |
J18815 — 3% 2022 | | | 30,088,566 | | | | 31,907,984 | | |
J19188 — 3% 2022 | | | 24,034,223 | | | | 25,424,641 | | |
J19459 — 3% 2022 | | | 23,089,706 | | | | 24,425,482 | | |
J12954 — 3.5% 2020 | | | 5,898,759 | | | | 6,293,445 | | |
J13919 — 3.5% 2020 | | | 36,577,165 | | | | 38,820,373 | | |
E97666 — 4% 2018 | | | 10,542,037 | | | | 11,329,422 | | |
G14025 — 4% 2025 | | | 35,257,920 | | | | 37,867,006 | | |
J11410 — 4% 2025 | | | 13,074,489 | | | | 13,886,807 | | |
J12397 — 4% 2025 | | | 19,013,335 | | | | 20,211,746 | | |
J11204 — 4.5% 2019 | | | 8,489,922 | | | | 9,045,248 | | |
E01322 — 5% 2018 | | | 9,306,917 | | | | 10,126,391 | | |
G13091 — 5% 2018 | | | 4,730,485 | | | | 5,177,752 | | |
E01642 — 5% 2019 | | | 6,149,194 | | | | 6,730,600 | | |
G13812 — 5% 2020 | | | 14,991,088 | | | | 16,408,495 | | |
G14187 — 5.5% 2020 | | | 22,915,893 | | | | 24,848,161 | | |
G12139 — 6.5% 2019 | | | 2,360,419 | | | | 2,630,923 | | |
A26942 — 6.5% 2034 | | | 794,167 | | | | 924,069 | | |
G08107 — 6.5% 2036 | | | 3,388,882 | | | | 3,966,517 | | |
P50543 — 6.5% 2037 | | | 261,914 | | | | 310,274 | | |
Federal National Mortgage Association | |
AD0705 — 2.338% 2040 | | | 7,498,655 | | | | 8,023,636 | | |
AP2309 — 2.5% 2027 | | | 9,130,701 | | | | 9,612,916 | | |
AP3431 — 2.5% 2027 | | | 7,623,411 | | | | 8,026,022 | | |
| 890328 — 3% 2020 | | | 26,716,429 | | | | 28,787,487 | | |
| 890429 — 3% 2022 | | | 53,549,238 | | | | 57,140,801 | | |
AB4390 — 3% 2022 | | | 42,187,509 | | | | 44,819,284 | | |
AP4062 — 3% 2022 | | | 35,824,557 | | | | 38,283,297 | | |
AK4846 — 3% 2027 | | | 13,165,130 | | | | 13,983,837 | | |
MA0577 — 3.5% 2020 | | | 18,420,045 | | | | 19,823,468 | | |
MA0598 — 3.5% 2020 | | | 6,916,341 | | | | 7,443,297 | | |
MA0629 — 3.5% 2021 | | | 69,847,507 | | | | 74,562,214 | | |
MA0905 — 3.5% 2021 | | | 19,983,677 | | | | 21,332,575 | | |
MA0989 — 3.5% 2022 | | | 53,567,891 | | | | 57,649,229 | | |
MA1019 — 3.5% 2022 | | | 56,597,338 | | | | 60,417,658 | | |
10
FPA NEW INCOME, INC.
PORTFOLIO OF INVESTMENTS (Continued)
September 30, 2012
BONDS & DEBENTURES — Continued | | Principal
Amount | | Fair
Value | |
MA0124 — 4% 2019 | | $ | 2,603,873 | | | $ | 2,796,560 | | |
MA0150 — 4% 2019 | | | 36,168,466 | | | | 38,844,933 | | |
MA0203 — 4% 2019 | | | 18,977,874 | | | | 20,382,237 | | |
MA0235 — 4% 2019 | | | 17,154,383 | | | | 18,423,807 | | |
MA0267 — 4% 2019 | | | 12,180,899 | | | | 13,082,286 | | |
MA0380 — 4% 2020 | | | 10,331,425 | | | | 11,095,950 | | |
| 932433 — 4% 2020 | | | 1,343,970 | | | | 1,443,424 | | |
MA0322 — 4% 2020 | | | 19,874,369 | | | | 21,345,072 | | |
MA0430 — 4% 2020 | | | 6,621,876 | | | | 7,111,895 | | |
AA4552 — 4% 2024 | | | 1,178,151 | | | | 1,265,134 | | |
AH4841 — 4% 2026 | | | 29,839,692 | | | | 32,356,372 | | |
| 735494 — 4.5% 2020 | | | 21,099,521 | | | | 22,796,344 | | |
AA8521 — 4.5% 2020 | | | 10,395,260 | | | | 11,232,806 | | |
AA0905 — 4.5% 2021 | | | 4,952,114 | | | | 5,351,552 | | |
| 995756 — 5% 2018 | | | 15,454,829 | | | | 16,827,681 | | |
| 735453 — 5% 2019 | | | 8,015,804 | | | | 8,769,931 | | |
AE0126 — 5% 2020 | | | 20,328,897 | | | | 22,208,710 | | |
| 890083 — 5% 2021 | | | 8,410,056 | | | | 9,163,933 | | |
| 890122 — 5% 2021 | | | 7,102,060 | | | | 7,778,815 | | |
| 995861 — 5% 2021 | | | 16,795,482 | | | | 18,294,311 | | |
AE0792 — 5% 2026 | | | 15,341,436 | | | | 16,791,048 | | |
| 257100 — 5.5% 2018 | | | 1,629,028 | | | | 1,784,372 | | |
| 745500 — 5.5% 2018 | | | 11,763,532 | | | | 12,918,005 | | |
| 995327 — 5.5% 2019 | | | 3,568,983 | | | | 3,918,351 | | |
| 735521 — 5.5% 2020 | | | 6,704,164 | | | | 7,361,172 | | |
| 889318 — 5.5% 2020 | | | 13,501,434 | | | | 14,738,435 | | |
| 995284 — 5.5% 2020 | | | 14,700,685 | | | | 16,066,085 | | |
| 889069 — 5.5% 2021 | | | 12,759,937 | | | | 14,013,218 | | |
AE0237 — 5.5% 2023 | | | 16,066,161 | | | | 17,646,429 | | |
| 865963 — 5.839% 2036 | | | 4,807,165 | | | | 5,114,102 | | |
| 745832 — 6% 2021 | | | 27,699,589 | | | | 30,587,548 | | |
AD0951 — 6% 2021 | | | 15,132,938 | | | | 16,708,277 | | |
| 890225 — 6% 2023 | | | 15,293,236 | | | | 16,888,168 | | |
| 923306 — 6.5% 2037 | | | 247,215 | | | | 276,945 | | |
| 323282 — 7.5% 2028 | | | 429,675 | | | | 499,192 | | |
Government National Mortgage Association | |
| 782281 — 6% 2023 | | | 5,394,612 | | | | 5,832,007 | | |
TOTAL MORTGAGE PASS-THROUGH SECURITIES | | $ | 1,268,355,093 | | |
11
FPA NEW INCOME, INC.
PORTFOLIO OF INVESTMENTS (Continued)
September 30, 2012
BONDS & DEBENTURES — Continued | | Principal
Amount | | Fair
Value | |
MORTGAGE-BACKED SECURITIES — 23.4% | | | |
Bayview Opportunity Master Fund Trust | |
2012-4NPL CL A — 3.4747% 2032† | | $ | 8,086,449 | | | $ | 8,086,449 | | |
Citicorp Mortgage Securities Inc. 2005-5 CL 2A3 — 5% 2020 | | | 446,143 | | | | 453,317 | | |
Federal Home Loan Bank | |
| 00-0606 CL Y — 5.27% 2012 | | | 9,408,549 | | | | 9,503,858 | | |
I7-2014 1 — 5.34% 2014 | | | 23,126,775 | | | | 24,314,797 | | |
| 00-0986 — 5.739% 2014 | | | 17,683,501 | | | | 18,870,241 | | |
Federal Home Loan Mortgage Corporation | |
| 3829 CL CD — 3% 2024 | | | 7,016,627 | | | | 7,228,038 | | |
| 2786 CL JC — 4% 2018 | | | 467,042 | | | | 469,218 | | |
| 3806 CL AB — 4% 2023 | | | 16,430,116 | | | | 17,234,699 | | |
| 2869 CL JA — 4% 2034 | | | 6,565,242 | | | | 6,654,989 | | |
| 4088 CL LE — 4% 2040 | | | 20,298,140 | | | | 21,929,181 | | |
| 2877 CL WA — 4.25% 2034 | | | 8,005,579 | | | | 8,279,370 | | |
| 3578 CL AM — 4.5% 2016 | | | 5,885,987 | | | | 6,205,478 | | |
| 2677 CL LD — 4.5% 2017 | | | 2,022,208 | | | | 2,029,791 | | |
| 2914 CL JQ — 4.5% 2019 | | | 4,475,752 | | | | 4,592,524 | | |
| 3439 CL AC — 4.5% 2022 | | | 9,250,025 | | | | 9,514,113 | | |
| 3939 CL D — 4.5% 2041 | | | 9,068,526 | | | | 9,766,919 | | |
| 2509 CL CB — 5% 2017 | | | 5,313,777 | | | | 5,591,688 | | |
| 2602 CL ET — 5% 2017 | | | 2,818,786 | | | | 2,873,217 | | |
| 2747 CL DX — 5% 2019 | | | 8,906,492 | | | | 9,579,199 | | |
| 3852 CL HA — 5% 2021 | | | 16,563,718 | | | | 17,833,161 | | |
| 3285 CL LC — 5% 2025 | | | 7,639,765 | | | | 7,827,780 | | |
| 2494 CL CF — 5.5% 2017 | | | 5,729,476 | | | | 6,122,174 | | |
| 2503 CL B — 5.5% 2017 | | | 5,546,707 | | | | 5,896,482 | | |
| 3808 CL BQ — 5.5% 2025 | | | 21,449,626 | | | | 23,034,110 | | |
| 3806 CL JB — 5.5% 2026 | | | 8,751,284 | | | | 9,610,573 | | |
| 3855 CL HQ — 5.5% 2026 | | | 11,406,730 | | | | 12,322,234 | | |
| 2922 CL Z — 5.5% 2032 | | | 1,513,213 | | | | 1,545,172 | | |
| 2670 CL QG — 5.5% 2032 | | | 13,572,462 | | | | 13,934,575 | | |
| 3133 CL BD — 5.75% 2033 | | | 1,537,508 | | | | 1,556,681 | | |
| 3926 CL GP — 6% 2025 | | | 10,729,105 | | | | 11,514,583 | | |
| 3614 CL DY — 6% 2032 | | | 16,870,196 | | | | 18,931,228 | | |
Federal National Mortgage Association | |
| 2011-125 CL GD — 3.5% 2025 | | | 19,629,427 | | | | 20,054,600 | | |
| 2012-8 CL LE — 3.5% 2042 | | | 43,390,000 | | | | 46,840,073 | | |
| 2012-26 CL ME — 3.5% 2042 | | | 56,555,000 | | | | 61,180,170 | | |
| 2012-41 CL LB — 3.5% 2042 | | | 54,300,000 | | | | 58,758,931 | | |
| 2012-48 CL MB — 3.5% 2042 | | | 54,440,000 | | | | 58,829,367 | | |
12
FPA NEW INCOME, INC.
PORTFOLIO OF INVESTMENTS (Continued)
September 30, 2012
BONDS & DEBENTURES — Continued | | Principal
Amount | | Fair
Value | |
| 2012-73 CL JB — 3.5% 2042 | | $ | 49,460,000 | | | $ | 53,299,417 | | |
| 2012-117 CL AD — 3.5% 2042 | | | 66,394,414 | | | | 70,959,030 | | |
| 2009-68 CL KA — 3.75% 2022 | | | 2,582,029 | | | | 2,635,658 | | |
| 2011-67 CL EA — 4% 2021 | | | 36,790,945 | | | | 39,445,412 | | |
| 2011-27 CL JQ — 4% 2039 | | | 19,199,607 | | | | 20,305,059 | | |
| 2012-95 CL AB — 4% 2040 | | | 26,650,121 | | | | 27,739,277 | | |
| 2012-78 CL PA — 4% 2041 | | | 32,984,375 | | | | 35,029,076 | | |
| 2012-97 CL MA 4% 2041 | | | 32,346,927 | | | | 33,883,985 | | |
| 2012-81 CL Q — 4% 2042 | | | 27,690,378 | | | | 29,612,647 | | |
| 2009-70 CL NU — 4.25% 2019 | | | 12,915,258 | | | | 13,614,619 | | |
| 2004-90 CL GA — 4.35% 2034 | | | 6,903,750 | | | | 7,123,496 | | |
| 2012-67 CL PB — 4.5% 2027 | | | 25,549,280 | | | | 26,839,519 | | |
| 2012-40 CL GC — 4.5% 2040 | | | 16,565,000 | | | | 17,512,864 | | |
| 2011-148 CL PB — 4.5% 2041 | | | 21,914,268 | | | | 23,990,472 | | |
| 2012-102 CL PA — 4.5% 2041 | | | 30,797,080 | | | | 33,106,011 | | |
| 2003-24 CL PD — 5% 2018 | | | 6,088,512 | | | | 6,487,492 | | |
| 2008-77 CL DA — 5% 2023 | | | 6,582,876 | | | | 6,927,490 | | |
| 2005-4 CL E — 5% 2032 | | | 723,007 | | | | 723,853 | | |
| 2010-39 CL PL — 5% 2032 | | | 11,089,804 | | | | 11,692,202 | | |
| 2004-60 CL LB — 5% 2034 | | | 14,651,791 | | | | 16,034,920 | | |
2003-W17 CL 1A5 — 5.35% 2033 | | | 6,773,848 | | | | 7,027,054 | | |
| 2011-19 CL WB — 5.5% 2018 | | | 13,991,491 | | | | 15,073,733 | | |
| 2009-116 CL PA — 5.5% 2024 | | | 8,587,547 | | | | 9,086,140 | | |
| 2006-21 CL CA — 5.5% 2029 | | | 2,534,791 | | | | 2,582,572 | | |
| 2003-28 CL PG — 5.5% 2032 | | | 3,328,380 | | | | 3,402,037 | | |
| 2002-87 CL N — 5.5% 2032 | | | 746,917 | | | | 749,546 | | |
| 2002-9 CL PC — 6% 2017 | | | 5,605,534 | | | | 6,009,188 | | |
Sequoia Mortgage Trust 2012-1 1A1 — 2.865% 2042 | | | 17,128,859 | | | | 17,338,047 | | |
Stanwich Mortgage Loan Trust Series | |
| 2009-2A — 3.1339% 2049†,* | | | 311,113 | | | | 139,130 | | |
2010-1A — 15.01004% 2047†,* | | | 1,641,753 | | | | 830,399 | | |
2010-2A — 7.83419% 2057†,* | | | 6,287,147 | | | | 3,169,979 | | |
2010-3A — 4.71977% 2038†,* | | | 3,630,627 | | | | 1,816,403 | | |
2010-4A — 4.45493% 2049†,* | | | 4,740,662 | | | | 2,215,311 | | |
2011-1 A — 14.66244% 2039†,* | | | 8,096,944 | | | | 4,270,563 | | |
2011-2 A — 4.62312% 2050†,* | | | 6,211,651 | | | | 3,324,500 | | |
2012-NPL3 CL A — 4.2126% 2042† | | | 6,204,186 | | | | 6,236,572 | | |
2012-NPL4 CL A — 2.9814% 2042† | | | 32,740,000 | | | | 32,740,000 | | |
Vericrest Opportunity Loan Transferee | |
2012-NL2A A1 — 2.4871% 2052† | | | 19,035,000 | | | | 19,073,641 | | |
2012-NL1A A1 — 4.2128% 2049† | | | 1,881,255 | | | | 1,882,515 | | |
13
FPA NEW INCOME, INC.
PORTFOLIO OF INVESTMENTS (Continued)
September 30, 2012
BONDS & DEBENTURES — Continued | | Principal
Amount | | Fair
Value | |
2011-NL3A A1 — 5.1938% 2051† | | $ | 4,694,643 | | | $ | 4,727,177 | | |
VRPL 2012-RP2A CL AI 4.7037% 2017† | | | 10,914,295 | | | | 10,996,152 | | |
Wells Fargo Mortgage-Backed Securities Trust 2006-5 2A1 — 5.25% 2021 | | | 10,896,130 | | | | 11,069,161 | | |
TOTAL MORTGAGE-BACKED SECURITIES | | $ | 1,189,691,299 | | |
COMMERCIAL MORTGAGE-BACKED SECURITIES — 13.3% | | | |
Government National Mortgage Association | |
| 2012-22 CL AB — 1.6661% 2026 | | $ | 7,769,652 | | | $ | 7,897,284 | | |
| 2011-49 CL AB — 2.8% 2034 | | | 40,782,584 | | | | 41,311,126 | | |
| 2011-120 CL A — 3.94387% 2033 | | | 47,494,419 | | | | 49,744,230 | | |
| 2006-67 CL A — 3.947% 2030 | | | 614,858 | | | | 617,250 | | |
| 2011-143 CL AB — 3.9738% 2033 | | | 47,537,696 | | | | 49,827,112 | | |
| 2008-45 CL C — 4.055% 2035 | | | 1,899,852 | | | | 1,904,253 | | |
| 2006-51 CL A — 4.253% 2030 | | | 644,813 | | | | 648,527 | | |
| 2007-77 C — 4.26% 2036 | | | 50,000,000 | | | | 53,157,115 | | |
| 2007-15 CL B — 4.425% 2032 | | | 40,922,000 | | | | 41,762,129 | | |
| 2008-39 CL A — 4.5% 2023 | | | 4,790,581 | | | | 4,837,720 | | |
| 2007-34 CL B — 4.579% 2031 | | | 48,265,000 | | | | 49,379,825 | | |
| 2005-52 CL C — 4.587% 2045 | | | 1,737,135 | | | | 1,749,364 | | |
| 2007-55 CL B — 4.633% 2033 | | | 50,000,000 | | | | 51,711,300 | | |
| 2004-78 CL C — 4.658% 2029 | | | 1,631,911 | | | | 1,655,149 | | |
| 2008-92 CL A — 4.771% 2027 | | | 1,551,116 | | | | 1,559,275 | | |
| 2006-67 CL B — 4.858% 2034 | | | 57,330,000 | | | | 59,572,302 | | |
| 2006-55 CL B — 4.875% 2032 | | | 14,789,952 | | | | 14,943,466 | | |
| 2006-30 CL B — 4.958% 2031 | | | 23,041,074 | | | | 24,010,599 | | |
| 2007-69 CL B — 4.959% 2030 | | | 13,873,213 | | | | 14,157,198 | | |
| 2006-8 CL C — 5.313% 2036 | | | 19,633,962 | | | | 20,300,142 | | |
| 2008-59 CL B — 5.553% 2026 | | | 10,697,305 | | | | 10,945,162 | | |
GS Mortgage Securities Corporation II | |
2007-EOP A1 — 1.10313% 2020† | | | 7,648,788 | | | | 7,657,814 | | |
2007-EOP A2 — 1.26008% 2020† | | | 20,755,000 | | | | 20,708,301 | | |
2007-EOP A3 — 1.45627% 2020† | | | 17,696,000 | | | | 17,681,666 | | |
JP Morgan Clearing Corporation 2011-FL1 MH — 4.511% 2028† | | | 20,000,000 | | | | 19,718,000 | | |
LSTAR Commercial Mortgage Trust 2001-1 A — 3.9129% 2017† | | | 11,460,364 | | | | 12,091,028 | | |
Store Master Funding LLC 2012-1A CLA — 5.77% 2042† | | | 17,220,113 | | | | 17,165,627 | | |
Wachovia Bank Commercial Mortgage Trust | |
2006-WL7A CL A1 — 0.31075% 2021† | | | 128,167 | | | | 125,283 | | |
2006-WL7A CL A2 — 0.3595% 2021† | | | 59,160,000 | | | | 56,497,800 | | |
Washington Mutual Commercial Mortgage Series Trust | |
2007-SL2 CL A — 5.42876% 2049† | | | 24,457,597 | | | | 24,756,958 | | |
TOTAL COMMERCIAL MORTGAGE-BACKED SECURITIES | | $ | 678,093,005 | | |
14
FPA NEW INCOME, INC.
PORTFOLIO OF INVESTMENTS (Continued)
September 30, 2012
BONDS & DEBENTURES — Continued | | Principal
Amount | | Fair
Value | |
STRIPPED MORTGAGE-BACKED SECURITIES — 13.2% | | | |
PRINCIPAL ONLY SECURITIES | | | |
Federal Home Loan Mortgage Corporation 217 — 0% 2032 | | $ | 802,951 | | | $ | 744,866 | | |
INTEREST ONLY SECURITIES | | | |
Federal Home Loan Mortgage Corporation | |
| 3714 TI — 2.25% 2015 | | | 74,241,098 | | | | 2,485,592 | | |
| 3948 AI — 3% 2021 | | | 14,185,373 | | | | 903,183 | | |
| 3935 LI — 3% 2021 | | | 10,981,339 | | | | 891,904 | | |
| 3956 KI — 3% 2021 | | | 29,072,699 | | | | 2,419,430 | | |
| 3968 AI — 3% 2021 | | | 11,003,403 | | | | 912,732 | | |
| 3992 OI — 3% 2022 | | | 8,350,615 | | | | 700,032 | | |
| 3994 EI — 3% 2022 | | | 17,878,000 | | | | 1,545,196 | | |
| 3998 KI — 3% 2026 | | | 31,298,095 | | | | 3,287,865 | | |
| 3994 AI — 3% 2027 | | | 19,556,169 | | | | 1,685,937 | | |
| 4100 EI — 3% 2027 | | | 132,673,600 | | | | 14,042,439 | | |
| 3706 AI — 3.5% 2020 | | | 21,220,674 | | | | 1,155,041 | | |
| 3722 AI — 3.5% 2020 | | | 20,418,533 | | | | 1,574,881 | | |
| 3735 AI — 3.5% 2020 | | | 10,196,938 | | | | 784,552 | | |
| 3755 AI — 3.5% 2020 | | | 19,159,418 | | | | 1,493,093 | | |
| 3760 KI — 3.5% 2020 | | | 16,151,204 | | | | 1,125,577 | | |
| 3753 CI — 3.5% 2020 | | | 4,465,467 | | | | 353,576 | | |
| 3874 DI — 3.5% 2020 | | | 18,704,814 | | | | 1,415,910 | | |
| 3893 DI — 3.5% 2020 | | | 13,330,569 | | | | 956,468 | | |
| 3784 BI — 3.5% 2021 | | | 12,072,933 | | | | 1,067,489 | | |
| 3874 BI — 3.5% 2021 | | | 10,241,775 | | | | 966,492 | | |
| 3893 BI — 3.5% 2021 | | | 8,370,635 | | | | 778,888 | | |
| 3909 KI — 3.5% 2021 | | | 8,251,289 | | | | 696,180 | | |
| 3938 IO — 3.5% 2021 | | | 48,867,530 | | | | 4,692,260 | | |
| 3778 GI — 3.5% 2024 | | | 10,202,569 | | | | 617,255 | | |
| 3854 GI — 3.5% 2024 | | | 10,005,405 | | | | 491,465 | | |
| 3763 NI — 3.5% 2025 | | | 8,142,285 | | | | 664,166 | | |
| 3852 YI — 3.5% 2025 | | | 27,989,544 | | | | 1,396,678 | | |
| 3904 QI — 3.5% 2025 | | | 9,944,700 | | | | 616,571 | | |
| 3909 UI — 3.5% 2025 | | | 16,655,902 | | | | 912,910 | | |
| 3904 NI — 3.5% 2026 | | | 18,447,633 | | | | 1,816,466 | | |
| 3930 AI — 3.5% 2026 | | | 18,809,868 | | | | 2,310,980 | | |
| 4018 AI — 3.5% 2027 | | | 34,147,766 | | | | 4,569,115 | | |
| 3684 CI — 4.5% 2024 | | | 48,219,362 | | | | 4,613,296 | | |
| 3917 AI — 4.5% 2026 | | | 61,039,647 | | | | 7,174,148 | | |
| 2558 CL JW — 5.5% 2022 | | | 1,117,134 | | | | 25,783 | | |
| 217 — 6.5% 2032 | | | 802,951 | | | | 168,620 | | |
15
FPA NEW INCOME, INC.
PORTFOLIO OF INVESTMENTS (Continued)
September 30, 2012
BONDS & DEBENTURES — Continued | | Principal
Amount | | Fair
Value | |
Federal National Mortgage Association | |
| 2011-88 BI — 3% 2020 | | $ | 8,121,031 | | | $ | 443,652 | | |
| 2011-113 GI — 3% 2021 | | | 13,784,201 | | | | 993,565 | | |
| 2011-129 AI — 3% 2021 | | | 18,143,710 | | | | 1,354,609 | | |
| 2011-141 EI — 3% 2021 | | | 30,017,878 | | | | 2,181,943 | | |
| 2011-149 KI — 3% 2021 | | | 26,678,992 | | | | 1,923,022 | | |
| 2012-8 TI — 3% 2021 | | | 14,341,253 | | | | 1,033,718 | | |
| 2012-8 UI — 3% 2021 | | | 43,675,305 | | | | 3,708,422 | | |
| 2011-137 AI — 3% 2022 | | | 24,489,061 | | | | 1,924,595 | | |
| 2011-138 IG — 3% 2022 | | | 27,478,268 | | | | 2,170,783 | | |
| 2011-145 — 3% 2022 | | | 35,523,067 | | | | 2,515,388 | | |
| 2012-23 IA — 3% 2022 | | | 15,809,731 | | | | 1,368,965 | | |
| 2012-32 AI — 3% 2022 | | | 26,055,192 | | | | 2,147,229 | | |
| 2012-53 CI — 3% 2022 | | | 38,434,391 | | | | 3,394,391 | | |
| 2012-78 AI — 3% 2022 | | | 22,334,812 | | | | 1,556,513 | | |
| 2010-124 AI — 3.5% 2020 | | | 13,533,764 | | | | 1,071,276 | | |
| 2010-128 LI — 3.5% 2020 | | | 25,715,658 | | | | 2,030,506 | | |
| 2010-145 BI — 3.5% 2020 | | | 12,071,183 | | | | 1,034,962 | | |
| 2011-75 BI — 3.5% 2020 | | | 14,028,012 | | | | 1,018,574 | | |
| 2011-78 LI — 3.5% 2020 | | | 35,724,962 | | | | 2,733,674 | | |
| 2010-104 CI — 3.5% 2021 | | | 28,426,755 | | | | 2,701,110 | | |
| 2011-61 BI — 3.5% 2021 | | | 9,755,478 | | | | 1,000,717 | | |
| 2011-66 QI — 3.5% 2021 | | | 17,447,685 | | | | 1,515,506 | | |
| 2011-104 DI — 3.5% 2021 | | | 49,699,334 | | | | 4,344,219 | | |
| 2011-110 AI — 3.5% 2021 | | | 20,883,928 | | | | 1,865,352 | | |
| 2011-118 IC — 3.5% 2021 | | | 52,929,005 | | | | 5,381,821 | | |
| 2011-125 DI — 3.5% 2021 | | | 36,306,007 | | | | 3,593,932 | | |
| 2011-143 MI — 3.5% 2022 | | | 16,638,733 | | | | 1,306,002 | | |
| 2012-2 MI — 3.5% 2022 | | | 21,954,649 | | | | 2,150,019 | | |
| 2010-135 DI — 3.5% 2024 | | | 21,343,767 | | | | 1,200,587 | | |
| 2010-137 BI — 3.5% 2024 | | | 10,570,454 | | | | 663,719 | | |
| 2011-22 IC — 3.5% 2025 | | | 13,394,056 | | | | 1,512,993 | | |
| 2011-66 BI — 3.5% 2025 | | | 5,553,218 | | | | 332,416 | | |
| 2011-67 CI — 3.5% 2025 | | | 8,911,430 | | | | 639,930 | | |
| 2011-75 AI — 3.5% 2025 | | | 38,158,078 | | | | 2,659,236 | | |
| 2011-80 KI — 3.5% 2025 | | | 17,861,902 | | | | 1,192,818 | | |
| 2011-101 IC — 3.5% 2026 | | | 93,193,216 | | | | 10,674,453 | | |
| 2011-101 EI — 3.5% 2026 | | | 34,137,692 | | | | 4,275,746 | | |
| 2011-101 IE — 3.5% 2026 | | | 31,652,152 | | | | 3,561,184 | | |
| 2011-104 IM — 3.5% 2026 | | | 27,001,233 | | | | 3,027,378 | | |
| 2010-89 LI — 4% 2020 | | | 21,496,663 | | | | 2,205,773 | | |
| 2010-104 CI — 4% 2020 | | | 9,398,444 | | | | 855,728 | | |
16
FPA NEW INCOME, INC.
PORTFOLIO OF INVESTMENTS (Continued)
September 30, 2012
BONDS & DEBENTURES — Continued | | Principal
Amount | | Fair
Value | |
| 2011-69 TI — 4% 2020 | | $ | 14,667,965 | | | $ | 998,742 | | |
| 2011-67 EI — 4% 2021 | | | 23,988,192 | | | | 1,703,881 | | |
| 2010-110 IH — 4.5% 2018 | | | 25,043,442 | | | | 2,173,222 | | |
| 2009-70 IN — 4.5% 2019 | | | 38,674,320 | | | | 2,998,420 | | |
| 2008-15 JI — 4.5% 2022 | | | 10,902,892 | | | | 605,874 | | |
| 2010-30 — 5% 2018 | | | 15,509,791 | | | | 1,265,754 | | |
| 2010-114 CI — 5% 2018 | | | 35,238,782 | | | | 2,842,360 | | |
| 2003-64 XI — 5% 2033 | | | 2,549,224 | | | | 487,718 | | |
Government National Mortgage Association | |
| 2002-56 — 0.04249% 2042 | | | 364,753 | | | | 605 | | |
| 2004-43 — 0.1801% 2044 | | | 87,227,740 | | | | 1,475,021 | | |
| 2008-48 — 0.23118% 2048 | | | 72,500,804 | | | | 2,116,298 | | |
| 2006-15 — 0.23737% 2046 | | | 21,608,442 | | | | 511,472 | | |
| 2004-108 — 0.31463% 2044 | | | 32,128,051 | | | | 821,836 | | |
| 2004-10 — 0.40128% 2044 | | | 80,768,143 | | | | 590,415 | | |
| 2006-30 — 0.40994% 2046 | | | 17,343,317 | | | | 663,382 | | |
| 2008-78 — 0.42609% 2048 | | | 69,074,153 | | | | 2,727,048 | | |
| 2006-55 — 0.43259% 2046 | | | 58,917,088 | | | | 1,799,917 | | |
| 2005-9 — 0.45163% 2045 | | | 15,522,978 | | | | 357,649 | | |
| 2008-45 — 0.49089% 2048 | | | 75,897,829 | | | | 1,550,593 | | |
| 2006-5 — 0.49138% 2046 | | | 73,048,106 | | | | 1,740,006 | | |
| 2007-4 — 0.56079% 2047 | | | 33,531,750 | | | | 1,195,742 | | |
| 2005-90 — 0.57499% 2045 | | | 82,575,532 | | | | 1,914,101 | | |
| 2006-67 — 0.68513% 2046 | | | 56,423,718 | | | | 1,735,029 | | |
| 2011-10 — 0.68879% 2045 | | | 117,324,807 | | | | 5,330,066 | | |
| 2005-50 — 0.69372% 2045 | | | 22,036,986 | | | | 600,508 | | |
| 2007-55 — 0.73551% 2047 | | | 114,550,528 | | | | 4,477,780 | | |
| 2007-34 — 0.7731% 2047 | | | 43,340,501 | | | | 1,971,559 | | |
| 2010-161 IA — 0.78339% 2050 | | | 285,256,864 | | | | 13,235,919 | | |
| 2007-15 — 0.79236% 2047 | | | 122,763,049 | | | | 5,268,990 | | |
| 2008-8 — 0.8029% 2047 | | | 128,363,720 | | | | 3,301,515 | | |
| 2007-77 — 0.80924% 2047 | | | 144,629,858 | | | | 5,383,123 | | |
| 2012-112 — 0.8626% 2053 | | | 485,005,000 | | | | 35,655,446 | | |
| 2010-18 — 0.87643% 2050 | | | 185,693,518 | | | | 8,924,430 | | |
| 2012-100 — 0.88492% 2053 | | | 159,590,056 | | | | 11,829,150 | | |
| 2010-123 — 0.89536% 2050 | | | 88,317,601 | | | | 5,163,047 | | |
| 2008-92 — 0.92784% 2048 | | | 110,714,321 | | | | 5,237,895 | | |
| 2010-63 — 0.95272% 2050 | | | 94,103,196 | | | | 4,408,735 | | |
| 2008-24 — 0.97788% 2047 | | | 47,130,881 | | | | 1,469,070 | | |
| 2009-119 — 0.99119% 2049 | | | 318,390,056 | | | | 15,983,181 | | |
| 2009-4 — 1.0211% 2049 | | | 90,947,258 | | | | 4,368,197 | | |
| 2012-114 — 1.0244% 2053 | | | 175,230,000 | | | | 16,906,957 | | |
| 2012-9 — 1.02829% 2052 | | | 179,706,631 | | | | 19,724,600 | | |
17
FPA NEW INCOME, INC.
PORTFOLIO OF INVESTMENTS (Continued)
September 30, 2012
BONDS & DEBENTURES — Continued | | Principal
Amount | | Fair
Value | |
| 2012-58 — 1.02936% 2055 | | $ | 239,680,596 | | | $ | 20,883,370 | | |
| 2011-6 — 1.03829% 2052 | | | 251,640,133 | | | | 14,783,858 | | |
| 2012-95 — 1.04669% 2053 | | | 149,343,332 | | | | 13,621,486 | | |
| 2012-79 — 1.05061% 2053 | | | 150,372,960 | | | | 12,819,295 | | |
| 2009-86 — 1.062% 2049 | | | 149,611,991 | | | | 7,420,755 | | |
| 2012-45 — 1.06356% 2053 | | | 36,282,738 | | | | 3,235,154 | | |
| 2011-165 — 1.06465% 2051 | | | 257,273,234 | | | | 15,830,022 | | |
| 2012-35 — 1.07093% 2052 | | | 158,019,497 | | | | 12,821,465 | | |
| 2009-105 — 1.07139% 2049 | | | 150,605,601 | | | | 8,664,340 | | |
| 2012-25 — 1.09589% 2052 | | | 124,028,545 | | | | 9,753,630 | | |
| 2011-143 — 1.10878% 2053 | | | 100,515,140 | | | | 14,832,014 | | |
| 2009-60 — 1.12065% 2049 | | | 135,097,321 | | | | 6,960,214 | | |
| 2011-64 IX — 1.12358% 2044 | | | 159,975,041 | | | | 10,601,546 | | |
| 2009-71 — 1.48283% 2049 | | | 145,633,460 | | | | 8,800,630 | | |
| 2010-28 — 1.15844% 2050 | | | 157,482,618 | | | | 8,689,891 | | |
| 2011-120 — 1.16719% 2043 | | | 124,577,031 | | | | 15,766,469 | | |
| 2011-49 — 1.17101% 2045 | | | 95,145,851 | | | | 6,261,548 | | |
| 2010-49 — 1.18555% 2050 | | | 169,343,896 | | | | 9,662,763 | | |
| 2011-149 — 1.20703% 2046 | | | 168,006,922 | | | | 13,868,971 | | |
| 2009-49 — 1.25376% 2049 | | | 137,061,602 | | | | 7,623,366 | | |
| 2011-78 IX — 1.26974% 2046 | | | 190,614,971 | | | | 13,924,424 | | |
| 2011-16 — 1.27918% 2046 | | | 154,782,793 | | | | 10,235,786 | | |
| 2011-164 — 1.40574% 2046 | | | 223,495,639 | | | | 17,799,193 | | |
| 2011-92 IX — 1.44179% 2044 | | | 44,559,521 | | | | 3,727,404 | | |
| 2010-148 IX — 1.46264% 2052 | | | 90,678,134 | | | | 6,583,233 | | |
| 2012-4 — 1.62286% 2052 | | | 301,335,492 | | | | 26,492,904 | | |
| 2009-30 — 1.88268% 2049 | | | 85,742,496 | | | | 6,992,301 | | |
TOTAL STRIPPED MORTGAGE-BACKED SECURITIES | | $ | 673,494,747 | | |
ASSET-BACKED SECURITIES — 10.7% | | | |
AmeriCredit Automobile Receivables Trust | |
| 2011-2 C — 3.19% 2016 | | $ | 8,580,000 | | | $ | 8,953,659 | | |
| 2010-3 D — 4.98% 2018 | | | 13,735,000 | | | | 14,946,976 | | |
| 2010-1 C — 5.19% 2015 | | | 2,765,000 | | | | 2,876,098 | | |
| 2010-2 D — 6.24% 2016 | | | 6,990,000 | | | | 7,584,709 | | |
Beacon Container Finance LLC 2012-1A A — 3.72% 2022† | | | 10,607,000 | | | | 10,607,000 | | |
CLI Funding LLC | |
| 2006-1A CL A — 0.40% 2021† | | | 28,380,422 | | | | 27,734,484 | | |
| 2012-1A — 4.21% 2022† | | | 49,439,927 | | | | 51,982,128 | | |
Cabela's Inc. 2011-4A A2 — 0.77075% 2019† | | | 18,500,000 | | | | 18,593,610 | | |
Credit Acceptance Auto Loan Trust | |
| 2012-2A A — 1.52% 2020† | | | 14,602,000 | | | | 14,610,031 | | |
18
FPA NEW INCOME, INC.
PORTFOLIO OF INVESTMENTS (Continued)
September 30, 2012
BONDS & DEBENTURES — Continued | | Principal
Amount | | Fair
Value | |
| 2012-1A — 2.2% 2019† | | $ | 3,500,000 | | | $ | 3,551,858 | | |
| 2011-1 A — 2.61% 2019† | | | 19,295,000 | | | | 19,362,725 | | |
| 2012-1A B — 3.12% 2020† | | | 4,500,000 | | | | 4,592,401 | | |
Cronos Containers Program 2012-2A A — 3.81% 2027† | | | 25,800,000 | | | | 26,135,400 | | |
DT Auto Owner Trust 2012-2A B — 1.85% 2017† | | | 7,352,000 | | | | 7,364,506 | | |
GE SEACO Finance 2005-1A CL A — 0.47075% 2020† | | | 1,306,250 | | | | 1,282,829 | | |
HFG HEALTHCO-4 LLC 2011-1A A — 2.4805% 2017† | | | 16,552,000 | | | | 16,906,544 | | |
MassMutual Asset Finance LLC | |
| 2011-AA A2 — 0.90% 2014† | | | 11,569,817 | | | | 11,564,263 | | |
| 2011-AA A2 — 0.90% 2014† | | | 20,111,000 | | | | 20,053,513 | | |
| 2009-AA — 2.37% 2013† | | | 7,616,350 | | | | 7,636,457 | | |
PFS Financing Corporation | |
2012-BA A — 0.92675% 2016† | | | 12,547,000 | | | | 12,547,263 | | |
2012-AA A —1.42075% 2016† | | | 25,808,000 | | | | 25,887,267 | | |
| 2010-D — 1.67075% 2015† | | | 19,247,000 | | | | 19,324,246 | | |
2011-BA A — 1.72075% 2016† | | | 43,915,000 | | | | 43,932,127 | | |
2012-AA B — 1.92075% 2016† | | | 4,720,000 | | | | 4,729,289 | | |
2011-BA B — 2.47075% 2016† | | | 4,000,000 | | | | 4,198,920 | | |
Prestige Auto Receivables Trust | |
| 2012-1A A2 — 1.23% 2015† | | | 10,506,774 | | | | 10,533,865 | | |
| 2011-1A A2 — 1.25% 2014† | | | 4,580,505 | | | | 4,589,391 | | |
| 2009-1A B — 10% 2013† | | | 4,053,860 | | | | 4,195,704 | | |
New York City Tax Lien 2012-AA CL A — 1.23% 2025† | | | 17,177,000 | | | | 17,177,136 | | |
National Collegiate Student Loan Trust 2006-3 A2 — 0.3265% 2026 | | | 25,014,750 | | | | 24,924,447 | | |
Global SC Finance 2012-1A CL A — 4.11% 2027† | | | 15,034,184 | | | | 15,767,852 | | |
Santander Drive Auto Receivables Trust | |
| 2011-3 A2 — 1.11% 2014 | | | 17,047,145 | | | | 17,091,809 | | |
| 2012-1 A2 — 1.25% 2015 | | | 7,707,165 | | | | 7,734,294 | | |
| 2011-4 A2 — 1.37% 2015 | | | 16,501,260 | | | | 16,524,527 | | |
TAL Advantage LLC 2006-1A — 0.4085% 2021† | | | 15,587,500 | | | | 15,300,066 | | |
Textainer Marine Containers Ltd 2005-1A A — 0.47% 2020† | | | 5,066,667 | | | | 4,995,176 | | |
Triton Container Finance LLC 2006-1A — 0.41% 2021† | | | 15,375,833 | | | | 15,020,190 | | |
World Financial Network Credit Card Master Trust II — 4.16% 2017† | | | 3,813,750 | | | | 3,820,348 | | |
TOTAL ASSET-BACKED SECURITIES | | $ | 544,633,108 | | |
U.S. TREASURY SECURITIES — 9.5% | | | |
U.S Treasury Notes | |
| — 0.5% 2013 | | $ | 90,000,000 | | | $ | 90,193,356 | | |
| — 0.625% 2013 | | | 70,000,000 | | | | 70,139,181 | | |
| — 0.625% 2013 | | | 120,000,000 | | | | 120,322,032 | | |
| — 2.5% 2013 | | | 200,950,000 | | | | 203,288,395 | | |
TOTAL U.S. TREASURY SECURITIES | | $ | 483,942,964 | | |
19
FPA NEW INCOME, INC.
PORTFOLIO OF INVESTMENTS (Continued)
September 30, 2012
BONDS & DEBENTURES — Continued | | Principal
Amount | | Fair
Value | |
CORPORATE BONDS & DEBENTURES — 2.1% | |
Barclays Bank plc — 1.9% 2014 | | $ | 38,654,000 | | | $ | 38,232,872 | | |
Continental Airlines Company | |
| 1997-1 1A — 7.461% 2015 | | | 575,175 | | | | 590,992 | | |
| — 8.388% 2020 | | | 10,545,233 | | | | 11,283,400 | | |
Delta Airlines | |
2012-1A — 4.75% 05/07/20 | | | 3,642,000 | | | | 3,805,890 | | |
2012-1B — 6.875% 05/07/19 | | | 2,321,000 | | | | 2,390,630 | | |
N671US — 7.5% 09/15/20 | | | 21,186,438 | | | | 21,186,438 | | |
Northwest Airlines 1999-2 B — 7.95% 2016 | | | 3,916,629 | | | | 4,190,793 | | |
Qwest Corporation — 3.63875% 2013 | | | 7,139,000 | | | | 7,182,781 | | |
United Airlines, Inc. — 9.875% 2013† | | | 19,728,000 | | | | 20,394,807 | | |
TOTAL CORPORATE BONDS & DEBENTURES | | $ | 109,258,603 | | |
U.S. AGENCIES SECURITIES — 0.7% | |
Federal National Mortgage Association — 0.4% 2012 | | $ | 33,700,000 | | | $ | 33,710,784 | | |
TOTAL U.S. AGENCIES SECURITIES | |
| TOTAL INVESTMENT SECURITIES — 97.8% (Cost $4,973,591,101) | | $ | 4,981,179,603 | | |
| SHORT-TERM INVESTMENTS — 2.6% (Cost $131,145,014) | |
Federal Home Loan Bank | |
| — 0.07% 10/1/12 | | $ | 40,000,000 | | | $ | 40,000,000 | | |
| — 0.07% 10/1/12 | | | 75,000,000 | | | | 75,000,000 | | |
State Street Bank Repurchase Agreement — 0.01% 10/01/12 | |
(Dated 09/28/12, repurchase price of $16,145,014, collateralized by
$12,115,000 Principal Amount U.S. Treasury Note 3.875% 2040,
fair value $16,471,542) | | | 16,145,000 | | | | 16,145,014 | | |
TOTAL SHORT-TERM INVESTMENTS | | $ | 131,145,014 | | |
| TOTAL INVESTMENTS — 100.4% (Cost $5,104,736,115) | | $ | 5,112,324,617 | | |
Other assets and liabilities, net — (0.4)% | | | (20,644,004 | ) | |
TOTAL NET ASSETS — 100.0% | | $ | 5,091,680,613 | | |
* These securities have been valued in good faith under policies adopted by authority of the Board of Directors in accordance with the Fund's fair value procedures. These securities constitued 0.3% of total net assets at September 30, 2012. Note 8
20
FPA NEW INCOME, INC.
PORTFOLIO OF INVESTMENTS (Continued)
September 30, 2012
† Restricted Securities. These securities are not registered and may not be sold to the public. There are legal and/or contractual restrictions on resale. The Fund does not have the right to demand that such securities be registered. The values of these securities are determined by valuations provided by pricing services, brokers, dealers, market makers, or in good faith under policies adopted by authority of the Fund's Board of Directors.
| Issuer | | Acquisition
Date(s) | | Cost | | Fair
Value | | Fair
Value as a %
of Net Assets | |
Bayview Opportunity 2012-4NPL CL A | | 9/7/12 | | | 8,086,449 | | | | 8,086,449 | | | | 0.2 | % | |
Stanwich 2009-2A | | 9/22/11 | | | 135,863 | | | | 139,130 | | | | 0.0 | % | |
Stanwich 2010-1A | | 4/22/2010, 9/22/11 | | | 769,988 | | | | 830,399 | | | | 0.0 | % | |
Stanwich 2010-2A | | 5/21/2010, 9/22/11 | | | 2,928,537 | | | | 3,169,979 | | | | 0.1 | % | |
Stanwich 2010-3A | | 6/2/2010, 9/22/11 | | | 1,582,419 | | | | 1,816,403 | | | | 0.0 | % | |
Stanwich 2010-4A | | 8/4/2010, 9/22/11 | | | 2,207,482 | | | | 2,215,311 | | | | 0.0 | % | |
Stanwich 2011-1A | | 5/10/2011, 9/22/11 | | | 3,876,108 | | | | 4,270,563 | | | | 0.1 | % | |
Stanwich 2011-2A | | 6/10/2011, 9/22/11 | | | 2,776,287 | | | | 3,324,500 | | | | 0.1 | % | |
Stanwich 2012-NPL3 CL A | | 5/23/12 | | | 6,204,186 | | | | 6,236,572 | | | | 0.1 | % | |
Stanwich 2012-NPL4 CL A | | 9/24/12 | | | 32,740,000 | | | | 32,740,000 | | | | 0.6 | % | |
Vericrest Opportunity 2012-NL2A A1 | | 9/14/12 | | | 19,035,000 | | | | 19,073,641 | | | | 0.4 | % | |
Vericrest Opportunity 2012-NL1A A1 | | 4/20/12 | | | 2,267,665 | | | | 1,882,515 | | | | 0.0 | % | |
Vericrest Opportunity 2011-NL3A A1 | | 11/9/11 | | | 4,694,643 | | | | 4,727,177 | | | | 0.1 | % | |
VRPL 2012-RP2A CL AI | | 6/21/12 | | | 10,914,295 | | | | 10,996,152 | | | | 0.2 | % | |
GS Mortgage 2007-EOP A1 | | 6/27/2011, 9/22/11,
11/15/11, 12/7/11 | | | 7,575,394 | | | | 7,657,814 | | | | 0.2 | % | |
GS Mortgage 2007-EOP A2 | | 8/1/2011, 9/22/11,
10/3/11, 11/2/11,
12/6/11, 12/7/11 | | | 20,468,254 | | | | 20,708,301 | | | | 0.4 | % | |
GS Mortgage 2007-EOP A3 | | 10/21/2011, 12/5/11,
1/13/12 | | | 17,411,058 | | | | 17,681,666 | | | | 0.4 | % | |
JP Morgan Clearing 2011-FL1 MH | | 12/14/11 | | | 19,300,000 | | | | 19,718,000 | | | | 0.4 | % | |
LSTAR Commercial 2001-1A | | 6/23/2011 | | | 11,463,770 | | | | 12,091,028 | | | | 0.2 | % | |
Store Master Funding 2012-1A CL A | | 8/31/12 | | | 17,165,628 | | | | 17,165,627 | | | | 0.3 | % | |
Wachovia Bank Commercial
Mortgage 2006-WL7A CL A1 | | 6/6/12 | | | 123,842 | | | | 125,283 | | | | 0.0 | % | |
Wachovia Bank Commercial
Mortgage 2006-WL7A CL A2 | | 4/26/2012, 4/27/12,
5/2/12, 5/16/12,
6/6/12, 8/6/12 | | |
55,747,844 | | | |
56,497,800 | | | |
1.1 | % | |
Washington Mutual Commercial
Mortgage 2007-SL2 CL A | | 5/22/2009, 9/22/11,
2/29/12 | | | 13,920,508 | | | | 24,756,958 | | | | 0.5 | % | |
Beacon Container 2012-1A A | | 9/25/12 | | | 10,606,526 | | | | 10,607,000 | | | | 0.2 | % | |
CLI Funding 2006-1A CL A | | 6/28/2012, 6/29/12,
7/2/16, 7/16/12,
7/30/12, 8/3/12 | | | 27,344,265 | | | | 27,734,484 | | | | 0.5 | % | |
21
FPA NEW INCOME, INC.
PORTFOLIO OF INVESTMENTS (Continued)
September 30, 2012
| Issuer | | Acquisition
Date(s) | | Cost | | Fair
Value | | Fair
Value as a %
of Net Assets | |
CLI Funding 2012-1A | | 6/14/12 | | | 49,433,801 | | | | 51,982,128 | | | | 1.0 | % | |
Cabela's 2011-4A A2 | | 10/20/11 | | | 18,500,000 | | | | 18,593,610 | | | | 0.4 | % | |
Credit Acceptance Auto Loan 2012-2A A | | 9/11/12 | | | 14,599,461 | | | | 14,610,031 | | | | 0.3 | % | |
Credit Acceptance Auto Loan 2012-1A | | 3/22/12 | | | 3,499,598 | | | | 3,551,858 | | | | 0.1 | % | |
Credit Acceptance Auto Loan 2011-1A | | 9/29/11 | | | 19,290,674 | | | | 19,362,725 | | | | 0.4 | % | |
Credit Acceptance Auto Loan 2012-1A B | | 3/22/12 | | | 4,499,265 | | | | 4,592,401 | | | | 0.1 | % | |
Cronos Containers 2012-2A A | | 9/20/12 | | | 25,789,208 | | | | 26,135,400 | | | | 0.5 | % | |
DT Auto 2012-2A B | | 7/17/12 | | | 7,351,623 | | | | 7,364,506 | | | | 0.1 | % | |
GE SEACO 2005-1A CL A | | 7/31/12 | | | 1,274,410 | | | | 1,282,829 | | | | 0.0 | % | |
HFG HEALTHCO 2011-1A A | | 5/26/2011, 9/22/11 | | | 16,577,140 | | | | 16,906,544 | | | | 0.3 | % | |
MassMutual Asset Finance 2011-AA A2 | | 7/20/11 | | | 11,568,707 | | | | 11,564,263 | | | | 0.2 | % | |
MassMutual Asset Finance 2011-AA A2 | | 6/13/12 | | | 20,108,989 | | | | 20,053,513 | | | | 0.4 | % | |
MassMutual Asset Finance 2009-AA | | 8/25/2010, 11/3/10,
1/6/11, 9/22/11 | | | 7,723,275 | | | | 7,636,457 | | | | 0.2 | % | |
PFS Financing 2012-BA A | | 9/10/12 | | | 12,547,000 | | | | 12,547,263 | | | | 0.2 | % | |
PFS Financing 2012-AA A | | 2/1/12 | | | 25,808,000 | | | | 25,887,267 | | | | 0.5 | % | |
PFS Financing 2010-D | | 8/22/12 | | | 19,352,257 | | | | 19,324,246 | | | | 0.4 | % | |
PFS Financing 2011-BA A | | 11/3/2011, 2/13/12 | | | 43,916,560 | | | | 43,932,127 | | | | 0.9 | % | |
PFS Financing 2012-AA B | | 2/1/12 | | | 4,720,000 | | | | 4,729,289 | | | | 0.1 | % | |
PFS Financing 2011-BA B | | 11/3/11 | | | 4,000,000 | | | | 4,198,920 | | | | 0.1 | % | |
Prestige Auto 2012-1A A2 | | 3/21/12 | | | 10,506,684 | | | | 10,533,865 | | | | 0.2 | % | |
Prestige Auto 2011-1A A2 | | 3/18/2011, 9/22/11,
11/10/11 | | | 4,579,574 | | | | 4,589,391 | | | | 0.1 | % | |
Prestige Auto 2009-1A B | | 8/16/2011, 9/22/11 | | | 4,349,296 | | | | 4,195,704 | | | | 0.1 | % | |
New York City 2012-AA CL A | | 8/1/12 | | | 17,175,779 | | | | 17,177,136 | | | | 0.3 | % | |
Global SC Finance 2012-1A CL A | | 7/25/12 | | | 15,031,202 | | | | 15,767,852 | | | | 0.3 | % | |
TAL Advantage 2006-1A | | 6/28/2012, 7/16/12,
7/31/12, 8/7/12,
9/11/12 | | | 15,117,418 | | | | 15,300,066 | | | | 0.3 | % | |
Textainer Marine Containers 2005-1A A | | 6/20/12 | | | 4,940,000 | | | | 4,995,176 | | | | 0.1 | % | |
Triton Container 2006-1A | | 6/28/2012, 7/24/12,
9/28/12 | | | 14,802,353 | | | | 15,020,190 | | | | 0.3 | % | |
World Financial Network Credit Card | | 7/21/2011, 9/22/11 | | | 3,920,651 | | | | 3,820,348 | | | | 0.1 | % | |
United Airlines | | 8/6/2010, 8/10/10,
8/11/10, 8/26/10,
8/27/10, 9/22/11,
9/19/12 | | | 21,039,959 | | | | 20,394,807 | | | | 0.4 | % | |
| | | | | 718,366,895 | | | | 740,302,664 | | | | 14.5 | % | |
See notes to financial statements.
22
FPA NEW INCOME, INC.
STATEMENT OF ASSETS AND LIABILITIES
September 30, 2012
ASSETS | |
Investments at value: | |
Investments securities — at fair value
(identified cost $4,973,591,101) | | $ | 4,981,179,603 | | | | | | |
Short-term investments — at amortized cost
(maturities 60 days or less) | | | 131,145,014 | | | $ | 5,112,324,617 | | |
Cash | | | | | | | 553 | | |
Receivable for: | |
Investment Securities sold | | $ | 48,906,672 | | | | | | |
Interest | | | 26,318,497 | | | | | | |
Capital Stock sold | | | 12,366,431 | | | | 87,591,600 | | |
| | | | | | | $ | 5,199,916,770 | | |
LIABILITIES | |
Payable for: | |
Investment securities purchased | | $ | 101,131,554 | | | | | | |
Capital Stock repurchased | | | 4,738,916 | | | | | | |
Advisory fees | | | 2,051,797 | | | | | | |
Accrued expenses and other liabilities | | | 313,890 | | | | 108,236,157 | | |
NET ASSETS | | | | | | $ | 5,091,680,613 | | |
SUMMARY OF SHAREHOLDERS' EQUITY | |
Capital Stock — par value $.01 per share; authorized
500,000,000 shares; outstanding 475,736,860 shares | | | | | | $ | 4,757,369 | | |
Additional Paid in Capital | | | | | | | 5,216,067,976 | | |
Accumulated net realized losses on investments | | | | | | | (151,086,612 | ) | |
Undistributed net investment income | | | | | | | 14,353,378 | | |
Unrealized appreciation of investments | | | | | | | 7,588,502 | | |
NET ASSETS | | | | | | $ | 5,091,680,613 | | |
NET ASSET VALUE, REDEMPTION PRICE AND
MAXIMUM OFFERING PRICE PER SHARE | |
Net asset value and redemption price per share
(net assets divided by shares outstanding) | | | | $ | 10.70 | | |
Maximum offering price per share
(100/96.5 of per share net asset value) | | | | $ | 11.09 | | |
See notes to financial statements.
23
FPA NEW INCOME, INC.
STATEMENT OF OPERATIONS
For the Year Ended September 30, 2012
INVESTMENT INCOME | |
Interest | | | | | | $ | 125,751,273 | | |
EXPENSES | |
Advisory fees | | $ | 23,284,683 | | | | | | |
Transfer agent fees and expenses | | | 2,468,489 | | | | | | |
Custodian fees and expenses | | | 298,686 | | | | | | |
| Registration fees | | | 237,363 | | | | | | |
Reports to shareholders | | | 219,625 | | | | | | |
Directors' fees and expenses | | | 86,285 | | | | | | |
Audit and tax services | | | 52,100 | | | | | | |
Legal fees | | | 29,474 | | | | | | |
| Other expenses | | | 60,892 | | | | 26,737,597 | | |
Net investment income | | | | | | $ | 99,013,676 | | |
NET REALIZED AND UNREALIZED GAIN (LOSS) ON INVESTMENTS | |
Net realized loss on investments: | |
Proceeds from sale of investment securities (excluding
short-term investments with maturities 60 days or less) | | $ | 3,403,738,171 | | | | | | |
| Cost of investment securities sold | | | 3,407,124,680 | | | | | | |
Net realized loss on investments | | | | | | $ | (3,386,509 | ) | |
Unrealized appreciation of investments: | |
Unrealized appreciation at beginning of year | | $ | 216,997 | | | | | | |
| Unrealized appreciation at end of year | | | 7,588,502 | | | | | | |
Change in unrealized appreciation of investments | | | | | | | 7,371,505 | | |
Net realized and unrealized gain on investments | | | | | | $ | 3,954,996 | | |
NET CHANGE IN NET ASSETS RESULTING FROM OPERATIONS | | | | | | $ | 102,998,672 | | |
See notes to financial statements.
24
FPA NEW INCOME, INC.
STATEMENT OF CHANGES IN NET ASSETS
| | | For the Year Ended
September 30, 2012 | | For the Year Ended
September 30, 2011 | |
INCREASE IN NET ASSETS | |
Operations: | |
Net investment income | | $ | 99,013,676 | | | | | | | $ | 150,703,689 | | | | | | |
| Net realized loss on investments | | | (3,386,509 | ) | | | | | | | (43,776,731 | ) | | | | | |
Change in unrealized
appreciation of investments | | | 7,371,505 | | | | | | | | (18,343,157 | ) | | | | | |
Change in net assets resulting
from operations | | | | | | $ | 102,998,672 | | | | | | | $ | 88,583,801 | | |
Distributions to shareholders from | |
net investment income | | | | | | | (156,031,919 | ) | | | | | | | (162,104,999 | ) | |
Capital Stock transactions: | |
Proceeds from Capital Stock sold | | $ | 2,319,494,537 | | | | | | | $ | 1,924,276,959 | | | | | | |
Proceeds from shares issued to
shareholders upon reinvestment
of dividends and distributions | | | 115,035,888 | | | | | | | | 125,649,634 | | | | | | |
Cost of Capital Stock repurchased* | | | (1,566,016,154 | ) | | | 868,514,271 | | | | (1,845,604,618 | ) | | | 204,321,975 | | |
Total change in net assets | | | | | | $ | 815,481,024 | | | | | | | $ | 130,800,777 | | |
NET ASSETS | |
Beginning of year | | | | | | | 4,276,199,589 | | | | | | | | 4,145,398,812 | | |
End of year | | | | | | $ | 5,091,680,613 | | | | | | | $ | 4,276,199,589 | | |
CHANGE IN CAPITAL STOCK
OUTSTANDING | |
Shares of Capital Stock sold | | | | | | | 217,206,681 | | | | | | | | 176,921,878 | | |
Shares issued to shareholders upon
reinvestment of dividends
and distributions | | | | | | | 10,792,801 | | | | | | | | 11,584,688 | | |
Shares of Capital Stock repurchased | | | | | | | (146,777,482 | ) | | | | | | | (169,311,361 | ) | |
Increase in Capital Stock outstanding | | | | | | | 81,222,000 | | | | | | | | 19,195,205 | | |
* Net of redemption fees of $699,948 and $202,426 for the years ended September 30, 2012 and 2011, respectively.
See notes to financial statements.
25
FPA NEW INCOME, INC.
FINANCIAL HIGHLIGHTS
Selected Data for Each Share of Capital Stock Outstanding Throughout Each Year
| | For the Year Ended September 30, | |
| | 2012 | | 2011 | | 2010 | | 2009 | | 2008 | |
Per share operating performance: | |
| Net asset value at beginning of year | | $ | 10.84 | | | $ | 11.04 | | | $ | 11.09 | | | $ | 11.06 | | | $ | 11.03 | | |
Income from investment operations: | |
| Net investment income | | $ | 0.27 | | | $ | 0.43 | | | $ | 0.36 | | | $ | 0.36 | | | $ | 0.47 | | |
Net realized and unrealized gain (loss)
on investment securities | | | (0.04 | ) | | | (0.16 | ) | | | (0.04 | ) | | | 0.08 | | | | 0.05 | | |
| Total from investment operations | | $ | 0.23 | | | $ | 0.27 | | | $ | 0.32 | | | $ | 0.44 | | | $ | 0.52 | | |
Less dividends from net
investment income | | $ | (0.37 | ) | | $ | (0.47 | ) | | $ | (0.37 | ) | | $ | (0.41 | ) | | $ | (0.49 | ) | |
| Redemption fees | | | — | * | | | — | * | | | — | * | | | — | * | | | — | * | |
| Net asset value at end of year | | $ | 10.70 | | | $ | 10.84 | | | $ | 11.04 | | | $ | 11.09 | | | $ | 11.06 | | |
| Total investment return** | | | 2.18 | % | | | 2.47 | % | | | 2.90 | % | | | 4.03 | % | | | 4.84 | % | |
Ratios/supplemental data: | |
| Net assets at end of period (in $000's) | | $ | 5,091,681 | | | $ | 4,276,200 | | | $ | 4,145,399 | | | $ | 3,813,468 | | | $ | 2,186,138 | | |
| Ratio of expenses to average net assets | | | 0.57 | % | | | 0.60 | % | | | 0.60 | % | | | 0.60 | % | | | 0.61 | % | |
Ratio of net investment income to
average net assets | | | 2.12 | % | | | 3.94 | % | | | 2.98 | % | | | 3.20 | % | | | 4.21 | % | |
| Portfolio turnover rate | | | 77 | % | | | 117 | % | | | 78 | % | | | 64 | % | | | 32 | % | |
* Rounds to less than $0.01 per share.
** Return is based on net asset value per share, adjusted for reinvestment of distributions, and does not reflect deduction of the sales charge.
See notes to financial statements.
26
FPA NEW INCOME, INC.
NOTES TO FINANCIAL STATEMENTS
September 30, 2012
NOTE 1 — Significant Accounting Policies
The Fund is registered under the Investment Company Act of 1940 as a diversified, open-end, management investment company. The Fund's primary investment objective is to seek current income and long-term total return. The following is a summary of significant accounting policies consistently followed by the Fund in the preparation of its financial statements.
A. Security Valuation
The Fund's investments are reported at fair value as defined by accounting principles generally accepted in the United States of America. The Fund generally determines its net asset value as of approximately 4:00 p.m. New York time each day the New York Stock Exchange is open. Further discussion of valuation methods, inputs and classifications can be found under Note 8.
B. Securities Transactions and Related Investment Income
Securities transactions are accounted for on the date the securities are purchased or sold. Dividend income and distributions to shareholders are recorded on the ex-dividend date. Interest income and expenses are recorded on an accrual basis. Market discounts and premiums on fixed income securities are amortized over the expected life of the securities. Realized gains or losses are based on the specific identification method.
C. Use of Estimates
The preparation of financial statements in conformity with accounting principles generally accepted in the United States requires management to make estimates and assumptions that affect the amounts reported. Actual results could differ from those estimates.
NOTE 2 — Risk Considerations
Investing in the Fund may involve certain risks including, but not limited to, those described below.
Market Risk: Because the values of the Fund's investments will fluctuate with market conditions, so will the value of your investment in the Fund. You could lose money on your investment in the Fund or the Fund could underperform other investments.
Interest Rate Risk: The values of, and the income generated by, most debt securities held by the Fund may be affected by changing interest rates and by changes in the effective maturities and credit ratings of these securities. For example, the values of debt securities in the Fund's portfolio generally will decline when interest rates rise and increase when interest rates fall. In addition, falling interest rates may cause an issuer to redeem, call or refinance a security before its stated maturity, which may result in the Fund having to reinvest the proceeds in lower yielding securities.
Mortgage-Backed and Other Asset-Backed Securities Risk: The values of some mortgaged-backed and other asset-backed securities may expose the Fund to a lower rate of return upon reinvestment of principal. When interest rates rise, the value of mortgage-related securities generally will decline; however, when interest rates are declining, the value of mortgage related-securities with prepayment features may not increase as much as other fixed income securities. The rate of prepayments on underlying mortgages will affect the price and volatility of a mortgage-related security, and may shorten or extend the effective maturity of the security beyond what was anticipated at the time of purchase. If an unanticipated rate of prepayment on underlying mortgages increases the effective maturity of a mortgage-related security, the volatility of the security can be expected to increase. The value of these securities may also fluctuate in response to the market's perception of the creditworthiness of the issuers. Additionally, although mortgages and mortgage-related securities are generally supported by some form
27
FPA NEW INCOME, INC.
NOTES TO FINANCIAL STATEMENTS
Continued
of government or private guarantee and/or insurance, there is no assurance that private guarantors or insurers will meet their obligations.
Stripped Mortgage-Backed Interest Only ("I/O") and Principal Only ("P/O") Securities: Stripped mortgage-backed securities are usually structured with two classes that receive different proportions of the interest and principal distributions on a pool of mortgage assets. In certain cases, one class will receive all of the interest payments on the underlying mortgages (the I/O class), while the other class will receive all of the principal payments (the P/O class). The Fund currently has investments in I/O securities. The yield to maturity on IOs is sensitive to the rate of principal repayments (including prepayments) on the related underlying mortgage assets, and principal payments may have a material effect on yield to maturity. If the underlying mortgage assets experience greater than anticipated prepayments of principal, a Fund may not fully recoup its initial investment in I/Os.
Repurchase Agreements: Repurchase agreements permit the Fund to maintain liquidity and earn income over periods of time as short as overnight. Repurchase agreements held by the Fund are fully collateralized by U.S. Government securities, or securities issued by U.S. Government agencies, or securities that are within the three highest credit categories assigned by established rating agencies (Aaa, Aa, or A by Moody's or AAA, AA or A by Standard & Poor's ) or, if not rated by Moody's or Standard & Poor's, are of equivalent investment quality as determined by the Adviser. Such collateral is in the possession of the Fund's custodian. The collateral is evaluated daily to ensure its market value equals or exceeds the current market value of the repurchase agreements including accrued interest. In the event of default on the obligation to repurchase, the Fund has the right to liquidate the collateral and apply the proceeds in satisfaction of the obligation.
Credit Risk: Debt securities are subject to credit risk, meaning that the issuer of the debt security may default or fail to make timely payments of principal or interest. The values of any of the Fund's investments may also decline in response to events affecting the issuer or its credit rating. The lower rated debt securities in which the Fund may invest are considered speculative and are generally subject to greater volatility and risk of loss than investment grade securities, particularly in deteriorating economic conditions. The Fund invests a significant portion of its assets in securities of issuers that hold mortgage- and asset-backed securities and direct investments in securities backed by commercial and residential mortgage loans and other financial assets. The value and related income of these securities is sensitive to changes in economic conditions, including delinquencies and/or defaults. Continuing shifts in the market's perception of credit quality on securities backed by commercial and residential mortgage loans and other financial assets may result in increased volatility of market price and periods of illiquidity that can negatively impact the valuation of certain securities held by the Fund.
NOTE 3 — Purchases of Investment Securities
Cost of purchases of investment securities (excluding short-term investments with maturities of 60 days at time of purchase) aggregated $4,015,609,341 for the year ended September 30, 2012.
NOTE 4 — Advisory Fees and Other Affiliated Transactions
Pursuant to an Investment Advisory Agreement (the "Agreement"), advisory fees were paid by the Fund to First Pacific Advisors, LLC (the "Adviser"). Under the terms of this agreement, the Fund pays the Adviser a monthly fee calculated at the annual rate of 0.5% of the average daily net assets of the Fund. The Agreement obligates the Adviser to reduce its fee to the extent necessary to reimburse the Fund for any annual expenses (exclusive of interest, taxes, the cost of any supplemental statistical and research information, and extraordinary expenses such as litigation) in excess of 11/2% of the first $15 million and 1% of the remaining average net assets of the Fund for the year.
28
FPA NEW INCOME, INC.
NOTES TO FINANCIAL STATEMENTS
Continued
For the year ended September 30, 2012, the Fund paid aggregate fees of $85,500 to all Directors who are not interested persons of the Adviser. Certain officers of the Fund are also officers of the Adviser and FPA Fund Distributors, Inc.
NOTE 5 — Federal Income Tax
No provision for federal income tax is required because the Fund has elected to be taxed as a "regulated investment company" under the Internal Revenue Code and intends to maintain this qualification and to distribute each year to its shareholders, in accordance with the distribution requirements of the Code, all of its taxable net investment income and taxable net realized gains on investments.
Distributions paid to shareholders are based on net investment income and net realized gains determined on a tax reporting basis, which may differ from financial reporting. For federal income tax purposes, the components of distributable earnings at September 30, 2012, were as follows:
Undistributed net investment income | | $ | 28,990,263 | | |
The tax status of dividends paid during fiscal years ended September 30, 2012 and 2011 were as follows:
| | | 2012 | | 2011 | |
Dividends from ordinary income | | $ | 156,031,919 | | | $ | 162,104,999 | | |
The Fund utilizes the provisions of federal income tax laws that provide for the carryforward of capital losses for prior years, offsetting such losses against any future realized capital gains. Under the Regulated Investment Company Act of 2010 (the "Act"), net capital losses recognized for fiscal years beginning after December 22, 2010 may be carried forward indefinitely, and their character is retained as short-term and/or long-term losses. Previously, net capital losses were carried forward for eight years and treated as short-term losses. As a transition rule, the Act requires that post-enactment net capital losses be used before pre-enactment net capital losses.
As of September 30, 2012, the post enactment accumulated losses were $55,028,718, and the pre-enactment capital loss carryforwards were $59,635,546. The ability to carry these pre-enactment losses forward expires as follows: $7,719,581 in 2013; $20,873,466 in 2014; $16,390,845 in 2015; $299,496 in 2017; $3,661,716 in 2018; $10,690,442 in 2019.
The cost of investment securities at September 30, 2012 for federal income tax purposes was $4,988,227,986. Gross unrealized appreciation and depreciation for all securities at September 30, 2012 for federal income tax purposes was $92,578,674 and $99,624,949, respectively, resulting in net unrealized depreciation of $7,046,275. As of and during the year ended September 30, 2012, the Fund did not have any liability for unrecognized tax benefits. The Fund recognizes interest and penalties, if any, related to unrecognized tax benefits as income tax expense in the Statement of Operations. During the period, the Fund did not incur any interest or penalties. The Fund is not subject to examination by U.S. federal tax authorities for years ended before September 30, 2009 or by state tax authorities for years ended before September 30, 2008.
During the year ended September 30, 2012, the Fund reclassified $47,143,443 of net amounts relating to market discount on securities sold, and paydowns from mortgage- and other asset-backed securities, from undistributed net investment income to accumulated net realized losses on investments to align financial reporting with tax reporting. The Fund also reclassified $27,348,079 of permanent differences from accumulated net losses to undistributed net investment income for losses incurred in the prior year on interest only securities that were included as ordinary losses in the Fund's tax provision. Accumulated capital losses of $11,767,907 were reclassified to Additional Paid-in Capital because the ability to carry them forward expired.
29
FPA NEW INCOME, INC.
NOTES TO FINANCIAL STATEMENTS
Continued
NOTE 6 — Distributor
For the year ended September 30, 2012, FPA Fund Distributors, Inc. ("Distributor"), a wholly owned subsidiary of the Adviser, received $49,978 in net Fund share sales commissions after reallowance to other dealers. The Distributor pays its own overhead and general administrative expenses, the cost of supplemental sales literature, promotion and advertising. Effective at the opening of business on October 1, 2012, UMB Distribution Services, LLC commenced serving as distributor to the Fund. The new distribution agreement is similar to the prior agreement with FPA Fund Distributors, Inc. There is no cost to the Fund or its shareholders for the services provided under the agreement.
NOTE 7 — Redemption Fees
A redemption fee of 2% applies to redemptions within 90 days of purchase for certain purchases made by persons eligible to purchase shares without an initial sales charge. For the year ended September 30, 2012, the Fund collected $699,948 in redemption fees, which amounted to less than $0.01 per share.
NOTE 8 — Disclosure of Fair Value Measurements
The Fund uses the following methods and inputs to establish the fair value of its assets and liabilities. Use of particular methods and inputs may vary over time based on availability and relevance as market and economic conditions evolve.
Equity securities are generally valued at the official closing price of, or the last reported sale price on, the exchange or market on which such securities are traded, as of the close of business on the day the securities are being valued or, lacking any sales, at the last available bid price. Prices for each security are taken from the principal exchange or market in which the security trades. Securities that are unlisted and fixed-income and convertible securities listed on a national securities exchange for which the over-the-counter market more accurately reflects the securities' value in the judgment of the Fund's officers, are valued at the most recent bid price. However, most fixed income securities are generally valued at prices obtained from pricing vendors. Vendors value such securities based on one or more of the following inputs: transactions, bids, offers quotations from dealers and trading systems, spreads and other relationships observed in the markets among comparable securities, benchmarks, underlying equity of the issuer, and proprietary pricing models such as cash flows, financial or collateral performance and other reference data (includes prepayments, defaults, collateral, credit enhancements, and interest rate volatility). Short-term corporate notes with maturities of 60 days or less at time of purchase are valued at amortized cost, which approximates fair value.
Securities for which representative market quotations are not readily available or are considered unreliable by the Adviser are valued as determined in good faith under guidelines adopted by authority of the Fund's Board of Trustees. Various inputs may be reviewed in order to make a good faith determination of a security's value. These inputs include, but are not limited to, the type and cost of the security; contractual or legal restrictions on resale of the security; relevant financial or business developments of the issuer; actively traded similar or related securities; conversion or exchange rights on the security; related corporate actions; significant events occurring after the close of trading in the security; and changes in overall market conditions. Fair valuations and valuations of investments that are not actively trading involve judgment and may differ materially from valuations of investments that would have been used had greater market activity occurred.
The Fund classifies its assets based on three valuation methodologies. Level 1 values are based on quoted market prices in active markets for identical assets. Level 2 values are based on significant observable market inputs, such as quoted prices for similar assets and quoted prices in inactive markets or other market observable inputs as noted above including spreads, cash flows, financial performance, prepayments, defaults, collateral,
30
FPA NEW INCOME, INC.
NOTES TO FINANCIAL STATEMENTS
Continued
credit enhancements, and interest rate volatility. Level 3 values are based on significant unobservable inputs that reflect the Fund's determination of assumptions that market participants might reasonably use in valuing the assets. These assumptions consider inputs such as proprietary pricing models, cash flows, prepayments, defaults, and collateral. The valuation levels are not necessarily an indication of the risk associated with investing in those securities. The following table presents the valuation levels of the Fund's investments as of September 30, 2012:
Investments | | Level 1 | | Level 2 | | Level 3 | | Total | |
Bonds & Debentures | |
Mortgage Pass-Through | | | — | | | $ | 1,268,355,093 | | | | — | | | $ | 1,268,355,093 | | |
Mortgage-Backed | | | — | | | | 1,173,925,014 | | | $ | 15,766,285 | | | | 1,189,691,299 | | |
Commercial Mortgage-Backed | | | — | | | | 678,093,005 | | | | — | | | | 678,093,005 | | |
Stripped Mortgage-Backed | | | — | | | | 673,494,747 | | | | — | | | | 673,494,747 | | |
Asset-Backed | | | — | | | | 544,633,108 | | | | — | | | | 544,633,108 | | |
U.S. Treasuries | | | — | | | | 483,942,964 | | | | — | | | | 483,942,964 | | |
Corporate | | | — | | | | 109,258,603 | | | | — | | | | 109,258,603 | | |
U.S. Agencies | | | — | | | | 33,710,784 | | | | — | | | | 33,710,784 | | |
Short-Term Investments | | | — | | | | 131,145,014 | | | | — | | | | 131,145,014 | | |
| | | | — | | | $ | 5,096,558,332 | | | $ | 15,766,285 | | | $ | 5,112,324,617 | | |
The following table summarizes the Fund's Level 3 investment securities and related transactions during the year ended September 30, 2012:
Investments | | Beginning
Value at
September 30,
2011 | | Net Realized
and Unrealized
Gains (Losses)* | | Purchases | | Sales | | Net
Transfers
In (Out) | | Ending
Value at
September 30,
2012 | |
Mortgage-Backed | | $ | 44,951,618 | | | $ | (5,416,857 | ) | | | — | | | $ | (23,768,476 | ) | | | — | | | $ | 15,766,285 | | |
* Net realized and unrealized gains (losses) are included in the related amounts in the statement of operations.
Transfers of investments between different levels of the fair value hierarchy are recorded at market value as of the end of the reporting period. There were no transfers between Level 1, 2, or 3 during the year ended September 30, 2012.
NOTE 9 — Distribution to Shareholders
On September 28, 2012, the Board of Directors declared a dividend from net investment income of $0.08 per share payable October 2, 2012 to shareholders of record on September 28, 2012. For financial statement purposes, this dividend was recorded on the ex-dividend date, October 1, 2012.
NOTE 10 — New Accounting Pronouncements
In April 2011, the Financial Accounting Standards Board (FASB) issued Accounting Standards Update (ASU) No. 2011-03 "Transfers and Servicing (Topic 860): Reconsideration of Effective Control for Repurchase Agreements." The ASU 2011-03 is intended to improve financial reporting of repurchase agreements and other agreements that both entitle and obligate a transferor to repurchase or redeem the financial assets before their
31
FPA NEW INCOME, INC.
NOTES TO FINANCIAL STATEMENTS
Continued
maturity. In May 2011, the FASB issued ASU No. 2011-04 "Amendments to Achieve Common Fair Value Measurement and Disclosure Requirements in U.S. GAAP and IFRS". ASU 2011-04 includes common requirements for measurement of and disclosure about fair value between U.S. GAAP and IFRS. ASU 2011-04 will require reporting entities to disclose quantitative information about the unobservable inputs used in the fair value measurements categorized within Level 3 of the fair value hierarchy. In addition, ASU 2011-04 will require reporting entities to make disclosures about amounts and reasons for all transfers in and out of Level 1 and Level 2 fair value measurements. These new pronouncements are effective for interim and annual reporting periods beginning after December 15, 2011. Management is currently evaluating the impact these pronouncements may have on the Fund's financial statements.
In December 2011, the FASB issued ASU No. 2011-11, Balance Sheet (Topic 210), Disclosures about Offsetting Assets and Liabilities, which requires entities to disclose information about financial instruments and derivative instruments that have been offset or that are subject to enforceable master netting arrangements, to enable users of its financial statements to understand the effect of those arrangements on its financial position. Entities will be required to provide both net (offset amounts) and gross information in the notes to the financial statements for relevant assets and liabilities that are offset or subject to the arrangements. The amendments in ASU No. 2011-11 are effective for interim and annual periods beginning on or after January 1, 2013 and an entity should provide the disclosures required by the amendments retrospectively for all comparative periods presented. The Fund is in the process of evaluating the disclosure requirements and any impact the new disclosures will have on its financial statements.
32
FPA NEW INCOME, INC.
REPORT OF INDEPENDENT REGISTERED
PUBLIC ACCOUNTING FIRM
TO THE SHAREHOLDERS AND
BOARD OF DIRECTORS OF FPA NEW INCOME, INC.
We have audited the accompanying statement of assets and liabilities of FPA New Income, Inc. (the "Fund"), including the portfolio of investments, as of September 30, 2012, the related statement of operations for the year then ended, the statements of changes in net assets for each of the two years in the period then ended, and the financial highlights for each of the five years in the period then ended. These financial statements and financial highlights are the responsibility of the Fund's management. Our responsibility is to express an opinion on these financial statements and financial highlights based on our audits.
We conducted our audits in accordance with the standards of the Public Company Accounting Oversight Board (United States). Those standards require that we plan and perform the audit to obtain reasonable assurance about whether the financial statements and financial highlights are free of material misstatement. The Fund is not required to have, nor were we engaged to perform, an audit of its internal control over financial reporting. Our audits included consideration of internal control over financial reporting as a basis for designing audit procedures that are appropriate in the circumstances, but not for the purpose of expressing an opinion on the effectiveness of the Fund's internal control over financial reporting. Accordingly, we express no such opinion. An audit also includes examining, on a test basis, evidence supporting the amounts and disclosures in the financial statements, assessing the accounting principles used and significant estimates made by management, as well as evaluating the overall financial statement presentation. Our procedures included confirmation of securities owned as of September 30, 2012, by correspondence with the custodian and brokers, where replies were not received from brokers, we performed other auditing procedures. We believe that our audits provide a reasonable basis for our opinion.
In our opinion, such financial statements and financial highlights referred to above present fairly, in all material respects, the financial position of FPA New Income, Inc. as of September 30, 2012, the results of its operations for the year then ended, the changes in its net assets for each of the two years in the period then ended, and the financial highlights for each of the five years in the period then ended, in conformity with accounting principles generally accepted in the United States of America.

Los Angeles, California
November 19, 2012
33
FPA NEW INCOME, INC.
RENEWAL OF THE INVESTMENT ADVISORY AGREEMENT
(Unaudited)
Approval of the Advisory Agreement. At a meeting of the Board of Directors held on August 7, 2012, the Directors approved the continuation of the advisory agreement between the Fund and the Adviser for an additional one-year period through September 30, 2013, on the recommendation of the Independent Directors who met in executive session on August 7, 2012 prior to the Board meeting to review and discuss the proposed continuation of the advisory agreement. The following paragraphs summarize the material information and factors considered by the Board and the Independent Directors as well as the Directors' conclusions relative to such factors.
Nature, Extent and Quality of Services. The Board and the Independent Directors considered information provided by the Adviser before the meeting as well as information provided throughout the year regarding the Adviser and its staffing in connection with the Fund, including the Fund's portfolio managers, the senior analysts supporting team, the scope of accounting, administrative, shareholder and other services supervised and provided by the Adviser, and the absence of any significant service problems reported to the Board. The Board and the Independent Directors noted the experience, length of service and the outstanding reputation of the Fund's portfolio managers: Tom Atteberry, who has been with the Adviser since 1997, Robert Rodriguez, who has managed the Fund since 1984, Julian W. H. Mann, who joined the Adviser in 2004, and Abhijeet V. Patwardhan, who joined the Adviser in 2010. The Board and the Independent Directors concluded that the nature, extent and quality of services provided by the Adviser have benefited and should continue to benefit the Fund and its shareholders.
Investment Performance. The Board and the Independent Directors reviewed the overall investment performance of the Fund. The Directors also received information from an independent consultant, Lipper, a Thomson Reuters Company ("Lipper"), regarding the Fund's performance relative to a peer group of absolute-return selected by Lipper (the "Peer Group"). The Directors discussed with the Adviser the Fund's absolute investment results and its long-term investment performance when compared to the Peer Group. The Board and the Independent Directors considered the Adviser's representation that the Fund's investing style, as evidenced by the short-term duration of most of its portfolio securities, as well as the Fund's flexibility to invest in a variety of areas, complicated Peer Group comparisons. The Board and the Independent Directors determined that the Fund's investment results were satisfactory in light of the Fund's objectives and concluded that the Adviser's continued management of the Fund should benefit the Fund and its shareholders.
Advisory Fees and Fund Expenses; Comparison with Peer Group and Institutional Fees. The Board and the Independent Directors considered information provided by the Adviser regarding the Fund's advisory fees and total expense levels. The Board and the Independent Directors reviewed comparative information regarding fees and expenses for the mutual fund industry generally and for the Peer Group. The Directors noted that the Fund's fees and expenses were at the lower end of the range for the Peer Group. The Board and the Independent Directors also noted that the overall expense ratio of the Fund was low when compared to the Peer Group. The Directors also noted that many funds in the universe charge fees for outside administration and similar services in addition to the advisory fee, and considered that the Adviser did not charge additional fees to the Fund for such services. In addition, the Directors noted that the fee rate charged to the Fund may be higher than institutional accounts managed in a similar style by the portfolio manager, but the services provided to those accounts differed from the services provided to the Fund. The Board and the Independent Directors concluded that the advisory fees paid by the Fund to the Adviser should continue to benefit the Fund and its shareholders.
Adviser Profitability and Costs. The Board and the Independent Directors considered information provided by the Adviser regarding the Adviser's costs in providing services to the Fund, the profitability of the Adviser and the benefits to the Adviser from its relationship to the Fund. They reviewed and considered the Adviser's representations regarding its assumptions and methods of allocating certain costs, such as personnel costs, which constitute the Adviser's largest operating cost. The Board and the Independent Directors recognized that the
34
FPA NEW INCOME, INC.
RENEWAL OF THE INVESTMENT ADVISORY AGREEMENT (Continued)
(Unaudited)
Adviser should be entitled to earn a reasonable level of profits for the services that it provides to the Fund. The Board and the Independent Directors concluded that the Adviser's level of profitability from its relationship with the Fund was not unreasonable or excessive.
Economies of Scale and Sharing of Economies of Scale. The Board and the Independent Directors considered whether there have been economies of scale with respect to the management of the Fund, whether the Fund has appropriately benefited from any economies of scale, and whether the fee rate is reasonable in relation to the Fund's asset levels and any economies of scale that may exist. The Board and the Independent Directors considered the Adviser's representation that its internal costs of providing investment management services to the Fund have increased significantly in recent years as a result of a number of factors, including the Adviser's substantial investment in additional professional resources: staffing. The Board and the Independent Directors considered information regarding the Adviser's representation that such increased costs have also included a significant investment in analysts who assist with the management of the Fund, and additions to administrative personnel and systems that enhance the quality of services provided to the Fund.
The Board and the Independent Directors recognized that the advisory fee rate schedule for the Fund does not have breakpoints. They considered that many mutual funds have breakpoints in the advisory fee structure as a means by which to share in the benefits of potential economies of scale as a fund's assets grow. They also considered that not all funds have breakpoints in their fee structures and that breakpoints are not the exclusive means of sharing potential economies of scale. The Board and the Independent Directors considered the Adviser's statement that it believes that breakpoints currently remain inappropriate for the Fund given the ongoing investments the Adviser is making in its business for the benefit of the Fund, uncertainties regarding the direction of the economy, rising inflation, increasing costs for personnel and systems, and growth or contraction in the Fund's assets, all of which could negatively impact the Adviser. The Board and the Independent Directors concluded that the Fund is benefitting from the ongoing investments made by the Adviser in its team of personnel serving the Fund and in its service infrastructure, and that in light of these investments, the addition of breakpoints in the Fund's advisory fee structure was not warranted at current asset levels.
Ancillary Benefits. The Board and the Independent Directors considered other actual and potential benefits to the Adviser from managing the Fund, including the acquisition and use of research services with commissions generated by the Fund, in concluding that the contractual advisory and other fees are fair and reasonable for the Fund. In particular, they noted that the Adviser does not have any affiliates that benefit from the Adviser's relationship to the Fund.
Conclusions. The Board and the Independent Directors determined that the Fund continues to benefit from the services of a highly experienced portfolio management team, which has produced satisfactory long-term returns. In addition, the Board and the Independent Directors agreed that the Fund continues to receive high quality accounting, administrative, shareholder and other ancillary services from the Adviser. The Board and the Independent Directors concluded that the current advisory fee rate is reasonable and fair to the Fund and its shareholders in light of the nature and quality of the services provided by the Adviser and the Adviser's profitability and costs. The Board and the Independent Directors also stated their intention to continue monitoring the factors relevant to the Adviser's compensation, such as changes in the Fund's asset levels, changes in portfolio management personnel and the cost and quality of the services provided by the Adviser to the Fund. On the basis of the foregoing, and without assigning particular weight to any single factor, none of which was dispositive, the Board and the Independent Directors concluded that it would be in the best interests of the Fund to continue to be advised and managed by the Adviser and determined to approve the continuation of the current Advisory Agreement for another one-year period through September 30, 2013.
35
FPA NEW INCOME, INC.
SHAREHOLDER EXPENSE EXAMPLE
September 30, 2012
(Unaudited)
Fund Expenses
As a shareholder of the Fund, you incur two types of costs: (1) transaction costs, and (2) ongoing costs, including advisory and administrative fees; shareholder service fees; and other Fund expenses. The Example is intended to help you understand your ongoing costs (in dollars) of investing in the Fund and to compare these costs with the ongoing costs of investing in other mutual funds. The Example is based on an investment of $1,000 invested at the beginning of the year and held for the entire year.
Actual Expenses
The information in the table under the heading "Actual Performance" provides information about actual account values and actual expenses. You may use the information in this column, together with the amount you invested, to estimate the expenses that you paid over the period. Simply divide your account value by $1,000 (for example, an $8,600 account value divided by $1,000= 8.6), then multiply the result by the number in the first column in the row entitled "Expenses Paid During Period" to estimate the expenses you paid on your account during this period.
Hypothetical Example for Comparison Purposes
The information in the table under the heading "Hypothetical Performance (5% return before expenses)" provides information about hypothetical account values and hypothetical expenses based on the Fund's actual expense ratio and an assumed rate of return of 5% per year before expenses, which is not the Fund's actual return. The hypothetical account values and expenses may not be used to estimate the
actual ending account balance or expenses you paid for the period. You may use this information to compare the ongoing costs of investing in the Fund and other funds. To do so, compare this 5% hypothetical example with the 5% hypothetical examples that appear in the shareholder reports of other funds.
Please note that the expenses shown in the table are meant to highlight your ongoing costs only and do not reflect any transactional costs. Therefore, the information under the heading "Hypothetical Performance (5% return before expenses)" is useful in comparing ongoing costs only, and will not help you determine the relative total costs of owning different funds. In addition, if these transactional costs were included, your costs would have been higher.
| | | Actual
Performance | | Hypothetical
Performance
(5% return
before
expenses) | |
Beginning Account Value
March 31, 2012 | | $ | 1,000.00 | | | $ | 1,000.00 | | |
Ending Account Value
September 30, 2012 | | $ | 1,015.10 | | | $ | 1,022.11 | | |
Expenses Paid During
Period* | | $ | 2.87 | | | $ | 2.89 | | |
* Expenses are equal to the Fund's annualized expense ratio of 0.57%, multiplied by the average account value over the period and prorated for the six-months ended September 30, 2012 (183/366 days).
36
FPA NEW INCOME, INC.
DIRECTOR AND OFFICER INFORMATION
| Name, Age & Address | | Position(s)
With Fund/
Years Served | | Principal Occupation(s)
During the Past 5 Years | | Portfolios in
Fund Complex
Overseen | | Other Directorships | |
Willard H. Altman, Jr. – (77)* | | Director and Chairman†
Years Served: 14 | | Retired. Formerly, until 1995, Partner of Ernst & Young LLP, a public accounting firm. | | | 7 | | | | |
Thomas P. Merrick – (75)* | | Director†
Years Served: 3 | | Private Consultant. President of Strategic Planning Consultants for more than the past five years. Former Executive Committee Member and Vice President of Fluor Corporation, responsible for strategic planning, from 1984 to 1998. | | | 7 | | | | |
Alfred E. Osborne, Jr. – (67)* | | Director†
Years Served: 13 | | Senior Associate Dean of the John E. Anderson School of Management at UCLA. | | | 4 | | | Kaiser Aluminum Corporation, and Heckmann Corporation. | |
Patrick B. Purcell – (69)* | | Director†
Years Served: 6 | | Retired. Formerly Consultant from March 1998 to August 2000, and Executive Vice President, Chief Financial Officer and Chief Administrative Officer from 1989 to March 1998, of Paramount Pictures. | | | 7 | | | The Motion Picture and Television Fund | |
Allan M. Rudnick – (71)* | | Director†
Years Served: 2 | | Private Investor. Formerly, Co-Founder,
Chief Executive Officer, Chairman and
Chief Investment Officer of Kayne Anderson Rudnick Investment Management from 1989 to 2007 | | | 7 | | | | |
Robert L. Rodriguez – (63) | | Director†
Portfolio Manager
Years Served: 28 | | Chief Executive Officer of the Adviser. | | | 2 | | | FPA Fund Distributors, Inc. | |
Thomas H. Atteberry – (59) | | Chief Executive Officer & Portfolio Manager
Years Served: 7 | | Partner of the Adviser. Formerly Vice President of First Pacific Advisors, Inc. from 1997 to 2006. | | | | | |
Eric S. Ende – (68) | | Vice President
Years Served: 27 | | Partner of the Adviser. Formerly Senior Vice President of First Pacific Advisors, Inc. from 1983 to 2006. | | | 3 | | | | |
J. Richard Atwood – (52) | | Treasurer
Years Served: 15 | | Chief Operating Officer of the Adviser. President and Chief Executive Officer of FPA Fund Distributors, Inc. | | | | FPA Fund Distributors, Inc. | |
Christopher H. Thomas – (55) | | Chief Compliance Officer
Years Served: 17 | | Vice President and Chief Compliance Officer of the Adviser and Vice President of FPA Fund Distributors, Inc. | | | | FPA Fund Distributors, Inc. | |
Sherry Sasaki – (57) | | Secretary
Years Served: 29 | | Assistant Vice President and Secretary of the Adviser and Secretary of FPA Fund Distributors, Inc. | | | | | |
E. Lake Setzler – (45) | | Assistant Treasurer
Years Served: 6 | | Vice President and Controller of the Adviser since 2005. | | | | | |
Michael P. Gomez – (27) | | Assistant Vice President
Years Served: <1 | | Assistant Vice President of the Adviser since 2010. Formerly In-Charge Associate of PricewaterhouseCoopers from 2007-2010. | | | | | |
† Directors serve until their resignation, removal or retirement.
* Audit Committee member
Additional information on the Directors is available in the Statement of Additional Information. Each of the above listed individuals can be contacted at 11400 W. Olympic Blvd., Suite 1200, Los Angeles, CA 90064.
37
INVESTMENT ADVISER
First Pacific Advisors, LLC
11400 West Olympic Boulevard, Suite 1200
Los Angeles, California 90064
DISTRIBUTOR
UMB Distribution Services
803 West Michigan St.
Milwaukee, Wisconsin 53233
COUNSEL
K&L Gates LLP
San Francisco, California
TICKER: FPNIX
CUSIP: 302544101
INDEPENDENT REGISTERED PUBLIC ACCOUNTING FIRM
Deloitte & Touche LLP
Los Angeles, California
CUSTODIAN
State Street Bank and Trust Company
Boston, Massachusetts
TRANSFER & SHAREHOLDER SERVICE AGENT
UMB Fund Services, Inc.
P.O. Box 2175
Milwaukee, WI 53201-2175
803 W. Michigan St., Ste. A
Milwaukee, WI 53233-2301
(800) 638-3060
This report has been prepared for the information of shareholders of FPA New Income, Inc., and is not authorized for distribution to prospective investors unless preceded or accompanied by a prospectus.
The Fund's complete proxy voting record for the 12 months ended June 30, 2012 is available without charge, upon request, by calling (800) 982-4372 and on the SEC's website at www.sec.gov.
The Fund's schedule of portfolio holdings, filed the first and third quarter of the Fund's fiscal year on Form N-Q with the SEC, is available on the SEC's website at www.sec.gov. Form N-Q is available at the SEC's Public Reference Room in Washington, D.C., and information on the operations of the Public Reference Room may be obtained by calling (202) 942-8090. To obtain information on Form N-Q from the Fund, shareholders can call (800) 982-4372.
Additional information about the Fund is available online at www.fpafunds.com. This information includes, among other things, holdings, top sectors and performance, and is updated on or about the 15th business day after the end of each quarter.
Item 2. | Code of Ethics. |
| |
| (a) | The registrant has adopted a code of ethics that applies to the registrant’s principal executive and financial officers. |
| | |
| (b) | Not Applicable |
| | |
| (c) | During the period covered by this report, there were not any amendments to the provisions of the code of ethics adopted in 2(a) above. |
| | |
| (d) | During the period covered by this report, there were not any implicit or explicit waivers to the provisions of the code of ethics adopted in 2(a). |
| | |
| (e) | Not Applicable |
| | |
| (f) | A copy of the registrant’s code of ethics is filed as an exhibit to this Form N-CSR. Upon request, any person may obtain a copy of this code of ethics, without charge, by calling (800) 982-4372. |
| |
Item 3. | Audit Committee Financial Expert. |
| |
| The registrant’s board of directors has determined that Willard H. Altman, Jr. and Patrick B. Purcell, each of whom is a member of the registrant’s audit committee and board of directors, is an “audit committee financial expert” and is “independent,” as those terms are defined in this Item. This designation will not increase the designees’ duties, obligations or liability as compared to each of their duties, obligations and liability as a member of the audit committee and of the board of directors. This designation does not affect the duties, obligations or liability of any other member of the audit committee or the board of directors. |
| |
Item 4. | Principal Accountant Fees and Services. |
| |
| | | | 2011 | | 2012 | |
| (a) | Audit Fees | | $ | 45,000 | | $ | 50,000 | |
| (b) | Audit Related Fees | | -0- | | -0- | |
| (c) | Tax Fees | | $ | 7,100 | | $ | 7,860 | |
| (d) | All Other Fees | | -0- | | -0- | |
| | |
| (e)(1) | Disclose the audit committee’s pre-approval policies and procedures described in paragraph (c)(7) of Rule 2-01 of Regulation S-X. The audit committee shall pre-approve all audit and permissible non-audit services that the committee considers compatible with maintaining the independent auditors’ independence. The pre-approval requirement will extend to all non-audit services provided to the registrant, the adviser, and any entity controlling, controlled by, or under common control with the adviser that provides ongoing services to the registrant, if the |
| | | | | | | | | | |
| | engagement relates directly to the operations and financial reporting of the registrant; provided, however, that an engagement of the registrant’s independent auditors to perform attest services for the registrant, the adviser or its affiliates required by generally accepted auditing standards to complete the examination of the registrant’s financial statements (such as an examination conducted in accordance with Statement on Auditing Standards Number 70 issued by the American Institute of Certified Public Accountants), will be deem pre-approved if: (i) the registrant’s independent auditors inform the audit committee of the engagement, (ii) the registrant’s independent auditors advise the audit committee at least annually that the performance of this engagement will not impair the independent auditor’s independence with respect to the registrant, and (iii) the audit committee receives a copy of the independent auditor’s report prepared in connection with such services. The committee may delegate to one or more committee members the authority to review and pre-approve audit and permissible non-audit services. Actions taken under any such delegation will be reported to the full committee at its next meeting. |
| | |
| (e)(2) | Disclose the percentage of services described in each of paragraphs (b) – (d) of this Item that were approved by the audit committee pursuant to paragraph (c)(7)(i)(C) of Rule 2-01 of Regulation S-X. 100% of the services provided to the registrant described in paragraphs (b) – (d) of this Item were pre-approved by the audit committee pursuant to paragraph (e)(1) of this Item. There were no services provided to the investment adviser or any entity controlling, controlled by or under common control with the adviser described in paragraphs (b) – (d) of this Item that were required to be pre-approved by the audit committee. |
| | |
| (f) | If greater than 50%, disclose the percentage of hours expended on the principal accountant’s engagement to audit the registrant’s financial statements for the most recent fiscal year that were attributed to work performed by persons other than the principal accountant’s full-time, permanent employees. All services performed on the engagement to audit the registrant’s financial statements for the most recent fiscal year end were performed by the principal accountant’s full-time, permanent employees. |
| | |
| (g) | Disclose the aggregate non-audit fees billed by the registrant’s accountant for services rendered to the registrant, and rendered to the registrant’s investment adviser (not including any sub-adviser whose role is primarily portfolio management and is subcontracted with or overseen by another investment adviser), and any entity controlling, controlled by, or under common control with the adviser that provides ongoing services to the registrant for each of the last two fiscal years of the registrant. None. |
| (h) | Disclose whether the registrant’s audit committee of the board of directors has considered whether the provision of non-audit services that were rendered to the registrant’s investment adviser (not including any sub-adviser whose role is primarily portfolio management and is subcontracted with or overseen by another investment adviser), and any entity controlling, controlled by, or under common control with the investment adviser that provides ongoing services to the registrant that were not pre-approved pursuant to paragraph (c)(7)(ii) of Rule 2-01 of Regulation S-X is compatible with maintaining the principal accountant’s independence. Not Applicable. |
| |
Item 5. | Audit Committee of Listed Registrants. Not Applicable. |
| |
Item 6. | Schedule of Investments. The schedule of investments is included as part of the report to stockholders filed under Item 1 of this Form. |
| |
Item 7. | Disclosure of Proxy Voting Policies and Procedures for Closed-End Management Investment Companies. Not Applicable. |
| |
Item 8. | Portfolio Managers of Closed-End Management Investment Companies. Not Applicable. |
| |
Item 9. | Purchases of Equity Securities by Closed-End Management Investment Company and Affiliated Purchasers. Not Applicable. |
| |
Item 10. | Submission of Matters to a Vote of Security Holders. There has been no material change to the procedures by which shareholders may recommend nominees to the registrant’s board of directors. |
| |
Item 11. | Controls and Procedures. |
| | |
| (a) | The principal executive officer and principal financial officer of the registrant have concluded that the registrant’s disclosure controls and procedures (as defined in Rule 30a-3(c) under the Investment Company Act of 1940) are effective based on their evaluation of the disclosure controls and procedures as of a date within 90 days of the filing date of this report. |
| | |
| (b) | There have been no significant changes in the registrant’s internal controls over financial reporting (as defined in Rule 30a-3(d) under the Investment Company Act of 1940) that occurred during the second fiscal quarter of the period covered by this report that have materially affected, or is reasonably likely to materially affect, the registrant’s internal controls over financial reporting. |
Item 12. | Exhibits. |
| | |
| (a)(1) | Code of ethics as applies to the registrant’s officers and directors, as required to be disclosed under Item 2 of Form N-CSR. Attached hereto as Ex.99.CODE.ETH. |
| | |
| (a)(2) | Separate certification for the registrant’s principal executive officer and principal financial officer, as required by Rule 30a-2(a) under the Investment Company Act of 1940. Attached hereto. |
| | |
| (a)(3) | Not Applicable |
| | |
| (b) | Separate certification for the registrant’s principal executive officer and principal financial officer, as required by Rule 30a-2(b) under the Investment Company Act of 1940. Attached hereto. |
SIGNATURES
Pursuant to the requirements of the Securities Exchange Act of 1934 and the Investment Company Act of 1940, the registrant has duly caused this report to be signed on its behalf by the undersigned, thereunto duly authorized.
FPA NEW INCOME, INC.
By: | /s/ THOMAS H. ATTEBERRY | |
Thomas H. Atteberry, Chief Executive Officer |
(Principal Executive Officer) |
Date: November 21, 2012
Pursuant to the requirements of the Securities Exchange Act of 1934 and the Investment Company Act of 1940, this report has been signed below by the following persons on behalf of the registrant and in the capacities and on the dates indicated.
FPA NEW INCOME, INC.
By: | /s/ THOMAS H. ATTEBERRY | |
Thomas H. Atteberry, Chief Executive Officer |
(Principal Executive Officer) |
Date: November 21, 2012
By: | /s/ J. RICHARD ATWOOD | |
J. Richard Atwood, Treasurer |
(Principal Financial Officer) |
Date: November 21, 2012