UNITED STATES
SECURITIES AND EXCHANGE COMMISSION
Washington, D.C. 20549
FORM N-CSR
CERTIFIED SHAREHOLDER REPORT OF REGISTERED
MANAGEMENT INVESTMENT COMPANIES
Investment Company Act file number | 811-1735 |
|
FPA NEW INCOME, INC. |
(Exact name of registrant as specified in charter) |
|
11400 WEST OLYMPIC BLVD., SUITE 1200, LOS ANGELES, CALIFORNIA | | 90064 |
(Address of principal executive offices) | | (Zip code) |
|
J. RICHARD ATWOOD, 11400 WEST OLYMPIC BLVD., SUITE 1200, LOS ANGELES, CALIFORNIA 90064 |
(Name and address of agent for service) |
|
Registrant’s telephone number, including area code: | 310-473-0225 | |
|
Date of fiscal year end: | SEPTEMBER 30 | |
|
Date of reporting period: | SEPTEMBER 30, 2010 | |
| | | | | | | | | |
Item 1. Report to Stockholders.
FPA New Income, Inc.
Annual Report
September 30, 2010

Distributor:
FPA FUND DISTRIBUTORS, INC.
11400 West Olympic Boulevard, Suite 1200
Los Angeles, California 90064
53987
LETTER TO SHAREHOLDERS
Dear Fellow Shareholders:
This Annual Report covers the year ended September 30, 2010. Your Fund's net asset value (NAV) closed at $11.04. During the fiscal year, your Fund paid four income dividends totaling $0.365. There were no capital gains distributions.
The following table shows the average annual total return for several different periods ended on that date for the Fund and comparative indices of securities prices. The data quoted represents past performance, and an investment in the Fund may fluctuate so that an investor's shares when redeemed may be worth more or less than their original cost.
| | | Periods Ended September 30, 2010 | |
| | | 1 Year | | 5 Years | | 10 Years | | 15 Years | | 20 Years | | 25 Years | | 6/30/1984
Inception | |
| FPA New Income (NAV)* | | | 2.90 | % | | | 4.34 | % | | | 5.21 | % | | | 5.61 | % | | | 7.13 | % | | | 7.62 | % | | | 8.54 | % | |
FPA New Income
(Net of Sales Charge)** | | | -0.70 | % | | | 3.60 | % | | | 4.84 | % | | | 5.36 | % | | | 6.94 | % | | | 7.47 | % | | | 8.39 | % | |
Lipper A-Rated Bond
Fund Average | | | 9.93 | % | | | 5.09 | % | | | 5.73 | % | | | 5.79 | % | | | 7.00 | % | | | N/A | | | | N/A | | |
| Barclays Govt/Credit Index | | | 8.73 | % | | | 6.15 | % | | | 6.52 | % | | | 6.44 | % | | | 7.30 | % | | | 7.83 | % | | | 8.57 | % | |
For the second half of the fiscal year, your Fund's return was 1.56%*, 6.24% for the Lipper Average and 7.29% for the Barclays Index. On a calendar year-to-date basis, total returns were: FPA New Income, Inc., 2.77%*; Lipper Average, 8.74%; and the Barclays Index, 8.95%.
Effective September 30, 2010, we are providing an additional portfolio classification called "Cash Plus Liquidity" (see page 8). This new category was created to help shareholders better understand how the Fund's portfolio is currently structured. This category includes cash equivalents and short-term investments plus other high quality, liquid, limited term securities. These securities were added to the portfolio beginning in the second quarter of 2010 and currently consist solely of U.S. Treasury Notes. The Fund's Cash Plus Liquidity position currently stands at 30.8% at September 30, 2010.
To shed further light on this new designation, in our effort to better manage short-term investments, we have been purchasing longer-term U.S. Treasury and Agency securities, usually with three to fourteen months to maturity at the time of purchase. These are being purchased in order to take advantage of a slightly higher yield without taking additional credit risk. FPA New Income's GAAP based financial statements reflect these securities in the portfolio as long-term investments; however, we have been purchasing these securities as cash equivalent substitutes. Thus, this new category better reflects the actual liquidity position of FPA New Income.
Commentary
In August of 2005, we penned a special commentary called "Lousy Performance," discussing our underperformance at that time. In that commentary (available on our website at www.fpafunds.com) we pointed to several investments in the portfolio that were the primary cause of our underperformance. Today, our underperformance is not being driven by investments that did not perform. Rather, the Fund's portfolio is performing exactly as we expected. Your Fund continues to be focused on preservation of capital in this low interest rate environment. The duration or interest-rate risk being undertaken by the Fund continues to be low, dropping from 1.61 years at the end of March to 1.05 years at the end of September. This purposeful reduction in interest-rate risk coincides with the continued rally in the Treasury market. Over the past six months the two-year Treasury
* Does not reflect deduction of the sales charge which, if reflected, would reduce the performance shown.
** Reflects deduction of the maximum sales charge of 3.5% of the offering price.
1
note declined from a yield of 1.02% to 0.42%, and the ten-year Treasury note declined from a yield of 3.83% to 2.51%. We believe that this continued decline in yields has created even greater risk for loss. We simply refuse to take duration risk in the portfolio as the ever-shrinking yields continue to heighten that risk.
Our primary benchmark, the Barclays Government/Credit Index, has a duration of 5.59 years which is more than four years longer than your Fund. This means that the index, and any fund with a similar duration, will be significantly more sensitive to changes in interest rates. The continued drop in rates has worked in their favor, benefiting from rising prices. However, when the direction changes and interest rates rise, this same heightened sensitivity will be a detriment. We believe that our unwillingness to take that risk should provide an opportunity in the future to use our liquidity to reinvest at much higher rates while avoiding the potential for permanent capital impairment we see looming for many of our competitors.
From a corporate credit perspective, we were only able to find a few short-maturity opportunities over the past 6 months reflecting the continued dearth in this sector. At the end of March the percentage of the portfolio with a credit rating less than AA was just over 2%, and at the end of September that percentage had increased to 7%. This was primarily due to our expansion of our holdings of Qwest Communications and the short-maturity airline equipment trusts. The range of yields on the lower credit quality corporate bonds purchase over the past six months was 3.64% to 8.0% with the shortest maturity bonds representing the lowest yield.
Looking at our sector allocations, the most significant change occurred in the Agency segment of the portfolio where that allocation declined from a little over 33% to about 7% at the end of September. As detailed in previous letters, the portfolio invested in Agency debentures, usually with a five-year maturity, and a coupon that increases every year. The bond was callable either every three or six months. As Treasury interest rates declined over the past six months, those calls were exercised which resulted in a significant reduction of the allocation. In prior periods, this type of security remained attractively priced and we were able to reinvest the proceeds in a similar profile; however, during the past six months we did not believe that the new Agency securities structured in a similar manner offered good value.
Most of the proceeds from these called Agency securities were reinvested in the previously discussed "ladder" of U.S. Treasuries with remaining maturities from three to fourteen months. At that time, yields ranged from 17 bps on the three-month Treasury bill to 39 bps on the fourteen-month Treasury note. The Fund's allocation to these very short Treasuries now represents about 28% of assets compared to about 4% of assets six months ago. The reason for selecting a maximum maturity of fourteen months was that this maturity point represented the longest maturity where we could apply our "100 basis point" test and still pass; that is, the point at which a treasury rate increase of 100 basis points or 1% in a one year period generates a zero or negative return. This is a key tool we use at the onset of our research process to to analyze each investment in the Fund. This acts as a starting point toward answering our question of whether we being pa id to take interest rate risk.
Other changes to the portfolio over the past six months include the expansion of our holdings in short-duration, asset backed securities primarily from three issuers: Cabela's, an outdoor gear retailer with its own private label credit card; Case New Holland, backed by loans on their agricultural and construction equipment; and Mass Mutual, backed by business equipment loans and leases, mostly to the Federal government.
To a lesser degree, we continue to systematically add to the GNMA Project Loan IO position with bonds which we estimate to have an average life of around 6 years and with an expected yield to maturity of 8.5%.
Economic Commentary
As we have repeatedly pointed out, your Fund's portfolio remains postured toward preservation of capital because of the significant risks we see in the fixed income markets. In addition to our 100 basis point test
2
discussed above, another component of our analysis for each investment we make is to determine how we get paid back. This may be through periodic amortization of principal, refinancing prior to maturity or payoff of principal at maturity. What happens if we apply this analytical component of our process to the programs or strategies being undertaken by the federal government as it attempts to get the economy to recover from the worst post-World War II recession on record? From our perspective, some of the largest public bailouts have the potential for taxpayers to recoup at least some of the bailout money; however, we believe the much larger government programs have been created with no clear plan on how we get paid back. The uncertainty this creates helps shape much of our negative view for economic growth and the investment horizon in the near to medium term for the bond market, which continues to drive our current conservative stance in t he portfolio.
During the depths of the economic downturn the federal government provided bailouts to many public companies. This group is led by three well-known companies: American International Group (AIG); Citigroup, and; General Motors. General Motors is more than 60% owned by the governments of the United States and Canada. On August 18, the company announced that it would undertake an equity underwriting which will start to put the company back to public ownership. It is expected that the company will raise $8 to $10 billion in equity with the proceeds used to reduce government borrowings. Since the fourth quarter of 2009, the federal government has been selling its equity holdings in Citigroup in the open market, reducing its ownership from 29.8% to 12.4%. The government has also converted its preferred holdings into common equity and is expected to liquidate those shares as well. AIG announced on September 30 that it will convert the government's $49.1 billion preferred stock holdings into 1.66 billion shares of common stock and sell those shares in the open market. At the same time, AIG continues to sell off various operating portions of its business to raise additional funds that will be used to repay the bailouts it received.
Without second guessing whether the tactics used by the government were appropriate, these situations have two key factors in common that stand out as to why there may be an exit strategy or a way for investors (the taxpayers) to get paid back. First, all three were public companies prior to the bailout and have the ability to generate revenue. Second, the pre-bailout investors have already realized a true economic loss and will not get paid back. We do know that once these new security offerings and sales occur, each company will have the opportunity to move forward on its own and have the potential to return to long-term profitability, which can bring economic value to the economy and all of its new stakeholders.
Unfortunately, we cannot see a clear exit strategy for many of the much larger government programs enacted. Starting in 2009, the Federal Reserve Bank decided to undertake a massive expansion of its balance sheet in order to stimulate the economy through lower interest rates. The size of the Bank's balance sheet grew from about $900 billion at the end of June 2008, to $2.3 billion. This was primarily affected through the purchase of Treasury and Agency securities. As of the latest reporting period, the Federal Reserve Bank owns $1.1 trillion in Agency mortgage-backed securities, $156 billion in Agency debentures and $789 billion in U.S. Treasuries. The Federal Reserve Bank "printed money" to purchase these securities hoping that this additional money in the financial system would result in more lending from banks and more borrowing by the private sector, thus stimulating economic growth.
After witnessing the dramatic rise in the bond market resulting from these purchases, we are concerned that the Federal Reserve Bank will not be able to dispose of these securities without an equally negative impact. We believe their purchases were a primary driver for the recent significant decline in interest rates. To date, very little has been revealed as to how the Bank gets out of these holdings. Is there a natural buyer for these holdings or will they flood the market and have to sell them at a loss? The Federal Reserve has discussed offering repurchase agreements or short-term borrowing from the banking system in exchange for the holdings but that does not appear to be a long-term solution. In fact, the Bank became concerned when the mortgages it held started to amortize
3
down. They felt that this repayment of debt would reverse the effects of their purchases and gradually tighten the money supply. So in August they announced that these refinancing proceeds would be reinvested in intermediate- to longer-maturity Treasuries. This was followed in September by the announcement that if the economy did not continue to recover at a satisfactory rate, the Bank would buy more even more Treasuries with these proceeds. Clearly this only makes the ultimate exit from these investments even more difficult.
Though we are not economists, using simple common sense it would appear to us that mortgage loan amortization, refinancing, or maturity are all positive money recycling events. The borrower reduces debt and builds net worth, and the lender has received funds to reinvest or, re-loan. In this case, the Federal Reserve Bank could have gracefully exited its intervention into the mortgage market with potentially minimal disruption. Contrast this natural decline in mortgage holdings with the purchase of Treasuries. When these instruments mature they will most likely need to be refinanced. If the Federal Reserve Bank does not use its proceeds at maturity to buy new Treasuries, then who will? And if someone else, don't they forgo consumption (slowing economic growth) in order to save rather than spend? The same would hold true if the Federal Reserve Bank decides to sell its holdings before maturity.
Another issue resulting from the Federal Reserve's increasing the money supply is that it does not go unnoticed by the capital markets. Since the first announced additional purchase in the summer, the value of the dollar has declined. The U.S. Dollar Trade Weighted Index compared with the Major Currencies Index has moved from 80.51 on June 7 to 73.55 as of September 30, or an 8.6% decline. What this means for U.S. households is that their international purchasing power has declined and the dollars in their wallets have become worth less than before.
How big is the Federal Reserve's impact on the Treasury market? Estimates range from approximately $187 billion to almost $300 billion, as the amount of money the Federal Reserve will reinvest from payments on and/or maturity of its holdings. In addition, the Federal Reserve will need to continue to finance the budget deficits. For argument's sake let's say that the deficit declines modestly from $1.3 trillion to just $1 trillion. In that scenario, just staying "neutral" would mean their purchases need to be about 15% to 30% of that deficit funding. Layer on top of that the additional purchases associated with Quantitative Easing 2 (QE2) of potentially up to $600 billion according to the latest FOMC meeting. The combined program purchases could equal the entire deficit. A rational person is hard pressed to think that there would not be a significant market impact for this bold activity.
While Treasury yields are at a seventy-year low, we believe that many investors in this segment of the market today may be speculating that there is little downside risk because they expect to have a natural buyer at a higher price in the future, the Federal Reserve Bank. If this is true then that same speculator may quickly sell their bonds at some later time if they anticipated the Federal Reserve Bank selling its holdings, resulting in a lot more sellers than buyers and potentially significant downside risk to the bond market.
In all fairness to the Federal Reserve Bank it has communicated that it understands the risk, it has never undertaken such a strategy in the past, and that the outcome is not certain. But they still decided to undertake this bond purchase strategy anyway. It seems to us that Chairman Bernanke and the Federal Open Market Committee members are asking bond investors to follow them into the interest-rate abyss and to trust them on an exit.
The combined federal, state and local government deficits by themselves are another policy without a solution. More simply put how we are going to pay back all that we have borrowed? Depending on the Federal Reserve Bank to print money and buy all of the debt cannot be a credible long-term strategy. In the last two years the federal government alone has run deficits to the tune of approximately $2.8 trillion. Looking out to next year the Congressional Budget Office estimates deficits of another $1+ trillion. At that time the Federal borrowings
4
will be approximately $14.9 trillion or 98% of the GDP. How is this sustainable? At this point, many policymakers only propose more deficit spending with the potentially mistaken belief that more government spending is all that is needed to get the economy growing again, without concern for the long-term effects.
There are a host of additional problems we face. As of this writing Congress had adjourned for the elections without addressing the personal income tax rate changes which will expire in January 2011. For all their discussion over the past two years, neither Congress nor the White House has come forth with any suggestion of significant cost savings or non-essential program cuts to reduce government outlays. Neither of these has put forth policies that would stimulate growth that could assist in reducing this unsustainable debt.
A review of policies without an exit strategy would not be complete without commenting on Fannie Mae and Freddie Mac (FNMA and FHLMC). In August 2008 the government put both entities into conservatorship. As part of that action the federal government agreed to contribute funds to each company every quarter to keep them solvent. As of today the contributions to keep these companies has totaled $159 billion and continues to grow each quarter as losses continue to mount. In December 2009, the White House announced that the financial support would be limitless through 2012. Estimates suggest that additional funding could be as much as $390 billion just for these two companies to stay at a "0" net worth.
These policy actions, which do not have an articulated exit strategy, also do not have a quantification of the long-term financial cost and economic cost. In is our opinion this reinforces the need for caution.
As we have stated in prior letters, we believed that government policies would play a key role in how quickly the economy recovers and that judging the effectiveness and speed of these policy actions would be very difficult. Having little clear policy direction just makes the economic situation worse. As a result, we have not been surprised by the continued slowdown in economic activity as evidence by the sequential declines in GDP growth from the peak number of 5.0% in Q4 2009 to the latest reading of 1.7% growth for the second quarter of 2010. The excess leverage in the economy and the solvency concerns of U.S. households and financial institutions lead us to believe it will take a long time to repair. These reasons continue to reinforce our belief that it is prudent to maintain a very risk-averse stance toward both interest-rate direction and credit risk. Preservation of capital remains paramount and we will only make investments when we feel that we are being properly compensated to take either of those two risks with your capital.
At the beginning of 2009 we debated whether to deploy capital into the high yield segment of the bond market. The following is a partial list of concerns that held us back. We were concerned that the economy would not be on a sustainable growth path of any magnitude as the problems that beset it were not liquidity driven but solvency related. We believed that the investment landscape would shift from fundamental investment analysis to being heavily driven by governmental policy and regulatory shift. We felt that during the significant economic downturn, the high yield market and the consumer market would need capital in the form of new extended credit to sustain them over the recovery period. We believed that the treasury market had rallied on a flight to quality which over 2009 would abate, and the result would be a higher base level of interest rates, and those would provide the potential for a greater return in the high quality portion of the bond market.
Where we went wrong was that capital flowed back into the high yield market as evidenced by the large amount of new issuance over the past eighteen months which did push out the maturity or refinance problem of that market for several years. The result was a strong rally in the high yield market. Our other error came from not recognizing the potential impact of the amount of money that flowed into bond mutual funds, driving up prices and driving down yields. We underestimated investors' willingness to chase yield in an attempt to make some sort of return on their principal. This was exacerbated by the Fed purchases discussed earlier.
5
We still have many of the same concerns now that we had back in 2009. The economy has not been able to sustain a recovery of any meaningful growth and continues to struggle with high unemployment. The influence of the current administration's policies has been significant and is cited as a prime reason why the economy has grown poorly. Uncertainty remains about what the future tax and regulatory environment will look like for business. Lastly, consumers are still in financial stress and remain focused on debt reduction rather than consumption.
Even with the weak economic environment, we still look for select opportunities to capitalize on some of the remaining uncertainty and make selective credit investments in the Fund. To help us research investments in corporate credits, we added Abhi Patwardhan to our fixed income team in June. Prior to joining FPA, Abhi was an investment analyst at Reservoir Capital Group and D.B. Zwirn & Co. and an investment banking analyst at UBS Warburg and Donaldson, Lufkin & Jenrette. Abhi received a BS in Economics and an MBA from the Wharton School of the University of Pennsylvania. We look forward to his contributions to the portfolio as we navigate this difficult economic environment.
Conclusion
Remember that the Fund's objective is both income and total return, and within that we employ a strategy to help ensure preservation of your capital. In addition, our goal is to generate a positive return each year. In this letter and other recent commentaries we have discussed challenges facing the bond market, including the far reaching fiscal and monetary policy actions being taken and their possible effect on the fixed income market. In our view, the risk that one or more of these policies fails is increasing, and that failure could have very costly results for bond investors. We believe the opportunity for significant upside return in the bond market remains limited as evidenced by the historic low yields on a vast majority of high quality fixed income assets. As value investors we must be properly compensated for risk and be protected to the downside in the event of adverse financial and/or economic outcomes. We continue to be prudent in deploying the portfolio's capital, evidenced by its short duration and high credit quality.
We thank you for your continued confidence and support.

Thomas H. Atteberry
Chief Executive Officer and Portfolio Manager
October 29, 2010
The discussion of Fund investments represents the views of the Fund's managers at the time of this report and are subject to change without notice. References to individual securities are for informational purposes only and should not be construed as recommendations to purchase or sell individual securities.
6
HISTORICAL PERFORMANCE
Change in Value of a $10,000 Investment in FPA New Income, Inc. vs. Lehman Brothers Government/Credit Index and Lipper Corporate Debt A Rated Fund Average from October 1, 2000 to September 30, 2010
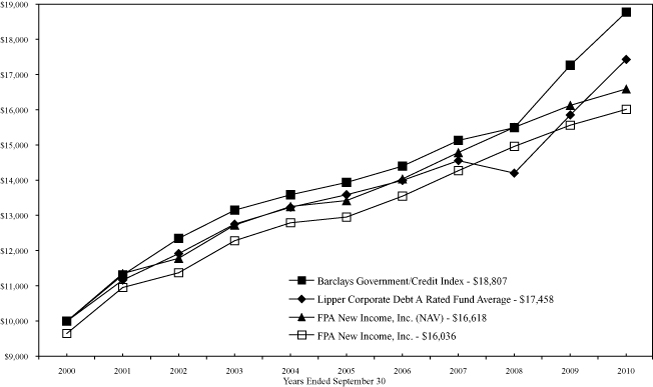
Past performance is not indicative of future performance. The Barclays Government/Credit Index is a broad-based unmanaged index of all government and corporate bonds that are investment grade with at least one year to maturity. The Barclays Government/Credit Index does not reflect any commissions or fees which would be incurred by an investor purchasing the securities it represents. The Lipper Corporate Debt A Rated Fund Average provides an additional comparison of how your Fund performed in relation to other mutual funds with similar objectives. The Lipper data does not include sales charges. The performance shown for FPA New Income, Inc., with an ending value of $16,036 reflects deduction of the current maximum sales charge of 3.5% of the offering price. In addition, since investors purchase shares of the Fund with varying sales charges depending primarily on volume purchased, the Fund's performance at net asset value (NAV) is also shown, as reflected by the ending value of $16,618. The performance of the Fund and of the Averages is computed on a total return basis which includes reinvestment of all distributions.
FORWARD LOOKING STATEMENT DISCLOSURE
As mutual fund managers, one of our responsibilities is to communicate with shareholders in an open and direct manner. Insofar as some of our opinions and comments in our letters to shareholders are based on current management expectations, they are considered "forward-looking statements" which may or may not be accurate over the long term. While we believe we have a reasonable basis for our comments and we have confidence in our opinions, actual results may differ materially from those we anticipate. You can identify forward-looking statements by words such as "believe," "expect," "may," "anticipate," and other similar expressions when discussing prospects for particular portfolio holdings and/or the markets, generally. We cannot, however, assure future results and disclaim any obligation to update or alter any forward-looking statements, whether as a result of new information, future events, or otherwise. Further, information provided in t his report should not be construed as a recommendation to purchase or sell any particular security.
7
PORTFOLIO SUMMARY
September 30, 2010 (unaudited)
| Bonds & Debentures | | | | | | | 98.3 | % | |
| U.S. Treasury* | | | 28.2 | % | | | | | |
| Mortgage-Backed | | | 21.0 | % | | | | | |
| Mortgage Pass-Through | | | 13.2 | % | | | | | |
| Corporate | | | 12.0 | % | | | | | |
| U.S. Agencies | | | 7.3 | % | | | | | |
| Stripped Mortgage-Backed | | | 5.9 | % | | | | | |
| Commercial Mortgage-Backed | | | 4.7 | % | | | | | |
| Asset-Backed | | | 4.1 | % | | | | | |
| Municipal | | | 1.0 | % | | | | | |
| Short-Term U.S. Agencies* | | | 0.9 | % | | | | | |
| Short-Term Investments* | | | | | | | 1.3 | % | |
| Other Assets and Liabilities, net* | | | | | | | 0.4 | % | |
| Total Net Assets | | | | | | | 100.0 | % | |
| *Cash Plus Liquidity | | | | | | | 30.8 | % | |
MAJOR PORTFOLIO CHANGES
For the Six Months Ended September 30, 2010 (unaudited)
| | | Principal
Amount | |
| NET PURCHASES | |
| Non-Convertible Bonds and Debentures | |
| American Airlines PT Trust—6.817% 2011 | | $ | 43,168,000 | | |
| Federal Home Loan Bank 17-2014 1—5.34% 2014 (1) | | $ | 40,757,791 | | |
First National Bank of Omaha Master Note Trust 2009-1A
(Floating)—1.06734% 2014 (1) | | $ | 47,900,000 | | |
| MassMutual Asset Finance LLC 2009-AA—2.37% 2013 (1) | | $ | 42,290,000 | | |
| Westpac Banking Corporation CPI (Floating)—3.5% 2017 (1) | | $ | 50,285,000 | | |
| NET SALES | |
| Non-Convertible Bonds and Debentures | |
| Federal Home Loan Bank—2% 2014 (2) | | $ | 49,145,000 | | |
| Federal Home Loan Bank—2.25% 2014 (2) | | $ | 46,865,000 | | |
| Federal National Mortgage Association—1% 2012 (2) | | $ | 48,179,000 | | |
| Federal National Mortgage Association 2010-34—5% 2035 (2) | | $ | 55,530,000 | | |
| Federal National Mortgage Association 2010-35—5% 2040 (2) | | $ | 54,590,000 | | |
(1) Indicates new commitment to portfolio
(2) Indicates elimination from portfolio
8
PORTFOLIO OF INVESTMENTS
September 30, 2010
| BONDS & DEBENTURES | | Principal
Amount | | Value | |
| U.S. TREASURY SECURITIES — 28.2% | |
| U.S.Treasury Notes | |
| —0.75% 2011 | | $ | 214,150,000 | | | $ | 215,187,299 | | |
| —0.875% 2011 | | | 95,635,000 | | | | 95,889,035 | | |
| —0.875% 2011 | | | 150,000,000 | | | | 150,468,750 | | |
| —0.875% 2011 | | | 141,665,000 | | | | 142,196,244 | | |
| —1% 2011 | | | 120,000,000 | | | | 120,712,500 | | |
| —1% 2011 | | | 39,000,000 | | | | 39,262,033 | | |
| —1% 2011 | | | 77,925,000 | | | | 78,497,266 | | |
| —1.125% 2011 | | | 150,000,000 | | | | 150,984,375 | | |
| —4.875% 2011 | | | 170,000,000 | | | | 175,232,821 | | |
| TOTAL U.S. TREASURY SECURITIES | | $ | 1,168,430,323 | | |
| MORTGAGE-BACKED SECURITIES — 21.0% | |
| Chase MTG 2003-S14 CL 2A4 — 7.5% 2034 | | $ | 5,868,763 | | | $ | 6,033,147 | | |
| Federal Home Loan Bank | |
| 0-0606 CL Y — 5.27% 2012 | | | 19,220,782 | | | | 20,606,216 | | |
| I7-2014 1 — 5.34% 2014 | | | 40,757,791 | | | | 44,795,258 | | |
| VN-2015 CL A — 5.46% 2015 | | | 37,217,703 | | | | 40,880,669 | | |
| 0-0986 — 5.739% 2014 | | | 31,164,762 | | | | 33,924,713 | | |
| Federal Home Loan Mortgage Corporation | |
| 2630 CL KS — 4% 2017 | | | 21,273,716 | | | | 21,931,287 | | |
| 2786 CL JC — 4% 2018 | | | 4,071,841 | | | | 4,241,148 | | |
| 2869 CL JA — 4% 2034 | | | 20,096,603 | | | | 20,477,635 | | |
| 2877 WA — 4.25% 2034 | | | 19,614,979 | | | | 20,364,271 | | |
| 2706 CL UG — 4.5% 2016 | | | 11,688,159 | | | | 12,057,154 | | |
| 2677 CL LD — 4.5% 2017 | | | 19,903,007 | | | | 20,563,787 | | |
| 2914 CL JQ — 4.5% 2019 | | | 16,517,733 | | | | 17,511,605 | | |
| 3439 CL AC — 4.5% 2022 | | | 27,521,515 | | | | 29,289,497 | | |
| 2509 CL CB — 5% 2017 | | | 12,396,191 | | | | 13,176,407 | | |
| 2602 CL ET — 5% 2017 | | | 10,490,022 | | | | 11,130,753 | | |
| 3080 CL MA — 5% 2018 | | | 7,579,499 | | | | 7,736,849 | | |
| 3285 CL LC — 5% 2025 | | | 27,684,981 | | | | 29,367,951 | | |
| 2780 CL MA — 5% 2030 | | | 6,439,912 | | | | 6,556,410 | | |
| 2010-39 CL PL — 5% 2032 | | | 20,848,059 | | | | 22,891,794 | | |
| 2494 CL CF — 5.5% 2017 | | | 12,828,984 | | | | 13,720,727 | | |
| 2503 CL B — 5.5% 2017 | | | 12,568,314 | | | | 13,400,713 | | |
| R005 CL AB — 5.5% 2018 | | | 28,042,988 | | | | 29,005,423 | | |
| 2542 CL PG — 5.5% 2031 | | | 13,329,248 | | | | 13,596,633 | | |
| 2903 CL UZ — 5.5% 2031 | | | 16,228,712 | | | | 16,615,929 | | |
| 2922 CL Z — 5.5% 2032 | | | 21,266,000 | | | | 21,932,051 | | |
| 2670 CL QG — 5.5% 2032 | | | 37,755,000 | | | | 40,042,953 | | |
9
PORTFOLIO OF INVESTMENTS
September 30, 2010
| BONDS & DEBENTURES — Continued | | Principal
Amount | | Value | |
| 3133 CL BD — 5.75% 2033 | | $ | 8,205,788 | | | $ | 8,477,646 | | |
| 3614 CL DY — 6% 2032 | | | 30,118,246 | | | | 33,097,242 | | |
| Federal National Mortgage Association | |
| 2004-90 CL GA — 4.35% 2034 | | | 13,950,721 | | | | 14,437,043 | | |
| 2008-77 CL DA — 5% 2023 | | | 14,675,512 | | | | 15,620,028 | | |
| 2004-60 CL LB — 5% 2034 | | | 22,930,419 | | | | 24,846,256 | | |
| 2002-83 CL HC — 5% 2017 | | | 5,601,649 | | | | 5,672,566 | | |
| 2005-4 CL E — 5% 2032 | | | 16,067,623 | | | | 16,808,180 | | |
| 2003-W17 CL IA5 — 5.35% 2033 | | | 20,480,985 | | | | 21,360,029 | | |
| 2009-116 CL PA — 5.5% 2024 | | | 16,580,393 | | | | 18,213,064 | | |
| 2006-53 CL PA — 5.5% 2026 | | | 4,567,799 | | | | 4,614,710 | | |
| 2006-21 CL CA — 5.5% 2029 | | | 9,331,737 | | | | 9,741,867 | | |
| 2002-70 CL QG — 5.5% 2031 | | | 8,826,187 | | | | 9,002,005 | | |
| 2004-52 CL KA — 5.5% 2032 | | | 8,599,900 | | | | 8,759,686 | | |
| 2003-28 CL PG — 5.5% 2032 | | | 15,041,587 | | | | 15,874,590 | | |
| 2005-6 CL KA — 5.5% 2032 | | | 7,887,807 | | | | 8,019,770 | | |
| 2002-87 CL N — 5.5% 2032 | | | 8,536,464 | | | | 8,825,509 | | |
| 2005-118 CL ME — 6% 2032 | | | 27,130,000 | | | | 28,127,028 | | |
| 2002-9 CL PC — 6% 2017 | | | 11,705,815 | | | | 12,674,471 | | |
| 2004-W6 — 8% 2034 | | | 3,332,875 | | | | 3,400,632 | | |
| SASC 2002-RM1 CL A (Floating) — 0.90625% 2037+ | | | 26,811,719 | | | | 22,236,969 | | |
| Stanwich Mortgage Loan Trust (Floating) | |
| 2010-1 — 3.63266% 2047+,* | | | 5,216,885 | | | | 2,736,079 | | |
| 2010-2 — 3.69809% 2057+,* | | | 12,604,314 | | | | 6,657,737 | | |
| 2010-3 — 5.58252% 2038+,* | | | 6,930,563 | | | | 3,313,980 | | |
| 2010-4 — 3.88348% 2049+,* | | | 14,591,364 | | | | 6,794,133 | | |
| WFMBS 2006-5 2A1 — 5.25% 2021 | | | 27,724,892 | | | | 27,823,038 | | |
| TOTAL MORTGAGE-BACKED SECURITIES | | $ | 868,985,238 | | |
| MORTGAGE PASS-THROUGH SECURITIES — 13.2% | |
| Federal Home Loan Mortgage Corporation | |
| 782629 (Floating) — 2.732% 2035 | | $ | 1,636,893 | | | $ | 1,715,038 | | |
| 847526 (Floating) — 2.752% 2034 | | | 10,573,650 | | | | 11,064,162 | | |
| 848215 (Floating) — 2.857% 2038 | | | 5,926,491 | | | | 6,188,797 | | |
| G11470 — 4.5% 2013 | | | 821,391 | | | | 848,801 | | |
| B18693 — 4.5% 2015 | | | 2,505,259 | | | | 2,630,697 | | |
| G13091 — 5% 2018 | | | 10,138,770 | | | | 10,760,175 | | |
| E01642 — 5% 2019 | | | 11,108,745 | | | | 11,864,473 | | |
| G13812 — 5% 2020 | | | 33,720,223 | | | | 35,824,702 | | |
| J03433 — 6% 2016 | | | 3,969,236 | | | | 4,289,871 | | |
| J04028 — 6% 2016 | | | 943,206 | | | | 1,020,474 | | |
| J02913 — 6% 2016 | | | 1,294,132 | | | | 1,397,235 | | |
10
PORTFOLIO OF INVESTMENTS
September 30, 2010
| BONDS & DEBENTURES — Continued | | Principal
Amount | | Value | |
| G12261 — 6% 2016 | | $ | 1,906,116 | | | $ | 2,085,358 | | |
| E02206 — 6% 2016 | | | 860,504 | | | | 933,690 | | |
| J03602 — 6% 2016 | | | 523,665 | | | | 566,160 | | |
| J03666 — 6% 2016 | | | 485,238 | | | | 523,882 | | |
| J03856 — 6% 2016 | | | 777,978 | | | | 840,800 | | |
| J04095 — 6% 2017 | | | 2,091,098 | | | | 2,243,372 | | |
| J04191 — 6% 2017 | | | 546,593 | | | | 590,501 | | |
| G12661 — 6% 2017 | | | 5,161,998 | | | | 5,582,391 | | |
| G12648 — 6% 2017 | | | 817,456 | | | | 884,447 | | |
| J04756 — 6% 2017 | | | 657,582 | | | | 712,036 | | |
| J04809 — 6% 2017 | | | 753,033 | | | | 814,985 | | |
| J04845 — 6% 2017 | | | 957,690 | | | | 1,035,914 | | |
| J05642 — 6% 2017 | | | 3,171,323 | | | | 3,434,765 | | |
| E02330 — 6% 2017 | | | 828,123 | | | | 898,472 | | |
| G12139 — 6.5% 2019 | | | 6,016,371 | | | | 6,348,475 | | |
| A26942 — 6.5% 2034 | | | 1,277,031 | | | | 1,402,934 | | |
| G08107 — 6.5% 2036 | | | 6,126,804 | | | | 6,684,159 | | |
| P50543 — 6.5% 2037 | | | 478,815 | | | | 522,775 | | |
| Federal National Mortgage Association | |
| AD0705 (Floating) — 2.65% 2040 | | | 10,429,280 | | | | 10,887,751 | | |
| 890123 — 4.5% 2016 | | | 10,345,050 | | | | 10,720,265 | | |
| 995756 — 5% 2018 | | | 31,847,352 | | | | 34,033,991 | | |
| 735453 — 5% 2019 | | | 16,658,820 | | | | 17,796,784 | | |
| 995861 — 5% 2021 | | | 34,287,872 | | | | 36,643,449 | | |
| 890122 — 5% 2021 | | | 13,626,586 | | | | 14,555,374 | | |
| 890083 — 5% 2021 | | | 17,122,786 | | | | 18,299,121 | | |
| 257100 — 5.5% 2018 | | | 3,626,827 | | | | 3,907,507 | | |
| 745500 — 5.5% 2018 | | | 25,550,379 | | | | 27,614,850 | | |
| 735521 — 5.5% 2020 | | | 12,769,216 | | | | 13,812,844 | | |
| 995284 — 5.5% 2020 | | | 31,550,980 | | | | 34,097,775 | | |
| 995327 — 5.5% 2019 | | | 6,558,634 | | | | 7,092,179 | | |
| 889069 — 5.5% 2021 | | | 24,627,609 | | | | 26,640,670 | | |
| AE0237 — 5.5% 2023 | | | 33,524,268 | | | | 36,247,444 | | |
| 865963 (Floating) — 5.802% 2036 | | | 6,203,977 | | | | 6,627,088 | | |
| 890225 — 6% 2023 | | | 31,389,638 | | | | 34,036,098 | | |
| 256266 — 6% 2016 | | | 2,143,964 | | | | 2,310,036 | | |
| 256385 — 6% 2016 | | | 439,813 | | | | 474,536 | | |
| 256502 — 6% 2016 | | | 953,938 | | | | 1,029,643 | | |
| 256547 — 6% 2016 | | | 6,882,194 | | | | 7,432,838 | | |
| 256560 — 6% 2017 | | | 6,759,862 | | | | 7,298,420 | | |
| 928002 — 6% 2017 | | | 718,583 | | | | 776,407 | | |
| 256632 — 6% 2017 | | | 2,305,470 | | | | 2,491,153 | | |
11
PORTFOLIO OF INVESTMENTS
September 30, 2010
| BONDS & DEBENTURES — Continued | | Principal
Amount | | Value | |
| 256683 — 6% 2017 | | $ | 4,630,158 | | | $ | 5,002,839 | | |
| 928100 — 6% 2017 | | | 707,341 | | | | 764,049 | | |
| 928128 — 6% 2017 | | | 403,288 | | | | 435,374 | | |
| 928249 — 6% 2017 | | | 1,114,046 | | | | 1,204,562 | | |
| 256743 — 6% 2017 | | | 1,772,237 | | | | 1,915,788 | | |
| 256838 — 6% 2017 | | | 131,485 | | | | 142,177 | | |
| 256794 — 6% 2017 | | | 4,112,847 | | | | 4,447,345 | | |
| 256869 — 6% 2017 | | | 7,752,514 | | | | 8,383,801 | | |
| AD0951 — 6% 2021 | | | 31,154,685 | | | | 33,798,160 | | |
| 923306 — 6.5% 2037 | | | 833,572 | | | | 906,051 | | |
| 323282 — 7.5% 2028 | | | 714,135 | | | | 796,553 | | |
| Government National Mortgage Association 782281 — 6% 2023 | | | 8,509,901 | | | | 9,333,745 | | |
| TOTAL MORTGAGE PASS-THROUGH SECURITIES | | $ | 545,639,208 | | |
| CORPORATE BONDS & DEBENTURES — 12.0% | |
| Allied Capital Corporation | |
| —6% 2012 | | $ | 12,770,000 | | | $ | 13,072,649 | | |
| —6.625% 2011 | | | 6,655,000 | | | | 6,786,836 | | |
| American Airlines PT Trust — 6.817% 2011 | | | 43,168,000 | | | | 43,905,309 | | |
| American Honda Finance Corporation (Floating) — 2.63938% 2011 | | | 33,000,000 | | | | 32,953,800 | | |
| Barclays Bank plc | |
| —1.9% 2014 (Step-up) | | | 37,858,000 | | | | 37,865,193 | | |
| —4.5% 2017 (Floating) | | | 45,000,000 | | | | 44,558,100 | | |
| CIT Group Inc. | |
| —7% 2013 | | | 31,445,373 | | | | 31,609,832 | | |
| —7% 2014 | | | 1,910,063 | | | | 1,904,142 | | |
| —7% 2015 | | | 1,910,063 | | | | 1,898,316 | | |
| —7% 2016 | | | 3,183,440 | | | | 3,128,335 | | |
| —7% 2017 | | | 4,456,816 | | | | 4,365,451 | | |
| Commonwealth Bank of Australia (Floating) | |
| —3.125% 2017+ | | | 50,445,000 | | | | 49,032,036 | | |
| —3.5% 2017+ | | | 54,963,000 | | | | 54,100,630 | | |
| Continental Airlines Company 1997-11A — 7.461% 2015 | | | 3,151,909 | | | | 3,270,106 | | |
| Delta Airlines, Inc. | |
| —7.111% 2011 | | | 6,711,000 | | | | 7,023,733 | | |
| —7.57% 2010 | | | 8,329,000 | | | | 8,378,558 | | |
| Northwest Airlines, Inc. — 6.841% 2011 | | | 8,472,000 | | | | 8,652,877 | | |
| Omnicare Inc. — 6.875% 2015 | | | 4,989,000 | | | | 5,041,335 | | |
| Qwest Corporation | |
| —3.54219% 2013 (Floating) | | | 7,139,000 | | | | 7,465,252 | | |
| —7.625% 2015 | | | 18,071,000 | | | | 20,738,460 | | |
| —7.5% 2014 | | | 15,000,000 | | | | 16,977,450 | | |
12
PORTFOLIO OF INVESTMENTS
September 30, 2010
| BONDS & DEBENTURES — Continued | | Principal
Amount | | Value | |
| Toyota Motor Credit Corporation (Floating) — 1.85% 2013 | | $ | 21,000,000 | | | $ | 20,743,800 | | |
| United Airlines Inc. — 9.875% 2013+ | | | 22,641,000 | | | | 24,561,862 | | |
| Westpac Banking Corporation CPI (Floating) — 3.5% 2017+ | | | 50,285,000 | | | | 49,238,066 | | |
| TOTAL CORPORATE BONDS & DEBENTURES | | $ | 497,272,128 | | |
| U.S. AGENCIES SECURITIES — 7.3% | |
| Federal Agricultural Mortgage Corporation | |
| —3.875% 2011 | | $ | 58,340,000 | | | $ | 60,140,373 | | |
| —4.875% 2011+ | | | 44,665,000 | | | | 45,243,858 | | |
| —5.5% 2011+ | | | 19,600,000 | | | | 20,373,024 | | |
| Federal Farm Credit Bank (Floating) | |
| —0.74625% 2011 | | | 60,000,000 | | | | 60,402,000 | | |
| Federal Home Loan Bank | |
| —2% 2013 | | | 46,900,000 | | | | 47,355,868 | | |
| Federal National Mortgage Association | |
| —1.85335% 2013 (Floating) | | | 21,250,000 | | | | 21,275,500 | | |
| —2.3% 2016 | | | 48,200,000 | | | | 48,395,692 | | |
| TOTAL U.S. AGENCIES SECURITIES | | $ | 303,186,315 | | |
| STRIPPED MORTGAGE-BACKED SECURITIES — 5.9% | |
| INTEREST ONLY SECURITIES | |
| Federal Home Loan Mortgage Corporation | |
| 3714 TI — 2.25% 2015 | | $ | 178,222,173 | | | $ | 9,372,704 | | |
| 3706 AI — 3.5% 2020 | | | 39,899,280 | | | | 3,790,432 | | |
| 3722 AI — 3.5% 2020 | | | 34,404,921 | | | | 3,467,373 | | |
| 2558 CL JW — 5.5% 2022 | | | 5,574,188 | | | | 415,389 | | |
| 217 — 6.5% 2032 | | | 1,284,156 | | | | 217,883 | | |
| Federal National Mortgage Association | |
| 2010-91 MI — 2% 2013 | | | 94,471,034 | | | | 3,203,513 | | |
| 2003-64 CL XI — 5% 2033 | | | 7,820,494 | | | | 1,118,018 | | |
| Government National Mortgage Association (Floating) | |
| 2002-56 — 0.57531% 2042 | | | 1,058,826 | | | | 12,007 | | |
| 2004-43 — 0.66639% 2044 | | | 134,425,885 | | | | 3,269,237 | | |
| 2004-108 — 0.65907% 2044 | | | 36,489,550 | | | | 1,044,696 | | |
| 2004-10 — 0.80384% 2044 | | | 147,088,742 | | | | 3,384,512 | | |
| 2005-9 — 0.72001% 2045 | | | 24,984,149 | | | | 842,216 | | |
| 2005-90 — 0.7917% 2045 | | | 115,386,046 | | | | 3,999,280 | | |
| 2005-50 — 0.90452% 2045 | | | 2,151,387 | | | | 85,625 | | |
| 2006-5 — 0.73123% 2046 | | | 96,988,389 | | | | 3,591,480 | | |
| 2006-30 — 0.76634% 2046 | | | 25,490,522 | | | | 1,071,622 | | |
| 2006-15 — 0.79809% 2046 | | | 30,091,156 | | | | 1,081,175 | | |
13
PORTFOLIO OF INVESTMENTS
September 30, 2010
| BONDS & DEBENTURES — Continued | | Principal
Amount | | Value | |
| 2006-55 — 0.85375% 2046 | | $ | 100,847,953 | | | $ | 4,305,199 | | |
| 2006-67 — 0.97147% 2046 | | | 73,057,468 | | | | 3,246,674 | | |
| 2007-15 — 0.8075% 2047 | | | 177,382,312 | | | | 8,778,651 | | |
| 2007-4 — 0.8917% 2047 | | | 53,818,946 | | | | 2,605,375 | | |
| 2007-34 — 0.90554% 2047 | | | 55,935,320 | | | | 2,800,122 | | |
| 2007-77 — 1.02777% 2047 | | | 205,479,167 | | | | 9,936,972 | | |
| 2007-55 — 1.04599% 2047 | | | 148,216,397 | | | | 7,461,213 | | |
| 2008-8 — 1.14629% 2047 | | | 190,440,146 | | | | 8,990,679 | | |
| 2008-24 — 1.1789% 2047 | | | 73,095,144 | | | | 3,692,036 | | |
| 2008-48 — 0.96239% 2048 | | | 158,411,869 | | | | 6,705,574 | | |
| 2008-78 — 0.98579% 2048 | | | 144,260,201 | | | | 6,944,686 | | |
| 2008-92 — 1.03742% 2048 | | | 149,509,277 | | | | 8,055,560 | | |
| 2008-45 — 1.12001% 2048 | | | 155,529,430 | | | | 7,043,928 | | |
| 2009-119 — 1.05609% 2049 | | | 286,873,292 | | | | 16,641,520 | | |
| 2009-105 — 1.09326% 2049 | | | 133,535,971 | | | | 8,400,748 | | |
| 2009-60 — 1.13739% 2049 | | | 147,241,991 | | | | 8,709,364 | | |
| 2009-86 — 1.1482% 2049 | | | 146,980,474 | | | | 8,496,941 | | |
| 2009-4 — 1.3461% 2049 | | | 157,437,162 | | | | 10,705,727 | | |
| 2009-49 — 1.40185% 2049 | | | 144,901,805 | | | | 9,970,693 | | |
| 2009-71 — 1.7275% 2049 | | | 159,008,328 | | | | 12,458,302 | | |
| 2009-30 — 1.97454% 2049 | | | 125,230,439 | | | | 11,329,598 | | |
| 2010-18 — 0.88704% 2050 | | | 178,557,203 | | | | 9,258,191 | | |
| 2010-123 — 0.90224% 2050 | | | 90,742,771 | | | | 5,357,453 | | |
| 2010-63 — 0.9879% 2050 | | | 82,317,494 | | | | 4,427,035 | | |
| 2010-28 — 1.17236% 2050 | | | 141,919,009 | | | | 8,790,463 | | |
| 2010-49 — 1.2857% 2050 | | | 163,894,853 | | | | 10,464,686 | | |
| PRINCIPAL ONLY SECURITY | |
| Federal Home Loan Mortgage Corporation 217 — 6.5% 2032 | | | 1,284,156 | | | | 1,184,249 | | |
| TOTAL STRIPPED MORTGAGE-BACKED SECURITIES | | $ | 246,728,801 | | |
| COMMERCIAL MORTGAGE-BACKED SECURITIES — 4.7% | |
| Government National Mortgage Association | |
| 2004-51 CL B — 4.982% 2024 | | $ | 10,030,000 | | | $ | 10,398,101 | | |
| 2004-6 CL C — 4.712% 2025 | | | 10,112,729 | | | | 10,309,421 | | |
| 2006-15 CL A — 3.727% 2027 | | | 23,260,239 | | | | 23,873,612 | | |
| 2004-108 CL A — 3.999% 2027 | | | 23,643,270 | | | | 24,600,586 | | |
| 2002-9 CL C — 6.269% 2027 | | | 2,087,532 | | | | 2,181,095 | | |
| 2006-30 CL A — 4.175% 2028 | | | 38,657,407 | | | | 40,193,653 | | |
| 2008-48 CL A — 3.725% 2029 | | | 17,787,753 | | | | 18,208,078 | | |
| 2005-34 CL B — 4.739% 2029 | | | 19,000,000 | | | | 19,691,410 | | |
| 2007-69 CL B — 4.959% 2030 | | | 7,065,000 | | | | 7,406,239 | | |
14
PORTFOLIO OF INVESTMENTS
September 30, 2010
| BONDS & DEBENTURES — Continued | | Principal
Amount | | Value | |
| Washington Mutual CMS 2007-SL2 CL A (Floating) | |
| —5.31283% 2049+ | | $ | 43,300,243 | | | $ | 37,939,673 | | |
| TOTAL COMMERCIAL MORTGAGE BACKED SECURITIES | | $ | 194,801,868 | | |
| ASSET BACKED SECURITIES — 4.1% | |
| Cabela's Inc. | |
| 2008-1A Al — 4.31% 2013+ | | $ | 4,420,000 | | | $ | 4,452,089 | | |
| 2006-3A Al — 4.97% 2013+ | | | 3,635,000 | | | | 3,640,525 | | |
| 2006-3A Al — 5.26% 2014+ | | | 53,325,000 | | | | 55,292,160 | | |
| Case New Holland Wholesale Master Note Trust 2009-1A A (Floating) | |
| — 1.95734% 2015+ | | | 13,900,000 | | | | 14,098,214 | | |
| First National Bank of Omaha Master Note Trust 2009-1 A (Floating) | |
| — 1.60734% 2014 | | | 47,900,000 | | | | 47,997,716 | | |
| MassMutual Asset Finance LLC 2009-AA — 2.37% 2013+ | | | 42,290,000 | | | | 42,780,141 | | |
| TOTAL ASSET BACKED SECURITIES | | $ | 168,260,845 | | |
| MUNICIPAL BOND — 1.0% | |
| Irvine Ranch WTR RF-2 California — 8.18% 2014 | | $ | 40,150,000 | | | $ | 43,161,250 | | |
| U.S. AGENCIES — SHORT TERM — 0.9% | |
| Federal National Mortgage Association — 0.42% 2010 | | $ | 38,411,000 | | | $ | 38,400,702 | | |
| TOTAL U.S. AGENCIES — SHORT TERM | | $ | 38,400,702 | | |
| TOTAL INVESTMENT SECURITIES — 98.3% (Cost $4,056,306,525) | | $ | 4,074,866,678 | | |
| SHORT-TERM INVESTMENTS — 1.3% | |
| General Electric Capital Corporation — 0.15% 10/01/10 | | $ | 10,959,000 | | | $ | 10,959,000 | | |
| Exxon Mobil Corporation — 0.16% 10/05/10 | | | 44,000,000 | | | | 43,999,218 | | |
| TOTAL SHORT-TERM INVESTMENTS (Cost $54,958,218) | | $ | 54,958,218 | | |
| TOTAL INVESTMENTS — 99.6% (Cost $4,111,264,743) | | $ | 4,129,824,896 | | |
| Other assets and liabilities, net — 0.4% | | | 15,573,916 | | |
| TOTAL NET ASSETS — 100.0% | | $ | 4,145,398,812 | | |
+ Restricted securities. These restricted securities constituted 10.7% of total net assets at September 30, 2010.
* These securities have been valued in good faith by the Board of Directors in accordance with the Fund's fair value procedures. These securities constituted less than 1% of total net assets at September 30, 2010.
See notes to financial statements.
15
STATEMENT OF ASSETS AND LIABILITIES
September 30, 2010
| ASSETS | |
| Investments at value: | |
Investments securities-at market value
(identified cost $4,056,306,525) | | $ | 4,074,866,678 | | | | | | |
Short-term investments — at amortized cost
(maturities 60 days or less) | | | 54,958,218 | | | $ | 4,129,824,896 | | |
| Cash | | | | | | | 239 | | |
| Receivable for: | |
| Interest | | $ | 21,695,671 | | | | | | |
| Capital Stock sold | | | 10,833,860 | | | | | | |
| Investment securities sold | | | 1,061,692 | | | | 33,591,223 | | |
| | | | | | | $ | 4,163,416,358 | | |
| LIABILITIES | |
| Payable for: | |
| Capital stock repurchased | | $ | 14,429,562 | | | | | | |
| Advisory fees | | | 1,724,017 | | | | | | |
| Investment securities purchased | | | 1,680,997 | | | | | | |
| Accrued expenses and other liabilities | | | 182,970 | | | | 18,017,546 | | |
| NET ASSETS | | | | | | $ | 4,145,398,812 | | |
| SUMMARY OF SHAREHOLDERS' EQUITY | |
Capital Stock — par value $.01 per share; authorized
400,000,000 shares; outstanding 375,319,655 shares | | | | | | $ | 3,753,196 | | |
| Additional paid in capital | | | | | | | 4,156,003,810 | | |
| Accumulated net loss on investments | | | | | | | (68,362,465 | ) | |
| Undistributed net investment income | | | | | | | 35,444,117 | | |
| Unrealized appreciation of investments | | | | | | | 18,560,154 | | |
| Net assets at September 30, 2010 | | | | | | $ | 4,145,398,812 | | |
NET ASSET VALUE, REDEMPTION PRICE AND
MAXIMUM OFFERING PRICE PER SHARE | |
Net asset value and redemption price per share
(net assets divided by shares outstanding) | | | | | | $ | 11.04 | | |
Maximum offering price per share
(100/96.5 of per share net asset value) | | | | | | $ | 11.44 | | |
See notes to financial statements.
16
STATEMENT OF OPERATIONS
For the Year Ended September 30, 2010
| INVESTMENT INCOME | |
| Interest | | | | | | $ | 142,558,325 | | |
| EXPENSES — Note 4 | |
| Advisory fees | | $ | 19,925,925 | | | | | | |
| Transfer agent fees and expenses | | | 2,749,940 | | | | | | |
| Reports to shareholders | | | 338,944 | | | | | | |
| Registration fees | | | 272,507 | | | | | | |
| Custodian fees and expenses | | | 249,287 | | | | | | |
| Insurance | | | 108,692 | | | | | | |
| Directors' fees and expenses | | | 85,049 | | | | | | |
| Audit and tax services | | | 39,200 | | | | | | |
| Legal fees | | | 22,278 | | | | | | |
| Other expenses | | | 63,733 | | | | 23,855,555 | | |
| Net investment income | | | | | | $ | 118,702,770 | | |
| NET REALIZED AND UNREALIZED GAIN (LOSS) ON INVESTMENTS | |
| Net realized gain on investments: | |
Proceeds from sale of investment securities (excluding
short-term investments with maturities 60 days or less) | | $ | 3,440,709,658 | | | | | | |
| Cost of investment securities sold | | | 3,437,263,243 | | | | | | |
| Net realized gain on investments | | | | | | $ | 3,446,415 | | |
| Change in unrealized appreciation of investments: | |
| Unrealized appreciation at beginning of year | | $ | 25,601,743 | | | | | | |
| Unrealized appreciation at end of year | | | 18,437,688 | | | | | | |
| Decrease in unrealized appreciation of investments | | | | | | | (7,164,055 | ) | |
| Net realized and unrealized loss on investments | | | | | | $ | (3,717,640 | ) | |
| CHANGE IN NET ASSETS RESULTING FROM OPERATIONS | | | | | | $ | 114,985,130 | | |
See notes to financial statements.
17
STATEMENT OF CHANGES IN NET ASSETS
| | | For the Years Ended September 30, | |
| | | 2010 | | 2009 | |
| CHANGES IN NET ASSETS | |
| Operations: | |
| Net investment income | | $ | 118,702,770 | | | | | | | $ | 98,739,319 | | | | | | |
| Net realized gain on investments | | | 3,446,415 | | | | | | | | 4,903,612 | | | | | | |
Change in unrealized
appreciation of investments | | | (7,164,055 | ) | | | | | | | 15,575,521 | | | | | | |
Change in net assets resulting
from operations | | | | | | $ | 114,985,130 | | | | | | | $ | 119,218,452 | | |
Distributions to shareholders from
net investment income | | | | | | | (130,371,322 | ) | | | | | | | (99,674,974 | ) | |
| Capital stock transactions: | |
| Proceeds from capital stock sold | | $ | 1,719,869,415 | | | | | | | $ | 2,630,632,211 | | | | | | |
Proceeds from shares issued to
shareholders upon reinvestment
of dividends and distributions | | | 94,165,060 | | | | | | | | 68,856,109 | | | | | | |
| Cost of capital stock repurchased* | | | (1,466,717,348 | ) | | | 347,317,127 | | | | (1,091,702,315 | ) | | | 1,607,786,005 | | |
| Total change in net assets | | | | | | $ | 331,930,935 | | | | | | | $ | 1,627,329,483 | | |
| NET ASSETS | |
| Beginning of year | | | | | | | 3,813,467,877 | | | | | | | | 2,186,138,394 | | |
| End of year | | | | | | $ | 4,145,398,812 | | | | | | | $ | 3,813,467,877 | | |
CHANGE IN CAPITAL STOCK
OUTSTANDING | |
| Shares of capital stock sold | | | | | | | 156,179,682 | | | | | | | | 238,978,610 | | |
Shares issued to shareholders upon
reinvestment of dividends
and distributions | | | | | | | 8,580,977 | | | | | | | | 6,281,367 | | |
| Shares of capital stock repurchased | | | | | | | (133,264,136 | ) | | | | | | | (99,187,934 | ) | |
| Increase in capital stock outstanding | | | | | | | 31,496,523 | | | | | | | | 146,072,043 | | |
* Net of redemption fees of $233,657 and $302,273 for the years ended September 30, 2010, and 2009, respectively.
See notes to financial statements.
18
FINANCIAL HIGHLIGHTS
Selected Data for Each Share of Capital Stock Outstanding Throughout Each Year
| | | For the Year Ended September 30, | |
| | | 2010 | | 2009 | | 2008 | | 2007 | | 2006 | |
| Per share operating performance: | |
| Net asset value at beginning of year | | $ | 11.09 | | | $ | 11.06 | | | $ | 11.03 | | | $ | 10.99 | | | $ | 11.04 | | |
| Income from investment operations: | |
| Net investment income | | $ | 0.36 | | | $ | 0.36 | | | $ | 0.47 | | | $ | 0.50 | | | $ | 0.53 | | |
Net realized and unrealized gain (loss) on
investment securities | | | (0.04 | ) | | | 0.08 | | | | 0.05 | | | | 0.07 | | | | (0.04 | ) | |
| Total from investment operations | | $ | 0.32 | | | $ | 0.44 | | | $ | 0.52 | | | $ | 0.57 | | | $ | 0.49 | | |
| Less dividends from net investment income | | $ | (0.37 | ) | | $ | (0.41 | ) | | $ | (0.49 | ) | | $ | (0.53 | ) | | $ | (0.54 | ) | |
| Redemption fees | | | — | * | | | — | * | | | — | * | | | — | * | | | — | * | |
| Net asset value at end of year | | $ | 11.04 | | | $ | 11.09 | | | $ | 11.06 | | | $ | 11.03 | | | $ | 10.99 | | |
| Total investment return** | | | 2.90 | % | | | 4.03 | % | | | 4.84 | % | | | 5.36 | % | | | 4.59 | % | |
| Ratios/supplemental data: | |
| Net assets at end of year (in $000's) | | $ | 4,145,399 | | | $ | 3,813,468 | | | $ | 2,186,138 | | | $ | 1,832,030 | | | $ | 1,819,107 | | |
| Ratio of expenses to average net assets | | | 0.60 | % | | | 0.60 | % | | | 0.61 | % | | | 0.62 | % | | | 0.62 | % | |
Ratio of net investment income to average
net assets | | | 2.98 | % | | | 3.20 | % | | | 4.21 | % | | | 4.31 | % | | | 4.68 | % | |
| Portfolio turnover rate | | | 78 | % | | | 64 | % | | | 32 | % | | | 53 | % | | | 60 | % | |
* Rounds to less than $0.01 per share.
** Return is based on net asset value per share, adjusted for reinvestment of distributions, and does not reflect deduction of the sales charge
See notes to financial statements.
19
NOTES TO FINANCIAL STATEMENTS
September 30, 2010
NOTE 1 — Significant Accounting Policies
The Fund is registered under the Investment Company Act of 1940 as a diversified, open-end, management investment company. The Fund's primary investment objective is to seek current income and long-term total return. The following is a summary of significant accounting policies consistently followed by the Fund in the preparation of its financial statements.
A. Security Valuation
The Fund values securities pursuant to policies and procedures approved by the Board of Directors. Securities listed or traded on a national securities exchange are valued at the last sale price. If there was not a sale that day, these securities are valued at the last bid price. Securities traded on the NASDAQ National Market System are valued at the NASDAQ Official Closing Price on the last business day of the year, or if there was not a sale that day, at the last bid price. Unlisted securities and securities listed on a national securities exchange for which the over-the-counter market more accurately reflects the securities' value in the judgment of the Fund's officers, are valued at the most recent bid price or other ascertainable market value. The Fund receives pricing information from independent pricing vendors that also use information provided by market makers or estimates of values obtained from data relating to securities with si milar characteristics. Short-term investments with maturities of 60 days or less are valued at amortized cost which approximates market value. Securities for which market quotations are not readily available from the sources above are valued at fair value as determined in good faith by, or under the direction of, the Board of Directors.
B. Securities Transactions and Related Investment Income
Securities transactions are accounted for on the date the securities are purchased or sold. Dividend income and distributions to shareholders are recorded on the ex-dividend date. Interest income and expenses are recorded on an accrual basis. Market discounts and premiums on fixed income securities are amortized over the expected life of the securities. Realized gains or losses are based on the specific identification method.
C. Use of Estimates
The preparation of financial statements in conformity with accounting principles generally accepted in the United States requires management to make estimates and assumptions that affect the amounts reported. Actual results could differ from these estimates.
NOTE 2 — Risk Considerations
Investing in the Fund may involve certain risks including, but not limited to, those described below.
Market Risk: Because the values of the Fund's investments will fluctuate with market conditions, so will the value of your investment in the Fund. You could lose money on your investment in the Fund or the Fund could underperform other investments.
Interest Rate Risk: The values of, and the income generated by, most debt securities held by the Fund may be affected by changing interest rates and by changes in the effective maturities and credit ratings of these securities. For example, the values of debt securities in the Fund's portfolio generally will decline when interest rates rise and increase when interest rates fall. In addition, falling interest rates may cause an issuer to redeem, call or refinance a security before its stated maturity, which may result in the Fund having to reinvest the proceeds in lower yielding securities.
Mortgage-Backed and Other Asset-Backed Securities Risk: The values of some mortgaged-backed and other asset-backed securities may expose the Fund to a lower rate of return upon reinvestment of principal. When
20
NOTES TO FINANCIAL STATEMENTS
Continued
interest rates rise, the value of mortgage-related securities generally will decline; however, when interest rates are declining, the value of mortgage related-securities with prepayment features may not increase as much as other fixed income securities. The rate of prepayments on underlying mortgages will affect the price and volatility of a mortgage-related security, and may shorten or extend the effective maturity of the security beyond what was anticipated at the time of purchase. If an unanticipated rate of prepayment on underlying mortgages increases the effective maturity of a mortgage-related security, the volatility of the security can be expected to increase. The value of these securities may also fluctuate in response to the market's perception of the creditworthiness of the issuers. Additionally, although mortgages and mortgage-related securities are generally supported by some form of government or private guarantee and/or insur ance, there is no assurance that private guarantors or insurers will meet their obligations.
Stripped Mortgage-Backed Interest Only ("I/O") and Principal Only ("P/O") Securities: Stripped mortgage-backed securities are usually structured with two classes that receive different proportions of the interest and principal distributions on a pool of mortgage assets. In certain cases, one class will receive all of the interest payments on the underlying mortgages (the I/O class), while the other class will receive all of the principal payments (the P/O class). The Fund is currently has investments in I/O securities. The yield to maturity on IOs is sensitive to the rate of principal repayments (including prepayments) on the related underlying mortgage assets, and principal payments may have a material effect on yield to maturity. If the underlying mortgage assets experience greater than anticipated prepayments of principal, a Fund may not fully recoup its initial investment in I/Os.
Credit Risk: The values of any of the Fund's investments may also decline in response to events affecting the issuer or its credit rating. The lower rated debt securities in which the Fund may invest are considered speculative and are generally subject to greater volatility and risk of loss than investment grade securities, particularly in deteriorating economic conditions. The Fund invests a significant portion of its assets in securities of issuers that hold mortgage- and asset-backed securities and direct investments in securities backed by commercial and residential mortgage loans and other financial assets. The value and related income of these securities is sensitive to changes in economic conditions, including delinquencies and/or defaults. Though the Fund has not been adversely impacted, continuing shifts in the market's perception of credit quality on securities backed by commercial and residential mortgage loans and other financial assets may result in increased volatility of market price and periods of illiquidity that can negatively impact the valuation of certain securities held by the Fund.
NOTE 3 — Purchases of Investment Securities
Cost of purchases of investment securities (excluding short-term investments with maturities of 60 days or less) aggregated $4,106,040,306 for the year ended September 30, 2010.
NOTE 4 — Advisory Fees and Other Affiliated Transactions
Pursuant to an Investment Advisory Agreement, advisory fees were paid by the Fund to First Pacific Advisors, LLC (the "Adviser"). Under the terms of this agreement, the Fund pays the Adviser a monthly fee calculated at the annual rate of 0.5% of the average daily net assets of the Fund. The Agreement obligates the Adviser to reduce its fee to the extent necessary to reimburse the Fund for any annual expenses (exclusive of interest, taxes, the cost of any supplemental statistical and research information, and extraordinary expenses such as litigation) in excess of 11/2% of the first $15 million and 1% of the remaining average net assets o f the Fund for the year.
For the year ended September 30, 2010, the Fund paid aggregate fees of $83,667 to all Directors who are not interested persons of the Adviser. Certain officers of the Fund are also officers of the Adviser and FPA Fund Distributors, Inc.
21
NOTES TO FINANCIAL STATEMENTS
Continued
NOTE 5 — Federal Income Tax
No provision for federal income tax is required because the Fund has elected to be taxed as a "regulated investment company" under the Internal Revenue Code and intends to maintain this qualification and to distribute each year to its shareholders, in accordance with the minimum distribution requirements of the Code, all of its taxable net investment income and taxable net realized gains on investments.
Distributions paid to shareholders are based on net investment income and net realized gains determined on a tax reporting basis, which may differ from financial reporting. For federal income tax purposes, the components of distributable earnings at September 30, 2010, were as follows:
| Undistributed net investment income | | $ | 45,094,586 | | |
The tax status of dividends paid during fiscal years ended September 30, 2010 and 2009 were as follows:
| | | 2010 | | 2009 | |
| Dividends from ordinary income | | $ | 130,371,322 | | | $ | 99,674,974 | | |
Accumulated net realized losses of $60,713,012 can be carried forward to offset future gains. The ability to carry these losses forward expires as follows: $11,767,908 in 2012, $7,719,581 in 2013, $20,873,466 in 2014, $16,390,845 in 2015, $299,496 in 2017, and $3,661,716 in 2018.
The cost of investment securities at September 30, 2010 for federal income tax purposes was $4,065,956,995. Gross unrealized appreciation and depreciation for all securities at September 30, 2010 for federal income tax purposes was $50,487,595 and $41,577,912, respectively, resulting in net unrealized appreciation of $8,909,683. As of and during the year ended September 30, 2010, the Fund did not have any liability for unrecognized tax benefits. The Fund recognizes interest and penalties, if any, related to unrecognized tax benefits as income tax expense in the Statement of Operations. During the period, the Fund did not incur any interest or penalties. The Fund is not subject to examination by U.S. federal tax authorities for years ended before September 30, 2007 or by state tax authorities for years ended before September 30, 2006.
During the year ended September 30, 2010, the Fund reclassified $13,237,797 of net amounts relating to losses recorded on paydowns from mortgage- and other asset-backed securities, from accumulated net loss to undistributed net investment income to align financial reporting with tax reporting.
NOTE 6 — Distributor
For the year ended September 30, 2010, FPA Fund Distributors, Inc. ("Distributor"), a wholly owned subsidiary of the Adviser, received $127,725 in net Fund share sales commissions after reallowance to other dealers. The Distributor pays its own overhead and general administrative expenses, the cost of supplemental sales literature, promotion and advertising.
NOTE 7 — Redemption Fees
A redemption fee of 2% applies to redemptions within 90 days of purchase for certain purchases made by persons eligible to purchase shares without an initial sales charge. For the year ended September 30, 2010, the Fund collected $233,657 in redemption fees, which amounted to less than $0.01 per share.
NOTE 8 — Disclosure of Fair Value Measurements
The Fund classifies its assets based on three valuation methodologies. Level 1 investment securities are valued based on quoted market prices in active markets for identical assets. Level 2 investment securities are valued based on significant observable market inputs, such as quoted prices for similar assets and quoted prices in inactive markets or other market observable inputs. Level 3 investment securities are valued using significant
22
NOTES TO FINANCIAL STATEMENTS
Continued
unobservable inputs that reflect the Fund's determination of assumptions that market participants might reasonably use in valuing the assets. The valuation levels are not necessarily an indication of the risk associated with investing in those securities. The following table presents the valuation levels of the Fund's investments as of September 30, 2010:
| Investments | | Level 1 | | Level 2 | | Level 3 | | Total | |
| Bonds & Debentures | |
| U.S. Treasury | | $ | 1,168,430,323 | | | | — | | | | — | | | $ | 1,168,430,323 | | |
| Mortgage-Backed | | | — | | | $ | 849,483,303 | | | $ | 19,501,935 | | | | 868,985,238 | | |
| Mortgage Pass-Through | | | — | | | | 545,639,208 | | | | — | | | | 545,639,208 | | |
| Corporate | | | — | | | | 497,272,128 | | | | — | | | | 497,272,128 | | |
| U.S. Agencies | | | | | | | 303,186,315 | | | | — | | | | 303,186,315 | | |
| Stripped Mortgage-Backed | | | — | | | | 246,728,801 | | | | — | | | | 246,728,801 | | |
| Commercial Mortgage-Backed | | | — | | | | 194,801,868 | | | | — | | | | 194,801,868 | | |
| Asset-Backed | | | | | | | 168,260,845 | | | | | | | | 168,260,845 | | |
| Municipal | | | — | | | | 43,161,250 | | | | — | | | | 43,161,250 | | |
| Short-Term U.S. Agencies | | | 38,400,702 | | | | — | | | | — | | | | 38,400,702 | | |
| Short-Term Investments | | | — | | | | 54,958,218 | | | | — | | | | 54,958,218 | | |
| Total Investments | | $ | 1,206,831,025 | | | $ | 2,903,491,936 | | | $ | 19,501,935 | | | $ | 4,129,824,896 | | |
The following table summarizes the Fund's Level 3 investment securities and related transactions during the year ended September 30, 2010:
| Investments | | Beginning
Value at
September 30,
2009 | | Net Realized and
Unrealized Gains
(Losses)* | | Net
Purchases
(Sales) | | Net
Transfers
In (Out) | | Ending
Value at
September 30,
2010 | |
| Mortgage-Backed | | $ | — | | | $ | 96,662 | | | $ | 19,405,273 | | | $ | — | | | $ | 19,501,935 | | |
* Net realized and unrealized gains (losses) are included in the related amounts in the statement of operations.
NOTE 9 — Subsequent Events
As of the date the financial statements were available to be issued, no subsequent events or transactions had occurred that would have materially impacted the financial statements as presented.
NOTE 10 — Distribution to Shareholders
On September 30, 2010, the Board of Directors declared a dividend from net investment income of $0.105 per share payable October 6, 2010 to shareholders of record on September 30, 2010. For financial statement purposes, this dividend was recorded on the ex-dividend date, October 1, 2010.
23
NOTES TO FINANCIAL STATEMENTS
Continued
NOTE 11 — New Accounting Pronouncement
In January 2010, the FASB issued ASU No. 2010-06, Improving Disclosures about Fair Value Measurements, which, among other things, amends ASC 820 to require entities to separately present purchases, sales, issuances, and settlements in their reconciliation of Level 3 fair value measurements (i.e., to present such items on a gross basis rather than on a net basis) and which clarifies existing disclosure requirements provided by ASC 820 regarding the level of disaggregation and the inputs and valuation techniques used to measure fair value for measurements that fall within either Level 2 or Level 3 of the fair value hierarchy. ASU 2010-06 is effective for interim and annual periods beginning after December 15, 2009, except for the disclosures about purchases, sales, issuances, and settlements in the rollforward of activity in Level 3 fair value measurements (which are effective for fiscal years beginning after December 15, 2010, and for interim periods within those fiscal years). The Adviser is currently assessing the impact that the adoption of ASU 2010-06 will have on the Fund's financial statement disclosures.
24
REPORT OF INDEPENDENT REGISTERED
PUBLIC ACCOUNTING FIRM
TO THE SHAREHOLDERS AND
BOARD OF DIRECTORS OF FPA NEW INCOME, INC.
We have audited the accompanying statement of assets and liabilities of FPA New Income, Inc. (the "Fund"), including the portfolio of investments, as of September 30, 2010, the related statement of operations for the year then ended, the statements of changes in net assets for each of the two years in the period then ended, and financial highlights for each of the five years in the period then ended. These financial statements and financial highlights are the responsibility of the Fund's management. Our responsibility is to express an opinion on these financial statements and financial highlights based on our audits.
We conducted our audits in accordance with standards of the Public Company Accounting Oversight Board (United States). Those standards require that we plan and perform the audit to obtain reasonable assurance about whether the financial statements and financial highlights are free of material misstatement. The Fund is not required to have, nor were we engaged to perform, an audit of its internal control over financial reporting. Our audits included consideration of internal control over financial reporting as a basis for designing audit procedures that are appropriate in the circumstances, but not for the purpose of expressing an opinion on the effectiveness of the Fund's internal control over financial reporting. Accordingly, we express no such opinion. An audit also includes examining, on a test basis, evidence supporting the amounts and disclosures in the financial statements, assessing the accounting principles used and significant estim ates made by management, as well as evaluating the overall financial statement presentation. Our procedures included confirmation of securities owned as of September 30, 2010, by correspondence with the custodian and brokers, where replies were not received from brokers, we performed other auditing procedures. We believe that our audits provide a reasonable basis for our opinion.
In our opinion, the 2010 financial statements and financial highlights referred to above present fairly, in all material respects, the financial position of FPA New Income, Inc. as of September 30, 2010, the results of its operations for the year then ended, the changes in its net assets for each of the two years in the period then ended, and the financial highlights for each of the five years in the period then ended, in conformity with accounting principles generally accepted in the United States of America.
Los Angeles, California
November 12, 2010
25
RENEWAL OF THE INVESTMENT ADVISORY AGREEMENT
Approval of the Advisory Agreement. At a meeting of the Board of Directors held on August 3, 2010, the Directors approved the continuation of the advisory agreement between the Fund and the Adviser for an additional one-year period through September 30, 2011, on the recommendation of the Independent Directors who met in executive session on August 3, 2010 prior to the Board meeting to review and discuss the proposed continuation of the advisory agreement. The following paragraphs summarize the material information and factors considered by the Board and the Independent Directors as well as the Directors' conclusions relative to such factors.
Nature, Extent and Quality of Services. The Board and the Independent Directors considered information regarding the Adviser and its staffing in connection with the Fund, including the Fund's portfolio managers, the senior analysts supporting team, the scope of accounting, administrative, shareholder and other services supervised and provided by the Adviser, and the absence of any significant service problems reported to the Board. The Board and the Independent Directors noted the experience, length of service and the outstanding reputation of the Fund's Portfolio managers; Tom Atteberry, who has been with the Adviser since 1997 and Robert Rodriguez, who has managed the Fund since 1984, The Directors concluded that the nature, extent and quality of services provided by the Adviser have benefited and should continue to benefit the Fund and its shareholders.
Investment Performance. The Board and the Independent Directors reviewed the overall investment performance of the Fund. They also received information from an independent consultant, Lipper Analytical Services, Inc. ("Lipper"), regarding the Fund's performance relative to a peer group of A-rated corporate debt value funds selected by Lipper (the "Peer Group"). The Board and the Independent Directors noted the Fund's competitive long-term investment performance when compared to the Peer Group. They further concluded that the Adviser's continued management of the Fund should benefit the Fund and its shareholders.
Advisory Fees and Fund Expenses; Adviser Profitability; Economies of Scale and Sharing of Economies of Scale. The Board and the Independent Directors were provided information by the Adviser to enable consideration of the Fund's advisory fees and total expense levels, as well as the overall profitability of the Adviser, the benefits to the Adviser from its relationship to the Fund, the extent to which economies of scale with respect to the management of the Fund, if any, would be realized, and whether the Fund is sharing, or will share, in those economies.
The Board and the Independent Directors reviewed comparative information relative to fees and expenses for the mutual fund industry generally and for the Peer Group. The Board and the Independent Directors noted that the Fund's fees and expenses were at the lower end of the range for the Peer Group. The Board and the Independent Directors noted that the overall expense ratio of the Fund was also low when compared to the Peer Group. The Board and the Independent Directors concluded that the overall fee rate was reasonable and fair to the Fund and its shareholders in light of the nature and quality of the services provided by the Adviser.
The Board and the Independent Directors considered whether there have been economies of scale with respect to the management of the Fund, whether the Fund has appropriately benefited from any economies of scale, and whether the fee rate is reasonable in relation to the Fund's assets and any economies of scale that may exist. The Board and the Independent Directors expressed concern that the fee rate does not have any breakpoints. The mutual fund industry has trended toward funds having breakpoints in the advisory fee structure as a means by which to share in economies of scale as a fund's assets grow; however, not all funds have breakpoints in their fee structures. The Adviser indicated its belief that additional breakpoints currently were not appropriate for the Fund and that no meaningful income and expense forecasts for its business could be prepared given uncertainties regarding the direction of the economy, rising inflation, increasing costs for personnel and
26
RENEWAL OF THE INVESTMENT ADVISORY AGREEMENT
Continued
systems, and growth (or not) in the Fund's assets, all of which could negatively impact the Adviser. The Board and the Independent Directors noted that the Adviser had not increased the fee rate charged to the Fund despite the Adviser's claims of increases in the Adviser's internal costs of providing investment management services to the Fund, in part due to administrative burdens and expenses resulting from recent legislative and regulatory actions. According to the Adviser, such increased costs have included investments in analysts who assist with the management of the Fund, additions to administrative personnel and systems that enhance the quality of services provided to the Fund and the continued employment of a full-time Chief Compliance Officer and his assistant.
Conclusions. The Board and the Independent Directors determined that the Fund continues to benefit from the services of a highly experienced portfolio management team that has produced competitive long-term returns. In addition, the Board and the Independent Directors agreed that the Fund continues to receive high quality accounting, administrative, shareholder and other ancillary services from the Adviser. The Board and the Independent Directors acknowledged that there is no uniform industry methodology to measure or apply economies of scale. The Board and the Independent Directors determined that the Fund's expense ratio, the overall profitability of the Adviser, and the sharing of economies of scale with the Fund are fair and reasonable under the current circumstances. The Board and the Ind ependent Directors also stated their intention to continue monitoring the factors relevant to the Adviser's compensation, such as changes in the Fund's asset levels, changes in portfolio management personnel and the cost and quality of the services provided by the Adviser to the Fund. On the basis of the foregoing, and without assigning particular weight to any single factor, the Board and the Independent Directors determined to approve the continuation of the current advisory agreement for an additional one-year period through September 30, 2011.
27
SHAREHOLDER EXPENSE EXAMPLE
September 30, 2010
(Unaudited)
Fund Expenses
As a shareholder of the Fund, you incur two types of costs: (1) transaction costs, and (2) ongoing costs, including advisory and administrative fees; shareholder service fees; and other Fund expenses. The Example is intended to help you understand your ongoing costs (in dollars) of investing in the Fund and to compare these costs with the ongoing costs of investing in other mutual funds. The Example is based on an investment of $1,000 invested at the beginning of the year and held for the entire year.
Actual Expenses
The information in the table under the heading "Actual Performance" provides information about actual account values and actual expenses. You may use the information in this column, together with the amount you invested, to estimate the expenses that you paid over the period. Simply divide your account value by $1,000 (for example, an $8,600 account value divided by $1,000= 8.6), then multiply the result by the number in the first column in the row entitled "Expenses Paid During Period" to estimate the expenses you paid on your account during this period.
Hypothetical Example for Comparison Purposes
The information in the table under the heading "Hypothetical Performance (5% return before expenses)" provides information about hypothetical account values and hypothetical expenses based on the Fund's actual expense ratio and an assumed rate of return of 5% per year before expenses, which is not the Fund's actual return. The hypothetical account values and expenses may not be used to estimate the actual ending account balance or expenses you paid for the period. You may use this information to compare the ongoing costs of investing in the Fund and other funds. To do so, compare this 5% hypothetical example with the 5% hypothetical examples that appear in the shareholder reports of other funds.
Please note that the expenses shown in the table are meant to highlight your ongoing costs only and do not reflect any transactional costs. Therefore, the information under the heading "Hypothetical Performance (5% return before expenses)" is useful in comparing ongoing costs only, and will not help you determine the relative total costs of owning different funds. In addition, if these transactional costs were included, your costs would have been higher.
| | | Actual
Performance | | Hypothetical
Performance
(5% return
before
expenses) | |
Beginning Account Value
March 31, 2010 | | $ | 1,000.00 | | | $ | 1,000.00 | | |
Ending Account Value
September 30, 2010 | | $ | 1,015.57 | | | $ | 1,021.95 | | |
Expenses Paid During
Period* | | $ | 3.03 | | | $ | 3.05 | | |
* Expenses are equal to the Fund's annualized expense ratio of 0.60%, multiplied by the average account value over the period and prorated for the six-months ended September 30, 2010 (183/365 days).
28
DIRECTOR AND OFFICER INFORMATION
| Name, Age & Address | | Position(s)
With Fund/
Years Served | | Principal Occupation(s)
During the Past 5 Years | | Portfolios in
Fund Complex
Overseen | | Other Directorships | |
| Willard H. Altman, Jr. – (75)* | | Director and Chairman†
Years Served: 12 | | Retired. Formerly, until 1995, Partner of Ernst & Young LLP, a public accounting firm. | | | 6 | | | | |
|
| Thomas P. Merrick – (73)* | | Director†
Years Served: 1 | | Private Consultant. President of Strategic Planning Consultants for more than the past five years. Former Executive Committee Member and Vice President of Fluor Corporation, responsible for strategic planning, from 1984 to 1998. | | | 6 | | | | |
|
| Alfred E. Osborne, Jr. – (65)* | | Director†
Years Served: 11 | | Senior Associate Dean of the John E. Anderson School of Management at UCLA. | | | 3 | | | Investment Directors Council, Wedbush, Inc., Kaiser Aluminum Corporation, and Heckmann Corporation. | |
|
| Patrick B. Purcell – (67)* | | Director†
Years Served: 4 | | Retired. Formerly Consultant from March 1998 to August 2000, and Executive Vice President, Chief Financial Officer and Chief Administrative Officer from 1989 to March 1998, of Paramount Pictures. | | | 4 | | | The Ocean Conservancy and The Motion Picture and Television Fund | |
|
| Allan M. Rudnick – (69)* | | Director†
Years Served: <1 | | Private Investor. Formerly, Co-Founder,
Chief Executive Officer, Chairman and
Chief Investment Officer of Kayne Anderson Rudnick Investment Management from 1989 to 2007 | | | 3 | | | California Council on Economic Education | |
|
| Robert L. Rodriguez – (61) | | Director†
Portfolio Manager
Years Served: 26 | | Chief Executive Officer of the Adviser. | | | 2 | | | FPA Fund Distributors, Inc. | |
|
| Thomas H. Atteberry – (57) | | Chief Executive Officer & Portfolio Manager
Years Served: 5 | | Partner of the Adviser. Formerly Vice President of First Pacific Advisors, Inc. from 1997 to 2006. | | | | | | | |
|
| Eric S. Ende – (66) | | Vice President
Years Served: 25 | | Partner of the Adviser. Formerly Senior Vice President of First Pacific Advisors, Inc. from 1983 to 2006. | | | 3 | | | | |
|
| J. Richard Atwood – (50) | | Treasurer
Years Served: 13 | | Chief Operating Officer of the Adviser. President and Chief Executive Officer of FPA Fund Distributors, Inc. | | | | | | FPA Fund Distributors, Inc. | |
|
| Christopher H. Thomas – (53) | | Chief Compliance Officer
Years Served: 15 | | Vice President and Chief Compliance Officer of the Adviser and Vice President of FPA Fund Distributors, Inc. | | | | | | FPA Fund Distributors, Inc. | |
|
| Sherry Sasaki – (55) | | Secretary
Years Served: 27 | | Assistant Vice President and Secretary of the Adviser and Secretary of FPA Fund Distributors, Inc. | | | | | | | |
|
| E. Lake Setzler – (43) | | Assistant Treasurer
Years Served: 4 | | Vice President and Controller of the Adviser since 2005. Formerly Chief Operating Officer of Inflective Asset Management, LLC (2004-2005) and Vice President of Transamerica Investment Management, LLC (2000-2004). | | | | | | | |
|
† Directors serve until their resignation, removal or retirement.
* Audit Committee member
Additional information on the Directors is available in the Statement of Additional Information. Each of the above listed individuals can be contacted at 11400 W. Olympic Blvd., Suite 1200, Los Angeles, CA 90064.
29
FPA NEW INCOME, INC.
INVESTMENT ADVISER
First Pacific Advisors, LLC
11400 West Olympic Boulevard, Suite 1200
Los Angeles, California 90064
DISTRIBUTOR
FPA Fund Distributors, Inc.
11400 West Olympic Boulevard, Suite 1200
Los Angeles, California 90064
COUNSEL
O'Melveny & Myers LLP
Los Angeles, California
TICKER: FPNIX
CUSIP: 302544101
INDEPENDENT REGISTERED PUBLIC ACCOUNTING FIRM
Deloitte & Touche LLP
Los Angeles, California
CUSTODIAN & TRANSFER AGENT
State Street Bank and Trust Company
Boston, Massachusetts
SHAREHOLDER SERVICE AGENT
Boston Financial Data Services, Inc.
P.O. Box 8500
Boston, Massachusetts 02266-8500
30 Dan Road
Canton, MA 02021-2809
(800) 638-3060
(617) 483-5000
This report has been prepared for the information of shareholders of FPA New Income, Inc., and is not authorized for distribution to prospective investors unless preceded or accompanied by a prospectus.
The Fund's complete proxy voting record for the 12 months ended June 30, 2010 is available without charge, upon request, by calling (800) 982-4372 and on the SEC's website at www.sec.gov.
The Fund's schedule of portfolio holdings, filed the first and third quarter of the Fund's fiscal year on Form N-Q with the SEC, is available on the SEC's website at www.sec.gov. Form N-Q is available at the SEC's Public Reference Room in Washington, D.C., and information on the operations of the Public Reference Room may be obtained by calling (202) 942-8090. To obtain information on Form N-Q from the Fund, shareholders can call (800) 982-4372.
Additional information about the Fund is available online at www.fpafunds.com. This information includes, among other things, holdings, top sectors and performance, and is updated on or about the 15th business day after the end of each quarter.
Item 2. | Code of Ethics. |
| |
| (a) | The registrant has adopted a code of ethics that applies to the registrant’s principal executive and financial officers. |
| | |
| (b) | Not Applicable |
| | |
| (c) | During the period covered by this report, there were not any amendments to the provisions of the code of ethics adopted in 2(a) above. |
| | |
| (d) | During the period covered by this report, there were not any implicit or explicit waivers to the provisions of the code of ethics adopted in 2(a). |
| | |
| (e) | Not Applicable |
| | |
| (f) | A copy of the registrant’s code of ethics is filed as an exhibit to this Form N-CSR. Upon request, any person may obtain a copy of this code of ethics, without charge, by calling (800) 982-4372. |
| |
Item 3. | Audit Committee Financial Expert. |
| |
| The registrant’s board of directors has determined that Willard H. Altman, Jr. and Patrick B. Purcell, each of whom is a member of the registrant’s audit committee and board of directors, is an “audit committee financial expert” and is “independent,” as those terms are defined in this Item. This designation will not increase the designees’ duties, obligations or liability as compared to each of their duties, obligations and liability as a member of the audit committee and of the board of directors. This designation does not affect the duties, obligations or liability of any other member of the audit committee or the board of directors. |
| |
Item 4. | Principal Accountant Fees and Services. |
| |
| | | | 2009 | | 2010 | |
| (a) | Audit Fees | | $ | 39,200 | | $ | 40,300 | |
| (b) | Audit Related Fees | | -0- | | -0- | |
| (c) | Tax Fees | | $ | 7,100 | | $ | 7,100 | |
| (d) | All Other Fees | | -0- | | -0- | |
| | |
| (e)(1) | Disclose the audit committee’s pre-approval policies and procedures described in paragraph (c)(7) of Rule 2-01 of Regulation S-X. The audit committee shall pre-approve all audit and permissible non-audit services that the committee considers compatible with maintaining the independent auditors’ independence. The pre-approval requirement will extend to all non-audit services provided to the registrant, the adviser, and any entity controlling, controlled by, or under common control with the adviser that provides ongoing services to the registrant, if the |
| | | | | | | | | | |
| | engagement relates directly to the operations and financial reporting of the registrant; provided, however, that an engagement of the registrant’s independent auditors to perform attest services for the registrant, the adviser or its affiliates required by generally accepted auditing standards to complete the examination of the registrant’s financial statements (such as an examination conducted in accordance with Statement on Auditing Standards Number 70 issued by the American Institute of Certified Public Accountants), will be deem pre-approved if: (i) the registrant’s independent auditors inform the audit committee of the engagement, (ii) the registrant’s independent auditors advise the audit committee at least annually that the performance of this engagement will not impair the independent auditor’s independence with respect to the registrant, and (iii) the audit committee receives a copy of the independent auditor’s report prepared in connection with such services. The committee may delegate to one or more committee members the authority to review and pre-approve audit and permissible non-audit services. Actions taken under any such delegation will be reported to the full committee at its next meeting. |
| | |
| (e)(2) | Disclose the percentage of services described in each of paragraphs (b) – (d) of this Item that were approved by the audit committee pursuant to paragraph (c)(7)(i)(C) of Rule 2-01 of Regulation S-X. 100% of the services provided to the registrant described in paragraphs (b) – (d) of this Item were pre-approved by the audit committee pursuant to paragraph (e)(1) of this Item. There were no services provided to the investment adviser or any entity controlling, controlled by or under common control with the adviser described in paragraphs (b) – (d) of this Item that were required to be pre-approved by the audit committee. |
| | |
| (f) | If greater than 50%, disclose the percentage of hours expended on the principal accountant’s engagement to audit the registrant’s financial statements for the most recent fiscal year that were attributed to work performed by persons other than the principal accountant’s full-time, permanent employees. All services performed on the engagement to audit the registrant’s financial statements for the most recent fiscal year end were performed by the principal accountant’s full-time, permanent employees. |
| | |
| (g) | Disclose the aggregate non-audit fees billed by the registrant’s accountant for services rendered to the registrant, and rendered to the registrant’s investment adviser (not including any sub-adviser whose role is primarily portfolio management and is subcontracted with or overseen by another investment adviser), and any entity controlling, controlled by, or under common control with the adviser that provides ongoing services to the registrant for each of the last two fiscal years of the registrant. None. |
| (h) | Disclose whether the registrant’s audit committee of the board of directors has considered whether the provision of non-audit services that were rendered to the registrant’s investment adviser (not including any sub-adviser whose role is primarily portfolio management and is subcontracted with or overseen by another investment adviser), and any entity controlling, controlled by, or under common control with the investment adviser that provides ongoing services to the registrant that were not pre-approved pursuant to paragraph (c)(7)(ii) of Rule 2-01 of Regulation S-X is compatible with maintaining the principal accountant’s independence. Not Applicable. |
| |
Item 5. | Audit Committee of Listed Registrants. Not Applicable. |
| |
Item 6. | Schedule of Investments. The schedule of investments is included as part of the report to stockholders filed under Item 1 of this Form. |
| |
Item 7. | Disclosure of Proxy Voting Policies and Procedures for Closed-End Management Investment Companies. Not Applicable. |
| |
Item 8. | Portfolio Managers of Closed-End Management Investment Companies. Not Applicable. |
| |
Item 9. | Purchases of Equity Securities by Closed-End Management Investment Company and Affiliated Purchasers. Not Applicable. |
| |
Item 10. | Submission of Matters to a Vote of Security Holders. There has been no material change to the procedures by which shareholders may recommend nominees to the registrant’s board of directors. |
| |
Item 11. | Controls and Procedures. |
| | |
| (a) | The principal executive officer and principal financial officer of the registrant have concluded that the registrant’s disclosure controls and procedures (as defined in Rule 30a-3(c) under the Investment Company Act of 1940) are effective based on their evaluation of the disclosure controls and procedures as of a date within 90 days of the filing date of this report. |
| | |
| (b) | There have been no significant changes in the registrant’s internal controls over financial reporting (as defined in Rule 30a-3(d) under the Investment Company Act of 1940) that occurred during the second fiscal quarter of the period covered by this report that have materially affected, or is reasonably likely to materially affect, the registrant’s internal controls over financial reporting. |
Item 12. | Exhibits. |
| | |
| (a)(1) | Code of ethics as applies to the registrant’s officers and directors, as required to be disclosed under Item 2 of Form N-CSR. Attached hereto as Ex.99.CODE.ETH. |
| | |
| (a)(2) | Separate certification for the registrant’s principal executive officer and principal financial officer, as required by Rule 30a-2(a) under the Investment Company Act of 1940. Attached hereto. |
| | |
| (a)(3) | Not Applicable |
| | |
| (b) | Separate certification for the registrant’s principal executive officer and principal financial officer, as required by Rule 30a-2(b) under the Investment Company Act of 1940. Attached hereto. |
SIGNATURES
Pursuant to the requirements of the Securities Exchange Act of 1934 and the Investment Company Act of 1940, the registrant has duly caused this report to be signed on its behalf by the undersigned, thereunto duly authorized.
FPA NEW INCOME, INC.
By: | /s/ THOMAS H. ATTEBERRY | |
Thomas H. Atteberry, Chief Executive Officer |
(Principal Executive Officer) |
Date: November 24, 2010
Pursuant to the requirements of the Securities Exchange Act of 1934 and the Investment Company Act of 1940, this report has been signed below by the following persons on behalf of the registrant and in the capacities and on the dates indicated.
FPA NEW INCOME, INC.
By: | /s/ THOMAS H. ATTEBERRY | |
Thomas H. Atteberry, Chief Executive Officer |
(Principal Executive Officer) |
Date: November 24, 2010
By: | /s/ J. RICHARD ATWOOD | |
J. Richard Atwood, Treasurer |
(Principal Financial Officer) |
Date: November 24, 2010