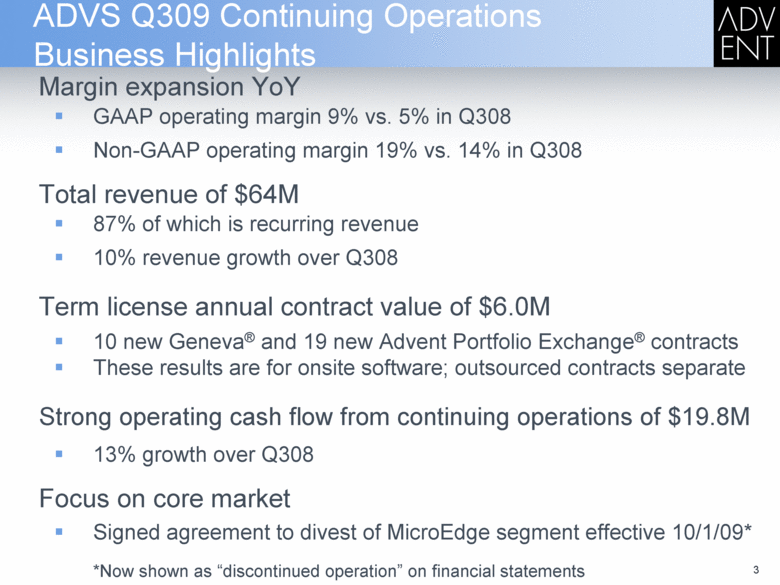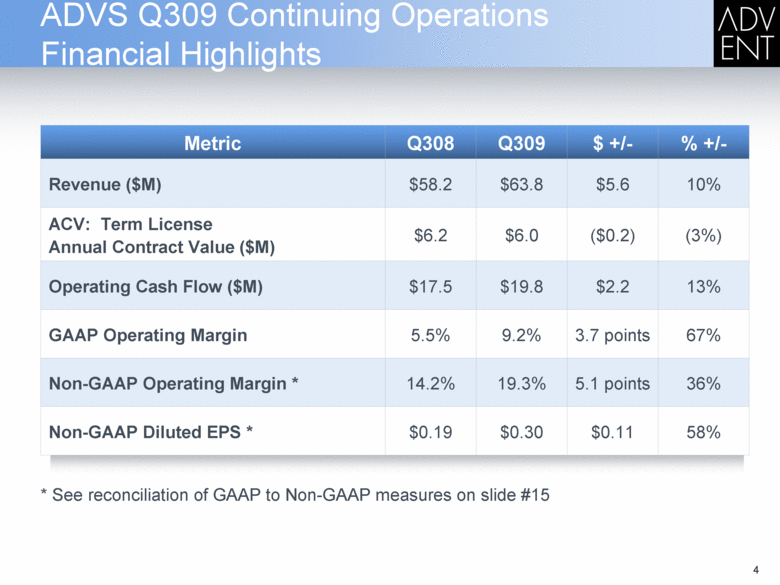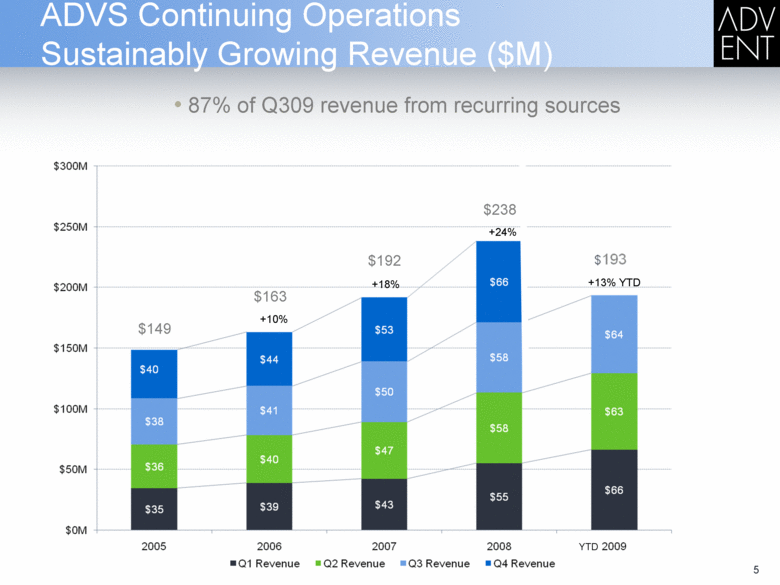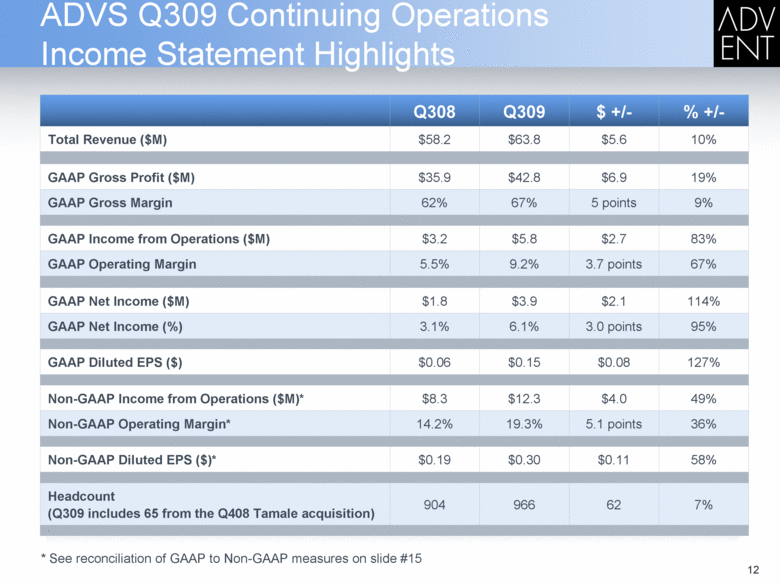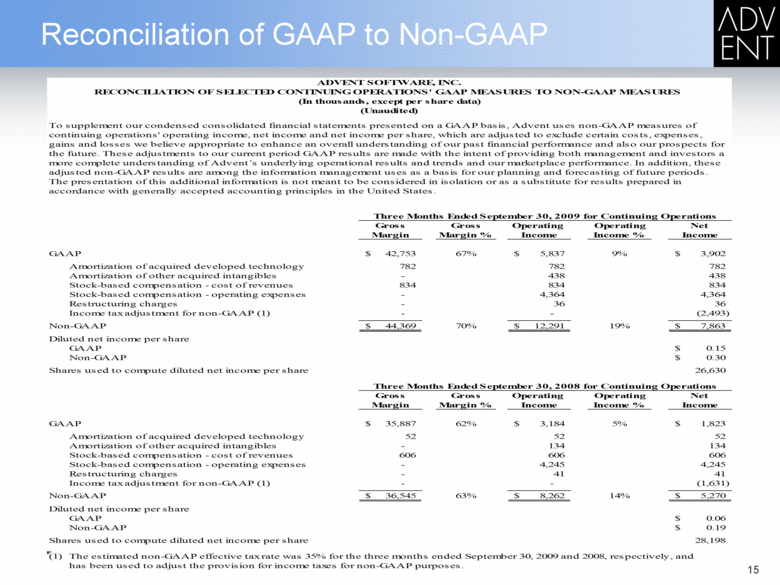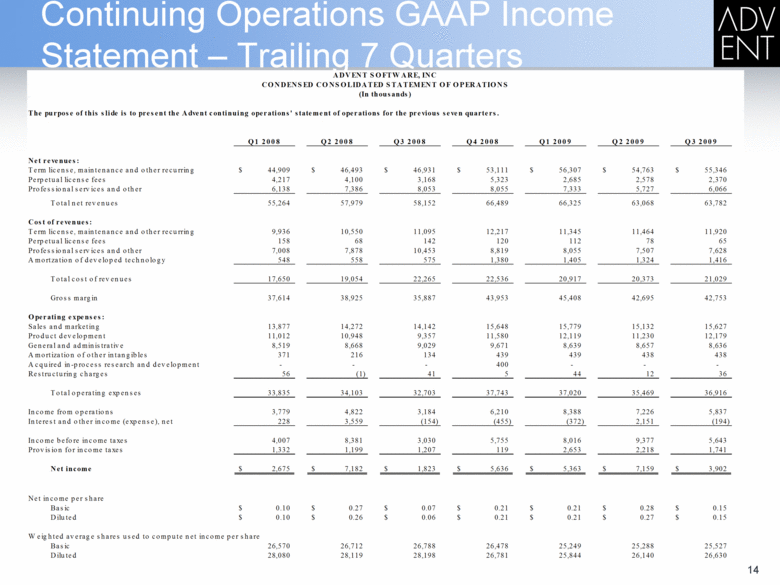
| Continuing Operations GAAP Income Statement – Trailing 7 Quarters The purpose of this slide is to present the Advent continuing operations' statement of operations for the previous seven quarters. Q1 2008 Q2 2008 Q3 2008 Q4 2008 Q1 2009 Q2 2009 Q3 2009 Net revenues: Term license, maintenance and other recurring 44,909 $ 46,493 $ 46,931 $ 53,111 $ 56,307 $ 54,763 $ 55,346 $ Perpetual license fees 4,217 4,100 3,168 5,323 2,685 2,578 2,370 Professional services and other 6,138 7,386 8,053 8,055 7,333 5,727 6,066 Total net revenues 55,264 57,979 58,152 66,489 66,325 63,068 63,782 Cost of revenues: Term license, maintenance and other recurring 9,936 10,550 11,095 12,217 11,345 11,464 11,920 Perpetual license fees 158 68 142 120 112 78 65 Professional services and other 7,008 7,878 10,453 8,819 8,055 7,507 7,628 Amortzation of developed technology 548 558 575 1,380 1,405 1,324 1,416 Total cost of revenues 17,650 19,054 22,265 22,536 20,917 20,373 21,029 Gross margin 37,614 38,925 35,887 43,953 45,408 42,695 42,753 Operating expenses: Sales and marketing 13,877 14,272 14,142 15,648 15,779 15,132 15,627 Product development 11,012 10,948 9,357 11,580 12,119 11,230 12,179 General and administrative 8,519 8,668 9,029 9,671 8,639 8,657 8,636 Amortization of other intangibles 371 216 134 439 439 438 438 Acquired in-process research and development - - - 400 - - - Restructuring charges 56 (1) 41 5 44 12 36 Total operating expenses 33,835 34,103 32,703 37,743 37,020 35,469 36,916 Income from operations 3,779 4,822 3,184 6,210 8,388 7,226 5,837 Interest and other income (expense), net 228 3,559 (154) (455) (372) 2,151 (194) Income before income taxes 4,007 8,381 3,030 5,755 8,016 9,377 5,643 Provision for income taxes 1,332 1,199 1,207 119 2,653 2,218 1,741 Net income 2,675 $ 7,182 $ 1,823 $ 5,636 $ 5,363 $ 7,159 $ 3,902 $ Net income per share Basic 0.10 $ 0.27 $ 0.07 $ 0.21 $ 0.21 $ 0.28 $ 0.15 $ Diluted 0.10 $ 0.26 $ 0.06 $ 0.21 $ 0.21 $ 0.27 $ 0.15 $ Weighted average shares used to compute net income per share Basic 26,570 26,712 26,788 26,478 25,249 25,288 25,527 Diluted 28,080 28,119 28,198 26,781 25,844 26,140 26,630 ADVENT SOFTWARE, INC CONDENSED CONSOLIDATED STATEMENT OF OPERATIONS (In thousands) |
