ANNUAL
REPORT
NEEDHAM FUNDS
Seeking to build wealth for long-term investors
December 31, 2022
Needham Growth Fund
Needham Aggressive Growth Fund
Needham Small Cap Growth Fund
www.needhamfunds.com
250 Park Avenue, 10th Floor
New York, New York 10177
1-800-625-7071
www.needhamfunds.com
Annual Report
December 31, 2022
CONTENTS
| Letter from the Adviser | 1 |
| Portfolio Characteristics (Unaudited) | |
| Needham Growth Fund | 5 |
| Needham Aggressive Growth Fund | 6 |
| Needham Small Cap Growth Fund | 7 |
| Disclosure of Fund Expenses | 9 |
| Schedules of Investments | |
| Needham Growth Fund | 11 |
| Needham Aggressive Growth Fund | 14 |
| Needham Small Cap Growth Fund | 18 |
| Statements of Assets and Liabilities | 20 |
| Statements of Operations | 21 |
| Statements of Changes in Net Assets | 22 |
| Financial Highlights | |
| Needham Growth Fund | 25 |
| Needham Aggressive Growth Fund | 27 |
| Needham Small Cap Growth Fund | 29 |
| Notes to Financial Statements | 31 |
| Report of Independent Registered Public Accounting Firm | 37 |
| Information about Directors and Officers | 38 |
| Supplementary Information | 40 |
This report is authorized for distribution to prospective investors only when preceded or accompanied by a current prospectus.
The prospectus contains more complete information, including investment objectives, risks, expenses and charges and should be
read carefully before investing or sending any money. To obtain a prospectus or summary prospectus, please call 1-800-625-7071.
Portfolios of The Needham Funds, Inc., like all mutual funds:
| | • | Are NOT FDIC insured |
| | • | Have no bank guarantee |
| | • | May lose value |
The Needham Funds, Inc. are distributed by Needham & Company, LLC.
Annual Report 2022
 | 250 Park Avenue, 10th Floor New York, New York 10177 (800) 625-7071 www.needhamfunds.com |
| |
| |
| |
February 2023
Dear Shareholders, Friends of Needham, and Prospective Shareholders,
We report Needham Funds’ results for the year ending December 31, 2022. Our mission is to create wealth for long-term investors, and 2022 was a step backward.
MARKET OVERVIEW/MACRO OBSERVATIONS
2022 was one of the worst years for investors in modern history. The S&P 500 had its worst first half since 1970 and ended the year down 18.11%. The Russell 2000 Growth Index fell 26.36% in 2022. By some measures, bonds had their worst year since 1754.1 It was all about inflation. In June, year-over-year inflation as measured by the Consumer Price Index peaked at 9.1%, and the price of gasoline increased 59.9% year-over-year. By November, year-over-year inflation remained high, but had fallen to 7.1%. In an effort to rein in inflation, the Federal Reserve aggressively raised interest rates, starting from 0.00% to 0.25% in March, and ending the year at 4.25% to 4.50%. The March increase was the first since 2015. As the Fed reaches the end of its rate hike cycle, markets could respond positively in 2023.
In March 2022, Russia began its attack on Ukraine. All year, we saw atrocities from the Russian assault on civilians, and it laid bare our assumptions about geopolitical stability and international economic cooperation. The war has reinforced the vulnerability of Europe’s reliance on Russian natural gas, and the need for increased defense spending. Combined with supply chain disruptions from the pandemic, the war underscores the need for countries and regions to shorten supply chains and become self-sufficient in energy and manufacturing.
The reshoring of U.S. manufacturing should create investment opportunities across life sciences, chemicals, oil and gas, alternative energy, and other industrial sectors. The Titanium Economy: How Industrial Technology Can Create a Better, Faster, Stronger America, written by several McKinsey partners, describes how industrial technology companies are important to the United States’ economic future.2 Clean Harbors, Inc. (CLH), a holding of Needham Growth Fund and Needham Aggressive Growth Fund, is one of the companies featured in the book. We have long focused our investments on companies supplying technology for manufacturing and R&D, but see even greater opportunities now.
NEEDHAM SMALL CAP GROWTH FUND – CHRIS RETZLER, PORTFOLIO MANAGER
For the year ended December 31, 2022, the Fund’s Institutional (NESIX) and Retail classes (NESGX) returned -29.82% and -30.33%, respectively, underperforming the Russell 2000 Growth Index’s -26.36%.
In 2022, the Fund benefitted from its concentrated investments in Intevac, Inc. (IVAC), Photronics, Inc. (PLAB), KVH Industries, Inc. (KVHI), TTM Technologies, Inc. (TTMI) and Edgio, Inc. (EGIO). The Fund’s top detractors in 2022 were Standard BioTools, Inc. (LAB), Telos Corporation (TLS), Sientra, Inc. (SIEN), 8x8, Inc. (EGHT), and nLight, Inc. (LASR).
In November 2022, the Fund’s long-term holding Benefitfocus (BNFT) announced its acquisition by Voya Financial. This is a perfect example of a management team that was improving operations, but realized that it is more prudent to consolidate based on economic circumstances and higher costs of capital. We expect more transactions like this one in 2023.
Throughout the second half of the year, the Fund increased its investment in Aspen Aerogels, Inc. (ASPN), a long-time portfolio holding. We are excited about the future of its aerogel insulation within the electric vehicle industry and its proposed expansion plans to supply accelerating customer demand.
The market volatility and multiples compression we experienced in the first half of 2022 began to abate in the last few months of the year. After the Fed surprised the markets in January 2022 with its faster-than-expected removal of monetary accommodation and numerous projected interest rate hikes, the markets reacted quickly and sold off. The interest rate yield curve remains steeply inverted as the Federal Reserve fights inflation and slows economic activity. Inflation is proving difficult to tame due to a variety of reasons, including supply constraints, component shortages, government regulations, energy supplies, food production costs, and transportation and logistics complications. We expect inflation to substantially decline in 2023.
As an asset class, small cap growth stocks experienced continued selling pressure in 2022. Wage pressures, logistics and transportation complications, higher commodity prices, and supply chain constraints continued to hamper earnings and forward guidance for many companies. These trends hurt smaller companies that lack the buying power and operational flexibility of larger companies. Overall, supply chain interruptions negatively impacted 2022 global growth and simultaneously supported persistently high inflation.
____________
1 | https://www.cnbc.com/2022/06/30/the-markets-worst-first-half-in-50-years-has-all-come-down-to-one-thing.html |
2 | https://www.mckinsey.com/featured-insights/mckinsey-on-books/the-titanium-economy |
Needham Funds
Widespread semiconductor shortages had negative implications for many end markets, including automotive, medical, industrial, and defense. However, supply chains have been recalibrated and disruptions have improved somewhat.
In August 2022, Congress passed the CHIPS and Science Act, which includes substantial funding and tax credits for domestic semiconductor production. The funding will help accelerate semiconductor development within the U.S., which has lagged over the past decade and will have enormous geopolitical benefits.
We continue to like the semiconductor capital equipment industry, including portfolio holdings Photronics, Inc., FormFactor, Inc. (FORM), and Veeco Instruments, Inc. (VECO). We like semiconductor manufacturers that are exposed to automotive, industrial, 5G and overall wireless infrastructure, such as portfolio holdings Sensata Technologies plc (ST), Marvell Technology, Inc. (MRVL) and Akoustis Technologies, Inc. (AKTS).
We also continue to like medical capital equipment and devices, and we expect to see growth as elective procedures increase. An example in our portfolio is ViewRay, Inc. (VRAY), a radiation oncology company. ViewRay is working on novel approaches to treating cancer, and it is experiencing acceleration in systems sales and placements.
We believe technology remains a great area to invest for the long term, and there are major secular trends firmly in place to support the technology sector’s continued growth. Areas of long-term investment that we like are mobile electrification, communications infrastructure, artificial intelligence, cloud computing, 5G devices and wireless connectivity, software and security, and specialty material manufacturing. We also see opportunities in military modernization and advancements in healthcare technologies.
As we enter 2023, we expect volatility to remain elevated as investors digest data from a slowing economy. However, we believe a lot of the damage to the equity markets was done in 2022. Improved global growth and accelerating revenue prospects should provide companies with leverage and drive improved earnings and cash flow. We expect the 2022 selloff to provide long-term investors with opportunities to buy high-quality growth stocks at reasonable prices in 2023. We will continue our strategy of patiently investing in small cap growth companies with good management teams, strong balance sheets, and the ability to generate cash flow and profits.
NEEDHAM GROWTH FUND – JOHN BARR AND CHRIS RETZLER, CO-PORTFOLIO MANAGERS
For the year ended December 31, 2022, the Fund’s Institutional (NEEIX) and Retail classes (NEEGX) returned -33.34% and -33.66%, underperforming the S&P 500’s -18.11% and the Russell 2000’s -20.44%.
Super Micro Computer, Inc. (SMCI) was the Fund’s leading contributor in 2022. Super Micro designs and manufactures servers. It grew throughout the year, sustained by large internet companies that operate their own data centers. These customers are investing in the computing power needed for the rapid growth of artificial intelligence applications. Super Micro is followed by just 4 Wall Street analysts who estimate 30% revenue growth in fiscal year 2023. Super Micro is valued at just 7x estimated earnings for the fiscal year ending June 30, 2023.
Parsons Corporation (PSN) was the Fund’s second leading contributor. Parsons does planning, construction, design, and implementation for infrastructure and government security programs. It builds airports, bridges, tunnels, roads, and railways. Its Federal Systems business does high-speed data and signal processing, network visualization, RF spectrum collection, geospatial collection systems, on-demand 3-D processing, missile defense, and counter hypersonics. We see Parsons as a beneficiary of the “Titanium Economy.”
Aspen Aerogels was the leading detractor in 2022, after being the largest contributor in 2021. The company supplies aerogel insulation used to insulate pipelines and refinery pipes. Aspen’s aerogel prevents thermal runaway in lithium-ion batteries, a major cause of fires in electric vehicles (EVs). Aspen has agreements with General Motors Company (GM), Toyota Motor Corp. ADRs (TM) and other EV makers to supply its PyroThinTM thermal barriers for use in EV batteries. We believe every EV maker has a similar need and that Aspen’s near-20 years of experience with aerogels puts it far ahead of any competitor. The EV battery market has the potential to increase Aspen’s revenues from $100 million to over $1 billion. However, Aspen needs to build a plant to meet this potential increase in demand. The plant in Statesboro, GA is making progress with the first products expected off the production lines in 2024. In November, Aspen completed a financing at $9.50 per share for most of its funding needs for the new plant. The Funds bought additional shares on this offering.
Entegris, Inc. (ENTG) was the second leading detractor in 2022, after being the Fund’s second leading contributor for 2021. Entegris supplies filters and chemicals used in advanced semiconductor manufacturing processes. We believe semiconductors will continue to increase as a percentage of industrial output, and that Entegris’ filtration and specialty materials products will grow faster than the semiconductor industry.3
____________
3 | https://www.regions.com/-/media/pdfs/AssetManagement-The-Semiconductor-Cycle.pdf?revision=1da76437-de80-4ebd-96f3-dc8ab8257328&la=en&hash=414BE463A90E72789127F9AB4D334AAA |
In 2022, Entegris acquired CMC Materials (formerly CCMP) for $6.5 billion. CMC produces specialty chemicals used to manufacture semiconductors. The acquisition is expected to be EPS accretive in the first year. Financed with debt and equity, it increased Entegris’ leverage ratio to over 4x adjusted EBITDA. We believe Entegris stock was down on concern over the leverage taken on for the acquisition, the difficulties in the semiconductor market, and the United States’ trade restrictions on China.
The Fund’s largest new positions in 2022 included Analog Devices, Inc. (ADI), ASM Holding NV ADR (ASML), and nLight Inc. (LASR). The Fund’s largest additions to existing positions were Laboratory Corporation of America (LH), Photronics, and Veeco.
The Fund’s largest position exits were IPG Photonics Corporation (IPGP) and Everbridge, Inc. (EVBG). The Fund reduced positions in some of the longer-term, larger holdings, including Gilead Sciences Inc. (GILD, Super Micro Computer, Comcast Corp. (CMSCA), and Thermo Fisher Scientific Inc. (TMO).
Morningstar categorizes the Fund as Mid-Cap Growth. Lipper categorizes it as Multi-Cap Core. When you hold companies for 10-15 years, and they succeed, they grow to larger market capitalization categories. Our mission is to find companies that may be compounders over many years, independent of industry or market cap.
NEEDHAM AGGRESSIVE GROWTH FUND – JOHN BARR, PORTFOLIO MANAGER
For the year ended December 31, 2022, the Fund’s Institutional (NEAIX) and Retail classes (NEAGX) returned -27.02%% and -27.53%, slightly underperforming the Russell 2000’s -26.36%.
Like the Needham Growth Fund, the Fund’s top contributors for 2022 were Super Micro Computer and Parsons. Other top contributors in 2022 were Vishay Precision Group Inc. (VPG), KVH Industries, Sharps Compliance Corp. (formerly SMED), and CRA International Inc. (CRAI).
In 2022, the top detractors to the Fund’s performance were Aspen Aerogels and Vicor Corporation (VICR). Many artificial intelligence and machine learning applications require sophisticated power conversion, and Vicor is uniquely positioned to meet these needs. Vicor was supply-constrained throughout 2022, and the stock suffered due to these supply constraints followed by slower orders in the second half. It opened a new manufacturing facility in May 2022 in Andover, MA.
Other major detractors were Entegris, Nova, Ltd. (NVMI), and Smith-Midland Corporation. (SMID). These stocks were top contributors in 2021.
NEEDHAM AGGRESSIVE GROWTH FUND – 2022 PORTFOLIO CHANGES
We believe 2022 was a good year to invest - time will tell. We took advantage of the market weakness throughout the year to invest the Fund’s cash position, which was 22.5% of assets on March 31 due to inflows, and ended the year at 6.7%. Many of these investments could benefit from the reshoring of U.S. manufacturing. We highlight the Fund’s most significant new positions below:
| | – | Adams Resources and Energy, Inc. (AE) was founded by Bud Adams, the founding owner of the Houston Oilers (now Tennessee Titans) football team. The $100 million market cap company transports liquid chemicals, pressurized gases, asphalt and dry bulk around the southern U.S. with a fleet of 300 trucks. It also markets, stores and transports crude oil via truck and pipeline connecting the Eagle Ford and other shale fields to the Gulf of Mexico. The company is an astute acquirer of complementary businesses. In November, it bought out the Adams heirs’ 44% ownership. We estimate Adams is valued at just 3-4x EBITDA. |
| | | |
| | – | Mativ Holdings, Inc. (MATV) was formed in July by the merger of Neenah, Inc. (formerly NP) and Schweitzer-Maudit International (formerly SWM). Mativ is a specialty materials company making filtration media and fine paper and packaged products for industrial and consumer markets. Mativ’s stock and its earnings suffered early in 2022 from a lag in passing through cost increases. |
| | | |
| | – | Bright Horizons Family Solutions, Inc. (BFAM) is a leading provider of child care centers. It suffered due to COVID-19, limited staff availability, and a slow return to the office. |
The most significant additions to existing positions in the portfolio were:
| | – | Vishay Precision Group, a specialty sensors and instruments company. |
| | | |
| | – | Photronics, a long-time portfolio company that manufactures photomasks used to manufacture semiconductors and LCD displays. Photronics reported disappointing earnings in August. |
| | | |
| | – | LabCorp- we believe there is hidden value in LabCorp’s contract research organization business. |
| | | |
| | – | Unisys Corporation (UIS), the new version of the old-line computer company. Unisys provides digital workplace solutions, cloud & infrastructure, and enterprise computing. We believe the profitability of its legacy operating system business alone is worth multiples of the current stock price. |
| | | |
| | – | Clean Harbors, an environmental services and used oil reprocessing company serving the energy and industrial markets. We believe the current stock price reflects little more than the replacement value of their incinerators and landfills. |
In 2022, the Fund exited Neophotonics Corporation (formerly NPTN), ChannelAdvisor Corporation (formerly ECOM) and Sharp Compliance Corp., on takeovers. We exited IPG Photonics because of its significant operations in Russia. The Fund reduced its position in Apple, Inc. (AAPL) to manage its position size.
CLOSING
We believe the U.S. remains the best place in the world to be investing, and we continue to see an opportunity to invest in small- and mid-cap stocks. Most importantly, we see a revolution happening in technology that has created and continues to create investment opportunities. We believe the reshoring of manufacturing in the U.S. will create investment opportunities. We see opportunity in our strategy of investing in companies that we know well and that we believe are positioned with secular growth drivers.
We welcome our new investors and thank all of our investors for their continued support. If you have any questions, thoughts or concerns, please contact us at (800) 625-7071 or jbarr@needhamco.com and cretzler@needhamco.com. For information about the Needham Funds, please visit our website at www.needhamfunds.com.
Sincerely,
 |  |
| Chris Retzler, | John O. Barr, |
| Portfolio Manager | Portfolio Manager |
The information presented in this commentary is not intended as personalized investment advice and does not constitute a recommendation to buy or sell a particular security or other investments. Past performance is no guarantee of future results. The views of Needham Investment Management L.L.C., the Funds’ investment adviser (the “Adviser”), and the securities described in this report are as of December 31, 2022; these views and portfolio holdings may have changed subsequent to this date. The specific securities discussed may, in aggregate, represent only a small percentage of a Fund’s holdings. If a specific security discussed is not found in a Fund’s Schedule of Investments, it may have been held by the Fund during the period. It should not be assumed that securities identified and discussed were, or will be, profitable, or that the investment decisions made in the future will be profitable, or equal the investment performance of the securities discussed herein. There can be no guarantee as to the accuracy of any outlooks for markets, sectors and securities as discussed herein.
This message is not an offer of the Needham Growth Fund, the Needham Aggressive Growth Fund or the Needham Small Cap Growth Fund. Shares are sold only through the currently effective prospectus. Please read the prospectus or summary prospectus carefully and consider the investment objectives, risks and charges and expenses of the Funds carefully before you invest. The prospectus and summary prospectus contain this and other information about the Funds and can be obtained on our website, www.needhamfunds.com or by contacting the Funds’ transfer agent U.S. Bancorp Fund Services LLC doing business as U.S. Bank Global Fund Services (“Fund Services”) at 1-800-625-7071.
Investment returns and principal value will fluctuate, and when redeemed, shares may be worth more or less than their original cost. Performance data quoted represents past performance, and does not guarantee future results. Current performance may be higher or lower than these results. Performance current to the most recent month-end may be obtained by calling our transfer agent at 1-800-625-7071. Total return figures include reinvestment of all dividends and capital gains.
All three of the Needham Funds have substantial exposure to small and micro capitalized companies. Funds holding smaller capitalized companies are subject to greater price fluctuation than those of larger companies. The coronavirus disease 2019 (COVID-19) global pandemic and the aggressive responses taken by many governments or voluntarily imposed by private parties, including closing borders, restricting travel and imposing prolonged quarantines or similar restrictions, as well as the closure of, or operational changes to, many retail and other businesses, have had negative impacts, and in many cases severe negative impacts, on markets worldwide. It is not known how long such impacts, or any future impacts of other significant events described above, will or would last, but there could be a prolonged period of global economic slowdown, which may impact your Fund investment. Needham & Company, LLC, member FINRA/SIPC, is the distributor of The Needham Funds, Inc.
The Russell 2000 Index is a broad unmanaged index composed of the smallest 2,000 companies in the Russell 3000 Index. The Russell 3000 Index is a market-capitalization-weighted equity index that provides exposure to the entire U.S. stock market. The Russell 3000 Index tracks the performance of the 3,000 largest U.S.-traded stocks. The Russell 2000 Growth Index measures the performance of the small cap growth segment of the U.S. equity universe. It includes those Russell 2000 companies with relatively higher price-to-value ratios and higher forecasted growth values. Please see the disclaimer regarding these indexes under “Supplementary Information—Index Disclaimer” on page 41 of this report.
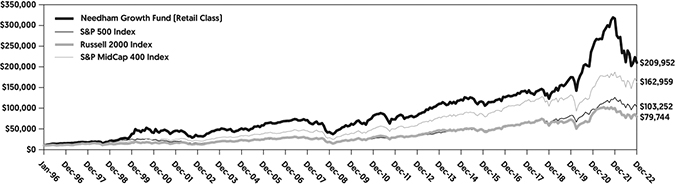
| NEEDHAM GROWTH FUND | Retail Class |
| Portfolio Characteristics (Unaudited) | Ticker Symbol: NEEGX |
| | Institutional Class |
| | Ticker Symbol: NEEIX |
COMPARISON OF CHANGE IN VALUE OF A $10,000 INVESTMENT
The chart above assumes an initial gross investment of $10,000 made on January 1, 1996.
COMPARATIVE PERFORMANCE STATISTICS AS OF DECEMBER 31, 2022
| | 1 | 5 | 10 | Since |
| | Year | Years | Years | Inception |
Needham Growth Fund Retail Class(1)(2) | -33.66% | 8.90% | 9.84% | 11.94% |
Needham Growth Fund Institutional Class(1)(3) | -33.34% | 9.42% | n/a | 9.33% |
S&P 500 Index(4)(5) | -18.11% | 9.42% | 12.56% | 9.03%(9) |
S&P MidCap 400 Index(4)(6) | -13.06% | 6.71% | 10.78% | 10.89%(9) |
Russell 2000 Index(4)(7) | -20.44% | 4.13% | 9.01% | 7.99%(9) |
Top Ten Holdings*
(as a % of total investments, as of December 31, 2022)
| | | % of Total |
Security | | Investments |
| Thermo Fisher Scientific, Inc. | TMO | 8.68% |
| PDF Solutions, Inc. | PDFS | 8.02% |
| Entegris, Inc. | ENTG | 5.39% |
| KVH Industries, Inc. | KVHI | 4.24% |
| Super Micro Computer, Inc. | SMCI | 3.92% |
| Aspen Aerogels, Inc. | ASPN | 3.91% |
| Becton Dickinson & Co. | BDX | 3.90% |
| Vicor Corp. | VICR | 3.57% |
| CarMax, Inc. | KMX | 3.46% |
| Nova, Ltd. | NVMI | 3.05% |
| | | |
Top Ten Holdings = 48.14% of Total Investments† | | |
Sector Weightings*
(as a % of net investments, as of December 31, 2022)
Sector(10) | Long(11) | (Short) | Total(12) |
| Cash | 4.6% | — | 4.6% |
| Communication Services | 4.4% | — | 4.4% |
| Consumer Discretionary | 4.1% | — | 4.1% |
| Energy | 0.9% | — | 0.9% |
| Health Care | 19.7% | — | 19.7% |
| Industrials | 8.4% | — | 8.4% |
| Information Technology | 53.5% | — | 53.5% |
| Materials | 3.9% | — | 3.9% |
| Real Estate | 0.4% | — | 0.4% |
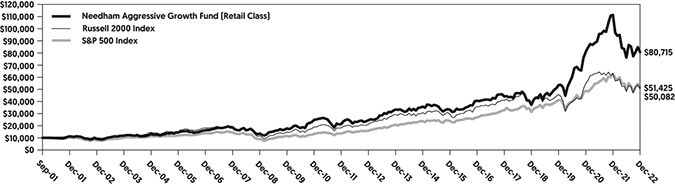
| NEEDHAM AGGRESSIVE GROWTH FUND | Retail Class |
| Portfolio Characteristics (Unaudited) | Ticker Symbol: NEAGX |
| | Institutional Class |
| | Ticker Symbol: NEAIX |
COMPARISON OF CHANGE IN VALUE OF A $10,000 INVESTMENT
The chart above assumes an initial gross investment of $10,000 made on September 4, 2001.
COMPARATIVE PERFORMANCE STATISTICS AS OF DECEMBER 31, 2022
| | 1 | 5 | 10 | Since |
| | Year | Years | Years | Inception |
Needham Aggressive Growth Fund Retail Class(1)(2) | -27.53% | 12.83% | 12.67% | 10.29% |
Needham Aggressive Growth Fund Institutional Class(1)(3) | -27.02% | 13.53% | n/a | 12.82% |
S&P 500 Index(4)(5) | -18.11% | 9.42% | 12.56% | 9.03%(9) |
Russell 2000 Index(4)(7) | -20.44% | 4.13% | 9.01% | 7.85%(9) |
Russell 2000 Growth Index(4)(8) | -26.36% | 3.51% | 9.20% | 7.39%(9) |
Top Ten Holdings*
(as a % of total investments, as of December 31, 2022)
| | | % of Total |
Security | | Investments |
| PDF Solutions, Inc. | PDFS | 7.33% |
| KVH Industries, Inc. | KVHI | 5.02% |
| Vicor Corp. | VICR | 4.51% |
| Super Micro Computer, Inc. | SMCI | 3.98% |
| Vishay Precision Group, Inc. | VPG | 3.90% |
| Nova, Ltd. | NVMI | 3.65% |
| Aspen Aerogels, Inc. | ASPN | 3.14% |
| Entegris, Inc. | ENTG | 3.05% |
| Photronics, Inc. | PLAB | 2.82% |
| Apple, Inc. | AAPL | 2.69% |
| | | |
Top Ten Holdings = 40.09% of Total Investments† | | |
Sector Weightings*
(as a % of net investments, as of December 31, 2022)
Sector(10) | Long(11) | (Short) | Total(12) |
| Cash | 6.7% | — | 6.7% |
| Communication Services | 0.6% | — | 0.6% |
| Consumer Discretionary | 5.4% | — | 5.4% |
| Consumer Staples | 1.1% | — | 1.1% |
| Energy | 2.6% | — | 2.6% |
| Financials | 1.5% | — | 1.5% |
| Health Care | 6.1% | — | 6.1% |
| Industrials | 18.3% | — | 18.3% |
| Information Technology | 48.9% | — | 48.9% |
| Materials | 7.4% | — | 7.4% |
| Real Estate | 1.4% | — | 1.4% |
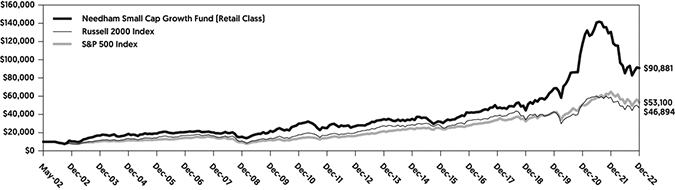
| NEEDHAM SMALL CAP GROWTH FUND | Retail Class |
| Portfolio Characteristics (Unaudited) | Ticker Symbol: NESGX |
| | Institutional Class |
| | Ticker Symbol: NESIX |
COMPARISON OF CHANGE IN VALUE OF A $10,000 INVESTMENT
The chart above assumes an initial gross investment of $10,000 made on May 22, 2002.
COMPARATIVE PERFORMANCE STATISTICS AS OF DECEMBER 31, 2022
| | 1 | 5 | 10 | Since |
| | Year | Years | Years | Inception |
Needham Small Cap Growth Fund Retail Class(1)(2) | -30.33% | 14.19% | 12.84% | 11.30% |
Needham Small Cap Growth Fund Institutional Class(1)(3) | -29.82% | 14.93% | n/a | 14.51% |
S&P 500 Index(4)(5) | -18.11% | 9.42% | 12.56% | 8.44%(9) |
Russell 2000 Index(4)(7) | -20.44% | 4.13% | 9.01% | 7.79%(9) |
Russell 2000 Growth Index(4)(8) | -26.36% | 3.51% | 9.20% | 7.75%(9) |
Top Ten Holdings*
(as a % of total investments, as of December 31, 2022)
| | | % of Total |
Security | | Investments |
| Intevac, Inc. | IVAC | 5.16% |
| nLight, Inc. | LASR | 5.03% |
| ViewRay, Inc. | VRAY | 4.92% |
| Photronics, Inc. | PLAB | 4.59% |
| Sumo Logic, Inc. | SUMO | 4.02% |
| Aspen Aerogels, Inc. | ASPN | 3.77% |
| Cambium Networks Corp. | CMBM | 3.76% |
| Infinera Corp. | INFN | 3.68% |
| Yext, Inc. | YEXT | 3.56% |
| 8x8, Inc. | EGHT | 3.43% |
| | | |
Top Ten Holdings = 41.92% of Total Investments† | | |
Sector Weightings*
(as a % of net investments, as of December 31, 2022)
\Sector(10) | Long(11) | (Short) | Total(12) |
| Cash | 17.7% | — | 17.7% |
| Consumer Discretionary | 0.3% | — | 0.3% |
| Health Care | 7.1% | — | 7.1% |
| Industrials | 5.1% | — | 5.1% |
| Information Technology | 66.0% | — | 66.0% |
| Materials | 3.8% | — | 3.8% |
Each Fund’s performance figures are for the years ended December 31, 2022. The performance data quoted is historical. Past performance is no guarantee of future results. Current performance may be higher or lower than the performance data quoted. The principal value and investment return of an investment will fluctuate so that your shares, when redeemed, may be worth more or less than their original cost. To obtain performance information current to the most recent month-end, please visit www.needhamfunds.com or call 1-800-625-7071. The returns shown above are net of expenses. The returns shown do not reflect the deduction of taxes that a shareholder would pay on Fund distributions or on the redemptions of Fund shares. In the absence of fee waivers and expense reimbursements, when they are necessary to keep the Fund’s total annual operating expenses at the expense cap currently in effect, total return would be reduced. Performance figures for periods greater than one year are annualized. For information about each index shown above, please see the notes below. The Global Industry Classification Standard (“GICS”) was developed by and/or is the exclusive property of MSCI, Inc. and Standard & Poor Financial Services LLC (“S&P”). GICS is a service mark of MSCI and S&P and has been licensed for use by U.S. Bancorp Fund Services, LLC, doing business as U.S. Bank Global Fund Services (“Fund Services”).
| (1) | Investment results calculated after reinvestment of dividends. |
| (2) | The inception date of the Retail Class of each Fund was as follows: Needham Growth Fund – 1/1/96; Needham Aggressive Growth Fund – 9/4/01; and Needham Small Cap Growth Fund – 5/22/02. |
| (3) | The inception date of the Institutional Class of each Fund was 12/30/16. |
| (4) | It is not possible to invest directly in an index. The performance of the index does not include the deduction of expenses associated with a mutual fund, such as investment management fees. |
| (5) | The S&P 500 Index focuses on the large-cap sector of the market; however, since it includes a significant portion of the total value of the market, it also is considered representative of the market. Companies in the S&P 500 are considered leading companies in leading industries. |
| (6) | The S&P MidCap 400 Index provides investors with a benchmark for mid-sized companies. The index seeks to remain an accurate measure of mid-sized companies, reflecting the risk and return characteristics of the broader mid-cap universe on an on-going basis. |
| (7) | The Russell 2000 Index measures the performance of the small-cap segment of the U.S. equity universe. The Russell 2000 Index is a subset of the Russell 3000 Index representing approximately 8% of the total market capitalization of that index. The Russell 2000 Index includes approximately 2,000 of the smallest securities based on a combination of their market cap and current index membership. |
| (8) | The Russell 2000 Growth Index is constructed to provide a comprehensive and unbiased barometer for the small-cap growth segment. The index is completely reconstituted annually to ensure new and growing equities are included and that the represented companies continue to reflect growth characteristics. |
| (9) | The return shown for the index is from the inception date of the Retail Class. The returns for the S&P 500 Index, S&P MidCap 400 Index, Russell 2000 Growth, and the Russell 2000 Index from the inception date of the Institutional Class are 11.40%, 8.24%, 6.40%, and 5.81%, respectively. |
| (10) | These categories represent broad market sectors. Refer to the Schedule of Investments for a more detailed categorization by industry. |
| (11) | Percentage of total investments includes all stocks, plus cash. |
| (12) | Net exposure represents the difference between the long exposure and the short exposure, which produces the net investment exposure. |
| * | Current portfolio holdings may not be indicative of future portfolio holdings. |
| † | Percentage of total investments. |
Disclosure of Fund Expenses (Unaudited)
The following expense table is shown so that you can understand the impact of fees on your investment. All mutual funds have operating expenses. As a shareholder of a Portfolio, you incur transactional costs and ongoing costs, which include costs for portfolio management, administrative services, and shareholder reports, among others. A Portfolio’s expenses are expressed as a percentage of its average net assets. This figure is known as the expense ratio. The following examples are intended to help you understand the ongoing costs (in dollars) of investing in each Portfolio and to compare these costs with those of other mutual funds. The examples are based on an investment of $1,000 made at the beginning of a six-month period and held for the entire period. The expense example table below illustrates your fund’s cost in two ways:
| • | Actual Expenses. This section helps you to estimate the actual expenses after fee waivers that you paid over the period. The “Ending Account Value” shown is derived from the Portfolio’s actual return, and “Expenses Paid During Period” shows the dollar amount that would have been paid by an investor who started with $1,000 in the Portfolio. You may use the information here, together with the amount you invested, to estimate the expenses that you paid over the period. To do so, simply divide your account value by $1,000 (for example, an $8,600 account value divided by $1,000 = 8.6), then multiply the result by the number given for your Portfolio under the heading entitled “Expenses Paid During Period”. |
| | |
| • | Hypothetical Expenses on a 5% Return. This section is intended to help you compare your Portfolio’s costs with those of other mutual funds. It assumes that the Portfolio had a return of 5% before expenses during the period shown, but that the expense ratio is unchanged. In this case, because the return used is not the Portfolio’s actual return, the results do not apply to your investment. The example is useful in making comparisons because the Securities and Exchange Commission requires all mutual funds to calculate expenses based on a 5% return. You can assess your Portfolio’s cost by comparing this hypothetical example with the hypothetical examples that appear in shareholders reports of other funds. |
Please note that the expenses shown in the table are meant to highlight your ongoing costs only and do not reflect any transactional costs. Therefore, the table is useful in comparing ongoing costs only, and will not help you determine the relative total costs of owning different funds. In addition, if these transactional costs were included, your costs would have been higher.
For the Period July 1, 2022 to December 31, 2022
Expense Example Table (Unaudited)
| | Beginning | Ending | Expenses Paid | Expense Ratio |
| | Account Value | Account Value | During Period* | During Period* |
| | 7/1/22 | 12/31/22 | 7/1/22 – 12/31/22 | 7/1/22 – 12/31/22 |
| Needham Growth Fund | | | | |
| Retail Class Actual Expenses | $1,000.00 | $ 993.80 | $9.19 | 1.83% |
| Retail Class Hypothetical | | | | |
| Example for Comparison Purposes | | | | |
| (5% return before expenses) | $1,000.00 | $1,015.99 | $9.29 | 1.83% |
| Institutional Class Actual Expenses | $1,000.00 | $ 996.20 | $7.04 | 1.40% |
| Institutional Class Hypothetical | | | | |
| Example for Comparison Purposes | | | | |
| (5% return before expenses) | $1,000.00 | $1,018.15 | $7.12 | 1.40% |
| | | | | |
| Needham Aggressive Growth Fund | | | | |
| Retail Class Actual Expenses | $1,000.00 | $1,058.70 | $9.60 | 1.85% |
| Retail Class Hypothetical | | | | |
| Example for Comparison Purposes | | | | |
| (5% return before expenses) | $1,000.00 | $1,015.88 | $9.40 | 1.85% |
| Institutional Class Actual Expenses | $1,000.00 | $1,062.60 | $6.13 | 1.18% |
| Institutional Class Hypothetical | | | | |
| Example for Comparison Purposes | | | | |
| (5% return before expenses) | $1,000.00 | $1,019.26 | $6.01 | 1.18% |
| | | | | |
| Needham Small Cap Growth Fund | | | | |
| Retail Class Actual Expenses | $1,000.00 | $1,066.40 | $9.64 | 1.85% |
| Retail Class Hypothetical | | | | |
| Example for Comparison Purposes | | | | |
| (5% return before expenses) | $1,000.00 | $1,015.88 | $9.40 | 1.85% |
| Institutional Class Actual Expenses | $1,000.00 | $1,070.70 | $6.16 | 1.18% |
| Institutional Class Hypothetical | | | | |
| Example for Comparison Purposes | | | | |
| (5% return before expenses) | $1,000.00 | $1,019.26 | $6.01 | 1.18% |
| * | Expenses are equal to the average account value times the Portfolio’s annualized expense ratio multiplied 184/365 (to reflect the one-half-year period). |
Needham Growth Fund
Schedule of Investments
December 31, 2022
| | | Shares | | | Fair Value | |
| Common Stocks (95.3%) | | | | | | |
| | | | | | | |
| Aerospace & Defense (3.0%) | | | | | | |
| Parsons Corp. (a) | | | 77,500 | | | $ | 3,584,375 | |
| | | | | | | | | |
| Biotechnology (1.4%) | | | | | | | | |
| G1 Therapeutics, Inc. (a) | | | 64,000 | | | | 347,520 | |
| Gilead Sciences, Inc. | | | 15,000 | | | | 1,287,750 | |
| | | | | | | | 1,635,270 | |
| Chemicals (3.9%) | | | | | | | | |
| Aspen Aerogels, Inc. (a) | | | 400,000 | | | | 4,716,000 | |
| | | | | | | | | |
| Commercial Services & Supplies (1.1%) | | | | | | | | |
| Clean Harbors, Inc. (a) | | | 11,900 | | | | 1,358,028 | |
| | | | | | | | | |
| Communications Equipment (8.1%) | | | | | | | | |
| ADTRAN Holdings, Inc. | | | 125,000 | | | | 2,348,750 | |
| Cambium Networks Corp. (a) | | | 94,250 | | | | 2,042,398 | |
| KVH Industries, Inc. (a) | | | 500,000 | | | | 5,110,000 | |
| ViaSat, Inc. (a)(c) | | | 10,000 | | | | 316,500 | |
| | | | | | | | 9,817,648 | |
| Diversified Consumer Services (0.4%) | | | | | | | | |
| Bright Horizons Family Solutions, Inc. (a) | | | 8,000 | | | | 504,800 | |
| | | | | | | | | |
| Electrical Equipment (3.6%) | | | | | | | | |
| Vicor Corp. (a) | | | 80,000 | | | | 4,300,000 | |
| | | | | | | | | |
| Electronic Equipment, Instruments & Components (3.9%) | | | | | | | | |
| Coherent Corp. (a) | | | 18,500 | | | | 649,350 | |
| Corning, Inc. | | | 37,500 | | | | 1,197,750 | |
| nLight, Inc. (a) | | | 135,850 | | | | 1,377,519 | |
| Vishay Intertechnology, Inc. | | | 55,000 | | | | 1,186,350 | |
| Vishay Precision Group, Inc. (a) | | | 8,000 | | | | 309,200 | |
| | | | | | | | 4,720,169 | |
| Health Care Equipment & Supplies (5.7%) | | | | | | | | |
| Becton Dickinson & Co. | | | 18,500 | | | | 4,704,550 | |
| Medtronic PLC | | | 20,000 | | | | 1,554,400 | |
| ViewRay, Inc. (a) | | | 144,780 | | | | 648,614 | |
| | | | | | | | 6,907,564 | |
| Health Care Providers & Services (2.9%) | | | | | | | | |
| Laboratory Corp. of America Holdings | | | 11,000 | | | | 2,590,280 | |
| Quest Diagnostics, Inc. | | | 5,500 | | | | 860,420 | |
| | | | | | | | 3,450,700 | |
| Hotels, Restaurants & Leisure (0.2%) | | | | | | | | |
| Vacasa, Inc. – Class A (a) | | | 214,150 | | | | 269,829 | |
| | | | | | | | | |
| Industrial Conglomerates (0.5%) | | | | | | | | |
| Honeywell International, Inc. – ADR | | | 2,500 | | | | 535,750 | |
| | | | | | | | | |
| Interactive Media & Services (0.4%) | | | | | | | | |
| Alphabet, Inc. – Class A (a) | | | 5,000 | | | | 441,150 | |
See accompanying notes to financial statements.
Needham Growth Fund
Schedule of Investments (Continued)
December 31, 2022
| | | Shares | | | Fair Value | |
| Common Stocks – Continued | | | | | | |
| | | | | | | |
| IT Services (2.5%) | | | | | | |
| Akamai Technologies, Inc. (a)(c) | | | 33,000 | | | $ | 2,781,900 | |
| BigCommerce Holdings, Inc. (a) | | | 30,000 | | | | 262,200 | |
| | | | | | | | 3,044,100 | |
| Life Sciences Tools & Services (9.7%) | | | | | | | | |
| Bruker Corp. | | | 7,500 | | | | 512,625 | |
| CryoPort, Inc. (a) | | | 43,500 | | | | 754,725 | |
| Thermo Fisher Scientific, Inc. | | | 19,000 | | | | 10,463,110 | |
| | | | | | | | 11,730,460 | |
| Media (4.1%) | | | | | | | | |
| The Trade Desk, Inc. – Class A (a) | | | 47,000 | | | | 2,107,010 | |
| Comcast Corp. – Class A | | | 80,000 | | | | 2,797,600 | |
| | | | | | | | 4,904,610 | |
| Oil, Gas & Consumable Fuels (0.9%) | | | | | | | | |
| Chevron Corp. | | | 5,000 | | | | 897,450 | |
| Navigator Holdings, Ltd. (a) | | | 20,000 | | | | 239,200 | |
| | | | | | | | 1,136,650 | |
| Real Estate Investment Trusts (REITs) (0.4%) | | | | | | | | |
| American Tower Corp. | | | 2,500 | | | | 529,650 | |
| | | | | | | | | |
| Semiconductors & Semiconductor Equipment (30.9%) (d) | | | | | | | | |
| Analog Devices, Inc. | | | 10,000 | | | | 1,640,300 | |
| Applied Materials, Inc. | | | 9,000 | | | | 876,420 | |
| ASML Holding NV (Netherlands) | | | 2,250 | | | | 1,229,400 | |
| AXT, Inc. (a) | | | 335,450 | | | | 1,469,271 | |
| Entegris, Inc. | | | 99,000 | | | | 6,493,410 | |
| FormFactor, Inc. (a) | | | 119,500 | | | | 2,656,485 | |
| Lam Research Corp. | | | 2,500 | | | | 1,050,750 | |
| Marvell Technology, Inc. | | | 15,000 | | | | 555,600 | |
| MKS Instruments, Inc. | | | 23,000 | | | | 1,948,790 | |
| Nova, Ltd. (Israel)(a) | | | 45,000 | | | | 3,675,600 | |
| PDF Solutions, Inc. (a) | | | 338,990 | | | | 9,667,995 | |
| Photronics, Inc. (a) | | | 185,000 | | | | 3,113,550 | |
| SiTime Corp. (a) | | | 12,500 | | | | 1,270,250 | |
| Teradyne, Inc. | | | 2,500 | | | | 218,375 | |
| Veeco Instruments, Inc. (a) | | | 75,000 | | | | 1,393,500 | |
| | | | | | | | 37,259,696 | |
| Software (1.9%) | | | | | | | | |
| Alteryx, Inc. – Class A (a) | | | 23,500 | | | | 1,190,745 | |
| Q2 Holdings, Inc. (a) | | | 16,500 | | | | 443,355 | |
| Telos Corp. (a) | | | 120,000 | | | | 610,800 | |
| | | | | | | | 2,244,900 | |
| Specialty Retail (3.5%) | | | | | | | | |
| CarMax, Inc. (a) | | | 68,500 | | | | 4,170,965 | |
See accompanying notes to financial statements.
Needham Growth Fund
Schedule of Investments (Continued)
December 31, 2022
| | | Shares | | | Fair Value | |
| Common Stocks – Continued | | | | | | |
| | | | | | | |
| Technology Hardware, Storage & Peripherals (6.1%) | | | | | | |
| Apple, Inc. | | | 8,500 | | | $ | 1,104,405 | |
| Hewlett Packard Enterprise Co. | | | 17,500 | | | | 279,300 | |
| Intevac, Inc. (a) | | | 200,000 | | | | 1,294,000 | |
| Super Micro Computer, Inc. (a) | | | 57,500 | | | | 4,720,750 | |
| | | | | | | | 7,398,455 | |
| Trading Companies & Distributors (0.2%) | | | | | | | | |
| Air Lease Corp. | | | 7,500 | | | | 288,150 | |
| Total Common Stocks | | | | | | | | |
| (Cost $55,611,915) | | | | | | $ | 114,948,919 | |
| | | | | | | | | |
| Short-Term Investments (4.6%) | | | | | | | | |
| | | | | | | | | |
| Money Market Fund (4.6%) | | | | | | | | |
| Dreyfus Treasury Securities Cash Management – Institutional Class, 3.93% (b) | | | | | | | | |
| Total Short-Term Investments | | | | | | | | |
| (Cost $5,532,105) | | | 5,532,105 | | | $ | 5,532,105 | |
| Total Investments (99.9%) | | | | | | | | |
| (Cost $61,144,020) | | | | | | | 120,481,024 | |
| Other Assets in Excess of Liabilities (0.1%) | | | | | | | 78,581 | |
| Net Assets (100.0%) | | | | | | $ | 120,559,605 | |
| | Percentages are stated as a percent of net assets. |
| | Industry classifications may be different than those used for compliance monitoring purposes. |
| (a) | Non-income producing security. |
| (b) | Rate shown is the seven day yield as of December 31, 2022. |
| (c) | Security position is either entirely or partially held in a segregated account as collateral for securities sold short, aggregating a total market value of $1,122,525. |
| (d) | As of December 31, 2022, the Fund had a significant portion of its assets invested in the Semiconductors & Semiconductor Equipment industry. |
| | |
| ADR | American Depositary Receipt |
The Global Industry Classification Standard (“GICS”) was developed by and/or is the exclusive property of MSCI, Inc. and Standard & Poor’s Financial Services LLC (“S&P”). GICS is a service mark of MSCI and S&P and has been licensed for use by U.S. Bancorp Fund Services, LLC.
Distribution of investments by country or territory of incorporation, as a percentage of Total Investments, is as follows (Unaudited):
| Country | | Long | |
| United States^ | | | 95.9 | % | |
| Israel | | | 3.1 | % | |
| Netherlands | | | 1.0 | % | |
| Total | | | 100.0 | % | |
| ^ | United States allocation includes Short-Term Investment-Money Market Fund of 4.6% |
See accompanying notes to financial statements.
Needham Aggressive Growth Fund
Schedule of Investments
December 31, 2022
| | | Shares | | | Fair Value | |
| Common Stocks (92.8%) | | | | | | |
| | | | | | | |
| Aerospace & Defense (2.7%) | | | | | | |
| Parsons Corp. (a) | | | 77,500 | | | $ | 3,584,375 | |
| | | | | | | | | |
| Biotechnology (0.3%) | | | | | | | | |
| Avrobio, Inc. (a) | | | 24,513 | | | | 17,475 | |
| G1 Therapeutics, Inc. (a) | | | 70,000 | | | | 380,100 | |
| | | | | | | | 397,575 | |
| Building Products (0.7%) | | | | | | | | |
| Alpha Pro Tech, Ltd. (a) | | | 220,000 | | | | 884,400 | |
| Jewett-Cameron Trading Co., Ltd. (a) | | | 7,500 | | | | 43,275 | |
| | | | | | | | 927,675 | |
| Chemicals (5.1%) | | | | | | | | |
| Aspen Aerogels, Inc. (a) | | | 357,000 | | | | 4,209,030 | |
| Mativ Holdings, Inc. | | | 130,000 | | | | 2,717,000 | |
| | | | | | | | 6,926,030 | |
| Commercial Services & Supplies (2.7%) | | | | | | | | |
| ACV Auctions, Inc. – Class A (a) | | | 86,500 | | | | 710,165 | |
| Clean Harbors, Inc. (a) | | | 26,000 | | | | 2,967,120 | |
| | | | | | | | 3,677,285 | |
| Communications Equipment (7.1%) | | | | | | | | |
| ADTRAN Holdings, Inc. | | | 70,000 | | | | 1,315,300 | |
| Cambium Networks Corp. (a) | | | 71,400 | | | | 1,547,238 | |
| KVH Industries, Inc. (a) | | | 658,750 | | | | 6,732,425 | |
| | | | | | | | 9,594,963 | |
| Construction & Engineering (0.7%) | | | | | | | | |
| Matrix Service Co. (a) | | | 150,000 | | | | 933,000 | |
| | | | | | | | | |
| Construction Materials (2.2%) | | | | | | | | |
| Smith-Midland Corp. (a) | | | 146,100 | | | | 2,995,050 | |
| | | | | | | | | |
| Distributors (0.9%) | | | | | | | | |
| Educational Development Corp. | | | 400,000 | | | | 1,264,000 | |
| | | | | | | | | |
| Diversified Consumer Services (1.5%) | | | | | | | | |
| Bright Horizons Family Solutions, Inc. (a) | | | 32,500 | | | | 2,050,750 | |
| | | | | | | | | |
| Electrical Equipment (8.5%) | | | | | | | | |
| Thermon Group Holdings, Inc. (a) | | | 117,500 | | | | 2,359,400 | |
| Vertiv Holdings Co. | | | 220,000 | | | | 3,005,200 | |
| Vicor Corp. (a) | | | 112,500 | | | | 6,046,875 | |
| | | | | | | | 11,411,475 | |
| Electronic Equipment, Instruments & Components (5.3%) | | | | | | | | |
| Arlo Technologies, Inc. (a) | | | 45,000 | | | | 157,950 | |
| nLight, Inc. (a) | | | 148,800 | | | | 1,508,832 | |
| VIA Optronics AG (Germany) – ADR (a) | | | 130,000 | | | | 207,506 | |
| Vishay Precision Group, Inc. (a) | | | 135,500 | | | | 5,237,075 | |
| | | | | | | | 7,111,363 | |
See accompanying notes to financial statements.
Needham Aggressive Growth Fund
Schedule of Investments (Continued)
December 31, 2022
| | | Shares | | | Fair Value | |
| Common Stocks – Continued | | | | | | |
| | | | | | | |
| Entertainment (0.1%) | | | | | | |
| World Wrestling Entertainment, Inc. – Class A | | | 2,250 | | | $ | 154,170 | |
| | | | | | | | | |
| Health Care Equipment & Supplies (1.7%) | | | | | | | | |
| LeMaitre Vascular, Inc. | | | 20,500 | | | | 943,410 | |
| Omnicell, Inc. (a) | | | 2,900 | | | | 146,218 | |
| Precision Optics Corp., Inc. (a) | | | 198,500 | | | | 1,117,555 | |
| Sientra, Inc. (a) | | | 20,000 | | | | 4,058 | |
| ViewRay, Inc. (a) | | | 4,300 | | | | 19,264 | |
| | | | | | | | 2,230,505 | |
| Health Care Providers & Services (2.5%) | | | | | | | | |
| Laboratory Corp. of America Holdings | | | 12,300 | | | | 2,896,404 | |
| Quest Diagnostics, Inc. | | | 3,000 | | | | 469,320 | |
| | | | | | | | 3,365,724 | |
| Hotels, Restaurants & Leisure (1.2%) | | | | | | | | |
| Vacasa, Inc. – Class A (a) | | | 1,250,000 | | | | 1,575,000 | |
| | | | | | | | | |
| Household Products (1.1%) | | | | | | | | |
| Oil-Dri Corp. of America | | | 45,000 | | | | 1,509,300 | |
| | | | | | | | | |
| Insurance (1.5%) | | | | | | | | |
| Markel Corp. (a) | | | 1,500 | | | | 1,976,235 | |
| | | | | | | | | |
| Interactive Media & Services (0.1%) | | | | | | | | |
| AcuityAds Holdings, Inc. (Canada) (a) | | | 50,000 | | | | 77,500 | |
| | | | | | | | | |
| Internet & Direct Marketing Retail (0.7%) | | | | | | | | |
| ThredUp, Inc. – Class A (a) | | | 700,000 | | | | 917,000 | |
| | | | | | | | | |
| IT Services (2.9%) | | | | | | | | |
| Akamai Technologies, Inc. (a)(b) | | | 14,500 | | | | 1,222,350 | |
| BigCommerce Holdings, Inc. (a) | | | 7,500 | | | | 65,550 | |
| Research Solutions, Inc. (a) | | | 480,000 | | | | 926,400 | |
| Unisys Corp. (a) | | | 325,000 | | | | 1,660,750 | |
| | | | | | | | 3,875,050 | |
| Life Sciences Tools & Services (1.6%) | | | | | | | | |
| Bruker Corp. | | | 22,500 | | | | 1,537,875 | |
| CryoPort, Inc. (a) | | | 37,500 | | | | 650,625 | |
| Standard BioTools, Inc. (a) | | | 25,000 | | | | 29,250 | |
| | | | | | | | 2,217,750 | |
| Machinery (0.2%) | | | | | | | | |
| Westinghouse Air Brake Technologies Corp. | | | 3,000 | | | | 299,430 | |
| | | | | | | | | |
| Media (0.4%) | | | | | | | | |
| The Trade Desk, Inc. – Class A (a) | | | 12,000 | | | | 537,960 | |
| | | | | | | | | |
| Oil, Gas & Consumable Fuels (2.6%) | | | | | | | | |
| Adams Resources & Energy, Inc. | | | 90,500 | | | | 3,522,260 | |
| | | | | | | | | |
| Professional Services (1.8%) | | | | | | | | |
| CRA International, Inc. | | | 20,000 | | | | 2,448,600 | |
See accompanying notes to financial statements.
Needham Aggressive Growth Fund
Schedule of Investments (Continued)
December 31, 2022
| | | Shares | | | Fair Value | |
| Common Stocks – Continued | | | | | | |
| | | | | | | |
| Real Estate Investment Trusts (REITs) (1.4%) | | | | | | |
| American Tower Corp. | | | 2,250 | | | $ | 476,685 | |
| Equinix, Inc. | | | 2,100 | | | | 1,375,563 | |
| | | | | | | | 1,852,248 | |
| Semiconductors & Semiconductor Equipment (21.9%) | | | | | | | | |
| ASML Holding NV (Netherlands) | | | 2,500 | | | | 1,366,000 | |
| AXT, Inc. (a) | | | 125,000 | | | | 547,500 | |
| Entegris, Inc. | | | 62,500 | | | | 4,099,375 | |
| FormFactor, Inc. (a) | | | 30,000 | | | | 666,900 | |
| MKS Instruments, Inc. | | | 22,000 | | | | 1,864,060 | |
| Nova, Ltd. (Israel) (a) | | | 60,000 | | | | 4,900,800 | |
| PDF Solutions, Inc. (a)(b) | | | 345,000 | | | | 9,839,400 | |
| Photronics, Inc. (a) | | | 225,000 | | | | 3,786,750 | |
| Pivotal Systems Corp. (a) | | | 1,082,494 | | | | 39,430 | |
| SiTime Corp. (a) | | | 5,000 | | | | 508,100 | |
| SkyWater Technology, Inc. (a) | | | 7,500 | | | | 53,325 | |
| Teradyne, Inc. | | | 5,000 | | | | 436,750 | |
| Veeco Instruments, Inc. (a) | | | 75,000 | | | | 1,393,500 | |
| | | | | | | | 29,501,890 | |
| Software (4.5%) | | | | | | | | |
| Altair Engineering, Inc. – Class A (a) | | | 26,000 | | | | 1,182,220 | |
| Copperleaf Technologies, Inc. (Canada) (a) | | | 75,000 | | | | 317,947 | |
| ESI Group (France) (a) | | | 35,000 | | | | 2,764,962 | |
| GSE Systems, Inc. (a)(d) | | | 1,500,000 | | | | 1,080,000 | |
| Q2 Holdings, Inc. (a) | | | 8,000 | | | | 214,960 | |
| Telos Corp. (a) | | | 100,000 | | | | 509,000 | |
| | | | | | | | 6,069,089 | |
| Specialty Retail (0.9%) | | | | | | | | |
| CarMax, Inc. (a) | | | 20,500 | | | | 1,248,245 | |
| | | | | | | | | |
| Technology Hardware, Storage & Peripherals (7.0%) | | | | | | | | |
| Apple, Inc. (b) | | | 27,800 | | | | 3,612,054 | |
| Intevac, Inc. (a) | | | 85,000 | | | | 549,950 | |
| Super Micro Computer, Inc. (a) | | | 65,000 | | | | 5,336,500 | |
| | | | | | | | 9,498,504 | |
| Textiles, Apparel & Luxury Goods (0.1%) | | | | | | | | |
| Allbirds, Inc. (a) | | | 75,000 | | | | 181,500 | |
| | | | | | | | | |
| Trading Companies & Distributors (0.9%) | | | | | | | | |
| Transcat, Inc. (a) | | | 17,500 | | | | 1,240,225 | |
| Total Common Stocks | | | | | | | | |
| (Cost $98,908,881) | | | | | | $ | 125,171,726 | |
See accompanying notes to financial statements.
Needham Aggressive Growth Fund
Schedule of Investments (Continued)
December 31, 2022
| | | Shares | | | Fair Value | |
| Short-Term Investments (6.7%) | | | | | | |
| | | | | | | |
| Money Market Fund (6.7%) | | | | | | |
| Dreyfus Treasury Securities Cash Management – Institutional Class, 3.93% (c) | | | | | | |
| Total Short-Term Investments | | | | | | |
| (Cost $9,027,317) | | | 9,027,317 | | | $ | 9,027,317 | |
| Total Investments (99.5%) | | | | | | | | |
| (Cost $107,936,197) | | | | | | | 134,199,043 | |
| Other Assets in Excess of Liabilities (0.5%) | | | | | | | 720,261 | |
| Net Assets (100.0%) | | | | | | $ | 134,919,304 | |
| | Percentages are stated as a percent of net assets. |
| | Industry classifications may be different than those used for compliance monitoring purposes. |
| (a) | Non-income producing security. |
| (b) | Security position is either entirely or partially held in a segregated account as collateral for securities sold short, aggregating a total market value of $1,185,535. |
| (c) | Rate shown is the seven day yield as of December 31, 2022. |
| (d) | Affiliated security. Please refer to Note 11 of the Financial Statements. |
| | |
| ADR | American Depositary Receipt |
The Global Industry Classification Standard (“GICS”) was developed by and/or is the exclusive property of MSCI, Inc. and Standard & Poor’s Financial Services LLC (“S&P”).
Distribution of investments by country or territory of incorporation, as a percentage of Total Investments, is as follows:
| Country | | Long | |
| United States^ | | | 92.8 | % | |
| Israel | | | 3.7 | % | |
| France | | | 2.1 | % | |
| Netherlands | | | 1.0 | % | |
| Canada | | | 0.2 | % | |
| Germany | | | 0.2 | % | |
| Total | | | 100.0 | % | |
| ^ | United States allocation includes Short-Term Investment-Money Market Fund of 6.7% |
See accompanying notes to financial statements.
Needham Small Cap Growth Fund
Schedule of Investments
December 31, 2022
| | | Shares | | | Fair Value | |
| Common Stocks (84.4%) | | | | | | |
| | | | | | | |
| Chemicals (3.9%) | | | | | | |
| Aspen Aerogels, Inc. (a)(b) | | | 644,734 | | | $ | 7,601,414 | |
| | | | | | | | | |
| Communications Equipment (16.8%) | | | | | | | | |
| ADTRAN Holdings, Inc. | | | 300,000 | | | | 5,637,000 | |
| Cambium Networks Corp. (a) | | | 350,000 | | | | 7,584,500 | |
| Infinera Corp. (a) | | | 1,100,000 | | | | 7,414,000 | |
| KVH Industries, Inc. (a) | | | 492,500 | | | | 5,033,350 | |
| Lumentum Holdings, Inc. (a) | | | 100,000 | | | | 5,217,000 | |
| ViaSat, Inc. (a) | | | 70,000 | | | | 2,215,500 | |
| | | | | | | | 33,101,350 | |
| Electrical Equipment (3.6%) | | | | | | | | |
| Sensata Technologies Holding PLC | | | 75,000 | | | | 3,028,500 | |
| Vicor Corp. (a) | | | 75,000 | | | | 4,031,250 | |
| | | | | | | | 7,059,750 | |
| Electronic Equipment, Instruments & Components (11.5%) | | | | | | | | |
| Akoustis Technologies, Inc. (a) | | | 1,092,500 | | | | 3,080,850 | |
| Coherent Corp. (a) | | | 100,000 | | | | 3,510,000 | |
| Frequency Electronics, Inc. (a)(d) | | | 570,000 | | | | 4,018,500 | |
| nLight, Inc. (a) | | | 1,000,000 | | | | 10,140,000 | |
| Rogers Corp. (a) | | | 15,000 | | | | 1,790,100 | |
| Vishay Precision Group, Inc. (a) | | | 4,000 | | | | 154,600 | |
| | | | | | | | 22,694,050 | |
| Health Care Equipment & Supplies (5.1%) | | | | | | | | |
| Sientra, Inc. (a) | | | 700,000 | | | | 142,030 | |
| ViewRay, Inc. (a) | | | 2,215,000 | | | | 9,923,200 | |
| | | | | | | | 10,065,230 | |
| IT Services (2.1%) | | | | �� | | | | |
| BigCommerce Holdings, Inc. (a) | | | 380,000 | | | | 3,321,200 | |
| Edgio, Inc. (a) | | | 700,000 | | | | 791,000 | |
| | | | | | | | 4,112,200 | |
| Life Sciences Tools & Services (2.2%) | | | | | | | | |
| Standard BioTools, Inc. (a) | | | 3,647,157 | | | | 4,267,174 | |
| | | | | | | | | |
| Machinery (1.6%) | | | | | | | | |
| Chart Industries, Inc. (a) | | | 27,500 | | | | 3,168,825 | |
| | | | | | | | | |
| Semiconductors & Semiconductor Equipment (12.5%) | | | | | | | | |
| AXT, Inc. (a) | | | 1,000,000 | | | | 4,380,000 | |
| FormFactor, Inc. (a)(b) | | | 180,000 | | | | 4,001,400 | |
| MaxLinear, Inc. (a) | | | 25,000 | | | | 848,750 | |
| MKS Instruments, Inc. | | | 44,500 | | | | 3,770,485 | |
| Photronics, Inc. (a)(b) | | | 550,000 | | | | 9,256,500 | |
| Veeco Instruments, Inc. (a) | | | 120,000 | | | | 2,229,600 | |
| | | | | | | | 24,486,735 | |
See accompanying notes to financial statements.
Needham Small Cap Growth Fund
Schedule of Investments (Continued)
December 31, 2022
| | | Shares | | | Fair Value | |
| Common Stocks – Continued | | | | | | |
| | | | | | | |
| Software (19.5%) | | | | | | |
| 8x8, Inc. (a) | | | 1,600,000 | | | $ | 6,912,000 | |
| Alteryx, Inc. – Class A (a) | | | 30,000 | | | | 1,520,100 | |
| Sumo Logic, Inc. (a) | | | 1,000,000 | | | | 8,100,000 | |
| Telos Corp. (a) | | | 1,200,000 | | | | 6,108,000 | |
| Upland Software, Inc. (a) | | | 542,500 | | | | 3,868,025 | |
| Yext, Inc. (a) | | | 1,100,612 | | | | 7,186,996 | |
| Zuora, Inc. – Class A (a) | | | 727,488 | | | | 4,626,823 | |
| | | | | | | | 38,321,944 | |
| Specialty Retail (0.3%) | | | | | | | | |
| CarMax, Inc. (a) | | | 10,000 | | | | 608,900 | |
| | | | | | | | | |
| Technology Hardware, Storage & Peripherals (5.3%) | | | | | | | | |
| Intevac, Inc. (a)(d) | | | 1,608,550 | | | | 10,407,319 | |
| Total Common Stocks | | | | | | | | |
| (Cost $209,684,812) | | | | | | $ | 165,894,891 | |
| | | | | | | | | |
| Warrants (0.0%) | | | | | | | | |
| Agile Therapeutics, Inc. 0.34% (a) | | | 4,375 | | | | 345 | |
| Total Warrants | | | | | | | | |
| (Cost $1,750) | | | | | | | 345 | |
| | | | | | | | | |
| Short-Term Investments (18.2%) | | | | | | | | |
| | | | | | | | | |
| Money Market Fund (18.2%) | | | | | | | | |
| Dreyfus Treasury Securities Cash Management – Institutional Class, 3.93% (c) | | | | | | | | |
| Total Short-Term Investments | | | | | | | | |
| (Cost $35,794,583) | | | 35,794,583 | | | $ | 35,794,583 | |
| Total Investments (102.6%) | | | | | | | | |
| (Cost $245,481,145) | | | | | | | 201,689,819 | |
| Liabilities in Excess of Other Assets (-2.6%) | | | | | | | (5,057,138 | ) |
| Net Assets (100.0%) | | | | | | $ | 196,632,681 | |
| | Percentages are stated as a percent of net assets. |
| | Industry classifications may be different than those used for compliance purposes. |
| (a) | Non-income producing security. |
| (b) | Security position is either entirely or partially held in a segregated account as collateral for securities sold short, aggregating a total market value of $1,284,750. |
| (c) | Rate shown is the seven day yield as of December 31, 2022. |
| (d) | Affiliated security. Please refer to Note 11 of the Financial Statements. |
The Global Industry Classification Standard (“GICS”) was developed by and/or is the exclusive property of MSCI, Inc. and Standard & Poor’s Financial Services LLC (“S&P”).
Distribution of investments by country or territory of incorporation, as a percentage of Total Investments, is as follows (Unaudited):
| Country | | Long | |
| United States^ | | | 100.0 | % | |
| Total | | | 100.0 | % | |
| ^ | United States allocation includes Short-Term Investment-Money Market Fund of 18.2% |
See accompanying notes to financial statements.
Statements of Assets and Liabilities
December 31, 2022
| | | | | | Needham | | | Needham | |
| | | Needham | | | Aggressive | | | Small Cap | |
| | | Growth Fund | | | Growth Fund | | | Growth Fund | |
| Assets | | | | | | | | | |
| Investments, at Value | | | | | | | | | |
| Unaffiliated Securities (Cost $61,144,020, $105,325,932, $231,022,813) | | $ | 120,481,024 | | | $ | 133,119,043 | | | $ | 187,264,000 | |
| Affiliated Securities, (Cost $—, $2,610,265, $14,458,332) | | | — | | | | 1,080,000 | | | | 14,425,819 | |
| Foreign Currency, (Cost $—, $9, $—) | | | — | | | | 10 | | | | — | |
| Cash | | | 32,655 | | | | — | | | | 321,999 | |
| Receivables: | | | | | | | | | | | | |
| Deposit with Broker for Securities Sold Short | | | 2,059 | | | | — | | | | — | |
| Dividends and Interest | | | 50,502 | | | | 34,054 | | | | 182,978 | |
| Fund Shares Sold | | | 121,078 | | | | 492,674 | | | | 536,663 | |
| Investment Securities Sold | | | 936,573 | | | | 564,722 | | | | — | |
| Prepaid Expenses | | | 24,250 | | | | 40,976 | | | | 59,075 | |
| Total Assets | | | 121,648,141 | | | | 135,331,479 | | | | 202,790,534 | |
| | | | | | | | | | | | | |
| Liabilities | | | | | | | | | | | | |
| Payables: | | | | | | | | | | | | |
| Investment Securities Purchased | | | 303,314 | | | | 130,150 | | | | 3,026,851 | |
| Fund Shares Redeemed | | | 525,875 | | | | 75,694 | | | | 2,716,801 | |
| Due to Adviser, net | | | 133,596 | | | | 110,220 | | | | 231,105 | |
| Distribution Fees | | | 13,954 | | | | 12,041 | | | | 9,963 | |
| Administration and Accounting Fees | | | 26,072 | | | | 27,450 | | | | 33,689 | |
| Transfer Agent Fees | | | 8,734 | | | | 14,069 | | | | 26,751 | |
| Audit and Tax Fees | | | 42,263 | | | | 26,867 | | | | 64,129 | |
| Directors’ Fees | | | 3,537 | | | | 5,190 | | | | 6,600 | |
| Accrued Expenses and Other Liabilities | | | 31,191 | | | | 10,494 | | | | 41,964 | |
| Total Liabilities | | | 1,088,536 | | | | 412,175 | | | | 6,157,853 | |
| Net Assets | | $ | 120,559,605 | | | $ | 134,919,304 | | | $ | 196,632,681 | |
| | | | | | | | | | | | | |
| Retail Class Shares | | | | | | | | | | | | |
| Net Assets | | | 62,117,974 | | | | 55,027,842 | | | | 59,054,176 | |
| Shares Issued and Outstanding $0.001 Par Value | | | | | | | | | | | | |
| (Authorized 800,000,000,100,000,000 and 100,000,000 respectively) | | | 1,423,712 | | | | 1,871,668 | | | | 3,810,407 | |
| Net Asset Value and Offering Price Per Share | | $ | 43.63 | | | $ | 29.40 | | | $ | 15.50 | |
| | | | | | | | | | | | | |
| Institutional Class Shares | | | | | | | | | | | | |
| Net Assets | | | 58,441,631 | | | | 79,891,462 | | | | 137,578,505 | |
| Shares Issued and Outstanding $0.001 Par Value | | | | | | | | | | | | |
| (Authorized 800,000,000,100,000,000 and 100,000,000 respectively) | | | 1,291,010 | | | | 2,600,002 | | | | 8,388,897 | |
| Net Asset Value and Offering Price Per Share | | $ | 45.27 | | | $ | 30.73 | | | $ | 16.40 | |
| | | | | | | | | | | | | |
| Components of Net Assets | | | | | | | | | | | | |
| Paid-in Capital | | | 61,853,166 | | | | 108,659,960 | | | | 279,162,720 | |
| Distributable Earnings | | | 58,706,439 | | | | 26,259,344 | | | | (82,530,039 | ) |
| Total Net Assets | | $ | 120,559,605 | | | $ | 134,919,304 | | | $ | 196,632,681 | |
See accompanying notes to financial statements.
Statements of Operations
For the year ended December 31, 2022
| | | | | | Needham | | | Needham | |
| | | Needham | | | Aggressive | | | Small Cap | |
| | | Growth Fund | | | Growth Fund | | | Growth Fund | |
| Investment Income | | | | | | | | | |
| Dividend Income from unaffiliated securities | | $ | 661,140 | | | $ | 436,696 | | | $ | 143,595 | |
| (net of foreign withholding tax of $4,963, $5,038, $—) | | | | | | | | | | | | |
| Interest Income | | | 63,455 | | | | 227,063 | | | | 690,411 | |
| Total Investment Income | | | 724,595 | | | | 663,759 | | | | 834,006 | |
| | | | | | | | | | | | | |
| Expenses | | | | | | | | | | | | |
| Investment Advisory Fees | | | 1,802,550 | | | | 1,755,716 | | | | 2,591,993 | |
| Distribution Fees | | | 183,081 | | | | 144,812 | | | | 182,305 | |
| Administration and Accounting Fees | | | 172,696 | | | | 166,696 | | | | 230,646 | |
| Audit Fees | | | 56,230 | | | | 40,848 | | | | 95,351 | |
| Chief Compliance Officer Fees | | | 11,004 | | | | 10,615 | | | | 15,749 | |
| Custodian Fees | | | 14,521 | | | | 16,224 | | | | 15,764 | |
| Directors’ Fees | | | 9,810 | | | | 12,433 | | | | 25,798 | |
| Filing Fees | | | 71,550 | | | | 58,156 | | | | 78,997 | |
| Legal Fees | | | 48,534 | | | | 29,603 | | | | 120,203 | |
| Printing Fees | | | 9,527 | | | | 14,285 | | | | 42,896 | |
| Transfer Agent Fees | | | 53,718 | | | | 66,755 | | | | 134,681 | |
| Other Expenses | | | 40,878 | | | | 19,935 | | | | 963 | |
| Total Expenses | | | 2,474,099 | | | | 2,336,078 | | | | 3,535,346 | |
| Fees Waived by Investment Adviser | | | (163,006 | ) | | | (371,424 | ) | | | (724,898 | ) |
| Fees Recouped by Investment Adviser | | | 36,285 | | | | 80,996 | | | | 125,549 | |
| Net Expenses | | | 2,347,378 | | | | 2,045,650 | | | | 2,935,997 | |
| Net Investment Loss | | | (1,622,783 | ) | | | (1,381,891 | ) | | | (2,101,991 | ) |
| | | | | | | | | | | | | |
| Net Realized / Change in Unrealized Gain (Loss) from Investments, | | | | | | | | | | | | |
| Securities Sold Short, Foreign Currency Transactions and Currency | | | | | | | | | | | | |
| Net Realized Gain (Loss) from Unaffiliated Securities | | | (625,056 | ) | | | 1,207,400 | | | | (38,412,252 | ) |
| Net Realized Loss from Affiliated Securities | | | — | | | | — | | | | (123,086 | ) |
| Net Realized Gain from Securities Sold Short | | | 63,370 | | | | 43,149 | | | | 385,614 | |
| Net Realized Gain from Foreign Currency Transactions and Currency | | | — | | | | 1,578 | | | | — | |
| Change in Unrealized Depreciation on Investments and Securities Sold Short | | | (65,440,863 | ) | | | (45,962,634 | ) | | | (44,675,487 | ) |
| Change in Unrealized Appreciation (Depreciation) on Affiliated Investments | | | — | | | | (1,456,987 | ) | | | 1,441,780 | |
| Change in Unrealized Appreciation on Foreign Currency Transactions and Currency | | | — | | | | 1,654 | | | | — | |
| Net Realized / Change in Unrealized Gain from Investments, | | | | | | | | | | | | |
| Securities Sold Short, Foreign Currency Transactions and Currency | | | (66,002,549 | ) | | | (46,165,840 | ) | | | (81,383,431 | ) |
| Change in Net Assets Resulting from Operations | | $ | (67,625,332 | ) | | $ | (47,547,731 | ) | | $ | (83,485,422 | ) |
See accompanying notes to financial statements.
Needham Growth Fund
Statements of Changes in Net Assets
| | | Year Ended | | | Year Ended | |
| | | December 31, 2022 | | | December 31, 2021 | |
| Change in Net Assets | | | | | | |
| Operations: | | | | | | |
| Net Investment Loss | | $ | (1,622,783 | ) | | $ | (2,057,039 | ) |
| Net Realized Gain (Loss) from Investments, Securities Sold Short, | | | | | | | | |
| Foreign Currency Transactions, and Currency | | | (561,686 | ) | | | 11,831,914 | |
| Net Change in Unrealized Appreciation (Depreciation) on Investments, | | | | | | | | |
| Securities Sold Short, Foreign Currency Translations | | | (65,440,863 | ) | | | 30,202,068 | |
| Change in Net Assets Resulting from Operations | | | (67,625,332 | ) | | | 39,976,943 | |
| | | | | | | | | |
| Distributable Earnings: | | | | | | | | |
| Retail Class | | | (1,112,516 | ) | | | (6,609,791 | ) |
| Institutional Class | | | (1,008,195 | ) | | | (6,714,291 | ) |
| Total Distributable Earnings | | | (2,120,711 | ) | | | (13,324,082 | ) |
| | | | | | | | | |
| Capital Transactions: | | | | | | | | |
| Retail Class: | | | | | | | | |
| Shares Issued | | | 3,103,586 | | | | 10,831,860 | |
| Shares Issued in Reinvestment of Distribution | | | 1,046,663 | | | | 6,263,875 | |
| Shares Exchanged for Institutional Class Shares | | | (329,331 | ) | | | (766,301 | ) |
| Shares Redeemed | | | (8,542,497 | ) | | | (12,784,502 | ) |
| Institutional Class: | | | | | | | | |
| Shares Issued | | | 12,533,645 | | | | 43,574,350 | |
| Shares Issued in Reinvestment of Distribution | | | 975,002 | | | | 6,484,070 | |
| Shares Issued in Exchange for Retail Class Shares | | | 329,331 | | | | 766,302 | |
| Shares Redeemed | | | (35,719,878 | ) | | | (4,786,939 | ) |
| Total Change in Net Assets from Capital Transactions | | | (26,603,479 | ) | | | 49,582,715 | |
| | | | | | | | | |
| Change in Net Assets | | | (96,349,522 | ) | | | 76,235,576 | |
| | | | | | | | | |
| Total Net Assets | | | | | | | | |
| Beginning of Year | | | 216,909,127 | | | | 140,673,551 | |
| End of Year | | $ | 120,559,605 | | | $ | 216,909,127 | |
| | | | | | | | | |
| Share Transaction: | | | | | | | | |
| Retail Class: | | | | | | | | |
| Number of Shares Issued | | | 57,289 | | | | 160,422 | |
| Number of Shares Reinvested | | | 23,584 | | | | 90,245 | |
| Number of Shares Exchanged for Institutional Class Shares | | | (6,573 | ) | | | (11,849 | ) |
| Number of Shares Redeemed | | | (165,817 | ) | | | (202,111 | ) |
| Change in Retail Class Shares | | | (91,517 | ) | | | 36,707 | |
| Institutional Class: | | | | | | | | |
| Number of Shares Issued | | | 228,548 | | | | 629,968 | |
| Number of Shares Reinvested | | | 21,182 | | | | 90,547 | |
| Number of Shares Issued in Exchange for Retail Class Shares | | | 6,351 | | | | 11,515 | |
| Number of Shares Redeemed | | | (638,226 | ) | | | (70,897 | ) |
| Change in Institutional Class Shares | | | (382,145 | ) | | | 661,133 | |
| Total Change in Shares | | | (473,662 | ) | | | 697,840 | |
See accompanying notes to financial statements.
Needham Aggressive Growth Fund
Statements of Changes in Net Assets
| | | Year Ended | | | Year Ended | |
| | | December 31, 2022 | | | December 31, 2021 | |
| Change in Net Assets | | | | | | |
| Operations: | | | | | | |
| Net Investment Loss | | $ | (1,381,891 | ) | | $ | (1,185,089 | ) |
| Net Realized Gain from Investments, Securities Sold Short, | | | | | | | | |
| Foreign Currency Transactions, and Currency | | | 1,252,127 | | | | 7,541,822 | |
| Net Change in Unrealized Appreciation (Depreciation) on Investments, | | | | | | | | |
| Securities Sold Short, Foreign Currency Translations | | | (47,417,967 | ) | | | 23,112,286 | |
| Change in Net Assets Resulting from Operations | | | (47,547,731 | ) | | | 29,469,019 | |
| | | | | | | | | |
| Distributable Earnings: | | | | | | | | |
| Retail Class | | | — | | | | (3,505,617 | ) |
| Institutional Class | | | — | | | | (3,738,621 | ) |
| Total Distributable Earnings | | | — | | | | (7,244,238 | ) |
| | | | | | | | | |
| Capital Transactions: | | | | | | | | |
| Retail Class: | | | | | | | | |
| Shares Issued | | | 32,589,452 | | | | 17,590,552 | |
| Shares Issued in Reinvestment of Distribution | | | — | | | | 3,443,051 | |
| Shares Exchanged for Institutional Class Shares | | | (738,424 | ) | | | (2,770,037 | ) |
| Shares Redeemed | | | (19,962,515 | ) | | | (6,070,119 | ) |
| Institutional Class: | | | | | | | | |
| Shares Issued | | | 75,218,012 | | | | 33,454,969 | |
| Shares Issued in Reinvestment of Distribution | | | — | | | | 3,737,661 | |
| Shares Issued in Exchange for Retail Class Shares | | | 738,424 | | | | 2,770,037 | |
| Shares Redeemed | | | (45,755,366 | ) | | | (8,393,730 | ) |
| Total Change in Net Assets from Capital Transactions | | | 42,089,583 | | | | 43,762,384 | |
| | | | | | | | | |
| Change in Net Assets | | | (5,458,148 | ) | | | 65,987,165 | |
| | | | | | | | | |
| Total Net Assets | | | | | | | | |
| Beginning of Year | | | 140,377,452 | | | | 74,390,287 | |
| End of Year | | $ | 134,919,304 | | | $ | 140,377,452 | |
| | | | | | | | | |
| Share Transaction: | | | | | | | | |
| Retail Class: | | | | | | | | |
| Number of Shares Issued | | | 962,894 | | | | 446,334 | |
| Number of Shares Reinvested | | | — | | | | 84,430 | |
| Number of Shares Exchanged for Institutional Class Shares | | | (23,793 | ) | | | (73,582 | ) |
| Number of Shares Redeemed | | | (635,372 | ) | | | (164,073 | ) |
| Change in Retail Class Shares | | | 303,729 | | | | 293,109 | |
| Institutional Class: | | | | | | | | |
| Number of Shares Issued | | | 2,160,212 | | | | 824,655 | |
| Number of Shares Reinvested | | | — | | | | 88,361 | |
| Number of Shares Issued in Exchange for Retail Class Shares | | | 22,856 | | | | 71,151 | |
| Number of Shares Redeemed | | | (1,406,449 | ) | | | (211,402 | ) |
| Change in Institutional Class Shares | | | 776,619 | | | | 772,765 | |
| Total Change in Shares | | | 1,080,348 | | | | 1,065,874 | |
See accompanying notes to financial statements.
Needham Small Cap Growth Fund
Statements of Changes in Net Assets
| | | Year Ended | | | Year Ended | |
| | | December 31, 2022 | | | December 31, 2021 | |
| Change in Net Assets | | | | | | |
| Operations: | | | | | | |
| Net Investment Loss | | $ | (2,101,991 | ) | | $ | (3,645,056 | ) |
| Net Realized Gain (Loss) from Investments, Securities Sold Short, | | | | | | | | |
| Foreign Currency Transactions, and Currency | | | (38,149,724 | ) | | | 60,836,434 | |
| Net Change in Unrealized Depreciation on Investments, | | | | | | | | |
| Securities Sold Short, Foreign Currency Translations | | | (43,233,707 | ) | | | (41,922,251 | ) |
| Change in Net Assets Resulting from Operations | | | (83,485,422 | ) | | | 15,269,127 | |
| | | | | | | | | |
| Distributable Earnings: | | | | | | | | |
| Retail Class | | | (2,436,435 | ) | | | (24,383,677 | ) |
| Institutional Class | | | (5,043,317 | ) | | | (34,026,765 | ) |
| Total Distributable Earnings | | | (7,479,752 | ) | | | (58,410,442 | ) |
| | | | | | | | | |
| Capital Transactions: | | | | | | | | |
| Retail Class: | | | | | | | | |
| Shares Issued | | | 23,274,194 | | | | 105,261,275 | |
| Shares Issued in Reinvestment of Distribution | | | 2,249,936 | | | | 22,837,418 | |
| Shares Exchanged for Institutional Class Shares | | | (355,490 | ) | | | (5,552,115 | ) |
| Shares Redeemed | | | (44,181,952 | ) | | | (81,878,650 | ) |
| Institutional Class: | | | | | | | | |
| Shares Issued | | | 89,867,190 | | | | 181,275,931 | |
| Shares Issued in Reinvestment of Distribution | | | 4,912,810 | | | | 31,653,377 | |
| Shares Issued in Exchange for Retail Class Shares | | | 355,490 | | | | 5,552,115 | |
| Shares Redeemed | | | (75,209,316 | ) | | | (146,472,526 | ) |
| Total Change in Net Assets from Capital Transactions | | | 912,862 | | | | 112,676,825 | |
| | | | | | | | | |
| Change in Net Assets | | | (90,052,312 | ) | | | 69,535,510 | |
| | | | | | | | | |
| Total Net Assets | | | | | | | | |
| Beginning of Year | | | 286,684,993 | | | | 217,149,483 | |
| End of Year | | $ | 196,632,681 | | | $ | 286,684,993 | |
| | | | | | | | | |
| Share Transaction: | | | | | | | | |
| Retail Class: | | | | | | | | |
| Number of Shares Issued | | | 1,274,649 | | | | 3,671,285 | |
| Number of Shares Reinvested | | | 147,827 | | | | 921,235 | |
| Number of Shares Exchanged for Institutional Class Shares | | | (22,360 | ) | | | (210,245 | ) |
| Number of Shares Redeemed | | | (2,454,992 | ) | | | (2,974,884 | ) |
| Change in Retail Class Shares | | | (1,054,876 | ) | | | 1,407,391 | |
| Institutional Class: | | | | | | | | |
| Number of Shares Issued | | | 4,829,226 | | | | 6,080,028 | |
| Number of Shares Reinvested | | | 305,333 | | | | 1,218,844 | |
| Number of Shares Issued in Exchange for Retail Class Shares | | | 21,248 | | | | 201,656 | |
| Number of Shares Redeemed | | | (3,914,928 | ) | | | (5,154,426 | ) |
| Change in Institutional Class Shares | | | 1,240,879 | | | | 2,346,102 | |
| Total Change in Shares | | | 186,003 | | | | 3,753,493 | |
See accompanying notes to financial statements.
Needham Growth Fund
Financial Highlights
| | | Retail Class | |
| | | Year Ended December 31, | |
| (For a Share Outstanding Throughout each Year) | | 2022 | | | 2021 | | | 2020 | | | 2019 | | | 2018 | |
| Net Asset Value, Beginning of Year | | $ | 66.90 | | | $ | 55.89 | | | $ | 41.99 | | | $ | 33.04 | | | $ | 42.91 | |
| Investment Operations | | | | | | | | | | | | | | | | | | | | |
| Net Investment Loss | | | (0.67 | ) | | | (0.89 | ) | | | (0.56 | ) | | | (0.48 | ) | | | (0.88 | ) |
| Net Realized and Unrealized Gain (Loss) on Investments | | | (21.82 | ) | | | 16.53 | | | | 17.66 | | | | 14.18 | | | | (3.11 | ) |
| Total from Investment Operations | | | (22.49 | ) | | | 15.64 | | | | 17.10 | | | | 13.70 | | | | (3.99 | ) |
| | | | | | | | | | | | | | | | | | | | | |
| Less Distributions | | | | | | | | | | | | | | | | | | | | |
| Net Realized Gains | | | (0.78 | ) | | | (4.63 | ) | | | (3.20 | ) | | | (4.75 | ) | | | (5.88 | ) |
| Total Distributions | | | (0.78 | ) | | | (4.63 | ) | | | (3.20 | ) | | | (4.75 | ) | | | (5.88 | ) |
| | | | | | | | | | | | | | | | | | | | | |
| Net Asset Value, End of Year | | $ | 43.63 | | | $ | 66.90 | | | $ | 55.89 | | | $ | 41.99 | | | $ | 33.04 | |
| | | | | | | | | | | | | | | | | | | | | |
| Total Return | | | (33.66 | )% | | | 27.68 | % | | | 41.59 | % | | | 42.31 | %(1) | | | (10.26 | )% |
| Net Assets, End of Year (000’s) | | $ | 62,117 | | | $ | 101,366 | | | $ | 82,628 | | | $ | 65,526 | | | $ | 54,245 | |
| Ratios/Supplemental Data | | | | | | | | | | | | | | | | | | | | |
| Ratio of Net Expenses to Average Net Assets | | | 1.85 | % | | | 1.78 | % | | | 1.85 | % | | | 1.98 | % | | | 2.76 | % |
| Ratio of Net Expenses to Average Net Assets | | | | | | | | | | | | | | | | | | | | |
| (before interest and dividend expense) | | | 1.85 | %(2) | | | 1.78 | % | | | 1.85 | % | | | 1.95 | % | | | 1.92 | % |
| Ratio of Gross Expenses to Average Net Assets | | | | | | | | | | | | | | | | | | | | |
| (before waiver and reimbursement of expenses) | | | 1.85 | % | | | 1.78 | % | | | 1.83 | % | | | 2.01 | % | | | 2.76 | % |
| Ratio of Net Investment Loss to Average Net Assets | | | (1.34 | )% | | | (1.40 | )% | | | (1.23 | )% | | | (1.21 | )% | | | (2.07 | )% |
| Ratio of Net Investment Loss to Average Net Assets | | | | | | | | | | | | | | | | | | | | |
| (before waivers and reimbursements of expenses) | | | (1.34 | )% | | | (1.40 | )% | | | (1.21 | )% | | | (1.24 | )% | | | (2.07 | )% |
| Portfolio turnover rate | | | 14 | % | | | 15 | % | | | 15 | % | | | 13 | % | | | 8 | % |
(1) | The return reflects the actual performance for the year and does not include the impact of any adjustments made for financial reporting required by Generally Accepted Accounting Principles (GAAP). |
(2) | The Adviser has contractually agreed to waive its fee and, if necessary, reimburse the Fund until April 30, 2023 to the extent Total Annual Fund Operating Expenses exceed 1.85% of the average daily net assets of the Retail Class shares of the Fund. |
See accompanying notes to financial statements.
Needham Growth Fund
Financial Highlights
| | | Institutional Class | |
| | | Year Ended December 31, | |
| (For a Share Outstanding Throughout each Year) | | 2022 | | | 2021 | | | 2020 | | | 2019 | | | 2018 | |
| Net Asset Value, Beginning of Year | | $ | 69.06 | | | $ | 57.36 | | | $ | 42.83 | | | $ | 33.45 | | | $ | 43.15 | |
| Investment Operations | | | | | | | | | | | | | | | | | | | | |
| Net Investment Loss | | | (0.47 | ) | | | (0.68 | ) | | | (0.36 | ) | | | (0.26 | ) | | | (0.65 | ) |
| Net Realized and Unrealized Gain (Loss) on Investments | | | (22.54 | ) | | | 17.01 | | | | 18.09 | | | | 14.39 | | | | (3.17 | ) |
| Total from Investment Operations | | | (23.01 | ) | | | 16.33 | | | | 17.73 | | | | 14.13 | | | | (3.82 | ) |
| | | | | | | | | | | | | | | | | | | | | |
| Less Distributions | | | | | | | | | | | | | | | | | | | | |
| Net Realized Gains | | | (0.78 | ) | | | (4.63 | ) | | | (3.20 | ) | | | (4.75 | ) | | | (5.88 | ) |
| Total Distributions | | | (0.78 | ) | | | (4.63 | ) | | | (3.20 | ) | | | (4.75 | ) | | | (5.88 | ) |
| Net Asset Value, End of Year | | $ | 45.27 | | | $ | 69.06 | | | $ | 57.36 | | | $ | 42.83 | | | $ | 33.45 | |
| | | | | | | | | | | | | | | | | | | | | |
| Total Return | | | (33.34 | )% | | | 28.18 | % | | | 42.24 | % | | | 43.13 | % | | | (9.83 | )% |
| Net Assets, End of Year (000’s) | | $ | 58,441 | | | $ | 115,543 | | | $ | 58,046 | | | $ | 44,959 | | | $ | 29,149 | |
| Ratios/Supplemental Data | | | | | | | | | | | | | | | | | | | | |
| Ratio of Net Expenses to Average Net Assets | | | 1.40 | % | | | 1.40 | % | | | 1.40 | % | | | 1.43 | % | | | 2.21 | % |
| Ratio of Net Expenses to Average Net Assets | | | | | | | | | | | | | | | | | | | | |
| (before interest and dividend expense) | | | 1.40 | %(1) | | | 1.40 | % | | | 1.40 | % | | | 1.40 | % | | | 1.40 | % |
| Ratio of Gross Expenses to Average Net Assets | | | | | | | | | | | | | | | | | | | | |
| (before waiver and reimbursement of expenses) | | | 1.58 | % | | | 1.50 | % | | | 1.58 | % | | | 1.73 | % | | | 2.48 | % |
| Ratio of Net Investment Loss to Average Net Assets | | | (0.90 | )% | | | (1.02 | )% | | | (0.77 | )% | | | (0.65 | )% | | | (1.52 | )% |
| Ratio of Net Investment Loss to Average Net Assets | | | | | | | | | | | | | | | | | | | | |
| (before waivers and reimbursements of expenses) | | | (1.08 | )% | | | (1.12 | )% | | | (0.96 | )% | | | (0.95 | )% | | | (1.79 | )% |
| Portfolio turnover rate | | | 14 | % | | | 15 | % | | | 15 | % | | | 13 | % | | | 8 | % |
(1) | The Adviser has contractually agreed to waive its fee and, if necessary, reimburse the Fund until April 30, 2023 to the extent Total Annual Fund Operating Expenses exceed 1.40% of the average daily net assets of the Institutional Class shares of the Fund. |
See accompanying notes to financial statements.
Needham Aggressive Growth Fund
Financial Highlights
| | | Retail Class | |
| | | Year Ended December 31, | |
| (For a Share Outstanding Throughout each Year) | | 2022 | | | 2021 | | | 2020 | | | 2019 | | | 2018 | |
| Net Asset Value, Beginning of Year | | $ | 40.56 | | | $ | 31.58 | | | $ | 21.77 | | | $ | 16.86 | | | $ | 23.07 | |
| Investment Operations | | | | | | | | | | | | | | | | | | | | |
| Net Investment Loss | | | (0.43 | ) | | | (0.59 | ) | | | (0.37 | ) | | | (0.30 | ) | | | (0.54 | ) |
| Net Realized and Unrealized Gain (Loss) on Investments | | | (10.73 | ) | | | 12.45 | | | | 11.41 | | | | 7.53 | | | | (2.88 | ) |
| Total from Investment Operations | | | (11.16 | ) | | | 11.86 | | | | 11.04 | | | | 7.23 | | | | (3.42 | ) |
| | | | | | | | | | | | | | | | | | | | | |
| Less Distributions | | | | | | | | | | | | | | | | | | | | |
| Net Realized Gains | | | — | | | | (2.88 | ) | | | (1.23 | ) | | | (2.32 | ) | | | (2.79 | ) |
| Total Distributions | | | — | | | | (2.88 | ) | | | (1.23 | ) | | | (2.32 | ) | | | (2.79 | ) |
| | | | | | | | | | | | | | | | | | | | | |
| Net Asset Value, End of Year | | | 29.40 | | | | 40.56 | | | | 31.58 | | | | 21.77 | | | $ | 16.86 | |
| | | | | | | | | | | | | | | | | | | | | |
| Total Return | | | (27.53 | )% | | | 37.54 | % | | | 51.39 | % | | | 43.93 | % | | | (15.80 | )% |
| Net Assets, End of Year (000’s) | | $ | 55,027 | | | $ | 63,599 | | | $ | 40,258 | | | $ | 30,238 | | | $ | 27,119 | |
| Ratios/Supplemental Data | | | | | | | | | | | | | | | | | | | | |
| Ratio of Net Expenses to Average Net Assets | | | 1.85 | % | | | 1.86 | % | | | 1.95 | % | | | 2.02 | % | | | 2.91 | % |
| Ratio of Net Expenses to Average Net Assets | | | | | | | | | | | | | | | | | | | | |
| (before interest and dividend expense) | | | 1.85 | %(1) | | | 1.86 | % | | | 1.95 | % | | | 1.95 | % | | | 1.95 | % |
| Ratio of Gross Expenses to Average Net Assets | | | | | | | | | | | | | | | | | | | | |
| (before waiver and reimbursement of expenses) | | | 1.82 | % | | | 1.82 | % | | | 1.96 | % | | | 2.17 | % | | | 2.97 | % |
| Ratio of Net Investment Loss to Average Net Assets | | | (1.38 | )% | | | (1.62 | )% | | | (1.56 | )% | | | (1.46 | )% | | | (2.40 | )% |
| Ratio of Net Investment Loss to Average Net Assets | | | | | | | | | | | | | | | | | | | | |
| (before waivers and reimbursements of expenses) | | | (1.35 | )% | | | (1.59 | )% | | | (1.57 | )% | | | (1.61 | )% | | | (2.46 | )% |
| Portfolio turnover rate | | | 11 | % | | | 12 | % | | | 13 | % | | | 9 | % | | | 8 | % |
(1) | The Adviser has contractually agreed to waive its fee and, if necessary, reimburse the Fund until April 30, 2023 to the extent Total Annual Fund Operating Expenses exceed 1.85% of the average daily net assets of the Retail Class shares of the Fund. |
See accompanying notes to financial statements.
Needham Aggressive Growth Fund
Financial Highlights
| | | Institutional Class | |
| | | Year Ended December 31, | |
| (For a Share Outstanding Throughout each Year) | | 2022 | | | 2021 | | | 2020 | | | 2019 | | | 2018 | |
| Net Asset Value, Beginning of Year | | $ | 42.11 | | | $ | 32.49 | | | $ | 22.23 | | | $ | 17.08 | | | $ | 23.21 | |
| Investment Operations | | | | | | | | | | | | | | | | | | | | |
| Net Investment Loss | | | (0.23 | ) | | | (0.36 | ) | | | (0.22 | ) | | | (0.19 | ) | | | (0.42 | ) |
| Net Realized and Unrealized Gain (Loss) on Investments | | | (11.15 | ) | | | 12.86 | | | | 11.71 | | | | 7.66 | | | | (2.92 | ) |
| Total from Investment Operations | | | (11.38 | ) | | | 12.50 | | | | 11.49 | | | | 7.47 | | | | (3.34 | ) |
| | | | | | | | | | | | | | | | | | | | | |
| Less Distributions | | | | | | | | | | | | | | | | | | | | |
| Net Realized Gains | | | — | | | | (2.88 | ) | | | (1.23 | ) | | | (2.32 | ) | | | (2.79 | ) |
| Total Distributions | | | — | | | | (2.88 | ) | | | (1.23 | ) | | | (2.32 | ) | | | (2.79 | ) |
| Net Asset Value, End of Year | | $ | 30.73 | | | $ | 42.11 | | | $ | 32.49 | | | $ | 22.23 | | | $ | 17.08 | |
| | | | | | | | | | | | | | | | | | | | | |
| Total Return | | | (27.02 | )% | | | 38.43 | % | | | 52.36 | % | | | 44.79 | % | | | (15.36 | )% |
| Net Assets, End of Year (000’s) | | $ | 79,891 | | | $ | 76,778 | | | $ | 34,132 | | | $ | 25,821 | | | $ | 13,478 | |
| Ratios/Supplemental Data | | | | | | | | | | | | | | | | | | | | |
| Ratio of Net Expenses to Average Net Assets | | | 1.18 | % | | | 1.18 | % | | | 1.33 | % | | | 1.46 | % | | | 2.35 | % |
| Ratio of Net Expenses to Average Net Assets | | | | | | | | | | | | | | | | | | | | |
| (before interest and dividend expense) | | | 1.18 | %(1) | | | 1.18 | % | | | 1.32 | % | | | 1.40 | % | | | 1.40 | % |
| Ratio of Gross Expenses to Average Net Assets | | | | | | | | | | | | | | | | | | | | |
| (before waiver and reimbursement of expenses) | | | 1.55 | % | | | 1.53 | % | | | 1.71 | % | | | 1.90 | % | | | 2.79 | % |
| Ratio of Net Investment Loss to Average Net Assets | | | (0.71 | )% | | | (0.95 | )% | | | (0.94 | )% | | | (0.90 | )% | | | (1.84 | )% |
| Ratio of Net Investment Loss to Average Net Assets | | | | | | | | | | | | | | | | | | | | |
| (before waivers and reimbursements of expenses) | | | (1.08 | )% | | | (1.30 | )% | | | (1.32 | )% | | | (1.34 | )% | | | (2.28 | )% |
| Portfolio turnover rate | | | 11 | % | | | 12 | % | | | 13 | % | | | 9 | % | | | 8 | % |
(1) | The Adviser has contractually agreed to waive its fee and, if necessary, reimburse the Fund until April 30, 2023 to the extent Total Annual Fund Operating Expenses exceed 1.18% of the average daily net assets of the Institutional Class shares of the Fund. |
See accompanying notes to financial statements.
Needham Small Cap Growth Fund
Financial Highlights
| | | Retail Class | |
| | | Year Ended December 31, | |
| (For a Share Outstanding Throughout each Year) | | 2022 | | | 2021 | | | 2020 | | | 2019 | | | 2018 | |
| Net Asset Value, Beginning of Year | | $ | 23.19 | | | $ | 25.80 | | | $ | 17.59 | | | $ | 12.40 | | | $ | 15.67 | |
| Investment Operations | | | | | | | | | | | | | | | | | | | | |
| Net Investment Loss | | | (0.26 | ) | | | (0.48 | ) | | | (0.32 | ) | | | (0.22 | ) | | | (0.19 | ) |
| Net Realized and Unrealized Gain (Loss) on Investments | | | (6.79 | ) | | | 3.69 | | | | 12.06 | | | | 6.89 | | | | (0.32 | ) |
| Total from Investment Operations | | | (7.05 | ) | | | 3.21 | | | | 11.74 | | | | 6.67 | | | | (0.51 | ) |
| | | | | | | | | | | | | | | | | | | | | |
| Less Distributions | | | | | | | | | | | | | | | | | | | | |
| Net Realized Gains | | | (0.64 | ) | | | (5.82 | ) | | | (3.53 | ) | | | (1.48 | ) | | | (2.76 | ) |
| Total Distributions | | | (0.64 | ) | | | (5.82 | ) | | | (3.53 | ) | | | (1.48 | ) | | | (2.76 | ) |
| | | | | | | | | | | | | | | | | | | | | |
| Net Asset Value, End of Year | | $ | 15.50 | | | $ | 23.19 | | | $ | 25.80 | | | $ | 17.59 | | | $ | 12.40 | |
| | | | | | | | | | | | | | | | | | | | | |
| Total Return | | | (30.33 | )% | | | 10.98 | % | | | 71.35 | % | | | 54.45 | % | | | (5.13 | )%(1) |
| Net Assets, End of Year (000’s) | | $ | 59,054 | | | $ | 112,830 | | | $ | 89,206 | | | $ | 85,521 | | | $ | 12,487 | |
| Ratios/Supplemental Data | | | | | | | | | | | | | | | | | | | | |
| Ratio of Net Expenses to Average Net Assets | | | 1.85 | % | | | 1.85 | % | | | 1.85 | % | | | 1.87 | % | | | 1.95 | % |
| Ratio of Net Expenses to Average Net Assets | | | | | | | | | | | | | | | | | | | | |
| (before interest and dividend expense) | | | 1.85 | %(2) | | | 1.85 | % | | | 1.85 | % | | | 1.87 | % | | | 1.95 | % |
| Ratio of Gross Expenses to Average Net Assets | | | | | | | | | | | | | | | | | | | | |
| (before waiver and reimbursement of expenses) | | | 1.86 | % | | | 1.83 | % | | | 1.80 | % | | | 2.07 | % | | | 2.19 | % |
| Ratio of Net Investment Loss to Average Net Assets | | | (1.47 | )% | | | (1.72 | )% | | | (1.64 | )% | | | (1.36 | )% | | | (1.20 | )% |
| Ratio of Net Investment Loss to Average Net Assets | | | | | | | | | | | | | | | | | | | | |
| (before waivers and reimbursements of expenses) | | | (1.48 | )% | | | (1.70 | )% | | | (1.59 | )% | | | (1.56 | )% | | | (1.44 | )% |
| Portfolio turnover rate | | | 109 | % | | | 133 | % | | | 191 | % | | | 136 | % | | | 103 | % |
(1) | The return reflects the actual performance for the year and does not include the impact of any adjustments made for financial reporting required by Generally Accepted Accounting Principles (GAAP). |
(2) | The Adviser has contractually agreed to waive its fee and, if necessary, reimburse the Fund until April 30, 2023 to the extent Total Annual Fund Operating Expenses exceed 1.85% of the average daily net assets of the Retail Class shares of the Fund. |
See accompanying notes to financial statements.
Needham Small Cap Growth Fund
Financial Highlights
| | | Institutional Class | |
| | | Year Ended December 31, | |
| (For a Share Outstanding Throughout each Year) | | 2022 | | | 2021 | | | 2020 | | | 2019 | | | 2018 | |
| Net Asset Value, Beginning of Year | | $ | 24.32 | | | $ | 26.64 | | | $ | 17.96 | | | $ | 12.57 | | | $ | 15.76 | |
| Investment Operations | | | | | | | | | | | | | | | | | | | | |
| Net Investment Loss | | | (0.14 | ) | | | (0.31 | ) | | | (0.20 | ) | | | (0.12 | ) | | | (0.10 | ) |
| Net Realized and Unrealized Gain (Loss) on Investments | | | (7.14 | ) | | | 3.81 | | | | 12.41 | | | | 6.99 | | | | (0.33 | ) |
| Total from Investment Operations | | | (7.28 | ) | | | 3.50 | | | | 12.21 | | | | 6.87 | | | | (0.43 | ) |
| | | | | | | | | | | | | | | | | | | | | |
| Less Distributions | | | | | | | | | | | | | | | | | | | | |
| Net Realized Gains | | | (0.64 | ) | | | (5.82 | ) | | | (3.53 | ) | | | (1.48 | ) | | | (2.76 | ) |
| Total Distributions | | | (0.64 | ) | | | (5.82 | ) | | | (3.53 | ) | | | (1.48 | ) | | | (2.76 | ) |
| Net Asset Value, End of Year | | $ | 16.40 | | | $ | 24.32 | | | $ | 26.64 | | | $ | 17.96 | | | $ | 12.57 | |
| | | | | | | | | | | | | | | | | | | | | |
| Total Return | | | (29.82 | )% | | | 11.74 | % | | | 72.51 | % | | | 55.31 | % | | | (4.58 | )%(1) |
| Net Assets, End of Year (000’s) | | $ | 137,578 | | | $ | 173,855 | | | $ | 127,943 | | | $ | 46,589 | | | $ | 12,168 | |
| Ratios/Supplemental Data | | | | | | | | | | | | | | | | | | | | |
| Ratio of Net Expenses to Average Net Assets | | | 1.18 | % | | | 1.18 | % | | | 1.18 | % | | | 1.22 | % | | | 1.40 | % |
| Ratio of Net Expenses to Average Net Assets | | | | | | | | | | | | | | | | | | | | |
| (before interest and dividend expense) | | | 1.18 | %(2) | | | 1.18 | % | | | 1.18 | % | | | 1.22 | % | | | 1.40 | % |
| Ratio of Gross Expenses to Average Net Assets | | | | | | | | | | | | | | | | | | | | |
| (before waiver and reimbursement of expenses) | | | 1.62 | % | | | 1.54 | % | | | 1.57 | % | | | 1.83 | % | | | 1.95 | % |
| Ratio of Net Investment Loss to Average Net Assets | | | (0.76 | )% | | | (1.04 | )% | | | (0.97 | )% | | | (0.72 | )% | | | (0.65 | )% |
| Ratio of Net Investment Loss to Average Net Assets | | | | | | | | | | | | | | | | | | | | |
| (before waivers and reimbursements of expenses) | | | (1.21 | )% | | | (1.40 | )% | | | (1.35 | )% | | | (1.33 | )% | | | (1.21 | )% |
| Portfolio turnover rate | | | 109 | % | | | 133 | % | | | 191 | % | | | 136 | % | | | 103 | % |
(1) | The return reflects the actual performance for the year and do not include the impact of any adjustments made for financial reporting required by Generally Accepted Accounting Principles (GAAP). |
(2) | The Adviser has contractually agreed to waive its fee and, if necessary, reimburse the Fund until April 30, 2023 to the extent Total Annual Fund Operating Expenses exceed 1.18% of the average daily net assets of the Institutional Class shares of the Fund. |
See accompanying notes to financial statements.
Notes to Financial Statements
December 31, 2022
Needham Growth Fund (“NGF”), Needham Aggressive Growth Fund (“NAGF”) and Needham Small Cap Growth Fund (“NSCGF”) (each, a “Portfolio” and collectively, the “Portfolios”), are portfolios of The Needham Funds, Inc. (the “Company”), which is registered under the Investment Company Act of 1940, as amended (the “1940 Act”), as an open-end management investment company. The Portfolios are “diversified” for purposes of the 1940 Act. Please refer to the most recently filed Registration Statement and Statement of Additional Information for a detailed description of each Portfolio’s investment strategy. The Company was organized as a Maryland corporation on October 12, 1995. NGF, NAGF, and NSCGF each currently offer two classes, the Retail Class and the Institutional Class. The Institutional Class of each Portfolio commenced operations on December 30, 2016.
Each Portfolio is an investment company and accordingly follows the investment company accounting and reporting guidance of the Financial Accounting Standards Board (“FASB”) Accounting Standards Codification Topic 946 “Financial Services – Investment Companies.”
| 2. | Class Specific Expenses |
Class level expenses are allocated daily to each class of shares based upon the ratio of net assets represented by each class as a percentage of the net assets of the Portfolio. Expenses deemed directly attributable to a class of shares are recorded by the specific class. Most Portfolio expenses are allocated by class based on relative net assets. Distribution Fees incurred in connection with the Company’s Amended and Restated Plan of Distribution Pursuant to Rule 12b-1 are expensed at 0.25% of average daily net assets of the Retail Class shares, and the specific amounts are detailed in Note 5.
| 3. | Significant Accounting Policies |
The following is a summary of significant accounting policies followed by the Company in the preparation of its financial statements. These policies are in conformity with accounting principles generally accepted in the United States of America (“GAAP”).
Security Valuation: Portfolio securities for which market quotations are readily available are stated at the last reported sale price reported by the principal exchange for the security as of the exchange’s close of business. Securities for which no sale has taken place during the day and securities which are not listed on an exchange are valued at the mean of the highest closing bid and lowest asked prices. Exchange traded options are valued at the last reported sale price on any exchange on which the option is principally traded. If no sales are reported on a particular day, the options will be valued at the mean between the highest closing bid and lowest asked prices across the exchanges where the option is traded. Non-exchange traded options will also be valued at the mean between the last bid and asked quotations. For options where market quotations are not readily available, value will be determined in accordance with the fair value procedures described below. All other securities and assets for which (a) market quotations are not readily available, such as in the case of a market or technical disruption that prevents the normal trading of a security held by a Portfolio, (b) market quotations are believed to be unrepresentative of fair market value, such as in the case of a thinly traded security, or (c) valuation is normally made at the last sale price on a foreign exchange and a significant event occurs after the close of that exchange but before the New York Stock Exchange closes, are valued at their fair value as determined in good faith by the Company’s Valuation Designee in accordance with Fair Value Procedures. The Company’s Fair Value Procedures are implemented and monitored by a Fair Value Committee (the "Committee") established by the Valuation Designee. The Company’s Board of Directors (the “Board”) has designated the Portfolios' investment adviser as the Company’s Valuation Designee.
When a security is valued in accordance with the Fair Value Procedures, the Committee determines a value after taking into consideration any relevant information that is reasonably available to the Committee. Some of the more common reasons that may necessitate that a security be valued pursuant to these Fair Value Procedures include, but are not limited to: the security’s trading has been halted or suspended; the security has been delisted from a national exchange; the security’s primary trading market is temporarily closed at a time when under normal conditions it would be open; or the security’s primary pricing source is not able or willing to provide a price. The securities of each Portfolio may also be valued on the basis of valuations provided by a pricing service approved by, or on behalf of, the Board.
Portfolio securities listed or traded on securities exchanges, including American Depositary Receipts (“ADRs”), are valued at the closing price on the exchange or system where the security is principally traded or at the NASDAQ Official Closing Price. If there have been no sales for that day on the exchange or system, a security is valued at the mean of the highest closing bid and lowest asked prices on the exchange or system where the security is principally traded.
Investment Transactions: Changes in holdings of portfolio securities for the Portfolios shall be reflected no later than in the first calculation on the first business day following the trade date for purposes of calculating each Portfolio’s daily net asset value per share. However, for financial reporting purposes, portfolio security transactions are reported on the trade date of the last business day of the reporting period. The cost (proceeds) of investments sold (bought to cover) is determined on a specific identification basis for the purpose of determining gains or losses on sales and buys to cover short positions. Dividend income, distributions to shareholders and dividend expense from securities sold short are recorded on the ex-dividend date. Interest income and interest expense from securities sold short is recorded on an accrual basis.
Notes to Financial Statements (Continued)
December 31, 2022
Foreign Currency: Foreign currency amounts are translated into U.S. dollars as follows: (i) assets and liabilities at the rate of exchange at the end of the respective period; and (ii) purchases and sales of securities and income and expenses at the rate of exchange prevailing on the dates of such transactions. The portion of realized/unrealized gains (losses) arising from changes in the exchange rates are included with the net realized/unrealized gain (loss) from affiliated and unaffiliated securities, securities sold short and foreign currency translations. Principal risks associated with such transactions include the movement in value of the foreign currency relative to the U.S. dollar and the ability of the counterparty to perform.
The Portfolios may also invest in forward currency contracts. Fluctuations in the value of such forward currency transactions are recorded daily as unrealized gain or loss; realized gain or loss includes net gain or loss on transactions that have terminated by settlement. These instruments involve securities and currency market risk, credit risk, or both kinds of risks, in excess of the amount recognized in the statements of assets and liabilities. Risks also arise from the possible inability of counterparties to meet the terms of their contracts. The Portfolios did not enter into forward currency contracts during the year ended December 31, 2022.
Allocation of Expenses: Expenses directly attributable to a Portfolio are charged directly to that Portfolio, while expenses which are attributable to more than one Portfolio are allocated among the respective Portfolios based upon relative net assets or some other reasonable method.
Use of Estimates: The preparation of financial statements in conformity with GAAP requires management to make estimates and assumptions that affect the reported amounts of assets and liabilities and disclosure of contingent assets and liabilities at the date of the financial statements and the reported amounts of increases and decreases in net assets from operations during the reporting period. Actual results could differ from those estimates.
Distributions to Shareholders: Dividends from net investment income, if any, are declared and paid annually for the Portfolios. Distributable net realized gains, if any, are declared and distributed at least annually.
Federal Income Taxes: It is the policy of each Portfolio to continue to qualify as a regulated investment company, as defined in the Internal Revenue Code, by complying with the provisions available to certain investment companies and to make distributions of net investment income and net realized capital gains sufficient to relieve it from all, or substantially all, federal income taxes. Accordingly, no provision for income taxes has been made in the Portfolios’ financial statements.
As of December 31, 2022, the Portfolios did not have any tax positions that did not meet the “more-likely-than-not” threshold of being sustained by the applicable tax authority. Open tax years are those that are open for exam by Federal and state taxing authorities. As of December 31, 2022, open Federal and New York tax years include the tax years ended December 31, 2019 through December 31, 2022. The Portfolios have no tax examinations in progress.
Fair Value Measurements: Valuation inputs used to determine the value of the Portfolios’ investments are summarized in the three broad levels listed below:
| | Level 1 — | Unadjusted quoted prices in active markets for identical assets and liabilities that the Portfolios have the ability to access. |
| | | |
| | Level 2 — | Observable inputs other than quoted prices included in Level 1 that are observable for the asset or liability, either directly or indirectly. These inputs may include quoted prices for the identical instrument in an inactive market, prices for similar instruments, interest rates, prepayment speeds, credit risk, yield curves, default rates and similar data. |
| | | |
| | Level 3 — | Unobservable inputs for the asset or liability, to the extent relevant observable inputs are not available, representing the Portfolios’ own assumptions about the assumptions a market participant would use in valuing the asset or liability, and would be based on the best information available. |
The inputs or methodology used to value securities are not necessarily an indication of the risk associated with investing in those securities.
Portfolio securities listed or traded on securities exchanges, including ADRs, are valued at the closing price on the exchange or system where the security is principally traded or at the NASDAQ Official Closing Price. If there have been no sales for that day on the exchange or system, a security is valued at the mean of the highest closing bid and lowest asked prices on the exchange or system where the security is principally traded. These valuations are typically categorized as Level 1 in the fair value hierarchy.
Fair value pricing may be used if events materially affecting the value of foreign securities occur between the times the exchange on which they are traded closes and the time the Portfolios’ net asset values are calculated. These valuations are categorized as Level 2 in the fair value hierarchy.
Notes to Financial Statements (Continued)
December 31, 2022
The following is a summary categorization, as of December 31, 2022, of each Portfolio’s investments based on the level of inputs utilized in determining the value of such investments:
| Needham Growth Fund | | | | | | | | | | | | |
| | | | | | | | | | | | | |
Assets(1) | | Level 1 | | | Level 2 | | | Level 3 | | | Total | |
| Common Stocks | | $ | 114,948,919 | | | $ | — | | | $ | — | | | $ | 114,948,919 | |
| Short-Term Investments | | | 5,532,105 | | | | — | | | | — | | | | 5,532,105 | |
| Total | | $ | 120,481,024 | | | $ | — | | | $ | — | | | $ | 120,481,024 | |
| | | | | | | | | | | | | | | | | |
| Needham Aggressive Growth Fund | | | | | | | | | | | | | | | | |
| | | | | | | | | | | | | | | | | |
Assets(1) | | Level 1 | | | Level 2 | | | Level 3 | | | Total | |
| Common Stocks | | $ | 124,014,741 | | | $ | 1,156,985 | | | $ | — | | | $ | 125,171,726 | |
| Short-Term Investments | | | 9,027,317 | | | | — | | | | — | | | | 9,027,317 | |
| Total | | $ | 133,042,058 | | | $ | 1,156,985 | | | $ | — | | | $ | 134,199,043 | |
| | | | | | | | | | | | | | | | | |
| Needham Small Cap Growth Fund | | | | | | | | | | | | | | | | |
| | | | | | | | | | | | | | | | | |
Assets(1) | | Level 1 | | | Level 2 | | | Level 3 | | | Total | |
| Common Stocks | | $ | 165,894,891 | | | $ | — | | | $ | — | | | $ | 165,894,891 | |
| Warrants | | | — | | | | — | | | | 345 | | | | 345 | |
| Short-Term Investments | | | 35,794,583 | | | | — | | | | — | | | | 35,794,583 | |
| Total | | $ | 201,689,474 | | | $ | — | | | $ | 345 | | | $ | 201,689,819 | |
(1) | Please refer to the Schedule of Investments to view segregation by industry. |
| 4. | Investment Advisory and Administrative Services |
The Company has engaged Needham Investment Management L.L.C. (the “Adviser”) to manage its investments pursuant to an Investment Advisory Agreement. The Company pays the Adviser an investment advisory fee at the annual rate of 1.25% of the average daily net assets of each Portfolio.
The Adviser has entered into an agreement with the Company (the “Expense Limitation Agreement”) whereby the Adviser has contractually agreed to waive its investment advisory fee for, and to reimburse expenses of, the Institutional Class and Retail Class shares of each Portfolio in an amount that limits annual operating expenses to not more than 1.40% and 1.95% for NGF, 1.18% and 1.85% for NAGF, and 1.18% and 1.85% for NSCGF, of the average daily net assets of the Portfolio’s Institutional Class and Retail Class, respectively (excluding taxes, interest, brokerage, dividends on short positions, acquired fund fees and expenses and extraordinary items, but including the investment advisory fee stated in the Investment Advisory Agreement). The Expense Limitation Agreement is effective for the period from April 29, 2022 through April 29, 2023. The Expense Limitation Agreement shall continue in effect from year to year thereafter only upon mutual agreement of the Company and the Adviser. Similar agreements were in effect for certain prior periods.
Any reimbursements or fee waivers made by the Adviser in respect of a Portfolio are subject to recoupment by the Adviser, to the extent that the Portfolio is able to make the repayment within the expense limitation established in the Expense Limitation Agreement. Under the Expense Limitation Agreement, the Adviser has a right to receive from each Portfolio class reimbursement for fee waivers and/or expense reimbursements made pursuant to the Agreement for a period of up to 36 months from the time of any waiver or reimbursement. The table below contains the amounts of fee waivers and expense reimbursements subject to recapture by the Adviser through December 31 of the year indicated:
| | | 2025 | | | 2024 | | | 2023 | | | Total | |
| NGF (Retail Class) | | $ | — | | | $ | — | | | $ | — | | | $ | — | |
| NGF (Institutional Class) | | | 144,750 | | | | 76,378 | | | | 88,423 | | | | 309,551 | |
| NAGF (Retail Class) | | | 57,810 | | | | — | | | | — | | | | 57,810 | |
| NAGF (Institutional Class) | | | 307,532 | | | | 163,479 | | | | 117,483 | | | | 588,494 | |
| NSCGF (Retail Class) | | | 60,133 | | | | — | | | | — | | | | 60,133 | |
| NSCGF (Institutional Class) | | | 597,068 | | | | 584,257 | | | | 214,920 | | | | 1,396,245 | |
The Company and Fund Services (the “Administrator”) are parties to a Fund Administration Servicing Agreement. The Administrator provides administrative and fund accounting services pursuant to this agreement and, in consideration of these services, receives a fee computed daily and paid monthly at an annual rate based on a percentage of the value of each Portfolio’s assets. The Administrator is also compensated for any out of pocket expenses that are reasonably incurred in carrying out its duties under this agreement. The Administrator also provides transfer agent services pursuant to a Transfer Agent Servicing Agreement for additional fees.
Notes to Financial Statements (Continued)
December 31, 2022
Certain officers of the Company are also officers of the Adviser and/or Needham & Company, LLC (the “Distributor”), an affiliate of the Adviser. Such officers receive no fees from the Company for serving as officers of the Company. Each of the three Directors who is not an “interested person” (as defined in the 1940 Act) of the Company (each, an “Independent Director”) receives a quarterly retainer of $3,000 and a per-meeting fee of $500. Each Independent Director is also a member of the Audit Committee of the Board and receives a fee of $500 per meeting attended. An affiliate of the Adviser provides an employee to serve as Chief Compliance Officer for the Company and to provide certain related services. The affiliate pays the Chief Compliance Officer’s compensation for acting as such and the Company reimburses the affiliate for the Company’s allocated portion of the expense.
| 5. | Distribution Plan and Brokerage Commissions |
The Company has adopted an Amended and Restated Plan of Distribution pursuant to Rule 12b-1 under the 1940 Act. Under the Plan, each Portfolio may pay compensation to the Distributor or any other distributor or financial institution with which the Company has an agreement with respect to the Retail Class of each Portfolio, with the amount of such compensation not to exceed an annual rate of 0.25% of the daily average net assets of each Portfolio’s Retail Class shares.
During the year ended December 31, 2022, NGF, NAGF and NSCGF incurred and paid brokerage commissions to the Distributor in the amount of $6,808, $38,592, and $195,421, respectively.
Each Portfolio may borrow from banks up to 25% of its total assets and may pledge its assets in connection with these borrowings, provided that no additional investments shall be made while borrowings exceed 5% of total assets.
The Portfolios did not engage in any temporary borrowings during the year ended December 31, 2022.
| 7. | Short Sale Transactions |
During the year ended December 31, 2022, NGF and NSCGF sold securities short. Upon selling a security short, the Portfolios record an asset for the settlement amount as “Deposit with Broker for Securities Sold Short” and a corresponding liability, which is marked-to-market to reflect current value. The broker for the Portfolios’ short sale transactions requires maintenance by each Portfolio of a minimum amount of collateral at all times, regardless of whether any short sales are outstanding. To the extent necessary to meet the broker’s collateral requirements for open short positions, additional securities will be segregated above the minimum to cover the short positions. At December 31, 2022, the market value of securities separately segregated to cover short positions was $1,122,525, $1,185,535, and $1,284,750 for NGF, NAGF and NSCGF, respectively.
Additionally, the Portfolios had receivables for Deposit with Broker for Securities Sold Short of $2,059, $0, and $0 pledged as collateral with a broker in connection with any open short positions for NGF, NAGF, and NSCGF, respectively as of December 31, 2022. None of the Funds held any securities sold short as of December 31, 2022.
| 8. | Investment Transactions |
The following summarizes the aggregate amount of the cost of purchases and proceeds from sales of investment securities and securities sold short, excluding short-term securities, during the year ended December 31, 2022:
| | | Purchases | | | Sales | |
| NGF | | | | | | |
| Long Transactions | | $ | 19,894,886 | | | $ | 24,829,471 | |
| Short Sale Transactions | | | 2,211,110 | | | | 2,147,739 | |
| NAGF | | | | | | | | |
| Long Transactions | | | 65,567,837 | | | | 12,713,641 | |
| Short Sale Transactions | | | 2,001,748 | | | | 1,958,599 | |
| NSCGF | | | | | | | | |
| Long Transactions | | | 193,456,733 | | | | 230,317,160 | |
| Short Sale Transactions | | | 7,731,338 | | | | 7,345,724 | |
There were no purchases or sales of U.S. government securities during the year ended December 31, 2022. See Note 11 for details of transactions with affiliates.
Notes to Financial Statements (Continued)
December 31, 2022
| 9. | Financial Instruments With Off-Balance Sheet Risk |
In the normal course of their business, the Portfolios may engage in transactions with off-balance sheet risk, including securities sold short, written options, futures, and forward currency contracts. Transactions in certain financial instruments represent future commitments to purchase or sell other financial instruments at specific terms at specified future dates. Each of these financial instruments contains varying degrees of off-balance sheet risk whereby changes in the market values of the securities underlying the financial instruments may be in excess of the amounts recognized in the financial statements.
Securities sold short represent obligations of the Portfolios to make future delivery of specific securities and, correspondingly, create an obligation to purchase the securities at market prices prevailing at a later delivery date (or to deliver the securities if already owned by the Portfolios). As a result, short sales create the risk that the Portfolios’ ultimate obligation to satisfy the delivery requirements may exceed the amount of the proceeds initially received on the liability recorded in the financial statements.
Under the Company’s organizational documents, the Company’s Directors and Officers are indemnified against certain liabilities arising out of the performance of their duties to the Company. In addition, in the ordinary course of business, the Company enters into contracts that contain a variety of indemnifications. The Company’s maximum exposure under these arrangements is unknown. However, the Company has not had prior claims or losses pursuant to these contracts and expects the risk of loss to be remote.
| 11. | Transactions with Affiliates |
NAGF owned 5% or more of the voting securities of the following company during the year ended December 31, 2022. As a result, this company is deemed to be an “affiliated person” (as defined in the 1940 Act) of NAGF (and the other Portfolios). Transactions during the year in this affiliated company were as follows:
| | | | | | | | | Net Change | | | Net | | | | | | Share | |
| | | Value at | | | | | | in Unrealized | | | Realized | | | | Value at | | Balance | |
| | | January 1, | | Value of | | Value of | | Appreciation | | | Gains | | Dividend | | December 31, | | December 31, | |
| Security Name | | 2022 | | Purchases | | Sales | | (Depreciation) | | | (Losses) | | Income | | 2022 | | 2022 | |
| GSE Systems, Inc. | | $ | 2,332,440 | | $ | 204,620 | | $ | — | | $ | (1,457,060 | ) | | $ | — | | $ | — | | $ | 1,080,000 | * | 1,500,000 | |
| * | The value of these securities agrees to the Investments in Affiliated Securities, at Value in the Statements of Assets and Liabilities. |
NSCGF owned 5% or more of the voting securities of the following companies during the period ended December 31, 2022. As a result, these companies are deemed to be “affiliated persons” (as defined in the 1940 Act) of NSCGF (and the other Portfolios). Transactions during the year in these affiliated companies were as follows:
| | | | | | | | | | Net Change | | | Net | | | | | | | Share | |
| | | Value at | | | | | | | in Unrealized | | | Realized | | | | | Value at | | Balance | |
| | | January 1, | | Value of | | Value of | | | Appreciation | | | Gains | | | Dividend | | December 31, | | December 31, | |
| Security Name | | 2022 | | Purchases | | Sales | | | (Depreciation) | | | (Losses) | | | Income | | 2022 | | 2022 | |
| Frequency | | | | | | | | | | | | | | | | | | | | |
| Electronics, Inc. | | $ | 5,309,610 | | $ | 279,839 | | $ | — | | | $ | (1,570,949 | ) | | $ | — | | | $ | — | | $ | 4,018,500 | | 570,000 | |
| Intevac, Inc. | | | 8,067,289 | | | 49,474 | | | (599,086 | ) | | | 3,012,728 | | | | (123,086 | ) | | | — | | | 10,407,319 | | 1,608,550 | |
| Total | | $ | 13,376,899 | | $ | 329,313 | | $ | (599,086 | ) | | $ | 1,441,779 | | | $ | (123,086 | ) | | $ | — | | $ | 14,425,819 | * | | |
| * | The value of these securities agrees to the Investments in Affiliated Securities, at Value in the Statements of Assets and Liabilities. |
No provision for federal income taxes is required since the Company intends to continue to qualify as a regulated investment company under Subchapter M of the Internal Revenue Code and distribute substantially all of its taxable income and capital gains to shareholders. Because income tax regulations differ from GAAP, the timing and character of income and capital gain distributions determined in accordance with tax regulations can differ from income and capital gains recognized for financial reporting purposes. Accordingly, the character of distributions and the composition of net assets for tax purposes can differ from those reflected in the financial statements. These book/tax differences may be temporary or permanent in nature. Temporary differences are generally due to differing book and tax treatment for the timing of the recognition of gains and losses on securities, including post-October losses (as described below). Permanent differences are generally due to differing treatment of net investment losses and distributions paid in connection with redemptions. To the extent these differences are permanent, they are charged or credited to paid-in capital or
Notes to Financial Statements (Continued)
December 31, 2022
distributable earnings, as appropriate, in the period in which the differences arise. These reclassifications have no effect on net assets or net asset value per share of each Portfolio. For the year ended December 31, 2022, the following table shows the reclassifications made:
| | Distributable Earnings/ | | | Paid In | |
| | (Accumulated Deficit) | | | Capital | |
| NGF | | $ | 1,622,788 | | | | $ | (1,622,788 | ) |
| NAGF | | | 129,764 | | | | | (129,764 | ) |
| NSCGF | | | 2,102,105 | | | | | (2,102,105 | ) |
As of December 31, 2022, the cost, gross unrealized appreciation, gross unrealized depreciation, and the net unrealized appreciation (depreciation) on securities, including proceeds from securities sold short for federal income tax purposes, were as follows:
| | | | | | Gross | | | Gross | | | Net Unrealized | |
| | | | | | Unrealized | | | Unrealized | | | Appreciation | |
| | | Cost | | | Appreciation | | | Depreciation | | | (Depreciation) | |
| NGF | | $ | 61,194,146 | | | $ | 66,030,323 | | | $ | (6,743,445 | ) | | $ | 59,286,878 | |
| NAGF | | | 107,939,709 | | | | 46,599,665 | | | | (20,340,321 | ) | | | 26,259,344 | |
| NSCGF | | | 245,694,671 | | | | 10,681,009 | | | | (54,685,861 | ) | | | (44,004,852 | ) |
The difference between the tax cost of investments and the cost of investments for GAAP purposes is primarily due to the tax treatment for wash sale losses and as it relates to NAGF Passive Foreign Investment Company income.
As of December 31, 2022, the components of distributable earnings (loss) on a tax basis were as follows:
| | | NGF | | | NAGF | | | NSCGF | |
| Undistributed ordinary income | | $ | — | | | $ | — | | | $ | — | |
| Undistributed long-term capital gains | | | — | | | | — | | | | — | |
| Other accumulated appreciation (depreciation) | | | (580,439 | ) | | | — | | | | (38,525,187 | ) |
| Unrealized appreciation (depreciation) | | | 59,286,878 | | | | 26,259,344 | | | | (44,004,852 | ) |
| Total accumulated earnings (loss) | | $ | 58,706,439 | | | $ | 26,259,344 | | | $ | (82,530,039 | ) |
The tax character of distributions paid during the year ended December 31, 2022 was as follows:
| | | NGF | | | NAGF | | | NSCGF | |
| Ordinary income | | $ | 10,444 | | | $ | — | | | $ | 988,562 | |
| Net long-term capital gains | | | 2,110,267 | | | | — | | | | 6,491,190 | |
| Total distributions paid | | $ | 2,120,711 | | | $ | — | | | $ | 7,479,752 | |
As of December 31, 2021, the Funds had accumulated capital loss carryovers of:
| | | Capital Loss | | | Capital Loss | | | | |
| | | Carryover ST | | | Carryover LT | | | Expires | |
| NGF | | $ | (580,439 | ) | | $ | — | | | Indefinite | |
| NAGF | | $ | — | | | $ | — | | | | N/A | |
| NSCGF | | $ | (25,474,824 | ) | | $ | (13,050,363 | ) | | Indefinite | |
Under current tax law, capital and currency losses realized after October 31 of a Portfolio’s fiscal year may be deferred and treated as occurring on the first business day of the following fiscal year for tax purposes. For the year ended December 31, 2022, the Portfolios had no such losses to defer.
Management has evaluated subsequent events through the date the financial statements were issued. This evaluation did not result in any subsequent events that necessitated recognition or disclosures.
Report of Independent Registered Public Accounting Firm
To the Shareholders and Board of Directors The Needham Funds, Inc.:
Opinion on the Financial Statements
We have audited the accompanying statements of assets and liabilities of Needham Growth Fund, Needham Aggressive Growth Fund and Needham Small Cap Growth Fund, each a “Portfolio” of The Needham Funds, Inc. (collectively, the Portfolios), including the schedules of investments as of December 31, 2022, the related statements of operations for the year then ended, the statements of changes in net assets for each of the two years in the period then ended, the related notes to the financial statements (collectively, the financial statements), and the financial highlights for each of the two years in the period then ended. In our opinion, the financial statements and financial highlights present fairly, in all material respects, the financial position of the Portfolios as of December 31, 2022, the results of its operations for the year then ended, and the changes in net assets and financial highlights for each of the two years in the period then ended, in conformity with accounting principles generally accepted in the United States of America.
The financial highlights for the years ended December 31, 2020, December 31, 2019, and December 31, 2018, for the Portfolios were audited by other auditors. Those auditors expressed an unqualified opinion on those financial statements and financial highlights in their report dated February 26, 2021.
Basis for Opinion
These financial statements are the responsibility of the Portfolios’ management. Our responsibility is to express an opinion on the Portfolios’ financial statements and financial highlights based on our audits. We are a public accounting firm registered with the Public Company Accounting Oversight Board (United States) (PCAOB) and are required to be independent with respect to the Portfolios in accordance with U.S. federal securities laws and the applicable rules and regulations of the Securities and Exchange Commission and the PCAOB.
We conducted our audits in accordance with the standards of the PCAOB. Those standards require that we plan and perform the audit to obtain reasonable assurance about whether the financial statements are free of material misstatement, whether due to error or fraud. The Portfolios are not required to have, nor were we engaged to perform, audits of their internal control over financial reporting. As part of our audits, we are required to obtain an understanding of internal control over financial reporting but not for the purpose of expressing an opinion on the effectiveness of the Portfolios’ internal control over financial reporting. Accordingly, we express no such opinion.
Our audits included performing procedures to assess the risks of material misstatement of the financial statements, whether due to error or fraud, and performing procedures that respond to those risks. Such procedures included examining, on a test basis, evidence regarding the amounts and disclosures in the financial statements. Our procedures included confirmation of securities owned as of December 31, 2022, by correspondence with the custodians and brokers. Our audits also included evaluating the accounting principles used and significant estimates made by management, as well as evaluating the overall presentation of the financial statements. We believe that our audits provide a reasonable basis for our opinion.
RSM US LLP
We have served as the auditor for The Needham Funds, Inc. since 2021
Boston, Massachusetts
February 27, 2023
Information about Directors and Officers (Unaudited)
December 31, 2022
Information pertaining to the Directors and Officers of the Company is set forth below.
The Portfolios’ Statement of Additional Information (SAI) includes additional information about the Directors and is available without charge, upon request, by calling 800-625-7071.
The address of each individual is 250 Park Avenue, New York, NY 10177. Each Director serves until the next annual shareholders meeting or until his successor is elected and qualified.
| | Term of Office | Portfolios in the | Principal Occupations(s) |
| Name, Year of Birth | and Length of | Fund Complex | During Past 5 Years |
| and Position with | Term Served by | Overseen by | and Other Directorships |
| the Company | Director/Officer | Director/Officer | Held by Director/Officer |
| Independent Directors |
| John W. Larson, | Indefinite; | Three | Currently retired. Partner at the law firm of Morgan, |
| Year of Birth: 1935 | Since 2006 | | Lewis & Bockius LLP from 2003 until retiring in December 2009. |
| Director | | | Partner at the law firm of Brobeck, Phleger & Harrison LLP |
| | | | from 1969 until 2003. From July 1971 to September 1973 worked |
| | | | in government service as Assistant Secretary of the United States |
| | | | Department of the Interior and Counselor to George P. Schultz, |
| | | | Chairman of the Cost of Living Council. Director of Wage |
| | | | Works, Inc. (an employee benefits company) from 2000 |
| | | | until 2018. Director of Sangamo BioSciences, Inc. since 1996. |
| F. Randall Smith, | Indefinite; | Three | Founder, Member of Investment Committee, Investment Analyst |
| Year of Birth: 1938 | Since 1996 | | and Portfolio Manager of Capital Counsel LLC (a registered |
| Director | | | investment adviser) since September 1999; President |
| | | | from 1999 to 2014. Co-founder and Chief Investment Officer of |
| | | | Train, Smith Counsel (a registered investment adviser) |
| | | | from 1975 to 1999. |
| David Shukis | Indefinite; | Three | Currently retired. Head of Global Investment Services (and other |
| Year of Birth: 1951 | Since 2021 | | positions) at Cambridge Associates, LLC (global investment |
| Director | | | consulting firm) from 1989 to 2016. Director and Chair of |
| | | | Cambridge Associates Fiduciary Trust Company from 2015 to |
| | | | 2018. Director, from 2011 to 2016, and Audit Committee Chair, |
| | | | since 2016, of Boston Lyric Opera. |
| Interested Director |
| George A. Needham*, | Indefinite; | Three | Chairman of the Board and Chief Executive Officer of The |
| Year of Birth: 1943 | Since 1996 | | Needham Group, Inc. and Needham Holdings, LLC since |
| Chairman, President | | | December 2004. President and Chief Executive Officer |
| and Director | | | of Needham Asset Management, LLC since April 2006. |
| | | | Chairman of the Board from 1996 to December 2004 and Chief |
| | | | Executive Officer from 1985 to December 2004 of Needham & |
| | | | Company, LLC. Managing Member of Needham Capital |
| | | | Management, LLC from 2000 to 2019. |
| * | An “interested person”, as defined in the 1940 Act, of the Company or the Company’s investment adviser. Mr. Needham is deemed to be an interested person because of his affiliation with the Portfolios’ Adviser and the Portfolios’ Distributor, and because he is an officer of the Company. |
Information about Directors and Officers (Unaudited) (Continued)
December 31, 2022
| | Term of Office | Portfolios in the | Principal Occupations(s) |
| Name, Year of Birth | and Length of | Fund Complex | During Past 5 Years |
| and Position with | Term Served by | Overseen by | and Other Directorships |
| the Company | Director/Officer | Director/Officer | Held by Director/Officer |
| Officers |
| John Barr, | One year; | Two | Portfolio Manager of Needham Asset Management, LLC |
| Year of Birth: 1956 | Since 2010 | | since 2010. Managing Director of Needham Asset Management, |
| Executive Vice President | | | LLC since 2009. Founding and Managing Member of Oliver |
| and Co-Portfolio | | | Investment Management, LLC from 2008 to 2009. Portfolio |
| Manager of the | | | Manager and Analyst at Buckingham Capital from 2002 to 2008. |
| Needham Growth | | | Managing Director and a Senior Analyst at Robertson Stephens |
| Fund, Executive Vice | | | following semiconductor companies from 2000 to 2002. |
| President and Portfolio | | | From 1995 to 2000, Managing Director and Senior Analyst at |
| Manager of the | | | Needham and Company, LLC and also served as Director of |
| Needham Aggressive | | | Research. Director of Coventor, Inc. from 2009 to 2017. |
| Growth Fund. | | | |
| Chris Retzler, | One year; | Two | Portfolio Manager of Needham Asset Management, LLC |
| Year of Birth: 1971 | Since 2008 | | since 2008. Managing Director of Needham Asset |
| Executive Vice President | | | Management, LLC since 2005. Head of Winterkorn, a healthcare |
| and Co-Portfolio | | | manufacturing and distribution company, from 2002 to 2005. |
| Manager of the | | | |
| Needham Growth | | | |
| Fund, Executive Vice | | | |
| President and Portfolio | | | |
| Manager of the Needham | | | |
| Small Cap Growth Fund. | | | |
| James W. Giangrasso, | One year; | Three | Managing Director of Needham and Company, LLC since 2021 |
| Year of Birth: 1962 | Since 2011 | | Chief Financial Officer of Needham Asset Management, LLC |
| Chief Financial Officer, | | | since 2011. Principal and Controller of Needham Asset |
| Treasurer and Secretary | | | Management, LLC from 2006 to 2011. |
| James M. Abbruzzese, | One year; | Three | Chief Compliance Officer of Needham Asset Management, LLC |
| Year of Birth: 1969 | Since 2004 | | since April 2006. Chief Compliance Officer and Managing |
| Chief Compliance | | | Director of Needham & Company, LLC from 2008 through 2012. |
| Officer | | | Chief Administrative Officer of Needham & Company, LLC |
| | | | since 2012. Chief Compliance Officer of Needham Capital |
| | | | Management, LLC since 2000. |
Supplementary Information (Unaudited)
December 31, 2022
Federal Income Tax Information
For the fiscal year ended December 31, 2022, certain dividends paid by the Portfolios may be subject to a maximum tax rate of 15%, as provided by the Jobs and Growth Tax Relief Reconciliation Act of 2003. The percentage of dividends declared from ordinary income reported as qualified dividend income was as follows:
| NGF | 100.00% | |
| NAGF | N/A | |
| NSCGF | 1.42% | |
For corporate shareholders, the percent of ordinary income distributions qualifying for the corporate dividends received deduction for the fiscal year ended December 31, 2022 was as follows:
| NGF | 100.00% | |
| NAGF | N/A | |
| NSCGF | 1.40% | |
The percentage of taxable ordinary income distributions that are designed as short-term capital gain distributions under Internal Revenue Section 871 (k)(2)(C) for each Fund were as follows:
| NGF | 100.00% | |
| NAGF | N/A | |
| NSCGF | 100.00% | |
Privacy Policy
It is the policy of the Company to keep personally identifiable financial information about you as an individual (“nonpublic personal information”) confidential, and use or disclose it only as necessary to provide services to you or the Company or as otherwise required or permitted by law. We may collect the following nonpublic personal information about you:
| | • | Information we receive from you on or in applications or other forms, correspondence, or conversations, including, but not limited to, your name, address, phone number, social security number, assets, income and date of birth; and |
| | | |
| | • | Information about your transactions with us, our affiliates, or others, including, but not limited to, your account number and balance, payments history, parties to transactions, cost basis information, other financial information and information about how you vote your shares. |
We disclose nonpublic personal information about current and former shareholders to companies that provide necessary services to the Company. These companies include the transfer agent, distributor, administrator and investment adviser as well as other affiliates of the Company. We maintain physical, electronic and procedural safeguards that comply with federal standards to guard your nonpublic personal information and restrict access to this information to those persons who need it to provide services to you or the Company or who are otherwise permitted by law to receive it. In the event that you hold any shares of our funds through a financial intermediary, including, but not limited to, a broker-dealer, bank, or trust company, the privacy policy of your financial intermediary governs how your nonpublic personal information is shared with nonaffiliated third parties. If you have any questions concerning the Company’s Privacy Policy, please call 1-800-625-7071.
Disclosure of Portfolio Holdings
Each Portfolio files its complete schedule of portfolio holdings with the Securities and Exchange Commission (“SEC”) for the first and third quarters of each fiscal year as an exhibit to its reports on Form N-PORT. For the Portfolios, this would be for the fiscal quarters ending March 31 and September 30. Each Portfolio’s Form N-PORT reports are available without charge, upon request, by calling 800-625-7071 or on the SEC’s website at http://www.sec.gov.
Voting Proxies on Company Portfolio Securities
A description of the policies and procedures that the Company uses to determine how to vote proxies relating to portfolio securities and information regarding how the Company voted proxies relating to portfolio securities during the most recent 12-month period ended June 30 are available without charge, upon request, by calling 800-625-7071 or on the SEC’s website at http://www.sec.gov.
Household Delivery of Shareholder Documents
To reduce expenses, the Company may mail only one copy of the Portfolios’ prospectuses, proxy statements, information statements, and each annual and semi-annual report to those addresses shared by two or more accounts. If you wish to receive individual copies of these documents, please call the Portfolios at 1-800-625-7071 or contact your financial institution. You will begin receiving individual copies thirty days after receiving your request.
Supplementary Information (Unaudited) (Continued)
December 31, 2022
Index Disclaimer
The Portfolios have been developed solely by the Adviser. The Portfolios are not in any way connected to or sponsored, endorsed, sold or promoted by the London Stock Exchange Group plc and its group undertakings (collectively, the “LSE Group”). FTSE Russell is a trading name of certain of the LSE Group companies.
All rights in the Russell 2000 Index and the Russell 3000 Index (together, the “Indexes”) vest in the relevant LSE Group company which owns the Index. “Russell®” is a trade mark of the relevant LSE Group company and is used by any other LSE Group company under license. The Indexes are calculated by or on behalf of FTSE International Limited or its affiliate, agent or partner. The LSE Group does not accept any liability whatsoever to any person arising out of (a) the use of, reliance on or any error in the Indexes or (b) investment in or operation of the Portfolios. The LSE Group makes no claim, prediction, warranty or representation either as to the results to be obtained from the Portfolios or the suitability of the Indexes for the purpose to which it is being put by the Adviser.
The source of the data for each of the Indexes is the LSE Group. © LSE Group 2021. All rights in the Indexes or data vest in the relevant LSE Group company which owns the Index or the data. Neither LSE Group nor its licensors accept any liability for any errors or omissions in the Indexes or data and no party may rely on any Indexes or data contained in this communication. No further distribution of data from the LSE Group is permitted without the relevant LSE Group company’s express written consent. The LSE Group does not promote, sponsor or endorse the content of this communication.
Board Consideration and Approval of Investment Advisory Agreement
On October 27, 2022, at a meeting called for the purpose of voting on such approval, the Board, including all of the Independent Directors, approved the continuance of the Investment Advisory Agreement (the “Advisory Agreement”) between the Company and the Adviser with respect to NGF, NAGF and NSCGF. In doing so, the Board reviewed materials provided by the Adviser to assist them in making a determination (the “Board Materials”). The Independent Directors were assisted in their review by independent legal counsel and met with counsel in executive session separate from representatives of the Adviser. In considering the renewal of the Advisory Agreement, the Board considered the nature, extent, and quality of the services to be provided by the Adviser; the investment performance of each Portfolio and the Adviser; the costs of the services to be provided and profits to be realized by the Adviser and its affiliates from the relationship with each Portfolio; the extent to which economies of scale would be realized as the Portfolios grow; and whether fee levels reflect these economies of scale for the benefit of investors.
The Directors stated that their consideration of the continuance of the Advisory Agreement included consideration of the peer group comparisons in the Board Materials to other investment companies with similar investment objectives and to each Portfolio’s unmanaged indices for various periods ended September 30, 2021, noting that NGF’s performance was above the average and median performance of its peer group for the year-to-date, one-year , three-year, five-year, ten-year (median only) and since inception time periods and above the relevant Morningstar Universes for the year-to-date, one-year, three-year, five-year (except Morningstar Mid Cap Universe median), and ten-year time periods. For NAGF, the Directors noted that the Portfolio’s performance was above the average and median performance of its peer group and the relevant Morningstar Universes for the year-to-date, one-year, three-year and five-year (except the peer group median), ten-year (except the peer group median) time periods. For NSCGF, the Directors noted that the Portfolio’s performance was above the average and median performance of its peer group and the relevant Morningstar Universes for the year-to-date, one-year, three-year, five-year, ten-year (peer group average only) and since inception periods. It was further noted that the Portfolios’ performance compared favorably to the longer term performance of their respective benchmark indices. In addition to reviewing each Portfolio’s performance and the profitability analysis of the Adviser, the Directors considered possible economies of scale, but did not believe material economies of scale to be present in light of the Portfolios’ asset size.
In their deliberations, the Directors considered all factors they believed relevant in addition to the performance comparisons described above, including the following: the nature, extent and quality of services rendered by the Adviser; the costs borne by, and profitability of, and other benefits to, the Adviser and its affiliates in providing services to each Portfolio; comparative fee and expense data for each Portfolio and other investment companies with similar investment objectives (having been advised that the Adviser does not manage other accounts with investment objectives and strategies similar to those of the Portfolios except private investment funds with fee structures that include performance fees); whether expenses of NGF, NAGF and NSCGF might be expected to decline as a percentage of net assets as NGF, NAGF and NSCGF assets increase; the professional experience and qualifications of each Portfolio’s portfolio manager(s) and other personnel of the Adviser, including the fact that a high caliber of personnel was both needed and provided to meet the needs of NGF, NAGF and NSCGF (specifically with respect to investments in securities sold short); and the terms of the Advisory Agreement. The Independent Directors confirmed that they had received adequate information to make a reasonable determination with respect to the approval of the Advisory Agreement. After full consideration of all the foregoing factors, the Board determined to approve the renewal of the Advisory Agreement.
Supplementary Information (Unaudited) (Continued)
December 31, 2022
Statement Regarding Liquidity Risk Management Program
The Company has adopted a liquidity risk management program (the “LRMP”) pursuant to the requirements of Rule 22e-4 under the 1940 Act, which requires registered open-end funds (other than money market funds) to adopt and implement a written liquidity risk management program that is reasonably designed to assess and manage fund liquidity risk. The rule is designed to promote effective liquidity risk management throughout the open-end fund industry, thereby reducing liquidity risk—i.e., the risk that a fund could not meet requests to redeem shares issued by the fund without significant dilution of remaining investors’ interests in the fund.
Pursuant to the requirements of Rule 22e-4, the LRMP is required to include policies and procedures reasonably designed to incorporate the following elements, and the LRMP complies with these requirements: (1) assessment, management and periodic review of liquidity risk; (2) classification of each Portfolio’s investments into one of the four liquidity categories in Rule 22e-4; (3) if the Portfolio does not primarily hold assets that are considered highly liquid investments (cash and other investments reasonably expected to be convertible into cash in current market conditions in three business days or less without the conversion into cash significantly changing the market value of the investment), determination of a “highly liquid investment minimum” (as defined in Rule 22e-4, the “HLIM”) and compliance with additional related requirements; (4) prohibition on the acquisition of any “illiquid investment” (as defined in Rule 22e-4) if immediately after the acquisition the Portfolio would have invested more than 15% of its net assets in illiquid investments; and (5) if the Portfolios reserve the right to engage in redemptions in-kind, establishment of policies and procedures regarding how and when the Portfolios will engage in such redemptions in-kind. There have been no material changes to the LRMP since it was initially approved by the Board.
The Board has approved the Adviser to administer the LRMP (the “Program Administrator”). As Program Administrator, the Adviser delegates the day-to-day activities required by the LRMP to a Liquidity Committee comprised of various Company officers and others within the Adviser (the “Liquidity Committee”), and the Liquidity Committee seeks assistance from and works together with Fund Services in effectuating the requirements of the LRMP as necessary.
Pursuant to the requirements of Rule 22e-4, the Board must review, no less frequently than annually, a written report prepared by the Program Administrator that addresses the operation of the program and assesses its adequacy and effectiveness of implementation, including, if applicable, the operation of the HLIM, and any material changes to the program. The Board received a written report in October 2022 (the “Annual Report”).
The Annual Report states that the Adviser, as the Program Administrator, acting primarily through the Liquidity Committee, has assessed the operation of the LRMP and believes that the LRMP is reasonably designed to assess and manage the Portfolios’ liquidity risk and is adequate and effective in its implementation. The Program Administrator and the Liquidity Committee initially determined that each Portfolio primarily holds assets that are highly liquid investments, and the Annual Report states that this determination continues to be maintained so that no Portfolio needs to maintain a HLIM. In addition, the Annual Report states that, since the LRMP was implemented, no Portfolio has breached its limit on illiquid investments.
(This Page Intentionally Left Blank.)
250 Park Avenue, 10th Floor
New York, New York 10177
1-800-625-7071
Investment Adviser:
Needham Investment Management L.L.C.
250 Park Avenue, 10th Floor
New York, New York 10177
President
George A. Needham
Executive Vice Presidents and Portfolio Managers
John Barr
Needham Growth Fund
Needham Aggressive Growth Fund
Chris Retzler
Needham Growth Fund
Needham Small Cap Growth Fund
Directors
George A. Needham
John W. Larson
David T. Shukis
F. Randall Smith
Distributor:
Needham & Company, LLC
250 Park Avenue, 10th Floor
New York, New York 10177
212-371-8300
Administrator, Shareholder Servicing Agent, and Transfer Agent:
U.S. Bancorp Fund Services, LLC,
doing business as U.S. Bank Global Fund Services
615 East Michigan Street
Milwaukee, WI 53202
Custodian:
U.S. Bank, N.A.
1555 North RiverCenter Drive
Milwaukee, WI 53212
Counsel:
Proskauer Rose LLP
Eleven Times Square
New York, NY 10036-8299
Independent Registered Public Accounting Firm:
RSM US LLP
80 City Square
Boston, MA 02129
| (b) | Not applicable for this Registrant |
Item 2. Code of Ethics.
The registrant has adopted a code of ethics that applies to the registrant’s principal executive officer and principal financial officer. The registrant has not made amendments to its code of ethics during the period covered by this report. The registrant has not granted any waivers from any provisions of the code of ethics during the period covered by this report.
A copy of the Registrant's Code of Ethics is incorporated by reference. See Item 13(a)(1).
Item 3. Audit Committee Financial Expert.
The registrant’s board of directors has determined that there is at least one audit committee financial expert serving on its audit committee. F. Randall Smith is the “audit committee financial expert” and is considered to be “independent” as each term is defined in Item 3 of Form N‑CSR.
Item 4. Principal Accountant Fees and Services.
The registrant has engaged its principal accountant to perform audit services, audit-related services, tax services and other services during the past two fiscal years. “Audit services” refer to performing an audit of the registrant's annual financial statements or services that are normally provided by the accountant in connection with statutory and regulatory filings or engagements for those fiscal years. All “Audit Fees” amounts for the fiscal years ended December 31, 2022 and 2021 reflect fees billed or expected to be billed by RSM US LLP. “Audit-related services” refer to the assurance and related services by the principal accountant that are reasonably related to the performance of the audit, along with auditor transition costs and registration statement update costs. All “Audit-Related Fees” amounts for the fiscal years ended December 31, 2022 and 2021 reflect fees billed by the registrant’s former principal accountant. “Tax services” refer to professional services rendered by the principal accountant for tax compliance, tax advice, and tax planning. “Other services” provided by the principal accountant were not applicable. The following table details the aggregate fees billed or expected to be billed for each of the last two fiscal years for audit fees, audit-related fees, tax fees and other fees by the principal accountant and former principal accountant.
| | FYE 12/31/2022 | FYE 12/31/2021 |
Audit Fees | $110,000 | $110,000 |
Audit-Related Fees | $ 23,400 | $ 4,000 |
Tax Fees | $ 21,000 | $ 21,000 |
All Other Fees | $ 0 | $ 0 |
The audit committee has adopted pre-approval policies and procedures that require the audit committee to pre‑approve all audit and non‑audit services of the registrant, including services provided to any entity affiliated with the registrant.
The percentage of fees billed by RSM US LLP applicable to non-audit services pursuant to waiver of pre-approval requirement were as follows:
| | FYE 12/31/2022 | FYE 12/31/2021 |
Audit-Related Fees | 0% | 0% |
Tax Fees | 0% | 0% |
All Other Fees | 0% | 0% |
All of the principal accountant’s hours spent on auditing the registrant’s financial statements were attributed to work performed by full‑time permanent employees of the principal accountant.
The following table indicates the non-audit fees billed or expected to be billed by the registrant’s accountant for services to the registrant and to the registrant’s investment adviser (and any other controlling entity, etc.—not sub-adviser) for the last two years. The audit committee of the board of trustees/directors has considered whether the provision of non-audit services that were rendered to the registrant's investment adviser is compatible with maintaining the principal accountant's independence and has concluded that the provision of such non-audit services by the accountant has not compromised the accountant’s independence.
Non-Audit Related Fees | FYE 12/31/2022 | FYE 12/31/2021 |
Registrant | $0 | $0 |
Registrant’s Investment Adviser | $0 | $0 |
Item 5. Audit Committee of Listed Registrants.
Not applicable to registrants who are not listed issuers (as defined in Rule 10A-3 under the Securities Exchange Act of 1934).
Item 6. Investments.
| (a) | Schedule of Investments is included as part of the report to shareholders filed under Item 1 of this Form. |
Item 7. Disclosure of Proxy Voting Policies and Procedures for Closed-End Management Investment Companies.
Not applicable to open-end investment companies.
Item 8. Portfolio Managers of Closed-End Management Investment Companies.
Not applicable to open-end investment companies.
Item 9. Purchases of Equity Securities by Closed‑End Management Investment Company and Affiliated Purchasers.
Not applicable to open-end investment companies.
Item 10. Submission of Matters to a Vote of Security Holders.
Not Applicable.
Item 11. Controls and Procedures.
| (a) | The Registrant’s Chief Executive Officer and Chief Financial Officer have reviewed the Registrant's disclosure controls and procedures (as defined in Rule 30a-3(c) under the Investment Company Act of 1940 (the “Act”)) as of a date within 90 days of the filing of this report, as required by Rule 30a-3(b) under the Act and Rules 13a-15(b) or 15d‑15(b) under the Securities Exchange Act of 1934. Based on their review, such officers have concluded that the disclosure controls and procedures are effective in ensuring that information required to be disclosed in this report is appropriately recorded, processed, summarized and reported and made known to them by others within the Registrant and by the Registrant’s service provider. |
| (b) | There were no changes in the Registrant's internal control over financial reporting (as defined in Rule 30a-3(d) under the Act) that occurred during the Registrant’s first fiscal half-year of the period covered by this report that has materially affected, or is reasonably likely to materially affect, the Registrant's internal control over financial reporting. |
Item 12. Disclosure of Securities Lending Activities for Closed-End Management Investment Companies
Not applicable to open-end investment companies.
Item 13. Exhibits.
(3) Any written solicitation to purchase securities under Rule 23c‑1 under the Act sent or given during the period covered by the report by or on behalf of the registrant to 10 or more persons. Not applicable to open-end investment companies.
(4) Change in the registrant’s independent public accountant. There was no change in the registrant’s independent public accountant for the period covered by this report.
SIGNATURES
Pursuant to the requirements of the Securities Exchange Act of 1934 and the Investment Company Act of 1940, the registrant has duly caused this report to be signed on its behalf by the undersigned, thereunto duly authorized.
(Registrant) The Needham Funds, Inc.
By (Signature and Title) /s/George A. Needham
George A. Needham, President
Date March 8, 2023
Pursuant to the requirements of the Securities Exchange Act of 1934 and the Investment Company Act of 1940, this report has been signed below by the following persons on behalf of the registrant and in the capacities and on the dates indicated.
By (Signature and Title) /s/George A. Needham
George A. Needham, President
Date March 8, 2023
By (Signature and Title) /s/James W. Giangrasso
James W. Giangrasso, Treasurer and Secretary
Date March 8, 2023