Annual
Report
Needham Funds
Seeking to build wealth for long-term investors.
December 31, 2020
Needham Growth Fund
Needham Aggressive Growth Fund
Needham Small Cap Growth Fund
www.needhamfunds.com
250 Park Avenue, 10th Floor
New York, New York 10177
1-800-625-7071
www.needhamfunds.com
Annual Report
December 31, 2020
| Contents | |
| Letter from the Adviser | 1 |
| Portfolio Characteristics | |
| Needham Growth Fund | 10 |
| Needham Aggressive Growth Fund | 11 |
| Needham Small Cap Growth Fund | 12 |
| Disclosure of Fund Expenses | 14 |
| Schedules of Investments | |
| Needham Growth Fund | 16 |
| Needham Aggressive Growth Fund | 22 |
| Needham Small Cap Growth Fund | 26 |
| Schedules of Securities Sold Short | |
| Needham Growth Fund | 21 |
| Needham Small Cap Growth Fund | 29 |
| Statements of Assets and Liabilities | 30 |
| Statements of Operations | 32 |
| Statements of Changes in Net Assets | 33 |
| Financial Highlights | |
| Needham Growth Fund | 36 |
| Needham Aggressive Growth Fund | 38 |
| Needham Small Cap Growth Fund | 40 |
| Notes to Financial Statements | 42 |
| Report of Independent Registered Public Accounting Firm | 52 |
| Information about Directors and Officers | 53 |
| Supplementary Information | 56 |
This report is authorized for distribution to prospective investors only when preceded or accompanied by a current prospectus. The prospectus contains more complete information, including investment objectives, risks, expenses and charges and should be read carefully before investing or sending any money. To obtain a prospectus or summary prospectus, please call 1-800-625-7071.
Portfolios of The Needham Funds, Inc., like all mutual funds:
| | • | Are NOT FDIC insured |
| | • | Have no bank guarantee |
| | • | May lose value |
The Needham Funds, Inc. are distributed by Needham & Company, LLC.
Annual Report 2020
 | 250 Park Avenue, 10th Floor |
| New York, NY 10177 |
| | (800) 625-7071 |
| | www.needhamfunds.com |
January 2021
Dear Shareholders, Friends of Needham, and Prospective Shareholders,
We are pleased to report Needham Funds’ results for the quarter and year ended December 31, 2020. Our mission is to create wealth for long-term investors and 2020 was a big step forward despite an unprecedented economic and social backdrop. All three Needham Funds significantly outperformed the Russell 2000 Index and the S&P 500 Index for the year.
Once again, the Needham Funds were recognized by Refinitiv Lipper for their top performance. For the one-year period ended December 31, 2020, the Needham Small Cap Growth Fund was ranked as the #2 fund in the Small-Cap Core category and the Needham Growth Fund was ranked as the #2 fund in the Multicap Core category. We are very excited about these recognitions and appreciate the long-term support and patience of our investors.
John’s Barr’s Macroeconomic and Market Commentary
Entering 2020, we anticipated strategic progress and growth from our portfolio companies. That all changed with COVID-19. From late February until March 23, the S&P 500 declined 34%, its largest drop in history. It was one of the worst quarters in the recorded history of the United States’ markets; however, in April 2020, the S&P 500 posted its best month since January 1987.
Along with the stock market performance, the monetary and fiscal policy responses to COVID-19 were unprecedented. The Federal Reserve announced an unlimited bond-buying program. These bonds included high-yield ETFs, bonds rated investment grade before the crisis, small business loans, municipals, asset-backed securities, collateralized loan obligations and commercial mortgage-backed securities. The fiscal response included the CARES Act with over $2 trillion of grants and loans to all kinds of businesses, including airlines, hospitals and small businesses, payments to state and local governments, and a $1,200 direct payment to some individuals. We believe these policy responses contributed to the strong performance of equities.
Company earnings for the March quarter were as expected. Business in the U.S. was strong until shelter-in-place restrictions went into effect in mid-March. Although most companies followed the legalistic path of withdrawing guidance, their commentaries on second quarter revenue and bookings were much better than we expected.
In April, Needham Funds recovered nearly all of their entire first quarter declines. April unemployment was 14.7%, the worst since an estimated 24.9% in the Great Depression.
May was another strong month for Needham Funds and the market. We believe the monetary and fiscal stimulus was a contributor to the positive month. May unemployment improved to 13.3%. June was another positive month for Needham Funds and the markets as more states began to open their economies.
Needham Funds
In early June, the Federal Reserve estimated second quarter GDP might drop a stunning 52.8%, following a 5.0% first quarter decline. In July, the U.S. Bureau of Economic Analysis published its estimate of -32.8% GDP in the second quarter.
Then came a rapid, but far from complete rebound in the third quarter. In late July, estimates for third quarter GDP were for 12% growth. In fact, third quarter GDP growth was 38%. The Federal Reserve maintained interest rates at near 0% and its aggressive purchases of a range of fixed-income securities through its Quantitative Easing program.
Recent commentary indicates even more aggressive accommodative monetary and fiscal policy. In late August the Federal Reserve adopted a new policy framework. Federal Reserve Chair Jerome H. Powell said, “Our revised statement reflects our appreciation for the benefits of a strong labor market, particularly for many in low- and moderate-income communities, and that a robust job market can be sustained without causing an unwelcome increase in inflation.” This framework allows for inflation over 2%.1,2 Raphael Bostic, President of the Atlanta Federal Reserve Bank, stated to the Wall Street Journal, “Economists believe that inflation is less of a problem today than it has been in the past.”3
By late September, the Federal Reserve’s balance sheet increased to $7 trillion, up from $4.2 trillion in early March, providing another tailwind to asset prices. After the 2008 financial crisis, it took five years for the Federal Reserve’s balance sheet to expand by $3 trillion.
In December, Congress and the Trump administration passed a $900 billion COVID Relief Bill. The Biden administration plans to quickly pass another $1.9 trillion relief bill.4
A recent Brookings Institute panel featured a draft paper, “Reconsideration of Fiscal Policy in the Era of Low Interest Rates.” Authors Jason Furman and Larry Summers argue that with structural low interest rates, the U.S. government can implement support of public sector spending for health care, education and a host of other programs without raising taxes or systemic risk.5 President Biden recently said, “Every major economist thinks we should be investing in deficit spending in order to generate economic growth.”6 For further information on the theory that governments should spend up to the point of measurable inflation read “The Deficit Myth: Modern Monetary Theory and the Birth of the People’s Economy” by Prof. Stephanie Kelton of SUNY Stonybrook. Accommodative monetary and fiscal policy may continue to lead to increasing equity prices.
The fourth quarter brought continued strong equity performance led by pandemic recovery stocks in the consumer discretionary, financial services, materials and energy sectors. Low quality and value factors outperformed.
____________
1 | https://www.federalreserve.gov/newsevents/pressreleases/monetary20200827a.htm |
2 | https://www.marketwatch.com/story/fed-unanimously-adopts-new-strategy-widely-seen-as-leading-to-easier-policy-2020-08-27 |
3 | https://www.wsj.com/video/inside-the-feds-plan-to-support-minority-workers/BDF130C8-3B41-4218-BDC7-D43CB3ED8753.html |
4 | https://www.marketwatch.com/story/lifeline-to-workers-why-bidens-call-for-a-19-billion-covid-19-rescue-package-has-not-come-a-moment-too-soon-2021-01-14 |
5 | https://www.brookings.edu/events/fiscal-policy-advice-for-joe-biden-and-congress |
6 | https://www.nbcnews.com/politics/white-house/joe-biden-wants-set-aside-deficit-concerns-invest-ailing-u-n1253638 |
Annual Report 2020
Needham Funds’ Portfolio Overview: The Great Digital Acceleration
2020 brought an unprecedented worldwide economic shutdown to control the spread of COVID-19. The pandemic accelerated trends that were already occurring; we call this the Great Digital Acceleration. As we look into 2021, we see four important themes to consider.
| | 1) | This time is different. The Great Digital Acceleration is here. There will be winners and losers. There will also be those investments, in the words of Warren Buffett and Charlie Munger, which belong in the “too hard” pile. Berkshire Hathaway’s sale of its airline investments in early 2020 is an example of “too hard.” Most commercial real estate investments belong in the “too hard” pile. We believe our areas of expertise – technology, applied technology and life sciences – belong in the winners’ category. |
| | | We see three groups of winners; digital business-to-consumer (B2C), digital business-to-business (B2B) and those that supply the infrastructure, research and development to the B2C and B2B groups. Many of our portfolio companies supply the infrastructure, research and development, equipment and services that enable digital transformation. |
| | 2) | For the winners, today’s valuations may work. Yet, it is important to do your homework and know why the price you are paying makes sense. Buying just any SPAC (Special Purpose Acquisition Company) at a $1-2 billion valuation seems a recipe for disaster. |
| | 3) | Stocks and industries that appear attractive to value investors may be squarely in the losers’ bracket. No matter the attractive valuation, these companies and stocks may be left behind. |
| | 4) | As discussed above, we are in the early stages of a new level of accommodative monetary and fiscal policies. A company trading at 40x earnings has a 2.5% earnings yield with prospects for higher earnings and compares favorably to a bond with a negative or near zero interest rate. |
Needham Growth Fund – John Barr, Chris Retzler, Co-Portfolio Managers
For the year ended December 31, 2020, NEEIX returned 42.24% and NEEGX returned 41.59%, considerably outperforming the S&P 500’s 18.40% and Russell 2000’s 19.96%.
Entegris, Inc. (ENTG) was the Fund’s leading contributor for the year 2020. It was also the Fund’s largest position at year-end. Entegris supplies filters and chemicals used in advanced semiconductor manufacturing processes. The company reported strong third quarter earnings and guidance for the fourth quarter. Demand for leading-edge semiconductors has been robust. Over time, we believe semiconductors will increase as a percentage of industrial output, and that Entegris’ filtration and specialty materials products will grow faster than the semiconductor industry.
Aspen Aerogels Inc. (ASPN) was the second-leading contributor for the year. The company supplies aerogel insulation used primarily in the energy industry to insulate pipelines and refinery pipes. Aspen’s aerogel has superior thermal and cryogenic properties and is lighter than older generation insulation, which was developed 50 years ago. In 2020, Aspen determined its aerogel has the potential to prevent thermal run-away in li-ion batteries, which is a major cause of engine fires in electric vehicles. In late October, Aspen
Needham Funds
announced that it was selected by a major U.S. automotive OEM to supply its new PyroThin™7 thermal barriers for use with electric vehicle batteries. We believe every EV maker has a similar need and that Aspen’s near-20 years of experience with aerogels puts it far ahead of any competitor. This market has the potential to transform Aspen from a $100 million revenue company to over a billion dollars. Of course, these developments may not occur and the company may not succeed with this opportunity.
Vicor Corporation (VICR) was also a leading contributor to the Fund’s performance in 2020. Vicor makes small, modular power converters used in data centers, on servers and in cars and transportation systems. It has invested $400 million in new product development over the last decade. Vicor has worked with Alphabet’s Google (GOOGL) on its Open Compute data centers to distribute DC (direct current) power throughout the data center, rather than go through the inefficient conversions to AC (alternating current) and back again to DC. Many artificial intelligence and machine learning applications require sophisticated power conversion, and Vicor is uniquely positioned to meet these needs. The company had a good year and we anticipate even more widespread adoption of its products in 2021.
Thermo Fisher Scientific, Inc. (TMO) was another top contributor for the year. Thermo Fisher’s PCR-testing, personal protective equipment and broad array of biopharmaceutical services helped the company have a very good year. Thermo Fisher’s mission is “to enable its customers to make the world healthier, cleaner and safer. Whether our customers are accelerating life sciences research, solving complex analytical challenges, improving patient diagnostics and therapies or increasing productivity in their laboratories.” The Fund began investing in the company in 2000. While Thermo Fisher had a great year and was well-positioned to contribute to the COVID-19 response, the company’s strategy positions it as a solution to many of the world’s life science challenges.
There were no material detractors in the year.
For the year, the Fund’s largest new positions included ADTRAN, Inc. (ADTN), AXT, Inc. (AXTI), 8x8, Inc. (EGHT) and Telos Corp. (TLS). The Fund’s largest additions to existing positions were Aspen Aerogels Inc. (ASPN) and Intevac, Inc. (IVAC).
The Fund’s largest complete exits were Brookfield Asset Management, Inc. (BAM), Bill.com (BILL), DIRTT Environmental Solutions (DRT) and Wabtec Corp. (WAB). The Fund also reduced positions in some of the longer-term, larger holdings including Air Lease Corporation (AL), Appian Corporation (APPN), CarMax, Inc. (KMX), Entegris, FormFactor, Inc. (FORM), Gilead Sciences, Inc. (GILD), II-VI, Inc. (IIVI) and Thermo Fisher Scientific, Inc.
At December 31, 2020, the Fund’s top 10 positions were 51.40% of net assets. The Fund had 2.7% of net assets in cash and was short 0.2%. The Fund had an Active Share of 95.2% versus the S&P 500 and trailing 12-month turnover was 15%.
Morningstar categorizes the Fund as Mid Cap Growth. Lipper categorizes it as MultiCap Core. When you hold companies for 10-15 years, and they succeed, they grow to larger market cap categories. Our mission is to find companies that may be compounders over many years, independent of industry or market cap.
____________
7 | https://info.aerogel.com/thermal-runaway |
Annual Report 2020
Needham Aggressive Growth – John Barr, Portfolio Manager
For the year ended December 31, 2020, NEAIX returned 52.36% and NEAGX returned 51.39%, considerably outperforming the S&P 500’s 18.40% and Russell 2000’s 19.96%.
The Fund’s greater-than-benchmark exposure to high quality and low exposure to value factors contributed to the Fund’s outperformance for the year.8,9 Quality factors, including high return on capital and low leverage, helped the Fund’s positions outperform during the COVID-19 crash early in the year. Under the guidance of our investment process, the Fund looks to purchase companies while they are “Hidden Compounders” – companies going through investment periods. As our investment thesis plays out, these companies convert to “Quality Compounders,” with strong return on capital and still below-average leverage. The Fund’s fourth quarter underperformance relative to the Russell 2000 was a result of underexposure to the strong consumer discretionary, financial services, materials, and energy sectors. With just 13% turnover, the Fund does not rotate into or out of sectors, but invests in companies we believe can outperform over the long-term.
Like the Growth Fund, the Fund’s top contributor for 2020 was Entegris, Inc. (ENTG), the Fund’s largest holding at December 31.10 We invested in Entegris in 2009 and 2010, and the company performed well through 2016. In 2016, the company’s business faced a positive inflection – cloud infrastructure spending accelerated, benefitting the leading semiconductor and manufacturing technology companies, including Entegris. We believe Entegris and its peers are in the early stages of secular growth driven by increasing cloud adoption. Previously, the semiconductor industry was cyclical and controlled by seasonal personal computer purchases.
The four other top contributors for the year were the next largest holdings at year end: Apple, Inc. (AAPL), Nova Measuring Instruments, Inc. (NVMI), PDF Solutions Inc. (PDFS) and Vicor Corporation (VICR).
Apple reported a positive 4th quarter with a strong installed base and services revenue. Apple closed the year with talk of a positive 2021, with new 5G iPhones and discussion of an Apple Car by 2024.
In October, Nova Measuring announced a win for its new NovaPRISM optical metrology product with a leading global memory maker and strong results. Nova is well positioned for continued success as leading edge semiconductor manufacturing is metrology intensive.
PDF Solutions’ results showed continued progress establishing Exensio as the semiconductor manufacturing industry’s standard big data platform. On its first quarter conference call, PDF discussed a multi-year, eight-figure Exensio agreement with a major semiconductor company. Exensio is very useful for automotive electronics companies. In July, PDF announced a partnership with Advantest (6857-TKY). Advantest purchased
____________
8 | https://www.morningstar.com/funds/xnas/neagx/portfolio |
9 | https://research.ftserussell.com./products/downloads-research/FTSE_Russell_Monthly_Performance_Report_LCY.pdf#page=5 |
10 | https://www.regions.com/-/media/pdfs/AssetManagement-The-Semiconductor-Cycle.pdf?revision=1da76437-de80-4ebd-96f3-dc8ab8257328&la=en&hash=414BE463A90E72789127F9AB4D334AAA |
Needham Funds
3.3 million shares of PDF, representing 9% of the company for $19.70 per share. Advantest also purchased a 5-year, non-exclusive license for Exensio to be the basis for the Advantest Cloud Solution, which will be sold to Advantest customers. Advantest will also pay PDF to develop a close integration between Exensio and Advantest testers.
None of the Fund’s positions were material detractors in the year ended December 31.
In 2020, the Fund added four positions that each ended the year at over 0.50% of net assets. ADTRAN, Inc. (ADTN) and AXT, Inc. (AXTI) were added earlier in the year and Digimarc Corporation (DMRC) and Telos Corp. (TLS) were added in the fourth quarter. ADTRAN has a contract with British Telecom’s Openreach spin-out to provide communications equipment used to provide high-speed internet in the United Kingdom. AXT manufactures Gallium Arsenide and Indium Phosphide wafers, which are used in communications systems and consumer electronics. Both areas could grow in 2021 and beyond. Digimarc has been investing for many years in a unique watermarking technology that has the potential to replace QR codes. Digimarc is a leader in the European Union’s Holy Grail 2.0 initiative to significantly reduce plastic waste. Telos is a newly public provider of cyber security services to the leading defense and security agencies in the United States. They are looking to sell their incredible technology to commercial customers.
In 2020, the largest addition to an existing holding was to Smith-Midland Corporation (SMID), a micro-cap maker of pre-cast concrete systems for road barriers and construction. We are impressed by the company’s management and the returns from its barrier rental business.
The Fund also added to its Aspen Aerogels Inc (ASPN), Intevac Inc. (IVAC) and Transcat, Inc. (TRNS) positions. Intevac is developing sensors for use with night-vision systems for the U.S. military and allied forces. Transcat has a recurring business model where they maintain and calibrate instruments used in the electronics, life sciences and other industries.
In 2020, the Fund exited its investment in National Instruments Corp. (NATI) over concern for its long-term growth potential. The Fund reduced its positions in some of the longer-term, larger holdings including Apple, Akamai Technologies (AKAM), Entegris and PDF Solutions.
At December 31, 2020, the Fund’s top 10 positions were 63.83% of net assets. The Fund was fully invested and had no short positions. The Fund had an Active Share of 98.2% versus the Russell 2000 and trailing 12-month turnover was 13%. Morningstar and Lipper categorize the Fund as Small Cap Growth.
Needham Small Cap Growth Fund – Chris Retzler, Portfolio Manager
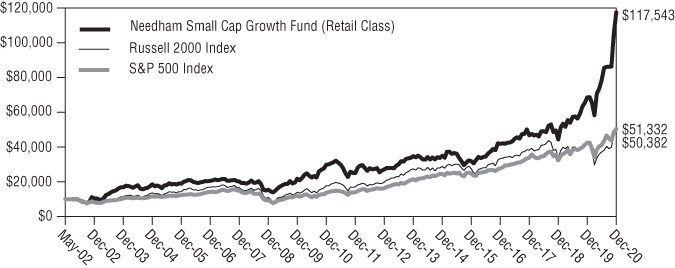
For year ended December 31, 2020, the Needham Small Cap Growth Fund Institutional and Retail classes returned 72.51% and 71.35%, respectively. The Russell 2000 Index returned 19.96% and the S&P 500 Index returned 18.40%.
After a strong first half, we were nimble in our exposure levels entering the fall months as the headline risk and volatility surrounding the U.S. election increased. We harvested many winning positions and deployed capital into new and existing positions during market pullbacks. The results of the election removed some significant unknown risks; markets
Annual Report 2020
improved and small cap stocks outperformed. While value stocks had nice gains, many of our small cap technology investments also rallied in expectation of improved economic growth. Both monetary and fiscal spending has been significantly supportive of risk assets in general, but the rally in small caps is often an early sign of a new economic cycle. We believe this is the case as the world begins to recover from the pandemic to a new normal, we hope by the second half of 2021.
Many of the Fund’s investments are technology-defined companies, however we achieve diversity in the portfolio through the broad array of end markets that our portfolio companies serve. Technology has permeated the entire global economy. End markets with strong secular growth include advanced communications, military modernization, automotive advancement, industrial digitization, medical enhancement, 5G wireless, data center buildouts, infrastructure expansion, security improvements and overall semiconductor processing and power management enhancements. Many of our portfolio companies are at the crossroads of many industries and therefore have multiple opportunities for success. This diverse market positioning inherently gives the portfolio a natural hedge and ultimately helps reduce volatility and risk. Using an old phrase, we like to invest in companies that “sell picks to the miners.”
The Fund benefitted from its concentrated investments in Veeco Instruments (VECO), Cambium Networks (CMBM), FireEye (FEYE), AXT, Inc. (AXTI) and Akoustis Technologies (AKTS).
Veeco Instruments has been a turnaround story for a couple of years after its last large company acquisition. It has significant upside in multiple product offerings in the markets of semiconductor manufacturing, light emitting diodes and hard disk drives. Veeco expects to continue improving its margin profile and balance sheet, and we believe it is well-positioned to drive shareholder value higher.
Cambium Networks became a top holding for the Fund as we believed in management and their ability to drive growth in the business model. Cambium is exposed to the rapidly expanding wireless communications markets and while it had a tough start as a new publicly-traded company in 2019, our patience and conviction paid off in 2020. Management executed through a difficult market and introduced new products that ultimately returned the company to strong financial results.
We have been a long-time believer in the FireEye’s software security solution. Unfortunately for many, there was a substantial hack in late 2020 and FireEye, along with other security stocks, had a substantial stock price move that far exceeded our previous valuation expectations.
AXT was a new investment in early 2020, based upon its technology in the substrate industry for semiconductors and other products such as LiDAR. We accumulated a large position in the stock and remained steadfast in our conviction that the business was improving. We were rewarded as manufacturing and product opportunities improved. Simultaneously, the company announced that it was going to list a subsidiary on the Chinese stock market which would unlock substantial value for shareholders.
Needham Funds
Finally, our investment in Akoustis Technologies also paid off, as filter technology for wireless communications continued to see customer interest and acceptance. As 5G continues to expand, we expect Akoustis to benefit and further broaden their end-market customer base.
Closing
We believe the U.S. remains the best place in the world to be investing, and we continue to see an opportunity to invest in small and mid-cap stocks. Most importantly, we see a revolution happening in technology that has created and continues to create investment opportunities. We see opportunity in our strategy of investing in companies that we know well and that we believe are positioned with secular growth drivers.
We welcome our new investors and thank all of our investors for their continued support. If you have any questions, thoughts or concerns, please contact us at (800) 625-7071 or jbarr@needhamco.com and cretzler@needhamco.com. For information about the Needham Funds, please visit our website at www.needhamfunds.com.
Sincerely,
 |  |
| | |
| Chris Retzler, | John O. Barr, |
| Portfolio Manager | Portfolio Manager |
Fact Sheet Links:
Needham Growth Fund
Needham Aggressive Growth Fund
Needham Small Cap Growth Fund
The information presented in this commentary is not intended as personalized investment advice and does not constitute a recommendation to buy or sell a particular security or other investments. Past performance is no guarantee of future results. The views of Needham Investment Management L.L.C., the Funds’ investment adviser (the “Adviser”), and the securities described in this report are as of December 31, 2020; these views and portfolio holdings may have changed subsequent to this date. The specific securities discussed may, in aggregate, represent only a small percentage of a Fund’s holdings. If a specific security discussed is not found in a Fund’s Schedule of Investments, it may have been held by the Fund during the period. It should not be assumed that securities identified and discussed were, or will be, profitable, or that the investment decisions made in the future will be profitable, or equal the investment performance of the securities discussed herein. There can be no guarantee as to the accuracy of any outlooks for markets, sectors and securities as discussed herein.
Annual Report 2020
This message is not an offer of the Needham Growth Fund, the Needham Aggressive Growth Fund or the Needham Small Cap Growth Fund. Shares are sold only through the currently effective prospectus. Please read the prospectus or summary prospectus carefully and consider the investment objectives, risks and charges and expenses of the Funds carefully before you invest. The prospectus and summary prospectus contain this and other information about the Funds and can be obtained on our website, www.needhamfunds.com or by contacting the Funds’ transfer agent U.S. Bancorp Fund Services LLC doing business as U.S. Bank Global Fund Services (“Fund Services”) at 1-800-625-7071.
Investment returns and principal value will fluctuate, and when redeemed, shares may be worth more or less than their original cost. Performance data quoted represents past performance, and does not guarantee future results. Current performance may be higher or lower than these results. Performance current to the most recent month-end may be obtained by calling our transfer agent at 1-800-625-7071. Total return figures include reinvestment of all dividends and capital gains.
All three of the Needham Funds have substantial exposure to small and micro capitalized companies. Funds holding smaller capitalized companies are subject to greater price fluctuation than those of larger companies. The coronavirus disease 2019 (COVID-19) global pandemic and the aggressive responses taken by many governments or voluntarily imposed by private parties, including closing borders, restricting travel and imposing prolonged quarantines or similar restrictions, as well as the closure of, or operational changes to, many retail and other businesses, have had negative impacts, and in many cases severe negative impacts, on markets worldwide. It is not known how long such impacts, or any future impacts of other significant events described above, will or would last, but there could be a prolonged period of global economic slowdown, which may impact your Fund investment. Needham & Company, LLC, member FINRA/SIPC, is the distributor of The Needham Funds, Inc.
The Russell 2000 Index is a broad unmanaged index composed of the smallest 2,000 companies in the Russell 3000 Index. The Russell 3000 Index is a market-capitalization-weighted equity index that provides exposure to the entire U.S. stock market. The Russell 3000 Index tracks the performance of the 3,000 largest U.S.-traded stocks. Please see the disclaimer regarding these indexes under “Supplementary Information—Index Disclaimer” on page 57 of this report.
Needham Funds
| NEEDHAM GROWTH FUND | Retail Class |
| Portfolio Characteristics (Unaudited) | Ticker Symbol: NEEGX |
| | Institutional Class |
| | Ticker Symbol: NEEIX |
Comparison of Change in Value of a $10,000 Investment
The chart above assumes an initial gross investment of $10,000 made on January 1, 1996.
Comparative Performance Statistics as of December 31, 2020
| | 1 | 5 | 10 | Since |
| | Year | Years | Years | Inception |
Needham Growth Fund Retail Class(1)(2) | 41.59% | 16.71% | 11.73% | 13.70% |
Needham Growth Fund Institutional Class(1)(3) | 42.24% | n/a | n/a | 18.89% |
S&P 500 Index(4)(5) | 18.40% | 15.22% | 13.88% | 9.56%(8) |
S&P MidCap 400 Index(4)(6) | 13.66% | 12.35% | 11.51% | 11.45%(8) |
Russell 2000 Index(4)(7) | 19.96% | 13.26% | 11.20% | 9.05%(8) |
Top Ten Holdings*
(as a % of investments†,
as of December 31, 2020)
| | | % of |
Security | | Investments |
| Entegris, Inc. | ENTG | 7.56% |
| Thermo Fisher Scientific, Inc. | TMO | 7.13% |
| PDF Solutions, Inc. | PDFS | 6.92% |
| Aspen Aerogels, Inc. | ASPN | 5.08% |
| CarMax, Inc. | KMX | 4.81% |
| Vicor Corp. | VICR | 4.56% |
| KVH Industries, Inc. | KVHI | 4.14% |
| Comcast Corp. | CMCSA | 4.08% |
| FormFactor, Inc. | FORM | 3.79% |
| Becton Dickinson & Co. | BDX | 3.38% |
| | | |
| Top Ten Holdings = 51.45% of Total Investments | | |
| | |
Sector Weightings*
(as a % of net exposure(12),
as of December 31, 2020)
| | | | Net |
Sector(10) | Long(11) | (Short) | Exposure(12) |
| Cash | 2.7% | — | 2.7% |
| Communication Services | 4.5% | — | 4.5% |
| Consumer Discretionary | 4.8% | — | 4.8% |
| Consumer Staples | 0.4% | — | 0.4% |
| Energy | 5.3% | — | 5.3% |
| Health Care | 17.4% | — | 17.4% |
| Industrials | 6.1% | — | 6.1% |
| Information Technology | 58.7% | (0.2)% | 58.5% |
| Real Estate | 0.3% | — | 0.3% |
| | | | |
Annual Report 2020
| NEEDHAM AGGRESSIVE GROWTH FUND | Retail Class |
| Portfolio Characteristics (Unaudited) | Ticker Symbol: NEAGX |
| | Institutional Class |
| | Ticker Symbol: NEAIX |
Comparison of Change in Value of a $10,000 Investment
The chart above assumes an initial gross investment of $10,000 made on September 4, 2001.
Comparative Performance Statistics as of December 31, 2020
| | 1 | 5 | 10 | Since |
| | Year | Years | Years | Inception |
Needham Aggressive Growth Fund Retail Class(1)(2) | 51.39% | 19.50% | 12.57% | 11.43% |
Needham Aggressive Growth Fund Institutional Class(1)(3) | 52.36% | n/a | n/a | 19.53% |
S&P 500 Index(4)(5) | 18.40% | 15.22% | 13.88% | 8.55%(8) |
Russell 2000 Index(4)(7) | 19.96% | 13.26% | 11.20% | 9.20%(8) |
| Top Ten Holdings* |
| (as a % of investments†, |
| as of December 31, 2020) |
| | | |
| | | % of |
Security | | Investments |
| Entegris, Inc. | ENTG | 10.46% |
| PDF Solutions, Inc. | PDFS | 9.69% |
| Vicor Corp. | VICR | 9.51% |
| Apple, Inc. | AAPL | 9.36% |
| Nova Measuring | | |
| Instruments, Ltd. (Israel) | NVMI | 5.79% |
| KVH Industries, Inc. | KVHI | 5.63% |
| MKS Instruments, Inc. | MKSI | 4.65% |
| Aspen Aerogels, Inc. | ASPN | 3.28% |
| Super Micro Computer, Inc. | SMCI | 2.96% |
| CarMax, Inc. | KMX | 2.47% |
| | | |
| Top Ten Holdings = 63.80 of Total Investments | | |
Sector Weightings*
(as a % of net exposure(12),
as of December 31, 2020)
| | | | Net |
Sector(10) | Long(11) | (Short) | Exposure(12) |
| Cash | 0.6% | — | 0.6% |
| Communication Services | 0.1% | — | 0.1% |
| Consumer Discretionary | 2.5% | — | 2.5% |
| Consumer Staples | 1.9% | — | 1.9% |
| Energy | 3.3% | — | 3.3% |
| Financials | 1.9% | — | 1.9% |
| Health Care | 5.3% | — | 5.3% |
| Industrials | 13.4% | — | 13.4% |
| Information Technology | 69.1% | — | 69.1% |
| Materials | 1.7% | — | 1.7% |
| Real Estate | 0.2% | — | 0.2% |
Needham Funds
| NEEDHAM SMALL CAP GROWTH FUND | Retail Class |
| Portfolio Characteristics (Unaudited) | Ticker Symbol: NESGX |
| | Institutional Class |
| | Ticker Symbol: NESIX |
Comparison of Change in Value of a $10,000 Investment
The chart above assumes an initial gross investment of $10,000 made on May 22, 2002.
Comparative Performance Statistics as of December 31, 2020
| | 1 | 5 | 10 | Since |
| | Year | Years | Years | Inception |
Needham Small Cap Growth Fund Retail Class(1)(2) | 71.35% | 29.82% | 14.70% | 14.16% |
Needham Small Cap Growth Fund Institutional Class(1)(3) | 72.51% | n/a | n/a | 30.20% |
S&P 500 Index(4)(5) | 18.40% | 15.22% | 13.88% | 9.08%(8) |
Russell 2000 Index(4)(7) | 19.96% | 13.26% | 11.20% | 9.19%(8) |
Top Ten Holdings*
(as a % of investments†,
as of December 31, 2020)
| | | % of |
Security | | Investments |
| Photronics, Inc. | PLAB | 6.12% |
| AXT, Inc. | AXTI | 5.49% |
| Limelight Networks, Inc. | LLNW | 4.10% |
| Intevac, Inc. | IVAC | 4.02% |
| Telos Corp. | TLS | 3.83% |
| Veeco Instruments, Inc. | VECO | 3.81% |
| EMCORE Corp. | EMKR | 3.73% |
| Fluidigm Corp. | FLDM | 3.43% |
| Akoustis Technologies, Inc. | AKTS | 3.39% |
| Sumo Logic, Inc. | SUMO | 3.30% |
| | | |
| Top Ten Holdings = 41.22% of Total Investments | | |
Sector Weightings*
(as a % of net exposure(12),
as of December 31, 2020)
| | | | Net |
Sector(10) | Long(11) | (Short) | Exposure(12) |
| Cash | 8.8% | — | 8.8% |
| Communication Services | 4.2% | — | 4.2% |
| Energy | 3.7% | — | 3.7% |
| Financials | 2.8% | — | 2.8% |
| Health Care | 9.3% | — | 9.3% |
| Industrials | 0.5% | — | 0.5% |
| Information Technology | 71.1% | (0.4)% | 70.7% |
Annual Report 2020
Each Fund’s performance figures are for the periods ended December 31, 2020. The performance data quoted is historical. Past performance is no guarantee of future results. Current performance may be higher or lower than the performance data quoted. The principal value and investment return of an investment will fluctuate so that your shares, when redeemed, may be worth more or less than their original cost. To obtain performance information current to the most recent month-end, please visit www.needhamfunds.com or call 1-800-625-7071. The returns shown above are net of expenses. The returns shown do not reflect the deduction of taxes that a shareholder would pay on Fund distributions or on the redemptions of Fund shares. In the absence of fee waivers and expense reimbursements, when they are necessary to keep the Fund’s total annual operating expenses at the expense cap currently in effect, total return would be reduced. Performance figures for periods greater than one year are annualized. For information about each index shown above, please see the notes below. The Global Industry Classification Standard (GICS®) was developed by and/or is the exclusive property of MSCI, Inc. and Standard & Poor Financial Services LLC (“S&P”). GICS is a service mark of MSCI and S&P and has been licensed for use by U.S. Bancorp Fund Services, LLC, doing business as U.S. Bank Global Fund Services (“Fund Services”).
(1) | Investment results calculated after reinvestment of dividends. |
(2) | The inception date of the Retail Class of each Fund was as follows: Needham Growth Fund – 1/1/96; Needham Aggressive Growth Fund – 9/4/01; and Needham Small Cap Growth Fund – 5/22/02. |
(3) | The inception date of the Institutional Class of each Fund was 12/30/16. |
(4) | It is not possible to invest directly in an index. The performance of the index does not include the deduction of expenses associated with a mutual fund, such as investment management fees. |
(5) | The S&P 500 Index focuses on the large-cap sector of the market; however, since it includes a significant portion of the total value of the market, it also is considered representative of the market. Companies in the S&P 500 are considered leading companies in leading industries. |
(6) | The S&P MidCap 400 Index provides investors with a benchmark for mid-sized companies. The index seeks to remain an accurate measure of mid-sized companies, reflecting the risk and return characteristics of the broader mid-cap universe on an on-going basis. |
(7) | The Russell 2000 Index measures the performance of the small-cap segment of the U.S. equity universe. The Russell 2000 Index is a subset of the Russell 3000 Index representing approximately 8% of the total market capitalization of that index. The Russell 2000 Index includes approximately 2,000 of the smallest securities based on a combination of their market cap and current index membership. |
(8) | The return shown for the index is from the inception date of the Retail Class. The returns for the S&P 500 Index, S&P MidCap 400 Index and the Russell 2000 Index from the inception date of the Institutional Class are 16.03%, 10.34%, 11.32%, respectively. |
(9) | The return reflects the actual performance for the year and does not include the impact of any adjustments made for financial reporting required by Generally Accepted Accounting Principles (GAAP). |
(10) | These categories represent broad market sectors. Refer to the Schedule of Investments for a more detailed categorization by industry. |
(11) | Percentage of total investments includes all stocks, plus cash. |
(12) | Net exposure represents the difference between the long exposure and the short exposure, which produces the net investment exposure. |
| * | Current portfolio holdings may not be indicative of future portfolio holdings. |
| † | Percentage of total investments. |
Needham Funds
Disclosure of Fund Expenses (Unaudited)
The following expense table is shown so that you can understand the impact of fees on your investment. All mutual funds have operating expenses. As a shareholder of a Fund, you incur ongoing costs, which include costs for portfolio management, administrative services, and shareholder reports, among others. A Fund’s expenses are expressed as a percentage of its average net assets. This figure is known as the expense ratio. The following examples are intended to help you understand the ongoing costs (in dollars) of investing in each Fund and to compare these costs with those of other mutual funds. The examples are based on an investment of $1,000 made at the beginning of a six-month period and held for the entire period. The expense example table below illustrates your Fund’s cost in two ways:
| • | Actual Expenses. This section helps you to estimate the actual expenses after fee waivers that you paid over the period. The “Ending Account Value” shown is derived from the Fund’s actual return, and “Expenses Paid During Period” shows the dollar amount that would have been paid by an investor who started with $1,000 in the Fund. You may use the information here, together with the amount you invested, to estimate the expenses that you paid over the period. To do so, simply divide your account value by $1,000 (for example, an $8,600 account value divided by $1,000 = 8.6), then multiply the result by the number given for your Fund under the heading entitled “Expenses Paid During Period”. |
| |
| • | Hypothetical Expenses on a 5% Return. This section is intended to help you compare your Fund’s costs with those of other mutual funds. It assumes that the Fund had a return of 5% before expenses during the period shown, but that the expense ratio is unchanged. In this case, because the return used is not the Fund’s actual return, the results do not apply to your investment. The example is useful in making comparisons because the Securities and Exchange Commission requires all mutual funds to calculate expenses based on a 5% return. You can assess your Fund’s cost by comparing this hypothetical example with the hypothetical examples that appear in shareholders reports of other funds. |
Annual Report 2020
For the Period July 1, 2020 to December 31, 2020
Expense Example Table
| | Beginning | Ending | Expenses Paid | Expense Ratio |
| | Account | Account | During Period* | During Period* |
| | Value | Value | 7/1/20 – | 7/1/20 – |
| | 7/1/20 | 12/31/20 | 12/31/20 | 12/31/20 |
| Needham Growth Fund | | | | |
| Retail Class Actual Expenses | $1,000.00 | $1,333.30 | $10.38 | 1.77% |
| Retail Class Hypothetical Example | | | | |
| for Comparison Purposes | | | | |
| (5% return before expenses) | $1,000.00 | $1,016.24 | $8.97 | 1.77% |
| Institutional Class Actual Expenses | $1,000.00 | $1,336.00 | $8.22 | 1.40% |
| Institutional Class Hypothetical | | | | |
| Example for Comparison Purposes | | | | |
| (5% return before expenses) | $1,000.00 | $1,018.10 | $7.10 | 1.40% |
| | | | | |
| Needham Aggressive Growth Fund | | | | |
| Retail Class Actual Expenses | $1,000.00 | $1,343.60 | $10.90 | 1.85% |
| Retail Class Hypothetical Example | | | | |
| for Comparison Purposes | | | | |
| (5% return before expenses) | $1,000.00 | $1,015.84 | $9.37 | 1.85% |
| Institutional Class Actual Expenses | $1,000.00 | $1,348.80 | $6.97 | 1.18% |
| Institutional Class Hypothetical | | | | |
| Example for Comparison Purposes | | | | |
| (5% return before expenses) | $1,000.00 | $1,019.20 | $5.99 | 1.18% |
| | | | | |
| Needham Small Cap Growth Fund | | | | |
| Retail Class Actual Expenses | $1,000.00 | $1,496.50 | $11.67 | 1.86% |
| Retail Class Hypothetical Example | | | | |
| for Comparison Purposes | | | | |
| (5% return before expenses) | $1,000.00 | $1,015.79 | $9.42 | 1.86% |
| Institutional Class Actual Expenses | $1,000.00 | $1,501.90 | $7.48 | 1.19% |
| Institutional Class Hypothetical | | | | |
| Example for Comparison Purposes | | | | |
| (5% return before expenses) | $1,000.00 | $1,019.15 | $6.04 | 1.19% |
| * | Expenses are equal to the average account value times the Fund’s annualized expense ratio multiplied by 184/366 (to reflect the one-half-year period). |
Needham Funds
Needham Growth Fund
Schedule of Investments
December 31, 2020
| | | Shares | | | Value | |
| Common Stocks (97.4%) | |
| | |
| Aerospace & Defense (0.6%) | |
| | Parsons Corp. (a) | | | 24,000 | | | $ | 873,840 | |
| | | | | | | | | | |
| Biotechnology (3.0%) | |
| | G1 Therapeutics, Inc. (a) | | | 11,000 | | | | 197,890 | |
| | Gilead Sciences, Inc. | | | 69,000 | | | | 4,019,940 | |
| | Moderna, Inc. (a) | | | 750 | | | | 78,353 | |
| | | | | | | | | 4,296,183 | |
| Building Products (0.1%) | |
| | Alpha Pro Tech, Ltd. (a) | | | 7,500 | | | | 83,625 | |
| | | | | | | | | | |
| Commercial Services & Supplies (0.2%) | |
| | Clean Harbors, Inc. (a) | | | 3,500 | | | | 266,350 | |
| | |
| Communications Equipment (6.6%) | |
| | ADTRAN, Inc. | | | 85,000 | | | | 1,255,450 | |
| | Cambium Networks Corp. (a) | | | 53,450 | | | | 1,340,526 | |
| | Inseego Corp. (a) | | | 11,458 | | | | 177,255 | |
| | KVH Industries, Inc. (a) | | | 513,100 | | | | 5,823,685 | |
| | ViaSat, Inc. (a)(b) | | | 19,500 | | | | 636,675 | |
| | | | | | | | | 9,233,591 | |
| Electrical Equipment (4.6%) | |
| | Vicor Corp. (a) | | | 69,500 | | | | 6,409,290 | |
| | | | | | | | | | |
| Electronic Equipment, Instruments & Components (4.5%) | |
| | Arlo Technologies, Inc. (a) | | | 40,000 | | | | 311,600 | |
| | Corning, Inc. | | | 32,500 | | | | 1,170,000 | |
| | FARO Technologies, Inc. (a) | | | 10,000 | | | | 706,300 | |
| | FLIR Systems, Inc. | | | 5,000 | | | | 219,150 | |
| | II-VI, Inc. (a) | | | 10,000 | | | | 759,600 | |
| | IPG Photonics Corp. (a) | | | 6,250 | | | | 1,398,687 | |
| | TTM Technologies, Inc. (a) | | | 4,000 | | | | 55,180 | |
| | Vishay Intertechnology, Inc. | | | 60,000 | | | | 1,242,600 | |
| | Vishay Precision Group, Inc. (a) | | | 15,000 | | | | 472,200 | |
| | | | | | | | | 6,335,317 | |
| Energy Equipment & Services (5.1%) | |
| | Aspen Aerogels, Inc. (a) | | | 428,000 | | | | 7,143,320 | |
See accompanying notes to financial statements.
Annual Report 2020
Needham Growth Fund
Schedule of Investments (Continued)
December 31, 2020
| | | Shares | | | Value | |
| Common Stocks – Continued | |
| | |
| Entertainment (0.1%) | |
| | World Wrestling Entertainment, Inc. – Class A | | | 4,500 | | | $ | 216,225 | |
| | | | | | | | | | |
| Food Products (0.0%) | |
| | Vital Farms, Inc. (a) | | | 1,500 | | | | 37,965 | |
| | | | | | | | | | |
| Health Care Equipment & Supplies (6.5%) | |
| | Becton Dickinson & Co. | | | 19,000 | | | | 4,754,180 | |
| | CryoLife, Inc. (a) | | | 6,000 | | | | 141,660 | |
| | CryoPort, Inc. (a) | | | 42,500 | | | | 1,864,900 | |
| | Medtronic PLC (Ireland) | | | 20,000 | | | | 2,342,800 | |
| | | | | | | | | 9,103,540 | |
| Health Care Providers & Services (0.6%) | |
| | Laboratory Corp. of America Holdings (a) | | | 2,000 | | | | 407,100 | |
| | Quest Diagnostics, Inc. | | | 3,750 | | | | 446,888 | |
| | | | | | | | | 853,988 | |
| Health Care Technology (0.1%) | |
| | American Well Corp. – Class A (a) | | | 6,500 | | | | 164,645 | |
| | | | | | | | | | |
| Household Products (0.4%) | |
| | Oil-Dri Corp. of America | | | 14,500 | | | | 494,160 | |
| | | | | | | | | | |
| Industrial Conglomerates (0.4%) | |
| | Honeywell International, Inc. | | | 2,500 | | | | 531,750 | |
| | | | | | | | | | |
| Interactive Media & Services (0.3%) | |
| | Alphabet, Inc. – Class A (a) | | | 250 | | | | 438,160 | |
| | | | | | | | | | |
| IT Services (3.0%) | |
| | Akamai Technologies, Inc. (a)(b) | | | 33,500 | | | | 3,517,165 | |
| | BigCommerce Holdings, Inc. (a) | | | 11,700 | | | | 750,555 | |
| | | | | | | | | 4,267,720 | |
| Life Sciences Tools & Services (7.2%) | |
| | Bruker Corp. | | | 1,000 | | | | 54,130 | |
| | Thermo Fisher Scientific, Inc. (b) | | | 21,500 | | | | 10,014,270 | |
| | | | | | | | | 10,068,400 | |
| Media (4.1%) | |
| | Comcast Corp. – Class A | | | 109,500 | | | | 5,737,800 | |
See accompanying notes to financial statements.
Needham Funds
Needham Growth Fund
Schedule of Investments (Continued)
December 31, 2020
| | | Shares | | | Value | |
| Common Stocks – Continued | |
| | |
| Oil, Gas & Consumable Fuels (0.2%) | |
| | Navigator Holdings, Ltd. (Marshall Islands) (a) | | | 27,500 | | | $ | 301,125 | |
| | | | | | | | | | |
| Real Estate Investment Trusts (REITs) (0.3%) | |
| | American Tower Corp. | | | 1,750 | | | | 392,805 | |
| | | | | | | | | | |
| Semiconductors & Semiconductor Equipment (31.1%) (d) | |
| | Allegro MicroSystems, Inc. (a) | | | 10,000 | | | | 266,600 | |
| | Applied Materials, Inc. | | | 9,000 | | | | 776,700 | |
| | AXT, Inc. (a) | | | 380,200 | | | | 3,638,514 | |
| | Entegris, Inc. | | | 110,500 | | | | 10,619,050 | |
| | FormFactor, Inc. (a) | | | 123,850 | | | | 5,328,027 | |
| | Lam Research Corp. | | | 2,500 | | | | 1,180,675 | |
| | MKS Instruments, Inc. | | | 22,000 | | | | 3,309,900 | |
| | NeoPhotonics Corp. (a) | | | 55,000 | | | | 499,950 | |
| | Nova Measuring Instruments, Ltd. (Israel) (a) | | | 48,750 | | | | 3,441,750 | |
| | PDF Solutions, Inc. (a) | | | 450,000 | | | | 9,720,000 | |
| | Photronics, Inc. (a) | | | 150,000 | | | | 1,674,000 | |
| | SiTime Corp. (a) | | | 12,500 | | | | 1,399,125 | |
| | Taiwan Semiconductor Manufacturing | | | | | | | | |
| | Co., Ltd. (Taiwan) – ADR | | | 9,000 | | | | 981,360 | |
| | Veeco Instruments, Inc. (a) | | | 50,650 | | | | 879,284 | |
| | | | | | | | | 43,714,935 | |
| Software (9.1%) | |
| | The Trade Desk, Inc. – Class A (a) | | | 4,750 | | | | 3,804,750 | |
| | 8x8, Inc. (a) | | | 20,000 | | | | 689,400 | |
| | Alteryx, Inc. – Class A (a) | | | 1,000 | | | | 121,790 | |
| | Appian Corp. (a) | | | 4,500 | | | | 729,405 | |
| | ChannelAdvisor Corp. (a) | | | 42,600 | | | | 680,748 | |
| | Coupa Software, Inc. (a) | | | 2,500 | | | | 847,275 | |
| | Datadog, Inc. – Class A (a) | | | 1,500 | | | | 147,660 | |
| | Duck Creek Technologies, Inc. (a) | | | 4,723 | | | | 204,506 | |
| | Everbridge, Inc. (a) | | | 11,500 | | | | 1,714,305 | |
| | FireEye, Inc. (a) | | | 1,250 | | | | 28,825 | |
| | GSE Systems, Inc. (a) | | | 24,029 | | | | 31,718 | |
| | Q2 Holdings, Inc. (a) | | | 16,500 | | | | 2,087,745 | |
| | Sumo Logic, Inc. (a) | | | 20,500 | | | | 585,890 | |
| | Telos Corp. (a) | | | 35,450 | | | | 1,169,141 | |
| | | | | | | | | 12,843,158 | |
See accompanying notes to financial statements.
Annual Report 2020
Needham Growth Fund
Schedule of Investments (Continued)
December 31, 2020
| | | Shares | | | Value | |
| Common Stocks – Continued | |
| | |
| Specialty Retail (4.8%) | |
| | CarMax, Inc. (a) | | | 71,500 | | | $ | 6,753,890 | |
| | | | | | | | | | |
| Technology Hardware, Storage & Peripherals (4.2%) | |
| | Apple, Inc. | | | 10,800 | | | | 1,433,052 | |
| | Intevac, Inc. (a) | | | 192,350 | | | | 1,386,843 | |
| | Super Micro Computer, Inc. (a) | | | 94,436 | | | | 2,989,844 | |
| | Western Digital Corp. | | | 2,250 | | | | 124,628 | |
| | | | | | | | | 5,934,367 | |
| Trading Companies & Distributors (0.3%) | |
| | Air Lease Corp. | | | 10,000 | | | | 444,200 | |
| Total Common Stocks | |
| (Cost $42,362,677) | | | $ | 136,940,349 | |
| | |
| Short-Term Investments (2.7%) | |
| | |
| Money Market Fund (2.7%) | |
| | Dreyfus Treasury Securities Cash Management – | | | | | | | | |
| | Institutional Class 0.01% (c) | | | | | | | | |
| Total Short-Term Investments | |
| (Cost $3,791,788) | | | 3,791,788 | | | $ | 3,791,788 | |
| | |
| Total Investments (100.1%) | |
| (Cost $46,154,465) | | | | 140,732,137 | |
| Total Securities Sold Short (-0.2%) | | | | (223,485 | ) |
| (Proceeds $221,612) | | | | | |
| Other Assets in Excess of Liabilities (0.1%) | | | | 164,899 | |
| Net Assets (100.0%) | | | $ | 140,673,551 | |
| | Percentages are stated as a percent of net assets. |
| | Industry classifications may be different than those used for compliance monitoring purposes. |
| (a) | Non-income producing security. |
| (b) | Security position is either entirely or partially held in a segregated account as collateral for securities sold short, aggregating a total market value of $1,963,860. |
| (c) | Rate shown is the seven-day yield as of December 31, 2020. |
| (d) | As of December 31, 2020, the Fund had a significant portion of its assets invested in the Semiconductors & Semiconductor Equipment industry. (unaudited) |
| | |
| ADR | American Depositary Receipt |
See accompanying notes to financial statements.
Needham Funds
Needham Growth Fund
Schedule of Investments (Continued)
December 31, 2020
Distribution of investments by country or territory of incorporation, as a percentage of Total Investments, is as follows (Unaudited):
| Country | Long | |
| United States^ | 95.0% | |
| Israel | 2.4% | |
| Ireland | 1.7% | |
| Taiwan | 0.7% | |
| Marshall Islands | 0.2% | |
| Total | 100.0% | |
| ^ | United States allocation includes Short-Term Investment-Money Market Fund of 2.7%. |
See accompanying notes to financial statements.
Annual Report 2020
Needham Growth Fund
Schedule of Securities Sold Short
December 31, 2020
| | | Shares | | | Value | |
| Securities Sold Short (-0.2%) | |
| | |
| Semiconductors & Semiconductor Equipment (-0.2%) | |
| | Onto Innovation, Inc. (a) | | | 4,700 | | | $ | 223,485 | |
| Total Securities Sold Short (-0.2%) | |
| (Proceeds $221,612) | | | $ | 223,485 | |
| (a) | Non-income producing security. |
Distribution of investments by country or territory of incorporation, as a percentage of Securities Sold Short, is as follows (Unaudited):
| Country | Short | |
| United States | 100.0% | |
| Total | 100.0% | |
See accompanying notes to financial statements.
Needham Funds
Needham Aggressive Growth Fund
Schedule of Investments
December 31, 2020
| | | Shares | | | Value | |
| Common Stocks (99.4%) | |
| | |
| Aerospace & Defense (0.4%) | |
| | Parsons Corp. (a) | | | 7,550 | | | $ | 274,895 | |
| | | | | | | | | | |
| Biotechnology (0.2%) | |
| | G1 Therapeutics, Inc. (a) | | | 7,000 | | | | 125,930 | |
| | Moderna, Inc. (a) | | | 200 | | | | 20,894 | |
| | | | | | | | | 146,824 | |
| Building Products (1.2%) | |
| | Alpha Pro Tech, Ltd. (a) | | | 75,000 | | | | 836,250 | |
| | Jewett-Cameron Trading Co., Ltd. (Canada) (a) | | | 7,500 | | | | 65,625 | |
| | | | | | | | | 901,875 | |
| Commercial Services & Supplies (0.2%) | |
| | Clean Harbors, Inc. (a) | | | 2,000 | | | | 152,200 | |
| | | | | | | | | | |
| Communications Equipment (7.2%) | |
| | ADTRAN, Inc. | | | 50,000 | | | | 738,500 | |
| | Cambium Networks Corp. (a) | | | 17,500 | | | | 438,900 | |
| | KVH Industries, Inc. (a) | | | 369,400 | | | | 4,192,690 | |
| | | | | | | | | 5,370,090 | |
| Construction Materials (1.7%) | |
| | Smith-Midland Corp. (a) | | | 137,500 | | | | 1,263,625 | |
| | | | | | | | | | |
| Electrical Equipment (9.5%) | |
| | Vicor Corp. (a) | | | 76,750 | | | | 7,077,885 | |
| | | | | | | | | | |
| Electronic Equipment, Instruments & Components (3.1%) | |
| | Arlo Technologies, Inc. (a) | | | 40,000 | | | | 311,600 | |
| | IPG Photonics Corp. (a) | | | 7,000 | | | | 1,566,530 | |
| | Vishay Precision Group, Inc. (a) | | | 12,500 | | | | 393,500 | |
| | | | | | | | | 2,271,630 | |
| Energy Equipment & Services (3.3%) | |
| | Aspen Aerogels, Inc. (a) | | | 146,100 | | | | 2,438,409 | |
| | | | | | | | | | |
| Entertainment (0.1%) | |
| | World Wrestling Entertainment, Inc. – Class A | | | 2,250 | | | | 108,112 | |
| | | | | | | | | | |
| Food Products (0.1%) | |
| | Vital Farms, Inc. (a) | | | 2,000 | | | | 50,620 | |
See accompanying notes to financial statements.
Annual Report 2020
Needham Aggressive Growth Fund
Schedule of Investments (Continued)
December 31, 2020
| | | Shares | | | Value | |
| Common Stocks – Continued | |
| | |
| Health Care Equipment & Supplies (2.9%) | |
| | CryoPort, Inc. (a) | | | 29,500 | | | $ | 1,294,460 | |
| | LeMaitre Vascular, Inc. | | | 22,000 | | | | 891,000 | |
| | | | | | | | | 2,185,460 | |
| Health Care Providers & Services (0.8%) | |
| | Laboratory Corp. of America Holdings (a) | | | 500 | | | | 101,775 | |
| | Quest Diagnostics, Inc. | | | 2,000 | | | | 238,340 | |
| | Sharps Compliance Corp. (a) | | | 27,500 | | | | 259,875 | |
| | | | | | | | | 599,990 | |
| Health Care Technology (0.5%) | |
| | American Well Corp. – Class A (a) | | | 1,155 | | | | 29,256 | |
| | Omnicell, Inc. (a) | | | 3,000 | | | | 360,060 | |
| | | | | | | | | 389,316 | |
| Household Products (1.8%) | |
| | Oil-Dri Corp. of America | | | 39,500 | | | | 1,346,160 | |
| | | | | | | | | | |
| IT Services (2.5%) | |
| | Akamai Technologies, Inc. (a)(b) | | | 14,500 | | | | 1,522,355 | |
| | BigCommerce Holdings, Inc. (a) | | | 5,000 | | | | 320,750 | |
| | | | | | | | | 1,843,105 | |
| Life Sciences Tools & Services (0.8%) | |
| | Bruker Corp. | | | 11,000 | | | | 595,430 | |
| | | | | | | | | | |
| Machinery (0.5%) | |
| | Westinghouse Air Brake Technologies Corp. | | | 5,000 | | | | 366,000 | |
| | | | | | | | | | |
| Professional Services (0.8%) | |
| | CRA International, Inc. | | | 12,000 | | | | 611,160 | |
| | | | | | | | | | |
| Real Estate Investment Trusts (REITs) (2.1%) | |
| | American Tower Corp. | | | 800 | | | | 179,568 | |
| | Equinix, Inc. | | | 2,000 | | | | 1,428,360 | |
| | | | | | | | | 1,607,928 | |
| Semiconductors & Semiconductor Equipment (35.6%) (d) | |
| | Allegro MicroSystems, Inc. (a) | | | 2,373 | | | | 63,264 | |
| | AXT, Inc. (a) | | | 56,750 | | | | 543,098 | |
See accompanying notes to financial statements.
Needham Funds
Needham Aggressive Growth Fund
Schedule of Investments (Continued)
December 31, 2020
| | | Shares | | | Value | |
| Common Stocks – Continued | |
| | |
| Semiconductors & Semiconductor Equipment – Continued | |
| | Entegris, Inc. | | | 81,000 | | | $ | 7,784,100 | |
| | FormFactor, Inc. (a) | | | 22,750 | | | | 978,705 | |
| | MKS Instruments, Inc. | | | 23,000 | | | | 3,460,350 | |
| | NeoPhotonics Corp. (a) | | | 25,000 | | | | 227,250 | |
| | Nova Measuring Instruments, Ltd. (Israel) (a)(b) | | | 61,000 | | | | 4,306,600 | |
| | PDF Solutions, Inc. (a)(b) | | | 334,000 | | | | 7,214,400 | |
| | Photronics, Inc. (a) | | | 30,000 | | | | 334,800 | |
| | SiTime Corp. (a) | | | 5,000 | | | | 559,650 | |
| | Taiwan Semiconductor Manufacturing | | | | | | | | |
| | Co., Ltd. (Taiwan) – ADR | | | 7,500 | | | | 817,800 | |
| | Veeco Instruments, Inc. (a) | | | 11,000 | | | | 190,960 | |
| | | | | | | | | 26,480,977 | |
| Software (7.6%) | |
| | The Trade Desk, Inc. – Class A (a) | | | 1,200 | | | | 961,200 | |
| | Absolute Software Corp. (Canada) | | | 8,500 | | | | 101,235 | |
| | Altair Engineering, Inc. – Class A (a) | | | 1,750 | | | | 101,815 | |
| | Appian Corp. (a) | | | 1,150 | | | | 186,404 | |
| | ChannelAdvisor Corp. (a) | | | 24,650 | | | | 393,907 | |
| | Digimarc Corp. (a) | | | 10,500 | | | | 496,020 | |
| | Duck Creek Technologies, Inc. (a) | | | 1,440 | | | | 62,352 | |
| | Everbridge, Inc. (a) | | | 2,000 | | | | 298,140 | |
| | fuboTV, Inc. (a) | | | 4,500 | | | | 126,000 | |
| | GSE Systems, Inc. (a)(e) | | | 1,057,625 | | | | 1,396,065 | |
| | Q2 Holdings, Inc. (a) | | | 8,000 | | | | 1,012,240 | |
| | Sumo Logic, Inc. (a) | | | 578 | | | | 16,519 | |
| | Telos Corp. (a) | | | 14,950 | | | | 493,051 | |
| | | | | | | | | 5,644,948 | |
| Specialty Retail (2.5%) | |
| | CarMax, Inc. (a) | | | 19,500 | | | | 1,841,970 | |
| | | | | | | | | | |
| Technology Hardware, Storage & Peripherals (13.2%) | |
| | Apple, Inc. | | | 52,500 | | | | 6,966,225 | |
| | Intevac, Inc. (a) | | | 92,675 | | | | 668,187 | |
| | Super Micro Computer, Inc. (a) | | | 69,500 | | | | 2,200,370 | |
| | | | | | | | | 9,834,782 | |
See accompanying notes to financial statements.
Annual Report 2020
Needham Aggressive Growth Fund
Schedule of Investments (Continued)
December 31, 2020
| | | Shares | | | Value | |
| Common Stocks – Continued | |
| | |
| Trading Companies & Distributors (0.6%) | |
| | Transcat, Inc. (a) | | | 13,500 | | | $ | 468,180 | |
| | | | | | | | | | |
| Transportation Infrastructure (0.2%) | |
| | exactEarth, Ltd. (Canada) (a) | | | 115,000 | | | | 126,483 | |
| Total Common Stocks | |
| (Cost $23,429,526) | | | $ | 73,998,054 | |
| | |
| Short-Term Investments (0.6%) | |
| | |
| Money Market Fund (0.6%) | |
| | Dreyfus Treasury Securities Cash Management – | | | | | | | | |
| | Institutional Class 0.01% (c) | | | | | | | | |
| Total Short-Term Investment | |
| (Cost $425,951) | | | 425,951 | | | $ | 425,951 | |
| | |
| Total Investments (100.0%) | |
| (Cost $23,855,477) | | | | 74,424,005 | |
| Liabilities in Excess of Other Assets (0.0%) | | | | (33,718 | ) |
| Net Assets (100.0%) | | | $ | 74,390,287 | |
| | Percentages are stated as a percent of net assets. |
| | Industry classifications may be different than those used for compliance monitoring purposes. |
| (a) | Non-income producing security. |
| (b) | Security position is either entirely or partially held in a segregated account as collateral for securities sold short, aggregating a total market value of $1,525,097. |
| (c) | Rate shown is the seven-day yield as of December 31, 2020. |
| (d) | As of December 31, 2020, the Fund had a significant portion of its assets invested in the Semiconductors & Semiconductor Equipment industry. (unaudited) |
| (e) | Affiliated security. Please refer to Note 11 of the Financial Statements. |
ADR
| American Depositary Receipt |
Distribution of investments by country or territory of incorporation, as a percentage of Total Investments, is as follows (Unaudited):
| Country | Long | |
| United States^ | 92.7% | |
| Israel | 5.8% | |
| Taiwan | 1.1% | |
| Canada | 0.4% | |
| Total | 100.0% | |
| ^ | United States allocation includes Short-Term Investment-Money Market Fund of 0.6%. |
See accompanying notes to financial statements.
Needham Funds
Needham Small Cap Growth Fund
Schedule of Investments
December 31, 2020
| | | Shares | | | Value | |
| Common Stocks (92.3%) | |
| | |
| Aerospace & Defense (0.5%) | |
| | Parsons Corp. (a) | | | 30,000 | | | $ | 1,092,300 | |
| | | | | | | | | | |
| Biotechnology (0.5%) | |
| | Voyager Therapeutics, Inc. (a) | | | 141,924 | | | | 1,014,757 | |
| | | | | | | | | | |
| Communications Equipment (15.8%) | |
| | ADTRAN, Inc. | | | 395,000 | | | | 5,834,150 | |
| | Cambium Networks Corp. (a) | | | 183,354 | | | | 4,598,518 | |
| | EMCORE Corp. (a)(e) | | | 1,500,000 | | | | 8,175,000 | |
| | Inseego Corp. (a) | | | 133,600 | | | | 2,066,792 | |
| | KVH Industries, Inc. (a)(b) | | | 568,400 | | | | 6,451,340 | |
| | Lantronix, Inc. (a) | | | 250,000 | | | | 1,110,000 | |
| | ViaSat, Inc. (a)(b) | | | 185,000 | | | | 6,040,250 | |
| | | | | | | | | 34,276,050 | |
| Consumer Finance (2.8%) | |
| | LendingTree, Inc. (a) | | | 22,500 | | | | 6,160,275 | |
| | | | | | | | | | |
| Diversified Telecommunication Services (1.6%) | |
| | Vonage Holdings Corp. (a) | | | 275,000 | | | | 3,540,625 | |
| | | | | | | | | | |
| Electronic Equipment, Instruments & Components (9.0%) | |
| | Akoustis Technologies, Inc. (a) | | | 607,500 | | | | 7,429,725 | |
| | TTM Technologies, Inc. (a) | | | 55,000 | | | | 758,725 | |
| | Vishay Intertechnology, Inc. | | | 225,000 | | | | 4,659,750 | |
| | Vishay Precision Group, Inc. (a)(b) | | | 214,000 | | | | 6,736,720 | |
| | | | | | | | | 19,584,920 | |
| Energy Equipment & Services (2.5%) | |
| | Aspen Aerogels, Inc. (a) | | | 320,000 | | | | 5,340,800 | |
| | | | | | | | | | |
| Entertainment (2.7%) | |
| | World Wrestling Entertainment, Inc. – Class A | | | 120,000 | | | | 5,766,000 | |
| | | | | | | | | | |
| Health Care Equipment & Supplies (4.4%) | |
| | CryoLife, Inc. (a) | | | 80,000 | | | | 1,888,800 | |
| | Sientra, Inc. (a) | | | 1,000,000 | | | | 3,890,000 | |
| | ViewRay, Inc. (a) | | | 1,000,000 | | | | 3,820,000 | |
| | | | | | | | | 9,598,800 | |
See accompanying notes to financial statements.
Annual Report 2020
Needham Small Cap Growth Fund
Schedule of Investments (Continued)
December 31, 2020
| | | Shares | | | Value | |
| Common Stocks – Continued | |
| | |
| Health Care Technology (0.2%) | |
| | American Well Corp. – Class A (a) | | | 20,800 | | | $ | 526,864 | |
| | | | | | | | | | |
| IT Services (5.5%) | |
| | BigCommerce Holdings, Inc. (a) | | | 46,800 | | | | 3,002,220 | |
| | Limelight Networks, Inc. (a)(b) | | | 2,250,000 | | | | 8,977,500 | |
| | | | | | | | | 11,979,720 | |
| Life Sciences Tools & Services (3.4%) | |
| | Fluidigm Corp. (a) | | | 1,250,000 | | | | 7,500,000 | |
| | | | | | | | | | |
| Oil, Gas & Consumable Fuels (1.3%) | |
| | Navigator Holdings, Ltd. (Marshall Islands) (a) | | | 257,044 | | | | 2,814,632 | |
| | |
| Pharmaceuticals (0.8%) | |
| | Agile Therapeutics, Inc. (a) | | | 600,000 | | | | 1,722,000 | |
| | | | | | | | | | |
| Semiconductors & Semiconductor Equipment (17.6%) | |
| | Allegro MicroSystems, Inc. (a) | | | 50,000 | | | | 1,333,000 | |
| | AXT, Inc. (a) | | | 1,255,000 | | | | 12,010,350 | |
| | NeoPhotonics Corp. (a) | | | 200,000 | | | | 1,818,000 | |
| | PDF Solutions, Inc. (a) | | | 60,000 | | | | 1,296,000 | |
| | Photronics, Inc. (a) | | | 1,200,000 | | | | 13,392,000 | |
| | Veeco Instruments, Inc. (a) | | | 480,428 | | | | 8,340,230 | |
| | | | | | | | | 38,189,580 | |
| Software (19.2%) | |
| | 8x8, Inc. (a) | | | 35,000 | | | | 1,206,450 | |
| | Benefitfocus, Inc. (a) | | | 15,000 | | | | 217,200 | |
| | ChannelAdvisor Corp. (a) | | | 90,250 | | | | 1,442,195 | |
| | Cornerstone OnDemand, Inc. (a) | | | 140,000 | | | | 6,165,600 | |
| | Duck Creek Technologies, Inc. (a) | | | 40,000 | | | | 1,732,000 | |
| | FireEye, Inc. (a) | | | 125,000 | | | | 2,882,500 | |
| | New Relic, Inc. (a) | | | 50,000 | | | | 3,270,000 | |
| | Sumo Logic, Inc. (a) | | | 252,500 | | | | 7,216,450 | |
| | Telos Corp. (a) | | | 254,600 | | | | 8,396,708 | |
| | Yext, Inc. (a) | | | 450,000 | | | | 7,074,000 | |
| | Zuora, Inc. – Class A (a) | | | 151,800 | | | | 2,114,574 | |
| | | | | | | | | 41,717,677 | |
Needham Funds
Needham Small Cap Growth Fund
Schedule of Investments (Continued)
December 31, 2020
| | | Shares | | | Value | |
| Common Stocks – Continued | |
| | |
| Technology Hardware, Storage & Peripherals (4.5%) | |
| | Intevac, Inc. (a)(e) | | | 1,220,468 | | | $ | 8,799,574 | |
| | Western Digital Corp. | | | 17,500 | | | | 969,325 | |
| | | | | | | | | 9,768,899 | |
| Total Common Stocks | |
| (Cost $159,221,856) | | | $ | 200,593,899 | |
| | |
| Short-Term Investments (8.9%) | |
| | |
| Money Market Fund (8.9%) | |
| | Dreyfus Treasury Securities Cash Management – | | | | | | | | |
| | Institutional Class 0.01% (c) | | | | | | | | |
| Total Short-Term Investments | |
| (Cost $19,254,825) | | | 19,254,825 | | | $ | 19,254,825 | |
| | |
| Total Investments (101.2%) | |
| (Cost $178,476,681) | | | | 219,848,724 | |
| Total Securities Sold Short (-0.4%) | | | | (884,430 | ) |
| (Proceeds $877,019) | | | | | |
| Liabilities in Excess of Other Assets (-0.8%) | | | | (1,814,811 | ) |
| Net Assets (100.0%) | | | $ | 217,149,483 | |
| | Percentages are stated as a percent of net assets. |
| | Industry classifications may be different than those used for compliance monitoring purposes. |
| (a) | Non-income producing security. |
| (b) | Security position is either entirely or partially held in a segregated account as collateral for securities sold short, aggregating a total market value of $2,239,430. |
| (c) | Rate shown is the seven-day yield as of December 31, 2020. |
| (e) | Affiliated security. Please refer to Note 11 of the Financial Statements. |
Distribution of investments by country or territory of incorporation, as a percentage of Total Investments, is as follows (Unaudited):
| Country | Long | |
| United States^ | 98.7% | |
| Marshall Islands | 1.3% | |
| Total | 100.0% | |
^ United States allocation includes Short-Term Investment-Money Market Fund of 8.90%
See accompanying notes to financial statements.
Annual Report 2020
Needham Small Cap Growth Fund
Schedule of Securities Sold Short
December 31, 2020
| | | Shares | | | Value | |
| Securities Sold Short (-0.4%) | |
| | |
| Semiconductors & Semiconductor Equipment (-0.4%) | |
| | Onto Innovation, Inc. (a) | | | 18,600 | | | $ | 884,430 | |
| Total Securities Sold Short (-0.4%) | |
| (Proceeds $877,019) | | | $ | 884,430 | |
| (a) | Non-income producing security. |
Distribution of investments by country or territory of incorporation, as a percentage of Total Securities Sold Short, is as follows (Unaudited):
| Country | Short | |
| United States | 100.0% | |
| Total | 100.0% | |
See accompanying notes to financial statements.
Needham Funds
Statements of Assets and Liabilities
December 31, 2020
| | | | | | Needham | | | Needham | |
| | | Needham | | | Aggressive | | | Small Cap | |
| | | Growth Fund | | | Growth Fund | | | Growth Fund | |
| Assets | | | | | | | | | |
| Investments, at Value: | | | | | | | | | |
| Unaffiliated Securities, | | | | | | | | | |
| (Cost $46,154,465, $21,869,017, $166,703,792) | | $ | 140,732,137 | | | $ | 73,027,940 | | | $ | 202,874,150 | |
| Affiliated securities (Cost $—, $1,986,460, $11,772,889) | | | — | | | | 1,396,065 | | | | 16,974,574 | |
| Receivables: | | | | | | | | | | | | |
| Deposit with Broker for Securities Sold Short | | | 231,715 | | | | — | | | | 981,766 | |
| Dividends and Interest | | | 26,477 | | | | 4,295 | | | | 290 | |
| Fund Shares Sold | | | 115,730 | | | | 132,331 | | | | 1,080,412 | |
| Investment Securities Sold | | | 59,609 | | | | — | | | | 2,452,354 | |
| Prepaid Expenses | | | 43,753 | | | | 30,671 | | | | 64,347 | |
| Total Assets | | | 141,209,421 | | | | 74,591,302 | | | | 224,427,893 | |
| | | | | | | | | | | | | |
| Liabilities | | | | | | | | | | | | |
| Securities Sold Short, at Value | | | | | | | | | | | | |
| (Proceeds $221,612, $—, $877,019) | | | 223,485 | | | | — | | | | 884,430 | |
| Payables: | | | | | | | | | | | | |
| Investment Securities Purchased | | | 36,244 | | | | 40,830 | | | | 5,682,690 | |
| Fund Shares Redeemed | | | 43,114 | | | | — | | | | 443,552 | |
| Due to Adviser | | | 142,216 | | | | 99,475 | | | | 175,107 | |
| Distribution Fees | | | 17,689 | | | | 8,627 | | | | 15,965 | |
| Administration and Accounting Fees | | | 20,810 | | | | 11,222 | | | | 26,906 | |
| Transfer Agent Fees | | | 3,167 | | | | 1,066 | | | | 5,939 | |
| Directors’ Fees | | | 1,045 | | | | 540 | | | | 1,391 | |
| Audit Fees | | | 20,350 | | | | 24,958 | | | | 20,350 | |
| Accrued Expenses and Other Liabilities | | | 27,750 | | | | 14,297 | | | | 22,080 | |
| Total Liabilities | | | 535,870 | | | | 201,015 | | | | 7,278,410 | |
| Total Net Assets | | $ | 140,673,551 | | | $ | 74,390,287 | | | $ | 217,149,483 | |
See accompanying notes to financial statements.
Annual Report 2020
Statements of Assets and Liabilities (Continued)
December 31, 2020
| | | | | | Needham | | | Needham | |
| | | Needham | | | Aggressive | | | Small Cap | |
| | | Growth Fund | | | Growth Fund | | | Growth Fund | |
| Retail Class Shares | | | | | | | | | |
| Net Assets | | $ | 82,627,969 | | | $ | 40,258,236 | | | $ | 89,206,186 | |
| Shares Issued and Outstanding | | | | | | | | | | | | |
| $0.001 Par Value (Authorized | | | | | | | | | | | | |
| 800,000,000,100,000,000 and | | | | | | | | | | | | |
| 100,000,000 respectively) | | | 1,478,523 | | | | 1,274,830 | | | | 3,457,891 | |
| Net Asset Value and | | | | | | | | | | | | |
| Offering Price Per Share | | $ | 55.89 | | | $ | 31.58 | | | $ | 25.80 | |
| | | | | | | | | | | | | |
| Institutional Class Shares | | | | | | | | | | | | |
| Net Assets | | $ | 58,045,582 | | | $ | 34,132,051 | | | $ | 127,943,297 | |
| Shares Issued and Outstanding | | | | | | | | | | | | |
| $0.001 Par Value (Authorized | | | | | | | | | | | | |
| 800,000,000,100,000,000 and | | | | | | | | | | | | |
| 100,000,000 respectively) | | | 1,012,022 | | | | 1,050,618 | | | | 4,801,916 | |
| Net Asset Value and | | | | | | | | | | | | |
| Offering Price Per Share | | $ | 57.36 | | | $ | 32.49 | | | $ | 26.64 | |
| | | | | | | | | | | | | |
| Components of Net Assets | | | | | | | | | | | | |
| Paid in Capital | | | 40,209,623 | | | | 22,902,189 | | | | 151,931,830 | |
| Distributable Earnings | | | 100,463,928 | | | | 51,488,098 | | | | 65,217,653 | |
| Total Net Assets | | $ | 140,673,551 | | | $ | 74,390,287 | | | $ | 217,149,483 | |
See accompanying notes to financial statements.
Needham Funds
Statements of Operations
For the year ended December 31, 2020
| | | | | | Needham | | | Needham | |
| | | Needham | | | Aggressive | | | Small Cap | |
| | | Growth Fund | | | Growth Fund | | | Growth Fund | |
| Investment Income | | | | | | | | | |
| Dividend Income from unaffiliated securities (net of | | | | | | | | | |
| foreign withholding tax of $3,778, $2,783, $—) | | $ | 706,333 | | | $ | 215,756 | | | $ | 89,014 | |
| Interest Income | | | 13,898 | | | | 8,500 | | | | 262,871 | |
| Total Investment Income | | | 720,231 | | | | 224,256 | | | | 351,885 | |
| | | | | | | | | | | | | |
| Expenses | | | | | | | | | | | | |
| Investment Advisory Fees | | | 1,441,336 | | | | 721,662 | | | | 2,065,798 | |
| Distribution Fees | | | 166,692 | | | | 79,228 | | | | 273,867 | |
| Administration and Accounting Fees | | | 141,152 | | | | 82,489 | | | | 191,166 | |
| Legal Fees | | | 57,632 | | | | 31,810 | | | | 98,940 | |
| Registration Fees | | | 41,628 | | | | 23,697 | | | | 50,327 | |
| Audit Fees | | | 33,057 | | | | 37,691 | | | | 39,739 | |
| Transfer Agent Fees | | | 29,091 | | | | 12,184 | | | | 44,123 | |
| Directors’ Fees | | | 13,155 | | | | 6,490 | | | | 15,904 | |
| Chief Compliance Officer Fees | | | 13,151 | | | | 6,357 | | | | 17,343 | |
| Custodian Fees | | | 11,842 | | | | 7,388 | | | | 17,697 | |
| Printing Fees | | | 9,349 | | | | 5,606 | | | | 10,439 | |
Dividend Expense(1) | | | 1,725 | | | | 305 | | | | 4,000 | |
Interest Expense(1) | | | 1,385 | | | | 697 | | | | 2,900 | |
| Other Expenses | | | 31,750 | | | | 15,954 | | | | 14,400 | |
| Total Expenses | | | 1,992,945 | | | | 1,068,251 | | | | 2,846,643 | |
| Fees Waived by Adviser | | | (88,423 | ) | | | (104,256 | ) | | | (240,497 | ) |
| Fees Recouped by Adviser | | | 14,374 | | | | — | | | | 84,831 | |
| Net Expenses | | | 1,918,896 | | | | 927,302 | | | | 2,690,977 | |
| Net Investment Loss | | | (1,198,665 | ) | | | (703,046 | ) | | | (2,339,092 | ) |
| | | | | | | | | | | | | |
| Net Realized / Unrealized Gain (Loss) from | | | | | | | | | | | | |
| Affiliated and Unaffiliated Securities, | | | | | | | | | | | | |
| Securities Sold Short (Note 3) | | | | | | | | | | | | |
| Net Realized Gain from Unaffiliated Securities | | | 12,575,169 | | | | 4,822,205 | | | | 54,082,947 | |
| Net Realized Loss from Affiliated Securities | | | — | | | | — | | | | (105,917 | ) |
| Net Realized Loss from Securities Sold Short | | | (533,947 | ) | | | (223,196 | ) | | | (103,425 | ) |
| Change in Unrealized Appreciation on | | | | | | | | | | | | |
| Unaffiliated Securities and Securities Sold Short | | | 30,373,279 | | | | 21,093,177 | | | | 28,545,514 | |
| Change in Unrealized Appreciation | | | | | | | | | | | | |
| (Depreciation) on Affiliated Securities | | | — | | | | (345,991 | ) | | | 4,728,538 | |
| Net Realized / Unrealized Gain (Loss) from Affiliated | | | | | | | | | | | | |
| and Unaffiliated Securities, Securities Sold Short, | | | | | | | | | | | | |
| Foreign Currency Translations (Note 3) | | | 42,414,501 | | | | 25,346,195 | | | | 87,147,657 | |
| Change in Net Assets Resulting from Operations | | $ | 41,215,836 | | | $ | 24,643,149 | | | $ | 84,808,565 | |
(1) | Expense related to short selling activities. |
See accompanying notes to financial statements.
Annual Report 2020
Needham Growth Fund
Statements of Changes in Net Assets
| | | Year Ended | | | Year Ended | |
| | | December 31, 2020 | | | December 31, 2019 | |
| Change in Net Assets | | | | | | |
| Operations: | | | | | | |
| Net Investment Loss | | $ | (1,198,665 | ) | | $ | (961,241 | ) |
| Net Realized / Unrealized Gain (Loss) from Affiliated | | | | | | | | |
| and Unaffiliated Securities, Securities Sold Short | | | 12,041,222 | | | | 6,876,369 | |
| Net Change in Unrealized Appreciation on Investments, | | | | | | | | |
| Securities Sold Short, Foreign Currency Translations | | | 30,373,279 | | | | 27,738,179 | |
| Change in Net Assets Resulting from Operations | | | 41,215,836 | | | | 33,653,307 | |
| | | | | | | | | |
| Distributable Earnings: | | | | | | | | |
| Retail Class | | | (4,431,004 | ) | | | (6,645,549 | ) |
| Institutional Class | | | (3,047,130 | ) | | | (4,505,348 | ) |
| Total Distributable Earnings | | | (7,478,134 | ) | | | (11,150,897 | ) |
| | | | | | | | | |
| Capital Transactions: | | | | | | | | |
| Retail Class: | | | | | | | | |
| Shares Issued | | | 3,900,254 | | | | 2,797,341 | |
| Shares Issued in Reinvestment of Distribution | | | 4,192,361 | | | | 6,238,725 | |
| Shares Issued in Exchange for Institutional Class Shares | | | (195,232 | ) | | | (609,257 | ) |
| Shares Redeemed | | | (10,572,031 | ) | | | (11,380,847 | ) |
| Institutional Class: | | | | | | | | |
| Shares Issued | | | 9,231,988 | | | | 5,618,710 | |
| Shares Issued in Reinvestment of Distribution | | | 2,910,539 | | | | 4,144,602 | |
| Shares Issued in Exchange for Institutional Class Shares | | | 195,232 | | | | 609,257 | |
| Shares Redeemed | | | (13,212,519 | ) | | | (2,829,421 | ) |
| Total Change in Net Assets from Capital Transactions | | | (3,549,408 | ) | | | 4,589,110 | |
| | | | | | | | | |
| Change in Net Assets | | | 30,188,295 | | | | 27,091,519 | |
| | | | | | | | | |
| Total Net Assets | | | | | | | | |
| Beginning of Year | | | 110,485,256 | | | | 83,393,737 | |
| End of Year | | $ | 140,673,551 | | | $ | 110,485,256 | |
| | | | | | | | | |
| Share Transaction: | | | | | | | | |
| Retail Class: | | | | | | | | |
| Number of Shares Issued | | | 83,429 | | | | 66,920 | |
| Number of Shares Reinvested | | | 83,463 | | | | 157,823 | |
| Number of Shares Exchanged for Institutional Class Shares | | | (4,844 | ) | | | (16,407 | ) |
| Number of Shares Redeemed | | | (243,966 | ) | | | (289,538 | ) |
| Change in Retail Class Shares | | | (81,918 | ) | | | (81,202 | ) |
| Institutional Class: | | | | | | | | |
| Number of Shares Issued | | | 199,217 | | | | 130,488 | |
| Number of Shares Reinvested | | | 56,482 | | | | 102,869 | |
| Number of Shares Issued in Exchange for Retail Class Shares | | | 4,741 | | | | 16,181 | |
| Number of Shares Redeemed | | | (298,025 | ) | | | (71,300 | ) |
| Change in Institutional Class Shares | | | (37,585 | ) | | | 178,238 | |
| Total Change in Shares | | | (119,503 | ) | | | 97,036 | |
See accompanying notes to financial statements.
Needham Funds
Needham Aggressive Growth Fund
Statements of Changes in Net Assets
| | | Year Ended | | | Year Ended | |
| | | December 31, 2020 | | | December 31, 2019 | |
| Change in Net Assets | | | | | | |
| Operations: | | | | | | |
| Net Investment Loss | | $ | (703,046 | ) | | $ | (573,290 | ) |
| Net Realized Gain from Investments, Securities Sold Short, | | | | | | | | |
| Foreign Currency Transactions, and Currency | | | 4,599,009 | | | | 3,753,492 | |
| Net Change in Unrealized Appreciation on Investments, | | | | | | | | |
| Securities Sold Short, Foreign Currency Translations | | | 20,747,186 | | | | 13,584,503 | |
| Change in Net Assets Resulting from Operations | | | 24,643,149 | | | | 16,764,705 | |
| | | | | | | | | |
| Distributable Earnings: | | | | | | | | |
| Retail Class | | | (1,502,908 | ) | | | (2,973,191 | ) |
| Institutional Class | | | (1,225,683 | ) | | | (2,002,195 | ) |
| Total Distributable Earnings | | | (2,728,591 | ) | | | (4,975,386 | ) |
| | | | | | | | | |
| Capital Transactions: | | | | | | | | |
| Retail Class: | | | | | | | | |
| Shares Issued | | | 3,289,524 | | | | 1,808,099 | |
| Shares Issued in Reinvestment of Distribution | | | 1,477,591 | | | | 2,926,680 | |
| Shares Issued in Exchange for Institutional Class Shares | | | (29,758 | ) | | | (1,367,428 | |
| Shares Redeemed | | | (6,766,562 | ) | | | (7,657,411 | ) |
| Institutional Class: | | | | | | | | |
| Shares Issued | | | 3,509,528 | | | | 6,220,562 | |
| Shares Issued in Reinvestment of Distribution | | | 1,225,683 | | | | 2,002,195 | |
| Shares Issued in Exchange for Retail Class Shares | | | 29,758 | | | | 1,367,428 | |
| Shares Redeemed | | | (6,319,760 | ) | | | (1,627,132 | ) |
| Total Change in Net Assets from Capital Transactions | | | (3,583,996 | ) | | | 3,672,993 | |
| | | | | | | | | |
| Change in Net Assets | | | 18,330,562 | | | | 15,462,312 | |
| | | | | | | | | |
| Total Net Assets | | | | | | | | |
| Beginning of Year | | | 56,059,725 | | | | 40,597,413 | |
| End of Year | | $ | 74,390,287 | | | $ | 56,059,725 | |
| | | | | | | | | |
| Share Transaction: | | | | | | | | |
| Retail Class: | | | | | | | | |
| Number of Shares Issued | | | 135,223 | | | | 85,672 | |
| Number of Shares Reinvested | | | 52,249 | | | | 144,885 | |
| Number of Shares Exchanged for Institutional Class Shares | | | (1,385 | ) | | | (68,640 | ) |
| Number of Shares Redeemed | | | (300,078 | ) | | | (381,645 | ) |
| Change in Retail Class Shares | | | (113,991 | ) | | | (219,728 | ) |
| Institutional Class: | | | | | | | | |
| Number of Shares Issued | | | 123,526 | | | | 286,847 | |
| Number of Shares Reinvested | | | 42,178 | | | | 97,147 | |
| Number of Shares Issued in Exchange for Retail Class Shares | | | 1,355 | | | | 67,464 | |
| Number of Shares Redeemed | | | (277,881 | ) | | | (78,919 | ) |
| Change in Institutional Class Shares | | | (110,822 | ) | | | 372,539 | |
| Total Change in Shares | | | (224,813 | ) | | | 152,811 | |
See accompanying notes to financial statements.
Annual Report 2020
Needham Small Cap Growth Fund
Statements of Changes in Net Assets
| | | Year Ended | | | Year Ended | |
| | | December 31, 2020 | | | December 31, 2019 | |
| Change in Net Assets | | | | | | |
| Operations: | | | | | | |
| Net Investment Loss | | $ | (2,339,092 | ) | | $ | (420,133 | ) |
| Net Realized Gain from Investments, Securities Sold Short, | | | | | | | | |
| Foreign Currency Transactions, and Currency | | | 53,873,605 | | | | 6,998,200 | |
| Net Change in Unrealized Appreciation on Investments, | | | | | | | | |
| Securities Sold Short, Foreign Currency Translations | | | 33,274,052 | | | | 10,435,265 | |
| Change in Net Assets Resulting from Operations | | | 84,808,565 | | | | 17,013,331 | |
| | | | | | | | | |
| Distributable Earnings: | | | | | | | | |
| Retail Class | | | (11,544,719 | ) | | | (2,064,023 | ) |
| Institutional Class | | | (8,098,648 | ) | | | (1,940,040 | ) |
| Total Distributable Earnings | | | (19,643,367 | ) | | | (4,004,063 | ) |
| | | | | | | | | |
| Capital Transactions: | | | | | | | | |
| Retail Class: | | | | | | | | |
| Shares Issued | | | 84,446,459 | | | | 70,656,572 | |
| Shares Issued in Reinvestment of Distribution | | | 11,109,353 | | | | 2,044,608 | |
| Shares Issued in Exchange for Institutional Class Shares | | | (924,436 | ) | | | (167,969 | ) |
| Shares Redeemed | | | (130,361,522 | ) | | | (5,572,277 | ) |
| Institutional Class: | | | | | | | | |
| Shares Issued | | | 79,913,591 | | | | 28,146,610 | |
| Shares Issued in Reinvestment of Distribution | | | 7,675,706 | | | | 1,902,565 | |
| Shares Issued in Exchange for Retail Class Shares | | | 924,743 | | | | 167,969 | |
| Shares Redeemed | | | (32,909,473 | ) | | | (2,731,986 | ) |
| Total Change in Net Assets from Capital Transactions | | | 19,874,421 | | | | 94,446,092 | |
| | | | | | | | | |
| Change in Net Assets | | | 85,039,619 | | | | 107,455,360 | |
| | | | | | | | | |
| Total Net Assets | | | | | | | | |
| Beginning of Year | | | 132,109,864 | | | | 24,654,504 | |
| End of Year | | $ | 217,149,483 | | | $ | 132,109,864 | |
| | | | | | | | | |
| Share Transaction: | | | | | | | | |
| Retail Class: | | | | | | | | |
| Number of Shares Issued | | | 4,553,066 | | | | 4,096,204 | |
| Number of Shares Reinvested | | | 529,269 | | | | 122,432 | |
| Number of Shares Exchanged for Institutional Class Shares | | | (43,421 | ) | | | (10,353 | ) |
| Number of Shares Redeemed | | | (6,443,142 | ) | | | (352,870 | ) |
| Change in Retail Class Shares | | | (1,404,228 | ) | | | 3,855,413 | |
| Institutional Class: | | | | | | | | |
| Number of Shares Issued | | | 3,581,702 | | | | 1,668,920 | |
| Number of Shares Reinvested | | | 354,372 | | | | 111,653 | |
| Number of Shares Issued in Exchange for Retail Class Shares | | | 42,326 | | | | 10,176 | |
| Number of Shares Redeemed | | | (1,769,931 | ) | | | (165,549 | ) |
| Change in Institutional Class Shares | | | 2,208,469 | | | | 1,625,200 | |
| Total Change in Shares | | | 804,241 | | | | 5,480,613 | |
See accompanying notes to financial statements.
Needham Funds
Needham Growth Fund
Financial Highlights
| | | Retail Class | |
| (For a Share Outstanding | | Year Ended December 31, | |
| Throughout each Year) | | 2020 | | | 2019 | | | 2018 | | | 2017 | | | 2016 | |
| Net Asset Value, Beginning of Year | | $ | 41.99 | | | $ | 33.04 | | | $ | 42.91 | | | $ | 43.40 | | | $ | 40.96 | |
| Investment Operations | | | | | | | | | | | | | | | | | | | | |
| Net Investment Loss | | | (0.56 | ) | | | (0.48 | ) | | | (0.88 | ) | | | (0.78 | ) | | | (0.59 | ) |
| Net Realized and Unrealized | | | | | | | | | | | | | | | | | | | | |
| Gain (Loss) on Investments | | | 17.66 | | | | 14.18 | | | | (3.11 | ) | | | 4.45 | | | | 4.86 | |
| Total from Investment Operations | | | 17.10 | | | | 13.70 | | | | (3.99 | ) | | | 3.67 | | | | 4.27 | |
| | | | | | | | | | | | | | | | | | | | | |
| Less Distributions | | | | | | | | | | | | | | | | | | | | |
| Net Realized Gains | | | (3.20 | ) | | | (4.75 | ) | | | (5.88 | ) | | | (4.16 | ) | | | (1.83 | ) |
| Total Distributions | | | (3.20 | ) | | | (4.75 | ) | | | (5.88 | ) | | | (4.16 | ) | | | (1.83 | ) |
| | | | | | | | | | | | | | | | | | | | | |
| Capital Contributions | | | | | | | | | | | | | | | | | | | | |
| Redemption Fees | | | — | | | | — | | | | — | | | | — | (1) | | | — | (1) |
| Total Capital Contributions | | | — | | | | — | | | | — | | | | — | (1) | | | — | (1) |
| Net Asset Value, End of Year | | $ | 55.89 | | | $ | 41.99 | | | $ | 33.04 | | | $ | 42.91 | | | $ | 43.40 | |
| | | | | | | | | | | | | | | | | | | | | |
| Total Return | | | 41.59 | % | | | 42.31 | %(2) | | | (10.26 | )% | | | 8.32 | % | | | 10.57 | % |
| Net Assets, End of Year (000’s) | | $ | 82,628 | | | $ | 65,526 | | | $ | 54,245 | | | $ | 78,014 | | | $ | 119,117 | |
| Ratios/Supplemental Data | | | | | | | | | | | | | | | | | | | | |
| Ratio of Net Expenses to | | | | | | | | | | | | | | | | | | | | |
| Average Net Assets | | | 1.85 | % | | | 1.98 | % | | | 2.76 | % | | | 2.34 | % | | | 2.17 | % |
| Ratio of Net Expenses to Average | | | | | | | | | | | | | | | | | | | | |
| Net Assets (before interest | | | | | | | | | | | | | | | | | | | | |
| and dividend expense) | | | 1.85 | % | | | 1.95 | % | | | 1.92 | % | | | 1.90 | % | | | 1.84 | % |
| Ratio of Total Expenses to Average | | | | | | | | | | | | | | | | | | | | |
| Net Assets (before waiver and | | | | | | | | | | | | | | | | | | | | |
| reimbursement of expenses) | | | 1.83 | % | | | 2.01 | % | | | 2.76 | % | | | 2.34 | % | | | 2.17 | % |
| Ratio of Net Investment Loss | | | | | | | | | | | | | | | | | | | | |
| to Average Net Assets | | | (1.23 | )% | | | (1.21 | )% | | | (2.07 | )% | | | (1.73 | )% | | | (1.36 | )% |
| Ratio of Net Investment Loss to | | | | | | | | | | | | | | | | | | | | |
| Average Net Assets (before waivers | | | | | | | | | | | | | | | | | | | | |
| and reimbursements of expenses) | | | (1.21 | )% | | | (1.24 | )% | | | (2.07 | )% | | | (1.73 | )% | | | (1.36 | )% |
| Portfolio turnover rate | | | 15 | % | | | 13 | % | | | 8 | % | | | 9 | % | | | 12 | % |
(1) | Value is less than $0.005 per share. |
(2) | The return reflects the actual performance for the year and does not include the impact of any adjustments made for financial reporting required by Generally Accepted Accounting Principles (GAAP). |
See accompanying notes to financial statements.
Annual Report 2020
Needham Growth Fund
Financial Highlights
| | | Institutional Class | |
| | | | | | | | | | | | | | | Period from | |
| | | | | | | | | | | | | | | December 30, | |
| | | | | | | | | | | | | | | 2016 | |
| | | | | | | | | | | | | | | through | |
| (For a Share Outstanding | | Year Ended December 31, | | | December 31, | |
| Throughout each Period/Year) | | 2020 | | | 2019 | | | 2018 | | | 2017 | | | 2016(1) | |
| Net Asset Value, Beginning of Period/Year | | $ | 42.83 | | | $ | 33.45 | | | $ | 43.15 | | | $ | 43.40 | | | $ | 43.40 | |
| Investment Operations | | | | | | | | | | | | | | | | | | | | |
| Net Investment Loss | | | (0.36 | ) | | | (0.26 | ) | | | (0.65 | ) | | | (0.56 | ) | | | — | |
| Net Realized and Unrealized | | | | | | | | | | | | | | | | | | | | |
| Gain (Loss) on Investments | | | 18.09 | | | | 14.39 | | | | (3.17 | ) | | | 4.47 | | | | — | |
| Total from Investment Operations | | | 17.73 | | | | 14.13 | | | | (3.82 | ) | | | 3.91 | | | | — | |
| | | | | | | | | | | | | | | | | | | | | |
| Less Distributions | | | | | | | | | | | | | | | | | | | | |
| Net Realized Gains | | | (3.20 | ) | | | (4.75 | ) | | | (5.88 | ) | | | (4.16 | ) | | | — | |
| Total Distributions | | | (3.20 | ) | | | (4.75 | ) | | | (5.88 | ) | | | (4.16 | ) | | | — | |
| Net Asset Value, End of Period/Year | | $ | 57.36 | | | $ | 42.83 | | | $ | 33.45 | | | $ | 43.15 | | | $ | 43.40 | |
| | | | | | | | | | | | | | | | | | | | | |
| Total Return | | | 42.24 | % | | | 43.13 | % | | | (9.83 | )% | | | 8.89 | % | | | 0.00 | % |
| Net Assets, End of Period/Year (000’s) | | $ | 58,046 | | | $ | 44,959 | | | $ | 29,149 | | | $ | 32,476 | | | $ | 117 | |
| Ratios/Supplemental Data | | | | | | | | | | | | | | | | | | | | |
| Ratio of Net Expenses to | | | | | | | | | | | | | | | | | | | | |
| Average Net Assets | | | 1.40 | % | | | 1.43 | % | | | 2.21 | % | | | 1.90 | % | | | 1.40 | % |
| Ratio of Net Expenses to Average | | | | | | | | | | | | | | | | | | | | |
| Net Assets (before interest | | | | | | | | | | | | | | | | | | | | |
| and dividend expense) | | | 1.40 | % | | | 1.40 | % | | | 1.40 | % | | | 1.40 | % | | | 1.40 | % |
| Ratio of Total Expenses to Average | | | | | | | | | | | | | | | | | | | | |
| Net Assets (before waiver and | | | | | | | | | | | | | | | | | | | | |
| reimbursement of expenses) | | | 1.58 | % | | | 1.73 | % | | | 2.48 | % | | | 2.15 | % | | | — | %(2) |
| Ratio of Net Investment | | | | | | | | | | | | | | | | | | | | |
| Loss to Average Net Assets | | | (0.77 | )% | | | (0.65 | )% | | | (1.52 | )% | | | (1.24 | )% | | | — | %(2) |
| Ratio of Net Investment Loss to | | | | | | | | | | | | | | | | | | | | |
| Average Net Assets (before waivers | | | | | | | | | | | | | | | | | | | | |
| and reimbursements of expenses) | | | (0.96 | )% | | | (0.95 | )% | | | (1.79 | )% | | | (1.49 | )% | | | — | %(2) |
| Portfolio turnover rate | | | 15 | % | | | 13 | % | | | 8 | % | | | 9 | % | | | 0 | % |
(1) | The Class commenced operations on December 30, 2016. |
(2) | Refer to Note 2 for further description of non-recurring charges related to the issuance of the share class. |
See accompanying notes to financial statements.
Needham Funds
Needham Aggressive Growth Fund
Financial Highlights
| | | Retail Class | |
| (For a Share Outstanding | | Year Ended December 31, | |
| Throughout each Year) | | 2020 | | | 2019 | | | 2018 | | | 2017 | | | 2016 | |
| Net Asset Value, Beginning of Year | | $ | 21.77 | | | $ | 16.86 | | | $ | 23.07 | | | $ | 22.29 | | | $ | 19.56 | |
| Investment Operations | | | | | | | | | | | | | | | | | | | | |
| Net Investment Loss | | | (0.37 | ) | | | (0.30 | ) | | | (0.54 | ) | | | (0.49 | ) | | | (0.38 | ) |
| Net Realized and Unrealized | | | | | | | | | | | | | | | | | | | | |
| Gain (Loss) on Investments | | | 11.41 | | | | 7.53 | | | | (2.88 | ) | | | 2.46 | | | | 4.61 | |
| Total from Investment Operations | | | 11.04 | | | | 7.23 | | | | (3.42 | ) | | | 1.97 | | | | 4.23 | |
| | | | | | | | | | | | | | | | | | | | | |
| Less Distributions | | | | | | | | | | | | | | | | | | | | |
| Net Realized Gains | | | (1.23 | ) | | | (2.32 | ) | | | (2.79 | ) | | | (1.19 | ) | | | (1.50 | ) |
| Total Distributions | | | (1.23 | ) | | | (2.32 | ) | | | (2.79 | ) | | | (1.19 | ) | | | (1.50 | ) |
| | | | | | | | | | | | | | | | | | | | | |
| Capital Contributions | | | | | | | | | | | | | | | | | | | | |
| Redemption Fees | | | — | | | | — | | | | — | | | | — | (1) | | | — | (1) |
| Total Capital Contributions | | | — | | | | — | | | | — | | | | — | (1) | | | — | (1) |
| Net Asset Value, End of Year | | $ | 31.58 | | | $ | 21.77 | | | $ | 16.86 | | | $ | 23.07 | | | $ | 22.29 | |
| | | | | | | | | | | | | | | | | | | | | |
| Total Return | | | 51.39 | % | | | 43.93 | % | | | (15.80 | )% | | | 8.73 | % | | | 22.18 | % |
| Net Assets, End of Year (000’s) | | $ | 40,258 | | | $ | 30,238 | | | $ | 27,119 | | | $ | 41,107 | | | $ | 58,696 | |
| Ratios/Supplemental Data | | | | | | | | | | | | | | | | | | | | |
| Ratio of Net Expenses to | | | | | | | | | | | | | | | | | | | | |
| Average Net Assets | | | 1.95 | %(2) | | | 2.02 | % | | | 2.91 | % | | | 2.63 | % | | | 2.71 | % |
| Ratio of Net Expenses to Average | | | | | | | | | | | | | | | | | | | | |
| Net Assets (before interest | | | | | | | | | | | | | | | | | | | | |
| and dividend expense) | | | 1.95 | %(2) | | | 1.95 | % | | | 1.95 | % | | | 1.95 | % | | | 1.95 | % |
| Ratio of Total Expenses to Average | | | | | | | | | | | | | | | | | | | | |
| Net Assets (before waiver and | | | | | | | | | | | | | | | | | | | | |
| reimbursement of expenses) | | | 1.96 | % | | | 2.17 | % | | | 2.97 | % | | | 2.65 | % | | | 2.72 | % |
| Ratio of Net Investment | | | | | | | | | | | | | | | | | | | | |
| Loss to Average Net Assets | | | (1.56 | )% | | | (1.46 | )% | | | (2.40 | )% | | | (2.12 | )% | | | (1.99 | )% |
| Ratio of Net Investment Loss to | | | | | | | | | | | | | | | | | | | | |
| Average Net Assets (before waivers | | | | | | | | | | | | | | | | | | | | |
| and reimbursements of expenses) | | | (1.57 | )% | | | (1.61 | )% | | | (2.46 | )% | | | (2.14 | )% | | | (2.00 | )% |
| Portfolio turnover rate | | | 13 | % | | | 9 | % | | | 8 | % | | | 15 | % | | | 14 | % |
(1) | Value is less than $0.005 per share. |
(2) | Effective June 1, 2020, the Adviser has contractually agreed to waive its fee and, if necessary, reimburse the Fund until April 30, 2021 to the extent Total Annual Fund Operating Expenses exceed 1.85% of the average daily net assets of the Retail Class shares of the Fund. Previously, the Adviser had contractually agreed to waive its fee and, if necessary, reimburse the Fund to the extent Total Annual Fund Operating Expenses exceeded 1.95% of the average daily net assets of the Retail Class shares of the Fund. |
See accompanying notes to financial statements.
Annual Report 2020
Needham Aggressive Growth Fund
Financial Highlights
| | | Institutional Class | |
| | | | | | | | | | | | | | | Period from | |
| | | | | | | | | | | | | | | December 30, | |
| | | | | | | | | | | | | | | 2016 | |
| | | | | | | | | | | | | | | through | |
| (For a Share Outstanding | | Year Ended December 31, | | | December 31, | |
| Throughout each Period/Year) | | 2020 | | | 2019 | | | 2018 | | | 2017 | | | 2016(1) | |
| Net Asset Value, Beginning of Period/Year | | $ | 22.23 | | | $ | 17.08 | | | $ | 23.21 | | | $ | 22.29 | | | $ | 22.29 | |
| Investment Operations | | | | | | | | | | | | | | | | | | | | |
| Net Investment Loss | | | (0.22 | ) | | | (0.19 | ) | | | (0.42 | ) | | | (0.39 | ) | | | — | |
| Net Realized and Unrealized | | | | | | | | | | | | | | | | | | | | |
| Gain (Loss) on Investments | | | 11.71 | | | | 7.66 | | | | (2.92 | ) | | | 2.50 | | | | — | |
| Total from Investment Operations | | | 11.49 | | | | 7.47 | | | | (3.34 | ) | | | 2.11 | | | | — | |
| | | | | | | | | | | | | | | | | | | | | |
| Less Distributions | | | | | | | | | | | | | | | | | | | | |
| Net Realized Gains | | | (1.23 | ) | | | (2.32 | ) | | | (2.79 | ) | | | (1.19 | ) | | | — | |
| Total Distributions | | | (1.23 | ) | | | (2.32 | ) | | | (2.79 | ) | | | (1.19 | ) | | | — | |
| Net Asset Value, End of Period/Year | | $ | 32.49 | | | $ | 22.23 | | | $ | 17.08 | | | $ | 23.21 | | | $ | 22.29 | |
| | | | | | | | | | | | | | | | | | | | | |
| Total Return | | | 52.36 | % | | | 44.79 | % | | | (15.36 | )% | | | 9.36 | % | | | 0.00 | % |
| Net Assets, End of Period/Year (000’s) | | $ | 34,132 | | | $ | 25,821 | | | $ | 13,478 | | | $ | 20,441 | | | $ | 162 | |
| Ratios/Supplemental Data | | | | | | | | | | | | | | | | | | | | |
| Ratio of Net Expenses to | | | | | | | | | | | | | | | | | | | | |
| Average Net Assets | | | 1.33 | %(3) | | | 1.46 | % | | | 2.35 | % | | | 2.22 | % | | | 1.40 | % |
| Ratio of Net Expenses to Average | | | | | | | | | | | | | | | | | | | | |
| Net Assets (before interest | | | | | | | | | | | | | | | | | | | | |
| and dividend expense) | | | 1.32 | %(3) | | | 1.40 | % | | | 1.40 | % | | | 1.40 | % | | | 1.40 | % |
| Ratio of Total Expenses to Average | | | | | | | | | | | | | | | | | | | | |
| Net Assets (before waiver and | | | | | | | | | | | | | | | | | | | | |
| reimbursement of expenses) | | | 1.71 | % | | | 1.90 | % | | | 2.79 | % | | | 2.64 | % | | | — | %(2) |
| Ratio of Net Investment | | | | | | | | | | | | | | | | | | | | |
| Loss to Average Net Assets | | | (0.94 | )% | | | (0.90 | )% | | | (1.84 | )% | | | (1.69 | )% | | | — | %(2) |
| Ratio of Net Investment Loss to | | | | | | | | | | | | | | | | | | | | |
| Average Net Assets (before waivers | | | | | | | | | | | | | | | | | | | | |
| and reimbursements of expenses) | | | (1.32 | )% | | | (1.34 | )% | | | (2.28 | )% | | | (2.11 | )% | | | — | %(2) |
| Portfolio turnover rate | | | 13 | % | | | 9 | % | | | 8 | % | | | 15 | % | | | 0 | % |
(1) | The Class commenced operations on December 30, 2016. |
(2) | Refer to Note 2 for further description of non-recurring charges related to the issuance of the share class. |
(3) | Effective June 1, 2020, the Adviser has contractually agreed to waive its fee and, if necessary, reimburse the Fund until April 30, 2021 to the extent Total Annual Fund Operating Expenses exceed 1.18% of the average daily net assets of the Institutional Class shares of the Fund. Previously, the Adviser had contractually agreed to waive its fee and, if necessary, reimburse the Fund to the extent Total Annual Fund Operating Expenses exceeded 1.40% of the average daily net assets of the Institutional Class shares of the Fund. |
See accompanying notes to financial statements.
Needham Funds
Needham Small Cap Growth Fund
Financial Highlights
| | | Retail Class | |
| (For a Share Outstanding | | Year Ended December 31, | |
| Throughout each Year) | | 2020 | | | 2019 | | | 2018 | | | 2017 | | | 2016 | |
| Net Asset Value, Beginning of Year | | $ | 17.59 | | | $ | 12.40 | | | $ | 15.67 | | | $ | 15.25 | | | $ | 12.44 | |
| Investment Operations | | | | | | | | | | | | | | | | | | | | |
| Net Investment Loss | | | (0.32 | ) | | | (0.22 | ) | | | (0.19 | ) | | | (0.18 | ) | | | (0.20 | ) |
| Net Realized and Unrealized | | | | | | | | | | | | | | | | | | | | |
| Gain (Loss) on Investments | | | 12.06 | | | | 6.89 | | | | (0.32 | ) | | | 1.99 | | | | 4.03 | |
| Total from Investment Operations | | | 11.74 | | | | 6.67 | | | | (0.51 | ) | | | 1.81 | | | | 3.83 | |
| | | | | | | | | | | | | | | | | | | | | |
| Less Distributions | | | | | | | | | | | | | | | | | | | | |
| Net Realized Gains | | | (3.53 | ) | | | (1.48 | ) | | | (2.76 | ) | | | (1.40 | ) | | | (1.02 | ) |
| Total Distributions | | | (3.53 | ) | | | (1.48 | ) | | | (2.76 | ) | | | (1.40 | ) | | | (1.02 | ) |
| | | | | | | | | | | | | | | | | | | | | |
| Capital Contributions | | | | | | | | | | | | | | | | | | | | |
| Redemption Fees | | | — | | | | — | | | | — | (1) | | | 0.01 | | | | — | (1) |
| Total Capital Contributions | | | — | | | | — | | | | — | (1) | | | 0.01 | | | | — | (1) |
| Net Asset Value, End of Year | | $ | 25.80 | | | $ | 17.59 | | | $ | 12.40 | | | $ | 15.67 | | | $ | 15.25 | |
| | | | | | | | | | | | | | | | | | | | | |
| Total Return | | | 71.35 | % | | | 54.45 | % | | | (5.13 | )%(3) | | | 11.88 | %(3) | | | 31.26 | % |
| Net Assets, End of Year (000’s) | | $ | 89,206 | | | $ | 85,521 | | | $ | 12,487 | | | $ | 19,317 | | | $ | 35,518 | |
| Ratios/Supplemental Data | | | | | | | | | | | | | | | | | | | | |
| Ratio of Net Expenses to | | | | | | | | | | | | | | | | | | | | |
| Average Net Assets | | | 1.85 | % | | | 1.87 | %(2) | | | 1.95 | % | | | 1.95 | % | | | 2.09 | % |
| Ratio of Net Expenses to Average | | | | | | | | | | | | | | | | | | | | |
| Net Assets (before interest | | | | | | | | | | | | | | | | | | | | |
| and dividend expense) | | | 1.85 | % | | | 1.87 | %(2) | | | 1.95 | % | | | 1.95 | % | | | 1.95 | % |
| Ratio of Total Expenses to Average | | | | | | | | | | | | | | | | | | | | |
| Net Assets (before waiver and | | | | | | | | | | | | | | | | | | | | |
| reimbursement of expenses) | | | 1.80 | % | | | 2.07 | % | | | 2.19 | % | | | 2.15 | % | | | 2.30 | % |
| Ratio of Net Investment | | | | | | | | | | | | | | | | | | | | |
| Loss to Average Net Assets | | | (1.64 | )% | | | (1.36 | )% | | | (1.20 | )% | | | (1.14 | )% | | | (1.83 | )% |
| Ratio of Net Investment Loss to | | | | | | | | | | | | | | | | | | | | |
| Average Net Assets (before waivers | | | | | | | | | | | | | | | | | | | | |
| and reimbursements of expenses) | | | (1.59 | )% | | | (1.56 | )% | | | (1.44 | )% | | | (1.34 | )% | | | (2.04 | )% |
| Portfolio turnover rate | | | 191 | % | | | 136 | % | | | 103 | % | | | 80 | % | | | 99 | % |
(1) | Value is less than $0.005 per share. |
(2) | Effective April 1, 2019, the Adviser contractually agreed to waive its fee and, if necessary, reimburse the Fund to the extent Total Annual Fund Operating Expenses exceed 1.85% of the average daily net assets of the Retail Class shares of the Fund. Previously, the Adviser had contractually agreed to waive its fee and, if necessary, reimburse the Fund to the extent Total Annual Fund Operating Expenses exceeded 1.95% of the average daily net assets of the Retail Class shares of the Fund. |
(3) | The return reflects the actual performance for the year and does not include the impact of any adjustments made for financial reporting required by Generally Accepted Accounting Principles (GAAP). |
See accompanying notes to financial statements.
Annual Report 2020
Needham Small Cap Growth Fund
Financial Highlights
| | | Institutional Class | |
| | | | | | | | | | | | | | | Period from | |
| | | | | | | | | | | | | | | December 30, | |
| | | | | | | | | | | | | | | 2016 | |
| | | | | | | | | | | | | | | through | |
| (For a Share Outstanding | | Year Ended December 31, | | | December 31, | |
| Throughout each Period/Year) | | 2020 | | | 2019 | | | 2018 | | | 2017 | | | 2016(1) | |
| Net Asset Value, Beginning of Period/Year | | $ | 17.96 | | | $ | 12.57 | | | $ | 15.76 | | | $ | 15.25 | | | $ | 15.25 | |
| Investment Operations | | | | | | | | | | | | | | | | | | | | |
| Net Investment Loss | | | (0.20 | ) | | | (0.12 | ) | | | (0.10 | ) | | | (0.07 | ) | | | — | |
| Net Realized and Unrealized | | | | | | | | | | | | | | | | | | | | |
| Gain (Loss) on Investments | | | 12.41 | | | | 6.99 | | | | (0.33 | ) | | | 1.98 | | | | — | |
| Total from Investment Operations | | | 12.21 | | | | 6.87 | | | | (0.43 | ) | | | 1.91 | | | | — | |
| | | | | | | | | | | | | | | | | | | | | |
| Less Distributions | | | | | | | | | | | | | | | | | | | | |
| Net Realized Gains | | | (3.53 | ) | | | (1.48 | ) | | | (2.76 | ) | | | (1.40 | ) | | | — | |
| Total Distributions | | | (3.53 | ) | | | (1.48 | ) | | | (2.76 | ) | | | (1.40 | ) | | | — | |
| Net Asset Value, End of Period/Year | | $ | 26.64 | | | $ | 17.96 | | | $ | 12.57 | | | $ | 15.76 | | | $ | 15.25 | |
| | | | | | | | | | | | | | | | | | | | | |
| Total Return | | | 72.51 | % | | | 55.31 | % | | | (4.58 | )%(4) | | | (12.48 | )%(4) | | | 0.00 | % |
| Net Assets, End of Period/Year (000’s) | | $ | 127,943 | | | $ | 46,589 | | | $ | 12,168 | | | $ | 10,325 | | | $ | 140 | |
| Ratios/Supplemental Data | | | | | | | | | | | | | | | | | | | | |
| Ratio of Net Expenses to | | | | | | | | | | | | | | | | | | | | |
| Average Net Assets | | | 1.18 | % | | | 1.22 | %(3) | | | 1.40 | % | | | 1.40 | % | | | 1.40 | % |
| Ratio of Net Expenses to Average | | | | | | | | | | | | | | | | | | | | |
| Net Assets (before interest | | | | | | | | | | | | | | | | | | | | |
| and dividend expense) | | | 1.18 | % | | | 1.22 | %(3) | | | 1.40 | % | | | 1.40 | % | | | 1.40 | % |
| Ratio of Total Expenses to Average | | | | | | | | | | | | | | | | | | | | |
| Net Assets (before waiver and | | | | | | | | | | | | | | | | | | | | |
| reimbursement of expenses) | | | 1.57 | % | | | 1.83 | % | | | 1.95 | % | | | 2.08 | % | | | — | %(2) |
| Ratio of Net Investment | | | | | | | | | | | | | | | | | | | | |
| Loss to Average Net Assets | | | (0.97 | )% | | | (0.72 | )% | | | (0.65 | )% | | | (0.41 | )% | | | — | %(2) |
| Ratio of Net Investment Loss to | | | | | | | | | | | | | | | | | | | | |
| Average Net Assets (before waivers | | | | | | | | | | | | | | | | | | | | |
| and reimbursements of expenses) | | | (1.35 | )% | | | (1.33 | )% | | | (1.21 | )% | | | (1.09 | )% | | | — | %(2) |
| Portfolio turnover rate | | | 191 | % | | | 136 | % | | | 103 | % | | | 80 | % | | | 0 | % |
(1) | The Class commenced operations on December 30, 2016. |
(2) | Refer to Note 2 for further description of non-recurring charges related to the issuance of the share class. |
(3) | Effective April 1, 2019, the Adviser contractually agreed to waive its fee and, if necessary, reimburse the Fund to the extent Total Annual Fund Operating Expenses exceed 1.18% of the average daily net assets of the Institutional Class shares of the Fund. Previously, the Adviser had contractually agreed to waive its fee and, if necessary, reimburse the Fund to the extent Total Annual Fund Operating Expenses exceeded 1.40% of the average daily net assets of the Institutional Class shares of the Fund. |
(4) | The return reflects the actual performance for the year and do not include the impact of any adjustments made for financial reporting required by Generally Accepted Accounting Principles (GAAP). |
See accompanying notes to financial statements.
Needham Funds
Notes to Financial Statements
December 31, 2020
1. Organization
Needham Growth Fund (“NGF”), Needham Aggressive Growth Fund (“NAGF”) and Needham Small Cap Growth Fund (“NSCGF”) (each, a “Portfolio” and collectively, the “Portfolios”), are portfolios of The Needham Funds, Inc. (the “Company”), which is registered under the Investment Company Act of 1940, as amended (the “1940 Act”), as an open-end management investment company. The Company was organized as a Maryland corporation on October 12, 1995. NGF, NAGF, and NSCGF each currently offer two classes, the Retail Class and the Institutional Class. The Institutional Class of each Portfolio commenced operations on December 30, 2016.
Each Portfolio is an investment company and accordingly follows the investment company accounting and reporting guidance of the Financial Accounting Standards Board (“FASB”) Accounting Standards Codification Topic 946 “Financial Services – Investment Companies.”
2. Class Specific Expenses
Class level expenses are allocated daily to each class of shares based upon the ratio of net assets represented by each class as a percentage of the net assets of the Portfolio. Expenses deemed directly attributable to a class of shares are recorded by the specific class. Most Portfolio expenses are allocated by class based on relative net assets. Distribution Fees incurred in connection with the Company’s Amended and Restated Plan of Distribution Pursuant to Rule 12b-1 are expensed at 0.25% of average daily net assets of the Retail Class shares, and the specific amounts are detailed in Note 5.
Certain of the Ratios and Supplemental Data presented in the Financial Highlights of the Institutional Class as of December 31, 2016 include non-recurring charges related to the issuance of the class and are not meaningful.
3. Significant Accounting Policies
The following is a summary of significant accounting policies followed by the Company in the preparation of its financial statements. These policies are in conformity with accounting principles generally accepted in the United States of America (“GAAP”).
Security Valuation: Portfolio securities for which market quotations are readily available are stated at the closing price reported by the principal exchange for the security as of the exchange’s close of business. Securities for which no sale has taken place during the day and securities which are not listed on an exchange are valued at the mean of the highest closing bid and lowest asked prices. Exchange traded options are valued at the last reported sale price on any exchange on which the option is principally traded. If no sales are reported on a particular day, the options will be valued at the mean between the highest closing bid and lowest asked prices across the exchanges where the option is traded. Non-exchange traded options will also be valued at the mean between the last bid and asked quotations. For options where market quotations are not readily available, value will be determined in accordance with the fair value procedures described below. All other securities and assets for which (a) market quotations are not readily available, such as in
Annual Report 2020
Notes to Financial Statements (Continued)
December 31, 2020
the case of a market or technical disruption that prevents the normal trading of a security held by a Portfolio, (b) market quotations are believed to be unrepresentative of fair market value, such as in the case of a thinly traded security, or (c) valuation is normally made at the last sale price on a foreign exchange and a significant event occurs after the close of that exchange but before the New York Stock Exchange closes, are valued at their fair value as determined in good faith by the Company’s Board of Directors (the “Board”) in accordance with Fair Value Procedures established by the Board. The Company’s Fair Value Procedures are implemented and monitored by a Fair Value Committee (the “Committee”) designated by the Board. When a security is valued in accordance with the Fair Value Procedures, the Committee determines a value after taking into consideration any relevant information that is reasonably available to the Committee. Some of the more common reasons that may necessitate that a security be valued pursuant to these Fair Value Procedures include, but are not limited to: the security’s trading has been halted or suspended; the security has been delisted from a national exchange; the security’s primary trading market is temporarily closed at a time when under normal conditions it would be open; or the security’s primary pricing source is not able or willing to provide a price. The securities of each Portfolio may also be valued on the basis of valuations provided by a pricing service approved by, or on behalf of, the Board.
Portfolio securities listed or traded on securities exchanges, including American Depositary Receipts (“ADRs”), are valued at the closing price on the exchange or system where the security is principally traded or at the NASDAQ Official Closing Price. If there have been no sales for that day on the exchange or system, a security is valued at the mean of the highest closing bid and lowest asked prices on the exchange or system where the security is principally traded.
The Portfolios did not value any securities in accordance with the Fair Value Procedures as of December 31, 2020.
Investment Transactions: Changes in holdings of portfolio securities for the Portfolios shall be reflected no later than in the first calculation on the first business day following the trade date for purposes of calculating each Portfolio’s daily net asset value per share. However, for financial reporting purposes, portfolio security transactions are reported on the trade date of the last business day of the reporting period. The cost (proceeds) of investments sold (bought to cover) is determined on a specific identification basis for the purpose of determining gains or losses on sales and buys to cover short positions. Dividend income, distributions to shareholders and dividend expense from securities sold short are recorded on the ex-dividend date. Interest income and interest expense from securities sold short is recorded on an accrual basis.
Foreign Currency: Foreign currency amounts are translated into U.S. dollars as follows: (i) assets and liabilities at the rate of exchange at the end of the respective period; and (ii) purchases and sales of securities and income and expenses at the rate of exchange prevailing on the dates of such transactions. The portion of realized/unrealized gains
Needham Funds
Notes to Financial Statements (Continued)
December 31, 2020
arising from changes in the exchange rates are included with the net realized/unrealized gain (loss) from affiliated and unaffiliated securities, securities sold short and foreign currency translations. Principal risks associated with such transactions include the movement in value of the foreign currency relative to the U.S. dollar and the ability of the counterparty to perform.
The Portfolios may also invest in forward currency contracts. Fluctuations in the value of such forward currency transactions are recorded daily as unrealized gain or loss; realized gain or loss includes net gain or loss on transactions that have terminated by settlement. These instruments involve securities and currency market risk, credit risk, or both kinds of risks, in excess of the amount recognized in the statements of assets and liabilities. Risks also arise from the possible inability of counterparties to meet the terms of their contracts. The Portfolios did not enter into forward currency contracts during the year ended December 31, 2020.
Allocation of Expenses: Expenses directly attributable to a Portfolio are charged directly to that Portfolio, while expenses which are attributable to more than one Portfolio are allocated among the respective Portfolios based upon relative net assets or some other reasonable method.
Use of Estimates: The preparation of financial statements in conformity with GAAP requires management to make estimates and assumptions that affect the reported amounts of assets and liabilities and disclosure of contingent assets and liabilities at the date of the financial statements and the reported amounts of increases and decreases in net assets from operations during the reporting period. Actual results could differ from those estimates.
Distributions to Shareholders: Dividends from net investment income, if any, are declared and paid annually for the Portfolios. Distributable net realized gains, if any, are declared and distributed at least annually.
Federal Income Taxes: It is the policy of each Portfolio to continue to qualify as a regulated investment company, as defined in the Internal Revenue Code, by complying with the provisions available to certain investment companies and to make distributions of net investment income and net realized capital gains sufficient to relieve it from all, or substantially all, federal income taxes. Accordingly, no provision for income taxes has been made in the Portfolios’ financial statements.
As of December 31, 2020, the Portfolios did not have any tax positions that did not meet the “more-likely-than-not” threshold of being sustained by the applicable tax authority. Open tax years are those that are open for exam by Federal and state taxing authorities. As of December 31, 2020, open Federal tax years include the tax years ended December 31, 2017 through December 31, 2019, and open New York tax years include the tax years ended December 31, 2017 through December 31, 2019. The Portfolios have no tax examinations in progress.
Annual Report 2020
Notes to Financial Statements (Continued)
December 31, 2020
Fair Value Measurements: Valuation inputs used to determine the value of the Portfolios’ investments are summarized in the three broad levels listed below:
| | Level 1 — | Unadjusted quoted prices in active markets for identical assets and liabilities that the Portfolios have the ability to access. |
| | | |
| | Level 2 — | Observable inputs other than quoted prices included in Level 1 that are observable for the asset or liability, either directly or indirectly. These inputs may include quoted prices for the identical instrument in an inactive market, prices for similar instruments, interest rates, prepayment speeds, credit risk, yield curves, default rates and similar data. |
| | | |
| | Level 3 — | Unobservable inputs for the asset or liability, to the extent relevant observable inputs are not available, representing the Portfolios’ own assumptions about the assumptions a market participant would use in valuing the asset or liability, and would be based on the best information available. |
The inputs or methodology used to value securities are not necessarily an indication of the risk associated with investing in those securities.
Portfolio securities listed or traded on securities exchanges, including ADRs, are valued at the closing price on the exchange or system where the security is principally traded or at the NASDAQ Official Closing Price. If there have been no sales for that day on the exchange or system, a security is valued at the mean of the highest closing bid and lowest asked prices on the exchange or system where the security is principally traded. These valuations are typically categorized as Level 1 in the fair value hierarchy.
In accordance with procedures adopted by the Board, fair value pricing may be used if events materially affecting the value of foreign securities occur between the times the exchange on which they are traded closes and the time the Portfolios’ net asset values are calculated. These valuations are categorized as Level 2 in the fair value hierarchy.
The following is a summary categorization, as of December 31, 2020, of each Portfolio’s investments based on the level of inputs utilized in determining the value of such investments:
| | | LEVEL 1 – Quoted Prices(1) | |
| | | NGF | | | NAGF | | | NSCGF | |
| Assets | | | | | | | | | |
Common Stocks(2) | | $ | 136,940,349 | | | $ | 73,998,054 | | | $ | 200,593,899 | |
| Short-Term Investments | | | 3,791,788 | | | | 425,951 | | | | 19,254,825 | |
| Liabilities | | | | | | | | | | | | |
Securities Sold Short(2) | | | (223,485 | ) | | | — | | | | (884,430 | ) |
| Total | | $ | 140,508,652 | | | $ | 74,424,005 | | | $ | 218,964,294 | |
(1) | As of December 31, 2020, the Portfolios did not hold Level 2 or Level 3 investments. |
(2) | Please refer to the Schedule of Investments and Schedule of Securities Sold Short to view segregation by industry. |
Needham Funds
Notes to Financial Statements (Continued)
December 31, 2020
4. Investment Advisory and Administrative Services
The Company has engaged Needham Investment Management L.L.C. (the “Adviser”) to manage its investments pursuant to an Investment Advisory Agreement. The Company pays the Adviser an investment advisory fee at the annual rate of 1.25% of the average daily net assets of each Portfolio.
The Adviser has entered into an agreement with the Company (the “Expense Limitation Agreement”) whereby the Adviser has contractually agreed to waive its investment advisory fee for, and to reimburse expenses of, the Institutional Class and Retail Class shares of each Portfolio in an amount that limits annual operating expenses to not more than 1.40% and 1.95% for NGF or 1.40% and 1.95% from January through May and 1.18% and 1.85% from June through December for NAGF and 1.18% and 1.85% for NSCGF, of the average daily net assets of the Portfolio’s Institutional Class and Retail Class, respectively (excluding taxes, interest, brokerage, dividends on short positions, acquired fund fees and expenses and extraordinary items, but including the investment advisory fee stated in the Investment Advisory Agreement). The Expense Limitation Agreement is effective for the period from June 1, 2020 through April 30, 2021. The Expense Limitation Agreement shall continue in effect from year to year thereafter only upon mutual agreement of the Company and the Adviser. Similar agreements were in effect for certain prior periods.
Any reimbursements or fee waivers made by the Adviser in respect of a Portfolio are subject to recoupment by the Adviser, to the extent that the Portfolio is able to make the repayment within the expense limitation established in the Expense Limitation Agreement. Under the Expense Limitation Agreement, the Adviser has a right to receive from each Portfolio class reimbursement for fee waivers and/or expense reimbursements made pursuant to the Agreement for a period of up to 36 months from the time of any waiver or reimbursement. The table below contains the amounts of fee waivers and expense reimbursements subject to recapture by the Adviser through December 31 of the year indicated:
| | | 2023 | | | 2022 | | | 2021 | | | Total | |
| NGF (Retail Class) | | $ | — | | | $ | — | | | $ | — | | | $ | — | |
| NGF (Institutional Class) | | | 88,423 | | | | 110,106 | | | | 91,844 | | | | 290,373 | |
| NAGF (Retail Class) | | | 3,324 | | | | 45,600 | | | | 23,838 | | | | 72,762 | |
| NAGF (Institutional Class) | | | 100,932 | | | | 77,228 | | | | 83,507 | | | | 261,667 | |
| NSCGF (Retail Class) | | | 25,578 | | | | 41,029 | | | | 9,768 | | | | 76,375 | |
| NSCGF (Institutional Class) | | | 214,920 | | | | 124,826 | | | | 69,833 | | | | 409,578 | |
The Company and Fund Services (the “Administrator”) are parties to a Fund Administration Servicing Agreement. The Administrator provides administrative and fund accounting services pursuant to this agreement and, in consideration of these services, receives a fee computed daily and paid monthly at an annual rate based on a percentage of the value of each Portfolio’s assets. The Administrator is also compensated for any out of pocket expenses that are reasonably incurred in carrying out its duties under this agreement. The Administrator also provides transfer agent services pursuant to a Transfer Agent Servicing Agreement for additional fees.
Annual Report 2020
Notes to Financial Statements (Continued)
December 31, 2020
Certain officers of the Company are also officers of the Adviser and/or Needham & Company, LLC (the “Distributor”), an affiliate of the Adviser. Such officers receive no fees from the Company for serving as officers of the Company. Each of the two Directors who is not an “interested person” (as defined in the 1940 Act) of the Company (each, an “Independent Director”) receives a quarterly retainer of $3,000 and a per-meeting fee of $500. Each Independent Director is also a member of the Audit Committee of the Board and receives a fee of $500 per meeting attended. The Adviser provides an employee to serve as Chief Compliance Officer for the Company and to provide certain related services. The Distributor pays the Chief Compliance Officer’s compensation and the Company reimburses the Distributor for the Company’s allocated portion of the expense.
5. Distribution Plan and Brokerage Commissions
The Company has adopted an Amended and Restated Plan of Distribution pursuant to Rule 12b-1 under the 1940 Act. Under the Plan, each Portfolio may pay compensation to the Distributor or any other distributor or financial institution with which the Company has an agreement with respect to the Retail Class of each Portfolio, with the amount of such compensation not to exceed an annual rate of 0.25% of the daily average net assets of each Portfolio’s Retail Class shares.
During the year ended December 31, 2020, NGF, NAGF and NSCGF incurred and paid brokerage commissions to the Distributor in the amount of $20,217, $10,062, and $204,828, respectively.
6. Temporary Borrowings
Each Portfolio may borrow from banks up to 25% of its total assets and may pledge its assets in connection with these borrowings, provided that no additional investments shall be made while borrowings exceed 5% of total assets.
The Portfolios did not engage in any temporary borrowings during the year ended December 31, 2020.
7. Short Sale Transactions
During the year ended December 31, 2020, each Portfolio sold securities short. Upon selling a security short, the Portfolios record an asset for the settlement amount as “Deposit with Broker for Securities Sold Short” and a corresponding liability, which is marked-to-market to reflect current value. The broker for the Portfolios’ short sale transactions requires maintenance by each Portfolio of a minimum amount of collateral at all times, regardless of whether any short sales are outstanding. To the extent necessary to meet the broker’s collateral requirements for open short positions, additional securities will be segregated above the minimum to cover the short positions. At December 31, 2020, the market value of securities separately segregated to cover short positions was $1,963,860, $1,525,097, and $2,239,430 for NGF, NAGF and NSCGF, respectively.
Needham Funds
Notes to Financial Statements (Continued)
December 31, 2020
Additionally, the Portfolios had receivables for Deposit with Broker for Securities Sold Short of $231,715, $0 and $981,766 pledged as collateral with a broker in connection with any open short positions for NGF, NAGF, and NSCGF, respectively at December 31, 2020. Securities sold short at December 31, 2020 and their related market values and proceeds are set forth in the preceding Schedule of Securities Sold Short for NGF and NSCGF.
8. Investment Transactions
The following summarizes the aggregate amount of the cost of purchases and proceeds from sales of investment securities and securities sold short, excluding short-term securities, during the year ended December 31, 2020:
| | | Purchases | | | Sales | |
| NGF | | | | | | |
| Long Transactions | | $ | 16,825,965 | | | $ | 31,206,349 | |
| Short Sale Transactions | | | 2,217,796 | | | | 2,770,585 | |
| NAGF | | | | | | | | |
| Long Transactions | | | 7,257,124 | | | | 10,676,123 | |
| Short Sale Transactions | | | 799,103 | | | | 501,071 | |
| NSCGF | | | | | | | | |
| Long Transactions | | | 307,143,178 | | | | 252,196,770 | |
| Short Sale Transactions | | | 7,668,997 | | | | 7,203,219 | |
There were no purchases or sales of U.S. government securities during the year ended December 31, 2020. See footnote 11 for details of transactions with affiliates.
9. Financial Instruments With Off-Balance Sheet Risk
In the normal course of their business, the Portfolios may engage in transactions with off-balance sheet risk, including securities sold short, written options, futures, and forward currency contracts. Transactions in certain financial instruments represent future commitments to purchase or sell other financial instruments at specific terms at specified future dates. Each of these financial instruments contains varying degrees of off-balance sheet risk whereby changes in the market values of the securities underlying the financial instruments may be in excess of the amounts recognized in the financial statements.
Securities sold short represent obligations of the Portfolios to make future delivery of specific securities and, correspondingly, create an obligation to purchase the securities at market prices prevailing at a later delivery date (or to deliver the securities if already owned by the Portfolios). As a result, short sales create the risk that the Portfolios’ ultimate obligation to satisfy the delivery requirements may exceed the amount of the proceeds initially received on the liability recorded in the financial statements.
10. Indemnification
Under the Company’s organizational documents, the Company’s Directors and Officers are indemnified against certain liabilities arising out of the performance of their duties to the Company. In addition, in the ordinary course of business, the Company enters into
Annual Report 2020
Notes to Financial Statements (Continued)
December 31, 2020
contracts that contain a variety of indemnifications. The Company’s maximum exposure under these arrangements is unknown. However, the Company has not had prior claims or losses pursuant to these contracts and expects the risk of loss to be remote.
11. Transactions with Affiliates
NAGF owned 5% or more of the voting securities of the following company during the year ended December 31, 2020. As a result, this company is deemed to be an “affiliated person” (as defined in the 1940 Act) of NAGF (and the other Portfolios). Transactions during the year in this affiliated company were as follows:
| | | | | Net Change | Net | | | Share |
| | Value at | | | in Unrealized | Realized | | Value at | Balance |
| Security | Dec. 31, | Value of | Value of | Appreciation | Gains | Dividend | Dec. 31, | Dec. 31, |
Name | 2019 | Purchases | Sales | (Depreciation) | (Losses) | Income | 2020 | 2020 |
| GSE | | | | | | | | |
| Systems, | | | | | | | | |
| Inc. | $1,736,831 | $5,225 | $— | $(345,991) | $— | $— | $1,396,065 | 1,057,625 |
NSCGF owned 5% or more of the voting securities of the following companies during the year ended December 31, 2020. As a result, these companies are deemed to be “affiliated persons” (as defined in the 1940 Act) of NSCGF (and the other Portfolios). Transactions during the year in these affiliated companies were as follows:
| | | | | | | | | | Net Change | | Net | | | | | | | Share | |
| | | Value at | | | | | | | in Unrealized | | Realized | | | | | Value at | | Balance | |
| Security | | Dec. 31, | | Value of | | Value of | | | Appreciation | | Gains | | | Dividend | | Dec. 31, | | Dec. 31, | |
Name | | 2019 | | Purchases | | Sales | | | (Depreciation) | | (Losses) | | | Income | | 2020 | | 2020 | |
| EMCORE | | | | | | | | | | | | | | | | | | | |
| Corp. | | $ | 1,489,600 | | $ | 3,859,820 | | $ | (403,965 | ) | | $ | 3,335,462 | | $ | (105,917 | ) | | $ | — | | $ | 8,175,000 | | 1,500,000 | |
| Intevac, | | | | | | | | | | | | | | | | | | | | | | | | | | |
| Inc. | | | 2,911,191 | | | 4,495,307 | | | — | | | | 1,393,076 | | | — | | | | — | | | 8,799,574 | | 1,220,468 | |
| Total | | $ | 4,400,791 | | $ | 8,355,127 | | $ | (403,965 | ) | | $ | 4,728,538 | | $ | (105,917 | ) | | $ | — | | $ | 16,974,574 | | 2,720,468 | |
12. Federal Income Taxes
No provision for federal income taxes is required since the Company intends to continue to qualify as a regulated investment company under Subchapter M of the Internal Revenue Code and distribute substantially all of its taxable income and capital gains to shareholders. Because income tax regulations differ from GAAP, the timing and character of income and capital gain distributions determined in accordance with tax regulations can differ from income and capital gains recognized for financial reporting purposes. Accordingly, the character of distributions and the composition of net assets for tax purposes can differ from those reflected in the financial statements. These book/tax differences may be temporary or permanent in nature. Temporary differences are generally due to differing book and tax treatment for the timing of the recognition of gains and losses on securities, including post-October losses (as described below). Permanent differences are generally due to differing treatment of net investment losses and distributions paid in connection
Needham Funds
Notes to Financial Statements (Continued)
December 31, 2020
with redemptions. To the extent these differences are permanent, they are charged or credited to paid-in capital or distributable earnings, as appropriate, in the period in which the differences arise. These reclassifications have no effect on net assets or net asset value per share of each Portfolio.
As of December 31, 2020, the cost, gross unrealized appreciation, gross unrealized depreciation, and the net unrealized appreciation (depreciation) on securities, including proceeds from securities sold short for federal income tax purposes, were as follows:
| | | | | | | | | | | | Net | |
| | | | | | Gross | | | Gross | | | Unrealized | |
| | | | | | Unrealized | | | Unrealized | | | Appreciation | |
| | | Cost | | | Appreciation | | | Depreciation | | | (Depreciation) | |
| NGF | | $ | 45,946,400 | | | $ | 95,152,555 | | | $ | (590,303 | ) | | $ | 94,562,252 | |
| NAGF | | | 23,908,751 | | | | 51,705,029 | | | | (1,189,775 | ) | | | 50,515,254 | |
| NSCGF | | | 177,916,785 | | | | 45,730,686 | | | | (4,683,177 | ) | | | 41,047,509 | |
The difference between the tax cost of investments and the cost of investments for GAAP purposes is primarily due to the tax treatment for wash sale losses and as it relates to NAGF Passive Foreign Investment Company income.
As of December 31, 2020, the components of distributable earnings (loss) on a tax basis were as follows:
| | | NGF | | | NAGF | | | NSCGF | |
| Undistributed ordinary income | | $ | 767,081 | | | $ | 123,340 | | | $ | 24,170,145 | |
| Undistributed long-term capital gains | | | 5,134,595 | | | | 849,504 | | | | — | |
| Unrealized appreciation (depreciation) | | | 94,562,252 | | | | 50,515,254 | | | | 41,047,509 | |
| Total accumulated earnings (loss) | | $ | 100,463,928 | | | $ | 51,488,098 | | | $ | 65,217,654 | |
The tax character of distributions paid during the year ended December 31, 2020 was as follows:
| | | NGF | | | NAGF | | | NSCGF | |
| Ordinary income | | $ | 678,314 | | | $ | 1,062 | | | $ | 19,078,759 | |
| Net long-term capital gains | | | 6,799,819 | | | | 2,727,529 | | | | 564,608 | |
| Total distributions paid | | $ | 7,478,133 | | | $ | 2,728,591 | | | $ | 19,643,367 | |
In 2020 a portion of dividends was distributed in connection with NEEGX, NEAGX, and NESGX redemptions.
The tax character of distributions paid during the year ended December 31, 2019 was as follows:
| | | NGF | | | NAGF | | | NSCGF | |
| Ordinary income | | $ | — | | | $ | — | | | $ | 414,676 | |
| Net long-term capital gains | | | 11,150,898 | | | | 4,975,386 | | | | 3,589,387 | |
| Total distributions paid | | $ | 11,150,898 | | | $ | 4,975,386 | | | $ | 4,004,063 | |
In 2019 a portion of dividends was distributed in connection with NEEGX, NEAGX, and NESGX redemptions.
Annual Report 2020
Notes to Financial Statements (Continued)
December 31, 2020
Under current tax law, capital and currency losses realized after October 31 of a Portfolio’s fiscal year may be deferred and treated as occurring on the first business day of the following fiscal year for tax purposes. For the year ended December 31, 2020, the Portfolios had no such losses to defer.
As of December 31, 2020, none of the Portfolios had accumulated capital loss carryovers.
13. New Accounting Pronouncements
In August 2018, FASB issued Accounting Standards Update (“ASU”) 2018-13, Fair Value Measurement (Topic 820): Disclosure Framework — Changes to the Disclosure Requirements for Fair Value Measurement (“ASU 2018-13”). The primary focus of ASU 2018-13 is to improve the effectiveness of the disclosure requirements for fair value measurements. The changes affect all companies that are required to include fair value measurement disclosures. In general, the amendments in ASU 2018-13 are effective for all entities for fiscal years and interim periods within those fiscal years, beginning after December 15, 2019. Management has adopted the relevant provisions of the disclosure framework for the year ended December 31, 2020.
14. Subsequent Events
Management has evaluated subsequent events through the date the financial statements were issued. This evaluation did not result in any subsequent events that necessitated recognition or disclosures.
Needham Funds
Report of Independent Registered Public Accounting Firm
To the Shareholders and Board of Directors The Needham Funds, Inc.:
Opinion on the Financial Statements
We have audited the accompanying statements of assets and liabilities of Needham Growth Fund, Needham Aggressive Growth Fund and Needham Small Cap Growth Fund, each a “Portfolio” of The Needham Funds, Inc. (collectively, the “Portfolios”), including the schedules of investments and schedules of securities sold short, as of December 31, 2020, the related statements of operations for the year then ended, the statements of changes in net assets for each of the years in the two-year period then ended, and the related notes (collectively, the “financial statements”) and the financial highlights for each of the years or periods in the five-year period then ended. In our opinion, the financial statements and financial highlights present fairly, in all material respects, the financial position of the Portfolios as of December 31, 2020, the results of their operations for the year then ended, the changes in their net assets for each of the years in the two-year period then ended, and the financial highlights for each of the years or periods in the five-year period then ended, in conformity with U.S. generally accepted accounting principles.
Basis for Opinion
These financial statements and financial highlights are the responsibility of the Portfolios’ management. Our responsibility is to express an opinion on these financial statements and financial highlights based on our audits. We are a public accounting firm registered with the Public Company Accounting Oversight Board (United States) (“PCAOB”) and are required to be independent with respect to the Portfolios in accordance with the U.S. federal securities laws and the applicable rules and regulations of the Securities and Exchange Commission and the PCAOB.
We conducted our audits in accordance with the standards of the PCAOB. Those standards require that we plan and perform the audit to obtain reasonable assurance about whether the financial statements and financial highlights are free of material misstatement, whether due to error or fraud. Our audits included performing procedures to assess the risks of material misstatement of the financial statements and financial highlights, whether due to error or fraud, and performing procedures that respond to those risks. Such procedures included examining, on a test basis, evidence regarding the amounts and disclosures in the financial statements and financial highlights. Such procedures also included confirmation of securities owned as of December 31, 2020, by correspondence with custodians and brokers, or by other appropriate auditing procedures when replies from brokers were not received. Our audits also included evaluating the accounting principles used and significant estimates made by management, as well as evaluating the overall presentation of the financial statements and financial highlights. We believe that our audits provide a reasonable basis for our opinion.
We have served as the auditor of The Needham Funds, Inc. since 2011.
New York, New York
February 26, 2021
Annual Report 2020
Information about Directors and Officers (Unaudited)
December 31, 2020
Information pertaining to the Directors and Officers of the Company is set forth below. The Portfolios’ Statement of Additional Information (SAI) includes additional information about the Directors and is available without charge, upon request, by calling 800-625-7071.
The address of each individual is 250 Park Avenue, New York, NY 10177. Each Director serves until the next annual shareholders meeting or until his successor is elected and qualified.
| | Term of Office | Portfolios in the | Principal Occupations(s) |
| Name, Year of Birth | and Length of | Fund Complex | During Past 5 Years |
| and Position with | Term Served by | Overseen by | and Other Directorships |
| the Company | Director/Officer | Director/Officer | Held by Director/Officer |
| Independent Directors |
| John W. Larson, | Indefinite; | Three | Currently retired. Partner at the law |
| Year of Birth: 1935 | Since 2006 | | firm of Morgan, Lewis & Bockius LLP |
| Director | | | from 2003 until retiring in December |
| | | | 2009. Partner at the law firm of |
| | | | Brobeck, Phleger & Harrison LLP from |
| | | | 1969 until 2003. From July 1971 to |
| | | | September 1973 worked in government |
| | | | service as Assistant Secretary of the |
| | | | United States Department of the Interior |
| | | | and Counselor to George P. Schultz, |
| | | | Chairman of the Cost of Living |
| | | | Council. Director of Wage Works, Inc. |
| | | | (an employee benefits company) from |
| | | | 2000 until 2018. Director of Sangamo |
| | | | BioSciences, Inc. since 1996. |
| | | | |
| F. Randall Smith, | Indefinite; | Three | Founder, Member of Investment |
| Year of Birth: 1938 | Since 1996 | | Committee, Investment Analyst and |
| Director | | | Portfolio Manager of Capital Counsel |
| | | | LLC (a registered investment adviser) |
| | | | since September 1999; President from |
| | | | 1999 to 2014. Co-founder and Chief |
| | | | Investment Officer of Train, Smith |
| | | | Counsel (a registered investment |
| | | | adviser) from 1975 to 1999. |
Needham Funds
Information about Directors and Officers (Unaudited) (Continued)
December 31, 2020
| | Term of Office | Portfolios in the | Principal Occupations(s) |
| Name, Year of Birth | and Length of | Fund Complex | During Past 5 Years |
| and Position with | Term Served by | Overseen by | and Other Directorships |
| the Company | Director/Officer | Director/Officer | Held by Director/Officer |
| Interested Director |
| George A. Needham*, | Indefinite; | Three | Chairman of the Board and Chief |
| Year of Birth: 1943 | Since 1996 | | Executive Officer of The Needham |
| Chairman, President | | | Group, Inc. and Needham Holdings, |
| and Director | | | LLC since December 2004. Chairman |
| | | | of the Board and Chief Executive Officer |
| | | | of Needham Asset Management, LLC |
| | | | since April 2006. Chairman of the |
| | | | Board from 1996 to December 2004 |
| | | | and Chief Executive Officer from 1985 |
| | | | to December 2004 of Needham & |
| | | | Company, LLC. Managing Member of |
| | | | Needham Capital Management, LLC |
| | | | since 2000. |
| * | An “interested person”, as defined in the 1940 Act, of the Company or the Company’s investment adviser. Mr. Needham is deemed to be an interested person because of his affiliation with the Portfolios’ Adviser and the Portfolios’ Distributor, and because he is an officer of the Company. |
Annual Report 2020
Information about Directors and Officers (Unaudited) (Continued)
December 31, 2020
| | Term of Office | Portfolios in the | Principal Occupations(s) |
| Name, Year of Birth | and Length of | Fund Complex | During Past 5 Years |
| and Position with | Term Served by | Overseen by | and Other Directorships |
| the Company | Director/Officer | Director/Officer | Held by Director/Officer |
| Officers |
| John Barr, | One year; | Two | Portfolio Manager of Needham |
| Year of Birth 1956 | Since 2010 | | Asset Management, LLC since 2010. |
| Executive Vice President | | | Founding and Managing Member |
| and Co-Portfolio | | | of Oliver Investment Management, |
| Manager of the Needham | | | LLC from 2008 to 2009. Manager |
| Growth Fund, Executive | | | and Analyst at Buckingham Capital |
| Vice President and | | | from 2002 to 2008. Managing |
| Portfolio Manager of | | | Director and a Senior Analyst at |
| the Needham Aggressive | | | Robertson Stephens following |
| Growth Fund. | | | semiconductor companies from |
| | | | 2000 to 2002. From 1995 to 2000, |
| | | | Managing Director and Senior Analyst |
| | | | at Needham and Company, LLC, |
| | | | also served as Director of Research. |
| | | | Director of Coventor, Inc. since 2009. |
| | | | |
| Chris Retzler, | One year; | Two | Portfolio Manager of Needham |
| Year of Birth: 1971 | Since 2008 | | Asset Management, LLC since 2008. |
| Executive Vice President | | | Vice President of Needham Asset |
| and Co-Portfolio | | | Management, LLC since 2005. |
| Manager of the | | | Head of Winterkorn, a healthcare |
| Needham Growth Fund, | | | manufacturing and distribution |
| Executive Vice President | | | company, from 2002 to 2005. |
| and Portfolio Manager | | | |
| of the Needham | | | |
| Small Cap Growth Fund. | | | |
| | | | |
| James W. Giangrasso, | One year; | Three | Chief Financial Officer of |
| Year of Birth: 1962 | Since 2011 | | Needham Asset Management, LLC |
| Chief Financial Officer, | | | since 2011. Principal and |
| Treasurer and Secretary | | | Controller of Needham Asset |
| | | | Management, LLC since 2006. |
| | | | |
| James M. Abbruzzese, | One year; | Three | Chief Compliance Officer of |
| Year of Birth: 1969 | Since 2004 | | Needham Asset Management, LLC |
| Chief Compliance Officer | | | since April 2006. Chief Compliance |
| | | | Officer and Managing Director of |
| | | | Needham & Company, LLC from 2008 |
| | | | through 2012. Chief Administrative |
| | | | Officer of Needham & Company, LLC |
| | | | since 2012. Chief Compliance Officer |
| | | | of Needham Capital Management, LLC |
| | | | since 2000. |
Needham Funds
Supplementary Information (Unaudited)
December 31, 2020
Federal Income Tax Information
For the fiscal year ended December 31, 2020, certain dividends paid by the Portfolios may be subject to a maximum tax rate of 15%, as provided by the Jobs and Growth Tax Relief Reconciliation Act of 2003. The percentage of dividends declared from ordinary income reported as qualified dividend income was as follows:
| NGF | 48.46% |
| NAGF | 100.00% |
| NSCGF | 0.21% |
For corporate shareholders, the percent of ordinary income distributions qualifying for the corporate dividends received deduction for the fiscal year ended December 31, 2020 was as follows:
| NGF | 43.84% |
| NAGF | 100.00% |
| NSCGF | 0.20% |
The percentage of taxable ordinary income distributions that are designed as short-term capital gain distributions under Internal Revenue Section 871 (k)(2)(C) for each Fund were as follows:
| NGF | 100.00% |
| NAGF | 100.00% |
| NSCGF | 100.00% |
Privacy Policy
It is the policy of the Company to keep personally identifiable financial information about you as an individual (“nonpublic personal information”) confidential, and use or disclose it only as necessary to provide services to you or the Company or as otherwise required or permitted by law. We may collect the following nonpublic personal information about you:
| | • | Information we receive from you on or in applications or other forms, correspondence, or conversations, including, but not limited to, your name, address, phone number, social security number, assets, income and date of birth; and |
| | • | Information about your transactions with us, our affiliates, or others, including, but not limited to, your account number and balance, payments history, parties to transactions, cost basis information, other financial information and information about how you vote your shares. |
Annual Report 2020
Supplementary Information (Unaudited) (Continued)
December 31, 2020
We disclose nonpublic personal information about current and former shareholders to companies that provide necessary services to the Company. These companies include the transfer agent, distributor, administrator and investment adviser as well as other affiliates of the Company. We maintain physical, electronic and procedural safeguards that comply with federal standards to guard your nonpublic personal information and restrict access to this information to those persons who need it to provide services to you or the Company or who are otherwise permitted by law to receive it. In the event that you hold any shares of our funds through a financial intermediary, including, but not limited to, a broker-dealer, bank, or trust company, the privacy policy of your financial intermediary governs how your nonpublic personal information is shared with nonaffiliated third parties. If you have any questions concerning the Company’s Privacy Policy, please call 1-800-625-7071.
Disclosure of Portfolio Holdings
Each Portfolio files its complete schedule of portfolio holdings with the Securities and Exchange Commission (“SEC”) for the first and third quarters of each fiscal year as an exhibit to its reports on Form N-PORT. For the Portfolios, this would be for the fiscal quarters ending March 31 and September 30. Each Portfolio’s Form N-PORT reports are available without charge, upon request, by calling 800-625-7071 or on the SEC’s website at http://www.sec.gov.
Voting Proxies on Company Portfolio Securities
A description of the policies and procedures that the Company uses to determine how to vote proxies relating to portfolio securities and information regarding how the Company voted proxies relating to portfolio securities during the most recent 12-month period ended June 30 are available without charge, upon request, by calling 800-625-7071 or on the SEC’s website at http://www.sec.gov.
Household Delivery of Shareholder Documents
To reduce expenses, the Company may mail only one copy of the Portfolios’ prospectuses, proxy statements, information statements, and each annual and semi-annual report to those addresses shared by two or more accounts. If you wish to receive individual copies of these documents, please call the Portfolios at 1-800-625-7071 or contact your financial institution. You will begin receiving individual copies thirty days after receiving your request.
Index Disclaimer
The Portfolios have been developed solely by the Adviser. The Portfolios are not in any way connected to or sponsored, endorsed, sold or promoted by the London Stock Exchange Group plc and its group undertakings (collectively, the “LSE Group”). FTSE Russell is a trading name of certain of the LSE Group companies.
Needham Funds
Supplementary Information (Unaudited) (Continued)
December 31, 2020
All rights in the Russell 2000 Index and the Russell 3000 Index (together, the “Indexes”) vest in the relevant LSE Group company which owns the Index. “Russell®” is a trade mark of the relevant LSE Group company and is used by any other LSE Group company under license. The Indexes are calculated by or on behalf of FTSE International Limited or its affiliate, agent or partner. The LSE Group does not accept any liability whatsoever to any person arising out of (a) the use of, reliance on or any error in the Indexes or (b) investment in or operation of the Portfolios. The LSE Group makes no claim, prediction, warranty or representation either as to the results to be obtained from the Portfolios or the suitability of the Indexes for the purpose to which it is being put by the Adviser.
The source of the data for each of the Indexes is the LSE Group. © LSE Group 2021. All rights in the Indexes or data vest in the relevant LSE Group company which owns the Index or the data. Neither LSE Group nor its licensors accept any liability for any errors or omissions in the Indexes or data and no party may rely on any Indexes or data contained in this communication. No further distribution of data from the LSE Group is permitted without the relevant LSE Group company’s express written consent. The LSE Group does not promote, sponsor or endorse the content of this communication.
Board Consideration and Approval of Investment Advisory Agreement
On October 21, 2020, at a meeting called for the purpose of voting on such approval, the Board, including all of the Independent Directors, approved the continuance of the Investment Advisory Agreement (the “Advisory Agreement”) between the Company and the Adviser with respect to NGF, NAGF and NSCGF. In doing so, the Board reviewed materials provided by the Adviser to assist them in making a determination (the “Board Materials”). The Independent Directors were assisted in their review by independent legal counsel and met with counsel in executive session separate from representatives of the Adviser. In considering the renewal of the Advisory Agreement, the Board considered the nature, extent, and quality of the services to be provided by the Adviser; the investment performance of each Portfolio and the Adviser; the costs of the services to be provided and profits to be realized by the Adviser and its affiliates from the relationship with each Portfolio; the extent to which economies of scale would be realized as the Portfolios grow; and whether fee levels reflect these economies of scale for the benefit of investors.
The Directors stated that their consideration of the continuance of the Advisory Agreement included consideration of the peer group comparisons in the Board Materials to other investment companies with similar investment objectives and to each Portfolio’s unmanaged indices for various periods ended September 30, 2020, noting that NGF’s performance was above the average and median performance of its peer group for the one-year (median only) and since inception time periods and above the relevant Morningstar Universes for the year-to-date (except the Morningstar Mid Cap Universe average), one-year and three-year (Morningstar Small Cap Universe only) periods. For NAGF, the Directors noted that the Portfolio’s performance was above the average and
Annual Report 2020
Supplementary Information (Unaudited) (Continued)
December 31, 2020
median performance of its peer group and the relevant Morningstar Universes for the year-to-date, one-year, three-year (Morningstar Small Cap Universe only) and five-year periods. For NSCGF, the Directors noted that the Portfolio’s performance was above the average and median performance of its peer group and the relevant Morningstar Universes for the year-to-date, one-year, three-year, five-year, ten-year (peer group average only) and since inception periods. It was further noted that the Portfolios’ performance compared favorably to the longer term performance of their respective benchmark indices. In addition to reviewing each Portfolio’s performance and the profitability analysis of the Adviser, the Directors considered possible economies of scale, but did not believe material economies of scale to be present in light of the Portfolios’ asset size.
In their deliberations, the Directors considered all factors they believed relevant in addition to the performance comparisons described above, including the following: the nature, extent and quality of services rendered by the Adviser; the costs borne by, and profitability of, and other benefits to, the Adviser and its affiliates in providing services to each Portfolio; comparative fee and expense data for each Portfolio and other investment companies with similar investment objectives (having been advised that the Adviser does not manage other accounts with investment objectives and strategies similar to those of the Portfolios except private investment funds with fee structures that include performance fees); whether expenses of NGF, NAGF and NSCGF might be expected to decline as a percentage of net assets as NGF, NAGF and NSCGF assets increase; the professional experience and qualifications of each Portfolio’s portfolio manager(s) and other personnel of the Adviser, including the fact that a high caliber of personnel was both needed and provided to meet the needs of NGF, NAGF and NSCGF (specifically with respect to investments in securities sold short); and the terms of the Advisory Agreement. The Independent Directors confirmed that they had received adequate information to make a reasonable determination with respect to the approval of the Advisory Agreement. After full consideration of all the foregoing factors, the Board determined to approve the renewal of the Advisory Agreement.
Statement Regarding Liquidity Risk Management Program
The Company has adopted a liquidity risk management program (the “LRMP”) pursuant to the requirements of Rule 22e-4 under the 1940 Act, which requires registered open-end funds (other than money market funds) to adopt and implement a written liquidity risk management program that is reasonably designed to assess and manage fund liquidity risk. The rule is designed to promote effective liquidity risk management throughout the open-end fund industry, thereby reducing liquidity risk—i.e., the risk that a fund could not meet requests to redeem shares issued by the fund without significant dilution of remaining investors’ interests in the fund.
Pursuant to the requirements of Rule 22e-4, the LRMP is required to include policies and procedures reasonably designed to incorporate the following elements, and the LRMP complies with these requirements: (1) assessment, management and periodic review of
Needham Funds
Supplementary Information (Unaudited) (Continued)
December 31, 2020
liquidity risk; (2) classification of each Portfolio’s investments into one of the four liquidity categories in Rule 22e-4; (3) if the Portfolio does not primarily hold assets that are considered highly liquid investments (cash and other investments reasonably expected to be convertible into cash in current market conditions in three business days or less without the conversion into cash significantly changing the market value of the investment), determination of a “highly liquid investment minimum” (as defined in Rule 22e-4, the “HLIM”) and compliance with additional related requirements; (4) prohibition on the acquisition of any “illiquid investment” (as defined in Rule 22e-4) if immediately after the acquisition the Portfolio would have invested more than 15% of its net assets in illiquid investments; and (5) if the Portfolios reserve the right to engage in redemptions in-kind, establishment of policies and procedures regarding how and when the Portfolios will engage in such redemptions in-kind. There have been no material changes to the LRMP since it was initially approved by the Board.
The Board has approved the Adviser to administer the LRMP (the “Program Administrator”). As Program Administrator, the Adviser delegates the day-to-day activities required by the LRMP to a Liquidity Committee comprised of various Company officers and others within the Adviser (the “Liquidity Committee”), and the Liquidity Committee seeks assistance from and works together with Fund Services in effectuating the requirements of the LRMP as necessary.
Pursuant to the requirements of Rule 22e-4, the Board must review, no less frequently than annually, a written report prepared by the Program Administrator that addresses the operation of the program and assesses its adequacy and effectiveness of implementation, including, if applicable, the operation of the HLIM, and any material changes to the program. The Board received a written report in October 2020 (the “Annual Report”).
The Annual Report states that the Adviser, as the Program Administrator, acting primarily through the Liquidity Committee, has assessed the operation of the LRMP and believes that the LRMP is reasonably designed to assess and manage the Portfolios’ liquidity risk and is adequate and effective in its implementation. The Program Administrator and the Liquidity Committee initially determined that each Portfolio primarily holds assets that are highly liquid investments, and the Annual Report states that this determination continues to be maintained so that no Portfolio needs to maintain a HLIM. In addition, the Annual Report states that, since the LRMP was implemented, no Portfolio has breached its limit on illiquid investments.
(This Page Intentionally Left Blank.)
250 Park Avenue, 10th Floor
New York, New York 10177
1-800-625-7071
Investment Adviser:
Needham Investment Management L.L.C.
250 Park Avenue, 10th Floor
New York, New York 10177
| | President |
| | George A. Needham |
| | Executive Vice Presidents and Portfolio Managers |
| | John Barr |
| | Needham Growth Fund |
| | Needham Aggressive Growth Fund |
| | Chris Retzler |
| | Needham Growth Fund |
| | Needham Small Cap Growth Fund |
| | Directors |
| | George A. Needham |
| | John W. Larson |
| | F. Randall Smith |
Distributor:
Needham & Company, LLC
250 Park Avenue, 10th Floor
New York, New York 10177
212-371-8300
Administrator, Shareholder Servicing Agent, and Transfer Agent:
U.S. Bancorp Fund Services, LLC, doing business as U.S. Bank Global Fund Services
615 East Michigan Street
Milwaukee, WI 53202
Custodian:
U.S. Bank, N.A.
1555 North RiverCenter Drive
Milwaukee, WI 53212
Counsel:
Proskauer Rose LLP
Eleven Times Square
New York, NY 10036-8299
Independent Registered Public Accounting Firm:
KPMG LLP
345 Park Avenue
New York, NY 10154
| (b) | Not applicable for this Registrant |
Item 2. Code of Ethics.
The registrant has adopted a code of ethics that applies to the registrant’s principal executive officer and principal financial officer. The registrant has not made amendments to its code of ethics during the period covered by this report. The registrant has not granted any waivers from any provisions of the code of ethics during the period covered by this report.
A copy of the registrant’s Code of Ethics is filed herewith.
Item 3. Audit Committee Financial Expert.
The registrant’s board of directors has determined that there is at least one audit committee financial expert serving on its audit committee. F. Randall Smith is the “audit committee financial expert” and is considered to be “independent” as each term is defined in Item 3 of Form N‑CSR.
Item 4. Principal Accountant Fees and Services.
The registrant has engaged its principal accountant to perform audit services, audit-related services, tax services and other services during the past two fiscal years. “Audit services” refer to performing an audit of the registrant's annual financial statements or services that are normally provided by the accountant in connection with statutory and regulatory filings or engagements for those fiscal years. “Audit-related services” refer to the assurance and related services by the principal accountant that are reasonably related to the performance of the audit. “Tax services” refer to professional services rendered by the principal accountant for tax compliance, tax advice, and tax planning. “Other services” provided by the principal accountant were not applicable. The following table details the aggregate fees billed or expected to be billed for each of the last two fiscal years for audit fees, audit-related fees, tax fees and other fees by the principal accountant.
| | FYE 12/31/2020 | FYE 12/31/2019 |
Audit Fees | $79,500 | $78,500 |
Audit-Related Fees | $ 0 | $ 0 |
Tax Fees | $24,675 | $23,925 |
All Other Fees | $ 0 | $ 0 |
The audit committee has adopted pre-approval policies and procedures that require the audit committee to pre‑approve all audit and non‑audit services of the registrant, including services provided to any entity affiliated with the registrant.
The percentage of fees billed by KPMG LLP applicable to non-audit services pursuant to waiver of pre-approval requirement were as follows:
| | FYE 12/31/2020 | FYE 12/31/2019 |
Audit-Related Fees | 0% | 0% |
Tax Fees | 0% | 0% |
All Other Fees | 0% | 0% |
All of the principal accountant’s hours spent on auditing the registrant’s financial statements were attributed to work performed by full‑time permanent employees of the principal accountant.
The following table indicates the non-audit fees billed or expected to be billed by the registrant’s accountant for services to the registrant and to the registrant’s investment adviser (and any other controlling entity, etc.—not sub-adviser) for the last two years. The audit committee of the board of trustees/directors has considered whether the provision of non-audit services that were rendered to the registrant's investment adviser is compatible with maintaining the principal accountant's independence and has concluded that the provision of such non-audit services by the accountant has not compromised the accountant’s independence.
Non-Audit Related Fees | FYE 12/31/2020 | FYE 12/31/2019 |
Registrant | $0 | $0 |
Registrant’s Investment Adviser | $8,700 | $8,300 |
Item 5. Audit Committee of Listed Registrants.
Not applicable to registrants who are not listed issuers (as defined in Rule 10A-3 under the Securities Exchange Act of 1934).
Item 6. Investments.
| (a) | Schedule of Investments is included as part of the report to shareholders filed under Item 1 of this Form. |
Item 7. Disclosure of Proxy Voting Policies and Procedures for Closed-End Management Investment Companies.
Not applicable to open-end investment companies.
Item 8. Portfolio Managers of Closed-End Management Investment Companies.
Not applicable to open-end investment companies.
Item 9. Purchases of Equity Securities by Closed‑End Management Investment Company and Affiliated Purchasers.
Not applicable to open-end investment companies.
Item 10. Submission of Matters to a Vote of Security Holders.
Not Applicable.
Item 11. Controls and Procedures.
(a) | The Registrant’s Chief Executive Officer and Chief Financial Officer have reviewed the Registrant's disclosure controls and procedures (as defined in Rule 30a-3(c) under the Investment Company Act of 1940 (the “Act”)) as of a date within 90 days of the filing of this report, as required by Rule 30a-3(b) under the Act and Rules 13a-15(b) or 15d‑15(b) under the Securities Exchange Act of 1934. Based on their review, such officers have concluded that the disclosure controls and procedures are effective in ensuring that information required to be disclosed in this report is appropriately recorded, processed, summarized and reported and made known to them by others within the Registrant and by the Registrant’s service provider. |
(b) | There were no changes in the Registrant's internal control over financial reporting (as defined in Rule 30a-3(d) under the Act) that occurred during the Registrant’s first fiscal half-year of the period covered by this report that has materially affected, or is reasonably likely to materially affect, the Registrant's internal control over financial reporting. |
Item 12. Disclosure of Securities Lending Activities for Closed-End Management Investment Companies
Not applicable to open-end investment companies.
Item 13. Exhibits.
(3) Any written solicitation to purchase securities under Rule 23c‑1 under the Act sent or given during the period covered by the report by or on behalf of the registrant to 10 or more persons. Not applicable to open-end investment companies.
SIGNATURES
Pursuant to the requirements of the Securities Exchange Act of 1934 and the Investment Company Act of 1940, the registrant has duly caused this report to be signed on its behalf by the undersigned, thereunto duly authorized.
(Registrant) The Needham Funds, Inc.
By (Signature and Title) /s/George A. Needham
George A. Needham, President (Chief Executive Officer)
Date March 5, 2021
Pursuant to the requirements of the Securities Exchange Act of 1934 and the Investment Company Act of 1940, this report has been signed below by the following persons on behalf of the registrant and in the capacities and on the dates indicated.
By (Signature and Title) /s/George A. Needham
George A. Needham, President (Chief Executive Officer)
Date March 5, 2021
By (Signature and Title) /s/James W. Giangrasso
James W. Giangrasso, Treasurer and Secretary (Chief Financial Officer)
Date March 5, 2021