Annual
Report
Needham Funds
Seeking to build wealth for long-term investors.
December 31, 2018
Needham Growth Fund
Needham Aggressive Growth Fund
Needham Small Cap Growth Fund
www.needhamfunds.com
Beginning on January 1, 2021, as permitted by regulations adopted by the Securities and Exchange Commission, paper copies of the Funds’ shareholder reports will no longer be sent by mail, unless you specifically request paper copies of the reports from the Funds or from your financial intermediary, such as a broker-dealer or bank. Instead, the reports will be made available on a website, and you will be notified by mail each time a report is posted and provided with a website link to access the report.
If you already elected to receive shareholder reports electronically, you will not be affected by this change and you need not take any action. You may elect to receive shareholder reports and other communications electronically from the Funds by calling 1-800-625-7071 or by contacting your financial intermediary (such as a broker-dealer or bank).
You may elect to receive all future reports in paper free of charge. You can request to continue receiving paper copies of your shareholder reports by contacting your financial intermediary or, if you invest directly with a Fund, calling 1-800-625-7071 to let the Fund know of your request. Your election to receive in paper will apply to all funds held in your account.
250 Park Avenue, 10th Floor
New York, New York 10177
1-800-625-7071
www.needhamfunds.com
Annual Report
December 31, 2018
Contents
| Letter from the Adviser | 1 |
| Portfolio Characteristics | |
| Needham Growth Fund | 12 |
| Needham Aggressive Growth Fund | 14 |
| Needham Small Cap Growth Fund | 16 |
| Disclosure of Fund Expenses | 18 |
| Schedules of Investments | |
| Needham Growth Fund | 20 |
| Needham Aggressive Growth Fund | 25 |
| Needham Small Cap Growth Fund | 30 |
| Schedules of Securities Sold Short | |
| Needham Growth Fund | 24 |
| Needham Aggressive Growth Fund | 29 |
| Statements of Assets and Liabilities | 34 |
| Statements of Operations | 36 |
| Statements of Changes in Net Assets | 37 |
| Financial Highlights | |
| Needham Growth Fund | 40 |
| Needham Aggressive Growth Fund | 42 |
| Needham Small Cap Growth Fund | 44 |
| Notes to Financial Statements | 46 |
| Report of Independent Registered Public Accounting Firm | 55 |
| Information about Directors and Officers | 56 |
| Supplementary Information and Privacy Policy | 58 |
This report is authorized for distribution to prospective investors only when preceded or accompanied by a current prospectus. The prospectus contains more complete information, including investment objectives, risks, expenses and charges and should be read carefully before investing or sending any money. To obtain a prospectus or summary prospectus, please call 1-800-625-7071.
Portfolios of The Needham Funds, Inc., like all mutual funds:
• Are NOT FDIC insured
• Have no bank guarantee
• May lose value
The Needham Funds, Inc. are distributed by Needham & Company, LLC.
 | 250 Park Avenue, 10th Floor |
| New York, NY 10177 |
| (800) 625-7071 |
| www.needhamfunds.com |
February 2019
Dear Shareholders, Friends of Needham and Prospective Shareholders,
We are reporting results for the quarter and year ended December 31, 2018 for the Needham Growth Fund, Needham Aggressive Growth Fund, and Needham Small Cap Growth Fund. Our mission is to create wealth for long-term investors, but the fourth quarter was a step backward. January 2019 was a step forward as the Funds earned back most of the fourth quarter 2018 losses.
Needham Funds’ Fourth Quarter and Year-End 2018 Results
In the fourth quarter, the Needham Growth Fund Institutional and Retail classes returned -14.11% and -14.22%, respectively; the Needham Aggressive Growth Fund Institutional and Retail classes returned -18.41% and -18.49%, respectively; and the Needham Small Cap Growth Fund Institutional and Retail classes returned -16.07% and -16.24% respectively. The Russell 2000 Total Return Index returned -20.20%, and the S&P 500 Total Return Index returned -13.52%. December 2018 was the worst December for the Dow Jones Industrials and the S&P 500 since 1931. January 2019 was a good step forward as the Funds earned back most of the fourth quarter 2018 losses.
In 2018, the Needham Growth Fund Institutional and Retail classes returned -9.83% and -10.26% respectively; the Needham Aggressive Growth Institutional and Retail classes returned -15.36% and -15.80% respectively, and the Needham Small Cap Growth Fund Institutional and Retail classes returned -4.32% and -5.07% respectively. The Russell 2000 Total Return Index returned -11.01%, and the S&P 500 Total Return Index was down -4.38%. It was a horrible quarter, which made for a negative year. It was the worst year for stocks since 2008.
2018
It’s hard to remember, but 2018 began as a continuation of the dream market of the last three years. The market and the Needham Funds responded positively to the Tax Cuts and Jobs Act of 2017. The beginning of February brought a different story. The markets took a sharp downturn as the Federal Reserve raised interest rates and $1.5 trillion in “risk parity” trades began to unravel. The markets and the Needham Funds retraced their January gains.
At the start of the second quarter, rising interest rates and geopolitical risk and trade wars with Russia, China, North Korea and Iran dominated the market’s laundry list of worries. However, May delivered a strong market and outperformance by the Needham Funds. Despite more talk of trade wars, the economy and inflation seemed not too hot and not too cold, and earnings were better than expected.
In June, a strong jobs report was followed by the Federal Open Market Committee’s raise of its target interest rates for the second time in 2018. President Trump had a summit with North Korea’s Kim Jong-un and reached broad outlines of a peace agreement—a shift from
the fears of nuclear war that made headlines earlier in the year. By the end of June, global growth appeared to be robust, assuaging concerns of earlier in the year. The Funds and the markets were positive during the second quarter.
In late July, the U.S. Department of Commerce reported 4.1% annualized GDP growth for the second quarter and unemployment remained low at 4.0%. Some of the Funds’ industrial and semiconductor manufacturing equipment holdings were affected by disappointing guidance relating to their European and Asian businesses. The MSCI EAFE (Europe, Australasia and Far East) Index was down for the year as of July 31, while the Needham Funds and the U.S. markets were all positive. In July, the U.S. announced 10% tariffs on $200 billion of Chinese goods and China responded by imposing duties on over $100 billion of U.S. manufactured goods. These tariffs were effective September 24.
August brought an even better month for the markets and the Needham Funds. By the end of August, the U.S. and Canada had yet to reach a trade agreement. The weakness in international markets persisted and the trade rhetoric between the U.S. and China escalated.
September brought the third Federal Reserve interest rate hike for the year. At of the end of the third quarter, all three Needham Funds and the U.S. markets had positive returns for the year. However, international markets had turned negative; at September 30, China had returned -14.7% year-to-date, Germany -5.2%, Canada -0.8%, and Italy -5.2%.
Then came October with continued international weakness, trade war rhetoric, additional tariffs on U.S./China trade, and the prospect of a Federal Reserve December rate increase. The FAANG stocks were de-fanged in October, as Facebook, Inc. Class A (FB), Amazon.com, Inc. (AMZN), Apple Inc. (AAPL), Netflix, Inc. (NFLX), Alphabet Inc. Class A (GOOGL) and also NVIDIA (NVDA) fell an average of 16.4%; these stocks fell an average of another 11.1% in the first 19 days of November. Other high-growth companies that the market had previously rewarded with high multiples also fell.
October 2018 was one of the worst months for the markets and the Needham Funds in the last decade. The Russell 2000 was down -10.86% and the S&P 500 was down -6.84%. I recall the summer of 2011—it was the peak of the European sovereign debt crisis and included the Standard & Poor’s downgrade of U.S. debt. The Federal Reserve and European monetary authorities responded in force with liquidity measures. The markets rebounded quickly in October and the fourth quarter of 2011 was positive. Ultimately, we suspect the current monetary authorities will respond in similar fashion.
November brought a reprieve, as the markets and Funds were positive or nearly even. During midterm elections, Republicans increased their majority in the Senate and Democrats won control of the House. An increase in the Producer Price Index led to concerns that the Fed would stay on a tightening course. Toward the end of November, Fed Chairman Powell appeared to change his stance, stating that he viewed interest rates as just below a neutral level. Previously, he said rates were a long way from neutral. Foretelling things to come: Apple (AAPL) was down 18.4% in the month.
Then came December—it was worse than October. In fact, it was the worst December since 1931. The Russell 2000 was down -11.88%, the S&P 500 was down -9.03%, and the Needham Funds were also down. To highlight the market’s volatility, the S&P 500 was up or
down more than 1% on 9 of 21 days, compared to 8 times in all of 2017. Trade fears, along with rising interest rates and a slowing global economy, weighed on the market.
On December 2, President Trump and Chinese President Xi Jinping agreed to halt new trade tariffs for 90 days to give time for detailed negotiations. The U.S. agreed not to increase tariffs on another $250 billion of Chinese goods to 25% from 10% on January 1. The market traded up or down based on talk of a trade deal with China.
On December 19, the Fed raised its target range for federal funds to 2.25-2.50%—this was the fourth increase in 2018 and the ninth since the Fed began raising rates in December 2015. The Fed appeared to be on course for two increases in 2019.
John’s Commentary
Outlook for 2019
2019 began with the same market strength we saw in January 2018. However, 2018 started against a backdrop of euphoria, while 2019 began with despair and lower valuations. Through January 31, the Needham Growth Fund Institutional and Retail classes returned 9.57% and 9.47%, respectively; the Needham Aggressive Growth Fund Institutional and Retail classes returned 11.77% and 11.68%, respectively; and the Needham Small Cap Growth Fund Institutional and Retail classes returned 15.35% and 15.32% respectively. The Russell 2000 Total Return Index returned -11.25%, and the S&P 500 Total Return Index returned 8.01%.
The market started its move higher when the Fed indicated a cautious stance on rate increases and highlighted the risks of a slowing economy. While a Federal Reserve pause is good for the equity markets, we also recognize that 2.25-2.50% is still a historically low range for interest rates.
Our portfolio companies’ fourth quarter earnings reports have shown a slowing in China business. While it’s easy to point to trade friction, it’s more likely that China’s infrastructure spending got ahead of real demand and is due for a pause. We believe the U.S. and China could reach a productive trade agreement, which could be positive for the markets.
As I look to invest in North American small-cap companies with unrecognized growth potential, I believe that our small-cap portfolio companies’ destinies are more in their control than perceived, and that they are less likely victims of macro risk. Success with their new products and services may happen, even if the Chinese economy slows or the Federal Reserve increases rates in 2019. We note that as a rule, monetary authorities pursue easy money policies. Paul Volcker is the one exception in the last 40 years. We believe equity markets could benefit in 2019 from those easy monetary policies.
Quantitative Strategies and ETFs versus the Needham Funds
At Needham Funds, we are active, fundamental managers in a world headed toward passive management and quantitative strategies. We evaluate companies and their business prospects. Actually, I am an inactive/active manager. I look to hold a company for a long time, which results in low turnover. I am a long-term investor in a few companies which I believe can outperform over the long term.
In January, The Wall Street Journal ran an article on quantitative strategies and the fourth quarter.1 It quoted Rufus Rankin, Director of Research and Portfolio Manager at Equinox Institutional Management, “A lot of trend-followers ended the year down because it was tricky to catch many trends.” Kathryn Kaminski, Chief Research Strategist at Alpha Simplex said, “But using mathematical models to predict where markets are headed has been difficult as prices have been whipsawed by trade negotiations and mixed economic signals.” To see a more humorous interpretation please see the video titled, “World’s Worst Sheep Dog.”2 A funny guy on Twitter re-titled this, “Quant Traders in the Fourth Quarter.”
As the quants fine-tune their models to capture performance from new factors, they create a self-reinforcing momentum mechanism, which, for the most part, we don’t participate in. While most of our stocks were down in the fourth quarter, our companies continued to make progress on their new projects. In fact, the Needham Funds have rebounded and recovered all of their December losses as of January 31.
In the last decade, “growth at any price” stocks have worked and value has underperformed. While we are a growth-oriented firm, we are sensitive to valuation. We don’t buy blindly value in the form of a low price-to-book or P/E. These companies may have overstated book values or business models broken by new technology competitors. Rather, we are attracted to technology companies with low multiples-to-revenue that invest in new products or distribution. Sometimes these companies take time to see the benefits of their investments and, in the meantime, the stocks underperform. I am hopeful that 2019 will be a year of stock outperformance for some of our top small cap holdings, including PDF Solutions, Inc. (PDFS), Oil-Dri Corporation of America (ODC), KVH Industries, Inc. (KVHI), GSE Systems, Inc. (GVP), DIRTT Environmental Solutions Ltd. (DRT:TSE), and FormFactor, Inc. (FORM).
The Needham Funds Are Very Different from an Index
At Needham, we view our Funds’ investments similar to a venture capital investor. Months, quarters or even years can pass without markets recognizing progress behind the scenes. Consequently, the Needham Funds are not correlated with the averages, as shown by an R-Squared of 79.97 relative to the Russell 20003 for the Needham Aggressive Growth Fund; 69.47 relative to the Russell 20004 for the Needham Small Cap Growth Fund; and 55.06 relative to the S&P 5005 for the Needham Growth Fund. R-Squared measures the percentage of a fund’s returns that can be explained by the returns of the benchmark.
As of December 31, 2018, Needham Aggressive Growth Fund held 58 long positions. The Fund’s top 10 holdings represent 62.52% of net assets. Therefore, the Fund has a very different constitution than the indices, as shown by its high Active Share6 of 106.3% versus the Russell 2000 Total Return Index. The other Needham Funds also have high
____________
1 | https://www.wsj.com/articles/computer-models-to-investors-short-everything-11547038800 |
2 | https://www.youtube.com/watch?v=p-9-3DtUzug |
3 | Since inception of the Fund on 9/4/01. As of 12/31/18. |
4 | Since inception of the Fund on 5/22/02. As of 12/31/18. |
5 | Since inception of the Fund on 1/1/96. As of 12/31/18. |
6 | Active Share represents the proportion of portfolio holdings that differ from those in the benchmark index. As of 12/31/18. |
Active Share—Needham Growth Fund is 105.7% versus the S&P 500 TR Index, and Needham Small Cap Growth Fund is 98.5% versus the Russell 2000. We don’t try to rotate sectors to match or beat an index. We look to invest in companies that might earn an above market, compounding long-term return.
Needham Small Cap Growth Fund (NESGX/NESIX)
The Needham Small Cap Growth Fund Institutional class returned -16.07% and the Retail class returned -16.24% in the quarter ended December 31, 2018. For the year, the Fund’s Institutional class returned -4.32% and the Retail class returned -5.07% while the Russell 2000 Total Return Index returned -20.20% for the quarter and -11.01% for the year.
We were pleased with the Fund’s significant quarterly and annual outperformance of the Russell 2000 Total Return Index. Outperformance was consistent throughout the year with many of our concentrated positions outperforming the broader markets. However, in the last few weeks of December, some of these positions declined owing to an overall market correction. While the fourth quarter turned the Fund’s year from positive to negative, our cautious cash position and trading flexibility allowed us to take advantage of the correction and deploy significant amounts of our cash position into stocks at the end of December. Thankfully, this strategic decision allowed us to capture substantial recovery in the early part of 2019. The market for small cap companies continues to offer good value, and we will evaluate our position sizes and valuation targets.
The Fund continued its lean toward a concentrated portfolio of stocks, with top 10 holdings representing 55.35% of net assets at December 31, 2018. Top holdings at December 31, 2018 included Photronics, Inc. (PLAB), Amber Road, Inc. (AMBR), PDF Solutions, Inc. (PDFS), EMCORE Corp. (EMKR), Aquantia Corp. (AQ), Aspen Aerogels, Inc. (ASPN), Ultra Clean Holdings, Inc. (UCTT), Super Micro Computer, Inc.(SMCI), Hawaiian Holdings, Inc. (HA), and Electronics for Imaging, Inc. (EFII). The Fund’s top fourth quarter contributors included Corium International, Inc., Akoustis Technologies, Inc. (AKTS), FormFactor, Inc. (FORM), Frequency Electronics, Inc. (FEIM), and Zscaler, Inc. (ZS).
The Fund’s largest fourth quarter detractors were Aspen Aerogels, Aquantia, Ultra Clean Holdings, Electronics for Imaging, and Super Micro Computer. With regard to Aspen Aerogels’ poor performance throughout the quarter, we observed that a significant institutional shareholder of the stock had been selling their position along with a general trend of tax-loss selling of small capitalization companies across the market. We do not believe that the fundamental story of the company has changed, and we remain excited about its new product launches and future growth trajectory. The stock has since partially recovered in January off its December lows, and its funding needs were greatly improved with a cash infusion from its product line partner BASF.
While volatility may seem to be a bad word for the overall markets, it is a great chance for active managers to find buying opportunities. It is in these volatile markets when a cash position is truly strategic for small cap fund managers. Many small cap investment opportunities “trade by appointment,” and we like to capitalize on these opportunities when liquidity is available to both buy and sell stock positions. We added to existing positions and also added many new small positions to the Fund, including Akoustis Technologies, TTM Technologies, Inc. (TTMI), Cohu, Inc. (COHU), Five9, Inc. (FIVN), Intevac, Inc. (IVAC),
and Everbridge, Inc. (EVBG). We exited our holding in WageWorks, Inc. (WAGE), FireEye, Inc. (FEYE), and Orbotech, Ltd. (ORBK). The Fund ended the quarter with a cash position of 4.9%. We remain excited about the composition of the portfolio as we enter 2019, and we look forward to learning about new small cap prospects this year.
We continue to believe that a good environment remains for investment in equities. Three themes we are focused on include: 1) continuation of the growth in the semiconductor capital equipment industry; 2) 5G communication infrastructure; and 3) military and defense modernization. These three areas of investment impact much of our portfolio, and we believe that long term, they should create shareholder value.
We expect a continuation of volatility into 2019, as the markets evaluate any economic slowdowns, interest rate curve risks, Federal Reserve actions, government shutdowns, trade policy negotiations, and overall geopolitical risks. The Federal Reserve has indicated at this point in time that they are on hold for the near-term for any short-term interest rate hikes. This position may change if economic data improves throughout the year, but at the moment, the markets are applauding this pause in rate policy. The expectation of pro-growth policies has boosted confidence for both individuals and corporations, and this should translate ultimately into higher economic activity for many of our portfolio companies. The high-yield markets showed signs of weakness at the end of 2018 but has since recovered, which is also supportive of the small cap asset class valuations.
The Fund benefited from the previously discussed sale of Invuity and also saw the sale of its holdings in Corium International and Reis, Inc. We were very happy with the results, as Corium received a nice premium to current price and, similar to Invuity, avoided returning to the capital markets. Reis had announced it was running a strategic review of its business and it ultimately sold to Moody’s Corporation (MCO). We reiterate from our last quarterly letter that mergers and acquisitions continued in the small cap universe, but have slowed since 2016. We believe this trend is a pause, and we expect to see increased M&A activity as well as economic growth to improve and benefit the Needham Small Cap Growth Fund in 2019.
Needham Growth Fund (NEEGX/NEEIX)
The Needham Growth Fund Institutional class was down -14.11% and the Retail class was down -14.22% in the fourth quarter, underperforming the S&P 500, which was down -13.52%. For the year, the Needham Growth Fund Institutional class returned -9.83% and the Retail class was down -10.26%, compared to the S&P 500 which was down -4.38%.
For the fourth quarter, the short position in Medallion Financial Corp. (MFIN) was the Fund’s top contributor as the stock fell 29.5%. Historically, Medallion was a taxi cab medallion lender and is aggressively expanding their business in consumer and small business loans at the low-end of the credit spectrum. In a downturn, these loans could have higher than average default rates. Red Hat, Inc. (RHT) was the second-leading contributor and returned 30.7%. Red Hat agreed to be purchased by International Business Machines Corporation (IBM).
For the year, the Fund’s largest holding, Thermo Fisher Scientific, Inc. (TMO), was the leading contributor returning 18.2%. The Fund first invested in Thermo Fisher in January 2000 at $13 per share and the investment has compounded at 17.6% per year. Thermo Fisher had a good year across its market segments, including biopharma, industrial, academia, and
diagnostics. Trade Desk, Inc. Class A (TTD) was the second-leading contributor and returned 153.8%. The Trade Desk provides Software-as-a-Service used by ad agencies and brand managers for programmatic, digital ad campaigns. The growth of over-the-top video is a major opportunity for The Trade Desk. 2018 revenue is expected to have grown 48% with 21% GAAP operating income margin. The company has a culture of profitable growth.
The third-leading 2018 contributor was Red Hat, followed by Corium International, Inc. and Invuity, Inc.
The leading detractor for the fourth quarter was KVH Industries, Inc. which returned -21.5%. The company’s third quarter revenue and earnings results were fine and at 1x enterprise value-to-revenues, valuation is moderate. Most likely the stock decline was a result of being a small cap stock caught in a risk-off, tax-selling period.
KVH’s AgilePlans provides connectivity-as-a-service to the maritime industry and bundles a satellite antenna, air time, and news, entertainment and training programming. Customers pay monthly and are not required to sign a long-term contract. Customers save the capex upfront and retain flexibility should their business circumstances change. It has led to a 100% increase in unit bookings year-to-date through September 30, 2018. These strong results could show through in revenue and earnings in 2019.
In 2018, KVH worked to develop a photonic chip, a cost-reduced version of its fiber optic gyroscope (FOG) products. In December, KVH delivered prototypes to leading automotive companies. KVH’s FOGs are used on most self-driving car programs today. FOGs help vehicles maintain positioning when they are out of range of GPS satellites. The cost-reduced version is designed to meet the requirements for mass deployment on autonomous vehicles. Sometime in 2019, KVH could announce a partner for scale manufacturing and automotive expertise. Long term, we believe KVH could be a significantly larger company and earn several dollars per share.
Super Micro Computer, Inc. also detracted from fourth quarter and annual performance—the stock was down 33.0% in the fourth quarter. The company was victim of a bizarre story published by Bloomberg Businessweek about Chinese People’s Liberation Army hackers inserting “microchips the size of a grain of sand” into Super Micro servers, allowing the Chinese to spy on customers, including Apple, Amazon, and the Department of Defense. All of these entities and many others denied the story. Tim Cook of Apple personally called for Bloomberg to retract the story. From my experience in the electronics industry prior to Wall Street, I find the story highly unlikely. The article took Super Micro from $21.50 per share to a low of $8.50 in one day. The stock closed the quarter at $13.80.
The story hit Super Micro at a time of vulnerability, as it has yet to file its 10K for the June 2017 fiscal year. The company has concluded that the restatement is expected to move at most $50 million of revenue and under $10 million of net income between 2015 through 2017. These amounts represent 1-2% of revenue and less than 10% of net income. For all of the effort and expense, these changes seem immaterial. Despite weakness in the market for data center equipment, we believe Super Micro has earnings power of $2-3 per share.
Gilead Sciences, Inc. (GILD), another significant detractor, was down 18.3% in the fourth quarter. Gilead reported positive results for the third quarter and moved lower with the market. We note that with Bristol Myers-Squib Company’s (BMY) proposed acquisition of
Celgene Corporation (CELG), one Wall Street analyst suggested Gilead could be worth $104 per share in a merger. As of December 31, 2018, Gilead is the second-largest holding of the Fund at 6.45% of net assets.
For the year, PDF Solutions, Inc. returned -46.3% and was the Fund’s leading detractor. PDF’s legacy business declined and its largest customer, Global Foundries, announced that it was ending efforts to compete with Taiwan Semiconductor Manufacturing (TSMC). PDF had been working with GlobalFoundries on many leading-edge programs.
Throughout 2018, PDF investors waited for a contract announcement for the new DFI (Design for Inspection) offering. Importantly, the announcement came in mid-January 2019. I believe that PDF’s Exensio Big Data Analytics, cash flow from the legacy business and cash on the balance sheet are worth $11-12 per share, above the December 31st share price of $8.43. Should DFI and Exensio grow over the next few years, I believe PDF could earn several dollars per share and the stock could outperform.
The Fund’s short position in Ubiquiti Networks, Inc. (UBNT) contributed in the fourth quarter, but detracted for the year, as the stock appreciated 40.7%. Last February, the Securities and Exchange Commission issued subpoenas to Ubiquiti and some of its officers requesting information relating to accounting practices, financial information, auditors, international trade practices, and relationships with third parties. The company stated it is in the process of responding to the requests and intends to cooperate fully with the SEC. Through the end of September, Ubiquiti bought back $400 million of stock, and on November 6, 2018, they authorized a new $200 million buyback. Management has done a good job of supporting the stock.
In 2018, the Fund added new positions, including DIRTT Environmental Solutions Ltd., which closed the year at 3.4% of net assets, Cryoport, Inc. (CYRX) at 1.1% of net assets, Taiwan Semiconductor (TSMC), and Zuoro, Inc. Class A (ZUO). DIRTT Environmental is using technology to disrupt the interior construction industry. DIRTT has an incredible 3-D virtual reality CAD (computer-aided design) system that allows peers in different locations to walk through a VR model of their design prior to sign-off. The CAD system then feeds manufacturing, which is done at several factories and assembled on-site. DIRTT competes with drywall and on-site construction. It is green as there is minimal waste at the factories and no waste material on-site. It is predictable and helps contractors stick to schedule.
When we first invested, I was attracted to DIRTT because of its Founder & CEO. Late in 2018, the Board replaced almost all of DIRTT’s senior management team with people that have great experience in growing companies. I was skeptical at first, but have come to believe that the new team is making important changes that can help DIRTT reach its potential at multiples of its current sales level.
Cryoport is at the center of the ecosystem for transporting CAR-T cancer immunotherapies at temperatures as cold as -150C. Cyroport is part of the Gilead/Kite Pharmaceuticals’ Yescarta launch and the Novartis AG’s (NVS) Kymriah launch. CAR-T is a miracle of science, but as investors, we become immune (pun intended) to scientific miracles. By chance, I met a person who put a human face on CAR-T. He was recently treated with Yescarta at the Dana Farber Cancer Center outside Boston. He had gone through many other treatments. Yescarta was his last hope and after about a month, his cancer was gone. I met him at a CrossFit workout about six weeks after he left the hospital. The drug worked a miracle.
With GlobalFoundries’ strategic choice to stop developing leading-edge semiconductor manufacturing processes, Taiwan Semiconductor is the sole supplier for Apple (AAPL), NVIDIA Corporation (NVDA), Advanced Micro Devices, Inc. (AMD), and all others except for Intel Corporation (INTC) and Samsung Electronics Co. Ltd (005930-KRX). While the semiconductor industry is suffering a downturn, we believe Taiwan Semiconductor will emerge as a strong leader.
Zuora went public in 2018. It is a software-as-a-service company that enables accounting and subscription management for the subscription economy. The economy is becoming subscription-centric; even industrial equipment companies are looking for ways of monetizing data and analytics through subscription business models.
The Fund exited its position in ComScore, Inc. (SCOR) as valuation appeared stretched given the outlook for the next few years. Comscore successfully completed filing its delinquent financials in March 2018 with its last previous filing over 2 years before. This was a costly and protracted restatement process. We also exited our long-time holding in WageWorks, as the company announced in March that it was unable to file its financials.
As of December 31, 2018, the top 10 positions were 57.56% of net assets. The Fund had trailing 12-month turnover of just 8% and Active Share of 109.1% vs. the S&P 500.
Needham Aggressive Growth Fund (NEAGX/NEAIX)
Needham Aggressive Growth Fund Institutional class was down -18.41% in the fourth quarter and the Retail class was down -18.49%, compared to a -20.20% return for the Russell 2000. In 2018, the Needham Aggressive Growth Fund Institutional class returned -15.36% and the Retail class returned -15.80% compared to -11.01% for the Russell 2000.
Vicor (VICR) was the Fund’s top contributor in 2018 but one of the largest detractors for the fourth quarter. Vicor returned 80.8% in 2018, as its modular power conversion systems were adopted in leading data centers. Vicor has worked with Alphabet Inc. (GOOGL) on its Open Compute data centers to distribute DC (direct current) power throughout a data center. In most data centers today, power goes through inefficient conversions from DC to AC (alternating current) and back again to DC. In March 2018, NVIDIA announced its newest DGX-2 artificial intelligence system, which uses Vicor power converters. Vicor is uniquely positioned to meet future data center, artificial intelligence and automotive processing needs. The stock may fluctuate based on the quarterly outlook for data center spending, but long term, Vicor addresses big markets, has strong potential margins and return on capital, is founder-run, and has no analyst coverage. That’s my kind of company.
Other top contributors in 2018 were The Trade Desk, Cryoport, and Reis, Inc. In August, Reis agreed to be purchased by Moody’s.
The short positions in Medallion Financial and Health Insurance Innovations, Inc. Class A (HIIQ) were the top contributors in the fourth quarter. FormFactor (FORM) was the third-leading contributor for the quarter, returning 2.5%. FormFactor reported a good quarter with positive results from wafer probe cards used for advanced logic and memory applications and from system sales, which offset weakness at Intel and Samsung.
PDF Solutions was the Fund’s largest detractor in 2018 and the fourth quarter. GSE Systems, Inc. also hurt 2018 performance. Despite good results all year, GSE Systems fell 41.7% in the fourth quarter. I believe this micro-cap stock fell victim to tax-loss-selling in a horrible
market. GSE Systems made progress on its vision of being a leader in training, consulting and technology-enabled engineering solutions to the power and process industries. In May 2018, GSE acquired True North Consulting. True North has complementary skills in in-service inspection for specialty engineering and in-service testing for nuclear engineering programs. GSE currently has a run rate of about $100 million in revenue, with about $10 million of EBITDA, and a market cap of just $60 million.
Other significant detractors for the year were WageWorks, Ubiquiti Networks (short), and IPG Photonics Corp. (IPGP).
In the fourth quarter, long-time holding Apple fell 28.9% and was the Fund’s second-largest detractor. Apple reported weakness in China and with its new high-end phones. Apple was purchased by my predecessor on the Fund in 2006, before the iPhone was introduced. I continue to believe Apple represents a compelling value with long-term growth opportunities, thus it stays in the Fund. Other significant detractors in the fourth quarter were KVH Industries, Super-Micro, and Oil-Dri.
In 2018, we added three positions that remain above 0.4% holdings: Taiwan Semiconductor, Zuora, and Alpha Pro Tech, Ltd (APT). Alpha Pro Tech makes protective apparel for medical, industrial and infection control uses. It also makes covering products used in construction. Alpha Pro Tech is a micro-cap with no research coverage, it is family run, earns a good return on capital, and uses cash generated to shrink the share base.
The Fund exited long-time positions in Gilead Sciences, Comscore, WageWorks, and Reis. We trimmed or reduced positions in many of the largest holdings, including Entegris, Akamai, Apple, Form Factor, MKS Instruments, Vicor, and Nova Measuring Instruments Ltd. (NVMI). At December 31, 2018, the Fund’s top 10 positions were 62.52% of net assets. The Fund had an Active Share of 106.3% versus the Russell 2000 and had trailing 12-month turnover of 8%.
We welcome our new investors and thank all of our investors for their continued support. If you have any questions, thoughts or concerns, please contact us at (800) 625-7071 or at cretzler@needhamco.com or jbarr@needhamco.com. For information about the funds, please visit our website at www.needhamfunds.com.
Sincerely,
 |  |
| Chris Retzler | John O. Barr |
| Portfolio Manager | Portfolio Manager |
Fact Sheet Links:
Needham Growth Fund
Needham Aggressive Growth Fund
Needham Small Cap Growth Fund
The information presented in this commentary is not intended as personalized investment advice and does not constitute a recommendation to buy or sell a particular security or other investments. Past performance is no guarantee of future results. The views of the Adviser and the securities described in this report are as of December 31, 2018; these views and portfolio holdings may have changed subsequent to this date. The specific securities discussed may, in aggregate, represent only a small percentage of a Portfolio’s holdings. It should not be assumed that securities identified and discussed were, or will be, profitable, or that the investment decisions made in the future will be profitable, or equal the investment performance of the securities discussed herein. There can be no guarantee as to the accuracy of any outlooks for markets, sectors and securities as discussed herein.
This message is not an offer of the Needham Growth Fund, the Needham Aggressive Growth Fund or the Needham Small Cap Growth Fund. Shares are sold only through the currently effective prospectus. Please read the prospectus carefully and consider the investment objectives, risks, and charges and expenses of the Fund carefully before you invest. The prospectus contains this and other information about the Fund. A copy of the prospectus is available at www.needhamfunds.com or by contacting the Fund’s transfer agent, U.S. Bancorp Fund Services, LLC doing business as U.S. Bank Global Fund Services (“Fund Services”) at 1-800-625-7071.
All three of the Needham Funds have substantial exposure to small and micro capitalized companies. Funds holding smaller capitalized companies are subject to greater price fluctuation than those of larger companies.
Needham & Company, LLC, member FINRA/SIPC, is the distributor of The Needham Funds, Inc.
Portfolio holdings subject to change. Needham Funds’ ownership as a percentage of net assets in the stated securities as of 12/31/18:
| SECURITY | NEEGX | NEAGX | NESGX | SECURITY | NEEGX | NEAGX | NESGX | SECURITY | NEEGX | NEAGX | NESGX |
| PDFS | 5.01% | 7.59% | 6.98% | ZS | 0.00% | 0.00% | 0.08% | TSM | 0.27% | 0.41% | 0.00% |
| ODC | 0.59% | 2.94% | 0.54% | TTMI | 0.00% | 0.00% | 1.58% | UBNT | -5.19% | -4.77% | 0.00% |
| GVP | 0.00% | 5.79% | 0.00% | COHU | 0.00% | 0.00% | 1.96% | CYRX | 0.80% | 1.15% | 0.82% |
| DRT | 0.16% | 3.31% | 0.73% | FIVN | 0.00% | 0.00% | 0.35% | ZUO | 0.72% | 0.45% | 1.43% |
| FORM | 4.88% | 4.65% | 0.79% | IVAC | 0.00% | 0.00% | 0.65% | NVS | 0.00% | 0.00% | 0.00% |
| PLAB | 1.83% | 2.24% | 9.23% | EVBG | 0.65% | 0.63% | 0.46% | AAPL | 0.51% | 7.77% | 0.00% |
| AMBR | 4.39% | 3.32% | 8.68% | WAGE | 0.00% | 0.00% | 0.00% | NVDA | 0.00% | 0.00% | 0.00% |
| EMKR | 0.00% | 0.00% | 5.28% | FEYE | 0.00% | 0.00% | 0.00% | AMD | 0.00% | 0.00% | 0.00% |
| AQ | 0.45% | 0.00% | 4.98% | ORBK | 0.00% | 0.00% | 0.00% | INTC | 0.00% | 0.00% | 0.00% |
| ASPN | 1.11% | 0.87% | 4.28% | MFIN | -1.01% | -2.37% | 0.00% | 005930KRX | 0.00% | 0.00% | 0.00% |
| UCTT | 0.25% | 0.04% | 4.29% | RHT | 0.00% | 0.00% | 0.00% | VICR | 0.88% | 5.23% | 0.00% |
| SMCI | 3.23% | 3.00% | 3.84% | IBM | 0.00% | 0.00% | 0.00% | GOOGL | 0.00% | 0.00% | 0.00% |
| HA | 0.30% | 0.16% | 4.02% | TMO | 9.39% | 0.00% | 0.00% | HIIQ | -0.03% | -0.07% | 0.00% |
| EFII | 1.98% | 0.98% | 3.77% | TTD | 0.97% | 0.71% | 0.00% | IPGP | 0.85% | 1.95% | 0.00% |
| AKTS | 0.00% | 0.00% | 3.23% | GILD | 6.45% | 0.00% | 0.00% | APT | 0.00% | 0.55% | 0.00% |
| FEIM | 0.45% | 0.25% | 3.05% | BMY | 0.00% | 0.00% | 0.00% | NVMI | 1.60% | 3.54% | 0.00% |
The Russell 2000 Index is a broad unmanaged index composed of the smallest 2,000 companies in the Russell 3000 Index. The Russell 3000 Index is a market-capitalization-weighted equity index that provides exposure to the entire U.S. stock market. The Russell 3000 Index tracks the performance of the 3,000 largest U.S.-traded stocks. The Russell 2000 Total Return Index assumes cash distributions, such as dividends, are reinvested back into the index. Please see the disclaimer regarding these indexes under “Supplementary Information—Index Disclaimer” on page [59] of this report.
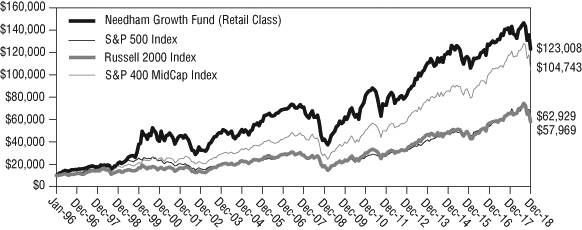
| NEEDHAM GROWTH FUND | Retail Class |
| | Ticker Symbol: NEEGX |
| | Institutional Class |
| | Ticker Symbol: NEEIX |
Comparison of Change in Value of a $10,000 Investment
The chart above assumes an initial gross investment of $10,000 made on January 1, 1996. The Fund’s performance figures are for the year ended December 31, 2018. The Performance data quoted is historical. Past performance is no guarantee of future results. Current performance may be higher or lower than the performance data quoted. The principal value and investment return of an investment will fluctuate so that your shares, when redeemed, may be worth more or less than their original cost. The returns shown do not reflect the deduction of taxes that a shareholder would pay on Fund distributions or on the redemptions of Fund shares. In the absence of fee waivers and reimbursements, when they are necessary to keep expenses at the expense cap, total return would be reduced. Performance figures for periods greater than one year are annualized.
The Global Industry Classification Standard (GICS®) was developed by and/or is the exclusive property of MSCI, Inc. and Standard & Poor Financial Services LLC (“S&P”). GICS is a service mark of MSCI and S&P and has been licensed for use by Fund Services.
Comparative Performance Statistics as of December 31, 2018 (Unaudited)
| | 1 | 5 | 10 | Since |
| | Year | Years | Years | Inception |
Needham Growth Fund Retail Class(1)(2) | -10.26% | 2.14% | 11.25% | 11.53% |
Needham Growth Fund Institutional Class(1)(3) | -9.83% | n/a | n/a | -0.91% |
S&P 500 Index(4)(5) | -4.38% | 8.49% | 13.12% | 8.33%(8) |
S&P 400 MidCap Index(4)(6) | -11.08% | 6.03% | 13.68% | 10.75%(8) |
Russell 2000 Index(4)(7) | -11.01% | 4.41% | 11.97% | 7.94%(8) |
| 1. | Investment results calculated after reinvestment of dividends. |
| 2. | The inception date of the Retail Class was 1/1/96. |
| 3. | The inception date of the Institutional Class was 12/30/16. |
| 4. | It is not possible to invest directly in an index. The performance of the index does not include the deduction of expenses associated with a mutual fund, such as investment management fees. |
| 5. | The S&P 500 Index is a broad unmanaged measure of the U.S. stock market. |
| 6. | The S&P 400 MidCap Index is a broad unmanaged measure of the U.S. stock market. |
| 7. | The Russell 2000 Index is a broad unmanaged index composed of the smallest 2,000 companies in the Russell 3000 Index. |
| 8. | The return shown for the Index is from the Inception date of the Retail Class. |
Top Ten Holdings*
(as a % of total investments,
as of December 31, 2018)
| | | % of Total | |
Security | | Investments | |
| Thermo Fisher Scientific, Inc. | TMO | 9.51% | |
| Gilead Sciences, Inc. | GILD | 6.53% | |
| CarMax, Inc. | KMX | 6.48% | |
| KVH Industries, Inc. | KVHI | 6.08% | |
| Becton Dickinson & Co. | BDX | 5.61% | |
| PDF Solutions, Inc. | PDFS | 5.07% | |
| FormFactor, Inc. | FORM | 4.94% | |
| Entegris, Inc. | ENTG | 4.86% | |
| Comcast Corp., Class A | CMCSA | 4.76% | |
| Amber Road, Inc. | AMBR | 4.45% | |
Top Ten Holdings = 58.29% of Total Investments†
| * | Current portfolio holdings may not be indicative of future portfolio holdings. |
| † | Percentage of total investments less cash. |
Sector Weightings*
(as a % of net investments,
as of December 31, 2018)
Sector | | Long* | | (Short)(1) | | Total(1)(2) | |
| Communication Services | | | 6.0 | % | | — | | | 6.0 | % | |
| Consumer Discretionary | | | 6.9 | % | | — | | | 6.9 | % | |
| Consumer Staples | | | 0.6 | % | | — | �� | | 0.6 | % | |
| Energy | | | 2.2 | % | | — | | | 2.2 | % | |
| Financials | | | 1.0 | % | | (1.1)% | | | (0.1 | )% | |
| Health Care | | | 27.2 | % | | — | | | 27.2 | % | |
| Industrials | | | 3.9 | % | | — | | | 3.9 | % | |
| Information Technology | | | 58.2 | % | | (5.6)% | | | 52.6 | % | |
| Cash | | | 0.7 | % | | — | | | 0.7 | % | |
| * | Current portfolio holdings may not be indicative of future portfolio holdings. |
(1) | Percentage of total investments includes all stocks, plus cash minus all short positions. |
(2) | Total represents the difference between the long exposure and the short exposure, which produces the net exposure. |
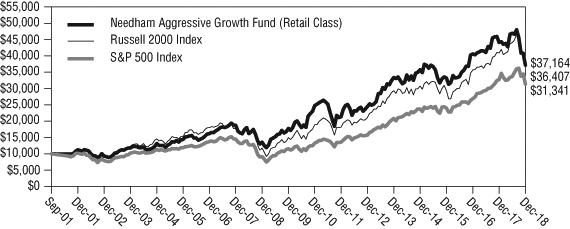
| NEEDHAM AGGRESSIVE GROWTH FUND | Retail Class |
| | Ticker Symbol: NEAGX |
| | Institutional Class |
| | Ticker Symbol: NEAIX |
Comparison of Change in Value of a $10,000 Investment
The chart above assumes an initial gross investment of $10,000 made on September 4, 2001. The Fund’s performance figures are for the year ended December 31, 2018.The Performance data quoted is historical. Past performance is no guarantee of future results. Current performance may be higher or lower than the performance data quoted. The principal value and investment return of an investment will fluctuate so that your shares, when redeemed, may be worth more or less than their original cost. The returns shown do not reflect the deduction of taxes that a shareholder would pay on Fund distributions or on the redemptions of Fund shares. In the absence of fee waivers and reimbursements, when they are necessary to keep expenses at the expense cap, total return would be reduced. Performance figures for periods greater than one year are annualized.
Comparative Performance Statistics as of December 31, 2018 (Unaudited)
| | 1 | 5 | 10 | Since |
| | Year | Years | Years | Inception |
Needham Aggressive Growth Fund Retail Class(1)(2) | -15.80% | 2.18% | 10.62% | 7.87% |
Needham Aggressive Growth Fund Institutional Class(1)(3) | -15.36% | n/a | n/a | -3.78% |
S&P 500 Index(4)(5) | -4.38% | 8.49% | 13.12% | 6.82%(7) |
Russell 2000 Index(4)(6) | -11.01% | 4.41% | 11.97% | 7.74%(7) |
| 1. | Investment results calculated after reinvestment of dividends. |
| 2. | The inception date of the Retail Class was 9/4/01. |
| 3. | The inception date of the Institutional Class was 12/30/16. |
| 4. | It is not possible to invest directly in an index. The performance of the index does not include the deduction of expenses associated with a mutual fund, such as investment management fees. |
| 5. | The S&P 500 Index is a broad unmanaged measure of the U.S. stock market. |
| 6. | The Russell 2000 Index is a broad unmanaged index composed of the smallest 2,000 companies in the Russell 3000 Index. |
| 7. | The return shown for the Index is from the Inception date of the Retail Class. |
Top Ten Holdings*
(as a % of total investments,
as of December 31, 2018)
| | | % of Total | |
Security | | Investments | |
| Entegris, Inc. | ENTG | 10.59% | |
| KVH Industries, Inc. | KVHI | 9.19% | |
| Apple, Inc. | AAPL | 7.63% | |
| PDF Solutions, Inc. | PDFS | 7.45% | |
| GSE Systems, Inc. | GVP | 5.69% | |
| Vicor Corp. | VICR | 5.14% | |
| FormFactor, Inc. | FORM | 4.57% | |
| Akamai Technologies, Inc. | AKAM | 4.06% | |
| MKS Instruments, Inc. | MKSI | 3.59% | |
| Nova Measuring | | | |
| Instruments, Ltd. (Israel) | NVMI | 3.47% | |
Top Ten Holdings = 61.38% of Total Investments†
| * | Current portfolio holdings may not be indicative of future portfolio holdings. |
| † | Percentage of total investments less cash. |
Sector Weightings*
(as a % of net investments,
as of December 31, 2018)
Sector | | Long* | | (Short)(1) | | | Total(1)(2) | |
| Communication Services | | | 1.0 | % | | — | | | | 1.0 | % | |
| Consumer Discretionary | | | 3.5 | % | | — | | | | 3.5 | % | |
| Consumer Staples | | | 3.1 | % | | — | | | | 3.1 | % | |
| Energy | | | 0.9 | % | | — | | | | 0.9 | % | |
| Financials | | | 0.5 | % | | (2.6)% | | | | (2.1 | )% | |
| Health Care | | | 5.1 | % | | — | | | | 5.1 | % | |
| Industrials | | | 11.6 | % | | — | | | | 11.6 | % | |
| Information Technology | | | 80.1 | % | | (5.0)% | | | | 75.1 | % | |
| Real Estate | | | 1.8 | % | | — | | | | 1.8 | % | |
| * | Current portfolio holdings may not be indicative of future portfolio holdings. |
(1) | Percentage of total investments includes all stocks, plus cash minus all short positions. |
(2) | Total represents the difference between the long exposure and the short exposure, which produces the net exposure. |
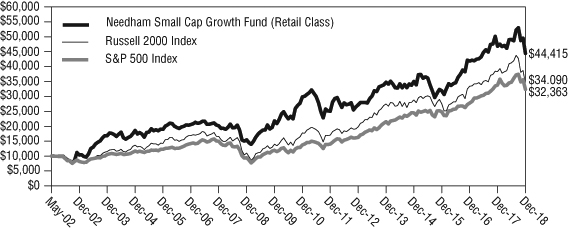
| NEEDHAM SMALL CAP GROWTH FUND | Retail Class |
| | Ticker Symbol: NESGX |
| | Institutional Class |
| | Ticker Symbol: NESIX |
Comparison of Change in Value of a $10,000 Investment
The chart above assumes an initial gross investment of $10,000 made on May 22, 2002. The Fund’s performance figures are for the year ended December 31, 2018.The Performance data quoted is historical. Past performance is no guarantee of future results. Current performance may be higher or lower than the performance data quoted. The principal value and investment return of an investment will fluctuate so that your shares, when redeemed, may be worth more or less than their original cost. The returns shown do not reflect the deduction of taxes that a shareholder would pay on Fund distributions or on the redemptions of Fund shares. In the absence of fee waivers and reimbursements, when they are necessary to keep expenses at the expense cap, total return would be reduced. Performance figures for periods greater than one year are annualized.
Comparative Performance Statistics as of December 31, 2018 (Unaudited)
| | 1 | 5 | 10 | Since |
| | Year | Years | Years | Inception |
Needham Small Cap Growth Fund Retail Class(1)(2) | -5.07% | 5.03% | 11.15% | 9.39% |
Needham Small Cap Growth Fund Institutional Class(1)(3) | -4.32% | n/a | n/a | 3.60% |
S&P 500 Index(4)(5) | -4.38% | 8.49% | 13.12% | 7.33%(7) |
Russell 2000 Index(4)(6) | -11.01% | 4.41% | 11.97% | 7.66%(7) |
| 1. | Investment results calculated after reinvestment of dividends. |
| 2. | The inception date of the Retail Class was 5/22/02. |
| 3. | The inception date of the Institutional Class was 12/30/16. |
| 4. | It is not possible to invest directly in an index. The performance of the index does not include the deduction of expenses associated with a mutual fund, such as investment management fees. |
| 5. | The S&P 500 Index is a broad unmanaged measure of the U.S. stock market. |
| 6. | The Russell 2000 Index is a broad unmanaged index composed of the smallest 2,000 companies in the Russell 3000 Index. |
| 7. | The return shown for the Index is from the Inception date of the Retail Class. |
Top Ten Holdings*
(as a % of total investments,
as of December 31, 2018)
| | | % of Total | |
Security | | Investments | |
| Photronics, Inc. | PLAB | 9.49% | |
| Amber Road, Inc. | AMBR | 8.93% | |
| PDF Solutions, Inc. | PDFS | 7.18% | |
| EMCORE Corp. | EMKR | 5.43% | |
| Aquantia Corp. | AQ | 5.12% | |
| Ultra Clean Holdings, Inc. | UCTT | 4.42% | |
| Aspen Aerogels, Inc. | ASPN | 4.40% | |
| Hawaiian Holdings, Inc. | HA | 4.13% | |
| Super Micro Computer, Inc. | SMCI | 3.95% | |
| Electronics for Imaging, Inc. | EFII | 3.88% | |
Top Ten Holdings = 56.93% of Total Investments†
| * | Current portfolio holdings may not be indicative of future portfolio holdings. |
| † | Percentage of total investments less cash. |
Sector Weightings*
(as a % of net investments,
as of December 31, 2018)
Sector | Long* | (Short)(1) | Total(1)(2) | |
| Closed-End Funds | 4.4% | — | 4.4% | |
| Consumer Discretionary | 1.7% | — | 1.7% | |
| Consumer Staples | 0.5% | — | 0.5% | |
| Energy | 8.0% | — | 8.0% | |
| Financials | 0.4% | — | 0.4% | |
| Health Care | 4.1% | — | 4.1% | |
| Industrials | 6.4% | — | 6.4% | |
| Information Technology | 69.6% | — | 69.6% | |
| Cash | 4.9% | — | 4.9% | |
| * | Current portfolio holdings may not be indicative of future portfolio holdings. |
(1) | Percentage of total investments includes all stocks, plus cash minus all short positions. |
(2) | Total represents the difference between the long exposure and the short exposure, which produces the net exposure. |
Disclosure of Fund Expenses (Unaudited)
The following expense table is shown so that you can understand the impact of fees on your investment. All mutual funds have operating expenses. As a shareholder of a Portfolio, you incur transactional costs, including redemption fees and ongoing costs, which include costs for portfolio management, administrative services, and shareholder reports, among others. A Portfolio’s expenses are expressed as a percentage of its average net assets. This figure is known as the expense ratio. The following examples are intended to help you understand the ongoing costs (in dollars) of investing in each Portfolio and to compare these costs with those of other mutual funds. The examples are based on an investment of $1,000 made at the beginning of a six-month period and held for the entire period. The expense example table below illustrates your fund’s cost in two ways:
| • | Actual Expenses. This section helps you to estimate the actual expenses after fee waivers that you paid over the period. The “Ending Account Value” shown is derived from the Portfolio’s actual return, and “Expenses Paid During Period” shows the dollar amount that would have been paid by an investor who started with $1,000 in the Portfolio. You may use the information here, together with the amount you invested, to estimate the expenses that you paid over the period. To do so, simply divide your account value by $1,000 (for example, an $8,600 account value divided by $1,000 = 8.6), then multiply the result by the number given for your Portfolio under the heading entitled “Expenses Paid During Period”. |
| | |
| • | Hypothetical Expenses on a 5% Return. This section is intended to help you compare your Portfolio’s costs with those of other mutual funds. It assumes that the Portfolio had a return of 5% before expenses during the period shown, but that the expense ratio is unchanged. In this case, because the return used is not the Portfolio’s actual return, the results do not apply to your investment. The example is useful in making comparisons because the Securities and Exchange Commission requires all mutual funds to calculate expenses based on a 5% return. You can assess your Portfolio’s cost by comparing this hypothetical example with the hypothetical examples that appear in shareholders reports of other funds. |
Please note that the expenses shown in the table are meant to highlight your ongoing costs only and do not reflect any transactional costs, such as redemption fees or exchange fees. Therefore, the table is useful in comparing ongoing costs only, and will not help you determine the relative total costs of owning different funds. In addition, if these transactional costs were included, your costs would have been higher.
For the Period July 1, 2018 to December 31, 2018
Expense Example Table
| | Beginning | Ending | Expenses Paid | Expense Ratio | |
| | Account | Account | During Period* | During Period* | |
| | Value | Value | 7/1/18 – | 7/1/18 – | |
| | 7/1/18 | 12/31/18 | 12/31/18 | 12/31/18 | |
| Needham Growth Fund | | | | | |
| Retail Class Actual Expenses | $1,000.00 | $ 867.10 | $11.95 | 2.54% | |
| Retail Class Hypothetical Example | | | | | |
| for Comparison Purposes | | | | | |
| (5% return before expenses) | $1,000.00 | $1,012.40 | $12.88 | 2.54% | |
| Institutional Class Actual Expenses | $1,000.00 | $ 869.30 | $ 9.38 | 1.99% | |
| Institutional Class Hypothetical | | | | | |
| Example for Comparison Purposes | | | | | |
| (5% return before expenses) | $1,000.00 | $1,015.17 | $10.11 | 1.99% | |
| | | | | | |
| Needham Aggressive Growth Fund | | | | | |
| Retail Class Actual Expenses | $1,000.00 | $ 791.90 | $11.79 | 2.61% | |
| Retail Class Hypothetical Example | | | | | |
| for Comparison Purposes | | | | | |
| (5% return before expenses) | $1,000.00 | $1,012.05 | $13.24 | 2.61% | |
| Institutional Class Actual Expenses | $1,000.00 | $ 793.80 | $9.31 | 2.06% | |
| Institutional Class Hypothetical | | | | | |
| Example for Comparison Purposes | | | | | |
| (5% return before expenses) | $1,000.00 | $1,014.82 | $10.46 | 2.06% | |
| | | | | | |
| Needham Small Cap Growth Fund | | | | | |
| Retail Class Actual Expenses | $1,000.00 | $ 904.80 | $ 9.36 | 1.95% | |
| Retail Class Hypothetical Example | | | | | |
| for Comparison Purposes | | | | | |
| (5% return before expenses) | $1,000.00 | $1,015.38 | $ 9.91 | 1.95% | |
| Institutional Class Actual Expenses | $1,000.00 | $ 907.60 | $ 6.73 | 1.40% | |
| Institutional Class Hypothetical | | | | | |
| Example for Comparison Purposes | | | | | |
| (5% return before expenses) | $1,000.00 | $1,018.15 | $ 7.12 | 1.40% | |
| * | Expenses are equal to the average account value times the Portfolio’s annualized expense ratio multiplied 184/365 (to reflect the one-half-year period). |
Needham Growth Fund
Schedule of Investments
December 31, 2018
| | | Shares | | | Value | |
| (Percentage of Net Assets) | | | | | | |
| | | | | | | |
| Common Stocks (98.8%) | | | | | | |
| | | | | | | |
| Airlines (0.3%) | | | | | | |
| Hawaiian Holdings, Inc. | | | 9,500 | | | $ | 250,895 | |
| | | | | | | | | |
| Biotechnology (6.5%) | | | | | | | | |
| Gilead Sciences, Inc. (c) | | | 86,000 | | | | 5,379,300 | |
| | | | | | | | | |
| Capital Markets (1.0%) | | | | | | | | |
| Oaktree Capital Group LLC, Class A | | | 20,000 | | | | 795,000 | |
| | | | | | | | | |
| Commercial Services & Supplies (0.1%) | | | | | | | | |
| Clean Harbors, Inc. (a) | | | 1,500 | | | | 74,025 | |
| | | | | | | | | |
| Communications Equipment (9.3%) | | | | | | | | |
| KVH Industries, Inc. (a) | | | 486,850 | | | | 5,009,687 | |
| ViaSat, Inc. (a)(c) | | | 47,200 | | | | 2,782,440 | |
| | | | | | | | 7,792,127 | |
| Diversified Manufacturing (0.2%) | | | | | | | | |
| DIRTT Environmental Solutions (Canada) (a) | | | 30,000 | | | | 134,266 | |
| | | | | | | | | |
| Electrical Equipment (0.9%) | | | | | | | | |
| Vicor Corp. (a) | | | 19,500 | | | | 736,905 | |
| | | | | | | | | |
| Electronic Equipment, Instruments & Components (5.5%) | | | | | | | | |
| Corning, Inc. | | | 35,000 | | | | 1,057,350 | |
| FLIR Systems, Inc. | | | 8,500 | | | | 370,090 | |
| Frequency Electronics, Inc. (a) | | | 35,200 | | | | 373,120 | |
| IPG Photonics Corp. (a) | | | 6,250 | | | | 708,063 | |
| National Instruments Corp. | | | 20,000 | | | | 907,600 | |
| nLight, Inc. (a) | | | 3,500 | | | | 62,230 | |
| Vishay Intertechnology, Inc. | | | 60,000 | | | | 1,080,600 | |
| | | | | | | | 4,559,053 | |
| Energy Equipment & Services (1.6%) | | | | | | | | |
| Aspen Aerogels, Inc. (a) | | | 434,050 | | | | 924,526 | |
| Core Laboratories NV (Netherlands) | | | 1,000 | | | | 59,660 | |
| Schlumberger, Ltd. (Curacao) | | | 10,000 | | | | 360,800 | |
| | | | | | | | 1,344,986 | |
See accompanying notes to financial statements.
Needham Growth Fund
Schedule of Investments (Continued)
December 31, 2018
| | | Shares | | | Value | |
| Common Stocks – Continued | | | | | | |
| | | | | | | |
| Entertainment (0.9%) | | | | | | |
| World Wrestling Entertainment, Inc., Class A | | | 9,500 | | | $ | 709,840 | |
| | | | | | | | | |
| Health Care Equipment & Supplies (8.9%) | | | | | | | | |
| Becton Dickinson & Co. | | | 20,500 | | | | 4,619,060 | |
| CryoPort, Inc. (a) | | | 60,150 | | | | 663,454 | |
| GenMark Diagnostics, Inc. (a) | | | 32,000 | | | | 155,520 | |
| Medtronic PLC (Ireland) | | | 22,000 | | | | 2,001,120 | |
| | | | | | | | 7,439,154 | |
| Health Care Providers & Services (0.6%) | | | | | | | | |
| Laboratory Corp. of America Holdings (a) | | | 2,000 | | | | 252,720 | |
| Quest Diagnostics, Inc. | | | 3,000 | | | | 249,810 | |
| | | | | | | | 502,530 | |
| Household Products (0.6%) | | | | | | | | |
| Oil-Dri Corp. of America | | | 18,500 | | | | 490,250 | |
| | | | | | | | | |
| Industrial Conglomerates (0.4%) | | | | | | | | |
| Honeywell International, Inc. | | | 2,500 | | | | 330,300 | |
| | | | | | | | | |
| Interactive Media & Services (0.0%) | | | | | | | | |
| Eventbrite, Inc. (a) | | | 1,000 | | | | 27,810 | |
| | | | | | | | | |
| IT Services (2.7%) | | | | | | | | |
| Akamai Technologies, Inc. (a)(c) | | | 36,500 | | | | 2,229,420 | |
| | | | | | | | | |
| Life Sciences Tools & Services (9.4%) | | | | | | | | |
| Thermo Fisher Scientific, Inc (c) | | | 35,000 | | | | 7,832,650 | |
| | | | | | | | | |
| Media (4.7%) | | | | | | | | |
| Comcast Corp., Class A | | | 115,000 | | | | 3,915,750 | |
| | | | | | | | | |
| Oil, Gas & Consumable Fuels (0.4%) | | | | | | | | |
| Hess Corp. | | | 7,500 | | | | 303,750 | |
| Navigator Holdings, Ltd. (Marshall Islands) (a) | | | 6,000 | | | | 56,400 | |
| | | | | | | | 360,150 | |
| Semiconductors & Semiconductor Equipment (21.7%) | | | | | | | | |
| Applied Materials, Inc. | | | 7,500 | | | | 245,550 | |
| Aquantia Corp. (a) | | | 42,500 | | | | 372,725 | |
| Entegris, Inc. | | | 143,500 | | | | 4,002,932 | |
See accompanying notes to financial statements.
Needham Growth Fund
Schedule of Investments (Continued)
December 31, 2018
| | | Shares | | | Value | |
| Common Stocks – Continued | | | | | | |
| | | | | | | |
| Semiconductors & Semiconductor Equipment – Continued | | | | | | |
| FormFactor, Inc. (a) | | | 288,750 | | | $ | 4,068,488 | |
| Lam Research Corp. | | | 2,500 | | | | 340,425 | |
| MKS Instruments, Inc. | | | 25,000 | | | | 1,615,250 | |
| Nova Measuring Instruments, Ltd. (Israel) (a) | | | 58,500 | | | | 1,332,630 | |
| PDF Solutions, Inc. (a) | | | 495,400 | | | | 4,176,222 | |
| Photronics, Inc. (a) | | | 157,500 | | | | 1,524,600 | |
| Taiwan Semiconductor Manufacturing | | | | | | | | |
| Co., Ltd. (Taiwan) – ADR | | | 6,000 | | | | 221,460 | |
| Ultra Clean Holdings, Inc. (a) | | | 25,000 | | | | 211,750 | |
| | | | | | | | 18,112,032 | |
| Software (9.2%) | | | | | | | | |
| The Trade Desk, Inc., Class A (a) | | | 7,000 | | | | 812,420 | |
| 2U, Inc. (a) | | | 4,000 | | | | 198,880 | |
| Altair Engineering, Inc., Class A (a) | | | 2,996 | | | | 82,630 | |
| Amber Road, Inc. (a) | | | 445,000 | | | | 3,662,350 | |
| Appian Corp., Class A (a) | | | 10,000 | | | | 267,100 | |
| Coupa Software, Inc. (a) | | | 4,800 | | | | 301,728 | |
| Everbridge, Inc. (a) | | | 9,500 | | | | 539,220 | |
| Pluralsight, Inc. (a) | | | 6,000 | | | | 141,300 | |
| Q2 Holdings, Inc. (a) | | | 20,000 | | | | 991,000 | |
| Tenable Holdings, Inc. (a) | | | 5,000 | | | | 110,950 | |
| Zuora, Inc. (a) | | | 33,000 | | | | 598,620 | |
| | | | | | | | 7,706,198 | |
| Specialty Retail (6.4%) | | | | | | | | |
| CarMax, Inc. (a)(c) | | | 85,000 | | | | 5,332,050 | |
| | | | | | | | | |
| Technology Hardware, Storage & Peripherals (5.7%) | | | | | | | | |
| Apple, Inc. | | | 2,700 | | | | 425,898 | |
| Electronics for Imaging, Inc. (a) | | | 66,500 | | | | 1,649,200 | |
| Super Micro Computer, Inc. (a) | | | 195,000 | | | | 2,691,000 | |
| | | | | | | | 4,766,098 | |
| Trading Companies & Distributors (1.8%) | | | | | | | | |
| Air Lease Corp., Class A | | | 50,000 | | | | 1,510,500 | |
| | | | | | | | | |
| Total Common Stocks | | | | | | | | |
| (Cost $42,296,082) | | | | | | $ | 82,331,289 | |
See accompanying notes to financial statements.
Needham Growth Fund
Schedule of Investments (Continued)
December 31, 2018
| | | Shares | | | Value | |
| Short-Term Investments (0.6%) | | | | | | |
| | | | | | | |
| Money Market Fund (0.6%) | | | | | | |
| Dreyfus Treasury Securities Cash Management – | | | | | | |
| Institutional Class 2.20% (b) | | | | | | |
| | | | | | | |
| Total Short Term Investments | | | | | | |
| (Cost $536,118) | | | 536,118 | | | $ | 536,118 | |
| | | | | | | | | |
| Total Investments (99.4%) | | | | | | | | |
| (Cost $42,832,200) | | | | | | | 82,867,407 | |
| Total Securities Sold Short (-6.2%) | | | | | | | (5,195,265 | ) |
| (Proceeds $1,624,399) | | | | | | | | |
| Other Assets in Excess of Liabilities (6.8%) | | | | | | | 5,721,595 | |
| Total Net Assets (100.0%) | | | | | | $ | 83,393,737 | |
Percentages are stated as a percent of net assets.
| (a) | Non-income producing security. |
| (b) | Rate shown is the seven-day yield as of December 31, 2018. |
| (c) | Security position is either entirely or partially held in a segregated account as collateral for securities sold short, aggregating a total market value of $5,665,150. |
See accompanying notes to financial statements.
Needham Growth Fund
Schedule of Securities Sold Short
December 31, 2018
| | | Shares | | | Value | |
| Securities Sold Short (-6.2%) | | | | | | |
| | | | | | | |
| Communications Equipment (-5.2%) | | | | | | |
| Ubiquiti Networks, Inc. | | | 43,500 | | | $ | 4,324,335 | |
| | | | | | | | | |
| Consumer Finance (-1.0%) | | | | | | | | |
| Medallion Financial Corp. (a) | | | 180,000 | | | | 844,200 | |
| | | | | | | | | |
| Insurance (0.0%) | | | | | | | | |
| Health Insurance Innovations, Inc., Class A (a) | | | 1,000 | | | | 26,730 | |
| | | | | | | | | |
| Total Securities Sold Short | | | | | | | | |
| (Proceeds $1,624,399) | | | | | | $ | 5,195,265 | |
| (a) | Non-income producing security. |
See accompanying notes to financial statements.
Needham Aggressive Growth Fund
Schedule of Investments
December 31, 2018
| | | Shares | | | Value | |
| (Percentage of Net Assets) | | | | | | |
| | | | | | | |
| Common Stocks (101.6%) | | | | | | |
| | | | | | | |
| Airlines (0.2%) | | | | | | |
| Hawaiian Holdings, Inc. | | | 2,500 | | | $ | 66,025 | |
| | | | | | | | | |
| Building Products (0.5%) | | | | | | | | |
| Alpha Pro Tech, Ltd. (a) | | | 59,843 | | | | 222,018 | |
| | | | | | | | | |
| Commercial Services & Supplies (1.0%) | | | | | | | | |
| Ecology and Environment, Inc., Class A | | | 34,100 | | | | 386,694 | |
| | | | | | | | | |
| Communications Equipment (9.6%) | | | | | | | | |
| KVH Industries, Inc. (a)(b) | | | 369,400 | | | | 3,801,126 | |
| ViaSat, Inc. (a) | | | 1,800 | | | | 106,110 | |
| | | | | | | | 3,907,236 | |
| Diversified Manufacturing (3.3%) | | | | | | | | |
| DIRTT Environmental Solutions (Canada) (a) | | | 300,000 | | | | 1,342,660 | |
| | | | | | | | | |
| Electrical Equipment (5.2%) | | | | | | | | |
| Vicor Corp. (a) | | | 56,227 | | | | 2,124,818 | |
| | | | | | | | | |
| Electronic Equipment, Instruments & Components (3.8%) | | | | | | | | |
| Frequency Electronics, Inc. (a) | | | 9,500 | | | | 100,700 | |
| II-VI, Inc. (a) | | | 500 | | | | 16,230 | |
| IPG Photonics Corp. (a) | | | 7,000 | | | | 793,030 | |
| National Instruments Corp. | | | 8,000 | | | | 363,040 | |
| nLight, Inc. (a) | | | 1,523 | | | | 27,079 | |
| Vishay Precision Group, Inc. (a) | | | 7,500 | | | | 226,725 | |
| | | | | | | | 1,526,804 | |
| Energy Equipment & Services (0.9%) | | | | | | | | |
| Aspen Aerogels, Inc. (a) | | | 165,450 | | | | 352,409 | |
| | | | | | | | | |
| Entertainment (0.8%) | | | | | | | | |
| World Wrestling Entertainment, Inc., Class A | | | 4,500 | | | | 336,240 | |
| | | | | | | | | |
| Health Care Equipment & Supplies (3.0%) | | | | | | | | |
| Becton Dickinson & Co. | | | 750 | | | | 168,990 | |
| CryoPort, Inc. (a) | | | 42,500 | | | | 468,775 | |
| LeMaitre Vascular, Inc. | | | 25,000 | | | | 591,000 | |
| | | | | | | | 1,228,765 | |
See accompanying notes to financial statements.
Needham Aggressive Growth Fund
Schedule of Investments (Continued)
December 31, 2018
| | | Shares | | | Value | |
| Common Stocks – Continued | | | | | | |
| | | | | | | |
| Health Care Providers & Services (0.5%) | | | | | | |
| Laboratory Corp. of America Holdings (a) | | | 500 | | | $ | 63,180 | |
| Quest Diagnostics, Inc. | | | 1,500 | | | | 124,905 | |
| | | | | | | | 188,085 | |
| Health Care Technology (1.4%) | | | | | | | | |
| Omnicell, Inc. (a) | | | 9,000 | | | | 551,160 | |
| | | | | | | | | |
| Household Durables (0.1%) | | | | | | | | |
| iRobot Corp. (a) | | | 500 | | | | 41,870 | |
| | | | | | | | | |
| Household Products (2.9%) | | | | | | | | |
| Oil-Dri Corp. of America | | | 45,000 | | | | 1,192,500 | |
| | | | | | | | | |
| Insurance (0.4%) | | | | | | | | |
| Markel Corp. (a) | | | 175 | | | | 181,659 | |
| | | | | | | | | |
| Interactive Media & Services (0.1%) | | | | | | | | |
| Eventbrite, Inc. (a) | | | 1,500 | | | | 41,715 | |
| | | | | | | | | |
| IT Services (4.1%) | | | | | | | | |
| Akamai Technologies, Inc. (a)(b) | | | 27,500 | | | | 1,679,700 | |
| | | | | | | | | |
| Professional Services (0.5%) | | | | | | | | |
| CRA International, Inc. | | | 5,000 | | | | 212,750 | |
| | | | | | | | | |
| Real Estate Investment Trusts (REITs) (1.7%) | | | | | | | | |
| Equinix, Inc. | | | 2,000 | | | | 705,120 | |
| | | | | | | | | |
| Semiconductors & Semiconductor Equipment (32.9%) (c) | | | | | | | | |
| Entegris, Inc. | | | 157,000 | | | | 4,379,515 | |
| FormFactor, Inc. (a) | | | 134,000 | | | | 1,888,060 | |
| Ichor Holdings, Ltd. (Cayman Islands) (a) | | | 1,000 | | | | 16,300 | |
| MKS Instruments, Inc. | | | 23,000 | | | | 1,486,030 | |
| Nova Measuring Instruments, Ltd. (Israel) (a)(b) | | | 63,000 | | | | 1,435,140 | |
| PDF Solutions, Inc. (a)(b) | | | 365,500 | | | | 3,081,165 | |
| Photronics, Inc. (a) | | | 93,750 | | | | 907,500 | |
| Taiwan Semiconductor Manufacturing | | | | | | | | |
| Co., Ltd. (Taiwan) – ADR | | | 4,500 | | | | 166,095 | |
| Ultra Clean Holdings, Inc. (a) | | | 2,000 | | | | 16,940 | |
| | | | | | | | 13,376,745 | |
See accompanying notes to financial statements.
Needham Aggressive Growth Fund
Schedule of Investments (Continued)
December 31, 2018
| | | Shares | | | Value | |
| Common Stocks – Continued | | | | | | |
| | | | | | | |
| Software (13.6%) | | | | | | |
| The Trade Desk, Inc., Class A (a) | | | 2,500 | | | $ | 290,150 | |
| 2U, Inc. (a) | | | 2,000 | | | | 99,440 | |
| Altair Engineering, Inc., Class A (a) | | | 1,000 | | | | 27,580 | |
| Amber Road, Inc. (a)(b) | | | 163,550 | | | | 1,346,016 | |
| Appian Corp., Class A (a) | | | 5,500 | | | | 146,905 | |
| Carbon Black, Inc. (a) | | | 1,500 | | | | 20,130 | |
| Coupa Software, Inc. (a) | | | 1,200 | | | | 75,432 | |
| Everbridge, Inc. (a) | | | 4,500 | | | | 255,420 | |
| GSE Systems, Inc. (a)(d) | | | 1,120,000 | | | | 2,352,000 | |
| Pluralsight, Inc. (a) | | | 4,000 | | | | 94,200 | |
| Q2 Holdings, Inc. (a) | | | 12,000 | | | | 594,600 | |
| Tenable Holdings, Inc. (a) | | | 2,000 | | | | 44,380 | |
| Zuora, Inc. (a) | | | 10,000 | | | | 181,400 | |
| | | | | | | | 5,527,653 | |
| Specialty Retail (3.2%) | | | | | | | | |
| CarMax, Inc. (a)(b) | | | 20,500 | | | | 1,285,965 | |
| | | | | | | | | |
| Technology Hardware, Storage & Peripherals (11.8%) | | | | | | | | |
| Apple, Inc. (b) | | | 20,000 | | | | 3,154,800 | |
| Electronics for Imaging, Inc. (a) | | | 16,000 | | | | 396,800 | |
| Super Micro Computer, Inc. (a)(b) | | | 88,350 | | | | 1,219,230 | |
| | | | | | | | 4,770,830 | |
See accompanying notes to financial statements.
Needham Aggressive Growth Fund
Schedule of Investments (Continued)
December 31, 2018
| | | Shares | | | Value | |
| Common Stocks – Continued | | | | | | |
| | | | | | | |
| Trading Companies & Distributors (0.2%) | | | | | | |
| Air Lease Corp., Class A | | | 3,000 | | | $ | 90,630 | |
| | | | | | | | | |
| Total Common Stocks | | | | | | | | |
| (Cost $23,318,969) | | | | | | $ | 41,340,051 | |
| | | | | | | | | |
| Total Investments (101.8%) | | | | | | | | |
| (Cost $23,318,969) | | | | | | | 41,340,051 | |
| Total Securities Sold Short (-7.2%) | | | | | | | (2,926,675 | ) |
| (Proceeds $1,142,432) | | | | | | | | |
| Other Assets in Excess of Liabilities (5.4%) | | | | | | | 2,184,037 | |
| Total Net Assets (100.0%) | | | | | | $ | 40,597,413 | |
Percentages are stated as a percent of net assets.
| (a) | Non-income producing security. |
| (b) | Security position is either entirely or partially held in a segregated account as collateral for securities sold short, aggregating a total market value of $4,678,877. |
| (c) | As of December 31, 2018, the Fund had a significant portion of its assets invested in the Semiconductors and Semiconductor Equipment industry. |
| (d) | Affiliated security. Please refer to Note 11 of the Financial Statements. |
| ADR | American Depositary Receipt |
See accompanying notes to financial statements.
Needham Aggressive Growth Fund
Schedule of Securities Sold Short
December 31, 2018
| | | Shares | | | Value | |
| Securities Sold Short (-7.2%) | | | | | | |
| | | | | | | |
| Communications Equipment (-4.8%) | | | | | | |
| Ubiquiti Networks, Inc. | | | 19,500 | | | $ | 1,938,495 | |
| | | | | | | | | |
| Consumer Finance (-2.3%) | | | | | | | | |
| Medallion Financial Corp. (a) | | | 205,000 | | | | 961,450 | |
| | | | | | | | | |
| Insurance (-0.1%) | | | | | | | | |
| Health Insurance Innovations, Inc., Class A (a) | | | 1,000 | | | | 26,730 | |
| | | | | | | | | |
| Total Securities Sold Short | | | | | | | | |
| (Proceeds $1,142,432) | | | | | | $ | 2,926,675 | |
| (a) | Non-income producing security. |
See accompanying notes to financial statements.
Needham Small Cap Growth Fund
Schedule of Investments
December 31, 2018
| | | Shares | | | Value | |
| (Percentage of Net Assets) | | | | | | |
| | | | | | | |
| Common Stocks (92.7%) | | | | | | |
| | | | | | | |
| Airlines (4.0%) | | | | | | |
| Hawaiian Holdings, Inc. | | | 37,500 | | | $ | 990,375 | |
| | | | | | | | | |
| Biotechnology (0.4%) | | | | | | | | |
| Exact Sciences Corp. (a) | | | 1,000 | | | | 63,100 | |
| | | | | | | | | |
| Communications Equipment (8.8%) | | | | | | | | |
| EMCORE Corp. (a) | | | 310,000 | | | | 1,302,000 | |
| KVH Industries, Inc. (a)(b) | | | 37,591 | | | | 386,811 | |
| Quantenna Communications, Inc. (a) | | | 12,500 | | | | 179,375 | |
| ViaSat, Inc. (a) | | | 5,000 | | | | 294,750 | |
| | | | | | | | 2,162,936 | |
| Diversified Manufacturing (0.7%) | | | | | | | | |
| DIRTT Environmental Solutions (Canada) (a) | | | 40,000 | | | | 179,021 | |
| | | | | | | | | |
| Electronic Equipment, Instruments & Components (10.6%) | | | | | | | | |
| Akoustis Technologies, Inc. (a) | | | 160,000 | | | | 795,200 | |
| Coherent, Inc. (a) | | | 1,500 | | | | 158,565 | |
| Frequency Electronics, Inc. (a) | | | 71,000 | | | | 752,600 | |
| II-VI, Inc. (a) | | | 15,000 | | | | 486,900 | |
| TTM Technologies, Inc. (a) | | | 40,000 | | | | 389,200 | |
| Vishay Precision Group, Inc. (a) | | | 1,000 | | | | 30,230 | |
| | | | | | | | 2,612,695 | |
| Energy Equipment & Services (6.1%) | | | | | | | | |
| Aspen Aerogels, Inc. (a) | | | 495,450 | | | | 1,055,308 | |
| Core Laboratories NV (Netherlands) | | | 5,000 | | | | 298,300 | |
| Schlumberger, Ltd. (Curacao) | | | 4,000 | | | | 144,320 | |
| | | | | | | | 1,497,928 | |
| Health Care Equipment & Supplies (3.7%) | | | | | | | | |
| CryoPort, Inc. (a) | | | 18,350 | | | | 202,401 | |
| GenMark Diagnostics, Inc. (a) | | | 148,500 | | | | 721,710 | |
| | | | | | | | 924,111 | |
| Household Durables (1.2%) | | | | | | | | |
| Roku, Inc., Class A (a) | | | 10,000 | | | | 306,400 | |
| | | | | | | | | |
| Household Products (0.5%) | | | | | | | | |
| Oil-Dri Corp. of America | | | 5,000 | | | | 132,500 | |
See accompanying notes to financial statements.
Needham Small Cap Growth Fund
Schedule of Investments (Continued)
December 31, 2018
| | | Shares | | | Value | |
| Common Stocks – Continued | | | | | | |
| | | | | | | |
| IT Services (0.2%) | | | | | | |
| Twilio, Inc., Class A (a) | | | 500 | | | $ | 44,650 | |
| | | | | | | | | |
| Oil, Gas & Consumable Fuels (2.1%) | | | | | | | | |
| Hess Corp. | | | 2,250 | | | | 91,125 | |
| Navigator Holdings, Ltd. (Marshall Islands) (a) | | | 45,000 | | | | 423,000 | |
| | | | | | | | 514,125 | |
| Pharmaceuticals (0.2%) | | | | | | | | |
| Agile Therapeutics, Inc. (a) | | | 80,000 | | | | 46,072 | |
| | | | | | | | | |
| Semiconductors & Semiconductor Equipment (32.2%) (d) | | | | | | | | |
| Aquantia Corp. (a) | | | 140,000 | | | | 1,227,800 | |
| Cohu, Inc. | | | 30,000 | | | | 482,100 | |
| Entegris, Inc. | | | 4,500 | | | | 125,527 | |
| FormFactor, Inc. (a)(b) | | | 13,750 | | | | 193,738 | |
| Ichor Holdings, Ltd. (Cayman Islands) (a) | | | 13,000 | | | | 211,900 | |
| MKS Instruments, Inc. | | | 5,000 | | | | 323,050 | |
| NeoPhotonics Corp. (a) | | | 1,000 | | | | 6,480 | |
| PDF Solutions, Inc. (a)(b) | | | 204,000 | | | | 1,719,720 | |
| Photronics, Inc. (a) | | | 235,000 | | | | 2,274,800 | |
| Rudolph Technologies, Inc. (a) | | | 15,500 | | | | 317,285 | |
| Ultra Clean Holdings, Inc. (a) | | | 125,000 | | | | 1,058,750 | |
| | | | | | | | 7,941,150 | |
| Software (11.0%) | | | | | | | | |
| Amber Road, Inc. (a)(b) | | | 260,000 | | | | 2,139,800 | |
| Everbridge, Inc. (a) | | | 2,000 | | | | 113,520 | |
| Five9, Inc. (a) | | | 2,000 | | | | 87,440 | |
| Zscaler, Inc. (a) | | | 500 | | | | 19,605 | |
| Zuora, Inc. (a) | | | 19,500 | | | | 353,730 | |
| | | | | | | | 2,714,095 | |
| Specialty Retail (0.5%) | | | | | | | | |
| Floor & Decor Holdings, Inc. (a) | | | 5,000 | | | | 129,500 | |
| | | | | | | | | |
| Technology Hardware, Storage & Peripherals (8.3%) | | | | | | | | |
| Electronics for Imaging, Inc. (a) | | | 37,500 | | | | 930,000 | |
| Intevac, Inc. (a) | | | 30,600 | | | | 160,038 | |
| Super Micro Computer, Inc. (a)(b) | | | 68,600 | | | | 946,680 | |
| | | | | | | | 2,036,718 | |
See accompanying notes to financial statements.
Needham Small Cap Growth Fund
Schedule of Investments (Continued)
December 31, 2018
| | | Shares | | | Value | |
| Common Stocks – Continued | | | | | | |
| | | | | | | |
| Thrifts & Mortgage Finance (0.4%) | | | | | | |
| LendingTree, Inc. (a) | | | 500 | | | $ | 109,785 | |
| | | | | | | | | |
| Trading Companies & Distributors (1.8%) | | | | | | | | |
| Air Lease Corp., Class A | | | 15,000 | | | | 453,150 | |
| | | | | | | | | |
| Total Common Stocks | | | | | | | | |
| (Cost $24,880,917) | | | | | | $ | 22,858,311 | |
| | | | | | | | | |
| Closed-End Funds (4.4%) | | | | | | | | |
| Tekla Healthcare Investors | | | 31,000 | | | | 556,450 | |
| Tekla Life Sciences Investors | | | 36,000 | | | | 543,960 | |
| | | | | | | | | |
| Total Closed-End Funds | | | | | | | | |
| (Cost $1,422,489) | | | | | | $ | 1,100,410 | |
| | | | | | | | | |
| Short-Term Investments (5.0%) | | | | | | | | |
| | | | | | | | | |
| Money Market Fund (5.0%) | | | | | | | | |
| Dreyfus Treasury Securities Cash Management – | | | | | | | | |
| Institutional Class 2.20% (c) | | | | | | | | |
| | | | | | | | | |
| Total Short-Term Investments | | | | | | | | |
| (Cost $1,228,206) | | | 1,228,206 | | | $ | 1,228,206 | |
| | | | | | | | | |
| Total Investments (102.1%) | | | | | | | | |
| (Cost $27,531,612) | | | | | | �� | 25,186,927 | |
| Liabilities in Excess of Other Assets (-2.1%) | | | | | | | (532,423 | ) |
| Total Net Assets (100.0%) | | | | | | $ | 24,654,504 | |
Percentages are stated as a percent of net assets.
| (a) | Non-income producing security. |
| (b) | Security position is either entirely or partially held in a segregated account as collateral for securities sold short, aggregating a total market value of $1,029,213. |
| (c) | Rate shown is the seven day yield as of December 31, 2018 |
| (d) | As of December 31, 2018, the Fund had a significant portion of its assets invested in the Semiconductors and Semiconductor Equipment industry. |
See accompanying notes to financial statements.
(This Page Intentionally Left Blank.)
Statements of Assets and Liabilities
December 31, 2018
| | | | | | | Needham | | | Needham | |
| | | | Needham | | | Aggressive | | | Small Cap | |
| | | | Growth Fund | | | Growth Fund | | | Growth Fund | |
| Assets | | | | | | | | | | |
| Investments, at value: | | | | | | | | | | |
| Unaffiliated securities, (Cost $42,832,200, | | | | | | | | | | |
| $21,039,851, $27,531,612) | | $ | 82,867,407 | | | $ | 38,988,051 | | | $ | 25,186,927 | |
| Affiliated securities (Cost $—, $2,279,118, $—) | | | | — | | | | 2,352,000 | | | | — | |
| Cash | | | | — | | | | — | | | | 30,930 | |
| Receivables: | | | | | | | | | | | | | |
| Deposit with Broker for Securities Sold Short | | | | 5,575,398 | | | | 2,906,168 | | | | 2 | |
| Dividends and Interest | | | | 51,678 | | | | 564 | | | | 7,355 | |
| Fund Shares Sold | | | | 1,997 | | | | 279,146 | | | | 7,399 | |
| Investment Securities Sold | | | | 280,071 | | | | 218,450 | | | | 564,857 | |
| Prepaid Expenses | | | | 43,382 | | | | 24,183 | | | | 20,335 | |
| Total Assets | | | | 88,819,933 | | | | 44,768,562 | | | | 25,817,805 | |
| | | | | | | | | | | | | | | |
| Liabilities | | | | | | | | | | | | | |
| Securities Sold Short, at Value | | | | | | | | | | | | | |
| (Proceeds $1,624,399, $1,142,432, $—) | | | | 5,195,265 | | | | 2,926,675 | | | | — | |
| Payables: | | | | | | | | | | | | | |
| Investment Securities Purchased | | | | — | | | | — | | | | 486,211 | |
| Fund Shares Redeemed | | | | 66,687 | | | | 385,412 | | | | 628,302 | |
| Due to Bank | | | | — | | | | 772,893 | | | | — | |
| Due to Adviser | | | | 81,489 | | | | 35,811 | | | | 10,174 | |
| Custodian Fees | | | | 1,746 | | | | 1,783 | | | | 1,880 | |
| Distribution Fees | | | | 12,379 | | | | 6,164 | | | | 3,272 | |
| Administration and Accounting Fees | | | | 21,272 | | | | 10,523 | | | | 8,816 | |
| Transfer Agent Fees | | | | 9,011 | | | | 8,318 | | | | 6,271 | |
| Accrued Expenses and Other Liabilities | | | | 38,347 | | | | 23,570 | | | | 18,375 | |
| Total Liabilities | | | | 5,426,196 | | | | 4,171,149 | | | | 1,163,301 | |
| Total Net Assets | | | $ | 83,393,737 | | | $ | 40,597,413 | | | $ | 24,654,504 | |
See accompanying notes to financial statements.
Statements of Assets and Liabilities (Continued)
December 31, 2018
| | | | | | Needham | | | Needham | |
| | | Needham | | | Aggressive | | | Small Cap | |
| | | Growth Fund | | | Growth Fund | | | Growth Fund | |
| Retail Class Shares | | | | | | | | | |
| Net Assets | | $ | 54,244,392 | | | $ | 27,119,360 | | | $ | 12,486,518 | |
| Shares Issued and Outstanding | | | | | | | | | | | | |
| $0.001 Par Value (Authorized | | | | | | | | | | | | |
| 800,000,000,100,000,000 and | | | | | | | | | | | | |
| 100,000,000 respectively) | | | 1,641,643 | | | | 1,608,549 | | | | 1,006,706 | |
| Net Asset Value and | | | | | | | | | | | | |
| Offering Price Per Share | | $ | 33.04 | | | $ | 16.86 | | | $ | 12.40 | |
| | | | | | | | | | | | | |
| Institutional Class Shares | | | | | | | | | | | | |
| Net Assets | | $ | 29,149,345 | | | $ | 13,478,053 | | | $ | 12,167,986 | |
| Shares Issued and Outstanding | | | | | | | | | | | | |
| $0.001 Par Value (Authorized | | | | | | | | | | | | |
| 800,000,000,100,000,000 and | | | | | | | | | | | | |
| 100,000,000 respectively) | | | 871,369 | | | | 788,901 | | | | 968,247 | |
| Net Asset Value and | | | | | | | | | | | | |
| Offering Price Per Share | | $ | 33.45 | | | $ | 17.08 | | | $ | 12.57 | |
| | | | | | | | | | | | | |
| Components of Net Assets | | | | | | | | | | | | |
| Paid in Capital | | | 39,160,089 | | | | 22,840,276 | | | | 27,144,702 | |
| Distributable Earnings | | | 44,233,648 | | | | 17,757,137 | | | | (2,490,198 | ) |
| Total Net Assets | | $ | 83,393,737 | | | $ | 40,597,413 | | | $ | 24,654,504 | |
See accompanying notes to financial statements.
Statements of Operations
For the year ended December 31, 2018
| | | | | | Needham | | | Needham | |
| | | Needham | | | Aggressive | | | Small Cap | |
| | | Growth Fund | | | Growth Fund | | | Growth Fund | |
| Investment Income | | | | | | | | | |
| Dividend Income from unaffiliated securities (net of | | | | | | | | | |
| foreign withholding tax of $165, $—, $—) | | $ | 708,686 | | | $ | 282,460 | | | $ | 157,507 | |
| Interest Income | | | 9,046 | | | | 4,062 | | | | 76,602 | |
| Total Investment Income | | | 717,732 | | | | 286,522 | | | | 234,109 | |
| | | | | | | | | | | | | |
| Expenses | | | | | | | | | | | | |
| Investment Advisory Fees | | | 1,295,494 | | | | 697,841 | | | | 392,323 | |
| Distribution Fees | | | 174,488 | | | | 92,026 | | | | 46,926 | |
| Administration and Accounting Fees | | | 129,475 | | | | 79,899 | | | | 51,858 | |
| Audit Fees | | | 40,281 | | | | 28,890 | | | | 28,890 | |
| Chief Compliance Officer Fees | | | 20,463 | | | | 10,275 | | | | 6,696 | |
| Custodian Fees | | | 10,643 | | | | 10,641 | | | | 8,458 | |
| Directors’ Fees | | | 18,082 | | | | 9,233 | | | | 4,848 | |
Dividend Expense(1) | | | 23,063 | | | | 10,813 | | | | — | |
| Registration Fees | | | 40,763 | | | | 45,001 | | | | 40,912 | |
Interest Expense(1) | | | 836,115 | | | | 523,048 | | | | — | |
| Legal Fees | | | 78,574 | | | | 40,910 | | | | 24,222 | |
| Printing Fees | | | 9,323 | | | | 6,590 | | | | 5,364 | |
| Transfer Agent Fees | | | 54,634 | | | | 51,159 | | | | 37,156 | |
| Other Expenses | | | 33,680 | | | | 18,919 | | | | 9,890 | |
| Total Expenses | | | 2,765,078 | | | | 1,625,245 | | | | 657,543 | |
| Fees Waived by Investment Adviser | | | (91,844 | ) | | | (107,345 | ) | | | (115,149 | ) |
| Net Expenses | | | 2,673,234 | | | | 1,517,900 | | | | 542,394 | |
| Net Investment Loss | | | (1,955,502 | ) | | | (1,231,378 | ) | | | (308,285 | ) |
| | | | | | | | | | | | | |
| Net Realized / Unrealized Gain (Loss) from Affiliated | | | | | | | | | | | | |
| and Unaffiliated Securities, Securities Sold Short, | | | | | | | | | | | | |
| Foreign Currency Translations (Note 3) | | | | | | | | | | | | |
| Net Realized Gain from Unaffiliated Securities | | | 14,255,146 | | | | 9,580,767 | | | | 5,424,412 | |
| Net Realized Loss from Securities Sold Short | | | (1,058,497 | ) | | | (928,883 | ) | | | (41,528 | ) |
| Change in Unrealized Depreciation on | | | | | | | | | | | | |
| Unaffiliated Securities and Securities Sold Short | | | (20,652,199 | ) | | | (14,096,172 | ) | | | (6,218,661 | ) |
| Change in Unrealized Depreciation on | | | | | | | | | | | | |
| Affiliated Securities and Securities Sold Short | | | — | | | | (1,288,000 | ) | | | — | |
| Net Realized / Unrealized Gain (Loss) from Affiliated and | | | | | | | | | | | | |
| Unaffiliated Securities, Securities Sold Short, | | | | | | | | | | | | |
| Foreign Currency Translations (Note 3) | | | (7,455,550 | ) | | | (6,732,288 | ) | | | (835,777 | ) |
| Change in Net Assets Resulting from Operations | | $ | (9,411,052 | ) | | $ | (7,963,666 | ) | | $ | (1,144,062 | ) |
(1) | Expense related to securities sold short. |
See accompanying notes to financial statements.
Needham Growth Fund
Statements of Changes in Net Assets
| | | Year Ended | | | Year Ended | |
| | | December 31, 2018 | | | December 31, 2017 | |
| Change in Net Assets | | | | | | |
| Operations: | | | | | | |
| Net Investment Loss | | $ | (1,955,502 | ) | | $ | (1,887,080 | ) |
| Net Realized Gain from Securities, Securities Sold Short, | | | | | | | | |
| Foreign Currency Transactions, and Currency | | | 13,196,649 | | | | 19,118,249 | |
| Net Change in Unrealized Appreciation (Depreciation) on Investments, | | | | | | | | |
| Securities Sold Short, Foreign Currency Translations | | | (20,652,199 | ) | | | (7,518,528 | ) |
| Change in Net Assets Resulting from Operations | | | (9,411,052 | ) | | | 9,712,641 | |
| | | | | | | | | |
| Distributions to Shareholders from: | | | | | | | | |
| Distributable Earnings | | | (13,467,264 | ) | | | (10,480,369 | )(1) |
| | | | | | | | | |
| Capital Transactions: | | | | | | | | |
| Retail Class: | | | | | | | | |
| Shares Issued | | | 819,983 | | | | 3,536,898 | |
| Shares Issued in Reinvestment of Distribution | | | 8,154,389 | | | | 6,546,656 | |
| Shares Exchanged for Institutional Class Shares | | | (3,993,084 | ) | | | (34,786,282 | ) |
| Shares Redeemed | | | (14,136,166 | ) | | | (17,205,930 | ) |
| Redemption Fees | | | — | | | | 137 | |
| Institutional Class: | | | | | | | | |
| Shares Issued | | | 849,415 | | | | 7,117,796 | |
| Shares Issued in Reinvestment of Distribution | | | 4,391,658 | | | | 2,871,221 | |
| Shares Issued in Exchange for Retail Class Shares | | | 3,993,084 | | | | 34,786,282 | |
| Shares Redeemed | | | (4,297,069 | ) | | | (11,643,231 | ) |
| Redemption Fees | | | — | | | | — | |
| Total Change in Net Assets from Capital Transactions | | | (4,217,790 | ) | | | (8,776,453 | ) |
| | | | | | | | | |
| Change in Net Assets | | | (27,096,106 | ) | | | (9,544,181 | ) |
| | | | | | | | | |
| Total Net Assets | | | | | | | | |
| Beginning of Year | | | 110,489,843 | | | | 120,034,024 | |
| End of Year | | $ | 83,393,737 | | | $ | 110,489,843 | (2) |
| | | | | | | | | |
| Share Transaction: | | | | | | | | |
| Retail Class: | | | | | | | | |
| Number of Shares Issued | | | 19,432 | | | | 78,824 | |
| Number of Shares Reinvested | | | 228,927 | | | | 150,428 | |
| Number of Shares Exchanged for Institutional Class Shares | | | (88,717 | ) | | | (794,070 | ) |
| Number of Shares Redeemed | | | (336,013 | ) | | | (379,993 | ) |
| Change in Shares – Retail Class | | | (176,371 | ) | | | (944,811 | ) |
| Institutional Class: | | | | | | | | |
| Number of Shares Issued | | | 20,085 | | | | 154,738 | |
| Number of Shares Reinvested | | | 121,889 | | | | 65,673 | |
| Number of Shares Issued in Exchange for Retail Class Shares | | | 88,007 | | | | 793,772 | |
| Number of Shares Redeemed | | | (111,309 | ) | | | (264,191 | ) |
| Change in Shares – Institutional Class | | | 118,672 | | | | 749,992 | |
| Total Change in Shares | | | (57,699 | ) | | | (194,819 | ) |
(1) | Distributions from net investment income and from realized gains are no longer required to be separately disclosed. See Note 13. For the year ended December 31, 2017, distributions from net realized gains was $10,480,369. |
(2) | Parenthetical disclosure of accumulated net investment income or loss is no longer required. See Note 13. As of December 31, 2017, end of year net assets included accumulated net investment loss of $18,197. |
See accompanying notes to financial statements.
Needham Aggressive Growth Fund
Statements of Changes in Net Assets
| | | Year Ended | | | Year Ended | |
| | | December 31, 2018 | | | December 31, 2017 | |
| Change in Net Assets | | | | | | |
| Operations: | | | | | | |
| Net Investment Loss | | $ | (1,231,378 | ) | | $ | (1,270,987 | ) |
| Net Realized Gain from Securities, Securities Sold Short, | | | | | | | | |
| Foreign Currency Transactions, and Currency | | | 8,651,884 | | | | 4,441,738 | |
| Net Change in Unrealized Appreciation (Depreciation) on Investments, | | | | | | | | |
| Securities Sold Short, Foreign Currency Translations | | | (15,384,172 | ) | | | 2,260,616 | |
| Change in Net Assets Resulting from Operations | | | (7,963,666 | ) | | | 5,431,367 | |
| | | | | | | | | |
| Distributions to Shareholders from: | | | | | | | | |
| Distributable Earnings | | | (6,200,868 | ) | | | (3,108,250 | )(1) |
| | | | | | | | | |
| Capital Transactions: | | | | | | | | |
| Retail Class: | | | | | | | | |
| Shares Issued | | | 1,299,673 | | | | 9,199,681 | |
| Shares Issued in Reinvestment of Distribution | | | 4,037,862 | | | | 2,077,588 | |
| Shares Exchanged for Institutional Class Shares | | | (1,302,417 | ) | | | (15,691,618 | ) |
| Shares Redeemed | | | (8,767,504 | ) | | | (14,977,523 | ) |
| Redemption Fees | | | — | | | | 3,821 | |
| Institutional Class: | | | | | | | | |
| Shares Issued | | | 2,354,427 | | | | 4,358,525 | |
| Shares Issued in Reinvestment of Distribution | | | 2,069,912 | | | | 962,266 | |
| Shares Issued in Exchange for Retail Class Shares | | | 1,302,417 | | | | 15,691,618 | |
| Shares Redeemed | | | (7,780,135 | ) | | | (1,257,528 | ) |
| Redemption Fees | | | — | | | | 161 | |
| Total Change in Net Assets from Capital Transactions | | | (6,785,765 | ) | | | 366,991 | |
| | | | | | | | | |
| Change in Net Assets | | | (20,950,299 | ) | | | 2,690,108 | |
| | | | | | | | | |
| Total Net Assets | | | | | | | | |
| Beginning of Year | | | 61,547,712 | | | | 58,857,604 | |
| End of Year | | $ | 40,597,413 | | | $ | 61,547,712 | (2) |
| | | | | | | | | |
| Share Transaction: | | | | | | | | |
| Retail Class: | | | | | | | | |
| Number of Shares Issued | | | 56,865 | | | | 405,217 | |
| Number of Shares Reinvested | | | 219,927 | | | | 87,996 | |
| Number of Shares Exchanged for Institutional Class Shares | | | (55,934 | ) | | | (696,926 | ) |
| Number of Shares Redeemed | | | (393,860 | ) | | | (648,415 | ) |
| Change in Shares – Retail Class | | | (173,002 | ) | | | (852,128 | ) |
| Institutional Class: | | | | | | | | |
| Number of Shares Issued | | | 103,957 | | | | 189,553 | |
| Number of Shares Reinvested | | | 111,345 | | | | 40,551 | |
| Number of Shares Issued in Exchange for Retail Class Shares | | | 52,355 | | | | 696,049 | |
| Number of Shares Redeemed | | | (359,268 | ) | | | (52,911 | ) |
| Change in Shares – Institutional Class | | | (91,611 | ) | | | 873,242 | |
| Total Change in Shares | | | (264,613 | ) | | | 21,114 | |
(1) | Distributions from net investment income and from realized gains are no longer required to be separately disclosed. See Note 13. For the year ended December 31, 2017, distributions from net realized gains was $3,108,250. |
(2) | Parenthetical disclosure of accumulated net investment income or loss is no longer required. See Note 13. As of December 31, 2017, end of year net assets included accumulated net investment income of $0. |
See accompanying notes to financial statements.
Needham Small Cap Growth Fund
Statements of Changes in Net Assets
| | | Year Ended | | | Year Ended | |
| | | December 31, 2018 | | | December 31, 2017 | |
| Change in Net Assets | | | | | | |
| Operations: | | | | | | |
| Net Investment Loss | | $ | (308,285 | ) | | $ | (310,369 | ) |
| Net Realized Gain from Securities, Securities Sold Short, | | | | | | | | |
| Foreign Currency Transactions, and Currency | | | 5,382,884 | | | | 3,977,538 | |
| Net Change in Unrealized Appreciation (Depreciation) on Investments, | | | | | | | | |
| Securities Sold Short, Foreign Currency Translations | | | (6,218,661 | ) | | | (228,295 | ) |
| Change in Net Assets Resulting from Operations | | | (1,144,062 | ) | | | 3,438,874 | |
| | | | | | | | | |
| Distributions to Shareholders from: | | | | | | | | |
| Distributable Earnings | | | (5,214,199 | ) | | | (2,364,563 | )(1) |
| | | | | | | | | |
| Capital Transactions: | | | | | | | | |
| Retail Class: | | | | | | | | |
| Shares Issued | | | 2,080,595 | | | | 3,127,799 | |
| Shares Issued in Reinvestment of Distribution | | | 2,958,778 | | | | 1,624,010 | |
| Shares Exchanged for Institutional Class Shares | | | (513,300 | ) | | | (4,245,905 | ) |
| Shares Redeemed | | | (7,736,681 | ) | | | (17,706,408 | ) |
| Redemption Fees | | | 82 | | | | 12,314 | |
| Institutional Class: | | | | | | | | |
| Shares Issued | | | 4,684,908 | | | | 6,971,388 | |
| Shares Issued in Reinvestment of Distribution | | | 2,178,089 | | | | 689,541 | |
| Shares Issued in Exchange for Retail Class Shares | | | 513,300 | | | | 4,245,905 | |
| Shares Redeemed | | | (2,795,178 | ) | | | (1,808,408 | ) |
| Redemption Fees | | | — | | | | 164 | |
| Total Change in Net Assets from Capital Transactions | | | 1,370,593 | | | | (7,089,600 | ) |
| | | | | | | | | |
| Change in Net Assets | | | (4,987,668 | ) | | | (6,015,289 | ) |
| | | | | | | | | |
| Total Net Assets | | | | | | | | |
| Beginning of Year | | | 29,642,172 | | | | 35,657,461 | |
| End of Year | | $ | 24,654,504 | | | $ | 29,642,172 | (2) |
| | | | | | | | | |
| Share Transaction: | | | | | | | | |
| Retail Class: | | | | | | | | |
| Number of Shares Issued | | | 129,771 | | | | 201,179 | |
| Number of Shares Reinvested | | | 213,939 | | | | 102,075 | |
| Number of Shares Exchanged for Institutional Class Shares | | | (31,379 | ) | | | (274,456 | ) |
| Number of Shares Redeemed | | | (538,198 | ) | | | (1,125,564 | ) |
| Change in Shares – Retail Class | | | (225,867 | ) | | | (1,096,766 | ) |
| Institutional Class: | | | | | | | | |
| Number of Shares Issued | | | 321,658 | | | | 434,158 | |
| Number of Shares Reinvested | | | 155,578 | | | | 43,151 | |
| Number of Shares Issued in Exchange for Retail Class Shares | | | 31,112 | | | | 274,369 | |
| Number of Shares Redeemed | | | (195,266 | ) | | | (105,679 | ) |
| Change in Shares – Institutional Class | | | 313,082 | | | | 645,999 | |
| Total Change in Shares | | | 87,215 | | | | (450,767 | ) |
(1) | Distributions from net investment income and from realized gains are no longer required to be separately disclosed. See Note 13 for the year ended December 31, 2017, distributions from net realized gains was $2,634,563. |
(2) | Parenthetical disclosure of accumulated net investment income or loss is no longer required. See Note 13. As of December 31, 2017, end of year net assets included accumulated net investment income of $0. |
See accompanying notes to financial statements.
Needham Growth Fund
Financial Highlights
| | | Retail Class | |
| (For a Share Outstanding | | Year Ended December 31, | |
| Throughout each Year) | | 2018 | | | 2017 | | | 2016 | | | 2015 | | | 2014 | |
| Net Asset Value, Beginning of Year | | $ | 42.91 | | | $ | 43.40 | | | $ | 40.96 | | | $ | 46.00 | | | $ | 45.06 | |
| Investment Operations | | | | | | | | | | | | | | | | | | | | |
| Net Investment Income (Loss) | | | (0.88 | ) | | | (0.78 | ) | | | (0.59 | ) | | | (0.68 | ) | | | 0.58 | |
| Net Realized and Unrealized | | | | | | | | | | | | | | | | | | | | |
| Gain (Loss) on Investments | | | (3.11 | ) | | | 4.45 | | | | 4.86 | | | | (1.60 | ) | | | 4.59 | |
| Total from Investment Operations | | | (3.99 | ) | | | 3.67 | | | | 4.27 | | | | (2.28 | ) | | | 4.01 | |
| | | | | | | | | | | | | | | | | | | | | |
| Less Distributions | | | | | | | | | | | | | | | | | | | | |
| Net Realized Gains | | | (5.88 | ) | | | (4.16 | ) | | | (1.83 | ) | | | (2.76 | ) | | | (3.07 | ) |
| Total Distributions | | | (5.88 | ) | | | (4.16 | ) | | | (1.83 | ) | | | (2.76 | ) | | | (3.07 | ) |
| | | | | | | | | | | | | | | | | | | | | |
| Capital Contributions | | | | | | | | | | | | | | | | | | | | |
| Redemption Fees | | | — | | | | — | (1) | | | — | (1) | | | — | (1) | | | — | (1) |
| Total Capital Contributions | | | — | | | | — | (1) | | | — | (1) | | | — | (1) | | | — | (1) |
| Net Asset Value, End of Year | | $ | 33.04 | | | $ | 42.91 | | | $ | 43.40 | | | $ | 40.96 | | | $ | 46.00 | |
| | | | | | | | | | | | | | | | | | | | | |
| Total Return | | | (10.26 | )% | | | 8.32 | % | | | 10.57 | % | | | (5.07 | )% | | | 8.98 | % |
| Net Assets, End of Year (000’s) | | $ | 54,245 | | | $ | 78,014 | | | $ | 119,117 | | | $ | 127,154 | | | $ | 147,816 | |
| Ratios/Supplemental Data | | | | | | | | | | | | | | | | | | | | |
| Ratio of Net Expenses to | | | | | | | | | | | | | | | | | | | | |
| Average Net Assets | | | 2.76 | % | | | 2.34 | % | | | 2.17 | % | | | 2.05 | % | | | 1.84 | % |
| Ratio of Net Expenses to Average | | | | | | | | | | | | | | | | | | | | |
| Net Assets (before interest | | | | | | | | | | | | | | | | | | | | |
| and dividend expense) | | | 1.92 | % | | | 1.90 | % | | | 1.84 | % | | | 1.82 | % | | | 1.80 | % |
| Ratio of Total Expenses to Average | | | | | | | | | | | | | | | | | | | | |
| Net Assets (before waiver and | | | | | | | | | | | | | | | | | | | | |
| reimbursement of expenses) | | | 2.76 | % | | | 2.34 | % | | | 2.17 | % | | | 2.05 | % | | | 1.84 | % |
| Ratio of Net Investment Income | | | | | | | | | | | | | | | | | | | | |
| (Loss) to Average Net Assets | | | (2.07 | )% | | | (1.73 | )% | | | (1.36 | )% | | | (1.48 | )% | | | (1.32 | )% |
| Ratio of Net Investment Loss to | | | | | | | | | | | | | | | | | | | | |
| Average Net Assets (before waivers | | | | | | | | | | | | | | | | | | | | |
| and reimbursements of expenses) | | | (2.07 | )% | | | (1.73 | )% | | | (1.36 | )% | | | (1.48 | )% | | | (1.32 | )% |
| Portfolio turnover rate | | | 8 | % | | | 9 | % | | | 12 | % | | | 13 | % | | | 12 | % |
(1) | Value is less than $0.005 per share. |
See accompanying notes to financial statements.
Needham Growth Fund
Financial Highlights
| | | Institutional Class | |
| | | | | | | | | Period from | |
| | | Year Ended | | | Year Ended | | | December 30, 2016 | |
| (For a Share Outstanding | | December 31, | | | December 31, | | | through | |
| Throughout each Year/Period) | | 2018 | | | 2017 | | | December 31, 2016(1) | |
| Net Asset Value, Beginning of Year/Period | | $ | 43.15 | | | $ | 43.40 | | | $ | 43.40 | |
| Investment Operations | | | | | | | | | | | | |
| Net Investment Loss | | | (0.65 | ) | | | (0.56 | ) | | | — | |
| Net Realized and Unrealized | | | | | | | | | | | | |
| Gain (Loss) on Investments | | | (3.17 | ) | | | 4.47 | | | | — | |
| Total from Investment Operations | | | (3.82 | ) | | | 3.91 | | | | — | |
| | | | | | | | | | | | | |
| Less Distributions | | | | | | | | | | | | |
| Net Realized Gains | | | (5.88 | ) | | | (4.16 | ) | | | — | |
| Total Distributions | | | (5.88 | ) | | | (4.16 | ) | | | — | |
| | | | | | | | | | | | | |
| Net Asset Value, End of Year/Period | | $ | 33.45 | | | $ | 43.15 | | | $ | 43.40 | |
| | | | | | | | | | | | | |
| Total Return | | | (9.83 | )% | | | 8.89 | % | | | 0.00 | % |
| Net Assets, End of Year/Period (000’s) | | $ | 29,149 | | | $ | 32,476 | | | $ | 117 | |
| Ratios/Supplemental Data | | | | | | | | | | | | |
| Ratio of Net Expenses to Average Net Assets | | | 2.21 | % | | | 1.90 | % | | | 1.40 | % |
| Ratio of Net Expenses to Average Net Assets | | | | | | | | | | | | |
| (before interest and dividend expense) | | | 1.40 | % | | | 1.40 | % | | | 1.40 | % |
| Ratio of Total Expenses to Average Net Assets | | | | | | | | | | | | |
| (before waiver and reimbursement of expenses) | | | 2.48 | % | | | 2.15 | % | | | — | %(2) |
| Ratio of Net Investment Loss to Average Net Assets | | | (1.52 | )% | | | (1.24 | )% | | | — | %(2) |
| Ratio of Net Investment Loss to Average Net Assets | | | | | | | | | | | | |
| (before waivers and reimbursements of expenses) | | | (1.79 | )% | | | (1.49 | )% | | | — | %(2) |
| Portfolio turnover rate | | | 8 | % | | | 9 | % | | | 0 | % |
(1) | The Class commenced operations on December 30, 2016. |
(2) | Refer to Note 2 for further description of non-recurring charges related to the issuance of the share class. |
See accompanying notes to financial statements.
Needham Aggressive Growth Fund
Financial Highlights
| | | Retail Class | |
| (For a Share Outstanding | | Year Ended December 31, | |
| Throughout each Year) | | 2018 | | | 2017 | | | 2016 | | | 2015 | | | 2014 | |
| Net Asset Value, Beginning of Year | | $ | 23.07 | | | $ | 22.29 | | | $ | 19.56 | | | $ | 23.55 | | | $ | 22.66 | |
| Investment Operations | | | | | | | | | | | | | | | | | | | | |
| Net Investment Loss | | | (0.54 | ) | | | (0.49 | ) | | | (0.38 | ) | | | (0.39 | ) | | | (0.38 | ) |
| Net Realized and Unrealized | | | | | | | | | | | | | | | | | | | | |
| Gain (Loss) on Investments | | | (2.88 | ) | | | 2.46 | | | | 4.61 | | | | (1.28 | ) | | | 1.98 | |
| Total from Investment Operations | | | (3.42 | ) | | | 1.97 | | | | 4.23 | | | | (1.67 | ) | | | 1.60 | |
| | | | | | | | | | | | | | | | | | | | | |
| Less Distributions | | | | | | | | | | | | | | | | | | | | |
| Net Realized Gains | | | (2.79 | ) | | | (1.19 | ) | | | (1.50 | ) | | | (2.32 | ) | | | (0.71 | ) |
| Total Distributions | | | (2.79 | ) | | | (1.19 | ) | | | (1.50 | ) | | | (2.32 | ) | | | (0.71 | ) |
| | | | | | | | | | | | | | | | | | | | | |
| Capital Contributions | | | | | | | | | | | | | | | | | | | | |
| Redemption Fees | | | — | | | | — | (1) | | | — | (1) | | | — | (1) | | | — | (1) |
| Total Capital Contributions | | | — | | | | — | (1) | | | — | (1) | | | — | (1) | | | — | (1) |
| Net Asset Value, End of Year | | $ | 16.86 | | | $ | 23.07 | | | $ | 22.29 | | | $ | 19.56 | | | $ | 23.55 | |
| | | | | | | | | | | | | | | | | | | | | |
| Total Return | | | (15.80 | )% | | | 8.73 | % | | | 22.18 | % | | | (7.05 | )% | | | 7.13 | % |
| Net Assets, End of Year (000’s) | | $ | 27,119 | | | $ | 41,107 | | | $ | 58,696 | | | $ | 50,906 | | | $ | 62,353 | |
| Ratios/Supplemental Data | | | | | | | | | | | | | | | | | | | | |
| Ratio of Net Expenses to | | | | | | | | | | | | | | | | | | | | |
| Average Net Assets | | | 2.91 | % | | | 2.63 | % | | | 2.71 | % | | | 2.41 | % | | | 2.09 | % |
| Ratio of Net Expenses to Average | | | | | | | | | | | | | | | | | | | | |
| Net Assets (before interest | | | | | | | | | | | | | | | | | | | | |
| and dividend expense) | | | 1.95 | % | | | 1.95 | % | | | 1.95 | % | | | 1.93 | % | | | 1.91 | % |
| Ratio of Total Expenses to Average | | | | | | | | | | | | | | | | | | | | |
| Net Assets (before waiver and | | | | | | | | | | | | | | | | | | | | |
| reimbursement of expenses) | | | 2.97 | % | | | 2.65 | % | | | 2.72 | % | | | 2.42 | % | | | 2.09 | % |
| Ratio of Net Investment Loss to | | | | | | | | | | | | | | | | | | | | |
| Average Net Assets | | | (2.40 | )% | | | (2.12 | )% | | | (1.99 | )% | | | (1.73 | )% | | | (1.60 | )% |
| Ratio of Net Investment Loss to | | | | | | | | | | | | | | | | | | | | |
| Average Net Assets (before waivers | | | | | | | | | | | | | | | | | | | | |
| and reimbursements of expenses) | | | (2.46 | )% | | | (2.14 | )% | | | (2.00 | )% | | | (1.74 | )% | | | (1.60 | )% |
| Portfolio turnover rate | | | 8 | % | | | 15 | % | | | 14 | % | | | 15 | % | | | 19 | % |
(1) | Value is less than $0.005 per share. |
See accompanying notes to financial statements.
Needham Aggressive Growth Fund
Financial Highlights
| | | Institutional Class | |
| | | | | | | | | Period from | |
| | | Year Ended | | | Year Ended | | | December 30, 2016 | |
| (For a Share Outstanding | | December 31, | | | December 31, | | | through | |
| Throughout each Year/Period) | | 2018 | | | 2017 | | | December 31, 2016(1) | |
| Net Asset Value, Beginning of Year/Period | | $ | 23.21 | | | $ | 22.29 | | | $ | 22.29 | |
| Investment Operations | | | | | | | | | | | | |
| Net Investment Loss | | | (0.42 | ) | | | (0.39 | ) | | | — | |
| Net Realized and Unrealized | | | | | | | | | | | | |
| Gain (Loss) on Investments | | | (2.92 | ) | | | 2.50 | | | | — | |
| Total from Investment Operations | | | (3.34 | ) | | | 2.11 | | | | — | |
| | | | | | | | | | | | | |
| Less Distributions | | | | | | | | | | | | |
| Net Realized Gains | | | (2.79 | ) | | | (1.19 | ) | | | — | |
| Total Distributions | | | (2.79 | ) | | | (1.19 | ) | | | — | |
| | | | | | | | | | | | | |
| Net Asset Value, End of Year/Period | | $ | 17.08 | | | $ | 23.21 | | | $ | 22.29 | |
| | | | | | | | | | | | | |
| Total Return | | | (15.36 | )% | | | 9.36 | % | | | 0.00 | % |
| Net Assets, End of Year/Period (000’s) | | $ | 13,478 | | | $ | 20,441 | | | $ | 162 | |
| Ratios/Supplemental Data | | | | | | | | | | | | |
| Ratio of Net Expenses to Average Net Assets | | | 2.35 | % | | | 2.22 | % | | | 1.40 | % |
| Ratio of Net Expenses to Average Net Assets | | | | | | | | | | | | |
| (before interest and dividend expense) | | | 1.40 | % | | | 1.40 | % | | | 1.40 | % |
| Ratio of Total Expenses to Average Net Assets | | | | | | | | | | | | |
| (before waiver and reimbursement of expenses) | | | 2.79 | % | | | 2.64 | % | | | — | %(2) |
| Ratio of Net Investment Loss to Average Net Assets | | | (1.84 | )% | | | (1.69 | )% | | | — | %(2) |
| Ratio of Net Investment Loss to Average Net Assets | | | | | | | | | | | | |
| (before waivers and reimbursements of expenses) | | | (2.28 | )% | | | (2.11 | )% | | | — | %(2) |
| Portfolio turnover rate | | | 8 | % | | | 15 | % | | | 0 | % |
(1) | The Class commenced operations on December 30, 2016. |
(2) | Refer to Note 2 for further description of non-recurring charges related to the issuance of the share class. |
See accompanying notes to financial statements.
Needham Small Cap Growth Fund
Financial Highlights
| | | Retail Class | |
| (For a Share Outstanding | | Year Ended December 31, | |
| Throughout each Year) | | 2018 | | | 2017 | | | 2016 | | | 2015 | | | 2014 | |
| Net Asset Value, Beginning of Year | | $ | 15.67 | | | $ | 15.25 | | | $ | 12.44 | | | $ | 14.01 | | | $ | 15.63 | |
| Investment Operations | | | | | | | | | | | | | | | | | | | | |
| Net Investment Loss | | | (0.19 | ) | | | (0.18 | ) | | | (0.20 | ) | | | (0.24 | ) | | | (0.24 | ) |
| Net Realized and Unrealized | | | | | | | | | | | | | | | | | | | | |
| Gain (Loss) on Investments | | | (0.32 | ) | | | 1.99 | | | | 4.03 | | | | (1.02 | ) | | | 0.32 | |
| Total from Investment Operations | | | (0.51 | ) | | | 1.81 | | | | 3.83 | | | | (1.26 | ) | | | 0.08 | |
| | | | | | | | | | | | | | | | | | | | | |
| Less Distributions | | | | | | | | | | | | | | | | | | | | |
| Net Realized Gains | | | (2.76 | ) | | | (1.40 | ) | | | (1.02 | ) | | | (0.31 | ) | | | (1.70 | ) |
| Total Distributions | | | (2.76 | ) | | | (1.40 | ) | | | (1.02 | ) | | | (0.31 | ) | | | (1.70 | ) |
| | | | | | | | | | | | | | | | | | | | | |
| Capital Contributions | | | | | | | | | | | | | | | | | | | | |
| Redemption Fees | | | — | (1) | | | 0.01 | | | | — | (1) | | | — | (1) | | | — | (1) |
| Total Capital Contributions | | | — | | | | 0.01 | | | | — | (1) | | | — | (1) | | | — | (1) |
| Net Asset Value, End of Year | | $ | 12.40 | | | $ | 15.67 | | | $ | 15.25 | | | $ | 12.44 | | | $ | 14.01 | |
| | | | | | | | | | | | | | | | | | | | | |
| Total Return | | | (5.07 | )% | | | 11.81 | % | | | 31.26 | % | | | (8.96 | )% | | | 0.80 | % |
| Net Assets, End of Year (000’s) | | $ | 12,487 | | | $ | 19,317 | | | $ | 35,518 | | | $ | 23,473 | | | $ | 32,116 | |
| Ratios/Supplemental Data | | | | | | | | | | | | | | | | | | | | |
| Ratio of Net Expenses to | | | | | | | | | | | | | | | | | | | | |
| Average Net Assets | | | 1.95 | % | | | 1.95 | % | | | 2.09 | % | | | 2.05 | % | | | 2.01 | % |
| Ratio of Net Expenses to Average | | | | | | | | | | | | | | | | | | | | |
| Net Assets (before interest | | | | | | | | | | | | | | | | | | | | |
| and dividend expense) | | | 1.95 | % | | | 1.95 | % | | | 1.95 | % | | | 1.95 | % | | | 1.95 | % |
| Ratio of Total Expenses to Average | | | | | | | | | | | | | | | | | | | | |
| Net Assets (before waiver and | | | | | | | | | | | | | | | | | | | | |
| reimbursement of expenses) | | | 2.19 | % | | | 2.15 | % | | | 2.30 | % | | | 2.25 | % | | | 2.11 | % |
| Ratio of Net Investment Loss to | | | | | | | | | | | | | | | | | | | | |
| Average Net Assets | | | (1.20 | )% | | | (1.14 | )% | | | (1.83 | )% | | | (1.61 | )% | | | (1.49 | )% |
| Ratio of Net Investment Loss to | | | | | | | | | | | | | | | | | | | | |
| Average Net Assets (before waivers | | | | | | | | | | | | | | | | | | | | |
| and reimbursements of expenses) | | | (1.44 | )% | | | (1.34 | )% | | | (2.04 | )% | | | (1.81 | )% | | | (1.59 | )% |
| Portfolio turnover rate | | | 103 | % | | | 80 | % | | | 99 | % | | | 64 | % | | | 69 | % |
(1) | Value is less than $0.005 per share. |
See accompanying notes to financial statements.
Needham Small Cap Growth Fund
Financial Highlights
| | | Institutional Class | |
| | | | | | | | | Period from | |
| | | Year Ended | | | Year Ended | | | December 30, 2016 | |
| (For a Share Outstanding | | December 31, | | | December 31, | | | through | |
| Throughout each Year/Period) | | 2018 | | | 2017 | | | December 31, 2016(1) | |
| Net Asset Value, Beginning of Year/Period | | $ | 15.76 | | | $ | 15.25 | | | $ | 15.25 | |
| Investment Operations | | | | | | | | | | | | |
| Net Investment Loss | | | (0.10 | ) | | | (0.07 | ) | | | — | |
| Net Realized and Unrealized | | | | | | | | | | | | |
| Gain (Loss) on Investments | | | (0.33 | ) | | | 1.98 | | | | — | |
| Total from Investment Operations | | | (0.43 | ) | | | 1.91 | | | | — | |
| | | | | | | | | | | | | |
| Less Distributions | | | | | | | | | | | | |
| Net Realized Gains | | | (2.76 | ) | | | (1.40 | ) | | | — | |
| Total Distributions | | | (2.76 | ) | | | (1.40 | ) | | | — | |
| | | | | | | | | | | | | |
| Net Asset Value, End of Year/Period | | $ | 12.57 | | | $ | 15.76 | | | $ | 15.25 | |
| | | | | | | | | | | | | |
| Total Return | | | (4.32 | )% | | | 12.41 | % | | | 0.00 | % |
| Net Assets, End of Year/Period (000’s) | | $ | 12,168 | | | $ | 10,325 | | | $ | 140 | |
| Ratios/Supplemental Data | | | | | | | | | | | | |
| Ratio of Net Expenses to Average Net Assets | | | 1.40 | % | | | 1.40 | % | | | 1.40 | % |
| Ratio of Net Expenses to Average Net Assets | | | | | | | | | | | | |
| (before interest and dividend expense) | | | 1.40 | % | | | 1.40 | % | | | 1.40 | % |
| Ratio of Total Expenses to Average Net Assets | | | | | | | | | | | | |
| (before waiver and reimbursement of expenses) | | | 1.95 | % | | | 2.08 | % | | | — | %(2) |
| Ratio of Net Investment Loss to Average Net Assets | | | (0.65 | )% | | | (0.41 | )% | | | — | %(2) |
| Ratio of Net Investment Loss to Average Net Assets | | | | | | | | | | | | |
| (before waivers and reimbursements of expenses) | | | (1.21 | )% | | | (1.09 | )% | | | — | %(2) |
| Portfolio turnover rate | | | 103 | % | | | 80 | % | | | 0 | % |
(1) | The Class commenced operations on December 30, 2016. |
(2) | Refer to Note 2 for further description of non-recurring charges related to the issuance of the share class. |
See accompanying notes to financial statements.
Notes to Financial Statements
1. Organization
Needham Growth Fund (“NGF”), Needham Aggressive Growth Fund (“NAGF”) and Needham Small Cap Growth Fund (“NSCGF”) (each, a “Portfolio” and collectively, the “Portfolios”), are portfolios of The Needham Funds, Inc. (the “Company”), which is registered under the Investment Company Act of 1940, as amended (the “1940 Act”), as a diversified, open-end management investment company. The Company was organized as a Maryland corporation on October 12, 1995. NGF, NAGF, and NSCGF each currently offer two classes, the Retail Class and the Institutional Class. The Institutional Class commenced operations on December 30, 2016.
2. Class Specific Expenses
Class level expenses are allocated daily to each class of shares based upon the ratio of net assets represented by each class as a percentage of the net assets of the Portfolio. Expenses deemed directly attributable to a class of shares are recorded by the specific class. Most Portfolio expenses are allocated by class based on relative net assets. Distribution Fees incurred in connection with the Company’s Amended and Restated Plan of Distribution Pursuant to Rule 12b-1 are expensed at 0.25% of average daily net assets of the Retail class shares, and the specific amounts are detailed in Note 5.
Certain of the Ratios and Supplemental Data presented in the Financial Highlights of the Institutional Class as of December 31, 2016 include non-recurring charges related to the issuance of the class and are not meaningful.
3. Significant Accounting Policies
The following is a summary of significant accounting policies followed by the Company in the preparation of its financial statements. These policies are in conformity with accounting principles generally accepted in the United States of America (“GAAP”).
Security Valuation: Portfolio securities for which market quotations are readily available are stated at the last sale price reported by the principal exchange for the security as of the exchange’s close of business. Securities for which no sale has taken place during the day and securities which are not listed on an exchange are valued at the mean of the highest closing bid and lowest asked prices. Exchange traded options are valued at the last reported sale price on any exchange on which the option is principally traded. If no sales are reported on a particular day, the options will be valued at the mean between the highest closing bid and lowest asked prices across the exchanges where the option is traded. Non-exchange traded options will also be valued at the mean between the last bid and asked quotations. For options where market quotations are not readily available, value will be determined in accordance with the fair value procedures described below. All other securities and assets for which (a) market quotations are not readily available, such as in the case of a market or technical disruption that prevents the normal trading of a security held by a Portfolio, (b) market quotations are believed to be unrepresentative of fair market value, such as in the case of a thinly traded security, or (c) valuation is normally made at the last sale price on a
Notes to Financial Statements (Continued)
foreign exchange and a significant event occurs after the close of that exchange but before the New York Stock Exchange closes, are valued at their fair value as determined in good faith by the Board of Directors (the “Board”) in accordance with Fair Value Procedures established by the Board. The Company’s Fair Value Procedures are implemented and monitored by a Fair Value Committee (the “Committee”) designated by the Board. When a security is valued in accordance with the Fair Value Procedures, the Committee determines a value after taking into consideration any relevant information that is reasonably available to the Committee. Some of the more common reasons that may necessitate that a security be valued pursuant to these Fair Value Procedures include, but are not limited to: the security’s trading has been halted or suspended; the security has been delisted from a national exchange; the security’s primary trading market is temporarily closed at a time when under normal conditions it would be open; or the security’s primary pricing source is not able or willing to provide a price. The securities of each Portfolio may also be valued on the basis of valuations provided by a pricing service approved by, or on behalf of, the Board.
Portfolio securities listed or traded on securities exchanges, including American Depositary Receipts (“ADRs”), are valued at the closing price on the exchange or system where the security is principally traded or at the NASDAQ Official Closing Price. If there have been no sales for that day on the exchange or system, a security is valued at the mean of the highest closing bid and lowest asked prices on the exchange or system where the security is principally traded.
The Portfolios did not value any securities in accordance with the Fair Value Procedures as of December 31, 2018.
Investment Transactions: Changes in holdings of portfolio securities for the Portfolios shall be reflected no later than in the first calculation on the first business day following the trade date for purposes of calculating each Portfolio’s daily net asset value per share. However, for financial reporting purposes, portfolio security transactions are reported on the trade date of the last business day of the reporting period. The cost (proceeds) of investments sold (bought to cover) is determined on a specific identification basis for the purpose of determining gains or losses on sales and buys to cover short positions. Dividend income, distributions to shareholders and dividend expense from securities sold short are recorded on the ex-dividend date. Interest income and interest expense from securities sold short is recorded on an accrual basis.
Foreign Currency: Foreign currency amounts are translated into U.S. dollars as follows: (i) assets and liabilities at the rate of exchange at the end of the respective period; and (ii) purchases and sales of securities and income and expenses at the rate of exchange prevailing on the dates of such transactions. The portion of realized/unrealized gains arising from changes in the exchange rates are included with the net realized/unrealized gain (loss) from affiliated and unaffiliated securities, securities sold short and foreign currency translations. Principal risks associated with such transactions include the movement in value of the foreign currency relative to the U.S. dollar and the ability of the counterparty to perform.
Notes to Financial Statements (Continued)
The Portfolios may also invest in forward currency contracts. Fluctuations in the value of such forward currency transactions are recorded daily as unrealized gain or loss; realized gain or loss includes net gain or loss on transactions that have terminated by settlement. These instruments involve securities and currency market risk, credit risk, or both kinds of risks, in excess of the amount recognized in the statements of assets and liabilities. Risks also arise from the possible inability of counterparties to meet the terms of their contracts. The Portfolios did not enter into forward currency contracts during the year ended December 31, 2018.
Allocation of Expenses: Expenses directly attributable to a Portfolio are charged directly to that Portfolio, while expenses which are attributable to more than one Portfolio are allocated among the respective Portfolios based upon relative net assets or some other reasonable method.
Use of Estimates: The preparation of financial statements in conformity with U.S. generally accepted accounting principles (GAAP) requires management to make estimates and assumptions that affect the reported amounts of assets and liabilities and disclosure of contingent assets and liabilities at the date of the financial statements and the reported amounts of increases and decreases in net assets from operations during the reporting period. Actual results could differ from those estimates.
Distributions to Shareholders: Dividends from net investment income, if any, are declared and paid annually for the Portfolios. Distributable net realized gains, if any, are declared and distributed at least annually.
Federal Income Taxes: It is the policy of each Portfolio to continue to qualify as a regulated investment company, as defined in the Internal Revenue Code, by complying with the provisions available to certain investment companies and to make distributions of net investment income and net realized capital gains sufficient to relieve it from all, or substantially all, federal income taxes. Accordingly, no provision for income taxes has been made in the Portfolios’ financial statements.
As of December 31, 2018, the Portfolios did not have any tax positions that did not meet the “more-likely-than-not” threshold of being sustained by the applicable tax authority. Open tax years are those that are open for exam by Federal and state taxing authorities. As of December 31, 2017, open Federal tax years include the tax years ended December 31, 2015 through December 31, 2018, and open New York tax years include the tax years ended December 31, 2015 through December 31, 2017. The Portfolios have no tax examinations in progress.
Fair Value Measurements: Valuation inputs used to determine the value of the Portfolios’ investments are summarized in the three broad levels listed below:
| | Level 1 — | Unadjusted quoted prices in active markets for identical assets and liabilities that the Funds have the ability to access. |
Notes to Financial Statements (Continued)
| | Level 2 — | Observable inputs other than quoted prices included in Level 1 that are observable for the asset or liability, either directly or indirectly. These inputs may include quoted prices for the identical instrument in an inactive market, prices for similar instruments, interest rates, prepayment speeds, credit risk, yield curves, default rates and similar data. |
| | | |
| | Level 3 — | Unobservable inputs for the asset or liability, to the extent relevant observable inputs are not available, representing the Funds’ own assumptions about the assumptions a market participant would use in valuing the asset or liability, and would be based on the best information available. |
The inputs or methodology used to value securities are not necessarily an indication of the risk associated with investing in those securities.
Portfolio securities listed or traded on securities exchanges, including ADRs, are valued at the closing price on the exchange or system where the security is principally traded or at the NASDAQ Official Closing Price. If there have been no sales for that day on the exchange or system, a security is valued at the mean of the highest closing bid and lowest asked prices on the exchange or system where the security is principally traded. These valuations are typically categorized as Level 1 in the fair value hierarchy.
In accordance with procedures adopted by the Board, fair value pricing may be used if events materially affecting the value of foreign securities occur between the times the exchange on which they are traded closes and the time the Portfolios’ net asset values are calculated. These valuations are categorized as Level 2 in the fair value hierarchy.
The following is a summary categorization, as of December 31, 2018, of each Portfolio’s investments based on the level of inputs utilized in determining the value of such investments:
| | | LEVEL 1 – Quoted Prices(1) | |
| | | NGF | | | NAGF | | | NSCGF | |
| Assets | | | | | | | | | |
Common Stocks(2) | | $ | 82,331,289 | | | $ | 41,340,051 | | | $ | 22,858,311 | |
| Closed-End Funds | | | — | | | | — | | | | 1,100,410 | |
| Short-Term Investments | | | 536,118 | | | | — | | | | 1,228,206 | |
| Liabilities | | | | | | | | | | | | |
Securities Sold Short(2) | | | (5,195,265 | ) | | | (2,926,675 | ) | | | (— | ) |
| Total | | $ | 77,672,142 | | | $ | 38,413,376 | | | $ | 25,186,927 | |
(1) | As of December 31, 2018, the Portfolios did not hold Level 2 or Level 3 investments. |
(2) | Please refer to the Schedule of Investments and Schedule of Securities Sold Short to view segregation by industry. |
4. Investment Advisory and Administrative Services
The Company has engaged Needham Investment Management L.L.C. (the “Adviser”) to manage its investments pursuant to an Investment Advisory Agreement. The Company pays the Adviser an investment advisory fee at the annual rate of 1.25% of the average daily net assets of each Portfolio.
Notes to Financial Statements (Continued)
The Adviser has entered into an agreement with the Company (the “Expense Limitation Agreement”) whereby the Adviser has contractually agreed to waive its investment advisory fee for, and to reimburse expenses of, NGF, NAGF and NSCGF in an amount that limits annual operating expenses to not more than 1.40% and 1.95% of the average daily net assets of the Fund’s Institutional Class and Retail Class, respectively (excluding taxes, interest, brokerage, dividends on short positions, acquired fund fees and expenses and extraordinary items, and excluding shareholder redemption fees but including the investment advisory fee stated in the Investment Advisory Agreement). The Expense Limitation Agreement is effective for the period from May 1, 2019 through April 30, 2020. The Expense Limitation Agreement shall continue in effect from year to year thereafter only upon mutual agreement of the Company and the Adviser. Similar agreements were in effect for certain prior periods.
Any reimbursements or fee waivers made by the Adviser in respect of a Portfolio are subject to recoupment by the Adviser, to the extent that the Portfolio is able to make the repayment within the expense limitation established in the Expense Limitation Agreement. Under the Expense Limitation Agreement, the Adviser has a right to receive from each Portfolio class reimbursement for fee waivers and/or expense reimbursements made pursuant to the Agreement for a period of up to 36 months from the time of any waiver or reimbursement. The table below contains the amounts of fee waivers and expense reimbursements subject to recapture by the Adviser through December 31 of the year indicated:
| | | 2021 | | | 2020 | | | 2019 | | | Total | |
| NGF (Retail Class) | | $ | — | | | $ | — | | | $ | — | | | $ | — | |
| NGF (Institutional Class) | | | 91,844 | | | | 84,071 | | | | — | | | | 175,915 | |
| NAGF (Retail Class) | | | 23,838 | | | | 18,700 | | | | 2,039 | | | | 44,577 | |
| NAGF (Institutional Class) | | | 83,507 | | | | 65,936 | | | | — | | | | 149,443 | |
| NSCGF (Retail Class) | | | 45,317 | | | | 50,855 | | | | 54,644 | | | | 150,816 | |
| NSCGF (Institutional Class) | | | 69,832 | | | | 48,693 | | | | — | | | | 118,525 | |
The Company and Fund Services (the “Administrator”) are parties to a Fund Administration Servicing Agreement. The Administrator provides administrative and fund accounting services pursuant to this agreement and, in consideration of these services, receives a fee computed daily and paid monthly at an annual rate based on a percentage of the value of each Portfolio’s assets. The Administrator is also compensated for any out of pocket expenses that are reasonably incurred in carrying out its duties under the Administration Agreement. The Administrator also provides transfer agent services pursuant to a Transfer Agent Servicing Agreement for additional fees.
Certain officers of the Company are also officers of the Adviser and/or Needham & Company, LLC (the “Distributor”). Such officers receive no fees from the Company for serving as officers of the Company. Each of the two Directors who is not an “interested person” (as defined in the 1940 Act) of the Company (each, an “Independent Director”) receives a quarterly retainer of $3,000 and a per-meeting fee of $500. Each Independent
Notes to Financial Statements (Continued)
Director is also a member of the Audit Committee of the Company’s Board of Directors and receives a fee of $500 per meeting attended. The Adviser provides an employee to serve as Chief Compliance Officer for the Company and to provide certain related services. An affiliate of the Adviser, Needham & Company, LLC, pays the Chief Compliance Officer’s compensation and the Company reimburses this affiliate for the Company’s allocated portion of the expense.
5. Distribution Plan
The Company has adopted an Amended and Restated Plan of Distribution pursuant to Rule 12b-1 under the 1940 Act. Under the Plan, each Portfolio may pay compensation to the Distributor or any other distributor or financial institution with which the Company has an agreement with respect to the Retail Class of each Portfolio, with the amount of such compensation not to exceed an annual rate of 0.25% of each Portfolio’s daily average net assets.
During the year ended December 31, 2018, NGF, NAGF and NSCGF incurred and paid brokerage commissions to the Distributor in the amount of $5,104, $6,473, and $20,242, respectively.
6. Temporary Borrowings
Each Portfolio may borrow from banks up to 25% of its total assets and may pledge its assets in connection with these borrowings, provided that no additional investments shall be made while borrowings exceed 5% of total assets.
The Portfolios did not engage in any temporary borrowings during the year ended December 31, 2018.
7. Short Sale Transactions
During the year ended December 31, 2018, each Portfolio sold securities short. Upon selling a security short, the Portfolios record an asset for the settlement amount as “Deposit with Broker for Securities Sold Short” and a corresponding liability, which is marked-to-market to reflect current value. The broker for the Portfolios’ short sale transactions requires maintenance by each Portfolio of a minimum amount of collateral at all times, regardless of whether any short sales are outstanding. To the extent necessary to meet the broker’s collateral requirements for open short positions, additional securities will be segregated above the minimum to cover the short positions. At December 31, 2018, the market value of securities separately segregated to cover short positions was $5,665,150, $4,678,877, and $1,029,213 for NGF, NAGF and NSCGF, respectively.
Additionally, the Portfolios had receivables for Deposit with Broker for Securities Sold Short of $5,575,398, $2,906,168 and $2 pledged as collateral with a broker in connection with any open short positions for NGF, NAGF, and NSCGF, respectively at December 31, 2018. Securities sold short at December 31, 2018 and their related market values and proceeds are set forth in the preceding Schedule of Securities Sold Short for NGF and NAGF.
Notes to Financial Statements (Continued)
8. Investment Transactions
The following summarizes the aggregate amount of the cost of purchases and proceeds from sales of investment securities and securities sold short, excluding short-term securities, during the year ended December 31, 2018:
| | | Purchases | | | Sales | |
| NGF | | | | | | |
| Long Transactions | | $ | 8,103,517 | | | $ | 29,378,091 | |
| Short Sale Transactions | | | 3,335,494 | | | | 477,392 | |
| NAGF | | | | | | | | |
| Long Transactions | | | 4,426,418 | | | | 18,866,427 | |
| Short Sale Transactions | | | 2,787,737 | | | | 477,391 | |
| NSCGF | | | | | | | | |
| Long Transactions | | | 27,682,777 | | | | 28,064,646 | |
| Short Sale Transactions | | | 405,955 | | | | 162,435 | |
There were no purchases or sales of U.S. government securities during the year ended December 31, 2018.
9. Financial Instruments With Off-Balance Sheet Risk
In the normal course of their business, the Portfolios may engage in transactions with off-balance sheet risk, including securities sold short, written options, futures, and forward currency contracts. Transactions in certain financial instruments represent future commitments to purchase or sell other financial instruments at specific terms at specified future dates. Each of these financial instruments contains varying degrees of off-balance sheet risk whereby changes in the market values of the securities underlying the financial instruments may be in excess of the amounts recognized in the financial statements.
Securities sold short represent obligations of the Portfolios to make future delivery of specific securities and, correspondingly, create an obligation to purchase the securities at market prices prevailing at a later delivery date (or to deliver the securities if already owned by the Portfolios). As a result, short sales create the risk that the Portfolios’ ultimate obligation to satisfy the delivery requirements may exceed the amount of the proceeds initially received on the liability recorded in the financial statements.
10. Indemnification
Under the Company’s organizational documents, its Directors and Officers are indemnified against certain liabilities arising out of the performance of their duties to the Company. In addition, in the ordinary course of business, the Company enters into contracts that contain a variety of indemnifications. The Company’s maximum exposure under these arrangements is unknown. However, the Company has not had prior claims or losses pursuant to these contracts and expects the risk of loss to be remote.
11. Transactions with Affiliates
NAGF owned 5% or more of the voting securities of the following company during the year ended December 31, 2018. As a result, this company is deemed to be an affiliate of NAGF
Notes to Financial Statements (Continued)
as defined by the 1940 Act. Transactions during the year in this affiliated company were as follows:
| | | | | Net Change | Net | | | Share |
| | Value At | | | in Unrealized | Realized | | Value | Balance |
| Security | Dec. 31, | Value of | Value of | Appreciation | Gains | Dividend | Dec. 31, | Dec. 31, |
Name | 2017 | Purchases | Sales | (Depreciation) | (Losses) | Income | 2018 | 2018 |
| GSE | | | | | | | | |
| Systems, | | | | | | | | |
| Inc. | $3,640,000 | $— | $— | $(1,288,000) | $— | $— | $2,352,000 | 1,120,000 |
12. Federal Income Taxes
No provision for federal income taxes is required since the Company intends to continue to qualify as a regulated investment company under Subchapter M of the Internal Revenue Code and distribute substantially all of its taxable income and capital gains to shareholders. Because income tax regulations differ from GAAP, the timing and character of income and capital gain distributions determined in accordance with tax regulations can differ from income and capital gains recognized for financial reporting purposes. Accordingly, the character of distributions and the composition of net assets for tax purposes can differ from those reflected in the financial statements. These book/tax differences may be temporary or permanent in nature. Temporary differences are generally due to differing book and tax treatment for the timing of the recognition of gains and losses on securities, including post-October losses (as described below). Permanent differences are generally due to differing treatment of net investment losses. To the extent these differences are permanent, they are charged or credited to paid-in capital or distributable earnings, accumulated net realized gain (loss), or accumulated net investment income (loss), as appropriate, in the period in which the differences arise. These reclassifications have no effect on net assets or net asset value per share of each Portfolio.
As of December 31, 2018, the cost, gross unrealized appreciation, gross unrealized depreciation, and the net unrealized appreciation (depreciation) on securities, including proceeds from securities sold short for federal income tax purposes, were as follows:
| | | | | | | | | | | | Net | |
| | | | | | Gross | | | Gross | | | Unrealized | |
| | | | | | Unrealized | | | Unrealized | | | Appreciation | |
| | | Cost | | | Appreciation | | | Depreciation | | | (Depreciation) | |
| NGF | | $ | 41,430,094 | | | $ | 44,114,649 | | | $ | (7,872,601 | ) | | $ | 36,242,048 | |
| NAGF | | | 22,176,537 | | | | 20,551,457 | | | | (4,314,618 | ) | | | 16,236,839 | |
| NSCGF | | | 27,552,841 | | | | 1,900,346 | | | | (4,266,260 | ) | | | (2,365,914 | ) |
The difference between the tax cost of investments and the cost of investments for GAAP purposes is primarily due to the tax treatment for wash sale losses.
As of December 31, 2018, the components of distributable earnings (loss) on a tax basis were as follows:
Notes to Financial Statements (Continued)
| | | NGF | | | NAGF | | | NSCGF | |
| Undistributed ordinary income | | $ | — | | | $ | — | | | $ | — | |
| Undistributed long-term capital gains | | | 7,994,747 | | | | 1,520,298 | | | | — | |
| Unrealized appreciation (depreciation) | | | 36,242,048 | | | | 16,236,839 | | | | (2,365,914 | ) |
| Other accumulated gains (loss) | | | (3,147 | ) | | | — | | | | (124,284 | ) |
| Total accumulated earnings (loss) | | $ | 44,233,648 | | | $ | 17,757,137 | | | $ | (2,490,198 | ) |
The tax character of distributions paid during the year ended December 31, 2018 was as follows:
| | | NGF | | | NAGF | | | NSCGF | |
| Ordinary income | | $ | — | | | $ | — | | | $ | 2,522,946 | |
| Net long-term capital gains | | | 13,467,264 | | | | 6,200,868 | | | | 2,691,253 | |
| Return of capital | | | — | | | | — | | | | — | |
| Total distributions paid | | $ | 13,467,264 | | | $ | 6,200,868 | | | $ | 5,214,199 | |
In 2018 a portion of such dividends was distributed in connection with NEEGX, NEAGX, and NESGX redemptions.
The tax character of distributions paid during the year ended December 31, 2017 was as follows:
| | | NGF | | | NAGF | | | NSCGF | |
| Ordinary income | | $ | 66,959 | | | $ | — | | | $ | 2,019,133 | |
| Net long-term capital gains | | | 10,413,410 | | | | 3,108,250 | | | | 345,430 | |
| Return of capital | | | — | | | | — | | | | — | |
| Total distributions paid | | $ | 10,480,369 | | | $ | 3,108,250 | | | $ | 2,364,563 | |
Under current tax law, capital and currency losses realized after October 31 of a Portfolio’s fiscal year may be deferred and treated as occurring on the first business day of the following fiscal year for tax purposes. The following Portfolios had deferred post-October capital and currency losses, which will be treated as arising on the first business day of the year ended of December 31, 2018.
| | NGF | $ 3,147 | |
| | NAGF | — | |
| | NSCGF | 124,284 | |
As of December 31, 2018, none of the Portfolios had accumulated capital loss carryovers.
13. New Accounting Pronouncements
In August 2018, the Securities and Exchange Commission released its Final Rule on Disclosure Update and Simplification (the “Final Rule”) which is intended to simplify an issuer’s disclosure compliance efforts by removing redundant or outdated disclosure requirements without significantly altering the mix of information provided to investors. Effective with the current reporting period, the Company adopted the Final Rule with the most notable impacts being that the Company is no longer required to present the components of distributable earnings on the Statement of Assets and Liabilities or the sources of distributions to shareholders and the amount of undistributed net investment income on the Statements of Changes in Net Assets. The tax components of distributable earnings and distributions to shareholders continue to be disclosed within the Notes to Financial Statements.
Report of Independent Registered Public Accounting Firm
To the shareholders and board of directors
The Needham Funds, Inc.:
Opinion on the Financial Statements
We have audited the accompanying statements of assets and liabilities of the Needham Growth Fund, Needham Aggressive Growth Fund and Needham Small Cap Growth Fund, each a “Portfolio” of The Needham Funds, Inc. (collectively, the “Portfolios”), including the schedules of investments and schedules of securities sold short, as of December 31, 2018, the related statements of operations for the year then ended, the statements of changes in net assets for each of the years in the two-year period then ended, and the related notes (collectively, the “financial statements”) and the financial highlights for each of the years in the five-year period then ended. In our opinion, the financial statements and financial highlights present fairly, in all material respects, the financial position of the Portfolios as of December 31, 2018, the results of their operations for the year then ended, the changes in their net assets for each of the years in the two-year period then ended, and the financial highlights for each of the years in the five-year period then ended, in conformity with U.S. generally accepted accounting principles.
Basis for Opinion
These financial statements and financial highlights are the responsibility of the Portfolios’ management. Our responsibility is to express an opinion on these financial statements and financial highlights based on our audits. We are a public accounting firm registered with the Public Company Accounting Oversight Board (United States) (“PCAOB”) and are required to be independent with respect to the Portfolios in accordance with the U.S. federal securities laws and the applicable rules and regulations of the Securities and Exchange Commission and the PCAOB.
We conducted our audits in accordance with the standards of the PCAOB. Those standards require that we plan and perform the audit to obtain reasonable assurance about whether the financial statements and financial highlights are free of material misstatement, whether due to error or fraud. Our audits included performing procedures to assess the risks of material misstatement of the financial statements and financial highlights, whether due to error or fraud, and performing procedures that respond to those risks. Such procedures included examining, on a test basis, evidence regarding the amounts and disclosures in the financial statements and financial highlights. Such procedures also included confirmation of securities owned as of December 31, 2018, by correspondence with custodians and brokers. Our audits also included evaluating the accounting principles used and significant estimates made by management, as well as evaluating the overall presentation of the financial statements and financial highlights. We believe that our audits provide a reasonable basis for our opinion.
We have served as the auditor of The Needham Funds, Inc. since 2011.
New York, New York
March 1, 2019
Information about Directors and Officers (Unaudited)
December 31, 2018
Information pertaining to the Directors and Officers of the Company is set forth below. The Statement of Additional Information (SAI) includes additional information about the Directors and is available without charge, upon request, by calling 800-625-7071.
The address of each individual is 250 Park Avenue, New York, NY 10177. Each Director serves until the next annual shareholders meeting or until his successor is elected and qualified.
| | Term of Office | Portfolios in the | Principal Occupations(s) |
| Name, Year of Birth | and Length of | Fund Complex | During Past 5 Years |
| and Position with | Term Served by | Overseen by | and Other Directorships |
| the Company | Director/Officer | Director/Officer | Held by Director/Officer |
| Independent Directors |
| John W. Larson, | Indefinite; | Three | Currently retired. Partner at the law |
| Year of Birth: 1935 | Since 2006 | | firm of Morgan, Lewis & Bockius LLP |
| Director | | | from 2003 until retiring in December |
| | | | 2009. Partner at the law firm of |
| | | | Brobeck, Phleger & Harrison LLP from |
| | | | 1969 until 2003. From July 1971 to |
| | | | September 1973 worked in government |
| | | | service as Assistant Secretary of the |
| | | | United States Department of the Interior |
| | | | and Counselor to George P. Schultz, |
| | | | Chairman of the Cost of Living |
| | | | Council. Director of Wage Works, Inc. |
| | | | (an employee benefits company) from |
| | | | 2000 until 2018. Director of Sangamo |
| | | | BioSciences, Inc. since 1996. |
| F. Randall Smith, | Indefinite; | Three | Founder, Member of Investment |
| Year of Birth: 1938 | Since 1996 | | Committee, Investment Analyst and |
| Director | | | Portfolio Manager of Capital Counsel |
| | | | LLC (a registered investment adviser) |
| | | | since September 1999; President from |
| | | | 1999 to 2014. Co-founder and Chief |
| | | | Investment Officer of Train, Smith |
| | | | Counsel (a registered investment |
| | | | adviser) from 1975 to 1999. |
| Interested Director |
| George A. Needham*, | Indefinite; | Three | Chairman of the Board and Chief |
| Year of Birth: 1943 | Since 1996 | | Executive Officer of The Needham |
| Chairman, President | | | Group, Inc. and Needham Holdings, |
| and Director | | | LLC since December 2004. Chairman |
| | | | of the Board and Chief Executive Officer |
| | | | of Needham Asset Management, LLC |
| | | | since April 2006. Chairman of the |
| | | | Board from 1996 to December 2004 |
| | | | and Chief Executive Officer from 1985 |
| | | | to December 2004 of Needham & |
| | | | Company, LLC. Managing Member of |
| | | | Needham Capital Management, LLC |
| | | | since 2000. |
Information about Directors and Officers (Unaudited) (Continued)
December 31, 2018
| | Term of Office | Portfolios in the | Principal Occupations(s) |
| Name, Year of Birth | and Length of | Fund Complex | During Past 5 Years |
| and Position with | Term Served by | Overseen by | and Other Directorships |
| the Company | Director/Officer | Director/Officer | Held by Director/Officer |
| Officers |
| John Barr, | One year; | Two | Portfolio Manager of Needham |
| Year of Birth 1956 | Since 2010 | | Asset Management since 2010. |
| Executive Vice President | | | Founding and Managing Member |
| and Co-Portfolio | | | of Oliver Investment Management, |
| Manager of the Needham | | | LLC from 2008 to 2009. Manager |
| Growth Fund, Executive | | | and Analyst at Buckingham Capital |
| Vice President and | | | from 2002 to 2008. Managing |
| Portfolio Manager of | | | Director and a Senior Analyst at |
| the Needham Aggressive | | | Robertson Stephens following |
| Growth Fund. | | | semiconductor companies from |
| | | | 2000 to 2002. From 1995 to 2000, |
| | | | Managing Director and Senior Analyst |
| | | | at Needham and Company, LLC, |
| | | | also served as Director of Research. |
| | | | Director of Coventor, Inc. since 2009. |
| Chris Retzler, | One year; | Two | Portfolio Manager of Needham |
| Year of Birth: 1971 | Since 2008 | | Asset Management, LLC since 2008. |
| Executive Vice President | | | Vice President of Needham Asset |
| and Co-Portfolio | | | Management, LLC since 2005. |
| Manager of the | | | Head of Winterkorn, a healthcare |
| Needham Growth Fund, | | | manufacturing and distribution |
| Executive Vice President | | | company, from 2002 to 2005. |
| and Portfolio Manager | | | |
| of the Needham | | | |
| Small Cap Growth Fund. | | | |
| James W. Giangrasso, | One year; | Three | Chief Financial Officer of |
| Year of Birth: 1962 | Since 2011 | | Needham Asset Management, LLC |
| Chief Financial Officer, | | | since 2011. Principal and |
| Treasurer and Secretary | | | Controller of Needham Asset |
| | | | Management, LLC since 2006. |
| James M. Abbruzzese, | One year; | Three | Chief Compliance Officer of |
| Year of Birth: 1969 | Since 2004 | | Needham Asset Management, LLC |
| Chief Compliance Officer | | | since April 2006. Chief Compliance |
| | | | Officer and Managing Director of |
| | | | Needham & Company, LLC from 2008 |
| | | | through 2012. Chief Administrative |
| | | | Officer of Needham & Company, LLC |
| | | | since 2012. Chief Compliance Officer |
| | | | of Needham Capital Management, LLC |
| | | | since 2000. |
| * | An “interested person”, as defined in the 1940 Act, of the Company or the Company’s investment adviser. Mr. Needham is deemed to be an interested person because of his affiliation with the Portfolios’ Adviser and the Portfolios’ Distributor, and because he is an officer of the Company. |
Supplementary Information (Unaudited)
December 31, 2018
Federal Income Tax Information
For the fiscal year ended December 31, 2018, certain dividends paid by the Portfolios may be subject to a maximum tax rate of 23.8%, as provided by the Jobs and Growth Tax Relief Reconciliation Act of 2003. The percentage of dividends declared from ordinary income reported as qualified dividend income was as follows:
| NGF | 0.00% | |
| NAGF | 0.00% | |
| NSCGF | 4.67% | |
For corporate shareholders, the percent of ordinary income distributions qualifying for the corporate dividends received deduction for the fiscal year ended December 31, 2018 was as follows:
| NGF | 0.00% | |
| NAGF | 0.00% | |
| NSCGF | 2.35% | |
The percentage of taxable ordinary income distributions that are designed as short-term capital gain distributions under Internal Revenue Section 871 (k)(2)(C) for each Fund were as follows:
| NGF | 0.00% | |
| NAGF | 0.00% | |
| NSCGF | 100.00% | |
Privacy Policy
It is the policy of the Company to keep personally identifiable financial information about you as an individual (‘’nonpublic personal information’’) confidential, and use or disclose it only as necessary to provide services to you or the Company or as otherwise required or permitted by law. We may collect the following nonpublic personal information about you:
| | • | Information we receive from you on or in applications or other forms, correspondence, or conversations, including, but not limited to, your name, address, phone number, social security number, assets, income and date of birth; and |
| | | |
| | • | Information about your transactions with us, our affiliates, or others, including, but not limited to, your account number and balance, payments history, parties to transactions, cost basis information, other financial information and information about how you vote your shares. |
Supplementary Information (Unaudited) (Continued)
December 31, 2018
We disclose nonpublic personal information about current and former shareholders to companies that provide necessary services to the Company. These companies include the transfer agent, distributor, administrator and investment adviser as well as other affiliates of the Company. We maintain physical, electronic and procedural safeguards that comply with federal standards to guard your nonpublic personal information and restrict access to this information to those persons who need it to provide services to you or the Company or who are otherwise permitted by law to receive it. In the event that you hold any shares of our funds through a financial intermediary, including, but not limited to, a broker-dealer, bank, or trust company, the privacy policy of your financial intermediary governs how your nonpublic personal information is shared with nonaffiliated third parties.
If you have any questions concerning the Company’s Privacy Policy, please call 1-800-625-7071.
Disclosure of Portfolio Holdings
The Company files a Form N-Q with the Securities and Exchange Commission (the “SEC”) no more than sixty days after the Company’s first and third fiscal quarters. For the Company, this would be for the fiscal quarters ending March 31 and September 30. Form N-Q includes a complete schedule of the Company’s portfolio holdings as of the end of those fiscal quarters. The Company’s N-Q filings are available without charge, upon request, by calling 800-625-7071 or on the SEC’s website at http://www.sec.gov.
Voting Proxies on Company Portfolio Securities
A description of the policies and procedures that the Company uses to determine how to vote proxies relating to portfolio securities and information regarding how the Company voted proxies relating to portfolio securities during the most recent 12-month period ended June 30 are available without charge, upon request, by calling 800-625-7071 or on the SEC’s website at http://www.sec.gov.
Household Delivery of Shareholder Documents
To reduce expenses, the Company may mail only one copy of the Portfolios’ prospectuses, proxy statements, information statements, and each annual and semi-annual report to those addresses shared by two or more accounts. If you wish to receive individual copies of these documents, please call the Portfolios at 1-800-625-7071 or contact your financial institution. You will begin receiving individual copies thirty days after receiving your request.
Index Disclaimer
The Needham Growth Fund, the Needham Aggressive Growth Fund and the Needham Small Cap Growth Fund (collectively, the “Funds”) have been developed solely by Needham Investment Management L.L.C. (the “Adviser”). The Funds are not in any way connected to or sponsored, endorsed, sold or promoted by the London Stock Exchange Group plc and its group undertakings (collectively, the “LSE Group”). FTSE Russell is a trading name of certain of the LSE Group companies.
Supplementary Information (Unaudited) (Continued)
December 31, 2018
All rights in the Russell 2000 Total Return Index, the Russell 2000 Index and the Russell 3000 Index (collectively, the “Indexes”) vest in the relevant LSE Group company which owns the Index. “Russell®” is a trade mark of the relevant LSE Group company and is used by any other LSE Group company under license.
The Indexes are calculated by or on behalf of FTSE International Limited or its affiliate, agent or partner. The LSE Group does not accept any liability whatsoever to any person arising out of (a) the use of, reliance on or any error in the Indexes or (b) investment in or operation of the Funds. The LSE Group makes no claim, prediction, warranty or representation either as to the results to be obtained from the Funds or the suitability of the Indexes for the purpose to which it is being put by the Adviser.
The source of the data for each of the Indexes is the LSE Group. © LSE Group 2019. All rights in the Indexes or data vest in the relevant LSE Group company which owns the Index or the data. Neither LSE Group nor its licensors accept any liability for any errors or omissions in the Indexes or data and no party may rely on any Indexes or data contained in this communication. No further distribution of data from the LSE Group is permitted without the relevant LSE Group company’s express written consent. The LSE Group does not promote, sponsor or endorse the content of this communication.
Board Consideration and Approval of Investment Advisory Agreement
On October 23, 2018, at a meeting called for the purpose of voting on such approval, the Board, including all of the Independent Directors, approved the continuance of the Investment Advisory Agreement (the “Advisory Agreement”) between the Company and the Adviser with respect to NGF, NAGF and NSCGF. In doing so, the Board reviewed materials provided by the Adviser to assist them in making a determination (the “Board Materials”). The Independent Directors were assisted in their review by independent legal counsel and met with counsel in executive session separate from representatives of the Adviser. In considering the renewal of the Advisory Agreement, the Board considered the nature, extent, and quality of the services to be provided by the Adviser; the investment performance of each Portfolio and the Adviser; the costs of the services to be provided and profits to be realized by the Adviser and its affiliates from the relationship with each Portfolio; the extent to which economies of scale would be realized as the Portfolios grow; and whether fee levels reflect these economies of scale for the benefit of investors.
The Directors stated that their consideration of the continuance of the Advisory Agreement included consideration of the peer group comparisons in the Board Materials to other investment companies with similar investment objectives and to each Portfolio’s unmanaged indices for various periods ended September 30, 2018, noting that NGF’s performance was above its peer group average and median performance for the since inception periods and above the average and median performance of the relevant Morningstar Universes (with the exception of the Morningstar Small Cap Universe average) for the since inception period. For NAGF, the Directors noted that the Portfolio’s performance was above the peer group average performance for the 10-year period, but
Supplementary Information (Unaudited) (Continued)
December 31, 2018
below the average and median performance of the peer group and the relevant Morningstar Universes in each of the other time periods. For NSCGF, the Directors noted that the Portfolio’s performance was above the average and median performance of the peer group and the relevant Morningstar Universes for the 3-year period. It was further noted that the Portfolios’ performance compared favorably to the longer term performance of their respective benchmark indices. In addition to reviewing each Portfolio’s performance and the profitability analysis of the Adviser, the Directors considered possible economies of scale, but did not believe material economies of scale to be present in light of the Portfolios’ asset size and redemption trends.
In their deliberations, the Directors considered all factors they believed relevant in addition to the performance comparisons described above, including the following: the nature, extent and quality of services rendered by the Adviser; the costs borne by, and profitability of, and other benefits to, the Adviser and its affiliates in providing services to each Portfolio; comparative fee and expense data for each Portfolio and other investment companies with similar investment objectives (having been advised that the Adviser does not manage other accounts with investment objectives and strategies similar to those of the Portfolios except private investment funds with fee structures that include performance fees); whether expenses of NGF, NAGF and NSCGF might be expected to decline as a percentage of net assets as NGF, NAGF and NSCGF assets increase (although there had not been a significant increase in assets in recent years); the professional experience and qualifications of each Portfolio’s portfolio manager(s) and other personnel of the Adviser, including the fact that a high caliber of personnel was both needed and provided to meet the needs of NGF, NAGF and NSCGF (specifically with respect to investments in securities sold short); and the terms of the Advisory Agreement. The Independent Directors confirmed that they had received adequate information to make a reasonable determination with respect to the approval of the Advisory Agreement. After full consideration of all the foregoing factors, the Board determined to approve the renewal of the Advisory Agreement.
250 Park Avenue, 10th Floor
New York, New York 10177
1-800-625-7071
Investment Adviser:
Needham Investment Management L.L.C.
250 Park Avenue, 10th Floor
New York, New York 10177
President
George A. Needham
Executive Vice Presidents and Portfolio Managers
John Barr
Needham Growth Fund
Needham Aggressive Growth Fund
Chris Retzler
Needham Growth Fund
Needham Small Cap Growth Fund
Directors
George A. Needham
John W. Larson
F. Randall Smith
Distributor:
Needham & Company, LLC
250 Park Avenue, 10th Floor
New York, New York 10177
212-371-8300
Administrator, Shareholder Servicing Agent, and Transfer Agent:
U.S. Bancorp Fund Services, LLC, doing business as U.S. Bank Global Fund Services
615 East Michigan Street
Milwaukee, WI 53202
Custodian:
U.S. Bank, N.A.
1555 North RiverCenter Drive
Milwaukee, WI 53212
Counsel:
Proskauer Rose LLP
Eleven Times Square
New York, NY 10036-8299
Independent Registered Public Accounting Firm:
KPMG LLP
345 Park Avenue
New York, NY 10154
Item 2. Code of Ethics.
The registrant has adopted a code of ethics that applies to the registrant’s principal executive officer and principal financial officer. The registrant has not made amendments to its code of ethics during the period covered by this report. The registrant has not granted any waivers from any provisions of the code of ethics during the period covered by this report.
A copy of the registrant’s Code of Ethics is filed herewith.
Item 3. Audit Committee Financial Expert.
The registrant’s board of directors has determined that there is at least one audit committee financial expert serving on its audit committee. F. Randall Smith is the “audit committee financial expert” and is considered to be “independent” as each term is defined in Item 3 of Form N‑CSR.
Item 4. Principal Accountant Fees and Services.
The registrant has engaged its principal accountant to perform audit services, audit-related services, tax services and other services during the past two fiscal years. “Audit services” refer to performing an audit of the registrant's annual financial statements or services that are normally provided by the accountant in connection with statutory and regulatory filings or engagements for those fiscal years. “Audit-related services” refer to the assurance and related services by the principal accountant that are reasonably related to the performance of the audit. “Tax services” refer to professional services rendered by the principal accountant for tax compliance, tax advice, and tax planning. “Other services” provided by the principal accountant were not applicable. The following table details the aggregate fees billed or expected to be billed for each of the last two fiscal years for audit fees, audit-related fees, tax fees and other fees by the principal accountant.
| | FYE 12/31/2018 | FYE 12/31/2017 |
| Audit Fees | $78,500 | $75,800 |
| Audit-Related Fees | $ 0 | $ 0 |
| Tax Fees | $23,040 | $22,365 |
| All Other Fees | $ 0 | $ 0 |
The audit committee has adopted pre-approval policies and procedures that require the audit committee to pre‑approve all audit and non‑audit services of the registrant, including services provided to any entity affiliated with the registrant.
The percentage of fees billed by KPMG LLP applicable to non-audit services pursuant to waiver of pre-approval requirement were as follows:
| | FYE 12/31/2018 | FYE 12/31/2017 |
| Audit-Related Fees | 0% | 0% |
| Tax Fees | 0% | 0% |
| All Other Fees | 0% | 0% |
All of the principal accountant’s hours spent on auditing the registrant’s financial statements were attributed to work performed by full‑time permanent employees of the principal accountant.
The following table indicates the non-audit fees billed or expected to be billed by the registrant’s accountant for services to the registrant and to the registrant’s investment adviser (and any other controlling entity, etc.—not sub-adviser) for the last two years. The audit committee of the board of trustees/directors has considered whether the provision of non-audit services that were rendered to the registrant's investment adviser is compatible with maintaining the principal accountant's independence and has concluded that the provision of such non-audit services by the accountant has not compromised the accountant’s independence.
| Non-Audit Related Fees | FYE 12/31/2018 | FYE 12/31/2017 |
| Registrant | $0 | $0 |
| Registrant’s Investment Adviser | $7,900 | $7,900 |
Item 5. Audit Committee of Listed Registrants.
Not applicable to registrants who are not listed issuers (as defined in Rule 10A-3 under the Securities Exchange Act of 1934).
Item 6. Investments.
(a) | Schedule of Investments is included as part of the report to shareholders filed under Item 1 of this Form. |
Item 7. Disclosure of Proxy Voting Policies and Procedures for Closed-End Management Investment Companies.
Not applicable to open-end investment companies.
Item 8. Portfolio Managers of Closed-End Management Investment Companies.
Not applicable to open-end investment companies.
Item 9. Purchases of Equity Securities by Closed‑End Management Investment Company and Affiliated Purchasers.
Not applicable to open-end investment companies.
Item 10. Submission of Matters to a Vote of Security Holders.
Not Applicable.
Item 11. Controls and Procedures.
| (a) | The Registrant’s Chief Executive Officer and Chief Financial Officer have reviewed the Registrant's disclosure controls and procedures (as defined in Rule 30a-3(c) under the Investment Company Act of 1940 (the “Act”)) as of a date within 90 days of the filing of this report, as required by Rule 30a-3(b) under the Act and Rules 13a-15(b) or 15d‑15(b) under the Securities Exchange Act of 1934. Based on their review, such officers have concluded that the disclosure controls and procedures are effective in ensuring that information required to be disclosed in this report is appropriately recorded, processed, summarized and reported and made known to them by others within the Registrant and by the Registrant’s service provider. |
| (b) | There were no changes in the Registrant's internal control over financial reporting (as defined in Rule 30a-3(d) under the Act) that occurred during the Registrant’s first fiscal half-year of the period covered by this report that has materially affected, or is reasonably likely to materially affect, the Registrant's internal control over financial reporting. |
Item 12. Disclosure of Securities Lending Activities for Closed-End Management Investment Companies
Not applicable to open-end investment companies.
Item 13. Exhibits.
| (a) | (1) Any code of ethics or amendment thereto, that is the subject of the disclosure required by Item 2, to the extent that the registrant intends to satisfy Item 2 requirements through filing an exhibit. Filed herewith. |
(2) A separate certification for each principal executive and principal financial officer pursuant to Section 302 of the Sarbanes-Oxley Act of 2002. Filed herewith.
(3) Any written solicitation to purchase securities under Rule 23c‑1 under the Act sent or given during the period covered by the report by or on behalf of the registrant to 10 or more persons. Not applicable to open-end investment companies.
| (b) | Certifications pursuant to Section 906 of the Sarbanes‑Oxley Act of 2002. Furnished herewith. |
SIGNATURES
Pursuant to the requirements of the Securities Exchange Act of 1934 and the Investment Company Act of 1940, the registrant has duly caused this report to be signed on its behalf by the undersigned, thereunto duly authorized.
(Registrant) The Needham Funds, Inc.
By (Signature and Title) /s/George A. Needham
George A. Needham, President (Chief Executive Officer)
Date March 8, 2019
Pursuant to the requirements of the Securities Exchange Act of 1934 and the Investment Company Act of 1940, this report has been signed below by the following persons on behalf of the registrant and in the capacities and on the dates indicated.
By (Signature and Title) /s/George A. Needham
George A. Needham, President (Chief Executive Officer)
Date March 8, 2019
By (Signature and Title) /s/James W. Giangrasso
James W. Giangrasso, Treasurer and Secretary (Chief Financial Officer)
Date March 8, 2019