UNITED STATES
SECURITIES AND EXCHANGE COMMISSION
Washington, D.C. 20549
FORM N-CSR
CERTIFIED SHAREHOLDER REPORT OF REGISTERED
MANAGEMENT INVESTMENT COMPANIES
Investment Company Act file number 811-09114
The Needham Funds, Inc.
(Exact name of registrant as specified in charter)
445 Park Avenue, New York, NY 10022-2606
(Address of principal executive offices) (Zip code)
Mr. George A. Needham, 445 Park Avenue, New York, NY 10022-2606
(Name and address of agent for service)
1-800-625-7071
Registrant's telephone number, including area code
Date of fiscal year end: December 31, 2016
Date of reporting period: December 31, 2016
Item 1. Reports to Stockholders.
Annual
Report
Needham Funds
Seeking to build wealth for long-term investors.
December 31, 2016
Needham Growth Fund
Needham Aggressive Growth Fund
Needham Small Cap Growth Fund
www.needhamfunds.com
445 Park Avenue
New York, New York 10022-2606
1-800-625-7071
www.needhamfunds.com
Annual Report
December 31, 2016
| Contents | | |
| Letter from the Adviser | | | 1 |
| Portfolio Characteristics | | | |
| Needham Growth Fund | | | 12 |
| Needham Aggressive Growth Fund | | | 14 |
| Needham Small Cap Growth Fund | | | 16 |
| Disclosure of Fund Expenses | | | 18 |
| Schedules of Investments | | | |
| Needham Growth Fund | | | 20 |
| Needham Aggressive Growth Fund | | | 25 |
| Needham Small Cap Growth Fund | | | 30 |
| Schedule of Securities Sold Short | | | |
| Needham Growth Fund | | | 24 |
| Needham Aggressive Growth Fund | | | 29 |
| Needham Small Cap Growth Fund | | | 33 |
| Statements of Assets and Liabilities | | | 34 |
| Statements of Operations | | | 36 |
| Statements of Changes in Net Assets | | | 37 |
| Financial Highlights | | | |
| Needham Growth Fund | | | 40 |
| Needham Aggressive Growth Fund | | | 42 |
| Needham Small Cap Growth Fund | | | 44 |
| Notes to Financial Statements | | | 46 |
| Report of Independent Registered Public Accounting Firm | | | 55 |
| Information about Directors and Officers | | | 56 |
| Supplementary Information and Privacy Policy | | | 58 |
This report is authorized for distribution to prospective investors only when preceded or accompanied by a current prospectus. The prospectus contains more complete information, including investment objectives, risks, expenses and charges and should be read carefully before investing or sending any money. To obtain a prospectus or summary prospectus, please call 1-800-625-7071.
Portfolios of The Needham Funds, Inc., like all mutual funds:
| | • | Are NOT FDIC insured |
| | • | Have no bank guarantee |
| | • | May lose value |
The Needham Funds, Inc. are distributed by Needham & Company, LLC.
Annual Report 2016
| | 445 Park Avenue |
| | New York, NY 10022 |
| | (800) 625-7071 |
| | www.needhamfunds.com |
February 2017
Dear Shareholders, Friends of Needham and Prospective Shareholders,
We are pleased to report results for the fourth quarter and the year ending December 31, 2016 for the Needham Growth Fund, Needham Aggressive Growth Fund, and Needham Small Cap Growth Fund. Our mission is to create wealth for long-term investors. Capped by the post-election rally, the fourth quarter was a good quarter and 2016 was a very good year.
Needham Funds’ Fourth Quarter
In the fourth quarter, the Needham Growth Fund returned 3.43%, the Needham Aggressive Growth Fund returned 10.19%, and the Needham Small Cap Growth Fund returned 7.78%. The Russell 2000 Total Return Index returned 8.83%, the S&P 500 Total Return Index returned 3.82%, and the NASDAQ Composite Index returned 1.69%.
For the year 2016, the Needham Growth Fund returned 10.57%, the Needham Aggressive Growth Fund returned 22.18%, and the Needham Small Cap Growth Fund returned 31.26%. The Russell 2000 Total Return Index returned 21.31%, the S&P 500 Total Return Index returned 11.96%, and the NASDAQ Composite Index returned 8.97%.
For the one year period ending December 30, 2016, Needham Aggressive Growth Fund was ranked 2nd out of 389 Mid Cap Growth funds by The Wall Street Journal, based on total return1. The average fund in the category returned 5.90%.
For the one year period ending December 30, 2016, the Needham Small Cap Growth Fund was ranked 9th out of 874 Small Cap Core funds by The Wall Street Journal, based on total return2. The average Small Cap Core fund in the category returned 20.59%.
Availability of a New Institutional Share Class
We are pleased to announce that Needham Funds created an Institutional share class, effective December 30, 2016. The purpose of the Institutional class is to offer a lower cost option to our investors who have a substantial amount invested in The Needham Funds. Highlights of the new share class, as detailed in the prospectus available at www.needhamfunds.com/literature.html, are:
| | • | $100,000 investment minimum (aggregation permitted); |
| | • | No 12b-1 fees; |
| | • | An expense ratio capped at 1.40% (not including shorting and interest/dividend expenses); and |
| | • | Tax-free conversions from the retail shares. |
____________
1 | http://online.wsj.com/mdc/public/page/2_3061-mfq16_4_CategoryKings.html |
2 | http://online.wsj.com/mdc/public/page/2_3061-mfq16_4_CategoryKings.html |
Needham Funds
Institutional shares are currently available on Fidelity, Schwab, Pershing, and Raymond James platforms and for direct shareholders of Needham Funds. We are working to broaden distribution of these lower cost shares and encourage you to contact your financial advisor or intermediary about when you might find them available.
The institutional ticker symbols are Needham Growth Fund (NEEIX), Needham Aggressive Growth Fund (NEAIX) and Needham Small Cap Growth Fund (NESIX). The Needham retail share fund class is available as before under the ticker symbols NEEGX, NEAGX and NESGX.
Review of 2016
Our theme for the first half of 2016 was “Fears Overcome.” 2016 started with an unprecedented sell-off amidst fear of a stock market crash, devaluation in China, and a slowing world economy. Energy companies and their bankers were hurt as West Texas Intermediate oil hit a low of $26.21 per barrel.
In late January, Japan announced a surprise interest rate cut, which placed rates at -0.1% for financial firms with deposits at the Bank of Japan. In late January, we learned that 4Q15 GDP growth was just 0.7%. At the low in mid-February, the Russell 2000 was down 16% and the S&P 500 was down 11%. On February 10, Janet Yellen reiterated to Congress the Federal Reserve’s cautious stance in raising interest rates and would not take negative rates off the table. Russia, Saudi Arabia, Venezuela, and Qatar announced an oil production cutback, which, at the time, appeared to have teeth. Oil closed the first quarter at $40 per barrel. The rebound was aided by the weak dollar, which fell 4.5% versus the DXY index, a basket of currencies. All three Needham Funds outperformed during the sell-off and trailed the averages on the rebound.
In the second quarter, the markets continued to overcome fear. In April, we learned that first quarter GDP growth was just 0.5%. The employment report for April showed just 160,000 jobs added. Apple, Google and Microsoft reported disappointing first quarter earnings, and the Bank of Japan surprised by not easing further. The yen appreciated 5% versus the dollar on one day. In mid-May, the Federal Reserve minutes read, “It likely would be appropriate to raise rates in June if the economy shows clear signs of a rebound.”3 The report for May showed a disastrous 32,000 jobs created. Needless to say, a June interest rate hike was off the table.
Then came Brexit, the unanticipated monster. On June 22, the people of the United Kingdom unexpectedly voted to leave the European Union and turmoil filled the markets… for all of two days. The CBOE Market Volatility Index spiked 49%. The S&P 500 fell 5.3%. By July 8, the S&P 500 had regained these losses.
To top it off, we had fears of terrorism from attacks in Brussels, Orlando, and Nice, to name a few. Finally, we had the unusual circumstances of two Presidential primary elections more befitting reality TV shows.
July started with a market rebound from the late June Brexit vote. The S&P 500 returned 3.69% and the Russell 2000 returned 5.97%. The Needham Funds were also positive, roughly in line with the markets. July brought the failed coup in Turkey, more violence in Europe, and the Presidential conventions. And the Fed kept interest rates at 0.25%, but kept open the prospect of future increases. Government bonds remained at historically low yields around the world. Second quarter U.S. GDP growth was 1.2% and the first quarter’s growth was revised to just 0.8%.
____________
3 | http://www.nytimes.com/2016/05/19/business/economy/federal-reserve-interest-rates-meeting-minutes.html?_r=0 |
Annual Report 2016
In August, volatility was low and retail sales slowed. The Federal Reserve again declined to raise rates, but in an August 26 speech, Fed Chair Janet Yellen indicated that economic conditions may be ripe for an increase in September. However, the Federal Reserve decided not to raise interest rates in September.
The market was down in October over angst about the election. Election night in November brought a 700-point crash in the Dow Futures, followed by the Trump rally on the anticipation of fiscal stimulus, competitive corporate tax rates, and lessened regulation. In December, the rally continued, despite the much-anticipated Federal Reserve rate hike of 0.5% to 0.75%. This was only the Fed’s second rate increase since 2009 and came a full year after the first hike in 2015. GDP growth was 1.9% in the fourth quarter and 1.6% for 2016, continuing a string of years of below potential growth.
John Barr’s Commentary – Thoughts on Investing in These Times
Once again, the headlines are scary. A year ago, the markets were full of fear. This year, the fears are of trade wars, “border adjustment taxes” (also known as tariffs), immigration limits, and Executive Orders from the White House. There are marches in the streets and at airports. At least the markets are no longer obsessed with every word out of the Federal Reserve. Then again, there are always fears. Imagine what it was like investing through World War II, the Cold War, the Vietnam War, during the race riots of the 1960s, stagflation, 1987 when the stock market crashed, or the first Gulf War.
While these are real fears, there is hope of faster economic growth. For years, we have written that acceleration of growth seems unlikely unless Washington shifts its focus to a fiscal policy designed to promote business investment and capital formation. Imagine if we had an internationally competitive corporate tax regime, lower regulatory and policy barriers to private sector hiring, lower marginal tax rates, and a lower rate of increase of government spending. For now, we can imagine that acceleration of growth is possible. The details of how, when, and if remain to be seen.
From Robert Hagstrom Jr.’s book, The Warren Buffett Way: Investment Strategies of the World’s Greatest Investor, “Just as people spend fruitless hours worrying about the stock market, so too do they worry needlessly about the economy. If you find yourself discussing and debating whether the economy is poised for growth or tilting toward a recession, whether interest rates are moving up or down, or whether there is inflation or disinflation, STOP.”4
In a January 27 interview with Charlie Rose at Columbia University, Warren Buffett said, “This country moves forward, and you can’t stop it. I say the luckiest person in the history of the world is a baby being born in this country today.”
As always, I believe the proper course is to stay focused on our companies and the search for new compounders. I look for companies that make a good return on capital, can reinvest profits to bring new product or service offerings to market, and are managed by capable and trustworthy CEOs. In The Growth Factor Vol. 23, I wrote about the management teams of some of our compounders; many are founders, family or long-tenured management. These executives share a vision to create an enterprise that will last for a long time. To name just a
____________
4 | Robert Hagstrom, Jr., The Warren Buffett Way: Investment Strategies of the World’s Greatest Investor (1995), 227 |
Needham Funds
few of our investments, should PDF Solutions (PDFS) succeed with its new Design for Inspection process control service, should IPG Photonics (IPGP) succeed with fiber-lasers in the industrial welding market, should Oil-Dri Corporation of America (ODC) succeed with lightweight cat litter, these companies will be larger and the stock prices could be higher.
Needham Growth Fund (NEEGX/NEEIX)
The Needham Growth Fund returned 3.43% in the fourth quarter and 10.57% for the year ending December 31, 2016.
In the fourth quarter, KVH Industries, Inc. (KVHI) was the top contributor, returning 33.94%. In our view, KVH is like the combined Netflix, Inc. (NFLX) and Comcast Corporation (CMCSA) of the commercial maritime industry. The company supplies satellite communications equipment, voice and data services and entertainment, news and training content to ships at sea through their IP-Mobilecast technology. KVH also supplies fiber-optic gyroscopes for self-driving cars and military vehicles. IP-Mobilecast, which provides training, news, entertainment and sports offerings for commercial mariners, is a high-margin subscription business. KVH also supplies fiber-optic gyroscopes for autonomous vehicles and military navigation systems, which supplements the data from Global Positioning Satellite’s (GPS) for determining vehicle location.
CarMax, Inc. (KMX) was the second-largest contributor and returned 20.69% in the fourth quarter. CarMax reported comparable car sales above estimates. We remain enthusiastic about its small share of the U.S. used car market and its information advantage in buying and selling used cars. During the quarter, Beepi, a much-touted online, peer-to-peer used-car marketplace, announced a retreat to its California headquarters, which likely means it has burned through nearly $150 million of venture capital. Ultimately, we think CarMax’s information and logistics advantages will allow them to be the brick and mortar and e-commerce winner in the used car market.
PDF Solutions (PDFS) returned 24.11% for the quarter and 108.03% for the year. PDF was Needham Growth Fund’s top contributor for the year.
Thermo Fisher Scientific, Inc. (TMO) remained the largest position in the Fund and was the leading detractor for the quarter, down 11.20%. Many life sciences stocks suffered in the fourth quarter.
It was a difficult year for our other two large healthcare investments. Express Scripts Holding Corporation (ESRX), down 21.30%, and Gilead Sciences, Inc. (GILD), down 27.61%, were the leading detractors. In the third quarter 2016, Express Scripts had slightly lower gross margin and volume growth than estimated. Express Scripts continues to be in a lawsuit with Anthem, Inc. (ANTM), its largest customer. Gilead suffered with many of its pharmaceutical peers and as investors worried about the maturity of its Hepatitis C offering. Express Scripts is valued at just 7.5x EV/EBITDA and Gilead at just 5x.
In the fourth quarter, Needham Growth Fund added Red Hat, Inc., maker of Red Hat Enterprise Linux and Open Shift. Open Shift is a software development environment targeted for the digital economy and hybrid on-premise/Web 2.0 data centers. The company had a stumble on the third quarter earnings, which gave us an opportunity to invest. The Fund also added new positions in Invuity (IVTY), 2U (TWOU), and Under Armour, Inc. (Class C shares – UA/C).
Annual Report 2016
In the fourth quarter, Needham Growth Fund exited its position in Hutchinson Technology, Inc. (HTCH), as the company was acquired by TDK Corporation of Japan. The Fund sold three quarters of its investment in Hess (HES) on the rebound in oil prices. We bought Hess in 2012 for the restructuring, which has been completed.
At December 31, 2016, the Fund had an Active Share of 103.4% vs. the S&P 500 and trailing 12 months turnover of just 12%. Active Share is a measure of the difference of the holdings in a portfolio from the holdings in its appropriate passive benchmark, in this case the S&P 500. The Fund had 68% of invested net assets in companies with over $2 billion of market cap. The Fund’s top 10 positions were 52.6% of net assets. The Fund ended 2016 with 2.4% cash and is short 4.2%.
Needham Aggressive Growth Fund (NEAGX/NEAIX)
The Needham Aggressive Growth Fund returned 10.19% in the fourth quarter and 22.18% for the year ending December 31, 2016.
In “Patient Capital Outperformance: The Investment Skill of High Active Share Managers Who Trade Infrequently,”5 Professors Martijn Cremers and Ankur Pareek found that High Active Share and low turnover is an effective strategy for outperforming broad-based indices over the long term. Active Share is a measure of the difference of the holdings in a portfolio from the holdings in its appropriate passive benchmark, in this case the Russell 2000. They studied returns from mutual funds and institutional public equity investment managers from 1983 through 2013. The top quintile of funds had Active Share of 92.2 and fund turnover of 27% (3.7 year average holding period). The top quintile produced all of the out-performance over the 30 years.
As of December 30, 2016, The Fund had an Active Share of 113.3 vs. the Russell 2000 and trailing 12 months turnover of 14%. In 2016, The Needham Aggressive Growth Fund benefited from its High Active Share and the performance of its largest holdings. The top five holdings as of December 31, 2015 averaged a 43.86% return for the year 2016, led by PDF Solutions. All five top holdings were top ten contributors for the year 2016.
The Fund’s top contributor for the quarter and the year was PDF Solutions. Roger Lowenstein wrote about Warren Buffett’s view of a concentrated portfolio, “But when an investor had conviction about a stock, he or she should also show courage – and buy a ton of it.”6 The Fund owns a ton of PDF Solutions. As of December 30, 2016, PDF Solutions was the largest holding and a 9.77% position. The company reported progress with its Design for Inspection service. On November 1, PDF hosted its first investor day since going public in 2001. The market is beginning to understand PDF’s growth opportunities with Design for Inspection, Exsensio big data analytics, and the opportunity for the nascent Chinese semiconductor manufacturing industry. The Fund started its investment in PDF in 2010 and added to the position in 2011, 2015, and 2016.
The second-leading contributor for the fourth quarter and the year was Akamai Technologies, Inc. (AKAM), which returned 25.84% for the quarter. Akamai reported strong earnings for its cloud-based enterprise and e-commerce web site security offering. Akamai is the second-largest holding of the Fund at 7.08% of net assets.
____________
5 | Cremers, Martijn and Pareek, Ankur, “Patient Capital Outperformance: The Investment Skill of High Active Share Managers Who Trade Infrequently,” (September 9, 2014). |
6 | Roger Lowenstein, Roger, Buffett, The Making of an American Capitalist, p. 325. |
Needham Funds
The Fund’s third-leading contributor for the quarter was KVH Industries. KVH is the Fund’s third-largest position at 6.62% of net assets.
GSE Systems, Inc. (GVP) was the fourth-leading contributor in the quarter, returning 21.15%, and returned 45.83% for the year. GSE is an undiscovered microcap company. Its historical business is simulators to train nuclear power plant operators. We believe the new management team, led by Kyle Loudermilk, CEO, and Chris Sorrells, COO, could transform the company to a high-margin software and services company. Kyle’s experience at Aspen Technology, Inc. (AZPN) and Microstrategy, Incorporated (MSTR) is directly relevant. We started purchasing the stock three years ago at under $2 per share and have added continuously. It currently trades at over $3 per share.
For the year, the Fund’s short position in Medallion Financial Corp. (MFIN) returned 53.43% as the stock fell from $7 to $3. After cutting its dividend in August, Medallion Financial defaulted on $9 million of loans and the bank sued and asked for summary judgment.
In the fourth quarter, the sum total of losses from the top-ten detractors was less than the gains from any one of the top-ten contributors. The leading detractor was the short position in the Federal Home Loan Mortgage Corporation (FMCC), also known as Freddie Mac, which was up 138.22% on the Trump election. Freddie Mac stock is owned by John Paulson, Carl Icahn, and others connected with the new Trump administration.
The leading detractor for the year was the short position in Ubiquiti Networks (UBNT). Ubiquiti rose 82.39%. The revolving door on the Ubiquiti financial team continues, as their auditor, PriceWaterhouseCooper, was released by the company in the fourth quarter. The CFO left in the spring and has yet to be replaced. We continue to believe that with a new accounting team in New York City, the leading distributor in Paraguay (revenue is recognized on sell-in to the distributors), the cash in Hong Kong, a new auditor, and the CEO between California and his corporate jet, the company is poised for challenges. Gilead Sciences, Inc. (GILD) was the Fund’s second-leading detractor in 2016, down 27.61%.
Red Hat Software, Invuity, 2U, and Under Amour Class C were the most significant new investments added in the year and all were added in the fourth quarter. 2U is an education technology company that partners with top-tier universities, including Georgetown and the University of North Carolina, to develop and market online graduate degree programs that have the same rigor as on-premise programs.
In 2016, we also made significant additions to some of our high-conviction top investments. We added 295,000 shares of GSE Systems to end the year with 965,000 shares. Other additions were to KVH Industries, Corium, PDF Solutions, and IPG Photonics.
In the year, we exited Hutchinson Technology, Precision Castparts, FEI Company, Constant Contact, and Newport Corporation – all were acquired. We also exited five smaller positions due to valuation or a strategic investment review. The Fund reduced its position in FormFactor (FORM) by 44%, and nearly exited our position in TheStreet, Inc. (TST).
At December 31, 2016, Needham Aggressive Growth Fund had 59% of net assets invested in companies with under $2 billion in market cap. The Fund’s top-ten positions were 54.3% of net assets; it had a 7.4% short position, and a 4.7% cash position. I have been deliberate in putting new cash to work.
Annual Report 2016
Needham Small Cap Growth Fund (NESGX/NESIX)
The Needham Small Cap Growth Fund returned 7.78% in the fourth quarter and 31.26% for the full year 2016.
After a difficult year for semiconductor capital equipment stocks in 2015, our long-term investments shined in 2016, as spending returned, and is expected to remain strong through a better portion of 2017. Our top-performing investment for the fourth quarter of 2016 was Ultra Clean Holdings (UCTT). The company is engaged in the development, manufacture and supply of critical subsystems for the semiconductor capital equipment, flat panel, and research industries. The company has benefited from continued outsourcing by major OEM customers, such as Applied Material (AMAT) and Lam Research (LRCX). The management team is focused on capturing the increased business activity by these customers as they optimize their manufacturing operations. The Fund had similar industry exposure through its investments in MKS Instruments (MKSI), FormFactor (FORM), PDF Solutions (PDFS), Cohu (COHU), and Veeco Instruments (VECO). This concentration has been a core area of investment for the Fund and after a strong 2016, we will review price targets.
Our ability to short was also active in the fourth quarter, as we increased our exposure ahead of the election. We applied a combination of stock specific, industry ETF and broad market ETF shorts. We believe this strategy helps the Fund to have downside protection in an environment of higher volatility. We ended the year with a small short position and will continue to evaluate short exposure in 2017.
Our investments in semiconductor capital equipment were the highlight for 2016. While the summer of 2015 challenged performance the prior year, our patience paid off in 2016, as our holdings in Ultra Clean Holdings, PDF Solutions, FormFactor, and MKS Instruments all were top contributors to the Fund. The sector experienced a significant ramp as both foundry and memory spending returned. This sector has traditionally been a cyclical industry, and although we believe this cycle may extend itself longer than normal, we do expect that it will end at some point.
The Fund also benefited in 2016 from the recovery in two of our large holdings, Amber Road (AMBR) and TTM Technologies, Inc. (TTMI). Both companies experienced a return to growth and margin improvement. The third major contributor to the annual performance was the active M&A environment. Our long-term holding, Newport Corporation (NEWP), announced that it was being acquired by another of our holdings, MKS Instruments, and upon closing, MKS was able to achieve significant synergies from the acquisition. We also benefited from the acquisitions of portfolio holdings Invensense (INVN), Ruckus Wireless (RKUS), and Silicon Graphics (SGI).
We are pleased with the strong finish in 2016 by small cap stocks post-election. However, we are cautious with regard to the timing of many of the potentially growth-oriented policies that are expected out of the new administration. There are a lot of positive long-term factors that could impact the economy through tax reforms, deregulation, tax repatriation, and a generally more business-friendly government. This has increased confidence in the U.S. economy on many levels; however, we believe these benefits may be further out on the horizon than the markets have priced into stock valuations.
Needham Funds
We expect increased volatility in the near term, which should provide nice entry points into existing and new stock holdings. We consider the Fund’s currently large cash position, 28.95% of net assets at December 31, 2016, as a strategic asset in this uncertain environment that favors active management and stock pickers. Quarterly earnings calls tend to bring nice opportunities for value investors who have done their due diligence ahead of stock dislocations, and we expect to find those opportunities to put some cash to work in the upcoming earnings release season.
We continue to favor technology as a core area for investment, as tech companies generally have stronger barriers to entry to compete on a global and domestic basis. Healthcare continues to remain in the headlines, which weighs on the industry’s stock valuations, but also creates value investing opportunities. The long-term trends for healthcare remain favorable; however, the political environment poses headline near-term risk for stocks in the sector. The Fund has also increased exposure to energy and industrial sectors, as we believe there will be a more friendly business environment and a recovery in domestic spending.
Although we are more cautious at this point in time with regard to the market, we remain positive on small cap domestic stocks for the long term. A more growth-oriented administration should allow smaller companies to achieve increased leverage in their business models. We have also seen a positive M&A environment for small cap companies, and we expect this trend could continue and may accelerate with tax repatriation policy changes.
Although the Needham Small Cap Fund’s policy, under normal conditions, is to invest at least 80% its net assets, plus the amount of any borrowings for investment purposes, in the equity securities (principally, common stock) of domestic issuers listed on a nationally recognized securities exchange or traded on the NASDAQ System that have market capitalizations not exceeding $5 billion at the time of investment, the Fund currently has less than 80% of its assets so invested as it seeks to find appropriate small cap investments in which to deploy new cash from Fund share purchases and sales or mergers/buyouts of small cap holdings.
Closing
We believe the U.S. has the possibility of faster economic growth and remains the best place in the world to be investing and working. We believe there is opportunity in small and mid cap stocks in this difficult market. We are particularly excited that this market may give us a chance to add to positions already in the portfolio.
To reiterate our overall thesis: monetary policy remains accommodative. Most importantly, we see a revolution happening in technology that has created and continues to create investment opportunities. We see opportunity in our strategy of investing in companies that we know well and that we believe are positioned with secular growth drivers. We believe 2017 will bring a modest rebound for equities.
Annual Report 2016
We welcome our new investors and thank all of our investors for their continued support. If you have any questions, thoughts or concerns, please contact us at (800) 625-7071 or send us an email at cretzler@needhamco.com or jbarr@needhamco.com. For information about the funds, please visit our website at www.needhamfunds.com.
Sincerely,
 |  |
| | |
| Chris Retzler | John O. Barr |
| Portfolio Manager | Portfolio Manager |
The information presented in this commentary is not intended as personalized investment advice and does not constitute a recommendation to buy or sell a particular security or other investments. Past performance is no guarantee of future results.
This message is not an offer of the Needham Growth Fund, the Needham Aggressive Growth Fund or the Needham Small Cap Growth Fund. Shares are sold only through the currently effective prospectus. Please read the prospectus carefully and consider the investment objectives, risks, and charges and expenses of the Fund carefully before you invest. The prospectus contains this and other information about the Fund.
A copy of the prospectus are available at www.needhamfunds.com or by contacting the Fund’s transfer agent, U.S. Bancorp Fund Services, LLC at 1-800-625-7071.
All three of the Needham Funds have substantial exposure to small and micro capitalized companies. Funds holding smaller capitalized companies are subject to greater price fluctuation than those of larger companies.
Needham & Company, LLC, member FINRA/SIPC, is the distributor of The Needham Funds, Inc.
Needham Funds
The Needham Funds ownership as a percentage of net assets in the stated securities as of 12/31/16:
| | NEEGX | NEAGX | NESGX | |
| PDFS | 4.43% | 9.78% | 5.69% | |
| IPGP | 0.49% | 1.26% | 0.00% | |
| ODC | 0.13% | 1.72% | 0.00% | |
| KVHI | 5.21% | 6.62% | 4.30% | |
| KMX | 5.58% | 2.36% | 0.00% | |
| TMO | 7.46% | 0.00% | 0.00% | |
| ESRX | 6.82% | 0.70% | 0.19% | |
| GILD | 5.50% | 2.80% | 0.00% | |
| RHT | 0.58% | 0.59% | 0.00% | |
| IVTY | 0.49% | 0.47% | 2.62% | |
| TWOU | 0.15% | 0.31% | 0.42% | |
| UA/C | 0.00% | 0.00% | 0.00% | |
| HTCH | 0.00% | 0.00% | 0.00% | |
| TTDKY | 0.00% | 0.00% | 0.00% | |
| HES | 0.51% | 0.00% | 0.83% | |
| AKAM | 2.75% | 7.09% | 0.00% | |
| NFLX | 0.00% | 0.00% | 0.00% | |
| CMCSA | 3.42% | 0.00% | 0.00% | |
| GVP | 0.00% | 5.72% | 0.00% | |
| MFIN | -0.37% | -0.81% | 0.00% | |
| FMCC | 0.00% | -0.25% | 0.00% | |
| UBNT | -3.22% | -4.55% | -0.81% | |
| CORI | 0.69% | 0.97% | 1.48% | |
| FORM | 3.69% | 3.61% | 1.64% | |
| TST | 0.00% | 0.03% | 0.00% | |
| UCTT | 0.14% | 0.00% | 4.89% | |
| AMAT | 0.20% | 0.00% | 0.00% | |
| LRCX | 0.22% | 0.00% | 0.00% | |
| MKSI | 2.21% | 2.73% | 0.00% | |
| COHU | 0.00% | 0.00% | 1.56% | |
| VECO | 0.00% | 0.00% | 0.82% | |
Annual Report 2016
(This Page Intentionally Left Blank.)
Needham Funds
NEEDHAM GROWTH FUND | TICKER: NEEGX |
Comparative Performance Statistics as of December 31, 2016
| | | | | | | | Gross |
| | 6 | 1 | 3 | 5 | 10 | Since | Expense |
| | Months(7) | Year | Years(8) | Years(8) | Years(8 | Inception(8)(12) | Ratio(14) |
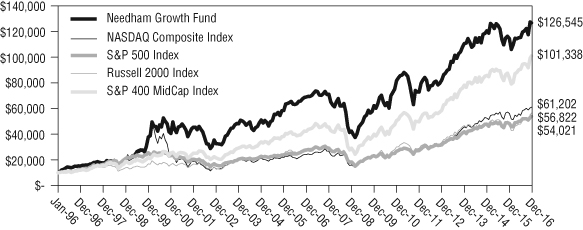
Needham Growth Fund(1) | 9.61% | 10.57% | 4.58%(9) | 11.69%(10) | 6.26%(11) | 12.85%(13) | 2.07% |
S&P 500 Index(2)(3) | 7.82% | 11.96% | 8.87% | 14.66% | 6.95% | 8.36% | |
| NASDAQ | | | | | | | |
Composite Index(2)(4) | 11.89% | 8.94% | 10.24% | 17.19% | 9.60% | 9.00% | |
S&P 400 MidCap Index(2)(5) | 11.87% | 20.74% | 9.04% | 15.33% | 9.16% | 11.66% | |
Russell 2000 Index(2)(6) | 18.68% | 21.31% | 6.74% | 14.46% | 7.07% | 8.62% | |
Past performance does not guarantee future results. The performance data quoted represents past performance, and current returns may be lower or higher. The investment return and net asset value will fluctuate so that an
investor’s shares, when redeemed, may be worth more or less than the original cost. To obtain performance information current to the most recent month-end, please call 1-800-625-7071. The returns shown in the above table and accompanying footnotes are net of expenses. The table above does not reflect the deduction of taxes that a shareholder would have paid on Fund distributions or on the redemption of Fund shares.
| 1. | Investment results calculated after reinvestment of dividends. |
| 2. | It is not possible to invest directly in an index. The performance of the index does not include the deduction of expenses associated with a mutual fund, such as investment management fees. |
| 3. | The S&P 500 Index is a broad unmanaged measure of the U.S. stock market. |
| 4. | The NASDAQ Composite Index is a broad-based capitalization-weighted index of all NASDAQ Global Market and Small Cap stocks. |
| 5. | The S&P 400 MidCap Index is a broad unmanaged measure of the U.S. stock market. |
| 6. | The Russell 2000 Index is a broad unmanaged index composed of the smallest 2,000 companies in the Russell 3000 Index. |
| 7. | Not annualized. |
| 8. | Compound annual growth rate (annualized return). Assumes all dividends were reinvested in shares of the Fund. |
| 9. | Cumulative return for the three year period was 14.39%, assuming all dividends were reinvested in shares of the Fund. |
| 10. | Cumulative return for the five year period was 73.78%, assuming all dividends were reinvested in shares of the Fund. |
| 11. | Cumulative return for the ten year period was 83.47%, assuming all dividends were reinvested in shares of the Fund. |
| 12. | The inception date of the Fund was 1/1/96. |
| 13. | Cumulative return since inception was 1,165.45%, assuming all dividends were reinvested in shares of the Fund. |
| 14. | Gross expense ratio is from the Fund’s prospectus dated May 1, 2016. Additional information pertaining to the Fund’s expense ratios as of December 31, 2016 can be found in the financial highlights. Since January 1, 2009, the investment performance reflects contractually agreed upon fee waivers which expire at the close of business on April 30, 2017. Without these fee waivers, the performance would have been lower. Excluding the indirect costs of investing in acquired funds, total fund operating expenses would be 2.05%. |
Annual Report 2016
Top Ten Holdings*
(as a % of total investments,
as of December 31, 2016)
| | | | % of Total |
Security | | | Investments |
| Thermo Fisher Scientific, Inc. | TMO | | | 7.60 | % |
| Express Scripts Holding Co. | ESRX | | | 6.95 | % |
| CarMax, Inc. | KMX | | | 5.69 | % |
| Gilead Sciences, Inc. | GILD | | | 5.61 | % |
| KVH Industries, Inc. | KVHI | | | 5.31 | % |
| ViaSat, Inc. | VSAT | | | 4.80 | % |
| Becton Dickinson and Co. | BDX | | | 4.53 | % |
| PDF Solutions, Inc. | PDFS | | | 4.52 | % |
| Super Micro Computer, Inc. | SMCI | | | 4.37 | % |
| FormFactor, Inc. | FORM | | | 3.76 | % |
Top Ten Holdings = 53.14% of Total Investments†
| * | Current portfolio holdings may not be indicative of future portfolio holdings. |
| † | Percentage of total investments less cash. |
Sector Weightings*
(as a % of net investments,
as of December 31, 2016)
Sector | | Long* | | | (Short)(1) | | | Total(1)(2) | |
| Consumer Discretionary | | | 11.2 | % | | | — | | | | 11.2 | % |
| Consumer Staples | | | 0.1 | % | | | — | | | | 0.1 | % |
| Energy | | | 1.9 | % | | | — | | | | 1.9 | % |
| Exchange Traded Funds | | | 0.0 | % | | | (0.2 | )% | | | (0.2 | )% |
| Financials | | | 2.6 | % | | | (0.5 | )% | | | 2.1 | % |
| Health Care | | | 31.1 | % | | | — | | | | 31.1 | % |
| Industrials | | | 3.8 | % | | | — | | | | 3.8 | % |
| Information Technology | | | 51.2 | % | | | (3.6 | )% | | | 47.6 | % |
| Cash | | | 2.4 | % | | | — | | | | 2.4 | % |
| * | Current portfolio holdings may not be indicative of future portfolio holdings. |
(1) | Percentage of total investments includes all stocks, plus cash minus all short positions. |
(2) | Total represents the difference between the long exposure and the short exposure, which produces the net exposure. |
Comparison of Change in Value of a $10,000 Investment
Past performance does not guarantee future results. The performance data quoted represents past performance, and current returns may be lower or higher. The investment return and net asset value will fluctuate so that an investor’s shares, when redeemed, may be worth more or less than the original cost. To obtain performance information current to the most recent month-end, please call 1-800-625-7071. The graph above does not reflect the deduction of taxes that a shareholder would have paid on Fund distributions or on the redemption of Fund shares. Since inception, the Fund’s adviser has absorbed certain expenses of the Fund, without which returns would have been lower.
The Global Industry Classification Standard (GICS) was developed by and/or is the exclusive property of MSCI, Inc. and Standard & Poor Financial Services LLC (‘‘S&P’’). GICS is a service mark of MSCI and S&P and has been licensed for use by U.S. Bancorp Fund Services, LLC.
Needham Funds
NEEDHAM AGGRESSIVE GROWTH FUND | TICKER: NEAGX |
Comparative Performance Statistics as of December 31, 2016
| | | | | | | | Gross |
| | 6 | 1 | 3 | 5 | 10 | Since | Expense |
| | Months(6) | Year | Years(7) | Years(7) | Years(7) | Inception(7)(11) | Ratio(13) |
| Needham Aggressive | | | | | | | |
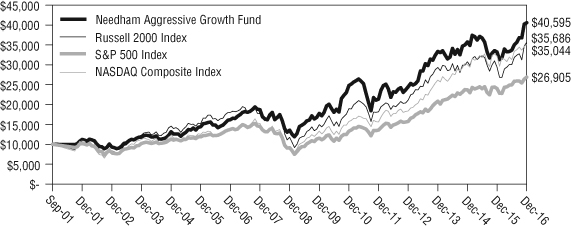
Growth Fund(1) | 20.46% | 22.18% | 6.76%(8) | 13.70%(9) | 9.63%(10) | 9.57%(12) | 2.43% |
S&P 500 Index(2)(3) | 7.82% | 11.96% | 8.87% | 14.66% | 6.95% | 6.67% | |
| NASDAQ | | | | | | | |
Composite Index(2)(4) | 11.89% | 8.94% | 10.24% | 17.19% | 9.60% | 8.52% | |
Russell 2000 Index(2)(5) | 18.68% | 21.31% | 6.74% | 14.46% | 7.07% | 8.66% | |
Past performance does not guarantee future results. The performance data quoted represents past performance, and current returns may be lower or higher. The investment return and net asset value will fluctuate so that an investor’s shares, when redeemed, may be worth more or less than the original cost. To obtain performance information current to the most recent month-end, please call 1-800-625-7071. The returns shown in the above table and accompanying footnotes are net of expenses. The table above does not reflect the deduction of taxes that a shareholder would have paid on Fund distributions or on the redemption of Fund shares.
| 1. | Investment results calculated after reinvestment of dividends. |
| 2. | It is not possible to invest directly in an index. The performance of the index does not include the deduction of expenses associated with a mutual fund, such as investment management fees. |
| 3. | The S&P 500 Index is a broad unmanaged measure of the U.S. stock market. |
| 4. | The NASDAQ Composite Index is a broad-based capitalization-weighted index of all NASDAQ Global Market and Small Cap stocks. |
| 5. | The Russell 2000 Index is a broad unmanaged index composed of the smallest 2,000 companies in the Russell 3000 Index. |
| 6. | Not annualized. |
| 7. | Compound annual growth rate (annualized return). Assumes all dividends were reinvested in shares of the Fund. |
| 8. | Cumulative return for the three year period was 21.67%, assuming all dividends were reinvested in shares of the Fund. |
| 9. | Cumulative return for the five year period was 90.00%, assuming all dividends were reinvested in shares of the Fund. |
| 10. | Cumulative return for the ten year period was 150.72%, assuming all dividends were reinvested in shares of the Fund. |
| 11. | The inception date of the Fund was 9/4/2001. |
| 12. | Cumulative return since inception was 305.95% assuming all dividends were reinvested in shares of the Fund. |
| 13. | Gross expense ratio is from the Fund’s prospectus dated May 1, 2016. Additional information pertaining to the Fund’s expense ratios as of December 31, 2016 can be found in the financial highlights. Since January 1, 2009, the investment performance reflects contractually agreed upon fee waivers which expire at the close of business on April 30, 2017. Without these fee waivers, the performance would have been lower. Excluding the indirect costs of investing in acquired funds, total fund operating expenses would be 2.41%. |
Annual Report 2016
Top Ten Holdings*
(as a % of total investments,
as of December 31, 2016)
| | | | % of Total |
| Security | | | Investments |
| PDF Solutions, Inc. | PDFS | | | 10.23 | % |
| Akamai Technologies, Inc. | AKAM | | | 7.41 | % |
| KVH Industries, Inc. | KVHI | | | 6.92 | % |
| Entegris, Inc. | ENTG | | | 6.05 | % |
| GSE Systems, Inc. | GVP | | | 5.97 | % |
| Apple, Inc. | AAPL | | | 4.53 | % |
| Super Micro Computer, Inc. | SMCI | | | 4.26 | % |
| Reis, Inc. | REIS | | | 4.06 | % |
| FormFactor, Inc. | FORM | | | 3.78 | % |
| WageWorks, Inc. | WAGE | | | 3.61 | % |
Top Ten Holdings = 56.82% of Total Investments†
| * | Current portfolio holdings may not be indicative of future portfolio holdings. |
| † | Percentage of total investments less cash. |
Sector Weightings*
(as a % of net investments,
as of December 31, 2016)
Sector | | Long* | | | (Short)(1) | | | Total(1)(2) | |
| Consumer Discretionary | | | 4.5 | % | | | — | | | | 4.5 | % |
| Consumer Staples | | | 1.8 | % | | | — | | | | 1.8 | % |
| Energy | | | 0.5 | % | | | — | | | | 0.5 | % |
| Financials | | | 4.0 | % | | | (1.4 | )% | | | 2.6 | % |
| Health Care | | | 10.2 | % | | | — | | | | 10.2 | % |
| Industrials | | | 5.6 | % | | | — | | | | 5.6 | % |
| Information Technology | | | 76.1 | % | | | (6.0 | )% | | | 70.1 | % |
| Cash | | | 4.7 | % | | | — | | | | 4.7 | % |
| * | Current portfolio holdings may not be indicative of future portfolio holdings. |
(1) | Percentage of total investments includes all stocks, plus cash minus all short positions. |
(2) | Total represents the difference between the long exposure and the short exposure, which produces the net exposure. |
Comparison of Change in Value of a $10,000 Investment
Past performance does not guarantee future results. The performance data quoted represents past performance, and current returns may be lower or higher. The investment return and net asset value will fluctuate so that an investor’s shares, when redeemed, may be worth more or less than the original cost. To obtain performance information current to the most recent month-end, please call 1-800-625-7071. The graph above does not reflect the deduction of taxes that a shareholder would have paid on Fund distributions or on the redemption of Fund shares. Since inception, the Fund’s adviser has absorbed certain expenses of the Fund, without which returns would have been lower.
The Global Industry Classification Standard (GICS) was developed by and/or is the exclusive property of MSCI, Inc. and Standard & Poor Financial Services LLC (‘‘S&P’’). GICS is a service mark of MSCI and S&P and has been licensed for use by U.S. Bancorp Fund Services, LLC.
Needham Funds
NEEDHAM SMALL CAP GROWTH FUND | TICKER: NESGX |
Comparative Performance Statistics as of December 31, 2016
| | | | | | | | Gross |
| | 6 | 1 | 3 | 5 | 10 | Since | Expense |
| | Months(6) | Year | Years(7) | Years(7) | Years(7) | Inception(7)(11) | Ratio(13) |
| Needham Small Cap | | | | | | | |
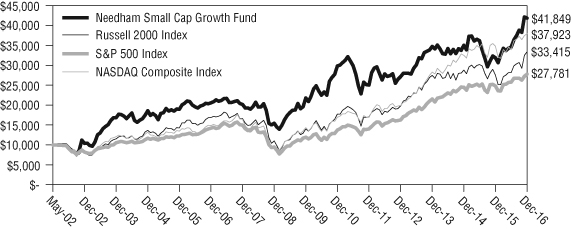
Growth Fund(1) | 21.04% | 31.26% | 6.40%(8) | 10.83%(9) | 7.36%(10) | 10.29%(12) | 2.05% |
S&P 500 Index(2)(3) | 7.82% | 11.96% | 8.87% | 14.66% | 6.95% | 7.24% | |
| NASDAQ | | | | | | | |
Composite Index(2)(4) | 11.89% | 8.94% | 10.24% | 17.19% | 9.60% | 9.54% | |
Russell 2000 Index(2)(5) | 18.68% | 21.31% | 6.74% | 14.46% | 7.07% | 8.61% | |
Past performance does not guarantee future results. The performance data quoted represents past performance, and current returns may be lower or higher. The investment return and net asset value will fluctuate so that an investor’s shares, when redeemed, may be worth more or less than the original cost. To obtain performance information current to the most recent month-end, please call 1-800-625-7071. The returns shown in the above table and accompanying footnotes are net of expenses. The table above does not reflect the deduction of taxes that a shareholder would have paid on Fund distributions or on the redemption of Fund shares.
| 1. | Investment results calculated after reinvestment of dividends. |
| 2. | It is not possible to invest directly in an index. The performance of the index does not include the deduction of expenses associated with a mutual fund, such as investment management fees. |
| 3. | The S&P 500 Index is a broad unmanaged measure of the U.S. stock market. |
| 4. | The NASDAQ Composite Index is a broad-based capitalization-weighted index of all NASDAQ Global Market and Small Cap stocks. |
| 5. | The Russell 2000 Index is a broad unmanaged index composed of the smallest 2,000 companies in the Russell 3000 Index. |
| 6. | Not annualized. |
| 7. | Compound annual growth rate (annualized return). Assumes all dividends were reinvested in shares of the Fund. |
| 8. | Cumulative return for the three year period was 20.45%, assuming all dividends were reinvested in shares of the Fund. |
| 9. | Cumulative return for the five year period was 67.19%, assuming all dividends were reinvested in shares of the Fund. |
| 10. | Cumulative return for the ten year period was 103.44%, assuming all dividends were reinvested in shares of the Fund. |
| 11. | The inception date of the Fund was 5/22/02. |
| 12. | Cumulative return since inception was 318.49% assuming all dividends were reinvested in shares of the Fund. |
| 13. | Gross expense ratio is from the Fund’s prospectus dated May 1, 2016. Additional information pertaining to the Fund’s expense ratios as of December 31, 2016 can be found in the financial highlights. Since January 1, 2009, the investment performance reflects contractually agreed upon fee waivers which expire at the close of business on April 30, 2017. Without these fee waivers, the performance would have been lower. Excluding the indirect costs of investing in acquired funds, total fund operating expenses would be 2.03%. |
Annual Report 2016
Top Ten Holdings*
(as a % of total investments,
as of December 31, 2016)
| | | | % of Total |
Security | | | Investments |
| PDF Solutions, Inc. | PDFS | | | 7.65 | % |
| Ultra Clean Holdings, Inc. | UCTT | | | 6.58 | % |
| Amber Road, Inc. | AMBR | | | 6.33 | % |
| InvenSense, Inc. | INVN | | | 6.08 | % |
| KVH Industries, Inc. | KVHI | | | 5.78 | % |
| Nimble Storage, Inc. | NMBL | | | 4.48 | % |
| Frequency Electronics, Inc. | FEIM | | | 4.06 | % |
| Pure Storage, Inc. | PSTG | | | 3.84 | % |
| FireEye, Inc. | FEYE | | | 3.59 | % |
| Invuity, Inc. | IVTY | | | 3.52 | % |
Top Ten Holdings = 51.91% of Total Investments†
| * | Current portfolio holdings may not be indicative of future portfolio holdings. |
| † | Percentage of total investments less cash. |
Sector Weightings*
(as a % of net investments,
as of December 31, 2016)
Sector | | Long* | | | (Short)(1) | | | Total(1)(2) | |
| Closed End | | | 0.1 | % | | | — | | | | 0.1 | % |
| Consumer Staples | | | 0.9 | % | | | — | | | | 0.9 | % |
| Energy | | | 5.1 | % | | | — | | | | 5.1 | % |
| Financials | | | 0.1 | % | | | — | | | | 0.1 | % |
| Health Care | | | 6.6 | % | | | — | | | | 6.6 | % |
| Industrials | | | 2.3 | % | | | — | | | | 2.3 | % |
| Information Technology | | | 56.7 | % | | | (0.8 | )% | | | 55.9 | % |
| Cash | | | 29.0 | % | | | — | | | | 29.0 | % |
| * | Current portfolio holdings may not be indicative of future portfolio holdings. |
(1) | Percentage of total investments includes all stocks, plus cash minus all short positions. |
(2) | Total represents the difference between the long exposure and the short exposure, which produces the net exposure. |
Comparison of Change in Value of a $10,000 Investment
Past performance does not guarantee future results. The performance data quoted represents past performance, and current returns may be lower or higher. The investment return and net asset value will fluctuate so that an investor’s shares, when redeemed, may be worth more or less than the original cost. To obtain performance information current to the most recent month-end, please call 1-800-625-7071. The graph above does not reflect the deduction of taxes that a shareholder would have paid on Fund distributions or on the redemption of Fund shares. Since inception, the Fund’s adviser has absorbed certain expenses of the Fund, without which returns would have been lower.
The Global Industry Classification Standard (GICS) was developed by and/or is the exclusive property of MSCI, Inc. and Standard & Poor Financial Services LLC (‘‘S&P’’). GICS is a service mark of MSCI and S&P and has been licensed for use by U.S. Bancorp Fund Services, LLC.
Needham Funds
Disclosure of Fund Expenses (Unaudited)
The following expense table is shown so that you can understand the impact of fees on your investment. All mutual funds have operating expenses. As a shareholder of a Portfolio, you incur transactional costs, including redemption fees and ongoing costs, which include costs for portfolio management, administrative services, and shareholder reports, among others. A Portfolio’s expenses are expressed as a percentage of its average net assets. This figure is known as the expense ratio. The following examples are intended to help you understand the ongoing costs (in dollars) of investing in each Portfolio and to compare these costs with those of other mutual funds. The examples are based on an investment of $1,000 made at the beginning of the period shown and held for the entire period. The expense example table below illustrates your fund’s cost in two ways:
| • | Actual Expenses. This section helps you to estimate the actual expenses after fee waivers that you paid over the period. The “Ending Account Value” shown is derived from the Portfolio’s actual return, and “Expenses Paid During Period” shows the dollar amount that would have been paid by an investor who started with $1,000 in the Portfolio. You may use the information here, together with the amount you invested, to estimate the expenses that you paid over the period. To do so, simply divide your account value by $1,000 (for example, an $8,600 account value divided by $1,000 = 8.6), then multiply the result by the number given for your Portfolio under the heading entitled “Expenses Paid During Period”. |
| | |
| • | Hypothetical Expenses on a 5% Return. This section is intended to help you compare your Portfolio’s costs with those of other mutual funds. It assumes that the Portfolio had a return of 5% before expenses during the period shown, but that the expense ratio is unchanged. In this case, because the return used is not the Portfolio’s actual return, the results do not apply to your investment. The example is useful in making comparisons because the Securities and Exchange Commission requires all mutual funds to calculate expenses based on a 5% return. You can assess your Portfolio’s cost by comparing this hypothetical example with the hypothetical examples that appear in shareholders reports of other funds. |
Please note that the expenses shown in the table are meant to highlight your ongoing costs only and do not reflect any transactional costs, such as redemption fees or exchange fees. Therefore, the table is useful in comparing ongoing costs only, and will not help you determine the relative total costs of owning different funds. In addition, if these transactional costs were included, your costs would have been higher.
Annual Report 2016
For the Period July 1, 2016 to December 31, 2016
Expense Example Table
| | Beginning | Ending | Expenses Paid | Expense Ratio |
| | Account | Account | During Period* | During Period* |
| | Value | Value | 7/1/16 – | 7/1/16 – |
| | 7/1/16 | 12/31/16 | 12/31/16 | 12/31/16 |
| Needham Growth Fund | | | | |
| Actual Expenses | $1,000.00 | $1,096.10 | $10.91 | 2.07% |
| Hypothetical Example for | | | | |
| Comparison Purposes | | | | |
| (5% return before expenses) | $1,000.00 | $1,014.73 | $10.48 | 2.07% |
| | | | | |
| Needham Aggressive Growth Fund | | | | |
| Actual Expenses | $1,000.00 | $1,204.60 | $13.80 | 2.49% |
| Hypothetical Example for | | | | |
| Comparison Purposes | | | | |
| (5% return before expenses) | $1,000.00 | $1,072.62 | $12.60 | 2.49% |
| | | | | |
| Needham Small Cap Growth Fund | | | | |
| Actual Expenses | $1,000.00 | $1,210.40 | $11.95 | 2.15% |
| Hypothetical Example for | | | | |
| Comparison Purposes | | | | |
| (5% return before expenses) | $1,000.00 | $1,014.33 | $10.89 | 2.15% |
| * | Expenses are equal to the average account value times the Portfolio’s annualized expense ratio multiplied 184/366 (to reflect the one-half-year period). |
Needham Funds
Needham Growth Fund
Schedule of Investments
December 31, 2016
| | | Shares | | | Market Value | |
| Common Stocks (98.9%) | | | | | | |
| | | | | | | |
| Airlines (0.3%) | | | | | | |
| United Continental Holdings, Inc.* | | | 5,000 | | | $ | 364,400 | |
| | | | | | | | | |
| Auto Components (0.1%) | | | | | | | | |
| Sypris Solutions, Inc.* | | | 202,233 | | | | 177,945 | |
| | | | | | | | | |
| Biotechnology (5.5%) | | | | | | | | |
| Gilead Sciences, Inc.† | | | 93,000 | | | | 6,659,730 | |
| | | | | | | | | |
| Capital Markets (2.5%) | | | | | | | | |
| Financial Engines, Inc.† | | | 60,000 | | | | 2,205,000 | |
| Oaktree Capital Group LLC | | | 20,000 | | | | 750,000 | |
| | | | | | | | 2,955,000 | |
| | | | | | | | | |
| Chemicals (0.0%) | | | | | | | | |
| AdvanSix, Inc.* | | | 160 | | | | 3,542 | |
| | | | | | | | | |
| Communications Equipment (10.0%) | | | | | | | | |
| KVH Industries, Inc.* | | | 534,725 | | | | 6,309,755 | |
| ViaSat, Inc.*† | | | 86,000 | | | | 5,694,920 | |
| | | | | | | | 12,004,675 | |
| | | | | | | | | |
| Electrical Equipment (0.2%) | | | | | | | | |
| Vicor Corp.* | | | 15,000 | | | | 226,500 | |
| | | | | | | | | |
| Electronic Equipment, Instruments & Components (6.3%) | | | | | | | | |
| Corning, Inc. | | | 35,000 | | | | 849,450 | |
| FLIR Systems, Inc. | | | 15,000 | | | | 542,850 | |
| Frequency Electronics, Inc.* | | | 34,850 | | | | 376,380 | |
| IPG Photonics Corp.* | | | 6,000 | | | | 592,260 | |
| Jabil Circuit, Inc.† | | | 150,000 | | | | 3,550,500 | |
| National Instruments Corp. | | | 20,800 | | | | 641,056 | |
| Vishay Intertechnology, Inc. | | | 60,000 | | | | 972,000 | |
| | | | | | | | 7,524,496 | |
| | | | | | | | | |
| Energy Equipment & Services (1.3%) | | | | | | | | |
| Aspen Aerogels, Inc.* | | | 50,000 | | | | 206,500 | |
| Core Laboratories NV | | | 2,500 | | | | 300,100 | |
| Schlumberger Ltd. | | | 12,500 | | | | 1,049,375 | |
| | | | | | | | 1,555,975 | |
See accompanying notes to financial statements.
Annual Report 2016
Needham Growth Fund
Schedule of Investments (Continued)
December 31, 2016
| | | Shares | | | Market Value | |
| Common Stocks – Continued | | | | | | |
| | | | | | | |
| Health Care Equipment & Supplies (9.1%) | | | | | | |
| Analogic Corp. | | | 5,000 | | | $ | 414,750 | |
| Becton Dickinson and Co. | | | 32,500 | | | | 5,380,375 | |
| CONMED Corp. | | | 30,000 | | | | 1,325,100 | |
| Invuity, Inc.* | | | 103,100 | | | | 592,825 | |
| Medtronic PLC | | | 26,290 | | | | 1,872,637 | |
| Varian Medical Systems, Inc.* | | | 14,500 | | | | 1,301,810 | |
| | | | | | | | 10,887,497 | |
| | | | | | | | | |
| Health Care Providers & Services (6.9%) | | | | | | | | |
| Express Scripts Holding Co.*† | | | 120,000 | | | | 8,254,800 | |
| | | | | | | | | |
| Health Care Technology (0.1%) | | | | | | | | |
| Castlight Health, Inc.* | | | 30,000 | | | | 148,500 | |
| | | | | | | | | |
| Household Products (0.1%) | | | | | | | | |
| Oil-Dri Corp. of America | | | 4,000 | | | | 152,840 | |
| | | | | | | | | |
| Industrial Conglomerates (0.4%) | | | | | | | | |
| Honeywell International, Inc. | | | 4,000 | | | | 463,400 | |
| | | | | | | | | |
| Internet Software & Services (8.3%) | | | | | | | | |
| 2U, Inc.* | | | 6,000 | | | | 180,900 | |
| Akamai Technologies, Inc.*† | | | 50,000 | | | | 3,334,000 | |
| Amber Road, Inc.* | | | 415,000 | | | | 3,768,200 | |
| Nutanix, Inc.* | | | 10,000 | | | | 265,600 | |
| Q2 Holdings, Inc.* | | | 20,000 | | | | 577,000 | |
| Reis, Inc. | | | 67,000 | | | | 1,490,750 | |
| The Trade Desk, Inc.* | | | 12,500 | | | | 345,875 | |
| | | | | | | | 9,962,325 | |
| | | | | | | | | |
| Life Sciences Tools & Services (7.7%) | | | | | | | | |
| Bruker Corp. | | | 10,000 | | | | 211,800 | |
| Thermo Fisher Scientific, Inc.† | | | 64,000 | | | | 9,030,400 | |
| | | | | | | | 9,242,200 | |
| | | | | | | | | |
| Media (3.6%) | | | | | | | | |
| Comcast Corp. | | | 60,000 | | | | 4,143,000 | |
| World Wrestling Entertainment, Inc. | | | 12,500 | | | | 230,000 | |
| | | | | | | | 4,373,000 | |
See accompanying notes to financial statements.
Needham Funds
Needham Growth Fund
Schedule of Investments (Continued)
December 31, 2016
| | | Shares | | | Market Value | |
| Common Stocks – Continued | | | | | | |
| | | | | | | |
| Oil, Gas & Consumable Fuels (0.5%) | | | | | | |
| Hess Corp. | | | 10,000 | | | $ | 622,900 | |
| Navigator Holdings Ltd.* | | | 5,000 | | | | 46,500 | |
| | | | | | | | 669,400 | |
| | | | | | | | | |
| Pharmaceuticals (0.9%) | | | | | | | | |
| Agile Therapeutics, Inc.* | | | 35,000 | | | | 199,500 | |
| Corium International, Inc.* | | | 205,000 | | | | 832,300 | |
| | | | | | | | 1,031,800 | |
| | | | | | | | | |
| Professional Services (1.3%) | | | | | | | | |
| WageWorks, Inc.* | | | 22,500 | | | | 1,631,250 | |
| | | | | | | | | |
| Semiconductors & Semiconductor Equipment (16.6%) | | | | | | | | |
| Applied Materials, Inc. | | | 7,500 | | | | 242,025 | |
| Brooks Automation, Inc. | | | 60,000 | | | | 1,024,200 | |
| Entegris, Inc.* | | | 167,500 | | | | 2,998,250 | |
| FormFactor, Inc.* | | | 399,100 | | | | 4,469,920 | |
| Lam Research Corp. | | | 2,500 | | | | 264,325 | |
| MKS Instruments, Inc. | | | 45,000 | | | | 2,673,000 | |
| Nova Measuring Instruments Ltd.* | | | 85,000 | | | | 1,116,900 | |
| PDF Solutions, Inc.* | | | 237,900 | | | | 5,364,645 | |
| Photronics, Inc.* | | | 139,500 | | | | 1,576,350 | |
| Ultra Clean Holdings, Inc.* | | | 17,500 | | | | 169,750 | |
| | | | | | | | 19,899,365 | |
| | | | | | | | | |
| Software (0.6%) | | | | | | | | |
| Red Hat, Inc.* | | | 10,000 | | | | 697,000 | |
| | | | | | | | | |
| Specialty Retail (6.8%) | | | | | | | | |
| CarMax, Inc.*† | | | 105,000 | | | | 6,760,950 | |
| Dick’s Sporting Goods, Inc. | | | 22,000 | | | | 1,168,200 | |
| Tiffany & Co. | | | 2,500 | | | | 193,575 | |
| | | | | | | | 8,122,725 | |
| | | | | | | | | |
| Technology Hardware, Storage & Peripherals (8.0%) | | | | | | | | |
| Apple, Inc. | | | 7,500 | | | | 868,650 | |
| Cray, Inc.* | | | 20,000 | | | | 414,000 | |
| Electronics For Imaging, Inc.* | | | 64,000 | | | | 2,807,040 | |
| Nimble Storage, Inc.* | | | 17,500 | | | | 138,600 | |
See accompanying notes to financial statements.
Annual Report 2016
Needham Growth Fund
Schedule of Investments (Continued)
December 31, 2016
| | | Shares | | | Market Value | |
| Common Stocks – Continued | | | | | | |
| | | | | | | |
| Technology Hardware, | | | | | | |
| Storage & Peripherals – Continued | | | | | | |
| Pure Storage, Inc.* | | | 17,500 | | | $ | 197,925 | |
| Super Micro Computer, Inc.* | | | 184,850 | | | | 5,185,042 | |
| | | | | | | | 9,611,257 | |
| | | | | | | | | |
| Textiles, Apparel & Luxury Goods (0.3%) | | | | | | | | |
| Under Armour, Inc.* | | | 12,500 | | | | 324,325 | |
| | | | | | | | | |
| Thrifts & Mortgage Finance (0.1%) | | | | | | | | |
| Ladder Capital Corp. | | | 7,430 | | | | 101,940 | |
| | | | | | | | | |
| Trading Companies & Distributors (1.4%) | | | | | | | | |
| Air Lease Corp. | | | 50,000 | | | | 1,716,500 | |
| | | | | | | | | |
| Total Common Stocks | | | | | | | | |
| (Cost $52,871,751) | | | | | | $ | 118,762,387 | |
| | | | | | | | | |
| Short-Term Investments (2.4%) | | | | | | | | |
| | | | | | | | | |
| Money Market Fund (2.4%) | | | | | | | | |
| Dreyfus Treasury Securities Cash Management – | | | | | | | | |
| Institutional Class 0.31% (a) | | | | | | | | |
| (Cost $2,841,831) | | | 2,841,831 | | | $ | 2,841,831 | |
| | | | | | | | | |
| Total Investments (101.3%) | | | | | | | | |
| (Cost $55,713,582) | | | | | | | 121,604,218 | |
| Total Securities Sold Short (-4.2%) | | | | | | | (5,047,843 | ) |
| (Proceeds $3,792,275) | | | | | | | | |
| Other Assets in Excess of Liabilities (2.9%) | | | | | | | 3,477,649 | |
| Net Assets (100.0%) | | | | | | $ | 120,034,024 | |
| * | Non-income producing security. |
| (a) | Rate shown is the seven day yield as of December 31, 2016. |
| † | Security position is either entirely or partially held in a segregated account as collateral for securities sold short, aggregating a total market value of $4,106,475. |
| | The Global Industry Classification Standard (GICS®) was developed by and/or is the exclusive property of MSCI, Inc. and Standard & Poor’s Financial Services LLC (“S&P”). GICS is a service mark of MSCI and S&P and has been licensed for use by U.S. Bancorp Fund Services, LLC. |
See accompanying notes to financial statements.
Needham Funds
Needham Growth Fund
Schedule of Securities Sold Short
December 31, 2016
| | | Shares | | | Market Value | |
| Securities Sold Short (-4.0%) | | | | | | |
| | | | | | | |
| Capital Markets (-0.4%) | | | | | | |
| Medallion Financial Corp. | | | 150,000 | | | $ | 453,000 | |
| | | | | | | | | |
| Communications Equipment (-3.3%) | | | | | | | | |
| Ubiquiti Networks, Inc.* | | | 67,500 | | | | 3,901,500 | |
| | | | | | | | | |
| Insurance (-0.1%) | | | | | | | | |
| Health Insurance Innovations, Inc.* | | | 8,750 | | | | 156,188 | |
| | | | | | | | | |
| Semiconductors & Semiconductor Equipment (-0.2%) | | | | | | | | |
| Acacia Communications, Inc.* | | | 2,000 | | | | 123,500 | |
| Applied Micro Circuits Corp.* | | | 16,500 | | | | 136,125 | |
| | | | | | | | 259,625 | |
| | | | | | | | | |
| Total Securities Sold Short (-4.0%) | | | | | | | | |
| (Proceeds $3,537,671) | | | | | | $ | 4,770,313 | |
| | | | | | | | | |
| Exchange Traded Funds Sold Short (-0.2%) | | | | | | | | |
| iShares Core S&P Small-Cap ETF | | | 1,000 | | | | 137,520 | |
| iShares S&P Small-Cap 600 Value ETF | | | 1,000 | | | | 140,010 | |
| | | | | | | | | |
| Total Exchange Traded Funds Sold Short (-0.2%) | | | | | | | | |
| (Proceeds $254,604) | | | | | | $ | 277,530 | |
| | | | | | | | | |
| Total Securities & Exchange Traded Funds Sold Short (-4.2%) | | | | | | | | |
| (Proceeds $3,792,275) | | | | | | $ | 5,047,843 | |
| * | Non-income producing security. |
See accompanying notes to financial statements.
Annual Report 2016
Needham Aggressive Growth Fund
Schedule of Investments
December 31, 2016
| | | Shares | | | Market Value | |
| Common Stocks (95.6%) | | | | | | |
| | | | | | | |
| Biotechnology (2.8%) | | | | | | |
| Gilead Sciences, Inc.† | | | 23,000 | | | $ | 1,647,030 | |
| | | | | | | | | |
| Capital Markets (1.6%) | | | | | | | | |
| Financial Engines, Inc. | | | 25,000 | | | | 918,750 | |
| TheStreet, Inc.* | | | 20,450 | | | | 17,383 | |
| | | | | | | | 936,133 | |
| | | | | | | | | |
| Commercial Services & Supplies (0.1%) | | | | | | | | |
| Clean Harbors, Inc.* | | | 1,000 | | | | 55,650 | |
| | | | | | | | | |
| Communications Equipment (10.0%) | | | | | | | | |
| KVH Industries, Inc.*† | | | 330,025 | | | | 3,894,295 | |
| Norsat International, Inc.* | | | 90,366 | | | | 713,891 | |
| ViaSat, Inc.*† | | | 19,500 | | | | 1,291,290 | |
| | | | | | | | 5,899,476 | |
| | | | | | | | | |
| Electrical Equipment (1.4%) | | | | | | | | |
| Vicor Corp.* | | | 53,727 | | | | 811,278 | |
| | | | | | | | | |
| Electronic Equipment, Instruments & Components (3.0%) | | | | | | | | |
| FLIR Systems, Inc. | | | 7,500 | | | | 271,425 | |
| Frequency Electronics, Inc.* | | | 28,950 | | | | 312,660 | |
| IPG Photonics Corp.* | | | 7,500 | | | | 740,325 | |
| National Instruments Corp. | | | 9,700 | | | | 298,954 | |
| Vishay Precision Group, Inc.* | | | 8,000 | | | | 151,200 | |
| | | | | | | | 1,774,564 | |
| | | | | | | | | |
| Energy Equipment & Services (0.5%) | | | | | | | | |
| Aspen Aerogels, Inc.* | | | 70,000 | | | | 289,100 | |
| | | | | | | | | |
| Health Care Equipment & Supplies (3.6%) | | | | | | | | |
| Analogic Corp. | | | 5,000 | | | | 414,750 | |
| Becton Dickinson and Co. | | | 4,500 | | | | 744,975 | |
| Invuity, Inc.* | | | 48,350 | | | | 278,012 | |
| LeMaitre Vascular, Inc. | | | 28,000 | | | | 709,520 | |
| | | | | | | | 2,147,257 | |
See accompanying notes to financial statements.
Needham Funds
Needham Aggressive Growth Fund
Schedule of Investments (Continued)
December 31, 2016
| | | Shares | | | Market Value | |
| Common Stocks – Continued | | | | | | |
| | | | | | | |
| Health Care Providers & Services (1.0%) | | | | | | |
| Civitas Solutions, Inc.* | | | 7,500 | | | $ | 149,250 | |
| Express Scripts Holding Co.* | | | 6,000 | | | | 412,740 | |
| | | | | | | | 561,990 | |
| | | | | | | | | |
| Health Care Technology (0.7%) | | | | | | | | |
| Omnicell, Inc.* | | | 13,000 | | | | 440,700 | |
| | | | | | | | | |
| Household Durables (0.4%) | | | | | | | | |
| iRobot Corp.* | | | 4,000 | | | | 233,800 | |
| | | | | | | | | |
| Household Products (1.7%) | | | | | | | | |
| Oil-Dri Corp. of America | | | 26,500 | | | | 1,012,565 | |
| | | | | | | | | |
| Internet Software & Services (15.3%) | | | | | | | | |
| 2U, Inc.* | | | 6,000 | | | | 180,900 | |
| Akamai Technologies, Inc.*† | | | 62,500 | | | | 4,167,500 | |
| Amber Road, Inc.*† | | | 168,550 | | | | 1,530,434 | |
| ARI Network Services, Inc.* | | | 15,000 | | | | 81,150 | |
| ChannelAdvisor Corp.* | | | 14,117 | | | | 202,579 | |
| Nutanix, Inc.* | | | 1,500 | | | | 39,840 | |
| Q2 Holdings, Inc.* | | | 12,500 | | | | 360,625 | |
| Reis, Inc.† | | | 102,500 | | | | 2,280,625 | |
| The Trade Desk, Inc. * | | | 5,000 | | | | 138,350 | |
| | | | | | | | 8,982,003 | |
| | | | | | | | | |
| Media (0.2%) | | | | | | | | |
| World Wrestling Entertainment, Inc. | | | 6,000 | | | | 110,400 | |
| | | | | | | | | |
| Pharmaceuticals (1.3%) | | | | | | | | |
| Agile Therapeutics, Inc.* | | | 35,000 | | | | 199,500 | |
| Corium International, Inc.* | | | 140,000 | | | | 568,400 | |
| | | | | | | | 767,900 | |
| | | | | | | | | |
| Professional Services (3.8%) | | | | | | | | |
| CRA International, Inc. | | | 5,000 | | | | 183,000 | |
| WageWorks, Inc.*† | | | 28,000 | | | | 2,030,000 | |
| | | | | | | | 2,213,000 | |
See accompanying notes to financial statements.
Annual Report 2016
Needham Aggressive Growth Fund
Schedule of Investments (Continued)
December 31, 2016
| | | Shares | | | Market Value | |
| Common Stocks – Continued | | | | | | |
| | | | | | | |
| Real Estate Investment Trusts (REITs) (2.1%) | | | | | | |
| Equinix, Inc. | | | 3,499 | | | $ | 1,250,578 | |
| | | | | | | | | |
| Semiconductors & Semiconductor Equipment (25.7%) | | | | | | | | |
| Entegris, Inc.* | | | 190,000 | | | | 3,401,000 | |
| FormFactor, Inc.* | | | 189,600 | | | | 2,123,520 | |
| MKS Instruments, Inc. | | | 27,000 | | | | 1,603,800 | |
| Nova Measuring Instruments Ltd.* | | | 80,000 | | | | 1,051,200 | |
| PDF Solutions, Inc.*† | | | 255,050 | | | | 5,751,377 | |
| Photronics, Inc.* | | | 97,750 | | | | 1,104,575 | |
| Xcerra Corp.* | | | 10,000 | | | | 76,400 | |
| | | | | | | | 15,111,872 | |
| | | | | | | | | |
| Software (7.2%) | | | | | | | | |
| Bottomline Technologies, Inc.* | | | 18,000 | | | | 450,360 | |
| Exa Corp.* | | | 5,000 | | | | 76,800 | |
| GSE Systems, Inc.* | | | 960,000 | | | | 3,360,000 | |
| Red Hat, Inc.* | | | 5,000 | | | | 348,500 | |
| | | | | | | | 4,235,660 | |
| | | | | | | | | |
| Specialty Retail (3.3%) | | | | | | | | |
| CarMax, Inc.*† | | | 21,500 | | | | 1,384,385 | |
| Dick’s Sporting Goods, Inc. | | | 10,000 | | | | 531,000 | |
| | | | | | | | 1,915,385 | |
| | | | | | | | | |
| Technology Hardware, Storage & Peripherals (9.6%) | | | | | | | | |
| Apple, Inc.† | | | 22,000 | | | | 2,548,040 | |
| Electronics For Imaging, Inc.* | | | 16,000 | | | | 701,760 | |
| Super Micro Computer, Inc.*† | | | 85,500 | | | | 2,398,275 | |
| | | | | | | | 5,648,075 | |
| | | | | | | | | |
| Textiles, Apparel & Luxury Goods (0.3%) | | | | | | | | |
| Under Armour, Inc.* | | | 7,000 | | | | 176,190 | |
| | | | | | | | | |
| Thrifts & Mortgage Finance (0.0%) | | | | | | | | |
| Ladder Capital Corp. | | | 1,576 | | | | 21,623 | |
| | | | | | | | | |
| Total Common Stocks | | | | | | | | |
| (Cost $25,858,880) | | | | | | $ | 56,242,229 | |
See accompanying notes to financial statements.
Needham Funds
Needham Aggressive Growth Fund
Schedule of Investments (Continued)
December 31, 2016
| | | Shares | | | Market Value | |
| Short-Term Investments (4.4%) | | | | | | |
| | | | | | | |
| Money Market Fund (4.4%) | | | | | | |
| Dreyfus Treasury Securities Cash Management – | | | | | | |
| Institutional Class 0.31% (a) | | | | | | |
| (Cost $2,564,997) | | | 2,564,997 | | | $ | 2,564,997 | |
| | | | | | | | | |
| Total Investments (100.0%) | | | | | | | | |
| (Cost $28,423,877) | | | | | | | 58,807,226 | |
| Total Securities Sold Short (-6.9%) | | | | | | | (4,039,537 | ) |
| (Proceeds $3,016,583) | | | | | | | | |
| Other Assets in Excess of Liabilities (6.9%) | | | | | | | 4,089,915 | |
| Net Assets (100.0%) | | | | | | $ | 58,857,604 | |
| * | Non-income producing security. |
| (a) | Rate shown is the seven day yield as of December 31, 2016. |
| † | Security position is either entirely or partially held in a segregated account as collateral for securities sold short, aggregating a total market value of $4,068,900. |
| | The Global Industry Classification Standard (GICS®) was developed by and/or is the exclusive property of MSCI, Inc. and Standard & Poor’s Financial Services LLC (“S&P”). GICS is a service mark of MSCI and S&P and has been licensed for use by U.S. Bancorp Fund Services, LLC. |
See accompanying notes to financial statements.
Annual Report 2016
Needham Aggressive Growth Fund
Schedule of Securities Sold Short
December 31, 2016
| | | Shares | | | Market Value | |
| Securities Sold Short (-6.9%) | | | | | | |
| | | | | | | |
| Capital Markets (-0.8%) | | | | | | |
| Medallion Financial Corp. | | | 158,000 | | | $ | 477,160 | |
| | | | | | | | | |
| Communications Equipment (-4.5%) | | | | | | | | |
| Ubiquiti Networks, Inc.* | | | 46,250 | | | | 2,673,249 | |
| | | | | | | | | |
| Insurance (-0.3%) | | | | | | | | |
| Health Insurance Innovations, Inc.* | | | 8,750 | | | | 156,188 | |
| | | | | | | | | |
| Semiconductors & Semiconductor Equipment (-0.4%) | | | | | | | | |
| Acacia Communications, Inc.* | | | 2,000 | | | | 123,500 | |
| Applied Micro Circuits Corp.* | | | 16,500 | | | | 136,125 | |
| | | | | | | | 259,625 | |
| | | | | | | | | |
| Software (-0.6%) | | | | | | | | |
| ANSYS, Inc.* | | | 3,500 | | | | 323,715 | |
| | | | | | | | | |
| Thrifts & Mortgage Finance (-0.3%) | | | | | | | | |
| Federal Home Loan Mortgage Corp.* | | | 40,000 | | | | 149,600 | |
| | | | | | | | | |
| Total Securities Sold Short (-6.9%) | | | | | | | | |
| (Proceeds $3,016,583) | | | | | | $ | 4,039,537 | |
| * | Non-income producing security. |
See accompanying notes to financial statements.
Needham Funds
Needham Small Cap Growth Fund
Schedule of Investments
December 31, 2016
| | | Shares | | | Market Value | |
| Common Stocks (74.4%) | | | | | | |
| | | | | | | |
| Biotechnology (0.6%) | | | | | | |
| Exact Sciences Corp.* | | | 15,000 | | | $ | 200,400 | |
| | | | | | | | | |
| Communications Equipment (6.9%) | | | | | | | | |
| KVH Industries, Inc.*† | | | 130,000 | | | | 1,534,000 | |
| ViaSat, Inc.* | | | 14,000 | | | | 927,080 | |
| | | | | | | | 2,461,080 | |
| | | | | | | | | |
| Electronic Equipment, Instruments & Components (8.0%) | | | | | | | | |
| Frequency Electronics, Inc.* | | | 99,616 | | | | 1,075,853 | |
| InvenSense, Inc.* | | | 126,000 | | | | 1,611,540 | |
| Jabil Circuit, Inc. | | | 7,500 | | | | 177,525 | |
| | | | | | | | 2,864,918 | |
| | | | | | | | | |
| Energy Equipment & Services (3.0%) | | | | | | | | |
| Aspen Aerogels, Inc.* | | | 120,000 | | | | 495,600 | |
| Core Laboratories NV | | | 4,000 | | | | 480,160 | |
| Independence Contract Drilling, Inc.* | | | 15,000 | | | | 100,500 | |
| | | | | | | | 1,076,260 | |
| | | | | | | | | |
| Food Products (1.0%) | | | | | | | | |
| Lifeway Foods, Inc.* | | | 30,000 | | | | 345,300 | |
| | | | | | | | | |
| Health Care Equipment & Supplies (2.6%) | | | | | | | | |
| Invuity, Inc.* | | | 162,489 | | | | 934,312 | |
| | | | | | | | | |
| Health Care Providers & Services (0.2%) | | | | | | | | |
| Express Scripts Holding Co.* | | | 1,000 | | | | 68,790 | |
| | | | | | | | | |
| Health Care Technology (0.8%) | | | | | | | | |
| Castlight Health, Inc.* | | | 60,000 | | | | 297,000 | |
| | | | | | | | | |
| Internet Software & Services (14.4%) | | | | | | | | |
| 2U, Inc.* | | | 5,000 | | | | 150,750 | |
| Amber Road, Inc.*† | | | 185,000 | | | | 1,679,800 | |
| ChannelAdvisor Corp.* | | | 40,000 | | | | 574,000 | |
| Hortonworks, Inc.* | | | 80,000 | | | | 664,800 | |
| Nutanix, Inc.* | | | 20,000 | | | | 531,200 | |
| Reis, Inc.† | | | 36,000 | | | | 801,000 | |
| The Trade Desk, Inc.* | | | 15,000 | | | | 415,050 | |
See accompanying notes to financial statements.
Annual Report 2016
Needham Small Cap Growth Fund
Schedule of Investments (Continued)
December 31, 2016
| | | Shares | | | Market Value | |
| Common Stocks – Continued | | | | | | |
| | | | | | | |
| Internet Software & Services – Continued | | | | | | |
| YuMe, Inc.* | | | 92,677 | | | $ | 331,784 | |
| | | | | | | | 5,148,384 | |
| | | | | | | | |
| Oil, Gas & Consumable Fuels (2.3%) | | | | | | | | |
| Approach Resources, Inc.* | | | 100,000 | | | | 335,000 | |
| Hess Corp. | | | 4,750 | | | | 295,877 | |
| Navigator Holdings Ltd.* | | | 20,000 | | | | 186,000 | |
| | | | | | | | 816,877 | |
| | | | | | | | |
| Pharmaceuticals (2.6%) | | | | | | | | |
| Agile Therapeutics, Inc.* | | | 70,000 | | | | 399,000 | |
| Corium International, Inc.* | | | 130,000 | | | | 527,800 | |
| | | | | | | | 926,800 | |
| | | | | | | | | |
| Semiconductors & Semiconductor Equipment (15.7%) | | | | | | | | |
| Cohu, Inc. | | | 40,000 | | | | 556,000 | |
| Entegris, Inc.* | | | 2,500 | | | | 44,750 | |
| FormFactor, Inc.* | | | 52,400 | | | | 586,880 | |
| PDF Solutions, Inc.*† | | | 90,000 | | | | 2,029,500 | |
| Photronics, Inc.* | | | 30,750 | | | | 347,475 | |
| Ultra Clean Holdings, Inc.* | | | 180,000 | | | | 1,746,000 | |
| Veeco Instruments, Inc.* | | | 10,000 | | | | 291,500 | |
| | | | | | | | 5,602,105 | |
| | | | | | | | | |
| Software (2.7%) | | | | | | | | |
| FireEye, Inc.* | | | 80,000 | | | | 952,000 | |
| | | | | | | | | |
| Technology Hardware, Storage & Peripherals (11.0%) | | | | | | | | |
| Cray, Inc.* | | | 40,000 | | | | 828,000 | |
| Nimble Storage, Inc.* | | | 150,000 | | | | 1,188,000 | |
| Pure Storage, Inc.* | | | 90,000 | | | | 1,017,900 | |
| Super Micro Computer, Inc.*† | | | 31,500 | | | | 883,575 | |
| | | | | | | | 3,917,475 | |
| | | | | | | | | |
| Thrifts & Mortgage Finance (0.2%) | | | | | | | | |
| LendingTree, Inc.* | | | 500 | | | | 50,675 | |
| | | | | | | | | |
See accompanying notes to financial statements.
Needham Funds
Needham Small Cap Growth Fund
Schedule of Investments (Continued)
December 31, 2016
| | | Shares | | | Market Value | |
| Common Stocks – Continued | | | | | | |
| | | | | | | |
| Trading Companies & Distributors (2.4%) | | | | | | |
| Air Lease Corp.† | | | 25,000 | | | $ | 858,250 | |
| Total Common Stocks | | | | | | | | |
| (Cost $22,415,676) | | | | | | $ | 26,520,626 | |
| | | | | | | | | |
| Closed-End Funds (0.1%) | | | | | | | | |
| Tekla Healthcare Investors | | | 1,000 | | | | 21,130 | |
| Tekla Life Sciences Investors | | | 1,500 | | | | 25,485 | |
| | | | | | | | 46,615 | |
| Total Closed-End Funds | | | | | | | | |
| (Cost $48,852) | | | | | | $ | 46,615 | |
| | | | | | | | | |
| Short-Term Investments (29.9%) | | | | | | | | |
| | | | | | | | | |
| Money Market Fund (29.9%) | | | | | | | | |
| Dreyfus Treasury Securities Cash Management – | | | | | | | | |
| Institutional Class 0.31% (a) | | | | | | | | |
| (Cost $10,666,908) | | | 10,666,908 | | | $ | 10,666,908 | |
| | | | | | | | | |
| Total Investments (104.4%) | | | | | | | | |
| (Cost $33,131,436) | | | | | | | 37,234,149 | |
| Total Securities Sold Short (-0.8%) | | | | | | | (289,000 | ) |
| (Proceeds $288,558) | | | | | | | | |
| Liabilities in Excess of Other Assets (-3.6%) | | | | | | | (1,287,688 | ) |
| Net Assets (100.0%) | | | | | | $ | 35,657,461 | |
| * | Non-income producing security. |
| (a) | Rate shown is the seven day yield as of December 31, 2016. |
| † | Security position is either entirely or partially held in a segregated account as collateral for securities sold short, aggregating a total market value of $849,100. |
| | The Global Industry Classification Standard (GICS®) was developed by and/or is the exclusive property of MSCI, Inc. and Standard & Poor’s Financial Services LLC (“S&P”). GICS is a service mark of MSCI and S&P and has been licensed for use by U.S. Bancorp Fund Services, LLC. |
See accompanying notes to financial statements.
Annual Report 2016
Needham Small Cap Growth Fund
Schedule of Securities Sold Short
December 31, 2016
| | | Shares | | | Market Value | |
| Securities Sold Short (-0.8%) | | | | | | |
| | | | | | | |
| Communications Equipment (-0.8%) | | | | | | |
| Ubiquiti Networks, Inc.* | | | 5,000 | | | $ | 289,000 | |
| | | | | | | | | |
| Total Securities Sold Short (-0.8%) | | | | | | | | |
| (Proceeds $288,558) | | | | | | $ | 289,000 | |
| * | Non-income producing security. |
See accompanying notes to financial statements.
Needham Funds
Statements of Assets and Liabilities
December 31, 2016
| | | | | | Needham | | | Needham | |
| | | Needham | | | Aggressive | | | Small Cap | |
| | | Growth Fund | | | Growth Fund | | | Growth Fund | |
| Assets | | | | | | | | | |
| Investments, at Value | | | | | | | | | |
| (Cost $55,713,582, $28,423,877, $33,131,436) | | $ | 121,604,218 | | | $ | 58,807,226 | | | $ | 37,234,149 | |
| Receivables: | | | | | | | | | | | | |
| Deposit with Broker for Securities Sold Short | | | 5,184,891 | | | | 4,203,445 | | | | 133,279 | |
| Dividends and Interest | | | 63,942 | | | | 2,906 | | | | 7,135 | |
| Fund Shares Sold | | | 2,011 | | | | 148,191 | | | | 174,451 | |
| Investment Securities Sold | | | 8,811 | | | | 201,219 | | | | 288,558 | |
| Prepaid Expenses | | | 64,269 | | | | 39,278 | | | | 27,772 | |
| Total Assets | | | 126,928,142 | | | | 63,402,265 | | | | 37,865,344 | |
| | | | | | | | | | | | | |
| Liabilities | | | | | | | | | | | | |
| Securities Sold Short, at Value | | | | | | | | | | | | |
| (Proceeds $3,792,275, $3,016,583, $288,558) | | | 5,047,843 | | | | 4,039,537 | | | | 289,000 | |
| Payables: | | | | | | | | | | | | |
| Investment Securities Purchased | | | 501,504 | | | | 336,378 | | | | 1,774,407 | |
| Fund Shares Redeemed | | | 1,083,493 | | | | 29,947 | | | | 64,235 | |
| Due to Adviser | | | 105,370 | | | | 53,433 | | | | 27,231 | |
| Distribution Fees | | | 26,298 | | | | 12,520 | | | | 7,349 | |
| Administration and Accounting Fees | | | 24,368 | | | | 11,195 | | | | 6,206 | |
| Transfer Agent Fees | | | 9,372 | | | | 6,733 | | | | 6,052 | |
| Accrued Expenses and Other Liabilities | | | 95,870 | | | | 54,918 | | | | 33,403 | |
| Total Liabilities | | | 6,894,118 | | | | 4,544,661 | | | | 2,207,883 | |
| Total Net Assets | | $ | 120,034,024 | | | $ | 58,857,604 | | | $ | 35,657,461 | |
| | | | | | | | | | | | | |
| Retail Class Shares | | | | | | | | | | | | |
| Net Assets | | $ | 119,916,582 | | | $ | 58,695,558 | | | $ | 35,517,673 | |
| Shares Issued and Outstanding | | | | | | | | | | | | |
| $0.001 Par Value (Authorized | | | | | | | | | | | | |
| 800,000,000,100,000,000 and | | | | | | | | | | | | |
| 100,000,000 respectively) | | | 2,762,825 | | | | 2,633,679 | | | | 2,329,339 | |
| Net Asset Value, Offering and | | | | | | | | | | | | |
| Redemption Price Per Share (a) | | $ | 43.40 | | | $ | 22.29 | | | $ | 15.25 | |
| | | | | | | | | | | | | |
| Institutional Class Shares | | | | | | | | | | | | |
| Net Assets | | $ | 117,442 | | | $ | 162,046 | | | $ | 139,788 | |
| Shares Issued and Outstanding | | | | | | | | | | | | |
| $0.001 Par Value (Authorized | | | | | | | | | | | | |
| 800,000,000,100,000,000 and | | | | | | | | | | | | |
| 100,000,000 respectively) | | | 2,706 | | | | 7,270 | | | | 9,166 | |
| Net Asset Value, Offering and | | | | | | | | | | | | |
| Redemption Price Per Share (a) | | $ | 43.40 | | | $ | 22.29 | | | $ | 15.25 | |
(a) | Subject to certain exceptions, a 2% redemption fee is imposed upon shares redeemed within 60 days of their purchase. See Note 2 of the notes to financial statements. |
See accompanying notes to financial statements.
Annual Report 2016
Statements of Assets and Liabilities (Continued)
December 31, 2016
| | | | | | Needham | | | Needham | |
| | | Needham | | | Aggressive | | | Small Cap | |
| | | Growth Fund | | | Growth Fund | | | Growth Fund | |
| Components of Net Assets | | | | | | | | | |
| Paid-in Capital | | $ | 50,702,889 | | | $ | 29,534,211 | | | $ | 31,398,122 | |
| Accumulated Net Investment Loss | | | (18,197 | ) | | | — | | | | — | |
| Accumulated Net Realized | | | | | | | | | | | | |
| Gain (Loss) from Investments | | | | | | | | | | | | |
| and Securities Sold Short | | | 4,714,264 | | | | (37,002 | ) | | | 157,068 | |
| Net Unrealized Appreciation on | | | | | | | | | | | | |
| Investment Securities and | | | | | | | | | | | | |
| Securities Sold Short | | | 64,635,068 | | | | 29,360,395 | | | | 4,102,271 | |
| Total Net Assets | | $ | 120,034,024 | | | $ | 58,857,604 | | | $ | 35,657,461 | |
See accompanying notes to financial statements.
Needham Funds
Statements of Operations
For the year ended December 31, 2016
| | | | | | Needham | | | Needham | |
| | | Needham | | | Aggressive | | | Small Cap | |
| | | Growth Fund | | | Growth Fund | | | Growth Fund | |
| Investment Income | | | | | | | | | |
| Dividends (net of foreign | | | | | | | | | |
| withholding tax of $0, $0, $165) | | $ | 957,190 | | | $ | 358,569 | | | $ | 54,422 | |
| Interest | | | 6,192 | | | | 1,000 | | | | 13,646 | |
| Total Investment Income | | | 963,382 | | | | 359,569 | | | | 68,068 | |
| | | | | | | | | | | | | |
| Expenses | | | | | | | | | | | | |
| Investment Advisory Fees | | | 1,487,011 | | | | 627,890 | | | | 323,051 | |
| Distribution Fees | | | 297,402 | | | | 125,578 | | | | 64,610 | |
| Administration and Accounting Fees | | | 145,633 | | | | 65,616 | | | | 35,833 | |
| Audit Fees | | | 43,412 | | | | 33,537 | | | | 26,976 | |
| Chief Compliance Officer Fees | | | 22,977 | | | | 9,625 | | | | 4,898 | |
| Custodian Fees | | | 8,630 | | | | 7,286 | | | | 7,317 | |
| Directors’ Fees | | | 22,460 | | | | 8,282 | | | | 4,536 | |
Dividend Expense(1) | | | 73,386 | | | | 75,363 | | | | 13,224 | |
| Filing Fees | | | 21,894 | | | | 21,335 | | | | 20,642 | |
Interest Expense(1) | | | 315,407 | | | | 304,920 | | | | 23,128 | |
| Legal Fees | | | 65,224 | | | | 27,162 | | | | 13,736 | |
| Printing Fees | | | 17,542 | | | | 9,956 | | | | 8,352 | |
| Transfer Agent Fees | | | 58,091 | | | | 41,779 | | | | 37,513 | |
| Other Expenses | | | 25,654 | | | | 18,239 | | | | 16,820 | |
| Total Expenses | | | 2,604,723 | | | | 1,376,568 | | | | 600,636 | |
| Fees Waived by Investment Adviser | | | (24,703 | ) | | | (15,924 | ) | | | (59,909 | ) |
| Net Expenses | | | 2,580,020 | | | | 1,360,644 | | | | 540,727 | |
| Net Investment Loss | | | (1,616,638 | ) | | | (1,001,075 | ) | | | (472,659 | ) |
| | | | | | | | | | | | | |
| Net Realized/Unrealized Gain (Loss) from | | | | | | | | | | | | |
| Investments and Securities Sold Short | | | | | | | | | | | | |
| Net Realized Gain from Investments | | $ | 9,346,263 | | | $ | 4,802,727 | | | $ | 3,099,317 | |
| Net Realized Loss from Securities Sold Short | | | (556,829 | ) | | | (143,112 | ) | | | (253,126 | ) |
| Change in Unrealized Appreciation on | | | | | | | | | | | | |
| Investments and Securities Sold Short | | | 4,521,650 | | | | 6,648,259 | | | | 4,604,040 | |
| Net Realized/Unrealized Gain from Investments | | | | | | | | | | | | |
| and Securities Sold Short | | | 13,311,084 | | | | 11,307,874 | | | | 7,450,231 | |
| Change in Net Assets Resulting from Operations | | $ | 11,694,446 | | | $ | 10,306,799 | | | $ | 6,977,572 | |
(1) | Expense related to securities sold short. |
See accompanying notes to financial statements.
Annual Report 2016
Needham Growth Fund
Statements of Changes in Net Assets
| | | Year Ended | | | Year Ended | |
| | | December 31, 2016 | | | December 31, 2015 | |
| Change in Net Assets | | | | | | �� |
| Operations: | | | | | | |
| Net Investment Loss | | $ | (1,616,638 | ) | | $ | (2,097,678 | ) |
| Net Realized Gain from Investments and Securities Sold Short | | | 8,789,434 | | | | 8,475,547 | |
| Net Change in Unrealized Appreciation (Depreciation) | | | | | | | | |
| on Investments and Securities Sold Short | | | 4,521,650 | | | | (13,415,509 | ) |
| Change in Net Assets Resulting from Operations | | | 11,694,446 | | | | (7,037,640 | ) |
| | | | | | | | | |
| Distributions to Shareholders from: | | | | | | | | |
| Net Investment Income | | | — | | | | — | |
| Capital Gains | | | (4,983,292 | ) | | | (8,209,695 | ) |
| Total Distributions to Shareholders | | | (4,983,292 | ) | | | (8,209,695 | ) |
| | | | | | | | | |
| Capital Transactions: | | | | | | | | |
| Retail Class: | | | | | | | | |
| Shares Issued | | | 3,874,739 | | | | 5,600,757 | |
| Shares Issued in Reinvestment of Distribution | | | 4,388,025 | | | | 7,775,634 | |
| Shares Redeemed | | | (22,212,309 | ) | | | (18,794,360 | ) |
| Redemption Fees | | | 611 | | | | 3,397 | |
Institutional Class:(1) | | | | | | | | |
| Shares Issued | | | 117,442 | | | | — | |
| Shares Issued in Reinvestment of Distribution | | | — | | | | — | |
| Shares Redeemed | | | — | | | | — | |
| Redemption Fees | | | — | | | | — | |
| Total Change in Net Assets from Capital Transactions | | | (13,831,492 | ) | | | (5,414,572 | ) |
| | | | | | | | | |
| Change in Net Assets | | | (7,120,338 | ) | | | (20,661,907 | ) |
| | | | | | | | | |
| Total Net Assets | | | | | | | | |
| Beginning of Year | | | 127,154,362 | | | | 147,816,269 | |
| End of Year | | $ | 120,034,024 | | | $ | 127,154,362 | |
| Accumulated Net Investment Income (Loss) | | $ | (18,197 | ) | | $ | 7,623 | |
| | | | | | | | | |
| Share Transaction: | | | | | | | | |
| Retail Class: | | | | | | | | |
| Number of Shares Issued | | | 94,336 | | | | 125,623 | |
| Number of Shares Reinvested | | | 104,402 | | | | 186,109 | |
| Number of Shares Redeemed | | | (540,109 | ) | | | (420,680 | ) |
Institutional Class:(1) | | | | | | | | |
| Number of Shares Issued | | | 2,706 | | | | — | |
| Number of Shares Reinvested | | | — | | | | — | |
| Number of Shares Redeemed | | | — | | | | — | |
| Total Change in Shares | | | (338,665 | ) | | | (108,948 | ) |
(1) | The class commenced operations on December 30, 2016. |
See accompanying notes to financial statements.
Needham Funds
Needham Aggressive Growth Fund
Statements of Changes in Net Assets
| | | Year Ended | | | Year Ended | |
| | | December 31, 2016 | | | December 31, 2015 | |
| Change in Net Assets | | | | | | |
| Operations: | | | | | | |
| Net Investment Loss | | $ | (1,001,075 | ) | | $ | (1,016,187 | ) |
| Net Realized Gain from Investments and Securities Sold Short | | | 4,659,615 | | | | 5,622,283 | |
| Net Change in Unrealized Appreciation (Depreciation) | | | | | | | | |
| on Investments and Securities Sold Short | | | 6,648,259 | | | | (8,806,498 | ) |
| Change in Net Assets Resulting from Operations | | | 10,306,799 | | | | (4,200,402 | ) |
| | | | | | | | | |
| Distributions to Shareholders from: | | | | | | | | |
| Net Investment Income | | | — | | | | — | |
| Capital Gains | | | (3,518,408 | ) | | | (5,612,688 | ) |
| Total Distributions to Shareholders | | | (3,518,408 | ) | | | (5,612,688 | ) |
| | | | | | | | | |
| Capital Transactions: | | | | | | | | |
| Retail Class: | | | | | | | | |
| Shares Issued | | | 5,941,597 | | | | 4,292,138 | |
| Shares Issued in Reinvestment of Distribution | | | 3,460,163 | | | | 5,457,811 | |
| Shares Redeemed | | | (8,401,668 | ) | | | (11,385,924 | ) |
| Redemption Fees | | | 1,432 | | | | 1,539 | |
Institutional Class:(1) | | | | | | | | |
| Shares Issued | | | 162,046 | | | | — | |
| Shares Issued in Reinvestment of Distribution | | | — | | | | — | |
| Shares Redeemed | | | — | | | | — | |
| Redemption Fees | | | — | | | | — | |
| Total Change in Net Assets from Capital Transactions | | | 1,163,570 | | | | (1,634,436 | ) |
| | | | | | | | | |
| Change in Net Assets | | | 7,951,961 | | | | (11,447,526 | ) |
| | | | | | | | | |
| Total Net Assets | | | | | | | | |
| Beginning of Year | | | 50,905,643 | | | | 62,353,169 | |
| End of Year | | $ | 58,857,604 | | | $ | 50,905,643 | |
| Accumulated Net Investment Income (Loss) | | $ | — | | | $ | — | |
| | | | | | | | | |
| Share Transaction: | | | | | | | | |
Retail Class: | | | | | | | | |
| Number of Shares Issued | | | 280,053 | | | | 185,078 | |
| Number of Shares Reinvested | | | 166,674 | | | | 279,744 | |
| Number of Shares Redeemed | | | (415,853 | ) | | | (509,153 | ) |
Institutional Class:(1) | | | | | | | | |
| Number of Shares Issued | | | 7,270 | | | | — | |
| Number of Shares Reinvested | | | — | | | | — | |
| Number of Shares Redeemed | | | — | | | | — | |
| Total Change in Shares | | | 38,144 | | | | (44,331 | ) |
(1) | The class commenced operations on December 30, 2016. |
See accompanying notes to financial statements.
Annual Report 2016
Needham Small Cap Growth Fund
Statements of Changes in Net Assets
| | | Year Ended | | | Year Ended | |
| | | December 31, 2016 | | | December 31, 2015 | |
| Change in Net Assets | | | | | | |
| Operations: | | | | | | |
| Net Investment Loss | | $ | (472,659 | ) | | $ | (456,897 | ) |
| Net Realized Gain from Investments and Securities Sold Short | | | 2,846,191 | | | | 1,472,214 | |
| Net Change in Unrealized Appreciation (Depreciation) | | | | | | | | |
| on Investments and Securities Sold Short | | | 4,604,040 | | | | (3,436,493 | ) |
| Change in Net Assets Resulting from Operations | | | 6,977,572 | | | | (2,421,176 | ) |
| | | | | | | | | |
| Distributions to Shareholders from: | | | | | | | | |
| Net Investment Income | | | — | | | | — | |
| Capital Gains | | | (1,895,460 | ) | | | (606,909 | ) |
| Total Distributions to Shareholders | | | (1,895,460 | ) | | | (606,909 | ) |
| | | | | | | | | |
| Capital Transactions: | | | | | | | | |
| Retail Class: | | | | | | | | |
| Shares Issued | | | 13,166,893 | | | | 2,202,629 | |
| Shares Issued in Reinvestment of Distribution | | | 1,830,167 | | | | 566,101 | |
| Shares Redeemed | | | (8,043,615 | ) | | | (8,383,898 | ) |
| Redemption Fees | | | 8,797 | | | | 120 | |
Institutional Class:(1) | | | | | | | | |
| Shares Issued | | | 139,788 | | | | — | |
| Shares Issued in Reinvestment of Distribution | | | — | | | | — | |
| Shares Redeemed | | | — | | | | — | |
| Redemption Fees | | | — | | | | — | |
| Total Change in Net Assets from Capital Transactions | | | 7,102,030 | | | | (5,615,048 | ) |
| | | | | | | | | |
| Change in Net Assets | | | 12,184,142 | | | | (8,643,133 | ) |
| | | | | | | | | |
| Total Net Assets | | | | | | | | |
| Beginning of Year | | | 23,473,319 | | | | 32,116,452 | |
| End of Year | | $ | 35,657,461 | | | $ | 23,473,319 | |
| Accumulated Net Investment Income (Loss) | | $ | — | | | $ | — | |
| | | | | | | | | |
| Share Transaction: | | | | | | | | |
| Retail Class: | | | | | | | | |
| Number of Shares Issued | | | 897,839 | | | | 158,817 | |
| Number of Shares Reinvested | | | 127,272 | | | | 45,617 | |
| Number of Shares Redeemed | | | (582,239 | ) | | | (610,896 | ) |
Institutional Class:(1) | | | | | | | | |
| Number of Shares Issued | | | 9,166 | | | | — | |
| Number of Shares Reinvested | | | — | | | | — | |
| Number of Shares Redeemed | | | — | | | | — | |
| Total Change in Shares | | | 452,038 | | | | (406,462 | ) |
(1) | The class commenced operations on December 30, 2016. |
See accompanying notes to financial statements.
Needham Funds
Needham Growth Fund
Financial Highlights
| | | Retail Class | |
| (For a Share Outstanding | | Year Ended December 31, | |
| Throughout each Period) | | 2016 | | | 2015 | | | 2014 | | | 2013 | | | 2012 | |
| Net Asset Value, Beginning of Year | | $ | 40.96 | | | $ | 46.00 | | | $ | 45.06 | | | $ | 33.66 | | | $ | 32.78 | |
| Investment Operations | | | | | | | | | | | | | | | | | | | | |
| Net Investment Income (Loss) | | | (0.59 | ) | | | (0.68 | ) | | | (0.58 | ) | | | (0.54 | ) | | | (0.24 | ) |
| Net Realized and Unrealized | | | | | | | | | | | | | | | | | | | | |
| Gain (Loss) on Investments | | | 4.86 | | | | (1.60 | ) | | | 4.59 | | | | 12.20 | | | | 4.31 | |
| Total from Investment Operations | | | 4.27 | | | | (2.28 | ) | | | 4.01 | | | | 11.66 | | | | 4.07 | |
| | | | | | | | | | | | | | | | | | | | | |
| Less Distributions | | | | | | | | | | | | | | | | | | | | |
| Net Realized Gains | | | (1.83 | ) | | | (2.76 | ) | | | (3.07 | ) | | | (0.26 | ) | | | (3.19 | ) |
| Total Distributions | | | (1.83 | ) | | | (2.76 | ) | | | (3.07 | ) | | | (0.26 | ) | | | (3.19 | ) |
| | | | | | | | | | | | | | | | | | | | | |
| Capital Contributions | | | | | | | | | | | | | | | | | | | | |
| Redemption Fees | | | — | (a) | | | — | (a) | | | — | (a) | | | — | (a) | | | — | (a) |
| Total Capital Contributions | | | — | (a) | | | — | (a) | | | — | (a) | | | — | (a) | | | — | (a) |
| Net Asset Value, End of Year | | $ | 43.40 | | | $ | 40.96 | | | $ | 46.00 | | | $ | 45.06 | | | $ | 33.66 | |
| | | | | | | | | | | | | | | | | | | | | |
| Total Return | | | 10.57 | % | | | (5.07 | )% | | | 8.98 | % | | | 34.68 | % | | | 12.80 | % |
| Net Assets, End of Year (000’s) | | $ | 119,917 | | | $ | 127,154 | | | $ | 147,816 | | | $ | 141,693 | | | $ | 113,561 | |
| Ratios/Supplemental Data | | | | | | | | | | | | | | | | | | | | |
| Ratio of Net Expenses to | | | | | | | | | | | | | | | | | | | | |
| Average Net Assets | | | 2.17 | % | | | 2.05 | % | | | 1.84 | % | | | 1.89 | % | | | 1.94 | % |
| Ratio of Net Expenses to Average | | | | | | | | | | | | | | | | | | | | |
| Net Assets (before interest | | | | | | | | | | | | | | | | | | | | |
| and dividend expense) | | | 1.84 | % | | | 1.82 | % | | | 1.80 | % | | | 1.82 | % | | | 1.82 | % |
| Ratio of Total Expenses to Average | | | | | | | | | | | | | | | | | | | | |
| Net Assets (before waiver and | | | | | | | | | | | | | | | | | | | | |
| reimbursement of expenses) | | | 2.17 | % | | | 2.05 | % | | | 1.84 | % | | | 1.89 | % | | | 1.94 | % |
| Ratio of Net Investment Income | | | | | | | | | | | | | | | | | | | | |
| (Loss) to Average Net Assets | | | (1.36 | )% | | | (1.48 | )% | | | (1.32 | )% | | | (1.30 | )% | | | (0.65 | )% |
| Ratio of Net Investment | | | | | | | | | | | | | | | | | | | | |
| Income (Loss) to Average | | | | | | | | | | | | | | | | | | | | |
| Net Assets (before waivers and | | | | | | | | | | | | | | | | | | | | |
| reimbursements of expenses) | | | (1.36 | )% | | | (1.48 | )% | | | (1.32 | )% | | | (1.30 | )% | | | (0.65 | )% |
| Portfolio turnover rate | | | 12 | % | | | 13 | % | | | 12 | % | | | 12 | % | | | 17 | % |
(a) | Value is less than $0.005 per share. |
See accompanying notes to financial statements.
Annual Report 2016
Needham Growth Fund
Financial Highlights
| | | Institutional Class | |
| | | Period from | |
| | | December 30, 2016 | |
| | | through | |
| (For a Share Outstanding Throughout each Period) | | December 31, 2016(1) | |
| Net Asset Value, Beginning of Period | | $ | 43.40 | |
| Investment Operations | | | | |
| Net Investment Income (Loss) | | | — | |
| Net Realized and Unrealized Gain (Loss) on Investments | | | — | |
| Total from Investment Operations | | | — | |
| | | | | |
| Less Distributions | | | | |
| Net Realized Gains | | | — | |
| Total Distributions | | | — | |
| | | | | |
| Capital Contributions | | | | |
| Redemption Fees | | | — | |
| Total Capital Contributions | | | — | |
| Net Asset Value, End of Period | | $ | 43.40 | |
| | | | | |
| Total Return | | | 0.00 | % |
| Net Assets, End of Period (000’s) | | $ | 117 | |
| Ratios/Supplemental Data | | | | |
| Ratio of Net Expenses to Average Net Assets | | | 1.40 | % |
| Ratio of Net Expenses to Average Net Assets | | | | |
| (before interest and dividend expense) | | | 1.40 | % |
| Ratio of Total Expenses to Average Net Assets | | | | |
| (before waiver and reimbursement of expenses) | | | — | %* |
| Ratio of Net Investment Income (Loss) to Average Net Assets | | | — | %* |
| Ratio of Net Investment Income (Loss) to Average Net Assets | | | | |
| (before waivers and reimbursements of expenses) | | | — | %* |
| Portfolio turnover rate | | | 0 | % |
(1) | The Class commenced operations on December 30, 2016. |
| * | Refer to footnote 2 for further description of non-recurring charges related to the issuance of the share class. |
See accompanying notes to financial statements.
Needham Funds
Needham Aggressive Growth Fund
Financial Highlights
| | | Retail Class | |
| (For a Share Outstanding | | Year Ended December 31, | |
| Throughout each Period) | | 2016 | | | 2015 | | | 2014 | | | 2013 | | | 2012 | |
| Net Asset Value, Beginning of Year | | $ | 19.56 | | | $ | 23.55 | | | $ | 22.66 | | | $ | 16.63 | | | $ | 14.52 | |
| Investment Operations | | | | | | | | | | | | | | | | | | | | |
| Net Investment Loss | | | (0.38 | ) | | | (0.39 | ) | | | (0.38 | ) | | | (0.37 | ) | | | (0.29 | ) |
| Net Realized and Unrealized | | | | | | | | | | | | | | | | | | | | |
| Gain (Loss) on Investments | | | 4.61 | | | | (1.28 | ) | | | 1.98 | | | | 6.40 | | | | 2.41 | |
| Total from Investment Operations | | | 4.23 | | | | (1.67 | ) | | | 1.60 | | | | 6.03 | | | | 2.12 | |
| | | | | | | | | | | | | | | | | | | | | |
| Less Distributions | | | | | | | | | | | | | | | | | | | | |
| Net Realized Gains | | | (1.50 | ) | | | (2.32 | ) | | | (0.71 | ) | | | — | | | | (0.01 | ) |
| Total Distributions | | | (1.50 | ) | | | (2.32 | ) | | | (0.71 | ) | | | — | | | | (0.01 | ) |
| | | | | | | | | | | | | | | | | | | | | |
| Capital Contributions | | | | | | | | | | | | | | | | | | | | |
| Redemption Fees | | | — | (a) | | | — | (a) | | | — | (a) | | | — | (a) | | | — | (a) |
| Total Capital Contributions | | | — | (a) | | | — | (a) | | | — | (a) | | | — | (a) | | | — | (a) |
| Net Asset Value, End of Year | | $ | 22.29 | | | $ | 19.56 | | | $ | 23.55 | | | $ | 22.66 | | | $ | 16.63 | |
| | | | | | | | | | | | | | | | | | | | | |
| Total Return | | | 22.18 | % | | | (7.05 | )% | | | 7.13 | % | | | 36.26 | % | | | 14.61 | % |
| Net Assets, End of Year (000’s) | | $ | 58,696 | | | $ | 50,906 | | | $ | 62,353 | | | $ | 68,470 | | | $ | 66,746 | |
| Ratios/Supplemental Data | | | | | | | | | | | | | | | | | | | | |
| Ratio of Net Expenses to | | | | | | | | | | | | | | | | | | | | |
| Average Net Assets | | | 2.71 | % | | | 2.41 | % | | | 2.09 | % | | | 2.07 | % | | | 2.06 | % |
| Ratio of Net Expenses to Average | | | | | | | | | | | | | | | | | | | | |
| Net Assets (before interest | | | | | | | | | | | | | | | | | | | | |
| and dividend expense) | | | 1.95 | % | | | 1.93 | % | | | 1.91 | % | | | 1.91 | % | | | 1.89 | % |
| Ratio of Total Expenses to Average | | | | | | | | | | | | | | | | | | | | |
| Net Assets (before waiver and | | | | | | | | | | | | | | | | | | | | |
| reimbursement of expenses) | | | 2.72 | % | | | 2.42 | % | | | 2.09 | % | | | 2.07 | % | | | 2.06 | % |
| Ratio of Net Investment Income | | | | | | | | | | | | | | | | | | | | |
| (Loss) to Average Net Assets | | | (1.99 | )% | | | (1.73 | )% | | | (1.60 | )% | | | (1.74 | )% | | | (1.40 | )% |
| Ratio of Net Investment | | | | | | | | | | | | | | | | | | | | |
| Income (Loss) to Average | | | | | | | | | | | | | | | | | | | | |
| Net Assets (before waivers and | | | | | | | | | | | | | | | | | | | | |
| reimbursements of expenses) | | | (2.00 | )% | | | (1.74 | )% | | | (1.60 | )% | | | (1.74 | )% | | | (1.40 | )% |
| Portfolio turnover rate | | | 14 | % | | | 15 | % | | | 19 | % | | | 20 | % | | | 15 | % |
(a) | Value is less than $0.005 per share. |
See accompanying notes to financial statements.
Annual Report 2016
Needham Aggressive Growth Fund
Financial Highlights
| | Institutional Class | |
| | Period from | |
| | December 30, 2016 | |
| | through | |
(For a Share Outstanding Throughout each Period) | | December 31, 2016(1) | |
Net Asset Value, Beginning of Period | | $ | 22.29 | |
Investment Operations | | | | |
Net Investment Income (Loss) | | | — | |
Net Realized and Unrealized Gain (Loss) on Investments | | | — | |
Total from Investment Operations | | | — | |
Less Distributions | | | | |
Net Realized Gains | | | — | |
Total Distributions | | | — | |
| | | | |
Capital Contributions | | | | |
Redemption Fees | | | — | |
| Total Capital Contributions | | | — | |
| Net Asset Value, End of Period | | $ | 22.29 | |
| | | | | |
| Total Return | | | 0.00 | % |
| Net Assets, End of Period (000’s) | | $ | 162 | |
Ratios/Supplemental Data | | | | |
| Ratio of Net Expenses to Average Net Assets | | | 1.40 | % |
| Ratio of Net Expenses to Average Net Assets | | | | |
| (before interest and dividend expense) | | | 1.40 | % |
| Ratio of Total Expenses to Average Net Assets | | | | |
| (before waiver and reimbursement of expenses) | | | — | %* |
Ratio of Net Investment Income (Loss) to Average Net Assets | | | — | %* |
| Ratio of Net Investment Income (Loss) to Average Net Assets | | | | |
| (before waivers and reimbursements of expenses) | | | — | %* |
| Portfolio turnover rate | | | 0 | % |
(1) | The Class commenced operations on December 30, 2016. |
* | Refer to footnote 2 for further description of non-recurring charges related to the issuance of the share class. |
See accompanying notes to financial statements.
Needham Funds
Needham Small Cap Growth Fund
Financial Highlights
| | | Retail Class | |
| (For a Share Outstanding | | Year Ended December 31, | |
| Throughout each Period) | | 2016 | | | 2015 | | | 2014 | | | 2013 | | | 2012 | |
| Net Asset Value, Beginning of Year | | $ | 12.44 | | | $ | 14.01 | | | $ | 15.63 | | | $ | 12.22 | | | $ | 11.26 | |
| Investment Operations | | | | | | | | | | | | | | | | | | | | |
| Net Investment Loss | | | (0.20 | ) | | | (0.24 | ) | | | (0.24 | ) | | | (0.31 | ) | | | (0.15 | ) |
| Net Realized and Unrealized | | | | | | | | | | | | | | | | | | | | |
| Gain (Loss) on Investments | | | 4.03 | | | | (1.02 | ) | | | 0.32 | | | | 3.72 | | | | 1.11 | |
| Total from Investment Operations | | | 3.83 | | | | (1.26 | ) | | | 0.08 | | | | 3.41 | | | | 0.96 | |
| | | | | | | | | | | | | | | | | | | | | |
| Less Distributions | | | | | | | | | | | | | | | | | | | | |
| Net Realized Gains | | | (1.02 | ) | | | (0.31 | ) | | | (1.70 | ) | | | — | | | | — | |
| Total Distributions | | | (1.02 | ) | | | (0.31 | ) | | | (1.70 | ) | | | — | | | | — | |
| | | | | | | | | | | | | | | | | | | | | |
| Capital Contributions | | | | | | | | | | | | | | | | | | | | |
| Redemption Fees | | | — | (a) | | | — | (a) | | | — | (a) | | | — | (a) | | | — | (a) |
| Total Capital Contributions | | | — | (a) | | | — | (a) | | | — | (a) | | | — | (a) | | | — | (a) |
| Net Asset Value, End of Year | | $ | 15.25 | | | $ | 12.44 | | | $ | 14.01 | | | $ | 15.63 | | | $ | 12.22 | |
| | | | | | | | | | | | | | | | | | | | | |
| Total Return | | | 31.26 | % | | | (8.96 | )% | | | 0.80 | % | | | 27.91 | % | | | 8.53 | % |
| Net Assets, End of Year (000’s) | | $ | 35,518 | | | $ | 23,473 | | | $ | 32,116 | | | $ | 43,950 | | | $ | 60,614 | |
| Ratios/Supplemental Data | | | | | | | | | | | | | | | | | | | | |
| Ratio of Net Expenses to | | | | | | | | | | | | | | | | | | | | |
| Average Net Assets | | | 2.09 | % | | | 2.05 | % | | | 2.01 | % | | | 2.06 | % | | | 2.04 | % |
| Ratio of Net Expenses to Average | | | | | | | | | | | | | | | | | | | | |
| Net Assets (before interest | | | | | | | | | | | | | | | | | | | | |
| and dividend expense) | | | 1.95 | % | | | 1.95 | % | | | 1.95 | % | | | 1.96 | % | | | 1.92 | % |
| Ratio of Total Expenses to Average | | | | | | | | | | | | | | | | | | | | |
| Net Assets (before waiver and | | | | | | | | | | | | | | | | | | | | |
| reimbursement of expenses) | | | 2.30 | % | | | 2.25 | % | | | 2.11 | % | | | 2.09 | % | | | 2.04 | % |
| Ratio of Net Investment Income | | | | | | | | | | | | | | | | | | | | |
| (Loss) to Average Net Assets | | | (1.83 | )% | | | (1.61 | )% | | | (1.49 | )% | | | (1.80 | )% | | | (1.02 | )% |
| Ratio of Net Investment | | | | | | | | | | | | | | | | | | | | |
| Income (Loss) to Average | | | | | | | | | | | | | | | | | | | | |
| Net Assets (before waivers and | | | | | | | | | | | | | | | | | | | | |
| reimbursements of expenses) | | | (2.04 | )% | | | (1.81 | )% | | | (1.59 | )% | | | (1.83 | )% | | | (1.02 | )% |
| Portfolio turnover rate | | | 99 | % | | | 64 | % | | | 69 | % | | | 58 | % | | | 72 | % |
(a) | Value is less than $0.005 per share. |
See accompanying notes to financial statements.
Annual Report 2016
Needham Small Cap Growth Fund
Financial Highlights
| | | Institutional Class | |
| | | Period from | |
| | | December 30, 2016 | |
| | | through | |
| (For a Share Outstanding Throughout each Period) | | December 31, 2016(1) | |
| Net Asset Value, Beginning of Period | | $ | 15.25 | |
| Investment Operations | | | | |
| Net Investment Income (Loss) | | | — | |
| Net Realized and Unrealized Gain (Loss) on Investments | | | — | |
| Total from Investment Operations | | | — | |
| | | | | |
| Less Distributions | | | | |
| Net Realized Gains | | | — | |
| Total Distributions | | | — | |
| | | | | |
| Capital Contributions | | | | |
| Redemption Fees | | | — | |
| Total Capital Contributions | | | — | |
| Net Asset Value, End of Period | | $ | 15.25 | |
| | | | | |
| Total Return | | | 0.00 | % |
| Net Assets, End of Period (000’s) | | $ | 140 | |
| Ratios/Supplemental Data | | | | |
| Ratio of Net Expenses to Average Net Assets | | | 1.40 | % |
| Ratio of Net Expenses to Average Net Assets | | | | |
| (before interest and dividend expense) | | | 1.40 | % |
| Ratio of Total Expenses to Average Net Assets | | | | |
| (before waiver and reimbursement of expenses) | | | — | %* |
| Ratio of Net Investment Income (Loss) to Average Net Assets | | | — | %* |
| Ratio of Net Investment Income (Loss) to Average Net Assets | | | | |
| (before waivers and reimbursements of expenses) | | | — | %* |
| Portfolio turnover rate | | | 0 | % |
(1) | The Class commenced operations on December 30, 2016. |
| * | Refer to footnote 2 for further description of non-recurring charges related to the issuance of the share class. |
See accompanying notes to financial statements.
Needham Funds
Notes to Financial Statements
1. Organization
Needham Growth Fund (“NGF”), Needham Aggressive Growth Fund (“NAGF”) and Needham Small Cap Growth Fund (“NSCGF”) (each, a “Portfolio” and collectively, the “Portfolios”), are portfolios of The Needham Funds, Inc. (the “Company”), which is registered under the Investment Company Act of 1940, as amended (the “1940 Act”), as a diversified, open-end management investment company. The Company was organized as a Maryland corporation on October 12, 1995. NGF, NAGF, and NSCGF currently offer two classes, the Retail Class and the Institutional Class. The Institutional Class commenced operations on December 30, 2016.
2. Class Specific Expenses
Class level expenses are allocated daily to each class of shares based upon the ratio of net assets represented by each class as a percentage of the net assets of the Portfolio. Expenses deemed directly attributable to a class of shares are recorded by the specific class. Most Portfolio expenses are allocated by class based on relative net assets. Distribution Fees incurred in connection with the Company’s Amended and Restated Plan of Distribution Pursuant to Rule 12b-1 are expensed at 0.25% of average daily net assets of the Retail class shares, and the specific amounts are detailed in Note 5.
Certain of the Ratios and Supplemental Data presented in the Financial Highlights of the Institutional Class as of December 31, 2016 include non-recurring charges related to the issuance of the class and are not meaningful. Total such non-recurring charges included in the Statements of Operations for the year ended December 31, 2016 (before application of the Expense Limitation Agreement) as a percentage of Institutional Class Net Assets as of December 31, 2016 for NGF, NAGF and NSCGF were 21.03%, 6.39% and 3.77%, respectively. The Expense Limitation Agreement is more fully described in Note 4.
3. Significant Accounting Policies
The following is a summary of significant accounting policies followed by the Company in the preparation of its financial statements. These policies are in conformity with accounting principles generally accepted in the United States of America (“GAAP”).
Security Valuation: Portfolio securities for which market quotations are readily available are stated at the last sale price reported by the principal exchange for the security as of the exchange’s close of business. Securities for which no sale has taken place during the day and securities which are not listed on an exchange are valued at the mean of the highest closing bid and lowest asked prices. Exchange traded options are valued at the last reported sale price on any exchange on which the option is principally traded. If no sales are reported on a particular day, the options will be valued at the mean between the highest closing bid and lowest asked prices across the exchanges where the option is traded. Non-exchange traded options will also be valued at the mean between the last bid and asked quotations. For options where market quotations are not readily available, value will be determined in accordance with the fair value procedures described below. All other securities and assets for which (a) market quotations are not readily available, such as in
Annual Report 2016
Notes to Financial Statements (Continued)
the case of a market or technical disruption that prevents the normal trading of a security held by a Portfolio, (b) market quotations are believed to be unrepresentative of fair market value, such as in the case of a thinly traded security, or (c) valuation is normally made at the last sale price on a foreign exchange and a significant event occurs after the close of that exchange but before the New York Stock Exchange closes, are valued at their fair value as determined in good faith by the Board of Directors (the “Board”) in accordance with Fair Value Procedures established by the Board. The Company’s Fair Value Procedures are implemented and monitored by a Fair Value Committee (the “Committee”) designated by the Board. When a security is valued in accordance with the Fair Value Procedures, the Committee determines a value after taking into consideration any relevant information that is reasonably available to the Committee. Some of the more common reasons that may necessitate that a security be valued pursuant to these Fair Value Procedures include, but are not limited to: the security’s trading has been halted or suspended; the security has been de-listed from a national exchange; the security’s primary trading market is temporarily closed at a time when under normal conditions it would be open; or the security’s primary pricing source is not able or willing to provide a price. The assets of each Portfolio may also be valued on the basis of valuations provided by a pricing service approved by, or on behalf of, the Board.
Portfolio securities listed or traded on securities exchanges, including American Depositary Receipts (“ADRs”), are valued at the closing price on the exchange or system where the security is principally traded or at the NASDAQ Official Closing Price. If there have been no sales for that day on the exchange or system, a security is valued at the mean of the highest closing bid and lowest asked prices on the exchange or system where the security is principally traded.
The Portfolios did not value any securities in accordance with the Fair Value Procedures as of December 31, 2016.
Investment Transactions: Changes in holdings of portfolio securities for the Portfolios shall be reflected no later than in the first calculation on the first business day following the trade date for purposes of calculating each Portfolio’s daily net asset value per share. However, for financial reporting purposes, portfolio security transactions are reported on the trade date of the last business day of the reporting period. The cost (proceeds) of investments sold (bought to cover) is determined on a specific identification basis for the purpose of determining gains or losses on sales and buys to cover short positions. Dividend income, distributions to shareholders and dividend expense from securities sold short are recorded on the ex-dividend date. Interest income and interest expense from securities sold short is recorded on an accrual basis.
Foreign Currency: Foreign currency amounts are translated into U.S. dollars as follows: (i) assets and liabilities at the rate of exchange at the end of the respective period; and (ii) purchases and sales of securities and income and expenses at the rate of exchange
Needham Funds
Notes to Financial Statements (Continued)
prevailing on the dates of such transactions. The portion of realized gains arising from changes in the exchange rates are included with the net realized and unrealized gain or loss on investments. Principal risks associated with such transactions include the movement in value of the foreign currency relative to the U.S. dollar and the ability of the counterparty to perform.
The Portfolios may also invest in forward currency contracts. Fluctuations in the value of such forward currency transactions are recorded daily as unrealized gain or loss; realized gain or loss includes net gain or loss on transactions that have terminated by settlement. These instruments involve securities and currency market risk, credit risk, or both kinds of risks, in excess of the amount recognized in the statements of assets and liabilities. Risks also arise from the possible inability of counterparties to meet the terms of their contracts. The Portfolios did not enter into forward currency contracts during the year ended December 31, 2016.
Allocation of Expenses: Expenses directly attributable to a Portfolio are charged directly to that Portfolio, while expenses which are attributable to more than one Portfolio are allocated among the respective Portfolios based upon relative net assets or some other reasonable method.
Use of Estimates: The preparation of financial statements in accordance with GAAP requires management to make estimates and assumptions that affect the reported amounts and disclosures in the financial statements. Actual results could differ from those estimates and those differences could be material.
Distributions to Shareholders: Dividends from net investment income, if any, are declared and paid annually for the Portfolios. Distributable net realized gains, if any, are declared and distributed at least annually.
Redemption Fees: The Portfolios reserve the right to assess a redemption fee for shares held 60 days or less. The shareholder will be charged a fee equal to 2.00% of the value of the shares redeemed. The redemption fee is intended to offset excess brokerage commissions and other costs associated with fluctuations in asset levels and cash flows caused by frequent trading by shareholders. The applicability of the redemption fee will be calculated using a first-in first-out method, which means the oldest shares, will be redeemed first, followed by the redemption of more recently acquired shares. For the year ended December 31, 2016, NGF, NAGF and NSCGF had contributions to capital due to redemption fees in the amounts of $611, $1,432 and $8,797, respectively.
Federal Income Taxes: It is the policy of each Portfolio to continue to qualify as a regulated investment company, as defined in the Internal Revenue Code, by complying with the provisions available to certain investment companies and to make distributions of net investment income and net realized capital gains sufficient to relieve it from all, or substantially all, federal income taxes. Accordingly, no provision for income taxes has been made in the Portfolios’ financial statements.
Annual Report 2016
Notes to Financial Statements (Continued)
As of December 31, 2016, the Portfolios did not have any tax positions that did not meet the “more-likely-than-not” threshold of being sustained by the applicable tax authority. Open tax years are those that are open for exam by Federal and state taxing authorities. As of December 31, 2016, open Federal tax years include the tax years ended December 31, 2013 through December 31, 2016. Open New York tax years include the tax years ended December 31, 2013 through December 31, 2016. The Portfolios have no tax examinations in progress.
Fair Value Measurements: Valuation inputs used to determine the value of the Portfolios’ investments are summarized in the three broad levels listed below:
| | Level 1 — | quoted prices in active markets for identical assets. |
| | | |
| | Level 2 — | other significant inputs (including quoted prices of similar securities, interest rates, prepayment speeds, credit risk, etc.). |
| | | |
| | Level 3 — | significant unobservable inputs (which may include the Portfolios’ own assumptions in determining the fair value of investments). |
The inputs or methodology used to value securities are not necessarily an indication of the risk associated with investing in those securities.
Portfolio securities listed or traded on securities exchanges, including ADRs, are valued at the closing price on the exchange or system where the security is principally traded or at the NASDAQ Official Closing Price. If there have been no sales for that day on the exchange or system, a security is valued at the mean of the highest closing bid and lowest asked prices on the exchange or system where the security is principally traded. These valuations are typically categorized as Level 1 in the fair value hierarchy.
In accordance with procedures adopted by the Board, fair value pricing may be used if events materially affecting the value of foreign securities occur between the times the exchange on which they are traded closes and the time the Portfolios’ net asset values are calculated. These valuations are categorized as Level 2 in the fair value hierarchy. As of December 31, 2016, the Portfolios did not hold any Level 2 or Level 3 securities.
The following is a summary categorization, as of December 31, 2016, of each Portfolio’s investments based on the level of inputs utilized in determining the value of such investments:
| | | LEVEL 1 – Quoted Prices(1)(3) | |
| | | NGF | | | NAGF | | | NSCGF | |
| Assets | | | | | | | | | |
Common Stocks(2) | | $ | 118,762,387 | | | $ | 56,242,229 | | | $ | 26,520,626 | |
| Closed-End Funds | | | — | | | | — | | | | 46,615 | |
| Short-Term Investments | | | 2,841,831 | | | | 2,564,997 | | | | 10,666,908 | |
| Liabilities | | | | | | | | | | | | |
Securities Sold Short(2) | | | (5,047,843 | ) | | | (4,039,537 | ) | | | (289,000 | ) |
| Total | | $ | 116,556,375 | | | $ | 54,767,689 | | | $ | 36,945,149 | |
(1) | As of December 31, 2016, the Portfolios did not hold Level 2 or Level 3 investments. |
(2) | Please refer to the Schedule of Investments and Schedule of Securities Sold Short to view segregation by industry. |
(3) | There were no transfers into or out of Levels 1, 2 or 3 during the period. |
Needham Funds
Notes to Financial Statements (Continued)
| 4. | Investment Advisory and Administrative Services |
| | |
| The Company has engaged Needham Investment Management L.L.C. (the “Adviser”) to manage its investments pursuant to an Investment Advisory Agreement. The Company pays the Adviser a fee at the annual rate of 1.25% of the average daily net assets of each Portfolio. |
| | |
| The Adviser has entered into agreements with the Company (the “Expense Limitation Agreements”) whereby the Adviser has contractually agreed to waive its management fee for, and to reimburse expenses of, NGF, NAGF and NSCGF in an amount that limits annual operating expenses to not more than 1.40% and 1.95% of the average daily net assets of the Fund’s Institutional Class and Retail Class, respectively (excluding taxes, interest, brokerage, dividends on short positions, acquired fund fees and expenses and extraordinary items, and excluding shareholder redemption fees but including the management fee stated in the Investment Advisory Agreement). The Expense Limitation Agreements are effective for the period from May 1, 2016 through April 30, 2017 with respect to the Retail Class and for the period from December 30, 2016 through December 31, 2017 with respect to the Institutional Class. The Expense Limitation Agreements shall continue in effect from year to year thereafter only upon mutual agreement of the Company and the Adviser. |
| | |
| Any reimbursements or fee waivers made by the Adviser in respect of a Portfolio are subject to recoupment by the Adviser, to the extent that the Portfolio is able to make the repayment within the expense limitation established in the Expense Limitation Agreements. Under the Expense Limitation Agreements, such recoupments must be made within three years following the fiscal year in which the Adviser reduced its compensation and/or assumed expenses for the applicable Portfolio. The Adviser did not recoup any fees previously waived or reimbursed under the Expense Limitation Agreements during the year ended December 31, 2016. The table below indicates the amount of fees that the Adviser has the potential to recoup from the Retail Class: |
| | | Recovery Expiring on | |
| | | 4/30/2020 | | | 4/30/2019 | | | 4/30/2018 | | | 4/30/2017 | |
| NGF | | $ | — | | | $ | — | | | $ | — | | | $ | — | |
| NAGF | | | — | | | | 11,174 | | | | — | | | | — | |
| NSCGF | | | 35,445 | | | | 60,837 | | | | 37,654 | | | | 24,827 | |
| The Company and U.S. Bancorp Fund Services, LLC (the “Administrator”) are parties to a Fund Administration Servicing Agreement. The Administrator provides administrative and fund accounting services pursuant to this agreement and, in consideration of these services, receives a fee computed daily and paid monthly at an annual rate based on a percentage of the value of each Portfolio’s assets. The Administrator is also compensated for any out of pocket expenses that are reasonably incurred in carrying out its duties under the Administration Agreement. The Administrator also provides transfer agent services pursuant to a Transfer Agent Servicing Agreement for additional fees. |
Annual Report 2016
Notes to Financial Statements (Continued)
| Certain officers of the Company are also officers of the Adviser and/or Needham & Company, LLC (the “Distributor”). Such officers receive no fees from the Company for serving as officers of the Company. Each of the two Directors who is not an “interested person” (as defined in the 1940 Act) of the Company (each, an “Independent Director”) receives a quarterly retainer of $3,000 and a per-meeting fee of $500. Each Independent Director is also a member of the Audit Committee of the Company’s Board of Directors and receives a fee of $500 per meeting attended. The Adviser provides an employee to serve as Chief Compliance Officer for the Company and to provide certain related services. An affiliate of the Adviser, Needham & Company, LLC, pays the Chief Compliance Officer’s compensation and the Company reimburses this affiliate for the Company’s allocated portion of the expense. |
| |
| 5. | Distribution Plan |
| |
| The Company has adopted an Amended and Restated Plan of Distribution pursuant to Rule 12b-1 under the 1940 Act. Under the Plan, each Portfolio may pay compensation to the Distributor or any other distributor or financialinstitution with which the Company has an agreement with respect to the Retail Class of each Portfolio, with the amount of such compensation not to exceed an annual rate of 0.25% of each Portfolio’s daily average net assets. For the year ended December 31, 2016, NGF, NAGF and NSCGF paid 12b-1 fees to the Distributor in the amount of $297,402, $125,578 and $64,610, respectively. |
| During the year ended December 31, 2016, NGF, NAGF and NSCGF incurred and paid brokerage commissions to the Distributor in the amount of $17,425, $13,484, and $21,472, respectively. |
| | |
| 6. | Temporary Borrowings |
| |
| Each Portfolio may borrow from banks up to 25% of its total assets and may pledge its assets in connection with these borrowings, provided that no additional investments shall be made while borrowings exceed 5% of total assets. |
| |
| The Portfolios did not engage in any temporary borrowings during the year ended December 31, 2016. |
| | |
| 7. | Short Sale Transactions |
| |
| During the year ended December 31, 2016, each Portfolio sold securities short. Upon selling a security short, the Portfolios record an asset for the settlement amount and a corresponding liability, which is marked-to-market to reflect current value. Certain securities owned by each respective Portfolio are segregated as collateral while the short sales are outstanding. At December 31, 2016, the market value of securities separately segregated to cover short positions was $4,106,475, $4,068,900, and $849,100 for NGF, NAGF and NSCGF, respectively. |
| |
| Additionally, the Portfolios had receivables for Deposit with Broker for Securities Sold Short of $5,184,891, $4,203,445, and $133,279 pledged as collateral with a broker in connection with open short positions for NGF, NAGF and NSCGF, respectively. Securities |
Needham Funds
Notes to Financial Statements (Continued)
| sold short at December 31, 2016 and their related market values and proceeds are set forth in the preceding Schedule of Securities Sold Short for each Portfolio. |
| | |
| 8. | Investment Transactions |
| |
| The following summarizes the aggregate amount of the cost of purchases and proceeds from sales of investment securities and securities sold short, excluding short-term securities, during the year ended December 31, 2016: |
| | | Purchases | | | Sales | |
| NGF | | $ | 14,571,525 | | | $ | 31,066,944 | |
| NAGF | | | 7,602,458 | | | | 14,862,868 | |
| NSCGF | | | 18,572,992 | | | | 18,851,056 | |
| There were no purchases or sales of U.S. government securities during the year ended December 31, 2016. |
| | |
| 9. | Financial Instruments With Off-Balance Sheet Risk |
| | |
| In the normal course of their business, the Portfolios may engage in transactions with off-balance sheet risk, including securities sold short, written options, futures, and forward currency contracts. Transactions in certain financial instruments represent future commitments to purchase or sell other financial instruments at specific terms at specified future dates. Each of these financial instruments contains varying degrees of off-balance sheet risk whereby changes in the market values of the securities underlying the financial instruments may be in excess of the amounts recognized in the financial statements. |
| | |
| Securities sold short represent obligations of the Portfolios to make future delivery of specific securities and, correspondingly, create an obligation to purchase the securities at market prices prevailing at a later delivery date (or to deliver the securities if already owned by the Portfolios). As a result, short sales create the risk that the Portfolios’ ultimate obligation to satisfy the delivery requirements may exceed the amount of the proceeds initially received on the liability recorded in the financial statements. |
| | |
| 10. | Indemnification |
| | |
| Under the Company’s organizational documents, its Directors and Officers are indemnified against certain liabilities arising out of the performance of their duties to the Company. In addition, in the ordinary course of business, the Company enters into contracts that contain a variety of indemnifications. The Company’s maximum exposure under these arrangements is unknown. However, the Company has not had prior claims or losses pursuant to these contracts and expects the risk of loss to be remote. |
| | |
| 11. | Federal Income Taxes |
| | |
| No provision for federal income taxes is required since the Company intends to continue to qualify as a regulated investment company under Subchapter M of the Internal Revenue Code and distribute substantially all of its taxable income and capital gains to shareholders. |
Annual Report 2016
Notes to Financial Statements (Continued)
Because income tax regulations differ from GAAP, the timing and character of income and capital gain distributions determined in accordance with tax regulations can differ from income and capital gains recognized for financial reporting purposes. Accordingly, the character of distributions and the composition of net assets for tax purposes can differ from those reflected in the financial statements. These book/tax differences may be temporary or permanent in nature. Temporary differences are generally due to differing book and tax treatment for the timing of the recognition of gains and losses on securities, including post-October losses (as described below). Permanent differences are generally due to differing treatment of net investment losses. To the extent these differences are permanent, they are charged or credited to paid-in capital, accumulated net realized gain (loss), or accumulated net investment income (loss), as appropriate, in the period in which the differences arise. These reclassifications have no effect on net assets or net asset value per share of each Portfolio.
As of December 31, 2016, the cost, gross unrealized appreciation, gross unrealized depreciation, and the net unrealized appreciation (depreciation) on securities, including proceeds from securities sold short for federal income tax purposes, were as follows:
| | | | | | | | | | | | Net | |
| | | | | | Gross | | | Gross | | | Unrealized | |
| | | | | | Unrealized | | | Unrealized | | | Appreciation | |
| | | Cost | | | Appreciation | | | Depreciation | | | (Depreciation) | |
| NGF | | $ | 55,845,916 | | | $ | 69,523,915 | | | $ | (3,765,613 | ) | | $ | 65,758,302 | |
| NAGF | | | 28,460,879 | | | | 33,053,974 | | | | (2,707,627 | ) | | | 30,346,347 | |
| NSCGF | | | 33,148,629 | | | | 5,199,641 | | | | (1,114,121 | ) | | | 4,085,520 | |
The difference between the tax cost of investments and the cost of investments for GAAP purposes is primarily due to the tax treatment for wash sale losses.
As of December 31, 2016, the components of distributable earnings (loss) on a tax basis were as follows:
| | | NGF | | | NAGF | | | NSCGF | |
| Undistributed ordinary income | | $ | 30,844 | | | $ | — | | | $ | 67,439 | |
| Undistributed long-term capital gains | | | 4,797,557 | | | | — | | | | 106,822 | |
| Unrealized appreciation (depreciation) | | | 65,758,302 | | | | 30,346,347 | | | | 4,085,520 | |
| Other accumulated gains (loss) | | | (1,255,568 | ) | | | (1,022,954 | ) | | | (442 | ) |
| Total accumulated earnings (loss) | | $ | 69,331,135 | | | $ | 29,323,393 | | | $ | 4,259,339 | |
The tax character of distributions paid during the year ended December 31, 2016 was as follows:
| | | NGF | | | NAGF | | | NSCGF | |
| Ordinary income | | $ | — | | | $ | — | | | $ | 548,261 | |
| Net long-term capital gains | | | 4,983,292 | | | | 3,518,408 | | | | 1,347,199 | |
| Return of capital | | | — | | | | — | | | | — | |
| Total distributions paid | | $ | 4,983,292 | | | $ | 3,518,408 | | | $ | 1,895,460 | |
Needham Funds
Notes to Financial Statements (Continued)
In 2016, a portion of such dividends was distributed in connection with NEEGX, NEAGX, and NESGX redemptions.
The tax character of distributions paid during the year ended December 31, 2015 was as follows:
| | | NGF | | | NAGF | | | NSCGF | |
| Ordinary income | | $ | — | | | $ | — | | | $ | — | |
| Net long-term capital gains | | | 8,209,695 | | | | 5,612,688 | | | | 606,909 | |
| Distribution in excess for | | | | | | | | | | | | |
| required excise distribution | | | — | | | | — | | | | — | |
| Total distributions paid | | $ | 8,209,695 | | | $ | 5,612,688 | | | $ | 606,909 | |
Under current tax law, capital and currency losses realized after October 31 of a Portfolio’s fiscal year may be deferred and treated as occurring on the first business day of the following fiscal year for tax purposes. The following Portfolios had deferred post-October capital and currency losses, which will be treated as arising on the first business day of the year ended of December 31, 2016.
As of December 31, 2016 none of the Portfolios had accumulated capital loss carryovers.
12. New Accounting Pronouncements
In October 2016, the U.S. Securities and Exchange Commission adopted new rules and amended existing rules (together, “final rules”) intended to modernize the reporting and disclosure of information by registered investment companies. In part, the final rules amend Regulation S-X and require standardized, enhanced disclosure about derivatives in investment company financial statements, as well as other amendments. The compliance date for the amendments to Regulation S-X is August 1, 2017. Management is currently evaluating the impact that the adoption of the amendments to Regulation S-X will have on the financial statements and related disclosures.
13. Subsequent Events
Management has evaluated subsequent events through the date of this filing. This evaluation did not result in any subsequent events that necessitated recognition or disclosures.
Annual Report 2016
Report of Independent Registered Public Accounting Firm
The Board of Directors and Shareholders
The Needham Funds, Inc.:
We have audited the accompanying statements of assets and liabilities of the Needham Growth Fund, Needham Aggressive Growth Fund and Needham Small Cap Growth Fund, each a “Portfolio” of The Needham Funds, Inc. (collectively, the “Portfolios”), including the schedules of investments and schedules of securities sold short, as of December 31, 2016, and the related statements of operations for the year then ended, the statements of changes in net assets for each of the years in the two year period then ended, and the financial highlights for each of the years in the five year period then ended. These financial statements and financial highlights are the responsibility of the Portfolios’ management. Our responsibility is to express an opinion on these financial statements and financial highlights based on our audits.
We conducted our audits in accordance with the standards of the Public Company Accounting Oversight Board (United States). Those standards require that we plan and perform the audit to obtain reasonable assurance about whether the financial statements and financial highlights are free of material misstatement. An audit includes examining, on a test basis, evidence supporting the amounts and disclosures in the financial statements. Our procedures included confirmation of securities owned as of December 31, 2016, by correspondence with the custodians and brokers or by other appropriate auditing procedures. An audit also includes assessing the accounting principles used and significant estimates made by management, as well as evaluating the overall financial statement presentation. We believe that our audits provide a reasonable basis for our opinion.
In our opinion, the financial statements and financial highlights referred to above present fairly, in all material respects, the financial position of Needham Growth Fund, Needham Aggressive Growth Fund and Needham Small Cap Growth Fund as of December 31, 2016, the results of their operations for the year then ended, the changes in their net assets for each of the years in the two year period then ended, and the financial highlights for each of the years in the five year period then ended, in conformity with U.S. generally accepted accounting principles.
New York, New York
March 1, 2017
Needham Funds
Information about Directors and Officers (Unaudited)
December 31, 2016
Information pertaining to the Directors and Officers of the Company is set forth below.
The Statement of Additional Information (SAI) includes additional information about the Directors and is available without charge, upon request, by calling 800-625-7071.
The address of each individual is 445 Park Avenue, New York, NY 10022-2606. Each Director serves until the next annual shareholders meeting or until his successor is elected and qualified.
| | | Term of Office | | Portfolios in the | | Principal Occupations(s) |
| Name, Year of Birth | | and Length of | | Fund Complex | | During Past 5 Years |
| and Position with | | Term Served by | | Overseen by | | and Other Directorships |
| the Company | | Director/Officer | | Director/Officer | | Held by Director/Officer |
| Independent Directors |
| John W. Larson, | | Indefinite; | | Three | | Currently retired. Partner at the law |
| Year of Birth: 1935 | | Since 2006 | | | | firm of Morgan, Lewis & Bockius LLP |
| Director | | | | | | from 2003 until retiring in December |
| | | | | | | 2009. Partner at the law firm of |
| | | | | | | Brobeck, Phleger & Harrison LLP from |
| | | | | | | 1969 until 2003. From July 1971 to |
| | | | | | | September 1973 worked in government |
| | | | | | | service as Assistant Secretary of the |
| | | | | | | United States Department of the Interior |
| | | | | | | and Counselor to George P. Schultz, |
| | | | | | | Chairman of the Cost of Living |
| | | | | | | Council. Director of Wage Works, Inc. |
| | | | | | | (an employee benefits company) |
| | | | | | | since 2000. Director of Sangamo |
| | | | | | | BioSciences, Inc. since 1996. |
| F. Randall Smith, | | Indefinite; | | Three | | Founder, Member of Investment |
| Year of Birth: 1938 | | Since 1996 | | | | Committee, Investment Analyst and |
| Director | | | | | | Portfolio Manager of Capital Counsel |
| | | | | | | LLC (a registered investment adviser) |
| | | | | | | since September 1999; President from |
| | | | | | | 1999 to 2014. Co-founder and Chief |
| | | | | | | Investment Officer of Train, Smith |
| | | | | | | Counsel (a registered investment |
| | | | | | | adviser) from 1975 to 1999. |
| Interested Director |
| George A. Needham*, | | Indefinite; | | Three | | Chairman of the Board and Chief |
| Year of Birth: 1943 | | Since 1996 | | | | Executive Officer of The Needham |
| Chairman, President | | | | | | Group, Inc. and Needham Holdings, |
| and Director | | | | | | LLC since December 2004. Chairman |
| | | | | | | of the Board and Chief Executive Officer |
| | | | | | | of Needham Asset Management, LLC |
| | | | | | | since April 2006. Chairman of the |
| | | | | | | Board from 1996 to December 2004 |
| | | | | | | and Chief Executive Officer from 1985 |
| | | | | | | to December 2004 of Needham & |
| | | | | | | Company, LLC. Managing Member of |
| | | | | | | Needham Capital Management, LLC |
| | | | | | | since 2000. |
| | | | | | | |
Annual Report 2016
Information about Directors and Officers (Unaudited) (Continued)
December 31, 2016
| | | Term of Office | | Portfolios in the | | Principal Occupations(s) |
| Name, Year of Birth | | and Length of | | Fund Complex | | During Past5 Years |
| and Position with | | Term Served by | | Overseen by | | and Other Directorships |
| the Company | | Director/Officer | | Director/Officer | | Held by Director/Officer |
| Officers |
| John Barr, | | One year; | | Two | | Portfolio Manager of Needham |
| Year of Birth 1956 | | Since 2010 | | | | Asset Management since 2010. |
| Executive Vice President | | | | | | Founding and Managing Member |
| and Co-Portfolio | | | | | | of Oliver Investment Management, |
| Manager of the Needham | | | | | | LLC from 2008 to 2009. Manager |
| Growth Fund, Executive | | | | | | and Analyst at Buckingham Capital |
| Vice President and | | | | | | from 2002 to 2008. Managing |
| Portfolio Manager of | | | | | | Director and a Senior Analyst at |
| the Needham Aggressive | | | | | | Robertson Stephens following |
| Growth Fund. | | | | | | semiconductor companies from |
| | | | | | | 2000 to 2002. From 1995 to 2000, |
| | | | | | | Managing Director and Senior Analyst |
| | | | | | | at Needham and Company, LLC, |
| | | | | | | also served as Director of Research. |
| | | | | | | Director of Coventor, Inc. since 2009. |
| Chris Retzler, | | One year; | | Two | | Portfolio Manager of Needham |
| Year of Birth: 1971 | | Since 2008 | | | | Asset Management, LLC since 2008. |
| Executive Vice President | | | | | | Vice President of Needham Asset |
| and Co-Portfolio | | | | | | Management, LLC since 2005. |
| Manager of the | | | | | | Head of Winterkorn, a healthcare |
| Needham Growth Fund, | | | | | | manufacturing and distribution |
| Executive Vice President | | | | | | company, from 2002 to 2005. |
| and Portfolio Manager | | | | | | |
| of the Needham | | | | | | |
| Small Cap Growth Fund. | | | | | | |
| James W. Giangrasso, | | One year; | | Three | | Chief Financial Officer of |
| Year of Birth: 1962 | | Since 2011 | | | | Needham Asset Management, LLC |
| Chief Financial Officer, | | | | | | since 2011. Principal and |
| Treasurer and Secretary | | | | | | Controller of Needham Asset |
| | | | | | | Management, LLC since 2006. |
| James M. Abbruzzese, | | One year; | | Three | | Chief Compliance Officer of |
| Year of Birth: 1969 | | Since 2004 | | | | Needham Asset Management, LLC |
| Chief Compliance Officer | | | | | | since April 2006. Chief Compliance |
| | | | | | | Officer and Managing Director of |
| | | | | | | Needham & Company, LLC from 2008 |
| | | | | | | through 2012. Chief Administrative |
| | | | | | | Officer of Needham & Company, LLC |
| | | | | | | since 2012. Chief Compliance Officer |
| | | | | | | of Needham Capital Management, LLC |
| | | | | | | since 2000. |
| * | An “interested person”, as defined in the 1940 Act, of the Company or the Company’s investment adviser. Mr. Needham is deemed to be an interested person because of his affiliation with the Portfolios’ Adviser and the Portfolios’ Distributor, and because he is an officer of the Company. |
Needham Funds
Supplementary Information (Unaudited)
December 31, 2016
Federal Income Tax Information
During the year ended December 31, 2016, NGF, NAGF and NSCGF declared and paid long-term realized gains distributions in the amounts of $4,983,292, $3,518,408 and $1,347,199 respectively.
For the year ended December 31, 2016, NGF, NAGF, and NSCGF did not declare any ordinary income distributions.
For the fiscal year ended December 31, 2016, certain dividends paid by the Portfolios may be subject to a maximum tax rate of 15%. The percentage of dividends declared from ordinary income reported as qualified dividend income was as follows:
| | | | | |
| NGF | | | 0.00 | % |
| NAGF | | | 0.00 | % |
| NSCGF | | | 9.19 | % |
For corporate shareholders, the percent of ordinary income distributions qualifying for the corporate dividends received deduction for the fiscal year ended December 31, 2016 was as follows:
| | | | | |
| NGF | | | 0.00 | % |
| NAGF | | | 0.00 | % |
| NSCGF | | | 8.06 | % |
The percentage of taxable ordinary income distributions that are designated as short-term capital gain distributions under Internal Revenue Section 871(k)(2)(C) for each Fund were as follows (unaudited):
| | | | | |
| NGF | | | 0.00 | % |
| NAGF | | | 0.00 | % |
| NSCGF | | | 100.00 | % |
Privacy Policy
It is the policy of the Company to keep personally identifiable financial information about you as an individual (“nonpublic personal information”) confidential, and use or disclose it only as necessary to provide services to you or the Company or as otherwise required or permitted by law. We may collect the following nonpublic personal information about you:
| | • | Information we receive from you on or in applications or other forms, correspondence, or conversations, including, but not limited to, your name, address, phone number, social security number, assets, income and date of birth; and |
| | • | Information about your transactions with us, our affiliates, or others, including, but not limited to, your account number and balance, payments history, parties to transactions, cost basis information, other financial information and information about how you vote your shares. |
Annual Report 2016
Supplementary Information (Unaudited) (Continued)
December 31, 2016
We disclose nonpublic personal information about current and former shareholders to companies that provide necessary services to the Company. These companies include the transfer agent, distributor, administrator and investment adviser as well as other affiliates of the Company. We maintain physical, electronic and procedural safeguards that comply with federal standards to guard your nonpublic personal information and restrict access to this information to those persons who need it to provide services to you or the Company or who are otherwise permitted by law to receive it. In the event that you hold any shares of our funds through a financial intermediary, including, but not limited to, a broker-dealer, bank, or trust company, the privacy policy of your financial intermediary governs how your nonpublic personal information is shared with nonaffiliated third parties.
If you have any questions concerning the Company’s Privacy Policy, please call 1-800-625-7071.
Disclosure of Portfolio Holdings
The Company files a Form N-Q with the Securities and Exchange Commission (the “SEC”) no more than sixty days after the Company’s first and third fiscal quarters. For the Company, this would be for the fiscal quarters ending March 31 and September 30. Form N-Q includes a complete schedule of the Company’s portfolio holdings as of the end of those fiscal quarters. The Company’s N-Q filings can be found free of charge on the SEC’s website at http://www.sec.gov, or they may be reviewed and copied at the SEC’s Public Reference Room in Washington, D.C. (call 800-SEC-0330 for information on the operation of the Public Reference Room). copied at the SEC’s Public Reference Room in Washington, D.C. (call 800-SEC-0330 for information on the operation of the Public Reference Room).
Voting Proxies on Company Portfolio Securities
A description of the policies and procedures that the Company uses to determine how to vote proxies relating to portfolio securities and information regarding how the Company voted proxies relating to portfolio securities during the most recent 12-month period ended June 30 are available without charge, upon request, by calling 800-625-7071 or on the SEC’s website at http://www.sec.gov.
Household Delivery of Shareholder Documents
To reduce expenses, the Company may mail only one copy of the Portfolios’ prospectuses, proxy statements, information statements, and each annual and semi-annual report to those addresses shared by two or more accounts. If you wish to receive individual copies of these documents, please call the Portfolios at 1-800-625-7071 or contact your financial institution. You will begin receiving individual copies thirty days after receiving your request.
Needham Funds
Supplementary Information (Unaudited) (Continued)
December 31, 2016
Board Consideration and Approval of Investment Advisory Agreement
On October 20, 2016, at a meeting called for the purpose of voting on such approval, the Board, including all of the Independent Directors, approved the continuance of the Investment Advisory Agreement (the “Advisory Agreement”) between the Company and the Adviser with respect to NGF, NAGF and NSCGF. In doing so, the Board reviewed materials provided by the Adviser to assist them in making a determination (the “Board Materials”). The Independent Directors were assisted in their review by independent legal counsel and met with counsel in executive session separate from representatives of the Adviser. In considering the renewal of the Advisory Agreement, the Board considered the nature, extent, and quality of the services to be provided by the Adviser; the investment performance of each Portfolio and the Adviser; the costs of the services to be provided and profits to be realized by the Adviser and its affiliates from the relationship with each Portfolio; the extent to which economies of scale would be realized as the Portfolios grow; and whether fee levels reflect these economies of scale for the benefit of investors.
The Directors stated that their consideration of the continuance of the Advisory Agreement included consideration of the peer group comparisons in the Board Materials, noting that NGF’s performance for various periods ended September 30, 2016 was above its peer group average and median performance for the year-to-date, 1-year, 3-year, 5-year and since inception periods and above the average and median performance of the relevant Morningstar Universes for the 1-year and since inception periods. For NAGF, the Directors noted that the Portfolio’s performance for various periods ended September 30, 2016 was above the peer group average and median performance for the year-to-date, 1-year, 3-year, 5-year and 10-year periods and above the average and median performance of the relevant Morningstar Universes for the year-to-date, 1-year, 5-year, 10-year and since inception periods. For NSCGF, the Directors noted that the Portfolio’s performance for various periods ended September 30, 2016 was above the peer group average and median performance for the year-to-date, 1-year, 3-year and 10-year periods and the average and median performance of the relevant Morningstar Universes for the year-to-date, 1-year and since inception periods. It was further noted that the Portfolios’ performance compared well to the longer term performance of their respective benchmark indices. In addition to reviewing each Portfolio’s performance and the profitability analysis of the Adviser, the Directors considered possible economies of scale, but did not believe material economies of scale to be present in light of the Portfolios’ asset size and growth trends.
In their deliberations, the Directors considered all factors they believed relevant, including the following: information comparing the performance of each of the Portfolios to other investment companies with similar investment objectives and to each Portfolio’s respective unmanaged index; the nature, extent and quality of services rendered by the Adviser; the costs borne by, and profitability of, and other benefits to, the Adviser and its affiliates in providing services to each Portfolio; comparative fee and expense data for each Portfolio and other investment companies with similar investment objectives (having been advised that the Adviser does not manage other accounts with investment objectives and strategies
Annual Report 2016
Supplementary Information (Unaudited) (Continued)
December 31, 2016
similar to those of the Portfolios except private investment funds with fee structures that include performance fees); whether expenses of NGF, NAGF and NSCGF might be expected to decline as a percentage of net assets as NGF, NAGF and NSCGF assets increase (although there had not been a significant increase in assets over the previous year); the professional experience and qualifications of each Portfolio’s management team and other personnel of the Adviser, including the fact that a high caliber of personnel was both needed and provided to meet the needs of NGF, NAGF and NSCGF (specifically with respect to investments in securities sold short); and the terms of the Advisory Agreement. The Independent Directors confirmed that they had received adequate information to make a reasonable determination with respect to the approval of the Advisory Agreement. After full consideration of all the foregoing factors, the Board determined to approve the renewal of the Advisory Agreement.
445 Park Avenue
New York, New York 10022-2606
1-800-625-7071
Investment Adviser:
Needham Investment Management L.L.C.
445 Park Avenue
New York, New York 10022-2606
| | President |
| | George A. Needham |
| | |
| | Executive Vice Presidents and Portfolio Managers |
| | John Barr |
| | | Needham Growth Fund |
| | | Needham Aggressive Growth Fund |
| | Chris Retzler |
| | | Needham Growth Fund |
| | | Needham Small Cap Growth Fund |
| | |
| | Directors |
| | George A. Needham |
| | John W. Larson |
| | F. Randall Smith |
Distributor:
Needham & Company, LLC
445 Park Avenue
New York, New York 10022-2606
212-371-8300
Administrator, Shareholder Servicing Agent and Transfer Agent:
U.S. Bancorp Fund Services, LLC
615 East Michigan Street
Milwaukee, WI 53202
Custodian:
U.S. Bank, N.A.
1555 North RiverCenter Drive
Milwaukee, WI 53212
Counsel:
Stroock & Stroock & Lavan LLP
180 Maiden Lane
New York, NY 10038
Independent Registered Public Accounting Firm:
KPMG LLP
345 Park Avenue
New York, NY 10154
Item 2. Code of Ethics.
The registrant has adopted a code of ethics that applies to the registrant’s principal executive officer and principal financial officer. The registrant has not made amendments to its code of ethics during the period covered by this report. The registrant has not granted any waivers from any provisions of the code of ethics during the period covered by this report.
A copy of the registrant’s Code of Ethics is filed herewith.
Item 3. Audit Committee Financial Expert.
The registrant’s board of directors has determined that there is at least one audit committee financial expert serving on its audit committee. F. Randall Smith is the “audit committee financial expert” and is considered to be “independent” as each term is defined in Item 3 of Form N‑CSR.
Item 4. Principal Accountant Fees and Services.
The registrant has engaged its principal accountant to perform audit services, audit-related services, tax services and other services during the past two fiscal years. “Audit services” refer to performing an audit of the registrant's annual financial statements or services that are normally provided by the accountant in connection with statutory and regulatory filings or engagements for those fiscal years. “Audit-related services” refer to the assurance and related services by the principal accountant that are reasonably related to the performance of the audit. “Tax services” refer to professional services rendered by the principal accountant for tax compliance, tax advice, and tax planning. “Other services” provided by the principal accountant were not applicable. The following table details the aggregate fees billed or expected to be billed for each of the last two fiscal years for audit fees, audit-related fees, tax fees and other fees by the principal accountant.
| | FYE 12/31/2016 | FYE 12/31/2015 |
| Audit Fees | $71,500 | $68,800 |
| Audit-Related Fees | $ 0 | $ 0 |
| Tax Fees | $21,000 | $20,475 |
| All Other Fees | $ 0 | $ 0 |
The audit committee has adopted pre-approval policies and procedures that require the audit committee to pre‑approve all audit and non‑audit services of the registrant, including services provided to any entity affiliated with the registrant.
The percentage of fees billed by KPMG LLP applicable to non-audit services pursuant to waiver of pre-approval requirement were as follows:
| | FYE 12/31/2016 | FYE 12/31/2015 |
| Audit-Related Fees | 0% | 0% |
| Tax Fees | 0% | 0% |
| All Other Fees | 0% | 0% |
All of the principal accountant’s hours spent on auditing the registrant’s financial statements were attributed to work performed by full‑time permanent employees of the principal accountant.
The following table indicates the non-audit fees billed or expected to be billed by the registrant’s accountant for services to the registrant and to the registrant’s investment adviser (and any other controlling entity, etc.—not sub-adviser) for the last two years. The audit committee of the board of trustees/directors has considered whether the provision of non-audit services that were rendered to the registrant's investment adviser is compatible with maintaining the principal accountant's independence and has concluded that the provision of such non-audit services by the accountant has not compromised the accountant’s independence.
| Non-Audit Related Fees | FYE 12/31/2016 | FYE 12/31/2015 |
| Registrant | $0 | $0 |
| Registrant’s Investment Adviser | $7,660 | $7,400 |
Item 5. Audit Committee of Listed Registrants.
Not applicable to registrants who are not listed issuers (as defined in Rule 10A-3 under the Securities Exchange Act of 1934).
Item 6. Investments.
(a) | Schedule of Investments is included as part of the report to shareholders filed under Item 1 of this Form. |
Item 7. Disclosure of Proxy Voting Policies and Procedures for Closed-End Management Investment Companies.
Not applicable to open-end investment companies.
Item 8. Portfolio Managers of Closed-End Management Investment Companies.
Not applicable to open-end investment companies.
Item 9. Purchases of Equity Securities by Closed‑End Management Investment Company and Affiliated Purchasers.
Not applicable to open-end investment companies.
Item 10. Submission of Matters to a Vote of Security Holders.
Not Applicable.
Item 11. Controls and Procedures.
| (a) | The Registrant’s Chief Executive Officer and Chief Financial Officer have reviewed the Registrant's disclosure controls and procedures (as defined in Rule 30a-3(c) under the Investment Company Act of 1940 (the “Act”)) as of a date within 90 days of the filing of this report, as required by Rule 30a-3(b) under the Act and Rules 13a-15(b) or 15d‑15(b) under the Securities Exchange Act of 1934. Based on their review, such officers have concluded that the disclosure controls and procedures are effective in ensuring that information required to be disclosed in this report is appropriately recorded, processed, summarized and reported and made known to them by others within the Registrant and by the Registrant’s service provider. |
| (b) | There were no changes in the Registrant's internal control over financial reporting (as defined in Rule 30a-3(d) under the Act) that occurred during the Registrant’s first fiscal half-year of the period covered by this report that has materially affected, or is reasonably likely to materially affect, the Registrant's internal control over financial reporting. |
Item 12. Exhibits.
| (a) | (1) Any code of ethics or amendment thereto, that is the subject of the disclosure required by Item 2, to the extent that the registrant intends to satisfy Item 2 requirements through filing an exhibit. Filed herewith. |
(2) A separate certification for each principal executive and principal financial officer pursuant to Section 302 of the Sarbanes-Oxley Act of 2002. Filed herewith.
(3) Any written solicitation to purchase securities under Rule 23c‑1 under the Act sent or given during the period covered by the report by or on behalf of the registrant to 10 or more persons. Not applicable to open-end investment companies.
| (b) | Certifications pursuant to Section 906 of the Sarbanes‑Oxley Act of 2002. Furnished herewith. |
SIGNATURES
Pursuant to the requirements of the Securities Exchange Act of 1934 and the Investment Company Act of 1940, the registrant has duly caused this report to be signed on its behalf by the undersigned, thereunto duly authorized.
(Registrant) The Needham Funds, Inc.
By (Signature and Title) /s/ George A. Needham
George A. Needham, President (Chief Executive Officer)
Date March 7, 2017
Pursuant to the requirements of the Securities Exchange Act of 1934 and the Investment Company Act of 1940, this report has been signed below by the following persons on behalf of the registrant and in the capacities and on the dates indicated.
By (Signature and Title) /s/ George A. Needham
George A. Needham, President (Chief Executive Officer)
Date March 7, 2017
By (Signature and Title) /s/ James W. Giangrasso
James W. Giangrasso, Treasurer and Secretary (Chief Financial Officer)
Date March 7, 2017