UNITED STATES
SECURITIES AND EXCHANGE COMMISSION
Washington, D.C. 20549
FORM N-CSR
CERTIFIED SHAREHOLDER REPORT OF REGISTERED
MANAGEMENT INVESTMENT COMPANIES
Investment Company Act file number 811-09114
The Needham Funds, Inc.
(Exact name of registrant as specified in charter)
250 Park Avenue, 10th Floor, New York, NY 10177-1099
(Address of principal executive offices) (Zip code)
Mr. George A. Needham, 250 Park Avenue, 10th Floor, New York, NY 10177-1099
(Name and address of agent for service)
1-800-625-7071
Registrant's telephone number, including area code
Date of fiscal year end: December 31, 2019
Date of reporting period: December 31, 2019
Item 1. Reports to Stockholders.
Annual
Report
Seeking to build wealth for long-term investors.
December 31, 2019
Needham Growth Fund
Needham Aggressive Growth Fund
Needham Small Cap Growth Fund
www.needhamfunds.com
Beginning on January 1, 2021, as permitted by regulations adopted by the Securities and Exchange Commission, paper copies of the Funds’ shareholder reports will no longer be sent by mail, unless you specifically request paper copies of the reports from the Funds or from your financial intermediary, such as a broker-dealer or bank. Instead, the reports will be made available on a website, and you will be notified by mail each time a report is posted and provided with a website link to access the report.
If you already elected to receive shareholder reports electronically, you will not be affected by this change and you need not take any action. You may elect to receive shareholder reports and other communications electronically from the Funds by calling 1-800-625-7071 or by contacting your financial intermediary (such as a broker-dealer or bank).
You may elect to receive all future reports in paper free of charge. You can request to continue receiving paper copies of your shareholder reports by contacting your financial intermediary or, if you invest directly with a Fund, calling 1-800-625-7071 to let the Fund know of your request. Your election to receive in paper will apply to all funds held in your account.
250 Park Avenue, 10th Floor
New York, New York 10177
1-800-625-7071
www.needhamfunds.com
Annual Report
December 31, 2019
Contents
| Letter from the Adviser | | | 1 |
| Portfolio Characteristics | | | |
| Needham Growth Fund | | | 8 |
| Needham Aggressive Growth Fund | | | 10 |
| Needham Small Cap Growth Fund | | | 12 |
| Disclosure of Fund Expenses | | | 14 |
| Schedules of Investments | | | |
| Needham Growth Fund | | | 16 |
| Needham Aggressive Growth Fund | | | 21 |
| Needham Small Cap Growth Fund | | | 26 |
| Schedules of Securities Sold Short | | | |
| Needham Growth Fund | | | 20 |
| Needham Aggressive Growth Fund | | | 25 |
| Needham Small Cap Growth Fund | | | 29 |
| Statements of Assets and Liabilities | | | 30 |
| Statements of Operations | | | 32 |
| Statements of Changes in Net Assets | | | 33 |
| Financial Highlights | | | |
| Needham Growth Fund | | | 36 |
| Needham Aggressive Growth Fund | | | 38 |
| Needham Small Cap Growth Fund | | | 40 |
| Notes to Financial Statements | | | 42 |
| Report of Independent Registered Public Accounting Firm | | | 52 |
| Information about Directors and Officers | | | 53 |
| Supplementary Information and Privacy Policy | | | 56 |
This report is authorized for distribution to prospective investors only when preceded or accompanied by a current prospectus. The prospectus contains more complete information, including investment objectives, risks, expenses and charges and should be read carefully before investing or sending any money. To obtain a prospectus or summary prospectus, please call 1-800-625-7071.
Portfolios of The Needham Funds, Inc., like all mutual funds:
| | • | Are NOT FDIC insured |
| | • | Have no bank guarantee |
| | • | May lose value |
The Needham Funds, Inc. are distributed by Needham & Company, LLC.
Annual Report 2019
| | 250 Park Avenue, 10th Floor |

| New York, NY 10177 |
(800) 625-7071 |
| | www.needhamfunds.com |
February 2020
Dear Shareholders, Friends of Needham and Prospective Shareholders,
The Needham Funds’ mission is to create wealth for long-term investors, and 2019 was an incredible step forward for all three of our mutual funds.
We are very pleased with the Funds’ annual performance. Needham Small Cap Growth Fund was recognized in the Wall Street Journal and Investor’s Business Daily as the top performing mutual fund in any category in 2019. According to Morningstar, Needham Aggressive Growth Fund was the second best performing mutual fund in the Small Cap Growth category in 2019. We are very excited about these recognitions and appreciate the long term support and patience of our investors.
Needham Growth Fund (NEEGX/NEEIX)
For the year ended December 31, 2019, the Fund’s Institutional and Retail classes returned 43.13% and 42.31%, respectively. The Russell 2000 Index returned 25.52% and the S&P 500 Index returned 31.49%.
PDF Solutions (PDFS) was the Needham Growth Fund’s leading contributor in 2019. In October, PDF hosted only its second investor day since going public in 2001. The company highlighted its four-year journey to become an analytics software company for the semiconductor manufacturing industry. Over 50% of revenue is from this fast-growing, high-value offering. PDF’s Exensio big data platform provides access to organized data from a customer’s supply chain, as well as Exensio’s automated intelligence and machine learning capabilities.
Thermo Fisher Scientific, Inc. (TMO) was the second leading contributor for the year. Thermo Fisher has been the largest holding of the Needham Growth Fund for four years. The company develops instruments and consumables used in life science and other research-oriented industries. For the 4 quarters reported in 2019, Thermo Fisher averaged 7% organic growth, which was growth above the 4-6% Wall Street expectations. We see continued organic growth and acquisition opportunities for the company.
Entegris, Inc. (ENTG) was the third-leading contributor in 2019. Entegris supplies filters and chemicals used in advanced semiconductor manufacturing processes. Based on confidence in its business, Entegris said the second quarter of 2019 represented a bottom, and revenue grew in the third and fourth quarters. The company also announced $20 million in annual cost savings, which was in place by the end of 2019.
In April, Entegris announced a merger with Versum Materials, which was bested by an offer from Merck AG (MKGAF). Throughout 2019, Entegris continued with its acquisition strategy by acquiring Digital Specialty Chemicals (DSC) in March, MPD Chemicals for $165 million cash in July, and Hangzhou Anow Microfiltration for $73 million in September. Entegris is doing its own version of what might have been with Versum.
Needham Funds
Entegris sees 2020 as a healthy year for its logic and foundry customers, led by Taiwan Semiconductor (TSM) and Intel Corporation (INTC), and an increasingly positive year for its memory customers. Over time, we believe that semiconductors will increase as a percentage of industrial output and that Entegris’ filtration and specialty materials products will grow even faster.
Aspen Aerogels Inc. (ASPN) and FormFactor Inc. (FORM) were other top contributors to the Fund’s performance in 2019. Aspen Aerogels makes aerogel insulation used in the energy, infrastructure and building materials markets. Its aerogel is a superior alternative to conventional fiber and foam insulation, yet the market has been slow to change. After a disappointing 2018 with $104 million of revenue, we estimate Aspen will have revenue of $135 million in 2019 with continued growth in 2020. Aspen Aerogels’ stock was at an all-time low on December 28, 2018 as the market was concerned about Aspen’s liquidity. In April, Aspen announced a second phase of their partnership with BASF SE (BASF), which included a cash prepayment for the new SLENTEX aerogel used in commercial construction. We are excited about Aspen’s prospects in the electric vehicle battery market.
FormFactor reported second quarter results at the high end of revenue, gross margin and earnings expectations. FormFactor makes probe cards that are used to test wafers for new semiconductor designs. At the start of the year, the company suffered from a delay in Intel Corporation’s (INTC) latest generation 14/10 nanometer manufacturing process. Demand at Intel recovered in the second quarter and stayed strong throughout the year. Over the last seven years, FormFactor has diversified its business by acquiring leading probe card companies for RF (radio frequency) design and logic/system-on chip design.
In 2019, the Fund’s short position in Ubiquiti, Inc. (UI) was the only major detractor. The company’s limited float and stock repurchases funded with bank debt have supported the stock price at a premium valuation. The stock spiked in November as the company reported 14% year-over-year revenue growth. While we remain skeptical about Ubiquiti’s business model and governance, it is time to move on from this short position. As of December 31, 2019, the Ubiquiti short position is down to 0.4% of net assets and it will no longer have a significant impact on the Fund.
Compounding returns come from owning great businesses for years. While the Fund has a mandate allowing short sales, short selling has only contributed to returns in a few years of the Fund’s 18-year existence. In the near future, we plan to do even less short-selling than we have in the last 10 years.
Additions to the Fund in 2019 included Cambium Networks Corporation (CMBM), FARO Technologies, Inc. (FARO), Intevac, Inc. (IVAC) and Wabtech Corp. (WAB), all of which were 50 basis point or above positions on December 31, 2019. The Fund exited only three positions that were over 50 basis points as of December 31, 2018 – Amber Road, Inc., Aquantia Corp., and Electronics for Imaging Inc. were all acquired.
The Fund added to only a few positions; its addition to its position in Vicor Corporation (VICR) was the most significant. The Fund reduced positions in many of its top holdings including FormFactor, Inc. (FORM), Photronics Inc. (PLAB), Super Micro Computer Inc. (SMCI), Thermo Fisher Scientific (TMO) and ViaSat, Inc. (VSAT).
Annual Report 2019
At December 31, 2019, the Fund’s top 10 positions were 55.42% of net assets. The Fund had an Active Share of 96.9% versus the S&P 500 and had trailing 12-month turnover of 13%. Active Share represents the proportion of portfolio holdings that differ from those in the benchmark index. The Fund was short 0.7% of total investments and held a cash position of 1.7%. Cash is included in Short-Term Investments on the Schedule of Investments, and in Investments in Unaffiliated Securities on the Statement of Assets and Liabilities.
Needham Aggressive Growth Fund (NEAGX/NEAIX)
For the year ended December 31, 2019, the Fund’s Institutional and Retail classes returned 44.79% and 43.93%, respectively. The Russell 2000 Index returned 25.52% and the S&P 500 Index returned 31.49%.
PDF Solutions (PDFS) was Needham Aggressive Growth Fund’s leading contributor in 2019. In October, PDF hosted only its second investor day since going public in 2001. The company highlighted its four-year journey to become an analytics software company for the semiconductor manufacturing industry. Over 50% of revenue is from this fast-growing, high-value offering. PDF’s Exensio big data platform provides access to organized data from a customer’s supply chain, as well as Exensio’s automated intelligence and machine learning capabilities.
Entegris, Inc. (ENTG) was the second-leading contributor in 2019. Entegris supplies filters and chemicals used in advanced semiconductor manufacturing processes. Based on confidence in its business, Entegris said the second quarter of 2019 represented a bottom, and revenue grew in the third and fourth quarters. The company also announced $20 million in annual cost savings, which was in place by the end of 2019.
In April, Entegris announced a merger with Versum Materials, which was bested by an offer from Merck AG (MKGAF). Throughout 2019, Entegris continued with its acquisition strategy by acquiring Digital Specialty Chemicals (DSC) in March, MPD Chemicals for $165 million cash in July, and Hangzhou Anow Microfiltration for $73 million in September. Entegris is doing its own version of what might have been with Versum.
Entegris sees 2020 as a healthy year for its logic and foundry customers, led by Taiwan Semiconductor (TSM) and Intel Corporation (INTC), and an increasingly positive year for its memory customers. Over time, we believe that semiconductors will increase as a percentage of industrial output and that Entegris’ filtration and specialty materials products will grow even faster.
Apple, Inc. (AAPL) and MKS Instruments, Inc. (MKSI) were also leading contributors in 2019. What a year it was for Apple. It’s hard to remember, but Apple fell to $143 per share on January 3, 2019 (the stock closed at $293.65 on December 31, 2019). Entering 2019, the market was concerned about weakness in China for Apple’s new, high-end phones. Apple reported revenues for iPhone and Services and gross margins above Wall Street estimates for the March quarter. It also increased its share buyback and raised its quarterly dividend. In June, Apple saw iPhone sales in emerging markets stabilize and near 50% growth in Wearables, which now account for nearly 10% of revenue. The September quarter brought strong iPhone, Wearables and Services results. Throughout the year, Apple showed increasing leverage and higher operating margins.
Needham Funds
In the fourth quarter, MKS Instruments reported strong revenue and earnings, benefitting from unexpected business from Taiwan Semiconductor (TSMC), as TSMC ramped leading-edge 7nm (nanometer) and 5nm manufacturing. As an aside, a 5nm transistor is about 10 atoms wide. Manufacturing these semiconductor devices is absolutely a miracle of science. The benefit of these leading-edge semiconductors is that they use less power and extend the battery life of smartphones and other devices.
DIRTT Environmental Solutions Ltd. (DRTT and DRT:TSE) was a leading detractor to the Fund’s performance in 2019. DIRTT is the future of semi-custom construction. DIRTT designs interior office spaces on its incredible virtual reality CAD system. DIRTT manufactures the walls and interior components, which are shipped and assembled on-site. As a result, there is less on-site waste and a more predictable schedule. DIRTT competes with dry wall and the requirement for skilled workers.
DIRTT is undergoing a management transition. Co-Founder & CEO Mogans Smed was dismissed by DIRTT’s board of directors in September 2018. New CEO Kevin O’Meara was a co-founder of Builders FirstSource, Inc. (BLDR) and was CEO of private equity-backed Atrium Corporation, North America’s largest vinyl and aluminum window manufacturer. O’Meara has also been affiliated with the private equity firms American Securities and Hicks, Muse & Co. We believe he’s a strong CEO to take DIRTT to the next level.
DIRTT’s third quarter revenue and earnings were disappointing, down year-over-year. DIRTT also guided to continued weakness in the 4th quarter. The company pointed to the sales force and distribution partner changes which first started in 2018. O’Meara and his new management team are professionalizing DIRTT’s customer engagement model, but it is taking time. DIRTT added a second major manufacturing facility in Rock Hill, South Carolina, which could lead to better margins.
Additions to the Fund in 2019 included Bruker Corporation (BRKR), Smith-Midland Corporation (SMID) and Wabtech Corp. (WAB), all of which were over 50 basis points of net assets on December 31, 2019. The Fund exited only three positions that were over 50 basis points of net assets as of December 31, 2018. Amber Road, Inc., Ecology & Environment, Inc. and Electronics for Imaging Inc. were all acquired.
At December 31, 2019, the Fund’s top 10 positions were 63.02% of net assets. For the first time in a long time, the Fund is not fully invested and held 6.7% of net assets in cash. Cash is included in Short-Term Investments on the Schedule of Investments, and in Investments in Unaffiliated Securities on the Statements of Assets and Liabilities. This is not a top-down allocation, but rather a decision to wait for our target prices in potential investments. The Fund had an Active Share of 99.8% versus the Russell 2000 and had trailing 12-month turnover of 9%. The Fund was short 0.5% of total investments.
Morningstar categorizes the Fund as Small Cap Growth, and Lipper categorizes it as Small Cap Core. When you hold companies for 10-15 years, and they succeed, they grow to larger market cap categories. The Fund’s mission is to find companies that match the three criteria and may be compounders over many years, independent of their industry or market cap.
Needham Small Cap Growth Fund (NESGX/NESIX)
For the year ended December 31, 2019, the Needham Small Cap Growth Fund Institutional and Retail classes returned 55.31% and 54.45%, respectively. The Russell 2000 Index returned 25.52% and the S&P 500 Index returned 31.49%.
Annual Report 2019
While headline and market volatility continued throughout 2019, we deployed a flexible investment approach that allowed the Fund to take advantage of the market environment. We employed disciplined risk management and continued to evaluate each stock individually as price targets were met and new risks arose. The interest rate curve finally steepened, sparking a market rally from the end of the summer months. I did not believe a recession was looming during the summer, which allowed the Fund an opportunity to deploy substantial capital at reasonable prices.
While global economic growth slowed in 2019, I remain constructive on the overall global economy as it adjusts. With the announcement of the Phase 1 U.S.-China trade deal and an accommodative Federal Reserve, the markets ended the year on a positive note, although the full effects of these developments will not be known until later in 2020.
As we write this letter, we are observing the potential economic impacts that may occur from the spread of the Coronavirus, and expect to see cautious outlook from many companies. Healthcare risk aside, which we believe will be temporary, we expect companies to be generally upbeat on their 2020 outlook, since global economic growth is expected to accelerate. However, will it be enough to support the significant market moves and elevated valuations we enjoyed in 2019? We believe there could be rotation from 2019 stock winners into more value-oriented names. We have adjusted the Fund to harvest some of our gains and look for better entry points to redeploy capital.
While volatility may seem to be a bad word for the overall markets, it is a great chance for active managers to find buying and selling opportunities. In volatile markets, a cash position is truly strategic for small cap fund managers. Many small cap investment opportunities “trade by appointment,” and the Needham Small Cap Growth Fund likes to capitalize on these opportunities when liquidity is available to both buy and sell stock positions. During the month of December, the Fund experienced sizeable inflows of new capital and therefore, we ended the year with a large cash balance. Cash is included in Short-Term Investments on the Schedule of Investments, and in Investments in Unaffiliated Securities on the Statements of Assets and Liabilities. Although we believe that, under normal conditions, the Fund’s assets will be invested in accordance with its policy with respect to the investment of at least 80% of its net assets (as disclosed in the Fund’s prospectus), high levels of new investment inflow, such as that which occurred during the month of December, can lead to periods of higher cash levels that are invested in due course as appropriate opportunities are identified. Typically, we find these opportunities during and after earnings season, which kicks off more significantly for small cap companies in late January and into February.
The Fund’s top holdings as a percentage of net assets at December 31, 2019 included II-VI, Inc. (IIVI), FireEye, Inc. (FEYE), Zuora, Inc. (ZUO), Cambium Networks Corp. (CMBM), and Cohu, Inc. (COHU).
The Fund’s top contributors for the year ending December 31, 2019 included Aspen Aerogels, Inc. (ASPN), PDF Solutions, Inc. (PDFS), Amber Road, Inc. (AMBR), Photronics, Inc. (PLAB) and Ultra Clean Holdings, Inc. (UCTT). The Fund’s top detractors for the year ended December 31, 2019 included Zuora, Inc. (ZUO), Genmark Diagnostics, Inc. (GNMK), Emcore Corp. (EMKR), 2U, Inc. (TWOU) and NeoPhotonics Corp. (NPTN).
Needham Funds
The markets have recovered nicely from the summer lows of 2019 and it would not surprise me to see a pause in the market recovery. However, our outlook for 2020 remains positive. We look forward to a year of patience rewarded, and we continue to believe that a favorable environment remains for investment in equities.
We are focused on the following three themes: 1) continuation of the growth in the semiconductor capital equipment industry; 2) 5G communication infrastructure build-outs; and 3) military and defense modernization. These three areas of investment impact much of the Fund’s portfolio, and we believe that they should create long-term shareholder value.
We expect increased volatility to continue into 2020. We also expect the Federal Reserve to remain vigilant in setting interest rate policy that remains a tailwind to risk assets. While global trade negotiations have been painful headlines for many, any resolution to these disagreements should provide a nice tailwind to the global economy as we enter the U.S. general election of 2020. The high-yield markets remain strong, which is also supportive of small cap asset class valuations. We reiterate from past quarterly letters that mergers and acquisitions continued in the small cap universe, and we expect to see increased M&A activity to improve and benefit our portfolio of stocks in 2020.
Conclusion
We believe the U.S. remains the best place in the world to be investing, and we continue to see an opportunity to invest in small and mid-cap stocks. Most importantly, we see a revolution happening in technology that has created and continues to create investment opportunities. We see opportunity in our strategy of investing in companies that we know well and that we believe are positioned with secular growth drivers.
We welcome our new investors and thank all of our investors for their continued support. If you have any questions, thoughts or concerns, please contact us at (800) 625-7071 or jbarr@needhamco.com and cretzler@needhamco.com. For information about the Needham Funds, please visit our website at www.needhamfunds.com.
Sincerely,
| | |
 |  |
| | |
Chris Retzler, | John O. Barr, |
Portfolio Manager | Portfolio Manager |
Fact Sheet Links:
Needham Growth Fund
Needham Aggressive Growth Fund
Needham Small Cap Growth Fund
Annual Report 2019
The information presented in this commentary is not intended as personalized investment advice and does not constitute a recommendation to buy or sell a particular security or other investments. Past performance is no guarantee of future results. The views of Needham Investment Management L.L.C., the Funds’ investment adviser, and the securities described in this report are as of December 31, 2019; these views and portfolio holdings may have changed subsequent to this date. The specific securities discussed may, in aggregate, represent only a small percentage of a Fund’s holdings. It should not be assumed that securities identified and discussed were, or will be, profitable, or that the investment decisions made in the future will be profitable, or equal the investment performance of the securities discussed herein. There can be no guarantee as to the accuracy of any outlooks for markets, sectors and securities as discussed herein.
This message is not an offer of the Needham Growth Fund, the Needham Aggressive Growth Fund or the Needham Small Cap Growth Fund. Shares are sold only through the currently effective prospectus. Please read the prospectus or summary prospectus carefully and consider the investment objectives, risks and charges and expenses of the Funds carefully before you invest. The prospectus and summary prospectus contain this and other information about the Funds and can be obtained on our website, www.needhamfunds.com or by contacting the Funds’ transfer agent U.S. Bancorp Fund Services LLC doing business as U.S. Bank Global Fund Services (“Fund Services”) at 1-800-625-7071.
Investment returns and principal value will fluctuate, and when redeemed, shares may be worth more or less than their original cost. Performance data quoted represents past performance, and does not guarantee future results. Current performance may be higher or lower than these results. Performance current to the most recent month-end may be obtained by calling our transfer agent at 1-800-625-7071. Total return figures include reinvestment of all dividends and capital gains.
All three of the Needham Funds have substantial exposure to small and micro capitalized companies. Funds holding smaller capitalized companies are subject to greater price fluctuation than those of larger companies. Needham & Company, LLC, member FINRA/SIPC, is the distributor of The Needham Funds, Inc.
The Russell 2000 Index is a broad unmanaged index composed of the smallest 2,000 companies in the Russell 3000 Index. The Russell 3000 Index is a market-capitalization-weighted equity index that provides exposure to the entire U.S. stock market. The Russell 3000 Index tracks the performance of the 3,000 largest U.S.-traded stocks. Please see the disclaimer regarding these indexes under “Supplementary Information—Index Disclaimer” on page 56 of this report.
Needham Funds
| NEEDHAM GROWTH FUND | Retail Class |
| Portfolio Characteristics (Unaudited) | Ticker Symbol: NEEGX |
| | |
| | Institutional Class |
| | Ticker Symbol: NEEIX |
Comparison of Change in Value of a $10,000 Investment
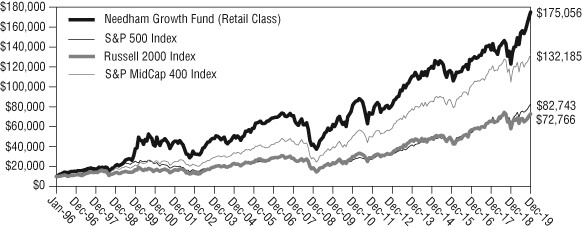
The chart above assumes an initial gross investment of $10,000 made on January 1, 1996. The Fund’s performance figures are for the period ended December 31, 2019. The Performance data quoted is historical. Past performance is no guarantee of future results. Current performance may be higher or lower than the performance data quoted. The principal value and investment return of an investment will fluctuate so that your shares, when redeemed, may be worth more or less than their original cost. To obtain performance information current to the most recent month-end, please call 1-800-625-7071. The returns shown do not reflect the deduction of taxes that a shareholder would pay on Fund distributions or on the redemptions of Fund shares. In the absence of fee waivers and reimbursements, when they are necessary to keep expenses at the expense cap, total return would be reduced. Performance figures for periods greater than one year are annualized.
The Global Industry Classification Standard (GICS®) was developed by and/or is the exclusive property of MSCI, Inc. and Standard & Poor Financial Services LLC (“S&P”). GICS is a service mark of MSCI and S&P and has been licensed for use by U.S. Fund Services.
Annual Report 2019
Comparative Performance Statistics as of December 31, 2019
| | | | | |
| | 1 | 5 | 10 | Since |
| | Year | Years | Years | Inception |
Needham Growth Fund Retail Class(1)(2) | 42.31%(9)
| 7.74% | 10.90% | 12.67%
|
Needham Growth Fund Institutional Class(1)(3) | 43.13%
| n/a | n/a | 12.00%
|
S&P 500 Index(4)(5) | 31.49%
| 11.70% | 13.56% | 9.20%(8) |
S&P MidCap 400 Index(4)(6) | 26.20%
| 9.03% | 12.72% | 11.36%(8) |
Russell 2000 Index(4)(7) | 25.52%
| 8.23% | 11.83% | 8.62%(8) |
| 1. | Investment results calculated after reinvestment of dividends. |
| 2. | The inception date of the Retail Class was 1/1/96. |
| 3. | The inception date of the Institutional Class was 12/30/16. |
| 4. | It is not possible to invest directly in an index. The performance of the index does not include the deduction of expenses associated with a mutual fund, such as investment management fees. |
| 5. | The S&P 500 Index focuses on the large-cap sector of the market; however, since it includes a significant portion of the total value of the market, it also represents the market. Companies in the S&P 500 are considered leading companies in leading industries. |
| 6. | The S&P MidCap 400 Index provides investors with a benchmark for mid-sized companies. The index seeks to remain an accurate measure of mid-sized companies, reflecting the risk and return characteristics of the broader mid-cap universe on an on-going basis. |
| 7. | The Russell 2000 Index measures the performance of the small-cap segment of the U.S. equity universe. The Russell 2000 Index is a subset of the Russell 3000 Index representing approximately 8% of the total market capitalization of that index. The Russell 2000 Index includes approximately 2,000 of the smallest securities based on a combination of their market cap and current index membership. |
| 8. | The return shown for the index is from the inception date of the Retail Class. The returns for the S&P 500 Index, S&P MidCap 400 Index and Russell 2000 Index from the inception date of the Institutional Class are 15.26%, 9.25%, 8.59%, respectively. |
| 9. | The return reflects the actual performance for the year and does not include the impact of any adjustments made for financial reporting required by Generally Accepted Accounting Principles (GAAP). |
| | |
Top Ten Holdings*
(as a % of total investments,
as of December 31, 2019)
| | | % of Total |
Security | | Investments |
Thermo Fisher Scientific, Inc. | TMO | 8.95% |
PDF Solutions, Inc. | PDFS | 7.50% |
CarMax, Inc. | KMX | 6.64% |
Entegris, Inc. | ENTG | 5.98% |
KVH Industries, Inc. | KVHI | 5.14% |
Gilead Sciences, Inc. | GILD | 5.13% |
Becton Dickinson & Co. | BDX | 5.00% |
Comcast Corp. – Class A | CMCSA | 4.75% |
FormFactor, Inc. | FORM | 3.82% |
Vicor Corp. | VICR | 3.33% |
Top Ten Holdings = 56.24% of Total Investments†
| * | Current portfolio holdings may not be indicative of future portfolio holdings. |
| † | Percentage of total investments less cash. |
Sector Weightings*
(as a % of net investments,
as of December 31, 2019)
Sector(3) | Long* | (Short)(1) | Total(1)(2) |
Cash | 1.9% | — | 1.9% |
Communication Services | 5.2% | — | 5.2% |
Consumer Discretionary | 6.8% | — | 6.8% |
Consumer Staples | 0.6% | — | 0.6% |
Energy | 3.6% | — | 3.6% |
Financials | 0.4% | (0.1)% | 0.3% |
Health Care | 22.7% | — | 22.7% |
Industrials | 8.4% | — | 8.4% |
Information Technology | 51.1% | (0.6)% | 50.5% |
| * | Current portfolio holdings may not be indicative of future portfolio holdings. |
(1) | Percentage of total investments includes all stocks, plus cash minus all short positions. |
(2) | Total represents the difference between the long exposure and the short exposure, which produces the net exposure. |
(3) | The categories above represent broad market sectors. Refer to the Schedule of Investments for a more detailed categorization by industry. |
Needham Funds
| NEEDHAM AGGRESSIVE GROWTH FUND | Retail Class |
| Portfolio Characteristics (Unaudited) | Ticker Symbol: NEAGX |
| | |
| | Institutional Class |
| | Ticker Symbol: NEAIX |
Comparison of Change in Value of a $10,000 Investment
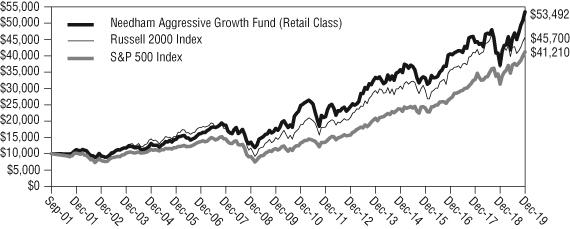
The chart above assumes an initial gross investment of $10,000 made on September 4, 2001. The Fund’s performance figures are for the period ended December 31, 2019.The Performance data quoted is historical. Past performance is no guarantee of future results. Current performance may be higher or lower than the performance data quoted. The principal value and investment return of an investment will fluctuate so that your shares, when redeemed, may be worth more or less than their original cost. To obtain performance information current to the most recent month-end, please call 1-800-625-7071. The returns shown do not reflect the deduction of taxes that a shareholder would pay on Fund distributions or on the redemptions of Fund shares. In the absence of fee waivers and reimbursements, when they are necessary to keep expenses at the expense cap, total return would be reduced. Performance figures for periods greater than one year are annualized.
Annual Report 2019
Comparative Performance Statistics as of December 31, 2019
| | 1 | 5 | 10 | Since |
| | Year | Years | Years | Inception |
Needham Aggressive Growth Fund Retail Class(1)(2) | 43.93% | 8.39% | 11.65% | 9.58% |
Needham Aggressive Growth Fund Institutional Class(1)(3) | 44.79% | n/a | n/a | 10.25% |
S&P 500 Index(4)(5) | 31.49% | 11.70% | 13.56% | 8.03%(7) |
Russell 2000 Index(4)(6) | 25.52% | 8.23% | 11.83% | 8.65%(7) |
| 1. | Investment results calculated after reinvestment of dividends. |
| 2. | The inception date of the Retail Class was 9/4/01. |
| 3. | The inception date of the Institutional Class was 12/30/16. |
| 4. | It is not possible to invest directly in an index. The performance of the index does not include the deduction of expenses associated with a mutual fund, such as investment management fees. |
| 5. | The S&P 500 Index focuses on the large-cap sector of the market; however, since it includes a significant portion of the total value of the market, it also represents the market. Companies in the S&P 500 are considered leading companies in leading industries. |
| 6. | The Russell 2000 Index measures the performance of the small-cap segment of the U.S. equity universe. The Russell 2000 Index is a subset of the Russell 3000 Index representing approximately 8% of the total market capitalization of that index. The Russell 2000 Index includes approximately 2,000 of the smallest securities based on a combination of their market cap and current index membership. |
| 7. | The return shown for the index is from the inception date of the Retail Class. The returns for the S&P 500 Index and Russell 2000 Index from the inception date of the Institutional Class are 15.26% and 8.59%, respectively. |
Top Ten Holdings*
(as a % of total investments,
as of December 31, 2019)
| | | % of Total |
Security | | Investments |
PDF Solutions, Inc. | PDFS | 11.85% |
Apple, Inc. | AAPL | 11.29% |
Entegris, Inc. | ENTG | 9.87% |
KVH Industries, Inc. | KVHI | 7.90% |
Vicor Corp. | VICR | 7.18% |
MKS Instruments, Inc. | MKSI | 4.86% |
Nova Measuring | | |
Instruments, Ltd. (Israel) | NVMI | 4.58% |
Akamai Technologies, Inc. | AKAM | 3.57% |
CarMax, Inc. | KMX | 3.45% |
GSE Systems, Inc. | GVP | 3.34% |
Top Ten Holdings = 67.89% of Total Investments†
| * | Current portfolio holdings may not be indicative of future portfolio holdings. |
| † | Percentage of total investments less cash. |
Sector Weightings*
(as a % of net investments,
as of December 31, 2019)
Sector(3) | Long* | (Short)(1) | Total(1)(2) |
Cash | 4.2% | — | 4.2% |
Communication Services | 0.5% | — | 0.5% |
Consumer Discretionary | 3.5% | — | 3.5% |
Consumer Staples | 2.7% | — | 2.7% |
Energy | 1.7% | — | 1.7% |
Financials | 3.0% | (0.1)% | 2.9% |
Health Care | 4.3% | — | 4.3% |
Industrials | 12.2% | — | 12.2% |
Information Technology | 65.5% | (0.4)% | 65.1% |
Materials | 0.9% | — | 0.9% |
Real Estate | 2.0% | — | 2.0% |
| * | Current portfolio holdings may not be indicative of future portfolio holdings. |
(1) | Percentage of total investments includes all stocks, plus cash minus all short positions. |
(2) | Total represents the difference between the long exposure and the short exposure, which produces the net exposure. |
(3) | The categories above represent broad market sectors. Refer to the Schedule of Investments for a more detailed categorization by industry. |
Needham Funds
| NEEDHAM SMALL CAP GROWTH FUND | Retail Class |
| Portfolio Characteristics (Unaudited) | Ticker Symbol: NESGX |
| | |
| | Institutional Class |
| | Ticker Symbol: NESIX |
Comparison of Change in Value of a $10,000 Investment
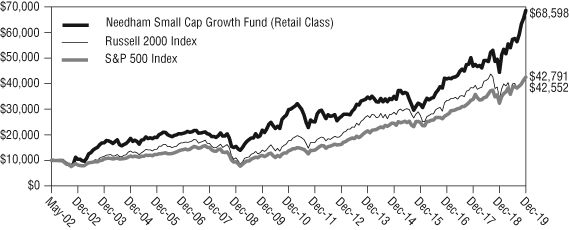
The chart above assumes an initial gross investment of $10,000 made on May 22, 2002. The Fund’s performance figures are for the period ended December 31, 2019.The Performance data quoted is historical. Past performance is no guarantee of future results. Current performance may be higher or lower than the performance data quoted. The principal value and investment return of an investment will fluctuate so that your shares, when redeemed, may be worth more or less than their original cost. To obtain performance information current to the most recent month-end, please call 1-800-625-7071. The returns shown do not reflect the deduction of taxes that a shareholder would pay on Fund distributions or on the redemptions of Fund shares. In the absence of fee waivers and reimbursements, when they are necessary to keep expenses at the expense cap, total return would be reduced. Performance figures for periods greater than one year are annualized.
Annual Report 2019
Comparative Performance Statistics as of December 31, 2019
| | 1 | 5 | 10 | Since |
| | Year | Years | Years | Inception |
Needham Small Cap Growth Fund Retail Class(1)(2) | 54.45% | 14.39% | 12.15% | 11.55% |
Needham Small Cap Growth Fund Institutional Class(1)(3) | 55.31% | n/a | n/a | 18.55% |
S&P 500 Index(4)(5) | 31.49% | 11.70% | 13.56% | 8.57%(7) |
Russell 2000 Index(4)(6) | 25.52% | 8.23% | 11.83% | 8.61%(7) |
| 1. | Investment results calculated after reinvestment of dividends. |
| 2. | The inception date of the Retail Class was 5/22/02. |
| 3. | The inception date of the Institutional Class was 12/30/16. |
| 4. | It is not possible to invest directly in an index. The performance of the index does not include the deduction of expenses associated with a mutual fund, such as investment management fees. |
| 5. | The S&P 500 Index focuses on the large-cap sector of the market; however, since it includes a significant portion of the total value of the market, it also represents the market. Companies in the S&P 500 are considered leading companies in leading industries. |
| 6. | The Russell 2000 Index measures the performance of the small-cap segment of the U.S. equity universe. The Russell 2000 Index is a subset of the Russell 3000 Index representing approximately 8% of the total market capitalization of that index. The Russell 2000 Index includes approximately 2,000 of the smallest securities based on a combination of their market cap and current index membership. |
| 7. | The return shown for the index is from the inception date of the Retail Class. The returns for the S&P 500 Index and Russell 2000 Index from the inception date of the Institutional Class are 15.26% and 8.59%, respectively. |
Top Ten Holdings*
(as a % of total investments,
as of December 31, 2019)
| | | % of Total |
Security | | Investments |
| II-VI, Inc. | IIVI | 8.93% |
| FireEye, Inc. | FEYE | 6.51% |
| Zuora, Inc. – Class A | ZUO | 6.38% |
| Cambium Networks Corp. | CMBM | 5.70% |
| Cohu, Inc. | COHU | 5.38% |
| Intevac, Inc. | IVAC | 4.98% |
| GenMark Diagnostics, Inc. | GNMK | 4.94% |
| Aspen Aerogels, Inc. | ASPN | 4.92% |
| ChannelAdvisor Corp. | ECOM | 4.33% |
| Vicor Corp. | VICR | 4.00% |
Top Ten Holdings = 56.07% of Total Investments†
| * | Current portfolio holdings may not be indicative of future portfolio holdings. |
| † | Percentage of total investments less cash. |
Sector Weightings*
(as a % of net investments,
as of December 31, 2019)
Sector(3) | Long* | (Short)(1) | Total(1)(2) |
Cash | 54.6% | — | 54.6% |
Communication Services | 1.0% | — | 1.0% |
Consumer Discretionary | 0.4% | — | 0.4% |
Energy | 3.9% | — | 3.9% |
Financials | 1.3% | — | 1.3% |
Health Care | 4.1% | — | 4.1% |
Industrials | 3.1% | — | 3.1% |
Information Technology | 31.9% | (0.3)% | 31.6% |
| * | Current portfolio holdings may not be indicative of future portfolio holdings. |
(1) | Percentage of total investments includes all stocks, plus cash minus all short positions. |
(2) | Total represents the difference between the long exposure and the short exposure, which produces the net exposure. |
(3) | The categories above represent broad market sectors. Refer to the Schedule of Investments for a more detailed categorization by industry. |
Needham Funds
Disclosure of Fund Expenses (Unaudited)
The following expense table is shown so that you can understand the impact of fees on your investment. All mutual funds have operating expenses. As a shareholder of a Fund, you incur ongoing costs, which include costs for portfolio management, administrative services, and shareholder reports, among others. A Fund’s expenses are expressed as a percentage of its average net assets. This figure is known as the expense ratio. The following examples are intended to help you understand the ongoing costs (in dollars) of investing in each Fund and to compare these costs with those of other mutual funds. The examples are based on an investment of $1,000 made at the beginning of a six-month period and held for the entire period. The expense example table below illustrates your Fund’s cost in two ways:
| • | Actual Expenses. This section helps you to estimate the actual expenses after fee waivers that you paid over the period. The “Ending Account Value” shown is derived from the Fund’s actual return, and “Expenses Paid During Period” shows the dollar amount that would have been paid by an investor who started with $1,000 in the Fund. You may use the information here, together with the amount you invested, to estimate the expenses that you paid over the period. To do so, simply divide your account value by $1,000 (for example, an $8,600 account value divided by $1,000 = 8.6), then multiply the result by the number given for your Fund under the heading entitled “Expenses Paid During Period”. |
| | |
| • | Hypothetical Expenses on a 5% Return. This section is intended to help you compare your Fund’s costs with those of other mutual funds. It assumes that the Portfolio had a return of 5% before expenses during the period shown, but that the expense ratio is unchanged. In this case, because the return used is not the Fund’s actual return, the results do not apply to your investment. The example is useful in making comparisons because the Securities and Exchange Commission requires all mutual funds to calculate expenses based on a 5% return. You can assess your Fund’s cost by comparing this hypothetical example with the hypothetical examples that appear in shareholders reports of other funds. |
Annual Report 2019
For the Period July 1, 2019 to December 31, 2019
Expense Example Table
| | | Beginning | | | Ending | | | Expenses Paid | | | Expense Ratio | |
| | | Account | | | Account | | | During Period* | | | During Period* | |
| | | Value | | | Value | | | 7/1/19 – | | | 7/1/19 – | |
| | 7/1/19 | | | 12/31/19 | | | 12/31/19 | | | 12/31/19 | |
| Needham Growth Fund | | | | | | | | | | | | |
| Retail Class Actual Expenses | | $ | 1,000.00 | | | $ | 1,134.50 | | | $ | 10.55 | | | | 1.96 | % |
| Retail Class Hypothetical Example | | | | | | | | | | | | | | | | |
| for Comparison Purposes | | | | | | | | | | | | | | | | |
| (5% return before expenses) | | $ | 1,000.00 | | | $ | 1,015.32 | | | $ | 9.96 | | | | 1.96 | % |
| Institutional Class Actual Expenses | | $ | 1,000.00 | | | $ | 1,137.50 | | | $ | 7.60 | | | | 1.41 | % |
| Institutional Class Hypothetical | | | | | | | | | | | | | | | | |
| Example for Comparison Purposes | | | | | | | | | | | | | | | | |
| (5% return before expenses) | | $ | 1,000.00 | | | $ | 1,018.10 | | | $ | 7.17 | | | | 1.41 | % |
| | | | | | | | | | | | | | | | | |
| Needham Aggressive Growth Fund | | | | | | | | | | | | | | | | |
| Retail Class Actual Expenses | | $ | 1,000.00 | | | $ | 1,176.90 | | | $ | 10.81 | | | | 1.97 | % |
| Retail Class Hypothetical Example | | | | | | | | | | | | | | | | |
| for Comparison Purposes | | | | | | | | | | | | | | | | |
| (5% return before expenses) | | $ | 1,000.00 | | | $ | 1,015.27 | | | $ | 10.01 | | | | 1.97 | % |
| Institutional Class Actual Expenses | | $ | 1,000.00 | | | $ | 1,180.40 | | | $ | 7.80 | | | | 1.42 | % |
| Institutional Class Hypothetical | | | | | | | | | | | | | | | | |
| Example for Comparison Purposes | | | | | | | | | | | | | | | | |
| (5% return before expenses) | | $ | 1,000.00 | | | $ | 1,018.05 | | | $ | 7.22 | | | | 1.42 | % |
| | | | | | | | | | | | | | | | | |
| Needham Small Cap Growth Fund | | | | | | | | | | | | | | | | |
| Retail Class Actual Expenses | | $ | 1,000.00 | | | $ | 1,197.00 | | | $ | 10.24 | | | | 1.85 | % |
| Retail Class Hypothetical Example | | | | | | | | | | | | | | | | |
| for Comparison Purposes | | | | | | | | | | | | | | | | |
| (5% return before expenses) | | $ | 1,000.00 | | | $ | 1,015.88 | | | $ | 9.40 | | | | 1.85 | % |
| Institutional Class Actual Expenses | | $ | 1,000.00 | | | $ | 1,200.60 | | | $ | 6.55 | | | | 1.18 | % |
| Institutional Class Hypothetical | | | | | | | | | | | | | | | | |
| Example for Comparison Purposes | | | | | | | | | | | | | | | | |
| (5% return before expenses) | | $ | 1,000.00 | | | $ | 1,019.26 | | | $ | 6.01 | | | | 1.18 | % |
| * | Expenses are equal to the average account value times the Portfolio’s annualized expense ratio multiplied by 184/365 (to reflect the one-half-year period). |
Needham Funds
Needham Growth Fund
Schedule of Investments
December 31, 2019
| | | Shares | | | Value | |
| Common Stocks (98.5%) | | | | | | |
| | | | | | | |
| Aerospace & Defense (0.2%) | | | | | | |
| Parsons Corp. (a) | | | 6,000 | | | $ | 247,680 | |
| | | | | | | | | |
| Airlines (0.3%) | | | | | | | | |
| Hawaiian Holdings, Inc. | | | 10,500 | | | | 307,545 | |
| | | | | | | | | |
| Biotechnology (5.1%) | | | | | | | | |
| Gilead Sciences, Inc. | | | 86,000 | | | | 5,588,280 | |
| | | | | | | | | |
| Building Products (0.5%) | | | | | | | | |
| DIRTT Environmental Solutions (Canada) (a) | | | 172,500 | | | | 565,778 | |
| | | | | | | | | |
| Capital Markets (0.3%) | | | | | | | | |
| Brookfield Asset Management, Inc. – Class A (Canada) | | | 6,173 | | | | 356,799 | |
| | | | | | | | | |
| Commercial Services & Supplies (0.1%) | | | | | | | | |
| Clean Harbors, Inc. (a) | | | 1,500 | | | | 128,625 | |
| | | | | | | | | |
| Communications Equipment (7.0%) | | | | | | | | |
| Cambium Networks Corp. (a) | | | 85,600 | | | | 748,144 | |
| KVH Industries, Inc. (a) | | | 503,250 | | | | 5,601,172 | |
| ViaSat, Inc. (a)(c) | | | 19,500 | | | | 1,427,303 | |
| | | | | | | | 7,776,619 | |
| | | | | | | | | |
| Electrical Equipment (3.3%) | | | | | | | | |
| Vicor Corp. (a) | | | 77,500 | | | | 3,620,800 | |
| | | | | | | | | |
| Electronic Equipment, Instruments & Components (7.3%) | | | | | | | | |
| Corning, Inc. | | | 35,000 | | | | 1,018,850 | |
| FARO Technologies, Inc. (a) | | | 10,000 | | | | 503,500 | |
| FLIR Systems, Inc. | | | 8,500 | | | | 442,595 | |
| Frequency Electronics, Inc. (a) | | | 26,000 | | | | 265,460 | |
| II-VI, Inc. (a) | | | 80,000 | | | | 2,693,600 | |
| IPG Photonics Corp. (a) | | | 6,250 | | | | 905,750 | |
| National Instruments Corp. | | | 20,000 | | | | 846,800 | |
| nLight, Inc. (a) | | | 5,000 | | | | 101,400 | |
| Vishay Intertechnology, Inc. | | | 60,000 | | | | 1,277,400 | |
| | | | | | | | 8,055,355 | |
| | | | | | | | | |
| Energy Equipment & Services (3.2%) | | | | | | | | |
| Aspen Aerogels, Inc. (a) | | | 375,150 | | | | 2,911,164 | |
| | | | | | | | | |
See accompanying notes to financial statements.
Annual Report 2019
Needham Growth Fund
Schedule of Investments (Continued)
December 31, 2019
| | | Shares | | | Value | |
| Common Stocks – Continued | | | | | | |
| | | | | | | |
| Energy Equipment & Services – Continued | | | | | | |
| Core Laboratories NV (Netherlands) | | | 5,000 | | | $ | 188,350 | |
| Schlumberger, Ltd. | | | 10,000 | | | | 402,000 | |
| | | | | | | | 3,501,514 | |
| | | | | | | | | |
| Entertainment (0.6%) | | | | | | | | |
| World Wrestling Entertainment, Inc. – Class A | | | 9,500 | | | | 616,265 | |
| | | | | | | | | |
| Health Care Equipment & Supplies (8.2%) | | | | | | | | |
| Becton Dickinson & Co. | | | 20,000 | | | | 5,439,400 | |
| CryoPort, Inc. (a) | | | 55,000 | | | | 905,300 | |
| GenMark Diagnostics, Inc. (a) | | | 45,000 | | | | 216,450 | |
| Medtronic PLC (Ireland) | | | 22,000 | | | | 2,495,900 | |
| | | | | | | | 9,057,050 | |
| | | | | | | | | |
| Health Care Providers & Services (0.6%) | | | | | | | | |
| Laboratory Corp. of America Holdings (a) | | | 2,000 | | | | 338,340 | |
| Quest Diagnostics, Inc. | | | 3,500 | | | | 373,765 | |
| | | | | | | | 712,105 | |
| | | | | | | | | |
| Household Durables (0.2%) | | | | | | | | |
| iRobot Corp. (a) | | | 3,500 | | | | 177,205 | |
| | | | | | | | | |
| Household Products (0.6%) | | | | | | | | |
| Oil-Dri Corp. of America | | | 17,000 | | | | 616,250 | |
| | | | | | | | | |
| Industrial Conglomerates (0.4%) | | | | | | | | |
| Honeywell International, Inc. | | | 2,500 | | | | 442,500 | |
| | | | | | | | | |
| Internet & Direct Marketing Retail (0.1%) | | | | | | | | |
| Stitch Fix, Inc. – Class A (a) | | | 5,000 | | | | 128,300 | |
| | | | | | | | | |
| IT Services (2.9%) | | | | | | | | |
| Akamai Technologies, Inc. (a)(c) | | | 34,000 | | | | 2,936,920 | |
| Bill.com Holdings, Inc. (a) | | | 7,985 | | | | 303,829 | |
| | | | | | | | 3,240,749 | |
| | | | | | | | | |
| Life Sciences Tools & Services (8.8%) | | | | | | | | |
| Thermo Fisher Scientific, Inc. (c) | | | 30,000 | | | | 9,746,100 | |
| | | | | | | | | |
| Machinery (1.5%) | | | | | | | | |
| Wabtec Corp. | | | 22,000 | | | | 1,711,600 | |
| | | | | | | | | |
| Media (4.7%) | | | | | | | | |
| Comcast Corp. – Class A | | | 115,000 | | | | 5,171,550 | |
See accompanying notes to financial statements.
Needham Funds
Needham Growth Fund
Schedule of Investments (Continued)
December 31, 2019
| | | Shares | | | Value | |
| Common Stocks – Continued | | | | | | |
| | | | | | | |
| Oil, Gas & Consumable Fuels (0.4%) | | | | | | |
| Navigator Holdings, Ltd. (a) | | | 33,000 | | | $ | 444,510 | |
| | | | | | | | | |
| Semiconductors & Semiconductor Equipment (24.3%) | | | | | | | | |
| Applied Materials, Inc. | | | 9,000 | | | | 549,360 | |
| Entegris, Inc. | | | 130,000 | | | | 6,511,700 | |
| FormFactor, Inc. (a) | | | 160,000 | | | | 4,155,200 | |
| Lam Research Corp. | | | 2,500 | | | | 731,000 | |
| MKS Instruments, Inc. | | | 25,000 | | | | 2,750,250 | |
| Nova Measuring Instruments, Ltd. (Israel) (a) | | | 58,000 | | | | 2,194,140 | |
| PDF Solutions, Inc. (a) | | | 483,200 | | | | 8,161,248 | |
| Photronics, Inc. (a) | | | 67,100 | | | | 1,057,496 | |
| SiTime Corp. (a) | | | 7,758 | | | | 197,829 | |
| Sprout Social, Inc. – Class A (a) | | | 259 | | | | 4,157 | |
| Taiwan Semiconductor Manufacturing | | | | | | | | |
| Co., Ltd. (Taiwan) – ADR | | | 8,500 | | | | 493,850 | |
| | | | | | | | 26,806,230 | |
| | | | | | | | | |
| Software (5.2%) | | | | | | | | |
| The Trade Desk, Inc. – Class A (a) | | | 5,000 | | | | 1,298,900 | |
| Altair Engineering, Inc. – Class A (a) | | | 2,996 | | | | 107,586 | |
| Appian Corp. (a) | | | 10,000 | | | | 382,100 | |
| ChannelAdvisor Corp. (a) | | | 30,000 | | | | 271,200 | |
| Coupa Software, Inc. (a) | | | 4,650 | | | | 680,063 | |
| Everbridge, Inc. (a) | | | 12,000 | | | | 936,960 | |
| GSE Systems, Inc. (a) | | | 24,029 | | | | 39,648 | |
| Q2 Holdings, Inc. (a) | | | 17,500 | | | | 1,418,900 | |
| Zuora, Inc. – Class A (a) | | | 45,000 | | | | 644,850 | |
| | | | | | | | 5,780,207 | |
| | | | | | | | | |
| Specialty Retail (6.5%) | | | | | | | | |
| CarMax, Inc. (a)(c) | | | 82,500 | | | | 7,232,775 | |
| | | | | | | | | |
| Technology Hardware, Storage & Peripherals (4.1%) | | | | | | | | |
| Apple, Inc. | | | 2,700 | | | | 792,855 | |
| Intevac, Inc. (a) | | | 73,750 | | | | 520,675 | |
| Pure Storage, Inc. – Class A (a) | | | 7,500 | | | | 128,325 | |
| Super Micro Computer, Inc. (a) | | | 130,000 | | | | 3,122,600 | |
| | | | | | | | 4,564,455 | |
See accompanying notes to financial statements.
Annual Report 2019
Needham Growth Fund
Schedule of Investments (Continued)
December 31, 2019
| | | Shares | | | Value | |
| Common Stocks – Continued | | | | | | |
| | | | | | | |
| Trading Companies & Distributors (2.1%) | | | | | | |
| Air Lease Corp. | | | 48,000 | | | $ | 2,280,960 | |
| | | | | | | | | |
| Total Common Stocks | | | | | | | | |
| (Cost $44,167,891) | | | | | | $ | 108,877,806 | |
| | | | | | | | | |
| Short-Term Investments (1.7%) | | | | | | | | |
| | | | | | | | | |
| Money Market Fund (1.7%) | | | | | | | | |
| Dreyfus Treasury Securities Cash Management – | | | | | | | | |
| Institutional Class 1.44% (b) | | | | | | | | |
| | | | | | | | | |
| Total Short-Term Investments | | | | | | | | |
| (Cost $1,850,459) | | | 1,850,459 | | | $ | 1,850,459 | |
| | | | | | | | | |
| | | | | | | | | |
| Total Investments (100.2%) | | | | | | | | |
| (Cost $46,018,350) | | | | | | | 110,728,265 | |
| Total Securities Sold Short (-0.7%) | | | | | | | (747,850 | ) |
| (Proceeds $240,455) | | | | | | | | |
| Other Assets in Excess of Liabilities (0.5%) | | | | | | | 504,841 | |
| Net Assets (100.0%) | | | | | | $ | 110,485,256 | |
| | Percentages are stated as a percent of net assets. |
| | Industry classifications may be different than those used for compliance monitoring purposes. |
| (a) | Non-income producing security. |
| (b) | Rate shown is the seven-day yield as of December 31, 2019. |
| (c) | Security position is either entirely or partially held in a segregated account as collateral for securities sold short, aggregating a total market value of $2,284,903. |
| ADR | American Depositary Receipt |
Distribution of investments by country or territory of incorporation, as a percentage of Total Investments, is as follows (Unaudited):
| Country | | Long | | |
| United States^ | | | 94.0 | % | |
| Canada | | | 0.8 | % | |
| Taiwan | | | 0.4 | % | |
| Ireland | | | 2.3 | % | |
| Israel | | | 2.0 | % | |
| Netherlands | | | 0.5 | % | |
| Total | | | 100.0 | % | |
| ^ | United States allocation includes Short-Term Investment-Money Market Fund of 1.7%. |
See accompanying notes to financial statements.
Needham Funds
Needham Growth Fund
Schedule of Securities Sold Short
December 31, 2019
| | | Shares | | | Value | |
| Securities Sold Short (-0.7%) | | | | | | |
| | | | | | | |
| Communications Equipment (-0.4%) | | | | | | |
| Ubiquiti, Inc. | | | 2,500 | | | $ | 472,450 | |
| | | | | | | | | |
| Consumer Finance (-0.1%) | | | | | | | | |
| Medallion Financial Corp. (a) | | | 15,000 | | | | 109,050 | |
| | | | | | | | | |
| Semiconductors & Semiconductor Equipment (-0.2%) | | | | | | | | |
| Ichor Holdings, Ltd. (a) | | | 5,000 | | | | 166,350 | |
| | | | | | | | | |
| Total Securities Sold Short (-0.7%) | | | | | | | | |
| (Proceeds $240,455) | | | | | | $ | 747,850 | |
| (a) | Non-income producing security. |
Distribution of investments by country or territory of incorporation, as a percentage of Total Securities Sold Short, is as follows (Unaudited):
| Country | | Short | | |
| United States | | | 100.0 | % | |
| Total | | | 100.0 | % | |
See accompanying notes to financial statements.
Annual Report 2019
Needham Aggressive Growth Fund
Schedule of Investments
December 31, 2019
| | | Shares | | | Value | |
| Common Stocks (92.8%) | | | | | | |
| | | | | | | |
| Aerospace & Defense (0.2%) | | | | | | |
| Parsons Corp. (a) | | | 3,000 | | | $ | 123,840 | |
| | | | | | | | | |
| Building Products (2.8%) | | | | | | | | |
| Alpha Pro Tech, Ltd. (a) | | | 85,000 | | | | 291,550 | |
| DIRTT Environmental Solutions (Canada) (a) | | | 370,000 | | | | 1,212,451 | |
| Jewett-Cameron Trading Co., Ltd. (a) | | | 8,000 | | | | 61,680 | |
| | | | | | | | 1,565,681 | |
| | | | | | | | | |
| Chemicals (0.2%) | | | | | | | | |
| Axalta Coating Systems, Ltd. (a) | | | 4,000 | | | | 121,600 | |
| | | | | | | | | |
| Communications Equipment (7.4%) | | | | | | | | |
| Cambium Networks Corp. (a) | | | 3,300 | | | | 28,842 | |
| KVH Industries, Inc. (a) | | | 369,400 | | | | 4,111,422 | |
| | | | | | | | 4,140,264 | |
| | | | | | | | | |
| Construction Materials (0.7%) | | | | | | | | |
| Smith-Midland Corp. | | | 63,670 | | | | 382,020 | |
| | | | | | | | | |
| Electrical Equipment (6.7%) | | | | | | | | |
| Vicor Corp. (a) | | | 80,000 | | | | 3,737,600 | |
| | | | | | | | | |
| Electronic Equipment, Instruments & Components (2.8%) | | | | | | | | |
| IPG Photonics Corp. (a) | | | 7,000 | | | | 1,014,440 | |
| National Instruments Corp. | | | 7,000 | | | | 296,380 | |
| nLight, Inc. (a) | | | 1,523 | | | | 30,886 | |
| Vishay Precision Group, Inc. (a) | | | 7,500 | | | | 255,000 | |
| | | | | | | | 1,596,706 | |
| | | | | | | | | |
| Energy Equipment & Services (1.7%) | | | | | | | | |
| Aspen Aerogels, Inc. (a) | | | 124,050 | | | | 962,628 | |
| | | | | | | | | |
| Entertainment (0.5%) | | | | | | | | |
| World Wrestling Entertainment, Inc. – Class A | | | 4,500 | | | | 291,915 | |
| | | | | | | | | |
| Health Care Equipment & Supplies (2.4%) | | | | | | | | |
| CryoPort, Inc. (a) | | | 34,000 | | | | 559,640 | |
| LeMaitre Vascular, Inc. | | | 22,500 | | | | 808,875 | |
| | | | | | | | 1,368,515 | |
See accompanying notes to financial statements.
Needham Funds
Needham Aggressive Growth Fund
Schedule of Investments (Continued)
December 31, 2019
| | | Shares | | | Value | |
| | | | | | | |
| Common Stocks – Continued | | | | | | |
| | | | | | | |
| Health Care Providers & Services (0.5%) | | | | | | |
| Laboratory Corp. of America Holdings (a) | | | 500 | | | $ | 84,585 | |
| Quest Diagnostics, Inc. | | | 1,750 | | | | 186,883 | |
| | | | | | | | 271,468 | |
| | | | | | | | | |
| Health Care Technology (0.4%) | | | | | | | | |
| Omnicell, Inc. (a) | | | 3,000 | | | | 245,160 | |
| | | | | | | | | |
| Household Durables (0.1%) | | | | | | | | |
| iRobot Corp. (a) | | | 1,000 | | | | 50,630 | |
| | | | | | | | | |
| Household Products (2.7%) | | | | | | | | |
| Oil-Dri Corp. of America | | | 42,000 | | | | 1,522,500 | |
| | | | | | | | | |
| Internet & Direct Marketing Retail (0.2%) | | | | | | | | |
| Stitch Fix, Inc. – Class A (a) | | | 4,000 | | | | 102,640 | |
| | | | | | | | | |
| IT Services (3.6%) | | | | | | | | |
| Akamai Technologies, Inc. (a)(c) | | | 21,500 | | | | 1,857,170 | |
| Bill.com Holdings, Inc. (a) | | | 3,767 | | | | 143,334 | |
| | | | | | | | 2,000,504 | |
| | | | | | | | | |
| Life Sciences Tools & Services (0.9%) | | | | | | | | |
| Bruker Corp. | | | 10,000 | | | | 509,700 | |
| | | | | | | | | |
| Machinery (1.3%) | | | | | | | | |
| FreightCar America, Inc. (a) | | | 40,000 | | | | 82,800 | |
| Wabtec Corp. | | | 8,500 | | | | 661,300 | |
| | | | | | | | 744,100 | |
| | | | | | | | | |
| Professional Services (0.7%) | | | | | | | | |
| CRA International, Inc. | | | 7,000 | | | | 381,290 | |
| | | | | | | | | |
| Real Estate Investment Trusts (REITs) (2.1%) | | | | | | | | |
| Equinix, Inc. | | | 2,000 | | | | 1,167,400 | |
| | | | | | | | | |
| Semiconductors & Semiconductor Equipment (31.6%) (d) | | | | | | | | |
| Entegris, Inc. | | | 102,500 | | | | 5,134,225 | |
| FormFactor, Inc. (a) | | | 24,000 | | | | 623,280 | |
| MKS Instruments, Inc. | | | 23,000 | | | | 2,530,230 | |
| Nova Measuring Instruments, Ltd. (Israel) (a)(c) | | | 63,000 | | | | 2,383,290 | |
| PDF Solutions, Inc. (a)(c) | | | 365,000 | | | | 6,164,850 | |
See accompanying notes to financial statements.
Annual Report 2019
Needham Aggressive Growth Fund
Schedule of Investments (Continued)
December 31, 2019
| | | Shares | | | Value | |
| Common Stocks – Continued | | | | | | |
| | | | | | | |
| Semiconductors & Semiconductor Equipment – Continued | | | | | | |
| Photronics, Inc. (a) | | | 22,500 | | | $ | 354,600 | |
| SiTime Corp. (a) | | | 3,605 | | | | 91,928 | |
| Sprout Social, Inc. – Class A (a) | | | 122 | | | | 1,958 | |
| Taiwan Semiconductor Manufacturing | | | | | | | | |
| Co., Ltd. (Taiwan) – ADR | | | 7,000 | | | | 406,700 | |
| | | | | | | | 17,691,061 | |
| | | | | | | | | |
| Software (6.1%) | | | | | | | | |
| Altair Engineering, Inc. – Class A (a) | | | 1,000 | | | | 35,910 | |
| Appian Corp. (a) | | | 2,500 | | | | 95,525 | |
| ChannelAdvisor Corp. (a) | | | 5,000 | | | | 45,200 | |
| Coupa Software, Inc. (a) | | | 1,050 | | | | 153,563 | |
| Everbridge, Inc. (a) | | | 4,500 | | | | 351,360 | |
| GSE Systems, Inc. (a)(e) | | | 1,052,625 | | | | 1,736,831 | |
| Pluralsight, Inc. – Class A (a) | | | 1,000 | | | | 17,210 | |
| Q2 Holdings, Inc. (a) | | | 8,250 | | | | 668,910 | |
| The Trade Desk, Inc. – Class A (a) | | | 1,200 | | | | 311,736 | |
| | | | | | | | 3,416,245 | |
| | | | | | | | | |
| Specialty Retail (3.2%) | | | | | | | | |
| CarMax, Inc. (a)(c) | | | 20,500 | | | | 1,797,235 | |
| | | | | | | | | |
| Technology Hardware, Storage & Peripherals (13.5%) | | | | | | | | |
| Apple, Inc. (c) | | | 20,000 | | | | 5,873,000 | |
| Intevac, Inc. (a) | | | 13,900 | | | | 98,134 | |
| Super Micro Computer, Inc. (a) | | | 66,500 | | | | 1,597,330 | |
| | | | | | | | 7,568,464 | |
| | | | | | | | | |
| Trading Companies & Distributors (0.5%) | | | | | | | | |
| Air Lease Corp. | | | 3,000 | | | | 142,560 | |
| Transcat, Inc. (a) | | | 4,000 | | | | 127,440 | |
| | | | | | | | 270,000 | |
| | | | | | | | | |
| Total Common Stocks | | | | | | | | |
| (Cost $22,026,323) | | | | | | $ | 52,029,166 | |
| | | | | | | | | |
See accompanying notes to financial statements.
Needham Funds
Needham Aggressive Growth Fund
Schedule of Investments (Continued)
December 31, 2019
| | | Shares | | | Value | |
| Short-Term Investments (6.6%) | | | | | | |
| | | | | | | |
| Money Market Fund (6.6%) | | | | | | |
| Dreyfus Treasury Securities Cash Management – | | | | | | |
| Institutional Class 1.44% (b) | | | | | | |
| | | | | | | |
| Total Short-Term Investment | | | | | | |
| (Cost $3,706,371) | | | 3,706,371 | | | $ | 3,706,371 | |
| | | | | | | | | |
| | | | | | | | | |
| Total Investments (99.4%) | | | | | | | | |
| (Cost $25,732,694) | | | | | | | 55,735,537 | |
| Total Securities Sold Short (-0.5%) | | | | | | | (256,337 | ) |
| (Proceeds $74,836) | | | | | | | | |
| Other Assets in Excess of Liabilities (1.1%) | | | | | | | 580,525 | |
| Net Assets (100.0%) | | | | | | $ | 56,059,725 | |
| | Percentages are stated as a percent of net assets. |
| | Industry classifications may be different than those used for compliance monitoring purposes. |
| (a) | Non-income producing security. |
| (b) | Rate shown is the seven-day yield as of December 31, 2019. |
| (c) | Security position is either entirely or partially held in a segregated account as collateral for securities sold short, aggregating a total market value of $3,977,490. |
| (d) | As of December 31, 2019, the Fund had a significant portion of its assets invested in the Semiconductors & Semiconductor Equipment industry. |
| (e) | Affiliated security. Please refer to Note 11 of the Financial Statements. |
| ADR | American Depositary Receipt |
Distribution of investments by country or territory of incorporation, as a percentage of Total Investments, is as follows (Unaudited):
| Country | | Long | |
| United States^ | | | 92.7 | % | |
| Canada | | | 2.3 | % | |
| Taiwan | | | 0.7 | % | |
| Israel | | | 4.3 | % | |
| Total | | | 100.0 | % | |
| ^ | United States allocation includes Short-Term Investment-Money Market Fund of 6.6%. |
See accompanying notes to financial statements.
Annual Report 2019
Needham Aggressive Growth Fund
Schedule of Securities Sold Short
December 31, 2019
| | | Shares | | | Value | |
| Securities Sold Short (-0.5%) | | | | | | |
| | | | | | | |
| Communications Equipment (-0.3%) | | | | | | |
| Ubiquiti, Inc. | | | 900 | | | $ | 170,082 | |
| | | | | | | | | |
| Consumer Finance (-0.1%) | | | | | | | | |
| Medallion Financial Corp. (a) | | | 5,000 | | | | 36,350 | |
| | | | | | | | | |
| Semiconductors & Semiconductor Equipment (-0.1%) | | | | | | | | |
| Ichor Holdings, Ltd. (a) | | | 1,500 | | | | 49,905 | |
| | | | | | | | | |
| Total Securities Sold Short (-0.5%) | | | | | | | | |
| (Proceeds $74,836) | | | | | | $ | 256,337 | |
| (a) | Non-income producing security. |
Distribution of investments by country or territory of incorporation, as a percentage of Total Securities Sold Short, is as follows (Unaudited):
| Country | | Short
| |
| United States | | | 100.0 | % | |
| Total | | | 100.0 | % | |
See accompanying notes to financial statements.
Needham Funds
Needham Small Cap Growth Fund
Schedule of Investments
December 31, 2019
| | | Shares | | | Value | |
| Common Stocks (44.2%) | | | | | | |
| | | | | | | |
| Airlines (0.4%) | | | | | | |
| Hawaiian Holdings, Inc. | | | 20,000 | | | $ | 585,800 | |
| | | | | | | | | |
| Biotechnology (1.1%) | | | | | | | | |
| CRISPR Therapeutics AG (Switzerland) (a) | | | 5,500 | | | | 334,978 | |
| Moderna, Inc. (a) | | | 42,500 | | | | 831,300 | |
| Voyager Therapeutics, Inc. (a) | | | 20,000 | | | | 279,000 | |
| | | | | | | | 1,445,278 | |
| | | | | | | | | |
| Building Products (0.1%) | | | | | | | | |
| DIRTT Environmental Solutions (a) | | | 40,000 | | | | 130,915 | |
| | | | | | | | | |
| Communications Equipment (4.8%) | | | | | | | | |
| Cambium Networks Corp. (a) | | | 381,100 | | | | 3,330,814 | |
| EMCORE Corp. (a) | | | 490,000 | | | | 1,489,600 | |
| KVH Industries, Inc. (a)(b) | | | 141,250 | | | | 1,572,112 | |
| | | | | | | | 6,392,526 | |
| | | | | | | | | |
| Diversified Telecommunication Services (0.8%) | | | | | | | | |
| Vonage Holdings Corp. (a) | | | 150,000 | | | | 1,111,500 | |
| | | | | | | | | |
| Electrical Equipment (1.8%) | | | | | | | | |
| Vicor Corp. (a)(b) | | | 50,000 | | | | 2,336,000 | |
| | | | | | | | | |
| Electronic Equipment, Instruments & Components (5.0%) | | | | | | | | |
| Akoustis Technologies, Inc. (a) | | | 3,400 | | | | 27,200 | |
| FARO Technologies, Inc. (a) | | | 10,000 | | | | 503,500 | |
| Frequency Electronics, Inc. (a) | | | 25,100 | | | | 256,271 | |
| II-VI, Inc. (a) | | | 155,000 | | | | 5,218,850 | |
| nLight, Inc. (a) | | | 15,000 | | | | 304,200 | |
| Vishay Precision Group, Inc. (a) | | | 10,000 | | | | 340,000 | |
| | | | | | | | 6,650,021 | |
| | | | | | | | | |
| Energy Equipment & Services (2.2%) | | | | | | | | |
| Aspen Aerogels, Inc. (a) | | | 370,000 | | | | 2,871,200 | |
| | | | | | | | | |
| Entertainment (0.1%) | | | | | | | | |
| World Wrestling Entertainment, Inc. – Class A | | | 2,000 | | | | 129,740 | |
| | | | | | | | | |
| Health Care Equipment & Supplies (2.9%) | | | | | | | | |
| CryoPort, Inc. (a) | | | 5,000 | | | | 82,300 | |
| GenMark Diagnostics, Inc. (a) | | | 600,000 | | | | 2,886,000 | |
See accompanying notes to financial statements.
Annual Report 2019
Needham Small Cap Growth Fund
Schedule of Investments (Continued)
December 31, 2019
| | | Shares | | | Value | |
| Common Stocks – Continued | | | | | | |
| | | | | | | |
| Health Care Equipment & Supplies – Continued | | | | | | |
| ViewRay, Inc. (a) | | | 215,000 | | | $ | 907,300 | |
| | | | | | | | 3,875,600 | |
| | | | | | | | | |
| Household Durables (0.4%) | | | | | | | | |
| iRobot Corp. (a) | | | 10,000 | | | | 506,300 | |
| | | | | | | | | |
| IT Services (0.9%) | | | | | | | | |
| Bill.com Holdings, Inc. (a) | | | 4,385 | | | | 166,849 | |
| Fastly, Inc. – Class A (a) | | | 10,000 | | | | 200,700 | |
| Limelight Networks, Inc. (a) | | | 200,000 | | | | 816,000 | |
| | | | | | | | 1,183,549 | |
| | | | | | | | | |
| Machinery (0.4%) | | | | | | | | |
| Wabtec Corp. | | | 6,000 | | | | 466,800 | |
| | | | | | | | | |
| Oil, Gas & Consumable Fuels (1.6%) | | | | | | | | |
| Navigator Holdings, Ltd. (a) | | | 157,300 | | | | 2,118,831 | |
| | | | | | | | | |
| Semiconductors & Semiconductor Equipment (5.4%) | | | | | | | | |
| AXT, Inc. (a) | | | 35,000 | | | | 152,250 | |
| Cohu, Inc. | | | 137,500 | | | | 3,141,875 | |
| MaxLinear, Inc. (a) | | | 40,000 | | | | 848,800 | |
| MKS Instruments, Inc. | | | 2,000 | | | | 220,020 | |
| PDF Solutions, Inc. (a)(b) | | | 120,000 | | | | 2,026,800 | |
| Photronics, Inc. (a) | | | 50,400 | | | | 794,304 | |
| | | | | | | | 7,184,049 | |
| | | | | | | | | |
| Software (10.0%) | | | | | | | | |
| Appian Corp. (a) | | | 25,000 | | | | 955,250 | |
| ChannelAdvisor Corp. (a) | | | 280,000 | | | | 2,531,200 | |
| Cornerstone OnDemand, Inc. (a) | | | 13,000 | | | | 761,150 | |
| FireEye, Inc. (a) | | | 230,000 | | | | 3,801,900 | |
| GSE Systems, Inc. (a) | | | 24,029 | | | | 39,648 | |
| Pluralsight, Inc. – Class A (a) | | | 80,000 | | | | 1,376,800 | |
| Zuora, Inc. – Class A (a) | | | 260,000 | | | | 3,725,800 | |
| | | | | | | | 13,191,748 | |
| | | | | | | | | |
| Technology Hardware, Storage & Peripherals (4.7%) | | | | | | | | |
| Intevac, Inc. (a) | | | 412,350 | | | | 2,911,191 | |
| Pure Storage, Inc. – Class A (a) | | | 70,000 | | | | 1,197,700 | |
See accompanying notes to financial statements.
Needham Funds
Needham Small Cap Growth Fund
Schedule of Investments (Continued)
December 31, 2019
| | | Shares | | | Value | |
| Common Stocks – Continued | | | | | | |
| | | | | | | |
| Technology Hardware, Storage & Peripherals – Continued | | | | | | |
| Super Micro Computer, Inc. (a)(b) | | | 85,000 | | | $ | 2,041,700 | |
| | | | | | | | 6,150,591 | |
| | | | | | | | | |
| Thrifts & Mortgage Finance (1.2%) | | | | | | | | |
| LendingTree, Inc. (a) | | | 5,300 | | | | 1,608,232 | |
| | | | | | | | | |
| Trading Companies & Distributors (0.4%) | | | | | | | | |
| Air Lease Corp. | | | 10,000 | | | | 475,200 | |
| | | | | | | | | |
| Total Common Stocks | | | | | | | | |
| (Cost $50,298,417) | | | | | | $ | 58,413,880 | |
| | | | | | | | | |
| Short-Term Investments (53.1%) | | | | | | | | |
| | | | | | | | | |
| Money Market Fund (53.1%) | | | | | | | | |
| Dreyfus Treasury Securities Cash Management – | | | | | | | | |
| Institutional Class 1.44% (c) | | | | | | | | |
| | | | | | | | | |
| Total Short-Term Investments | | | | | | | | |
| (Cost $70,172,813) | | | 70,172,813 | | | $ | 70,172,813 | |
| | | | | | | | | |
| Total Investments (97.3%) | | | | | | | | |
| (Cost $120,471,230) | | | | | | | 128,586,693 | |
| Total Securities Sold Short (-0.3%) | | | | | | | (332,700 | ) |
| (Proceeds $307,816) | | | | | | | | |
| Other Assets in Excess of Liabilities (3.0%) | | | | | | | 3,855,871 | |
| Net Assets (100.0%) | | | | | | $ | 132,109,864 | |
| | Percentages are stated as a percent of net assets. |
| | Industry classifications may be different than those used for compliance purposes. |
| (a) | Non-income producing security. |
| (b) | Security position is either entirely or partially held in a segregated account as collateral for securities sold short, aggregating a total market value of $1,937,050. |
| (c) | Rate shown is the seven day yield as of December 31, 2019 |
Distribution of investments by country or territory of incorporation, as a percentage of Total Investments, is as follows (Unaudited):
| Country | | Long
| |
| United States^ | | | 99.5 | % | |
| Canada | | | 0.3 | % | |
| Switzerland | | | 0.2 | % | |
| Total | | | 100.0 | % | |
| ^ | United States allocation includes Short-Term Investment-Money Market Fund of 53.1%. |
See accompanying notes to financial statements.
Annual Report 2019
Needham Small Cap Growth Fund
Schedule of Securities Sold Short
December 31, 2019
| | | Shares | | | Value | |
| Securities Sold Short (-0.3%) | | | | | | |
| | | | | | | |
| Semiconductors & Semiconductor Equipment (-0.3%) | | | | | | |
| Ichor Holdings, Ltd. (a) | | | 10,000 | | | $ | 332,700 | |
| | | | | | | | | |
| Total Securities Sold Short (-0.3%) | | | | | | | | |
| (Proceeds $307,816) | | | | | | $ | 332,700 | |
| (a) | Non-income producing security. |
Distribution of investments by country or territory of incorporation, as a percentage of Total Securities Sold Short, is as follows (Unaudited):
| Country | | Short
| |
| United States | | | 100.0 | % | |
| Total | | | 100.0 | % | |
See accompanying notes to financial statements.
Needham Funds
Statements of Assets and Liabilities
December 31, 2019
| | | | | | Needham | | | Needham | |
| | | Needham | | | Aggressive | | | Small Cap | |
| | | Growth Fund | | | Growth Fund | | | Growth Fund | |
| Assets | | | | | | | | | |
Investments, at Value: | | | | | | | | | |
Unaffiliated securities, | | | | | | | | | |
(Cost $46,018,350, $23,751,459, $120,471,230) | | $ | 110,728,265 | | | $ | 53,998,706 | | | $ | 128,586,693 | |
Affiliated securities (Cost $—, $1,981,235, $—) | | | — | | | | 1,736,831 | | | | — | |
Cash | | | 166,215 | | | | 496,200 | | | | — | |
Receivables: | | | | | | | | | | | | |
| Deposit with Broker for Securities Sold Short | | | 810,480 | | | | 282,615 | | | | 368,091 | |
| Dividends and Interest | | | 43,440 | | | | 22,233 | | | | 45,342 | |
| Fund Shares Sold | | | 22,262 | | | | 54,931 | | | | 6,669,995 | |
| Investment Securities Sold | | | 6,390 | | | | — | | | | 73,490 | |
Prepaid Expenses | | | 49,638 | | | | 16,870 | | | | 31,418 | |
| Total Assets | | | 111,826,690 | | | | 56,608,386 | | | | 135,775,029 | |
| | | | | | | | | | | | | |
| Liabilities | | | | | | | | | | | | |
Securities Sold Short, at Value | | | | | | | | | | | | |
(Proceeds $240,455, $74,836, $307,816) | | | 747,850 | | | | 256,337 | | | | 332,700 | |
Payables: | | | | | | | | | | | | |
| Investment Securities Purchased | | | 290,707 | | | | 153,029 | | | | 3,028,943 | |
| Fund Shares Redeemed | | | 71,820 | | | | 11,622 | | | | 167,758 | |
| Due to Adviser | | | 98,286 | | | | 54,342 | | | | 65,211 | |
| Due to Custodian | | | 2,885 | | | | 2,068 | | | | 1,937 | |
| Distribution Fees | | | 14,180 | | | | 6,559 | | | | 8,687 | |
| Administration and Accounting Fees | | | 30,056 | | | | 15,298 | | | | 14,571 | |
| Transfer Agent Fees | | | 12,574 | | | | 7,699 | | | | 5,859 | |
| Audit Fees | | | 34,643 | | | | 22,679 | | | | 19,399 | |
Accrued Expenses and Other Liabilities | | | 38,433 | | | | 19,028 | | | | 20,100 | |
| Total Liabilities | | | 1,341,434 | | | | 548,661 | | | | 3,665,165 | |
| Total Net Assets | | $ | 110,485,256 | | | $ | 56,059,725 | | | $ | 132,109,864 | |
See accompanying notes to financial statements.
Annual Report 2019
Statements of Assets and Liabilities (Continued)
December 31, 2019
| | | | | | Needham | | | Needham | |
| | | Needham | | | Aggressive | | | Small Cap | |
| | | Growth Fund | | | Growth Fund | | | Growth Fund | |
| Retail Class Shares | | | | | | | | | |
| Net Assets | | $ | 65,526,301 | | | $ | 30,238,497 | | | $ | 85,520,565 | |
Shares Issued and Outstanding | | | | | | | | | | | | |
$0.001 Par Value (Authorized | | | | | | | | | | | | |
800,000,000,100,000,000 and | | | | | | | | | | | | |
100,000,000 respectively) | | | 1,560,441 | | | | 1,388,821 | | | | 4,862,119 | |
| Net Asset Value and | | | | | | | | | | | | |
| Offering Price Per Share | | $ | 41.99 | | | $ | 21.77 | | | $ | 17.59 | |
| | | | | | | | | | | | | |
| Institutional Class Shares | | | | | | | | | | | | |
| Net Assets | | $ | 44,958,955 | | | $ | 25,821,228 | | | $ | 46,589,299 | |
Shares Issued and Outstanding | | | | | | | | | | | | |
$0.001 Par Value (Authorized | | | | | | | | | | | | |
800,000,000,100,000,000 and | | | | | | | | | | | | |
100,000,000 respectively) | | | 1,049,607 | | | | 1,161,440 | | | | 2,593,447 | |
| Net Asset Value and | | | | | | | | | | | | |
| Offering Price Per Share | | $ | 42.83 | | | $ | 22.23 | | | $ | 17.96 | |
| | | | | | | | | | | | | |
| Components of Net Assets | | | | | | | | | | | | |
Paid in Capital | | | 43,281,889 | | | | 26,244,186 | | | | 121,878,212 | |
Distributable Earnings | | | 67,203,367 | | | | 29,815,539 | | | | 10,231,652 | |
| Total Net Assets | | $ | 110,485,256 | | | $ | 56,059,725 | | | $ | 132,109,864 | |
See accompanying notes to financial statements.
Needham Funds
Statements of Operations
For the year ended December 31, 2019
| | | | | | Needham | | | Needham | |
| | | Needham | | | Aggressive | | | Small Cap | |
| | | Growth Fund | | | Growth Fund | | | Growth Fund | |
| Investment Income | | | | | | | | | |
Dividend Income from unaffiliated securities (net of | | | | | | | | | |
foreign withholding tax of $3,883, $2,974, $743) | | $ | 697,345 | | | $ | 250,888 | | | $ | 64,163 | |
Interest Income | | | 47,014 | | | | 6,969 | | | | 141,346 | |
| Total Investment Income | | | 744,359 | | | | 257,857 | | | | 205,509 | |
| | | | | | | | | | | | | |
| Expenses | | | | | | | | | | | | |
Investment Advisory Fees | | | 1,201,619 | | | | 574,866 | | | | 507,282 | |
Distribution Fees | | | 149,317 | | | | 71,136 | | | | 50,032 | |
Administration and Accounting Fees | | | 116,385 | | | | 66,909 | | | | 55,906 | |
Audit Fees | | | 52,932 | | | | 34,416 | | | | 30,133 | |
Chief Compliance Officer Fees | | | 18,859 | | | | 10,443 | | | | 8,920 | |
Custodian Fees | | | 13,657 | | | | 9,968 | | | | 8,267 | |
Directors’ Fees | | | 18,756 | | | | 8,212 | | | | 6,103 | |
Dividend Expense(1) | | | 17,125 | | | | 6,858 | | | | 500 | |
Registration Fees | | | 32,275 | | | | 47,524 | | | | 31,552 | |
Interest Expense(1) | | | 14,161 | | | | 23,940 | | | | — | |
Legal Fees | | | 96,032 | | | | 43,363 | | | | 53,454 | |
Printing Fees | | | 9,052 | | | | 6,009 | | | | 3,968 | |
Transfer Agent Fees | | | 58,969 | | | | 31,044 | | | | 23,926 | |
Other Expenses | | | 30,938 | | | | 16,699 | | | | 11,455 | |
| Total Expenses | | | 1,830,077 | | | | 951,387 | | | | 791,498 | |
| Fees Waived by Investment Adviser | | | (124,477 | ) | | | (122,828 | ) | | | (165,856 | ) |
| Fees Recaptured by Investment Adviser | | | — | | | | 2,588 | | | | — | |
| Net Expenses | | | 1,705,600 | | | | 831,147 | | | | 625,642 | |
| Net Investment Loss | | | (961,241 | ) | | | (573,290 | ) | | | (420,133 | ) |
| | | | | | | | | | | | | |
| Net Realized / Unrealized Gain (Loss) from | | | | | | | | | | | | |
| Affiliated and Unaffiliated Securities, Securities | | | | | | | | | | | | |
| Sold Short and Foreign Currency Transactions (Note 3) | | | | | | | | | | | | |
Net Realized Gain from Unaffiliated Securities | | | 12,685,986 | | | | 6,979,938 | | | | 7,019,225 | |
Net Realized Loss from Affiliated Securities | | | — | | | | (144,873 | ) | | | — | |
Net Realized Gain from Long-Term | | | | | | | | | | | | |
Capital Gains Distributions Received | | | — | | | | — | | | | 48,375 | |
Net Realized Loss from Securities Sold Short | | | (5,809,617 | ) | | | (3,081,573 | ) | | | (69,400 | ) |
Change in Unrealized Appreciation on | | | | | | | | | | | | |
Unaffiliated Securities and Securities Sold Short | | | 27,738,179 | | | | 13,901,789 | | | | 10,435,264 | |
Change in Unrealized Depreciation on | | | | | | | | | | | | |
Affiliated Securities and Securities Sold Short | | | — | | | | (317,286 | ) | | | — | |
| Net Realized / Unrealized Gain (Loss) from Affiliated | | | | | | | | | | | | |
| and Unaffiliated Securities, Securities Sold Short, | | | | | | | | | | | | |
| Foreign Currency Translations (Note 3) | | | 34,614,548 | | | | 17,337,995 | | | | 17,433,464 | |
| Change in Net Assets Resulting from Operations | | $ | 33,653,307 | | | $ | 16,764,705 | | | $ | 17,013,331 | |
(1) | Expense related to securities sold short. |
See accompanying notes to financial statements.
Annual Report 2019
Needham Growth Fund
Statements of Changes in Net Assets
| | | Year Ended | | | Year Ended | |
| | | December 31, 2019 | | | December 31, 2018 | |
| Change in Net Assets | | | | | | |
| Operations: | | | | | | |
Net Investment Loss | | $ | (961,241 | ) | | $ | (1,955,502 | ) |
Net Realized Gain from Securities, Securities Sold Short, | | | | | | | | |
Foreign Currency Transactions, and Currency | | | 6,876,369 | | | | 13,196,649 | |
Net Change in Unrealized Appreciation (Depreciation) on | | | | | | | | |
Investments, Securities Sold Short, Foreign Currency Translations | | | 27,738,179 | | | | (20,652,199 | ) |
| Change in Net Assets Resulting from Operations | | | 33,653,307 | | | | (9,411,052 | ) |
| | | | | | | | | |
| Distributions to Shareholders from: | | | | | | | | |
Distributable Earnings | | | (11,150,898 | ) | | | (13,467,264 | ) |
| | | | | | | | | |
| Capital Transactions: | | | | | | | | |
| Retail Class: | | | | | | | | |
| Shares Issued | | | 2,797,341 | | | | 819,983 | |
| Shares Issued in Reinvestment of Distribution | | | 6,238,725 | | | | 8,154,389 | |
| Shares Exchanged for Institutional Class Shares | | | (609,257 | ) | | | (3,993,084 | ) |
| Shares Redeemed | | | (11,380,847 | ) | | | (14,136,166 | ) |
| Institutional Class: | | | | | | | | |
| Shares Issued | | | 5,618,710 | | | | 849,415 | |
| Shares Issued in Reinvestment of Distribution | | | 4,144,602 | | | | 4,391,658 | |
| Shares Issued in Exchange for Retail Class Shares | | | 609,257 | | | | 3,993,084 | |
| Shares Redeemed | | | (2,829,421 | ) | | | (4,297,069 | ) |
Total Change in Net Assets from Capital Transactions | | | 4,589,110 | | | | (4,217,790 | ) |
| | | | | | | | | |
| Change in Net Assets | | | 27,091,519 | | | | (27,096,106 | ) |
| | | | | | | | | |
| Total Net Assets | | | | | | | | |
Beginning of Year | | | 83,393,737 | | | | 110,489,843 | |
End of Year | | $ | 110,485,256 | | | $ | 83,393,737 | |
| | | | | | | | | |
| Share Transaction: | | | | | | | | |
| Retail Class: | | | | | | | | |
| Number of Shares Issued | | | 66,920 | | | | 19,432 | |
| Number of Shares Reinvested | | | 157,823 | | | | 228,927 | |
| Number of Shares Exchanged for Institutional Class Shares | | | (16,407 | ) | | | (88,717 | ) |
| Number of Shares Redeemed | | | (289,538 | ) | | | (336,013 | ) |
Change in Retail Class Shares | | | (81,202 | ) | | | (176,371 | ) |
| Institutional Class: | | | | | | | | |
| Number of Shares Issued | | | 130,488 | | | | 20,085 | |
| Number of Shares Reinvested | | | 102,869 | | | | 121,889 | |
| Number of Shares Issued in Exchange for Retail Class Shares | | | 16,181 | | | | 88,007 | |
| Number of Shares Redeemed | | | (71,300 | ) | | | (111,309 | ) |
Change in Institutional Class Shares | | | 178,238 | | | | 118,672 | |
| Total Change in Shares | | | 97,036 | | | | (57,699 | ) |
See accompanying notes to financial statements.
Needham Funds
Needham Aggressive Growth Fund
Statements of Changes in Net Assets
| | | Year Ended | | | Year Ended | |
| | | December 31, 2019 | | | December 31, 2018 | |
| Change in Net Assets | | | | | | |
| Operations: | | | | | | |
Net Investment Loss | | $ | (573,290 | ) | | $ | (1,231,378 | ) |
Net Realized Gain from Securities, Securities Sold Short, | | | | | | | | |
Foreign Currency Transactions, and Currency | | | 3,753,492 | | | | 8,651,884 | |
Net Change in Unrealized Appreciation (Depreciation) on | | | | | | | | |
Investments, Securities Sold Short, Foreign Currency Translations | | | 13,584,503 | | | | (15,384,172 | ) |
| Change in Net Assets Resulting from Operations | | | 16,764,705 | | | | (7,963,666 | ) |
| | | | | | | | | |
| Distributions to Shareholders from: | | | | | | | | |
Distributable Earnings | | | (4,975,386 | ) | | | (6,200,868 | ) |
| | | | | | | | | |
| Capital Transactions: | | | | | | | | |
| Retail Class: | | | | | | | | |
| Shares Issued | | | 1,808,099 | | | | 1,299,673 | |
| Shares Issued in Reinvestment of Distribution | | | 2,926,680 | | | | 4,037,862 | |
| Shares Exchanged for Institutional Class Shares | | | (1,367,428 | ) | | | (1,302,417 | ) |
| Shares Redeemed | | | (7,657,411 | ) | | | (8,767,504 | ) |
| Institutional Class: | | | | | | | | |
| Shares Issued | | | 6,220,562 | | | | 2,354,427 | |
| Shares Issued in Reinvestment of Distribution | | | 2,002,195 | | | | 2,069,912 | |
| Shares Issued in Exchange for Retail Class Shares | | | 1,367,428 | | | | 1,302,417 | |
| Shares Redeemed | | | (1,627,132 | ) | | | (7,780,135 | ) |
Total Change in Net Assets from Capital Transactions | | | 3,672,993 | | | | (6,785,765 | ) |
| | | | | | | | | |
| Change in Net Assets | | | 15,462,312 | | | | (20,950,299 | ) |
| | | | | | | | | |
| Total Net Assets | | | | | | | | |
Beginning of Year | | | 40,597,413 | | | | 61,547,712 | |
End of Year | | $ | 56,059,725 | | | $ | 40,597,413 | |
| | | | | | | | | |
| Share Transaction: | | | | | | | | |
| Retail Class: | | | | | | | | |
Number of Shares Issued | | | 85,672 | | | | 56,865 | |
Number of Shares Reinvested | | | 144,885 | | | | 219,927 | |
Number of Shares Exchanged for Institutional Class Shares | | | (68,640 | ) | | | (55,934 | ) |
Number of Shares Redeemed | | | (381,645 | ) | | | (393,860 | ) |
Change in Retail Class Shares | | | (219,728 | ) | | | (173,002 | ) |
| Institutional Class: | | | | | | | | |
Number of Shares Issued | | | 286,847 | | | | 103,957 | |
Number of Shares Reinvested | | | 97,147 | | | | 111,345 | |
Number of Shares Issued in Exchange for Retail Class Shares | | | 67,464 | | | | 52,355 | |
Number of Shares Redeemed | | | (78,919 | ) | | | (359,268 | ) |
Change in Institutional Class Shares | | | 372,539 | | | | (91,611 | ) |
| Total Change in Shares | | | 152,811 | | | | (264,613 | ) |
See accompanying notes to financial statements.
Annual Report 2019
Needham Small Cap Growth Fund
Statements of Changes in Net Assets
| | | Year Ended | | | Year Ended | |
| | | December 31, 2019 | | | December 31, 2018 | |
| Change in Net Assets | | | | | | |
| Operations: | | | | | | |
Net Investment Loss | | $ | (420,133 | ) | | $ | (308,285 | ) |
Net Realized Gain from Securities, Securities Sold Short, | | | | | | | | |
Foreign Currency Transactions, and Currency | | | 6,998,200 | | | | 5,382,884 | |
Net Change in Unrealized Appreciation (Depreciation) on | | | | | | | | |
Investments, Securities Sold Short, Foreign Currency Translations | | | 10,435,265 | | | | (6,218,661 | ) |
| Change in Net Assets Resulting from Operations | | | 17,013,331 | | | | (1,144,062 | ) |
| | | | | | | | | |
| Distributions to Shareholders from: | | | | | | | | |
Distributable Earnings | | | (4,004,063 | ) | | | (5,214,199 | ) |
| | | | | | | | | |
| Capital Transactions: | | | | | | | | |
| Retail Class: | | | | | | | | |
| Shares Issued | | | 70,656,572 | | | | 2,080,595 | |
| Shares Issued in Reinvestment of Distribution | | | 2,044,608 | | | | 2,958,778 | |
| Shares Exchanged for Institutional Class Shares | | | (167,969 | ) | | | (513,300 | ) |
| Shares Redeemed | | | (5,572,277 | ) | | | (7,736,681 | ) |
| Redemption Fees | | | — | | | | 82 | |
| Institutional Class: | | | | | | | | |
| Shares Issued | | | 28,146,610 | | | | 4,684,908 | |
| Shares Issued in Reinvestment of Distribution | | | 1,902,565 | | | | 2,178,089 | |
| Shares Issued in Exchange for Retail Class Shares | | | 167,969 | | | | 513,300 | |
| Shares Redeemed | | | (2,731,986 | ) | | | (2,795,178 | ) |
| Redemption Fees | | | — | | | | — | |
Total Change in Net Assets from Capital Transactions | | | 94,446,092 | | | | 1,370,593 | |
| | | | | | | | | |
| Change in Net Assets | | | 107,455,360 | | | | (4,987,668 | ) |
| | | | | | | | | |
| Total Net Assets | | | | | | | | |
Beginning of Year | | | 24,654,504 | | | | 29,642,172 | |
End of Year | | $ | 132,109,864 | | | $ | 24,654,504 | |
| | | | | | | | | |
| Share Transaction: | | | | | | | | |
| Retail Class: | | | | | | | | |
Number of Shares Issued | | | 4,096,204 | | | | 129,771 | |
Number of Shares Reinvested | | | 122,432 | | | | 213,939 | |
Number of Shares Exchanged for Institutional Class Shares | | | (10,353 | ) | | | (31,379 | ) |
Number of Shares Redeemed | | | (352,870 | ) | | | (538,198 | ) |
Change in Retail Class Shares | | | 3,855,413 | | | | (225,867 | ) |
| Institutional Class: | | | | | | | | |
Number of Shares Issued | | | 1,668,920 | | | | 321,658 | |
Number of Shares Reinvested | | | 111,653 | | | | 155,578 | |
Number of Shares Issued in Exchange for Retail Class Shares | | | 10,176 | | | | 31,112 | |
Number of Shares Redeemed | | | (165,549 | ) | | | (195,266 | ) |
Change in Institutional Class Shares | | | 1,625,200 | | | | 313,082 | |
| Total Change in Shares | | | 5,480,613 | | | | 87,215 | |
See accompanying notes to financial statements.
Needham Funds
Needham Growth Fund
Financial Highlights
| | | Retail Class | |
| (For a Share Outstanding | | Year Ended December 31, | |
| Throughout each Year) | | 2019 | | | 2018 | | | 2017 | | | 2016 | | | 2015 | |
| Net Asset Value, Beginning of Year | | $ | 33.04 | | | $ | 42.91 | | | $ | 43.40 | | | $ | 40.96 | | | $ | 46.00 | |
| Investment Operations | | | | | | | | | | | | | | | | | | | | |
| Net Investment Income (Loss) | | | (0.48 | ) | | | (0.88 | ) | | | (0.78 | ) | | | (0.59 | ) | | | (0.68 | ) |
| Net Realized and Unrealized | | | | | | | | | | | | | | | | | | | | |
| Gain (Loss) on Investments | | | 14.18 | | | | (3.11 | ) | | | 4.45 | | | | 4.86 | | | | (1.60 | ) |
| Total from Investment Operations | | | 13.70 | | | | (3.99 | ) | | | 3.67 | | | | 4.27 | | | | (2.28 | ) |
| | | | | | | | | | | | | | | | | | | | | |
| Less Distributions | | | | | | | | | | | | | | | | | | | | |
| Net Realized Gains | | | (4.75 | ) | | | (5.88 | ) | | | (4.16 | ) | | | (1.83 | ) | | | (2.76 | ) |
| Total Distributions | | | (4.75 | ) | | | (5.88 | ) | | | (4.16 | ) | | | (1.83 | ) | | | (2.76 | ) |
| | | | | | | | | | | | | | | | | | | | | |
| Capital Contributions | | | | | | | | | | | | | | | | | | | | |
| Redemption Fees | | | — | | | | — | | | | — | (1) | | | — | (1) | | | — | (1) |
| Total Capital Contributions | | | — | | | | — | | | | — | (1) | | | — | (1) | | | — | (1) |
| Net Asset Value, End of Year | | $ | 41.99 | | | $ | 33.04 | | | $ | 42.91 | | | $ | 43.40 | | | $ | 40.96 | |
| | | | | | | | | | | | | | | | | | | | | |
| Total Return | | | 42.31 | %(2) | | | (10.26 | )% | | | 8.32 | % | | | 10.57 | % | | | (5.07 | )% |
| Net Assets, End of Year (000’s) | | $ | 65,526 | | | $ | 54,245 | | | $ | 78,014 | | | $ | 119,117 | | | $ | 127,154 | |
| Ratios/Supplemental Data | | | | | | | | | | | | | | | | | | | | |
| Ratio of Net Expenses to | | | | | | | | | | | | | | | | | | | | |
| Average Net Assets | | | 1.98 | % | | | 2.76 | % | | | 2.34 | % | | | 2.17 | % | | | 2.05 | % |
| Ratio of Net Expenses to Average | | | | | | | | | | | | | | | | | | | | |
| Net Assets (before interest | | | | | | | | | | | | | | | | | | | | |
| and dividend expense) | | | 1.95 | % | | | 1.92 | % | | | 1.90 | % | | | 1.84 | % | | | 1.82 | % |
| Ratio of Total Expenses to Average | | | | | | | | | | | | | | | | | | | | |
| Net Assets (before waiver and | | | | | | | | | | | | | | | | | | | | |
| reimbursement of expenses) | | | 2.01 | % | | | 2.76 | % | | | 2.34 | % | | | 2.17 | % | | | 2.05 | % |
| Ratio of Net Investment Income | | | | | | | | | | | | | | | | | | | | |
| (Loss) to Average Net Assets | | | (1.21 | )% | | | (2.07 | )% | | | (1.73 | )% | | | (1.36 | )% | | | (1.48 | )% |
| Ratio of Net Investment Loss to | | | | | | | | | | | | | | | | | | | | |
| Average Net Assets (before waivers | | | | | | | | | | | | | | | | | | | | |
| and reimbursements of expenses) | | | (1.24 | )% | | | (2.07 | )% | | | (1.73 | )% | | | (1.36 | )% | | | (1.48 | )% |
| Portfolio turnover rate | | | 13 | % | | | 8 | % | | | 9 | % | | | 12 | % | | | 13 | % |
| | | | | | | | | | | | | | | | | | | | | |
(1) | Value is less than $0.005 per share. |
(2) | The return reflects the actual performance for the year and does not include the impact of any adjustments made for financial reporting required by Generally Accepted Accounting Principles (GAAP). |
See accompanying notes to financial statements.
Annual Report 2019
Needham Growth Fund
Financial Highlights
| | | Institutional Class | |
| | | | | | | | | | | | Period from | |
| | | | | | | | | | | | December 30, | |
| | | | | | | | | | | | 2016 | |
| | | Year Ended | | | Year Ended | | | Year Ended | | | through | |
| (For a Share Outstanding | | December 31, | | | December 31, | | | December 31, | | | December 31, | |
| Throughout each Period/Year) | | 2019 | | | 2018 | | | 2017 | | | 2016(1) | |
| Net Asset Value, Beginning of Period/Year | | $ | 33.45 | | | $ | 43.15 | | | $ | 43.40 | | | $ | 43.40 | |
| Investment Operations | | | | | | | | | | | | | | | | |
| Net Investment Loss | | | (0.26 | ) | | | (0.65 | ) | | | (0.56 | ) | | | — | |
| Net Realized and Unrealized | | | | | | | | | | | | | | | | |
| Gain (Loss) on Investments | | | 14.39 | | | | (3.17 | ) | | | 4.47 | | | | — | |
| Total from Investment Operations | | | 14.13 | | | | (3.82 | ) | | | 3.91 | | | | — | |
| | | | | | | | | | | | | | | | | |
| Less Distributions | | | | | | | | | | | | | | | | |
| Net Realized Gains | | | (4.75 | ) | | | (5.88 | ) | | | (4.16 | ) | | | — | |
| Total Distributions | | | (4.75 | ) | | | (5.88 | ) | | | (4.16 | ) | | | — | |
| Net Asset Value, End of Period/Year | | $ | 42.83 | | | $ | 33.45 | | | $ | 43.15 | | | $ | 43.40 | |
| | | | | | | | | | | | | | | | | |
| Total Return | | | 43.13 | % | | | (9.83 | )% | | | 8.89 | % | | | 0.00 | % |
| Net Assets, End of Period/Year (000’s) | | $ | 44,959 | | | $ | 29,149 | | | $ | 32,476 | | | $ | 117 | |
| Ratios/Supplemental Data | | | | | | | | | | | | | | | | |
| Ratio of Net Expenses to | | | | | | | | | | | | | | | | |
| Average Net Assets | | | 1.43 | % | | | 2.21 | % | | | 1.90 | % | | | 1.40 | % |
| Ratio of Net Expenses to Average Net Assets | | | | | | | | | | | | | | | | |
| (before interest and dividend expense) | | | 1.40 | % | | | 1.40 | % | | | 1.40 | % | | | 1.40 | % |
| Ratio of Total Expenses to Average Net Assets | | | | | | | | | | | | | | | | |
| (before waiver and reimbursement of expenses) | | | 1.73 | % | | | 2.48 | % | | | 2.15 | % | | | — | %(2) |
| Ratio of Net Investment Loss to | | | | | | | | | | | | | | | | |
| Average Net Assets | | | (0.65 | )% | | | (1.52 | )% | | | (1.24 | )% | | | — | %(2) |
| Ratio of Net Investment Loss to | | | | | | | | | | | | | | | | |
| Average Net Assets (before waivers | | | | | | | | | | | | | | | | |
| and reimbursements of expenses) | | | (0.95 | )% | | | (1.79 | )% | | | (1.49 | )% | | | — | %(2) |
| Portfolio turnover rate | | | 13 | % | | | 8 | % | | | 9 | % | | | 0 | % |
(1) | The Class commenced operations on December 30, 2016. |
(2) | Refer to Note 2 for further description of non-recurring charges related to the issuance of the share class. |
See accompanying notes to financial statements.
Needham Funds
Needham Aggressive Growth Fund
Financial Highlights
| | | Retail Class | |
| (For a Share Outstanding | | Year Ended December 31, | |
| Throughout each Year) | | 2019 | | | 2018 | | | 2017 | | | 2016 | | | 2015 | |
| Net Asset Value, Beginning of Year | | $ | 16.86 | | | $ | 23.07 | | | $ | 22.29 | | | $ | 19.56 | | | $ | 23.55 | |
| Investment Operations | | | | | | | | | | | | | | | | | | | | |
| Net Investment Loss | | | (0.30 | ) | | | (0.54 | ) | | | (0.49 | ) | | | (0.38 | ) | | | (0.39 | ) |
| Net Realized and Unrealized | | | | | | | | | | | | | | | | | | | | |
| Gain (Loss) on Investments | | | 7.53 | | | | (2.88 | ) | | | 2.46 | | | | 4.61 | | | | (1.28 | ) |
| Total from Investment Operations | | | 7.23 | | | | (3.42 | ) | | | 1.97 | | | | 4.23 | | | | (1.67 | ) |
| | | | | | | | | | | | | | | | | | | | | |
| Less Distributions | | | | | | | | | | | | | | | | | | | | |
| Net Realized Gains | | | (2.32 | ) | | | (2.79 | ) | | | (1.19 | ) | | | (1.50 | ) | | | (2.32 | ) |
| Total Distributions | | | (2.32 | ) | | | (2.79 | ) | | | (1.19 | ) | | | (1.50 | ) | | | (2.32 | ) |
| | | | | | | | | | | | | | | | | | | | | |
| Capital Contributions | | | | | | | | | | | | | | | | | | | | |
| Redemption Fees | | | — | | | | — | | | | — | (1) | | | — | (1) | | | — | (1) |
| Total Capital Contributions | | | — | | | | — | | | | — | (1) | | | — | (1) | | | — | (1) |
| Net Asset Value, End of Year | | | 21.77 | | | $ | 16.86 | | | $ | 23.07 | | | $ | 22.29 | | | $ | 19.56 | |
| | | | | | | | | | | | | | | | | | | | | |
| Total Return | | | 43.93 | % | | | (15.80 | )% | | | 8.73 | % | | | 22.18 | % | | | (7.09 | )%(2) |
| Net Assets, End of Year (000’s) | | $ | 30,238 | | | $ | 27,119 | | | $ | 41,107 | | | $ | 58,696 | | | $ | 50,906 | |
| Ratios/Supplemental Data | | | | | | | | | | | | | | | | | | | | |
| Ratio of Net Expenses to | | | | | | | | | | | | | | | | | | | | |
| Average Net Assets | | | 2.02 | % | | | 2.91 | % | | | 2.63 | % | | | 2.71 | % | | | 2.41 | % |
| Ratio of Net Expenses to Average | | | | | | | | | | | | | | | | | | | | |
| Net Assets (before interest | | | | | | | | | | | | | | | | | | | | |
| and dividend expense) | | | 1.95 | % | | | 1.95 | % | | | 1.95 | % | | | 1.95 | % | | | 1.93 | % |
| Ratio of Total Expenses to Average | | | | | | | | | | | | | | | | | | | | |
| Net Assets (before waiver and | | | | | | | | | | | | | | | | | | | | |
| reimbursement of expenses) | | | 2.17 | % | | | 2.97 | % | | | 2.65 | % | | | 2.72 | % | | | 2.42 | % |
| Ratio of Net Investment Loss | | | | | | | | | | | | | | | | | | | | |
| to Average Net Assets | | | (1.46 | )% | | | (2.40 | )% | | | (2.12 | )% | | | (1.99 | )% | | | (1.73 | )% |
| Ratio of Net Investment Loss to | | | | | | | | | | | | | | | | | | | | |
| Average Net Assets (before waivers | | | | | | | | | | | | | | | | | | | | |
| and reimbursements of expenses) | | | (1.61 | )% | | | (2.46 | )% | | | (2.14 | )% | | | (2.00 | )% | | | (1.74 | )% |
| Portfolio turnover rate | | | 9 | % | | | 8 | % | | | 15 | % | | | 14 | % | | | 15 | % |
(1) | Value is less than $0.005 per share. |
(2) | The return reflects the actual performance for the year and does not include the impact of any adjustments made for financial reporting required by Generally Accepted Accounting Principles (GAAP). |
See accompanying notes to financial statements.
Annual Report 2019
Needham Aggressive Growth Fund
Financial Highlights
| | | Institutional Class | |
| | | | | | | | | | | | Period from | |
| | | | | | | | | | | | December 30, | |
| | | | | | | | | | | | 2016 | |
| | | Year Ended | | | Year Ended | | | Year Ended | | | through | |
| (For a Share Outstanding | | December 31, | | | December 31, | | | December 31, | | | December 31, | |
| Throughout each Period/Year) | | 2019 | | | 2018 | | | 2017 | | | 2016(1) | |
| Net Asset Value, Beginning of Period/Year | | $ | 17.08 | | | $ | 23.21 | | | $ | 22.29 | | | $ | 22.29 | |
| Investment Operations | | | | | | | | | | | | | | | | |
| Net Investment Loss | | | (0.19 | ) | | | (0.42 | ) | | | (0.39 | ) | | | — | |
| Net Realized and Unrealized | | | | | | | | | | | | | | | | |
| Gain (Loss) on Investments | | | 7.66 | | | | (2.92 | ) | | | 2.50 | | | | — | |
| Total from Investment Operations | | | 7.47 | | | | (3.34 | ) | | | 2.11 | | | | — | |
| | | | | | | | | | | | | | | | | |
| Less Distributions | | | | | | | | | | | | | | | | |
| Net Realized Gains | | | (2.32 | ) | | | (2.79 | ) | | | (1.19 | ) | | | — | |
| Total Distributions | | | (2.32 | ) | | | (2.79 | ) | | | (1.19 | ) | | | — | |
| Net Asset Value, End of Period/Year | | $ | 22.23 | | | $ | 17.08 | | | $ | 23.21 | | | $ | 22.29 | |
| | | | | | | | | | | | | | | | | |
| Total Return | | | 44.79 | % | | | (15.36 | )% | | | 9.36 | % | | | 0.00 | % |
| Net Assets, End of Period/Year (000’s) | | $ | 25,821 | | | $ | 13,478 | | | $ | 20,441 | | | $ | 162 | |
| Ratios/Supplemental Data | | | | | | | | | | | | | | | | |
| Ratio of Net Expenses to | | | | | | | | | | | | | | | | |
| Average Net Assets | | | 1.46 | % | | | 2.35 | % | | | 2.22 | % | | | 1.40 | % |
| Ratio of Net Expenses to Average Net Assets | | | | | | | | | | | | | | | | |
| (before interest and dividend expense) | | | 1.40 | % | | | 1.40 | % | | | 1.40 | % | | | 1.40 | % |
| Ratio of Total Expenses to Average Net Assets | | | | | | | | | | | | | | | | |
| (before waiver and reimbursement of expenses) | | | 1.90 | % | | | 2.79 | % | | | 2.64 | % | | | — | %(2) |
| Ratio of Net Investment Loss to | | | | | | | | | | | | | | | | |
| Average Net Assets | | | (0.90 | )% | | | (1.84 | )% | | | (1.69 | )% | | | — | %(2) |
| Ratio of Net Investment Loss to | | | | | | | | | | | | | | | | |
| Average Net Assets (before waivers | | | | | | | | | | | | | | | | |
| and reimbursements of expenses) | | | (1.34 | )% | | | (2.28 | )% | | | (2.11 | )% | | | — | %(2) |
| Portfolio turnover rate | | | 9 | % | | | 8 | % | | | 15 | % | | | 0 | % |
(1) | The Class commenced operations on December 30, 2016. |
(2) | Refer to Note 2 for further description of non-recurring charges related to the issuance of the share class. |
See accompanying notes to financial statements.
Needham Funds
Needham Small Cap Growth Fund
Financial Highlights
| | | Retail Class | |
| (For a Share Outstanding | | Year Ended December 31, | |
| Throughout each Year) | | 2019 | | | 2018 | | | 2017 | | | 2016 | | | 2015 | |
| Net Asset Value, Beginning of Year | | $ | 12.40 | | | $ | 15.67 | | | $ | 15.25 | | | $ | 12.44 | | | $ | 14.01 | |
| Investment Operations | | | | | | | | | | | | | | | | | | | | |
| Net Investment Loss | | | (0.22 | ) | | | (0.19 | ) | | | (0.18 | ) | | | (0.20 | ) | | | (0.24 | ) |
| Net Realized and Unrealized | | | | | | | | | | | | | | | | | | | | |
| Gain (Loss) on Investments | | | 6.89 | | | | (0.32 | ) | | | 1.99 | | | | 4.03 | | | | (1.02 | ) |
| Total from Investment Operations | | | 6.67 | | | | (0.51 | ) | | | 1.81 | | | | 3.83 | | | | (1.26 | ) |
| | | | | | | | | | | | | | | | | | | | | |
| Less Distributions | | | | | | | | | | | | | | | | | | | | |
| Net Realized Gains | | | (1.48 | ) | | | (2.76 | ) | | | (1.40 | ) | | | (1.02 | ) | | | (0.31 | ) |
| Total Distributions | | | (1.48 | ) | | | (2.76 | ) | | | (1.40 | ) | | | (1.02 | ) | | | (0.31 | ) |
| | | | | | | | | | | | | | | | | | | | | |
| Capital Contributions | | | | | | | | | | | | | | | | | | | | |
| Redemption Fees | | | — | | | | — | (1) | | | 0.01 | | | | — | (1) | | | — | (1) |
| Total Capital Contributions | | | — | | | | — | (1) | | | 0.01 | | | | — | (1) | | | — | (1) |
| Net Asset Value, End of Year | | $ | 17.59 | | | $ | 12.40 | | | $ | 15.67 | | | $ | 15.25 | | | $ | 12.44 | |
| | | | | | | | | | | | | | | | | | | | | |
| Total Return | | | 54.45 | % | | | (5.13 | )%(3) | | | 11.88 | %(3) | | | 31.26 | % | | | (8.96 | )% |
| Net Assets, End of Year (000’s) | | $ | 85,521 | | | $ | 12,487 | | | $ | 19,317 | | | $ | 35,518 | | | $ | 23,473 | |
| Ratios/Supplemental Data | | | | | | | | | | | | | | | | | | | | |
| Ratio of Net Expenses to | | | | | | | | | | | | | | | | | | | | |
| Average Net Assets | | | 1.87 | % | | | 1.95 | % | | | 1.95 | % | | | 2.09 | % | | | 2.05 | % |
| Ratio of Net Expenses to Average | | | | | | | | | | | | | | | | | | | | |
| Net Assets (before interest | | | | | | | | | | | | | | | | | | | | |
| and dividend expense) | | | 1.87 | %(2) | | | 1.95 | % | | | 1.95 | % | | | 1.95 | % | | | 1.95 | % |
| Ratio of Total Expenses to Average | | | | | | | | | | | | | | | | | | | | |
| Net Assets (before waiver and | | | | | | | | | | | | | | | | | | | | |
| reimbursement of expenses) | | | 2.07 | % | | | 2.19 | % | | | 2.15 | % | | | 2.30 | % | | | 2.25 | % |
| Ratio of Net Investment Loss | | | | | | | | | | | | | | | | | | | | |
| to Average Net Assets | | | (1.36 | )% | | | (1.20 | )% | | | (1.14 | )% | | | (1.83 | )% | | | (1.61 | )% |
| Ratio of Net Investment Loss to | | | | | | | | | | | | | | | | | | | | |
| Average Net Assets (before waivers | | | | | | | | | | | | | | | | | | | | |
| and reimbursements of expenses) | | | (1.56 | )% | | | (1.44 | )% | | | (1.34 | )% | | | (2.04 | )% | | | (1.81 | )% |
| Portfolio turnover rate | | | 136 | % | | | 103 | % | | | 80 | % | | | 99 | % | | | 64 | % |
(1) | Value is less than $0.005 per share. |
(2) | Effective April 1, 2019, the Adviser has contractually agreed to waive its fee and, if necessary, reimburse the Fund until April 30, 2020 to the extent Total Annual Fund Operating Expenses exceed 1.85% of the average daily net assets of the Retail Class shares of the Fund. |
(3) | The return reflects the actual performance for the year and does not include the impact of any adjustments made for financial reporting required by Generally Accepted Accounting Principles (GAAP). |
See accompanying notes to financial statements.
Annual Rport 2019
Needham Small Cap Growth Fund
Financial Highlights
| | | Institutional Class | |
| | | | | | | | | | | | Period from | |
| | | | | | | | | | | | December 30, | |
| | | | | | | | | | | | 2016 | |
| | | Year Ended | | | Year Ended | | | Year Ended | | | through | |
| (For a Share Outstanding | | December 31, | | | December 31, | | | December 31, | | | December 31, | |
| Throughout each Period/Year) | | 2019 | | | 2018 | | | 2017 | | | 2016(1) | |
| Net Asset Value, Beginning of Period/Year | | $ | 12.57 | | | $ | 15.76 | | | $ | 15.25 | | | $ | 15.25 | |
| Investment Operations | | | | | | | | | | | | | | | | |
| Net Investment Loss | | | (0.12 | ) | | | (0.10 | ) | | | (0.07 | ) | | | — | |
| Net Realized and Unrealized | | | | | | | | | | | | | | | | |
| Gain (Loss) on Investments | | | 6.99 | | | | (0.33 | ) | | | 1.98 | | | | — | |
| Total from Investment Operations | | | 6.87 | | | | (0.43 | ) | | | 1.91 | | | | — | |
| | | | | | | | | | | | | | | | | |
| Less Distributions | | | | | | | | | | | | | | | | |
| Net Realized Gains | | | (1.48 | ) | | | (2.76 | ) | | | (1.40 | ) | | | — | |
| Total Distributions | | | (1.48 | ) | | | (2.76 | ) | | | (1.40 | ) | | | — | |
| Net Asset Value, End of Period/Year | | $ | 17.96 | | | $ | 12.57 | | | $ | 15.76 | | | $ | 15.25 | |
| | | | | | | | | | | | | | | | | |
| Total Return | | | 55.31 | % | | | (4.58 | )%(4) | | | 12.48 | %(4) | | | 0.00 | % |
| Net Assets, End of Period/Year (000’s) | | $ | 46,589 | | | $ | 12,168 | | | $ | 10,325 | | | $ | 140 | |
| Ratios/Supplemental Data | | | | | | | | | | | | | | | | |
| Ratio of Net Expenses to | | | | | | | | | | | | | | | | |
| Average Net Assets | | | 1.22 | % | | | 1.40 | % | | | 1.40 | % | | | 1.40 | % |
| Ratio of Net Expenses to Average Net Assets | | | | | | | | | | | | | | | | |
| (before interest and dividend expense) | | | 1.22 | %(3) | | | 1.40 | % | | | 1.40 | % | | | 1.40 | % |
| Ratio of Total Expenses to Average Net Assets | | | | | | | | | | | | | | | | |
| (before waiver and reimbursement of expenses) | | | 1.83 | % | | | 1.95 | % | | | 2.08 | % | | | — | %(2) |
| Ratio of Net Investment Loss | | | | | | | | | | | | | | | | |
| to Average Net Assets | | | (0.72 | )% | | | (0.65 | )% | | | (0.41 | )% | | | — | %(2) |
| Ratio of Net Investment Loss to | | | | | | | | | | | | | | | | |
| Average Net Assets (before waivers | | | | | | | | | | | | | | | | |
| and reimbursements of expenses) | | | (1.33 | )% | | | (1.21 | )% | | | (1.09 | )% | | | — | %(2) |
| Portfolio turnover rate | | | 136 | % | | | 103 | % | | | 80 | % | | | 0 | % |
| | | | | | | | | | | | | | | | | |
(1) | The Class commenced operations on December 30, 2016. |
(2) | Refer to Note 2 for further description of non-recurring charges related to the issuance of the share class. |
(3) | Effective April 1, 2019, the Adviser has contractually agreed to waive its fee and, if necessary, reimburse the Fund until April 30, 2020 to the extent Total Annual Fund Operating Expenses exceed 1.18% of the average daily net assets of the Institutional Class shares of the Fund. |
(4) | The return reflects the actual performance for the year and do not include the impact of any adjustments made for financial reporting required by Generally Accepted Accounting Principles (GAAP). |
See accompanying notes to financial statements.
Needham Funds
Notes to Financial Statements
December 31, 2019
Needham Growth Fund (“NGF”), Needham Aggressive Growth Fund (“NAGF”) and Needham Small Cap Growth Fund (“NSCGF”) (each, a “Portfolio” and collectively, the “Portfolios”), are portfolios of The Needham Funds, Inc. (the “Company”), which is registered under the Investment Company Act of 1940, as amended (the “1940 Act”), as an open-end management investment company. The Company was organized as a Maryland corporation on October 12, 1995. NGF, NAGF, and NSCGF each currently offer two classes, the Retail Class and the Institutional Class. The Institutional Class commenced operations on December 30, 2016.
Each Portfolio is an investment company and accordingly follows the investment company accounting and reporting guidance of the Financial Accounting Standards Board (“FASB”) Accounting Standards Codification Topic 946 “Financial Services – Investment Companies.”
| 2. | Class Specific Expenses |
Class level expenses are allocated daily to each class of shares based upon the ratio of net assets represented by each class as a percentage of the net assets of the Portfolio. Expenses deemed directly attributable to a class of shares are recorded by the specific class. Most Portfolio expenses are allocated by class based on relative net assets. Distribution Fees incurred in connection with the Company’s Amended and Restated Plan of Distribution Pursuant to Rule 12b-1 are expensed at 0.25% of average daily net assets of the Retail Class shares, and the specific amounts are detailed in Note 5.
Certain of the Ratios and Supplemental Data presented in the Financial Highlights of the Institutional Class as of December 31, 2016 include non-recurring charges related to the issuance of the class and are not meaningful.
| 3. | Significant Accounting Policies |
The following is a summary of significant accounting policies followed by the Company in the preparation of its financial statements. These policies are in conformity with accounting principles generally accepted in the United States of America (“GAAP”).
Security Valuation: Portfolio securities for which market quotations are readily available are stated at the last sale price reported by the principal exchange for the security as of the exchange’s close of business. Securities for which no sale has taken place during the day and securities which are not listed on an exchange are valued at the mean of the highest closing bid and lowest asked prices. Exchange traded options are valued at the last reported sale price on any exchange on which the option is principally traded. If no sales are reported on a particular day, the options will be valued at the mean between the highest closing bid and lowest asked prices across the exchanges where the option is traded. Non-exchange traded options will also be valued at the mean between the last bid and asked quotations. For options where market quotations are not readily available, value will be determined in accordance with the fair value procedures described below. All other securities and assets for which (a) market quotations are not readily available, such as in the case of a market or technical disruption that prevents the normal trading of a security held by a Portfolio, (b) market quotations are believed to be unrepresentative of fair market value, such as in the
Annual Report 2019
Notes to Financial Statements (Continued)
December 31, 2019
case of a thinly traded security, or (c) valuation is normally made at the last sale price on a foreign exchange and a significant event occurs after the close of that exchange but before the New York Stock Exchange closes, are valued at their fair value as determined in good faith by the Company’s Board of Directors (the “Board”) in accordance with Fair Value Procedures established by the Board. The Company’s Fair Value Procedures are implemented and monitored by a Fair Value Committee (the “Committee”) designated by the Board. When a security is valued in accordance with the Fair Value Procedures, the Committee determines a value after taking into consideration any relevant information that is reasonably available to the Committee. Some of the more common reasons that may necessitate that a security be valued pursuant to these Fair Value Procedures include, but are not limited to: the security’s trading has been halted or suspended; the security has been delisted from a national exchange; the security’s primary trading market is temporarily closed at a time when under normal conditions it would be open; or the security’s primary pricing source is not able or willing to provide a price. The securities of each Portfolio may also be valued on the basis of valuations provided by a pricing service approved by, or on behalf of, the Board.
Portfolio securities listed or traded on securities exchanges, including American Depositary Receipts (“ADRs”), are valued at the closing price on the exchange or system where the security is principally traded or at the NASDAQ Official Closing Price. If there have been no sales for that day on the exchange or system, a security is valued at the mean of the highest closing bid and lowest asked prices on the exchange or system where the security is principally traded.
The Portfolios did not value any securities in accordance with the Fair Value Procedures as of December 31, 2019.
Investment Transactions: Changes in holdings of portfolio securities for the Portfolios shall be reflected no later than in the first calculation on the first business day following the trade date for purposes of calculating each Portfolio’s daily net asset value per share. However, for financial reporting purposes, portfolio security transactions are reported on the trade date of the last business day of the reporting period. The cost (proceeds) of investments sold (bought to cover) is determined on a specific identification basis for the purpose of determining gains or losses on sales and buys to cover short positions. Dividend income, distributions to shareholders and dividend expense from securities sold short are recorded on the ex-dividend date. Interest income and interest expense from securities sold short is recorded on an accrual basis.
Foreign Currency: Foreign currency amounts are translated into U.S. dollars as follows: (i) assets and liabilities at the rate of exchange at the end of the respective period; and (ii) purchases and sales of securities and income and expenses at the rate of exchange prevailing on the dates of such transactions. The portion of realized/unrealized gains arising from changes in the exchange rates are included with the net realized/unrealized gain (loss) from affiliated and unaffiliated securities, securities sold short and foreign currency translations. Principal risks associated with such transactions include the movement in value of the foreign currency relative to the U.S. dollar and the ability of the counterparty to perform.
Needham Funds
Notes to Financial Statements (Continued)
December 31, 2019
The Portfolios may also invest in forward currency contracts. Fluctuations in the value of such forward currency transactions are recorded daily as unrealized gain or loss; realized gain or loss includes net gain or loss on transactions that have terminated by settlement. These instruments involve securities and currency market risk, credit risk, or both kinds of risks, in excess of the amount recognized in the statements of assets and liabilities. Risks also arise from the possible inability of counterparties to meet the terms of their contracts. The Portfolios did not enter into forward currency contracts during the year ended December 31, 2019.
Allocation of Expenses: Expenses directly attributable to a Portfolio are charged directly to that Portfolio, while expenses which are attributable to more than one Portfolio are allocated among the respective Portfolios based upon relative net assets or some other reasonable method.
Use of Estimates: The preparation of financial statements in conformity with GAAP requires management to make estimates and assumptions that affect the reported amounts of assets and liabilities and disclosure of contingent assets and liabilities at the date of the financial statements and the reported amounts of increases and decreases in net assets from operations during the reporting period. Actual results could differ from those estimates.
Distributions to Shareholders: Dividends from net investment income, if any, are declared and paid annually for the Portfolios. Distributable net realized gains, if any, are declared and distributed at least annually.
Federal Income Taxes: It is the policy of each Portfolio to continue to qualify as a regulated investment company, as defined in the Internal Revenue Code, by complying with the provisions available to certain investment companies and to make distributions of net investment income and net realized capital gains sufficient to relieve it from all, or substantially all, federal income taxes. Accordingly, no provision for income taxes has been made in the Portfolios’ financial statements.
As of December 31, 2019, the Portfolios did not have any tax positions that did not meet the “more-likely-than-not” threshold of being sustained by the applicable tax authority. Open tax years are those that are open for exam by Federal and state taxing authorities. As of December 31, 2019, open Federal tax years include the tax years ended December 31, 2016 through December 31, 2019, and open New York tax years include the tax years ended December 31, 2016 through December 31, 2019. The Portfolios have no tax examinations in progress.
Fair Value Measurements: Valuation inputs used to determine the value of the Portfolios’ investments are summarized in the three broad levels listed below:
| | Level 1 — | Unadjusted quoted prices in active markets for identical assets and liabilities that the Portfolios have the ability to access. |
Annual Report 2019
Notes to Financial Statements (Continued)
December 31, 2019
| | Level 2 — | Observable inputs other than quoted prices included in Level 1 that are observable for the asset or liability, either directly or indirectly. These inputs may include quoted prices for the identical instrument in an inactive market, prices for similar instruments, interest rates, prepayment speeds, credit risk, yield curves, default rates and similar data. |
| | | |
| | Level 3 — | Unobservable inputs for the asset or liability, to the extent relevant observable inputs are not available, representing the Portfolios’ own assumptions about the assumptions a market participant would use in valuing the asset or liability, and would be based on the best information available. |
The inputs or methodology used to value securities are not necessarily an indication of the risk associated with investing in those securities.
Portfolio securities listed or traded on securities exchanges, including ADRs, are valued at the closing price on the exchange or system where the security is principally traded or at the NASDAQ Official Closing Price. If there have been no sales for that day on the exchange or system, a security is valued at the mean of the highest closing bid and lowest asked prices on the exchange or system where the security is principally traded. These valuations are typically categorized as Level 1 in the fair value hierarchy.
In accordance with procedures adopted by the Board, fair value pricing may be used if events materially affecting the value of foreign securities occur between the times the exchange on which they are traded closes and the time the Portfolios’ net asset values are calculated. These valuations are categorized as Level 2 in the fair value hierarchy.
The following is a summary categorization, as of December 31, 2019, of each Portfolio’s investments based on the level of inputs utilized in determining the value of such investments:
| | | LEVEL 1 – Quoted Prices(1) | |
| | | NGF | | | NAGF | | | NSCGF | |
| Assets | | | | | | | | | |
Common Stocks(2) | | $ | 108,877,806 | | | $ | 52,029,166 | | | $ | 58,413,880 | |
Short-Term Investments | | | 1,850,459 | | | | 3,706,371 | | | | 70,172,813 | |
| Liabilities | | | | | | | | | | | | |
Securities Sold Short(2) | | | (747,850 | ) | | | (256,337 | ) | | | (332,700 | ) |
| Total | | $ | 109,980,415 | | | $ | 55,479,200 | | | $ | 128,253,993 | |
(1) | As of December 31, 2019, the Portfolios did not hold Level 2 or Level 3 investments. |
(2) | Please refer to the Schedule of Investments and Schedule of Securities Sold Short to view segregation by industry. |
| 4. | Investment Advisory and Administrative Services |
The Company has engaged Needham Investment Management L.L.C. (the “Adviser”) to manage its investments pursuant to an Investment Advisory Agreement. The Company pays the Adviser an investment advisory fee at the annual rate of 1.25% of the average daily net assets of each Portfolio.
Needham Funds
Notes to Financial Statements (Continued)
December 31, 2019
The Adviser has entered into an agreement with the Company (the “Expense Limitation Agreement”) whereby the Adviser has contractually agreed to waive its investment advisory fee for, and to reimburse expenses of, the Institutional Class and Retail Class shares of each Portfolio in an amount that limits annual operating expenses to not more than 1.40% and 1.95% (or, for NSCGF only, 1.18% and 1.85%) of the average daily net assets of the Portfolio’s Institutional Class and Retail Class, respectively (excluding taxes, interest, brokerage, dividends on short positions, acquired fund fees and expenses and extraordinary items, but including the investment advisory fee stated in the Investment Advisory Agreement). The Expense Limitation Agreement is effective for the period from April 1, 2019 through April 30, 2020. The Expense Limitation Agreement shall continue in effect from year to year thereafter only upon mutual agreement of the Company and the Adviser. Similar agreements were in effect for certain prior periods.
Any reimbursements or fee waivers made by the Adviser in respect of a Portfolio are subject to recoupment by the Adviser, to the extent that the Portfolio is able to make the repayment within the expense limitation established in the Expense Limitation Agreement. Under the Expense Limitation Agreement, the Adviser has a right to receive from each Portfolio class reimbursement for fee waivers and/or expense reimbursements made pursuant to the Agreement for a period of up to 36 months from the time of any waiver or reimbursement. The table below contains the amounts of fee waivers and expense reimbursements subject to recapture by the Adviser through December 31 of the year indicated:
| | | 2022 | | | 2021 | | | 2020 | | | Total | |
NGF (Retail Class) | | $ | 14,374 | | | $ | — | | | $ | — | | | $ | 14,374 | |
NGF (Institutional Class) | | | 110,106 | | | | 91,844 | | | | 84,071 | | | | 286,021 | |
NAGF (Retail Class) | | | 45,600 | | | | 23,838 | | | | 16,112 | | | | 85,550 | |
NAGF (Institutional Class) | | | 77,228 | | | | 83,507 | | | | 65,936 | | | | 226,671 | |
NSCGF (Retail Class) | | | 41,030 | | | | 45,317 | | | | 50,855 | | | | 137,202 | |
NSCGF (Institutional Class) | | | 124,826 | | | | 69,832 | | | | 48,693 | | | | 243,351 | |
The Company and Fund Services (the “Administrator”) are parties to a Fund Administration Servicing Agreement. The Administrator provides administrative and fund accounting services pursuant to this agreement and, in consideration of these services, receives a fee computed daily and paid monthly at an annual rate based on a percentage of the value of each Portfolio’s assets. The Administrator is also compensated for any out of pocket expenses that are reasonably incurred in carrying out its duties under this agreement. The Administrator also provides transfer agent services pursuant to a Transfer Agent Servicing Agreement for additional fees.
Certain officers of the Company are also officers of the Adviser and/or Needham & Company, LLC (the “Distributor”), an affiliate of the Adviser. Such officers receive no fees from the Company for serving as officers of the Company. Each of the two Directors who is not an “interested person” (as defined in the 1940 Act) of the Company (each, an “Independent Director”) receives a quarterly retainer of $3,000 and a per-meeting fee of $500. Each Independent Director is also a member of the Audit Committee of the Board
Annual Report 2019
Notes to Financial Statements (Continued)
December 31, 2019
and receives a fee of $500 per meeting attended. The Adviser provides an employee to serve as Chief Compliance Officer for the Company and to provide certain related services. The Distributor pays the Chief Compliance Officer’s compensation and the Company reimburses the Distributor for the Company’s allocated portion of the expense.
| 5. | Distribution Plan and Brokerage Commissions |
The Company has adopted an Amended and Restated Plan of Distribution pursuant to Rule 12b-1 under the 1940 Act. Under the Plan, each Portfolio may pay compensation to the Distributor or any other distributor or financial institution with which the Company has an agreement with respect to the Retail Class of each Portfolio, with the amount of such compensation not to exceed an annual rate of 0.25% of the daily average net assets of each Portfolio’s Retail Class shares.
During the year ended December 31, 2019, NGF, NAGF and NSCGF incurred and paid brokerage commissions to the Distributor in the amount of $14,477, $5,505, and $58,391 respectively.
Each Portfolio may borrow from banks up to 25% of its total assets and may pledge its assets in connection with these borrowings, provided that no additional investments shall be made while borrowings exceed 5% of total assets.
The Portfolios did not engage in any temporary borrowings during the year ended December 31, 2019.
| 7. | Short Sale Transactions |
During the year ended December 31, 2019, each Portfolio sold securities short. Upon selling a security short, the Portfolios record an asset for the settlement amount as “Deposit with Broker for Securities Sold Short” and a corresponding liability, which is marked-to-market to reflect current value. The broker for the Portfolios’ short sale transactions requires maintenance by each Portfolio of a minimum amount of collateral at all times, regardless of whether any short sales are outstanding. To the extent necessary to meet the broker’s collateral requirements for open short positions, additional securities will be segregated above the minimum to cover the short positions. At December 31, 2019, the market value of securities separately segregated to cover short positions was $2,284,903, $3,977,490, and $1,937,050 for NGF, NAGF and NSCGF, respectively.
Additionally, the Portfolios had receivables for Deposit with Broker for Securities Sold Short of $810,480, $282,615, and $368,091 pledged as collateral with a broker in connection with any open short positions for NGF, NAGF, and NSCGF, respectively at December 31, 2019. Securities sold short at December 31, 2019 and their related market values and proceeds are set forth in the preceding Schedule of Securities Sold Short for NGF, NAGF and NSCGF.
Needham Funds
Notes to Financial Statements (Continued)
December 31, 2019
| 8. | Investment Transactions |
The following summarizes the aggregate amount of the cost of purchases and proceeds from sales of investment securities and securities sold short, excluding short-term securities, during the year ended December 31, 2019:
| | | Purchases | | | Sales | |
| NGF | | | | | | |
Long Transactions | | $ | 12,359,206 | | | $ | 22,928,182 | |
Short Sale Transactions | | | 439,945 | | | | 7,633,507 | |
NAGF | | | | | | | | |
Long Transactions | | | 4,143,254 | | | | 12,270,966 | |
Short Sale Transactions | | | 215,925 | | | | 4,365,094 | |
NSCGF | | | | | | | | |
Long Transactions | | | 62,761,795 | | | | 45,786,010 | |
Short Sale Transactions | | | 515,840 | | | | 227,424 | |
There were no purchases or sales of U.S. government securities during the year ended December 31, 2019.
| 9. | Financial Instruments With Off-Balance Sheet Risk |
In the normal course of their business, the Portfolios may engage in transactions with off-balance sheet risk, including securities sold short, written options, futures, and forward currency contracts. Transactions in certain financial instruments represent future commitments to purchase or sell other financial instruments at specific terms at specified future dates. Each of these financial instruments contains varying degrees of off-balance sheet risk whereby changes in the market values of the securities underlying the financial instruments may be in excess of the amounts recognized in the financial statements.
Securities sold short represent obligations of the Portfolios to make future delivery of specific securities and, correspondingly, create an obligation to purchase the securities at market prices prevailing at a later delivery date (or to deliver the securities if already owned by the Portfolios). As a result, short sales create the risk that the Portfolios’ ultimate obligation to satisfy the delivery requirements may exceed the amount of the proceeds initially received on the liability recorded in the financial statements.
Under the Company’s organizational documents, its Directors and Officers are indemnified against certain liabilities arising out of the performance of their duties to the Company. In addition, in the ordinary course of business, the Company enters into contracts that contain a variety of indemnifications. The Company’s maximum exposure under these arrangements is unknown. However, the Company has not had prior claims or losses pursuant to these contracts and expects the risk of loss to be remote.
Annual Report 2019
Notes to Financial Statements (Continued)
December 31, 2019
| 11. | Transactions with Affiliates |
NAGF owned 5% or more of the voting securities of the following company during the year ended December 31, 2019. As a result, this company is deemed to be an “affiliated person” (as defined by the 1940 Act) of NAGF (and the other Portfolios). Transactions during the year in this affiliated company were as follows:
| | | | Net Change | Net | | | Share |
| | Value at | | | in Unrealized | Realized | | Value | Balance |
| Security | Dec. 31, | Value of | Value of | Appreciation | Gains | Dividend | Dec. 31, | Dec. 31, |
Name | 2018 | Purchases | Sales | (Depreciation) | (Losses) | Income | 2019 | 2019 |
GSE | | | | | | | | |
Systems, | | | | | | | | |
Inc. | $2,352,000 | $76,979 | $(229,989) | $(317,286) | $(144,873) | $— | $1,736,831 | 1,052,625 |
No provision for federal income taxes is required since the Company intends to continue to qualify as a regulated investment company under Subchapter M of the Internal Revenue Code and distribute substantially all of its taxable income and capital gains to shareholders. Because income tax regulations differ from GAAP, the timing and character of income and capital gain distributions determined in accordance with tax regulations can differ from income and capital gains recognized for financial reporting purposes. Accordingly, the character of distributions and the composition of net assets for tax purposes can differ from those reflected in the financial statements. These book/tax differences may be temporary or permanent in nature. Temporary differences are generally due to differing book and tax treatment for the timing of the recognition of gains and losses on securities, including post-October losses (as described below). Permanent differences are generally due to differing treatment of net investment losses. To the extent these differences are permanent, they are charged or credited to paid-in capital or distributable earnings, accumulated net realized gain (loss), or accumulated net investment income (loss), as appropriate, in the period in which the differences arise. These reclassifications have no effect on net assets or net asset value per share of each Portfolio.
As of December 31, 2019, the cost, gross unrealized appreciation, gross unrealized depreciation, and the net unrealized appreciation (depreciation) on securities, including proceeds from securities sold short for federal income tax purposes, were as follows:
| | | | | | | | | | | | Net | |
| | | | | | Gross | | | Gross | | | Unrealized | |
| | | | | | Unrealized | | | Unrealized | | | Appreciation | |
| | | Cost | | | Appreciation | | | Depreciation | | | (Depreciation) | |
NGF | | $ | 45,791,442 | | | $ | 65,868,454 | | | $ | (1,679,481 | ) | | $ | 64,188,973 | |
NAGF | | | 25,663,661 | | | | 31,440,951 | | | | (1,625,412 | ) | | | 29,815,539 | |
NSCGF | | | 120,180,001 | | | | 9,292,314 | | | | (1,218,323 | ) | | | 8,073,991 | |
The difference between the tax cost of investments and the cost of investments for GAAP purposes is primarily due to the tax treatment for wash sale losses.
Needham Funds
Notes to Financial Statements (Continued)
December 31, 2019
As of December 31, 2019, the components of distributable earnings (loss) on a tax basis were as follows:
| | | NGF | | | NAGF | | | NSCGF | |
Undistributed ordinary income | | $ | — | | | $ | — | | | $ | 1,593,081 | |
Undistributed long-term capital gains | | | 3,014,394 | | | | — | | | | 564,580 | |
Unrealized appreciation (depreciation) | | | 64,188,973 | | | | 29,815,539 | | | | 8,073,991 | |
Other accumulated gains (loss) | | | — | | | | — | | | | — | |
Total accumulated earnings (loss) | | $ | 67,203,367 | | | $ | 29,815,539 | | | $ | 10,231,652 | |
The tax character of distributions paid during the year ended December 31, 2019 was as follows:
| | | NGF | | | NAGF | | | NSCGF | |
Ordinary income | | $ | — | | | $ | — | | | $ | 414,676 | |
Net long-term capital gains | | | 11,150,898 | | | | 4,975,386 | | | | 3,589,387 | |
Return of capital | | | — | | | | — | | | | — | |
Total distributions paid | | $ | 11,150,898 | | | $ | 4,975,386 | | | $ | 4,004,063 | |
In 2019 a portion of such dividends was distributed in connection with NEEGX, NEAGX, and NESGX redemptions.
The tax character of distributions paid during the year ended December 31, 2018 was as follows:
| | | NGF | | | NAGF | | | NSCGF | |
Ordinary income | | $ | — | | | $ | — | | | $ | 2,522,946 | |
Net long-term capital gains | | | 13,467,264 | | | | 6,200,868 | | | | 2,691,253 | |
Return of capital | | | — | | | | — | | | | — | |
Total distributions paid | | $ | 13,467,264 | | | $ | 6,200,868 | | | $ | 5,214,199 | |
Under current tax law, capital and currency losses realized after October 31 of a Portfolio’s fiscal year may be deferred and treated as occurring on the first business day of the following fiscal year for tax purposes. For the year ended December 31, 2019, the Portfolios had no such losses to defer.
As of December 31, 2019, none of the Portfolios had accumulated capital loss carryovers.
| 13. | New Accounting Pronouncements |
In August 2018, the FASB issued Accounting Standards Update (“ASU”) 2018-13, Fair Value Measurement (Topic 820): Disclosure Framework — Changes to the Disclosure Requirements for Fair Value Measurement (“ASU 2018-13”). The primary focus of ASU 2018-13 is to improve the effectiveness of the disclosure requirements for fair value measurements. The changes affect all companies that are required to include fair value measurement disclosures. In general, the amendments in ASU 2018-13 are effective for all entities for fiscal years and interim periods within those fiscal years, beginning after December 15, 2019. An entity is permitted to early adopt the removed or modified disclosures upon the issuance of ASU 2018-13 and may delay adoption of the additional
Annual Report 2019
Notes to Financial Statements (Continued)
December 31, 2019
disclosures, which are required for public companies only, until their effective date. Management has evaluated ASU 2018-13 and has early adopted the relevant provisions of the disclosure framework.
Needham Funds
Report of Independent Registered Public Accounting Firm
To the shareholders and board of directors
The Needham Funds, Inc.:
Opinion on the Financial Statements
We have audited the accompanying statements of assets and liabilities of the Needham Growth Fund, Needham Aggressive Growth Fund and Needham Small Cap Growth Fund, each a “Portfolio” of The Needham Funds, Inc. (collectively, the “Portfolios”), including the schedules of investments and schedules of securities sold short, as of December 31, 2019, the related statements of operations for the year then ended, the statements of changes in net assets for each of the years in the two year period then ended, and the related notes (collectively, the “financial statements”) and the financial highlights for each of the years or periods in the five year period then ended. In our opinion, the financial statements and financial highlights present fairly, in all material respects, the financial position of the Portfolios as of December 31, 2019, the results of their operations for the year then ended, the changes in their net assets for each of the years in the two year period then ended, and the financial highlights for each of the years or periods in the five year period then ended, in conformity with U.S. generally accepted accounting principles.
Basis for Opinion
These financial statements and financial highlights are the responsibility of the Portfolios’ management. Our responsibility is to express an opinion on these financial statements and financial highlights based on our audits. We are a public accounting firm registered with the Public Company Accounting Oversight Board (United States) (“PCAOB”) and are required to be independent with respect to the Portfolios in accordance with the U.S. federal securities laws and the applicable rules and regulations of the Securities and Exchange Commission and the PCAOB.
We conducted our audits in accordance with the standards of the PCAOB. Those standards require that we plan and perform the audit to obtain reasonable assurance about whether the financial statements and financial highlights are free of material misstatement, whether due to error or fraud. Our audits included performing procedures to assess the risks of material misstatement of the financial statements and financial highlights, whether due to error or fraud, and performing procedures that respond to those risks. Such procedures included examining, on a test basis, evidence regarding the amounts and disclosures in the financial statements and financial highlights. Such procedures also included confirmation of securities owned as of December 31, 2019, by correspondence with custodians and brokers. Our audits also included evaluating the accounting principles used and significant estimates made by management, as well as evaluating the overall presentation of the financial statements and financial highlights. We believe that our audits provide a reasonable basis for our opinion.
We have served as the auditor of The Needham Funds, Inc. since 2011.
New York, New York
February 28, 2020
Annual Report 2019
Information about Directors and Officers (Unaudited)
December 31, 2019
Information pertaining to the Directors and Officers of the Company is set forth below. The Portfolios’ Statement of Additional Information (SAI) includes additional information about the Directors and is available without charge, upon request, by calling 800-625-7071.
The address of each individual is 250 Park Avenue, New York, NY 10177. Each Director serves until the next annual shareholders meeting or until his successor is elected and qualified.
| | Term of Office | Portfolios in the | Principal Occupations(s) | |
| Name, Year of Birth | and Length of | Fund Complex | During Past 5 Years | |
| and Position with | Term Served by | Overseen by | and Other Directorships | |
| the Company | Director/Officer | Director/Officer | Held by Director/Officer | |
| Independent Directors | |
| John W. Larson, | Indefinite; | Three | Currently retired. Partner at the law | |
| Year of Birth: 1935 | Since 2006 | | firm of Morgan, Lewis & Bockius LLP | |
| Director | | | from 2003 until retiring in December | |
| | | | 2009. Partner at the law firm of | |
| | | | Brobeck, Phleger & Harrison LLP from | |
| | | | 1969 until 2003. From July 1971 to | |
| | | | September 1973 worked in government | |
| | | | service as Assistant Secretary of the | |
| | | | United States Department of the Interior | |
| | | | and Counselor to George P. Schultz, | |
| | | | Chairman of the Cost of Living | |
| | | | Council. Director of Wage Works, Inc. | |
| | | | (an employee benefits company) from | |
| | | | 2000 until 2018. Director of Sangamo | |
| | | | BioSciences, Inc. since 1996. | |
| F. Randall Smith, | Indefinite; | Three | Founder, Member of Investment | |
| Year of Birth: 1938 | Since 1996 | | Committee, Investment Analyst and | |
| Director | | | Portfolio Manager of Capital Counsel | |
| | | | LLC (a registered investment adviser) | |
| | | | since September 1999; President from | |
| | | | 1999 to 2014. Co-founder and Chief | |
| | | | Investment Officer of Train, Smith | |
| | | | Counsel (a registered investment | |
| | | | adviser) from 1975 to 1999. | |
Information about Directors and Officers (Unaudited) (Continued)
December 31, 2019
| | Term of Office | Portfolios in the | Principal Occupations(s) | |
| Name, Year of Birth | and Length of | Fund Complex | During Past 5 Years | |
| and Position with | Term Served by | Overseen by | and Other Directorships | |
| the Company | Director/Officer | Director/Officer | Held by Director/Officer | |
| Interested Director | |
| George A. Needham*, | Indefinite; | Three | Chairman of the Board and Chief | |
| Year of Birth: 1943 | Since 1996 | | Executive Officer of The Needham | |
| Chairman, President | | | Group, Inc. and Needham Holdings, | |
| and Director | | | LLC since December 2004. Chairman | |
| | | | of the Board and Chief Executive Officer | |
| | | | of Needham Asset Management, LLC | |
| | | | since April 2006. Chairman of the | |
| | | | Board from 1996 to December 2004 | |
| | | | and Chief Executive Officer from 1985 | |
| | | | to December 2004 of Needham & | |
| | | | Company, LLC. Managing Member of | |
| | | | Needham Capital Management, LLC | |
| | | | since 2000. | |
| * | An “interested person”, as defined in the 1940 Act, of the Company or the Company’s investment adviser. Mr. Needham is deemed to be an interested person because of his affiliation with the Portfolios’ Adviser and the Portfolios’ Distributor, and because he is an officer of the Company. |
Annual Report 2019
Information about Directors and Officers (Unaudited) (Continued)
December 31, 2019
| | Term of Office | Portfolios in the | Principal Occupations(s) | |
| Name, Year of Birth | and Length of | Fund Complex | During Past 5 Years | |
| and Position with | Term Served by | Overseen by | and Other Directorships | |
| the Company | Director/Officer | Director/Officer | Held by Director/Officer | |
| Officers | |
| John Barr, | One year; | Two | Portfolio Manager of Needham | |
| Year of Birth 1956 | Since 2010 | | Asset Management, LLC since 2010. | |
| Executive Vice President | | | Founding and Managing Member | |
| and Co-Portfolio | | | of Oliver Investment Management, | |
| Manager of the Needham | | | LLC from 2008 to 2009. Manager | |
| Growth Fund, Executive | | | and Analyst at Buckingham Capital | |
| Vice President and | | | from 2002 to 2008. Managing | |
| Portfolio Manager of | | | Director and a Senior Analyst at | |
| the Needham Aggressive | | | Robertson Stephens following | |
| Growth Fund. | | | semiconductor companies from | |
| | | | 2000 to 2002. From 1995 to 2000, | |
| | | | Managing Director and Senior Analyst | |
| | | | at Needham and Company, LLC, | |
| | | | also served as Director of Research. | |
| | | | Director of Coventor, Inc. since 2009. | |
| Chris Retzler, | One year; | Two | Portfolio Manager of Needham | |
| Year of Birth: 1971 | Since 2008 | | Asset Management, LLC since 2008. | |
| Executive Vice President | | | Vice President of Needham Asset | |
| and Co-Portfolio | | | Management, LLC since 2005. | |
| Manager of the | | | Head of Winterkorn, a healthcare | |
| Needham Growth Fund, | | | manufacturing and distribution | |
| Executive Vice President | | | company, from 2002 to 2005. | |
| and Portfolio Manager | | | | |
| of the Needham | | | | |
| Small Cap Growth Fund. | | | | |
| James W. Giangrasso, | One year; | Three | Chief Financial Officer of | |
| Year of Birth: 1962 | Since 2011 | | Needham Asset Management, LLC | |
| Chief Financial Officer, | | | since 2011. Principal and | |
| Treasurer and Secretary | | | Controller of Needham Asset | |
| | | | Management, LLC since 2006. | |
| James M. Abbruzzese, | One year; | Three | Chief Compliance Officer of | |
| Year of Birth: 1969 | Since 2004 | | Needham Asset Management, LLC | |
| Chief Compliance Officer | | | since April 2006. Chief Compliance | |
| | | | Officer and Managing Director of | |
| | | | Needham & Company, LLC from 2008 | |
| | | | through 2012. Chief Administrative | |
| | | | Officer of Needham & Company, LLC | |
| | | | since 2012. Chief Compliance Officer | |
| | | | of Needham Capital Management, LLC | |
| | | | since 2000. | |
Needham Funds
Supplementary Information (Unaudited)
December 31, 2019
Federal Income Tax Information
For the fiscal year ended December 31, 2019, certain dividends paid by the Portfolios may be subject to a maximum tax rate of 23.8%, as provided by the Jobs and Growth Tax Relief Reconciliation Act of 2003. The percentage of dividends declared from ordinary income reported as qualified dividend income was as follows:
NGF | | | 0.00 | % |
NAGF | | | 0.00 | % |
NSCGF | | | 0.00 | % |
For corporate shareholders, the percent of ordinary income distributions qualifying for the corporate dividends received deduction for the fiscal year ended December 31, 2019 was as follows:
NGF | | | 0.00 | % |
NAGF | | | 0.00 | % |
NSCGF | | | 0.00 | % |
The percentage of taxable ordinary income distributions that are designed as short-term capital gain distributions under Internal Revenue Section 871(k)(2)(C) for each Portfolio were as follows:
NGF | | | 0.00 | % |
NAGF | | | 0.00 | % |
NSCGF | | | 0.00 | % |
Privacy Policy
It is the policy of the Company to keep personally identifiable financial information about you as an individual (“nonpublic personal information”) confidential, and use or disclose it only as necessary to provide services to you or the Company or as otherwise required or permitted by law. We may collect the following nonpublic personal information about you:
• | Information we receive from you on or in applications or other forms, correspondence, or conversations, including, but not limited to, your name, address, phone number, social security number, assets, income and date of birth; and |
| | |
• | Information about your transactions with us, our affiliates, or others, including, but not limited to, your account number and balance, payments history, parties to transactions, cost basis information, other financial information and information about how you vote your shares. |
Annual Report 2019
Supplementary Information (Unaudited) (Continued)
December 31, 2019
We disclose nonpublic personal information about current and former shareholders to companies that provide necessary services to the Company. These companies include the transfer agent, distributor, administrator and investment adviser as well as other affiliates of the Company. We maintain physical, electronic and procedural safeguards that comply with federal standards to guard your nonpublic personal information and restrict access to this information to those persons who need it to provide services to you or the Company or who are otherwise permitted by law to receive it. In the event that you hold any shares of our funds through a financial intermediary, including, but not limited to, a broker-dealer, bank, or trust company, the privacy policy of your financial intermediary governs how your nonpublic personal information is shared with nonaffiliated third parties.
If you have any questions concerning the Company’s Privacy Policy, please call 1-800-625-7071.
Disclosure of Portfolio Holdings
The Company files a Form N-Q with the Securities and Exchange Commission (the “SEC”) no more than sixty days after the Company’s first and third fiscal quarters. For the Company, this would be for the fiscal quarters ending March 31 and September 30. Form N-Q includes a complete schedule of the Company’s portfolio holdings as of the end of those fiscal quarters. The Company’s N-Q filings are available without charge, upon request, by calling 800-625-7071 or on the SEC’s website at http://www.sec.gov.
Voting Proxies on Company Portfolio Securities
A description of the policies and procedures that the Company uses to determine how to vote proxies relating to portfolio securities and information regarding how the Company voted proxies relating to portfolio securities during the most recent 12-month period ended June 30 are available without charge, upon request, by calling 800-625-7071 or on the SEC’s website at http://www.sec.gov.
Household Delivery of Shareholder Documents
To reduce expenses, the Company may mail only one copy of the Portfolios’ prospectuses, proxy statements, information statements, and each annual and semi-annual report to those addresses shared by two or more accounts. If you wish to receive individual copies of these documents, please call the Portfolios at 1-800-625-7071 or contact your financial institution. You will begin receiving individual copies thirty days after receiving your request.
Index Disclaimer
The Portfolios have been developed solely by the Adviser. The Portfolios are not in any way connected to or sponsored, endorsed, sold or promoted by the London Stock Exchange Group plc and its group undertakings (collectively, the “LSE Group”). FTSE Russell is a trading name of certain of the LSE Group companies.
Needham Funds
Supplementary Information (Unaudited) (Continued)
December 31, 2019
All rights in the Russell 2000 Index and the Russell 3000 Index (together, the “Indexes”) vest in the relevant LSE Group company which owns the Index. “Russell®” is a trade mark of the relevant LSE Group company and is used by any other LSE Group company under license.
The Indexes are calculated by or on behalf of FTSE International Limited or its affiliate, agent or partner. The LSE Group does not accept any liability whatsoever to any person arising out of (a) the use of, reliance on or any error in the Indexes or (b) investment in or operation of the Portfolios. The LSE Group makes no claim, prediction, warranty or representation either as to the results to be obtained from the Portfolios or the suitability of the Indexes for the purpose to which it is being put by the Adviser.
The source of the data for each of the Indexes is the LSE Group. © LSE Group 2020. All rights in the Indexes or data vest in the relevant LSE Group company which owns the Index or the data. Neither LSE Group nor its licensors accept any liability for any errors or omissions in the Indexes or data and no party may rely on any Indexes or data contained in this communication. No further distribution of data from the LSE Group is permitted without the relevant LSE Group company’s express written consent. The LSE Group does not promote, sponsor or endorse the content of this communication.
Board Consideration and Approval of Investment Advisory Agreement
On October 29, 2019, at a meeting called for the purpose of voting on such approval, the Board, including all of the Independent Directors, approved the continuance of the Investment Advisory Agreement (the “Advisory Agreement”) between the Company and the Adviser with respect to NGF, NAGF and NSCGF. In doing so, the Board reviewed materials provided by the Adviser to assist them in making a determination (the “Board Materials”). The Independent Directors were assisted in their review by independent legal counsel and met with counsel in executive session separate from representatives of the Adviser. In considering the renewal of the Advisory Agreement, the Board considered the nature, extent, and quality of the services to be provided by the Adviser; the investment performance of each Portfolio and the Adviser; the costs of the services to be provided and profits to be realized by the Adviser and its affiliates from the relationship with each Portfolio; the extent to which economies of scale would be realized as the Portfolios grow; and whether fee levels reflect these economies of scale for the benefit of investors.
The Directors stated that their consideration of the continuance of the Advisory Agreement included consideration of the peer group comparisons in the Board Materials to other investment companies with similar investment objectives and to each Portfolio’s unmanaged indices for various periods ended September 30, 2019, noting that NGF’s performance was above the average and median performance of its peer group and the relevant Morningstar Universes for the year-to-date, one-year and since inception periods. For NAGF, the Directors noted that the Portfolio’s performance was above the average and median performance of its peer group and the relevant Morningstar Universes for the year-to-date, one-year and since inception periods. For NSCGF, the Directors noted that the
Annual Report 2019
Supplementary Information (Unaudited) (Continued)
December 31, 2019
Portfolio’s performance was above the average and median performance of its peer group for the year-to-date, one-year, three-year, five-year and ten-year (average only) periods and above the average and median performance of the relevant Morningstar Universes for the year-to-date, one-year, three-year, five-year and since inception periods. It was further noted that the Portfolios’ performance compared favorably to the longer term performance of their respective benchmark indices. In addition to reviewing each Portfolio’s performance and the profitability analysis of the Adviser, the Directors considered possible economies of scale, but did not believe material economies of scale to be present in light of the Portfolios’ asset size and redemption trends.
In their deliberations, the Directors considered all factors they believed relevant in addition to the performance comparisons described above, including the following: the nature, extent and quality of services rendered by the Adviser; the costs borne by, and profitability of, and other benefits to, the Adviser and its affiliates in providing services to each Portfolio; comparative fee and expense data for each Portfolio and other investment companies with similar investment objectives (having been advised that the Adviser does not manage other accounts with investment objectives and strategies similar to those of the Portfolios except private investment funds with fee structures that include performance fees); whether expenses of NGF, NAGF and NSCGF might be expected to decline as a percentage of net assets as NGF, NAGF and NSCGF assets increase (although there had not been a significant increase in assets in recent years); the professional experience and qualifications of each Portfolio’s portfolio manager(s) and other personnel of the Adviser, including the fact that a high caliber of personnel was both needed and provided to meet the needs of NGF, NAGF and NSCGF (specifically with respect to investments in securities sold short); and the terms of the Advisory Agreement. The Independent Directors confirmed that they had received adequate information to make a reasonable determination with respect to the approval of the Advisory Agreement. After full consideration of all the foregoing factors, the Board determined to approve the renewal of the Advisory Agreement.
(This Page Intentionally Left Blank.)
250 Park Avenue, 10th Floor
New York, New York 10177
1-800-625-7071
Investment Adviser:
Needham Investment Management L.L.C.
250 Park Avenue, 10th Floor
New York, New York 10177
| | President |
| | George A. Needham |
| | |
| | Executive Vice Presidents and Portfolio Managers |
| | John Barr |
| | | Needham Growth Fund |
| | | Needham Aggressive Growth Fund |
| | Chris Retzler |
| | | Needham Growth Fund |
| | | Needham Small Cap Growth Fund |
| | |
| | Directors |
| | George A. Needham |
| | John W. Larson |
| | F. Randall Smith |
Distributor:
Needham & Company, LLC
250 Park Avenue, 10th Floor
New York, New York 10177
212-371-8300
Administrator, Shareholder Servicing Agent, and Transfer Agent:
U.S. Bancorp Fund Services, LLC, doing business as U.S. Bank Global Fund Services
615 East Michigan Street
Milwaukee, WI 53202
Custodian:
U.S. Bank, N.A.
1555 North RiverCenter Drive
Milwaukee, WI 53212
Counsel:
Proskauer Rose LLP
Eleven Times Square
New York, NY 10036-8299
Independent Registered Public Accounting Firm:
KPMG LLP
345 Park Avenue
New York, NY 10154
Item 2. Code of Ethics.
The registrant has adopted a code of ethics that applies to the registrant’s principal executive officer and principal financial officer. The registrant has not made amendments to its code of ethics during the period covered by this report. The registrant has not granted any waivers from any provisions of the code of ethics during the period covered by this report.
A copy of the registrant’s Code of Ethics is filed herewith.
Item 3. Audit Committee Financial Expert.
The registrant’s board of directors has determined that there is at least one audit committee financial expert serving on its audit committee. F. Randall Smith is the “audit committee financial expert” and is considered to be “independent” as each term is defined in Item 3 of Form N‑CSR.
Item 4. Principal Accountant Fees and Services.
The registrant has engaged its principal accountant to perform audit services, audit-related services, tax services and other services during the past two fiscal years. “Audit services” refer to performing an audit of the registrant's annual financial statements or services that are normally provided by the accountant in connection with statutory and regulatory filings or engagements for those fiscal years. “Audit-related services” refer to the assurance and related services by the principal accountant that are reasonably related to the performance of the audit. “Tax services” refer to professional services rendered by the principal accountant for tax compliance, tax advice, and tax planning. “Other services” provided by the principal accountant were not applicable. The following table details the aggregate fees billed or expected to be billed for each of the last two fiscal years for audit fees, audit-related fees, tax fees and other fees by the principal accountant.
| | FYE 12/31/2019 | FYE 12/31/2018 |
Audit Fees | $78,500 | $78,500 |
Audit-Related Fees | $ 0 | |
Tax Fees | $23,925 | $23,040 |
All Other Fees | $ 0 | |
The audit committee has adopted pre-approval policies and procedures that require the audit committee to pre‑approve all audit and non‑audit services of the registrant, including services provided to any entity affiliated with the registrant.
The percentage of fees billed by KPMG LLP applicable to non-audit services pursuant to waiver of pre-approval requirement were as follows:
| | FYE 12/31/2019 | FYE 12/31/2018 |
Audit-Related Fees | 0% | 0% |
Tax Fees | 0% | 0% |
All Other Fees | 0% | 0% |
All of the principal accountant’s hours spent on auditing the registrant’s financial statements were attributed to work performed by full‑time permanent employees of the principal accountant.
The following table indicates the non-audit fees billed or expected to be billed by the registrant’s accountant for services to the registrant and to the registrant’s investment adviser (and any other controlling entity, etc.—not sub-adviser) for the last two years. The audit committee of the board of trustees/directors has considered whether the provision of non-audit services that were rendered to the registrant's investment adviser is compatible with maintaining the principal accountant's independence and has concluded that the provision of such non-audit services by the accountant has not compromised the accountant’s independence.
Non-Audit Related Fees | FYE 12/31/2019 | FYE 12/31/2018 |
Registrant | $0 | $0 |
Registrant’s Investment Adviser | $8,300 | $7,900 |
Item 5. Audit Committee of Listed Registrants.
Not applicable to registrants who are not listed issuers (as defined in Rule 10A-3 under the Securities Exchange Act of 1934).
Item 6. Investments.
(a) | Schedule of Investments is included as part of the report to shareholders filed under Item 1 of this Form. |
Item 7. Disclosure of Proxy Voting Policies and Procedures for Closed-End Management Investment Companies.
Not applicable to open-end investment companies.
Item 8. Portfolio Managers of Closed-End Management Investment Companies.
Not applicable to open-end investment companies.
Item 9. Purchases of Equity Securities by Closed‑End Management Investment Company and Affiliated Purchasers.
Not applicable to open-end investment companies.
Item 10. Submission of Matters to a Vote of Security Holders.
Not Applicable.
Item 11. Controls and Procedures.
(a) | The Registrant’s Chief Executive Officer and Chief Financial Officer have reviewed the Registrant's disclosure controls and procedures (as defined in Rule 30a-3(c) under the Investment Company Act of 1940 (the “Act”)) as of a date within 90 days of the filing of this report, as required by Rule 30a-3(b) under the Act and Rules 13a-15(b) or 15d‑15(b) under the Securities Exchange Act of 1934. Based on their review, such officers have concluded that the disclosure controls and procedures are effective in ensuring that information required to be disclosed in this report is appropriately recorded, processed, summarized and reported and made known to them by others within the Registrant and by the Registrant’s service provider. |
(b) | There were no changes in the Registrant's internal control over financial reporting (as defined in Rule 30a-3(d) under the Act) that occurred during the Registrant’s first fiscal half-year of the period covered by this report that has materially affected, or is reasonably likely to materially affect, the Registrant's internal control over financial reporting. |
Item 12. Disclosure of Securities Lending Activities for Closed-End Management Investment Companies
Not applicable to open-end investment companies.
Item 13. Exhibits.
| (a) | (1) Any code of ethics or amendment thereto, that is the subject of the disclosure required by Item 2, to the extent that the registrant intends to satisfy Item 2 requirements through filing an exhibit. Filed herewith. |
(2) A separate certification for each principal executive and principal financial officer pursuant to Section 302 of the Sarbanes-Oxley Act of 2002. Filed herewith.
(3) Any written solicitation to purchase securities under Rule 23c‑1 under the Act sent or given during the period covered by the report by or on behalf of the registrant to 10 or more persons. Not applicable to open-end investment companies.
| (b) | Certifications pursuant to Section 906 of the Sarbanes‑Oxley Act of 2002. Furnished herewith. |
SIGNATURES
Pursuant to the requirements of the Securities Exchange Act of 1934 and the Investment Company Act of 1940, the registrant has duly caused this report to be signed on its behalf by the undersigned, thereunto duly authorized.
(Registrant) The Needham Funds, Inc.
By (Signature and Title) /s/ George A. Needham
George A. Needham, President (Chief Executive Officer)
Date March 4, 2020
Pursuant to the requirements of the Securities Exchange Act of 1934 and the Investment Company Act of 1940, this report has been signed below by the following persons on behalf of the registrant and in the capacities and on the dates indicated.
By (Signature and Title) /s/ George A. Needham
George A. Needham, President (Chief Executive Officer)
Date March 4, 2020
By (Signature and Title) /s/ James W. Giangrasso
James W. Giangrasso, Treasurer and Secretary (Chief Financial Officer)
Date March 4, 2020