UNITED STATES
SECURITIES AND EXCHANGE COMMISSION
Washington, D.C. 20549
FORM N-CSR
CERTIFIED SHAREHOLDER REPORT OF REGISTERED
MANAGEMENT INVESTMENT COMPANIES
Investment Company Act file number 811-09114
The Needham Funds, Inc.
(Exact name of registrant as specified in charter)
250 Park Avenue, New York, NY 10177-1099
(Address of principal executive offices) (Zip code)
Mr. George A. Needham, 250 Park Avenue, New York, NY 10177-1099
(Name and address of agent for service)
1-800-625-7071
Registrant's telephone number, including area code
Date of fiscal year end: December 31, 2017
Date of reporting period: December 31, 2017
Item 1. Reports to Stockholders.
Annual
Report
Needham Funds
Seeking to build wealth for long-term investors.
December 31, 2017
Needham Growth Fund
Needham Aggressive Growth Fund
Needham Small Cap Growth Fund
www.needhamfunds.com
250 Park Avenue, 10th Floor
New York, New York 10177
1-800-625-7071
www.needhamfunds.com
Annual Report
December 31, 2017
| Contents | |
| Letter from the Adviser | 1 |
| Portfolio Characteristics | |
| Needham Growth Fund | 14 |
| Needham Aggressive Growth Fund | 16 |
| Needham Small Cap Growth Fund | 18 |
| Disclosure of Fund Expenses | 20 |
| Schedules of Investments | |
| Needham Growth Fund | 22 |
| Needham Aggressive Growth Fund | 28 |
| Needham Small Cap Growth Fund | 33 |
| Schedules of Securities Sold Short | |
| Needham Growth Fund | 27 |
| Needham Aggressive Growth Fund | 32 |
| Needham Small Cap Growth Fund | 36 |
| Statements of Assets and Liabilities | 38 |
| Statements of Operations | 40 |
| Statements of Changes in Net Assets | 41 |
| Financial Highlights | |
| Needham Growth Fund | 44 |
| Needham Aggressive Growth Fund | 46 |
| Needham Small Cap Growth Fund | 48 |
| Notes to Financial Statements | 50 |
| Report of Independent Registered Public Accounting Firm | 59 |
| Information about Directors and Officers | 60 |
| Supplementary Information and Privacy Policy | 62 |
This report is authorized for distribution to prospective investors only when preceded or accompanied by a current prospectus. The prospectus contains more complete information, including investment objectives, risks, expenses and charges and should be read carefully before investing or sending any money. To obtain a prospectus or summary prospectus, please call 1-800-625-7071.
Portfolios of The Needham Funds, Inc., like all mutual funds:
| | • | Are NOT FDIC insured |
| | • | Have no bank guarantee |
| | • | May lose value |
The Needham Funds, Inc. are distributed by Needham & Company, LLC.
Annual Report 2017
250 Park Avenue, 10th Floor
New York, NY 10177
(800) 625-7071
www.needhamfunds.com
February 2018
Dear Shareholders, Friends of Needham and Prospective Shareholders,
We are reporting results for the quarter and year ending December 31, 2017 for the Needham Growth Fund, Needham Aggressive Growth Fund, and Needham Small Cap Growth Fund. Our mission is to create wealth for long-term investors.
Needham Funds’ Fourth Quarter and Year-End 2017 Results
In the fourth quarter, the Needham Growth Fund Institutional and Retail classes were down -2.40% and -2.55%, respectively; the Needham Aggressive Growth Fund Institutional and Retail classes were down -2.84% and -2.98%, respectively; and the Needham Small Cap Growth Fund Institutional and Retail classes were down -1.13% and -1.27%, respectively. The Russell 2000 Total Return Index returned 3.34%, the S&P 500 Total Return Index returned 6.64%, and the NASDAQ Composite Index returned 6.57%. We are disappointed with the fourth quarter results.
In 2017, the Needham Growth Fund Institutional and Retail classes returned 8.89% and 8.32%, respectively; the Needham Aggressive Growth Institutional and Retail classes returned 9.36% and 8.73%, respectively, and the Needham Small Cap Growth Fund Institutional and Retail classes returned 12.48% and 11.88%, respectively. The Russell 2000 Total Return Index returned 14.65%, the S&P 500 Total Return Index returned 21.83%, and the NASDAQ Composite Index returned 29.73%. The Funds’ absolute returns were good, but disappointing relative to the averages.
Start to 2018
Before we review 2017, a word on the start to 2018. The first few weeks were a continuation of the dream market of the last three years. Through January 23, the S&P 500 returned 6.19%, the Russell 2000 returned 4.90% and the Needham Funds were positive. The Tax Cut and Jobs Act of 2017 became law and established an internationally competitive corporate tax structure with the first sweeping overhaul to the U.S. tax code in over 30 years. The market and the Needham Funds responded positively.
Regarding the new tax law, many of our portfolio holdings should benefit from a reduction in the corporate tax rate from 35% to 22%. However, some of our companies are in investment mode and not yet generating enough taxable earnings to benefit. Companies that have been investing for many years could be long-term beneficiaries of the tax change; they were investing, thus not generating earnings that would have been taxed at the higher rate. Future earnings that may result from these past investments will be taxed at the new, lower corporate tax rate. What brilliant tax planning!
The beginning of February brought a different story. On Friday, February 2, the Dow Jones Industrial Average fell 666 points and the decline continued through the following week. As of February 8, the S&P 500 was down 3.46%, the Russell 2000 was down 4.67% and
Needham Funds
the Needham Funds were also down for 2018. We point to two factors. First, the Federal Reserve is raising interest rates, as it views the economy at full employment and inflation at its 2% target.
Second, there is $1.5 trillion in “risk parity” trades, which are short the market’s volatility. Grant’s Interest Rate Observer did a great write-up on risk parity in its March 10, 2017 issue. This second week of February will have served a good result, if the risk volatility traders realize this trade is over. According to Barron’s, the Credit Suisse Velocity Shares Daily Inverse VIX Short-Term ETN (XIV) and ProShares Short VIX Short-Term Futures ETF (SVXY) fell from $3 billion to $150 million of net asset value, creating significant losses for retail investors. Credit Suisse is liquidating its fund. As market pundit Ed Borgato wrote on Twitter, “How … are people supposed to save for retirement without a reliable way to short vol?” I facetiously said, “It’s too bad there weren’t triple-levered volatility ETFs…”
Trading volatility is so far from our investment philosophy. We look to create wealth for long-term investors by investing in companies with strong management teams and attractive valuations.
Review of 2017 – “Reward and Patience”
Well, the world didn’t end in 2017, as it appeared it might at the beginning of the year. In fact, it was a robust year for the economy and equities. The U.S. started 2017 with the inauguration of President Trump and fear about everything.
In 2017, the Needham Funds were rewarded by our patience in semiconductor capital equipment holdings, some of which were started eight years ago. On the other hand, some of our long-term holdings suffered owing to lack of perceived progress and a few company stumbles. These will require additional patience, and we believe many of these holdings are poised for outperformance in 2018. The short positions hurt the overall performance of the Needham Growth and Aggressive Growth Funds as well.
In January, the market rallied on the presidential inauguration and proposals of pro-growth tax reform, infrastructure spending, and reduced regulatory burden. In February, President Trump promised a “phenomenal tax plan” and to streamline the new drug regulatory process. Failure to repeal the Affordable Care Act and introduce new healthcare legislation brought worries that tax reform would be delayed. The indices rallied for each month of the first quarter.
In April, the market remained positive. Preliminary GDP showed just 0.7% economic growth, although that number was later revised to a still low 1.2%. The Atlanta Fed’s GDPNow showed preliminary second quarter GDP growth at a slightly higher 2.5%, making the first half of 2017 consistent with the growth of the last 8 years.
In May, we had the firing of FBI Director James Comey and North Korea’s third missile launch. June saw the market rally and there was a sell-off in the FAANG stocks (Facebook, Amazon, Apple, Netflix, Google/Alphabet), which lasted about one week.
July was another positive month for the markets and the Funds. The preliminary 2Q17 GDP came in at 2.6%. The Core Consumer Price Index showed a 1.7% year-over-year increase, which remained below the Federal Reserve’s 2% target. Both of these indicated a goldilocks economy – not too hot and not too cold.
August saw the S&P 500 eke out a small gain and the Russell 2000 decline. The Funds were down and slightly underperformed. August brought terrorism in Barcelona, violence in Charlottesville, a troubling North Korean situation, stalled healthcare and tax reform policy, and disappointing earnings from Cisco Systems, Inc. (CSCO) and retail companies.
September was a good month for the Funds and for the markets. The second quarter GDP estimate was revised higher to 3.1%—the strongest growth in over two years. As expected, the Federal Reserve left the target federal funds rate unchanged at 1-1.25% and announced its intention to begin normalizing its balance sheet by reducing holdings of Treasuries and mortgage-backed securities by $10 billion per month in the October quarter. With $4.2 trillion of holdings, this will take time. In September, Applied Materials (AMAT) reinforced our positive thesis on the long-term, secular growth opportunity in semiconductor capital equipment at its investor day.
October was another positive month for the markets. The third quarter preliminary GDP reading was 2.1% and the Core Consumer Price Index showed a 2.0% year-over-year increase, in-line with the Fed’s 2% target. Again, both of these indicated a goldilocks economy.
The markets showed continued strength in November. We learned that GDP grew 3.3% in the third quarter, the fastest pace since 2014. We also saw progress on the tax bill, which would be a generational change in favor of an internationally competitive corporate tax structure.
December was a mostly flat month for the averages, but a down month for all three Needham Funds. December saw the passage of the tax bill. Sectors including financials, energy, industrials and consumer all outperformed. Many of the companies in these sectors will have a greater short-term benefit from a lower corporate tax rate than some of our small cap companies, which are not yet taxpayers.
Our outlook for 2018 is positive, with the possibilities of stronger economic growth and reward of value recognition in our small cap companies that lagged in 2017. We look forward to a year of patience rewarded.
John Barr’s Commentary – Reward and Patience with Compounders
I believe that finding and holding investments in compounding stocks is the path to long-term wealth creation.
There are a wide variety of options for one looking to generate wealth. Some masquerade as investments, others are known openly as gambling. People can buy and sell baseball cards, fine wines, or they could have traded volatility with the Velocity Shares Daily Inverse VIX Short-Term ETN (XIV).1 Gamblers can play the lottery, bet on sports, and play the tables in Las Vegas.2 Gambling primarily requires luck, although a few are able to win through skill. Buying and selling stuff requires many right decisions. Many things that one trades won’t capture the relentless move forward by the American economy and its worldwide trade partners. It also leaves one at risk of being uninvested at the wrong time.
____________
1 ETF is sponsored by Credit Suisse and fell spectacularly on February 5 during the volatility traders induced sell-off. CSFB will close this ETF.
2 Molly’s Game is a great movie showing the addiction of gambling and how lack of skill can be disastrous in “playing” games of chance.
Needham Funds
In the 2016 Berkshire Hathaway Annual Letter, Warren Buffett wrote “American business—and consequently a basket of stocks—is virtually certain to be worth far more in the years ahead. Innovation, productivity gains, entrepreneurial spirit and an abundance of capital will see to that. Ever-present naysayers may prosper by marketing their gloomy forecasts. But heaven help them if they act on the nonsense they peddle. Many companies, of course, will fall behind, and some will fail.”
3
By owning common stocks in the right companies, we have the opportunity to be the financial partner with great entrepreneurs and CEOs. Our investments represent partial ownership of businesses that provide value to customers, invest in new products and plants, employ engineers, marketers and operations people, and may grow and generate cash for their owners. Imagine how our predecessors a few generations back would have viewed this opportunity to be a business owner. An ownership mentality matches the investment duration of investors in the Needham Funds looking to create wealth over the long term.
I look to make investments in companies with great management, which, to me, generally means founders, family, or long-tenured managers, with high return or the potential for a high return on capital and the opportunity to be 5-10x larger. These are potential compounders. I look for companies available at an attractive valuation that may be in an investment stage, operating near break-even, and below potential operating margin. When I purchase a new investment, I believe that financial results could come within 6-12 months. However, investment phases may last longer than expected while the companies are making progress behind the scenes. It’s impossible for a quantitative or passive investor to see this progress.
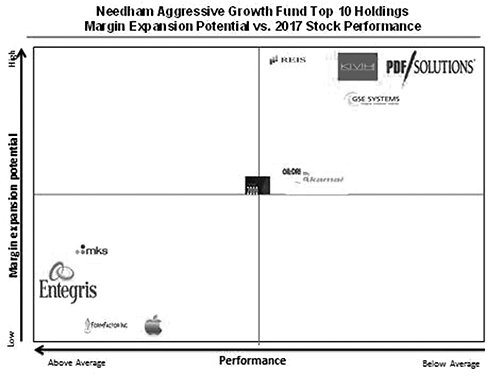
The adjacent chart shows the 2017 performance of Needham Aggressive Growth Fund’s top 10 holdings and their potential for margin expansion. The other Needham Funds have some of these same top 10 holdings.
____________
3 http://www.berkshirehathaway.com/letters/2016ltr.pdf, p. 6
Reward – The Needham Aggressive Growth Fund’s 2017 outperformers were Entegris (ENTG), MKS Instruments (MKSI), FormFactor (FORM), and Apple (AAPL). All of these companies are operating close to their peak margins. They are also seeing strong revenue growth. These winners are clustered in the lower left quadrant of the chart.
Patience is required for companies still in investment mode that have yet to show financial results. The investments may be in operating expenses or capital equipment to open a new office, expand capacity or bring a new product to market. The level of investment can be measured by looking at a company’s potential operating margin and its current level. It may also be seen by comparing capex spending with the historical level of depreciation and amortization.
Reis (REIS), KVH Industries (KVHI), PDF Solutions (PDFS) and GSE Systems (GVP) are clustered in the upper right of the chart; they all remain in investment mode and detracted from the Fund’s performance in 2017. I expected more visible progress, but these companies made progress behind the scenes. All four are small or micro-cap companies, where there is less investor focus and a less efficient market. In all four cases, I believe 2018 may be a year of reward, but the timing may remain uncertain.
The Needham Funds Are Very Different from an Index
At Needham, we view our Funds’ public investments the same way venture capital investors view theirs. Months, quarters or even years can pass without markets recognizing progress behind the scenes that may lead to an above-market, compounding return. Consequently, the Needham Funds are not correlated with the averages, as shown by an R-Squared of 79.58 relative to the Russell 20004 for the Needham Aggressive Growth Fund; 68.63 relative to the Russell 2000 for the Needham Small Cap Growth Fund; and 59.63 relative to the S&P 5005 for the Needham Growth Fund.
As of December 31, 2017, Needham Aggressive Growth Fund owned stakes in 57 companies. The Fund’s top 10 holdings represent 57% of net assets. Therefore, the Fund has a very different constitution than the indices, as shown by its high Active Share6 of 112.7% versus the Russell 2000 Total Return Index. The other Needham Funds also have high Active Share—Needham Growth Fund is 107.4% versus the S&P 500 TR Index, and Needham Small Cap Growth Fund is 100.4% versus the Russell 2000. The bottom line is that I don’t try to rotate sectors to match or beat an index. I look to invest in companies that might earn an above market, compounding long-term return.
Needham Growth Fund (NEEGX/NEEIX)
The Needham Growth Fund Institutional class was down -2.40% and the Retail class was down -2.55% in the fourth quarter, underperforming the S&P 500, which returned 6.64%. For the year, Needham Growth Fund Institutional class returned 8.89% and the Retail class returned 8.32%, compared to the S&P 500’s return of 21.83%.
____________
4 Since inception on 9/4/01.
5 Since inception on 1/1/96.
6 Active Share represents the proportion of portfolio holdings that differ from those in the benchmark index.
Needham Funds
For the fourth quarter, ViaSat, Inc. (VSAT) was the top contributor and returned 16.4%. The ViaSat 2 high-throughput satellite launched and is prepared to go in service in early February. This satellite has twice the capacity of the next previous generation of High-throughput Satellite (HTS).
Akamai Technologies, Inc. (AKAM) was the second best contributor for the quarter and returned 33.5%. On December 15, activist investor Elliott Management announced a stake in Akamai. Elliott seeks to speak with Akamai about maximizing shareholder value. On January 9, 2018, Bloomberg reported that Akamai was working with Morgan Stanley on a strategic review. Our patience was rewarded.
Long-time holding Becton Dickinson and Co. (BDX) returned 9.6% and was the third leading contributor, as it closed the accretive acquisition of healthcare company C.R. Bard.
CarMax, Inc. (KMX) was the leading detractor in the fourth quarter, as comparable used car sales were up slightly less than Wall Street expectations, amid much ado about an upcoming peak in used car sales. CarMax is the nation’s leading seller of used cars. It offers a great dealership experience with professional salespeople and no price negotiation. With our long-term view, CarMax has the opportunity to grow from single-digit national market share. CarMax has barriers to entry from its scale. It knows the logistics of moving cars, and it knows more about what cars are worth than any other company. Consequently, CarMax can offer a fair price to the car seller and to the car buyer.
Short positions in Ubiquiti Networks, Inc. (UBNT) and Medallion Financial Corp. (MFIN) were detractors in the fourth quarter. Medallion Financial remains in default on a bank loan that we believe it will have difficulty repaying. Its bank sued in 2016, and they are due in court in February for a summary judgment hearing. This is a basic case of, “They didn’t pay and the bank wants its money back.” The stock was up 62.6% in the fourth quarter due to short-covering and as the momentum traders seized control.
KVH Industries, Inc. (KVHI) was the third-largest detractor, down -13.4%, despite a good earnings report, progress on its strategic plan, and an activist becoming its largest investor. KVH is a case of additional patience required. The company’s new AgilePlans offering bundles communications hardware, airtime, entertainment and operational content on a new high-throughput satellite network. KVH continued its work on a low-cost fiber optic gyroscope (FOG) for the autonomous vehicle market. These vehicles depend on many sensors, including FOGs, to know where they are. We estimate KVH is on almost all of the autonomous cars manufactured to date. Vintage Capital filed a 13G with the SEC to disclose it had acquired 1.5 million shares of KVH, or about 9% of KVH’s outstanding shares. Vintage has made successful investments in a number of small defense electronics companies, some of which were acquired.
For the year the Fund’s largest position, Thermo Fisher Scientific, Inc. (TMO), was the top performer and returned 35.0%. Thermo Fisher has a record of mid-single-digit revenue growth and mid-teens earnings growth. We see continued organic growth and acquisition opportunities in life science tools. Thermo Fisher is an 18-year holding of the Fund and has compounded at a near 18% annual rate.
Entegris, Inc. (ENTG) was the second top contributor in 2017, returning 70.5%. Entering 2017, we thought Entegris might generate $1.24 billion of revenue with $1.06 per share of earnings. Exiting 2017, we believe the year will be $1.33 billion of revenue and $1.40 per share of earnings.
FormFactor, Inc. (FORM) was the third top contributor in 2017, returning 39.7%. It provides wafer probe cards used to test integrated circuits. FormFactor benefitted from strong business across its customer base, including mobile phone customers, DRAM, logic (Intel [INTC] is their largest customer) and foundry with new business at Taiwan Semiconductor (TSM). Taiwan Semiconductor manufactures processors for Apple’s (AAPL) iPhones. FormFactor sees growing demand from the automotive market and from the RF (radio frequency) market.
As I wrote last quarter, the debate in semiconductor industry circles revolves around cyclical versus secular growth. Consensus is that the semiconductor equipment stocks will soon suffer in unison, owing to an overbuild in capacity. It is always dangerous to say, “This time is different.” However, among other market drivers, NAND memory is replacing disk drives in storage systems. Given the growth in data storage and the early stage of this replacement cycle, we believe the NAND memory and equipment makers could see growth for a number of years. Nonetheless, the stocks will have days or weeks when the “top is in” argument will rule. Entegris, FormFactor, MKS Instruments (MKSI) and Nova Measuring Instruments Ltd. (NVMI) all contributed to Needham Growth Fund’s performance in 2017.
The largest detractor in 2017 was PDF Solutions (PDFS), which was down -30.38%. Super Micro Computer, Inc. (SMCI) was the second largest detractor, down -25.4%. Super Micro supplies servers and network equipment and has many leading storage and data center companies as customers. It supplies a critical part of the web infrastructure. In August, Super Micro announced that it was unable to file its 10K for the June 2017 fiscal year. As of February 2018, it has yet to file and recently announced management changes, including the appointment of a new CFO, Kevin Bauer, whom we’ve known from previous companies. Apart from the accounting, Super Micro’s business is strong. We believe growth in fiscal year 2018 could reach 12% with expanding gross margins. The Fund has owned Super Micro for over eight years, and we believe in the company’s long-term vision to reach $5 billion of server and network equipment sales, up from $500 million when we first invested.
Electronics For Imaging (EFII) was the fourth largest detractor in 2017, down -32.7%. It also stumbled on accounting and delayed an earnings report, as it analyzed some revenue transactions. The company did not miss a filing date. However, EFI, did not grow revenue in 2017, after many years of double-digit growth.
In 2017, Needham Growth Fund nearly completed the exit of its long-term, successful holding of Express Scripts, Inc. (ESRX), which started the year as the Fund’s second-largest holding. We previously saw Express Scripts contributing to lowering costs in the U.S. healthcare system. Throughout 2017, that view became murkier and it appeared that Express Scripts was acting more as a rent-seeking middleman than an efficient delivery mechanism for prescription drugs.
Needham Funds
In 2017, the Fund did not add any positions of over 0.75%. The Fund added to PDF Solutions and Super Micro on price weaknesses. The Fund exited Varian Medical Systems, Inc. (VAR), Jabil Circuits, Inc. (JBL) and Brooks Automation, Inc. (BRKS) on valuation, and Financial Engines, Inc. (FNGN) and Dick’s Sporting Goods (DKS) over concern for their businesses.
As of December 31, 2017, the top 10 positions were 52.49% of net assets. The Fund had trailing 12-month turnover of just 9% and Active Share of 107.4% vs. the S&P 500.
Needham Aggressive Growth Fund (NEAGX/NEAIX)
Needham Aggressive Growth Fund Institutional class was down -2.84% in the fourth quarter and the Retail class was down -2.98%, compared to a 3.34% return for the Russell 2000. In 2017, the Needham Aggressive Growth Fund Institutional class returned 9.36% and the Retail class returned 8.73%.
Akamai was the Fund’s top contributor for the fourth quarter. Reis, Inc. (REIS) returned 15.7% and was the second leading contributor for the quarter. Reis licenses information to real estate investors, and its revenue growth returned to 5% in the third quarter, after several years of subpar growth. This return to growth has taken six months longer than I anticipated. I believe the new products and the additional sales resources could help Reis return to long-term, double-digit revenue growth and 40% operating margins in 2018.
Apple was the third leading contributor in the fourth quarter at 48.5%. iPhones and services exceeded expectations. Apple was purchased by my predecessor on the Fund in 2006, before the iPhone was introduced. I continue to believe Apple represents a compelling value with long-term growth opportunities, thus it stays in the Fund.
The short positions in Ubiquiti and Medallion Financial were top detractors in the fourth quarter.
2017 saw a mixture of stock performance from the Fund’s holdings. Of the Needham Aggressive Growth Fund’s top 10 holdings at the beginning of 2017, only three were major contributors. Seven were down and underperformed in 2017. The top contributor was Entegris, now the largest position in the Fund. Entegris supplies filters and chemicals used in advanced manufacturing processes, particularly for semiconductors. Semiconductor manufacturing plants require filters capable of capturing one contaminated drop of water in a day’s worth of water flowing over Niagara Falls, which is filtering one part in a quadrillion. Over 80% of Entegris’ revenue is from consumables used in the manufacturing process. Entegris reported strong March and June quarter results after a strong 2016. In October, Entegris announced that it would be paying its first dividend.
Apple was the second-largest contributor, and MKS Instruments, which returned 60.5%, was third. MKS provides instruments and subsystems that measure, control and power advanced processes, with semiconductor manufacturing being its largest market. MKS reported strong June quarter results and is benefitting from the strength of its customers, including Lam Research Corp. (LRCX) and Applied Materials. MKS also saw strong results from its Light and Motion segment, most of which it acquired last year as Newport Corporation.
Like the Needham Growth Fund, PDF Solutions, Super Micro, and KVH were top detractors for 2017.
PDF Solutions benefits from the need for low power semiconductors to provide longer battery lives for mobile phones and other devices. The company made very good progress with its new Design-for-Inspection offering, but its current business was below expectations throughout 2017. The company receives Gainshare royalties from semiconductors manufactured on lines where its technology has been used, and Solutions revenue from software and services. Royalties and Solutions revenues are largely irrelevant to the reasons I remain invested in PDF. I am enthusiastic about the Design-for-Inspection and Exensio Big Data analytics offerings, as well as the opportunity in China.
Design-for-Inspection (DFI) is sold to semiconductor design and manufacturing companies to determine whether leading edge semiconductors can be manufactured with high yield. Today, semiconductor manufacturing companies use light-based inspection systems to find problem areas on semiconductors. Today’s most advanced semiconductors have feature sizes that are about 20 atoms, and these features are very difficult to see with light. DFI software inserts billions of tiny test instruments on a semiconductor wafer. The wafer can then be analyzed electrically by a PDF-designed electron-beam microscope, called an eProbe. DFI may perform 10 billion electrical measurements on a single wafer, which produces a great deal of data. PDF’s Exensio Big Data analytics software is then used for analysis. DFI allows a manufacturing engineer to inspect a wafer to “detect the undetectables.” PDF’s business model for DFI is two-fold.
During its July 27 conference call, PDF mentioned that John Chen of NVIDIA Corporation (NVDA) was the keynote speaker at PDF’s User Meeting. This is the first confirmation that NVIDIA, a leader in computer graphics and artificial intelligence, with a $100 billion market cap, is interested in Design-for-Inspection. Importantly, the first eProbe 150 system, which was shipped to a customer in mid-2016, is being used in production by a leading semiconductor fab on programs from leading fabless semiconductor companies, including what we believe to be Apple for the processors on their latest phones. PDF originally intended the eProbe 150 to be used exclusively in engineering testing. On the third quarter 2017 conference call, the Gen-2 DFI customer demo was delayed into early 2018. I believe it is important for PDF to really understand how its customers can use DFI and fine-tune the applications. I believe they made good progress in 2017; it just wasn’t visible, nor expected to be visible, on the income statement. We are hopeful that visibility will improve in 2018. These investments take patience.
In 2017, we added positions in CyroPort (CYRX), Appian (APPN), DIRTT Environmental (DRT.TSE) and Markel Corporation (MKL). We also added a position in comScore (SCOR), thinking that its inability to file financials would be resolved in the summer of 2017. It has yet to file and its business growth has decreased. It’s hard to imagine comScore as a compounder; nonetheless, we bought the stock at an attractive price and believe there’s value yet to be recognized.
We exited our position in Norsat International, as the company was acquired. We also exited long-time holdings Bottomline Technologies (EPAY), Financial Engines, and Dick’s Sporting Goods.
At December 31, 2017, the Fund’s top 10 positions were 57.64% of net assets. The Fund had an Active Share of 112.7% versus the Russell 2000 and had trailing 12-month turnover of 15%.
Needham Funds
Needham Small Cap Growth Fund (NESGX/NESIX)
The Needham Small Cap Growth Fund Institutional class returned -1.13% and the Retail class returned -1.27% in the quarter ended December 31, 2017. For the year, the Fund’s Institutional class returned 12.48% and the Retail class returned 11.88%.
We were pleased with the Fund’s performance up until the last three weeks of 2017. Throughout the year, the Fund performed very well, with many of our concentrated positions outperforming the broader markets. However, in the last few weeks of December, we saw some of these positions decline due to some company-specific news items and an overall “sell the winners” trend in small cap stocks. Thankfully, some of this correction was regained in the early part of 2018. The market for small cap companies continues to offer good value; however, large cap stocks continue to outperform this asset category. The Fund continued its lean toward a concentrated portfolio of stocks, with the top 10 holdings representing 54.04% of net assets at December 31, 2017.
With the exception of the last three weeks of December, the Fund continued to show strength in the fourth quarter. Fear of an economic slowdown, along with geopolitical headline risks, quickly subsided by October, and the portfolio recovered from the summer lows. The Trump reflation trade returned as attention toward tax reform accelerated. While tax reform took longer than the markets had anticipated last December, we believe the full benefits of reforms have yet to be priced into the market completely.
Top holdings at December 31, 2017 included PDF Solutions, Pure Storage (PSTG), Amber Road (AMBR), Super Micro Computers (SMCI), and Invuity (IVTY). The Fund’s top fourth quarter contributors included Nutanix (NTNX), NeoPhotonics (NPTN), Reis (REIS), Aspen Aerogels (ASPN), and Air Lease Corporation (AL). The Fund’s largest fourth quarter detractors were Invuity, Agile Therapeutics (AGRX), FireEye (FEYE), KVH Industries, and Corium (CORI). With regard to Invuity’s poor performance throughout the quarter, we learned that a significant institutional shareholder of the stock has been facing redemptions, thereby forcing the sale of stock. We do not believe that the fundamental story of the company has changed, and we remain excited about its new product launches and future growth trajectory.
Agile Therapeutics was another disappointment, as the FDA did not give final approval for the company’s patch contraceptive product. The stock had been a strong contributor throughout the year and it was a big disappointment and surprise when approval was not received at the end of December. We believe the company has a good plan of action to continue to seek FDA approval, and we will monitor its progress throughout 2018. Corium was also affected by the Agile news, as it is the production partner for the new product. Corium’s stock reacted negatively with the FDA news, but has since recovered in 2018. There were no significant additions or deletions from the portfolio, but we trimmed some of our holdings as they achieved our price targets after significant appreciation. The Fund ended the quarter with a cash position of 8.8%. We remain excited about the composition of the portfolio as we enter 2018, and we look forward to learning about new small cap prospects this year.
We continue to believe that a good environment remains for investment in equities. Three themes we are focused on include: 1) continuation of the growth in the semiconductor capital equipment industry; 2) cyber-security; and 3) military and defense modernization. These three areas of investment impact much of our portfolio, and we believe that long term, they should create shareholder value.
We expect increased volatility in 2018, as we have already seen in the first week of February. The Federal Reserve continues to raise short-term interest rates, but at a gradual pace. We expect one more rate increase this year, in December. The expectation of pro-growth policies has boosted confidence for both individuals and corporations, and this should ultimately translate into higher economic activity for many of our portfolio companies. The high-yield markets remain strong, which is also supportive of the small cap asset class valuations. We reiterate from our last quarterly letter that mergers and acquisitions continued in the small cap universe, but have slowed since 2016. We believe this trend is a pause, and we expect to see increased M&A activity in 2018. We expect economic growth to improve and benefit our portfolio of stocks in 2018.
Closing
We believe the U.S. remains the best place in the world to be investing, and we continue to see an opportunity to invest in small and mid-cap stocks. Most importantly, we see a revolution happening in technology that has created and continues to create investment opportunities. We see opportunity in our strategy of investing in companies that we know well and that we believe are positioned with secular growth drivers.
We welcome our new investors and thank all of our investors for their continued support. If you have any questions, thoughts or concerns, please contact us at (800) 625-7071 or at cretzler@needhamco.com or jbarr@needhamco.com. For information about the funds, please visit our website at www.needhamfunds.com.
Sincerely,
| | |
 |  |
| Chris Retzler | John O. Barr |
| Portfolio Manager | Portfolio Manager |
Needham Funds Fact Sheet Links:
Needham Growth Fund
Needham Aggressive Growth Fund
Needham Small Cap Growth Fund
Needham Funds
The information presented in this commentary is not intended as personalized investment advice and does not constitute a recommendation to buy or sell a particular security or other investments. Past performance is no guarantee of future results. Not all investments have been profitable.
This message is not an offer of the Needham Growth Fund, the Needham Aggressive Growth Fund or the Needham Small Cap Growth Fund. Shares are sold only through the currently effective prospectus. Please read the prospectus carefully and consider the investment objectives, risks, and charges and expenses of the Fund carefully before you invest. The prospectus contains this and other information about the Fund. A copy of the prospectus is available at www.needhamfunds.com or by contacting the Fund’s transfer agent, U.S. Bancorp Fund Services, LLC at 1-800-625-7071.
All three of the Needham Funds have substantial exposure to small and micro capitalized companies. Funds holding smaller capitalized companies are subject to greater price fluctuation than those of larger companies.
Needham & Company, LLC, member FINRA/SIPC, is the distributor of The Needham Funds, Inc.
Portfolio holdings are subject to change. The Needham Funds ownership as a percentage of net assets in the stated securities as of 12/31/17:
| Security | Growth | Aggressive | Small Cap | | Security | Growth | Aggressive | Small Cap |
| AAPL | 0.41% | 5.84% | 0.00% | | IJR | -0.14% | 0.00% | 0.00% |
| AGRX | 0.30% | 0.25% | 2.10% | | IJS | -0.14% | 0.00% | 0.00% |
| AKAM | 2.94% | 6.34% | 0.22% | | INTC | 0.00% | 0.00% | 0.00% |
| AL | 2.07% | 0.00% | 1.83% | | IPGP | 1.16% | 2.61% | 0.00% |
| ALNA | 0.05% | 0.00% | 0.00% | | IRBT | 0.00% | 0.06% | 0.00% |
| ALTR | 0.06% | 0.06% | 0.06% | | IVTY | 0.65% | 0.46% | 4.71% |
| AMAT | 0.35% | 0.00% | 0.00% | | JBL | 0.00% | 0.00% | 0.00% |
| AMBR | 2.99% | 2.05% | 6.69% | | KMX | 5.19% | 2.24% | 0.00% |
| APPN | 0.28% | 0.38% | 0.27% | | KVHI | 4.96% | 6.31% | 3.39% |
| AQ | 0.41% | 0.37% | 0.76% | | LCRX | 0.00% | 0.00% | 0.00% |
| ASPN | 0.74% | 1.06% | 4.51% | | LMAT | 0.00% | 1.45% | 0.00% |
| BDX | 4.84% | 1.22% | 0.00% | | LRCX | 0.42% | 0.00% | 0.00% |
| BKRS | 0.00% | 0.00% | 0.00% | | MDT | 1.92% | 0.00% | 0.00% |
| BRKR | 0.23% | 0.00% | 0.00% | | MDXG | -0.06% | -0.10% | 0.00% |
| CASA | 0.12% | 0.00% | 0.11% | | MFIN | -0.81% | -1.59% | 0.00% |
| CLB | 0.05% | 0.00% | 0.00% | | MKL | 0.15% | 0.28% | 0.00% |
| CLH | 0.05% | 0.00% | 0.00% | | MKSI | 2.48% | 4.15% | 0.00% |
| CMCSA | 4.17% | 0.00% | 0.00% | | NATI | 0.78% | 0.61% | 0.00% |
| CNMD | 0.55% | 0.00% | 0.00% | | NPTN | 0.00% | 0.00% | 4.66% |
| CORI | 1.65% | 1.01% | 3.06% | | NTNX | 0.60% | 0.00% | 4.13% |
| COUP | 0.16% | 0.16% | 0.00% | | NVGS | 0.04% | 0.00% | 0.33% |
| CRAI | 0.00% | 0.37% | 0.00% | | NVMI | 1.50% | 2.93% | 0.00% |
| CSCO | 0.00% | 0.00% | 0.00% | | OAK | 0.76% | 0.00% | 0.00% |
Annual Report 2017
| Security | Growth | Aggressive | Small Cap | | Security | Growth | Aggressive | Small Cap |
| CSLT | 0.05% | 0.00% | 0.76% | | ODC | 0.67% | 3.03% | 0.00% |
| CUTR | -0.21% | 0.00% | -0.76% | | OMCL | 0.00% | 1.02% | 0.00% |
| CYRX | 0.00% | 1.01% | 0.00% | | PDFS | 4.97% | 8.35% | 8.47% |
| DKS | 0.52% | 0.47% | 0.00% | | PLAB | 1.16% | 1.35% | 2.44% |
| DRTTF | 0.00% | 0.87% | 0.00% | | PSTG | 0.63% | 0.00% | 6.96% |
| ECOM | 0.00% | 0.21% | 2.13% | | QTWO | 0.67% | 0.75% | 0.00% |
| EEI | 0.00% | 0.53% | 0.00% | | RDFN | 0.08% | 0.08% | 0.26% |
| EFII | 1.71% | 0.77% | 1.99% | | REIS | 1.53% | 4.02% | 4.53% |
| EGOV | 0.02% | 0.03% | 0.00% | | RHT | 0.98% | 0.00% | 0.00% |
| ENTG | 4.27% | 9.30% | 0.00% | | ROKU | 0.10% | 0.04% | 0.09% |
| EPAY | 0.00% | 0.00% | 0.00% | | SCOR | 1.81% | 1.85% | 3.17% |
| EQIX | 0.00% | 1.47% | 0.00% | | SLB | 0.30% | 0.00% | 0.00% |
| ESRX | 0.68% | 0.00% | 0.00% | | SMCI | 3.84% | 2.92% | 4.94% |
| EVBG | 0.07% | 0.07% | 0.00% | | SYPR | 0.09% | 0.00% | 0.00% |
| EXAS | 0.00% | 0.00% | 0.09% | | TMO | 7.73% | 0.00% | 0.00% |
| FEIM | 0.42% | 0.27% | 4.26% | | TREE | 0.00% | 0.00% | 0.57% |
| FEYE | 0.00% | 0.00% | 4.31% | | TSM | 0.00% | 0.00% | 0.00% |
| FLIR | 0.63% | 0.57% | 0.00% | | TTD | 0.41% | 0.30% | 0.00% |
| FNGN | 0.55% | 0.00% | 0.00% | | TWLO | 0.00% | 0.00% | 0.60% |
| FNKO | 0.05% | 0.04% | 0.00% | | TWOU | 0.23% | 0.21% | 0.44% |
| FORM | 5.03% | 4.39% | 0.96% | | UA | 0.09% | 0.00% | 0.00% |
| GILD | 5.67% | 1.69% | 0.00% | | UAL | 0.31% | 0.00% | 0.00% |
| GLW | 1.01% | 0.00% | 0.00% | | UBNT | -4.08% | -4.59% | 0.00% |
| GNMK | 0.08% | 0.00% | 0.84% | | VAR | 0.00% | 0.00% | 0.00% |
| GVP | 0.00% | 5.91% | 0.00% | | VICR | 0.38% | 2.38% | 0.00% |
| HES | 0.43% | 0.00% | 1.12% | | VPG | 0.00% | 0.33% | 1.70% |
| HIIQ | -0.19% | -0.33% | 0.00% | | VSAT | 5.66% | 2.07% | 0.51% |
| HON | 0.35% | 0.00% | 0.00% | | VSH | 1.13% | 0.00% | 0.00% |
| HQH | 0.00% | 0.00% | 2.09% | | WAGE | 1.26% | 2.82% | 0.00% |
| HQL | 0.00% | 0.00% | 2.15% | | WWE | 0.28% | 0.30% | 0.00% |
| ICHR | 0.00% | 0.00% | 0.50% | | XCRA | 0.00% | 0.08% | 0.00% |
| NEEDHAM GROWTH FUND | Retail Class |
| | Ticker Symbol: NEEGX |
| | Institutional Class |
| | Ticker Symbol: NEEIX |
Comparative Performance Statistics as of December 31, 2017
| | | | | | | | Gross |
| | 6 | 1 | 3 | 5 | 10 | Since | Expense |
| | Months(9) | Year | Years(10) | Years(10) | Years(10) | Inception(9) | Ratio(16) |
| Needham Growth Fund | | | | | | | |
Retail Class(1)(2) | 4.12% | 8.32% | 4.37%(11) | 10.79%(12) | 6.78%(13) | 12.64%(14) | 2.18% |
| Needham Growth Fund | | | | | | | |
Institutional Class(1)(3) | 4.41% | 8.89% | n/a | n/a | n/a | 8.86% | 1.74% |
S&P 500 Index(4)(5) | 11.42% | 21.83% | 11.41% | 15.79% | 8.50% | 8.94%(15) | |
NASDAQ Composite Index(4)(6) | 13.04% | 29.73% | 14.81% | 19.49% | 11.35% | 9.87%(15) | |
S&P 400 MidCap Index(4)(7) | 9.68% | 16.24% | 11.14% | 15.01% | 9.97% | 11.86%(15) | |
Russell 2000 Index(4)(8) | 9.20% | 14.65% | 9.96% | 14.12% | 8.71% | 8.89%(15) | |
Past performance does not guarantee future results. The performance data quoted represents past performance, and current returns may be lower or higher. The investment return and net asset value will fluctuate so that an investor’s shares, when redeemed, may be worth more or less than the original cost. To obtain performance information current to the most recent month-end, please call 1-800-625-7071. The returns shown in the above table and accompanying footnotes are net of expenses. The table above does not reflect the deduction of taxes that a shareholder would have paid on Fund distributions or on the redemption of Fund shares.
1. | Investment results calculated after reinvestment of dividends. |
| 2. | The inception date of the Retail Class was 1/1/96. |
| 3. | The inception date of the Institutional Class was 12/30/16. |
| 4. | It is not possible to invest directly in an index. The performance of the index does not include the deduction of expenses associated with a mutual fund, such as investment management fees. |
| 5. | The S&P 500 Index is a broad unmanaged measure of the U.S.stock market. |
| 6. | The NASDAQ Composite Index is a broad-based capitalization-weighted index of all NASDAQ Global Market and Small Cap stocks. |
| 7. | The S&P 400 MidCap Index is a broad unmanaged measure of the U.S. stock market. |
| 8. | The Russell 2000 Index is a broad unmanaged index composed of the smallest 2,000 companies in the Russell 3000 Index. |
| 9. | Not annualized. |
| 10. | Compound annual growth rate (annualized return). Assumes all dividends were reinvested in shares of the Retail Class. |
| 11. | Cumulative return for the three year period was 13.70%, assuming all dividends were reinvested in shares of the Retail Class. |
| 12. | Cumulative return for the five year period was 66.88%, assuming all dividends were reinvested in shares of the Retail Class. |
| 13. | Cumulative return for the ten year period was 92.77%, assuming all dividends were reinvested in shares of the Retail Class. |
| 14. | Cumulative return since inception was 1,270.77%, assuming all dividends were reinvested in shares of the Retail Class. |
| 15. | The return shown for the Index is from the Inception date of the Retail Class. |
| 16. | Gross expense ratio is from the Fund’s prospectus dated May 1, 2017. Additional information pertaining to the Fund’s expense ratios as of December 31, 2017 can be found in the financial highlights. Since January 1, 2009, the investment performance reflects contractually agreed upon fee waivers which expire at the close of business on April 30, 2018. Without these fee waivers, the performance would have been lower. Excluding the indirect costs of investing in acquired funds, total class operating expenses would be 2.17% and 1.73% for the Retail Class and Institutional Class, respectively. |
Annual Report 2017
| Top Ten Holdings* |
| (as a % of total investments, |
| as of December 31, 2017) |
| | | % of Total |
Security | | Investments |
| Thermo Fisher Scientific, Inc. | TMO | 7.82% |
| Gilead Sciences, Inc. | GILD | 5.74% |
| ViaSat, Inc. | VSAT | 5.72% |
| CarMax, Inc. | KMX | 5.25% |
| FormFactor, Inc. | FORM | 5.08% |
| PDF Solutions, Inc. | PDFS | 5.03% |
| KVH Industries, Inc. | KVHI | 5.01% |
| Becton Dickinson and Co. | BDX | 4.90% |
| Entegris, Inc. | ENTG | 4.32% |
| Comcast Corp., Class A | CMCSA | 4.21% |
Top Ten Holdings = 53.08% of Total Investments†
| * | Current portfolio holdings may not be indicative of future portfolio holdings. |
| † | Percentage of total investments less cash and short-term investments. |
| Sector Weightings* |
| (as a % of net investments, |
| as of December 31, 2017) |
Sector | Long(1)* | (Short)(1)* | Total(2) |
| Consumer Discretionary | 11.1% | — | 11.1% |
| Consumer Staples | 0.7% | — | 0.7% |
| Energy | 1.7% | — | 1.7% |
| Exchange Traded Funds | — | (0.3)% | (0.3)% |
| Finance and Insurance | — | (0.3)% | (0.3)% |
| Financials | 1.6% | (1.1)% | 0.5% |
| Health Care | 25.8% | (0.3)% | 25.5% |
| Industrials | 4.7% | — | 4.7% |
| Information Technology | 59.1% | (4.3)% | 54.8% |
| Real Estate | 0.1% | — | 0.1% |
| Cash | 1.5% | — | 1.5% |
| * | Current portfolio holdings may not be indicative of future portfolio holdings. |
(1) | Percentage of total investments includes all stocks, plus cash minus all short positions. |
(2) | Total represents the difference between the long exposure and the short exposure, which produces the net exposure. |
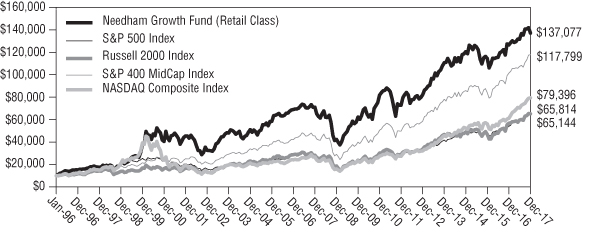
Comparison of Change in Value of a $10,000 Investment
Past performance does not guarantee future results. The performance data quoted represents past performance, and current returns may be lower or higher. The investment return and net asset value will fluctuate so that an investor’s shares, when redeemed, may be worth more or less than the original cost. To obtain performance information current to the most recent month-end, please call 1-800-625-7071. The graph above does not reflect the deduction of taxes that a shareholder would have paid on Fund distributions or on the redemption of Fund shares. Since inception, the Fund’s adviser has absorbed certain expenses of the Fund, without which returns would have been lower.
The Global Industry Classification Standard (GICS®) was developed by and/or is the exclusive property of MSCI, Inc. and Standard & Poor Financial Services LLC (“S&P”). GICS is a service mark of MSCI and S&P and has been licensed for use by U.S. Bancorp Fund Services, LLC.
| NEEDHAM AGGRESSIVE GROWTH FUND | Retail Class |
| | Ticker Symbol: NEAGX |
| | Institutional Class |
| | Ticker Symbol: NEAIX |
Comparative Performance Statistics as of December 31, 2017
| | | | | | | | Gross |
| | 6 | 1 | 3 | 5 | 10 | Since | Expense |
| | Months(8) | Year | Years(9) | Years(9) | Years(9) | Inception(9) | Ratio(15) |
| Needham Aggressive Growth | | | | | | | |
Fund Retail Class(1)(2) | 7.48% | 8.73% | 7.27%(10) | 12.51%(11) | 8.96%(12) | 9.52%(13) | 2.71% |
| Needham Aggressive Growth | | | | | | | |
Fund Institutional Class(1)(3) | 7.77% | 9.36% | n/a | n/a | n/a | 9.34% | 2.16% |
S&P 500 Index(4)(5) | 11.42% | 21.83% | 11.41% | 15.79% | 8.50% | 7.54%(14) | |
NASDAQ Composite Index(4)(6) | 13.04% | 29.73% | 14.81% | 19.49% | 11.35% | 9.71%(14) | |
Russell 2000 Index(4)(7) | 9.20% | 14.65% | 9.96% | 14.12% | 8.71% | 9.01%(14) | |
Past performance does not guarantee future results. The performance data quoted represents past performance, and current returns may be lower or higher. The investment return and net asset value will fluctuate so that an investor’s shares, when redeemed, may be worth more or less than the original cost. To obtain performance information current to the most recent month-end, please call 1-800-625-7071. The returns shown in the above table and accompanying footnotes are net of expenses. The table above does not reflect the deduction of taxes that a shareholder would have paid on Fund distributions or on the redemption of Fund shares.
| 1. | Investment results calculated after reinvestment of dividends. |
| 2. | The inception date of the Retail Class was 9/4/01. |
| 3. | The inception date of the Institutional Class was 12/30/16. |
| 4. | It is not possible to invest directly in an index. The performance of the index does not include the deduction of expenses associated with a mutual fund, such as investment management fees. |
| 5. | The S&P 500 Index is a broad unmanaged measure of the U.S. stock market. |
| 6. | The NASDAQ Composite Index is a broad-based capitalization-weighted index of all NASDAQ Global Market and Small Cap stocks. |
| 7. | The Russell 2000 Index is a broad unmanaged index composed of the smallest 2,000 companies in the Russell 3000 Index. |
| 8. | Not annualized. |
| 9. | Compound annual growth rate (annualized return). Assumes all dividends were reinvested in shares of the Retail Class. |
| 10. | Cumulative return for the three year period was 23.43%, assuming all dividends were reinvested in shares of the Retail Class. |
| 11. | Cumulative return for the five year period was 80.26%, assuming all dividends were reinvested in shares of the Retail Class. |
| 12. | Cumulative return for the ten year period was 135.87%, assuming all dividends were reinvested in shares of the Retail Class. |
| 13. | Cumulative return since inception was 341.39% assuming all dividends were reinvested in shares of the Retail Class. |
| 14. | The return shown for the Index is from the Inception date of the Retail Class. |
| 15. | Gross expense ratio is from the Fund’s prospectus dated May 1, 2017. Additional information pertaining to the Fund’s expense ratios as of December 31, 2017 can be found in the financial highlights. Since January 1, 2009, the investment performance reflects contractually agreed upon fee waivers which expire at the close of business on April 30, 2018. Without these fee waivers, the performance would have been lower. Excluding the indirect costs of investing in acquired funds, total class operating expenses would be 2.71% and 2.16% for the Retail Class and Institutional Class, respectively. |
| Top Ten Holdings* |
| (as a % of total investments, |
| as of December 31, 2017) |
| | | % of Total |
Security | | Investments |
| Entegris, Inc. | ENTG | 9.33% |
| PDF Solutions, Inc. | PDFS | 8.38% |
| Akamai Technologies, Inc. | AKAM | 6.36% |
| KVH Industries, Inc. | KVHI | 6.33% |
| GSE Systems, Inc. | GVP | 5.93% |
| Apple, Inc. | AAPL | 5.86% |
| FormFactor, Inc. | FORM | 4.40% |
| MKS Instruments, Inc. | MKSI | 4.16% |
| Reis, Inc. | REIS | 4.03% |
| Oil-Dri Corp. of America | ODC | 3.04% |
Top Ten Holdings = 57.82% of Total Investments†
| * | Current portfolio holdings may not be indicative of future portfolio holdings. |
| † | Percentage of total investments less cash and short-term investments. |
| Sector Weightings* |
| (as a % of net investments, |
| as of December 31, 2017) |
Sector | Long(1)* | (Short)(1)* | Total(2) |
| Consumer Discretionary | 3.4% | — | 3.4% |
| Consumer Staples | 3.2% | — | 3.2% |
| Energy | 1.1% | — | 1.1% |
| Financials | 0.3% | (2.1)% | (1.8)% |
| Health Care | 8.7% | (0.1)% | 8.6% |
| Industrials | 7.5% | — | 7.5% |
| Information Technology | 80.9% | (4.9)% | 76.0% |
| Real Estate | 1.8% | — | 1.8% |
| Cash | 0.2% | — | 0.2% |
| * | Current portfolio holdings may not be indicative of future portfolio holdings. |
(1) | Percentage of total investments includes all stocks, plus cash minus all short positions. |
(2) | Total represents the difference between the long exposure and the short exposure, which produces the net exposure. |
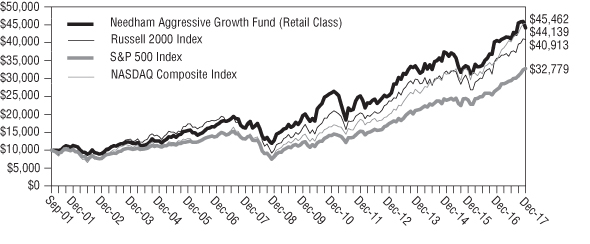
Comparison of Change in Value of a $10,000 Investment
Past performance does not guarantee future results. The performance data quoted represents past performance, and current returns may be lower or higher. The investment return and net asset value will fluctuate so that an investor’s shares, when redeemed, may be worth more or less than the original cost. To obtain performance information current to the most recent month-end, please call 1-800-625-7071. The graph above does not reflect the deduction of taxes that a shareholder would have paid on Fund distributions or on the redemption of Fund shares. Since inception, the Fund’s adviser has absorbed certain expenses of the Fund, without which returns would have been lower.
The Global Industry Classification Standard (GICS®) was developed by and/or is the exclusive property of MSCI, Inc. and Standard & Poor Financial Services LLC (“S&P”). GICS is a service mark of MSCI and S&P and has been licensed for use by U.S. Bancorp Fund Services, LLC.
| NEEDHAM SMALL CAP GROWTH FUND | Retail Class |
| | Ticker Symbol: NESGX |
| | Institutional Class |
| | Ticker Symbol: NESIX |
Comparative Performance Statistics as of December 31, 2017
| | | | | | | | Gross |
| | 6 | 1 | 3 | 5 | 10 | Since | Expense |
| | Months(8) | Year | Years(9) | Years(9) | Years(9) | Inception(9) | Ratio(15) |
| Needham Small Cap Growth | | | | | | | |
Fund Retail Class(1)(2) | 4.48% | 11.81% | 10.14%(10) | 11.49%(11) | 8.79%(12) | 10.39%(13) | 2.15% |
| Needham Small Cap Growth | | | | | | | |
Fund Institutional Class(1)(3) | 4.78% | 12.41% | n/a | n/a | n/a | 12.37% | 1.60% |
S&P 500 Index(4)(5) | 11.42% | 21.83% | 11.41% | 15.79% | 8.50% | 8.12%(14) | |
NASDAQ Composite Index(4)(6) | 13.04% | 29.73% | 14.81% | 19.49% | 11.35% | 10.73%(14) | |
Russell 2000 Index(4)(7) | 9.20% | 14.65% | 9.96% | 14.12% | 8.71% | 8.98%(14) | |
Past performance does not guarantee future results. The performance data quoted represents past performance, and current returns may be lower or higher. The investment return and net asset value will fluctuate so that an investor’s shares, when redeemed, may be worth more or less than the original cost. To obtain performance information current to the most recent month-end, please call 1-800-625-7071. The returns shown in the above table and accompanying footnotes are net of expenses. The table above does not reflect the deduction of taxes that a shareholder would have paid on Fund distributions or on the redemption of Fund shares.
| 1. | Investment results calculated after reinvestment of dividends. |
| 2. | The inception date of the Retail Class was 5/22/02. |
| 3. | The inception date of the Institutional Class was 12/30/16. |
| 4. | It is not possible to invest directly in an index. The performance of the index does not include the deduction of expenses associated with a mutual fund, such as investment management fees. |
| 5. | The S&P 500 Index is a broad unmanaged measure of the U.S. stock market. |
| 6. | The NASDAQ Composite Index is a broad-based capitalization-weighted index of all NASDAQ Global Market and Small Cap stocks. |
| 7. | The Russell 2000 Index is a broad unmanaged index composed of the smallest 2,000 companies in the Russell 3000 Index. |
| 8. | Not annualized. |
| 9. | Compound annual growth rate (annualized return). Assumes all dividends were reinvested in shares of the Retail Class. |
| 10. | Cumulative return for the three year period was 33.68%, assuming all dividends were reinvested in shares of the Retail Class. |
| 11. | Cumulative return for the five year period was 72.36%, assuming all dividends were reinvested in shares of the Retail Class. |
| 12. | Cumulative return for the ten year period was 132.27%, assuming all dividends were reinvested in shares of the Retail Class. |
| 13. | Cumulative return since inception was 368.19% assuming all dividends were reinvested in shares of the Retail Class. |
| 14. | The return shown for the Index is from the Inception date of the Retail Class. |
| 15. | Gross expense ratio is from the Fund’s prospectus dated May 1, 2017. Additional information pertaining to the Fund’s expense ratios as of December 31, 2017 can be found in the financial highlights. Since January 1, 2009, the investment performance reflects contractually agreed upon fee waivers which expire at the close of business on April 30, 2018. Without these fee waivers, the performance would have been lower. Excluding the indirect costs of investing in acquired funds, total class operating expenses would be 2.09% and 1.54% for the Retail Class and Institutional Class, respectively. |
| Top Ten Holdings* |
| (as a % of total investments, |
| as of December 31, 2017) |
| | | % of Total |
Security | | Investments |
| PDF Solutions, Inc. | PDFS | 9.14% |
| Pure Storage, Inc., Class A | PSTG | 7.50% |
| Amber Road, Inc. | AMBR | 7.21% |
| Super Micro Computer, Inc. | SMCI | 5.33% |
| Invuity, Inc. | IVTY | 5.08% |
| NeoPhotonics Corp. | NPTN | 5.03% |
| Reis, Inc. | REIS | 4.88% |
| Aspen Aerogels, Inc. | ASPN | 4.86% |
| FireEye, Inc. | FEYE | 4.65% |
| Frequency Electronics, Inc. | FEIM | 4.60% |
Top Ten Holdings = 61.09% of Total Investments†
| * | Current portfolio holdings may not be indicative of future portfolio holdings. |
| † | Percentage of total investments less cash and short-term investments. |
| Sector Weightings* |
| (as a % of net investments, |
| as of December 31, 2017) |
Sector | Long(1)* | (Short)(1)* | Total(2) |
| Closed-End Funds | 4.2% | — | 4.2% |
| Consumer Discretionary | 0.1% | — | 0.1% |
| Energy | 6.0% | — | 6.0% |
| Financials | 0.6% | — | 0.6% |
| Health Care | 11.5% | (0.8)% | 10.7% |
| Industrials | 1.8% | — | 1.8% |
| Information Technology | 67.6% | — | 67.6% |
| Real Estate | 0.3% | — | 0.3% |
| Cash | 8.7% | — | 8.7% |
| * | Current portfolio holdings may not be indicative of future portfolio holdings. |
(1) | Percentage of total investments includes all stocks, plus cash minus all short positions. |
(2) | Total represents the difference between the long exposure and the short exposure, which produces the net exposure. |
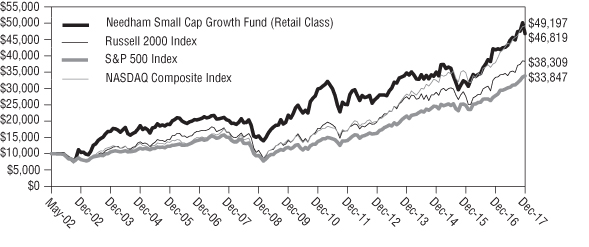
Comparison of Change in Value of a $10,000 Investment
Past performance does not guarantee future results. The performance data quoted represents past performance, and current returns may be lower or higher. The investment return and net asset value will fluctuate so that an investor’s shares, when redeemed, may be worth more or less than the original cost. To obtain performance information current to the most recent month-end, please call 1-800-625-7071. The graph above does not reflect the deduction of taxes that a shareholder would have paid on Fund distributions or on the redemption of Fund shares. Since inception, the Fund’s adviser has absorbed certain expenses of the Fund, without which returns would have been lower.
The Global Industry Classification Standard (GICS®) was developed by and/or is the exclusive property of MSCI, Inc. and Standard & Poor Financial Services LLC (“S&P”). GICS is a service mark of MSCI and S&P and has been licensed for use by U.S. Bancorp Fund Services, LLC.
Needham Funds
Disclosure of Fund Expenses (Unaudited)
The following expense table is shown so that you can understand the impact of fees on your investment. All mutual funds have operating expenses. As a shareholder of a Portfolio, you incur transactional costs, including redemption fees and ongoing costs, which include costs for portfolio management, administrative services, and shareholder reports, among others. A Portfolio’s expenses are expressed as a percentage of its average net assets. This figure is known as the expense ratio. The following examples are intended to help you understand the ongoing costs (in dollars) of investing in each Portfolio and to compare these costs with those of other mutual funds. The examples are based on an investment of $1,000 made at the beginning of the period shown and held for the entire period. The expense example table below illustrates your fund’s cost in two ways:
| • | Actual Expenses. This section helps you to estimate the actual expenses after fee waivers that you paid over the period. The “Ending Account Value” shown is derived from the Portfolio’s actual return, and “Expenses Paid During Period” shows the dollar amount that would have been paid by an investor who started with $1,000 in the Portfolio. You may use the information here, together with the amount you invested, to estimate the expenses that you paid over the period. To do so, simply divide your account value by $1,000 (for example, an $8,600 account value divided by $1,000 = 8.6), then multiply the result by the number given for your Portfolio under the heading entitled “Expenses Paid During Period”. |
| • | Hypothetical Expenses on a 5% Return. This section is intended to help you compare your Portfolio’s costs with those of other mutual funds. It assumes that the Portfolio had a return of 5% before expenses during the period shown, but that the expense ratio is unchanged. In this case, because the return used is not the Portfolio’s actual return, the results do not apply to your investment. The example is useful in making comparisons because the Securities and Exchange Commission requires all mutual funds to calculate expenses based on a 5% return. You can assess your Portfolio’s cost by comparing this hypothetical example with the hypothetical examples that appear in shareholders reports of other funds. |
Please note that the expenses shown in the table are meant to highlight your ongoing costs only and do not reflect any transactional costs, such as redemption fees or exchange fees. Therefore, the table is useful in comparing ongoing costs only, and will not help you determine the relative total costs of owning different funds. In addition, if these transactional costs were included, your costs would have been higher.
Annual Report 2017
For the Period July 1, 2017 to December 31, 2017
Expense Example Table
| | Beginning | Ending | Expenses Paid | Expense Ratio |
| | Account | Account | During Period* | During Period* |
| | Value | Value | 7/1/17 – | 7/1/17 – |
| | 7/1/17 | 12/31/17 | 12/31/17 | 12/31/17 |
| Needham Growth Fund | | | | |
| Retail Class Actual Expenses | $1,000.00 | $1,041.20 | $13.63 | 2.65% |
| Retail Class Hypothetical Example | | | | |
| for Comparison Purposes | | | | |
| (5% return before expenses) | $1,000.00 | $1,011.85 | $13.43 | 2.65% |
| Institutional Class Actual Expenses | $1,000.00 | $1,044.10 | $10.97 | 2.13% |
| Institutional Class Hypothetical | | | | |
| Example for Comparison Purposes | | | | |
| (5% return before expenses) | $1,000.00 | $1,014.47 | $10.81 | 2.13% |
| | | | | |
| Needham Aggressive Growth Fund | | | | |
| Retail Class Actual Expenses | $1,000.00 | $1,074.80 | $15.73 | 3.01% |
| Retail Class Hypothetical Example | | | | |
| for Comparison Purposes | | | | |
| (5% return before expenses) | $1,000.00 | $1,010.04 | $15.24 | 3.01% |
| Institutional Class Actual Expenses | $1,000.00 | $1,077.70 | $12.95 | 2.47% |
| Institutional Class Hypothetical | | | | |
| Example for Comparison Purposes | | | | |
| (5% return before expenses) | $1,000.00 | $1,012.74 | $12.54 | 2.47% |
| | | | | |
| Needham Small Cap Growth Fund | | | | |
| Retail Class Actual Expenses | $1,000.00 | $1,045.40 | $10.05 | 1.95% |
| Retail Class Hypothetical Example | | | | |
| for Comparison Purposes | | | | |
| (5% return before expenses) | $1,000.00 | $1,015.38 | $ 9.90 | 1.95% |
| Institutional Class Actual Expenses | $1,000.00 | $1,048.50 | $ 7.22 | 1.40% |
| Institutional Class Hypothetical | | | | |
| Example for Comparison Purposes | | | | |
| (5% return before expenses) | $1,000.00 | $1,018.15 | $ 7.11 | 1.40% |
| * | Expenses are equal to the average account value times the Portfolio’s annualized expense ratio multiplied 184/365 (to reflect the one-half-year period). |
Needham Funds
Needham Growth Fund
Schedule of Investments
December 31, 2017
| | | Shares | | | Value | |
| (Percentage of Net Assets) | | | | | | |
| | | | | | | |
| Common Stocks (98.9%) | | | | | | |
| | | | | | | |
| Airlines (0.3%) | | | | | | |
| United Continental Holdings, Inc.* | | | 5,000 | | | $ | 337,000 | |
| | | | | | | | | |
| Auto Components (0.1%) | | | | | | | | |
| Sypris Solutions, Inc.* | | | 76,000 | | | | 104,120 | |
| | | | | | | | | |
| Biotechnology (5.7%) | | | | | | | | |
| Allena Pharmaceuticals, Inc.* | | | 5,020 | | | | 50,501 | |
| Gilead Sciences, Inc.† | | | 87,500 | | | | 6,268,500 | |
| | | | | | | | 6,319,001 | |
| Capital Markets (1.3%) | | | | | | | | |
| Financial Engines, Inc.† | | | 20,000 | | | | 606,000 | |
| Oaktree Capital Group LLC, Class A | | | 20,000 | | | | 842,000 | |
| | | | | | | | 1,448,000 | |
| Commercial Services & Supplies (0.0%) | | | | | | | | |
| Clean Harbors, Inc.* | | | 1,000 | | | | 54,200 | |
| | | | | | | | | |
| Communications Equipment (10.7%) | | | | | | | | |
| Casa Systems, Inc.* | | | 7,354 | | | | 130,607 | |
| KVH Industries, Inc.* | | | 529,375 | | | | 5,479,031 | |
| ViaSat, Inc.*† | | | 83,500 | | | | 6,249,975 | |
| | | | | | | | 11,859,613 | |
| Distributors (0.0%) | | | | | | | | |
| Funko, Inc., Class A* | | | 7,497 | | | | 49,855 | |
| | | | | | | | | |
| Electrical Equipment (0.4%) | | | | | | | | |
| Vicor Corp.* | | | 20,000 | | | | 418,000 | |
| | | | | | | | | |
| Electronic Equipment, Instruments & Components (5.1%) | | | | | | | | |
| Corning, Inc. | | | 35,000 | | | | 1,119,650 | |
| FLIR Systems, Inc. | | | 15,000 | | | | 699,300 | |
| Frequency Electronics, Inc.* | | | 50,000 | | | | 468,000 | |
| IPG Photonics Corp.* | | | 6,000 | | | | 1,284,780 | |
| National Instruments Corp. | | | 20,800 | | | | 865,904 | |
| Vishay Intertechnology, Inc. | | | 60,000 | | | | 1,245,000 | |
| | | | | | | | 5,682,634 | |
See accompanying notes to financial statements.
Annual Report 2017
Needham Growth Fund
Schedule of Investments (Continued)
December 31, 2017
| | | Shares | | | Value | |
| Common Stocks – Continued | | | | | | |
| | | | | | | |
| Energy Equipment & Services (1.1%) | | | | | | |
| Aspen Aerogels, Inc.* | | | 167,600 | | | $ | 817,888 | |
| Core Laboratories NV (Netherlands) | | | 500 | | | | 54,775 | |
| Schlumberger Ltd. (Netherlands) | | | 5,000 | | | | 336,950 | |
| | | | | | | | 1,209,613 | |
| Health Care Equipment & Supplies (8.0%) | | | | | | | | |
| Becton Dickinson and Co. | | | 25,000 | | | | 5,351,500 | |
| CONMED Corp. | | | 12,000 | | | | 611,640 | |
| GenMark Diagnostics, Inc.* | | | 20,000 | | | | 83,400 | |
| Invuity, Inc.* | | | 115,000 | | | | 713,000 | |
| Medtronic PLC (Ireland) | | | 26,290 | | | | 2,122,918 | |
| | | | | | | | 8,882,458 | |
| Health Care Providers & Services (0.7%) | | | | | | | | |
| Express Scripts Holding Co.*† | | | 10,000 | | | | 746,400 | |
| | | | | | | | | |
| Health Care Technology (0.1%) | | | | | | | | |
| Castlight Health, Inc., Class B* | | | 15,000 | | | | 56,250 | |
| | | | | | | | | |
| Household Durables (0.1%) | | | | | | | | |
| Roku, Inc., Class A* | | | 2,085 | | | | 107,961 | |
| | | | | | | | | |
| Household Products (0.7%) | | | | | | | | |
| Oil-Dri Corp. of America | | | 17,800 | | | | 738,700 | |
| | | | | | | | | |
| Industrial Conglomerates (0.3%) | | | | | | | | |
| Honeywell International, Inc. | | | 2,500 | | | | 383,400 | |
| | | | | | | | | |
| Insurance (0.2%) | | | | | | | | |
| Markel Corp.* | | | 150 | | | | 170,870 | |
| | | | | | | | | |
| Internet Software & Services (11.4%) | | | | | | | | |
| The Trade Desk, Inc., Class A* | | | 10,000 | | | | 457,300 | |
| 2U, Inc.* | | | 4,000 | | | | 258,040 | |
| Akamai Technologies, Inc.*† | | | 50,000 | | | | 3,252,000 | |
| Amber Road, Inc.* | | | 450,000 | | | | 3,303,000 | |
| comScore, Inc.* | | | 70,200 | | | | 2,000,700 | |
| Coupa Software, Inc.* | | | 5,700 | | | | 177,954 | |
| NIC, Inc. | | | 1,500 | | | | 24,900 | |
See accompanying notes to financial statements.
Needham Funds
Needham Growth Fund
Schedule of Investments (Continued)
December 31, 2017
| | | Shares | | | Value | |
| Common Stocks – Continued | | | | | | |
| | | | | | | |
| Internet Software & Services – Continued | | | | | | |
| Nutanix, Inc.* | | | 18,800 | | | $ | 663,264 | |
| Q2 Holdings, Inc.* | | | 20,000 | | | | 737,000 | |
| Reis, Inc. | | | 82,000 | | | | 1,693,300 | |
| | | | | | | | 12,567,458 | |
| Life Sciences Tools & Services (8.0%) | | | | | | | | |
| Bruker Corp. | | | 7,500 | | | | 257,400 | |
| Thermo Fisher Scientific, Inc.† | | | 45,000 | | | | 8,544,600 | |
| | | | | | | | 8,802,000 | |
| Media (4.4%) | | | | | | | | |
| Comcast Corp., Class A | | | 115,000 | | | | 4,605,750 | |
| World Wrestling Entertainment, Inc., Class A | | | 10,000 | | | | 305,800 | |
| | | | | | | | 4,911,550 | |
| Oil, Gas & Consumable Fuels (0.5%) | | | | | | | | |
| Hess Corp. | | | 10,000 | | | | 474,700 | |
| Navigator Holdings Ltd.* (United Kingdom) | | | 5,000 | | | | 49,250 | |
| | | | | | | | 523,950 | |
| Pharmaceuticals (1.9%) | | | | | | | | |
| Agile Therapeutics, Inc.* | | | 121,294 | | | | 326,281 | |
| Corium International, Inc.* | | | 190,000 | | | | 1,825,900 | |
| | | | | | | | 2,152,181 | |
| Professional Services (1.3%) | | | | | | | | |
| WageWorks, Inc.* | | | 22,500 | | | | 1,395,000 | |
| | | | | | | | | |
| Real Estate Management & Development (0.1%) | | | | | | | | |
| Redfin Corp.* | | | 2,993 | | | | 93,741 | |
| | | | | | | | | |
| Semiconductors & Semiconductor Equipment (20.6%) | | | | | | | | |
| Applied Materials, Inc. | | | 7,500 | | | | 383,400 | |
| Aquantia Corp.* | | | 40,000 | | | | 453,200 | |
| Entegris, Inc. | | | 155,000 | | | | 4,719,750 | |
| FormFactor, Inc.* | | | 355,000 | | | | 5,555,750 | |
| Lam Research Corp. | | | 2,500 | | | | 460,175 | |
| MKS Instruments, Inc. | | | 29,000 | | | | 2,740,500 | |
See accompanying notes to financial statements.
Annual Report 2017
Needham Growth Fund
Schedule of Investments (Continued)
December 31, 2017
| | | Shares | | | Value | |
| Common Stocks – Continued | | | | | | |
| | | | | | | |
| Semiconductors & Semiconductor Equipment – Continued | | | | | | |
| Nova Measuring Instruments Ltd.* (Israel) | | | 64,000 | | | $ | 1,658,240 | |
| PDF Solutions, Inc.* | | | 350,000 | | | | 5,495,000 | |
| Photronics, Inc.* | | | 150,000 | | | | 1,278,750 | |
| | | | | | | | 22,744,765 | |
| Software (1.4%) | | | | | | | | |
| Altair Engineering, Inc., Class A* | | | 2,996 | | | | 71,664 | |
| Appian Corp., Class A* | | | 10,000 | | | | 314,800 | |
| Everbridge, Inc.* | | | 2,500 | | | | 74,300 | |
| Red Hat, Inc.* | | | 9,000 | | | | 1,080,900 | |
| | | | | | | | 1,541,664 | |
| Specialty Retail (5.7%) | | | | | | | | |
| CarMax, Inc.*† | | | 89,500 | | | | 5,739,635 | |
| Dick’s Sporting Goods, Inc. | | | 20,000 | | | | 574,800 | |
| | | | | | | | 6,314,435 | |
| Technology Hardware, Storage & Peripherals (6.6%) | | | | | | | | |
| Apple, Inc. | | | 2,700 | | | | 456,921 | |
| Electronics For Imaging, Inc.* | | | 64,000 | | | | 1,889,920 | |
| Pure Storage, Inc., Class A* | | | 44,000 | | | | 697,840 | |
| Super Micro Computer, Inc.* | | | 202,900 | | | | 4,245,682 | |
| | | | | | | | 7,290,363 | |
| Textiles, Apparel & Luxury Goods (0.1%) | | | | | | | | |
| Under Armour, Inc., Class C* | | | 7,483 | | | | 99,674 | |
| | | | | | | | | |
| Trading Companies & Distributors (2.1%) | | | | | | | | |
| Air Lease Corp., Class A | | | 47,500 | | | | 2,284,275 | |
| | | | | | | | | |
| Total Common Stocks | | | | | | | | |
| (Cost $49,393,998) | | | | | | $ | 109,289,131 | |
See accompanying notes to financial statements.
Needham Funds
Needham Growth Fund
Schedule of Investments (Continued)
December 31, 2017
| | | Shares | | | Value | |
| Short-Term Investments (1.1%) | | | | | | |
| | | | | | | |
| Money Market Fund (1.1%) | | | | | | |
| Dreyfus Treasury Securities Cash Management – | | | | | | |
| Institutional Class 1.11% (a) | | | | | | |
| (Cost $1,262,813) | | | 1,262,813 | | | $ | 1,262,813 | |
| | | | | | | | | |
| Total Investments (100.0%) | | | | | | | | |
| (Cost $50,656,811) | | | | | | | 110,551,944 | |
| Total Securities Sold Short (-5.6%) | | | | | | | (6,202,598 | ) |
| (Proceeds $3,424,005) | | | | | | | | |
| Other Assets in Excess of Liabilities (5.6%) | | | | | | | 6,140,497 | |
| Net Assets (100.0%) | | | | | | $ | 110,489,843 | |
| * | Non-income producing security. |
| (a) | Rate shown is the seven-day yield as of December 31, 2017. |
| † | Security position is either entirely or partially held in a segregated account as collateral for securities sold short, aggregating a total market value of $5,621,050. |
| | The Global Industry Classification Standard (GICS®) was developed by and/or is the exclusive property of MSCI, Inc. and Standard & Poor’s Financial Services LLC (“S&P”). GICS is a service mark of MSCI and S&P and has been licensed for use by U.S. Bancorp Fund Services, LLC. |
See accompanying notes to financial statements.
Annual Report 2017
Needham Growth Fund
Schedule of Securities Sold Short
December 31, 2017
| | | Shares | | | Value | |
| Securities Sold Short (-5.3%) | | | | | | |
| | | | | | | |
| Biotechnology (0.0%) | | | | | | |
| MiMedx Group, Inc.* | | | 5,000 | | | $ | 63,050 | |
| | | | | | | | | |
| Capital Markets (-0.8%) | | | | | | | | |
| Medallion Financial Corp.* | | | 250,000 | | | | 890,000 | |
| | | | | | | | | |
| Communications Equipment (-4.1%) | | | | | | | | |
| Ubiquiti Networks, Inc.* | | | 63,500 | | | | 4,509,770 | |
| | | | | | | | | |
| Health Care Equipment & Supplies (-0.2%) | | | | | | | | |
| Cutera, Inc.* | | | 5,000 | | | | 226,750 | |
| | | | | | | | | |
| Insurance (-0.2%) | | | | | | | | |
| Health Insurance Innovations, Inc., Class A* | | | 8,250 | | | | 205,838 | |
| | | | | | | | | |
| Total Securities Sold Short (-5.3%) | | | | | | | | |
| (Proceeds $3,169,401) | | | | | | $ | 5,895,408 | |
| | | | | | | | | |
| Exchange Traded Funds Sold Short (-0.3%) | | | | | | | | |
| iShares Core S&P Small-Cap ETF | | | 2,000 | | | | 153,620 | |
| iShares S&P Small-Cap 600 Value ETF | | | 1,000 | | | | 153,570 | |
| | | | | | | | 307,190 | |
| | | | | | | | | |
| Total Exchange Traded Funds Sold Short (-0.3%) | | | | | | | | |
| (Proceeds $254,604) | | | | | | $ | 307,190 | |
| | | | | | | | | |
| Total Securities & Exchange Traded Funds Sold Short (-5.6%) | | | | | | | | |
| (Proceeds $3,424,005) | | | | | | $ | 6,202,598 | |
| * | Non-income producing security. |
See accompanying notes to financial statements.
Needham Funds
Needham Aggressive Growth Fund
Schedule of Investments
December 31, 2017
| | | Shares | | | Value | |
| (Percentage of Net Assets) | | | | | | |
| | | | | | | |
| Common Stocks (99.7%) | | | | | | |
| | | | | | | |
| Biotechnology (1.7%) | | | | | | |
| Gilead Sciences, Inc.† | | | 14,500 | | | $ | 1,038,780 | |
| | | | | | | | | |
| Building Products (0.9%) | | | | | | | | |
| DIRTT Environmental Solutions* (Canada) | | | 100,000 | | | | 536,000 | |
| | | | | | | | | |
| Commercial Services & Supplies (0.5%) | | | | | | | | |
| Ecology and Environment, Inc., Class A | | | 31,000 | | | | 325,500 | |
| | | | | | | | | |
| Communications Equipment (8.4%) | | | | | | | | |
| KVH Industries, Inc.*† | | | 375,000 | | | | 3,881,250 | |
| ViaSat, Inc.*† | | | 17,000 | | | | 1,272,450 | |
| | | | | | | | 5,153,700 | |
| Distributors (0.0%) | | | | | | | | |
| Funko, Inc., Class A* | | | 4,022 | | | | 26,746 | |
| | | | | | | | | |
| Electrical Equipment (2.4%) | | | | | | | | |
| Vicor Corp.* | | | 70,000 | | | | 1,463,000 | |
| | | | | | | | | |
| Electronic Equipment, Instruments & Components (4.4%) | | | | | | | | |
| FLIR Systems, Inc. | | | 7,500 | | | | 349,650 | |
| Frequency Electronics, Inc.* | | | 17,950 | | | | 168,012 | |
| IPG Photonics Corp.* | | | 7,500 | | | | 1,605,975 | |
| National Instruments Corp. | | | 9,000 | | | | 374,670 | |
| Vishay Precision Group, Inc.* | | | 8,000 | | | | 201,200 | |
| | | | | | | | 2,699,507 | |
| Energy Equipment & Services (1.1%) | | | | | | | | |
| Aspen Aerogels, Inc.* | | | 133,600 | | | | 651,968 | |
| | | | | | | | | |
| Health Care Equipment & Supplies (4.1%) | | | | | | | | |
| Becton Dickinson and Co. | | | 3,500 | | | | 749,210 | |
| CryoPort, Inc.* | | | 72,500 | | | | 622,775 | |
| Invuity, Inc.* | | | 46,000 | | | | 285,200 | |
| LeMaitre Vascular, Inc. | | | 28,000 | | | | 891,520 | |
| | | | | | | | 2,548,705 | |
| Health Care Technology (1.0%) | | | | | | | | |
| Omnicell, Inc.* | | | 13,000 | | | | 630,500 | |
See accompanying notes to financial statements.
Annual Report 2017
Needham Aggressive Growth Fund
Schedule of Investments (Continued)
December 31, 2017
| | | Shares | | | Value | |
| Common Stocks – Continued | | | | | | |
| | | | | | | |
| Household Durables (0.1%) | | | | | | |
| iRobot Corp.* | | | 500 | | | $ | 38,350 | |
| Roku, Inc., Class A* | | | 500 | | | | 25,890 | |
| | | | | | | | 64,240 | |
| Household Products (3.0%) | | | | | | | | |
| Oil-Dri Corp. of America | | | 45,000 | | | | 1,867,500 | |
| | | | | | | | | |
| Insurance (0.3%) | | | | | | | | |
| Markel Corp.* | | | 150 | | | | 170,870 | |
| | | | | | | | | |
| Internet Software & Services (15.9%) | | | | | | | | |
| The Trade Desk, Inc., Class A* | | | 4,000 | | | | 182,920 | |
| 2U, Inc.* | | | 2,000 | | | | 129,020 | |
| Akamai Technologies, Inc.*† | | | 60,000 | | | | 3,902,400 | |
| Amber Road, Inc.*† | | | 171,650 | | | | 1,259,911 | |
| ChannelAdvisor Corp.* | | | 14,117 | | | | 127,053 | |
| comScore, Inc.* | | | 40,000 | | | | 1,140,000 | |
| Coupa Software, Inc.* | | | 3,200 | | | | 99,904 | |
| NIC, Inc. | | | 1,000 | | | | 16,600 | |
| Q2 Holdings, Inc.* | | | 12,500 | | | | 460,625 | |
| Reis, Inc.† | | | 119,700 | | | | 2,471,805 | |
| | | | | | | | 9,790,238 | |
| Media (0.3%) | | | | | | | | |
| World Wrestling Entertainment, Inc., Class A | | | 6,000 | | | | 183,480 | |
| | | | | | | | | |
| Pharmaceuticals (1.3%) | | | | | | | | |
| Agile Therapeutics, Inc.* | | | 56,250 | | | | 151,313 | |
| Corium International, Inc.* | | | 64,797 | | | | 622,699 | |
| | | | | | | | 774,012 | |
| Professional Services (3.2%) | | | | | | | | |
| CRA International, Inc. | | | 5,000 | | | | 224,750 | |
| WageWorks, Inc.*† | | | 28,000 | | | | 1,736,000 | |
| | | | | | | | 1,960,750 | |
| Real Estate Investment Trusts (REITs) (1.5%) | | | | | | | | |
| Equinix, Inc. | | | 2,000 | | | | 906,440 | |
See accompanying notes to financial statements.
Needham Funds
Needham Aggressive Growth Fund
Schedule of Investments (Continued)
December 31, 2017
| | | Shares | | | Value | |
| Common Stocks – Continued | | | | | | |
| | | | | | | |
| Real Estate Management & Development (0.1%) | | | | | | |
| Redfin Corp.* | | | 1,637 | | | $ | 51,271 | |
| | | | | | | | | |
| Semiconductors & Semiconductor Equipment (30.9%) | | | | | | | | |
| Aquantia Corp.* | | | 20,000 | | | | 226,600 | |
| Entegris, Inc. | | | 188,000 | | | | 5,724,600 | |
| FormFactor, Inc.* | | | 172,600 | | | | 2,701,190 | |
| MKS Instruments, Inc. | | | 27,000 | | | | 2,551,500 | |
| Nova Measuring Instruments Ltd.*† (Israel) | | | 69,500 | | | | 1,800,745 | |
| PDF Solutions, Inc.*† | | | 327,500 | | | | 5,141,750 | |
| Photronics, Inc.* | | | 97,750 | | | | 833,319 | |
| Xcerra Corp.* | | | 5,000 | | | | 48,950 | |
| | | | | | | | 19,028,654 | |
| Software (6.4%) | | | | | | | | |
| Altair Engineering, Inc., Class A* | | | 1,620 | | | | 38,750 | |
| Appian Corp., Class A* | | | 7,500 | | | | 236,100 | |
| Everbridge, Inc.* | | | 1,500 | | | | 44,580 | |
| GSE Systems, Inc.*^ | | | 1,120,000 | | | | 3,640,000 | |
| | | | | | | | 3,959,430 | |
| Specialty Retail (2.7%) | | | | | | | | |
| CarMax, Inc.*† | | | 21,500 | | | | 1,378,795 | |
| Dick’s Sporting Goods, Inc. | | | 10,000 | | | | 287,400 | |
| | | | | | | | 1,666,195 | |
| Technology Hardware, Storage & Peripherals (9.5%) | | | | | | | | |
| Apple, Inc.† | | | 21,250 | | | | 3,596,137 | |
| Electronics For Imaging, Inc.* | | | 16,000 | | | | 472,480 | |
| Super Micro Computer, Inc.*† | | | 85,800 | | | | 1,795,365 | |
| | | | | | | | 5,863,982 | |
| Total Common Stocks | | | | | | | | |
| (Cost $28,193,419) | | | | | | $ | 61,361,468 | |
See accompanying notes to financial statements.
Annual Report 2017
Needham Aggressive Growth Fund
Schedule of Investments (Continued)
December 31, 2017
| | | Shares | | | Value | |
| Short-Term Investments (0.3%) | | | | | | |
| | | | | | | |
| Money Market Fund (0.3%) | | | | | | |
| Dreyfus Treasury Securities Cash Management – | | | | | | |
| Institutional Class, 1.11% (a) | | | | | | |
| (Cost $192,261) | | | 192,261 | | | $ | 192,261 | |
| | | | | | | | | |
| Total Investments (100.0%) | | | | | | | | |
| (Cost $28,385,680) | | | | | | | 61,553,729 | |
| Total Securities Sold Short (-6.6%) | | | | | | | (4,070,933 | ) |
| (Proceeds $2,523,894) | | | | | | | | |
| Other Assets in Excess of Liabilities (6.6%) | | | | | | | 4,064,916 | |
| Net Assets (100.0%) | | | | | | $ | 61,547,712 | |
| * | Non-income producing security. |
| ^ | Affiliated security. Please refer to Note 11 of the Notes to Financial Statements. |
| (a) | Rate shown is the seven-day yield as of December 31, 2017. |
| † | Security position is either entirely or partially held in a segregated account as collateral for securities sold short, aggregating a total market value of $5,784,355. |
| | The Global Industry Classification Standard (GICS®) was developed by and/or is the exclusive property of MSCI, Inc. and Standard & Poor’s Financial Services LLC (“S&P”). GICS is a service mark of MSCI and S&P and has been licensed for use by U.S. Bancorp Fund Services, LLC. |
See accompanying notes to financial statements.
Needham Funds
Needham Aggressive Growth Fund
Schedule of Securities Sold Short
December 31, 2017
| | | Shares | | | Value | |
| Securities Sold Short (-6.6%) | | | | | | |
| | | | | | | |
| Biotechnology (-0.1%) | | | | | | |
| MiMedx Group, Inc.* | | | 5,000 | | | $ | 63,050 | |
| | | | | | | | | |
| Capital Markets (-1.6%) | | | | | | | | |
| Medallion Financial Corp.* | | | 275,000 | | | | 979,000 | |
| | | | | | | | | |
| Communications Equipment (-4.6%) | | | | | | | | |
| Ubiquiti Networks, Inc.* | | | 39,750 | | | | 2,823,045 | |
| | | | | | | | | |
| Insurance (-0.3%) | | | | | | | | |
| Health Insurance Innovations, Inc., Class A* | | | 8,250 | | | | 205,838 | |
| | | | | | | | | |
| Total Securities Sold Short (-6.6%) | | | | | | | | |
| (Proceeds $2,523,894) | | | | | | $ | 4,070,933 | |
| * | Non-income producing security. |
See accompanying notes to financial statements.
Annual Report 2017
Needham Small Cap Growth Fund
Schedule of Investments
December 31, 2017
| | | Shares | | | Value | |
| (Percentage of Net Assets) | | | | | | |
| | | | | | | |
| Common Stocks (88.5%) | | | | | | |
| | | | | | | |
| Biotechnology (0.1%) | | | | | | |
| Exact Sciences Corp.* | | | 500 | | | $ | 26,270 | |
| | | | | | | | | |
| Communications Equipment (4.0%) | | | | | | | | |
| Casa Systems, Inc.* | | | 1,911 | | | | 33,939 | |
| KVH Industries, Inc.*† | | | 97,000 | | | | 1,003,950 | |
| ViaSat, Inc.* | | | 2,000 | | | | 149,700 | |
| | | | | | | | 1,187,589 | |
| Electronic Equipment, Instruments & Components (6.0%) | | | | | | | | |
| Frequency Electronics, Inc.* | | | 135,000 | | | | 1,263,600 | |
| Vishay Precision Group, Inc.* | | | 20,000 | | | | 503,000 | |
| | | | | | | | 1,766,600 | |
| Energy Equipment & Services (4.5%) | | | | | | | | |
| Aspen Aerogels, Inc.* | | | 273,800 | | | | 1,336,144 | |
| | | | | | | | | |
| Health Care Equipment & Supplies (5.5%) | | | | | | | | |
| GenMark Diagnostics, Inc.* | | | 60,000 | | | | 250,200 | |
| Invuity, Inc.* | | | 225,000 | | | | 1,395,000 | |
| | | | | | | | 1,645,200 | |
| Health Care Technology (0.8%) | | | | | | | | |
| Castlight Health, Inc., Class B* | | | 60,000 | | | | 225,000 | |
| | | | | | | | | |
| Household Durables (0.1%) | | | | | | | | |
| Roku, Inc., Class A* | | | 530 | | | | 27,443 | |
| | | | | | | | | |
| Internet Software & Services (21.9%) | | | | | | | | |
| 2U, Inc.* | | | 2,000 | | | | 129,020 | |
| Akamai Technologies, Inc.* | | | 1,000 | | | | 65,040 | |
| Amber Road, Inc.*† | | | 270,000 | | | | 1,981,800 | |
| ChannelAdvisor Corp.* | | | 70,000 | | | | 630,000 | |
| comScore, Inc.* | | | 33,000 | | | | 940,500 | |
| Nutanix, Inc., Class A* | | | 34,700 | | | | 1,224,216 | |
| Reis, Inc.† | | | 65,000 | | | | 1,342,250 | |
| Twilio, Inc., Class A* | | | 7,500 | | | | 177,000 | |
| | | | | | | | 6,489,826 | |
See accompanying notes to financial statements.
Needham Funds
Needham Small Cap Growth Fund
Schedule of Investments (Continued)
December 31, 2017
| | | Shares | | | Value | |
| Common Stocks – Continued | | | | | | |
| | | | | | | |
| Oil, Gas & Consumable Fuels (1.4%) | | | | | | |
| Hess Corp. | | | 7,000 | | | $ | 332,290 | |
| Navigator Holdings Ltd.* (United Kingdom) | | | 10,000 | | | | 98,500 | |
| | | | | | | | 430,790 | |
| Pharmaceuticals (5.2%) | | | | | | | | |
| Agile Therapeutics, Inc.* | | | 231,294 | | | | 622,181 | |
| Corium International, Inc.* | | | 94,250 | | | | 905,742 | |
| | | | | | | | 1,527,923 | |
| Real Estate Management & Development (0.3%) | | | | | | | | |
| Redfin Corp.* | | | 2,500 | | | | 78,300 | |
| | | | | | | | | |
| Semiconductors & Semiconductor Equipment (17.8%) | | | | | | | | |
| Aquantia Corp.* | | | 20,000 | | | | 226,600 | |
| FormFactor, Inc.* | | | 18,100 | | | | 283,265 | |
| Ichor Holdings Ltd.* | | | 6,000 | | | | 147,600 | |
| NeoPhotonics Corp.* | | | 210,000 | | | | 1,381,800 | |
| PDF Solutions, Inc.*† | | | 160,000 | | | | 2,512,000 | |
| Photronics, Inc.* | | | 85,000 | | | | 724,625 | |
| | | | | | | | 5,275,890 | |
| Software (4.6%) | | | | | | | | |
| Altair Engineering, Inc., Class A* | | | 752 | | | | 17,988 | |
| Appian Corp., Class A* | | | 2,500 | | | | 78,700 | |
| FireEye, Inc.* | | | 90,000 | | | | 1,278,000 | |
| | | | | | | | 1,374,688 | |
| Technology Hardware, Storage & Peripherals (13.9%) | | | | | | | | |
| Electronics For Imaging, Inc.* | | | 20,000 | | | | 590,600 | |
| Pure Storage, Inc., Class A* | | | 130,000 | | | | 2,061,800 | |
| Super Micro Computer, Inc.*† | | | 70,000 | | | | 1,464,750 | |
| | | | | | | | 4,117,150 | |
| Thrifts & Mortgage Finance (0.6%) | | | | | | | | |
| LendingTree, Inc.* | | | 500 | | | | 170,225 | |
See accompanying notes to financial statements.
Annual Report 2017
Needham Small Cap Growth Fund
Schedule of Investments (Continued)
December 31, 2017
| | | Shares | | | Value | |
| Common Stocks – Continued | | | | | | |
| | | | | | | |
| Trading Companies & Distributors (1.8%) | | | | | | |
| Air Lease Corp., Class A† | | | 11,250 | | | $ | 541,013 | |
| | | | | | | | | |
| Total Common Stocks | | | | | | | | |
| (Cost $22,300,427) | | | | | | $ | 26,220,051 | |
| | | | | | | | | |
| Closed-End Funds (4.2%) | | | | | | | | |
| Tekla Healthcare Investors | | | 27,500 | | | | 620,125 | |
| Tekla Life Sciences Investors | | | 32,500 | | | | 637,975 | |
| | | | | | | | | |
| Total Closed-End Funds | | | | | | | | |
| (Cost $1,278,990) | | | | | | $ | 1,258,100 | |
| | | | | | | | | |
| Short-Term Investments (8.8%) | | | | | | | | |
| | | | | | | | | |
| Money Market Fund (8.8%) | | | | | | | | |
| Dreyfus Treasury Securities Cash Management – | | | | | | | | |
| Institutional Class, 1.11% (a) | | | | | | | | |
| (Cost $2,620,491) | | | 2,620,491 | | | $ | 2,620,491 | |
| | | | | | | | | |
| Total Investments (101.5%) | | | | | | | | |
| (Cost $26,199,908) | | | | | | | 30,098,642 | |
| Total Securities Sold Short (-0.8%) | | | | | | | (226,750 | ) |
| (Proceeds $201,992) | | | | | | | | |
| Liabilities in Excess of Other Assets (-0.7%) | | | | | | | (229,720 | ) |
| Net Assets (100.0%) | | | | | | $ | 29,642,172 | |
| * | Non-income producing security. |
| (a) | Rate shown is the seven-day yield as of December 31, 2017. |
| † | Security position is either entirely or partially held in a segregated account as collateral for securities sold short, aggregating a total market value of $1,148,963. |
| | The Global Industry Classification Standard (GICS®) was developed by and/or is the exclusive property of MSCI, Inc. and Standard & Poor’s Financial Services LLC (“S&P”). GICS is a service mark of MSCI and S&P and has been licensed for use by U.S. Bancorp Fund Services, LLC. |
See accompanying notes to financial statements.
Needham Funds
Needham Small Cap Growth Fund
Schedule of Securities Sold Short
December 31, 2017
| | | Shares | | | Value | |
| Securities Sold Short (-0.8%) | | | | | | |
| | | | | | | |
| Health Care Equipment & Supplies (-0.8%) | | | | | | |
| Cutera, Inc.* | | | 5,000 | | | $ | 226,750 | |
| | | | | | | | | |
| Total Securities Sold Short (-0.8%) | | | | | | | | |
| (Proceeds $201,992) | | | | | | $ | 226,750 | |
| * | Non-income producing security. |
See accompanying notes to financial statements.
(This Page Intentionally Left Blank.)
Statements of Assets and Liabilities
December 31, 2017
| | | | | | | Needham | | | Needham | |
| | | | Needham | | | Aggressive | | | Small Cap | |
| | | | Growth Fund | | | Growth Fund | | | Growth Fund | |
| Assets | | | | | | | | | | |
| Investments, at Value: | | | | | | | | | | |
| Unaffiliated securities, (Cost $50,656,811, | | | | | | | | | | |
| $26,106,562, $26,199,908) | | | $ | 110,551,944 | | | $ | 57,913,729 | | | $ | 30,098,642 | |
| Affiliated securities (Cost $—, $2,279,118, $—) | | | | — | | | | 3,640,000 | | | | — | |
| Cash | | | | — | | | | — | | | | 25,900 | |
| Receivables: | | | | | | | | | | | | | |
| Deposit with Broker for Securities Sold Short | | | | 6,365,434 | | | | 4,204,337 | | | | 242,162 | |
| Dividends and Interest | | | | 42,026 | | | | 120 | | | | 3,763 | |
| Fund Shares Sold | | | | 282 | | | | 14,488 | | | | 212 | |
| Prepaid Expenses | | | | 47,647 | | | | 32,603 | | | | 21,392 | |
| Total Assets | | | | 117,007,333 | | | | 65,805,277 | | | | 30,392,071 | |
| | | | | | | | | | | | | | |
| Liabilities | | | | | | | | | | | | | |
| Securities Sold Short, at Value | | | | | | | | | | | | | |
| (Proceeds $3,424,005, $2,523,894, $201,992) | | | | 6,202,598 | | | | 4,070,933 | | | | 226,750 | |
| Payables: | | | | | | | | | | | | | |
| Investment Securities Purchased | | | | 39,845 | | | | 10,435 | | | | 458,655 | |
| Fund Shares Redeemed | | | | 57,796 | | | | 57,689 | | | | 13,821 | |
| Due to Adviser | | | | 111,305 | | | | 47,583 | | | | 16,948 | |
| Distribution Fees | | | | 17,344 | | | | 9,151 | | | | 4,401 | |
| Administration and Accounting Fees | | | | 23,636 | | | | 11,440 | | | | 7,971 | |
| Transfer Agent Fees | | | | 9,742 | | | | 8,636 | | | | 3,669 | |
| Accrued Expenses and Other Liabilities | | | | 55,224 | | | | 41,698 | | | | 17,684 | |
| Total Liabilities | | | | 6,517,490 | | | | 4,257,565 | | | | 749,899 | |
| Total Net Assets | | | $ | 110,489,843 | | | $ | 61,547,712 | | | $ | 29,642,172 | |
See accompanying notes to financial statements.
Annual Report 2017
Statements of Assets and Liabilities (Continued)
December 31, 2017
| | | | | | Needham | | | Needham | |
| | | Needham | | | Aggressive | | | Small Cap | |
| | | Growth Fund | | | Growth Fund | | | Growth Fund | |
| Retail Class Shares | | | | | | | | | |
| Net Assets | | $ | 78,013,909 | | | $ | 41,106,649 | | | $ | 19,317,133 | |
| Shares Issued and Outstanding | | | | | | | | | | | | |
| $0.001 Par Value (Authorized | | | | | | | | | | | | |
| 800,000,000,100,000,000 and | | | | | | | | | | | | |
| 100,000,000 respectively) | | | 1,818,014 | | | | 1,781,551 | | | | 1,232,573 | |
| Net Asset Value and | | | | | | | | | | | | |
| Offering Price Per Share | | $ | 42.91 | | | $ | 23.07 | | | $ | 15.67 | |
| | | | | | | | | | | | | |
| Institutional Class Shares | | | | | | | | | | | | |
| Net Assets | | $ | 32,475,934 | | | $ | 20,441,063 | | | $ | 10,325,039 | |
| Shares Issued and Outstanding | | | | | | | | | | | | |
| $0.001 Par Value (Authorized | | | | | | | | | | | | |
| 800,000,000,100,000,000 and | | | | | | | | | | | | |
| 100,000,000 respectively) | | | 752,698 | | | | 880,512 | | | | 655,165 | |
| Net Asset Value and | | | | | | | | | | | | |
| Offering Price Per Share | | $ | 43.15 | | | $ | 23.21 | | | $ | 15.76 | |
| | | | | | | | | | | | | |
| Components of Net Assets | | | | | | | | | | | | |
| Paid-in Capital | | $ | 44,392,925 | | | $ | 29,945,245 | | | $ | 25,661,707 | |
| Accumulated Net Investment Loss | | | — | | | | — | | | | — | |
| Accumulated Net Realized Gain from | | | | | | | | | | | | |
| Investments, Securities Sold Short, | | | | | | | | | | | | |
| Foreign Currency Transactions and Currency | | | 8,980,378 | | | | (18,544 | ) | | | 106,489 | |
| Net Unrealized Appreciation on | | | | | | | | | | | | |
| Investment Securities and | | | | | | | | | | | | |
| Securities Sold Short | | | 57,116,540 | | | | 31,621,011 | | | | 3,873,976 | |
| Total Net Assets | | $ | 110,489,843 | | | $ | 61,547,712 | | | $ | 29,642,172 | |
See accompanying notes to financial statements.
Needham Funds
Statements of Operations
For the year ended December 31, 2017
| | | | | | Needham | | | Needham | |
| | | Needham | | | Aggressive | | | Small Cap | |
| | | Growth Fund | | | Growth Fund | | | Growth Fund | |
| Investment Income | | | | | | | | | |
| Dividend Income from unaffiliated securities (net of | | | | | | | | | |
| foreign withholding tax of $949, $0, $1,361) | | $ | 737,293 | | | $ | 321,234 | | | $ | 248,740 | |
| Interest | | | 8,635 | | | | 4,612 | | | | 22,179 | |
| Total Investment Income | | | 745,928 | | | | 325,846 | | | | 270,919 | |
| | | | | | | | | | | | | |
| Expenses | | | | | | | | | | | | |
| Investment Advisory Fees | | | 1,484,553 | | | | 789,757 | | | | 398,063 | |
| Distribution Fees | | | 213,549 | | | | 118,986 | | | | 61,778 | |
| Administration and Accounting Fees | | | 145,023 | | | | 84,666 | | | | 53,178 | |
| Audit Fees | | | 43,219 | | | | 29,280 | | | | 31,861 | |
| Chief Compliance Officer Fees | | | 19,495 | | | | 11,567 | | | | 6,536 | |
| Custodian Fees | | | 10,242 | | | | 10,857 | | | | 8,818 | |
| Directors’ Fees | | | 19,536 | | | | 10,717 | | | | 5,749 | |
Dividend Expense(1) | | | 4,006 | | | | — | | | | — | |
| Filing Fees | | | 39,258 | | | | 40,354 | | | | 39,172 | |
Interest Expense(1) | | | 541,300 | | | | 451,448 | | | | 70 | |
| Legal Fees | | | 80,834 | | | | 45,181 | | | | 22,636 | |
| Printing Fees | | | 10,346 | | | | 8,891 | | | | 5,940 | |
| Transfer Agent Fees | | | 58,864 | | | | 52,122 | | | | 38,569 | |
| Other Expenses | | | 46,854 | | | | 18,507 | | | | 6,893 | |
| Total Expenses | | | 2,717,079 | | | | 1,672,333 | | | | 679,263 | |
| Fees Waived by Investment Adviser | | | (84,071 | ) | | | (75,500 | ) | | | (97,975 | ) |
| Net Expenses | | | 2,633,008 | | | | 1,596,833 | | | | 581,288 | |
| Net Investment Loss | | | (1,887,080 | ) | | | (1,270,987 | ) | | | (310,369 | ) |
| | | | | | | | | | | | | |
| Net Realized / Unrealized Gain (Loss) from Affiliated | | | | | | | | | | | | |
| and Unaffiliated Securities, Securities Sold Short, | | | | | | | | | | | | |
| Foreign Currency Transactions and Currency | | | | | | | | | | | | |
| Net Realized Gain from Unaffiliated Securities | | | 18,836,185 | | | | 4,906,025 | | | | 3,958,131 | |
| Net Realized Gain (Loss) from Securities Sold Short | | | 282,064 | | | | (464,287 | ) | | | 19,407 | |
| Change in Unrealized Appreciation (Depreciation) | | | | | | | | | | | | |
| on Unaffiliated Securities and Securities Sold Short | | | (7,518,528 | ) | | | 2,469,134 | | | | (228,295 | ) |
| Change in Unrealized Depreciation | | | | | | | | | | | | |
| on Affiliated Securities and Securities Sold Short | | | — | | | | (208,518 | ) | | | — | |
| Net Realized / Unrealized Gain from Affiliated and | | | | | | | | | | | | |
| Unaffiliated Securities, Securities Sold Short, | | | | | | | | | | | | |
| Foreign Currency Transactions and Currency | | | 11,599,721 | | | | 6,702,354 | | | | 3,749,243 | |
| Change in Net Assets Resulting from Operations | | $ | 9,712,641 | | | $ | 5,431,367 | | | $ | 3,438,874 | |
(1) | Expense related to securities sold short. |
See accompanying notes to financial statements.
Needham Growth Fund
Statements of Changes in Net Assets
| | | Year Ended | | | Year Ended | |
| | | December 31, 2017 | | | December 31, 2016 | |
| Change in Net Assets | | | | | | |
| Operations: | | | | | | |
| Net Investment Loss | | $ | (1,887,080 | ) | | $ | (1,616,638 | ) |
| Net Realized Gain from Securities, Securities Sold Short, | | | | | | | | |
| Foreign Currency Transactions, and Currency | | | 19,118,249 | | | | 8,789,434 | |
| Net Change in Unrealized Appreciation (Depreciation) on Investments, | | | | | | | | |
| Securities Sold Short, Foreign Currency Transactions and Currency | | | (7,518,528 | ) | | | 4,521,650 | |
| Change in Net Assets Resulting from Operations | | | 9,712,641 | | | | 11,694,446 | |
| | | | | | | | | |
| Distributions to Shareholders from: | | | | | | | | |
| Net Investment Income | | | — | | | | — | |
| Capital Gains | | | (10,480,369 | ) | | | (4,983,292 | ) |
| Total Distributions to Shareholders | | | (10,480,369 | ) | | | (4,983,292 | ) |
| | | | | | | | | |
| Capital Transactions: | | | | | | | | |
| Retail Class: | | | | | | | | |
| Shares Issued | | | 3,536,898 | | | | 3,874,739 | |
| Shares Issued in Reinvestment of Distribution | | | 6,546,656 | | | | 4,388,025 | |
| Shares Exchanged for Institutional Class Shares | | | (34,786,282 | ) | | | — | |
| Shares Redeemed | | | (17,205,930 | ) | | | (22,212,309 | ) |
| Redemption Fees | | | 137 | | | | 611 | |
Institutional Class:(1) | | | | | | | | |
| Shares Issued | | | 7,117,796 | | | | 117,442 | |
| Shares Issued in Reinvestment of Distribution | | | 2,871,221 | | | | — | |
| Shares Issued in Exchange for Retail Class Shares | | | 34,786,282 | | | | — | |
| Shares Redeemed | | | (11,643,231 | ) | | | — | |
| Redemption Fees | | | — | | | | — | |
| Total Change in Net Assets from Capital Transactions | | | (8,776,453 | ) | | | (13,831,492 | ) |
| | | | | | | | | |
| Change in Net Assets | | | (9,544,181 | ) | | | (7,120,338 | ) |
| | | | | | | | | |
| Total Net Assets | | | | | | | | |
| Beginning of Year | | | 120,034,024 | | | | 127,154,362 | |
| End of Year | | $ | 110,489,843 | | | $ | 120,034,024 | |
| Accumulated Net Investment Income (Loss) | | $ | — | | | $ | (18,197 | ) |
| | | | | | | | | |
| Share Transaction: | | | | | | | | |
| Retail Class: | | | | | | | | |
| Number of Shares Issued | | | 78,824 | | | | 94,336 | |
| Number of Shares Reinvested | | | 150,428 | | | | 104,402 | |
| Number of Shares Exchanged for Institutional Class Shares | | | (794,070 | ) | | | — | |
| Number of Shares Redeemed | | | (379,993 | ) | | | (540,109 | ) |
Institutional Class:(1) | | | | | | | | |
| Number of Shares Issued | | | 154,738 | | | | 2,706 | |
| Number of Shares Reinvested | | | 65,673 | | | | — | |
| Number of Shares Issued in Exchange for Retail Class Shares | | | 793,772 | | | | — | |
| Number of Shares Redeemed | | | (264,191 | ) | | | — | |
| Total Change in Shares | | | (194,819 | ) | | | (338,665 | ) |
(1) | The class commenced operations on December 30, 2016. |
See accompanying notes to financial statements.
Needham Funds
Needham Aggressive Growth Fund
Statements of Changes in Net Assets
| | | Year Ended | | | Year Ended | |
| | | December 31, 2017 | | | December 31, 2016 | |
| Change in Net Assets | | | | | | |
| Operations: | | | | | | |
| Net Investment Loss | | $ | (1,270,987 | ) | | $ | (1,001,075 | ) |
| Net Realized Gain from Securities, Securities Sold Short, | | | | | | | | |
| Foreign Currency Transactions, and Currency | | | 4,441,738 | | | | 4,659,615 | |
| Net Change in Unrealized Appreciation on Investments, | | | | | | | | |
| Securities Sold Short, Foreign Currency Transactions and Currency | | | 2,260,616 | | | | 6,648,259 | |
| Change in Net Assets Resulting from Operations | | | 5,431,367 | | | | 10,306,799 | |
| | | | | | | | | |
| Distributions to Shareholders from: | | | | | | | | |
| Net Investment Income | | | — | | | | — | |
| Capital Gains | | | (3,108,250 | ) | | | (3,518,408 | ) |
| Total Distributions to Shareholders | | | (3,108,250 | ) | | | (3,518,408 | ) |
| | | | | | | | | |
| Capital Transactions: | | | | | | | | |
| Retail Class: | | | | | | | | |
| Shares Issued | | | 9,199,681 | | | | 5,941,597 | |
| Shares Issued in Reinvestment of Distribution | | | 2,077,588 | | | | 3,460,163 | |
| Shares Exchanged for Institutional Class Shares | | | (15,691,618 | ) | | | — | |
| Shares Redeemed | | | (14,977,523 | ) | | | (8,401,668 | ) |
| Redemption Fees | | | 3,821 | | | | 1,432 | |
Institutional Class:(1) | | | | | | | | |
| Shares Issued | | | 4,358,525 | | | | 162,046 | |
| Shares Issued in Reinvestment of Distribution | | | 962,266 | | | | — | |
| Shares Issued in Exchange for Retail Class Shares | | | 15,691,618 | | | | — | |
| Shares Redeemed | | | (1,257,528 | ) | | | — | |
| Redemption Fees | | | 161 | | | | — | |
| Total Change in Net Assets from Capital Transactions | | | 366,991 | | | | 1,163,570 | |
| | | | | | | | | |
| Change in Net Assets | | | 2,690,108 | | | | 7,951,961 | |
| | | | | | | | | |
| Total Net Assets | | | | | | | | |
| Beginning of Year | | | 58,857,604 | | | | 50,905,643 | |
| End of Year | | $ | 61,547,712 | | | $ | 58,857,604 | |
| Accumulated Net Investment Income (Loss) | | $ | — | | | $ | — | |
| | | | | | | | | |
| Share Transaction: | | | | | | | | |
| Retail Class: | | | | | | | | |
| Number of Shares Issued | | | 405,217 | | | | 280,053 | |
| Number of Shares Reinvested | | | 87,996 | | | | 166,674 | |
| Number of Shares Exchanged for Institutional Class Shares | | | (696,926 | ) | | | — | |
| Number of Shares Redeemed | | | (648,415 | ) | | | (415,853 | ) |
Institutional Class:(1) | | | | | | | | |
| Number of Shares Issued | | | 189,553 | | | | 7,270 | |
| Number of Shares Reinvested | | | 40,551 | | | | — | |
| Number of Shares Issued in Exchange for Retail Class Shares | | | 696,049 | | | | — | |
| Number of Shares Redeemed | | | (52,911 | ) | | | — | |
| Total Change in Shares | | | 21,114 | | | | 38,144 | |
(1) | The class commenced operations on December 30, 2016. |
See accompanying notes to financial statements.
Needham Small Cap Growth Fund
Statements of Changes in Net Assets
| | | Year Ended | | | Year Ended | |
| | | December 31, 2017 | | | December 31, 2016 | |
| Change in Net Assets | | | | | | |
| Operations: | | | | | | |
| Net Investment Loss | | $ | (310,369 | ) | | $ | (472,659 | ) |
| Net Realized Gain from Securities, Securities Sold Short, | | | | | | | | |
| Foreign Currency Transactions, and Currency | | | 3,977,538 | | | | 2,846,191 | |
| Net Change in Unrealized Appreciation (Depreciation) on Investments, | | | | | | | | |
| Securities Sold Short, Foreign Currency Transactions and Currency | | | (228,295 | ) | | | 4,604,040 | |
| Change in Net Assets Resulting from Operations | | | 3,438,874 | | | | 6,977,572 | |
| | | | | | | | | |
| Distributions to Shareholders from: | | | | | | | | |
| Net Investment Income | | | — | | | | — | |
| Capital Gains | | | (2,364,563 | ) | | | (1,895,460 | ) |
| Total Distributions to Shareholders | | | (2,364,563 | ) | | | (1,895,460 | ) |
| | | | | | | | | |
| Capital Transactions: | | | | | | | | |
| Retail Class: | | | | | | | | |
| Shares Issued | | | 3,127,799 | | | | 13,166,893 | |
| Shares Issued in Reinvestment of Distribution | | | 1,624,010 | | | | 1,830,167 | |
| Shares Exchanged for Institutional Class Shares | | | (4,245,905 | ) | | | — | |
| Shares Redeemed | | | (17,706,408 | ) | | | (8,043,615 | ) |
| Redemption Fees | | | 12,314 | | | | 8,797 | |
Institutional Class:(1) | | | | | | | | |
| Shares Issued | | | 6,971,388 | | | | 139,788 | |
| Shares Issued in Reinvestment of Distribution | | | 689,541 | | | | — | |
| Shares Issued in Exchange for Retail Class Shares | | | 4,245,905 | | | | — | |
| Shares Redeemed | | | (1,808,408 | ) | | | — | |
| Redemption Fees | | | 164 | | | | — | |
| Total Change in Net Assets from Capital Transactions | | | (7,089,600 | ) | | | 7,102,030 | |
| | | | | | | | | |
| Change in Net Assets | | | (6,015,289 | ) | | | 12,184,142 | |
| | | | | | | | | |
| Total Net Assets | | | | | | | | |
| Beginning of Year | | | 35,657,461 | | | | 23,473,319 | |
| End of Year | | $ | 29,642,172 | | | $ | 35,657,461 | |
| Accumulated Net Investment Income (Loss) | | $ | — | | | $ | — | |
| | | | | | | | | |
| Share Transaction: | | | | | | | | |
| Retail Class: | | | | | | | | |
| Number of Shares Issued | | | 201,179 | | | | 897,839 | |
| Number of Shares Reinvested | | | 102,075 | | | | 127,272 | |
| Number of Shares Exchanged for Institutional Class Shares | | | (274,456 | ) | | | — | |
| Number of Shares Redeemed | | | (1,125,564 | ) | | | (582,239 | ) |
Institutional Class:(1) | | | | | | | | |
| Number of Shares Issued | | | 434,158 | | | | 9,166 | |
| Number of Shares Reinvested | | | 43,151 | | | | — | |
| Number of Shares Issued in Exchange for Retail Class Shares | | | 274,369 | | | | — | |
| Number of Shares Redeemed | | | (105,679 | ) | | | — | |
| Total Change in Shares | | | (450,767 | ) | | | 452,038 | |
(1) | The class commenced operations on December 30, 2016. |
See accompanying notes to financial statements.
Needham Funds
Needham Growth Fund
Financial Highlights
| | | Retail Class | |
| (For a Share Outstanding | | Year Ended December 31, | |
| Throughout each Year) | | 2017 | | | 2016 | | | 2015 | | | 2014 | | | 2013 | |
| Net Asset Value, Beginning of Year | | $ | 43.40 | | | $ | 40.96 | | | $ | 46.00 | | | $ | 45.06 | | | $ | 33.66 | |
| Investment Operations | | | | | | | | | | | | | | | | | | | | |
| Net Investment Income (Loss) | | | (0.78 | ) | | | (0.59 | ) | | | (0.68 | ) | | | 0.58 | | | | (0.54 | ) |
| Net Realized and Unrealized | | | | | | | | | | | | | | | | | | | | |
| Gain (Loss) on Investments | | | 4.45 | | | | 4.86 | | | | (1.60 | ) | | | 4.59 | | | | 12.20 | |
| Total from Investment Operations | | | 3.67 | | | | 4.27 | | | | (2.28 | ) | | | 4.01 | | | | 11.66 | |
| | | | | | | | | | | | | | | | | | | | | |
| Less Distributions | | | | | | | | | | | | | | | | | | | | |
| Net Realized Gains | | | (4.16 | ) | | | (1.83 | ) | | | (2.76 | ) | | | (3.07 | ) | | | (0.26 | ) |
| Total Distributions | | | (4.16 | ) | | | (1.83 | ) | | | (2.76 | ) | | | (3.07 | ) | | | (0.26 | ) |
| | | | | | | | | | | | | | | | | | | | | |
| Capital Contributions | | | | | | | | | | | | | | | | | | | | |
| Redemption Fees | | | — | (a) | | | — | (a) | | | — | (a) | | | — | (a) | | | — | (a) |
| Total Capital Contributions | | | — | (a) | | | — | (a) | | | — | (a) | | | — | (a) | | | — | (a) |
| Net Asset Value, End of Year | | $ | 42.91 | | | $ | 43.40 | | | $ | 40.96 | | | $ | 46.00 | | | $ | 45.06 | |
| | | | | | | | | | | | | | | | | | | | | |
| Total Return | | | 8.32 | % | | | 10.57 | % | | | (5.07 | )% | | | 8.98 | % | | | 34.68 | % |
| Net Assets, End of Year (000’s) | | $ | 78,014 | | | $ | 119,117 | | | $ | 127,154 | | | $ | 147,816 | | | $ | 141,693 | |
| Ratios/Supplemental Data | | | | | | | | | | | | | | | | | | | | |
| Ratio of Net Expenses to | | | | | | | | | | | | | | | | | | | | |
| Average Net Assets | | | 2.34 | % | | | 2.17 | % | | | 2.05 | % | | | 1.84 | % | | | 1.89 | % |
| Ratio of Net Expenses to Average | | | | | | | | | | | | | | | | | | | | |
| Net Assets (before interest | | | | | | | | | | | | | | | | | | | | |
| and dividend expense) | | | 1.90 | % | | | 1.84 | % | | | 1.82 | % | | | 1.80 | % | | | 1.82 | % |
| Ratio of Total Expenses to Average | | | | | | | | | | | | | | | | | | | | |
| Net Assets (before waiver and | | | | | | | | | | | | | | | | | | | | |
| reimbursement of expenses) | | | 2.34 | % | | | 2.17 | % | | | 2.05 | % | | | 1.84 | % | | | 1.89 | % |
| Ratio of Net Investment Income | | | | | | | | | | | | | | | | | | | | |
| (Loss) to Average Net Assets | | | (1.73 | )% | | | (1.36 | )% | | | (1.48 | )% | | | (1.32 | )% | | | (1.30 | )% |
| Ratio of Net Investment Loss to | | | | | | | | | | | | | | | | | | | | |
| Average Net Assets (before waivers | | | | | | | | | | | | | | | | | | | | |
| and reimbursements of expenses) | | | (1.73 | )% | | | (1.36 | )% | | | (1.48 | )% | | | (1.32 | )% | | | (1.30 | )% |
| Portfolio turnover rate | | | 9 | % | | | 12 | % | | | 13 | % | | | 12 | % | | | 12 | % |
(a) | Value is less than $0.005 per share. |
See accompanying notes to financial statements.
Needham Growth Fund
Financial Highlights
| | | Institutional Class | |
| | | | | | Period from | |
| | | | | | December 30, 2016 | |
| | | Year Ended | | | through | |
| (For a Share Outstanding Throughout each Period) | | December 31, 2017 | | | December 31, 2016(1) | |
| Net Asset Value, Beginning of Period | | $ | 43.40 | | | $ | 43.40 | |
| Investment Operations | | | | | | | | |
| Net Investment Loss | | | (0.56 | ) | | | — | |
| Net Realized and Unrealized Gain on Investments | | | 4.47 | | | | — | |
| Total from Investment Operations | | | 3.91 | | | | — | |
| | | | | | | | | |
| Less Distributions | | | | | | | | |
| Net Realized Gains | | | (4.16 | ) | | | — | |
| Total Distributions | | | (4.16 | ) | | | — | |
| | | | | | | | | |
| Capital Contributions | | | | | | | | |
| Redemption Fees | | | — | | | | — | |
| Total Capital Contributions | | | — | | | | — | |
| Net Asset Value, End of Period | | $ | 43.15 | | | $ | 43.40 | |
| | | | | | | | | |
| Total Return | | | 8.89 | % | | | 0.00 | % |
| Net Assets, End of Period (000’s) | | $ | 32,476 | | | $ | 117 | |
| Ratios/Supplemental Data | | | | | | | | |
| Ratio of Net Expenses to Average Net Assets | | | 1.90 | % | | | 1.40 | % |
| Ratio of Net Expenses to Average Net Assets | | | | | | | | |
| (before interest and dividend expense) | | | 1.40 | % | | | 1.40 | % |
| Ratio of Total Expenses to Average Net Assets | | | | | | | | |
| (before waiver and reimbursement of expenses) | | | 2.15 | % | | | — | %* |
| Ratio of Net Investment Loss to Average Net Assets | | | (1.24 | )% | | | — | %* |
| Ratio of Net Investment Loss to Average Net Assets | | | | | | | | |
| (before waivers and reimbursements of expenses) | | | (1.49 | )% | | | — | %* |
| Portfolio turnover rate | | | 9 | % | | | 0 | % |
(1) | The Class commenced operations on December 30, 2016. |
| * | Refer to Note 2 for further description of non-recurring charges related to the issuance of the share class. |
See accompanying notes to financial statements.
Needham Funds
Needham Aggressive Growth Fund
Financial Highlights
| | | Retail Class | |
| (For a Share Outstanding | | Year Ended December 31, | |
| Throughout each Year) | | 2017 | | | 2016 | | | 2015 | | | 2014 | | | 2013 | |
| Net Asset Value, Beginning of Year | | $ | 22.29 | | | $ | 19.56 | | | $ | 23.55 | | | $ | 22.66 | | | $ | 16.63 | |
| Investment Operations | | | | | | | | | | | | | | | | | | | | |
| Net Investment Loss | | | (0.49 | ) | | | (0.38 | ) | | | (0.39 | ) | | | (0.38 | ) | | | (0.37 | ) |
| Net Realized and Unrealized | | | | | | | | | | | | | | | | | | | | |
| Gain (Loss) on Investments | | | 2.46 | | | | 4.61 | | | | (1.28 | ) | | | 1.98 | | | | 6.40 | |
| Total from Investment Operations | | | 1.97 | | | | 4.23 | | | | (1.67 | ) | | | 1.60 | | | | 6.03 | |
| | | | | | | | | | | | | | | | | | | | | |
| Less Distributions | | | | | | | | | | | | | | | | | | | | |
| Net Realized Gains | | | (1.19 | ) | | | (1.50 | ) | | | (2.32 | ) | | | (0.71 | ) | | | — | |
| Total Distributions | | | (1.19 | ) | | | (1.50 | ) | | | (2.32 | ) | | | (0.71 | ) | | | — | |
| | | | | | | | | | | | | | | | | | | | | |
| Capital Contributions | | | | | | | | | | | | | | | | | | | | |
| Redemption Fees | | | — | (a) | | | — | (a) | | | — | (a) | | | — | (a) | | | — | (a) |
| Total Capital Contributions | | | — | (a) | | | — | (a) | | | — | (a) | | | — | (a) | | | — | (a) |
| Net Asset Value, End of Year | | $ | 23.07 | | | $ | 22.29 | | | $ | 19.56 | | | $ | 23.55 | | | $ | 22.66 | |
| | | | | | | | | | | | | | | | | | | | | |
| Total Return | | | 8.73 | % | | | 22.18 | % | | | (7.05 | )% | | | 7.13 | % | | | 36.26 | % |
| Net Assets, End of Year (000’s) | | $ | 41,107 | | | $ | 58,696 | | | $ | 50,906 | | | $ | 62,353 | | | $ | 68,470 | |
| Ratios/Supplemental Data | | | | | | | | | | | | | | | | | | | | |
| Ratio of Net Expenses to | | | | | | | | | | | | | | | | | | | | |
| Average Net Assets | | | 2.63 | % | | | 2.71 | % | | | 2.41 | % | | | 2.09 | % | | | 2.07 | % |
| Ratio of Net Expenses to Average | | | | | | | | | | | | | | | | | | | | |
| Net Assets (before interest | | | | | | | | | | | | | | | | | | | | |
| and dividend expense) | | | 1.95 | % | | | 1.95 | % | | | 1.93 | % | | | 1.91 | % | | | 1.91 | % |
| Ratio of Total Expenses to Average | | | | | | | | | | | | | | | | | | | | |
| Net Assets (before waiver and | | | | | | | | | | | | | | | | | | | | |
| reimbursement of expenses) | | | 2.65 | % | | | 2.72 | % | | | 2.42 | % | | | 2.09 | % | | | 2.07 | % |
| Ratio of Net Investment Loss | | | | | | | | | | | | | | | | | | | | |
| to Average Net Assets | | | (2.12 | )% | | | (1.99 | )% | | | (1.73 | )% | | | (1.60 | )% | | | (1.74 | )% |
| Ratio of Net Investment Loss to | | | | | | | | | | | | | | | | | | | | |
| Average Net Assets (before waivers | | | | | | | | | | | | | | | | | | | | |
| and reimbursements of expenses) | | | (2.14 | )% | | | (2.00 | )% | | | (1.74 | )% | | | (1.60 | )% | | | (1.74 | )% |
| Portfolio turnover rate | | | 15 | % | | | 14 | % | | | 15 | % | | | 19 | % | | | 20 | % |
(a) | Value is less than $0.005 per share. |
See accompanying notes to financial statements.
Needham Aggressive Growth Fund
Financial Highlights
| | | Institutional Class | |
| | | | | | Period from | |
| | | | | | December 30, 2016 | |
| | | Year Ended | | | through | |
| (For a Share Outstanding Throughout each Period) | | December 31, 2017 | | | December 31, 2016(1) | |
| Net Asset Value, Beginning of Period | | $ | 22.29 | | | $ | 22.29 | |
| Investment Operations | | | | | | | | |
| Net Investment Loss | | | (0.40 | ) | | | — | |
| Net Realized and Unrealized Gain on Investments | | | 2.51 | | | | — | |
| Total from Investment Operations | | | 2.11 | | | | — | |
| | | | | | | | | |
| Less Distributions | | | | | | | | |
| Net Realized Gains | | | (1.19 | ) | | | — | |
| Total Distributions | | | (1.19 | ) | | | — | |
| | | | | | | | | |
| Capital Contributions | | | | | | | | |
| Redemption Fees | | | — | | | | — | |
| Total Capital Contributions | | | — | | | | — | |
| Net Asset Value, End of Period | | $ | 23.21 | | | $ | 22.29 | |
| | | | | | | | | |
| Total Return | | | 9.36 | % | | | 0.00 | % |
| Net Assets, End of Period (000’s) | | $ | 20,441 | | | $ | 162 | |
| Ratios/Supplemental Data | | | | | | | | |
| Ratio of Net Expenses to Average Net Assets | | | 2.22 | % | | | 1.40 | % |
| Ratio of Net Expenses to Average Net Assets | | | | | | | | |
| (before interest and dividend expense) | | | 1.40 | % | | | 1.40 | % |
| Ratio of Total Expenses to Average Net Assets | | | | | | | | |
| (before waiver and reimbursement of expenses) | | | 2.64 | % | | | — | %* |
| Ratio of Net Investment Loss to Average Net Assets | | | (1.69 | )% | | | — | %* |
| Ratio of Net Investment Loss to Average Net Assets | | | | | | | | |
| (before waivers and reimbursements of expenses) | | | (2.11 | )% | | | — | %* |
| Portfolio turnover rate | | | 15 | % | | | 0 | % |
(1) | The Class commenced operations on December 30, 2016. |
| * | Refer to Note 2 for further description of non-recurring charges related to the issuance of the share class. |
See accompanying notes to financial statements.
Needham Funds
Needham Small Cap Growth Fund
Financial Highlights
| | | Retail Class | |
| (For a Share Outstanding | | Year Ended December 31, | |
| Throughout each Year) | | 2017 | | | 2016 | | | 2015 | | | 2014 | | | 2013 | |
| Net Asset Value, Beginning of Year | | $ | 15.25 | | | $ | 12.44 | | | $ | 14.01 | | | $ | 15.63 | | | $ | 12.22 | |
| Investment Operations | | | | | | | | | | | | | | | | | | | | |
| Net Investment Loss | | | (0.18 | ) | | | (0.20 | ) | | | (0.24 | ) | | | (0.24 | ) | | | (0.31 | ) |
| Net Realized and Unrealized | | | | | | | | | | | | | | | | | | | | |
| Gain (Loss) on Investments | | | 1.99 | | | | 4.03 | | | | (1.02 | ) | | | 0.32 | | | | 3.72 | |
| Total from Investment Operations | | | 1.81 | | | | 3.83 | | | | (1.26 | ) | | | 0.08 | | | | 3.41 | |
| | | | | | | | | | | | | | | | | | | | | |
| Less Distributions | | | | | | | | | | | | | | | | | | | | |
| Net Realized Gains | | | (1.40 | ) | | | (1.02 | ) | | | (0.31 | ) | | | (1.70 | ) | | | — | |
| Total Distributions | | | (1.40 | ) | | | (1.02 | ) | | | (0.31 | ) | | | (1.70 | ) | | | — | |
| | | | | | | | | | | | | | | | | | | | | |
| Capital Contributions | | | | | | | | | | | | | | | | | | | | |
| Redemption Fees | | | 0.01 | | | | — | (a) | | | — | (a) | | | — | (a) | | | — | (a) |
| Total Capital Contributions | | | 0.01 | | | | — | (a) | | | — | (a) | | | — | (a) | | | — | (a) |
| Net Asset Value, End of Year | | $ | 15.67 | | | $ | 15.25 | | | $ | 12.44 | | | $ | 14.01 | | | $ | 15.63 | |
| | | | | | | | | | | | | | | | | | | | | |
| Total Return | | | 11.81 | % | | | 31.26 | % | | | (8.96 | )% | | | 0.80 | % | | | 27.91 | % |
| Net Assets, End of Year (000’s) | | $ | 19,317 | | | $ | 35,518 | | | $ | 23,473 | | | $ | 32,116 | | | $ | 43,950 | |
| Ratios/Supplemental Data | | | | | | | | | | | | | | | | | | | | |
| Ratio of Net Expenses to | | | | | | | | | | | | | | | | | | | | |
| Average Net Assets | | | 1.95 | % | | | 2.09 | % | | | 2.05 | % | | | 2.01 | % | | | 2.06 | % |
| Ratio of Net Expenses to Average | | | | | | | | | | | | | | | | | | | | |
| Net Assets (before interest | | | | | | | | | | | | | | | | | | | | |
| and dividend expense) | | | 1.95 | % | | | 1.95 | % | | | 1.95 | % | | | 1.95 | % | | | 1.96 | % |
| Ratio of Total Expenses to Average | | | | | | | | | | | | | | | | | | | | |
| Net Assets (before waiver and | | | | | | | | | | | | | | | | | | | | |
| reimbursement of expenses) | | | 2.15 | % | | | 2.30 | % | | | 2.25 | % | | | 2.11 | % | | | 2.09 | % |
| Ratio of Net Investment Loss | | | | | | | | | | | | | | | | | | | | |
| to Average Net Assets | | | (1.14 | )% | | | (1.83 | )% | | | (1.61 | )% | | | (1.49 | )% | | | (1.80 | )% |
| Ratio of Net Investment Loss to | | | | | | | | | | | | | | | | | | | | |
| Average Net Assets (before waivers | | | | | | | | | | | | | | | | | | | | |
| and reimbursements of expenses) | | | (1.34 | )% | | | (2.04 | )% | | | (1.81 | )% | | | (1.59 | )% | | | (1.83 | )% |
| Portfolio turnover rate | | | 80 | % | | | 99 | % | | | 64 | % | | | 69 | % | | | 58 | % |
(a) | Value is less than $0.005 per share. |
See accompanying notes to financial statements.
Needham Small Cap Growth Fund
Financial Highlights
| | | Institutional Class | |
| | | | | | Period from | |
| | | | | | December 30, 2016 | |
| | | Year Ended | | | through | |
| (For a Share Outstanding Throughout each Period) | | December 31, 2017 | | | December 31, 2016(1) | |
| Net Asset Value, Beginning of Period | | $ | 15.25 | | | $ | 15.25 | |
| Investment Operations | | | | | | | | |
| Net Investment Loss | | | (0.07 | ) | | | — | |
| Net Realized and Unrealized Gain on Investments | | | 1.98 | | | | — | |
| Total from Investment Operations | | | 1.91 | | | | — | |
| | | | | | | | | |
| Less Distributions | | | | | | | | |
| Net Realized Gains | | | (1.40 | ) | | | — | |
| Total Distributions | | | (1.40 | ) | | | — | |
| | | | | | | | | |
| Capital Contributions | | | | | | | | |
| Redemption Fees | | | — | | | | — | |
| Total Capital Contributions | | | — | | | | — | |
| Net Asset Value, End of Period | | $ | 15.76 | | | $ | 15.25 | |
| | | | | | | | | |
| Total Return | | | 12.41 | % | | | 0.00 | % |
| Net Assets, End of Period (000’s) | | $ | 10,325 | | | $ | 140 | |
| Ratios/Supplemental Data | | | | | | | | |
| Ratio of Net Expenses to Average Net Assets | | | 1.40 | % | | | 1.40 | % |
| Ratio of Net Expenses to Average Net Assets | | | | | | | | |
| (before interest and dividend expense) | | | 1.40 | % | | | 1.40 | % |
| Ratio of Total Expenses to Average Net Assets | | | | | | | | |
| (before waiver and reimbursement of expenses) | | | 2.08 | % | | | — | %* |
| Ratio of Net Investment Loss to Average Net Assets | | | (0.41 | )% | | | — | %* |
| Ratio of Net Investment Loss to Average Net Assets | | | | | | | | |
| (before waivers and reimbursements of expenses) | | | (1.09 | )% | | | — | %* |
| Portfolio turnover rate | | | 80 | % | | | 0 | % |
(1) | The Class commenced operations on December 30, 2016. |
| * | Refer to Note 2 for further description of non-recurring charges related to the issuance of the share class. |
See accompanying notes to financial statements.
Needham Funds
Notes to Financial Statements
1. Organization
Needham Growth Fund (“NGF”), Needham Aggressive Growth Fund (“NAGF”) and Needham Small Cap Growth Fund (“NSCGF”) (each, a “Portfolio” and collectively, the “Portfolios”), are portfolios of The Needham Funds, Inc. (the “Company”), which is registered under the Investment Company Act of 1940, as amended (the “1940 Act”), as a diversified, open-end management investment company. The Company was organized as a Maryland corporation on October 12, 1995. NGF, NAGF, and NSCGF currently offer two classes, the Retail Class and the Institutional Class. The Institutional Class commenced operations on December 30, 2016.
2. Class Specific Expenses
Class level expenses are allocated daily to each class of shares based upon the ratio of net assets represented by each class as a percentage of the net assets of the Portfolio. Expenses deemed directly attributable to a class of shares are recorded by the specific class. Most Portfolio expenses are allocated by class based on relative net assets. Distribution Fees incurred in connection with the Company’s Amended and Restated Plan of Distribution Pursuant to Rule 12b-1 are expensed at 0.25% of average daily net assets of the Retail class shares, and the specific amounts are detailed in Note 5.
Certain of the Ratios and Supplemental Data presented in the Financial Highlights of the Institutional Class as of December 31, 2016 include non-recurring charges related to the issuance of the class and are not meaningful.
3. Significant Accounting Policies
The following is a summary of significant accounting policies followed by the Company in the preparation of its financial statements. These policies are in conformity with accounting principles generally accepted in the United States of America (“GAAP”).
Security Valuation: Portfolio securities for which market quotations are readily available are stated at the last sale price reported by the principal exchange for the security as of the exchange’s close of business. Securities for which no sale has taken place during the day and securities which are not listed on an exchange are valued at the mean of the highest closing bid and lowest asked prices. Exchange traded options are valued at the last reported sale price on any exchange on which the option is principally traded. If no sales are reported on a particular day, the options will be valued at the mean between the highest closing bid and lowest asked prices across the exchanges where the option is traded. Non-exchange traded options will also be valued at the mean between the last bid and asked quotations. For options where market quotations are not readily available, value will be determined in accordance with the fair value procedures described below. All other securities and assets for which (a) market quotations are not readily available, such as in the case of a market or technical disruption that prevents the normal trading of a security held by a Portfolio, (b) market quotations are believed to be unrepresentative of fair market value, such as in the case of a thinly traded security, or (c) valuation is normally made at the last sale price on a
Notes to Financial Statements (Continued)
foreign exchange and a significant event occurs after the close of that exchange but before the New York Stock Exchange closes, are valued at their fair value as determined in good faith by the Board of Directors (the “Board”) in accordance with Fair Value Procedures established by the Board. The Company’s Fair Value Procedures are implemented and monitored by a Fair Value Committee (the “Committee”) designated by the Board. When a security is valued in accordance with the Fair Value Procedures, the Committee determines a value after taking into consideration any relevant information that is reasonably available to the Committee. Some of the more common reasons that may necessitate that a security be valued pursuant to these Fair Value Procedures include, but are not limited to: the security’s trading has been halted or suspended; the security has been delisted from a national exchange; the security’s primary trading market is temporarily closed at a time when under normal conditions it would be open; or the security’s primary pricing source is not able or willing to provide a price. The securities of each Portfolio may also be valued on the basis of valuations provided by a pricing service approved by, or on behalf of, the Board.
Portfolio securities listed or traded on securities exchanges, including American Depositary Receipts (“ADRs”), are valued at the closing price on the exchange or system where the security is principally traded or at the NASDAQ Official Closing Price. If there have been no sales for that day on the exchange or system, a security is valued at the mean of the highest closing bid and lowest asked prices on the exchange or system where the security is principally traded.
The Portfolios did not value any securities in accordance with the Fair Value Procedures as of December 31, 2017.
Investment Transactions: Changes in holdings of portfolio securities for the Portfolios shall be reflected no later than in the first calculation on the first business day following the trade date for purposes of calculating each Portfolio’s daily net asset value per share. However, for financial reporting purposes, portfolio security transactions are reported on the trade date of the last business day of the reporting period. The cost (proceeds) of investments sold (bought to cover) is determined on a specific identification basis for the purpose of determining gains or losses on sales and buys to cover short positions. Dividend income, distributions to shareholders and dividend expense from securities sold short are recorded on the ex-dividend date. Interest income and interest expense from securities sold short is recorded on an accrual basis.
Foreign Currency: Foreign currency amounts are translated into U.S. dollars as follows: (i) assets and liabilities at the rate of exchange at the end of the respective period; and (ii) purchases and sales of securities and income and expenses at the rate of exchange prevailing on the dates of such transactions. The portion of realized gains arising from changes in the exchange rates are included with the net realized and unrealized gain or loss on investments. Principal risks associated with such transactions include the movement in value of the foreign currency relative to the U.S. dollar and the ability of the counterparty to perform.
Needham Funds
Notes to Financial Statements (Continued)
The Portfolios may also invest in forward currency contracts. Fluctuations in the value of such forward currency transactions are recorded daily as unrealized gain or loss; realized gain or loss includes net gain or loss on transactions that have terminated by settlement. These instruments involve securities and currency market risk, credit risk, or both kinds of risks, in excess of the amount recognized in the statements of assets and liabilities. Risks also arise from the possible inability of counterparties to meet the terms of their contracts. The Portfolios did not enter into forward currency contracts during the year ended December 31, 2017.
Allocation of Expenses: Expenses directly attributable to a Portfolio are charged directly to that Portfolio, while expenses which are attributable to more than one Portfolio are allocated among the respective Portfolios based upon relative net assets or some other reasonable method.
Use of Estimates: The preparation of financial statements in conformity with U.S. generally accepted accounting principles (GAAP) requires management to make estimates and assumptions that affect the reported amounts of assets and liabilities and disclosure of contingent assets and liabilities at the date of the financial statements and the reported amounts of increases and decreases in net assets from operations during the reporting period. Actual results could differ from those estimates.
Distributions to Shareholders: Dividends from net investment income, if any, are declared and paid annually for the Portfolios. Distributable net realized gains, if any, are declared and distributed at least annually.
Redemption Fees: Effective August 25, 2017, the Portfolios no longer have a redemption fee. For the year ended December 31, 2017, NGF, NAGF and NSCGF Retail Classes had contributions to capital due to redemption fees in the amounts of $137, $3,821 and $12,314, respectively. For the year ended December 31, 2017, NAGF and NSCGF Institutional Classes had contributions to capital due to redemption fees in the amounts of $161 and $164, respectively.
Federal Income Taxes: It is the policy of each Portfolio to continue to qualify as a regulated investment company, as defined in the Internal Revenue Code, by complying with the provisions available to certain investment companies and to make distributions of net investment income and net realized capital gains sufficient to relieve it from all, or substantially all, federal income taxes. Accordingly, no provision for income taxes has been made in the Portfolios’ financial statements.
As of December 31, 2017, the Portfolios did not have any tax positions that did not meet the “more-likely-than-not” threshold of being sustained by the applicable tax authority. Open tax years are those that are open for exam by Federal and state taxing authorities. As of December 31, 2017, open Federal tax years include the tax years ended December 31, 2014 through December 31, 2017, and open New York tax years include the tax years ended December 31, 2014 through December 31, 2017. The Portfolios have no tax examinations in progress.
Notes to Financial Statements (Continued)
Fair Value Measurements: Valuation inputs used to determine the value of the Portfolios’ investments are summarized in the three broad levels listed below:
| | Level 1 — | quoted prices in active markets for identical assets. |
| | Level 2 — | other significant inputs (including quoted prices of similar securities, interest rates, prepayment speeds, credit risk, etc.). |
| | Level 3 — | significant unobservable inputs (which may include the Portfolios’ own assumptions in determining the fair value of investments). |
The inputs or methodology used to value securities are not necessarily an indication of the risk associated with investing in those securities.
Portfolio securities listed or traded on securities exchanges, including ADRs, are valued at the closing price on the exchange or system where the security is principally traded or at the NASDAQ Official Closing Price. If there have been no sales for that day on the exchange or system, a security is valued at the mean of the highest closing bid and lowest asked prices on the exchange or system where the security is principally traded. These valuations are typically categorized as Level 1 in the fair value hierarchy.
In accordance with procedures adopted by the Board, fair value pricing may be used if events materially affecting the value of foreign securities occur between the times the exchange on which they are traded closes and the time the Portfolios’ net asset values are calculated. These valuations are categorized as Level 2 in the fair value hierarchy.
The following is a summary categorization, as of December 31, 2017, of each Portfolio’s investments based on the level of inputs utilized in determining the value of such investments:
| | | LEVEL 1 – Quoted Prices(1)(3) | |
| | | NGF | | | NAGF | | | NSCGF | |
| Assets | | | | | | | | | |
Common Stocks(2) | | $ | 109,289,131 | | | $ | 61,361,468 | | | $ | 26,220,051 | |
| Closed-End Funds | | | — | | | | — | | | | 1,258,100 | |
| Short-Term Investments | | | 1,262,813 | | | | 192,261 | | | | 2,620,491 | |
| Liabilities | | | | | | | | | | | | |
Securities Sold Short(2) | | | (6,202,598 | ) | | | (4,070,933 | ) | | | (226,750 | ) |
| Total | | $ | 104,349,346 | | | $ | 57,482,796 | | | $ | 29,871,892 | |
(1) | As of December 31, 2017, the Portfolios did not hold Level 2 or Level 3 investments. |
(2) | Please refer to the Schedule of Investments and Schedule of Securities Sold Short to view segregation by industry. |
(3) | There were no transfers into or out of Levels 1, 2 or 3 during the period. |
4. Investment Advisory and Administrative Services
The Company has engaged Needham Investment Management L.L.C. (the “Adviser”) to manage its investments pursuant to an Investment Advisory Agreement. The Company pays the Adviser an investment advisory fee at the annual rate of 1.25% of the average daily net assets of each Portfolio.
Needham Funds
Notes to Financial Statements (Continued)
The Adviser has entered into agreements with the Company (the “Expense Limitation Agreements”) whereby the Adviser has contractually agreed to waive its investment advisory fee for, and to reimburse expenses of, NGF, NAGF and NSCGF in an amount that limits annual operating expenses to not more than 1.40% and 1.95% of the average daily net assets of the Fund’s Institutional Class and Retail Class, respectively (excluding taxes, interest, brokerage, dividends on short positions, acquired fund fees and expenses and extraordinary items, and excluding shareholder redemption fees but including the investment advisory fee stated in the Investment Advisory Agreement). The Expense Limitation Agreements are effective for the period from May 1, 2017 through April 30, 2018. The Expense Limitation Agreements shall continue in effect from year to year thereafter only upon mutual agreement of the Company and the Adviser. Similar agreements were in effect for certain prior periods.
Any reimbursements or fee waivers made by the Adviser in respect of a Portfolio are subject to recoupment by the Adviser, to the extent that the Portfolio is able to make the repayment within the expense limitation established in the Expense Limitation Agreements. Under the Expense Limitation Agreements, such recoupments must be made within three years following the fiscal year in which the Adviser reduced its compensation and/or assumed expenses for the applicable Portfolio. The table below indicates the amount of fees that the Adviser has the potential to recoup from the Portfolios:
| | Recovery Expiring on |
| | 4/30/2021 | 4/30/2020 | 4/30/2019 | 4/30/2018 |
| NGF (Retail Class) | $ — | $ — | $ — | $ — |
| NGF (Institutional Class) | 70,976 | 13,094 | — | — |
| NAGF (Retail Class) | 15,519 | — | 5,220 | — |
| NAGF (Institutional Class) | 48,107 | 17,829 | — | — |
| NSCGF (Retail Class) | 36,626 | 48,101 | 60,837 | 37,654 |
| NSCGF (Institutional Class) | 36,035 | 12,657 | — | — |
The Company and U.S. Bancorp Fund Services, LLC (the “Administrator”) are parties to a Fund Administration Servicing Agreement. The Administrator provides administrative and fund accounting services pursuant to this agreement and, in consideration of these services, receives a fee computed daily and paid monthly at an annual rate based on a percentage of the value of each Portfolio’s assets. The Administrator is also compensated for any out of pocket expenses that are reasonably incurred in carrying out its duties under the Administration Agreement. The Administrator also provides transfer agent services pursuant to a Transfer Agent Servicing Agreement for additional fees.
Certain officers of the Company are also officers of the Adviser and/or Needham & Company, LLC (the “Distributor”). Such officers receive no fees from the Company for serving as officers of the Company. Each of the two Directors who is not an “interested person” (as defined in the 1940 Act) of the Company (each, an “Independent Director”) receives a quarterly retainer of $3,000 and a per-meeting fee of $500. Each Independent Director is also a member of the Audit Committee of the Company’s Board of Directors and receives a fee of
Notes to Financial Statements (Continued)
$500 per meeting attended. The Adviser provides an employee to serve as Chief Compliance Officer for the Company and to provide certain related services. An affiliate of the Adviser, Needham & Company, LLC, pays the Chief Compliance Officer’s compensation and the Company reimburses this affiliate for the Company’s allocated portion of the expense.
5. Distribution Plan
The Company has adopted an Amended and Restated Plan of Distribution pursuant to Rule 12b-1 under the 1940 Act. Under the Plan, each Portfolio may pay compensation to the Distributor or any other distributor or financial institution with which the Company has an agreement with respect to the Retail Class of each Portfolio, with the amount of such compensation not to exceed an annual rate of 0.25% of each Portfolio’s daily average net assets. For the year ended December 31, 2017, NGF, NAGF and NSCGF paid 12b-1 fees to the Distributor in the amount of $213,549, $118,986 and $61,778, respectively.
During the year ended December 31, 2017, NGF, NAGF and NSCGF incurred and paid brokerage commissions to the Distributor in the amount of $14,183, $11,990, and $33,951, respectively.
6. Temporary Borrowings
Each Portfolio may borrow from banks up to 25% of its total assets and may pledge its assets in connection with these borrowings, provided that no additional investments shall be made while borrowings exceed 5% of total assets.
The Portfolios did not engage in any temporary borrowings during the year ended December 31, 2017.
7. Short Sale Transactions
During the year ended December 31, 2017, each Portfolio sold securities short. Upon selling a security short, the Portfolios record an asset for the settlement amount and a corresponding liability, which is marked-to-market to reflect current value. Certain securities owned by each respective Portfolio are segregated as collateral while the short sales are outstanding. At December 31, 2017, the market value of securities separately segregated to cover short positions was $5,621,050, $5,784,355, and $1,148,963 for NGF, NAGF and NSCGF, respectively.
Additionally, the Portfolios had receivables for Deposit with Broker for Securities Sold Short of $6,365,434, $4,204,337, and $242,162 pledged as collateral with a broker in connection with open short positions for NGF, NAGF, and NSCGF, respectively. Securities sold short at December 31, 2017 and their related market values and proceeds are set forth in the preceding Schedule of Securities Sold Short for each Portfolio.
Needham Funds
Notes to Financial Statements (Continued)
8. Investment Transactions
The following summarizes the aggregate amount of the cost of purchases and proceeds from sales of investment securities and securities sold short, excluding short-term securities, during the year ended December 31, 2017:
| | Purchases | Sales |
| NGF | | |
| Long Transactions | $10,324,088 | $32,566,500 |
| Short Sale Transactions | — | 457,435 |
| NAGF | | |
| Long Transactions | 9,786,507 | 12,305,372 |
| Short Sale Transactions | — | 1,043,290 |
| NAGF | | |
| Long Transactions | 22,425,551 | 25,216,713 |
| Short Sale Transactions | — | — |
There were no purchases or sales of U.S. government securities during the year ended December 31, 2017.
9. Financial Instruments With Off-Balance Sheet Risk
In the normal course of their business, the Portfolios may engage in transactions with off-balance sheet risk, including securities sold short, written options, futures, and forward currency contracts. Transactions in certain financial instruments represent future commitments to purchase or sell other financial instruments at specific terms at specified future dates. Each of these financial instruments contains varying degrees of off-balance sheet risk whereby changes in the market values of the securities underlying the financial instruments may be in excess of the amounts recognized in the financial statements.
Securities sold short represent obligations of the Portfolios to make future delivery of specific securities and, correspondingly, create an obligation to purchase the securities at market prices prevailing at a later delivery date (or to deliver the securities if already owned by the Portfolios). As a result, short sales create the risk that the Portfolios’ ultimate obligation to satisfy the delivery requirements may exceed the amount of the proceeds initially received on the liability recorded in the financial statements.
10. Indemnification
Under the Company’s organizational documents, its Directors and Officers are indemnified against certain liabilities arising out of the performance of their duties to the Company. In addition, in the ordinary course of business, the Company enters into contracts that contain a variety of indemnifications. The Company’s maximum exposure under these arrangements is unknown. However, the Company has not had prior claims or losses pursuant to these contracts and expects the risk of loss to be remote.
Notes to Financial Statements (Continued)
11. Transactions with Affiliates
NAGF owned 5% or more of the voting securities of the following company during the year ended December 31, 2017. As a result, this company is deemed to be an affiliate of NAGF as defined by the 1940 Act. Transactions during the period in this affiliated company were as follows:
| | Share | | | Share | Net Change | | | |
| | Balance | | | Balance | in Unrealized | Realized | | Value |
| | Dec. 31, | | | Dec. 31, | Appreciation | Gains | Dividend | Dec. 31, |
Security Name | 2016 | Purchases | Sales | 2017 | (Depreciation) | (Losses) | Income | 2017 |
| GSE | | | | | | | | |
| Systems, Inc. | 960,000 | 160,000 | — | 1,120,000 | $(208,518) | — | — | $3,640,000 |
12. Federal Income Taxes
No provision for federal income taxes is required since the Company intends to continue to qualify as a regulated investment company under Subchapter M of the Internal Revenue Code and distribute substantially all of its taxable income and capital gains to shareholders. Because income tax regulations differ from GAAP, the timing and character of income and capital gain distributions determined in accordance with tax regulations can differ from income and capital gains recognized for financial reporting purposes. Accordingly, the character of distributions and the composition of net assets for tax purposes can differ from those reflected in the financial statements. These book/tax differences may be temporary or permanent in nature. Temporary differences are generally due to differing book and tax treatment for the timing of the recognition of gains and losses on securities, including post-October losses (as described below). Permanent differences are generally due to differing treatment of net investment losses. To the extent these differences are permanent, they are charged or credited to paid-in capital, accumulated net realized gain (loss), or accumulated net investment income (loss), as appropriate, in the period in which the differences arise. These reclassifications have no effect on net assets or net asset value per share of each Portfolio.
As of December 31, 2017, the cost, gross unrealized appreciation, gross unrealized depreciation, and the net unrealized appreciation (depreciation) on securities, including proceeds from securities sold short for federal income tax purposes, were as follows:
| | | | | Net |
| | | Gross | Gross | Unrealized |
| | | Unrealized | Unrealized | Appreciation |
| | Cost | Appreciation | Depreciation | (Depreciation) |
| NGF | $47,399,745 | $62,139,014 | $(5,189,413) | $56,949,601 |
| NAGF | 25,880,329 | 34,818,425 | (3,215,958) | 31,602,467 |
| NSCGF | 26,150,660 | 5,023,040 | (1,301,808) | 3,721,232 |
The difference between the tax cost of investments and the cost of investments for GAAP purposes is primarily due to the tax treatment for wash sale losses.
Needham Funds
Notes to Financial Statements (Continued)
As of December 31, 2017, the components of distributable earnings (loss) on a tax basis were as follows:
| | | NGF | | | NAGF | | | NSCGF | |
| Undistributed ordinary income | | $ | — | | | $ | — | | | $ | 259,233 | |
| Undistributed long-term capital gains | | | 9,147,986 | | | | — | | | | — | |
| Unrealized appreciation (depreciation) | | | 56,949,601 | | | | 31,602,467 | | | | 3,721,232 | |
| Other accumulated gains (loss) | | | (669 | ) | | | — | | | | — | |
| Total accumulated earnings (loss) | | $ | 66,096,918 | | | $ | 31,602,467 | | | $ | 3,980,465 | |
The tax character of distributions paid during the year ended December 31, 2017 was as follows:
| | | NGF | | | NAGF | | | NSCGF | |
| Ordinary income | | $ | 66,959 | | | $ | — | | | $ | 2,019,133 | |
| Net long-term capital gains | | | 10,413,410 | | | | 3,108,250 | | | | 345,430 | |
| Return of capital | | | — | | | | — | | | | — | |
| Total distributions paid | | $ | 10,480,369 | | | $ | 3,108,250 | | | $ | 2,364,563 | |
In 2017, a portion of such dividends was distributed in connection with NEEGX, NEAGX, and NESGX redemptions.
The tax character of distributions paid during the year ended December 31, 2016 was as follows:
| | | NGF | | | NAGF | | | NSCGF | |
| Ordinary income | | $ | — | | | $ | — | | | $ | 548,261 | |
| Net long-term capital gains | | | 4,983,292 | | | | 3,518,408 | | | | 1,347,199 | |
| Return of capital | | | — | | | | — | | | | — | |
| Total distributions paid | | $ | 4,983,292 | | | $ | 3,518,408 | | | $ | 1,895,460 | |
Under current tax law, capital and currency losses realized after October 31 of a Portfolio’s fiscal year may be deferred and treated as occurring on the first business day of the following fiscal year for tax purposes. The following Portfolios had deferred post-October capital and currency losses, which will be treated as arising on the first business day of the year ended of December 31, 2017.
As of December 31, 2017, none of the Portfolios had accumulated capital loss carryovers.
13. Subsequent Events
Management has evaluated subsequent events through the date of this filing. This evaluation did not result in any subsequent events that necessitated recognition or disclosures.
Report of Independent Registered Public Accounting Firm
To the shareholders and board of directors
The Needham Funds, Inc.:
Opinion on the Financial Statements
We have audited the accompanying statements of assets and liabilities of the Needham Growth Fund, Needham Aggressive Growth Fund and Needham Small Cap Growth Fund, each a “Portfolio” of The Needham Funds, Inc. (collectively, the “Portfolios”), including the schedules of investments and schedules of securities sold short, as of December 31, 2017, the related statements of operations for the year then ended, the statements of changes in net assets for each of the years in the two year period then ended, and the related notes (collectively, the “financial statements”) and the financial highlights for each of the years in the five year period then ended. In our opinion, the financial statements and financial highlights present fairly, in all material respects, the financial position of the Portfolios as of December 31, 2017, the results of their operations for the year then ended, the changes in their net assets for each of the years in the two year period then ended, and the financial highlights for each of the years in the five year period then ended, in conformity with U.S. generally accepted accounting principles.
Basis for Opinion
These financial statements and financial highlights are the responsibility of the Portfolios’ management. Our responsibility is to express an opinion on these financial statements and financial highlights based on our audits. We are a public accounting firm registered with the Public Company Accounting Oversight Board (United States) (“PCAOB”) and are required to be independent with respect to the Portfolios in accordance with the U.S. federal securities laws and the applicable rules and regulations of the Securities and Exchange Commission and the PCAOB.
We conducted our audits in accordance with the standards of the PCAOB. Those standards require that we plan and perform the audit to obtain reasonable assurance about whether the financial statements and financial highlights are free of material misstatement, whether due to error or fraud. Our audits included performing procedures to assess the risks of material misstatement of the financial statements and financial highlights, whether due to error or fraud, and performing procedures that respond to those risks. Such procedures included examining, on a test basis, evidence regarding the amounts and disclosures in the financial statements and financial highlights. Such procedures also included confirmation of securities owned as of December 31, 2017, by correspondence with custodians and brokers. Our audits also included evaluating the accounting principles used and significant estimates made by management, as well as evaluating the overall presentation of the financial statements and financial highlights. We believe that our audits provide a reasonable basis for our opinion.
We have served as the auditor of The Needham Funds, Inc. since 2011.
New York, New York
February 28, 2018
Needham Funds
Information about Directors and Officers (Unaudited)
December 31, 2017
Information pertaining to the Directors and Officers of the Company is set forth below. The Statement of Additional Information (SAI) includes additional information about the Directors and is available without charge, upon request, by calling 800-625-7071.
The address of each individual is 250 Park Avenue, New York, NY 10177-1099. Each Director serves until the next annual shareholders meeting or until his successor is elected and qualified.
| | | | Term of Office | | Portfolios in the | | Principal Occupations(s) | |
| | Name, Year of Birth | | and Length of | | Fund Complex | | During Past 5 Years | |
| | and Position with | | Term Served by | | Overseen by | | and Other Directorships | |
| | the Company | | Director/Officer | | Director/Officer | | Held by Director/Officer | |
| | Independent Directors | |
| | John W. Larson, | | Indefinite; | | Three | | Currently retired. Partner at the law | |
| | Year of Birth: 1935 | | Since 2006 | | | | firm of Morgan, Lewis & Bockius LLP | |
| | Director | | | | | | from 2003 until retiring in December | |
| | | | | | | | 2009. Partner at the law firm of | |
| | | | | | | | Brobeck, Phleger & Harrison LLP from | |
| | | | | | | | 1969 until 2003. From July 1971 to | |
| | | | | | | | September 1973 worked in government | |
| | | | | | | | service as Assistant Secretary of the | |
| | | | | | | | United States Department of the Interior | |
| | | | | | | | and Counselor to George P. Schultz, | |
| | | | | | | | Chairman of the Cost of Living | |
| | | | | | | | Council. Director of Wage Works, Inc. | |
| | | | | | | | (an employee benefits company) | |
| | | | | | | | since 2000. Director of Sangamo | |
| | | | | | | | BioSciences, Inc. since 1996. | |
| | F. Randall Smith, | | Indefinite; | | Three | | Founder, Member of Investment | |
| | Year of Birth: 1938 | | Since 1996 | | | | Committee, Investment Analyst and | |
| | Director | | | | | | Portfolio Manager of Capital Counsel | |
| | | | | | | | LLC (a registered investment adviser) | |
| | | | | | | | since September 1999; President from | |
| | | | | | | | 1999 to 2014. Co-founder and Chief | |
| | | | | | | | Investment Officer of Train, Smith | |
| | | | | | | | Counsel (a registered investment | |
| | | | | | | | adviser) from 1975 to 1999. | |
| | Interested Director | |
| | George A. Needham*, | | Indefinite; | | Three | | Chairman of the Board and Chief | |
| | Year of Birth: 1943 | | Since 1996 | | | | Executive Officer of The Needham | |
| | Chairman, President | | | | | | Group, Inc. and Needham Holdings, | |
| | and Director | | | | | | LLC since December 2004. Chairman | |
| | | | | | | | of the Board and Chief Executive Officer | |
| | | | | | | | of Needham Asset Management, LLC | |
| | | | | | | | since April 2006. Chairman of the | |
| | | | | | | | Board from 1996 to December 2004 | |
| | | | | | | | and Chief Executive Officer from 1985 | |
| | | | | | | | to December 2004 of Needham & | |
| | | | | | | | Company, LLC. Managing Member of | |
| | | | | | | | Needham Capital Management, LLC | |
| | | | | | | | since 2000. | |
Information about Directors and Officers (Unaudited) (Continued)
December 31, 2017
| | | | Term of Office | | Portfolios in the | | Principal Occupations(s) | |
| | Name, Year of Birth | | and Length of | | Fund Complex | | During Past 5 Years | |
| | and Position with | | Term Served by | | Overseen by | | and Other Directorships | |
| | the Company | | Director/Officer | | Director/Officer | | Held by Director/Officer | |
| | Officers | |
| | John Barr, | | One year; | | Two | | Portfolio Manager of Needham | |
| | Year of Birth 1956 | | Since 2010 | | | | Asset Management since 2010. | |
| | Executive Vice President | | | | | | Founding and Managing Member | |
| | and Co-Portfolio | | | | | | of Oliver Investment Management, | |
| | Manager of the Needham | | | | | | LLC from 2008 to 2009. Manager | |
| | Growth Fund, Executive | | | | | | and Analyst at Buckingham Capital | |
| | Vice President and | | | | | | from 2002 to 2008. Managing | |
| | Portfolio Manager of | | | | | | Director and a Senior Analyst at | |
| | the Needham Aggressive | | | | | | Robertson Stephens following | |
| | Growth Fund. | | | | | | semiconductor companies from | |
| | | | | | | | 2000 to 2002. From 1995 to 2000, | |
| | | | | | | | Managing Director and Senior Analyst | |
| | | | | | | | at Needham and Company, LLC, | |
| | | | | | | | also served as Director of Research. | |
| | | | | | | | Director of Coventor, Inc. since 2009. | |
| | Chris Retzler, | | One year; | | Two | | Portfolio Manager of Needham | |
| | Year of Birth: 1971 | | Since 2008 | | | | Asset Management, LLC since 2008. | |
| | Executive Vice President | | | | | | Vice President of Needham Asset | |
| | and Co-Portfolio | | | | | | Management, LLC since 2005. | |
| | Manager of the | | | | | | Head of Winterkorn, a healthcare | |
| | Needham Growth Fund, | | | | | | manufacturing and distribution | |
| | Executive Vice President | | | | | | company, from 2002 to 2005. | |
| | and Portfolio Manager | | | | | | | |
| | of the Needham | | | | | | | |
| | Small Cap Growth Fund. | | | | | | | |
| | James W. Giangrasso, | | One year; | | Three | | Chief Financial Officer of | |
| | Year of Birth: 1962 | | Since 2011 | | | | Needham Asset Management, LLC | |
| | Chief Financial Officer, | | | | | | since 2011. Principal and | |
| | Treasurer and Secretary | | | | | | Controller of Needham Asset | |
| | | | | | | | Management, LLC since 2006. | |
| | James M. Abbruzzese, | | One year; | | Three | | Chief Compliance Officer of | |
| | Year of Birth: 1969 | | Since 2004 | | | | Needham Asset Management, LLC | |
| | Chief Compliance Officer | | | | | | since April 2006. Chief Compliance | |
| | | | | | | | Officer and Managing Director of | |
| | | | | | | | Needham & Company, LLC from 2008 | |
| | | | | | | | through 2012. Chief Administrative | |
| | | | | | | | Officer of Needham & Company, LLC | |
| | | | | | | | since 2012. Chief Compliance Officer | |
| | | | | | | | of Needham Capital Management, LLC | |
| | | | | | | | since 2000. | |
| * | An “interested person”, as defined in the 1940 Act, of the Company or the Company’s investment adviser. Mr. Needham is deemed to be an interested person because of his affiliation with the Portfolios’ Adviser and the Portfolios’ Distributor, and because he is an officer of the Company. |
Needham Funds
Supplementary Information (Unaudited)
December 31, 2017
Federal Income Tax Information
During the year ended December 31, 2017, NGF, NAGF and NSCGF declared and paid long-term realized gains distributions in the amounts of $10,413,410, $3,108,250 and $345,430, respectively.
For the year ended December 31, 2017, NGF and NSCGF declared and paid ordinary income distributions in the amounts of $66,959 and $2,019,133 respectively. NAGF did not declare any ordinary income distributions.
For the fiscal year ended December 31, 2017, certain dividends paid by the Portfolios may be subject to a maximum tax rate of 15%. The percentage of dividends declared from ordinary income reported as qualified dividend income was as follows:
| NGF | 100.00% | |
| NAGF | 0.00% | |
| NSCGF | 7.37% | |
For corporate shareholders, the percent of ordinary income distributions qualifying for the corporate dividends received deduction for the fiscal year ended December 31, 2017 was as follows:
| NGF | 0.00% | |
| NAGF | 0.00% | |
| NSCGF | 0.00% | |
The percentage of taxable ordinary income distributions that are designated as short-term capital gain distributions under Internal Revenue Section 871 (k)(2)(C) for each Fund were as follows (unaudited):
| NGF | 100.00% | |
| NAGF | 0.00% | |
| NSCGF | 100.00% | |
Privacy Policy
It is the policy of the Company to keep personally identifiable financial information about you as an individual (“nonpublic personal information’’) confidential, and use or disclose it only as necessary to provide services to you or the Company or as otherwise required or permitted by law. We may collect the following nonpublic personal information about you:
| | • | Information we receive from you on or in applications or other forms, correspondence, or conversations, including, but not limited to, your name, address, phone number, social security number, assets, income and date of birth; and |
| | • | Information about your transactions with us, our affiliates, or others, including, but not limited to, your account number and balance, payments history, parties to transactions, cost basis information, other financial information and information about how you vote your shares. |
Supplementary Information (Unaudited) (Continued)
December 31, 2017
We disclose nonpublic personal information about current and former shareholders to companies that provide necessary services to the Company. These companies include the transfer agent, distributor, administrator and investment adviser as well as other affiliates of the Company. We maintain physical, electronic and procedural safeguards that comply with federal standards to guard your nonpublic personal information and restrict access to this information to those persons who need it to provide services to you or the Company or who are otherwise permitted by law to receive it. In the event that you hold any shares of our funds through a financial intermediary, including, but not limited to, a broker-dealer, bank, or trust company, the privacy policy of your financial intermediary governs how your nonpublic personal information is shared with nonaffiliated third parties.
If you have any questions concerning the Company’s Privacy Policy, please call 1-800-625-7071.
Disclosure of Portfolio Holdings
The Company files a Form N-Q with the Securities and Exchange Commission (the “SEC”) no more than sixty days after the Company’s first and third fiscal quarters. For the Company, this would be for the fiscal quarters ending March 31 and September 30. Form N-Q includes a complete schedule of the Company’s portfolio holdings as of the end of those fiscal quarters. The Company’s N-Q filings can be found free of charge on the SEC’s website at http://www.sec.gov, or they may be reviewed and copied at the SEC’s Public Reference Room in Washington, D.C. (call 800-SEC-0330 for information on the operation of the Public Reference Room). copied at the SEC’s Public Reference Room in Washington, D.C. (call 800-SEC-0330 for information on the operation of the Public Reference Room).
Voting Proxies on Company Portfolio Securities
A description of the policies and procedures that the Company uses to determine how to vote proxies relating to portfolio securities and information regarding how the Company voted proxies relating to portfolio securities during the most recent 12-month period ended June 30 are available without charge, upon request, by calling 800-625-7071 or on the SEC’s website at http://www.sec.gov.
Household Delivery of Shareholder Documents
To reduce expenses, the Company may mail only one copy of the Portfolios’ prospectuses, proxy statements, information statements, and each annual and semi-annual report to those addresses shared by two or more accounts. If you wish to receive individual copies of these documents, please call the Portfolios at 1-800-625-7071 or contact your financial institution. You will begin receiving individual copies thirty days after receiving your request.
Needham Funds
Supplementary Information (Unaudited) (Continued)
December 31, 2017
Board Consideration and Approval of Investment Advisory Agreement
On October 20, 2017, at a meeting called for the purpose of voting on such approval, the Board, including all of the Independent Directors, approved the continuance of the Investment Advisory Agreement (the “Advisory Agreement”) between the Company and the Adviser with respect to NGF, NAGF and NSCGF. In doing so, the Board reviewed materials provided by the Adviser to assist them in making a determination (the “Board Materials”). The Independent Directors were assisted in their review by independent legal counsel and met with counsel in executive session separate from representatives of the Adviser. In considering the renewal of the Advisory Agreement, the Board considered the nature, extent, and quality of the services to be provided by the Adviser; the investment performance of each Portfolio and the Adviser; the costs of the services to be provided and profits to be realized by the Adviser and its affiliates from the relationship with each Portfolio; the extent to which economies of scale would be realized as the Portfolios grow; and whether fee levels reflect these economies of scale for the benefit of investors.
The Directors stated that their consideration of the continuance of the Advisory Agreement included consideration of the peer group comparisons in the Board Materials to other investment companies with similar investment objectives and to each Portfolio’s respective unmanaged index for various periods ended September 30, 2017, noting that NGF’s performance was above its peer group average and median performance for the 5-year, 10-year and since inception periods and above the average and median performance of the relevant Morningstar Universes for the since inception period. For NAGF, the Directors noted that the Portfolio’s performance was above the peer group average and median performance for the 1-year, 3-year, 5-year (average only) and 10-year periods and above the average and median performance of the relevant Morningstar Universes for the 1-year, 3-year, 5-year, 10-year and since inception (median only) periods. For NSCGF, the Directors noted that the Portfolio’s performance was above the peer group average and median performance for the 1-year, 3-year and 10-year periods and the average and median performance of the relevant Morningstar Universes for the 1-year, 3-year, 10-year and since inception periods. It was further noted that the Portfolios’ performance compared favorably to the longer term performance of their respective benchmark indices. In addition to reviewing each Portfolio’s performance and the profitability analysis of the Adviser, the Directors considered possible economies of scale, but did not believe material economies of scale to be present in light of the Portfolios’ asset size and redemption trends.
In their deliberations, the Directors considered all factors they believed relevant in addition to the performance comparisons described above, including the following: the nature, extent and quality of services rendered by the Adviser; the costs borne by, and profitability of, and other benefits to, the Adviser and its affiliates in providing services to each Portfolio; comparative fee and expense data for each Portfolio and other investment companies with similar investment objectives (having been advised that the Adviser does not manage other accounts with investment objectives and strategies similar to those of the Portfolios except private investment funds with fee structures that include performance
Supplementary Information (Unaudited) (Continued)
December 31, 2017
fees); whether expenses of NGF, NAGF and NSCGF might be expected to decline as a percentage of net assets as NGF, NAGF and NSCGF assets increase (although there had not been a significant increase in assets in recent years); the professional experience and qualifications of each Portfolio’s portfolio manager(s) and other personnel of the Adviser, including the fact that a high caliber of personnel was both needed and provided to meet the needs of NGF, NAGF and NSCGF (specifically with respect to investments in securities sold short); and the terms of the Advisory Agreement. The Independent Directors confirmed that they had received adequate information to make a reasonable determination with respect to the approval of the Advisory Agreement. After full consideration of all the foregoing factors, the Board determined to approve the renewal of the Advisory Agreement.
250 Park Avenue, 10th Floor
New York, New York 10177
1-800-625-7071
Investment Adviser:
Needham Investment Management L.L.C.
250 Park Avenue, 10th Floor
New York, New York 10177
President
George A. Needham
Executive Vice Presidents and Portfolio Managers
John Barr
Needham Growth Fund
Needham Aggressive Growth Fund
Chris Retzler
Needham Growth Fund
Needham Small Cap Growth Fund
Directors
George A. Needham
John W. Larson
F. Randall Smith
Distributor:
Needham & Company, LLC
250 Park Avenue, 10th Floor
New York, New York 10177
212-371-8300
Administrator, Shareholder Servicing Agent and Transfer Agent:
U.S. Bancorp Fund Services, LLC
615 East Michigan Street
Milwaukee, WI 53202
Custodian:
U.S. Bank, N.A.
1555 North RiverCenter Drive
Milwaukee, WI 53212
Counsel:
Proskauer Rose LLP
Eleven Times Square
New York, NY 10036-8299
Independent Registered Public Accounting Firm:
KPMG LLP
345 Park Avenue
New York, NY 10154
Item 2. Code of Ethics.
The registrant has adopted a code of ethics that applies to the registrant’s principal executive officer and principal financial officer. The registrant has not made amendments to its code of ethics during the period covered by this report. The registrant has not granted any waivers from any provisions of the code of ethics during the period covered by this report.
A copy of the registrant’s Code of Ethics is filed herewith.
Item 3. Audit Committee Financial Expert.
The registrant’s board of directors has determined that there is at least one audit committee financial expert serving on its audit committee. F. Randall Smith is the “audit committee financial expert” and is considered to be “independent” as each term is defined in Item 3 of Form N‑CSR.
Item 4. Principal Accountant Fees and Services.
The registrant has engaged its principal accountant to perform audit services, audit-related services, tax services and other services during the past two fiscal years. “Audit services” refer to performing an audit of the registrant's annual financial statements or services that are normally provided by the accountant in connection with statutory and regulatory filings or engagements for those fiscal years. “Audit-related services” refer to the assurance and related services by the principal accountant that are reasonably related to the performance of the audit. “Tax services” refer to professional services rendered by the principal accountant for tax compliance, tax advice, and tax planning. “Other services” provided by the principal accountant were not applicable. The following table details the aggregate fees billed or expected to be billed for each of the last two fiscal years for audit fees, audit-related fees, tax fees and other fees by the principal accountant.
| | FYE 12/31/2017 | FYE 12/31/2016 |
| Audit Fees | $75,800 | $71,500 |
| Audit-Related Fees | $ 0 | $ 0 |
| Tax Fees | $22,365 | $21,000 |
| All Other Fees | $ 0 | $ 0 |
The audit committee has adopted pre-approval policies and procedures that require the audit committee to pre‑approve all audit and non‑audit services of the registrant, including services provided to any entity affiliated with the registrant.
The percentage of fees billed by KPMG LLP applicable to non-audit services pursuant to waiver of pre-approval requirement were as follows:
| | FYE 12/31/2017 | FYE 12/31/2016 |
| Audit-Related Fees | 0% | 0% |
| Tax Fees | 0% | 0% |
| All Other Fees | 0% | 0% |
All of the principal accountant’s hours spent on auditing the registrant’s financial statements were attributed to work performed by full‑time permanent employees of the principal accountant.
The following table indicates the non-audit fees billed or expected to be billed by the registrant’s accountant for services to the registrant and to the registrant’s investment adviser (and any other controlling entity, etc.—not sub-adviser) for the last two years. The audit committee of the board of trustees/directors has considered whether the provision of non-audit services that were rendered to the registrant's investment adviser is compatible with maintaining the principal accountant's independence and has concluded that the provision of such non-audit services by the accountant has not compromised the accountant’s independence.
| Non-Audit Related Fees | FYE 12/31/2017 | FYE 12/31/2016 |
| Registrant | $0 | $0 |
| Registrant’s Investment Adviser | $7,900 | $7,660 |
Item 5. Audit Committee of Listed Registrants.
Not applicable to registrants who are not listed issuers (as defined in Rule 10A-3 under the Securities Exchange Act of 1934).
Item 6. Investments.
(a) | Schedule of Investments is included as part of the report to shareholders filed under Item 1 of this Form. |
Item 7. Disclosure of Proxy Voting Policies and Procedures for Closed-End Management Investment Companies.
Not applicable to open-end investment companies.
Item 8. Portfolio Managers of Closed-End Management Investment Companies.
Not applicable to open-end investment companies.
Item 9. Purchases of Equity Securities by Closed‑End Management Investment Company and Affiliated Purchasers.
Not applicable to open-end investment companies.
Item 10. Submission of Matters to a Vote of Security Holders.
Not Applicable.
Item 11. Controls and Procedures.
| (a) | The Registrant’s Chief Executive Officer and Chief Financial Officer have reviewed the Registrant's disclosure controls and procedures (as defined in Rule 30a-3(c) under the Investment Company Act of 1940 (the “Act”)) as of a date within 90 days of the filing of this report, as required by Rule 30a-3(b) under the Act and Rules 13a-15(b) or 15d‑15(b) under the Securities Exchange Act of 1934. Based on their review, such officers have concluded that the disclosure controls and procedures are effective in ensuring that information required to be disclosed in this report is appropriately recorded, processed, summarized and reported and made known to them by others within the Registrant and by the Registrant’s service provider. |
| (b) | There were no changes in the Registrant's internal control over financial reporting (as defined in Rule 30a-3(d) under the Act) that occurred during the Registrant’s first fiscal half-year of the period covered by this report that has materially affected, or is reasonably likely to materially affect, the Registrant's internal control over financial reporting. |
Item 12. Exhibits.
| (a) | (1) Any code of ethics or amendment thereto, that is the subject of the disclosure required by Item 2, to the extent that the registrant intends to satisfy Item 2 requirements through filing an exhibit. Filed herewith. |
(2) A separate certification for each principal executive and principal financial officer pursuant to Section 302 of the Sarbanes-Oxley Act of 2002. Filed herewith.
(3) Any written solicitation to purchase securities under Rule 23c‑1 under the Act sent or given during the period covered by the report by or on behalf of the registrant to 10 or more persons. Not applicable to open-end investment companies.
| (b) | Certifications pursuant to Section 906 of the Sarbanes‑Oxley Act of 2002. Furnished herewith. |
SIGNATURES
Pursuant to the requirements of the Securities Exchange Act of 1934 and the Investment Company Act of 1940, the registrant has duly caused this report to be signed on its behalf by the undersigned, thereunto duly authorized.
(Registrant) The Needham Funds, Inc.
By (Signature and Title) /s/George A. Needham
George A. Needham, President (Chief Executive Officer)
Date March 5, 2018
Pursuant to the requirements of the Securities Exchange Act of 1934 and the Investment Company Act of 1940, this report has been signed below by the following persons on behalf of the registrant and in the capacities and on the dates indicated.
By (Signature and Title) /s/George A. Needham
George A. Needham, President (Chief Executive Officer)
By (Signature and Title) /s/James W. Giangrasso
James W. Giangrasso, Treasurer and Secretary (Chief Financial Officer)