As filed with the Securities and Exchange Commission on March 10, 2016.
UNITED STATES
SECURITIES AND EXCHANGE COMMISSION
Washington, D.C. 20549
FORM N-CSR
CERTIFIED SHAREHOLDER REPORT OF REGISTERED
MANAGEMENT INVESTMENT COMPANIES
Investment Company Act file number 811-09114
The Needham Funds, Inc.
(Exact name of registrant as specified in charter)
445 Park Avenue, New York, NY 10022-2606
(Address of principal executive offices) (Zip code)
Mr. George A. Needham, 445 Park Avenue, New York, NY 10022-2606
(Name and address of agent for service)
1-800-625-7071
Registrant's telephone number, including area code
Date of fiscal year end: December 31, 2015
Date of reporting period: December 31, 2015
Item 1. Reports to Stockholders.

445 Park Avenue
New York, New York 10022-2606
1-800-625-7071
www.needhamfunds.com
Annual Report
December 31, 2015
Contents
| Letter from the Adviser | 1 |
| | |
| Portfolio Characteristics | |
| Needham Growth Fund | 8 |
| Needham Aggressive Growth Fund | 9 |
| Needham Small Cap Growth Fund | 10 |
| Disclosure of Fund Expenses | 11 |
| | |
| Schedules of Investments | |
| Needham Growth Fund | 12 |
| Needham Aggressive Growth Fund | 15 |
| Needham Small Cap Growth Fund | 18 |
| | |
| Schedule of Securities Sold Short | |
| Needham Growth Fund | 14 |
| Needham Aggressive Growth Fund | 17 |
| Needham Small Cap Growth Fund | 19 |
| | |
| Statements of Assets and Liabilities | 20 |
| | |
| Statements of Operations | 21 |
| | |
| Statements of Changes in Net Assets | 22 |
| | |
| Financial Highlights | |
| Needham Growth Fund | 23 |
| Needham Aggressive Growth Fund | 24 |
| Needham Small Cap Growth Fund | 25 |
| | |
| Notes to Financial Statements | 26 |
| | |
| Report of Independent Registered Public Accounting Firm | 31 |
| | |
| Information about Directors and Officers | 32 |
| | |
| Supplementary Information and Privacy Policy | 33 |
This report is authorized for distribution to prospective investors only when preceded or accompanied by a current prospectus. The prospectus contains more complete information, including investment objectives, risks, expenses and charges and should be read carefully before investing or sending any money. To obtain a prospectus or summary prospectus, please call 1-800-625-7071.
Portfolios of The Needham Funds, Inc., like all mutual funds:
The Needham Funds, Inc. are distributed by Needham & Company, LLC.
| Needham Funds | Annual Report 2015 |
| | 445 Park Avenue |
| New York, NY 10022 |
| (800) 625-7071 |
| www.needhamfunds.com |
February 2016
Dear Shareholders, Friends of Needham and Prospective Shareholders,
We are reporting results for the fourth quarter and the year ending December 31, 2015 for the Needham Growth Fund, Needham Aggressive Growth Fund, and Needham Small Cap Growth Fund. Our mission is to create wealth for long-term investors. 2015 was a disappointing year and 2016 is off to a disappointing start. We believe there are opportunities in small and mid-cap stocks, even in this difficult market.
Needham Funds’ Fourth Quarter
In the fourth quarter, the Needham Growth Fund (NEEGX) returned 4.39%, the Needham Aggressive Growth Fund (NEAGX) returned 4.73%, and the Needham Small Cap Growth Fund (NESGX) returned 7.63%. The Russell 2000 Total Return Index returned 3.59%, the S&P 500 Total Return Index returned 7.04%, and the NASDAQ Composite Index returned 8.76%.
For the year 2015, the Needham Growth Fund (NEEGX) declined 5.07%, the Needham Aggressive Growth Fund (NEAGX) declined 7.05%, and the Needham Small Cap Growth Fund (NESGX) declined 8.96%. The Russell 2000 Total Return Index declined 4.41%, the S&P 500 Total Return Index returned 1.38%, and the NASDAQ Composite Index returned 7.11%.
Thoughts on Investing in Small Caps in This Difficult Market
Through February 18, 2016, the Russell 2000 Total Return Index has declined 11.42% and the S&P 500 has declined 5.86%. On top of the difficult second half of 2015, these are trying times for investors, financial advisors and fund managers. However, as evidenced by the recent transaction (highlighted below), patient value investing can produce exemplary results.
On January 29, 2016, Berkshire Hathaway, Inc. (BRK.A/BRK.B) closed its acquisition of Precision Castparts Corporation (PCP) for $235 per share in cash. Jim Kloppenburg, the founding Portfolio Manager of NEAGX, bought Precision Cast-parts for $10 per share in November 2002, resulting in a 13-year, 23-bagger, and 27% return CAGR for the Fund. However, the PCP investment was not without its difficult days or years: PCP fell from a high of $154 in 2007 to a low of $47 in the depths of 2008. In the end, a sound business strategy and patient investing on behalf of the Fund produced quite a result.
With Berkshire Hathaway’s acquisition of NEAGX holding Precision Castparts Corporation, we had occasion to reread a number of the books written about Warren Buffett and Charlie Munger. We offer a few of their perspectives:
| 1) | Pay little attention to the macro. Times are never easy. As bad as things may seem today, imagine what it was like investing during World War II or the Cold War. In an August 6, 1979 essay for Forbes, Warren Buffett wrote, “The future is never clear; you pay a very high price in the stock market for a cheery consensus. Uncertainty actually is the friend of the buyer of long-term values.” |
And from Robert Hagstrom Jr.’s book, The Warren Buffett Way: Investment Strategies of the World’s Greatest Investor, “Just as people spend fruitless hours worrying about the stock market, so too do they worry needlessly about the economy. If you find yourself discussing and debating whether the economy is poised for growth or tilting toward a recession, whether interest rates are moving up or down, or whether there is inflation or disinflation, STOP.”1
(1) Robert Hagstrom, Jr., The Warren Buffett Way: Investment Strategies of the World’s Greatest Investor (1995), 227.
| | 2) | Focus on the business, not on the stock. “He (Warren Buffett) never forgot that underneath each stock and bond, no matter how arcane, there lay a tangible, ordinary business.2 ... Study prospects—and their competitors— in great detail. Look at raw data, not analysts’ summaries. Trust your own eyes.”3 |
| | | |
| | 3) | Invest in companies or funds that you understand. It’s important to define your circle of competence. If something sounds too complicated or good to be true, it probably is. If Warren Buffett can’t understand an investment opportunity, it goes into the “Too Hard” box on his desk. |
| | | |
| | 4) | Invest with a margin of safety. Once you understand the strategic and operational aspects of a business, it’s important to determine what you believe to be the intrinsic value of the business. What do you think is the company’s growth rate and future cash generation potential? What are the assets on the balance sheet worth? If the stock is too expensive, be patient. |
| | | |
| | 5) | Once you invest, be prepared to stay the course. Buffett says one should be prepared to withstand a 50% drop in an investment and if that happens, one should be prepared to hold for at least two years to let your investment thesis play out. “To the extent that he, or any investor, is not thinking about how and when he will get out, he will be more selective on the way in.”4 |
| | | |
| | 6) | Professors Martijn Cremers and Ankur Pareek found that High Active Share and Low Turnover is an effective strategy for outperforming broad-based indices over the long-term. In writing about Buffett’s view of a concentrated portfolio, Lowenstein wrote, “But when an investor had conviction about a stock, he or she should also show courage—and buy a ton of it.”5 |
| | | |
| | | In “The Education of a Value Investor,” Guy Spier highlighted the importance of low turnover, “Long-term compounding is an investor’s best friend, so why get in its way?”6 |
| | | |
| | | “...what makes sense in business also makes sense in stocks: An investor should ordinarily hold a small piece of an outstanding business with the same tenacity that an owner would exhibit if he owned all of that business.”7 |
| | | |
| | 7) | Make investment decisions away from the noise. Spier described the importance of one’s work environment and the dangers of listening to the pervasive investing noise. As humans, we are inclined to act and respond to stimulus. It takes discipline to ignore the noise and we all have a limited amount of discipline. Rather than try the difficult task of trying to be more disciplined, how about changing the work environment and minimizing the distractions? Get rid of the televisions, Bloomberg terminals and quote screens. |
| | | |
| | 8) | Know yourself and avoid leverage. The 2016 sell-off has caused fear in institutional and retail investors alike; this fear can cause one to sometimes act against well thought out plans and long-term interests. Investing will find and expose your weaknesses. |
| | | |
| | | “As investors, we all have shortcomings; as I came to see it, the key is to accept who we are, understand our differences and limitations and figure out ways to work around them.”8 |
| | | |
| | | At a Capital Cities/ABC management conference Warren Buffett said, “You can have somebody, whose aggregate performance is terrific, but if they have a weakness, maybe it’s alcohol, maybe it’s susceptibility to taking a little easy money, it’s the weak link that snaps you. And frequently in the financial markets, the weak link is borrowed money.”9 |
(2) Roger Lowenstein, Buffett, The Making of an American Capitalist, (1995), xii.
(3) Lowenstein, Buffett, The Making of an American Capitalist, 325.
(4) Lowenstein, Buffett, The Making of an American Capitalist, 272.
(5) Lowenstein, Buffett, The Making of an American Capitalist, 325.
(6) Guy Spier, The Education of a Value Investor, (2014), 48.
(7) Berkshire Hathaway, Annual Report, 1993.
(8) Spier, The Education of a Value Investor, 48.
(9) Lowenstein, Buffett, The Making of an American Capitalist, 273.
Annual Report 2015
| 9) | There’s no hurry to get rich. Disciplined investing, over time, in things you understand, will bring wealth. Spier and his friend, Mohnish Pabrai, won the auction for lunch with Warren Buffett in 2008. Spier quotes Buffett as having said, “If you’re even a slightly above-average investor who spends less than you earn, over a lifetime you can’t help but get very wealthy, if you’re patient.” |
2015 was Dominated by Weak Commodities, the Strong U.S. Dollar, Slowing Growth in China and “FANG” Stocks10
In late January 2015, the European Central Bank announced a massive quantitative easing program that will run through September 2016. Consequently, February 2015 was a very strong month as the Russell 2000 Total Return Index returned 5.9%, the S&P 500 TR returned 5.8%, and the Needham Funds outperformed. In March, the U.S. Federal Reserve dropped the word “patient” from its outlook for interest rates, but made it clear it was in no hurry to normalize rates.
The Funds and the markets declined at the beginning of the second quarter, owing to weak economic results. However, the Funds and markets closed the half year in positive territory.
Then came the third quarter. The Russell 2000 and the Needham Funds were down each month of the quarter. Brent oil fell nearly 24% from $63.59 to $48.37, and companies doing business in the energy sector were hurt badly. China has been a major consumer of commodities to fuel its infrastructure construction, but it hasslowed. Chinese officials made stunning policy moves in July to attempt to counteract the falling stock market. The Shanghai Stock Exchange had been up over 60% in 2015, but then fell over 30% from mid-June into July. China halted trading in many stocks, forbid large holders from selling, and the People’s Bank of China injected over $200 billion to prop up equity prices. On August 7, China announced a surprise devaluation of the Yuan, which could be revalued even lower in 2016. These are extraordinary measures for investors in Chinese securities to consider. We continue to believe that U.S. equities are the most viable asset class.
August brought the ETF “flash crash.” The S&P 500 was down 6% at the open on Monday, August 24. Many stocks had delayed openings, which made it difficult for the ETF market makers to value ETFs. While ETFs provide intraday liquidity, they are dependent on orderly markets, and “quant” trading systems can have an outsized short-term impact. Again, we prefer plain old U.S. equities and mutual funds.
Economic weakness continued through September and the markets remained confused about the Federal Reserve’s message regarding a rate hike. Right until the Fed meeting of September 17, it seemed as if the Fed would raise interest rates for the first time in nine years—to all of 0.25%. Alas, it took until the December meeting for the Fed to raise rates.
The Funds and markets were positive in October and November. December brought a restart of the weakness, which continued through February 18 with the S&P 500 TR declining 5.86% and the Russell 2000 TR declining 11.42% in 2016. The S&P 500 and the NASDAQ Composite indices were dominated by strong performance of the FANG large-cap stocks: Facebook (FB), Amazon (AMZN), Netflix (NFLX) and Alphabet (f/k/a Google) (GOOG). The top 10 largest stocks by market cap in the S&P 500 Index gained nearly 23%, while the other 490 dropped on average 3.5%. Since summer 2015, U.S. stocks have declined, with most stocks down 20% or more and many have fallen 30% or more.
2016 Outlook – Still About Commodities, China and the U.S. Dollar
Brent oil remains at low levels. In mid-January, it traded as low as $26 per barrel. In January, the average price of regular gas in the United States fell to $1.80 from $2.00 per gallon. Consumers will benefit. In January, the Shenzen market fell another 27%. Kenneth Rogoff’s February 2 article, The Great Escape from China, argues that weak commodities and a declining Yuan could lead to continued strength for the dollar, which could lead to additional pressure on our exporters. We believe that the U.S. economy will grow 1.5-2%, which is below the “new normal” of 2-2.5%, which has prevailed for the past seven years. We do not foresee the Federal Reserve raising rates again in 2016. Many international markets have negative interest rates. Bonds with negative interest rates would seem to be full of risk, should monetary affairs normalize.
Acceleration of growth seems unlikely unless Washington shifts focus to a fiscal policy designed to promote business investment and capital formation. Imagine if we had an internationally competitive corporate tax regime, lower regulatory and policy barriers to private sector hiring, lower marginal tax rates, and a lower rate of increase of government spending. Unfortunately, this Presidential Primary election season has been devoid of any discussion of positive fiscal policy. Hopefully, that day will return.
(10) “FANG” refers to Facebook, Inc., Amazon.com, Inc., Netflix, Inc. and Alphabet, Inc. (f/k/a Google, Inc.)
Needham Funds
Big Opportunity in Small Cap Stocks
It’s easy to be concerned about the market and macroeconomic fears. However, when we think of the Needham Funds as having partial ownership in businesses with great new products and services, it’s easier to be excited. Our job is to find companies which we believe have misunderstood growth prospects. We believe our portfolios are full of such companies and many are on sale, having fallen 20-30% since last summer.
Dividing the Russell 3000 stocks by market cap shows that the smaller the market, the more severe the sell-off. The largest companies, with market cap over $25 billion, declined 17.1% from July 1, 2015 thru January 21, 2016, while those under $200 million declined 62%. Those between $200 million and $500 million declined 33.8%.
Russell 3000 Current Valuation & Performance by Market Capitalization
| | 1/21/2016 | 2015 Performance |
| Market Capitalization | EV/Sales | MTD | Q4 | Q3 & Q4 | Year |
| >$25B | 4.4X | -8.4% | -5.6% | -8.4% | 7.9% |
| $1B - $25B | 3.9X | -11.3% | -10.6% | -14.4% | 2.6% |
| $500MM - $1B | 3.0X | -14.2% | -13.3% | -20.6% | -2.4% |
| $200MM - $500MM | 2.7X | -14.5% | -14.6% | -22.6% | -7.3% |
| <$200MM | 2.4X | -24.0% | -35.0% | -50.0% | -36.0% |
(Source: Emancipation Capital)
We see a big opportunity in our small cap equity universe. All three Funds also have substantial small-cap (under $2 billion market cap) and micro-cap (market caps under $250 million) exposure.
2015 and Fourth Quarter Contributors Across All Three Funds:
Photronics, Inc. (PLAB) returned 37.4% in the fourth quarter and 49.8% in 2015. Photronics makes photomasks, which are used to manufacture semiconductors and flat panel displays. Photronics reported a strong fourth quarter ending October 30, with growth from high-end integrated circuits and flat-panel displays. The company significantly exceeded earnings expectations for the year, with actual gross margins of 27% versus 24% estimated at the beginning of FY15.
FormFactor, Inc. (FORM) returned 32.7% in the fourth quarter and 4.7% in 2015. The company makes wafer probe cards used to test a manufactured semiconductor wafer with system-on-chip and memory designs. In 2015, FormFactor introduced a new NAND flash memory product. Additionally, the latest system-on-chip logic designs use copper pillar packaging, which is best tested with FormFactor’s MEMs probe cards. FormFactor grew revenues by 5% and EPS by 16% in 2015. On February 4, 2016, FormFactor announced the acquisition of Cascade Microtech (CSCD) for $350 million cash.
Detractors Across the Needham Funds
Super Micro Computer, Inc. (SMCI) makes servers and storage systems used in cloud data centers by leading Internet companies. We believe Super Micro has an opportunity to gain market share versus Lenovo Group, Ltd. (992-HK) and Hewlett-Packard (HPQ). Lenovo purchased IBM Corporation’s (IBM) server business in 2014. Super Micro’s customers include high-growth, next-generation storage companies such as Nimble Storage, Inc. (NMBL) and Nutanix, Inc., and IBM’s SoftLayer subsidiary.
Super Micro declined 10.1% in the fourth quarter and 29.7% for the year, as investors worried about slowing orders from data center customers and the company’s December quarter. In January 2016, Super Micro reported a very strong fourth quarter, allaying investors’ concerns over the quarter. Super Micro had 26% revenue growth and 12% EPS growth in 2015. However, as of December 31, 2015, Super Micro was valued at just 10x earnings, ex-cash.
KVH Industries, Inc. (KVHI) declined 5.8% in the fourth quarter and 25.5% for the year. On its upcoming fourth quarter earnings announcement, we believe KVH will report progress in 2015, just not as much as first expected. KVH is estimated to grow revenue by 7% and EPS by 11%. Most importantly, we believe KVH is positioned for further growth in 2016.
In our view, KVH is like the combined Netflix, Inc. (NFLX) and Comcast Corporation (CMCSA) of the commercial maritime industry. The company supplies satellite communications equipment, voice and data services and entertainment, news and training content to ships at sea through their IP-Multicast technology. KVH also supplies fiber optic gyroscopes for self-driving cars and military vehicles, including vehicles in the Middle East.
Annual Report 2015
KVH has not traded below $10 per share since June 2012. At $8.67 per share on February 18, KVHI is valued at just 0.8x EV/estimated 2015 revenue and 7x EV/estimated 2015 EBITDA, which gives no credit for the investments made to position the company for faster growth.
Needham Growth Fund
The Needham Growth Fund returned 4.39% in the fourth quarter, but declined 5.07% for the year ending December 31, 2015.
Thermo Fisher Scientific (TMO), the Fund’s second-largest holding at 8.4% of net assets, was the top contributor for the quarter, returning 16.1%, and 13.8% for the year. The Fund bought Thermo Fisher in 2000 and 2002 and as of December 31, 2015, it was an 8-bagger. In October, Thermo Fisher reported 4% organic revenue growth for the fourth quarter, raised guidance for the year and announced a $1 billion share buyback. In January 2016, Thermo Fisher announced an agreement to purchase Affymetrix, Inc. (AFFX) for $1.3 billion. Affymetrix’s microarray products fit with Thermo’s genetic analysis business. The planned 15% of revenue cost synergies make for a high-single-digit return-on-investment capital for the acquisition, which is expected to close in the second quarter of 2016. Other top contributors included FormFactor, Becton Dickinson & Co. (BDX), and Photronics.
Akamai Technologies, Inc. (AKAM) was the leading detractor for the quarter, down 23.8%. Guidance for the fourth quarter fell below expectations; we believe this shortcoming was due to Apple (AAPL) utilizing less of Akamai’s services to deliver the iOS 9 iPhone upgrade and the delayed launch of Apple’s over-the-top TV bundle. Akamai benefits from the long-term prospects for growth in over-the-top video and cloud cyber security. Super Micro Computer, Inc. was the largest detractor for the year, down 29.7%.
During the quarter, we added to positions in Akamai and Super Micro Computer. We exited our long-term holding in II-VI, Inc. We reduced positions in Photronics and FormFactor on the market strength.
On December 31, 2015, the Fund had an Active Share of 103.0% compared to the S&P 500, and trailing twelve-month turnover of 13%. The top ten positions were 54% of net assets.
On December 31, 2015, 50% of Needham Growth Fund’s net assets were invested in companies with market capitalizations of over $8 billion, 14% between $2-8 billion, and 36% under $2 billion. The Fund had a 4% short position and 6% in cash, up from 5% in the September quarter.
Needham Aggressive Growth Fund
The Needham Aggressive Growth Fund returned 4.73% in the fourth quarter, but declined 7.05% for the year ending December 31, 2015.
GSE Systems, Inc. (GVP) was the top contributor for the year, returning 50.9%, and the second leading contributor for the fourth quarter. GSE, featured in our third quarter letter, supplies training simulators for the nuclear and process manufacturing industries. As of December 31, 2015, it had a $44 million market cap with $13 million of net cash, $43 million of revenue for the first three quarters of 2015 and its first quarter with positive adjusted EBITDA since 2013. During the quarter, we saw insider buying from GSE’s new management team.
Oil-Dri Corp. (ODC), another microcap, was the third-leading contributor for the quarter returning 62.0%. Oil-Dri is creating the category for lightweight cat litter and is the leading supplier. Oil-Dri owns the mines and clay reserves necessary to make lightweight cat litter.
LeMaitre Vascular, Inc. (LMAT), yet another microcap, was a leading contributor for the year as it returned 128.8%. LeMaitre is a seven-year holding and a five-bagger for the Fund. LeMaitre makes devices for vascular surgeons and exceeded expectations in 2015.
FormFactor was the top contributor for the fourth quarter. For the quarter, Akamai and Super Micro were the leading detractors.
PDF Solutions, Inc. declined 27.1% and was the leading detractor for 2015. PDF gets paid a gainshare royalty when semiconductor companies such as Qualcomm and AMD manufacture parts at Samsung, Global Foundries or other fabs that utilize PDF’s technology. PDF’s stock price has fallen to $10.35 per share as of February 18, 2016. It has $4 per share in cash and is estimated to earn $0.80 per share in 2016. We believe the company’s big data analytics SaaS revenue could
Needham Funds
grow 100% annually and reach 20% of revenue by the fourth quarter of 2016. We also believe the company’s new electrical design for inspection initiative has the potential to generate royalties in 2017 and a longer-term opportunity to double royalty revenue.
The largest additions to the portfolio in the fourth quarter were to Akamai, CRA International, Inc. (CRAI), GSE Systems and Norsat International (NSAT). We sold positions, including Bruker Corporation (BRKR), Brooks Automation, Inc. (BRKS), and Electro-Scientific Industries, Inc. (ESIO).
On December 31, 2015, the Fund had an Active Share of 111.7% compared to the Russell 2000 and trailing twelve-month turnover of 15%. The top ten positions were 49% of net assets.
The Fund exited the fourth quarter with 27% of net assets invested in companies with over an $8 billion market cap, 7% between $2 and 8 billion, 4% between $250 million and $2 billion and 16% under $250 million. The Fund had a 7% short position and was again fully invested.
Needham Small Cap Growth Fund
The Needham Small Cap Growth Fund returned 7.63% in the fourth quarter, but declined 8.96% for the year ending December 31, 2015.
We are pleased that many of our core holdings recovered in the fourth quarter after suffering a significant downturn in the third quarter. We found liquidity in our holdings during the quarter and took advantage of the opportunity to lighten our investments and raise cash. Shorting was also a contributor to performance.
After a difficult second half in 2015 for semiconductor capital equipment, we are positive on the industry’s trends and outlook later in 2016. The stocks did not see their seasonal December rally, which provides better valuation entry points as the industry begins to see an uptick in orders in 2016. NESGX holding Ultra Clean Holdings (UCTT) engages in the development, manufacture and supply of critical subsystems for the semiconductor capital equipment, flat panel, medical and research industries. Ultra Clean was a top ten position for NESGX at December 31, 2015, and we are excited about the risk/reward after a tough 2015.
TTM Technologies (TTMI), another top-ten holding at December 31, 2015, is another stock we are excited about, as we expect the company to begin to realize greater synergies and return on invested capital following the integration of its acquisition of Viasystems Group last year. The acquisition expanded and diversified its customer base and end markets and should begin to leverage its greater market share as a combined company. The stock has traded down based upon its exposure to the Apple supply chain, although this only represents 17% of its sales. The company should be able to generate substantial cash flow that will help it to deleverage from the acquisition and thereby drive higher return on equity. Again, we believe TTMI exhibits a strong risk/reward after a tough 2015.
Although the macro and geopolitical environment is a headwind to global growth, we believe this is the time for stock pickers. Other than the U.S. Federal Reserve, most central banks around the global are providing increased quantitative easing, which has caused a stronger U.S. Dollar. In general, small cap stocks should not be as impacted by a stronger Dollar as will larger cap companies that are more exposed to international customers and markets. However, the collapse of the high yield market has certainly affected the appetite for small cap stocks, which also points to the importance of stock picking rather than blanket index buying. We remain concentrated in our top holdings, as we feel most comfortable in evaluating their growth prospects and downside risks. Our increased cash position should help in a more volatile market as well as allow us to make investments at better valuations.
Closing
We believe the U.S. is again facing sub-par economic growth, but it remains the best place in the world to be investing and working. Asia and Europe are facing difficult economic times. We believe there’s opportunity in small and mid-cap stocks in this difficult market. We are particularly excited that this market may give us a chance to add to positions already in the portfolio.
To reiterate perspectives from Warren Buffett and Charlie Munger:
| 1) | Pay little attention to the macro. |
| 2) | Focus on the business, not on the stock. |
| 3) | Invest in companies or funds that you understand. |
Annual Report 2015
| 4) | Invest with a margin of safety. |
| 5) | Once you invest, be prepared to stay the course. |
| 6) | Professors Cremers and Pareek found that High Active Share and Low Turnover is an effective strategy to outperform the averages over the long-term. |
| 7) | Make investment decisions away from the noise. |
| 8) | Know yourself and avoid leverage. |
| 9) | There’s no hurry to get rich. |
To reiterate our overall thesis: monetary policy remains accommodative. Most importantly, we see a revolution happening in technology that has created and continues to create investment opportunities.
We see opportunity in our strategy of investing in companies that we know well and that we believe are positioned with secular growth drivers. We believe 2016 will bring a modest rebound for equities. As it already has this year, we believe the markets will experience more volatility and that our ability to short could dampen the possible volatility.
We welcome our new investors and thank all of our investors for their continued support. If you have any questions, thoughts or concerns, please contact us at (800) 625-7071 or send us an email at cretzler@needhamco.com or jbarr@needhamco.com. For information about the funds, please visit our website at www.needhamfunds.com.
| Sincerely, | |
| | |
 |  |
| | |
| Chris Retzler | John O. Barr |
| Portfolio Manager | Portfolio Manager |
Needham Funds
| NEEDHAM GROWTH FUND | TICKER: NEEGX |
Comparative Performance Statistics as of December 31, 2015
| | | | | | | | | | | | | Since | | Gross Expense |
| | | 6 Months(7) | | 1 Year | | 3 Years(8) | | 5 Years(8) | | 10 Years(8) | | Inception(8)(12) | | Ratio(14) |
| Needham Growth Fund(1) | | (8.28)% | | (5.07)% | | 11.69%(9) | | 6.96%(10) | | 6.95%(11) | | 12.96%(13) | | 1.84% |
| S&P 500 Index(2)(3) | | 0.15% | | 1.38% | | 15.13% | | 12.57% | | 7.31% | | 8.19% | | |
| NASDAQ Composite Index(2)(4) | | 1.05% | | 7.11% | | 19.91% | | 15.02% | | 9.79% | | 9.00% | | |
| S&P 400 MidCap Index(2)(5) | | (6.11)% | | (2.18)% | | 12.76% | | 10.68% | | 8.18% | | 11.22% | | |
| Russell 2000 Index(2)(6) | | (8.75)% | | (4.41)% | | 11.65% | | 9.19% | | 6.80% | | 8.03% | | |
Past performance does not guarantee future results. The performance data quoted represents past performance, and current returns may be lower or higher. The investment return and net asset value will fluctuate so that an investor’s shares, when redeemed, may be worth more or less than the original cost. To obtain performance information current to the most recent month-end, please call 1-800-625-7071. The returns shown in the above table and accompanying footnotes are net of expenses. The table above does not reflect the deduction of taxes that a shareholder would have paid on Fund distributions or on the redemption of Fund shares.
| 1. | Investment results calculated after reinvestment of dividends. |
| 2. | It is not possible to invest directly in an index. The performance of the index does not include the deduction of expenses associated with a mutual fund, such as investment management fees. |
| 3. | The S&P 500 Index is a broad unmanaged measure of the U.S. stock market. |
| 4. | The NASDAQ Composite Index is a broad-based capitalization-weighted index of all NASDAQ Global Market and Small Cap stocks. |
| 5. | The S&P 400 MidCap Index is a broad unmanaged measure of the U.S. stock market. |
| 6. | The Russell 2000 Index is a broad unmanaged index composed of the smallest 2,000 companies in the Russell 3000 Index. |
| 8. | Compound annual growth rate (annualized return). Assumes all dividends were reinvested in shares of the Fund. |
| 9. | Cumulative return for the three year period was 39.33%, assuming all dividends were reinvested in shares of the Fund. |
| 10. | Cumulative return for the five year period was 39.97%, assuming all dividends were reinvested in shares of the Fund. |
| 11. | Cumulative return for the ten year period was 95.87%, assuming all dividends were reinvested in shares of the Fund. |
| 12. | The inception date of the Fund was 1/1/96. |
| 13. | Cumulative return since inception was 1,044.46%, assuming all dividends were reinvested in shares of the Fund. |
| 14. | Gross expense ratio is from the Fund’s prospectus dated May 1, 2015. Additional information pertaining to the Fund’s expense ratios as of December 31, 2015 can be found in the financial highlights. Since January 1, 2009, the investment performance reflects contractually agreed upon fee waivers which expire at the close of business on April 30, 2016. Without these fee waivers, the performance would have been lower. Excluding the indirect costs of investing in acquired funds, total fund operating expenses would be 1.84%. |
Top Ten Holdings*
(as a % of total investments, as of December 31, 2015)
| | | | | % of Total |
| | | Security | | | | | Investments† |
| 1 Express Scripts Holding Co. | | ESRX | | 9.54% |
| 2 Thermo Fisher Scientific, Inc. | | TMO | | 8.94% |
| 3 Gilead Sciences, Inc. | | GILD | | 8.03% |
| 4 Becton Dickinson and Co. | | BDX | | 5.37% |
| 5 CarMax, Inc. | | KMX | | 5.10% |
| 6 ViaSat, Inc. | | VSAT | | 4.61% |
| 7 FormFactor, Inc. | | FORM | | 4.54% |
| 8 Super Micro Computer, Inc. | | SMCI | | 4.27% |
| 9 KVH Industries, Inc. | | KVHI | | 4.06% |
| 10 Jabil Circuit, Inc. | | JBL | | 2.93% |
Top Ten Holdings = 57.39% of Total Investments†
* Current portfolio holdings may not be indicative of future portfolio holdings.
† Percentage of total investments less cash.
Sector Weightings*
(as a % of total investments, as of December 31, 2015)
| | | Sector | | | Long(1) | | (Short) (1) | | Total(1)(2) |
| Consumer Discretionary | | 9.4% | | — | | 9.4% |
| Energy | | 2.7% | | — | | 2.7% |
| Financials | | 3.2% | | (0.7)% | | 2.5% |
| Health Care | | 36.7% | | — | | 36.7% |
| Industrials | | 3.2% | | — | | 3.2% |
| Information Technology | | 42.9% | | (3.4)% | | 39.5% |
| Cash | | 6.0% | | — | | 6.0% |
* Current portfolio holdings may not be indicative of future portfolio holdings.
| (1) | Percentage of total investments includes all stocks, plus cash minus all short positions. |
| (2) | Total represents the difference between the long exposure and the short exposure, which produces the net exposure. |
Comparison of Change in Value of a $10,000 Investment

Past performance does not guarantee future results. The performance data quoted represents past performance, and current returns may be lower or higher. The investment return and net asset value will fluctuate so that an investor’s shares, when redeemed, may be worth more or less than the original cost. To obtain performance information current to the most recent month-end, please call 1-800-625-7071. The graph above does not reflect the deduction of taxes that a shareholder would have paid on Fund distributions or on the redemption of Fund shares. Since inception, the Fund’s adviser has absorbed certain expenses of the Fund, without which returns would have been lower.
The Global Industry Classification Standard (GICS®) was developed by and/or is the exclusive property of MSCI, Inc. and Standard & Poor Financial Services LLC (“S&P”). GICS is a service mark of MSCI and S&P and has been licensed for use by U.S. Bancorp Fund Services, LLC.
Annual Report 2015
| NEEDHAM AGGRESSIVE GROWTH FUND | TICKER: NEAGX |
Comparative Performance Statistics as of December 31, 2015
| | | | | | | | | | | | | Since | | Gross Expense |
| | | 6 Months(6) | | 1 Year | | 3 Years(7) | | 5 Years(7) | | 10 Years(7) | | Inception(7)(11) | | Ratio(13) |
| Needham Aggressive Growth Fund(1) | | -9.58% | | -7.05% | | 10.71%(8) | | 6.04%(9) | | 8.70%(10) | | 8.74% (12) | | 2.09% |
| S&P 500 Index(2)(3) | | 0.15% | | 1.38% | | 15.13% | | 12.57% | | 7.31% | | 6.31% | | |
| NASDAQ Composite Index(2)(4) | | 1.05% | | 7.11% | | 19.91% | | 15.02% | | 9.79% | | 8.49% | | |
| Russell 2000 Index(2)(5) | | -8.75% | | -4.41% | | 11.65% | | 9.19% | | 6.80% | | 7.82% | | |
Past performance does not guarantee future results. The performance data quoted represents past performance, and current returns may be lower or higher. The investment return and net asset value will fluctuate so that an investor’s shares, when redeemed, may be worth more or less than the original cost. To obtain performance information current to the most recent month-end, please call 1-800-625-7071. The returns shown in the above table and accompanying footnotes are net of expenses. The table above does not reflect the deduction of taxes that a shareholder would have paid on Fund distributions or on the redemption of Fund shares.
| 1. | Investment results calculated after reinvestment of dividends. |
| 2. | It is not possible to invest directly in an index. The performance of the index does not include the deduction of expenses associated with a mutual fund, such as investment management fees. |
| 3. | The S&P 500 Index is a broad unmanaged measure of the U.S. stock market. |
| 4. | The NASDAQ Composite Index is a broad-based capitalization-weighted index of all NASDAQ Global Market and Small Cap stocks. |
| 5. | The Russell 2000 Index is a broad unmanaged index composed of the smallest 2,000 companies in the Russell 3000 Index. |
| 7. | Compound annual growth rate (annualized return). Assumes all dividends were reinvested in shares of the Fund. |
| 8. | Cumulative return for the three year period was 35.68%, assuming all dividends were reinvested in shares of the Fund. |
| 9. | Cumulative return for the five year period was 34.09%, assuming all dividends were reinvested in shares of the Fund. |
| 10. | Cumulative return for the ten year period was 130.26%, assuming all dividends were reinvested in shares of the Fund. |
| 11. | The inception date of the Fund was 9/4/2001. |
| 12. | Cumulative return since inception was 232.24% assuming all dividends were reinvested in shares of the Fund. |
| 13. | Gross expense ratio is from the Fund’s prospectus dated May 1, 2015. Additional information pertaining to the Fund’s expense ratios as of December 31, 2015 can be found in the financial highlights. Since January 1, 2009, the investment performance reflects contractually agreed upon fee waivers which expire at the close of business on April 30, 2016. Without these fee waivers, the performance would have been lower. Excluding the indirect costs of investing in acquired funds, total fund operating expenses would be 2.09%. |
Top Ten Holdings*
(as a % of total investments, as of December 31, 2015)
| | | | | | | | % of Total |
| | | Security | | | | | Investments† |
| 1 Akamai Technologies, Inc. | | AKAM | | 6.92% |
| 2 FormFactor, Inc. | | FORM | | 6.03% |
| 3 Entegris, Inc. | | ENTG | | 5.23% |
| 4 PDF Solutions, Inc. | | PDFS | | 5.11% |
| 5 KVH Industries, Inc. | | KVHI | | 5.06% |
| 6 Apple, Inc. | | AAPL | | 4.61% |
| 7 Gilead Sciences, Inc. | | GILD | | 4.58% |
| 8 Reis, Inc. | | REIS | | 4.44% |
| 9 Super Micro Computer, Inc. | | SMCI | | 4.13% |
| 10 GSE Systems, Inc. | | GVP | | 3.14% |
Top Ten Holdings = 49.25% of Total Investments†
* Current portfolio holdings may not be indicative of future portfolio holdings.
† Percentage of total investments less cash.
Sector Weightings*
(as a % of total investments, as of December 31, 2015)
| | | Sector | | | Long(1) | | (Short) (1) | | Total(1)(2) |
| Consumer Discretionary | | 5.1% | | — | | 5.1% |
| Consumer Staples | | 2.7% | | — | | 2.7% |
| Energy | | 1.1% | | — | | 1.1% |
| Financials | | 5.2% | | (2.3)% | | 2.9% |
| Health Care | | 10.8% | | — | | 10.8% |
| Industrials | | 6.9% | | — | | 6.9% |
| Information Technology | | 74.8% | | (4.4)% | | 70.4% |
| Cash | | 0.1% | | — | | 0.1% |
* Current portfolio holdings may not be indicative of future portfolio holdings.
(1) Percentage of total investments includes all stocks, plus cash minus all short positions.
(2) Total represents the difference between the long exposure and the short exposure, which produces the net exposure.
Comparison of Change in Value of a $10,000 Investment
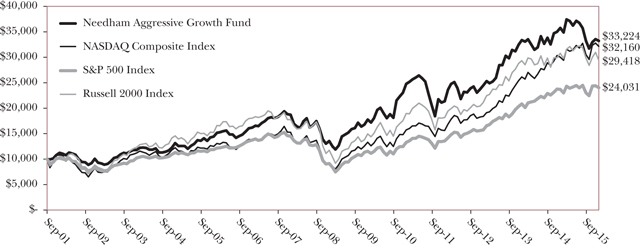
Past performance does not guarantee future results. The performance data quoted represents past performance, and current returns may be lower or higher. The investment return and net asset value will fluctuate so that an investor’s shares, when redeemed, may be worth more or less than the original cost. To obtain performance information current to the most recent month-end, please call 1-800-625-7071. The graph above does not reflect the deduction of taxes that a shareholder would have paid on Fund distributions or on the redemption of Fund shares. Since inception, the Fund’s adviser has absorbed certain expenses of the Fund, without which returns would have been lower.
The Global Industry Classification Standard (GICS®) was developed by and/or is the exclusive property of MSCI, Inc. and Standard & Poor Financial Services LLC (“S&P”). GICS is a service mark of MSCI and S&P and has been licensed for use by U.S. Bancorp Fund Services, LLC.
Needham Funds
| NEEDHAM SMALL CAP GROWTH FUND | TICKER: NESGX |
Comparative Performance Statistics as of December 31, 2015
| | | | | | | | | | | | | Since | | Gross Expense |
| | | 6 Months(6) | | 1 Year | | 3 Years(7) | | 5 Years(7) | | 10 Years(7) | | Inception(7)(11) | | Ratio(13) |
| Needham Small Cap Growth Fund(1) | | -11.86% | | -8.96% | | 5.48%(8) | | 1.34%(9) | | 5.34%(10) | | 8.89% (12) | | 2.01% |
| S&P 500 Index(2)(3) | | 0.15% | | 1.38% | | 15.13% | | 12.57% | | 7.31% | | 6.91% | | |
| NASDAQ Composite Index(2)(4) | | 1.05% | | 7.11% | | 19.91% | | 15.02% | | 9.79% | | 9.59% | | |
| Russell 2000 Index(2)(5) | | -8.75% | | -4.41% | | 11.65% | | 9.19% | | 6.80% | | 7.73% | | |
Past performance does not guarantee future results. The performance data quoted represents past performance, and current returns may be lower or higher. The investment return and net asset value will fluctuate so that an investor’s shares, when redeemed, may be worth more or less than the original cost. To obtain performance information current to the most recent month-end, please call 1-800-625-7071. The returns shown in the above table and accompanying footnotes are net of expenses. The table above does not reflect the deduction of taxes that a shareholder would have paid on Fund distributions or on the redemption of Fund shares.
| 1. | Investment results calculated after reinvestment of dividends. |
| 2. | It is not possible to invest directly in an index. The performance of the index does not include the deduction of expenses associated with a mutual fund, such as investment management fees. |
| 3. | The S&P 500 Index is a broad unmanaged measure of the U.S. stock market. |
| 4. | The NASDAQ Composite Index is a broad-based capitalization-weighted index of all NASDAQ Global Market and Small Cap stocks. |
| 5. | The Russell 2000 Index is a broad unmanaged index composed of the smallest 2,000 companies in the Russell 3000 Index. |
| 7. | Compound annual growth rate (annualized return). Assumes all dividends were reinvested in shares of the Fund. |
| 8. | Cumulative return for the three year period was 17.37%, assuming all dividends were reinvested in shares of the Fund. |
| 9. | Cumulative return for the five year period was 6.88%, assuming all dividends were reinvested in shares of the Fund. |
| 10. | Cumulative return for the ten year period was 68.20%, assuming all dividends were reinvested in shares of the Fund. |
| 11. | The inception date of the Fund was 5/22/02. |
| 12. | Cumulative return since inception was 218.83% assuming all dividends were reinvested in shares of the Fund. |
| 13. | Gross expense ratio is from the Fund’s prospectus dated May 1, 2015. Additional information pertaining to the Fund’s expense ratios as of December 31, 2015 can be found in the financial highlights. Since January 1, 2009, the investment performance reflects contractually agreed upon fee waivers which expire at the close of business on April 30, 2016. Without these fee waivers, the performance would have been lower. Excluding the indirect costs of investing in acquired funds, total fund operating expenses would be 2.01%. |
Top Ten Holdings*
(as a % of total investments, as of December 31, 2015)
| | | | | | % of Total |
| | | Security | | | | | Investments† |
| 1 Newport Corp. | | NEWP | | 7.65% |
| 2 Silicon Graphics International Corp. | | SGI | | 7.54% |
| 3 KVH Industries, Inc. | | KVHI | | 6.88% |
| 4 Ultra Clean Holdings, Inc. | | UCTT | | 6.81% |
| 5 Super Micro Computer, Inc. | | SMCI | | 6.39% |
| 6 FormFactor, Inc. | | FORM | | 6.10% |
| 7 TTM Technologies, Inc. | | TTMI | | 5.94% |
| 8 Reis, Inc. | | REIS | | 5.88% |
| 9 Frequency Electronics, Inc. | | FEIM | | 5.81% |
| 10 Air Lease Corp. | | AL | | 5.67% |
Top Ten Holdings = 64.67% of Total Investments†
* Current portfolio holdings may not be indicative of future portfolio holdings.
† Percentage of total investments less cash.
Sector Weightings*
(as a % of total investments, as of December 31, 2015)
| | | Sector | | | Long(1) | | (Short) (1) | | Total(1)(2) |
| Consumer Staples | | 2.5% | | — | | 2.5% |
| Energy | | 1.1% | | — | | 1.1% |
| Financials | | 0.4% | | — | | 0.4% |
| Health Care | | 1.4% | | — | | 1.4% |
| Industrials | | 5.4% | | — | | 5.4% |
| Information Technology | | 73.0% | | (3.6)% | | 69.4% |
| Cash | | 19.8% | | — | | 19.8% |
| * | Current portfolio holdings may not be indicative of future portfolio holdings. |
| (1) | Percentage of total investments includes all stocks, plus cash minus all short positions. |
| (2) | Total represents the difference between the long exposure and the short exposure, which produces the net exposure. |
Comparison of Change in Value of a $10,000 Investment
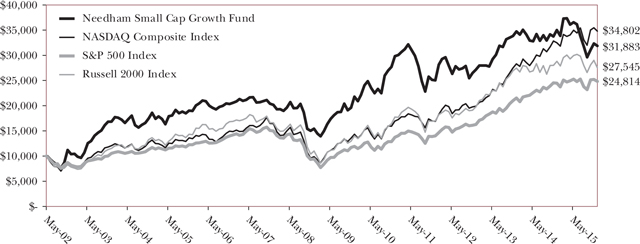
Past performance does not guarantee future results. The performance data quoted represents past performance, and current returns may be lower or higher. The investment return and net asset value will fluctuate so that an investor’s shares, when redeemed, may be worth more or less than the original cost. To obtain performance information current to the most recent month-end, please call 1-800-625-7071. The graph above does not reflect the deduction of taxes that a shareholder would have paid on Fund distributions or on the redemption of Fund shares. Since inception, the Fund’s adviser has absorbed certain expenses of the Fund, without which returns would have been lower.
The Global Industry Classification Standard (GICS®) was developed by and/or is the exclusive property of MSCI, Inc. and Standard & Poor Financial Services LLC (“S&P”). GICS is a service mark of MSCI and S&P and has been licensed for use by U.S. Bancorp Fund Services, LLC.
Annual Report
Disclosure of Fund Expenses (Unaudited)
The following expense table is shown so that you can understand the impact of fees on your investment. All mutual funds have operating expenses. As a shareholder of a Portfolio, you incur transactional costs, including redemption fees and ongoing costs, which include costs for portfolio management, administrative services, and shareholder reports, among others. A Portfolio’s expenses are expressed as a percentage of its average net assets. This figure is known as the expense ratio. The following examples are intended to help you understand the ongoing costs (in dollars) of investing in each Portfolio and to compare these costs with those of other mutual funds. The examples are based on an investment of $1,000 made at the beginning of the period shown and held for the entire period. The expense example table below illustrates your fund’s cost in two ways:
| • | Actual Expenses. This section helps you to estimate the actual expenses after fee waivers that you paid over the period. The “Ending Account Value” shown is derived from the Portfolio’s actual return, and “Expenses Paid During Period” shows the dollar amount that would have been paid by an investor who started with $1,000 in the Portfolio. You may use the information here, together with the amount you invested, to estimate the expenses that you paid over the period. To do so, simply divide your account value by $1,000 (for example, an $8,600 account value divided by $1,000 = 8.6), then multiply the result by the number given for your Portfolio under the heading entitled “Expenses Paid During Period”. |
| • | Hypothetical Expenses on a 5% Return. This section is intended to help you compare your Portfolio’s costs with those of other mutual funds. It assumes that the Portfolio had a return of 5% before expenses during the period shown, but that the expense ratio is unchanged. In this case, because the return used is not the Portfolio’s actual return, the results do not apply to your investment. The example is useful in making comparisons because the Securities and Exchange Commission requires all mutual funds to calculate expenses based on a 5% return. You can assess your Portfolio’s cost by comparing this hypothetical example with the hypothetical examples that appear in shareholders reports of other funds. |
Please note that the expenses shown in the table are meant to highlight your ongoing costs only and do not reflect any transactional costs, such as redemption fees. Therefore, the table is useful in comparing ongoing costs only, and will not help you determine the relative total costs of owning different funds. In addition, if these transactional costs were included, your costs would have been higher.
For the Period July 1, 2015 to December 31, 2015
Expense Example Table
| | | Beginning | | Ending | | Expenses Paid | | Expense Ratio | |
| | | Account Value | | Account Value | | During Period* | | During Period* | |
| | | 7/1/15 | | 12/31/15 | | 7/1/15 - 12/31/15 | | 7/1/15 - 12/31/15 | |
| Needham Growth Fund | | | | | | | | | | | | | |
| Actual Expenses | | $ | 1,000.00 | | | $ | 1,035.00 | | | $ | 10.87 | | | | 2.25 | % | |
| Hypothetical Example for Comparison Purposes (5% return before expenses) | | $ | 1,000.00 | | | $ | 1,015.57 | | | $ | 11.42 | | | | 2.25 | % | |
| | | | | | | | | | | | | | | | | | |
| Needham Aggressive Growth Fund | | | | | | | | | | | | | | | | | |
| Actual Expenses | | $ | 1,000.00 | | | $ | 1,028.00 | | | $ | 13.53 | | | | 2.82 | % | |
| Hypothetical Example for Comparison Purposes (5% return before expenses) | | $ | 1,000.00 | | | $ | 1,014.68 | | | $ | 14.29 | | | | 2.82 | % | |
| | | | | | | | | | | | | | | | | | |
| Needham Small Cap Growth Fund | | | | | | | | | | | | | | | | | |
| Actual Expenses | | $ | 1,000.00 | | | $ | 1,032.80 | | | $ | 10.15 | | | | 2.14 | % | |
| Hypothetical Example for Comparison Purposes (5% return before expenses) | | $ | 1,000.00 | | | $ | 1,014.98 | | | $ | 10.87 | | | | 2.14 | % | |
| * | Expenses are equal to the average account value times the Portfolio annualized expense ratio multiplied by 184/365 (to reflect the one-half year period). |
Needham Funds
Needham Growth Fund
Schedule of Investments
December 31, 2015
| | | Shares | | | Market Value | |
| Common Stocks (93.6%) | | | | | | | | |
| | | | | | | | | |
| Aerospace & Defense (0.6%) | | | | | | | | |
| Honeywell International, Inc. | | | 7,000 | | | $ | 724,990 | |
| | | | | | | | | |
| Air Freight & Logistics (0.2%) | | | | | | | | |
| FedEx Corp. | | | 2,000 | | | | 297,980 | |
| | | | | | | | | |
| Airlines (0.2%) | | | | | | | | |
| United Continental Holdings, Inc.* | | | 5,000 | | | | 286,500 | |
| | | | | | | | | |
| Auto Components (0.2%) | | | | | | | | |
| Sypris Solutions, Inc.* | | | 185,400 | | | | 202,086 | |
| | | | | | | | | |
| Biotechnology (7.6%) | | | | | | | | |
| Foundation Medicine, Inc.* | | | 7,500 | | | | 157,950 | |
| Gilead Sciences, Inc.† | | | 94,500 | | | | 9,562,455 | |
| | | | | | | | 9,720,405 | |
| | | | | | | | | |
| Capital Markets (2.8%) | | | | | | | | |
| Financial Engines, Inc.† | | | 66,500 | | | | 2,239,055 | |
| GSV Capital Corp.* | | | 37,500 | | | | 351,375 | |
| Oaktree Capital Group LLC | | | 20,000 | | | | 954,400 | |
| | | | | | | | 3,544,830 | |
| | | | | | | | | |
| Communications Equipment (8.1%) | | | | | | | | |
| KVH Industries, Inc.* | | | 512,560 | | | | 4,828,315 | |
| ViaSat, Inc.*† | | | 90,000 | | | | 5,490,900 | |
| | | | | | | | 10,319,215 | |
| | | | | | | | | |
| Electronic Equipment, Instruments & Components (8.4%) | | | | | | | | |
| Corning, Inc. | | | 35,000 | | | | 639,800 | |
| Electro Scientific Industries, Inc.* | | | 180,000 | | | | 934,200 | |
| Flir Systems, Inc. | | | 15,000 | | | | 421,050 | |
| Frequency Electronics, Inc.* | | | 33,247 | | | | 353,083 | |
| Jabil Circuit, Inc.† | | | 150,000 | | | | 3,493,500 | |
| National Instruments Corp. | | | 20,000 | | | | 573,800 | |
| Newport Corp.* | | | 210,000 | | | | 3,332,700 | |
| TTM Technologies, Inc.* | | | 30,750 | | | | 200,183 | |
| Vishay Intertechnology, Inc. | | | 62,500 | | | | 753,125 | |
| | | | | | | | 10,701,441 | |
| | | | | | | | | |
| Energy Equipment & Services (0.7%) | | | | | | | | |
| Schlumberger Ltd. | | | 12,500 | | | | 871,875 | |
| | | | | | | | | |
| Health Care Equipment & Supplies (9.3%) | | | | | | | | |
| Analogic Corp. | | | 5,000 | | | | 413,000 | |
| Becton Dickinson and Co. | | | 41,500 | | | | 6,394,735 | |
| CONMED Corp. | | | 30,000 | | | | 1,321,500 | |
| Medtronic PLC | | | 26,290 | | | | 2,022,227 | |
| Varian Medical Systems, Inc.* | | | 20,000 | | | | 1,616,000 | |
| | | | | | | | 11,767,462 | |
| | | | | | | | | |
| Health Care Providers & Services (8.9%) | | | | | | | | |
| Express Scripts Holding Co.*† | | | 130,000 | | | | 11,363,300 | |
| | | | | | | | | |
| Health Care Technology (0.1%) | | | | | | | | |
| Castlight Health, Inc.* | | | 15,000 | | | | 64,050 | |
| | | | | | | | | |
| Internet Software & Services (3.9%) | | | | | | | | |
| Akamai Technologies, Inc.*† | | | 54,250 | | | | 2,855,177 | |
| Amber Road, Inc.* | | | 264,000 | | | | 1,343,760 | |
| Q2 Holdings, Inc.* | | | 20,000 | | | | 527,400 | |
| Reis, Inc. | | | 10,000 | | | | 237,300 | |
| | | | | | | | 4,963,637 | |
| | | | | | | | | |
| Life Sciences Tools & Services (8.8%) | | | | | | | | |
| Bruker Corp.* | | | 25,000 | | | | 606,750 | |
| Thermo Fisher Scientific, Inc.† | | | 75,000 | | | | 10,638,750 | |
| | | | | | | | 11,245,500 | |
| | | | | | | | | |
| Media (3.1%) | | | | | | | | |
| Comcast Corp. | | | 60,000 | | | | 3,385,800 | |
| Twenty-First Century Fox, Inc. | | | 10,000 | | | | 271,600 | |
| World Wrestling Entertainment, Inc. | | | 12,500 | | | | 223,000 | |
| | | | | | | | 3,880,400 | |
| | | | | | | | | |
| Oil, Gas & Consumable Fuels (1.9%) | | | | | | | | |
| Hess Corp.† | | | 49,375 | | | | 2,393,700 | |
| | | | | | | | | |
| Pharmaceuticals (0.3%) | | | | | | | | |
| Corium International, Inc.* | | | 50,000 | | | | 406,000 | |
| | | | | | | | | |
| Professional Services (0.8%) | | | | | | | | |
| WageWorks, Inc.* | | | 23,500 | | | | 1,066,195 | |
| | | | | | | | | |
| Semiconductors & Semiconductor Equipment (13.7%) |
| Applied Materials, Inc. | | | 8,000 | | | | 149,360 | |
| Brooks Automation, Inc. | | | 90,000 | | | | 961,200 | |
| Entegris, Inc.* | | | 227,500 | | | | 3,018,925 | |
| FormFactor, Inc.* | | | 600,000 | | | | 5,400,000 | |
| Lam Research Corp. | | | 2,500 | | | | 198,550 | |
| MKS Instruments, Inc. | | | 67,500 | | | | 2,430,000 | |
| Nova Measuring Instruments Ltd.* | | | 130,000 | | | | 1,274,000 | |
| PDF Solutions, Inc.* | | | 202,000 | | | | 2,189,680 | |
| Photronics, Inc.* | | | 147,788 | | | | 1,839,960 | |
| | | | | | | | 17,461,675 | |
| | | | | | | | | |
| Software (0.4%) | | | | | | | | |
| Barracuda Networks, Inc.* | | | 28,023 | | | | 523,470 | |
See accompanying notes to financial statements.
Annual Report 2015
Needham Growth Fund
Schedule of Investments (Continued)
December 31, 2015
| | | Shares | | | Market Value | |
| Common Stocks - Continued | | | | | | | | |
| | | | | | | | | |
| Specialty Retail (5.6%) | | | | | | | | |
| CarMax, Inc.*† | | | 112,500 | | | $ | 6,071,625 | |
| Dick’s Sporting Goods, Inc. | | | 24,000 | | | | 848,400 | |
| Tiffany & Co. | | | 2,500 | | | | 190,725 | |
| | | | | | | | 7,110,750 | |
| | | | | | | | | |
| Technology Hardware, Storage & Peripherals (6.4%) | | | | | | | | |
| Electronics For Imaging, Inc.* | | | 64,000 | | | | 2,991,360 | |
| Super Micro Computer, Inc.* | | | 207,500 | | | | 5,085,825 | |
| | | | | | | | 8,077,185 | |
| | | | | | | | | |
| Textiles, Apparel & Luxury Goods (0.1%) | | | | | | | | |
| Under Armour, Inc.* | | | 2,000 | | | | 161,220 | |
| | | | | | | | | |
| Thrifts & Mortgage Finance (0.3%) | | | | | | | | |
| Ladder Capital Corp. | | | 31,954 | | | | 396,869 | |
| | | | | | | | | |
| Trading Companies & Distributors (1.2%) | | | | | | | | |
| Air Lease Corp. | | | 45,000 | | | | 1,506,600 | |
| | | | | | | | | |
| Total Common Stocks | | | | | | | | |
| (Cost $58,612,546) | | | | | | $ | 119,057,335 | |
| | | | | | | | | |
| Short-Term Investments (5.7%) | | | | | | | | |
| | | | | | | | | |
| Money Market Fund (5.7%) | | | | | | | | |
| Dreyfus Treasury Prime Cash | | | | | | | | |
| Management - Institutional | | | | | | | | |
| Class 0.01% (a) | | | | | | | | |
| (Cost $7,306,182) | | | 7,306,182 | | | | 7,306,182 | |
| | | | | | | | | |
| Total Investments (99.3%) | | | | | | | | |
| (Cost $65,918,726) | | | | | | | 126,363,517 | |
| Total Securities Sold Short (-3.9%) | | | | | | | | |
| (Proceeds $4,612,182) | | | | | | | (4,943,555 | ) |
| Other Assets in Excess of Liabilities (4.6%) | | | | | | | 5,734,400 | |
| Net Assets (100.0%) | | | | | | $ | 127,154,362 | |
| * | Non-income producing security. |
| | |
| (a) | Rate shown is the seven day yield as of December 31, 2015 |
| | |
| † | Security position is either entirely or partially held in a segregated account as collateral for securities sold short, aggregating a total market value of $6,079,840. |
| | |
| | The Global Industry Classification Standard (GICS®) was developed by and/or is the exclusive property of MSCI, Inc. and Standard & Poor’s Financial Services LLC (“S&P”). GICS is a service mark of MSCI and S&P and has been licensed for use by U.S. Bancorp Fund Services, LLC. |
See accompanying notes to financial statements.
Needham Funds
Needham Growth Fund
Schedule of Securities Sold Short
December 31, 2015
| | | Shares | | | Market Value | |
| | | | | | | | | |
| Securities Sold Short (-3.9%) | | | | | | | | |
| | | | | | | | | |
| Capital Markets (-0.6%) | | | | | | | | |
| Medallion Financial Corp. | | | 112,000 | | | $ | 788,480 | |
| | | | | | | | | |
| Communications Equipment (-1.7%) | | | | | | | | |
| Ubiquiti Networks, Inc.* | | | 69,000 | | | | 2,186,610 | |
| | | | | | | | | |
| Internet Software & Services (-0.2%) | | | | | | | | |
| SPS Commerce, Inc.* | | | 2,575 | | | | 180,791 | |
| | | | | | | | | |
| Semiconductors & Semiconductor Equipment (-0.3%) | | | | | | | | |
| Advanced Energy Industries, Inc.* | | | 5,000 | | | | 141,150 | |
| Applied Micro Circuits Corp.* | | | 5,000 | | | | 31,850 | |
| Rudolph Technologies, Inc.* | | | 3,000 | | | | 42,660 | |
| Solaredge Technologies, Inc.* | | | 5,000 | | | | 140,850 | |
| | | | | | | | 356,510 | |
| | | | | | | | | |
| Software (-1.1%) | | | | | | | | |
| ANSYS, Inc.* | | | 15,000 | | | | 1,387,500 | |
| | | | | | | | | |
| Technology Hardware, Storage & Peripherals (0.0%) | | | | | | | | |
| QLogic Corp.* | | | 3,579 | | | | 43,664 | |
| | | | | | | | | |
| Total Securities Sold Short (-3.9%) | | | | | | | | |
| (Proceeds $4,612,182) | | | | | | $ | 4,943,555 | |
| * | Non-income producing security. | | | |
See accompanying notes to financial statements.
Annual Report 2015
Needham Aggressive Growth Fund
Schedule of Investments
December 31, 2015
| | | Shares | | | Market Value | |
| Common Stocks (99.6%) | | | | | | | | |
| | | | | | | | | |
| Aerospace & Defense (2.3%) | | | | | | | | |
| Precision Castparts Corp. | | | 5,000 | | | $ | 1,160,050 | |
| | | | | | | | | |
| Biotechnology (4.7%) | | | | | | | | |
| Foundation Medicine, Inc.* | | | 2,500 | | | | 52,650 | |
| Gilead Sciences, Inc.† | | | 23,000 | | | | 2,327,370 | |
| | | | | | | | 2,380,020 | |
| | | | | | | | | |
| Capital Markets (2.3%) | | | | | | | | |
| Financial Engines, Inc.† | | | 29,000 | | | | 976,430 | |
| GSV Capital Corp.* | | | 18,700 | | | | 175,219 | |
| | | | | | | | 1,151,649 | |
| | | | | | | | | |
| Commercial Services & Supplies (0.2%) | | | | | | | | |
| Clean Harbors, Inc.* | | | 2,400 | | | | 99,960 | |
| | | | | | | | | |
| Communications Equipment (7.9%) | | | | | | | | |
| KVH Industries, Inc.* | | | 272,560 | | | | 2,567,515 | |
| Norsat International, Inc.* | | | 62,500 | | | | 275,000 | |
| ViaSat, Inc.*† | | | 19,500 | | | | 1,189,695 | |
| | | | | | | | 4,032,210 | |
| | | | | | | | | |
| Electrical Equipment (0.8%) | | | | | | | | |
| Vicor Corp.* | | | 45,000 | | | | 410,400 | |
| | | | | | | | | |
| Electronic Equipment, Instruments & Components (6.5%) |
| FEI Co. | | | 14,000 | | | | 1,117,060 | |
| Flir Systems, Inc. | | | 8,500 | | | | 238,595 | |
| Frequency Electronics, Inc.* | | | 51,100 | | | | 542,682 | |
| IPG Photonics Corp.* | | | 4,500 | | | | 401,220 | |
| National Instruments Corp. | | | 9,000 | | | | 258,210 | |
| Newport Corp.*† | | | 22,500 | | | | 357,075 | |
| Vishay Precision Group, Inc.* | | | 33,000 | | | | 373,560 | |
| | | | | | | | 3,288,402 | |
| | | | | | | | | |
| Energy Equipment & Services (0.4%) | | | | | | | | |
| Aspen Aerogels, Inc.* | | | 35,200 | | | | 213,664 | |
| | | | | | | | | |
| Health Care Equipment & Supplies (3.1%) | | | | | | | | |
| Analogic Corp. | | | 5,000 | | | | 413,000 | |
| Becton Dickinson and Co. | | | 4,500 | | | | 693,405 | |
| LeMaitre Vascular, Inc. | | | 28,000 | | | | 483,000 | |
| | | | | | | | 1,589,405 | |
| | | | | | | | | |
| Health Care Providers & Services (1.0%) | | | | | | | | |
| Express Scripts Holding Co.* | | | 6,000 | | | | 524,460 | |
| | | | | | | | | |
| Health Care Technology (0.8%) | | | | | | | | |
| Omnicell, Inc.* | | | 13,000 | | | | 404,040 | |
| | | | | | | | | |
| Hotels, Restaurants & Leisure (0.7%) | | | | | | | | |
| Panera Bread Co.* | | | 1,800 | | | | 350,604 | |
| | | | | | | | | |
| Household Durables (0.8%) | | | | | | | | |
| iRobot Corp.* | | | 5,000 | | | | 177,000 | |
| Libbey, Inc. | | | 10,000 | | | | 213,200 | |
| | | | | | | | 390,200 | |
| | | | | | | | | |
| Household Products (2.5%) | | | | | | | | |
| Oil-Dri Corp. of America | | | 34,687 | | | | 1,277,522 | |
| | | | | | | | | |
| Insurance (0.1%) | | | | | | | | |
| Crawford & Co. | | | 13,400 | | | | 67,938 | |
| | | | | | | | | |
| Internet Software & Services (16.5%) | | | | | | | | |
| Akamai Technologies, Inc.*† | | | 66,750 | | | | 3,513,053 | |
| Amber Road, Inc.* | | | 89,000 | | | | 453,010 | |
| ARI Network Services, Inc.* | | | 15,000 | | | | 67,500 | |
| ChannelAdvisor Corp.* | | | 14,117 | | | | 195,520 | |
| Constant Contact, Inc.* | | | 42,000 | | | | 1,228,080 | |
| Q2 Holdings, Inc.* | | | 12,500 | | | | 329,625 | |
| Reis, Inc.† | | | 95,000 | | | | 2,254,350 | |
| TheStreet, Inc. | | | 270,000 | | | | 405,000 | |
| | | | | | | | 8,446,138 | |
| | | | | | | | | |
| Media (0.2%) | | | | | | | | |
| World Wrestling Entertainment, Inc. | | | 6,000 | | | | 107,040 | |
| | | | | | | | | |
| Oil, Gas & Consumable Fuels (0.6%) | | | | | | | | |
| Hess Corp. | | | 6,375 | | | | 309,060 | |
| | | | | | | | | |
| Pharmaceuticals (0.5%) | | | | | | | | |
| Corium International, Inc.* | | | 30,000 | | | | 243,600 | |
| | | | | | | | | |
| Professional Services (2.9%) | | | | | | | | |
| CRA International, Inc.* | | | 12,500 | | | | 233,125 | |
| WageWorks, Inc.*† | | | 28,000 | | | | 1,270,360 | |
| | | | | | | | 1,503,485 | |
| | | | | | | | | |
| Real Estate Investment Trusts (REITs) (2.1%) | | | | | | | | |
| Equinix, Inc. | | | 3,593 | | | | 1,086,523 | |
| | | | | | | | | |
| Semiconductors & Semiconductor Equipment (23.4%) | | | | | | | | |
| Entegris, Inc.* | | | 200,000 | | | | 2,654,000 | |
| FormFactor, Inc.* | | | 340,000 | | | | 3,060,000 | |
| MKS Instruments, Inc.† | | | 29,100 | | | | 1,047,600 | |
| Nova Measuring Instruments Ltd.* | | | 94,900 | | | | 930,020 | |
| PDF Solutions, Inc.*† | | | 239,500 | | | | 2,596,180 | |
| Photronics, Inc.* | | | 117,500 | | | | 1,462,875 | |
| Ultra Clean Holdings, Inc.* | | | 20,000 | | | | 102,400 | |
| Xcerra Corp.* | | | 10,000 | | | | 60,500 | |
| | | | | | | | 11,913,575 | |
See accompanying notes to financial statements.
Needham Funds
Needham Aggressive Growth Fund
Schedule of Investments (Continued)
December 31, 2015
| | | Shares | | | Market Value | |
| Common Stocks - Continued | | | | | | | | |
| | | | | | | | | |
| Software (5.2%) | | | | | | | | |
| Barracuda Networks, Inc.* | | | 13,539 | | | $ | 252,909 | |
| Bottomline Technologies, Inc.* | | | 25,000 | | | | 743,250 | |
| Exa Corp.* | | | 5,000 | | | | 58,050 | |
| GSE Systems, Inc.* | | | 665,000 | | | | 1,596,000 | |
| | | | | | | | 2,650,209 | |
| | | | | | | | | |
| Specialty Retail (3.1%) | | | | | | | | |
| CarMax, Inc.*† | | | 22,500 | | | | 1,214,325 | |
| Dick’s Sporting Goods, Inc. | | | 10,000 | | | | 353,500 | |
| | | | | | | | 1,567,825 | |
| | | | | | | | | |
| Technology Hardware, Storage & Peripherals (10.4%) | | | | | | | | |
| Apple, Inc.† | | | 22,250 | | | | 2,342,035 | |
| Avid Technology, Inc.* | | | 13,750 | | | | 100,238 | |
| Electronics For Imaging, Inc.* | | | 16,000 | | | | 747,840 | |
| Super Micro Computer, Inc.*† | | | 85,500 | | | | 2,095,605 | |
| | | | | | | | 5,285,718 | |
| | | | | | | | | |
| Thrifts & Mortgage Finance (0.4%) | | | | | | | | |
| Ladder Capital Corp. | | | 14,894 | | | | 184,983 | |
| | | | | | | | | |
| Trading Companies & Distributors (0.2%) | | | | | | | | |
| Air Lease Corp. | | | 3,000 | | | | 100,440 | |
| | | | | | | | | |
| Total Common Stocks | | | | | | | | |
| (Cost $27,881,472) | | | | | | $ | 50,739,120 | |
| | | | | | | | | |
| Short-Term Investments (0.1%) | | | | | | | | |
| | | | | | | | | |
| Money Market Fund (0.1%) | | | | | | | | |
| Dreyfus Treasury Prime Cash | | | | | | | | |
| Management - Institutional | | | | | | | | |
| Class 0.01% (a) | | | | | | | | |
| (Cost $26,486) | | | 26,486 | | | | 26,486 | |
| | | | | | | | | |
| Total Investments (99.7%) | | | | | | | | |
| (Cost $27,907,957) | | | | | | | 50,765,606 | |
| Total Securities Sold Short (-6.2%) | | | | | | | | |
| (Proceeds $3,031,869) | | | | | | | (3,177,382 | ) |
| Other Assets in Excess of Liabilities (6.5%) | | | | | | | 3,317,419 | |
| Net Assets (100.0%) | | | | | | $ | 50,905,643 | |
| * | Non-income producing security. |
| (a) | Rate shown is the seven day yield as of December 31, 2015. |
| † | Security position is either entirely or partially held in a segregated account as collateral for securities sold short, aggregating a total market value of $6,031,110. |
| | |
| | The Global Industry Classification Standard (GICS®) was developed by and/or is the exclusive property of MSCI, Inc. and Standard & Poor’s Financial Services LLC (“S&P”). GICS is a service mark of MSCI and S&P and has been licensed for use by U.S. Bancorp Fund Services, LLC. |
See accompanying notes to financial statements.
Annual Report 2015
Needham Aggressive Growth Fund
Schedule of Securities Sold Short
December 31, 2015
| | | Shares | | | Market Value | |
| | | | | | | | | |
| Securities Sold Short (-6.2%) | | | | | | | | |
| | | | | | | | | |
| Capital Markets (-1.7%) | | | | | | | | |
| Medallion Financial Corp. | | | 123,000 | | | $ | 865,920 | |
| | | | | | | | | |
| Communications Equipment (-2.9%) | | | | | | | | |
| Ubiquiti Networks, Inc.* | | | 46,250 | | | | 1,465,662 | |
| | | | | | | | | |
| Semiconductors & Semiconductor Equipment (-0.3%) | | | | | | | | |
| Applied Micro Circuits Corp.* | | | 5,000 | | | | 31,850 | |
| Solaredge Technologies, Inc.* | | | 5,000 | | | | 140,850 | |
| | | | | | | | 172,700 | |
| | | | | | | | | |
| Software (-0.9%) | | | | | | | | |
| ANSYS, Inc.* | | | 5,000 | | | | 462,500 | |
| | | | | | | | | |
| Thrifts & Mortgage Finance (-0.4%) | | | | | | | | |
| Federal Home Loan Mortgage Corp.* | | | 130,000 | | | | 210,600 | |
| | | | | | | | | |
| Total Securities Sold Short (-6.2%) | | | | | | | | |
| (Proceeds $3,031,869) | | | | | | $ | 3,177,382 | |
| * | Non-income producing security. |
See accompanying notes to financial statements.
Needham Funds
Needham Small Cap Growth Fund
Schedule of Investments
December 31, 2015
| | | Shares | | | Market Value | |
| Common Stocks (81.7%) | | | | | | | | |
| | | | | | | | | |
| Communications Equipment (8.6%) | | | | | | | | |
| KVH Industries, Inc.* | | | 140,000 | | | $ | 1,318,800 | |
| Ruckus Wireless, Inc.*† | | | 65,000 | | | | 696,150 | |
| | | | | | | | 2,014,950 | |
| | | | | | | | | |
| Electrical Equipment (0.6%) | | | | | | | | |
| Generac Holdings, Inc.* | | | 5,000 | | | | 148,850 | |
| | | | | | | | | |
| Electronic Equipment, Instruments & Components (17.5%) |
| Electro Scientific Industries, Inc.* | | | 75,000 | | | | 389,250 | |
| Frequency Electronics, Inc.* | | | 105,000 | | | | 1,115,100 | |
| Newport Corp.*† | | | 92,500 | | | | 1,467,975 | |
| TTM Technologies, Inc.* | | | 175,000 | | | | 1,139,250 | |
| | | | | | | | 4,111,575 | |
| | | | | | | | | |
| Health Care Providers & Services (1.1%) | | | | | | | | |
| Express Scripts Holding Co.* | | | 3,000 | | | | 262,230 | |
| | | | | | | | | |
| Health Care Technology (0.3%) | | | | | | | | |
| Castlight Health, Inc.* | | | 15,000 | | | | 64,050 | |
| | | | | | | | | |
| Household Products (2.4%) | | | | | | | | |
| Oil-Dri Corp. of America | | | 15,404 | | | | 567,329 | |
| | | | | | | | | |
| Internet Software & Services (10.2%) | | | | | | | | |
| Akamai Technologies, Inc.* | | | 1,000 | | | | 52,630 | |
| Amber Road, Inc.* | | | 150,000 | | | | 763,500 | |
| Reis, Inc.† | | | 47,500 | | | | 1,127,175 | |
| TheStreet, Inc. | | | 300,000 | | | | 450,000 | |
| | | | | | | | 2,393,305 | |
| | | | | | | | | |
| Oil, Gas & Consumable Fuels (1.1%) | | | | | | | | |
| Hess Corp. | | | 5,250 | | | | 254,520 | |
| | | | | | | | | |
| Semiconductors & Semiconductor Equipment (23.5%) | | | | | | | | |
| Entegris, Inc.* | | | 60,000 | | | | 796,200 | |
| FormFactor, Inc.* | | | 130,000 | | | | 1,170,000 | |
| MKS Instruments, Inc.† | | | 30,000 | | | | 1,080,000 | |
| Nanometrics, Inc.* | | | 1,402 | | | | 21,226 | |
| PDF Solutions, Inc.*† | | | 77,000 | | | | 834,680 | |
| Photronics, Inc.* | | | 24,750 | | | | 308,138 | |
| Ultra Clean Holdings, Inc.* | | | 255,000 | | | | 1,305,600 | |
| | | | | | | | 5,515,844 | |
| | | | | | | | | |
| Technology Hardware, Storage & Peripherals (11.4%) | | | | | | | | |
| Silicon Graphics International Corp.* | | | 245,000 | | | | 1,445,500 | |
| Super Micro Computer, Inc.*† | | | 50,000 | | | | 1,225,500 | |
| | | | | | | | 2,671,000 | |
| | | | | | | | | |
| Thrifts & Mortgage Finance (0.4%) | | | | | | | | |
| LendingTree, Inc.* | | | 1,000 | | | | 89,280 | |
| | | | | | | | | |
| Trading Companies & Distributors (4.6%) | | | | | | | | |
| Air Lease Corp.† | | | 32,500 | | | | 1,088,100 | |
| | | | | | | | | |
| Total Common Stocks | | | | | | | | |
| (Cost $19,649,626) | | | | | | $ | 19,181,033 | |
| | | | | | | | | |
| Short-Term Investments (19.2%) | | | | | | | | |
| | | | | | | | | |
| Money Market Fund (19.2%) | | | | | | | | |
| Dreyfus Treasury Prime Cash | | | | | | | | |
| Management - Institutional | | | | | | | | |
| Class 0.01% (a) | | | | | | | | |
| (Cost $4,514,166) | | | 4,514,166 | | | | 4,514,166 | |
| | | | | | | | | |
| Total Investments (100.9%) | | | | | | | | |
| (Cost $24,163,793) | | | | | | | 23,695,199 | |
| Total Securities Sold Short (-3.5%) | | | | | | | | |
| (Proceeds $787,829) | | | | | | | (821,003 | ) |
| Other Assets in Excess of | | | | | | | | |
| Liabilities (2.6%) | | | | | | | 599,123 | |
| Net Assets (100.0%) | | | | | | $ | 23,473,319 | |
| * | Non-income producing security. |
| (a) | Rate shown is the seven day yield as of December 31, 2015. |
| † | Security position is either entirely or partially held in a segregated account as collateral for securities sold short, aggregating a total market value of $1,135,650. |
The Global Industry Classification Standard (GICS®) was developed by and/or is the exclusive property of MSCI, Inc. and Standard & Poor’s Financial Services LLC (“S&P”). GICS is a service mark of MSCI and S&P and has been licensed for use by U.S. Bancorp Fund Services, LLC.
See accompanying notes to financial statements.
Annual Report 2015
Needham Small Cap Growth Fund
Schedule of Securities Sold Short
December 31, 2015
| | | Shares | | | Market Value | |
| | | | | | | | | |
| Securities Sold Short (-3.5%) | | | | | | | | |
| | | | | | | | | |
| Communications Equipment (-1.1%) | | | | | | | | |
| Ubiquiti Networks, Inc.* | | | 8,000 | | | $ | 253,520 | |
| | | | | | | | | |
| Internet Software & Services (-1.0%) | | | | | | | | |
| SPS Commerce, Inc.* | | | 3,425 | | | | 240,469 | |
| | | | | | | | | |
| Semiconductors & Semiconductor Equipment (-1.2%) | | | | | | | | |
| Advanced Energy Industries, Inc.* | | | 5,000 | | | | 141,150 | |
| Rudolph Technologies, Inc.* | | | 10,000 | | | | 142,200 | |
| | | | | | | | 283,350 | |
| | | | | | | | | |
| Technology Hardware, Storage & Peripherals (-0.2%) | | | | | | | | |
| QLogic Corp.* | | | 3,579 | | | | 43,664 | |
| | | | | | | | | |
| Total Securities Sold Short (-3.5%) | | | | | | | | |
| (Proceeds $787,829) | | | | | | $ | 821,003 | |
| * | Non-income producing security. |
See accompanying notes to financial statements.
Needham Funds
Statements of Assets and Liabilities
December 31, 2015
| | | | | | Needham | | | Needham | |
| | | Needham | | | Aggressive | | | Small Cap | |
| | | Growth Fund | | | Growth Fund | | | Growth Fund | |
| Assets | | | | | | | | | | | | |
| Investments, at Value | | | | | | | | | | | | |
| (Cost $65,918,726, $27,907,957, $24,163,793) | | $ | 126,363,517 | | | $ | 50,765,606 | | | $ | 23,695,199 | |
| Cash | | | 71,996 | | | | 12,741 | | | | 103,674 | |
| Receivables: | | | | | | | | | | | | |
| Deposit with Broker for Securities Sold Short | | | 5,320,554 | �� | | | 3,308,997 | | | | 986,460 | |
| Dividends and Interest | | | 89,521 | | | | 24,427 | | | | 1,649 | |
| Fund Shares Sold | | | 6,292 | | | | 17,733 | | | | 1,722 | |
| Investment Securities Sold | | | 620,429 | | | | 91,119 | | | | 17,243 | |
| Prepaid Expenses | | | 28,237 | | | | 21,802 | | | | 16,489 | |
| Total Assets | | | 132,500,546 | | | | 54,242,425 | | | | 24,822,436 | |
| | | | | | | | | | | | | |
| Liabilities | | | | | | | | | | | | |
| Securities Sold Short, at Value | | | | | | | | | | | | |
| (Proceeds $4,612,182, $3,031,869, $787,829) | | | 4,943,555 | | | | 3,177,382 | | | | 821,003 | |
| Payables: | | | | | | | | | | | | |
| Investment Securities Purchased | | | 39,590 | | | | — | | | | 466,186 | |
| Fund Shares Redeemed | | | 95,344 | | | | 32,286 | | | | 781 | |
| Due to Adviser | | | 136,604 | | | | 51,238 | | | | 16,481 | |
| Distribution Fees | | | 27,614 | | | | 11,116 | | | | 5,150 | |
| Administration and Accounting Fees | | | 23,665 | | | | 10,867 | | | | 5,343 | |
| Transfer Agent Fees | | | 9,757 | | | | 8,145 | | | | 6,894 | |
| Directors’ Fees | | | 1,149 | | | | 1,447 | | | | 240 | |
| Accrued Expenses and Other Liabilities | | | 68,906 | | | | 44,301 | | | | 27,039 | |
| Total Liabilities | | | 5,346,184 | | | | 3,336,782 | | | | 1,349,117 | |
| | | | | | | | | | | | | |
| Net Assets | | $ | 127,154,362 | | | $ | 50,905,643 | | | $ | 23,473,319 | |
| Shares Issued and Outstanding $0.001 Par Value | | | | | | | | | | | | |
| (Authorized 800,000,000,100,000,000 and 100,000,000 respectively) | | | 3,104,196 | | | | 2,602,804 | | | | 1,886,467 | |
| Net Asset Value, Offering and Redemption Price Per Share(a) | | $ | 40.96 | | | $ | 19.56 | | | $ | 12.44 | |
| | | | | | | | | | | | | |
| Components of Net Assets | | | | | | | | | | | | |
| Paid-in Capital | | | 63,672,147 | | | | 28,242,082 | | | | 24,089,025 | |
| Accumulated Net Investment Loss | | | 7,623 | | | | — | | | | — | |
| Accumulated Net Realized Gain (Loss) from Investments, Securities Sold Short, Foreign Currency Transactions and Currency | | | 3,361,174 | | | | (48,575 | ) | | | (113,937 | ) |
| Net Unrealized Appreciation (Depreciation) on Investment Securities and Securities Sold Short | | | 60,113,418 | | | | 22,712,136 | | | | (501,769 | ) |
| Net Unrealized Appreciation on Foreign Currency Transactions and Currency | | | — | | | | — | | | | — | |
| Total Net Assets | | $ | 127,154,362 | | | $ | 50,905,643 | | | $ | 23,473,319 | |
| (a) | Subject to certain exceptions, a 2% redemption fee is imposed upon shares redeemed within 60 days of their purchase. See Note 2 of the notes to finanical statements. |
See accompanying notes to financial statements.
Annual Report 2015
Statements of Operations
For the year ended December 31, 2015
| | | | | | Needham | | | Needham | |
| | | Needham | | | Aggressive | | | Small Cap | |
| | | Growth Fund | | | Growth Fund | | | Growth Fund | |
| Investment Income | | | | | | | | | | | | |
| Dividends | | $ | 804,805 | | | $ | 395,472 | | | $ | 125,653 | |
| Interest | | | 46 | | | | — | | | | 25 | |
| Total Investment Income | | | 804,851 | | | | 395,472 | | | | 125,678 | |
| | | | | | | | | | | | | |
| Expenses | | | | | | | | | | | | |
| Investment Advisory Fees | | | 1,772,856 | | | | 733,704 | | | | 354,456 | |
| Distribution Fees | | | 354,571 | | | | 146,741 | | | | 70,891 | |
| Administration and Accounting Fees | | | 152,266 | | | | 70,007 | | | | 35,505 | |
| Audit Fees | | | 34,117 | | | | 23,444 | | | | 23,389 | |
| Chief Compliance Officer Fees | | | 23,234 | | | | 9,618 | | | | 4,648 | |
| Custodian Fees | | | 9,820 | | | | 8,627 | | | | 7,272 | |
| Directors’ Fees | | | 31,085 | | | | 13,961 | | | | 6,488 | |
| Dividend Expense(1) | | | 72,664 | | | | 78,153 | | | | 4,442 | |
| Filing Fees | | | 22,249 | | | | 22,047 | | | | 22,756 | |
| Interest Expense(1) | | | 253,833 | | | | 203,972 | | | | 25,202 | |
| Legal Fees | | | 63,345 | | | | 26,369 | | | | 12,671 | |
| Printing Fees | | | 17,539 | | | | 10,575 | | | | 9,801 | |
| Transfer Agent Fees | | | 59,466 | | | | 49,590 | | | | 42,684 | |
| Other Expenses | | | 35,484 | | | | 20,449 | | | | 16,865 | |
| Total Expenses | | | 2,902,529 | | | | 1,417,257 | | | | 637,070 | |
| Fees Waived by Investment Adviser | | | — | | | | (5,598 | ) | | | (54,495 | ) |
| Net Expenses | | | 2,902,529 | | | | 1,411,659 | | | | 582,575 | |
| Net Investment Loss | | | (2,097,678 | ) | | | (1,016,187 | ) | | | (456,897 | ) |
| | | | | | | | | | | | | |
| Net Realized/Unrealized Gain (Loss) from Investments, Securities Sold Short, Foreign Currency Transactions and Currency | | | | | | | | | | | | |
| Net Realized Gain from Investments | | | 8,542,753 | | | | 5,560,630 | | | | 1,419,863 | |
| Net Realized Gain (Loss) from Securities Sold Short | | | (67,206 | ) | | | 61,939 | | | | 52,351 | |
| Net Realized Loss from Foreign Currency Transactions and Currency | | | — | | | | (286 | ) | | | — | |
| Change in Unrealized Depreciation on Investments and Securities Sold Short | | | (13,415,509 | ) | | | (8,806,555 | ) | | | (3,436,493 | ) |
| Change in Unrealized Depreciation on Foreign Currency Transactions and Currency | | | — | | | | 57 | | | | — | |
| Net Realized/Unrealized Loss from Investments, Securities Sold Short, Foreign Currency Transactions and Currency | | | (4,939,962 | ) | | | (3,184,215 | ) | | | (1,964,279 | ) |
| Change in Net Assets Resulting from Operations | | $ | (7,037,640 | ) | | $ | (4,200,402 | ) | | $ | (2,421,176 | ) |
| (1) | Expense related to securities sold short. |
See accompanying notes to financial statements.
Needham Funds
Statements of Changes in Net Assets
| | | | | | | | | Needham Aggressive | | | Needham Small Cap | |
| | | Needham Growth Fund | | | Growth Fund | | | Growth Fund | |
| | | Year Ended | | | Year Ended | | | Year Ended | | | Year Ended | | | Year Ended | | | Year Ended | |
| | | December 31, | | | December 31, | | | December 31, | | | December 31, | | | December 31, | | | December 31, | |
| | | 2015 | | | 2014 | | | 2015 | | | 2014 | | | 2015 | | | 2014 | |
| Change in Net Assets | | | | | | | | | | | | | | | | | | | | | | | | |
| Operations: | | | | | | | | | | | | | | | | | | | | | | | | |
| Net Investment Loss | | $ | (2,097,678 | ) | | $ | (1,875,063 | ) | | $ | (1,016,187 | ) | | $ | (1,005,141 | ) | | $ | (456,897 | ) | | $ | (552,072 | ) |
| Net Realized Gain from Investments, Securities Sold Short, Foreign Currency Transactions, and Currency | | | 8,475,547 | | | | 9,622,864 | | | | 5,622,283 | | | | 6,415,833 | | | | 1,472,214 | | | | 2,071,624 | |
| Net Change in Unrealized Appreciation (Depreciation) on Investments, Securities Sold Short, Foreign Currency Transactions and Currency | | | (13,415,509 | ) | | | 4,452,922 | | | | (8,806,498 | ) | | | (1,328,100 | ) | | | (3,436,493 | ) | | | (1,701,768 | ) |
| Change in Net Assets Resulting from Operations | | | (7,037,640 | ) | | | 12,200,723 | | | | (4,200,402 | ) | | | 4,082,592 | | | | (2,421,176 | ) | | | (182,216 | ) |
| | | | | | | | | | | | | | | | | | | | | | | | | |
| Distributions to Shareholders from: | | | | | | | | | | | | | | | | | | | | | | | | |
| Net Investment Income | | | — | | | | — | | | | — | | | | — | | | | — | | | | — | |
| Capital Gains | | | (8,209,695 | ) | | | (9,182,356 | ) | | | (5,612,688 | ) | | | (1,852,789 | ) | | | (606,909 | ) | | | (3,642,737 | ) |
| Total Distributions to Shareholders | | | (8,209,695 | ) | | | (9,182,356 | ) | | | (5,612,688 | ) | | | (1,852,789 | ) | | | (606,909 | ) | | | (3,642,737 | ) |
| | | | | | | | | | | | | | | | | | | | | | | | | |
| Capital Transactions: | | | | | | | | | | | | | | | | | | | | | | | | |
| Shares Issued | | | 5,600,757 | | | | 12,224,922 | | | | 4,292,138 | | | | 3,447,337 | | | | 2,202,629 | | | | 3,876,827 | |
| Shares Issued in Reinvestment of Distribution | | | 7,775,634 | | | | 8,793,743 | | | | 5,457,811 | | | | 1,817,962 | | | | 566,101 | | | | 3,491,790 | |
| Shares Redeemed | | | (18,794,360 | ) | | | (17,914,336 | ) | | | (11,385,924 | ) | | | (13,602,601 | ) | | | (8,383,898 | ) | | | (15,377,681 | ) |
| Redemption Fees | | | 3,397 | | | | 79 | | | | 1,539 | | | | 1,372 | | | | 120 | | | | 173 | |
| Change in Net Assets from Capital Transactions | | | (5,414,572 | ) | | | 3,104,408 | | | | (1,634,436 | ) | | | (8,335,930 | ) | | | (5,615,048 | ) | | | (8,008,891 | ) |
| | | | | | | | | | | | | | | | | | | | | | | | | |
| Change in Net Assets | | | (20,661,907 | ) | | | 6,122,775 | | | | (11,447,526 | ) | | | (6,106,127 | ) | | | (8,643,133 | ) | | | (11,833,844 | ) |
| | | | | | | | | | | | | | | | | | | | | | | | | |
| Net Assets | | | | | | | | | | | | | | | | | | | | | | | | |
| Beginning of Year | | | 147,816,269 | | | | 141,693,494 | | | | 62,353,169 | | | | 68,459,296 | | | | 32,116,452 | | | | 43,950,296 | |
| End of Year | | $ | 127,154,362 | | | $ | 147,816,269 | | | $ | 50,905,643 | | | $ | 62,353,169 | | | $ | 23,473,319 | | | $ | 32,116,452 | |
| Accumulated Net Investment Loss | | $ | 7,623 | | | $ | (1,796,338 | ) | | $ | — | | | $ | (1,013,350 | ) | | $ | — | | | $ | (552,072 | ) |
| | | | | | | | | | | | | | | | | | | | | | | | | |
| Share Transaction: | | | | | | | | | | | | | | | | | | | | | | | | |
| Number of Shares Issued | | | 125,623 | | | | 267,721 | | | | 185,078 | | | | 152,427 | | | | 158,817 | | | | 255,422 | |
| Number of Shares Reinvested | | | 186,109 | | | | 193,652 | | | | 279,744 | | | | 78,734 | | | | 45,617 | | | | 255,809 | |
| Number of Shares Redeemed | | | (420,680 | ) | | | (392,522 | ) | | | (509,153 | ) | | | (605,395 | ) | | | (610,896 | ) | | | (1,030,428 | ) |
| Change in Shares | | | (108,948 | ) | | | 68,851 | | | | (44,331 | ) | | | (374,234 | ) | | | (406,462 | ) | | | (519,197 | ) |
See accompanying notes to financial statements.
Annual Report 2015
Needham Growth Fund
Financial Highlights
| (For a Share Outstanding | | Year Ended December 31, | |
| Throughout each Period) | | 2015 | | | 2014 | | | 2013 | | | 2012 | | | 2011 | |
| Net Asset Value, Beginning of Year | | $ | 46.00 | | | $ | 45.06 | | | $ | 33.66 | | | $ | 32.78 | | | $ | 39.11 | |
| Investment Operations | | | | | | | | | | | | | | | | | | | | |
| Net Investment Loss | | | (0.68 | ) | | | (0.58 | ) | | | (0.54 | ) | | | (0.24 | ) | | | (0.58 | ) |
| Net Realized and Unrealized Gain (Loss) on Investments | | | (1.60 | ) | | | 4.59 | | | | 12.20 | | | | 4.31 | | | | (3.79 | ) |
| Total from Investment Operations | | | (2.28 | ) | | | (4.01 | ) | | | 11.66 | | | | 4.07 | | | | (4.37 | ) |
| | | | | | | | | | | | | | | | | | | | | |
| Less Distributions | | | | | | | | | | | | | | | | | | | | |
| Net Realized Gains | | | (2.76 | ) | | | (3.07 | ) | | | (0.26 | ) | | | (3.19 | ) | | | (1.97 | ) |
| Total Distributions | | | (2.76 | ) | | | (3.07 | ) | | | (0.26 | ) | | | (3.19 | ) | | | (1.97 | ) |
| | | | | | | | | | | | | | | | | | | | | |
| Capital Contributions | | | | | | | | | | | | | | | | | | | | |
| Redemption Fees | | | — | (a) | | | — | (a) | | | — | (a) | | | — | (a) | | | 0.01 | |
| Total Capital Contributions | | | — | (a) | | | — | (a) | | | — | (a) | | | — | (a) | | | 0.01 | |
| Net Asset Value, End of Year | | $ | 40.96 | | | $ | 46.00 | | | $ | 45.06 | | | $ | 33.66 | | | $ | 32.78 | |
| | | | | | | | | | | | | | | | | | | | | |
| Total Return | | | (5.07 | )% | | | 8.98 | % | | | 34.68 | % | | | 12.80 | % | | | (10.94 | )% |
| Net Assets, End of Year (000’s) | | $ | 127,154 | | | $ | 147,816 | | | $ | 141,693 | | | $ | 113,561 | | | $ | 125,966 | |
| Ratios/Supplemental Data | | | | | | | | | | | | | | | | | | | | |
| Ratio of Total Expenses to Average Net Assets | | | 2.05 | % | | | 1.84 | % | | | 1.89 | % | | | 1.94 | % | | | 1.81 | % |
| Ratio of Total Expenses to Average Net Assets (before interest and dividend expense) | | | 1.82 | % | | | 1.80 | % | | | 1.82 | % | | | 1.82 | % | | | 1.78 | % |
| Ratio of Total Expenses to Average Net Assets (before waiver and reimbursement of expenses) | | | 2.05 | % | | | 1.84 | % | | | 1.89 | % | | | 1.94 | % | | | 1.81 | % |
| Ratio of Net Investment Income (Loss) to Average Net Assets | | | (1.48 | )% | | | (1.32 | )% | | | (1.30 | )% | | | (0.65 | )% | | | (1.41 | )% |
| Ratio of Net Investment Income (Loss) to Average Net Assets (before waivers and reimbursements of expenses) | | | (1.48 | )% | | | (1.32 | )% | | | (1.30 | )% | | | (0.65 | )% | | | (1.41 | )% |
| Portfolio turnover rate | | | 13 | % | | | 12 | % | | | 12 | % | | | 17 | % | | | 29 | % |
| (a) | Value is less than $0.005 per share. |
See accompanying notes to financial statements.
Needham Funds
Needham Aggressive Growth Fund
Financial Highlights
| (For a Share Outstanding | | Year Ended December 31, | |
| Throughout each Period) | | 2015 | | | 2014 | | | 2013 | | | 2012 | | | 2011 | |
| Net Asset Value, Beginning of Year | | $ | 23.55 | | | $ | 22.66 | | | $ | 16.63 | | | $ | 14.52 | | | $ | 17.14 | |
| Investment Operations | | | | | | | | | | | | | | | | | | | | |
| Net Investment Loss | | | (0.39 | ) | | | (0.38 | ) | | | (0.37 | ) | | | (0.29 | ) | | | (0.34 | ) |
| Net Realized and Unrealized Gain (Loss) on Investments | | | (1.28 | ) | | | 1.98 | | | | 6.40 | | | | 2.41 | | | | (2.04 | ) |
| Total from Investment Operations | | | (1.67 | ) | | | 1.60 | | | | 6.03 | | | | 2.12 | | | | (2.38 | ) |
| | | | | | | | | | | | | | | | | | | | | |
| Less Distributions | | | | | | | | | | | | | | | | | | | | |
| Net Realized Gains | | | (2.32 | ) | | | (0.71 | ) | | | — | | | | (0.01 | ) | | | (0.25 | ) |
| Total Distributions | | | (2.32 | ) | | | (0.71 | ) | | | — | | | | (0.01 | ) | | | (0.25 | ) |
| | | | | | | | | | | | | | | | | | | | | |
| Capital Contributions | | | | | | | | | | | | | | | | | | | | |
| Redemption Fees | | | — | (a) | | | — | (a) | | | — | (a) | | | — | (a) | | | 0.01 | |
| Total Capital Contributions | | | — | (a) | | | — | (a) | | | — | (a) | | | — | (a) | | | 0.01 | |
| Net Asset Value, End of Year | | $ | 19.56 | | | $ | 23.55 | | | $ | 22.66 | | | $ | 16.63 | | | $ | 14.52 | |
| | | | | | | | | | | | | | | | | | | | | |
| Total Return | | | (7.05 | )% | | | 7.13 | % | | | 36.26 | % | | | 14.61 | % | | | (13.77 | )% |
| Net Assets, End of Year (000’s) | | $ | 50,906 | | | $ | 62,353 | | | $ | 68,470 | | | $ | 66,746 | | | $ | 90,170 | |
| Ratios/Supplemental Data | | | | | | | | | | | | | | | | | | | | |
| Ratio of Total Expenses to Average Net Assets | | | 2.41 | % | | | 2.09 | % | | | 2.07 | % | | | 2.06 | % | | | 1.83 | % |
| Ratio of Total Expenses to Average Net Assets (before interest and dividend expense) | | | 1.93 | % | | | 1.91 | % | | | 1.91 | % | | | 1.89 | % | | | 1.80 | % |
| Ratio of Total Expenses to Average Net Assets (before waiver and reimbursement of expenses) | | | 2.42 | % | | | 2.09 | % | | | 2.07 | % | | | 2.06 | % | | | 1.83 | % |
| Ratio of Net Investment Income (Loss) to Average Net Assets | | | (1.73 | )% | | | (1.60 | )% | | | (1.74 | )% | | | (1.40 | )% | | | (1.62 | )% |
| Ratio of Net Investment Income (Loss) to Average Net Assets (before waivers and reimbursements of expenses) | | | (1.74 | )% | | | (1.60 | )% | | | (1.74 | )% | | | (1.40 | )% | | | (1.62 | )% |
| Portfolio turnover rate | | | 15 | % | | | 19 | % | | | 20 | % | | | 15 | % | | | 45 | % |
| (a) | Value is less than $0.005 per share. |
See accompanying notes to financial statements.
Annual Report 2015
Needham Small Cap Growth Fund
Financial Highlights
| (For a Share Outstanding | | Year Ended December 31, | |
| Throughout each Period) | | 2015 | | | 2014 | | | 2013 | | | 2012 | | | 2011 | |
| Net Asset Value, Beginning of Year | | $ | 14.01 | | | $ | 15.63 | | | $ | 12.22 | | | $ | 11.26 | | | $ | 14.21 | |
| Investment Operations | | | | | | | | | | | | | | | | | | | | |
| Net Investment Loss | | | (0.24 | ) | | | (0.24 | ) | | | (0.31 | ) | | | (0.15 | ) | | | (0.27 | ) |
| Net Realized and Unrealized Gain (Loss) on Investments | | | (1.02 | ) | | | 0.32 | | | | 3.72 | | | | 1.11 | | | | (2.04 | ) |
| Total from Investment Operations | | | (1.26 | ) | | | 0.08 | | | | 3.41 | | | | 0.96 | | | | (2.31 | ) |
| | | | | | | | | | | | | | | | | | | | | |
| Less Distributions | | | | | | | | | | | | | | | | | | | | |
| Net Realized Gains | | | (0.31 | ) | | | (1.70 | ) | | | — | | | | — | | | | (0.62 | ) |
| Return of Capital | | | — | | | | — | | | | — | | | | — | | | | (0.02 | ) |
| Total Distributions | | | (0.31 | ) | | | (1.70 | ) | | | — | | | | — | | | | (0.64 | ) |
| | | | | | | | | | | | | | | | | | | | | |
| Capital Contributions | | | | | | | | | | | | | | | | | | | | |
| Redemption Fees | | | — | (a) | | | — | (a) | | | — | (a) | | | — | (a) | | | — | (a) |
| Total Capital Contributions | | | — | (a) | | | — | (a) | | | — | (a) | | | — | (a) | | | — | (a) |
| Net Asset Value, End of Year | | $ | 12.44 | | | $ | 14.01 | | | $ | 15.63 | | | $ | 12.22 | | | $ | 11.26 | |
| | | | | | | | | | | | | | | | | | | | | |
| Total Return | | | (8.96 | )% | | | 0.80 | % | | | 27.91 | % | | | 8.53 | % | | | (16.10 | )% |
| Net Assets, End of Year (000’s) | | $ | 23,473 | | | $ | 32,116 | | | $ | 43,950 | | | $ | 60,614 | | | $ | 82,675 | |
| Ratios/Supplemental Data | | | | | | | | | | | | | | | | | | | | |
| Ratio of Total Expenses to Average Net Assets | | | 2.05 | % | | | 2.01 | % | | | 2.06 | % | | | 2.04 | % | | | 1.84 | % |
| Ratio of Total Expenses to Average Net Assets (before interest and dividend expense) | | | 1.95 | % | | | 1.95 | % | | | 1.96 | % | | | 1.92 | % | | | 1.81 | % |
| Ratio of Total Expenses to Average Net Assets (before waiver and reimbursement of expenses) | | | 2.25 | % | | | 2.11 | % | | | 2.09 | % | | | 2.04 | % | | | 1.84 | % |
| Ratio of Net Investment Income (Loss) to Average Net Assets | | | (1.61 | )% | | | (1.49 | )% | | | (1.80 | )% | | | (1.02 | )% | | | (1.57 | )% |
| Ratio of Net Investment Income (Loss) to Average Net Assets (before waivers and reimbursements of expenses) | | | (1.81 | )% | | | (1.59 | )% | | | (1.83 | )% | | | (1.02 | )% | | | (1.57 | )% |
| Portfolio turnover rate | | | 64 | % | | | 69 | % | | | 58 | % | | | 72 | % | | | 105 | % |
| (a) | Value is less than $0.005 per share. |
See accompanying notes to financial statements.
Needham Funds
Notes to Financial Statements
Needham Growth Fund (“NGF”), Needham Aggressive Growth Fund (“NAGF”) and Needham Small Cap Growth Fund (“NSCGF”) (each, a “Portfolio” and collectively, the “Portfolios”), are portfolios of The Needham Funds, Inc. (the “Company”), which is registered under the Investment Company Act of 1940, as amended (the “1940 Act”), as a diversified, open-end management investment company. The Company was organized as a Maryland corporation on October 12, 1995.
| 2. | Significant Accounting Policies |
The following is a summary of significant accounting policies followed by the Company in the preparation of its financial statements. These policies are in conformity with accounting principles generally accepted in the United States of America (“GAAP”).
Security Valuation: Portfolio securities for which market quotations are readily available are stated at the last sale price reported by the principal exchange for the security as of the exchange’s close of business. Securities for which no sale has taken place during the day and securities which are not listed on an exchange are valued at the mean of the highest closing bid and lowest asked prices. Exchange traded options are valued at the last reported sale price on any exchange on which the option is principally traded. If no sales are reported on a particular day, the options will be valued at the mean between the highest closing bid and lowest asked prices across the exchanges where the option is traded. Non-exchange traded options will also be valued at the mean between the last bid and asked quotations. For options where market quotations are not readily available, value will be determined in accordance with the fair value procedures described below. All other securities and assets for which (a) market quotations are not readily available, such as in the case of a market or technical disruption that prevents the normal trading of a security held by a Portfolio, (b) market quotations are believed to be unrepresentative of fair market value, such as in the case of a thinly traded security, or (c) valuation is normally made at the last sale price on a foreign exchange and a significant event occurs after the close of that exchange but before the New York Stock Exchange closes, are valued at their fair value as determined in good faith by the Board of Directors (the “Board”) in accordance with Fair Value Procedures established by the Board. The Company’s Fair Value Procedures are implemented and monitored by a Fair Value Committee (the “Committee”) designated by the Board. When a security is valued in accordance with the Fair Value Procedures, the Committee determines a value after taking into consideration any relevant information that is reasonably available to the Committee. Some of the more common reasons that may necessitate that a security be valued pursuant to these Fair Value Procedures include, but are not limited to: the security’s trading has been halted or suspended; the security has been de-listed from a national exchange; the security’s primary trading market is temporarily closed at a time when under normal conditions it would be open; or the security’s primary pricing source is not able or willing to provide a price. The assets of each Portfolio may also be valued on the basis of valuations provided by a pricing service approved by, or on behalf of, the Board.
Portfolio securities listed or traded on securities exchanges, including American Depositary Receipts (“ADRs”), are valued at the closing price on the exchange or system where the security is principally traded or at the NASDAQ Official Closing Price. If there have been no sales for that day on the exchange or system, a security is valued at the mean of the highest closing bid and lowest asked prices on the exchange or system where the security is principally traded.
The Portfolios did not value any securities in accordance with the Fair Value Procedures as of December 31, 2015.
Investment Transactions: Changes in holdings of portfolio securities for the Portfolios shall be reflected no later than in the first calculation on the first business day following the trade date for purposes of calculating each Portfolio’s daily net asset value per share. However, for financial reporting purposes, portfolio security transactions are reported on the trade date of the last business day of the reporting period. The cost (proceeds) of investments sold (bought to cover) is determined on a specific identification basis for the purpose of determining gains or losses on sales and buys to cover short positions. Dividend income, distributions to shareholders and dividend expense from securities sold short are recorded on the ex-dividend date. Interest income and interest expense from securities sold short is recorded on an accrual basis.
Foreign Currency: Foreign currency amounts are translated into U.S. dollars as follows: (i) assets and liabilities at the rate of exchange at the end of the respective period; and (ii) purchases and sales of securities and income and expenses at the rate of exchange prevailing on the dates of such transactions. The portion of realized gains arising from changes in the exchange rates are included with the net realized and unrealized gain or loss on investments. Principal risks associated with such transactions include the
Annual Report 2015
Notes to Financial Statements (Continued)
movement in value of the foreign currency relative to the U.S. dollar and the ability of the counterparty to perform.
The Portfolios may also invest in forward currency contracts. Fluctuations in the value of such forward currency transactions are recorded daily as unrealized gain or loss; realized gain or loss includes net gain or loss on transactions that have terminated by settlement. These instruments involve securities and currency market risk, credit risk, or both kinds of risks, in excess of the amount recognized in the statements of assets and liabilities. Risks also arise from the possible inability of counterparties to meet the terms of their contracts. The Portfolios did not enter into forward currency contracts during the year ended December 31, 2015.
Allocation of Expenses: Expenses directly attributable to a Portfolio are charged directly to that Portfolio, while expenses which are attributable to more than one Portfolio are allocated among the respective Portfolios based upon relative net assets or some other reasonable method.
Use of Estimates: The preparation of financial statements in accordance with GAAP requires management to make estimates and assumptions that affect the reported amounts and disclosures in the financial statements. Actual results could differ from those estimates and those differences could be material.
Distributions to Shareholders: Dividends from net investment income, if any, are declared and paid annually for the Portfolios. Distributable net realized gains, if any, are declared and distributed at least annually.
Redemption Fees: The Portfolios reserve the right to assess a redemption fee for shares held 60 days or less. The shareholder will be charged a fee equal to 2.00% of the value of the shares redeemed. The redemption fee is intended to offset excess brokerage commissions and other costs associated with fluctuations in asset levels and cash flows caused by frequent trading by shareholders. The applicability of the redemption fee will be calculated using a first-in first-out method, which means the oldest shares, will be redeemed first, followed by the redemption of more recently acquired shares. For the year ended December 31, 2015, NGF, NAGF and NSCGF had contributions to capital due to redemption fees in the amounts of $3,397, $1,539 and $120, respectively.
Federal Income Taxes: It is the policy of each Portfolio to continue to qualify as a regulated investment company, as defined in the Internal Revenue Code, by complying with the provisions available to certain investment companies and to make distributions of net investment income and net realized capital gains sufficient to relieve it from all, or substantially all, federal income taxes. Accordingly, no provision for income taxes has been made in the Portfolios’ financial statements.
As of December 31, 2015, the Portfolios did not have any tax positions that did not meet the “more-likely-than-not” threshold of being sustained by the applicable tax authority. Open tax years are those that are open for exam by Federal and state taxing authorities. As of December 31, 2015, open Federal tax years include the tax years ended December 31, 2012 through December 31, 2015, open New York tax years include the tax years ended December 31, 2012 through December 31, 2015. The Portfolios have no tax examinations in progress.
Fair Value Measurements: Valuation inputs used to determine the value of the Portfolios’ investments are summarized in the three broad levels listed below:
| Level 1 — | quoted prices in active markets for identical assets. |
| Level 2 — | other significant inputs (including quoted prices of similar securities, interest rates, prepayment speeds, credit risk, etc.). |
| Level 3 — | significant unobservable inputs (which may include the Portfolios’ own assumptions in determining the fair value of investments). |
The inputs or methodology used to value securities are not necessarily an indication of the risk associated with investing in those securities.
Portfolio securities listed or traded on securities exchanges, including ADRs, are valued at the closing price on the exchange or system where the security is principally traded or at the NASDAQ Official Closing Price. If there have been no sales for that day on the exchange or system, a security is valued at the mean of the highest closing bid and lowest asked prices on the exchange or system where the security is principally traded. These valuations are typically categorized as Level 1 in the fair value hierarchy.
In accordance with procedures adopted by the Board, fair value pricing may be used if events materially affecting the value of foreign securities occur between the time the exchange on which they are traded closes and the time the Portfolios’ net asset values are calculated. These valuations are categorized as Level 2 in the fair value hierarchy. As of December 31, 2015, the Portfolios did not hold any Level 2 or Level 3 securities.
Needham Funds
Notes to Financial Statements (Continued)
The following is a summary categorization, as of December 31, 2015, of each Portfolio’s investments based on the level of inputs utilized in determining the value of such investments:
| | | | LEVEL 1 - Quoted Prices(1)(3) | |
| | | | NGF | | | | NAGF | | | | NSCGF | |
| Assets | | | | | | | | | | | | |
| Common Stocks(2) | | $ | 119,057,335 | | | $ | 50,739,120 | | | $ | 19,181,033 | |
| Short-Term Investments | | | 7,306,182 | | | | 26,486 | | | | 4,514,166 | |
| Liabilities | | | | | | | | | | | | |
| Securities Sold Short(2) | | | (4,943,555 | ) | | | (3,177,382 | ) | | | (821,003 | ) |
| Total | | $ | 121,419,962 | | | $ | 47,588,224 | | | $ | 22,874,196 | |
| (1) | As of December 31, 2015, the Portfolios did not hold Level 2 or Level 3 investments. |
| (2) | Please refer to the Schedule of Investments and Schedule of Securities Sold Short to view segregation by industry. |
| (3) | There were no transfers into or out of Levels 1, 2 or 3 during the period. |
| 3. | Investment Advisory and Administrative Services |
The Company has engaged Needham Investment Management L.L.C. (the “Adviser”) to manage its investments pursuant to an Investment Advisory Agreement. The Company pays the Adviser a fee at the annual rate of 1.25% of the average daily net assets of each Portfolio.
The Adviser has entered into an agreement with the Company (the “Expense Limitation Agreement”) whereby the Adviser has contractually agreed to waive its management fee for, and to reimburse expenses of, NGF, NAGF and NSCGF in an amount that limits annual operating expenses to not more than 1.95% of the average daily net assets of the relevant Portfolio (excluding taxes, interest, brokerage, dividends on short positions, acquired fund fees and expenses and extraordinary items, and excluding shareholder redemption fees but including the management fee stated in the Investment Advisory Agreement). The agreement is effective for the period from May 1, 2015 through April 30, 2016. The agreement shall continue in effect from year to year thereafter only upon mutual agreement of the Company and the Adviser.
Any reimbursements or fee waivers made by the Adviser in respect of a Portfolio are subject to recoupment by the Adviser, to the extent that the Portfolio is able to make the repayment within the expense limitation established in the Expense Limitation Agreement. Under the Expense Limitation Agreement, such recoupments must be made within three years following the fiscal year in which the Adviser reduced its compensation and/or assumed expenses for the applicable Portfolio. The Adviser did not recoup any fees previously waived or reimbursed under the Expense Limitation Agreement during the year ended December 31, 2015. The table below indicates the amount of fees that the Adviser has the potential to recoup:
| | | Recovery Expiring on | |
| | | 4/30/2019 | | | 4/30/2018 | | | 4/30/2017 | | | 4/30/2016 | |
| NGF | | $ | — | | | $ | — | | | $ | — | | | $ | — | |
| NAGF | | | 5,598 | | | | — | | | | — | | | | — | |
| NSCGF | | | 41,639 | | | | 37,932 | | | | 24,636 | | | | 1,464 | |
The Company and U.S. Bancorp Fund Services, LLC (the “Administrator”) are parties to a Fund Administration Servicing Agreement. The Administrator provides administrative and fund accounting services pursuant to this agreement and, in consideration of these services, receives a fee computed daily and paid monthly at an annual rate based on a percentage of the value of each Portfolio’s assets. The Administrator is also compensated for any out of pocket expenses that are reasonably incurred in carrying out its duties under the Administration Agreement. The Administrator also provides transfer agent services pursuant to a Transfer Agent Servicing Agreement for additional fees.
Certain officers of the Company are also officers of the Adviser and/or Needham & Company, LLC (the “Distributor”). Such officers receive no fees from the Company for serving as officers of the Company. Each of the two Directors who is not an “interested person” (as defined in the 1940 Act) of the Company (each, an “Independent Director”) receives a quarterly retainer of $3,000 and a per-meeting fee of $500. Each Independent Director is also a member of the Audit Committee of the Company’s Board of Directors and receives a fee of $500 per meeting attended. The Adviser provides an employee to serve as Chief Compliance Officer for the Company and to provide certain related services. An affiliate of the Adviser, Needham & Company, LLC, pays the Chief Compliance Officer’s compensation and the Company reimburses this affiliate for the Company’s allocated portion of the expense.
The Company has adopted an Amended and Restated Plan of Distribution pursuant to Rule 12b-1 under the 1940 Act. Under the Plan, each Portfolio may pay compensation to the Distributor or any other distributor or financial institution with which the Company has an agreement with respect to each Portfolio, with the amount of such compensation not to exceed an annual rate of 0.25% of each Portfolio’s daily average net assets. For the year ended December 31, 2015, NGF, NAGF and NSCGF paid 12b-1 fees to the Distributor in the amount of $354,571, $146,741 and $70,891, respectively.
Annual Report 2015
Notes to Financial Statements (Continued)
During the year ended December 31, 2015, NGF, NAGF and NSCGF incurred and paid brokerage commissions to the Distributor in the amount of $16,675 $10,299, and $22,748, respectively.
Each Portfolio may borrow from banks up to 25% of its total assets and may pledge its assets in connection with these borrowings, provided that no additional investments shall be made while borrowings exceed 5% of total assets.
The Portfolios did not engage in any temporary borrowings during the year ended December 31, 2015.
| 6. | Short Sale Transactions |
During the year ended December 31, 2015, each Portfolio sold securities short. Upon selling a security short, the Portfolios record an asset for the settlement amount and a corresponding liability, which is marked-to-market to reflect current value. Certain securities owned by each respective Portfolio are segregated as collateral while the short sales are outstanding. At December 31, 2015, the market value of securities separately segregated to cover short positions was $6,079,840, $6,031,110, and $1,135,650 for NGF, NAGF and NSCGF, respectively.
Additionally, the Portfolios had receivables for Deposit with Broker for Securities Sold Short of $5,320,554, $3,308,997, and $986,460 pledged as collateral with a broker in connection with open short positions for NGF, NAGF and NSCGF, respectively. Securities sold short at December 31, 2015 and their related market values and proceeds are set forth in the preceding Schedule of Securities Sold Short for each Portfolio.
| 7. | Investment Transactions |
The following summarizes the aggregate amount of the cost of purchases and proceeds from sales of investment securities and securities sold short, excluding short-term securities, during the year ended December 31, 2015:
| | | Purchases | | | Sales | |
| NGF | | $ | 17,632,374 | | | $ | 29,947,713 | |
| NAGF | | | 9,316,278 | | | | 17,328,756 | |
| NSCGF | | | 16,549,964 | | | | 26,026,309 | |
There were no purchases or sales of U.S. government securities during the year ended December 31, 2015.
| 8. | Financial Instruments With Off-Balance Sheet Risk |
In the normal course of their business, the Portfolios may engage in transactions with off-balance sheet risk, including securities sold short, written options, futures, and forward currency contracts. Transactions in certain financial instruments represent future commitments to purchase or sell other financial instruments at specific terms at specified future dates. Each of these financial instruments contains varying degrees of off-balance sheet risk whereby changes in the market values of the securities underlying the financial instruments may be in excess of the amounts recognized in the financial statements.
Securities sold short represent obligations of the Portfolios to make future delivery of specific securities and, correspondingly, create an obligation to purchase the securities at market prices prevailing at a later delivery date (or to deliver the securities if already owned by the Portfolios). As a result, short sales create the risk that the Portfolios’ ultimate obligation to satisfy the delivery requirements may exceed the amount of the proceeds initially received on the liability recorded in the financial statements.
Under the Company’s organizational documents, its Directors and Officers are indemnified against certain liabilities arising out of the performance of their duties to the Company. In addition, in the ordinary course of business, the Company enters into contracts that contain a variety of indemnifications. The Company’s maximum exposure under these arrangements is unknown. However, the Company has not had prior claims or losses pursuant to these contracts and expects the risk of loss to be remote.
No provision for federal income taxes is required since the Company intends to continue to qualify as a regulated investment company under Subchapter M of the Internal Revenue Code and distribute substantially all of its taxable income and capital gains to shareholders. Because income tax regulations differ from GAAP, the timing and character of income and capital gain distributions determined in accordance with tax regulations can differ from income and capital gains recognized for financial reporting purposes. Accordingly, the character of distributions and the composition of net assets for tax purposes can differ from those reflected in the financial statements. These book/tax differences may be temporary or permanent in nature. Temporary differences are generally due to differing book and tax treatment for the timing of the recognition of gains and losses on securities,
Needham Funds
Notes to Financial Statements (Continued)
including post-October losses (as described below). Permanent differences are generally due to differing treatment of net investment losses. To the extent these differences are permanent, they are charged or credited to paid-in capital, accumulated net realized gain (loss), or accumulated net investment income (loss), as appropriate, in the period in which the differences arise. These reclassifications have no effect on net assets or net asset value per share of each Portfolio.
As of December 31, 2015, the cost, gross unrealized appreciation, gross unrealized depreciation, and the net unrealized appreciation (depreciation) on securities, including proceeds from securities sold short for federal income tax purposes, were as follows:
| | | | | | | | | | | | Net | |
| | | | | | Gross | | | Gross | | | Unrealized | |
| | | | | | Unrealized | | | Unrealized | | | Appreciation | |
| | | Cost | | | Appreciation | | | Depreciation | | | (Depreciation) | |
| NGF | | $ | 66,025,870 | | | $ | 65,528,413 | | | $ | (5,190,766 | ) | | $ | 60,337,647 | |
| NAGF | | | 27,938,076 | | | | 25,344,869 | | | | (2,517,339 | ) | | | 22,827,530 | |
| NSCGF | | | 24,275,835 | | | | 2,429,892 | | | | (3,010,528 | ) | | | (580,636 | ) |
The difference between the tax cost of investments and the cost of investments for GAAP purposes is primarily due to the tax treatment for wash sale losses.
As of December 31, 2015, the components of distributable earnings (loss) on a tax basis were as follows:
| | | NGF | | | NAGF | | | NSCGF | |
| Undistributed ordinary income | | $ | — | | | $ | — | | | $ | — | |
| Undistributed long-term capital gains | | | 3,475,941 | | | | — | | | | — | |
| Unrealized appreciation (depreciation) | | | 60,337,647 | | | | 22,827,530 | | | | (580,636 | ) |
| Other accumulated gains (loss) | | | (331,373) | | | | (163,969) | | | | (35,070 | ) |
| Total accumulated earnings (loss) | | $ | 63,482,215 | | | $ | 22,663,561 | | | $ | (615,706 | ) |
The tax character of distributions paid during the year ended December 31, 2015 was as follows:
| | | NGF | | | NAGF | | | NSCGF | |
| Ordinary income | | $ | — | | | $ | — | | | $ | — | |
| Net long-term capital gains | | | 8,209,695 | | | | 5,612,688 | | | | 606,909 | |
| Return of capital | | | — | | | | — | | | | — | |
| Total distributions paid | | $ | 8,209,695 | | | $ | 5,612,688 | | | $ | 606,909 | |
The tax character of distributions paid during the year ended December 31, 2014 was as follows:
| | | NGF | | | NAGF | | | NSCGF | |
| Ordinary income | | $ | — | | | $ | — | | | $ | 39,890 | |
| Net long-term capital gains | | | 9,182,355 | | | | 1,796,420 | | | | 2,470,645 | |
| Distribution in excess for required excise distribution | | | — | | | | 56,369 | | | | 1,132,201 | |
| Total distributions paid | | $ | 9,182,355 | | | $ | 1,852,789 | | | $ | 3,642,736 | |
Under current tax law, capital and currency losses realized after October 31 of a Portfolio’s fiscal year may be deferred and treated as occurring on the first business day of the following fiscal year for tax purposes. The following Portfolios had deferred post-October capital and currency losses, which will be treated as arising on the first business day of the year ended December 31, 2015.
| | NGF | | $ | — | |
| | NAGF | | | 18,456 | |
| | NSCGF | | | 1,895 | |
As of December 31, 2015 none of the Portfolios had accumulated capital loss carryovers.
| 11. | New Accounting Pronouncements |
In May 2015, the Financial Accounting Standards Board (“FASB”) issued Accounting Standards Update (“ASU”) No. 2015-07 “Disclosure for Investments in Certain Entities that Calculate Net Asset Value per Share (or Its Equivalent)”. The amendments in ASU No. 2015-07 remove the requirement to categorize within the fair value hierarchy investments measured using the NAV practical expedient. The ASU also removes certain disclosure requirements for investments that qualify, but do not utilize, the NAV practical expedient. The amendments in the ASU are effective for fiscal years beginning after December 15, 2015, and interim periods within those fiscal years. Management is currently evaluating the impact these changes will have on the Portfolios’ financial statements and related disclosures.
Management has evaluated subsequent events through the date of this filing. This evaluation did not result in any subsequent events that necessitated recognition or disclosures.
Annual Report 2015
Report of Independent Registered Public Accounting Firm
The Board of Directors and Shareholders
The Needham Funds, Inc.:
We have audited the accompanying statements of assets and liabilities of the Needham Growth Fund, Needham Aggressive Growth Fund and Needham Small Cap Growth Fund, each a “Portfolio” of The Needham Funds, Inc. (collectively, the “Portfolios”), including the schedules of investments and schedules of securities sold short, as of December 31, 2015, and the related statements of operations for the year then ended, the statements of changes in net assets for each of the years in the two-year period then ended, and the financial highlights for each of the years in the five-year period then ended. These financial statements and financial highlights are the responsibility of the Portfolios’ management. Our responsibility is to express an opinion on these financial statements and financial highlights based on our audits.
We conducted our audits in accordance with the standards of the Public Company Accounting Oversight Board (United States). Those standards require that we plan and perform the audit to obtain reasonable assurance about whether the financial statements and financial highlights are free of material misstatement. An audit includes examining, on a test basis, evidence supporting the amounts and disclosures in the financial statements. Our procedures included confirmation of securities owned as of December 31, 2015, by correspondence with the custodians and brokers or by other appropriate auditing procedures. An audit also includes assessing the accounting principles used and significant estimates made by management, as well as evaluating the overall financial statement presentation. We believe that our audits provide a reasonable basis for our opinion.
In our opinion, the financial statements and financial highlights referred to above present fairly, in all material respects, the financial position of Needham Growth Fund, Needham Aggressive Growth Fund and Needham Small Cap Growth Fund as of December 31, 2015, the results of their operations for the year then ended, the changes in their net assets for each of the years in the two-year period then ended, and the financial highlights for each of the years in the five-year period then ended, in conformity with U.S. generally accepted accounting principles.
New York, New York
February 26, 2016
Needham Funds
Information about Directors and Officers (Unaudited)
December 31, 2015
Information pertaining to the Directors and Officers of the Company is set forth below. The Statement of Additional Information (SAI) includes additional information about the Directors and is available without charge, upon request, by calling 800-625-7071.
The address of each individual is 445 Park Avenue, New York, NY 10022-2606. Each Director serves until the next annual shareholders meeting or until his successor is elected and qualified.
| | Term of Office | Portfolios in the | |
| | and Length of | Fund Complex | Principal Occupations(s) |
| Name, Age and Position | Term Served by | Overseen by | During Past 5 Years and Other |
| with the Company | Director/Officer | Director/Officer | Directorships Held by Director/Officer |
| Independent Directors |
| John W. Larson, 80, Director | Indefinite; Since 2006 | Three | Partner at the law firm of Morgan, Lewis & Bockius LLP from 2003 until retiring in December 2009. Partner at the law firm of Brobeck, Phleger & Harrison LLP from 1969 until retiring in January 2003. From July 1971 to September 1973 worked in government service as Assistant Secretary of the United States Department of the Interior and Counselor to George P. Schultz, Chairman of the Cost of Living Council. Director of Wage Works, Inc. (an employee benefits company) since 2000. Director of Sangamo BioSciences, Inc. since 1996. |
| F. Randall Smith, 77, Director | Indefinite; Since 1996 | Three | Founder and Chief Executive and Investment Officer of Capital Counsel LLC (a registered investment adviser) since September 1999. Co-founder and Managing Partner of Train, Smith Counsel (a registered investment adviser) from 1975 to 1999. |
| Interested Director |
| George A. Needham*, 72, Chairman, President and Director | Indefinite; Since 1996 | Three | Chairman of the Board and Chief Executive Officer of The Needham Group, Inc. and Needham Holdings, LLC since December 2004. Chairman of the Board and Chief Executive Officer of Needham Asset Management, LLC since April 2006. Chairman of the Board from 1996 to December 2004 and Chief Executive Officer from 1985 to December 2004 of Needham & Company, LLC. |
| Officers |
| John Barr, 59, Executive Vice President and Co-Portfolio Manager of the Needham Growth Fund, Executive Vice President and Portfolio Manager of the Needham Aggressive Growth Fund. | One year; Since 2010 | Two | Portfolio Manager of Needham Asset Management since 2010. Founding and Managing Member of Oliver Investment Management, LLC from 2008 to 2009. Manager and Analyst at Buckingham Capital from 2002 to 2008. Managing Director and a Senior Analyst at Robertson Stephens following semiconductor companies from 2000 to 2002. From 1995 to 2000, Managing Director and Senior Analyst at Needham and Company, also served as Director of Research. Director of Coventor, Inc. since 2009. |
| Chris Retzler, 44, Executive Vice President and Co-Portfolio Manager of the Needham Growth Fund, Executive Vice President and Portfolio Manager of the Needham Small Cap Growth Fund. | One year; Since 2008 | Two | Portfolio Manager of Needham Asset Management, LLC since 2008. Vice President of Needham Asset Management, LLC since 2005. Head of Winterkorn, a healthcare manufacturing and distribution company, from 2002 to 2005. |
| James W. Giangrasso, 53, Chief Financial Officer, Treasurer and Secretary | One year; Since 2011 | Three | Chief Financial Officer of Needham Asset Management, LLC since 2011. Principal and Controller of Needham Asset Management, LLC since 2006. |
| James M. Abbruzzese, 46, Chief Compliance Officer | One year; Since 2004 | Three | Chief Compliance Officer of Needham Asset Management, LLC since April 2006 and Chief Compliance Officer and Managing Director of Needham & Company, LLC since July 1998. |
| * | An “interested person”, as defined in the 1940 Act, of the Company or the Company’s investment adviser. Mr. Needham is deemed to be an interested person because of his affiliation with the Portfolios’ Adviser and the Portfolios’ Distributor, and because he is an officer of the Company. |
Annual Report 2015
Supplementary Information (Unaudited)
December 31, 2015
Federal Income Tax Information
During the year ended December 31, 2015, NGF, NAGF and NSCGF declared and paid long-term realized gains distributions in the amounts of $8,209,695, $5,612,688 and $606,909 respectively.
For the year ended December 31, 2015, NGF, NAGF, and NSCGF did not declare any ordinary income distributions.
For the fiscal year ended December 31, 2015, certain dividends paid by the Portfolios may be subject to a maximum tax rate of 15%. The percentage of dividends declared from ordinary income reported as qualified dividend income was as follows:
| NGF | | | 0.00 | % |
| NAGF | | | 0.00 | % |
| NSCGF | | | 0.00 | % |
For corporate shareholders, the percent of ordinary income distributions qualifying for the corporate dividends received deduction for the fiscal year ended December 31, 2015 was as follows:
| NGF | | | 0.00 | % |
| NAGF | | | 0.00 | % |
| NSCGF | | | 0.00 | % |
Privacy Policy
It is the policy of the Company to keep personally identifiable financial information about you as an individual (“nonpublic personal information”) confidential, and use or disclose it only as necessary to provide services to you or the Company or as otherwise required or permitted by law. We may collect the following nonpublic personal information about you:
| • | Information we receive from you on or in applications or other forms, correspondence, or conversations, including, but not limited to, your name, address, phone number, social security number, assets, income and date of birth; and |
| • | Information about your transactions with us, our affiliates, or others, including, but not limited to, your account number and balance, payments history, parties to transactions, cost basis information, other financial information and information about how you vote your shares. |
We disclose nonpublic personal information about current and former shareholders to companies that provide necessary services to the Company. These companies include the transfer agent, distributor, administrator and investment adviser as well as other affiliates of the Company. We maintain physical, electronic and procedural safeguards that comply with federal standards to guard your nonpublic personal information and restrict access to this information to those persons who need it to provide services to you or the Company or who are otherwise permitted by law to receive it. In the event that you hold any shares of our funds through a financial intermediary, including, but not limited to, a broker-dealer, bank, or trust company, the privacy policy of your financial intermediary governs how your nonpublic personal information is shared with nonaffiliated third parties.
If you have any questions concerning the Company’s Privacy Policy, please call 1-800-625-7071.
Disclosure of Portfolio Holdings
The Company files a Form N-Q with the Securities and Exchange Commission (the “SEC”) no more than sixty days after the Company’s first and third fiscal quarters. For the Company, this would be for the fiscal quarters ending March 31 and September 30. Form N-Q includes a complete schedule of the Company’s portfolio holdings as of the end of those fiscal quarters. The Company’s N-Q filings can be found free of charge on the SEC’s website at http://www.sec.gov, or they may be reviewed and copied at the SEC’s Public Reference Room in Washington, D.C. (call 800-SEC-0330 for information on the operation of the Public Reference Room). copied at the SEC’s Public Reference Room in Washington, D.C. (call 800-SEC-0330 for information on the operation of the Public Reference Room).
Voting Proxies on Company Portfolio Securities
A description of the policies and procedures that the Company uses to determine how to vote proxies relating to portfolio securities and information regarding how the Company voted proxies relating to portfolio securities during the most recent 12-month period ended June 30 are available without charge, upon request, by calling 800-625-7071 or on the SEC’s website at http://www.sec.gov.
Household Delivery of Shareholder Documents
To reduce expenses, the Company may mail only one copy of the Portfolios’ prospectuses, proxy statements, information statements, and each annual and semi-annual report to those addresses shared by two or more accounts. If you wish to receive individual copies of these documents, please call the Portfolios at 1-800-625-7071 or contact your financial institution. You will begin receiving individual copies thirty days after receiving your request.
Needham Funds
Supplementary Information (Unaudited) (Continued)
December 31, 2015
Board Consideration and Approval of Investment Advisory Agreemen
On October 29, 2015, at a meeting called for the purpose of voting on such approval, the Board, including all of the Independent Directors, approved the continuance of the Investment Advisory Agreement (the “Advisory Agreement”) between the Company and the Adviser with respect to NGF, NAGF and NSCGF. In doing so, the Board reviewed materials provided by the Adviser to assist them in making a determination (the “Board Materials”). The Independent Directors were assisted in their review by independent legal counsel and met with counsel in executive session separate from representatives of the Adviser. In considering the renewal of the Advisory Agreement, the Board considered the nature, extent, and quality of the services to be provided by the Adviser; the investment performance of each Portfolio and the Adviser; the costs of the services to be provided and profits to be realized by the Adviser and its affiliates from the relationship with each Portfolio; the extent to which economies of scale would be realized as the Portfolios grow; and whether fee levels reflect these economies of scale for the benefit of investors.
The Directors stated that their consideration of the continuance of the Advisory Agreement included consideration of the peer-group comparisons in the Board Materials, noting that NGF’s performance was above its peer group average and median performance for the three-year and since inception periods and above the average and median performance of the relevant Morningstar Universes for the since inception period. For NAGF, the Directors noted that the Portfolio’s performance was above the peer group average and median performance for the ten-year period and above the average and median performance of the relevant Morningstar Universes for the ten-year and since inception periods. For NSCGF, the Directors noted that the Portfolio’s performance was below the peer group average and median performance and the average and median performance of the relevant Morningstar Universes for the various periods, except the Portfolio’s performance was above the average and median performance of the relevant Morningstar Universes since inception. It was further noted that the Portfolios’ performance compared well to the longer term performance of their respective benchmark indices. In addition to reviewing each Portfolio’s performance and the profitability analysis of the Adviser, the Directors considered possible economies of scale, but did not believe material economies of scale to be present in light of the Portfolios’ asset size and growth trends.
In their deliberations, the Directors considered all factors they believed relevant, including the following: information comparing the performance of each of the Portfolios to other investment companies with similar investment objectives and to each Portfolio’s respective unmanaged index; the nature, extent and quality of services rendered by the Adviser; the costs borne by, and profitability of, and other benefits to, the Adviser and its affiliates in providing services to each Portfolio; comparative fee and expense data for each Portfolio and other investment companies with similar investment objectives (having been advised that the Adviser does not manage other accounts with investment objectives and strategies similar to those of the Portfolios except private investment funds with fee structures that include performance fees); whether expenses of NGF, NAGF and NSCGF might be expected to decline as a percentage of net assets as NGF, NAGF and NSCGF assets increase (although there had not been a significant increase in assets over the previous year); the professional experience and qualifications of each Portfolio’s management team and other personnel of the Adviser, including the fact that a high caliber of personnel was both needed and provided to meet the needs of NGF, NAGF and NSCGF specifically with respect to investments in securities sold short; and the terms of the Advisory Agreement. The Independent Directors confirmed that they had received adequate information to make a reasonable determination with respect to the approval of the Advisory Agreement. After full consideration of all the foregoing factors, the Board determined to approve the renewal of the Advisory Agreement.
Item 2. Code of Ethics.
The registrant has adopted a code of ethics that applies to the registrant’s principal executive officer and principal financial officer. The registrant has not made amendments to its code of ethics during the period covered by this report. The registrant has not granted any waivers from any provisions of the code of ethics during the period covered by this report.
A copy of the registrant’s Code of Ethics is filed herewith.
Item 3. Audit Committee Financial Expert.
The registrant’s board of directors has determined that there is at least one audit committee financial expert serving on its audit committee. F. Randall Smith is the “audit committee financial expert” and is considered to be “independent” as each term is defined in Item 3 of Form N-CSR.
Item 4. Principal Accountant Fees and Services.
The registrant has engaged its principal accountant to perform audit services, audit-related services, tax services and other services during the past two fiscal years. “Audit services” refer to performing an audit of the registrant's annual financial statements or services that are normally provided by the accountant in connection with statutory and regulatory filings or engagements for those fiscal years. “Audit-related services” refer to the assurance and related services by the principal accountant that are reasonably related to the performance of the audit. “Tax services” refer to professional services rendered by the principal accountant for tax compliance, tax advice, and tax planning. “Other services” provided by the principal accountant were not applicable. The following table details the aggregate fees billed or expected to be billed for each of the last two fiscal years for audit fees, audit-related fees, tax fees and other fees by the principal accountant.
| | FYE 12/31/2015 | FYE 12/31/2014 |
| Audit Fees | $68,800 | $65,800 |
| Audit-Related Fees | $ 0 | $ 0 |
| Tax Fees | $20,475 | $19,875 |
| All Other Fees | $ 0 | $ 0 |
The audit committee has adopted pre-approval policies and procedures that require the audit committee to pre-approve all audit and non-audit services of the registrant, including services provided to any entity affiliated with the registrant.
The percentage of fees billed by KPMG LLP applicable to non-audit services pursuant to waiver of pre-approval requirement were as follows:
| | FYE 12/31/2015 | FYE 12/31/2014 |
| Audit-Related Fees | 0% | 0% |
| Tax Fees | 0% | 0% |
| All Other Fees | 0% | 0% |
All of the principal accountant’s hours spent on auditing the registrant’s financial statements were attributed to work performed by full-time permanent employees of the principal accountant.
The following table indicates the non-audit fees billed or expected to be billed by the registrant’s accountant for services to the registrant and to the registrant’s investment adviser (and any other controlling entity, etc.—not sub-adviser) for the last two years. The audit committee of the board of trustees/directors has considered whether the provision of non-audit services that were rendered to the registrant's investment adviser is compatible with maintaining the principal accountant's independence and has concluded that the provision of such non-audit services by the accountant has not compromised the accountant’s independence.
| Non-Audit Related Fees | FYE 12/31/2015 | FYE 12/31/2014 |
| Registrant | $ 0 | $ 0 |
| Registrant’s Investment Adviser | $7,400 | $7,000 |
Item 5. Audit Committee of Listed Registrants.
Not applicable to registrants who are not listed issuers (as defined in Rule 10A-3 under the Securities Exchange Act of 1934).
Item 6. Investments.
| (a) | Schedule of Investments is included as part of the report to shareholders filed under Item 1 of this Form. |
Item 7. Disclosure of Proxy Voting Policies and Procedures for Closed-End Management Investment Companies.
Not applicable to open-end investment companies.
Item 8. Portfolio Managers of Closed-End Management Investment Companies.
Not applicable to open-end investment companies.
Item 9. Purchases of Equity Securities by Closed-End Management Investment Company and Affiliated Purchasers.
Not applicable to open-end investment companies.
Item 10. Submission of Matters to a Vote of Security Holders.
Not Applicable.
Item 11. Controls and Procedures.
| (a) | The Registrant’s Chief Executive Officer and Chief Financial Officer have reviewed the Registrant's disclosure controls and procedures (as defined in Rule 30a-3(c) under the Investment Company Act of 1940 (the “Act”)) as of a date within 90 days of the filing of this report, as required by Rule 30a-3(b) under the Act and Rules 13a-15(b) or 15d-15(b) under the Securities Exchange Act of 1934. Based on their review, such officers have concluded that the disclosure controls and procedures are effective in ensuring that information required to be disclosed in this report is appropriately recorded, processed, summarized and reported and made known to them by others within the Registrant and by the Registrant’s service provider. |
| (b) | There were no changes in the Registrant's internal control over financial reporting (as defined in Rule 30a-3(d) under the Act) that occurred during the Registrant’s first fiscal half-year of the period covered by this report that has materially affected, or is reasonably likely to materially affect, the Registrant's internal control over financial reporting. |
Item 12. Exhibits.
| (a) | (1) Any code of ethics or amendment thereto, that is the subject of the disclosure required by Item 2, to the extent that the registrant intends to satisfy Item 2 requirements through filing an exhibit. Filed herewith. |
(2) A separate certification for each principal executive and principal financial officer pursuant to Section 302 of the Sarbanes-Oxley Act of 2002. Filed herewith.
(3) Any written solicitation to purchase securities under Rule 23c-1 under the Act sent or given during the period covered by the report by or on behalf of the registrant to 10 or more persons. Not applicable to open-end investment companies.
| (b) | Certifications pursuant to Section 906 of the Sarbanes-Oxley Act of 2002. Furnished herewith. |
SIGNATURES
Pursuant to the requirements of the Securities Exchange Act of 1934 and the Investment Company Act of 1940, the registrant has duly caused this report to be signed on its behalf by the undersigned, thereunto duly authorized.
(Registrant) The Needham Funds, Inc.
By (Signature and Title) /s/ George A. Needham
George A. Needham, President (Chief Executive Officer)
Date 03/07/2016
Pursuant to the requirements of the Securities Exchange Act of 1934 and the Investment Company Act of 1940, this report has been signed below by the following persons on behalf of the registrant and in the capacities and on the dates indicated.
By (Signature and Title) /s/ George A. Needham
George A. Needham, President (Chief Executive Officer)
Date 03/07/2016
By (Signature and Title) /s/ James W. Giangrasso
James W. Giangrasso, Treasurer and Secretary (Chief Financial Officer)
Date 03/07/2016