As filed with the Securities and Exchange Commission on March 11, 2013
UNITED STATES
SECURITIES AND EXCHANGE COMMISSION
Washington, D.C. 20549
FORM N-CSR
CERTIFIED SHAREHOLDER REPORT OF REGISTERED
MANAGEMENT INVESTMENT COMPANIES
Investment Company Act file number 811-09114
The Needham Funds, Inc.
(Exact name of registrant as specified in charter)
445 Park Avenue, New York, NY 10022-2606
(Address of principal executive offices) (Zip code)
Mr. George A. Needham, 445 Park Avenue, New York, NY 10022-2606
(Name and address of agent for service)
1-800-625-7071
Registrant's telephone number, including area code
Date of fiscal year end: December 31, 2012
Date of reporting period: December 31, 2012
Item 1. Reports to Stockholders.
| | | |
| | | |
| | | |
| | | |
| | | |
| | | |
| | | |
| | Annual | |
| | Report | |
| | | |
| | Needham Funds | |
| | | |
| | | |
| | Seeking to build wealth for long-term investors. | |
| | | |
| | | |
| | | |
| | | |
| | | |
| | December 31, 2012 | |
| | | |
| | | |
| | | |
| | | |
| | Needham Growth Fund | |
| | | |
| | | |
| | | |
| | | |
| | Needham Aggressive Growth Fund | |
| | | |
| | | |
| | | |
| | | |
| | Needham Small Cap Growth Fund | |
| | | |
| | | |
| | | |
| | | |
| | | |
| |  | |
| | www.needhamfunds.com | |
| | | |
| | | |
| | | |
 | |
| 445 Park Avenue | |
| New York, New York 10022-2606 | |
| | |
| 1-800-625-7071 | |
| www.needhamfunds.com | |
| | |
| Annual Report | |
| December 31, 2012 | |
| | |
| Contents | |
| | |
| Letter from the Adviser | 1 |
| Portfolio Characteristics | |
| Needham Growth Fund | 5 |
| Needham Aggressive Growth Fund | 6 |
| Needham Small Cap Growth Fund | 7 |
| Disclosure of Fund Expenses | 8 |
| Schedules of Investments | |
| Needham Growth Fund | 9 |
| Needham Aggressive Growth Fund | 12 |
| Needham Small Cap Growth Fund | 15 |
| Schedules of Securities Sold Short | |
| Needham Growth Fund | 11 |
| Needham Aggressive Growth Fund | 14 |
| Needham Small Cap Growth Fund | 17 |
| Statements of Assets and Liabilities | 18 |
| Statements of Operations | 19 |
| Statements of Changes in Net Assets | 20 |
| Financial Highlights | |
| Needham Growth Fund | 21 |
| Needham Aggressive Growth Fund | 22 |
| Needham Small Cap Growth Fund | 23 |
| Notes to Financial Statements | 24 |
Report of Independent Registered Public
Accounting Firm | 30 |
| Information about Directors and Officers | 31 |
Supplementary Information
and Privacy Policy | 32 |
This report is authorized for distribution to prospective investors only when preceded or accompanied by a current prospectus. The prospectus contains more complete information, including investment objectives, risks, expenses and charges and should be read carefully before investing or sending any money. To obtain a prospectus or summary prospectus, please call 1-800-625-7071.
Portfolios of The Needham Funds, Inc., like all mutual funds:
| | ● | Are NOT FDIC insured |
| | ● | Have no bank guarantee |
| | ● | May lose value |
The Needham Funds, Inc. are distributed by Needham & Company, LLC.
| Needham Funds | Annual Report 2012 |
| | 445 Park Avenue |
February 2013
Dear Shareholders, Friends of Needham and Prospective Shareholders,
We are pleased to report results for the fourth quarter of 2012 and for the year 2012 for the Needham Growth Fund, Needham Aggressive Growth Fund and Needham Small Cap Growth Fund.
Needham Funds’ Fourth Quarter and Full-Year 2012 Overview
The equity markets and The Needham Funds provided mixed results in the fourth quarter. The Needham Growth Fund and Needham Aggressive Growth Fund were up 1.0%, while the Needham Small Cap Growth Fund was down 2.6%. The S&P 500 Total Return Index was down 0.4%, the NASDAQ Composite was down 2.5%, and the Russell 2000 Total Return Index was up 1.9%. The funds and indices were down in October as the markets suffered prior to the election. We saw mostly gains of up to 4% each month in November and December.
For the year, NEEGX was up 12.9%, NEAGX was up 14.6%, and NESGX was up 8.5%. The S&P 500 was up 16.0%, the NASDAQ was up 17.8%, and the Russell 2000 was up 16.3%. 2012 started with the best first quarter since 1998 for the Dow Jones Industrial Average and the S&P 500. The second quarter brought a pullback as the economy slowed and the European debt situation deteriorated. The funds and markets appreciated in the third quarter as the Federal Reserve announced its QE-3 program and the ECB announced its commitment to ‘‘do whatever it takes to preserve the Euro.’’
Patience Rewarded in 2012
Our winners across the three funds for 2012 and for the fourth quarter included a number of long-term holdings such as Seagate Technology (STX), Akamai Technologies (AKAM), Gilead Sciences (GILD), CarMax (KMX), Express Scripts (ESRX), Varian Medical (VAR) and Thermo Fisher Scientific (TMO). Additionally, some of our top contributors were small caps. We’d like to highlight two of them.
PDF Solutions (PDFS, +97.7% in 2012) was a major contributor across all three funds. For the quarter ending June 30, PDF announced $8.7 million of gain-share revenue, up from $3-4 million per quarter in 2011. This higher level of revenue was a result of major customers manufacturing more semiconductors using processes that PDF developed. NESGX began purchasing the stock in 2008, when the company’s market capitalization was under $50 million, and NEEGX and NEAGX began buying PDFS in 2010, when its market capitalization was still below $150 million. PDF Solutions’ market capitalization is currently over $400 million. It is still followed by just one sell-side analyst. Our patience was rewarded.
SoundBite Communications (SDBT, +50.7% in 2012) was another top contributor in the fourth quarter and 2012. It is a micro-cap, special situation stock that we’ve known since 2007, and it has been in the portfolios since 2008. SoundBite provides hosted customer communications services, primarily automated calling and texting. Its customers include leading financial institutions, consumer packaged goods companies like Proctor & Gamble and retailers such as Lane Bryant. Jim Milton has been CEO for three years. He has positioned the company in the marketing space, achieved profitability and is seeing strong organic growth from its interactive mobile marketing offering. We note that Mr. Milton has had great success running larger companies. He sold his previous company, Intervoice, which had revenues over $200 million, to Convergys for $335 million in 2008.
SoundBite is valued at just 0.6x enterprise value to run-rate revenues and has a $50 million market capitalization. In September, SoundBite received its first analyst coverage in years. Again, this is a company where our patience was rewarded.
Opportunity in 2013
We believe there are significant opportunities in underfollowed and undiscovered small-cap stocks. As the small-capitalization asset class continues to be exited by investors, we are finding great value opportunities for the patient investor. Trading volumes in many of our holdings are low, therefore significant trading discipline is required.
Morningstar’s website shows valuation and growth metrics comparing our portfolios with the S&P. Our portfolio stocks have superior historical earnings growth, sales growth, cash flow growth and book value growth. They are valued at a discount on forward-looking price-to-book, price-to-sales and price-to-cash flow. Our stocks trade at a premium price-to-forward-looking earnings ratio. We believe that all of these valuation parameters should be considered when purchasing growth equities.
A few of our companies suffered in 2012; however, we believe they are well positioned for 2013. These companies include Super Micro Computer (SMCI), FormFactor (FORM), Brightcove (BCOV), TTM Technologies (TTMI) and UltraClean Holdings (UCTT). These companies are each bringing new products or services to market. Patience has been required of these investments. However, when small-cap stocks turn up, the turn can be quick. In hopes of dampening the volatility in these small-cap stocks, we increased the large-cap holdings in the Needham Growth Fund and Needham Aggressive Growth Fund during 2012.
Our largest detractor across the three funds for 2012 was Super Micro Computer (SMCI, -34.9% in 2012). Super Micro supplies high-performance, lower priced servers and storage systems to the enterprise market. Super Micro announced disappointing earnings for the June quarter due to weak enterprise spending, and depressed margins due to ramifications from the hard disk drive shortage. On October 9, Super Micro announced that for the third-consecutive quarter, it suffered from declining gross margins of 13%.
We believe 2012 represented a trough in gross margins for Super Micro, as it began shipping its higher-priced drive inventory. Gross margin troughs have marked lows in Super Micro’s stock in the past. On January 23, Super Micro announced fourth quarter results with gross margins of 13.8% and the stock rose 18.6% on that news. We believe that Super Micro is well positioned for margin improvement as enterprise spending recovers and the company increases utilization of its Taiwan manufacturing facility.
Sometimes, our small-cap positions don’t work and we exit or reduce our positions. Mercury Systems (MRCY, -30.8% in 2012) was also a large detractor across the three funds in 2012. Mercury suffered due to the depressed defense spending environment. We also believe Mercury overpaid for its acquisition of Micronetics and thus we reduced our positions.
Needham Growth Fund
The Needham Growth Fund was up 1.0% for the fourth quarter and 12.8% for 2012.
The top contributor, by far, in the fourth quarter was used car retailer CarMax (KMX, +32.7% in 4Q12), which finished the year as the third largest position in the fund. CarMax has been in the fund since 2007. In late December 2012, the company reported same-store sales of +12%. CarMax has just 119 stores and a nationwide opportunity—it should be able to grow to be a much larger company.
The top detractor in the fourth quarter was our largest position at 10.3% of net assets, Express Scripts (ESRX, -13.8% in 4Q12). After its October quarterly conference call, ESRX fell as it announced that due to the economy, it was not confident of the growth in 2013. Despite the fourth quarter, Express was one of the top contributors for the year. The fund has owned Express Scripts since 2006 and it’s been a ten-bagger stock.
For 2012, the largest contributor was hard-disk drive manufacturer Seagate Technology. During the fourth quarter, we reduced our position in Seagate from 3.9% to 1.9% over concern about the future of the PC market and as STX achieved our price target.
Some of the small-cap positions were primary detractors, including Super Micro Computer, Electro Scientific Industries (ESIO), and QuinStreet (QNST). We remain optimistic about these stocks, although they certainly tested our patience in 2012.
Needham Aggressive Growth Fund
The Needham Aggressive Growth Fund was up 1.0% in the fourth quarter and 14.6% for 2012. In the fourth quarter, SoundBite Communications was the top contributor and the fund added to its position during the quarter. Due to appreciation and additional purchases, SoundBite ended December as a top 10 position at 3.1% of net assets, up from 1.1% on September 30.
The top detractor during the fourth quarter was Apple (AAPL). We note that Apple has been in the Needham Aggressive Growth Fund since 2006, and it was up over 32% for 2012. Other detractors in the fourth quarter were Entropic Communications (ENTR) and FormFactor—both are examples of positions requiring patience.
Needham Small Cap Growth Fund
The Needham Small Cap Growth Fund was down 2.6% in the fourth quarter and was up 8.5% for 2012. The fund carried defensive cash and short positions and ended the year with 12.9% cash and 7.8% short, changed from 8.4% cash and 15.1% short at the beginning of the quarter.
The major contributor for the quarter was AVG Technologies N.V. (AVG, +64.9% in 4Q12), which had been a detractor in the previous quarters. AVG finally renewed its agreement with Google, which had been an overhang on the stock. The new agreement allows AVG to expand its relationship with other Internet search vendors, which it previously had not been able to do. AVG is an example of patience rewarded and we will monitor their ability to achieve the expected growth rates post contract signing.
For the year, the major contributors were Seagate Technology, American Eagle Outfitters (AEO), and PDF Solutions. The fund exited these positions during the quarter as price targets were achieved.
The largest detractor during the fourth quarter was MaxLinear (MXL, -25.0%). The company warned of an inventory correction in the first quarter of 2013; however, the primary opportunity is its sales into the rapidly growing satellite television market. We are encouraged by the increased discussion of the home gateways and the requirement for an increase in the number of tuners required in televisions and digital video recorders. MaxLinear is a clear example of a story that requires patience but has many great fundamental opportunities ahead. Overall in 2012, MaxLinear was a leading contributor, up 49.4% in the third quarter.
Other fourth quarter detractors included QuinStreet, FormFactor and Super Micro Computer. Consistent with our strategy of patience with these small-cap holdings, we look for positive results in 2013. In 2012, Super Micro, Allscripts Healthcare Solutions (MDRX) and QuinStreet were the major detractors.
2012 was a year of investment in growth and restructuring for many of our small-cap technology holdings. With a slow growth macroeconomic backdrop and volatile news coming out of Europe and Washington, D.C., our company stock prices struggled throughout the year. Although we would have liked to see better stock performance in 2012, we remain confident that the management teams of our portfolio holdings have their businesses on the right path for 2013 and beyond—most have now better positioned their fundamental growth stories and financial health.
Market Commentary
As we have said for many quarters, much of today’s equity movements continue to be a result of the market’s liquidity programs from the U.S. Federal Reserve and its international counterparts.
Following in the ways of the July statement from Prime Minister Draghi of the European Central Bank, in November, Japan’s Prime Minister Shinzo Abe called for both “unlimited easing” to attain 2-3% inflation and for direct purchases of government bonds by the Bank of Japan. On January 22, the Bank of Japan voted for a 2% inflation target and $145 billion per month of securities purchasing to begin in January 2014. Prime Minister Abe will use political pressure to move that date forward.
After its meeting on December 11-12, the U.S. Federal Reserve announced that beginning January 2013, the Open Market Trading Desk is directed to purchase longer-term Treasury securities at a pace of about $45 billion per month. The Desk is also authorized to continue purchasing agency mortgage-backed securities at a pace of about $40 billion per month, until unemployment drops to normal ranges.
The monetary authorities believe that these programs will provide economic stimulus. They also hope to weaken their currencies to promote economic activity. However, as the new year-end tax law brings higher taxes for 2013, we expect GDP growth to be moderate. We believe that equity prices will benefit from the continued liquidity.
Small and mid-cap stocks continue to see extremely low trading volumes, even after the summer slowdown. Domestic equity mutual funds have been under siege with significant daily outflows, with perhaps temporary reprieve in January, that are being reallocated into other investment classes such as fixed income. While we, as long-term investors, do not enjoy the current market volatility and thin trading environment, we also believe that incredible investing opportunities are being created when investor outflows are greatest. We see many great companies trading at book value or lower and whose stock prices are caught in the outflow of capital from the equity markets. Many companies have hit air pockets as inventory builds have stalled ahead of the uncertainties. Our long-term investment themes remain in place, and we expect the slowdowns to be temporary.
As we have previously written, in an era of managed, low interest rates, we believe that growth equities have a role to play in a portfolio. Growth companies are managed by smart entrepreneurs always looking for ways to improve earnings and cash generation. Bonds are at an all-time low yield and are subject to the risk of higher interest rates. We continue to find and own stocks within our growth universes that are attractively valued and should benefit us in 2013.
The Growth Factor
We have been writing periodic investment commentary, The Growth Factor, which can be found at www.needhamfunds.com. So far in 2013, we have issued the fourth and fifth installments of The Growth Factor. The Growth Factor Vol. 4 was a review of Peter Lynch’s One Up on Wall Street and reviews our belief that individual investing and finding “ten-bagger stocks” is just as possible today as it was in 1990. The Growth Factor Vol. 5 was our preview of the 15th Annual Needham Growth Conference. At the Needham Growth Conference, our team had over 100 meetings with companies in the portfolios, prospective investments and companies that supply to or compete with our companies. The Growth Factor Vol. 6 will discuss our view of dividends and how they contribute to the Needham Funds. If you would like to receive The Growth Factor via email, please visit www.needhamfunds.com to sign up.
Closing
We remain positive on our strategy of investing in companies that we know well and that we believe are positioned with secular growth drivers. We welcome our new investors and thank all of our investors for their continued support. If you have any questions, thoughts or concerns, please contact us at (800) 625-7071 or send us an email at cretzler@needhamco.com or jbarr@needhamco.com. For information about the funds, please visit our website at www.needhamfunds.com.
Sincerely,
| | |
 |  |
| Chris Retzler | John O. Barr |
| Portfolio Manager | Portfolio Manager |
| NEEDHAM GROWTH FUND | TICKER: NEEGX |
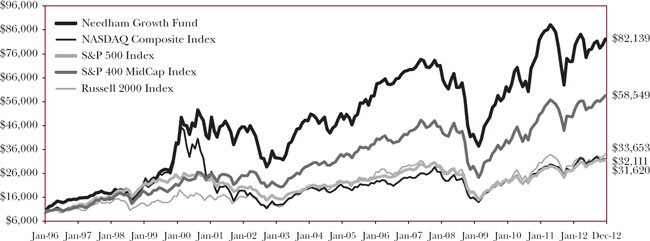
Comparative Performance Statistics as of December 31, 2012 (Unaudited)
| | | | | 6 Months(7) | | 1 Year | | 3 Years(8) | | 5 Years(8) | | 10 Years(8) | | Since Inception(8)(12) | | Gross Expense Ratio(14) | |
| | Needham Growth Fund(1) | | 5.80 | % | | 12.80 | % | | 9.69 | %(9) | | 2.93 | %(10) | | 9.68 | %(11) | | 13.19 | %(13) | | 1.82 | % | |
| | S&P 500 Index(2)(3) | | 5.95 | % | | 16.00 | % | | 10.87 | % | | 1.66 | % | | 7.10 | % | | 7.01 | % | | | | |
| | NASDAQ Composite Index(2)(4) | | 3.91 | % | | 17.75 | % | | 11.33 | % | | 3.78 | % | | 9.46 | % | | 7.10 | % | | | | |
| | S&P 400 MidCap Index(2)(5) | | 9.25 | % | | 17.88 | % | | 13.62 | % | | 5.15 | % | | 10.53 | % | | 10.96 | % | | | | |
| | Russell 2000 Index(2)(6) | | 7.20 | % | | 16.35 | % | | 12.25 | % | | 3.56 | % | | 9.72 | % | | 7.40 | % | | | | |
| | | | | | | | | | | | | | | | | | | | | | | | | |
| | Past performance does not guarantee future results. The performance data quoted represents past performance, and current returns may be lower or higher. The investment return and net asset value will fluctuate so that an investor’s shares, when redeemed, may be worth more or less than the original cost. To obtain performance information current to the most recent month-end, please call 1-800-625-7071. The returns shown in the above table and accompanying footnotes are net of expenses. The table above does not reflect the deduction of taxes that a shareholder would have paid on Fund distributions or on the redemption of Fund shares. | |
| | 1. | Investment results calculated after reinvestment of dividends. | |
| | 2. | It is not possible to invest directly in an index. The performance of the index does not include the deduction of expenses associated with a mutual fund, such as investment management fees. | |
| | 3. | The S&P 500 Index is a broad unmanaged measure of the U.S. stock market. | |
| | 4. | The NASDAQ Composite Index is a broad-based capitalization-weighted index of all NASDAQ Global Market and Small Cap stocks. | |
| | 5. | The S&P 400 MidCap Index is a broad unmanaged measure of the U.S. stock market. | |
| | 6. | The Russell 2000 Index is a broad unmanaged index composed of the smallest 2,000 companies in the Russell 3000 Index. | |
| | 7. | Not annualized. | |
| | 8. | Compound annual growth rate (annualized return). Assumes all dividends were reinvested in shares of the Fund. | |
| | 9. | Cumulative return for the three year period was 31.98%, assuming all dividends were reinvested in shares of the Fund. | |
| | 10. | Cumulative return for the five year period was 15.51%, assuming all dividends were reinvested in shares of the Fund. | |
| | 11. | Cumulative return for the ten year period was 151.87%, assuming all dividends were reinvested in shares of the Fund. | |
| | 12. | The inception date of the Fund was 1/1/96. | |
| | 13. | Cumulative return since inception was 721.39%, assuming all dividends were reinvested in shares of the Fund. | |
| | 14. | Gross expense ratio is from the Fund’s prospectus dated May 1, 2012. Additional information pertaining to the Fund’s expense ratios as of December 31, 2012 can be found in the financial highlights. Since January 1, 2009, the investment performance reflects contractually agreed upon fee waivers which expire at the close of business on May 1, 2013. Without these fee waivers, the performance would have been lower. Excluding the indirect costs of investing in acquired funds, total net fund operating expenses would be 1.81%. | |
| | Top Ten Holdings* (as a % of total investments, as of December 31, 2012) | | | | Sector Weightings* (as a % of total investments, as of December 31, 2012) | |
| | | | | Security | | | | | % of Total Investments† | | | | | | Sector | | | Long(1) | | (Short)(1) | | Total(1)(2) | |
| | 1) | | Express Scripts Holding Co. | | ESRX | | 10.31 | % | | | | Consumer Discretionary | | 8.9 | % | | — | | | 8.9 | % | |
| | 2) | | Thermo Fisher Scientific, Inc. | | TMO | | 7.00 | % | | | | Energy | | 4.0 | % | | — | | | 4.0 | % | |
| | 3) | | CarMax, Inc. | | KMX | | 5.55 | % | | | | Exchange Traded Funds | | — | | | (1.7 | )% | | (1.7 | )% | |
| | 4) | | Gilead Sciences, Inc. | | GILD | | 4.91 | % | | | | Financials | | 2.9 | % | | — | | | 2.9 | % | |
| | 5) | | ViaSat, Inc. | | VSAT | | 4.45 | % | | | | Health Care | | 29.6 | % | | — | | | 29.6 | % | |
| | 6) | | PDF Solutions, Inc. | | PDFS | | 3.56 | % | | | | Industrials | | 4.1 | % | | (0.4 | )% | | 3.7 | % | |
| | 7) | | Becton Dickinson and Co. | | BDX | | 3.43 | % | | | | Information Technology | | 47.7 | % | | (5.1 | )% | | 42.6 | % | |
| | 8) | | Entropic Communications, Inc. | | ENTR | | 3.31 | % | | | | Materials | | 0.4 | % | | — | | | 0.4 | % | |
| | 9) | | Super Micro Computer, Inc. | | SMCI | | 3.03 | % | | | | Cash | | 9.6 | % | | — | | | 9.6 | % | |
| | 10) | | Emulex Corp. | | ELX | | 3.00 | % | | | | * | Current portfolio holdings may not be indicative of future portfolio holdings. | |
| | Top Ten Holdings = 48.55% of Total Investments† | | | | | | | (1) | Percentage of total investments includes all stocks, plus cash minus all short positions. | |
| | * | | Current portfolio holdings may not be indicative of future portfolio holdings. | | | | (2) | Total represents the difference between the long exposure and the short exposure, which produces the net exposure. | |
| | † | | Percentage of total investments less cash. | | | | | |
Comparison of Change in Value of a $10,000 Investment
Past performance does not guarantee future results. The performance data quoted represents past performance, and current returns may be lower or higher. The investment return and net asset value will fluctuate so that an investor’s shares, when redeemed, may be worth more or less than the original cost. To obtain performance information current to the most recent month-end, please call 1-800-625-7071. The graph above does not reflect the deduction of taxes that a shareholder would have paid on Fund distributions or on the redemption of Fund shares. Since inception, the Fund’s adviser has absorbed certain expenses of the Fund, without which returns would have been lower.
The Global Industry Classification Standard (GICS®) was developed by and/or is the exclusive property of MSCI, Inc. and Standard & Poor Financial Services LLC (“S&P”). GICS is a service mark of MSCI and S&P and has been licensed for use by U.S. Bancorp Fund Services, LLC.
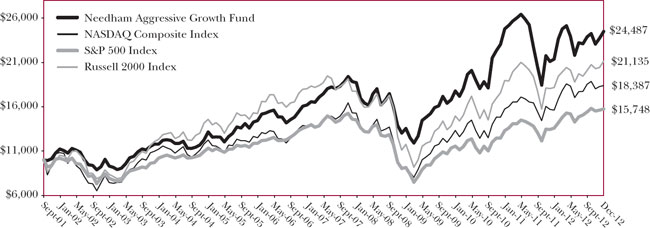
| NEEDHAM AGGRESSIVE GROWTH FUND | TICKER: NEAGX |
Comparative Performance Statistics as of December 31, 2012 (Unaudited)
| | | | | 6 Months(6) | | 1 Year | | 3 Years(7) | | 5 Years(7) | | 10 Years(7) | | Since Inception(7)(11) | | Gross Expense Ratio(13) | |
| | Needham Aggressive Growth Fund(1) | | 5.52 | % | | 14.61 | % | | 11.28 | %(8) | | 5.52 | %(9) | | 10.16 | %(10) | | 8.23 | %(12) | | 1.85 | % | |
| | S&P 500 Index(2)(3) | | 5.95 | % | | 16.00 | % | | 10.87 | % | | 1.66 | % | | 7.10 | % | | 4.09 | % | | | | |
| | NASDAQ Composite Index(2)(4) | | 3.91 | % | | 17.75 | % | | 11.33 | % | | 3.78 | % | | 9.46 | % | | 5.52 | % | | | | |
| | Russell 2000 Index (2)(5) | | 7.20 | % | | 16.35 | % | | 12.25 | % | | 3.56 | % | | 9.72 | % | | 6.83 | % | | | | |
| | | | | | | | | | | | | | | | | | | | | | | | | |
| | Past performance does not guarantee future results. The performance data quoted represents past performance, and current returns may be lower or higher. The investment return and net asset value will fluctuate so that an investor’s shares, when redeemed, may be worth more or less than the original cost. To obtain performance information current to the most recent month-end, please call 1-800-625-7071. The returns shown in the above table and accompanying footnotes are net of expenses. The table above does not reflect the deduction of taxes that a shareholder would have paid on Fund distributions or on the redemption of Fund shares. | |
| | 1. | Investment results calculated after reinvestment of dividends. | |
| | 2. | It is not possible to invest directly in an index. The performance of the index does not include the deduction of expenses associated with a mutual fund, such as investment management fees. | |
| | 3. | The S&P 500 Index is a broad unmanaged measure of the U.S. stock market. | |
| | 4. | The NASDAQ Composite Index is a broad-based capitalization-weighted index of all NASDAQ Global Market and Small Cap stocks. | |
| | 5. | The Russell 2000 Index is a broad unmanaged index composed of the smallest 2,000 companies in the Russell 3000 Index. | |
| | 6. | Not annualized. | |
| | 7. | Compound annual growth rate (annualized return). Assumes all dividends were reinvested in shares of the Fund. | |
| | 8. | Cumulative return for the three year period was 37.78%, assuming all dividends were reinvested in shares of the Fund. | |
| | 9. | Cumulative return for the five year period was 30.85%, assuming all dividends were reinvested in shares of the Fund. | |
| | 10. | Cumulative return for the ten year period was 163.18%, assuming all dividends were reinvested in shares of the Fund. | |
| | 11. | The inception date of the Fund was 9/4/2001. | |
| | 12. | Cumulative return since inception was 144.87% assuming all dividends were reinvested in shares of the Fund. | |
| | 13. | Gross expense ratio is from the Fund’s prospectus dated May 1, 2012. Additional information pertaining to the Fund’s expense ratios as of December 31, 2012 can be found in the financial highlights. Since inception, the investment performance reflects contractually agreed upon fee waivers which expire at the close of business on May 1, 2013. Without these fee waivers, the performance would have been lower. Excluding the indirect costs of investing in acquired funds, total net fund operating expenses would be 1.83%. | |
| | Top Ten Holdings* (as a % of total investments, as of December 31, 2012) | | | | Sector Weightings* (as a % of total investments, as of December 31, 2012) | |
| | | | | Security | | | | | % of Total Investments† | | | | | | Sector | | | Long(1) | | (Short)(1) | | Total(1)(2) | |
| | 1) | | Akamai Technologies, Inc. | | AKAM | | 10.45 | % | | | | Consumer Discretionary | | 3.0 | % | | (0.2 | )% | | 2.8 | % | |
| | 2) | | PDF Solutions, Inc. | | PDFS | | 10.18 | % | | | | Consumer Staples | | 0.1 | % | | — | | | 0.1 | % | |
| | 3) | | Entropic Communications, Inc. | | ENTR | | 6.21 | % | | | | Energy | | 3.7 | % | | — | | | 3.7 | % | |
| | 4) | | Gilead Sciences, Inc. | | GILD | | 5.58 | % | | | | Exchange Traded Funds | | — | | | (0.5 | )% | | (0.5 | )% | |
| | 5) | | Apple, Inc. | | AAPL | | 4.33 | % | | | | Financials | | 3.3 | % | | — | | | 3.3 | % | |
| | 6) | | Financial Engines, Inc. | | FNGN | | 3.12 | % | | | | Health Care | | 11.3 | % | | (0.1 | )% | | 11.2 | % | |
| | 7) | | Soundbite Communications, Inc. | | SDBT | | 3.09 | % | | | | Industrials | | 3.0 | % | | (0.6 | )% | | 2.4 | % | |
| | 8) | | Jabil Circuit, Inc. | | JBL | | 3.08 | % | | | | Information Technology | | 79.5 | % | | (4.4 | )% | | 75.1 | % | |
| | 9) | | Anaren, Inc. | | ANEN | | 2.71 | % | | | | Materials | | 0.5 | % | | (0.2 | )% | | 0.3 | % | |
| | 10) | | Entegris, Inc. | | ENTG | | 2.58 | % | | | | Cash | | 1.6 | % | | — | | | 1.6 | % | |
| | Top Ten Holdings = 51.33% of Total Investments† | | | | * | Current portfolio holdings may not be indicative of future portfolio holdings. | |
| | * | | Current portfolio holdings may not be indicative of future portfolio holdings. | | | | (1) | Percentage of total investments includes all stocks, plus cash minus all short positions. | |
| | † | | Percentage of total investments less cash. | | | | (2) | Total represents the difference between the long exposure and the short exposure, which produces the net exposure. | |
Comparison of Change in Value of a $10,000 Investment
Past performance does not guarantee future results. The performance data quoted represents past performance, and current returns may be lower or higher. The investment return and net asset value will fluctuate so that an investor’s shares, when redeemed, may be worth more or less than the original cost. To obtain performance information current to the most recent month-end, please call 1-800-625-7071. The graph above does not reflect the deduction of taxes that a shareholder would have paid on Fund distributions or on the redemption of Fund shares. Since inception, the Fund’s adviser has absorbed certain expenses of the Fund, without which returns would have been lower.
The Global Industry Classification Standard (GICS®) was developed by and/or is the exclusive property of MSCI, Inc. and Standard & Poor Financial Services LLC (“S&P”). GICS is a service mark of MSCI and S&P and has been licensed for use by U.S. Bancorp Fund Services, LLC.
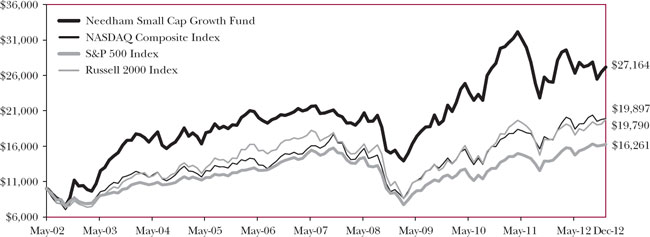
| NEEDHAM SMALL CAP GROWTH FUND | TICKER: NESGX |
Comparative Performance Statistics as of December 31, 2012 (Unaudited)
| | | | | 6 Months(6) | | 1 Year | | 3 Years(7) | | 5 Years(7) | | 10 Years(7) | | Since Inception(7)(11) | | Gross Expense Ratio(13) | |
| | Needham Small Cap Growth Fund(1) | | -2.40 | % | | 8.53 | % | | 7.62 | %(8) | | 6.15 | %(9) | | 10.10 | %(10) | | 9.88 | %(12) | | 1.86 | % | |
| | S&P 500 Index(2)(3) | | 5.95 | % | | 16.00 | % | | 10.87 | % | | 1.66 | % | | 7.10 | % | | 4.69 | % | | | | |
| | NASDAQ Composite Index(2)(4) | | 3.91 | % | | 17.75 | % | | 11.33 | % | | 3.78 | % | | 9.46 | % | | 6.69 | % | | | | |
| | Russell 2000 Index(2)(5) | | 7.20 | % | | 16.35 | % | | 12.25 | % | | 3.56 | % | | 9.72 | % | | 6.64 | % | | | | |
| | | | | | | | | | | | | | | | | | | | | | | | | |
| | Past performance does not guarantee future results. The performance data quoted represents past performance, and current returns may be lower or higher. The investment return and net asset value will fluctuate so that an investor’s shares, when redeemed, may be worth more or less than the original cost. To obtain performance information current to the most recent month-end, please call 1-800-625-7071. The returns shown in the above table and accompanying footnotes are net of expenses. The table above does not reflect the deduction of taxes that a shareholder would have paid on Fund distributions or on the redemption of Fund shares. | |
| | 1. | Investment results calculated after reinvestment of dividends. | |
| | 2. | It is not possible to invest directly in an index. The performance of the index does not include the deduction of expenses associated with a mutual fund, such as investment management fees. | |
| | 3. | The S&P 500 Index is a broad unmanaged measure of the U.S. stock market. | |
| | 4. | The NASDAQ Composite Index is a broad-based capitalization-weighted index of all NASDAQ Global Market and Small Cap stocks. | |
| | 5. | The Russell 2000 Index is a broad unmanaged index composed of the smallest 2,000 companies in the Russell 3000 Index. | |
| | 6. | Not annualized. | |
| | 7. | Compound annual growth rate (annualized return). Assumes all dividends were reinvested in shares of the Fund. | |
| | 8. | Cumulative return for the three year period was 24.65%, assuming all dividends were reinvested in shares of the Fund. | |
| | 9. | Cumulative return for the five year period was 34.76%, assuming all dividends were reinvested in shares of the Fund. | |
| | 10. | Cumulative return for the ten year period was 161.70%, assuming all dividends were reinvested in shares of the Fund. | |
| | 11. | The inception date of the Fund was 5/22/02. | |
| | 12. | Cumulative return since inception was 171.64%, assuming all dividends were reinvested in shares of the Fund. | |
| | 13. | Gross expense ratio is from the Fund’s prospectus dated May 1, 2012. Additional information pertaining to the Fund’s expense ratios as of December 31, 2012 can be found in the financial highlights. Since inception, the investment performance reflects contractually agreed upon fee waivers which expire at the close of business on May 1, 2013. Without these fee waivers, the performance would have been lower. Excluding the indirect costs of investing in acquired funds, total net fund operating expenses would be 1.84%. | |
| | Top Ten Holdings* (as a % of total investments, as of December 31, 2012) | | | | Sector Weightings* (as a % of total investments, as of December 31, 2012) | |
| | | | | Security | | | | | % of Total Investments† | | | | | | Sector | | | Long(1) | | (Short)(1) | | Total(1)(2) | |
| | 1) | | Emulex Corp. | | ELX | | 7.93 | % | | | | Consumer Discretionary | | 6.5 | % | | — | | | 6.5 | % | |
| | 2) | | TTM Technologies, Inc. | | TTMI | | 6.78 | % | | | | Energy | | 5.3 | % | | — | | | 5.3 | % | |
| | 3) | | Super Micro Computer, Inc. | | SMCI | | 5.99 | % | | | | Exchange Traded Funds | | — | | | (2.8 | ) | | (2.8 | )% | |
| | 4) | | Anaren, Inc. | | ANEN | | 5.51 | % | | | | Financials | | 0.4 | % | | — | | | 0.4 | % | |
| | 5) | | FormFactor, Inc. | | FORM | | 5.17 | % | | | | Health Care | | 6.4 | % | | (0.1 | ) | | 6.3 | % | |
| | 6) | | Entropic Communications, Inc. | | ENTR | | 4.75 | % | | | | Industrials | | 5.3 | % | | (0.7 | ) | | 4.6 | % | |
| | 7) | | Electro Scientific Industries, Inc. | | ESIO | | 4.70 | % | | | | Information Technology | | 69.7 | % | | (4.2 | ) | | 65.5 | % | |
| | 8) | | Aeropostale, Inc. | | ARO | | 4.24 | % | | | | Materials | | 1.3 | % | | — | | | 1.3 | % | |
| | 9) | | Ultra Clean Holdings | | UCTT | | 4.03 | % | | | | Cash | | 12.9 | % | | — | | | 12.9 | % | |
| | 10) | | Vishay Intertechnology, Inc. | | VSH | | 3.71 | % | | | | * | Current portfolio holdings may not be indicative of future portfolio holdings. | |
| | Top Ten Holdings = 52.81% of Total Investments† | | | | | | | (1) | Percentage of total investments includes all stocks, plus cash minus all short positions. | |
| | * | | Current portfolio holdings may not be indicative of future portfolio holdings. | | | | (2) | Total represents the difference between the long exposure and the short exposure, which produces the net exposure. | |
| | † | | Percentage of total investments less cash. | | | | | |
Comparison of Change in Value of a $10,000 Investment
Past performance does not guarantee future results. The performance data quoted represents past performance, and current returns may be lower or higher. The investment return and net asset value will fluctuate so that an investor’s shares, when redeemed, may be worth more or less than the original cost. To obtain performance information current to the most recent month-end, please call 1-800-625-7071. The graph above does not reflect the deduction of taxes that a shareholder would have paid on Fund distributions or on the redemption of Fund shares. Since inception, the Fund’s adviser has absorbed certain expenses of the Fund, without which returns would have been lower.
The Global Industry Classification Standard (GICS®) was developed by and/or is the exclusive property of MSCI, Inc. and Standard & Poor Financial Services LLC (“S&P”). GICS is a service mark of MSCI and S&P and has been licensed for use by U.S. Bancorp Fund Services, LLC.
Disclosure of Fund Expenses (Unaudited)
The following expense table is shown so that you can understand the impact of fees on your investment. All mutual funds have operating expenses. As a shareholder of the Fund, you incur transactional costs, including redemption fees and exchange fees, and ongoing costs, which include costs for portfolio management, administrative services, and shareholder reports, among others. A Fund’s expenses are expressed as a percentage of its average net assets. This figure is known as the expense ratio. The following examples are intended to help you understand the ongoing costs (in dollars) of investing in each fund and to compare these costs with those of other mutual funds. The examples are based on an investment of $1,000 made at the beginning of the period shown and held for the entire period.
The expense example table below illustrates your fund’s cost in two ways:
| ● | Actual Expenses. This section helps you to estimate the actual expenses after fee waivers that you paid over the period. The ‘‘Ending Account Value’’ shown is derived from the Fund’s actual return, and ‘‘Expenses Paid During Period’’ shows the dollar amount that would have been paid by an investor who started with $1,000 in the Fund. You may use the information here, together with the amount you invested, to estimate the expenses that you paid over the period. To do so, simply divide your account value by $1,000 (for example, an $8,600 account value divided by $1,000 = 8.6), then multiply the result by the number given for your fund under the heading entitled ‘‘Expenses Paid During Period’’. |
| ● | Hypothetical Expenses on a 5% Return. This section is intended to help you compare your Fund’s costs with those of other mutual funds. It assumes that the Fund had a return of 5% before expenses during the period shown, but that the expense ratio is unchanged. In this case, because the return used is not the Fund’s actual return, the results do not apply to your investment. The example is useful in making comparisons because the Securities and Exchange Commission requires all mutual funds to calculate expenses based on a 5% return. You can assess your Fund’s cost by comparing this hypothetical example with the hypothetical examples that appear in shareholders reports of other funds. |
Please note that the expenses shown in the table are meant to highlight your ongoing costs only and do not reflect any transactional costs, such as redemption fees or exchange fees. Therefore, the table is useful in comparing ongoing costs only, and will not help you determine the relative total costs of owning different funds. In addition, if these transactional costs were included, your costs would have been higher.
For the Period July 1, 2012 to December 31, 2012
Expense Example Table
| | | | | | | | | | | | | |
| | | Beginning Account Value 7/1/12 | | | Ending Account Value 12/31/12 | | | Expenses Paid During Period* 7/1/12 – 12/31/12 | | | Expense Ratio During Period* 7/1/12 – 12/31/12 | |
| Needham Growth Fund | | | | | | | | | | | | |
| Actual Expenses | | $ | 1,000.00 | | | $ | 1,058.60 | | | $ | 10.30 | | | | 1.99 | % |
Hypothetical Example for Comparison Purposes
(5% return before expenses) | | $ | 1,000.00 | | | $ | 1,015.13 | | | $ | 10.08 | | | | 1.99 | % |
| | | | | | | | | | | | | | | | | |
| Needham Aggressive Growth Fund | | | | | | | | | | | | | | | | |
| Actual Expenses | | $ | 1,000.00 | | | $ | 1,055.20 | | | $ | 10.69 | | | | 2.07 | % |
Hypothetical Example for Comparison Purposes
(5% return before expenses) | | $ | 1,000.00 | | | $ | 1,014.73 | | | $ | 10.48 | | | | 2.07 | % |
| | | | | | | | | | | | | | | | | |
| Needham Small Cap Growth Fund | | | | | | | | | | | | | | | | |
| Actual Expenses | | $ | 1,000.00 | | | $ | 976.00 | | | $ | 10.43 | | | | 2.10 | % |
Hypothetical Example for Comparison Purposes
(5% return before expenses) | | $ | 1,000.00 | | | $ | 1,014.58 | | | $ | 10.63 | | | | 2.10 | % |
* Expenses are equal to the average account value times the Fund’s annualized expense ratio multiplied by the number of days in the most recent fiscal half-year divided by the number of days in the fiscal year. |
Needham Growth Fund
Schedule of Investments
December 31, 2012
| | | | Shares | | | | Fair Value | |
| Common Stocks (92.3%) | | | | | | | | |
| | | | | | | | | |
| Aerospace & Defense (1.9%) | | | | | | | | |
| Honeywell International, Inc. | | | 20,000 | | | $ | 1,269,400 | |
| Sypris Solutions, Inc. | | | 225,000 | | | | 891,000 | |
| | | | | | | | 2,160,400 | |
| | | | | | | | | |
| Biotechnology (4.5%) | | | | | | | | |
| Gilead Sciences, Inc.* | | | 70,000 | | | | 5,141,500 | |
| | | | | | | | | |
| Capital Markets (2.8%) | | | | | | | | |
| Financial Engines, Inc.* | | | 80,000 | | | | 2,220,000 | |
| Oaktree Capital Group LLC | | | 20,000 | | | | 909,800 | |
| | | | | | | | 3,129,800 | |
| | | | | | | | | |
| Communications Equipment (9.5%) | | | | | | | | |
| Anaren, Inc.* | | | 100,000 | | | | 1,945,000 | |
| Emulex Corp.* | | | 430,000 | | | | 3,139,000 | |
| Finisar Corp.* | | | 45,000 | | | | 733,500 | |
| QUALCOMM, Inc. | | | 5,000 | | | | 310,100 | |
| ViaSat, Inc.* | | | 120,000 | | | | 4,668,000 | |
| | | | | | | | 10,795,600 | |
| | | | | | | | | |
| Computers & Peripherals (6.1%) | | | | | | | | |
| Electronics for Imaging, Inc.* | | | 86,250 | | | | 1,637,888 | |
| Seagate Technology PLC | | | 70,000 | | | | 2,133,600 | |
| Super Micro Computer, Inc.* | | | 311,000 | | | | 3,172,200 | |
| | | | | | | | 6,943,688 | |
| | | | | | | | | |
| Electrical Equipment (1.4%) | | | | | | | | |
| II-VI, Inc.* | | | 88,200 | | | | 1,611,414 | |
| | | | | | | | | |
| Electronic Equipment, Instruments & Components (8.5%) | | | | | | | | |
| Corning, Inc. | | | 35,000 | | | | 441,700 | |
| Electro Scientific Industries, Inc. | | | 270,000 | | | | 2,686,500 | |
| Jabil Circuit, Inc.† | | | 150,000 | | | | 2,893,500 | |
| Newport Corp.* | | | 125,000 | | | | 1,681,250 | |
| Vishay Intertechnology, Inc.* | | | 185,000 | | | | 1,966,550 | |
| | | | | | | | 9,669,500 | |
| | | | | | | | | |
| Energy Equipment & Services (1.4%) | | | | | | | | |
| Halliburton Co. | | | 5,000 | | | | 173,450 | |
| National Oilwell Varco, Inc. | | | 10,000 | | | | 683,500 | |
| Schlumberger Ltd. | | | 11,000 | | | | 762,190 | |
| | | | | | | | 1,619,140 | |
| | | | | | | | | |
| Health Care Equipment & Supplies (7.5%) | | | | | | | | |
| Becton Dickinson and Co. | | | 46,000 | | | | 3,596,740 | |
| CONMED Corp. | | | 50,000 | | | | 1,397,500 | |
| Covidien PLC | | | 30,000 | | | | 1,732,200 | |
| Varian Medical Systems, Inc.* | | | 25,000 | | | | 1,756,000 | |
| | | | | | | | 8,482,440 | |
| | | | | | | | | |
| Health Care Providers & Services (9.5%) | | | | | | | | |
| Express Scripts Holding Co.*† | | | 200,000 | | | | 10,800,000 | |
| | | | | | | | | |
| Internet Software & Services (3.8%) | | | | | | | | |
| Akamai Technologies, Inc.* | | | 55,000 | | | | 2,250,050 | |
| Brightcove, Inc.* | | | 54,600 | | | | 493,584 | |
| QuinStreet, Inc.* | | | 155,000 | | | | 1,041,600 | |
| Soundbite Communications, Inc.* | | | 200,000 | | | | 572,000 | |
| | | | | | | | 4,357,234 | |
| | | | | | | | | |
| Life Sciences Tools & Services (6.5%) | | | | | | | | |
| Thermo Fisher Scientific, Inc.† | | | 115,000 | | | | 7,334,700 | |
| | | | | | | | | |
| Media (2.0%) | | | | | | | | |
| Comcast Corp. | | | 60,000 | | | | 2,242,800 | |
| | | | | | | | | |
| Metals & Mining (0.4%) | | | | | | | | |
| Walter Energy, Inc. | | | 11,000 | | | | 394,680 | |
| | | | | | | | | |
| Oil, Gas & Consumable Fuels (2.3%) | | | | | | | | |
| Hess Corp. | | | 50,000 | | | | 2,648,000 | |
| | | | | | | | | |
| Professional Services (0.6%) | | | | | | | | |
| WageWorks, Inc.* | | | 35,000 | | | | 623,000 | |
| | | | | | | | | |
| Semiconductors & Semiconductor Equipment (15.3%) | | | | | | | | |
| Brooks Automation, Inc. | | | 300,000 | | | | 2,415,000 | |
| Entegris, Inc.* | | | 210,000 | | | | 1,927,800 | |
| Entropic Communications, Inc.* | | | 655,000 | | | | 3,464,950 | |
| FormFactor, Inc.* | | | 420,000 | | | | 1,915,200 | |
| MKS Instruments, Inc. | | | 67,500 | | | | 1,740,150 | |
| Nova Measuring Instruments Ltd.* | | | 167,500 | | | | 1,336,650 | |
| PDF Solutions, Inc.* | | | 270,500 | | | | 3,727,490 | |
| TriQuint Semiconductor, Inc.* | | | 107,500 | | | | 520,300 | |
| Ultra Clean Holdings* | | | 75,000 | | | | 368,250 | |
| | | | | | | | 17,415,790 | |
| | | | | | | | | |
| Software (1.9%) | | | | | | | | |
| AVG Technologies NV* | | | 132,500 | | | | 2,097,475 | |
| | | | | | | | | |
| Specialty Retail (6.5%) | | | | | | | | |
| CarMax, Inc.* | | | 155,000 | | | | 5,818,700 | |
| Dick’s Sporting Goods, Inc.† | | | 30,000 | | | | 1,364,700 | |
| Tiffany & Co. | | | 2,500 | | | | 143,350 | |
| | | | | | | | 7,326,750 | |
| | | | | | | | | |
| Total Common Stocks | | | | | | | | |
| (Cost $70,530,849) | | | | | | | 104,793,911 | |
See accompanying notes to financial statements.
Needham Growth Fund
Schedule of Investments (Continued)
December 31, 2012
| | | | | | | | | |
| | | | Shares | | | Fair Value | |
| Short-Term Investment (9.1%) | | | | | | | | |
| | | | | | | | | |
| Money Market Fund (9.1%) | | | | | | | | |
Dreyfus Treasury Prime Cash
Management 0.00% (a)
(Cost $10,361,879) | | | 10,361,879 | | | $ | 10,361,879 | |
| | | | | | | | | |
| Total Investments (101.4%) | | | | | | | | |
| (Cost $80,892,728) | | | | | | | 115,155,790 | |
| Total Securities Sold Short (-6.8%) | | | | | | | | |
| (Proceeds $6,822,850) | | | | | | | (7,666,669 | ) |
Other Assets in Excess
of Liabilities (5.4%) | | | | | | | 6,072,059 | |
| | | | | | | | | |
| Net Assets (100.0%) | | | | | | $ | 113,561,180 | |
| * | Non-income producing security. |
| | |
| (a) | Rate shown is the seven day yield as of December 31, 2012 and is less than 0.01%. |
| | |
| † | Security position is either entirely or partially held in a segregated account as collateral for securities sold short, aggregating a total market value of $4,623,400. |
| | |
| | The Global Industry Classification Standard (GICS®) was developed by and/or is the exclusive property of MSCI, Inc. and Standard & Poor’s Financial Services LLC (“S&P”). GICS is a service mark of MSCI and S&P and has been licensed for use by U.S. Bancorp Fund Services, LLC. |
See accompanying notes to financial statements.
Needham Growth Fund
Schedule of Securities Sold Short
December 31, 2012
| | | | | | | | | |
| | | | Shares | | | Fair Value | |
| Securities Sold Short (-5.2%) | | | | | | | | |
| | | | | | | | | |
| Airlines (-0.3%) | | | | | | | | |
| Allegiant Travel Co.* | | | 5,000 | | | $ | 367,050 | |
| | | | | | | | | |
| Health Care Technology (0.0%) | | | | | | | | |
| Medidata Solutions, Inc.* | | | 788 | | | | 30,882 | |
| | | | | | | | | |
| Internet Software & Services (-0.4%) | | | | | | | | |
| SPS Commerce, Inc.* | | | 12,500 | | | | 465,875 | |
| | | | | | | | | |
| Semiconductors & Semiconductor Equipment (-2.8%) | | | | | | | | |
| Advanced Energy Industries, Inc.* | | | 37,500 | | | | 517,875 | |
| EZchip Semiconductor Ltd.* | | | 17,500 | | | | 578,725 | |
| Hittite Microwave Corp.* | | | 25,000 | | | | 1,552,500 | |
| Microsemi Corp.* | | | 8,550 | | | | 179,892 | |
| Rudolph Technologies, Inc.* | | | 25,000 | | | | 336,250 | |
| | | | | | | | 3,165,242 | |
| | | | | | | | | |
| Software (-1.6%) | | | | | | | | |
| ANSYS, Inc.* | | | 27,500 | | | | 1,851,850 | |
| | | | | | | | | |
| Total Securities Sold Short | | | | | | | | |
| (Proceeds $5,106,270) | | | | | | | 5,880,899 | |
| | | | | | | | | |
| Exchange Traded Funds Sold Short (-1.6%) | | | | | | | | |
iShares Russell 2000 Growth
Index Fund | | | 7,000 | | | | 667,170 | |
| iShares Russell 2000 Index Fund | | | 7,000 | | | | 590,030 | |
iShares Russell 2000 Value
Index Fund | | | 7,000 | | | | 528,570 | |
| | | | | | | | | |
| Total Exchange Traded Funds Sold Short | | | | | | | | |
| (Proceeds $1,716,580) | | | | | | | 1,785,770 | |
| | | | | | | | | |
| Total Securities & Exchange Traded Funds Sold Short | | | | | | | | |
| (Proceeds $6,822,850) | | | | | | | 7,666,669 | |
| | | | | | | | | |
| Total Securities & Exchange Traded | | | | | | | | |
| Funds Sold Short (-6.8%) | | | | | | | (7,666,669 | ) |
Total Investments
(Cost $80,892,728) (101.4%) | | | | | | | 115,155,790 | |
Other Assets in Excess
of Liabilities (5.4%) | | | | | | | 6,072,059 | |
| | | | | | | | | |
| Net Assets (100.0%) | | | | | | $ | 113,561,180 | |
| * | Non-income producing security. |
| | |
| | The Global Industry Classification Standard (GICS®) was developed by and/or is the exclusive property of MSCI, Inc. and Standard & Poor’s Financial Services LLC (“S&P”). GICS is a service mark of MSCI and S&P and has been licensed for use by U.S. Bancorp Fund Services, LLC. |
See accompanying notes to financial statements.
Needham Aggressive Growth Fund
Schedule of Investments
December 31, 2012
| | | | | | | | | |
| | | Shares | | | Fair Value | |
| Common Stocks (98.5%) | | | | | | | | |
| | | | | | | | | |
| Aerospace & Defense (1.4%) | | | | | | | | |
| Precision Castparts Corp.† | | | 5,000 | | | $ | 947,100 | |
| | | | | | | | | |
| Biotechnology (5.5%) | | | | | | | | |
| Gilead Sciences, Inc.* | | | 50,000 | | | | 3,672,500 | |
| | | | | | | | | |
| Capital Markets (3.1%) | | | | | | | | |
| Financial Engines, Inc.* | | | 74,000 | | | | 2,053,500 | |
| | | | | | | | | |
| Chemicals (0.5%) | | | | | | | | |
| AZ Electronic Materials SA | | | 60,000 | | | | 340,454 | |
| | | | | | | | | |
| Communications Equipment (7.4%) | | | | | | | | |
| Anaren, Inc.* | | | 91,550 | | | | 1,780,648 | |
| Emulex Corp.* | | | 202,500 | | | | 1,478,250 | |
| Finisar Corp.* | | | 37,000 | | | | 603,100 | |
| ViaSat, Inc.* | | | 27,500 | | | | 1,069,750 | |
| | | | | | | | 4,931,748 | |
| | | | | | | | | |
| Computers & Peripherals (8.8%) | | | | | | | | |
| Apple, Inc.*† | | | 5,350 | | | | 2,851,711 | |
| Electronics for Imaging, Inc.* | | | 70,000 | | | | 1,329,300 | |
| Seagate Technology PLC | | | 5,000 | | | | 152,400 | |
| Super Micro Computer, Inc.* | | | 153,000 | | | | 1,560,600 | |
| | | | | | | | 5,894,011 | |
| | | | | | | | | |
| Electrical Equipment (0.3%) | | | | | | | | |
| II-VI, Inc.* | | | 11,900 | | | | 217,413 | |
| | | | | | | | | |
| Electronic Equipment, Instruments & Components (11.0%) | | | | | | | | |
| Corning, Inc. | | | 58,000 | | | | 731,960 | |
| Electro Scientific Industries, Inc. | | | 53,000 | | | | 527,350 | |
| FEI Co. | | | 16,000 | | | | 887,360 | |
| IPG Photonics Corp.* | | | 5,000 | | | | 333,250 | |
| Jabil Circuit, Inc.† | | | 105,100 | | | | 2,027,379 | |
| Multi-Fineline Electronix, Inc.* | | | 75,000 | | | | 1,515,750 | |
| Newport Corp.* | | | 25,000 | | | | 336,250 | |
| TTM Technologies, Inc.* | | | 105,000 | | | | 966,000 | |
| | | | | | | | 7,325,299 | |
| | | | | | | | | |
| Energy Equipment & Services (0.4%) | | | | | | | | |
| Halliburton Co. | | | 2,000 | | | | 69,380 | |
| National Oilwell Varco, Inc. | | | 3,000 | | | | 205,050 | |
| | | | | | | | 274,430 | |
| | | | | | | | | |
| Health Care Equipment & Supplies (3.1%) | | | | | | | | |
| Becton Dickinson and Co. | | | 8,000 | | | | 625,520 | |
| LeMaitre Vascular, Inc. | | | 40,000 | | | | 229,600 | |
| Varian Medical Systems, Inc.* | | | 11,500 | | | | 807,760 | |
| Volcano Corp.* | | | 16,000 | | | | 377,760 | |
| | | | | | | | 2,040,640 | |
| | | | | | | | | |
| Health Care Providers & Services (1.4%) | | | | | | | | |
| Express Scripts Holding Co.*† | | | 18,000 | | | | 972,000 | |
| | | | | | | | | |
| Health Care Technology (0.6%) | | | | | | | | |
| Omnicell, Inc.* | | | 26,700 | | | | 397,029 | |
| | | | | | | | | |
| Household Products (0.1%) | | | | | | | | |
| Oil-Dri Corp. of America | | | 3,000 | | | | 82,800 | |
| | | | | | | | | |
| Internet Software & Services (20.2%) | | | | | | | | |
| Akamai Technologies, Inc.*† | | | 168,000 | | | | 6,872,880 | |
| Brightcove, Inc.* | | | 49,000 | | | | 442,960 | |
| Carbonite, Inc.* | | | 25,000 | | | | 231,250 | |
| Constant Contact, Inc.* | | | 45,000 | | | | 639,450 | |
| E2open, Inc.* | | | 52,500 | | | | 743,400 | |
| Equinix, Inc.* | | | 4,000 | | | | 824,800 | |
| Reis, Inc.* | | | 105,000 | | | | 1,368,150 | |
| Responsys, Inc.* | | | 52,500 | | | | 312,900 | |
| Soundbite Communications, Inc.* | | | 710,000 | | | | 2,030,600 | |
| | | | | | | | 13,466,390 | |
| | | | | | | | | |
| Machinery (0.2%) | | | | | | | | |
| Edwards Group Ltd. - ADR* | | | 20,625 | | | | 125,400 | |
| | | | | | | | | |
| Oil, Gas & Consumable Fuels (3.1%) | | | | | | | | |
| Hess Corp. | | | 7,500 | | | | 397,200 | |
| Suncor Energy, Inc.† | | | 50,500 | | | | 1,665,490 | |
| | | | | | | | 2,062,690 | |
| | | | | | | | | |
| Professional Services (0.9%) | | | | | | | | |
| WageWorks, Inc.* | | | 35,000 | | | | 623,000 | |
| | | | | | | | | |
| Semiconductors & Semiconductor Equipment (25.7%) | | | | | | | | |
| ATMI, Inc.* | | | 35,000 | | | | 730,800 | |
| Entegris, Inc.* | | | 185,000 | | | | 1,698,300 | |
| Entropic Communications, Inc.* | | | 772,500 | | | | 4,086,525 | |
| FormFactor, Inc.* | | | 225,000 | | | | 1,026,000 | |
| MKS Instruments, Inc. | | | 29,100 | | | | 750,198 | |
| Nanometrics, Inc.* | | | 5,000 | | | | 72,100 | |
| Nova Measuring Instruments Ltd.* | | | 138,200 | | | | 1,102,836 | |
| PDF Solutions, Inc.* | | | 486,000 | | | | 6,697,080 | |
| Photronics, Inc.* | | | 61,000 | | | | 363,560 | |
| TriQuint Semiconductor, Inc.* | | | 100,000 | | | | 484,000 | |
| Ultra Clean Holdings* | | | 31,900 | | | | 156,629 | |
| | | | | | | | 17,168,028 | |
| | | | | | | | | |
| Software (1.9%) | | | | | | | | |
| AVG Technologies NV* | | | 10,000 | | | | 158,300 | |
| Bottomline Technologies, Inc.* | | | 32,280 | | | | 851,869 | |
See accompanying notes to financial statements.
Needham Aggressive Growth Fund
Schedule of Investments (Continued)
December 31, 2012
| | | | | | | | | |
| | | Shares | | | Fair Value | |
| Common Stocks - Continued | | | | | | | | |
| Exa Corp.* | | | 27,500 | | | $ | 267,575 | |
| | | | | | | | 1,277,744 | |
| | | | | | | | | |
| Specialty Retail (2.9%) | | | | | | | | |
| Aeropostale, Inc.* | | | 30,000 | | | | 390,300 | |
| CarMax, Inc.* | | | 22,500 | | | | 844,650 | |
| Dick’s Sporting Goods, Inc. | | | 15,000 | | | | 682,350 | |
| | | | | | | | 1,917,300 | |
| | | | | | | | | |
| Total Common Stocks | | | | | | | | |
| (Cost $50,707,559) | | | | | | | 65,789,476 | |
| | | | | | | | | |
| Short-Term Investment (1.5%) | | | | | | | | |
| | | | | | | | | |
| Money Market Fund (1.5%) | | | | | | | | |
| Dreyfus Treasury Prime Cash | | | | | | | | |
| Management 0.00% (a) | | | | | | | | |
| (Cost $985,630) | | | 985,630 | | | | 985,630 | |
| | | | | | | | | |
| Total Investments (100.0%) | | | | | | | | |
| (Cost $51,693,189) | | | | | | | 66,775,106 | |
| Total Securities Sold Short (-5.6%) | | | | | | | | |
| (Proceeds $3,297,895) | | | | | | | (3,759,418 | ) |
| Other Assets in Excess of | | | | | | | | |
| Liabilities (5.6%) | | | | | | | 3,730,591 | |
| | | | | | | | | |
| | | | | | | | | |
| Net Assets (100.0%) | | | | | | $ | 66,746,279 | |
| * | Non-income producing security. |
| | |
| (a) | Rate shown is the seven day yield as of December 31, 2012 and is less than 0.01%. |
| | |
| † | Security position is either entirely or partially held in a segregated account as collateral for securities sold short, aggregating a total Security position is either entirely or partially held in a segregated account as collateral for securities sold short, aggregating a total market value of $3,767,838. |
| | |
| | The Global Industry Classification Standard (GICS®) was developed by and/or is the exclusive property of MSCI, Inc. and Standard & Poor’s Financial Services LLC (‘‘S&P’’). GICS is a service mark of MSCI and S&P and has been licensed for use by U.S. Bancorp Fund Services, LLC. |
See accompanying notes to financial statements.
Needham Aggressive Growth Fund
Schedule of Securities Sold Short
December 31, 2012
| | | | | | | | | |
| | | Shares | | | Fair Value | |
| Securities Sold Short (-5.1%) | | | | | | | | |
| | | | | | | | | |
| Airlines (-0.6%) | | | | | | | | |
| Allegiant Travel Co.* | | | 5,000 | | | $ | 367,050 | |
| | | | | | | | | |
| Chemicals (-0.2%) | | | | | | | | |
| Zoltek Cos., Inc.* | | | 13,750 | | | | 106,562 | |
| | | | | | | | | |
| Electronic Equipment, Instruments & Components (-0.1%) | | | | | | | | |
| Maxwell Technologies, Inc.* | | | 10,000 | | | | 82,900 | |
| | | | | | | | | |
| Health Care Technology (0.0%) | | | | | | | | |
| Medidata Solutions, Inc.* | | | 788 | | | | 30,882 | |
| | | | | | | | | |
| Internet & Catalog Retail (-0.2%) | | | | | | | | |
| HomeAway, Inc.* | | | 6,500 | | | | 143,000 | |
| | | | | | | | | |
| Internet Software & Services (-0.4%) | | | | | | | | |
| SPS Commerce, Inc.* | | | 7,500 | | | | 279,525 | |
| | | | | | | | | |
| Semiconductors & Semiconductor Equipment (-1.8%) | | | | | | | | |
| Advanced Energy Industries, Inc.* | | | 20,000 | | | | 276,200 | |
| Hittite Microwave Corp.* | | | 10,000 | | | | 621,000 | |
| Microsemi Corp.* | | | 8,100 | | | | 170,424 | |
| QuickLogic Corp.* | | | 67,500 | | | | 146,475 | |
| | | | | | | | 1,214,099 | |
| | | | | | | | | |
| Software (-1.8%) | | | | | | | | |
| ANSYS, Inc.* | | | 18,000 | | | | 1,212,120 | |
| | | | | | | | | |
| Total Securities Sold Short | | | | | | | | |
| (Proceeds $2,988,876) | | | | | | | 3,436,138 | |
| | | | | | | | | |
Exchange Traded Funds
Sold Short (-0.5%) | | | | | | | | |
| iShares Russell 2000 | | | | | | | | |
| Growth Index Fund | | | 1,800 | | | | 171,558 | |
| iShares Russell 2000 Index Fund | | | 1,800 | | | | 151,722 | |
| | | | | | | | | |
Total Exchange Traded Funds
Sold Short | | | | | | | | |
| (Proceeds $309,019) | | | | | | | 323,280 | |
| | | | | | | | | |
Total Securities & Exchange Traded
Funds Sold Short | | | | | | | | |
| (Proceeds $3,297,895) | | | | | | | 3,759,418 | |
| | | | | | | | | |
Total Securities & Exchange Traded
Funds Sold Short (-5.6%) | | | | | | | (3,759,418 | ) |
| Total Investments (Cost $51,693,189) | | | | | | | | |
| (100.0%) | | | | | | | 66,775,106 | |
| Other Assets in Excess of | | | | | | | | |
| Liabilities (5.6%) | | | | | | | 3,730,591 | |
| | | | | | | | | |
| Net Assets (100.0%) | | | | | | $ | 66,746,279 | |
| * | Non-income producing security. |
| | |
| | The Global Industry Classification Standard (GICS®) was developed by and/or is the exclusive property of MSCI, Inc. and Standard & Poor’s Financial Services LLC (‘‘S&P’’). GICS is a service mark of MSCI and S&P and has been licensed for use by U.S. Bancorp Fund Services, LLC. |
See accompanying notes to financial statements.
| Annual Report 2012 |
| |
| Needham Small Cap Growth Fund |
| Schedule of Investments |
| December 31, 2012 |
| | | Shares | | | Fair Value | |
| Common Stocks (87.3%) | | | | | | | | |
| | | | | | | | | |
| Capital Markets (0.3%) | | | | | | | | |
| Financial Engines, Inc.* | | | 7,500 | | | $ | 208,125 | |
| | | | | | | | | |
| Commercial Services & Supplies (1.0%) | | | | | | | | |
| Ritchie Bros Auctioneers, Inc. | | | 30,000 | | | | 626,700 | |
| | | | | | | | | |
| Communications Equipment (15.8%) | | | | | | | | |
| Anaren, Inc.*† | | | 150,000 | | | | 2,917,500 | |
| Aruba Networks, Inc.*† | | | 80,000 | | | | 1,660,000 | |
| Emulex Corp.*† | | | 575,000 | | | | 4,197,500 | |
| ViaSat, Inc.* | | | 20,000 | | | | 778,000 | |
| | | | | | | | 9,553,000 | |
| | | | | | | | | |
| Computers & Peripherals (5.2%) | | | | | | | | |
| Super Micro Computer, Inc.*† | | | 311,000 | | | | 3,172,200 | |
| | | | | | | | | |
| Electrical Equipment (2.4%) | | | | | | | | |
| II-VI, Inc.* | | | 80,000 | | | | 1,461,600 | |
| | | | | | | | | |
| Electronic Equipment, Instruments & Components (15.7%) | | | | | | | | |
| Electro Scientific Industries, Inc.† | | | 250,000 | | | | 2,487,500 | |
| Mercury Systems, Inc.* | | | 60,000 | | | | 552,000 | |
| Newport Corp.* | | | 70,000 | | | | 941,500 | |
| TTM Technologies, Inc.*† | | | 390,000 | | | | 3,588,000 | |
| Vishay Intertechnology, Inc.*† | | | 185,000 | | | | 1,966,550 | |
| | | | | | | | 9,535,550 | |
| | | | | | | | | |
| Energy Equipment & Services (2.6%) | | | | | | | | |
| Gulfmark Offshore, Inc.* | | | 5,500 | | | | 189,475 | |
| Halliburton Co. | | | 7,500 | | | | 260,175 | |
| National Oilwell Varco, Inc. | | | 10,000 | | | | 683,500 | |
| Superior Energy Services, Inc.* | | | 22,500 | | | | 466,200 | |
| | | | | | | | 1,599,350 | |
| | | | | | | | | |
| Health Care Equipment & Supplies (1.2%) | | | | | | | | |
| DexCom, Inc.* | | | 40,000 | | | | 544,400 | |
| Palomar Medical Technologies, Inc.* | | | 20,000 | | | | 184,200 | |
| | | | | | | | 728,600 | |
| | | | | | | | | |
| Health Care Providers & Services (2.9%) | | | | | | | | |
| Express Scripts Holding Co.*† | | | 32,500 | | | | 1,755,000 | |
| | | | | | | | | |
| Health Care Technology (1.8%) | | | | | | | | |
| Allscripts Healthcare | | | | | | | | |
| Solutions, Inc.*† | | | 115,000 | | | | 1,083,300 | |
| | | | | | | | | |
| Internet Software & Services (4.0%) | | | | | | | | |
| Brightcove, Inc.* | | | 8,200 | | | | 74,128 | |
| QuinStreet, Inc.*† | | | 290,000 | | | | 1,948,800 | |
| Soundbite Communications, Inc.* | | | 150,000 | | | | 429,000 | |
| | | | | | | | 2,451,928 | |
| | | | | | | | | |
| Metals & Mining (1.2%) | | | | | | | | |
| Walter Energy, Inc. | | | 20,000 | | | | 717,600 | |
| | | | | | | | | |
| Oil, Gas & Consumable Fuels (2.2%) | | | | | | | | |
| Hess Corp.† | | | 25,000 | | | | 1,324,000 | |
| | | | | | | | | |
| Professional Services (1.5%) | | | | | | | | |
| WageWorks, Inc.* | | | 50,000 | | | | 890,000 | |
| | | | | | | | | |
| Semiconductors & Semiconductor Equipment (20.9%) | | | | | | | | |
| Brooks Automation, Inc. | | | 100,000 | | | | 805,000 | |
| Entropic Communications, Inc.* | | | 475,000 | | | | 2,512,750 | |
| FormFactor, Inc.* | | | 600,000 | | | | 2,736,000 | |
| MaxLinear, Inc.* | | | 245,000 | | | | 1,229,900 | |
| MKS Instruments, Inc. | | | 15,000 | | | | 386,700 | |
| Nova Measuring Instruments Ltd.* | | | 25,000 | | | | 199,500 | |
| Photronics, Inc.* | | | 268,750 | | | | 1,601,750 | |
| Supertex, Inc.* | | | 17,200 | | | | 301,860 | |
| TriQuint Semiconductor, Inc.* | | | 150,000 | | | | 726,000 | |
| Ultra Clean Holdings* | | | 434,900 | | | | 2,135,359 | |
| | | | | | | | 12,634,819 | |
| | | | | | | | | |
| Software (2.6%) | | | | | | | | |
| AVG Technologies NV* | | | 100,000 | | | | 1,583,000 | |
| | | | | | | | | |
| Specialty Retail (4.7%) | | | | | | | | |
| Aeropostale, Inc.*† | | | 172,500 | | | | 2,244,225 | |
| Guess?, Inc. | | | 25,000 | | | | 613,500 | |
| | | | | | | | 2,857,725 | |
| Textiles, Apparel & Luxury Goods (1.3%) | | | | | | | | |
| True Religion Apparel, Inc. | | | 30,000 | | | | 762,600 | |
| Total Common Stocks | | | | | | | | |
| (Cost $58,941,734) | | | | | | | 52,945,097 | |
See accompanying notes to financial statements.
| Needham Funds |
| |
| Needham Small Cap Growth Fund |
| Schedule of Investments (Continued) |
| December 31, 2012 |
| | | Shares | | | Fair Value | |
| Short-Term Investment (11.9%) | | | | | | |
| | | | | | | |
| Money Market Fund (11.9%) | | | | | | |
| Dreyfus Treasury Prime Cash | | | | | | |
| Management 0.00% (a) | | | | | | |
| (Cost $7,211,621) | | | 7,211,621 | | | $ | 7,211,621 | |
| | | | | | | | | |
| Total Investments (99.2%) | | | | | | | | |
| (Cost $66,153,355) | | | | | | | 60,156,718 | |
| Total Securities Sold Short (-7.1%) | | | | | | | | |
| (Proceeds $3,967,990) | | | | | | | (4,330,346 | ) |
| Other Assets in | | | | | | | | |
| Excess of Liabilities (7.9%) | | | | | | | 4,788,060 | |
| | | | | | | | | |
| Net Assets (100.0%) | | | | | | $ | 60,614,432 | |
| * | Non-income producing security. |
| | |
| (a) | Rate shown is the seven day yield as of December 31, 2012 and is less than 0.01%. |
| | |
| † | Security position is either entirely or partially held in a segregated account as collateral for securities sold short, aggregating a total market value of $7,792,900. |
| | |
| | The Global Industry Classification Standard (GICS®) was developed by and/or is the exclusive property of MSCI, Inc. and Standard & Poor’s Financial Services LLC (‘‘S&P’’). GICS is a service mark of MSCI and S&P and has been licensed for use by U.S. Bancorp Fund Services, LLC. |
See accompanying notes to financial statements.
| Annual Report 2012 |
| |
| Needham Small Cap Growth Fund |
| Schedule of Securities Sold Short |
| December 31, 2012 |
| | | | Shares | | | Fair Value | |
| Securities Sold Short (-4.5%) | | | | | | | | |
| | | | | | | | | |
| Airlines (-0.6%) | | | | | | | | |
| Allegiant Travel Co.* | | | 5,000 | | | $ | 367,050 | |
| | | | | | | | | |
| Communications Equipment (-0.3%) | | | | | | | | |
| Arris Group, Inc.* | | | 12,500 | | | | 186,750 | |
| | | | | | | | | |
| Health Care Technology (-0.1%) | | | | | | | | |
| Medidata Solutions, Inc.* | | | 788 | | | | 30,882 | |
| | | | | | | | | |
| Internet Software & Services (-0.6%) | | | | | | | | |
| SPS Commerce, Inc.* | | | 10,000 | | | | 372,700 | |
| | | | | | | | | |
| Semiconductors & Semiconductor Equipment (-2.9%) | | | | | | | | |
| Advanced Energy Industries, Inc.* | | | 20,000 | | | | 276,200 | |
| Hittite Microwave Corp.* | | | 17,500 | | | | 1,086,750 | |
| Microsemi Corp.* | | | 7,350 | | | | 154,644 | |
| Rudolph Technologies, Inc.* | | | 20,000 | | | | 269,000 | |
| | | | | | | | 1,786,594 | |
| | | | | | | | | |
| Total Securities Sold Short | | | | | | | | |
| (Proceeds $2,450,138) | | | | | | | 2,743,976 | |
| | | | | | | | | |
| Exchange Traded Funds | | | | | | | | |
| Sold Short (-2.6%) | | | | | | | | |
iShares Russell 2000 Growth
Index Fund | | | 5,000 | | | | 476,550 | |
| iShares Russell 2000 Index Fund | | | 6,000 | | | | 505,740 | |
iShares Russell 2000 Value
Index Fund | | | 8,000 | | | | 604,080 | |
| | | | | | | | | |
| Total Exchange Traded Funds Sold Short | | | | | | | | |
| (Proceeds $1,517,852) | | | | | | | 1,586,370 | |
| | | | | | | | | |
| Total Securities & Exchange Traded Funds Sold Short | | | | | | | | |
| (Proceeds $3,967,990) | | | | | | | 4,330,346 | |
| | | | | | | | | |
| Total Securities & Exchange Traded Funds Sold Short (-7.1%) | | | | | | | (4,330,346 | ) |
| Total Investments (99.2%) | | | | | | | | |
| (Cost $66,153,355) | | | | | | | 60,156,718 | |
Other Assets in Excess
of Liabilities (7.9%) | | | | | | | 4,788,060 | |
| | | | | | | | | |
| Net Assets (100.0%) | | | | | | $ | 60,614,432 | |
| * | Non-income producing security. |
| | |
| | The Global Industry Classification Standard (GICS®) was developed by and/or is the exclusive property of MSCI, Inc. and Standard & Poor’s Financial Services LLC (‘‘S&P’’). GICS is a service mark of MSCI and S&P and has been licensed for use by U.S. Bancorp Fund Services, LLC. |
See accompanying notes to financial statements.
Statements of Assets and Liabilities
December 31, 2012
| | | | | | Needham | | | Needham | |
| | | Needham | | | Aggressive | | | Small Cap | |
| | | Growth Fund | | | Growth Fund | | | Growth Fund | |
| Assets | | | | | | | | | |
| Investments, at Value | | | | | | | | | |
| (Cost $80,892,728, $51,693,189, $66,153,355) | | $ | 115,155,790 | | | $ | 66,775,106 | | | $ | 60,156,718 | |
| Receivables: | | | | | | | | | | | | |
| Deposit with Broker for Securities Sold Short | | | 7,656,184 | | | | 3,923,629 | | | | 4,553,584 | |
| Dividends and Interest | | | 38,018 | | | | — | | | | — | |
| Fund Shares Sold | | | 39,093 | | | | 52,071 | | | | 124,137 | |
| Investment Securities Sold | | | 676,995 | | | | 226,002 | | | | 762,315 | |
| Prepaid Expenses | | | 32,307 | | | | 28,936 | | | | 21,376 | |
| Total Assets | | | 123,598,387 | | | | 71,005,744 | | | | 65,618,130 | |
| | | | | | | | | | | | | |
| Liabilities | | | | | | | | | | | | |
Securities Sold Short, at Value
(Proceeds $6,822,850, $3,297,895, $3,967,990) | | | 7,666,669 | | | | 3,759,418 | | | | 4,330,346 | |
| Payables: | | | | | | | | | | | | |
| Investment Securities Purchased | | | 67,700 | | | | 67,183 | | | | 208,980 | |
| Fund Shares Redeemed | | | 372,432 | | | | 278,245 | | | | 320,017 | |
| Due to Adviser | | | 121,222 | | | | 71,129 | | | | 63,723 | |
| Capital Gains Distribution Payable | | | 1,691,994 | | | | — | | | | — | |
| Distribution Fees | | | 25,910 | | | | 15,419 | | | | 13,652 | |
| Administration and Accounting Fees | | | 30,096 | | | | 20,315 | | | | 18,302 | |
| Transfer Agent Fees | | | 14,957 | | | | 15,555 | | | | 16,334 | |
| Directors’ Fees | | | 191 | | | | 115 | | | | 103 | |
| Accrued Expenses and Other Liabilities | | | 46,036 | | | | 32,086 | | | | 32,241 | |
| Total Liabilities | | | 10,037,207 | | | | 4,259,465 | | | | 5,003,698 | |
| | | | | | | | | | | | | |
| Net Assets | | $ | 113,561,180 | | | $ | 66,746,279 | | | $ | 60,614,432 | |
Shares Issued and Outstanding $0.001 Par Value
(Authorized 800,000,000, 100,000,000 and 100,000,000 respectively) | | | 3,373,472 | | | | 4,013,895 | | | | 4,961,107 | |
Net Asset Value, Offering and Redemption Price Per Share(a) | | $ | 33.66 | | | $ | 16.63 | | | $ | 12.22 | |
| | | | | | | | | | | | | |
| Components of Net Assets | | | | | | | | | | | | |
| Paid-in Capital | | | 80,458,334 | | | | 59,369,656 | | | | 67,355,064 | |
| Accumulated Net Investment Income (Loss) | | | 32,300 | | | | (12 | ) | | | — | |
Accumulated Net Realized Gain (Loss) from Investments, Securities Sold Short,
Foreign Currency Transactions and Currency | | | (348,697 | ) | | | (7,243,759 | ) | | | (381,639 | ) |
Net Unrealized Appreciation (Depreciation) on
Investment Securities and Securities Sold Short | | | 33,419,243 | | | | 14,620,394 | | | | (6,358,993 | ) |
| Total Net Assets | | $ | 113,561,180 | | | $ | 66,746,279 | | | $ | 60,614,432 | |
| (a) | Subject to certain exceptions, a 2% redemption fee is imposed upon shares redeemed within 60 days of their purchase. See Note 2 of the notes to financial statements. |
See accompanying notes to financial statements.
Statements of Operations
For the year ended December 31, 2012
| | | | | | Needham | | | Needham | |
| | | Needham | | | Aggressive | | | Small Cap | |
| | | Growth Fund | | | Growth Fund | | | Growth Fund | |
| Investment Income | | | | | | | | | |
| Dividends | | $ | 1,595,065 | | | $ | 543,138 | | | $ | 770,391 | |
| Interest | | | 3 | | | | 1 | | | | 3 | |
| Less: Foreign Taxes Withheld | | | — | | | | (4,078 | ) | | | (5,317 | ) |
| Total Investment Income | | | 1,595,068 | | | | 539,061 | | | | 765,077 | |
| | | | | | | | | | | | | |
| Expenses | | | | | | | | | | | | |
| Investment Advisory Fees | | | 1,540,087 | | | | 1,028,941 | | | | 939,559 | |
| Distribution Fees | | | 308,017 | | | | 205,788 | | | | 187,912 | |
| Administration and Accounting Fees | | | 123,979 | | | | 82,332 | | | | 78,939 | |
| Audit Fees | | | 38,603 | | | | 21,711 | | | | 22,036 | |
| Chief Compliance Officer Fees | | | 16,413 | | | | 11,020 | | | | 10,066 | |
| Custodian Fees | | | 7,915 | | | | 8,599 | | | | 7,607 | |
| Directors’ Fees | | | 27,376 | | | | 18,353 | | | | 17,011 | |
Dividend Expense(1) | | | 59,395 | | | | 28,228 | | | | 53,558 | |
| Filing Fees | | | 20,178 | | | | 28,791 | | | | 29,865 | |
Interest Expense(1) | | | 85,767 | | | | 110,128 | | | | 39,368 | |
| Legal Fees | | | 40,931 | | | | 31,448 | | | | 25,934 | |
| Printing Fees | | | 20,276 | | | | 17,407 | | | | 20,411 | |
| Transfer Agent Fees | | | 60,354 | | | | 66,869 | | | | 68,983 | |
| Other Expenses | | | 42,095 | | | | 32,495 | | | | 34,238 | |
| Total Expenses | | | 2,391,386 | | | | 1,692,110 | | | | 1,535,487 | |
| | | | | | | | | | | | | |
| Net Investment Loss | | | (796,318 | ) | | | (1,153,049 | ) | | | (770,410 | ) |
| | | | | | | | | | | | | |
Net Realized/Unrealized Gain (Loss) from Investments, Securities Sold
Short, Foreign Currency Transactions and Currency | | | | | | | | | | | | |
| Net Realized Gain (Loss) from Investments | | | 7,941,772 | | | | (7,232,277 | ) | | | 1,384,182 | |
| Net Realized Gain (Loss) from Securities Sold Short | | | (14,579 | ) | | | 66,321 | | | | 112,776 | |
| Net Realized Gain from Foreign Currency Transactions | | | — | | | | 5 | | | | 9,416 | |
| Net Realized Gain (Loss) from Currency | | | — | | | | 7 | | | | (3,647 | ) |
Change in Unrealized Appreciation on
Investments and Securities Sold Short | | | 8,505,697 | | | | 20,111,842 | | | | 6,357,419 | |
Net Realized/Unrealized Gain from Investments, Securities Sold
Short, Foreign Currency Transactions and Currency | | | 16,432,890 | | | | 12,945,898 | | | | 7,860,146 | |
| Change in Net Assets Resulting from Operations | | $ | 15,636,572 | | | $ | 11,792,849 | | | $ | 7,089,736 | |
| (1) | Expense related to securities sold short. |
See accompanying notes to financial statements.
Statements of Changes in Net Assets
| | | | | | | | | Needham Aggressive | | | Needham Small Cap | |
| | | Needham Growth Fund | | | Growth Fund | | | Growth Fund | |
| | | Year Ended | | | Year Ended | | | Year Ended | | | Year Ended | | | Year Ended | | | Year Ended | |
| | | December 31, | | | December 31, | | | December 31, | | | December 31, | | | December 31, | | | December 31, | |
| | | 2012 | | | 2011 | | | 2012 | | | 2011 | | | 2012 | | | 2011 | |
| Change in Net Assets | | | | | | | | | | | | | | | | | | |
| Operations: | | | | | | | | | | | | | | | | | | |
| Net Investment Loss | | $ | (796,318 | ) | | $ | (2,224,789 | ) | | $ | (1,153,049 | ) | | $ | (2,115,245 | ) | | $ | (770,410 | ) | | $ | (1,992,147 | ) |
Net Realized Gain (Loss) from
Investments, Securities Sold Short,
Foreign Currency Transactions, and
Currency | | | 7,927,193 | | | | 4,607,364 | | | | (7,165,944 | ) | | | 3,402,036 | | | | 1,502,727 | | | | 2,008,962 | |
Change in Unrealized Appreciation
(Depreciation) on Investments and
Securities Sold Short | | | 8,505,697 | | | | (21,938,332 | ) | | | 20,111,842 | | | | (25,075,813 | ) | | | 6,357,419 | | | | (25,763,708 | ) |
Change in Net Assets Resulting from
Operations | | | 15,636,572 | | | | (19,555,757 | ) | | | 11,792,849 | | | | (23,789,022 | ) | | | 7,089,736 | | | | (25,746,893 | ) |
| | | | | | | | | | | | | | | | | | | | | | | | | |
| Distributions to Shareholders from: | | | | | | | | | | | | | | | | | | | | | | | | |
| Capital Gains | | | (10,332,430 | ) | | | (7,330,132 | ) | | | (42,629 | ) | | | (1,568,190 | ) | | | — | | | | (4,537,435 | ) |
| Return of Capital | | | — | | | | — | | | | — | | | | — | | | | — | | | | (135,521 | ) |
| Total Distributions to Shareholders | | | (10,332,430 | ) | | | (7,330,132 | ) | | | (42,629 | ) | | | (1,568,190 | ) | | | — | | | | (4,672,956 | ) |
| | | | | | | | | | | | | | | | | | | | | | | | | |
| Capital Transactions: | | | | | | | | | | | | | | | | | | | | | | | | |
| Shares Issued | | | 5,365,652 | | | | 51,065,814 | | | | 8,345,065 | | | | 110,323,772 | | | | 14,664,256 | | | | 106,098,656 | |
Shares Issued in Reinvestment of
Distribution | | | 8,356,672 | | | | 7,104,581 | | | | 42,097 | | | | 1,550,038 | | | | — | | | | 4,495,940 | |
| Shares Redeemed | | | (31,433,234 | ) | | | (65,153,889 | ) | | | (43,575,127 | ) | | | (102,972,789 | ) | | | (43,834,450 | ) | | | (96,483,443 | ) |
| Redemption Fees | | | 1,961 | | | | 29,934 | | | | 14,166 | | | | 74,691 | | | | 20,159 | | | | 72,766 | |
Change in Net Assets from Capital
Transactions | | | (17,708,949 | ) | | | (6,953,560 | ) | | | (35,173,799 | ) | | | 8,975,712 | | | | (29,150,035 | ) | | | 14,183,919 | |
| | | | | | | | | | | | | | | | | | | | | | | | | |
| Change in Net Assets | | | (12,404,807 | ) | | | (33,839,449 | ) | | | (23,423,579 | ) | | | (16,381,500 | ) | | | (22,060,299 | ) | | | (16,235,930 | ) |
| | | | | | | | | | | | | | | | | | | | | | | | | |
| Net Assets | | | | | | | | | | | | | | | | | | | | | | | | |
| Beginning of Period | | | 125,965,987 | | | | 159,805,436 | | | | 90,169,858 | | | | 106,551,358 | | | | 82,674,731 | | | | 98,910,661 | |
| End of Period | | $ | 113,561,180 | | | $ | 125,965,987 | | | $ | 66,746,279 | | | $ | 90,169,858 | | | $ | 60,614,432 | | | $ | 82,674,731 | |
Accumulated Net
Investment Income (Loss) | | $ | 32,300 | | | $ | — | | | $ | (12 | ) | | $ | — | | | $ | — | | | $ | — | |
| | | | | | | | | | | | | | | | | | | | | | | | | |
| Share Transaction: | | | | | | | | | | | | | | | | | | | | | | | | |
| Number of Shares Issued | | | 149,747 | | | | 1,281,150 | | | | 513,281 | | | | 6,348,443 | | | | 1,170,618 | | | | 7,443,556 | |
| Number of Shares Reinvested | | | 257,922 | | | | 225,685 | | | | 2,685 | | | | 113,806 | | | | — | | | | 416,677 | |
| Number of Shares Redeemed | | | (877,473 | ) | | | (1,749,928 | ) | | | (2,713,361 | ) | | | (6,468,840 | ) | | | (3,548,660 | ) | | | (7,481,888 | ) |
| Change in Shares | | | (469,804 | ) | | | (243,093 | ) | | | (2,197,395 | ) | | | (6,591 | ) | | | (2,378,042 | ) | | | 378,345 | |
See accompanying notes to financial statements.
Needham Growth Fund
Financial Highlights
| | | | | | | | | | | | | | | | |
| (For a Share Outstanding | | Year Ended December 31, | |
| Throughout each Period) | | 2012 | | | 2011 | | | 2010 | | | 2009 | | | 2008 | |
| Net Asset Value, Beginning of Period | | $ | 32.78 | | | $ | 39.11 | | | $ | 29.77 | | | $ | 20.27 | | | $ | 36.05 | |
| Investment Operations | | | | | | | | | | | | | | | | | | | | |
| Net Investment Loss | | | (0.24 | ) | | | (0.58 | ) | | | (0.60 | ) | | | (0.43 | ) | | | (0.45 | ) |
| Net Realized and Unrealized | | | | | | | | | | | | | | | | | | | | |
| Gain (Loss) on Investments | | | 4.31 | | | | (3.79 | ) | | | 9.94 | | | | 9.93 | | | | (14.10 | ) |
| Total from Investment Operations | | | 4.07 | | | | (4.37 | ) | | | 9.34 | | | | 9.50 | | | | (14.55 | ) |
| | | | | | | | | | | | | | | | | | | | | |
| Less Distributions | | | | | | | | | | | | | | | | | | | | |
| Net Investment Income | | | — | | | | — | | | | — | | | | — | | | | — | |
| Net Realized Gains | | | (3.19 | ) | | | (1.97 | ) | | | — | | | | — | | | | (1.23 | ) |
| Total Distributions | | | (3.19 | ) | | | (1.97 | ) | | | — | | | | — | | | | (1.23 | ) |
| | | | | | | | | | | | | | | | | | | | | |
| Capital Contributions | | | | | | | | | | | | | | | | | | | | |
| Redemption Fees | | | — | (a) | | | 0.01 | | | | — | (a) | | | — | (a) | | | — | |
| Total Capital Contributions | | | — | (a) | | | 0.01 | | | | — | (a) | | | — | (a) | | | — | |
| Net Asset Value, End of Period | | $ | 33.66 | | | $ | 32.78 | | | $ | 39.11 | | | $ | 29.77 | | | $ | 20.27 | |
| | | | | | | | | | | | | | | | | | | | | |
| Total Return | | | 12.80 | % | | | (10.94 | )% | | | 31.37 | % | | | 46.87 | % | | | (40.41 | )% |
| Net Assets, End of Period (000’s) | | $ | 113,561 | | | $ | 125,966 | | | $ | 159,805 | | | $ | 119,175 | | | $ | 92,818 | |
| Ratios/Supplemental Data | | | | | | | | | | | | | | | | | | | | |
| Ratio of Total Expenses to Average Net Assets | | | 1.94 | % | | | 1.81 | % | | | 2.11 | % | | | 2.03 | % | | | 2.04 | % |
| Ratio of Total Expenses to Average Net Assets | | | | | | | | | | | | | | | | | | | | |
| (before interest and dividend expense) | | | 1.82 | % | | | 1.78 | % | | | 2.00 | % | | | 2.00 | % | | | 2.03 | % |
| Ratio of Total Expenses to Average Net Assets | | | | | | | | | | | | | | | | | | | | |
| (before waiver and reimbursement of expenses) | | | 1.94 | % | | | 1.81 | % | | | 2.11 | % | | | 2.08 | % | | | 2.04 | % |
| Ratio of Net Investment Loss to | | | | | | | | | | | | | | | | | | | | |
| Average Net Assets | | | (0.65 | )% | | | (1.41 | )% | | | (1.85 | )% | | | (1.71 | )% | | | (1.37 | )% |
| Ratio of Net Investment Loss to | | | | | | | | | | | | | | | | | | | | |
| Average Net Assets (before waiver and | | | | | | | | | | | | | | | | | | | | |
| reimbursement of expenses) | | | (0.65 | )% | | | (1.41 | )% | | | (1.85 | )% | | | (1.76 | )% | | | (1.37 | )% |
| Portfolio turnover rate | | | 17 | % | | | 29 | % | | | 62 | % | | | 29 | % | | | 41 | % |
(a) Value is less than $0.005 per share.
See accompanying notes to financial statements.
Needham Aggressive Growth Fund
Financial Highlights
| | | | | | | | | | | | | | | | |
| (For a Share Outstanding | | Year Ended December 31, | |
| Throughout each Period) | | 2012 | | | 2011 | | | 2010 | | | 2009 | | | 2008 | |
| Net Asset Value, Beginning of Period | | $ | 14.52 | | | $ | 17.14 | | | $ | 12.38 | | | $ | 9.45 | | | $ | 14.14 | |
| Investment Operations | | | | | | | | | | | | | | | | | | | | |
| Net Investment Loss | | | (0.29 | ) | | | (0.34 | ) | | | (0.11 | ) | | | (0.19 | ) | | | (0.26 | ) |
| Net Realized and Unrealized | | | | | | | | | | | | | | | | | | | | |
| Gain (Loss) on Investments | | | 2.41 | | | | (2.04 | ) | | | 4.98 | | | | 3.13 | | | | (3.65 | ) |
| Total from Investment Operations | | | 2.12 | | | | (2.38 | ) | | | 4.87 | | | | 2.94 | | | | (3.91 | ) |
| | | | | | | | | | | | | | | | | | | | | |
| Less Distributions | | | | | | | | | | | | | | | | | | | | |
| Net Realized Gains | | | (0.01 | ) | | | (0.25 | ) | | | (0.11 | ) | | | (0.02 | ) | | | (0.78 | ) |
| Total Distributions | | | (0.01 | ) | | | (0.25 | ) | | | (0.11 | ) | | | (0.02 | ) | | | (0.78 | ) |
| | | | | | | | | | | | | | | | | | | | | |
| Capital Contributions | | | | | | | | | | | | | | | | | | | | |
| Redemption Fees | | | — | (a) | | | 0.01 | | | | — | (a) | | | 0.01 | | | | — | |
| Total Capital Contributions | | | — | (a) | | | 0.01 | | | | — | (a) | | | 0.01 | | | | — | |
| Net Asset Value, End of Period | | $ | 16.63 | | | $ | 14.52 | | | $ | 17.14 | | | $ | 12.38 | | | $ | 9.45 | |
| | | | | | | | | | | | | | | | | | | | | |
| Total Return | | | 14.61 | % | | | (13.77 | )% | | | 39.42 | % | | | 31.18 | % | | | (27.60 | )% |
| Net Assets, End of Period (000’s) | | $ | 66,746 | | | $ | 90,170 | | | $ | 106,551 | | | $ | 22,819 | | | $ | 10,202 | |
| Ratios/Supplemental Data | | | | | | | | | | | | | | | | | | | | |
| Ratio of Total Expenses to Average Net Assets | | | 2.06 | % | | | 1.83 | % | | | 2.09 | % | | | 2.50 | % | | | 2.51 | % |
| Ratio of Total Expenses to Average Net Assets (before interest and dividend expense) | | | 1.89 | % | | | 1.80 | % | | | 2.05 | % | | | 2.49 | % | | | 2.50 | % |
| Ratio of Total Expenses to Average Net Assets (before waiver and reimbursement of expenses) | | | 2.06 | % | | | 1.83 | % | | | 2.09 | % | | | 2.50 | % | | | 2.63 | % |
| Ratio of Net Investment Loss to Average Net Assets | | | (1.40 | )% | | | (1.62 | )% | | | (1.77 | )% | | | (2.39 | )% | | | (2.04 | )% |
| Ratio of Net Investment Loss to Average Net Assets (before waiver and reimbursement of expenses) | | | (1.40 | )% | | | (1.62 | )% | | | (1.77 | )% | | | (2.39 | )% | | | (2.15 | )% |
| Portfolio turnover rate | | | 15 | % | | | 45 | % | | | 55 | % | | | 70 | % | | | 45 | % |
(a) Value is less than $0.005 per share.
See accompanying notes to financial statements.
Needham Small Cap Growth Fund
Financial Highlights
| | | | | | | | | | | | | | | | |
| (For a Share Outstanding | | Year Ended December 31, | |
| Throughout each Period) | | 2012 | | | 2011 | | | 2010 | | | 2009 | | | 2008 | |
| Net Asset Value, Beginning of Period | | $ | 11.26 | | | $ | 14.21 | | | $ | 10.73 | | | $ | 7.61 | | | $ | 11.29 | |
| Investment Operations | | | | | | | | | | | | | | | | | | | | |
| Net Investment Loss | | | (0.15 | ) | | | (0.27 | ) | | | (0.08 | ) | | | (0.20 | ) | | | (0.19 | ) |
| Net Realized and Unrealized | | | | | | | | | | | | | | | | | | | | |
| Gain (Loss) on Investments | | | 1.11 | | | | (2.04 | ) | | | 3.99 | | | | 3.33 | | | | (2.49 | ) |
| Total from Investment Operations | | | 0.96 | | | | (2.31 | ) | | | 3.91 | | | | 3.13 | | | | (2.68 | ) |
| | | | | | | | | | | | | | | | | | | | | |
| Less Distributions | | | | | | | | | | | | | | | | | | | | |
| Net Realized Gains | | | — | | | | (0.62 | ) | | | (0.43 | ) | | | (0.01 | ) | | | (0.82 | ) |
| Return of Capital | | | — | | | | (0.02 | ) | | | — | | | | — | | | | (0.18 | ) |
| Total Distributions | | | — | | | | (0.64 | ) | | | (0.43 | ) | | | (0.01 | ) | | | (1.00 | ) |
| | | | | | | | | | | | | | | | | | | | | |
| Capital Contributions | | | | | | | | | | | | | | | | | | | | |
| Redemption Fees | | | — | (a) | | | — | (a) | | | — | (a) | | | — | (a) | | | — | |
| Total Capital Contributions | | | — | (a) | | | — | (a) | | | — | (a) | | | — | (a) | | | — | |
| Net Asset Value, End of Period | | $ | 12.22 | | | $ | 11.26 | | | $ | 14.21 | | | $ | 10.73 | | | $ | 7.61 | |
| | | | | | | | | | | | | | | | | | | | | |
| Total Return | | | 8.53 | % | | | (16.10 | )% | | | 36.89 | % | | | 41.18 | % | | | (23.42 | )% |
| Net Assets, End of Period (000’s) | | $ | 60,614 | | | $ | 82,675 | | | $ | 98,911 | | | $ | 11,303 | | | $ | 5,309 | |
| Ratios/Supplemental Data | | | | | | | | | | | | | | | | | | | | |
| Ratio of Total Expenses to Average Net Assets | | | 2.04 | % | | | 1.84 | % | | | 2.16 | % | | | 2.57 | % | | | 2.51 | % |
| Ratio of Total Expenses to Average Net Assets (before interest and dividend expense) | | | 1.92 | % | | | 1.81 | % | | | 2.08 | % | | | 2.50 | % | | | 2.50 | % |
| Ratio of Total Expenses to Average Net Assets (before waiver and reimbursement of expenses) | | | 2.04 | % | | | 1.84 | % | | | 2.16 | % | | | 3.02 | % | | | 3.57 | % |
| Ratio of Net Investment Loss to Average Net Assets | | | (1.02 | )% | | | (1.57 | )% | | | (1.88 | )% | | | (2.50 | )% | | | (2.02 | )% |
| Ratio of Net Investment Loss to Average Net Assets (before waivers and reimbursements of expenses) | | | (1.02 | )% | | | (1.57 | )% | | | (1.88 | )% | | | (2.95 | )% | | | (3.09 | )% |
| Portfolio turnover rate | | | 72 | % | | | 105 | % | | | 65 | % | | | 154 | % | | | 219 | % |
(a) Value is less than $0.005 per share.
See accompanying notes to financial statements.
Notes to Financial Statements
Needham Growth Fund (‘‘NGF’’), Needham Aggressive Growth Fund (‘‘NAGF’’) and Needham Small Cap Growth Fund (‘‘NSCGF’’) (each, a ‘‘Portfolio’’ and collectively, the ‘‘Portfolios’’), are portfolios of The Needham Funds, Inc. (the ‘‘Company’’), which is registered under the Investment Company Act of 1940, as amended (the ‘‘1940 Act’’), as a diversified, open-end management investment company. The Company was organized as a Maryland corporation on October 12, 1995.
| | |
| 2. | Significant Accounting Policies |
The following is a summary of significant accounting policies followed by the Company in the preparation of its financial statements. These policies are in conformity with accounting principles generally accepted in the United States of America (‘‘GAAP’’).
Security Valuation: Portfolio securities for which market quotations are readily available are stated at the last sale price reported by the principal exchange for the security as of the exchange’s close of business. Securities for which no sale has taken place during the day and securities which are not listed on an exchange are valued at the mean of the highest closing bid and lowest asked prices. Exchange traded options are valued at the last reported sale price on any exchange on which the option is principally traded. If no sales are reported on a particular day, the options will be valued at the mean between the highest closing bid and lowest asked prices across the exchanges where the option is traded. Non-exchange traded options will also be valued at the mean between the last bid and asked quotations. For options where market quotations are not readily available, value will be determined in accordance with the fair value procedures described below. All other securities and assets for which (a) market quotations are not readily available, such as in the case of a market or technical disruption that prevents the normal trading of a security held by a Portfolio, (b) market quotations are believed to be unrepresentative of fair market value, such as in the case of a thinly traded security, or (c) valuation is normally made at the last sale price on a foreign exchange and a significant event occurs after the close of that exchange but before the New York Stock Exchange close, are valued at their fair value as determined in good faith by the Board of Directors (the ‘‘Board’’) in accordance with Fair Value Procedures established by the Board. The Company’s Fair Value Procedures are implemented and monitored by a Fair Value Committee (the ‘‘Committee’’) designated by the Board. When a security is valued in accordance with the Fair Value Procedures, the Committee determines a value after taking into consideration any relevant information that is reasonably available to the Committee. Some of the more common reasons that may necessitate that a security be valued pursuant to these Fair Value Procedures include, but are not limited to: the security’s trading has been halted or suspended; the security has been de-listed from a national exchange; the security’s primary trading market is temporarily closed at a time when under normal conditions it would be open; or the security’s primary pricing source is not able or willing to provide a price. The assets of each Portfolio may also be valued on the basis of valuations provided by a pricing service approved by, or on behalf of, the Board.
Portfolio securities listed or traded on securities exchanges, including American Depositary Receipts (‘‘ADRs’’), are valued at the closing price on the exchange or system where the security is principally traded or at the NASDAQ Official Closing Price. If there have been no sales for that day on the exchange or system, a security is valued at the mean of the highest closing bid and lowest asked prices on the exchange or system where the security is principally traded.
The Portfolios did not value any securities in accordance with the Fair Value Procedures as of December 31, 2012.
Investment Transactions: Changes in holdings of portfolio securities for the Portfolios shall be reflected no later than in the first calculation on the first business day following the trade date for purposes of calculating each Portfolio’s daily net asset value per share. However, for financial reporting purposes, portfolio security transactions are reported on the trade date of the last business day of the reporting period. The cost (proceeds) of investments sold (bought to cover) is determined on a specific identification basis for the purpose of determining gains or losses on sales and buys to cover short positions. Dividend income, distributions to shareholders and dividend expense from securities sold short are recorded on the ex-dividend date. Interest income and interest expense from securities sold short is recorded on an accrual basis.
Foreign Currency: Foreign currency amounts are translated into U.S. dollars as follows: (i) assets and liabilities at the rate of exchange at the end of the respective period; and (ii) purchases and sales of securities and income and expenses at the rate of exchange prevailing on the dates of such transactions. The portion of realized gains arising from changes in the exchange rates are included with the net realized and unrealized gain or loss on investments. Principal risks associated with such transactions include the movement in value of the foreign currency relative to the U.S. dollar and the ability of the counterparty to perform.
Notes to Financial Statements (Continued)
The Portfolios may also invest in forward currency contracts. Fluctuations in the value of such forward currency transactions are recorded daily as unrealized gain or loss; realized gain or loss includes net gain or loss on transactions that have terminated by settlement. These instruments involve securities and currency market risk, credit risk, or both kinds of risks, in excess of the amount recognized in the statements of assets and liabilities. Risks also arise from the possible inability of counterparties to meet the terms of their contracts. The Portfolios did not enter into forward currency contracts during the year ended December 31, 2012.
Allocation of Expenses: Expenses directly attributable to a Portfolio are charged directly to that Portfolio, while expenses which are attributable to more than one Portfolio are allocated among the respective Portfolios based upon relative net assets or some other reasonable method.
Use of Estimates: The preparation of financial statements in accordance with GAAP requires management to make estimates and assumptions that affect the reported amounts and disclosures in the financial statements. Actual results could differ from those estimates and those differences could be material.
Distributions to Shareholders: Dividends from net investment income, if any, are declared and paid annually for the Portfolios. Distributable net realized gains, if any, are declared and distributed at least annually.
Redemption Fees: The Portfolios reserve the right to assess a redemption fee for shares redeemed within 60 days of purchase. The shareholder will be charged a fee equal to 2.00% of the value of the shares redeemed. The redemption fee is intended to offset excess brokerage commissions and other costs associated with fluctuations in asset levels and cash flows caused by frequent trading by shareholders. The applicability of the redemption fee will be calculated using a first-in first-out method, which means the oldest shares will be redeemed first, followed by the redemption of more recently acquired shares. For the year ended December 31, 2012, NGF, NAGF and NSCGF had contributions to capital due to redemption fees in the amounts of $1,961, $14,166 and $20,159, respectively.
Federal Income Taxes: It is the policy of each Portfolio to continue to qualify as a regulated investment company, as defined in the Internal Revenue Code, by complying with the provisions available to certain investment companies and to make distributions of net investment income and net realized capital gains sufficient to relieve it from all, or substantially all, federal income taxes. Accordingly, no provision for income taxes has been made in the Portfolios’ financial statements.
As of December 31, 2012, the Portfolios did not have any tax positions that did not meet the ‘‘more-likely-than-not’’ threshold of being sustained by the applicable tax authority. Generally, tax authorities can examine all the tax returns filed for the last three years.
Fair Value Measurements: Valuation inputs used to determine the value of the Portfolios’ investments are summarized in the three broad levels listed below:
| | |
| | Level 1 — quoted prices in active markets for identical assets. |
| | |
| | Level 2 — other significant inputs (including quoted prices of similar securities, interest rates, prepayment speeds, credit risk, etc.). |
| | |
| | Level 3 — significant unobservable inputs (which may include the Portfolios’ own assumptions in determining the fair value of investments). |
The inputs or methodology used to value securities are not necessarily an indication of the risk associated with investing in those securities.
Portfolio securities listed or traded on securities exchanges, including ADRs, are valued at the closing price on the exchange or system where the security is principally traded or at the NASDAQ Official Closing Price. If there have been no sales for that day on the exchange or system, a security is valued at the mean of the highest closing bid and lowest asked prices on the exchange or system where the security is principally traded. These valuations are typically categorized as Level 1 in the fair value hierarchy.
In accordance with procedures adopted by the Board, fair value pricing may be used if events materially affecting the value of foreign securities occur between the time the exchange on which they are traded closes and the time the Portfolios’ net asset values are calculated. These valuations are categorized as Level 2 in the fair value hierarchy.
Notes to Financial Statements (Continued)
The following is a summary categorization, as of December 31, 2012, of each Portfolio’s investments based on the level of inputs utilized in determining the value of such investments:
| | | | | | | | | | |
| | | LEVEL 1 - Quoted Prices(1)(3) | |
| | | NGF | | | NAGF | | | NSCGF | |
| Assets | | | | | | | | | |
Common Stocks(2) | | $ | 104,793,911 | | | $ | 65,789,476 | | | $ | 52,945,097 | |
| | | 10,361,879 | | | | 985,630 | | | | 7,211,621 | |
| Liabilities | | | | | | | | | | | | |
Securities Sold Short(2) | | | (7,666,669 | ) | | | (3,759,418 | ) | | | (4,330,346 | ) |
| Total | | $ | 107,489,121 | | | $ | 63,015,688 | | | $ | 55,826,372 | |
(1) As of December 31, 2012, the Portfolios did not hold Level 2 or Level 3 investments.
(2) Please refer to the Schedule of Investments to view segregation by industry.
(3) There were no transfers into or out of Level 1 or Level 2 during the period.
| | |
| 3. | Derivative Instruments and Hedging Activities |
The ‘‘Derivatives and Hedging’’ Topic of the Codification (ASC 815, formerly SFAS 133 and SFAS 161) requires enhanced disclosures about the Portfolios’ derivative and hedging activities, including how such activities are accounted for and their effect on the Portfolios’ financial position, performance and cash flows. The Portfolios did not use derivatives during the year ended December 31, 2012.
| | |
| 4. | Investment Advisory and Administrative Services |
The Company has engaged Needham Investment Management L.L.C. (the ‘‘Adviser’’) to manage its investments. The Company pays the Adviser a fee at the annual rate of 1.25% of the average daily net assets of each Portfolio.
The Adviser has entered into agreements with the Portfolios whereby the Adviser has contractually agreed to waive its fee for, and to reimburse expenses (excluding interest, dividends on short positions, acquired fund fees and expenses and extraordinary items) of NGF, NAGF and NSCGF in an amount that limits annual operating expenses to not more than 1.95% of the average daily net assets. The agreement is effective for the period from May 1, 2012 through May 1, 2013. The agreement shall continue in effect from year to year thereafter only upon mutual agreement of the respective Portfolio and the Adviser.
The Company and U.S. Bancorp Fund Services, LLC (the ‘‘Administrator’’) are parties to a Fund Administration Servicing Agreement. The Administrator provides administrative and fund accounting services pursuant to this agreement and, in consideration of these services, receives a fee computed daily and paid monthly at an annual rate based on a percentage of the value of the Company’s assets. The Administrator is also compensated for any out of pocket expenses that are reasonably incurred by the Administrator in carrying out its duties under the Administration Agreement. The Administrator also provides transfer agent services pursuant to a Transfer Agent Servicing Agreement for additional fees.
Certain officers of the Company are also officers of the Adviser and/or Needham & Company, LLC (the ‘‘Distributor’’). Such officers receive no fees from the Company for serving as officers of the Company. Each of the three Directors who is not an ‘‘interested person’’ (as defined in the 1940 Act) of the Company (each, an Independent Director) receives a quarterly retainer of $3,000 and a per-meeting fee of $500. Each Independent Director is also a member of the Audit Committee of the Company’s Board of Directors and receives a fee of $500 per meeting attended. The Adviser provides an employee to serve as Chief Compliance Officer for the Company and to provide certain related services. An affiliate of the Adviser, Needham & Company, LLC, pays the Chief Compliance Officer’s compensation and the Company reimburses this affiliate for the Company’s portion of the expense.
The Company has adopted an Amended and Restated Plan of Distribution pursuant to Rule 12b-1 under the 1940 Act. Under the Plan, each Portfolio pays the Distributor, and any other distributor or financial institution with which the Company has an agreement with respect to each Portfolio, a fee at an annual rate of 0.25% of each Portfolio’s daily average net assets. For the year ended December 31, 2012, NGF, NAGF and NSCGF paid 12b-1 fees to the Distributor in the amount of $308,017, $205,788, and $187,912, respectively.
During the year ended December 31, 2012, NGF, NAGF and NSCGF incurred and paid brokerage commissions to the Distributor in the amount of $23,685, $22,075, and $64,607, respectively.
Each Portfolio may borrow from banks up to 25% of its total assets and may pledge its assets in connection with these borrowings, provided that no additional investments shall be made while borrowings exceed 5% of total assets.
The Portfolios did not engage in any temporary borrowings during the year ended December 31, 2012.
Notes to Financial Statements (Continued)
| | |
| 7. | Short Sale Transactions |
During the year ended December 31, 2012, each Portfolio sold securities short. Upon selling a security short, the Portfolios record a receivable for the settlement amount and a corresponding liability, which is marked-to-market to reflect current value. Certain securities owned by each respective Portfolio are segregated as collateral while the short sales are outstanding. At December 31, 2012, the market value of securities separately segregated to cover short positions was $4,623,400, $3,767,838, and $7,792,900 for NGF, NAGF and NSCGF, respectively.
Additionally, the Portfolios had receivables for Deposit with Broker for Securities Sold Short of $7,656,184, $3,923,629, and $4,553,584 pledged as collateral with brokers in connection with open short positions for NGF, NAGF and NSCGF, respectively. Securities sold short at December 31, 2012 and their related market values and proceeds are set forth in the preceding Schedule of Securities Sold Short for each Portfolio.
| | |
| 8. | Investment Transactions |
The following summarizes the aggregate amount of the cost of purchases and proceeds from sales of investment securities and securities sold short, excluding short-term securities, during the year ended December 31, 2012:
| | | | | | | | |
| | | Purchases | | | Sales | |
| NGF | | | 31,811,892 | | | 55,698,394 | |
| NAGF | | | 20,407,166 | | | 56,790,392 | |
| NSCGF | | | 63,790,846 | | | 94,878,576 | |
| 9. | Financial Instruments With Off-Balance Sheet Risk |
In the normal course of their business, the Portfolios may trade various financial instruments with off-balance sheet risk. These financial instruments include securities sold short, written options, futures, and forward currency contracts. Generally, these financial instruments represent future commitments to purchase or sell other financial instruments at specific terms at specified future dates. Each of these financial instruments contains varying degrees of off-balance sheet risk whereby changes in the market values of the securities underlying the financial instruments may be in excess of the amounts recognized in the financial statements.
Securities sold short represent obligations of the Portfolios to make future delivery of specific securities and, correspondingly, create an obligation to purchase the securities at market prices prevailing at a later delivery date (or to deliver the securities if already owned by the Portfolios). As a result, short sales create the risk that the Portfolios’ ultimate obligation to satisfy the delivery requirements may exceed the amount of the proceeds initially received on the liability recorded in the financial statements.
Under the Company’s organizational documents, its Directors and officers are indemnified against certain liabilities arising out of the performance of their duties to the Company. In addition, in the ordinary course of business, the Company enters into contracts that contain a variety of indemnifications. The Company’s maximum exposure under these arrangements is unknown. However, the Company has not had prior claims or losses pursuant to these contracts and expects the risk of loss to be remote.
No provision for federal income taxes is required since the Company intends to continue to qualify as a regulated investment company under Subchapter M of the Internal Revenue Code and distribute substantially all of its taxable income and capital gains to shareholders. Because income tax regulations differ from GAAP, the timing and character of income and capital gain distributions determined in accordance with tax regulations can differ from income and capital gains recognized for financial reporting purposes. Accordingly, the character of distributions and the composition of net assets for tax purposes can differ from those reflected in the financial statements. These book/tax differences may be temporary or permanent in nature. Temporary differences are generally due to differing book and tax treatment for the timing of the recognition of gains and losses on securities, including post-October losses (as described below). Permanent differences are generally due to differing treatment of net investment losses. To the extent these differences are permanent, they are charged or credited to paid-in capital, accumulated net realized gain (loss), or accumulated net investment income (loss), as appropriate, in the period in which the differences arise. These reclassifications have no effect on net assets or net asset value per share of each Portfolio.
Notes to Financial Statements (Continued)
As of December 31, 2012, the cost, gross unrealized appreciation, gross unrealized depreciation, and the net unrealized appreciation (depreciation) on securities, including proceeds from securities sold short for federal income tax purposes, were as follows:
| | | | | | | | | | | | | |
| | Cost | | Gross Unrealized Appreciation | | Gross Unrealized Depreciation | | Net Unrealized Appreciation (depreciation) | |
| NGF | | $ | 81,028,401 | | | $ | 41,016,321 | | | $ | (6,888,932 | ) | | $ | 34,127,389 | |
| NAGF | | | 51,835,589 | | | | 20,490,128 | | | | (5,550,611 | ) | | | 14,939,517 | |
| NSCGF | | | 66,312,787 | | | | 3,574,636 | | | | (9,730,705 | ) | | | (6,156,069 | ) |
The difference between the tax cost of investments and the cost of investments for GAAP purposes is primarily due to the tax treatment for wash sale losses.
As of December 31, 2012, the components of distributable earnings (loss) on a tax basis were as follows:
| | | | | | | | | | |
| | | NGF | | | NAGF | | | NSCGF | |
Undistributed ordinary income | | $ | — | | | $ | — | | | $ | — | |
Undistributed long-term capital gains | | | — | | | | — | | | | — | |
Unrealized appreciation (depreciation) | | | 34,127,389 | | | | 14,939,517 | | | | (6,156,069 | ) |
Total accumulated earnings (loss) | | $ | 34,127,389 | | | $ | 14,939,517 | | | $ | (6,156,069 | ) |
The tax character of distributions paid during the year ended December 31, 2012 was as follows:
| | | | | | | | | | |
| | | NGF | | | NAGF | | | NSCGF | |
| Ordinary income | | $ | — | | | $ | — | | | $ | — | |
| Net long-term capital gains | | | 10,206,783 | | | | 42,591 | | | | — | |
| Return of capital | | | — | | | | 38 | | | | — | |
| Total distributions paid | | $ | 10,206,783 | | | $ | 42,629 | | | $ | — | |
Under current tax law, capital and currency losses realized after October 31 of a Portfolio’s fiscal year may be deferred and treated as occurring on the first business day of the following fiscal year for tax purposes. The following Portfolios had deferred post-October capital and currency losses, which will be treated as arising on the first business day of the fiscal year ending December 31, 2012.
| | | | | |
| NGF | | $ | 55,077 | |
| NAGF | | | — | |
| NSCGF | | | 222,207 | |
As of December 31, 2012 the Funds had post-December late year losses of:
As of December 31, 2012 the Funds had accumulated capital loss carryovers of:
| | | | | | | | | | | | |
| | | | Capital Loss | | | | | | | |
| | | | Carryover | | Term | | Expires | |
| NGF | | | $ | — | | | — | | | — | |
| NAGF | | | | (7,026,204 | ) | | Short Term | | | Unlimited | |
| NAGF | | | | (58,742 | ) | | Long Term | | | Unlimited | |
| NSCGF | | | | — | | | — | | | — | |
The Regulated Investment Company Modernization Act of 2010 (the ‘‘Act’’) was enacted on December 22, 2010. The Act made changes to several tax rules impacting the Portfolios. In general, the provisions of the Act were effective for the Company’s fiscal year ending December 31, 2012. Although the Act provides several benefits, including the unlimited carryover of future capital losses, there may be a greater likelihood that all or a portion of each Portfolio’s pre-enactment capital loss carryovers may expire without being utilized due to the fact that post-enactment capital losses get utilized before pre-enactment capital loss carryovers.
The Act also changed the definition of post-October capital losses eligible for elective deferral to the greatest of a Regulated Investment Company’s (‘‘RIC’s’’) net capital loss attributable to the portion of the RIC’s taxable year after October 31, the RIC’s net long-term capital loss attributable to the portion of the RIC’s taxable year after October 31, or the RIC’s net short-term capital loss attributable to the portion of the RIC’s taxable year after October 31. As such, any post-October capital loss which a RIC has elected to defer is deemed to arise on the first day of the RIC’s following taxable year. The aggregate amount of the RIC’s anticipated deferred post-October capital losses would be included in the RIC’s tax basis accumulated loss carryforward, if applicable.
Management has evaluated subsequent events through the date of this filing. This evaluation did not result in any subsequent events that necessitated recognition or disclosures.
Notes to Financial Statements (Continued)
| | |
| 13. | New Accounting Pronouncements |
In December 2011, the Financial Accounting Standards Board issued Accounting Standards Update (‘‘ASU’’) No. 2011-11 ‘‘Disclosures about Offsetting Assets and Liabilities.’’ ASU No. 2011-11 requires disclosures to make financial statements that are prepared under U.S. GAAP more comparable to those prepared under International Financial Reporting Standards. The new disclosure requirements mandate that entities disclose both gross and net information about instruments and transactions eligible for offset in the Statements of Assets and Liabilities as well as instruments and transactions subject to an agreement similar to a master netting arrangement. In addition, ASU No. 2011-11 requires disclosure of collateral received and posted in connection with master netting agreements or similar arrangements. New disclosures are required for annual reporting periods beginning on or after January 1, 2013, and interim periods within those annual periods.
Management is currently evaluating the impact ASU No. 2011-11 will have on the Funds’ financial statements and disclosures.
| | |
| 14. | Change in Independent Registered Public Accounting Firm |
Ernst & Young LLP (‘‘E&Y’’), 1100 Huntington Center, 41 South High Street, Columbus, Ohio 43215, an independent registered public accounting firm, was the independent registered public accounting firm for the Company for the fiscal year ended December 31, 2010. Effective November 23, 2011, the Audit Committee engaged KPMG LLP to replace E&Y as the independent registered public accounting firm for the Company. During the Company’s past two fiscal years and any subsequent interim period: (i) no report on the Company’s financial statements contained an adverse opinion or a disclaimer of opinion, or was qualified or modified as to uncertainty, audit scope, or accounting principles; and (ii) there were no ‘‘disagreements’’ (as such term is used in Item 304 of Regulation S-K) with E&Y on any matter of accounting principles or practices, financial statement disclosure, or auditing scope or procedure, which disagreement(s), if not resolved to the satisfaction of E&Y, would have caused it to make reference to the subject matter of the disagreement(s) in connection with its report.
Report of Independent Registered Public Accounting Firm
The Board of Directors and Shareholders The Needham Funds, Inc.:
We have audited the accompanying statements of assets and liabilities, including the schedules of investments and schedules of securities sold short, of the Needham Growth Fund, Needham Aggressive Growth Fund and Needham Small Cap Growth Fund, each a ‘‘Portfolio’’ of The Needham Funds, Inc. (collectively, the ‘‘Portfolios’’) as of December 31, 2012, the related statements of operations for the year then ended, and the statements of changes in net assets and financial highlights for each of the years in the two-year period then ended. These financial statements and financial highlights are the responsibility of the Portfolios’ management. Our responsibility is to express an opinion on these financial statements and financial highlights based on our audits. The financial highlights for each of the years in the three-year period ended December 31, 2010 were audited by other independent registered public accountants whose report thereon, dated February 28, 2011, expressed an unqualified opinion on those financial highlights.
We conducted our audits in accordance with the standards of the Public Company Accounting Oversight Board (United States). Those standards require that we plan and perform the audit to obtain reasonable assurance about whether the financial statements and financial highlights are free of material misstatement. An audit includes examining, on a test basis, evidence supporting the amounts and disclosures in the financial statements. Our procedures included confirmation of securities owned as of December 31, 2012 by correspondence with the custodian and brokers. An audit also includes assessing the accounting principles used and significant estimates made by management, as well as evaluating the overall financial statement presentation. We believe that our audits provide a reasonable basis for our opinion.
In our opinion, the financial statements and financial highlights referred to above present fairly, in all material respects, the financial position of the Needham Growth Fund, Needham Aggressive Growth Fund and Needham Small Cap Growth Fund as of December 31, 2012, the results of their operations for the year then ended, and the changes in their net assets and the financial highlights for each of the years in the two-year period then ended, in conformity with U.S. generally accepted accounting principles.
New York, New York
February 27, 2013
Information about Directors and Officers (Unaudited)
December 31, 2012
Information pertaining to the Directors and Officers of the Company is set forth below. The Statement of Additional Information (SAI) includes additional information about the Directors and is available without charge, upon request, by calling 800-625-7071.
The address of each individual is 445 Park Avenue, New York, NY 10022-2606. Each Director serves until the next annual shareholders meeting or until his successor is elected and qualified.
| | | | |
Name, Age and Position with the Fund | Term of Office and Length of Term Served by Director/Officer | Portfolios in the Fund Complex Overseen by Director/Officer | Principal Occupation(s) During Past 5 Years and Other Directorships Held by Director/Officer |
| Independent Directors |
John W. Larson, 77, Director | Indefinite; Since 2006 | Three | Partner at the law firm of Morgan, Lewis & Bockius LLP from 2003 until retiring in December 2009. Partner at the law firm of Brobeck, Phleger & Harrison LLP from 1969 until retiring in January 2003. From July 1971 to September 1973 worked in government service as Assistant Secretary of the United States Department of the Interior and Counselor to George P. Schultz, Chairman of the Cost of Living Council. Director of Wage Works, Inc. (an employee benefits company) since 2000. Director of Sangamo BioSciences, Inc. since 1996. |
James P. Poitras, 70, Director | Indefinite; Since 1996 | Three | Currently retired. Director (since 2000) and Chairman (since 2001) of Kyma Technologies, Inc. (a specialty materials semiconductor company). Founder, Chairman, President and Chief Executive Officer of Integrated Silicon Systems (a computer software company) from 1985 to 1995. |
F. Randall Smith, 74, Director | Indefinite; Since 1996 | Three | Founder and Chief Executive and Investment Officer of Capital Counsel LLC (a registered investment adviser) since September 1999. Co-Founder and Managing Partner of Train, Smith Counsel (a registered investment adviser) from 1975 to 1999. |
| Interested Director |
George A. Needham*, 69, Chairman, President and Director | Indefinite; Since 1996 | Three | Chairman of the Board and Chief Executive Officer of The Needham Group, Inc. and Needham Holdings, LLC since December 2004. Chairman of the Board and Chief Executive Officer of Needham Asset Management, LLC since April 2006. Chairman of the Board from 1996 to December 2004 and Chief Executive Officer from 1985 to December 2004 of Needham & Company, LLC. |
| Officers |
John Barr, 56 Executive Vice President and Co-Portfolio Manager of the Needham Growth Fund, Executive Vice President and Portfolio Manager of the Needham Aggressive Growth Fund. | One year: Since 2010 | Two | Portfolio Manager of Needham Asset Management since 2010. Founding and Managing Member of Oliver Investment Management, LLC from 2008 to 2009. Manager and Analyst at Buckingham Capital from 2002 to 2008. Managing Director and a Senior Analyst at Robertson Stephens following semiconductor companies from 2000 to 2002. From 1995 to 2000, Managing Director and Senior Analyst at Needham and Company, also served as Director of Research. Director of Coventor, Inc. since 2009. |
Chris Retzler, 41 Executive Vice President and Co-Portfolio Manager of the Needham Growth Fund, Executive Vice President and Portfolio Manager of the Needham Small Cap Growth Fund. | One year: Since 2008 | Two | Portfolio Manager of Needham Asset Management, LLC since 2008. Vice President of Needham Asset Management, LLC since 2005. Head of Winterkorn, a healthcare manufacturing and distribution company, from 2002 to 2005. |
James W. Giangrasso, 50 Chief Financial Officer, Treasurer and Secretary | One year: Since 2011 | Three | Chief Financial Officer of Needham Asset Management, LLC since 2011. Principal and Controller of Needham Asset Management, LLC since 2006. |
James M. Abbruzzese, 43, Chief Compliance Officer | One year; Since 2004 | Three | Chief Compliance Officer of Needham Asset Management, LLC since April 2006 and Chief Compliance Officer and Managing Director of Needham & Company, LLC since July 1998. |
| | |
| * | An “interested person”, as defined in the 1940 Act, of the Company or the Company’s investment adviser. Mr. Needham is deemed to be an interested person because of his affiliation with the Funds’ Adviser and the Funds’ Distributor, and because he is an officer of the Company. |
Supplementary Information (Unaudited)
December 31, 2012
Federal Income Tax Information
During the year ended December 31, 2012, NGF and NAGF declared and paid long-term realized gains distributions in the amounts of $10,332,430 and $42,629 respectively. NSCGF did not declare any long-term realized gains distributions.
For the year ended December 31, 2012, NGF, NAGF, and NSCGF did not declare any ordinary income distributions.
Privacy Policy
It is the policy of the Company to keep personally identifiable financial information about you as an individual (‘‘nonpublic personal information’’) confidential, and use or disclose it only as necessary to provide services to you or the Company or as otherwise required or permitted by law. We may collect the following nonpublic personal information about you:
| | | |
| | ● | Information we receive from you on or in applications or other forms, correspondence, or conversations, including, but not limited to, your name, address, phone number, social security number, assets, income and date of birth; and |
| | | |
| | ● | Information about your transactions with us, our affiliates, or others, including, but not limited to, your account number and balance, payments history, parties to transactions, cost basis information, other financial information and information about how you vote your shares. |
We disclose nonpublic personal information about current and former shareholders to companies that provide necessary services to the Company. These companies include the transfer agent, distributor, administrator and investment adviser as well as other affiliates of the Company. We maintain physical, electronic and procedural safeguards that comply with federal standards to guard your nonpublic personal information and restrict access to this information to those persons who need it to provide services to you or the Company or who are otherwise permitted by law to receive it. In the event that you hold any shares of our funds through a financial intermediary, including, but not limited to, a broker-dealer, bank, or trust company, the privacy policy of your financial intermediary governs how your non-public personal information is shared with nonaffiliated third parties.
If you have any questions concerning the Company’s Privacy Policy, please call 1-800-625-7071.
Disclosure of Portfolio Holdings
The Company files a Form N-Q with the Securities and Exchange Commission (the ‘‘SEC’’) no more than sixty days after the Company’s first and third fiscal quarters. For the Company, this would be for the fiscal quarters ending March 31 and September 30. Form N-Q includes a complete schedule of the Company’s portfolio holdings as of the end of those fiscal quarters. The Company’s N-Q filings can be found free of charge on the SEC’s website at http://www.sec.gov, or they may be reviewed and copied at the SEC’s Public Reference Room in Washington, D.C. (call 800-SEC-0330 for information on the operation of the Public Reference Room).
Voting Proxies on Company Portfolio Securities
A description of the policies and procedures that the Company uses to determine how to vote proxies relating to portfolio securities and information regarding how the Company voted proxies relating to portfolio securities during the most recent 12-month period ended June 30 are available without charge, upon request, by calling 800-625-7071 or on the SEC’s website at http://www.sec.gov.
Board Consideration and Approval of Investment Advisory Agreement
On October 25, 2012, at a meeting called for the purpose of voting on such approval, the Board of Directors, including all of the Independent Directors, approved the continuance of the Company’s Restated Investment Advisory Agreement (the ‘‘Advisory Agreement’’) between the Company and the Adviser with respect to NGF, NAGF and NSCGF. In doing so, the Board reviewed materials provided by the Adviser to assist them in making a determination (the ‘‘Board Materials’’). The Independent Directors were assisted in their review by independent legal counsel and met with counsel in executive session separate from representatives of the Adviser. In considering the renewal of the Advisory Agreement, the Board considered the nature, extent, and quality of the services to be provided by the Adviser; the investment performance of each Portfolio and the Adviser; the costs of the services to be provided and profits to be realized by the Adviser and its affiliates from the relationship with each Portfolio; the extent to which economies of scale would be realized as the Portfolios grow; and whether fee levels reflect these economies of scale for the benefit of investors.
Supplementary Information (Unaudited) (Continued)
December 31, 2012
The Independent Directors stated that their consideration of the continuance of the Advisory Agreement was influenced primarily by the peer-group comparisons in the Board Materials, noting that overall each Portfolio’s long-term performance was better than its respective peer group average. It was further noted that the Portfolios’ performance compared well to the longer term performance of their respective benchmark indices. In addition to reviewing each Portfolio’s performance and the profitability analysis of the Adviser, the Directors considered possible economies of scale.
In their deliberations, the Directors considered all factors they believed relevant, including the following: information comparing the performance of each of the Portfolios to other investment companies with similar investment objectives and to each Portfolio’s respective unmanaged index; the nature, extent and quality of services rendered by the Adviser; the costs borne by, and profitability of, and other benefits to, the Adviser and its affiliates in providing services to each Portfolio; comparative fee and expense data for each Portfolio and other investment companies with similar investment objectives (having been advised that the Adviser does not manage other accounts with investment objectives and strategies similar to those of the Portfolios except private investment funds with fee structures that include performance fees); whether expenses of NGF, NAGF and NSCGF might be expected to decline as a percentage of net assets as NGF, NAGF and NSCGF assets increase (although there had not been a significant increase in assets over the previous year), concluding that the implementation of advisory fee breakpoints was not presently warranted due to the size of each Portfolio, but that breakpoints would be considered if and when appropriate; the professional experience and qualifications of each Portfolio’s management team and other personnel of the Adviser, including the fact that a high caliber of personnel was both needed and provided to meet the needs of the shareholders of NGF, NAGF and NSCGF specifically with respect to investments in securities sold short; and the terms of the Advisory Agreement. The Independent Directors confirmed that they had received adequate other information to make a reasonable determination with respect to the approval of the Advisory Agreement. After full consideration of all the foregoing factors, as well as those discussed below, the Board concluded that the advisory fee was both fair and reasonable given the nature, extent and quality of services provided by the Adviser, and renewal of the Advisory Agreement was in the best interests of each Portfolio and its shareholders.
| | |
| | |
| | |
| |  |
| | 445 Park Avenue |
| | New York, New York 10022-2606 |
| | 1-800-625-7071 |
| | |
| | Investment Adviser: |
| | Needham Investment Management L.L.C. |
| | 445 Park Avenue |
| | New York, NY 10022-2606 |
| | |
| | President |
| | George A. Needham |
| | |
| | Executive Vice Presidents and Portfolio Managers |
| | John Barr |
| | Needham Growth Fund |
| | Needham Aggressive Growth Fund |
| | |
| | Chris Retzler |
| | Needham Growth Fund |
| | Needham Small Cap Growth Fund |
| | |
| | Directors |
| | George A. Needham |
| | John W. Larson |
| | James P. Poitras |
| | F. Randall Smith |
| | |
| | Distributor: |
| | Needham & Company, LLC |
| | 445 Park Avenue |
| | New York, NY 10022-2606 |
| | 212-371-8300 |
| | |
| | Administrator, Shareholder Servicing |
| | Agent and Transfer Agent: |
| | U.S. Bancorp Fund Services, LLC |
| | 615 East Michigan Street |
| | Milwaukee, WI 53202 |
| | |
| | Custodian: |
| | U.S. Bank, N.A. |
| | 1555 North RiverCenter Drive |
| | Milwaukee, WI 53212 |
| | |
| | Counsel: |
| | Stroock & Stroock & Lavan LLP |
| | 180 Maiden Lane |
| | New York, NY 10038 |
| | |
| | Independent Registered Public Accounting Firm: |
| | KPMG LLP |
| | 345 Park Avenue |
| | New York, NY 10154 |