445 Park Avenue
New York, New York 10022-2606
1-800-625-7071
www.needhamfunds.com
| Annual Report | |
| December 31, 2011 | |
| | |
| Contents | |
| | |
| Letter from the Adviser | 1 |
| Portfolio Characteristics | |
| Needham Growth Fund | 6 |
| Needham Aggressive Growth Fund | 7 |
| Needham Small Cap Growth Fund | 8 |
| Disclosure of Fund Expenses | 9 |
| Schedules of Investments | |
| Needham Growth Fund | 10 |
| Needham Aggressive Growth Fund | 13 |
| Needham Small Cap Growth Fund | 16 |
| Schedules of Securities Sold Short | |
| Needham Growth Fund | 12 |
| Needham Aggressive Growth Fund | 15 |
| Needham Small Cap Growth Fund | 18 |
| Statements of Assets and Liabilities | 19 |
| Statements of Operations | 20 |
| Statements of Changes in Net Assets | 21 |
| Financial Highlights | |
| Needham Growth Fund | 22 |
| Needham Aggressive Growth Fund | 23 |
| Needham Small Cap Growth Fund | 24 |
| Notes to Financial Statements | 25 |
| Report of Independent Registered Public | |
| Accounting Firm | 30 |
| Information about Directors and Officers | 31 |
| Supplementary Information | |
| and Privacy Policy | 32 |
This report is authorized for distribution to prospective investors only when preceded or accompanied by a current prospectus. The prospectus contains more complete information, including investment objectives, risks, expenses and charges and should be read carefully before investing or sending any money. To obtain a prospectus or summary prospectus, please call 1-800-625-7071.
Portfolios of The Needham Funds, Inc., like all mutual funds:
The Needham Funds, Inc. are distributed by Needham & Company, LLC.
| Needham Funds | Annual Report 2011 |
 | 445 Park Avenue New York, NY 10022 (800) 625-7071 www.needhamfunds.com |
February 2012
Dear Shareholders, Friends of Needham and Prospective Shareholders,
Please find below our 2011 summary for the Needham Growth Fund, Needham Aggressive Growth Fund and Needham Small Cap Growth Fund.
Needham Funds 2011 Overview
2011 was a difficult year for growth equities and the Needham Funds, although the funds had strong performance in the fourth quarter and have had a strong start to 2012. The Needham Growth Fund was down 10.9% for the year, but up 15.5% for the fourth quarter; the Needham Aggressive Growth Fund was down 13.8% for the year, but up 15.9% for the fourth quarter; and the Needham Small Cap Growth Fund was down 16.1% for the year, but up 9.7% for the fourth quarter.
Merger and acquisition activity contributed positively to the funds in 2010 and again in 2011. The growth opportunities for our micro, small and mid cap companies make them attractive acquisition targets. We believe the trend will continue in 2012. Our largest contributor for the year across all three funds was EMS Technologies, which was acquired by Honey-well (HON) in August. Another top contributor to all three funds was TomoTherapy, which was acquired by Accuray (ARAY) in June. The funds also benefited from the acquisitions of Southwall Technologies, Advanced Analogic Technologies, Vital Images, Genoptix, and the proposed acquisition of ISTA Pharmaceuticals (ISTA).
Early in 2011, Seagate Technology (STX), a manufacturer of hard disk drives that is a major holding of all three funds, announced that it would not pursue a sale of the company, but a restructuring of its operations and balance sheet. The company announced aggressive buyback and dividend plans, which it increased in January 2012. The disk drive industry is benefitting from consolidation as Seagate has purchased Samsung’s hard drive operations and Western Digital is in the process of acquiring Hitachi GST. Seagate also benefitted from the tragic floods in Thailand, as its facilities and supply chain were relatively unscathed compared to its competitors. Seagate has a 3.8% dividend yield as of February 13 and has been a major contributor so far in 2012.
Market Commentary
2011 was a three act play. The market entered the year with the S&P 500 Index up six of eight weeks with hardly a correction. From the beginning of the year through early July, the Needham Growth Fund was up 5.6%. There were corrections in the first and second quarters and the macro environment was full of turmoil. The Middle East was in revolt and is still fraught with risk, as Syria is in revolt and the West imposes sanctions on Iranian oil. On March 11, Japan was struck by the tsunami and the Bank of Japan responded with a $300 billion injection into its banking system.
From mid-July through the end of September, the Needham Growth Fund was down 30.6% from peak to trough and the Russell 2000 Index was down 30.1%. First, we had thought the United States’ debt ceiling negotiations would be completed in mid-July without much ado, but they stretched to early August. The process was unseemly. As Reinhart and Rogoff wrote in their book, This Time Is Different, countries run into serious trouble when the debt to GDP ratio reaches 80-90%—and we are there. Second, the Federal Reserve’s Quantitative Easing-2 program ended on June 30, which meant a slowing in liquidity injections. Third, business slowed significantly in July and August. In the semiconductor industry, inventories fell to the point that they needed to be rebuilt. And fourth, the European debt crisis moved beyond Greece as Spanish and Italian bond yields jumped.
In late September, the Federal Reserve announced Operation Twist, whereby it sells short-term Treasuries and buys long-term Treasuries. In addition to managing short-term rates, which had been set at 0%, through open market operations, the Federal Reserve is now participating in the longer-term markets with an objective of lowering mortgage and commercial interest rates. These actions set the stage for the year to end with a bang. The Needham Growth Fund was up 17.5% in October and closed the fourth quarter up 15.5%.
In November, Europe almost imploded and a major European bank was reported to have been on the verge of collapse. At the beginning of December, worldwide central banks coordinated action to lower interest rates on U.S. dollar swap liquidity lines. On December 9, at yet another summit, European leaders agreed to deficit limits (again). Most importantly, on December 21, European banks bid for €489 billion of three-year 1% loans from the European Central Bank. In late January 2012, the Federal Reserve stated that it would keep interest rates at 0% through 2014, as the Open Market Committee seeks to foster maximum employment, which is a far cry from 8.5% unemployment. This all paved the way for quite a rally in January. In January 2012, the Needham Growth Fund was up 9.4%, while the S&P 500 Total Return Index was up 4.5%.
As of February 6, 2012, the average correlation of the S&P 500 to its 500 stocks was at 78%, which was near an all-time high. Jim Bianco of Bianco Research LLC wrote that because correlation is high due to central bank intervention, it is as if every company had a Chairman of the Board of Directors named Ben Bernanke dictating capital allocation decisions and the market’s reaction to them. As fundamental investors in stocks, we find this correlation distressing, but believe it too shall pass. However, what won’t pass is the need for the authorities around the world to continue to supply liquidity. Our job is to find equities which we believe will outperform a market that rises on liquidity. Thus, we remain bullish on equities and believe that our universe of predominantly small cap and mid cap growth equities is full of opportunity.
Needham Growth Fund
2011 was a challenging year for the Needham Growth Fund, as the Fund was down 10.9% for the year. The challenges were concentrated in the third quarter, when the Fund was down 25.8%. With a strong fourth quarter 2011 and year-to-date 2012, when the Fund is up 14.4%, last year’s losses have been more than made up. As we generally buy stocks to hold for long-term gains, we found that many of our stocks that had great performance in 2010 suffered in the third quarter of 2011.
The Fund’s largest contributor in 2011 was EMS Technologies. On April 19, EMS announced that it had hired an investment banker to explore a sale (the stock had been at $24.00 per share). On June 13, EMS announced an agreement to be acquired by Honeywell (HON) for $33.00 per share; the transaction closed on August 22.
Our second largest contributor was IPG Photonics (IPGP). IPG Photonics is the leader in the new category of fiber lasers. Its lasers can be used in cutting and welding in automotive and general manufacturing markets. Fiber lasers replace other laser technologies and gas welding. Fiber lasers give a faster, cleaner cut or weld and are very early in their adoption by general manufacturing. We exited our position in the third quarter due to valuation and concerns over slowing manufacturing activity. We will look to reestablish this holding in the future.
Entropic Communications (ENTR) is the second largest holding across the three mutual funds and was our largest loser during the year, but was one of our top contributors in 2010, in the fourth quarter of 2011, and in January 2012. Entrop-ic’s MoCA3 integrated circuits are used in whole-house digital video recorders. New cable TV services subscribers mean good business for Entropic. The company reported disappointing guidance in July as Verizon (VZ) was in the midst of a strike and DIRECTV (DTV) was suffering as a result of the NFL lockout. As expected, Broadcom (BRCM) introduced a competitive integrated product. We believe the standard is moving toward MoCA3 2.0 and that Entropic is well positioned.
In January 2012, Entropic announced an agreement to acquire Trident Microsystems’ $120 million per year set-top box system-on-chip business for $55 million. The acquisition was announced coincident with Trident’s bankruptcy filing. Trident is second to Broadcom (BRCM) in its markets. In addition to being the leader in MoCA3 2.0, the combination will be the leading alternative source to Broadcom for semiconductors for the emerging home gateway market. As the stalking horse bidder, Entropic has advantages in the bidding process, which could lead to a late February selection and closing. Entropic’s stock price is up 113% from its August lows.
In 2011, we were also hurt by Express Scripts (ESRX), which is a long-time holding and our largest holding in the Fund. On July 22, Express Scripts announced an agreement to acquire Medco Health Solutions (MHS) for $29 billion. Both companies are pharmacy benefit managers. The merger should double the size of Express Scripts and the combined company could see over $1 billion in annual cost savings. We expect a potential closing of the merger in mid-2012. Contract renegotiations with Walgreens Pharmacy have also affected ESRX’s outlook and should provide a tailwind to the stock once they are resolved in 2012. Express Scripts was down due to uncertainty about the merger and over the political/budget pressure on healthcare companies from Washington. From its low in October, the stock is up 44%. We see Express Scripts as contributing savings to the healthcare system and a long-term winner.
In the fourth quarter, we reduced our long invested position from 94% to 86% of assets. We also exited nine long positions, while adding just one. We increased our average market cap exposure as we added large cap and small cap stocks, while reducing mid cap and micro cap stocks. Each of these decisions was made on a stock-by-stock basis. We are biased to continuing to slightly increase the average market capitalization of our investments in the Needham Growth Fund. This should serve to decrease the volatility of the Fund.
Needham Aggressive Growth Fund
The Needham Aggressive Growth Fund was down 13.8% for the year. The challenges were concentrated in the third quarter, when the Fund was down 26.9%. In the fourth quarter, the Fund was up 15.9% and it was up another 10.7% in January 2012. As we generally buy stocks to hold for long-term gains, we found that many of our stocks that had strong performance in 2010 suffered in the third quarter of 2011.
Our top contributors included EMS Technologies, Seagate and ISTA Pharmaceuticals (ISTA). In December, Valeant Pharmaceuticals (VRX-TSE) announced an offer to acquire ISTA Pharmaceuticals and the stock appreciated 72%. PDF Solutions (PDFS) was also a major contributor in 2011. PDF supplies software and services to help semiconductor companies ramp new processes. PDF should benefit as Samsung manufactures the A5 processor for Apple and as Global Foundries ramps its leading edge processes in Dresden and Malta, New York.
Our largest detractors included Entropic Communications, FormFactor (FORM), Emulex (ELX) and Akamai (AKAM). FormFactor supplies wafer probe cards to the semiconductor industry and is valued near its cash value. While new management under CEO Tom St. Dennis has done a good job of focusing on the new Smart Matrix products and cutting expenses, FormFactor has suffered along with its DRAM (Dynamic Random Access Memory) customers. DRAMs makers have suffered as the personal computer market growth has slowed due to the Thailand flood and to the rise of tablets.
Emulex and Akamai were both significant positive contributors in the fourth quarter and in January. Akamai is the largest holding in the Fund. As of December 30, 2011, the stock was up 77% since its early October low. The company reported solid results in October. In December, Akamai announced an agreement to acquire Cotendo, which is a private company with web and mobile acceleration technology. Akamai is still valued at just 11x 2012 estimated EBITDA, with 13% revenue growth estimated for 2012.
At the end of the fourth quarter, we had increased our large cap holdings to 14.3% from 9.8% as of September 30, 2011. We reduced our micro cap holdings to 13.0% from 17.8%. While these changes were made on stock-by-stock decisions, they should serve to reduce volatility.
Needham Small Cap Growth Fund
The fourth quarter saw a recovery in some of our stocks. However, the typical December rally was limited by both tax selling and light volumes. We were able to add to positions in some of our portfolio holdings when attractive prices were available. We maintained our focus on 2012 opportunities and the potential for a snap-back in small cap stocks in January, which occurred. Although we exited the year disappointed in the overall performance of the Fund in 2011, we have already seen a significant recovery in most of our holdings in January 2012.
The Small Cap Growth Fund’s top contributors in 2011 came from healthcare, technology and specialty retail. The largest contributor was EMS Technologies, followed by one of our consumer discretionary investments, True Religion (TRLG). We sold our True Religion position throughout the year as it hit our price targets. Other leading contributors included healthcare companies Genoptix (acquired by Novartis), Omnicell (OMCL), Thoratec (THOR) and Catalyst Health Solutions (CHSI).
Our largest losers included Entropic, FormFactor, Emulex and Oclaro (OCLR). We would like to highlight Emulex as one of our favorite investments for 2012. In late 2011, there was a delay in the launch of the Romley chip, Intel’s (INTC) much anticipated next-generation processor that will allow for lower power use and higher efficiency. This delay caused Emulex, along with other companies leveraged to Romley, to underperform. However, it seems that Romley is on track to begin shipping by the end of the first quarter in 2012 and shipments should consistently increase throughout the year. Romley allows more processing jobs to be run on a server and creates a need for more input/output ports. Emulex’s 10GB Ether-net network adapters are used to move data on and off of a server. The greater the traffic, the greater the need for Emulex.
We also believe Oclaro, which suffered from the carrier spending slowdown in the second half of 2011, will benefit in 2012. Oclaro had company-specific issues with difficulties transitioning its ROADM (reconfigurable optical add drop multiplexer) product to manufacturing. ROADMs will be a key component of the next-generation carrier networks. We expect that carrier spend should return by the end of 2012, as there is an increased number of devices putting ever increasing strain on the capacity of carrier networks.
The S&P is up 20.4% since the bottom in September, therefore, we believe the market is due for a pause. At the end of December, the Fund had a 10.3% cash position and a 3.7% short position. During the fourth quarter, we increased the number of short positions from four to seven, which gives us the opportunity to increase our short exposure in the future.
We would like to take a moment to address the higher than normal levels of cash held in the Fund. Typically, the Fund invests at least 80% of its net assets in small capitalization equity securities of domestic issuers. Due to the abnormal market conditions that we have faced over the past few years, we have maintained, and continue to maintain, a higher than usual cash position until we observe a more normal investment environment.
Investment Themes for 2012
(1) Intel’s Romley processor and virtualized data centers will make the cloud even more productive. We believe that 2012 is the forefront of a generational change in information technology and enterprise virtualization is the big theme. Virtualized servers require less power, less floor space and fewer computers. Virtualization is primarily an economic move, although it enables new applications because it reduces computing as a constraint. The extra processing allows e-commerce sites to more quickly introduce new functionality. Intel’s Romley takes virtualization to a new level and should stimulate demand for new, more efficient servers.
Virtualization requires a lot of input/output, which is good for our Emulex investment. It also creates communications traffic in the data center, which is good for Brocade (BRCD) and Cisco (CSCO). It also requires more storage, which is good for storage system vendors like EMC and the hard-disk drive makers Seagate and Western Digital.
(2) Third-party data centers are the place to be. The move to external data centers will continue. It is becoming less economical for enterprises to be in the data center real-estate business. We own Equinix (EQIX).
(3) Apple continues to be the star. Apple (AAPL) was a star in 2011 and left its competitors and their suppliers behind. Apple’s iPhones, iPads, Macs, e-commerce and China opportunity have significant growth ahead. We should benefit from owning Apple and its suppliers, including TTM Technologies (TTMI), Multi-Fineline Elec-tronix (MFLX), Jabil Circuits (JBL), PDF Solutions (PDFS), TriQuint Semiconductor (TQNT), and a number of semiconductor capital equipment companies.
(4) Semiconductor capital equipment will benefit from technology and capacity buys as Taiwan Semiconductor Manufacturing (TSM), Samsung and even Intel compete for Apple and its suppliers’ business. We own a number of semiconductor capital equipment and materials companies with broad exposure, including Entegris (ENTG), ATMI (ATMI), Brooks Automation (BRKS), MKS Instruments (MKSI) and Nova Measuring Instruments (NVMI).
(5) Specialty retail stocks should benefit from the current pullback in cotton prices and attractive valuations. We own American Eagle Outfitters (AEO) and Aeropostale (ARO), and will continue to look for opportunities in this sector where we see value.
(6) Technology M&A will continue. The large IT companies—IBM, HP, Oracle, Dell and Cisco—have strategies of offering complete stacks of hardware, software, services and security. After a lull in the third quarter, M&A activity picked up. We expect it to continue in 2012.
Investment Outlook
We continue to believe that monetary authorities around the world will apply liquidity to the financial system. Whether the problem is Greek or other European debt, U.S. unemployment, U.K. stagflation, Chinese bank lending or natural disasters, the international answer is to provide liquidity. This liquidity can be provided through lower interest rates, swap lines, bank lending facilities, budget deficits and a host of other invisible means. Watch the headlines for these code words. As an example, in late February, the ECB will release another tranche of LTRO (long-term refinancing operation).
Inflation will be the check on liquidity injections. For now, U.S. reported inflation is less than the desired 2%. Alternative inflation estimates by John Williams of ShadowStats suggest current real-life inflation is much higher. As long as the official statistics provide cover and unemployment is above the desired 4-6%, liquidity will reign. Equities will do well in a liquidity environment.
After five weeks of strong performance, we believe the market may be due for a pause. However, valuations remain attractive as 14 of our top 20 positions are valued at enterprise values of just 1.3-1.6x 2012 estimated revenues. We are positive on the prospects for 2012.
We believe growth equities are a better place to be than the bond market or cash. Growth companies are managed by smart entrepreneurs always looking for a way to improve earnings and cash generation. Bonds are subject to the risk of higher interest rates and cash loses its purchasing power as the price of goods, not reflected in the Consumer Price Index, goes up. We continue to find stocks within our mid and small cap universes that are attractively valued and will benefit from our 2012 themes.
Closing
We remain positive on our strategy of investing in companies that we know well and that we believe are positioned with secular growth drivers. We welcome our new investors and thank all of our investors for their continued support. If you have any questions, thoughts or concerns, please contact us at (800) 625-7071 or send us an email at cretzler@needhamco.com or jbarr@needhamco.com. For information about the funds, please visit our website at www.needhamfunds.com.
Sincerely,
 |  |
| Chris Retzler | John O. Barr |
| Portfolio Manager | Portfolio Manager |
| NEEDHAM GROWTH FUND | | | | | | TICKER: NEEGX |
| | | Comparative Performance Statistics as of December 31, 2011 (Unaudited) | |
| | | | | | | | | Since | Gross Expense | |
| | | | 6 Months(7) | 1 Year | 3 Years(8) | 5 Years(8) | 10 Years(8) | Inception(8)(12) | Ratio(14) | |
| | Needham Growth Fund(1) | -14.27% | -10.94% | 19.78%(9) | 1.09%(10) | 4.82%(11) | 13.21%(13) | 2.07% | |
| | S&P 500 Index(2)(3) | -3.69% | 2.11% | 14.11% | -0.25% | 2.92% | 6.47% | | |
| | NASDAQ Composite Index(2)(4) | -5.53% | -0.79% | 19.44% | 2.50% | 3.74% | 6.47% | | |
| | S&P 400 MidCap Index(2)(5) | -9.48% | -1.73% | 19.57% | 3.32% | 7.04% | 10.54% | | |
| | Russell 2000 Index(2)(6) | -9.77% | -4.18% | 15.63% | 0.15% | 5.62% | 6.86% | | |
| | Past performance does not guarantee future results. The performance data quoted represents past performance, and current returns may be lower or higher. The investment return and net asset value will fluctuate so that an investor’s shares, when redeemed, may be worth more or less than the original cost. To obtain performance information current to the most recent month-end, please call 1-800-625-7071. The returns shown in the above table and accompanying footnotes are net of expenses. The table above does not reflect the deduction of taxes that a shareholder would have paid on Fund distributions or on the redemption of Fund shares. | |
| | 1. | Investment results calculated after reinvestment of dividends. | | | | | | | | |
| | 2. | It is not possible to invest directly in an index. The performance of the index does not include the deduction of expenses associated with a mutual fund, such as investment management fees. | |
| | 3. | The S&P 500 Index is a broad unmanaged measure of the U.S. stock market. | |
| | 4. | The NASDAQ Composite Index is a broad-based capitalization-weighted index of all NASDAQ Global Market and Small Cap stocks. | | | |
| | 5. | The S&P 400 MidCap Index is a broad unmanaged measure of the U.S. stock market. | |
| | 6. | The Russell 2000 Index is a broad unmanaged index composed of the smallest 2,000 companies in the Russell 3000 Index. | | | | |
| | 7. | Not annualized. | | | | | | | | |
| | 8. | Compound annual growth rate (annualized return). Assumes all dividends were reinvested in shares of the Fund. | | | | |
| | 9. | Cumulative return for the three year period was 71.84%, assuming all dividends were reinvested in shares of the Fund. | | | | |
| | 10. | Cumulative return for the five year period was 5.57%, assuming all dividends were reinvested in shares of the Fund. | | | | |
| | 11. | Cumulative return for the ten year period was 60.11%, assuming all dividends were reinvested in shares of the Fund. | | | | |
| | 12. | The inception date of the Fund was 1/1/96. | | | | | | | | |
| | 13. | Cumulative return since inception was 628.19%, assuming all dividends were reinvested in shares of the Fund. | |
| | 14. | Gross expense ratio is from the Fund’s prospectus dated May 1, 2011. Additional information pertaining to the Fund’s expense ratios as of December 31, 2011 can be found in the financial highlights. Since January 1, 2009, the investment performance reflects contractually agreed upon fee waivers which expire at the close of business on May 1, 2012. Without these fee waivers, the performance would have been lower. Excluding the indirect costs of investing in acquired funds, total net fund operating expenses would be 2.06%. | |
| | Top Ten Holdings* | | | Sector Weightings* |
| | (as a % of total investments, as of December 31, 2011) | | | (as a % of total investments, as of December 31, 2011) |
| | | | % of Total | | | | | | | | |
| | Security | | Investments† | | | | Sector | Long(1) | (Short)(1) | Total(1)(2) | |
| | 1) Express Scripts, Inc. | ESRX | 9.27% | | | Consumer Discretionary | 7.0% | (0.2)% | 6.8% | |
| | 2) Seagate Technology PLC | STX | 5.67% | | | Energy | 1.5% | — | 1.5% | |
| | 3) Viasat, Inc. | VSAT | 4.89% | | | Financials | 1.8% | — | 1.8% | |
| | 4) Thermo Fisher Scientific, Inc. | TMO | 4.77% | | | Health Care | 24.9% | — | 24.9% | |
| | 5) CarMax, Inc. | KMX | 4.71% | | | Industrials | 2.9% | (0.5)% | 2.4% | |
| | 6) Brooks Automation, Inc. | BRKS | 4.21% | | | Information Technology | 50.4% | (2.4)% | 48.0% | |
| | 7) Entropic Communications, Inc. | ENTR | 3.75% | | | Cash | 14.6% | 0 % | 14.6% | |
| | 8) Varian Medical Systems, Inc. | VAR | 3.40% | | | * | Current portfolio holdings may not be indicative of future portfolio holdings. | |
| | 9) Becton Dickinson and Co. | BDX | 3.17% | | | (1) Percentage of total investments includes all stocks, plus cash minus all short positions. | |
| | 10) Jabil Circuit, Inc. | JBL | 2.72% | | | (2) | Total represents the difference between the long exposure and the short exposure, which | |
| | Top Ten Holdings = 46.56% of Total Investments† | | | | | | produces the net exposure. | |
| | * Current portfolio holdings may not be indicative of future portfolio holdings. | | | | | |
| | † Percentage of total investments less cash. | | | | | | | | | | |
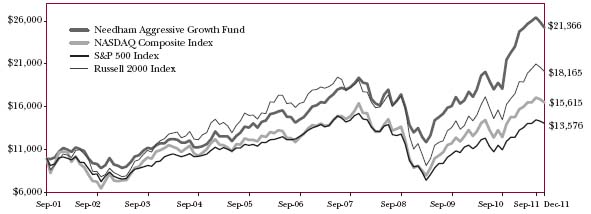
Comparison of Change in Value of a $10,000 Investment
Past performance does not guarantee future results. The performance data quoted represents past performance, and current returns may be lower or higher. The investment return and net asset value will fluctuate so that an investor’s shares, when redeemed, may be worth more or less than the original cost. To obtain performance information current to the most recent month-end, please call 1-800-625-7071. The graph above does not reflect the deduction of taxes that a shareholder would have paid on Fund distributions or on the redemption of Fund shares. Since inception, the Fund’s Adviser has absorbed certain expenses of the Fund, without which returns would have been lower.
The Global Industry Classification Standard (GICS3) was developed by and/or is the exclusive property of MSCI, Inc. and Standard & Poor Financial Services LLC (‘‘S&P’’). GICS is a service mark of MSCI and S&P and has been licensed for use by U.S. Bancorp Fund Services, LLC.
| NEEDHAM AGGRESSIVE GROWTH FUND | | | | | | TICKER: NEAGX |
| | | Comparative Performance Statistics as of December 31, 2011 (Unaudited) | |
| | | | | | | | | Since | Gross Expense | |
| | | | 6 Months(6) | 1 Year | 3 Years(7) | 5 Years(7) | 10 Years(7) | Inception(7)(11) | Ratio(13) | |
| | Needham Aggressive Growth Fund(1) | -15.30% | -13.77% | 16.40%(8) | 5.70%(9) | 6.64%(10) | 7.63%(12) | 2.01% | |
| | S&P 500 Index(2)(3) | -3.69% | 2.11% | 14.11% | -0.25% | 2.92% | 3.01% | | |
| | NASDAQ Composite Index(2)(4) | -5.53% | -0.79% | 19.44% | 2.50% | 3.74% | 4.41% | | |
| | Russell 2000 Index(2)(5) | -9.77% | -4.18% | 15.63% | 0.15% | 5.62% | 5.95% | | |
| | Past performance does not guarantee future results. The performance data quoted represents past performance, and current returns may be lower or higher. The investment return and net asset value will fluctuate so that an investor’s shares, when redeemed, may be worth more or less than the original cost. To obtain performance information current to the most recent month-end, please call 1-800-625-7071. The returns shown in the above table and accompanying footnotes are net of expenses. The table above does not reflect the deduction of taxes that a shareholder would have paid on Fund distributions or on the redemption of Fund shares. | |
| | 1. | Investment results calculated after reinvestment of dividends. | | | | | | | | |
| | 2. | It is not possible to invest directly in an index. The performance of the index does not include the deduction of expenses associated with a mutual fund, such as investment management fees. | |
| | 3. | The S&P 500 Index is a broad unmanaged measure of the U.S. stock market. | | | | | | | |
| | 4. | The NASDAQ Composite Index is a broad-based capitalization-weighted index of all NASDAQ Global Market and Small Cap stocks. | | | |
| | 5. | The Russell 2000 Index is a broad unmanaged index composed of the smallest 2,000 companies in the Russell 3000 Index. | | | |
| | 6. | Not annualized. | | | | | | | | |
| | 7. | Compound annual growth rate (annualized return). Assumes all dividends were reinvested in shares of the Fund. | | | | |
| | 8. | Cumulative return for the three year period was 57.71%, assuming all dividends were reinvested in shares of the Fund. | | | | |
| | 9. | Cumulative return for the five year period was 31.96%, assuming all dividends were reinvested in shares of the Fund. | | | | |
| | 10. | Cumulative return for the ten year period was 90.26%, assuming all dividends were reinvested in shares of the Fund. | | | | |
| | 11. | The inception date of the Fund was 9/4/2001. | | | | |
| | 12. | Cumulative return since inception was 113.66%, assuming all dividends were reinvested in shares of the Fund. | | | | |
| | 13. | Gross expense ratio is from the Fund’s prospectus dated May 1, 2011. Additional information pertaining to the Fund’s expense ratios as of December 31, 2011 can be found in the financial highlights. Since inception, the investment performance reflects contractually agreed upon fee waivers which expire at the close of business on May 1, 2012. Without these fee waivers, the performance would have been lower. Excluding the indirect costs of investing in acquired funds, total net fund operating expenses would be 1.99%. | |
| | Top Ten Holdings* | | | Sector Weightings* |
| | (as a % of total investments, as of December 31, 2011) | | | (as a % of total investments, as of December 31, 2011) |
| | | | % of Total | | | | | | |
| | Security | Ticker | Investments† | | | Sector | Long(1) | (Short)(1) | Total(1)(2) |
| | 1) Akamai Technologies, Inc. | AKAM | 9.09% | | | Consumer Discretionary | 2.4% | — | 2.4% |
| | 2) Entropic Communications, Inc. | ENTR | 5.17% | | | Energy | 2.0% | — | 2.0% |
| | 3) PDF Solutions, Inc. | PDFS | 4.40% | | | Financials | 2.5% | — | 2.5% |
| | 4) Seagate Technology PLC | STX | 3.79% | | | Health Care | 11.1% | — | 11.1% |
| | 5) Formfactor, Inc. | FORM | 3.49% | | | Industrials | 1.1% | (0.8)% | 0.3% |
| | 6) TTM Technologies, Inc. | TTMI | 3.40% | | | Information Technology | 82.6% | (2.6)% | 80.0% |
| | 7) Mercury Computer Systems, Inc. | MRCY | 2.85% | | | Cash | 1.7% | — | 1.7% |
| | 8) Finisar Corp. | FNSR | 2.83% | | | * Current portfolio holdings may not be indicative of future portfolio holdings. |
| | 9) Emulex Corp. | ELX | 2.77% | | | (1) Percentage of total investments includes all stocks, plus cash minus all short positions. |
| | 10) Saba Software, Inc. | SABA | 2.71% | | | (2) Total represents the difference between the long exposure and the short exposure, which |
| | | | | | | produces the net exposure. | | | |
| | Top Ten Holdings = 40.50% of Total Investments† | | | | | | |
| | * Current portfolio holdings may not be indicative of future portfolio holdings. | | | | | | |
| | † Percentage of total investments less cash. | | | | | | | | |
Comparison of Change in Value of a $10,000 Investment
Past performance does not guarantee future results. The performance data quoted represents past performance, and current returns may be lower or higher. The investment return and net asset value will fluctuate so that an investor’s shares, when redeemed, may be worth more or less than the original cost. To obtain performance information current to the most recent month-end, please call 1-800-625-7071. The graph above does not reflect the deduction of taxes that a shareholder would have paid on Fund distributions or on the redemption of Fund shares. Since inception, the Fund’s Adviser has absorbed certain expenses of the Fund, without which returns would have been lower.
The Global Industry Classification Standard (GICS3) was developed by and/or is the exclusive property of MSCI, Inc. and Standard & Poor Financial Services LLC (‘‘S&P’’). GICS is a service mark of MSCI and S&P and has been licensed for use by U.S. Bancorp Fund Services, LLC.
| NEEDHAM SMALL CAP GROWTH FUND | | | | | TICKER: NESGX |
| | Comparative Performance Statistics as of December 31, 2011 (Unaudited) | |
| | | | | | | | Since | Gross Expense | |
| | | | 6 Months(6) | 1 Year | 3 Years(7) | 5 Years(7) | Inception(7)(10) | Ratio(12) | |
| | Needham Small Cap Growth Fund(1) | -16.33% | -16.10% | 17.48%(8) | 4.00%(9) | 10.02%(11) | 2.06% | |
| | S&P 500 Index(2)(3) | -3.69% | 2.11% | 14.11% | -0.25% | 3.58% | | |
| | NASDAQ Composite Index(2)(4) | -5.53% | -0.79% | 19.44% | 2.50% | 5.61% | | |
| | Russell 2000 Index(2)(5) | -9.77% | -4.18% | 15.63% | 0.15% | 5.68% | | |
| | Past performance does not guarantee future results. The performance data quoted represents past performance, and current returns may be lower or higher. The investment return and net asset value will fluctuate so that an investor’s shares, when redeemed, may be worth more or less than the original cost. To obtain performance information current to the most recent month-end, please call 1-800-625-7071. The returns shown in the above table and accompanying footnotes are net of expenses. The table above does not reflect the deduction of taxes that a shareholder would have paid on Fund distributions or on the redemption of Fund shares. | |
| | 1. | Investment results calculated after reinvestment of dividends. | | | | | | | |
| | 2. | It is not possible to invest directly in an index. The performance of the index does not include the deduction of expenses associated with a mutual fund, such as investment management fees. | |
| | 3. | The S&P 500 Index is a broad unmanaged measure of the U.S. stock market. | | | | | | | |
| | 4. | The NASDAQ Composite Index is a broad-based capitalization-weighted index of all NASDAQ Global Market and Small Cap stocks. | | | |
| | 5. | The Russell 2000 Index is a broad unmanaged index composed of the smallest 2,000 companies in the Russell 3000 Index. | | | |
| | 6. | Not annualized. | | | | | | | |
| | 7. | Compound annual growth rate (annualized return). Assumes all dividends were reinvested in shares of the Fund. | | |
| | 8. | Cumulative return for the three year period was 62.15%, assuming all dividends were reinvested in shares of the Fund. | |
| | 9. | Cumulative return for the five year period was 21.68%, assuming all dividends were reinvested in shares of the Fund. | |
| | 10. | The inception date of the Fund was 5/22/02. | | | | | | | |
| | 11. | Cumulative return since inception was 150.30%, assuming all dividends were reinvested in shares of the Fund. | | | |
| | 12. | Gross expense ratio is from the Fund’s prospectus dated May 1, 2011. Additional information pertaining to the Fund’s expense ratios as of December 31, 2011 can be found in the financial highlights. Since inception, the investment performance reflects contractually agreed upon fee waivers which expire at the close of business on May 1, 2012. Without these fee waivers, the performance would have been lower. Excluding the indirect costs of investing in acquired funds, total net fund operating expenses would be 2.03%. | |
| | Top Ten Holdings* | | | Sector Weightings* |
| | (as a % of total investments, as of December 31, 2011) | | | (as a % of total investments, as of December 31, 2011) |
| | | | % of Total | | | | | | |
| | Security | | Investments† | | | Sector | Long(1) | (Short)(1) | Total(1)(2) |
| | 1) Seagate Technology PLC | STX | 7.11% | | | Consumer Discretionary | 5.6% | (0.5)% | 5.1% |
| | 2) Emulex Corp. | ELX | 5.97% | | | Energy | 2.0% | — | 2.0% |
| | 3) Entropic Communications, Inc. | ENTR | 5.63% | | | Financials | 2.8% | — | 2.8% |
| | 4) Formfactor, Inc. | FORM | 4.49% | | | Health Care | 18.5% | — | 18.5% |
| | 5) Omnicell, Inc. | OMCL | 4.41% | | | Industrials | 1.9% | (1.6)% | 0.3% |
| | 6) American Eagle Outfitters, Inc. | AEO | 4.08% | | | Information Technology | 62.7% | (1.7)% | 61.0% |
| | 7) Brocade Communications Systems, Inc. | BRCD | 3.98% | | | Cash | 10.3% | — | 10.3% |
| | 8) Allscripts Healthcare Solutions, Inc. | MDRX | 3.79% | | | * Current portfolio holdings may not be indicative of future portfolio holdings. |
| | 9) QuinStreet, Inc. | QNST | 3.12% | | | (1) Percentage of total investments includes all stocks, plus cash minus all short |
| | 10) DexCom, Inc. | DXCM | 3.11% | | | positions. | | | |
| | | | | | | (2) Total represents the difference between the long exposure and the short exposure, |
| | Top Ten Holdings = 45.69% of Total Investments† | | | which produces the net exposure. | | | |
| | * Current portfolio holdings may not be indicative of future portfolio holdings. | | | | | | |
| | † Percentage of total investments less cash. | | | | | | | | |
Comparison of Change in Value of a $10,000 Investment
Past performance does not guarantee future results. The performance data quoted represents past performance, and current returns may be lower or higher. The investment return and net asset value will fluctuate so that an investor’s shares, when redeemed, may be worth more or less than the original cost. To obtain performance information current to the most recent month-end, please call 1-800-625-7071. The graph above does not reflect the deduction of taxes that a shareholder would have paid on Fund distributions or on the redemption of Fund shares. Since inception, the Fund’s Adviser has absorbed certain expenses of the Fund, without which returns would have been lower.
The Global Industry Classification Standard (GICS3) was developed by and/or is the exclusive property of MSCI, Inc. and Standard & Poor Financial Services LLC (‘‘S&P’’). GICS is a service mark of MSCI and S&P and has been licensed for use by U.S. Bancorp Fund Services, LLC.
Disclosure of Fund Expenses (Unaudited)
The following expense table is shown so that you can understand the impact of fees on your investment. All mutual funds have operating expenses. As a shareholder of the fund, you incur transactional costs, including redemption fees and exchange fees, and ongoing costs, which include costs for portfolio management, administrative services, and shareholder reports, among others. A fund’s expenses are expressed as a percentage of its average net assets. This figure is known as the expense ratio. The following examples are intended to help you understand the ongoing costs (in dollars) of investing in each fund and to compare these costs with those of other mutual funds. The examples are based on an investment of $1,000 made at the beginning of the period shown and held for the entire period.
The expense example table below illustrates your fund’s cost in two ways:
| ● | Actual Expenses. This section helps you to estimate the actual expenses after fee waivers that you paid over the period. The ‘‘Ending Account Value’’ shown is derived from the fund’s actual return, and ‘‘Expenses Paid During Period’’ shows the dollar amount that would have been paid by an investor who started with $1,000 in the fund. You may use the information here, together with the amount you invested, to estimate the expenses that you paid over the period. To do so, simply divide your account value by $1,000 (for example, an $8,600 account value divided by $1,000 = 8.6), then multiply the result by the number given for your fund under the heading entitled ‘‘Expenses Paid During Period’’. |
| ● | Hypothetical Expenses on a 5% Return. This section is intended to help you compare your fund’s costs with those of other mutual funds. It assumes that the fund had a return of 5% before expenses during the period shown, but that the expense ratio is unchanged. In this case, because the return used is not the fund’s actual return, the results do not apply to your investment. The example is useful in making comparisons because the Securities and Exchange Commission requires all mutual funds to calculate expenses based on a 5% return. You can assess your fund’s cost by comparing this hypothetical example with the hypothetical examples that appear in shareholders reports of other funds. |
Please note that the expenses shown in the table are meant to highlight your ongoing costs only and do not reflect any transactional costs, such as redemption fees or exchange fees. Therefore, the table is useful in comparing ongoing costs only, and will not help you determine the relative total costs of owning different funds. In addition, if these transactional costs were included, your costs would have been higher.
For the Period July 1, 2011 to December 31, 2011
Expense Example Table
| | | Beginning | | | Ending | | | Expenses Paid | | | Expense Ratio | |
| | | Account Value | | | Account Value | | | During Period* | | | During Period* | |
| | | 7/1/11 | | | 12/31/11 | | | 7/1/11 - 12/31/11 | | | 7/1/11 - 12/31/11 | |
| Needham Growth Fund | | | | | | | | | | | | |
| Actual Expenses | | $ | 1,000.00 | | | $ | 857.30 | | | $ | 8.47 | | | | 1.81 | % |
| Hypothetical Example for Comparison Purposes | | | | | | | | | | | | | | | | |
| (5% return before expenses) | | $ | 1,000.00 | | | $ | 1,016.08 | | | $ | 9.20 | | | | 1.81 | % |
| | | | | | | | | | | | | | | | | |
| Needham Aggressive Growth Fund | | | | | | | | | | | | | | | | |
| Actual Expenses | | $ | 1,000.00 | | | $ | 847.00 | | | $ | 8.71 | | | | 1.87 | % |
| Hypothetical Example for Comparison Purposes | | | | | | | | | | | | | | | | |
| (5% return before expenses) | | $ | 1,000.00 | | | $ | 1,015.78 | | | $ | 9.50 | | | | 1.87 | % |
| | | | | | | | | | | | | | | | | |
| Needham Small Cap Growth Fund | | | | | | | | | | | | | | | | |
| Actual Expenses | | $ | 1,000.00 | | | $ | 836.70 | | | $ | 8.61 | | | | 1.86 | % |
| Hypothetical Example for Comparison Purposes | | | | | | | | | | | | | | | | |
| (5% return before expenses) | | $ | 1,000.00 | | | $ | 1,015.83 | | | $ | 9.45 | | | | 1.86 | % |
* Expenses are equal to the average account value times the Fund’s annualized expense ratio multiplied by the number of days in the most recent fiscal half-year divided by the number of days in the fiscal year. | |
| | | | | | | | | | | | | | | | | |
| Needham Growth Fund | | | | | | |
| Schedule of Investments | | | | | | |
| December 31, 2011 | | | | | | |
| | | Shares | | | Value | |
| Common Stocks(86.1%) | | | | | | |
| | | | | | | |
| Aerospace & Defense (2.0%) | | | | | | |
| Honeywell International, Inc. | | | 20,000 | | | $ | 1,087,000 | |
| Sypris Solutions, Inc.* | | | 356,200 | | | | 1,414,114 | |
| | | | | | | | 2,501,114 | |
| | | | | | | | | |
| Biotechnology (2.3%) | | | | | | | | |
| Gilead Sciences, Inc.* | | | 70,000 | | | | 2,865,100 | |
| | | | | | | | | |
| Capital Markets (1.8%) | | | | | | | | |
| Financial Engines, Inc.* | | | 100,000 | | | | 2,233,000 | |
| | | | | | | | | |
| Communications Equipment (9.0%) | | | | | | | | |
| Anaren, Inc.* | | | 55,000 | | | | 914,100 | |
| Brocade Communications | | | | | | | | |
| Systems, Inc.* | | | 300,000 | | | | 1,557,000 | |
| Emulex Corp.* | | | 252,975 | | | | 1,735,409 | |
| Finisar Corp.* | | | 112,500 | | | | 1,883,812 | |
| Viasat, Inc.* | | | 115,000 | | | | 5,303,799 | |
| | | | | | | | 11,394,120 | |
| | | | | | | | | |
| Computers & Peripherals (8.2%) | | | | | | | | |
| Electronics for Imaging, Inc.* | | | 86,250 | | | | 1,229,063 | |
| Immersion Corp.* | | | 47,500 | | | | 246,050 | |
| Seagate Technology PLC | | | 375,000 | | | | 6,150,000 | |
| Super Micro Computer, Inc.* | | | 175,000 | | | | 2,744,000 | |
| | | | | | | | 10,369,113 | |
| | | | | | | | | |
| Electrical Equipment (0.8%) | | | | | | | | |
| II-VI, Inc.* | | | 55,000 | | | | 1,009,800 | |
| | | | | | | | | |
| Electronic Equipment, Instruments & Components (8.7%) | | | | | | | | |
| Corning, Inc. | | | 43,750 | | | | 567,875 | |
| Electro Scientific Industries, Inc.* | | | 191,500 | | | | 2,772,920 | |
| Jabil Circuit, Inc. | | | 150,000 | | | | 2,949,000 | |
| Mercury Computer Systems, Inc.* | | | 122,400 | | | | 1,626,696 | |
| Newport Corp.* | | | 140,700 | | | | 1,914,927 | |
| Vishay Intertechnology, Inc.* | | | 130,000 | | | | 1,168,700 | |
| | | | | | | | 11,000,118 | |
| | | | | | | | | |
| Energy Equipment & Services (0.5%) | | | | | | | | |
| Schlumberger Ltd. | | | 10,000 | | | | 683,100 | |
| | | | | | | | | |
| Health Care Equipment & Supplies (8.4%) | | | | | | | | |
| Becton Dickinson and Co. | | | 46,000 | | | | 3,437,120 | |
| CONMED Corp.* | | | 50,000 | | | | 1,283,500 | |
| Covidien PLC | | | 30,000 | | | | 1,350,300 | |
| Varian Medical Systems, Inc.* | | | 55,000 | | | | 3,692,150 | |
| Volcano Corp.* | | | 35,000 | | | | 832,650 | |
| | | | | | | | 10,595,720 | |
| Health Care Providers & Services (8.0%) | | | | | | |
| Express Scripts, Inc.*† | | | 225,000 | | | | 10,055,250 | |
| | | | | | | | | |
| Health Care Technology (1.5%) | | | | | | | | |
| Allscripts Healthcare Solutions, Inc.* | | | 100,000 | | | | 1,894,000 | |
| | | | | | | | | |
| Internet Software & Services (4.0%) | | | | | | | | |
| Akamai Technologies, Inc.* | | | 80,000 | | | | 2,582,400 | |
| QuinStreet, Inc.* | | | 150,000 | | | | 1,404,000 | |
| Responsys, Inc.* | | | 62,500 | | | | 555,625 | |
| Soundbite Communications, Inc.* | | | 200,000 | | | | 450,000 | |
| | | | | | | | 4,992,025 | |
| | | | | | | | | |
| IT Services (0.4%) | | | | | | | | |
| InterXion Holding NV* | | | 32,500 | | | | 437,125 | |
| | | | | | | | | |
| Life Sciences Tools & Services (4.1%) | | | | | | | | |
| Thermo Fisher Scientific, Inc.* | | | 115,000 | | | | 5,171,550 | |
| | | | | | | | | |
| Media (1.1%) | | | | | | | | |
| Comcast Corp. | | | 60,000 | | | | 1,422,600 | |
| | | | | | | | | |
| Oil, Gas & Consumable Fuels (0.9%) | | | | | | | | |
| Chesapeake Energy Corp. | | | 50,000 | | | | 1,114,500 | |
| | | | | | | | | |
| Semiconductors & Semiconductor Equipment (17.5%) | | | | | | | | |
| Anadigics, Inc.* | | | 200,000 | | | | 438,000 | |
| Brooks Automation, Inc. | | | 445,000 | | | | 4,570,150 | |
| Entegris, Inc.* | | | 210,000 | | | | 1,832,250 | |
| Entropic Communications, Inc.* | | | 795,000 | | | | 4,062,450 | |
| Formfactor, Inc.* | | | 414,550 | | | | 2,097,623 | |
| Intermolecular, Inc.* | | | 37,884 | | | | 325,045 | |
| Lattice Semiconductor Corp.* | | | 150,000 | | | | 891,000 | |
| MEMC Electronic Materials, Inc.* | | | 50,000 | | | | 197,000 | |
| MKS Instruments, Inc. | | | 60,000 | | | | 1,669,200 | |
| Nova Measuring Instruments Ltd.* | | | 227,265 | | | | 1,674,943 | |
| PDF Solutions, Inc.* | | | 390,000 | | | | 2,718,300 | |
| TriQuint Semiconductor, Inc.* | | | 100,000 | | | | 487,000 | |
| Ultra Clean Holdings, Inc.* | | | 185,800 | | | | 1,135,238 | |
| | | | | | | | 22,098,199 | |
| | | | | | | | | |
| Software (1.2%) | | | | | | | | |
| Actuate Corp.* | | | 250,000 | | | | 1,465,000 | |
| | | | | | | | | |
| Specialty Retail (5.7%) | | | | | | | | |
| CarMax, Inc.* | | | 167,500 | | | | 5,105,400 | |
| Dick’s Sporting Goods, Inc.† | | | 55,000 | | | | 2,028,400 | |
| | | | | | | | 7,133,800 | |
| Total Common Stocks | | | | | | | | |
| (Cost $83,094,298) | | | | | | | 108,435,234 | |
See accompanying notes to financial statements.
| Needham Growth Fund | | | | | | |
| Schedule of Investments (Continued) | | | | | | |
| December 31, 2011 | | | | | | |
| | | Shares | | | Value | |
| Short-Term Investment (14.2%) | | | | | | |
| | | | | | | |
| Money Market Fund (14.2%) | | | | | | |
| Dreyfus Treasury Prime Cash | | | | | | |
| Management 0.00% (a) | | | | | | |
| (Cost $17,872,579) | | | 17,872,579 | | | $ | 17,872,579 | |
| | | | | | | | | |
| Total Investments (100.3%) | | | | | | | | |
| (Cost $100,966,877) | | | | | | | 126,307,813 | |
| Total Securities Sold Short (-3.0%) | | | | | | | | |
| (Proceeds $3,326,470) | | | | | | | (3,753,860 | ) |
| Other Assets in Excess | | | | | | | | |
| of Liabilities (2.7%) | | | | | | | 3,412,034 | |
| | | | | | | | | |
| Net Assets (100.0%) | | | | | | $ | 125,965,987 | |
| (a) | Rate shown is the seven day yield as of December 31, 2011 and is less than 0.01%. |
| * | Non-income producing security. |
| † | Security position is either entirely or partially held in a segregated account as collateral for securities sold short, aggregating a total market value of $4,525,400. |
The Global Industry Classification Standard (GICS3) was developed by and/or is the exclusive property of MSCI, Inc. and Standard & Poor Financial Services LLC (‘‘S&P’’). GICS is a service mark of MSCI and S&P and has been licensed for use by U.S. Bancorp Fund Services, LLC.
See accompanying notes to financial statements.
| Needham Growth Fund | | | | | | |
| Schedule of Securities Sold Short | | | | | | |
| December 31, 2011 | | | | | | |
| | | Shares | | | Value | |
| Securities Sold Short (-3.0%) | | | | | | |
| | | | | | | |
| Airlines (-0.5%) | | | | | | |
| Allegiant Travel Co.* | | | 11,250 | | | $ | 600,075 | |
| | | | | | | | | |
| Auto Components (-0.2%) | | | | | | | | |
| Drew Industries, Inc. | | | 7,500 | | | | 183,975 | |
| | | | | | | | | |
| Computers & Peripherals (-0.2%) | | | | | | | | |
| Xyratex Ltd. | | | 20,000 | | | | 266,400 | |
| | | | | | | | | |
| Semiconductors & Semiconductor Equipment (-0.1%) | | | | | | | | |
| STR Holdings, Inc.* | | | 20,000 | | | | 164,600 | |
| | | | | | | | | |
| Software (-2.0%) | | | | | | | | |
| ANSYS, Inc.* | | | 39,500 | | | | 2,262,560 | |
| Ebix, Inc. | | | 12,500 | | | | 276,250 | |
| | | | | | | | 2,538,810 | |
| | | | | | | | | |
| Total Securities Sold Short | | | | | | | | |
| (Proceeds $3,326,470) | | | | | | | 3,753,860 | |
| | | | | | | | | |
| Total Securities Sold Short (-3.0%) | | | | | | | (3,753,860 | ) |
| Total Investments (100.3%) | | | | | | | | |
| (Cost $100,966,877) | | | | | | | 126,307,813 | |
| Other Assets in | | | | | | | | |
| Excess of Liabilities (2.7%) | | | | | | | 3,412,034 | |
| | | | | | | | | |
| Net Assets (100.0%) | | | | | | $ | 125,965,987 | |
| * | Non-income producing security. |
The Global Industry Classification Standard (GICS3) was developed by and/or is the exclusive property of MSCI, Inc. and Standard & Poor Financial Services LLC (‘‘S&P’’). GICS is a service mark of MSCI and S&P and has been licensed for use by U.S. Bancorp Fund Services, LLC.
See accompanying notes to financial statements.
| Needham Aggressive Growth Fund | | | | |
| Schedule of Investments | | | | | | |
| December 31, 2011 | | | | | | |
| | | Shares | | | Value | |
| Common Stocks(98.4%) | | | | | | |
| | | | | | | |
| Aerospace & Defense (1.0%) | | | | | | |
| Precision Castparts Corp.† | | | 5,500 | | | $ | 906,345 | |
| | | | | | | | | |
| Biotechnology (2.3%) | | | | | | | | |
| Gilead Sciences, Inc.* | | | 50,000 | | | | 2,046,500 | |
| | | | | | | | | |
| Capital Markets (2.0%) | | | | | | | | |
| Financial Engines, Inc.* | | | 80,000 | | | | 1,786,400 | |
| | | | | | | | | |
| Communications Equipment (11.2%) | | | | | | | | |
| Anaren, Inc.* | | | 91,550 | | | | 1,521,561 | |
| Brocade Communications | | | | | | | | |
| Systems, Inc.* | | | 295,000 | | | | 1,531,050 | |
| Emulex Corp.* | | | 357,800 | | | | 2,454,508 | |
| Extreme Networks Inc.* | | | 100,000 | | | | 292,000 | |
| Finisar Corp.* | | | 150,000 | | | | 2,511,750 | |
| Network Equipment | | | | | | | | |
| Technologies, Inc.* | | | 357,750 | | | | 414,990 | |
| Oclaro, Inc.* | | | 100,000 | | | | 282,000 | |
| Powerwave Technologies, Inc.* | | | 97,500 | | | | 202,800 | |
| Viasat, Inc.* | | | 20,000 | | | | 922,400 | |
| | | | | | | | 10,133,059 | |
| | | | | | | | | |
| Computers & Peripherals (9.7%) | | | | | | | | |
| Apple, Inc.*† | | | 5,250 | | | | 2,126,250 | |
| Electronics for Imaging, Inc.* | | | 70,000 | | | | 997,500 | |
| Immersion Corp.* | | | 11,250 | | | | 58,275 | |
| Seagate Technology PLC | | | 205,000 | | | | 3,362,000 | |
| STEC, Inc.* | | | 53,900 | | | | 463,001 | |
| Super Micro Computer, Inc.* | | | 110,000 | | | | 1,724,800 | |
| | | | | | | | 8,731,826 | |
| | | | | | | | | |
| Electrical Equipment (0.1%) | | | | | | | | |
| II-VI, Inc.* | | | 5,000 | | | | 91,800 | |
| | | | | | | | | |
| Electronic Equipment, Instruments & Components (15.7%) | | | | | | | | |
| Corning, Inc. | | | 86,300 | | | | 1,120,174 | |
| Electro Scientific Industries, Inc.* | | | 50,000 | | | | 724,000 | |
| FEI Co.* | | | 30,000 | | | | 1,223,400 | |
| IPG Photonics Corp.* | | | 5,000 | | | | 169,350 | |
| Jabil Circuit, Inc. | | | 105,100 | | | | 2,066,266 | |
| LeCroy Corp.* | | | 30,000 | | | | 252,300 | |
| Mercury Computer Systems, Inc.* | | | 190,500 | | | | 2,531,745 | |
| Multi-Fineline Electronix, Inc.* | | | 65,000 | | | | 1,335,750 | |
| Newport Corp.* | | | 70,000 | | | | 952,700 | |
| Trimble Navigation Ltd.* | | | 17,500 | | | | 759,500 | |
| TTM Technologies, Inc.* | | | 275,000 | | | | 3,014,000 | |
| | | | | | | | 14,149,185 | |
| Health Care Equipment & Supplies (3.9%) | | | | | | |
| Becton Dickinson and Co. | | | 8,000 | | | | 597,760 | |
| LeMaitre Vascular, Inc. | | | 40,000 | | | | 236,800 | |
| Solta Medical, Inc.*† | | | 231,629 | | | | 727,315 | |
| Varian Medical Systems, Inc.* | | | 16,000 | | | | 1,074,080 | |
| Volcano Corp.* | | | 35,000 | | | | 832,650 | |
| | | | | | | | 3,468,605 | |
| | | | | | | | | |
| Health Care Providers & Services (0.9%) | | | | | | | | |
| Express Scripts, Inc.* | | | 18,000 | | | | 804,420 | |
| | | | | | | | | |
| Health Care Technology (2.5%) | | | | | | | | |
| Allscripts Healthcare | | | | | | | | |
| Solutions, Inc.* | | | 60,000 | | | | 1,136,400 | |
| MedAssets, Inc.* | | | 54,325 | | | | 502,506 | |
| Omnicell, Inc.* | | | 35,000 | | | | 578,200 | |
| | | | | | | | 2,217,106 | |
| | | | | | | | | |
| Insurance (0.4%) | | | | | | | | |
| Crawford & Co. | | | 95,000 | | | | 386,650 | |
| | | | | | | | | |
| Internet Software & Services (15.0%) | | | | | | | | |
| Akamai Technologies, Inc.* | | | 250,000 | | | | 8,070,000 | |
| Equinix, Inc.* | | | 7,000 | | | | 709,800 | |
| QuinStreet, Inc.* | | | 34,800 | | | | 325,728 | |
| Reis, Inc.* | | | 100,000 | | | | 912,000 | |
| Responsys, Inc.* | | | 75,000 | | | | 666,750 | |
| Saba Software, Inc.* | | | 305,000 | | | | 2,406,450 | |
| Soundbite Communications, Inc.* | | | 175,000 | | | | 393,750 | |
| | | | | | | | 13,484,478 | |
| | | | | | | | | |
| Oil, Gas & Consumable Fuels (1.9%) | | | | | | | | |
| Suncor Energy, Inc. | | | 60,000 | | | | 1,729,800 | |
| | | | | | | | | |
| Pharmaceuticals (1.2%) | | | | | | | | |
| ISTA Pharmaceuticals, Inc.* | | | 160,000 | | | | 1,128,000 | |
| | | | | | | | | |
| Semiconductors & Semiconductor Equipment (26.1%) | | | | | | | | |
| Advanced Analogic | | | | | | | | |
| Technologies, Inc.* | | | 125,000 | | | | 722,500 | |
| ATMI, Inc.* | | | 41,200 | | | | 825,236 | |
| Brooks Automation, Inc. | | | 110,000 | | | | 1,129,700 | |
| Entegris, Inc.* | | | 185,000 | | | | 1,614,125 | |
| Entropic Communications, Inc.* | | | 897,500 | | | | 4,586,225 | |
| Formfactor, Inc.* | | | 612,100 | | | | 3,097,226 | |
| Lattice Semiconductor Corp.* | | | 30,000 | | | | 178,200 | |
| MEMC Electronic Materials, Inc.* | | | 157,500 | | | | 620,550 | |
| MIPS Technologies, Inc.* | | | 255,000 | | | | 1,137,300 | |
| MKS Instruments, Inc. | | | 29,100 | | | | 809,562 | |
See accompanying notes to financial statements.
| Needham Aggressive Growth Fund | |
| Schedule of Investments (Continued) | |
| December 31, 2011 | | | | | | |
| | | Shares | | | Value | |
| Common Stocks - Continued | | | | | | |
| Nova Measuring Instruments Ltd.* | | | 139,200 | | | $ | 1,025,904 | |
| PDF Solutions, Inc.* | | | 560,000 | | | | 3,903,200 | |
| RF Micro Devices, Inc.* | | | 300,000 | | | | 1,620,000 | |
| TriQuint Semiconductor, Inc.*† | | | 290,000 | | | | 1,412,300 | |
| Ultra Clean Holdings, Inc.* | | | 145,300 | | | | 887,783 | |
| | | | | | | | 23,569,811 | |
| | | | | | | | | |
| Software (2.2%) | | | | | | | | |
| Actuate Corp.*† | | | 212,700 | | | | 1,246,422 | |
| Bottomline Technologies, Inc.* | | | 32,280 | | | | 747,928 | |
| | | | | | | | 1,994,350 | |
| | | | | | | | | |
| Specialty Retail (2.3%) | | | | | | | | |
| Aeropostale, Inc.* | | | 50,000 | | | | 762,500 | |
| CarMax, Inc.* | | | 22,500 | | | | 685,800 | |
| Dick’s Sporting Goods, Inc.† | | | 18,000 | | | | 663,840 | |
| | | | | | | | 2,112,140 | |
| | | | | | | | | |
| Total Common Stocks | | | | | | | | |
| (Cost $93,992,711) | | | | | | | 88,740,475 | |
| Short-Term Investment(1.6%) | | | | | | |
| | | | | | | |
| Money Market Fund (1.6%) | | | | | | |
| Dreyfus Treasury Prime Cash | | | | | | |
| Management 0.00% (a) | | | | | | |
| (Cost $1,441,543) | | | 1,441,543 | | | $ | 1,441,543 | |
| | | | | | | | | |
| Total Investments (100.0%) | | | | | | | | |
| (Cost $95,434,254) | | | | | | | 90,182,018 | |
| Total Securities Sold Short (-3.2%) | | | | | | | | |
| (Proceeds $2,678,848) | | | | | | | (2,918,060 | ) |
| Other Assets in | | | | | | | | |
| Excess of Liabilities (3.2%) | | | | | | | 2,905,900 | |
| | | | | | | | | |
| Net Assets (100.0%) | | | | | | $ | 90,169,858 | |
| (a) | Rate shown is the seven day yield as of December 31, 2011 and is less than 0.01%. |
| * | Non-income producing security. |
| † | Security position is either entirely or partially held in a segregated account as collateral for securities sold short, aggregating a total market value of $3,944,756. |
The Global Industry Classification Standard (GICS3) was developed by and/or is the exclusive property of MSCI, Inc. and Standard & Poor Financial Services LLC (‘‘S&P’’). GICS is a service mark of MSCI and S&P and has been licensed for use by U.S. Bancorp Fund Services, LLC.
See accompanying notes to financial statements.
| Needham Aggressive Growth Fund | | | | | | |
| Schedule of Securities Sold Short | | | | | | |
| December 31, 2011 | | | | | | |
| | | Shares | | | Value | |
| Securities Sold Short (-3.2%) | | | | | | |
| | | | | | | |
| Airlines (-0.7%) | | | | | | |
| Allegiant Travel Co.* | | | 12,250 | | | $ | 653,415 | |
| | | | | | | | | |
| Chemicals (0.0%) | | | | | | | | |
| Zoltek Cos, Inc.* | | | 2,500 | | | | 19,050 | |
| | | | | | | | | |
| Computers & Peripherals (-0.3%) | | | | | | | | |
| Xyratex Ltd. | | | 20,000 | | | | 266,400 | |
| | | | | | | | | |
| Internet Software & Services (-0.1%) | | | | | | | | |
| KIT Digital, Inc.* | | | 10,000 | | | | 84,500 | |
| | | | | | | | | |
| IT Services (-0.2%) | | | | | | | | |
| Lender Processing Services, Inc. | | | 10,000 | | | | 150,700 | |
| ServiceSource International, Inc.* | | | 2,500 | | | | 39,225 | |
| | | | | | | | 189,925 | |
| Software (-1.9%) | | | | | | |
| ANSYS, Inc.* | | | 24,000 | | | | 1,374,720 | |
| Ebix, Inc. | | | 10,000 | | | | 221,000 | |
| Fortinet, Inc.* | | | 5,000 | | | | 109,050 | |
| | | | | | | | 1,704,770 | |
| | | | | | | | | |
| Total Securities Sold Short | | | | | | | | |
| (Proceeds $2,678,848) | | | | | | | 2,918,060 | |
| | | | | | | | | |
| Total Securities Sold Short (-3.2%) | | | | | | | (2,918,060 | ) |
| Total Investments (100.0%) | | | | | | | | |
| (Cost $95,434,254) | | | | | | | 90,182,018 | |
| Other Assets in | | | | | | | | |
| Excess of Liabilities (3.2%) | | | | | | | 2,905,900 | |
| | | | | | | | | |
| Net Assets (100.0%) | | | | | | $ | 90,169,858 | |
| * | Non-income producing security. |
The Global Industry Classification Standard (GICS3) was developed by and/or is the exclusive property of MSCI, Inc. and Standard & Poor Financial Services LLC (‘‘S&P’’). GICS is a service mark of MSCI and S&P and has been licensed for use by U.S. Bancorp Fund Services, LLC.
See accompanying notes to financial statements.
| Needham Small Cap Growth Fund | | | | | | |
| Schedule of Investments | | | | | | |
| December 31, 2011 | | | | | | |
| | | Shares | | | Value | |
| Common Stocks(90.6%) | | | | | | |
| | | | | | | |
| Capital Markets (2.7%) | | | | | | |
| Financial Engines, Inc.* | | | 100,000 | | | $ | 2,233,000 | |
| | | | | | | | | |
| Commercial Services & Supplies (1.1%) | | | | | | | | |
| Ritchie Bros Auctioneers, Inc. | | | 40,000 | | | | 883,200 | |
| | | | | | | | | |
| Communications Equipment (15.3%) | | | | | | | | |
| Anaren, Inc.* | | | 120,000 | | | | 1,994,400 | |
| Brocade Communications | | | | | | | | |
| Systems, Inc.*† | | | 575,000 | | | | 2,984,250 | |
| Emulex Corp.* | | | 652,425 | | | | 4,475,636 | |
| Extreme Networks, Inc.* | | | 150,000 | | | | 438,000 | |
| Harris Corp. | | | 40,000 | | | | 1,441,600 | |
| Network Equipment Technologies, | | | | | | | | |
| Inc.* | | | 233,421 | | | | 270,768 | |
| Oclaro, Inc.* | | | 250,000 | | | | 705,000 | |
| Powerwave Technologies, Inc.* | | | 170,000 | | | | 353,600 | |
| | | | | | | | 12,663,254 | |
| | | | | | | | | |
| Computers & Peripherals (6.4%) | | | | | | | | |
| Seagate Technology PLC | | | 325,000 | | | | 5,330,000 | |
| | | | | | | | | |
| Electrical Equipment (0.8%) | | | | | | | | |
| II-VI, Inc.* | | | 35,000 | | | | 642,600 | |
| | | | | | | | | |
| Electronic Equipment, Instruments & Components (7.6%) | | | | | | | | |
| Electro Scientific Industries, Inc.* | | | 37,500 | | | | 543,000 | |
| Mercury Computer Systems, Inc.* | | | 106,111 | | | | 1,410,215 | |
| Newport Corp.* | | | 125,000 | | | | 1,701,250 | |
| TTM Technologies, Inc.* | | | 140,000 | | | | 1,534,400 | |
| Vishay Intertechnology, Inc.* | | | 125,000 | | | | 1,123,750 | |
| | | | | | | | 6,312,615 | |
| | | | | | | | | |
| Energy Equipment & Services (0.6%) | | | | | | | | |
| CE Franklin Ltd.* | | | 59,300 | | | | 486,260 | |
| | | | | | | | | |
| Health Care Equipment & Supplies (7.1%) | | | | | | | | |
| DexCom, Inc.* | | | 250,000 | | | | 2,327,500 | |
| NuVasive, Inc.* | | | 60,000 | | | | 755,400 | |
| Palomar Medical | | | | | | | | |
| Technologies, Inc.* | | | 100,000 | | | | 930,000 | |
| Solta Medical, Inc.* | | | 150,000 | | | | 471,000 | |
| Volcano Corp.* | | | 60,000 | | | | 1,427,400 | |
| | | | | | | | 5,911,300 | |
| | | | | | | | | |
| Health Care Providers & Services (1.9%) | | | | | | | | |
| Express Scripts, Inc.*† | | | 35,000 | | | | 1,564,150 | |
| Health Care Technology (8.9%) | | | | | | |
| Allscripts Healthcare | | | | | | |
| Solutions, Inc.*† | | | 150,000 | | | | 2,841,000 | |
| MedAssets, Inc.* | | | 130,000 | | | | 1,202,500 | |
| Omnicell, Inc.*† | | | 200,000 | | | | 3,304,000 | |
| | | | | | | | 7,347,500 | |
| | | | | | | | | |
| Internet Software & Services (5.4%) | | | | | | | | |
| QuinStreet, Inc.* | | | 250,000 | | | | 2,340,000 | |
| Responsys, Inc.* | | | 70,000 | | | | 622,300 | |
| Saba Software, Inc.* | | | 155,000 | | | | 1,222,950 | |
| Soundbite Communications, Inc.* | | | 121,463 | | | | 273,292 | |
| | | | | | | | 4,458,542 | |
| | | | | | | | | |
| IT Services (2.3%) | | | | | | | | |
| InterXion Holding NV* | | | 140,000 | | | | 1,883,000 | |
| | | | | | | | | |
| Oil, Gas & Consumable Fuels (1.3%) | | | | | | | | |
| Carrizo Oil & Gas, Inc.* | | | 40,000 | | | | 1,054,000 | |
| GMX Resources, Inc.* | | | 50,000 | | | | 62,500 | |
| | | | | | | | 1,116,500 | |
| | | | | | | | | |
| Semiconductors & Semiconductor Equipment (23.7%) | | | | | | | | |
| Anadigics, Inc.* | | | 35,000 | | | | 76,650 | |
| Brooks Automation, Inc. | | | 170,000 | | | | 1,745,900 | |
| Entropic Communications, Inc.*† | | | 825,000 | | | | 4,215,749 | |
| Formfactor, Inc.* | | | 665,150 | | | | 3,365,659 | |
| Intermolecular, Inc.* | | | 25,948 | | | | 222,634 | |
| Lattice Semiconductor Corp.* | | | 75,000 | | | | 445,500 | |
| MaxLinear, Inc.* | | | 330,000 | | | | 1,567,500 | |
| MEMC Electronic Materials, Inc.* | | | 475,000 | | | | 1,871,500 | |
| Microsemi Corp.* | | | 30,000 | | | | 502,500 | |
| Nova Measuring Instruments Ltd.* | | | 99,035 | | | | 729,888 | |
| PDF Solutions, Inc.* | | | 140,000 | | | | 975,800 | |
| Rudolph Technologies, Inc.* | | | 100,000 | | | | 926,000 | |
| TriQuint Semiconductor, Inc.* | | | 250,000 | | | | 1,217,500 | |
| Ultra Clean Holdings, Inc.* | | | 280,000 | | | | 1,710,800 | |
| | | | | | | | 19,573,580 | |
| | | | | | | | | |
| Specialty Retail (5.5%) | | | | | | | | |
| Aeropostale, Inc.* | | | 95,000 | | | | 1,448,750 | |
| American Eagle Outfitters, Inc.† | | | 200,000 | | | | 3,058,000 | |
| | | | | | | | 4,506,750 | |
| Total Common Stocks | | | | | | | | |
| (Cost $87,565,148) | | | | | | | 74,912,251 | |
See accompanying notes to financial statements.
| Needham Small Cap Growth Fund | | | | |
| Schedule of Investments (Continued) | | | | |
| December 31, 2011 | | | | | | |
| | | Shares | | | Value | |
| Short-Term Investment(10.0%) | | | | | | |
| | | | | | | |
| Money Market Fund (10.0%) | | | | | | |
| Dreyfus Treasury Prime Cash | | | | | | |
| Management 0.00% (a) | | | | | | |
| (Cost $8,234,950) | | | 8,234,950 | | | $ | 8,234,950 | |
| | | | | | | | | |
| Total Investments (100.6%) | | | | | | | | |
| (Cost $95,800,098) | | | | | | | 83,147,201 | |
| Total Securities Sold Short (-3.6%) | | | | | | | | |
| (Proceeds $2,926,755) | | | | | | | (2,990,270 | ) |
| Other Assets in | | | | | | | | |
| Excess of Liabilities (3.0%) | | | | | | | 2,517,800 | |
| | | | | | | | | |
| Net Assets (100.0%) | | | | | | $ | 82,674,731 | |
| (a) | Rate shown is the seven day yield as of December 31, 2011 and is less than 0.01%. |
| * | Non-income producing security. |
† | Security position is either entirely or partially held in a segregated account as collateral for securities sold short, aggregating a total market value of $6,517,300 |
The Global Industry Classification Standard (GICS3) was developed by and/or is the exclusive property of MSCI, Inc. and Standard & Poor Financial Services LLC (‘‘S&P’’). GICS is a service mark of MSCI and S&P and has been licensed for use by U.S. Bancorp Fund Services, LLC.
See accompanying notes to financial statements.
| Needham Small Cap Growth Fund | | | | |
| Schedule of Securities Sold Short | | | | | | |
| December 31, 2011 | | | | | | |
| | | Shares | | | Value | |
| Securities Sold Short (-3.6%) | | | | | | |
| | | | | | | |
| Aerospace & Defense (-0.5%) | | | | | | |
| HEICO Corp. | | | 7,500 | | | $ | 438,600 | |
| | | | | | | | | |
| Airlines (-1.0%) | | | | | | | | |
| Allegiant Travel Co.* | | | 15,000 | | | | 800,100 | |
| | | | | | | | | |
| Auto Components (-0.4%) | | | | | | | | |
| Drew Industries, Inc. | | | 15,000 | | | | 367,950 | |
| | | | | | | | | |
| Computers & Peripherals (-0.3%) | | | | | | | | |
| Xyratex Ltd. | | | 20,000 | | | | 266,400 | |
| | | | | | | | | |
| IT Services (-0.2%) | | | | | | | | |
| Lender Processing Services, Inc. | | | 10,000 | | | | 150,700 | |
| Semiconductors & Semiconductor Equipment (-0.2%) | | | | | | |
| STR Holdings, Inc.* | | | 20,000 | | | | 164,600 | |
| | | | | | | | | |
| Software (-1.0%) | | | | | | | | |
| ANSYS, Inc.* | | | 14,000 | | | | 801,920 | |
| | | | | | | | | |
| Total Securities Sold Short | | | | | | | | |
| (Proceeds $2,926,755) | | | | | | | 2,990,270 | |
| | | | | | | | | |
| Total Securities Sold Short (-3.6%) | | | | | | | (2,990,270 | ) |
| Total Investments (100.6%) | | | | | | | | |
| (Cost $95,800,098) | | | | | | | 83,147,201 | |
| Other Assets in | | | | | | | | |
| Excess of Liabilities (3.0%) | | | | | | | 2,517,800 | |
| | | | | | | | | |
| Net Assets (100.0%) | | | | | | $ | 82,674,731 | |
| * | Non-income producing security. |
The Global Industry Classification Standard (GICS3) was developed by and/or is the exclusive property of MSCI, Inc. and Standard & Poor Financial Services LLC (‘‘S&P’’). GICS is a service mark of MSCI and S&P and has been licensed for use by U.S. Bancorp Fund Services, LLC.
See accompanying notes to financial statements.
| Statements of Assets and Liabilities | | | | | | | | |
| December 31, 2011 | | | | | | | | |
| | | | | | | | | |
| | | | | | Needham | | | Needham |
| | | Needham | | | Aggressive | | | Small Cap |
| | | Growth Fund | | | Growth Fund | | | Growth Fund |
| Assets | | | | | | | | |
| Investments, at Value | | | | | | | | |
| (Cost $100,966,877, $95,434,254, $95,800,098) | $ | 126,307,813 | | $ | 90,182,018 | | $ | 83,147,201 |
| Receivables: | | | | | | | | |
| Deposit with Broker for Securities Sold Short | | 3,752,057 | | | 2,986,734 | | | 3,472,272 |
| Dividends and Interest | | 9,251 | | | 165 | | | 22,000 |
| Fund Shares Sold | | 30,698 | | | 28,894 | | | 53,366 |
| Investment Securities Sold | | — | | | 249,069 | | | — |
| Prepaid Expenses | | 38,346 | | | 45,839 | | | 35,321 |
| Total Assets | | 130,138,165 | | | 93,492,719 | | | 86,730,160 |
| | | | | | | | | |
| Liabilities | | | | | | | | |
| Securities Sold Short, at Value | | | | | | | | |
| (Proceeds $3,326,470, $2,678,848, $2,926,755) | | 3,753,860 | | | 2,918,060 | | | 2,990,270 |
| Payables: | | | | | | | | |
| Investment Securities Purchased | | — | | | — | | | 646,124 |
| Fund Shares Redeemed | | 180,363 | | | 211,766 | | | 241,243 |
| Due to Adviser | | 134,501 | | | 96,651 | | | 90,217 |
| Distribution Fees | | 27,003 | | | 19,406 | | | 18,114 |
| Administration and Accounting Fees | | 19,588 | | | 21,873 | | | 15,946 |
| Transfer Agent Fees | | 10,794 | | | 12,618 | | | 12,036 |
| Accrued Expenses and Other Liabilities | | 46,069 | | | 42,487 | | | 41,479 |
| Total Liabilities | | 4,172,178 | | | 3,322,861 | | | 4,055,429 |
| | | | | | | | | |
| Net Assets | $ | 125,965,987 | | $ | 90,169,858 | | $ | 82,674,731 |
| Shares Issued and Outstanding $0.001 Par Value | | | | | | | | |
| (Authorized 800,000,000, 100,000,000 and 100,000,000 respectively) | | 3,843,276 | | | 6,211,290 | | | 7,339,149 |
Net Asset Value, Offering and Redemption Price Per Share(a) | $ | 32.78 | | $ | 14.52 | | $ | 11.26 |
| | | | | | | | | |
| Components of Net Assets | | | | | | | | |
| Paid-in Capital | | 98,995,611 | | | 95,696,520 | | | 97,269,256 |
| Accumulated Net Investment Income | | — | | | — | | | — |
| Accumulated Net Realized Gain (Loss) from Investments, Securities Sold | | | | | | | | |
| Short, Foreign Currency Transactions and Currency | | 2,056,830 | | | (35,214) | | | (1,878,113) |
| Net Unrealized Appreciation (Depreciation) on | | | | | | | | |
| Investment Securities and Securities Sold Short | | 24,913,546 | | | (5,491,448) | | | (12,716,412) |
| Total Net Assets | $ | 125,965,987 | | $ | 90,169,858 | | $ | 82,674,731 |
| (a) | Subject to certain exceptions, a 2% redemption fee is imposed upon shares redeemed within 60 days of their purchase. See Note 2 of the notes to financial statements. |
See accompanying notes to financial statements.
| Statements of Operations | | | | | | | | |
| For the Year Ended December 31, 2011 | | | | | | | | |
| | | | | | | | | |
| | | | | | Needham | | | Needham |
| | | Needham | | | Aggressive | | | Small Cap |
| | | Growth Fund | | | Growth Fund | | | Growth Fund |
| | | | | | | | | |
| Investment Income | | | | | | | | |
| Dividends | $ | 632,772 | | $ | 272,716 | | $ | 336,456 |
| Interest | | 81 | | | 151 | | | 127 |
| Less: Foreign Taxes Withheld | | — | | | (2,229) | | | (211) |
| Total Investment Income | | 632,853 | | | 270,638 | | | 336,372 |
| | | | | | | | | |
| Expenses | | | | | | | | |
| Investment Advisory Fees | | 1,973,113 | | | 1,629,143 | | | 1,582,636 |
| Distribution Fees | | 394,623 | | | 325,829 | | | 316,527 |
| Administration and Accounting Fees | | 142,875 | | | 125,501 | | | 129,345 |
| Audit Fees | | 42,480 | | | 21,520 | | | 19,900 |
| Chief Compliance Officer Fees | | 14,228 | | | 11,798 | | | 11,475 |
| Custodian Fees | | 10,735 | | | 10,681 | | | 11,154 |
| Directors’ Fees | | 16,491 | | | 18,137 | | | 17,563 |
Dividend Expense(1) | | 2,287 | | | 1,280 | | | 6,360 |
| Filing Fees | | 34,296 | | | 36,769 | | | 45,038 |
Interest Expense(1) | | 50,470 | | | 36,633 | | | 29,668 |
| Legal Fees | | 31,937 | | | 29,496 | | | 30,045 |
| Printing Fees | | 19,386 | | | 33,985 | | | 40,145 |
| Transfer Agent Fees | | 66,623 | | | 80,539 | | | 68,140 |
| Other Expenses | | 58,098 | | | 24,572 | | | 20,523 |
| Total Expenses | | 2,857,642 | | | 2,385,883 | | | 2,328,519 |
| | | | | | | | | |
| Net Investment Loss | | (2,224,789) | | | (2,115,245) | | | (1,992,147) |
| | | | | | | | | |
| Net Realized/Unrealized Gain (Loss) from Investments, Securities Sold | | | | | | | | |
| Short, Foreign Currency Transactions and Currency | | | | | | | | |
| Net Realized Gain from Investments | | 6,408,805 | | | 2,185,396 | | | 2,015,637 |
| Net Realized Gain (Loss) from Securities Sold Short | | (1,801,441) | | | 1,216,895 | | | (6,675) |
| Net Realized Loss from Foreign Currency Transactions | | — | | | (229) | | | — |
| Net Realized Loss from Currency | | — | | | (26) | | | — |
| Change in Unrealized Depreciation on | | | | | | | | |
| Investments and Securities Sold Short | | (21,938,332) | | | (25,075,813) | | | (25,763,708) |
| Net Realized/Unrealized Loss from Investments, Securities Sold | | | | | | | | |
| Short, Foreign Currency Transactions and Currency | | (17,330,968) | | | (21,673,777) | | | (23,754,746) |
| Change in Net Assets Resulting from Operations | $ | (19,555,757) | | $ | (23,789,022) | | $ | (25,746,893) |
| (1) | Expense related to securities sold short. |
See accompanying notes to financial statements.
| Statements of Changes in Net Assets | | | | | | | | | | | | | | | |
| | | | | | | | Needham Aggressive | | Needham Small Cap |
| | | Needham Growth Fund | | Growth Fund | | Growth Fund |
| | | Year Ended | | | Year Ended | | Year Ended | | | Year Ended | | Year Ended | | | Year Ended |
| | | December 31, | | | December 31, | | December 31, | | | December 31, | | December 31, | | | December 31, |
| | | 2011 | | | 2010 | | 2011 | | | 2010 | | 2011 | | | 2010 |
| Change in Net Assets | | | | | | | | | | | | | | | |
| Operations: | | | | | | | | | | | | | | | |
| Net Investment Loss | $ | (2,224,789) | | $ | (2,435,448) | $ | (2,115,245) | | $ | (699,519) | $ | (1,992,147) | | $ | (573,899) |
| Net Realized Gain from Investments, | | | | | | | | | | | | | | | |
| Securities Sold Short, Foreign Cur- | | | | | | | | | | | | | | | |
| rency Transactions, and Currency | | 4,607,364 | | | 13,553,779 | | 3,402,036 | | | 1,263,483 | | 2,008,962 | | | 3,102,850 |
| Change in Unrealized Appreciation/ | | | | | | | | | | | | | | | |
| Depreciation on Investments and | | | | | | | | | | | | | | | |
| Securities Sold Short | | (21,938,332) | | | 26,230,306 | | (25,075,813) | | | 14,970,923 | | (25,763,708) | | | 10,097,638 |
| Change in Net Assets Resulting from | | | | | | | | | | | | | | | |
| Operations | | (19,555,757) | | | 37,348,637 | | (23,789,022) | | | 15,534,887 | | (25,746,893) | | | 12,626,589 |
| | | | | | | | | | | | | | | | |
| Distributions to Shareholders from: | | | | | | | | | | | | | | | |
| Capital Gains | | (7,330,132) | | | — | | (1,568,190) | | | (434,554) | | (4,537,435) | | | (1,957,692) |
| Return of Capital | | — | | | — | | — | | | — | | (135,521) | | | — |
| Total Distributions to Shareholders | | (7,330,132) | | | — | | (1,568,190) | | | (434,554) | | (4,672,956) | | | (1,957,692) |
| | | | | | | | | | | | | | | | |
| Capital Transactions: | | | | | | | | | | | | | | | |
| Shares Issued | | 51,065,814 | | | 30,369,946 | | 110,323,772 | | | 76,055,443 | | 106,098,656 | | | 82,898,156 |
| Shares Issued in Reinvestment of | | | | | | | | | | | | | | | |
| Distribution | | 7,104,581 | | | — | | 1,550,038 | | | 429,244 | | 4,495,940 | | | 1,888,546 |
| Shares Redeemed | | (65,153,889) | | | (27,099,636) | | (102,972,789) | | | (7,863,052) | | (96,483,443) | | | (7,862,485) |
| Redemption Fees | | 29,934 | | | 11,664 | | 74,691 | | | 10,430 | | 72,766 | | | 14,369 |
| Change in Net Assets from Capital | | | | | | | | | | | | | | | |
| Transactions | | (6,953,560) | | | 3,281,974 | | 8,975,712 | | | 68,632,065 | | 14,183,919 | | | 76,938,586 |
| | | | | | | | | | | | | | | | |
| Change in Net Assets | | (33,839,449) | | | 40,630,611 | | (16,381,500) | | | 83,732,398 | | (16,235,930) | | | 87,607,483 |
| | | | | | | | | | | | | | | | |
| Net Assets | | | | | | | | | | | | | | | |
| Beginning of Period | | 159,805,436 | | | 119,174,825 | | 106,551,358 | | | 22,818,960 | | 98,910,661 | | | 11,303,178 |
| End of Period | $ | 125,965,987 | | $ | 159,805,436 | $ | 90,169,858 | | $ | 106,551,358 | $ | 82,674,731 | | $ | 98,910,661 |
| Accumulated Net Investment Loss | $ | — | | $ | — | $ | — | | $ | — | $ | — | | $ | (271) |
| | | | | | | | | | | | | | | | |
| Share Transaction: | | | | | | | | | | | | | | | |
| Number of Shares Issued | | 1,281,150 | | | 921,616 | | 6,348,443 | | | 4,922,459 | | 7,443,556 | | | 6,413,702 |
| Number of Shares Reinvested | | 225,685 | | | — | | 113,806 | | | 27,747 | | 416,677 | | | 146,626 |
| Number of Shares Redeemed | | (1,749,928) | | | (838,093) | | (6,468,840) | | | (574,880) | | (7,481,888) | | | (652,522) |
| Change in Shares | | (243,093) | | | 83,523 | | (6,591) | | | 4,375,326 | | 378,345 | | | 5,907,806 |
See accompanying notes to financial statements.
| Needham Growth Fund | | | | | | | | | | |
| Financial Highlights | | | | | | | | | | |
| | | | | | | | | | | |
| (For a Share Outstanding | | | | Year Ended December 31, | | |
| Throughout each Period) | | 2011 | | 2010 | | 2009 | | 2008 | | 2007 |
| Net Asset Value, Beginning of Period | $ | 39.11 | $ | 29.77 | $ | 20.27 | | $ 36.05 | $ | 39.01 |
| Investment Operations | | | | | | | | | | |
| Net Investment Loss | | (0.58) | | (0.60) | | (0.43) | | (0.45) | | (0.25) |
| Net Realized and Unrealized | | | | | | | | | | |
| Gain (Loss) on Investments | | (3.79) | | 9.94 | | 9.93 | | (14.10) | | 1.45 |
| Total from Investment Operations | | (4.37) | | 9.34 | | 9.50 | | (14.55) | | 1.20 |
| | | | | | | | | | | |
| Less Distributions | | | | | | | | | | |
| Net Investment Income | | — | | — | | — | | — | | (0.01) |
| Net Realized Gains | | (1.97) | | — | | — | | (1.23) | | (4.15) |
| Total Distributions | | (1.97) | | — | | — | | (1.23) | | (4.16) |
| | | | | | | | | | | |
| Capital Contributions | | | | | | | | | | |
| Redemption Fees | | 0.01 | | —(a) | | —(a) | | — | | — |
| Total Capital Contributions | | 0.01 | | —(a) | | —(a) | | — | | — |
| Net Asset Value, End of Period | $ | 32.78 | $ | 39.11 | $ | 29.77 | $ | 20.27 | $ | 36.05 |
| | | | | | | | | | | |
| Total Return | | (10.94)% | | 31.37% | | 46.87% | | (40.41)% | | 3.09% |
| Net Assets, End of Period (000’s) | $ | 125,966 | $ | 159,805 | $ | 119,175 | $ | 92,818 | $ | 209,397 |
| Ratios/Supplemental Data | | | | | | | | | | |
| Ratio of Total Expenses to Average Net Assets | | 1.81% | | 2.11% | | 2.03% | | 2.04% | | 1.86% |
| Ratio of Total Expenses to Average Net Assets | | | | | | | | | | |
| (before interest and dividend expense) | | 1.78% | | 2.00% | | 2.00% | | 2.03% | | 1.85% |
| Ratio of Total Expenses to Average Net Assets | | | | | | | | | | |
| (before waiver and reimbursement of expenses) | | 1.81% | | 2.11% | | 2.08% | | 2.04% | | 1.86% |
| Ratio of Total Investment Income (Loss) to | | | | | | | | | | |
| Average Net Assets | | (1.41)% | | (1.85)% | | (1.71)% | | (1.37)% | | (0.61)% |
| Ratio of Total Investment Income (Loss) to | | | | | | | | | | |
| Average Net Assets (before waivers and | | | | | | | | | | |
| reimbursements of expenses) | | (1.41)% | | (1.85)% | | (1.76)% | | (1.37)% | | (0.61)% |
| Portfolio turnover rate | | 29% | | 62% | | 29% | | 41% | | 41% |
| | | | | | | | | | | |
| (a) Value is less than $0.005 per share. | | | | | | | | | | |
See accompanying notes to financial statements.
| Needham Aggressive Growth Fund | | | | | | | | | | |
| Financial Highlights | | | | | | | | | | |
| | | | | | | | | | | |
| (For a Share Outstanding | | | | | Year Ended December 31, | | | |
| Throughout each Period) | | 2011 | | 2010 | | 2009 | | 2008 | | 2007 |
| | | | | | | | | | | |
| Net Asset Value, Beginning of Period | $ | 17.14 | $ | 12.38 | $ | 9.45 | $ | 14.14 | $ | 13.96 |
| Investment Operations | | | | | | | | | | |
| Net Investment Loss | | (0.34) | | (0.11) | | (0.19) | | (0.26) | | (0.16) |
| Net Realized and Unrealized | | | | | | | | | | |
| Gain (Loss) on Investments | | (2.04) | | 4.98 | | 3.13 | | (3.65) | | 2.34 |
| Total from Investment Operations | | (2.38) | | 4.87 | | 2.94 | | (3.91) | | 2.18 |
| | | | | | | | | | | |
| Less Distributions | | | | | | | | | | |
| Net Realized Gains | | (0.25) | | (0.11) | | (0.02) | | (0.78) | | (2.00) |
| Total Distributions | | (0.25) | | (0.11) | | (0.02) | | (0.78) | | (2.00) |
| | | | | | | | | | | |
| Capital Contributions | | | | | | | | | | |
| Redemption Fees | | 0.01 | | —(a) | | 0.01 | | — | | — |
| Total Capital Contributions | | 0.01 | | —(a) | | 0.01 | | — | | — |
| Net Asset Value, End of Period | $ | 14.52 | $ | 17.14 | $ | 12.38 | $ | 9.45 | $ | 14.14 |
| | | | | | | | | | | |
| Total Return | | (13.77)% | | 39.42% | | 31.18% | | (27.60)% | | 15.58% |
| Net Assets, End of Period (000’s) | $ | 90,170 | $ | 106,551 | $ | 22,819 | $ | 10,202 | $ | 20,518 |
| Ratios/Supplemental Data | | | | | | | | | | |
| Ratio of Total Expenses to Average Net Assets | | 1.83% | | 2.09% | | 2.50% | | 2.51% | | 2.18% |
| Ratio of Total Expenses to Average Net Assets | | | | | | | | | | |
| (before interest and dividend expense) | | 1.80% | | 2.05% | | 2.49% | | 2.50% | | 2.18% |
| Ratio of Total Expenses to Average Net Assets | | | | | | | | | | |
| (before waiver and reimbursement of expenses) | | 1.83% | | 2.09% | | 2.50% | | 2.63% | | 2.18% |
| Ratio of Total Investment Loss to Average Net Assets | | (1.62)% | | (1.77)% | | (2.39)% | | (2.04)% | | (1.18)% |
| Ratio of Total Investment Loss to Average Net Assets | | | | | | | | | | |
| (before waiver and reimbursement of expenses) | | (1.62)% | | (1.77)% | | (2.39)% | | (2.15)% | | (1.18)% |
| Portfolio turnover rate | | 45% | | 55% | | 70% | | 45% | | 64% |
| | | | | | | | | | | |
| (a) Value is less than $0.005 per share. | | | | | | | | | | |
See accompanying notes to financial statements.
| Needham Small Cap Growth Fund | | | | | | | | | | |
| Financial Highlights | | | | | | | | | | |
| | | | | | | | | | | |
| (For a Share Outstanding | | | | Year Ended December 31, | | |
| Throughout each Period) | | 2011 | | 2010 | | 2009 | 2008 | | 2007 |
| | | | | | | | | | | |
| Net Asset Value, Beginning of Period | $ | 14.21 | $ | 10.73 | $ | 7.61 | $ | 11.29 | $ | 14.32 |
| Investment Operations | | | | | | | | | | |
| Net Investment Loss | | (0.27) | | (0.08) | | (0.20) | | (0.19) | | (0.26) |
| Net Realized and Unrealized | | | | | | | | | | |
| Gain (Loss) on Investments | | (2.04) | | 3.99 | | 3.33 | | (2.49) | | (0.02) |
| Total from Investment Operations | | (2.31) | | 3.91 | | 3.13 | | (2.68) | | (0.28) |
| | | | | | | | | | | |
| Less Distributions | | | | | | | | | | |
| Net Realized Gains | | (0.62) | | (0.43) | | (0.01) | | (0.82) | | (2.75) |
| Return of Capital | | (0.02) | | — | | — | | (0.18) | | — |
| Total Distributions | | (0.64) | | (0.43) | | (0.01) | | (1.00) | | (2.75) |
| | | | | | | | | | | |
| Capital Contributions | | | | | | | | | | |
| Redemption Fees | | —(a) | | —(a) | | —(a) | | — | | — |
| Total Capital Contributions | | —(a) | | —(a) | | —(a) | | — | | — |
| Net Asset Value, End of Period | $ | 11.26 | $ | 14.21 | $ | 10.73 | $ | 7.61 | $ | 11.29 |
| | | | | | | | | | | |
| Total Return | | (16.10)% | | 36.89% | | 41.18% | | (23.42)% | | (2.01)% |
| Net Assets, End of Period (000’s) | $ | 82,675 | $ | 98,911 | $ | 11,303 | $ | | $ | 7,726 |
| Ratios/Supplemental Data | | | | | | | | | | |
| Ratio of Total Expenses to Average Net Assets | | 1.84% | | 2.16% | | 2.57% | | 2.51% | | 2.50% |
| Ratio of Total Expenses to Average Net Assets | | | | | | | | | | |
| (before interest and dividend expense) | | 1.81% | | 2.08% | | 2.50% | | 2.50% | | 2.50% |
| Ratio of Total Expenses to Average Net Assets | | | | | | | | | | |
| (before waiver and reimbursement of expenses) | | 1.84% | | 2.16% | | 3.02% | | 3.57% | | 2.64% |
| Ratio of Total Investment Loss to Average Net Assets | | (1.57)% | | (1.88)% | | (2.50)% | | (2.02)% | | (1.54)% |
| Ratio of Total Investment Loss to Average Net Assets | | | | | | | | | | |
| (before waivers and reimbursements of expenses) | | (1.57)% | | (1.88)% | | (2.95)% | | (3.09)% | | (1.68)% |
| Portfolio turnover rate | | 105% | | 65% | | 154% | | 219% | | 38% |
| | | | | | | | | | | |
| (a) Value is less than $0.005 per share. | | | | | | | | | | |
See accompanying notes to financial statements.
Notes to Financial Statements
Needham Growth Fund (‘‘NGF’’), Needham Aggressive Growth Fund (‘‘NAGF’’) and Needham Small Cap Growth Fund (‘‘NSCGF’’) (each, a ‘‘Portfolio’’ and collectively, the ‘‘Portfolios’’), are portfolios of The Needham Funds, Inc. (the ‘‘Company’’), which is registered under the Investment Company Act of 1940, as amended (the ‘‘1940 Act’’) as a non-diversified, open-end management investment company. The Company was organized as a Maryland corporation on October 12, 1995.
| 2. | Significant Accounting Policies |
The following is a summary of significant accounting policies followed by the Company in the preparation of its financial statements. These policies are in conformity with accounting principles generally accepted in the United States of America (‘‘GAAP’’).
Security Valuation: Portfolio securities for which market quotations are readily available are stated at the last sale price reported by the principal exchange for the security as of the exchange’s close of business. Securities for which no sale has taken place during the day and securities which are not listed on an exchange are valued at the mean of the highest closing bid and lowest asked prices. New York Stock Exchange traded options are valued at the last reported sale price on any exchange on which the option is principally traded. If no sales are reported on a particular day, the options will be valued at the mean between the highest closing bid and lowest asked prices across the exchanges where the option is traded. Non-exchange traded options will also be valued at the mean between the last bid and asked quotations. For options where market quotations are not readily available, value will be determined in accordance with the fair value procedures described below. All other securities and assets for which (a) market quotations are not readily available, such as in the case of a market or technical disruption that prevents the normal trading of a security held by a Portfolio, (b) market quotations are believed to be unrepresentative of fair market value, such as in the case of a thinly traded security, or (c) valuation is normally made at the last sale price on a foreign exchange and a significant event occurs after the close of that exchange but before the New York Stock Exchange close, are valued at their fair value as determined in good faith by the Board of Directors (the ‘‘Board’’) in accordance with Fair Value Procedures established by the Board. The Company’s Fair Value Procedures are implemented and monitored by a Fair Value Committee (the ‘‘Committee’’) designated by the Board. When a security is valued in accordance with the
Fair Value Procedures, the Committee determines a value after taking into consideration any relevant information that is reasonably available to the Committee. Some of the more common reasons that may necessitate that a security be valued pursuant to these Fair Value Procedures include, but are not limited to: the security’s trading has been halted or suspended; the security has been de-listed from a national exchange; the security’s primary trading market is temporarily closed at a time when under normal conditions it would be open; or the security’s primary pricing source is not able or willing to provide a price. The assets of each Portfolio may also be valued on the basis of valuations provided by a pricing service approved by, or on behalf of, the Board.
The Portfolios did not value any securities in accordance with the Fair Value Procedures as of December 31, 2011.
Investment Transactions: Changes in holdings of portfolio securities for the Portfolios shall be reflected no later than in the first calculation on the first business day following the trade date for purposes of calculating each Portfolio’s daily net asset value per share. However, for financial reporting purposes, portfolio security transactions are reported on the trade date of the last business day of the reporting period. The cost (proceeds) of investments sold (bought to cover) is determined on a specific identification basis for the purpose of determining gains or losses on sales and buys to cover short positions. Dividend income, distributions to shareholders and dividend expense from securities sold short are recorded on the ex-dividend date. Interest income and interest expense from securities sold short is recorded on an accrual basis.
Foreign Currency: Foreign currency amounts are translated into U.S. dollars as follows: (i) assets and liabilities at the rate of exchange at the end of the respective period; and (ii) purchases and sales of securities and income and expenses at the rate of exchange prevailing on the dates of such transactions. The portion of realized gains arising from changes in the exchange rates are included with the net realized and unrealized gain or loss on investments. Principal risks associated with such transactions include the movement in value of the foreign currency relative to the U.S. dollar and the ability of the counterparty to perform.
The Portfolios may also invest in forward currency contracts. Fluctuations in the value of such forward currency transactions are recorded daily as unrealized gain or loss; realized gain or loss includes net gain or loss on transactions that have terminated by settlement. These instruments involve market risk, credit risk, or both kinds of risks, in excess of the amount recognized in the statements of assets and liabilities. Risks arise from the possible inability of counterparties to meet the terms of their contracts and from movement in currency and securities values and interest rates. The Portfolios did not enter into forward currency contracts during the year ended December 31, 2011.
Notes to Financial Statements (Continued)
Allocation of Expenses: Expenses directly attributable to a Portfolio are charged directly to that Portfolio, while expenses which are attributable to more than one Portfolio are allocated among the respective Portfolios based upon relative net assets or some other reasonable method.
Use of Estimates: The preparation of financial statements in accordance with GAAP requires management to make estimates and assumptions that affect the reported amounts and disclosures in the financial statements. Actual results could differ from those estimates and those differences could be material.
Distributions to Shareholders: Dividends from net investment income, if any, are declared and paid annually for the Portfolios. Distributable net realized gains, if any, are declared and distributed at least annually.
Redemption Fees: The Portfolios reserve the right to assess a redemption fee for shares redeemed within 60 days of purchase. The shareholder will be charged a fee equal to 2.00% of the value of the shares redeemed. The redemption fee is intended to offset excess brokerage commissions and other costs associated with fluctuations in asset levels and cash flows caused by frequent trading by shareholders. The applicability of the redemption fee will be calculated using a first-in first-out method, which means the oldest shares will be redeemed first, followed by the redemption of more recently acquired shares. For the year ended December 31, 2011, NGF, NAGF and NSCGF had contributions to capital due to redemption fees in the amounts of $29,934, $74,691 and $72,766, respectively.
Federal Income Taxes: It is the policy of each Portfolio to continue to qualify as a regulated investment company, as defined in the Internal Revenue Code, by complying with the provisions available to certain investment companies and to make distributions of net investment income and net realized capital gains sufficient to relieve it from all, or substantially all, federal income taxes. Accordingly, no provision for income taxes has been made in the Portfolios’ financial statements.
As of December 31, 2011, the Portfolios did not have any tax positions that did not meet the ‘‘more-likely-than-not’’ threshold of being sustained by the applicable tax authority.
Generally, tax authorities can examine all the tax returns filed for the last three years.
Fair Value Measurements: Valuation inputs used to determine the value of the Portfolios’ investments are summarized in the three broad levels listed below:
Level 1 — quoted prices in active markets for identical assets.
Level 2 — other significant inputs (including quoted prices of similar securities, interest rates, prepayment speeds, credit risk, etc.).
Level 3 — significant unobservable inputs (which may include the Portfolios’ own assumptions in determining the fair value of investments).
The inputs or methodology used to value securities are not necessarily an indication of the risk associated with investing in those securities.
Portfolio securities listed or traded on securities exchanges, including American Depositary Receipts (‘‘ADRs’’), are valued at the closing price on the exchange or system where the security is principally traded or at the NASDAQ Official Closing Price. If there have been no sales for that day on the exchange or system, a security is valued at the mean of the highest closing bid and lowest asked prices on the exchange or system where the security is principally traded. These valuations are typically categorized as Level 1 in the fair value hierarchy.
In accordance with procedures adopted by the Board, fair value pricing may be used if events materially affecting the value of foreign securities occur between the time the exchange on which they are traded closes and the time the Portfolios’ net asset values are calculated. These valuations are categorized as Level 2 in the fair value hierarchy.
The following is a summary categorization, as of December 31, 2011, of each Portfolio’s investments based on the level of inputs utilized in determining the value of such investments:
| | | LEVEL 1 - Quoted Prices(1)(3) | |
| | | NGF | | | NAGF | | | NSCGF | |
| Assets | | | | | | | | | |
Common Stocks(2) | | $ | 108,435,234 | | | $ | 88,740,475 | | | $ | 74,912,251 | |
| Short-Term | | | | | | | | | | | | |
| Investments | | | 17,872,579 | | | | 1,441,543 | | | | 8,234,950 | |
| Liabilities | | | | | | | | | | | | |
Securities Sold Short(2) | | | (3,753,860 | ) | | | (2,918,060 | ) | | | (2,990,270 | ) |
| Total | | $ | 122,553,953 | | | $ | 87,263,958 | | | $ | 80,156,931 | |
(1) As of December 31, 2011, the Portfolios did not hold Level 2 or Level 3 investments. | |
(2) Please refer to the Schedule of Investments to view segregation by industry. | |
(3) There were no transfers into or out of Level 1 or Level 2 during the period. | |
Notes to Financial Statements (Continued)
| 3. | Derivative Instruments and Hedging Activities |
The ‘‘Derivatives and Hedging’’ Topic of the Codification (ASC 815, formerly SFAS 133 and SFAS 161) requires enhanced disclosures about the Portfolios’ derivative and hedging activities, including how such activities are accounted for and their effect on the Portfolios’ financial position, performance and cash flows. The Portfolios did not use derivatives during the year ended December 31, 2011.
| 4. | Investment Advisory and Administrative Services |
The Company has engaged Needham Investment Management L.L.C. (the ‘‘Adviser’’) to manage its investments. The Company pays the Adviser a fee at the annual rate of 1.25% of the average daily net assets of each Portfolio.
The Adviser has entered into agreements with the Portfolios whereby the Adviser has contractually agreed to waive its fee for, and to reimburse expenses (excluding interest, dividends on short positions, acquired fund fees and expenses and extraordinary items) of NGF, NAGF and NSCGF in an amount that limits annual operating expenses to not more than 1.95% of the average daily net assets. The agreement is effective for the period from May 1, 2011 through May 1, 2012. The agreement shall continue in effect from year to year thereafter only upon mutual agreement of the respective Portfolio and the Adviser.
The Company and U.S. Bancorp Fund Services, LLC (the ‘‘Administrator’’) are parties to a Fund Administration Servicing Agreement. The Administrator provides administrative and fund accounting services pursuant to this agreement and, in consideration of these services, receives a fee computed daily and paid monthly at an annual rate based on a percentage of the value of the Company’s assets. The Administrator is also compensated for any out of pocket expenses that are reasonably incurred by the Administrator in carrying out its duties under the Administration Agreement. The Administrator also provides transfer agent services pursuant to a Transfer Agent Servicing Agreement for additional fees.
Certain officers of the Company are also officers of the Adviser and/or Needham & Company, LLC (the ‘‘Distributor’’). Such officers receive no fees from the Company for serving as officers of the Company. Each of the three Independent Directors receives a quarterly retainer of $3,000 and a per-meeting fee of $500. Each Independent Director is also a member of the Board’s Audit Committee and receives a fee of $500 per meeting attended. The Adviser provides an employee to serve as Chief Compliance Officer for the Company and to provide certain related services. An affiliate of the Adviser, Needham & Company, LLC, pays the Chief Compliance Officer’s compensation and the Company reimburses this affiliate for the Company’s portion of the expense.
The Company has adopted an Amended and Restated Plan of Distribution pursuant to Rule 12b-1 under the 1940 Act. Under the Plan, each Portfolio pays the Distributor and any other distributor or financial institution with which the Company has an agreement with respect to each Portfolio, a fee at an annual rate of 0.25% of each Portfolio’s daily average net assets. For the year ended December 31, 2011, NGF, NAGF and NSCGF paid 12b-1 fees to the Distributor in the amount of $400,455, $325,674 and $315,773, respectively.
During the year ended December 31, 2011, NGF, NAGF and NSCGF incurred and paid brokerage commissions to the Distributor in the amount of $41,140, $37,309 and $94,566, respectively.
Each Portfolio may borrow from banks up to 25% of its total assets and may pledge its assets in connection with these borrowings, provided that no additional investments shall be made while borrowings exceed 5% of total assets.
The Portfolios did not engage in any temporary borrowings during the year ended December 31, 2011.
| 7. | Short Sale Transactions |
During the year ended December 31, 2011, each Portfolio sold securities short. Upon selling a security short, the Portfolios record a receivable for the settlement amount and a corresponding liability, which is marked-to-market to reflect current value. Certain securities owned by each respective Portfolio are segregated as collateral while the short sales are outstanding. At December 31, 2011, the market value of securities separately segregated to cover short positions was $4,525,400, $3,944,756 and $6,517,300 for NGF, NAGF and NSCGF, respectively.
Additionally, the Portfolios had receivables for Deposit with Broker for Securities Sold Short of $3,752,057, $2,986,734 and $3,472,272 pledged as collateral with brokers in connection with open short positions for NGF, NAGF and NSCGF, respectively. Securities sold short at December 31, 2011 and their related market values and proceeds are set forth in the preceding Schedule of Securities Sold Short for each Portfolio.
Notes to Financial Statements (Continued)
| 8. | Investment Transactions |
The following summarizes the aggregate amount of the cost of purchases and proceeds from sales of investment securities and securities sold short, excluding short-term securities, during the year ended December 31, 2011:
| | | Purchases | | | Sales | |
| NGF | | $ | 68,259,330 | | | $ | 80,698,117 | |
| NAGF | | | 99,335,982 | | | | 58,681,583 | |
| NSCGF | | | 179,893,289 | | | | 137,075,860 | |
| 9. | Financial Instruments With Off-Balance Sheet Risk |
In the normal course of their business, the Portfolios may trade various financial instruments with off-balance sheet risk. These financial instruments include securities sold short, written options, futures, and forward currency contracts. Generally, these financial instruments represent future commitments to purchase or sell other financial instruments at specific terms at specified future dates. Each of these financial instruments contains varying degrees of off-balance sheet risk whereby changes in the market values of the securities underlying the financial instruments may be in excess of the amounts recognized in the financial statements.
Securities sold short represent obligations of the Portfolios to make future delivery of specific securities and, correspondingly, create an obligation to purchase the securities at market prices prevailing at a later delivery date (or to deliver the securities if already owned by the Portfolios). As a result, short sales create the risk that the Portfolios’ ultimate obligation to satisfy the delivery requirements may exceed the amount of the proceeds initially received on the liability recorded in the financial statements.
10. Indemnification
Under the Company’s organizational documents, its directors and officers are indemnified against certain liabilities arising out of the performance of their duties to the Company. In addition, in the ordinary course of business, the Company enters into contracts that contain a variety of indemnifications. The Company’s maximum exposure under these arrangements is unknown. However, the Company has not had prior claims or losses pursuant to these contracts and expects the risk of loss to be remote.
11. Federal Income Taxes
No provision for federal income taxes is required since the Company intends to continue to qualify as a regulated investment company under Subchapter M of the Internal Revenue Code and distribute substantially all of its taxable income and capital gains to shareholders. Because income tax regulations differ from GAAP, the timing and character of income and capital gain distributions determined in accordance with tax regulations can differ from income and capital gains recognized for financial reporting purposes. Accordingly, the character of distributions and the composition of net assets for tax purposes can differ from those reflected in the financial statements. These book/tax differences may be temporary or permanent in nature. Temporary differences are generally due to differing book and tax treatment for the timing of the recognition of gains and losses on securities, including post-October losses (as described below). Permanent differences are generally due to differing treatment of net investment losses. To the extent these differences are permanent, they are charged or credited to paid-in capital, accumulated net realized gain (loss), or accumulated net investment income (loss), as appropriate, in the period in which the differences arise. These reclassifications have no effect on net assets or net asset value per share of each Portfolio.
As of December 31, 2011, the cost, gross unrealized appreciation, gross unrealized depreciation, and the net unrealized appreciation (depreciation) on securities, including proceeds from securities sold short for federal income tax purposes, were as follows:
| | | | | | | | | | | | Net | |
| | | | | | Gross | | | Gross | | | Unrealized | |
| | | | | | Unrealized | | | Unrealized | | | Appreciation | |
| | | Cost | | | Appreciation | | | Depreciation | | | (depreciation) | |
| NGF | | $ | 101,119,541 | | | $ | 35,557,883 | | | $ | (10,369,611 | ) | | $ | 25,188,272 | |
| NAGF | | | 95,501,083 | | | | 14,968,647 | | | | (20,287,712 | ) | | | (5,319,065 | ) |
| NSCGF | | | 95,970,899 | | | | 6,285,931 | | | | (19,109,629 | ) | | | (12,823,698 | ) |
The difference between the tax cost of investments and the cost of investments for GAAP purposes is primarily due to the tax treatment for wash sale losses.
As of December 31, 2011, the components of distributable earnings (loss) on a tax basis were as follows:
| | | NGF | | | NAGF | | | NSCGF | |
| Undistributed ordinary | | | | | | | | | |
| income | | $ | — | | | $ | — | | | $ | — | |
| Undistributed long- | | | | | | | | | | | | |
| term capital gains | | | 3,328,227 | | | | 42,591 | | | | — | |
| Unrealized | | | | | | | | | | | | |
| appreciation | | | | | | | | | | | | |
| (depreciation) | | | 25,188,272 | | | | (5,319,065 | ) | | | (12,823,698 | ) |
| Total accumulated | | | | | | | | | | | | |
| earnings (loss) | | $ | 28,516,499 | | | $ | (5,276,474 | ) | | $ | (12,823,698 | ) |
Notes to Financial Statements (Continued)
The tax character of distributions paid during the year ended December 31, 2011 was as follows:
| | | NGF | | | NAGF | | | NSCGF | |
| Ordinary Income | | $ | 52,091 | | | $ | 30,729 | | | $ | — | |
| Net long-term capital gains | | | 7,278,041 | | | | 1,537,461 | | | | 4,537,435 | |
| Return of Capital | | | — | | | | — | | | | 135,521 | |
| Total distributions paid | | $ | 7,330,132 | | | $ | 1,568,190 | | | $ | 4,672,956 | |
Under current tax law, capital and currency losses realized after October 31 of a Portfolio’s fiscal year may be deferred and treated as occurring on the first business day of the following fiscal year for tax purposes. The following Portfolios had deferred post-October capital and currency losses, which will be treated as arising on the first business day of the fiscal year ending December 31, 2012.
| NGF | | $ | 1,118,733 | |
| NAGF | | | 10,976 | |
| NSCGF | | | 1,707,312 | |
The Regulated Investment Company Modernization Act of 2010 (the ‘‘Act’’) was enacted on December 22, 2010. The Act made changes to several tax rules impacting the Portfolios. In general, the provisions of the Act are effective for the Company’s fiscal year ending December 31, 2011. Although the Act provides several benefits, including the unlimited carryover of future capital losses, there may be a greater likelihood that all or a portion of each Portfolio’s pre-enactment capital loss carryovers may expire without being utilized due to the fact that post-enactment capital losses get utilized before pre-enactment capital loss carryovers.
The Act also changed the definition of post-October capital losses eligible for elective deferral to the greatest of a Regulated Investment Company’s (‘‘RIC’s’’) net capital loss attributable to the portion of the RIC’s taxable year after October 31, the RIC’s net long-term capital loss attributable to the portion of the RIC’s taxable year after October 31, or the RIC’s net short-term capital loss attributable to the portion of the RIC’s taxable year after October 31. As such, any post-October capital loss which a RIC has elected to defer is deemed to arise on the first day of the RIC’s following taxable year. The aggregate amount of the RIC’s anticipated deferred post-October capital losses would be included in the RIC’s tax basis accumulated loss carryforward, if applicable.
12. Subsequent Events
Management has evaluated subsequent events through the date of this filing. This evaluation did not result in any subsequent events that necessitated recognition or disclosures.
13. New Accounting Pronouncements
In May 2011, the Financial Accounting Standards Board issued Accounting Standards Update (‘‘ASU’’) No. 2011-04 ‘‘Amendments to Achieve Common Fair Value Measurement and Disclosure Requirements in U.S. GAAP and IFRSs.’’ ASU No. 2011-04 requires additional disclosures regarding fair value measurements. Effective for fiscal years beginning after December 15, 2011, and for interim periods within those fiscal years, entities will need to disclose the following:
1) the amounts of any transfers between Level 1 and Level 2 and the reasons for those transfers, and
2) for Level 3 fair value measurements, quantitative information about the significant unobservable inputs used, a description of the entity’s valuation processes, and a narrative description of the sensitivity of the fair value measurement to changes in the unobservable inputs and the interrelationship between inputs.
Management is currently evaluating the impact ASU No. 2011-04 will have on the Company’s financial statement disclosures.
14. Change in Independent Registered Public Accounting Firm (Unaudited)
Ernst & Young LLP (‘‘E&Y’’), 1100 Huntington Center, 41 South High Street, Columbus, Ohio 43215, an independent registered public accounting firm, was the independent registered public accounting firm for the Company for the fiscal year ended December 31, 2010. Effective November 23, 2011, the Audit Committee engaged KPMG LLP to replace E&Y as the independent registered public accounting firm for the Company.
During the Company’s past two fiscal years and any subsequent interim period: (i) no report on the Company’s financial statements contained an adverse opinion or a disclaimer of opinion, or was qualified or modified as to uncertainty, audit scope, or accounting principles; and (ii) there were no ‘‘disagreements’’ (as such term is used in Item 304 of Regulation S-K) with E&Y on any matter of accounting principles or practices, financial statement disclosure, or auditing scope or procedure, which disagree-ment(s), if not resolved to the satisfaction of E&Y, would have caused it to make reference to the subject matter of the disagreement(s) in connection with its report.
Report of Independent Registered Public Accounting Firm
The Board of Directors and Shareholders The Needham Funds, Inc.:
We have audited the accompanying statements of assets and liabilities, including the schedules of investments and schedules of securities sold short, of the Needham Growth Fund, Needham Aggressive Growth Fund and Needham Small Cap Growth Fund, each a ‘‘Portfolio’’ of The Needham Funds, Inc. (collectively, the ‘‘Portfolios’’) as of December 31, 2011, and the related statements of operations, changes in net assets and financial highlights for the year then ended. These financial statements and financial highlights are the responsibility of the Portfolios’ management. Our responsibility is to express an opinion on these financial statements and financial highlights based on our audits. The statements of changes in net assets for the year ended December 31, 2010 and the financial highlights for each of the years in the four-year period ended December 31, 2010 were audited by other independent registered public accountants whose report thereon, dated February 28, 2011, expressed an unqualified opinion on those statements of changes in net assets and financial highlights.
We conducted our audits in accordance with the standards of the Public Company Accounting Oversight Board (United States). Those standards require that we plan and perform the audit to obtain reasonable assurance about whether the financial statements and financial highlights are free of material misstatement. An audit includes examining, on a test basis, evidence supporting the amounts and disclosures in the financial statements. Our procedures included confirmation of securities owned as of December 31, 2011 by correspondence with the custodian and brokers. An audit also includes assessing the accounting principles used and significant estimates made by management, as well as evaluating the overall financial statement presentation. We believe that our audits provide a reasonable basis for our opinion.
In our opinion, the financial statements and financial highlights referred to above present fairly, in all material respects, the financial position of each of the portfolios constituting The Needham Funds, Inc. as of December 31, 2011, and the results of their operations, the changes in their net assets, and the financial highlights for the year then ended, in conformity with U.S. generally accepted accounting principles.
New York, New York
February 27, 2012
Information about Directors and Officers (Unaudited)
December 31, 2011
Information pertaining to the Directors and Officers of the Company is set forth below. The Statement of Additional Information (SAI) includes additional information about the Directors and is available without charge, upon request, by calling 800-625-7071.
The address of each individual is 445 Park Avenue, New York, NY 10022-2606. Each Director serves until the next annual shareholders meeting or until his successor is elected and qualified.
| | Term of Office | Portfolios in the | |
| | and Length of | Fund Complex | Principal Occupation(s) |
| Name, Age and Position | Term Served by | Overseen by | During Past 5 Years and Other |
| with the Fund | Director/Officer | Director/Officer | Directorships Held by Director/Officer |
| Independent Directors |
| John W. Larson, 76, | Indefinite; | Three | Partner at the law firm of Morgan, Lewis & Bockius LLP from 2003 until retiring |
| Director | Since 2006 | | in December 2009. Partner at the law firm of Brobeck, Phleger & Harrison LLP |
| | | | from 1969 until retiring in January 2003. From July 1971 to September 1973 |
| | | | worked in government service as Assistant Secretary of the United States Depart- |
| | | | ment of the Interior and Counselor to George P. Schultz, Chairman of the Cost of |
| | | | Living Council. Director of Wage Works, Inc. (an employee benefits company) |
| | | | since 2000. Director of MBA Polymers, Inc. (a plastics recycling company) since |
| | | | 1999. Director of Sangamo BioSciences, Inc. since 1996. |
| James P. Poitras, 69, | Indefinite; | Three | Currently retired. Director (since 2000) and Chairman (since 2001) of Kyma |
| Director | Since 1996 | | Technologies, Inc. (a specialty materials semiconductor company). Founder, |
| | | | Chairman, President and Chief Executive Officer of Integrated Silicon Systems (a |
| | | | computer software company) from 1985 to 1995. |
| F. Randall Smith, 73, | Indefinite; | Three | Founder and Chief Executive and Investment Officer of Capital Counsel LLC (a |
| Director | Since 1996 | | registered investment adviser) since September 1999. Co-Founder and Managing |
| | | | Partner of Train, Smith Counsel (a registered investment adviser) from 1975 to |
| | | | 1999. |
| | | | |
| Interested Director |
| George A. Needham*, 68, | Indefinite; | Three | Chairman of the Board and Chief Executive Officer of The Needham Group, Inc. |
| Chairman, President and | Since 1996 | | and Needham Holdings, LLC since December 2004. Chairman of the Board and |
| Director | | | Chief Executive Officer of Needham Asset Management, LLC since April 2006. |
| | | | Chairman of the Board from 1996 to December 2004 and Chief Executive Officer |
| | | | from 1985 to December 2004 of Needham & Company, LLC. |
| | | | |
| Officers |
| John Barr, 55 | One year: | Two | Portfolio Manager of Needham Asset Management since 2010. Founding and |
| Executive Vice President and | Since 2010 | | Managing Member of Oliver Investment Management, LLC from 2008 to 2009. |
| Co-Portfolio Manager of | | | Manager and Analyst at Buckingham Capital from 2002 to 2008. Managing Direc- |
| the Needham Growth Fund, | | | tor and a Senior Analyst at Robertson Stephens following semiconductor |
| Executive Vice President | | | companies from 2000 to 2002. From 1995 to 2000, Managing Director and Senior |
| and Portfolio Manager of | | | Analyst at Needham and Company, also served as Director of Research. |
| the Needham Aggressive | | | |
| Growth Fund. | | | |
| Chris Retzler, 40 | One year: | Two | Portfolio Manager of Needham Asset Management, LLC since 2008. Vice |
| Executive Vice President and | Since 2008 | | President of Needham Asset Management, LLC since 2005. Head of Winterkorn, |
| Co-Portfolio Manager of | | | a healthcare manufacturing and distribution company, from 2002 to 2005. |
| the Needham Growth Fund, | | | |
| Executive Vice President | | | |
| and Portfolio Manager of | | | |
| the Needham Small Cap | | | |
| Growth Fund. | | | |
| James W. Giangrasso, 49 | One year: | Three | Chief Financial Officer of Needham Asset Management, LLC since 2011. |
| Chief Financial Officer, | Since 2011 | | Principal and Controller of Needham Asset Management, LLC since 2006. |
| Treasurer and Secretary | | | |
| James M. Abbruzzese, 42, | One year; | Three | Chief Compliance Officer of Needham Asset Management, LLC since April 2006 |
| Chief Compliance Officer | Since 2004 | | and Chief Compliance Officer and Managing Director of Needham & Company, |
| | | | LLC since July 1998. |
* | An ‘‘interested person’’, as defined in the 1940 Act, of the Company or the Company’s investment adviser. Mr. Needham is deemed to be an interested person because of hisaffiliation with the Funds’ Adviser and the Funds’ Distributor, and because he is an officer of the Company. |
Supplementary Information (Unaudited)
December 31, 2011
Federal Income Tax Information
During the year ended December 31, 2011, NGF, NAGF and NSCGF declared and paid long-term realized gains distributions in the amounts of $7,278,041, $1,537,461 and $4,672,956, respectively.
For the year ended December 31, 2011, NGF and NAGF declared and paid ordinary income distributions in the amounts of $52,091 and $30,729, respectively. NSCGF did not declare any ordinary income distributions.
For the fiscal year ended December 31, 2011, certain dividends paid by the Portfolios may be subject to a maximum tax rate of 15%. The percentage of dividends declared from ordinary income reported as qualified dividend income was as follows:
| NGF | 100.00% |
| NAGF | 100.00% |
| NSCGF | 0.00% |
For corporate shareholders, the percent of ordinary income distributions qualifying for the corporate dividends received deduction for the fiscal year ended December 31, 2011 was as follows:
| NGF | 100.00% |
| NAGF | 100.00% |
| NSCGF | 0.00% |
Privacy Policy
It is the policy of The Needham Funds, Inc. (the ‘‘Fund’’) to keep personally identifiable financial information about you as an individual (‘‘nonpublic personal information’’) confidential, and use or disclose it only as necessary to provide services to you or the Fund or as otherwise required or permitted by law. We may collect the following nonpublic personal information about you:
| ● | Information we receive from you on or in applications or other forms, correspondence, or conversations, including, but not limited to, your name, address, phone number, social security number, assets, income and date of birth; and |
| ● | Information about your transactions with us, our affiliates, or others, including, but not limited to, your account number and balance, payments history, parties to transactions, cost basis information, other financial information and information about how you vote your shares. |
We disclose nonpublic personal information about current and former shareholders to companies that provide necessary services to the Fund. These companies include the transfer agent, distributor, administrator and investment adviser as well as other affiliates of the Fund. We maintain physical, electronic and procedural safeguards that comply with federal standards to guard your nonpublic personal information and restrict access to this information to those persons who need it to provide services to you or the Fund or who are otherwise permitted by law to receive it. In the event that you hold any shares of our funds through a financial intermediary, including, but not limited to, a broker-dealer, bank, or trust company, the privacy policy of your financial intermediary governs how your non-public personal information is shared with nonaffiliated third parties.
If you have any questions concerning the Fund’s Privacy Policy, please call 1-800-625-7071.
Disclosure of Portfolio Holdings
The Company files a Form N-Q with the Securities and Exchange Commission (the ‘‘SEC’’) no more than sixty days after the Company’s first and third fiscal quarters. For the Company, this would be for the fiscal quarters ending March 31 and September 30. Form N-Q includes a complete schedule of the Company’s portfolio holdings as of the end of those fiscal quarters. The Company’s N-Q filings can be found free of charge on the SEC’s website at http://www.sec.gov, or they may be reviewed and copied at the SEC’s Public Reference Room in Washington, D.C. (call 800-SEC-0330 for information on the operation of the Public Reference Room).
Voting Proxies on Company Portfolio Securities
A description of the policies and procedures that the Company uses to determine how to vote proxies relating to portfolio securities and information regarding how the Company voted proxies relating to portfolio securities during the most recent 12-month period ended June 30 are available without charge, upon request, by calling 800-625-7071 or on the SEC’s website at http://www.sec.gov.
Board Consideration and Approval of Investment Advisory Agreement
On October 27, 2011, at a meeting called for the purpose of voting on such approval, the Board of Directors, including all of the Directors who are not parties to the Advisory Agreement or interested persons of any such party (the ‘‘Independent Directors’’), approved the continuance of the Company’s Restated Investment Advisory Agreement
Supplementary Information (Unaudited) (Continued)
December 31, 2011 dated October 21, 2004 (the ‘‘Advisory Agreement’’) with the Adviser. In so doing, the Board studied materials specifically relating to the Advisory Agreement provided by the Adviser and counsel to the Fund, including peer group comparisons consisting of performance and expense information for other investment companies with the ability to engage in short sales. The Board considered a variety of factors, including the following:
The Board considered the nature, extent and quality of the services to be provided by the Adviser to the Fund pursuant to the Advisory Agreement, including the Adviser’s competence and integrity; research capabilities; implementation and enforcement of compliance procedures and financial reporting controls; and adherence to the investment objectives, policies and restrictions of each Portfolio. The Board also reviewed information provided by the Adviser as to its methodology, research and analysis, including, but not limited to, its company visits, which it employs in selecting securities for the Company’s Portfolios. The Board considered the qualifications, capabilities and experience of the Company’s portfolio managers, as well as that of other personnel employed by the Adviser who are responsible for providing services to the Company, including the fact that a high caliber of personnel was both needed and provided to meet the needs of the shareholders of each Portfolio specifically with respect to investments in securities sold short. The Board concluded that the Adviser fulfilled all of its responsibilities in accordance with its obligations under the Advisory Agreement.
The Board also evaluated the investment performance of each Portfolio and the Adviser relative to the NASDAQ Composite Index, the S&P 500 Index, the S&P 400 MidCap Index and the Russell 2000 Index for the third quarter of 2011, the year-to-date, 1 year, 3 years, 5 years, 10 years (with respect to the Growth Fund and the Aggressive Growth Fund) and since inception, as well as peer group expense data provided by the Adviser, as of September 30, 2011, considering the Company’s investment strategy. The Board noted the performance of each Portfolio over the 1-, 3-, 5-and 10-year (with respect to the Growth Fund and the Aggressive Growth Fund) and since inception periods on an absolute basis and relative to its peers, with emphasis placed on the advisory fee paid for each Portfolio as compared to the returns produced by the respective Portfolio, the profitability of the Adviser, and the long-term performance of the Portfolios compared to their peer groups in light of current market conditions. The Independent Directors stated that their consideration of the continuance of the Advisory Agreement was influenced primarily by the long-established peer-group comparisons contained in the Board meeting materials, noting that each Portfolio’s long-term performance returns were in line with the returns of the peer group funds.
Additionally, the Board reviewed information on the fee structure of the Advisory Agreement, including the costs of the services to be provided and the profits and benefits to be realized by the Adviser and its affiliates from their relationship with the Company, as evidenced by the Adviser’s profitability analysis, including specifically the profitability of the Portfolios. The profitability analysis consisted of revenues and expenses by category and profit or loss for each Portfolio for the year ended December 31, 2010. The Board also reviewed comparisons of the rates of compensation paid to managers of funds in each Portfolio’s peer group, including funds with the ability to engage in short sales, and Lipper data relating to average expenses and advisory fees for funds comparable in size, character and investment strategy to each Portfolio. The Independent Directors’ consideration of the continuance of the Advisory Agreement was influenced primarily by the long-established peer-group comparisons provided by the Adviser. The Independent Directors confirmed that they had received adequate other information to make a reasonable determination with respect to the approval of the Advisory Agreement. Based on the information provided, the Board determined that, although the Company’s fee structure is slightly higher than the average of its respective peer funds, it is still competitive with its peer group and both fair and reasonable given the services and long-term performance results provided by the Adviser.
The Board considered the Company’s investment advisory fees, 12b-1 fees, professional fees, other expenses and total expenses, as well as the income and expenses of the Adviser. The Board also considered the amount and nature of fees paid by shareholders. The Board considered the fact that the Adviser has contractually agreed to waive a portion of its fees.
The Adviser provided information on peer-group comparisons consisting of no load mid-cap growth, small blend, long/short equity, and small growth funds comparable in size to the Portfolios. The materials compared each Portfolio’s average net assets; management fee; 12b-1 fees; net expense ratio; gross expense ratio; expense waiver; and performance for the quarter-to-date, 1-year, 3-year, 5-year and 10-year (with respect to the Growth Fund and the Aggressive Growth Fund) and since inception periods ended September 30, 2011. It was noted
Supplementary Information (Unaudited) (Continued)
December 31, 2011 that the Fund’s management fee and expense ratios are within the average range compared to its respective peer funds.
The Board considered the issue of economies of scale and noted that, given the small size of each Portfolio, consideration of fee breakpoints was premature.
Based on its evaluation of all material aspects of the Advisory Agreement, including the foregoing factors and such other information believed to be reasonably necessary or relevant in the exercise of their reasonable business judgment to evaluate the terms of the Advisory Agreement, the Board, including all of the Independent Directors voting separately, concluded that the continuation of the Advisory Agreement would be in the best interest of each Portfolio’s shareholders, and determined that the compensation to the Adviser provided for in the Advisory Agreement is fair and reasonable in light of the services to be performed.
The Advisory Agreement provides that it shall continue in effect from year to year with respect to each Portfolio as long as it is approved at least annually (i) by a vote of a majority of the outstanding voting securities of each Portfolio (as defined in the 1940 Act) or by a vote of a majority of the Directors of the Fund, on behalf of each Portfolio, and (ii) a vote of a majority of the Directors who are not parties to the Advisory Agreement or ‘‘interested persons’’ of any party thereto, cast in person at a meeting called for the purpose of voting on such approval. The Advisory Agreement may be terminated on 60 days’ written notice by either party and will terminate automatically if it is assigned within the meaning of the 1940 Act.
Item 2. Code of Ethics.
The registrant has adopted a code of ethics that applies to the registrant’s principal executive officer and principal financial officer. The registrant has not made any amendments to its code of ethics during the period covered by this report. The registrant has not granted any waivers from any provisions of the code of ethics during the period covered by this report.
A copy of the registrant’s Code of Ethics is filed herewith.
Item 3. Audit Committee Financial Expert.
The registrant’s board of directors has determined that there is at least one audit committee financial expert serving on its audit committee. F. Randall Smith is the “audit committee financial expert” and is considered to be “independent” as each term is defined in Item 3 of Form N-CSR.
Item 4. Principal Accountant Fees and Services.
The registrant has engaged its principal accountant to perform audit services, audit-related services, tax services and other services during the past two fiscal years. “Audit services” refer to performing an audit of the registrant's annual financial statements or services that are normally provided by the accountant in connection with statutory and regulatory filings or engagements for those fiscal years. “Audit-related services” refer to the assurance and related services by the principal accountant that are reasonably related to the performance of the audit. “Tax services” refer to professional services rendered by the principal accountant for tax compliance, tax advice, and tax planning. “Other services” provided by the principal accountant. The following table details the aggregate fees billed or expected to be billed for each of the last two fiscal years for audit fees, audit-related fees, tax fees and other fees by the principal accountant.
| | FYE 12/31/2011 | FYE 12/31/2010 |
| Audit Fees | $ 62,500 | $ 80,000 |
| Audit-Related Fees | $ 0 | $ 0 |
| Tax Fees | $ 18,000 | $ 18,900 |
| All Other Fees | $ 0 | $ 0 |
The audit committee has adopted pre-approval policies and procedures that require the audit committee to pre-approve all audit and non-audit services of the registrant, including services provided to any entity affiliated with the registrant.
The percentage of fees billed by KPMG LLP applicable to non-audit services pursuant to waiver of pre-approval requirement were as follows:
| | FYE 12/31/2011 | FYE 12/31/2010 |
| Audit-Related Fees | 0% | 0% |
| Tax Fees | 0% | 0% |
| All Other Fees | 0% | 0% |
All of the principal accountant’s hours spent on auditing the registrant’s financial statements were attributed to work performed by full-time permanent employees of the principal accountant. (If more than 50 percent of the accountant’s hours were spent to audit the registrant's financial statements for the most recent fiscal year, state how many hours were attributed to work performed by persons other than the principal accountant's full-time, permanent employees.)
The following table indicates the non-audit fees billed or expected to be billed by the registrant’s accountant for services to the registrant and to the registrant’s investment adviser (and any other controlling entity, etc.—not sub-adviser) for the last two years. The audit committee of the board of trustees/directors has considered whether the provision of non-audit services that were rendered to the registrant's investment adviser is compatible with maintaining the principal accountant's independence and has concluded that the provision of such non-audit services by the accountant has not compromised the accountant’s independence.
| Non-Audit Related Fees | FYE 12/31/2011 | FYE 12/31/2010 |
| Registrant | None | None |
| Registrant’s Investment Adviser | None | None |
Item 5. Audit Committee of Listed Registrants.
Not applicable to registrants who are not listed issuers (as defined in Rule 10A-3 under the Securities Exchange Act of 1934).
Item 6. Investments.
| (a) | Schedule of Investments is included as part of the report to shareholders filed under Item 1 of this Form. |
Item 7. Disclosure of Proxy Voting Policies and Procedures for Closed-End Management Investment Companies.
Not applicable to open-end investment companies.
Item 8. Portfolio Managers of Closed-End Management Investment Companies.
Not applicable to open-end investment companies.
Item 9. Purchases of Equity Securities by Closed-End Management Investment Company and Affiliated Purchasers.
Not applicable to open-end investment companies.
Item 10. Submission of Matters to a Vote of Security Holders.
Not Applicable.
Item 11. Controls and Procedures.
| (a) | The Registrant’s Chief Executive Officer and Chief Financial Officer have reviewed the Registrant's disclosure controls and procedures (as defined in Rule 30a-3(c) under the Investment Company Act of 1940 (the “Act”)) as of a date within 90 days of the filing of this report, as required by Rule 30a-3(b) under the Act and Rules 13a-15(b) or 15d-15(b) under the Securities Exchange Act of 1934. Based on their review, such officers have concluded that the disclosure controls and procedures are effective in ensuring that information required to be disclosed in this report is appropriately recorded, processed, summarized and reported and made known to them by others within the Registrant and by the Registrant’s service provider. |
| (b) | There were no changes in the Registrant's internal control over financial reporting (as defined in Rule 30a-3(d) under the Act) that occurred during the second fiscal quarter of the period covered by this report that has materially affected, or is reasonably likely to materially affect, the Registrant's internal control over financial reporting. |
Item 12. Exhibits.
| (a) | (1) Any code of ethics or amendment thereto, that is the subject of the disclosure required by Item 2, to the extent that the registrant intends to satisfy Item 2 requirements through filing an exhibit. Filed herewith. |
(2) A separate certification for each principal executive and principal financial officer pursuant to Section 302 of the Sarbanes-Oxley Act of 2002. Filed herewith.
(3) Any written solicitation to purchase securities under Rule 23c-1 under the Act sent or given during the period covered by the report by or on behalf of the registrant to 10 or more persons. Not applicable to open-end investment companies.
| (b) | Certifications pursuant to Section 906 of the Sarbanes-Oxley Act of 2002. Furnished herewith. |
SIGNATURES
Pursuant to the requirements of the Securities Exchange Act of 1934 and the Investment Company Act of 1940, the registrant has duly caused this report to be signed on its behalf by the undersigned, thereunto duly authorized.
(Registrant) The Needham Funds, Inc.
By (Signature and Title) /s/ George A. Needham
George A. Needham, President (Chief Executive Officer)
Date March 8, 2012
Pursuant to the requirements of the Securities Exchange Act of 1934 and the Investment Company Act of 1940, this report has been signed below by the following persons on behalf of the registrant and in the capacities and on the dates indicated.
By (Signature and Title) /s/ George A. Needham
George A. Needham, President (Chief Executive Officer)
Date March 8, 2012
By (Signature and Title) /s/ James W. Giangrasso
James W. Giangrasso, Treasurer and Secretary (Chief Financial Officer)
Date March 8, 2012