Washington, D.C. 20549
The Needham Funds, Inc.
Mr. George A. Needham, 445 Park Avenue, New York, NY 10022-2606
Item 1. Reports to Stockholders.
445 Park Avenue
New York, New York 10022-2606
1-800-625-7071
www.needhamfunds.com
Annual Report
December 31, 2013
| | | |
| Contents | | |
| | | |
| Letter from the Adviser | | 1 |
| | | |
| Portfolio Characteristics | | |
| Needham Growth Fund | | 5 |
| Needham Aggressive Growth Fund | | 6 |
| Needham Small Cap Growth Fund | | 7 |
| Disclosure of Fund Expenses | | 8 |
| | | |
| Schedules of Investments | | |
| Needham Growth Fund | | 9 |
| Needham Aggressive Growth Fund | | 12 |
| Needham Small Cap Growth Fund | | 15 |
| | | |
| Schedules of Securities Sold Short | | |
| Needham Growth Fund | | 11 |
| Needham Aggressive Growth Fund | | 14 |
| Needham Small Cap Growth Fund | | 15 |
| | | |
| Statements of Assets and Liabilities | | 17 |
| | | |
| Statements of Operations | | 18 |
| | | |
| Statements of Changes in Net Assets | | 19 |
| | | |
| Financial Highlights | | |
| Needham Growth Fund | | 20 |
| Needham Aggressive Growth Fund | | 21 |
| Needham Small Cap Growth Fund | | 22 |
| | | |
| Notes to Financial Statements | | 23 |
| | | |
| Report of Independent Registered Public | | |
| Accounting Firm | | 28 |
| | | |
| Information about Directors and Officers | | 29 |
| | | |
| Supplementary Information | | |
| and Privacy Policy | | 30 |
This report is authorized for distribution to prospective investors only when preceded or accompanied by a current prospectus. The prospectus contains more complete information, including investment objectives, risks, expenses and charges and should be read carefully before investing or sending any money. To obtain a prospectus or summary prospectus, please call 1-800-625-7071.
Portfolios of The Needham Funds, Inc., like all mutual funds:
| | | |
| | ● | Are NOT FDIC insured |
| | ● | Have no bank guarantee |
| | ● | May lose value |
The Needham Funds, Inc. are distributed by Needham & Company, LLC.
| | |
| Needham Funds | Annual Report 2013 |
| | |
 | 445 Park Avenue |
| New York, NY 10022 |
| (800) 625-7071 |
| www.needhamfunds.com |
February 2014
Dear Shareholders, Friends of Needham and Prospective Shareholders,
We are pleased to report results for the fourth quarter and for the year 2013 for the Needham Growth Fund, Needham Aggressive Growth Fund and Needham Small-Cap Growth Fund.
Needham Funds’ Fourth Quarter and Full Year 2013 Overview
The equity markets were strong in the fourth quarter and in 2013. In the fourth quarter, the Needham Growth Fund (NEEGX) was up 7.7%, the Needham Aggressive Growth Fund (NEAGX) was up 6.1%, and the Needham Small-Cap Growth Fund (NESGX) was up 4.7%. The S&P 500 Total Return Index was up 10.5%, the NASDAQ Composite was up 11.1%, and the Russell 2000 Total Return Index was up 8.7%. The Funds were hurt by their short exposure in the fourth quarter.
In 2013, NEEGX was up 34.7%, NEAGX was up 36.3%, and NESGX was up 27.9%. The S&P 500 Total Return Index was up 32.4%, the NASDAQ was up 40.2%, and the Russell 2000 Index was up 38.8%. The year was dominated by the accommodative monetary policies around the world, with a pause in August over concern that the Federal Reserve would begin to taper its quantitative easing program. The Funds outperformed in May and July with strong earnings and merger and acquisition activity.
We highlight Super Micro Computer, Inc. (SMCI), up 27% in the fourth quarter and 68% in 2013, and held by all three Funds. The company makes servers and storage systems. CEO Charles Liang started Super Micro over 20 years ago without venture capital backing and still owns 16% of the company, now valued at about $150 million.
We saw merger and acquisition activity in the fourth quarter and throughout 2013. In December, NESGX and NEAGX holding Solta Medical, Inc. (SLTM) announced an agreement to sell to Valeant Pharmaceuticals International, Inc. (VRX). In November, Anaren (ANEN), held by all three Funds, agreed to be acquired by a financial buyer. In October, MAKO Surgical Corp. (MAKO) agreed to be acquired by Stryker Corp. (SYK), and in December, NEAGX holding AZ Electronic Materials (AZEM; London) agreed to be acquired by Merck KGaA.
We believe the M&A thesis will continue in 2014 and will require patient investing. The Funds benefitted from six other acquisitions in 2013. In 2014, we have already had an additional acquisition of one of the companies held by NEAGX and NESGX as of December 31, 2013. Our small cap companies with innovative products are attractive targets for larger companies with broader distribution.
As 2013 progressed, the pockets of exuberance in the equity markets expanded. From high-flying IPOs, such as Potbelly Corp. (PBPB), FireEye (FEYE) and RocketFuel (FUEL), which were all up 100% on the first day of trading, we saw activity that is not sustainable. Last quarter, we commented that corners of the equities market were seeing extraordinary valuations. Twitter (TWTR) at 26x enterprise value-to-revenues, ServiceNow (NOW) at 13x, and Workday (WDAY) at 22x leave little room for error.
Recently, Facebook agreed to pay $19 billion for WhatsApp with its $20 million of revenue. The valuation was justified as “it’s only $40 per user.” Billion-dollar private company valuations are common.
Last week, our holding Akamai Technologies priced a four-year convertible bond at a 50% conversion premium and a 0% interest rate. In this era of low and managed interest rates, investment hurdle rates are low and some valuations are extended.
In The Growth Factor, we wrote, “Are we in a bubble? We say no, but be careful out there.” We believe we are closer to the day when these valuations will end. But in the fourth quarter and in 2013, our shorts were some of the largest detractors.
In other issues of The Growth Factor, we wrote about our investment process and our success with three-to –ten-baggers. We also highlighted World Wrestling Entertainment, Inc. (WWE), Clean Harbors, Inc. (CLH), Black Diamond, Inc. (BDE) and several interesting private companies in a preview of the 16th Annual Needham Growth Conference held in January.
2014: Another Year for TINA (There Is No Alternative to Equities)
We continue to believe in TINA, “There Is No Alternative” to equities. Actual monetary tightening seems unlikely. Throughout the developed world, central bankers are pursuing accommodative monetary policies. New Federal Reserve Chairwoman Janet Yellen is focused on employment (not the unemployment rate) and sees need for continued monetary easing. Last month, Christine Lagarde, head of the IMF, warned that deflation must be “fought decisively.” In 2012, European Central Bank President Draghi stated an intent to “do whatever it takes” to preserve the Euro and this intent continued for 2013. Japan’s Prime Minister Abe and Japan Central Bank President Kuroda have made their marks through depreciating the yen and use of quantitative easing and other monetary tools.
Bonds and pure dividend-paying stocks were poor performers since interest rates bottomed on April 30 of last year. From April 30 thru December 31, 2013, dividend-paying stocks as represented by the Dow Jones Utility Index are down over (6.0)% and the iShares 20+ year Treasury bond ETF is down over (15.2)%, while the Needham Growth Fund was up 22.1%, the Needham Aggressive Growth Fund was up 28.5%, and the Needham Small Cap Growth Fund was up 25.0%.
In the last few months, the correlation between stocks has decreased and the importance of stock selection has increased. We see several themes in our domestic-based holdings, all revolving around applying innovative technology to: 1)
| | | |
| | 1) | Industrial manufacturing, including next-generation semiconductors; |
| | | |
| | 2) | Business services thru software-as-a-service and cloud-based technology; and |
| | | |
| | 3) | Bring savings and innovation to the healthcare system. |
We see opportunity in our valuation-sensitive, domestically focused portfolios in 2014. The best of these investments have become three-to-ten-baggers as they grow and generate long-term capital appreciation. In Growth Factor #11 we highlighted the 18 three, five and ten-baggers which the Funds have held for three to ten years. During 2013, the Funds had a net addition of one ten-bagger and five five-baggers, and a decrease of two three-baggers. We target the compounding returns that come from sound company management and internally funded growth opportunities, however, our investments may not meet these stated objectives and goals and may lose money.
Over the last three years, the Needham Growth Fund and Needham Aggressive Growth Fund have increased their market capitalizations as their holdings have appreciated. Since March 30, 2010, the large cap exposure of NEEGX has increased to 52% from 21% of its invested net assets, and NEAGX has gone to 29% from 9%. NEAGX also has 10% of assets in mid-cap equities. Our larger cap investments could help dampen volatility in 2014.
We’d like to highlight II-VI Incorporated (IIVI), KVH Industries, Inc. (KVHI), The Street, Inc. (TST), World Wrestling Entertainment and Zygo Corporation (ZIGO) as stocks to watch for 2014. These are all small cap stocks that we believe to be underfollowed and unloved today. II-VI and Zygo fit into our theme of automating industrial manufacturing. The Street (a digital financial media company), KVH Industries (voice and media for the commercial maritime market) and World Wrestling Entertainment (live action sports) are using technology to provide content in new ways.
As the markets have already exhibited in January, we believe 2014 could be a more volatile year, and our ability to short and hold cash could reduce the impact of this market volatility on the Funds. The Funds can hold up to 25% of their net asset value in short positions. Over the last four years, short positions have ranged from 0% to 10% of invested assets, which is where they stood at year-end for all three Funds.
Needham Growth Fund
The Needham Growth Fund was up 7.7% in the fourth quarter and 34.7% for 2013. It was the quarter and year of health-care. The top three holdings—Express Scripts Holding Company (ESRX), +14%; Thermo Fisher Scientific Inc. (TMO), +21%; and Gilead Sciences, Inc. (GILD), +19%—were the top 3 contributors in the fourth quarter and are all long-term holdings. In 2013, Gilead was +104% and Thermo Fisher +76%.
Over the next few years, we see Gilead with the potential to double the size of its business through its Hepatitis C drug, Sovaldi. Thermo Fisher Scientific, which provides analytical instruments and laboratory technology to the life sciences industry, could see significant synergies from its just completed acquisition of Life Technologies Corporation (LIFE), a leading supplier of DNA reagents, assays and other consumables and instruments to biotechnology companies. Express Scripts, a pharmacy benefits manager, continues to benefit because it reduces the cost of delivering medications.
The biggest percentage winner for 2013 was WageWorks (WAGE), + 234%. WageWorks provides consumer direct benefits management for enterprises. WageWorks saw progress with large enterprise sales, and we believe investors came to recognize the recurring nature of its revenues.
The leading detractors for the year were two short positions. For the year, many of our long-term holdings such as Express Scripts, CarMax, Inc. (KMX), Akamai Technologies, Inc. (AKAM), and Schlumberger NV (SLB) were only +15-30%, which means they underperformed the indices and were a drag on performance. It was that kind of year.
The Needham Growth Fund closed 2013 with holdings of 52% large-cap and 38% small and micro-cap. The fund is not a typical, mid-cap, large-cap or all-cap fund trying to overweight or underweight positions in an index. While Morningstar categorizes the fund as Mid-Cap Growth and Lipper as Mid-Cap Core, we view our mandate to make money through long-term holdings with as little risk as possible. Express Scripts, Thermo Fisher and Gilead are 3-10-year holdings. As of December 31, they were three and five-baggers for the Fund.
The Needham Growth Fund closed the year with a 4% short position and 4% cash, as a percentage of total investments.
Needham Aggressive Growth Fund
The Needham Aggressive Growth Fund was up 6.1% in the fourth quarter and +36.3% for 2013. The top contributor for the quarter and the year was the Fund’s largest, long-term holding, PDF Solutions, Inc. (PDFS). PDF was up 21% for the fourth quarter and up 86% in 2013. We believe PDF is at the beginning of an increase in revenue from 28nm production by its leading customers, Samsung and Global Foundries. PDF is still followed by just one Wall Street analyst.
Gilead Sciences was the second best contributor for the quarter and the year. For the quarter, other top contributors were Apple Inc. (AAPL), Electronics for Imaging, Inc. (EFII) Super Micro, and World Wrestling Entertainment, Inc., which was a new holding in the third quarter.
WWE has transitioned from risqué family entertainment in a world starved for content and sports programming. The just announced WWE Network, which is an over-the-top subscription offering, and the renegotiation of the WWE’s TV rights could double or triple earnings over the next few years.
Two of the Fund’s largest detractors in the quarter and in 2013 were short positions. One of those positions is a technology equipment provider valued at 10x enterprise value to last 12 months revenue. Historically, companies in this segment are worth 1-2x. We believe the company will have inventory issues at some point in 2014 and we will be rewarded.
In addition to II-VI, KVH Industries, The Street, WWE, and Zygo, we are excited about our underfollowed, small cap investments in CEVA, Inc. (CEVA) and Crawford & Company Class A shares (CRD/A). Except for II-VI, these are all new positions added in 2013. The companies have very little analyst coverage. We’d be glad to follow-up with you on any of these companies.
The Needham Aggressive Growth Fund closed the year with 10% short position and 1% cash.
Needham Small-Cap Growth Fund
The Needham Small Cap Growth Fund was up 4.7% in the fourth quarter and up 27.9% in 2013. Activist involvement in long-term NESGX holding Emulex Corporation (ELX) resulted in the recapitalization of the company and disappointed many investors who had entered the investment in expectation of a terminal transaction. We remain committed to our investment in Emulex, as we believe long-term investors will be rewarded for their patience. The company continues to remove cost and is realigning priorities to higher margin businesses. Emulex is expected to continue its share buyback plan and has at least $100 million still remaining in the announced program. The reduction in share count alone will drive significant growth in the earnings per share, but it will take time for this result to be achieved.
Form Factor, Inc. (FORM), another long-term holding of the Fund, was set to have a good end of year but was negatively impacted by a factory fire at its large customer SK Hynix in China. A product quality issue that had to be fixed and accounted for also impacted FORM. With both of these issues behind the company in 2014, we believe again that patience will pay off and our opportunistic purchases during the fourth quarter will pay off.
Acquisition activity contributed positively to the Fund as two of our holdings, Anaren, Inc. and Solta Medical, Inc., announced intentions to be acquired. We are sorry to see Anaren leave the public markets, as it has been a long-term holding and is an example of a great management team that we seek in our investment process. We believe our other concentrated top positions in Electro Scientific Industries, Inc. (ESIO), TTM Technologies, Inc. (TTMI), II-VI Inc. and Super Micro Computer are all well positioned for 2014.
Closing
We see opportunity in our strategy of investing in companies that we know well and that we believe are positioned with secular growth drivers. We believe 2014 will be another good year for TINA and equities. However, we believe 2014 could bring more volatility to the markets and that our ability to short could dampen the possible volatility. We welcome our new investors and thank all of our investors for their continued support. If you have any questions, thoughts or concerns, please contact us at (800) 625-7071 or send us an email at cretzler@needhamco.com or jbarr@needhamco.com. For information about the funds, please visit our website at www.needhamfunds.com.
Sincerely,
| | |
 |  |
| | |
| Chris Retzler | John O. Barr |
| Portfolio Manager | Portfolio Manager |
| NEEDHAM GROWTH FUND | TICKER: NEEGX |
Comparative Performance Statistics as of December 31, 2013 (Unaudited)
| | | | | | | | | | | | | | | | |
| | | | | | | | | | | | | Since | | Gross Expense | |
| | | 6 Months(7) | | 1 Year | | 3 Years(8) | | 5 Years(8) | | 10 Years(8) | | Inception(8)(12) | | Ratio(14) | |
| | Needham Growth Fund(1) | 15.09% | | 34.68% | | 10.60%(9) | | 21.16%(10) | | 8.70%(11) | | 14.29%(13) | | 1.95% | |
| | S&P 500 Index(2)(3) | 16.31% | | 32.39% | | 16.18% | | 17.94% | | 7.41% | | 8.28% | | | |
| | NASDAQ Composite Index(2)(4) | 23.59% | | 40.17% | | 17.85% | | 22.95% | | 8.83% | | 8.80% | | | |
| | S&P 400 MidCap Index(2)(5) | 16.50% | | 33.50% | | 15.64% | | 21.89% | | 10.36% | | 12.10% | | | |
| | Russell 2000 Index(2)(6) | 19.82% | | 38.82% | | 15.67% | | 20.08% | | 9.07% | | 8.94% | | | |
| | | |
| | Past performance does not guarantee future results. The performance data quoted represents past performance, and current returns may be lower or higher. The investment return and net asset value will fluctuate so that an investor’s shares, when redeemed, may be worth more or less than the original cost. To obtain performance information current to the most recent month-end, please call 1-800-625-7071. The returns shown in the above table and accompanying footnotes are net of expenses. The table above does not reflect the deduction of taxes that a shareholder would have paid on Fund distributions or on the redemption of Fund shares. | |
| | 1. | Investment results calculated after reinvestment of dividends. | |
| | 2. | It is not possible to invest directly in an index. The performance of the index does not include the deduction of expenses associated with a mutual fund, such as investment management fees. | |
| | 3. | The S&P 500 Index is a broad unmanaged measure of the U.S. stock market. | |
| | 4. | The NASDAQ Composite Index is a broad-based capitalization-weighted index of all NASDAQ Global Market and Small Cap stocks. | |
| | 5. | The S&P 400 MidCap Index is a broad unmanaged measure of the U.S. stock market. | |
| | 6. | The Russell 2000 Index is a broad unmanaged index composed of the smallest 2,000 companies in the Russell 3000 Index. | |
| | 7. | Not annualized. | |
| | 8. | Compound annual growth rate (annualized return). Assumes all dividends were reinvested in shares of the Fund. | |
| | 9. | Cumulative return for the three year period was 35.30%, assuming all dividends were reinvested in shares of the Fund. | |
| | 10. | Cumulative return for the five year period was 161.05%, assuming all dividends were reinvested in shares of the Fund. | |
| | 11. | Cumulative return for the ten year period was 130.23%, assuming all dividends were reinvested in shares of the Fund. | |
| | 12. | The inception date of the Fund was 1/1/96. | |
| | 13. | Cumulative return since inception was 1006.25%, assuming all dividends were reinvested in shares of the Fund. | |
| | 14. | Gross expense ratio is from the Fund’s prospectus dated May 1, 2013. Additional information pertaining to the Fund’s expense ratios as of December 31, 2013 can be found in the financial highlights. Since January 1, 2009, the investment performance reflects contractually agreed upon fee waivers which expire at the close of business on April 30, 2014. Without these fee waivers, the performance would have been lower. Excluding the indirect costs of investing in acquired funds, total net fund operating expenses would be 1.94%. | |
| | | | |
Top Ten Holdings*
(as a % of total investments, as of December 31, 2013)
| | | | | | | |
| | | | | | % of Total | |
| | | | | Security | | | Investments† | |
| | 1) | | Express Scripts Holding Co. | ESRX | 9.59% | |
| | 2) | | Thermo Fisher Scientific, Inc. | TMO | 9.24% | |
| | 3) | | Gilead Sciences, Inc. | GILD | 7.66% | |
| | 4) | | CarMax, Inc. | KMX | 5.31% | |
| | 5) | | ViaSat, Inc. | VSAT | 4.51% | |
| | 6) | | Becton Dickinson and Co. | BDX | 3.62% | |
| | 7) | | FormFactor, Inc. | FORM | 3.45% | |
| | 8) | | Emulex Corp. | ELX | 3.42% | |
| | 9) | | Financial Engines, Inc. | FNGN | 3.41% | |
| | 10) | | PDF Solutions, Inc. | PDFS | 3.36% | |
| | Top Ten Holdings = 53.57% of Total Investments† | |
| | * | Current portfolio holdings may not be indicative of future portfolio holdings. | |
| | † | Percentage of total investments less cash. | |
| | | | | | | |
Sector Weightings*
(as a % of total investments, as of December 31, 2013)
| | | | | | | | | | | | |
| | | Sector | | Long(1) | | (Short)(1) | | Total(1)(2) | |
| | Consumer Discretionary | 9.7% | | | | 9.7 | % | |
| | Energy | 5.3% | | | | 5.3 | % | |
| | Exchange Traded Funds | | | (1.0)% | | (1.0 | )% | |
| | Financials | 4.3% | | | | 4.3 | % | |
| | Health Care | 34.5% | | (0.2)% | | 34.3 | % | |
| | Industrials | 4.6% | | (0.2)% | | 4.4 | % | |
| | Information Technology | 42.1% | | (2.7)% | | 39.4 | % | |
| | Materials | 0.1% | | | | 0.1 | % | |
| | Cash | 3.5% | | | | 3.5 | % | |
| | * | Current portfolio holdings may not be indicative of future portfolio holdings. | | |
| | (1) | Percentage of total investments includes all stocks, plus cash minus all short positions. | | |
| | (2) | Total represents the difference between the long exposure and the short exposure, which produces the net exposure. | | |
| | | | | |
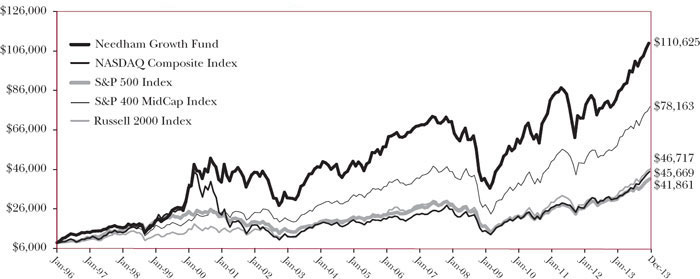
Comparison of Change in Value of a $10,000 Investment
Past performance does not guarantee future results. The performance data quoted represents past performance, and current returns may be lower or higher. The investment return and net asset value will fluctuate so that an investor’s shares, when redeemed, may be worth more or less than the original cost. To obtain performance information current to the most recent month-end, please call 1-800-625-7071. The graph above does not reflect the deduction of taxes that a shareholder would have paid on Fund distributions or on the redemption of Fund shares. Since inception, the Fund’s adviser has absorbed certain expenses of the Fund, without which returns would have been lower.
The Global Industry Classification Standard (GICS®) was developed by and/or is the exclusive property of MSCI, Inc. and Standard & Poor Financial Services LLC (“S&P”). GICS is a service mark of MSCI and S&P and has been licensed for use by U.S. Bancorp Fund Services, LLC.
| NEEDHAM AGGRESSIVE GROWTH FUND | TICKER: NEAGX |
Comparative Performance Statistics as of December 31, 2013 (Unaudited)
| | | | | | | | | | | | | | | | |
| | | | | | | | | | | | | Since | | Gross Expense | |
| | | 6 Months(6) | | 1 Year | | 3 Years(7) | | 5 Years(7) | | 10 Years(7) | | Inception(7)(11) | | Ratio(13) | |
| | Needham Aggressive Growth Fund(1) | 17.29% | | 36.26% | | 10.43%(8) | | 19.75%(9) | | 10.97%(10) | | 10.27%(12) | | 2.06% | |
| | S&P 500 Index(2)(3) | 16.31% | | 32.39% | | 16.18% | | 17.94% | | 7.41% | | 6.14% | | | |
| | NASDAQ Composite Index(2)(4) | 23.59% | | 40.17% | | 17.85% | | 22.95% | | 8.83% | | 8.11% | | | |
| | Russell 2000 Index(2)(5) | 19.82% | | 38.82% | | 15.67% | | 20.08% | | 9.07% | | 9.13% | | | |
| | Past performance does not guarantee future results. The performance data quoted represents past performance, and current returns may be lower or higher. The investment return and net asset value will fluctuate so that an investor’s shares, when redeemed, may be worth more or less than the original cost. To obtain performance information current to the most recent month-end, please call 1-800-625-7071. The returns shown in the above table and accompanying footnotes are net of expenses. The table above does not reflect the deduction of taxes that a shareholder would have paid on Fund distributions or on the redemption of Fund shares. | |
| | 1. | Investment results calculated after reinvestment of dividends. | |
| | 2. | It is not possible to invest directly in an index. The performance of the index does not include the deduction of expenses associated with a mutual fund, such as investment management fees. | |
| | 3. | The S&P 500 Index is a broad unmanaged measure of the U.S. stock market. | |
| | 4. | The NASDAQ Composite Index is a broad-based capitalization-weighted index of all NASDAQ Global Market and Small Cap stocks. | |
| | 5. | The Russell 2000 Index is a broad unmanaged index composed of the smallest 2,000 companies in the Russell 3000 Index. | |
| | 6. | Not annualized. | |
| | 7. | Compound annual growth rate (annualized return). Assumes all dividends were reinvested in shares of the Fund. | |
| | 8. | Cumulative return for the three year period was 34.66%, assuming all dividends were reinvested in shares of the Fund. | |
| | 9. | Cumulative return for the five year period was 146.28%, assuming all dividends were reinvested in shares of the Fund. | |
| | 10. | Cumulative return for the ten year period was 183.21%, assuming all dividends were reinvested in shares of the Fund. | |
| | 11. | The inception date of the Fund was 9/4/2001. | |
| | 12. | Cumulative return since inception was 233.65% assuming all dividends were reinvested in shares of the Fund. | |
| | 13. | Gross expense ratio is from the Fund’s prospectus dated May 1, 2013. Additional information pertaining to the Fund’s expense ratios as of December 31, 2013 can be found in the financial highlights. Since inception, the investment performance reflects contractually agreed upon fee waivers which expire at the close of business on April 30, 2014. Without these fee waivers, the performance would have been lower. Excluding the indirect costs of investing in acquired funds, total net fund operating expenses would be 2.06%. | |
| | | | |
Top Ten Holdings*
(as a % of total investments, as of December 31, 2013)
| | | | | | % of Total | |
| | | | | Security | | | Investments† | |
| | 1) | | PDF Solutions, Inc. | PDFS | 12.46% | |
| | 2) | | Akamai Technologies, Inc. | AKAM | 8.48% | |
| | 3) | | Gilead Sciences, Inc. | GILD | 8.31% | |
| | 4) | | Apple, Inc. | AAPL | 4.51% | |
| | 5) | | FormFactor, Inc. | FORM | 4.15% | |
| | 6) | | Financial Engines, Inc. | FNGN | 3.48% | |
| | 7) | | Electronics For Imaging, Inc. | EFII | 3.42% | |
| | 8) | | Entegris, Inc. | ENTG | 3.42% | |
| | 9) | | WageWorks, Inc. | WAGE | 2.89% | |
| | 10) | | Super Micro Computer, Inc. | SMCI | 2.77% | |
| | Top Ten Holdings = 53.89% of Total Investments† | |
| | * | Current portfolio holdings may not be indicative of future portfolio holdings. | |
| | † | Percentage of total investments less cash. | |
| | | | | | | |
Sector Weightings*
(as a % of total investments, as of December 31, 2013)
| | | | | | | | | | | | |
| | | Sector | | | Long(1) | | (Short)(1) | | Total(1)(2) | |
| | Consumer Discretionary | | 6.7% | | | | 6.7% | |
| | Consumer Staples | | 0.9% | | | | 0.9% | |
| | Energy | | 1.1% | | | | 1.1% | |
| | Exchange Traded Funds | | — | | (0.5)% | | (0.5)% | |
| | Financials | | 4.1% | | (3.1)% | | 1.0% | |
| | Health Care | | 13.5% | | (0.5)% | | 13.0% | |
| | Industrials | | 7.1% | | (0.4)% | | 6.7% | |
| | Information Technology | | 75.1% | | (5.5)% | | 69.6% | |
| | Materials | | 0.6% | | | | 0.6% | |
| | Cash | | 0.9% | | — | | 0.9% | |
| | * | Current portfolio holdings may not be indicative of future portfolio holdings. | |
| | (1) | Percentage of total investments includes all stocks, plus cash minus all short positions. | |
| | (2) | Total represents the difference between the long exposure and the short exposure, which produces the net exposure. | |
| | | | |
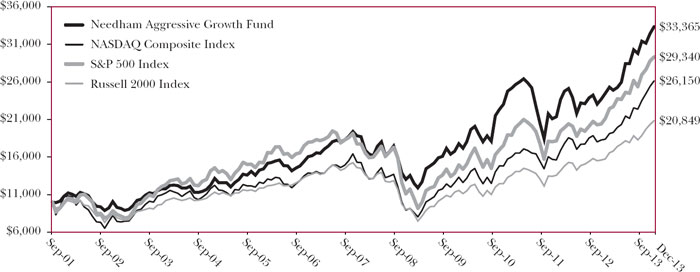
Comparison of Change in Value of a $10,000 Investment
Past performance does not guarantee future results. The performance data quoted represents past performance, and current returns may be lower or higher. The investment return and net asset value will fluctuate so that an investor’s shares, when redeemed, may be worth more or less than the original cost. To obtain performance information current to the most recent month-end, please call 1-800-625-7071. The graph above does not reflect the deduction of taxes that a shareholder would have paid on Fund distributions or on the redemption of Fund shares. Since inception, the Fund’s adviser has absorbed certain expenses of the Fund, without which returns would have been lower.
The Global Industry Classification Standard (GICS®) was developed by and/or is the exclusive property of MSCI, Inc. and Standard & Poor Financial Services LLC (“S&P”). GICS is a service mark of MSCI and S&P and has been licensed for use by U.S. Bancorp Fund Services, LLC.
| NEEDHAM SMALL CAP GROWTH FUND | TICKER: NESGX |
Comparative Performance Statistics as of December 31, 2013 (Unaudited)
| | | | | | | | | | | | | | | | |
| | | | | | | | | | | | | Since | | Gross Expense | |
| | | 6 Months(6) | | 1 Year | | 3 Years(7) | | 5 Years(7) | | 10 Years(7) | | Inception(7)(11) | | Ratio(13) | |
| | Needham Small Cap Growth Fund(1) | 15.44% | | 27.91% | | 5.21%(8) | | 17.62%(9) | | 7.51%(10) | | 11.32%(12) | | 2.05% | |
| | S&P 500 Index(2)(3) | 16.31% | | 32.39% | | 16.18% | | 17.94% | | 7.41% | | 6.83% | | | |
| | NASDAQ Composite Index(2)(4) | 23.59% | | 40.17% | | 17.85% | | 22.95% | | 8.83% | | 9.36% | | | |
| | Russell 2000 Index(2)(5) | 19.82% | | 38.82% | | 15.67% | | 20.08% | | 9.07% | | 9.09% | | | |
| | | | |
| | Past performance does not guarantee future results. The performance data quoted represents past performance, and current returns may be lower or higher. The investment return and net asset value will fluctuate so that an investor’s shares, when redeemed, may be worth more or less than the original cost. To obtain performance information current to the most recent month-end, please call 1-800-625-7071. The returns shown in the above table and accompanying footnotes are net of expenses. The table above does not reflect the deduction of taxes that a shareholder would have paid on Fund distributions or on the redemption of Fund shares. | |
| | 1. | Investment results calculated after reinvestment of dividends. | |
| | 2. | It is not possible to invest directly in an index. The performance of the index does not include the deduction of expenses associated with a mutual fund, such as investment management fees. | |
| | 3. | The S&P 500 Index is a broad unmanaged measure of the U.S. stock market. | |
| | 4. | The NASDAQ Composite Index is a broad-based capitalization-weighted index of all NASDAQ Global Market and Small Cap stocks. | |
| | 5. | The Russell 2000 Index is a broad unmanaged index composed of the smallest 2,000 companies in the Russell 3000 Index. | |
| | 6. | Not annualized. | |
| | 7. | Compound annual growth rate (annualized return). Assumes all dividends were reinvested in shares of the Fund. | |
| | 8. | Cumulative return for the three year period was 16.47%, assuming all dividends were reinvested in shares of the Fund. | |
| | 9. | Cumulative return for the five year period was 125.08%, assuming all dividends were reinvested in shares of the Fund. | |
| | 10. | Cumulative return for the ten year period was 106.32%, assuming all dividends were reinvested in shares of the Fund. | |
| | 11. | The inception date of the Fund was 5/22/02. | |
| | 12. | Cumulative return since inception was 247.45%, assuming all dividends were reinvested in shares of the Fund. | |
| | 13. | Gross expense ratio is from the Fund’s prospectus dated May 1, 2013. Additional information pertaining to the Fund’s expense ratios as of December 31, 2013 can be found in the financial highlights. Since inception, the investment performance reflects contractually agreed upon fee waivers which expire at the close of business on April 30, 2014. Without these fee waivers, the performance would have been lower. Excluding the indirect costs of investing in acquired funds, total net fund operating expenses would be 2.04%. | |
| | | | |
Top Ten Holdings*
(as a % of total investments, as of December 31, 2013)| | | | | | | | % of Total | |
| | | | | Security | | | Investments† | |
| | 1) | | FormFactor, Inc. | FORM | 9.70% | |
| | 2) | | Emulex Corp. | ELX | 9.07% | |
| | 3) | | Electro Scientific Industries, Inc. | ESIO | 5.78% | |
| | 4) | | Anaren, Inc. | ANEN | 5.08% | |
| | 5) | | Superior Energy Services, Inc. | SPN | 4.90% | |
| | 6) | | TTM Technologies, Inc. | TTMI | 4.84% | |
| | 7) | | II-VI, Inc. | IIVI | 4.66% | |
| | 8) | | C&J Energy Services, Inc. | CJES | 3.72% | |
| | 9) | | Express Scripts Holding Co. | ESRX | 3.64% | |
| | 10) | | Zygo Corp. | ZIGO | 3.56% | |
| | Top Ten Holdings = 54.95% of Total Investments† | |
| | * | Current portfolio holdings may not be indicative of future portfolio holdings. | |
| | † | Percentage of total investments less cash. | |
| | | | | | | |
Sector Weightings*
(as a % of total investments, as of December 31, 2013)
| | | | | | | | | | |
| | | Sector | | Long(1) | | (Short)(1) | | Total(1)(2) | |
| | Consumer Discretionary | 4.9% | | — | | 4.9% | |
| | Energy | 14.7% | | — | | 14.7% | |
| | Health Care | 8.3% | | — | | 8.3% | |
| | Industrials | 5.5% | | — | | 5.5% | |
| | Information Technology | 62.3% | | — | | 62.3% | |
| | Materials | 0.7% | | — | | 0.7% | |
| | Cash | 3.6% | | — | | 3.6% | |
| | * | Current portfolio holdings may not be indicative of future portfolio holdings. | |
| | (1) | Percentage of total investments includes all stocks, plus cash minus all short positions. | |
| | (2) | Total represents the difference between the long exposure and the short exposure, which produces the net exposure. | |
| | | | |
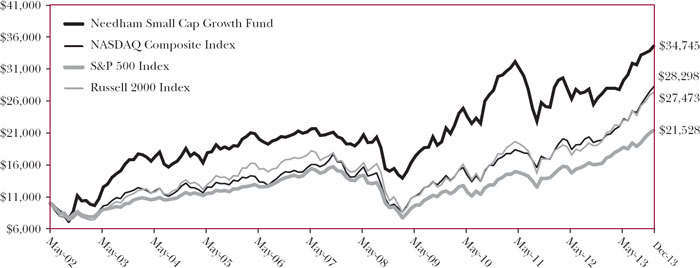
Comparison of Change in Value of a $10,000 Investment
Past performance does not guarantee future results. The performance data quoted represents past performance, and current returns may be lower or higher. The investment return and net asset value will fluctuate so that an investor’s shares, when redeemed, may be worth more or less than the original cost. To obtain performance information current to the most recent month-end, please call 1-800-625-7071. The graph above does not reflect the deduction of taxes that a shareholder would have paid on Fund distributions or on the redemption of Fund shares. Since inception, the Fund’s adviser has absorbed certain expenses of the Fund, without which returns would have been lower.
The Global Industry Classification Standard (GICS®) was developed by and/or is the exclusive property of MSCI, Inc. and Standard & Poor Financial Services LLC (“S&P”). GICS is a service mark of MSCI and S&P and has been licensed for use by U.S. Bancorp Fund Services, LLC.
Disclosure of Fund Expenses (Unaudited)
The following expense table is shown so that you can understand the impact of fees on your investment. All mutual funds have operating expenses. As a shareholder of the fund, you incur transactional costs, including redemption fees and exchange fees, and ongoing costs, which include costs for portfolio management, administrative services, and shareholder reports, among others. A fund’s expenses are expressed as a percentage of its average net assets. This figure is known as the expense ratio. The following examples are intended to help you understand the ongoing costs (in dollars) of investing in each fund and to compare these costs with those of other mutual funds. The examples are based on an investment of $1,000 made at the beginning of the period shown and held for the entire period.
The expense example table below illustrates your fund’s cost in two ways:
| ● | Actual Expenses. This section helps you to estimate the actual expenses after fee waivers that you paid over the period. The “Ending Account Value” shown is derived from the fund’s actual return, and “Expenses Paid During Period” shows the dollar amount that would have been paid by an investor who started with $1,000 in the fund. You may use the information here, together with the amount you invested, to estimate the expenses that you paid over the period. To do so, simply divide your account value by $1,000 (for example, an $8,600 account value divided by $1,000 = 8.6), then multiply the result by the number given for your fund under the heading entitled “Expenses Paid During Period”. |
| | |
| ● | Hypothetical Expenses on a 5% Return. This section is intended to help you compare your fund’s costs with those of other mutual funds. It assumes that the fund had a return of 5% before expenses during the period shown, but that the expense ratio is unchanged. In this case, because the return used is not the fund’s actual return, the results do not apply to your investment. The example is useful in making comparisons because the Securities and Exchange Commission requires all mutual funds to calculate expenses based on a 5% return. You can assess your fund’s cost by comparing this hypothetical example with the hypothetical examples that appear in shareholders reports of other funds. |
Please note that the expenses shown in the table are meant to highlight your ongoing costs only and do not reflect any transactional costs, such as redemption fees or exchange fees. Therefore, the table is useful in comparing ongoing costs only, and will not help you determine the relative total costs of owning different funds. In addition, if these transactional costs were included, your costs would have been higher.
For the Period July 1, 2013 to December 31, 2013
Expense Example Table
| | Beginning | Ending | Expenses Paid | Expense Ratio |
| | Account Value | Account Value | During Period* | During Period* |
| | 7/1/13 | 12/31/13 | 7/1/13 - 12/31/13 | 7/1/13 - 12/31/13 |
| Needham Growth Fund | | | | |
| Actual Expenses | $1,000.00 | $1,150.90 | $10.25 | 1.89% |
| Hypothetical Example for Comparison Purposes | | | | |
| (5% return before expenses) | $1,000.00 | $1,015.68 | $ 9.60 | 1.89% |
| | | | | |
| Needham Aggressive Growth Fund | | | | |
| Actual Expenses | $1,000.00 | $1,172.90 | $11.72 | 2.14% |
| Hypothetical Example for Comparison Purposes | | | | |
| (5% return before expenses) | $1,000.00 | $1,014.42 | $10.87 | 2.14% |
| | | | | |
| Needham Small Cap Growth Fund | | | | |
| Actual Expenses | $1,000.00 | $1,154.40 | $11.35 | 2.09% |
| Hypothetical Example for Comparison Purposes | | | | |
| (5% return before expenses) | $1,000.00 | $1,014.67 | $10.61 | 2.09% |
| * | Expenses are equal to the average account value times the Fund’s annualized expense ratio multiplied by the number of days in the most recent fiscal half-year divided by the number of days in the fiscal year. |
| | | | | | | |
| Needham Growth Fund | | | | | | |
| Schedule of Investments | | | | | | |
| December 31, 2013 | | | | | | |
| | | | | | | |
| | | Shares | | | Market Value | |
| Common Stocks (97.0%) | | | | | | |
| | | | | | | |
| Aerospace & Defense (1.5%) | | | | | | |
| Honeywell International, Inc. | | | 15,000 | | | $ | 1,370,550 | |
| Sypris Solutions, Inc. | | | 225,000 | | | | 688,500 | |
| | | | | | | | 2,059,050 | |
| | | | | | | | | |
| Biotechnology (7.4%) | | | | | | | | |
| Gilead Sciences, Inc.* | | | 140,000 | | | | 10,521,000 | |
| | | | | | | | | |
| Capital Markets (4.1%) | | | | | | | | |
| Financial Engines, Inc. | | | 67,500 | | | | 4,689,900 | |
| Oaktree Capital Group LLC | | | 20,000 | | | | 1,176,800 | |
| | | | | | | | 5,866,700 | |
| | | | | | | | | |
| Commercial Services & Supplies (0.3%) | | | | | | | | |
| ACCO Brands Corp.* | | | 10,000 | | | | 67,200 | |
| Clean Harbors, Inc.* | | | 5,000 | | | | 299,800 | |
| | | | | | | | 367,000 | |
| | | | | | | | | |
| Communications Equipment (10.5%) | | | | | | | | |
| Anaren, Inc.* | | | 86,945 | | | | 2,433,591 | |
| Emulex Corp.* | | | 656,750 | | | | 4,702,330 | |
| KVH Industries, Inc.* | | | 86,550 | | | | 1,127,746 | |
| QUALCOMM, Inc. | | | 5,000 | | | | 371,250 | |
| ViaSat, Inc.*† | | | 99,000 | | | | 6,202,350 | |
| | | | | | | | 14,837,267 | |
| | | | | | | | | |
| Computers & Peripherals (5.0%) | | | | | | | | |
| Electronics For Imaging, Inc.* | | | 80,000 | | | | 3,098,400 | |
| Super Micro Computer, Inc.* | | | 235,000 | | | | 4,032,600 | |
| | | | | | | | 7,131,000 | |
| | | | | | | | | |
| Electrical Equipment (1.7%) | | | | | | | | |
| II-VI, Inc.* | | | 140,000 | | | | 2,464,000 | |
| | | | | | | | | |
| Electronic Equipment, Instruments & Components (7.6%) | |
| Corning, Inc. | | | 35,000 | | | | 623,700 | |
| Electro Scientific Industries, Inc. | | | 275,000 | | | | 2,876,500 | |
| Jabil Circuit, Inc.† | | | 165,000 | | | | 2,877,600 | |
| Newport Corp.* | | | 100,000 | | | | 1,807,000 | |
| Vishay Intertechnology, Inc.* | | | 75,000 | | | | 994,500 | |
| Zygo Corp.* | | | 104,650 | | | | 1,546,727 | |
| | | | | | | | 10,726,027 | |
| | | | | | | | | |
| Energy Equipment & Services (1.5%) | | | | | | | | |
| Halliburton Co. | | | 5,000 | | | | 253,750 | |
| National Oilwell Varco, Inc. | | | 10,000 | | | | 795,300 | |
| Schlumberger Ltd. | | | 12,500 | | | | 1,126,375 | |
| | | | | | | | 2,175,425 | |
| | | | | | | | | |
| | | Shares | | | Market Value | |
| Common Stocks - Continued | | | | | | | | |
| | | | | | | | | |
| Health Care Equipment & Supplies (7.6%) | | | | | |
| Becton Dickinson and Co. | | | 45,000 | | | $ | 4,972,050 | |
| CONMED Corp. | | | 50,000 | | | | 2,125,000 | |
| Covidien PLC | | | 27,500 | | | | 1,872,750 | |
| Natus Medical, Inc.* | | | 10,000 | | | | 225,000 | |
| Varian Medical Systems, Inc.* | | | 20,000 | | | | 1,553,800 | |
| | | | | | | | 10,748,600 | |
| | | | | | | | | |
| Health Care Providers & Services (9.3%) | | | | | | | | |
| Express Scripts Holding Co.*† | | | 187,500 | | | | 13,170,000 | |
| | | | | | | | | |
| Internet Software & Services (3.1%) | | | | | | | | |
| Akamai Technologies, Inc.* | | | 60,000 | | | | 2,830,800 | |
| Brightcove, Inc.* | | | 54,200 | | | | 766,388 | |
| QuinStreet, Inc.* | | | 62,430 | | | | 542,517 | |
| YuMe, Inc.* | | | 25,000 | | | | 186,250 | |
| | | | | | | | 4,325,955 | |
| | | | | | | | | |
| Leisure Equipment & Products (0.6%) | | | | | | | | |
| Black Diamond, Inc.* | | | 62,500 | | | | 833,125 | |
| | | | | | | | | |
| Life Sciences Tools & Services (9.0%) | | | | | | | | |
| Quintiles Transnational | | | | | | | | |
| Holdings, Inc.* | | | 1,108 | | | | 51,345 | |
| Thermo Fisher Scientific, Inc.† | | | 114,000 | | | | 12,693,900 | |
| | | | | | | | 12,745,245 | |
| | | | | | | | | |
| Media (2.2%) | | | | | | | | |
| Comcast Corp. | | | 60,000 | | | | 3,117,900 | |
| | | | | | | | | |
| Metals & Mining (0.1%) | | | | | | | | |
| Walter Energy, Inc. | | | 11,000 | | | | 182,930 | |
| | | | | | | | | |
| Oil, Gas & Consumable Fuels (3.5%) | | | | | | | | |
| Hess Corp.† | | | 55,000 | | | | 4,565,000 | |
| WPX Energy, Inc.* | | | 22,000 | | | | 448,360 | |
| | | | | | | | 5,013,360 | |
| | | | | | | | | |
| Professional Services (1.0%) | | | | | | | | |
| WageWorks, Inc.* | | | 23,500 | | | | 1,396,840 | |
| | | | | | | | | |
| Semiconductors & Semiconductor Equipment (13.2%) | |
| Broadcom Corp. | | | 5,000 | | | | 148,250 | |
| Brooks Automation, Inc. | | | 150,000 | | | | 1,573,500 | |
| Entegris, Inc.* | | | 210,000 | | | | 2,436,000 | |
| Entropic Communications, Inc.* | | | 391,700 | | | | 1,844,907 | |
| FormFactor, Inc.* | | | 787,500 | | | | 4,740,750 | |
| MKS Instruments, Inc. | | | 67,500 | | | | 2,020,950 | |
| Nova Measuring Instruments Ltd.* | | | 130,000 | | | | 1,279,200 | |
| PDF Solutions, Inc.* | | | 180,000 | | | | 4,611,600 | |
| | | | | | | | 18,655,157 | |
| See accompanying notes to financial statements. | |
| Needham Growth Fund | | | | | | |
| Schedule of Investments (Continued) | | | | |
| December 31, 2013 | | | | | | |
| | | | | | | |
| | | Shares | | | Market Value | |
| Common Stocks - Continued | | | | | | |
| | | | | | | |
| Software (1.3%) | | | | | | |
| Barracuda Networks, Inc.* | | | 28,023 | | | $ | 1,111,952 | |
| Mavenir Systems, Inc.* | | | 60,000 | | | | 669,600 | |
| | | | | | | | 1,781,552 | |
| | | | | | | | | |
| Specialty Retail (6.5%) | | | | | | | | |
| CarMax, Inc.*† | | | 155,000 | | | | 7,288,100 | |
| Dick’s Sporting Goods, Inc.† | | | 30,000 | | | | 1,743,000 | �� |
| Tiffany & Co. | | | 2,500 | | | | 231,950 | |
| | | | | | | | 9,263,050 | |
| | | | | | | | | |
| Total Common Stocks | | | | | | | | |
| (Cost $66,262,310) | | | | | | | 137,381,183 | |
| | | | | | | |
| | | Shares | | | Market Value | |
| | | | | | | |
| Short-Term Investment (3.3%) | | | | | | |
| | | | | | | |
| Money Market Fund (3.3%) | | | | | | |
| Dreyfus Treasury Prime Cash | | | | | | |
| Management 0.00% (a) | | | | | | |
| (Cost $4,723,709) | | | 4,723,709 | | | $ | 4,723,709 | |
| | | | | | | | | |
| Total Investments (100.3%) | | | | | | | | |
| (Cost $70,986,019) | | | | | | | 142,104,892 | |
| | | | | | | | | |
Total Securities Sold Short (-3.9%)
(Proceeds $3,530,002) | | | | | | | (5,572,870 | ) |
| | | | | | | | | |
Other Assets in Excess of
Liabilities (3.6%) | | | | | | | 5,161,472 | |
| | | | | | | | | |
| Net Assets (100.0%) | | | | | | $ | 141,693,494 | |
| * | Non-income producing security. |
| | |
| (a) | Rate shown is the seven day yield as of December 31, 2013. |
| | |
| † | Security position is either entirely or partially held in a segregated account as collateral for securities sold short, aggregating a total market value of $5,020,500. |
| | |
| | The Global Industry Classification Standard (GICS®) was developed by and/or is the exclusive property of MSCI, Inc. and Standard & Poor’s Financial Services LLC (“S&P”). GICS is a service mark of MSCI and S&P and has been licensed for use by U.S. Bancorp Fund Services, LLC. |
| See accompanying notes to financial statements. | |
| Needham Growth Fund | | | | | | |
| Schedule of Securities Sold Short | | | | | | |
| December 31, 2013 | | | | | | |
| | | | | | | |
| | | Shares | | | Market Value | |
| Securities Sold Short (-3.0%) | | | | | | |
| | | | | | | |
| Airlines (-0.2%) | | | | | | |
| Allegiant Travel Co. | | | 2,500 | | | $ | 263,600 | |
| | | | | | | | | |
| Communications Equipment (-0.9%) | | | | | | | | |
| Ubiquiti Networks, Inc.* | | | 29,000 | | | | 1,332,840 | |
| | | | | | | | | |
| Health Care Technology (-0.2%) | | | | | | | | |
| Medidata Solutions, Inc.* | | | 5,000 | | | | 302,850 | |
| | | | | | | | | |
| Semiconductors & Semiconductor Equipment (-0.3%) | | | | | | | | |
| Advanced Energy Industries, Inc.* | | | 18,000 | | | | 411,480 | |
| | | | | | | | | |
| Software (-1.4%) | | | | | | | | |
| ANSYS, Inc.* | | | 22,500 | | | | 1,962,000 | |
| | | | | | | | | |
| Total Securities Sold Short | | | | | | | | |
| (Proceeds $2,509,600) | | | | | | | 4,272,770 | |
| | | | | | | |
| | | Shares | | | Market Value | |
| Exchange Traded Funds Sold Short (-0.9%) | | | | |
| iShares Russell 2000 ETF | | | 2,500 | | | $ | 288,275 | |
| iShares Russell 2000 Growth ETF | | | 2,500 | | | | 338,775 | |
| iShares Russell 2000 Value ETF | | | 2,500 | | | | 248,750 | |
| Market Vectors Semiconductor ETF | | | 10,000 | | | | 424,300 | |
| | | | | | | | | |
| Total Exchange Traded Funds Sold Short | | | | | | | | |
| (Proceeds $1,020,402) | | | | | | | 1,300,100 | |
| | | | | | | | | |
| Total Securities & Exchange Traded Funds Sold Short | | | | | | | | |
| (Proceeds $3,530,002) | | | | | | | 5,572,870 | |
| | | | | | | | | |
| Total Securities & Exchange Traded | | | | | | | | |
| Funds Sold Short (-3.9%) | | | | | | | (5,572,870 | ) |
| Total Investments (100.3%) | | | | | | | 142,104,892 | |
| Other Assets in Excess of | | | | | | | | |
| Liabilities (3.6%) | | | | | | | 5,161,472 | |
| | | | | | | | | |
| Net Assets (100.0%) | | | | | | $ | 141,693,494 | |
| * | Non-income producing security. |
| See accompanying notes to financial statements. | |
| Needham Aggressive Growth Fund | | | | |
| Schedule of Investments | | | | | | |
| December 31, 2013 | | | | | | |
| | | | | | | |
| | | Shares | | | Market Value | |
| Common Stocks (99.1%) | | | | | | |
| | | | | | | |
| Aerospace & Defense (2.0%) | | | | | | |
| Precision Castparts Corp.† | | | 5,000 | | | $ | 1,346,500 | |
| | | | | | | | | |
| Biotechnology (8.2%) | | | | | | | | |
| Gilead Sciences, Inc.*† | | | 75,000 | | | | 5,636,250 | |
| | | | | | | | | |
| Capital Markets (3.5%) | | | | | | | | |
| Financial Engines, Inc. | | | 34,000 | | | | 2,362,320 | |
| | | | | | | | | |
| Chemicals (0.6%) | | | | | | | | |
| AZ Electronic Materials SA | | | 60,000 | | | | 392,462 | |
| | | | | | | | | |
| Commercial Services & Supplies (0.4%) | | | | | | | | |
| Clean Harbors, Inc.* | | | 5,000 | | | | 299,800 | |
| | | | | | | | | |
| Communications Equipment (4.4%) | | | | | | | | |
| Anaren, Inc.* | | | 8,750 | | | | 244,913 | |
| Emulex Corp.* | | | 60,000 | | | | 429,600 | |
| KVH Industries, Inc.* | | | 66,500 | | | | 866,495 | |
| ViaSat, Inc.*† | | | 23,000 | | | | 1,440,950 | |
| | | | | | | | 2,981,958 | |
| | | | | | | | | |
| Computers & Peripherals (10.6%) | | | | | | | | |
| Apple, Inc.† | | | 5,450 | | | | 3,058,049 | |
| Electronics For Imaging, Inc.*† | | | 60,000 | | | | 2,323,800 | |
| Super Micro Computer, Inc.* | | | 109,500 | | | | 1,879,020 | |
| | | | | | | | 7,260,869 | |
| | | | | | | | | |
| Electrical Equipment (0.5%) | | | | | | | | |
| II-VI, Inc.* | | | 18,500 | | | | 325,600 | |
| | | | | | | | | |
| Electronic Equipment, Instruments & Components (6.0%) | |
| Electro Scientific Industries, Inc. | | | 60,000 | | | | 627,600 | |
| FEI Co. | | | 15,000 | | | | 1,340,400 | |
| IPG Photonics Corp. | | | 5,000 | | | | 388,050 | |
| Jabil Circuit, Inc.† | | | 34,700 | | | | 605,168 | |
| Zygo Corp.* | | | 77,075 | | | | 1,139,168 | |
| | | | | | | | 4,100,386 | |
| | | | | | | | | |
| Health Care Equipment & Supplies (1.6%) | | | | | |
| Becton Dickinson and Co. | | | 6,000 | | | | 662,940 | |
| LeMaitre Vascular, Inc. | | | 57,800 | | | | 462,978 | |
| | | | | | | | 1,125,918 | |
| | | | | | | | | |
| Health Care Providers & Services (1.9%) | | | | | | | | |
| Express Scripts Holding Co.*† | | | 18,000 | | | | 1,264,320 | |
| | | | | | | | | |
| Health Care Technology (0.5%) | | | | | | | | |
| Omnicell, Inc.* | | | 13,000 | | | | 331,890 | |
| | | | | | | | | |
| Hotels, Restaurants & Leisure (0.7%) | | | | | | | | |
| Panera Bread Co.* | | | 2,750 | | | | 485,897 | |
| | | | | | | |
| | | Shares | | | Market Value | |
| Common Stocks - Continued | | | | | | |
| | | | | | | |
| Household Products (0.8%) | | | | | | |
| Oil-Dri Corp. of America | | | 15,000 | | | $ | 567,600 | |
| | | | | | | | | |
| Insurance (0.3%) | | | | | | | | |
| Crawford & Co. | | | 23,500 | | | | 180,715 | |
| | | | | | | | | |
| Internet & Catalog Retail (0.0%) | | | | | | | | |
| RetailMeNot, Inc.* | | | 678 | | | | 19,520 | |
| | | | | | | | | |
| Internet Software & Services (16.5%) | | | | | | | | |
| Akamai Technologies, Inc.*† | | | 122,000 | | | | 5,755,960 | |
| Brightcove, Inc.* | | | 50,000 | | | | 707,000 | |
| Carbonite, Inc.* | | | 20,000 | | | | 236,600 | |
| ChannelAdvisor Corp.* | | | 3,383 | | | | 141,105 | |
| Constant Contact, Inc.* | | | 45,000 | | | | 1,398,150 | |
| Equinix, Inc.* | | | 3,500 | | | | 621,075 | |
| Reis, Inc.* | | | 94,750 | | | | 1,822,042 | |
| TheStreet, Inc.* | | | 150,000 | | | | 339,000 | |
| YuMe, Inc.* | | | 40,000 | | | | 298,000 | |
| | | | | | | | 11,318,932 | |
| | | | | | | | | |
| Leisure Equipment & Products (0.6%) | | | | | | | | |
| Black Diamond, Inc.* | | | 30,000 | | | | 399,900 | |
| | | | | | | | | |
| Machinery (0.7%) | | | | | | | | |
| Edwards Group Ltd. - ADR* | | | 50,000 | | | | 509,000 | |
| | | | | | | | | |
| Media (1.7%) | | | | | | | | |
| World Wrestling Entertainment, Inc. | | | 70,000 | | | | 1,160,600 | |
| | | | | | | | | |
| Oil, Gas & Consumable Fuels (1.0%) | | | | | | | | |
| Hess Corp.† | | | 8,500 | | | | 705,500 | |
| | | | | | | | | |
| Professional Services (2.9%) | | | | | | | | |
| WageWorks, Inc.*† | | | 33,000 | | | | 1,961,520 | |
| | | | | | | | | |
| Semiconductors & Semiconductor Equipment (27.5%) | | | | | |
| ATMI, Inc.* | | | 45,000 | | | | 1,359,450 | |
| Ceva, Inc.* | | | 40,000 | | | | 608,800 | |
| Entegris, Inc.* | | | 200,000 | | | | 2,320,000 | |
| Entropic Communications, Inc.* | | | 127,150 | | | | 598,877 | |
| FormFactor, Inc.* | | | 467,500 | | | | 2,814,350 | |
| LTX-Credence Corp.* | | | 10,000 | | | | 79,900 | |
| MKS Instruments, Inc. | | | 29,100 | | | | 871,254 | |
| Nanometrics, Inc.* | | | 3,000 | | | | 57,150 | |
| Nova Measuring Instruments Ltd.* | | | 94,900 | | | | 933,816 | |
| PDF Solutions, Inc.* | | | 330,000 | | | | 8,454,600 | |
| Photronics, Inc.* | | | 61,000 | | | | 550,830 | |
| Tessera Technologies, Inc. | | | 10,000 | | | | 197,100 | |
| | | | | | | | 18,846,127 | |
| See accompanying notes to financial statements. | |
Needham Aggressive Growth Fund
Schedule of Investments (Continued)
December 31, 2013
| | | Shares | | | Market Value | |
| Common Stocks - Continued | | | | | | |
| | | | | | | |
| Software (3.2%) | | | | | | |
| Barracuda Networks, Inc.* | | | 13,539 | | | $ | 537,228 | |
| Bottomline Technologies, Inc.*† | | | 30,000 | | | | 1,084,800 | |
| BroadSoft, Inc.* | | | 5,000 | | | | 136,700 | |
| Exa Corp.* | | | 5,000 | | | | 66,300 | |
| Mavenir Systems, Inc.* | | | 32,600 | | | | 363,816 | |
| | | | | | | | 2,188,844 | |
| | | | | | | | | |
| Specialty Retail (2.8%) | | | | | | | | |
| CarMax, Inc.*† | | | 22,500 | | | | 1,057,950 | |
| Dick’s Sporting Goods, Inc.† | | | 15,000 | | | | 871,500 | |
| | | | | | | | 1,929,450 | |
| | | | | | | | | |
| Textiles, Apparel & Luxury Goods (0.2%) | | | | | | | | |
| Costa, Inc.* | | | 7,500 | | | | 162,975 | |
| | | | | | | | | |
| Total Common Stocks | | | | | | | | |
| (Cost $32,358,807) | | | | | | | 67,864,853 | |
| | | Shares | | | Market Value | |
| Short-Term Investment (0.8%) | | | | | | |
| | | | | | | |
| Money Market Fund (0.8%) | | | | | | |
| Dreyfus Treasury Prime Cash | | | | | | |
| Management 0.00% (a) | | | | | | |
| (Cost $568,053) | | | 568,053 | | | $ | 568,053 | |
| | | | | | | | | |
| Total Investments (99.9%) | | | | | | | | |
| (Cost $32,926,860) | | | | | | | 68,432,906 | |
| Total Securities Sold Short (-9.1%) | | | | | | | | |
| (Proceeds $3,578,131) | | | | | | | (6,237,430 | ) |
| Other Assets in Excess of | | | | | | | | |
| Liabilities (9.2%) | | | | | | | 6,263,820 | |
| | | | | | | | | |
| Net Assets (100.0%) | | | | | | $ | 68,459,296 | |
ADR American Depository Receipt
| | |
| * | Non-income producing security. |
| | |
| (a) | Rate shown is the seven day yield as of December 31, 2013. |
| | |
| † | Security position is either entirely or partially held in a segregated account as collateral for securities sold short, aggregating a total market value of $7,171,765. |
| | |
| | The Global Industry Classification Standard (GICS®) was developed by and/or is the exclusive property of MSCI, Inc. and Standard & Poor’s Financial Services LLC (“S&P”). GICS is a service mark of MSCI and S&P and has been licensed for use by U.S. Bancorp Fund Services, LLC. |
| See accompanying notes to financial statements. | |
Needham Aggressive Growth Fund
Schedule of Securities Sold Short
December 31, 2013
| | | Shares | | | Market Value | |
| Securities Sold Short (-8.6%) | | | | | | |
| | | | | | | |
| Airlines (-0.4%) | | | | | | |
| Allegiant Travel Co. | | | 2,500 | | | $ | 263,600 | |
| | | | | | | | | |
| Communications Equipment (-2.7%) | | | | | | | | |
| Ubiquiti Networks, Inc. | | | 40,500 | | | | 1,861,380 | |
| | | | | | | | | |
| Health Care Technology (-0.5%) | | | | | | | | |
| Medidata Solutions, Inc.* | | | 5,000 | | | | 302,850 | |
| | | | | | | | | |
| Semiconductors & Semiconductor Equipment (-0.6%) | | | | | | | | |
| Advanced Energy Industries, Inc.* | | | 10,000 | | | | 228,600 | |
| QuickLogic Corp.* | | | 52,500 | | | | 207,375 | |
| | | | | | | | 435,975 | |
| | | | | | | | | |
| Software (-1.6%) | | | | | | | | |
| ANSYS, Inc.* | | | 12,800 | | | | 1,116,160 | |
| | | | | | | | | |
| Thrifts & Mortgage Finance (-2.8%) | | | | | | | | |
| Federal Home Loan Mortgage | | | | | | | | |
| Corp.* | | | 670,000 | | | | 1,943,000 | |
| | | | | | | | | |
| Total Securities Sold Short | | | | | | | | |
| (Proceeds $3,346,187) | | | | | | | 5,922,965 | |
| | | Shares | | | Market Value | |
| Exchange Traded Funds Sold Short (-0.5%) | | | | | | |
| iShares Russell 2000 ETF | | | 1,000 | | | $ | 115,310 | |
| iShares Russell 2000 Growth ETF | | | 1,000 | | | | 135,510 | |
| Market Vectors Semiconductor ETF | | | 1,500 | | | | 63,645 | |
| | | | | | | | | |
| Total Exchange Traded Funds | | | | | | | | |
| Sold Short | | | | | | | | |
| (Proceeds $231,944) | | | | | | | 314,465 | |
| | | | | | | | | |
| Total Securities & Exchange Traded | | | | | | | | |
| Funds Sold Short | | | | | | | | |
| (Proceeds $3,578,131) | | | | | | | 6,237,430 | |
| | | | | | | | | |
| Total Securities & Exchange Traded | | | | | | | | |
| Funds Sold Short (-9.1%) | | | | | | | (6,237,430 | ) |
| Total Investments (99.9%) | | | | | | | 68,432,906 | |
| Other Assets in Excess of | | | | | | | | |
| Liabilities (9.2%) | | | | | | | 6,263,820 | |
| | | | | | | | | |
| Net Assets (100.0%) | | | | | | $ | 68,459,296 | |
| * | Non-income producing security. |
| See accompanying notes to financial statements. | |
Needham Small Cap Growth Fund
Schedule of Investments
December 31, 2013
| | | Shares | | | Market Value | |
| Common Stocks (98.8%) | | | | | | |
| | | | | | | |
| Commercial Services & Supplies (1.0%) | | | | | | |
| ACCO Brands Corp.* | | | 20,000 | | | $ | 134,400 | |
| Clean Harbors, Inc.* | | | 5,000 | | | | 299,800 | |
| | | | | | | | 434,200 | |
| | | | | | | | | |
| Communications Equipment (17.2%) | | | | | | | | |
| Anaren, Inc.* | | | 78,765 | | | | 2,204,632 | |
| Emulex Corp.* | | | 550,000 | | | | 3,938,000 | |
| KVH Industries, Inc.* | | | 44,050 | | | | 573,972 | |
| Ruckus Wireless, Inc.* | | | 60,000 | | | | 852,000 | |
| | | | | | | | 7,568,604 | |
| | | | | | | | | |
| Computers & Peripherals (2.7%) | | | | | | | | |
| Super Micro Computer, Inc.* | | | 70,000 | | | | 1,201,200 | |
| | | | | | | | | |
| Electrical Equipment (4.6%) | | | | | | | | |
| II-VI, Inc.*† | | | 115,000 | | | | 2,024,000 | |
| | | | | | | | | |
| Electronic Equipment, Instruments & Components (14.0%) | | | | | | | | |
| Electro Scientific Industries, Inc. | | | 240,000 | | | | 2,510,400 | |
| TTM Technologies, Inc.*† | | | 245,000 | | | | 2,102,100 | |
| Zygo Corp.* | | | 104,650 | | | | 1,546,727 | |
| | | | | | | | 6,159,227 | |
| | | | | | | | | |
| Energy Equipment & Services (10.3%) | | | | | | | | |
| C&J Energy Services, Inc.* | | | 70,000 | | | | 1,617,000 | |
| Halliburton Co. | | | 7,500 | | | | 380,625 | |
| National Oilwell Varco, Inc. | | | 5,000 | | | | 397,650 | |
| Superior Energy Services, Inc.* | | | 80,000 | | | | 2,128,800 | |
| | | | | | | | 4,524,075 | |
| | | | | | | | | |
| Health Care Equipment & Supplies (4.9%) | | | | | | | | |
| Natus Medical, Inc.* | | | 10,000 | | | | 225,000 | |
| NxStage Medical, Inc.* | | | 120,000 | | | | 1,200,000 | |
| Solta Medical, Inc.* | | | 250,000 | | | | 737,500 | |
| | | | | | | | 2,162,500 | |
| | | | | | | | | |
| Health Care Providers & Services (3.6%) | | | | | | | | |
| Express Scripts Holding Co.*† | | | 22,500 | | | | 1,580,400 | |
| | | | | | | | | |
| Internet Software & Services (4.9%) | | | | | | | | |
| Brightcove, Inc.* | | | 76,900 | | | | 1,087,366 | |
| Carbonite, Inc.* | | | 22,000 | | | | 260,260 | |
| Reis, Inc.* | | | 41,457 | | | | 797,218 | |
| YuMe, Inc.* | | | 2,400 | | | | 17,880 | |
| | | | | | | | 2,162,724 | |
| | | Shares | | | Market Value | |
| Common Stocks - Continued | | | | | | |
| | | | | | | |
| Leisure Equipment & Products (1.3%) | | | | | | |
| Black Diamond, Inc.* | | | 42,500 | | | $ | 566,525 | |
| | | | | | | | | |
| Metals & Mining (0.7%) | | | | | | | | |
| Walter Energy, Inc. | | | 20,000 | | | | 332,600 | |
| | | | | | | | | |
| Oil, Gas & Consumable Fuels (4.8%) | | | | | | | | |
| Hess Corp.† | | | 15,000 | | | | 1,245,000 | |
| WPX Energy, Inc.* | | | 42,000 | | | | 855,960 | |
| | | | | | | | 2,100,960 | |
| | | | | | | | | |
| Semiconductors & Semiconductor Equipment (23.0%) | | | | | | | | |
| Entropic Communications, Inc.* | | | 224,100 | | | | 1,055,511 | |
| FormFactor, Inc.* | | | 700,000 | | | | 4,214,000 | |
| MaxLinear, Inc.* | | | 70,000 | | | | 730,100 | |
| MKS Instruments, Inc. | | | 30,000 | | | | 898,200 | |
| NeoPhotonics Corp.* | | | 150,000 | | | | 1,059,000 | |
| Photronics, Inc.*† | | | 50,000 | | | | 451,500 | |
| Rudolph Technologies, Inc.* | | | 55,000 | | | | 645,700 | |
| Supertex, Inc.* | | | 12,000 | | | | 300,600 | |
| Ultra Clean Holdings, Inc.* | | | 75,000 | | | | 752,250 | |
| | | | | | | | 10,106,861 | |
| | | | | | | | | |
| Software (2.0%) | | | | | | | | |
| Barracuda Networks, Inc.* | | | 9,405 | | | | 373,191 | |
| BroadSoft, Inc.* | | | 7,000 | | | | 191,380 | |
| Mavenir Systems, Inc.* | | | 26,300 | | | | 293,508 | |
| | | | | | | | 858,079 | |
| | | | | | | | | |
| Specialty Retail (3.8%) | | | | | | | | |
| Abercrombie & Fitch Co. | | | 10,000 | | | | 329,100 | |
| Aeropostale, Inc.* | | | 75,000 | | | | 681,750 | |
| Francesca’s Holdings Corp.* | | | 35,000 | | | | 644,350 | |
| | | | | | | | 1,655,200 | |
| | | | | | | | | |
| Total Common Stocks | | | | | | | | |
| (Cost $38,800,663) | | | | | | | 43,437,155 | |
| See accompanying notes to financial statements. | |
Needham Small Cap Growth Fund
Schedule of Investments (Continued)
December 31, 2013
| | | Shares | | | Market Value | |
| Short-Term Investment (3.7%) | | | | | | |
| | | | | | | |
| Money Market Fund (3.7%) | | | | | | |
| Dreyfus Treasury Prime Cash | | | | | | |
| Management 0.00% (a) | | | | | | |
| (Cost $1,631,683) | | | 1,631,683 | | | $ | 1,631,683 | |
| | | | | | | | | |
| Total Investments (102.5%) | | | | | | | | |
| (Cost $40,432,346) | | | | | | | 45,068,838 | |
| Liabilities in Excess of Other | | | | | | | | |
| Assets (-2.5%) | | | | | | | (1,118,542 | ) |
| | | | | | | | | |
| Net Assets (100.0%) | | | | | | $ | 43,950,296 | |
| * | Non-income producing security. |
| | |
| (a) | Rate shown is the seven day yield as of December 31, 2013. |
| | |
| † | Security position is either entirely or partially held in a segregated account as collateral for securities sold short, aggregating a total market value of $482,430. |
| | |
| | The Global Industry Classification Standard (GICS®) was developed by and/or is the exclusive property of MSCI, Inc. and Standard & Poor’s Financial Services LLC (“S&P”). GICS is a service mark of MSCI and S&P and has been licensed for use by U.S. Bancorp Fund Services, LLC. |
| See accompanying notes to financial statements. |
Statements of Assets and Liabilities
December 31, 2013
| | | | | | | | | | | |
| | | Needham Growth Fund | | Needham Aggressive Growth Fund | | Needham Small Cap Growth Fund | |
| Assets | | | | | | | | | | |
| Investments, at Value | | | | | | | | | | |
| (Cost $70,986,019, $32,926,860, $40,432,346) | | $ | 142,104,892 | | $ | 68,432,906 | | $ | 45,068,838 | |
| Cash | | | — | | | — | | | 133,992 | |
| Receivables: | | | | | | | | | | |
| Deposit with Broker for Securities Sold Short | | | 5,578,776 | | | 6,067,673 | | | — | |
| Dividends and Interest | | | 51,432 | | | 2,202 | | | — | |
| Fund Shares Sold | | | 22,048 | | | 163,245 | | | 30,402 | |
| Investment Securities Sold | | | — | | | 340,379 | | | 92,601 | |
| Prepaid Expenses | | | 43,555 | | | 30,094 | | | 16,487 | |
| Total Assets | | | 147,800,703 | | | 75,036,499 | | | 45,342,320 | |
| | | | | | | | | | | |
| Liabilities | | | | | | | | | | |
| Securities Sold Short, at Value | | | | | | | | | | |
| (Proceeds $3,530,002, $3,578,131, $0) | | | 5,572,870 | | | 6,237,430 | | | — | |
| Payables: | | | | | | | | | | |
| Investment Securities Purchased | | | 88,467 | | | 124,691 | | | 1,172,931 | |
| Fund Shares Redeemed | | | 152,913 | | | 53,976 | | | 105,715 | |
| Due to Adviser | | | 147,955 | | | 71,197 | | | 41,836 | |
| Distribution Fees | | | 30,001 | | | 14,437 | | | 9,422 | |
| Administration and Accounting Fees | | | 37,426 | | | 19,637 | | | 13,970 | |
| Transfer Agent Fees | | | 14,652 | | | 13,393 | | | 12,941 | |
| Accrued Expenses and Other Liabilities | | | 62,925 | | | 42,442 | | | 35,209 | |
| Total Liabilities | | | 6,107,209 | | | 6,577,203 | | | 1,392,024 | |
| | | | | | | | | | | |
| Net Assets | | $ | 141,693,494 | | $ | 68,459,296 | | $ | 43,950,296 | |
| Shares Issued and Outstanding $0.001 Par Value | | | | | | | | | | |
| (Authorized 800,000,000, 100,000,000 and 100,000,000 respectively) | | | 3,144,293 | | | 3,021,369 | | | 2,812,126 | |
Net Asset Value, Offering and Redemption Price Per Share(a) | | $ | 45.06 | | $ | 22.66 | | $ | 15.63 | |
| | | | | | | | | | | |
| Components of Net Assets | | | | | | | | | | |
| Paid-in Capital | | | 69,185,327 | | | 40,291,498 | | | 38,942,682 | |
| Accumulated Net Investment Income | | | 78,725 | | | — | | | — | |
| Accumulated Net Realized Gain (Loss) from Investments, Securities Sold Short,Foreign Currency Transactions and Currency | | | 3,353,437 | | | (4,678,936 | ) | | 371,122 | |
| Net Unrealized Appreciation on Investment Securities and | | | | | | | | | | |
| Securities Sold Short | | | 69,076,005 | | | 32,846,747 | | | 4,636,492 | |
| Net Unrealized Depreciation on Foreign Currency Transactions and Currency | | | — | | | (13 | ) | | — | |
| Total Net Assets | | $ | 141,693,494 | | $ | 68,459,296 | | $ | 43,950,296 | |
| (a) | Subject to certain exceptions, a 2% redemption fee is imposed upon shares redeemed within 60 days of their purchase. See Note 2 of the notes to financial statements. |
See accompanying notes to financial statements.
Statements of Operations
For the year ended December 31, 2013
| | | | | | | | | | | |
| | | Needham Growth Fund | | Needham Aggressive Growth Fund | | Needham Small Cap Growth Fund | |
| Investment Income | | | | | | | | | | |
| Dividends | | $ | 765,362 | | $ | 213,405 | | $ | 127,537 | |
| Interest | | | 5 | | | — | | | 2 | |
| Less: Foreign Taxes Withheld | | | — | | | (775 | ) | | — | |
| Total Investment Income | | | 765,367 | | | 212,630 | | | 127,539 | |
| | | | | | | | | | | |
| Expenses | | | | | | | | | | |
| Investment Advisory Fees | | | 1,644,429 | | | 811,425 | | | 613,046 | |
| Distribution Fees | | | 328,886 | | | 162,285 | | | 122,609 | |
| Administration and Accounting Fees | | | 138,446 | | | 72,893 | | | 55,191 | |
| Audit Fees | | | 36,963 | | | 24,581 | | | 24,030 | |
| Chief Compliance Officer Fees | | | 20,060 | | | 9,908 | | | 7,532 | |
| Custodian Fees | | | 8,141 | | | 8,716 | | | 6,934 | |
| Directors’ Fees | | | 31,904 | | | 15,940 | | | 12,444 | |
Dividend Expense(1) | | | 32,094 | | | 9,377 | | | 29,386 | |
| Filing Fees | | | 29,829 | | | 26,104 | | | 22,536 | |
Interest Expense(1) | | | 52,554 | | | 90,097 | | | 22,036 | |
| Legal Fees | | | 41,897 | | | 20,479 | | | 15,989 | |
| Printing Fees | | | 20,855 | | | 12,091 | | | 14,939 | |
| Transfer Agent Fees | | | 58,713 | | | 54,431 | | | 55,249 | |
| Other Expenses | | | 35,520 | | | 22,574 | | | 22,776 | |
| Total Expenses | | | 2,480,291 | | | 1,340,901 | | | 1,024,697 | |
| Fees Waived by Investment Adviser | | | — | | | — | | | (12,794 | ) |
| Net Expenses | | | 2,480,291 | | | 1,340,901 | | | 1,011,903 | |
| Net Investment Loss | | | (1,714,924 | ) | | (1,128,271 | ) | | (884,364 | ) |
| | | | | | | | | | | |
| Net Realized/Unrealized Gain (Loss) from Investments, Securities Sold Short, Foreign Currency Transactions and Currency | | | | | | | | | | |
| Net Realized Gain from Investments | | | 5,257,647 | | | 3,007,853 | | | 2,776,235 | |
| Net Realized Loss from Securities Sold Short | | | (734,787 | ) | | (443,030 | ) | | (1,139,110 | ) |
| Net Realized Gain from Foreign Currency Transactions and Currency | | | — | | | 39 | | | — | |
| Change in Unrealized Appreciation on Investments and Securities Sold Short | | | 35,656,762 | | | 18,226,353 | | | 10,995,485 | |
| Change in Unrealized Depreciation on Foreign Currency Transactions and Currency | | | — | | | (13 | ) | | — | |
| Net Realized/Unrealized Gain from Investments, Securities Sold Short, | | | | | | | | | | |
| Foreign Currency Transactions and Currency | | | 40,179,622 | | | 20,791,202 | | | 12,632,610 | |
| Change in Net Assets Resulting from Operations | | $ | 38,464,698 | | $ | 19,662,931 | | $ | 11,748,246 | |
| (1) | Expense related to securities sold short. |
See accompanying notes to financial statements.
Statements of Changes in Net Assets
| | | | | | | | | | | | | | | | | | | | | | |
| | | Needham Growth Fund | | | Needham Aggressive Growth Fund | | | Needham Small Cap Growth Fund | |
| | | Year Ended December 31, 2013 | | Year Ended December 31, 2012 | | | Year Ended December 31, 2013 | | Year Ended December 31, 2012 | | | Year Ended December 31, 2013 | | Year Ended December 31, 2012 | |
| Change in Net Assets | | | | | | | | | | | | | | | | | | | | | |
| Operations: | | | | | | | | | | | | | | | | | | | | | |
| Net Investment Loss | | $ | (1,714,924 | ) | $ | (796,318 | ) | | $ | (1,128,271 | ) | $ | (1,153,049 | ) | | $ | (884,364 | ) | $ | (770,410 | ) |
| Net Realized Gain (Loss) from | | | | | | | | | | | | | | | | | | | | | |
| Investments, Securities Sold Short, | | | | | | | | | | | | | | | | | | | | | |
Foreign Currency Transactions, and Currency | | | 4,522,860 | | | 7,927,193 | | | | 2,564,862 | | | (7,165,944 | ) | | | 1,637,125 | | | 1,502,727 | |
| Change in Unrealized Appreciation on | | | | | | | | | | | | | | | | | | | | | |
| Investments, Securities Sold Short, | | | | | | | | | | | | | | | | | | | | | |
| Foreign Currency Transactions and | | | | | | | | | | | | | | | | | | | | | |
| Currency | | | 35,656,762 | | | 8,505,697 | | | | 18,226,340 | | | 20,111,842 | | | | 10,995,485 | | | 6,357,419 | |
Change in Net Assets Resulting from Operations | | | 38,464,698 | | | 15,636,572 | | | | 19,662,931 | | | 11,792,849 | | | | 11,748,246 | | | 7,089,736 | |
| | | | | | | | | | | | | | | | | | | | | | |
| Distributions to Shareholders from: | | | | | | | | | | | | | | | | | | | | | |
| Capital Gains | | | (820,726 | ) | | (10,332,430 | ) | | | — | | | (42,629 | ) | | | — | | | — | |
| Total Distributions to Shareholders | | | (820,726 | ) | | (10,332,430 | ) | | | — | | | (42,629 | ) | | | — | | | — | |
| | | | | | | | | | | | | | | | | | | | | | |
| Capital Transactions: | | | | | | | | | | | | | | | | | | | | | |
| Shares Issued | | | 17,889,415 | | | 5,365,652 | | | | 7,195,084 | | | 8,345,065 | | | | 4,297,099 | | | 14,664,256 | |
| Shares Issued in Reinvestment of | | | | | | | | | | | | | | | | | | | | | |
| Distribution | | | 2,426,683 | | | 8,356,672 | | | | — | | | 42,097 | | | | — | | | — | |
| Shares Redeemed | | | (29,836,034 | ) | | (31,433,234 | ) | | | (25,160,046 | ) | | (43,575,127 | ) | | | (32,714,268 | ) | | (43,834,450 | ) |
| Redemption Fees | | | 8,278 | | | 1,961 | | | | 15,048 | | | 14,166 | | | | 4,787 | | | 20,159 | |
| Change in Net Assets from Capital | | | | | | | | | | | | | | | | | | | | | |
| Transactions | | | (9,511,658 | ) | | (17,708,949 | ) | | | (17,949,914 | ) | | (35,173,799 | ) | | | (28,412,382 | ) | | (29,150,035 | ) |
| | | | | | | | | | | | | | | | | | | | | | |
| Change in Net Assets | | | 28,132,314 | | | (12,404,807 | ) | | | 1,713,017 | | | (23,423,579 | ) | | | (16,664,136 | ) | | (22,060,299 | ) |
| | | | | | | | | | | | | | | | | | | | | | |
| Net Assets | | | | | | | | | | | | | | | | | | | | | |
| Beginning of Period | | | 113,561,180 | | | 125,965,987 | | | | 66,746,279 | | | 90,169,858 | | | | 60,614,432 | | | 82,674,731 | |
| End of Period | | $ | 141,693,494 | | $ | 113,561,180 | | | $ | 68,459,296 | | $ | 66,746,279 | | | $ | 43,950,296 | | $ | 60,614,432 | |
| Accumulated Net Investment Income | | | | | | | | | | | | | | | | | | | | | |
| (Loss) | | $ | 78,725 | | $ | 32,300 | | | $ | — | | $ | (12 | ) | | $ | — | | $ | — | |
| | | | | | | | | | | | | | | | | | | | | | |
| Share Transaction: | | | | | | | | | | | | | | | | | | | | | |
| Number of Shares Issued | | | 462,075 | | | 149,747 | | | | 365,831 | | | 513,281 | | | | 318,218 | | | 1,170,618 | |
| Number of Shares Reinvested | | | 65,282 | | | 257,922 | | | | — | | | 2,685 | | | | — | | | — | |
| Number of Shares Redeemed | | | (756,536 | ) | | (877,473 | ) | | | (1,358,357 | ) | | (2,713,361 | ) | | | (2,467,199 | ) | | (3,548,660 | ) |
| Change in Shares | | | (229,179 | ) | | (469,804 | ) | | | (992,526 | ) | | (2,197,395 | ) | | | (2,148,981 | ) | | (2,378,042 | ) |
See accompanying notes to financial statements.
Needham Growth Fund
Financial Highlights
| (For a Share Outstanding | | Year Ended December 31, | |
| | 2013 | | 2012 | | 2011 | | 2010 | | 2009 | |
| Net Asset Value, Beginning of Period | | $ | 33.66 | | $ | 32.78 | | $ | 39.11 | | $ | 29.77 | | $ | 20.27 | |
| Investment Operations | | | | | | | | | | | | | | | | |
| Net Investment Loss | | | (0.54 | ) | | (0.24 | ) | | (0.58 | ) | | (0.60 | ) | | (0.43 | ) |
| Net Realized and Unrealized | | | | | | | | | | | | | | | | |
| Gain (Loss) on Investments | | | 12.20 | | | 4.31 | | | (3.79 | ) | | 9.94 | | | 9.93 | |
| Total from Investment Operations | | | 11.66 | | | 4.07 | | | (4.37 | ) | | 9.34 | | | 9.50 | |
| | | | | | | | | | | | | | | | | |
| Less Distributions | | | | | | | | | | | | | | | | |
| Net Realized Gains | | | (0.26 | ) | | (3.19 | ) | | (1.97 | ) | | — | | | — | |
| Total Distributions | | | (0.26 | ) | | (3.19 | ) | | (1.97 | ) | | — | | | — | |
| | | | | | | | | | | | | | | | | |
| Capital Contributions | | | | | | | | | | | | | | | | |
| Redemption Fees | | | — | (a) | | — | (a) | | 0.01 | | | — | (a) | | — | (a) |
| Total Capital Contributions | | | — | (a) | | — | (a) | | 0.01 | | | — | (a) | | — | (a) |
| Net Asset Value, End of Period | | $ | 45.06 | | $ | 33.66 | | $ | 32.78 | | $ | 39.11 | | $ | 29.77 | |
| | | | | | | | | | | | | | | | | |
| | | | | | | | | | | | | | | | | |
| Total Return | | | 34.68 | % | | 12.80 | % | | (10.94 | )% | | 31.37 | % | | 46.87 | % |
| Net Assets, End of Period (000’s) | | $ | 141,693 | | $ | 113,561 | | $ | 125,966 | | $ | 159,805 | | $ | 119,175 | |
| Ratios/Supplemental Data | | | | | | | | | | | | | | | | |
| Ratio of Total Expenses to Average Net Assets | | | 1.89 | % | | 1.94 | % | | 1.81 | % | | 2.11 | % | | 2.03 | % |
| Ratio of Total Expenses to Average Net Assets | | | | | | | | | | | | | | | | |
| (before interest and dividend expense) | | | 1.82 | % | | 1.82 | % | | 1.78 | % | | 2.00 | % | | 2.00 | % |
| Ratio of Total Expenses to Average Net Assets | | | | | | | | | | | | | | | | |
| (before waiver and reimbursement of expenses) | | | 1.89 | % | | 1.94 | % | | 1.81 | % | | 2.11 | % | | 2.08 | % |
| Ratio of Net Investment Loss to Average Net Assets | | | (1.30 | )% | | (0.65 | )% | | (1.41 | )% | | (1.85 | )% | | (1.71 | )% |
| Ratio of Net Investment Loss to Average Net Assets | | | | | | | | | | | | | | | | |
| (before waiver and reimbursement of expenses) | | | (1.30 | )% | | (0.65 | )% | | (1.41 | )% | | (1.85 | )% | | (1.76 | )% |
| Portfolio turnover rate | | | 12 | % | | 17 | % | | 29 | % | | 62 | % | | 29 | % |
| (a) | Value is less than $0.005 per share. |
See accompanying notes to financial statements.
| Needham Aggressive Growth Fund | | | | | | | | | | | | | | | |
| Financial Highlights | | | | | | | | | | | | | | | |
| | | | | | | | | | | | | | | | |
| (For a Share Outstanding | | Year Ended December 31, | |
| Throughout each Period) | | 2013 | | | 2012 | | | 2011 | | | 2010 | | | 2009 | |
| Net Asset Value, Beginning of Period | | $ | 16.63 | | | $ | 14.52 | | | $ | 17.14 | | | $ | 12.38 | | | $ | 9.45 | |
| Investment Operations | | | | | | | | | | | | | | | | | | | | |
| Net Investment Loss | | | (0.37 | ) | | | (0.29 | ) | | | (0.34 | ) | | | (0.11 | ) | | | (0.19 | ) |
| Net Realized and Unrealized | | | | | | | | | | | | | | | | | | | | |
| Gain (Loss) on Investments | | | 6.40 | | | | 2.41 | | | | (2.04 | ) | | | 4.98 | | | | 3.13 | |
| Total from Investment Operations | | | 6.03 | | | | 2.12 | | | | (2.38 | ) | | | 4.87 | | | | 2.94 | |
| | | | | | | | | | | | | | | | | | | | | |
| Less Distributions | | | | | | | | | | | | | | | | | | | | |
| Net Realized Gains | | | — | | | | (0.01 | ) | | | (0.25 | ) | | | (0.11 | ) | | | (0.02 | ) |
| Total Distributions | | | — | | | | (0.01 | ) | | | (0.25 | ) | | | (0.11 | ) | | | (0.02 | ) |
| | | | | | | | | | | | | | | | | | | | | |
| Capital Contributions | | | | | | | | | | | | | | | | | | | | |
| Redemption Fees | | | — | (a) | | | — | (a) | | | 0.01 | | | | — | (a) | | | 0.01 | |
| Total Capital Contributions | | | — | (a) | | | — | (a) | | | 0.01 | | | | — | (a) | | | 0.01 | |
| Net Asset Value, End of Period | | $ | 22.66 | | | $ | 16.63 | | | $ | 14.52 | | | $ | 17.14 | | | $ | 12.38 | |
| | | | | | | | | | | | | | | | | | | | | |
| Total Return | | | 36.26 | % | | | 14.61 | % | | | (13.77 | )% | | | 39.42 | % | | | 31.18 | % |
| Net Assets, End of Period (000’s) | | $ | 68,459 | | | $ | 66,746 | | | $ | 90,170 | | | $ | 106,551 | | | $ | 22,819 | |
| Ratios/Supplemental Data | | | | | | | | | | | | | | | | | | | | |
| Ratio of Total Expenses to Average Net Assets | | | 2.07 | % | | | 2.06 | % | | | 1.83 | % | | | 2.09 | % | | | 2.50 | % |
| Ratio of Total Expenses to Average Net Assets | | | | | | | | | | | | | | | | | | | | |
| (before interest and dividend expense) | | | 1.91 | % | | | 1.89 | % | | | 1.80 | % | | | 2.05 | % | | | 2.49 | % |
| Ratio of Total Expenses to Average Net Assets | | | | | | | | | | | | | | | | | | | | |
| (before waiver and reimbursement of expenses) | | | 2.07 | % | | | 2.06 | % | | | 1.83 | % | | | 2.09 | % | | | 2.50 | % |
| Ratio of Net Investment Loss to Average Net Assets | | | (1.74 | )% | | | (1.40 | )% | | | (1.62 | )% | | | (1.77 | )% | | | (2.39 | )% |
Ratio of Net Investment Loss to Average Net Assets (before waiver and reimbursement of expenses) | | | (1.74 | )% | | | (1.40 | )% | | | (1.62 | )% | | | (1.77 | )% | | | (2.39 | )% |
| Portfolio turnover rate | | | 20 | % | | | 15 | % | | | 45 | % | | | 55 | % | | | 70 | % |
(a) Value is less than $0.005 per share.| | |
| See accompanying notes to financial statements. | |
| Needham Small Cap Growth Fund | | | | | | | | | | | | | | | |
| Financial Highlights | | | | | | | | | | | | | | | |
| | | | | | | | | | | | | | | | |
| (For a Share Outstanding | | Year Ended December 31, |
| Throughout each Period) | | 2013 | | | 2012 | | | 2011 | | | 2010 | | | 2009 | |
| Net Asset Value, Beginning of Period | | $ | 12.22 | | | $ | 11.26 | | | $ | 14.21 | | | $ | 10.73 | | | $ | 7.61 | |
| Investment Operations | | | | | | | | | | | | | | | | | | | | |
| Net Investment Loss | | | (0.31 | ) | | | (0.15 | ) | | | (0.27 | ) | | | (0.08 | ) | | | (0.20 | ) |
| Net Realized and Unrealized | | | | | | | | | | | | | | | | | | | | |
| Gain (Loss) on Investments | | | 3.72 | | | | 1.11 | | | | (2.04 | ) | | | 3.99 | | | | 3.33 | |
| Total from Investment Operations | | | 3.41 | | | | 0.96 | | | | (2.31 | ) | | | 3.91 | | | | 3.13 | |
| | | | | | | | | | | | | | | | | | | | | |
| Less Distributions | | | | | | | | | | | | | | | | | | | | |
| Net Realized Gains | | | — | | | | — | | | | (0.62 | ) | | | (0.43 | ) | | | (0.01 | ) |
| Return of Capital | | | — | | | | — | | | | (0.02 | ) | | | — | | | | — | |
| Total Distributions | | | — | | | | — | | | | (0.64 | ) | | | (0.43 | ) | | | (0.01 | ) |
| | | | | | | | | | | | | | | | | | | | | |
| Capital Contributions | | | | | | | | | | | | | | | | | | | | |
| Redemption Fees | | | — | (a) | | | — | (a) | | | — | (a) | | | — | (a) | | | — | (a) |
| Total Capital Contributions | | | — | (a) | | | — | (a) | | | — | (a) | | | — | (a) | | | — | (a) |
| Net Asset Value, End of Period | | $ | 15.63 | | | $ | 12.22 | | | $ | 11.26 | | | $ | 14.21 | | | $ | 10.73 | |
| | | | | | | | | | | | | | | | | | | | | |
| Total Return | | | 27.91 | % | | | 8.53 | % | | | (16.10 | )% | | | 36.89 | % | | | 41.18 | % |
| Net Assets, End of Period (000’s) | | $ | 43,950 | | | $ | 60,614 | | | $ | 82,675 | | | $ | 98,911 | | | $ | 11,303 | |
| Ratios/Supplemental Data | | | | | | | | | | | | | | | | | | | | |
| Ratio of Total Expenses to Average Net Assets | | | 2.06 | % | | | 2.04 | % | | | 1.84 | % | | | 2.16 | % | | | 2.57 | % |
| Ratio of Total Expenses to Average Net Assets | | | | | | | | | | | | | | | | | | | | |
| (before interest and dividend expense) | | | 1.96 | % | | | 1.92 | % | | | 1.81 | % | | | 2.08 | % | | | 2.50 | % |
| Ratio of Total Expenses to Average Net Assets | | | | | | | | | | | | | | | | | | | | |
| (before waiver and reimbursement of expenses) | | | 2.09 | % | | | 2.04 | % | | | 1.84 | % | | | 2.16 | % | | | 3.02 | % |
| Ratio of Net Investment Loss to Average Net Assets | | | (1.80 | )% | | | (1.02 | )% | | | (1.57 | )% | | | (1.88 | )% | | | (2.50 | )% |
Ratio of Net Investment Loss to Average Net Assets (before waiver and reimbursement of expenses) | | | (1.83 | )% | | | (1.02 | )% | | | (1.57 | )% | | | (1.88 | )% | | | (2.95 | )% |
| Portfolio turnover rate | | | 58 | % | | | 72 | % | | | 105 | % | | | 65 | % | | | 154 | % |
| (a) | Value is less than $0.005 per share. |
| | |
| See accompanying notes to financial statements. | |
Notes to Financial Statements
Needham Growth Fund (“NGF”), Needham Aggressive Growth Fund (“NAGF”) and Needham Small Cap Growth Fund (“NSCGF”) (each, a “Portfolio” and collectively, the “Portfolios”), are portfolios of The Needham Funds, Inc. (the “Company”), which is registered under the Investment Company Act of 1940, as amended (the “1940 Act”), as a diversified, open-end management investment company. The Company was organized as a Maryland corporation on October 12, 1995.
| 2. | Significant Accounting Policies |
The following is a summary of significant accounting policies followed by the Company in the preparation of its financial statements. These policies are in conformity with accounting principles generally accepted in the United States of America (“GAAP”).
Security Valuation: Portfolio securities for which market quotations are readily available are stated at the last sale price reported by the principal exchange for the security as of the exchange’s close of business. Securities for which no sale has taken place during the day and securities which are not listed on an exchange are valued at the mean of the highest closing bid and lowest asked prices. Exchange traded options are valued at the last reported sale price on any exchange on which the option is principally traded. If no sales are reported on a particular day, the options will be valued at the mean between the highest closing bid and lowest asked prices across the exchanges where the option is traded. Non-exchange traded options will also be valued at the mean between the last bid and asked quotations. For options where market quotations are not readily available, value will be determined in accordance with the fair value procedures described below. All other securities and assets for which (a) market quotations are not readily available, such as in the case of a market or technical disruption that prevents the normal trading of a security held by a Portfolio, (b) market quotations are believed to be unrepresentative of fair market value, such as in the case of a thinly traded security, or (c) valuation is normally made at the last sale price on a foreign exchange and a significant event occurs after the close of that exchange but before the New York Stock Exchange close, are valued at their fair value as determined in good faith by the Board of Directors (the “Board”) in accordance with Fair Value Procedures established by the Board. The Company’s Fair Value Procedures are implemented and monitored by a Fair Value Committee (the “Committee”) designated by the Board. When a security is valued in accordance with the Fair Value Procedures, the Committee determines a value after taking into consideration any relevant information that is reasonably available to the Committee. Some of the more common reasons that may necessitate that a security be valued pursuant to these Fair Value Procedures include, but are not limited to: the security’s trading has been halted or suspended; the security has been de-listed from a national exchange; the security’s primary trading market is temporarily closed at a time when under normal conditions it would be open; or the security’s primary pricing source is not able or willing to provide a price. The assets of each Portfolio may also be valued on the basis of valuations provided by a pricing service approved by, or on behalf of, the Board.
Portfolio securities listed or traded on securities exchanges, including American Depositary Receipts (“ADRs”), are valued at the closing price on the exchange or system where the security is principally traded or at the NASDAQ Official Closing Price. If there have been no sales for that day on the exchange or system, a security is valued at the mean of the highest closing bid and lowest asked prices on the exchange or system where the security is principally traded.
The Portfolios did not value any securities in accordance with the Fair Value Procedures as of December 31, 2013.
Investment Transactions: Changes in holdings of portfolio securities for the Portfolios shall be reflected no later than in the first calculation on the first business day following the trade date for purposes of calculating each Portfolio’s daily net asset value per share. However, for financial reporting purposes, portfolio security transactions are reported on the trade date of the last business day of the reporting period. The cost (proceeds) of investments sold (bought to cover) is determined on a specific identification basis for the purpose of determining gains or losses on sales and buys to cover short positions. Dividend income, distributions to shareholders and dividend expense from securities sold short are recorded on the ex-dividend date. Interest income and interest expense from securities sold short is recorded on an accrual basis.
Foreign Currency: Foreign currency amounts are translated into U.S. dollars as follows: (i) assets and liabilities at the rate of exchange at the end of the respective period; and (ii) purchases and sales of securities and income and expenses at the rate of exchange prevailing on the dates of such transactions. The portion of realized gains arising from changes in the exchange rates are included with the net realized and unrealized gain or loss on investments. Principal risks associated with such transactions include the movement in value of the foreign currency relative to the U.S. dollar and the ability of the counterparty to perform.
Notes to Financial Statements (Continued)
The Portfolios may also invest in forward currency contracts. Fluctuations in the value of such forward currency transactions are recorded daily as unrealized gain or loss; realized gain or loss includes net gain or loss on transactions that have terminated by settlement. These instruments involve securities and currency market risk, credit risk, or both kinds of risks, in excess of the amount recognized in the statements of assets and liabilities. Risks also arise from the possible inability of counterparties to meet the terms of their contracts. The Portfolios did not enter into forward currency contracts during the year ended December 31, 2013.
Allocation of Expenses: Expenses directly attributable to a Portfolio are charged directly to that Portfolio, while expenses which are attributable to more than one Portfolio are allocated among the respective Portfolios based upon relative net assets or some other reasonable method.
Use of Estimates: The preparation of financial statements in accordance with GAAP requires management to make estimates and assumptions that affect the reported amounts and disclosures in the financial statements. Actual results could differ from those estimates and those differences could be material.
Distributions to Shareholders: Dividends from net investment income, if any, are declared and paid annually for the Portfolios. Distributable net realized gains, if any, are declared and distributed at least annually.
Redemption Fees: The Portfolios reserve the right to assess a redemption fee for shares held 60 days or less. The shareholder will be charged a fee equal to 2.00% of the value of the shares redeemed. The redemption fee is intended to offset excess brokerage commissions and other costs associated with fluctuations in asset levels and cash flows caused by frequent trading by shareholders. The applicability of the redemption fee will be calculated using a first-in first-out method, which means the oldest shares will be redeemed first, followed by the redemption of more recently acquired shares. For the year ended December 31, 2013, NGF, NAGF and NSCGF had contributions to capital due to redemption fees in the amounts of $8,278, $15,048 and $4,787, respectively.
Federal Income Taxes: It is the policy of each Portfolio to continue to qualify as a regulated investment company, as defined in the Internal Revenue Code, by complying with the provisions available to certain investment companies and to make distributions of net investment income and net realized capital gains sufficient to relieve it from all, or substantially all, federal income taxes. Accordingly, no provision for income taxes has been made in the Portfolios’ financial statements.
As of December 31, 2013, the Portfolios did not have any tax positions that did not meet the “more-likely-than-not” threshold of being sustained by the applicable tax authority. Generally, tax authorities can examine all the tax returns filed for the last three years.
Fair Value Measurements: Valuation inputs used to determine the value of the Portfolios’ investments are summarized in the three broad levels listed below:
Level 1 — quoted prices in active markets for identical assets.
Level 2 — other significant inputs (including quoted prices of similar securities, interest rates, prepayment speeds, credit risk, etc.).
Level 3 — significant unobservable inputs (which may include the Portfolios’ own assumptions in determining the fair value of investments).
The inputs or methodology used to value securities are not necessarily an indication of the risk associated with investing in those securities.
Portfolio securities listed or traded on securities exchanges, including ADRs, are valued at the closing price on the exchange or system where the security is principally traded or at the NASDAQ Official Closing Price. If there have been no sales for that day on the exchange or system, a security is valued at the mean of the highest closing bid and lowest asked prices on the exchange or system where the security is principally traded. These valuations are typically categorized as Level 1 in the fair value hierarchy.
In accordance with procedures adopted by the Board, fair value pricing may be used if events materially affecting the value of foreign securities occur between the time the exchange on which they are traded closes and the time the Portfolios’ net asset values are calculated. These valuations are categorized as Level 2 in the fair value hierarchy. As of December 31, 2013, the Portfolios did not hold any Level 2 securities.
Notes to Financial Statements (Continued)
The following is a summary categorization, as of December 31, 2013, of each Portfolio’s investments based on the level of inputs utilized in determining the value of such investments:
| | | | |
| | | LEVEL 1 - Quoted Prices(1)(3) | |
| | | NGF | | | NAGF | | | NSCGF | |
| Assets | | | | | | | | | |
Common Stocks(2) | | $ | 137,381,183 | | | $ | 67,864,853 | | | $ | 43,437,155 | |
| Short-Term | | | | | | | | | | | | |
| Investments | | | 4,723,709 | | | | 568,053 | | | | 1,631,683 | |
| Liabilities | | | | | | | | | | | | |
Securities Sold Short(2) | | | (5,572,870 | ) | | | (6,237,430 | ) | | | — | |
| Total | | $ | 136,532,022 | | | $ | 62,195,476 | | | $ | 45,068,838 | |
| (1) | As of December 31, 2013, the Portfolios did not hold Level 2 or Level 3 investments. |
| (2) | Please refer to the Schedule of Investments and Schedule of Securities Sold Short to view segregation by industry. |
| (3) | There were no transfers into or out of Levels 1, 2 or 3 during the period. |
| 3. | Derivative Instruments and Hedging Activities |
The “Derivatives and Hedging” Topic of the Codification (ASC 815, formerly SFAS 133 and SFAS 161) requires enhanced disclosures about the Portfolios’ derivative and hedging activities, including how such activities are accounted for and their effect on the Portfolios’ financial position, performance and cash flows. The Portfolios did not use derivatives during the year ended December 31, 2013.
| 4. | Investment Advisory and Administrative Services |
The Company has engaged Needham Investment Management L.L.C. (the “Adviser”) to manage its investments. The Company pays the Adviser a fee at the annual rate of 1.25% of the average daily net assets of each Portfolio.
The Adviser has entered into agreements with the Portfolios (the “Expense Limitation Agreements”) whereby the Adviser has contractually agreed to waive its fee for, and to reimburse expenses (excluding interest, dividends on short positions, acquired fund fees and expenses and extraordinary items) of NGF, NAGF and NSCGF in an amount that limits annual operating expenses to not more than 1.95% of the average daily net assets. The agreement is effective for the period from May 1, 2013 through April 30, 2014. The agreement shall continue in effect from year to year thereafter only upon mutual agreement of the respective Portfolio and the Adviser.
Any reimbursements or fee waivers made by the Adviser to a Portfolio are subject to recoupment by the Adviser, to the extent that the Portfolio is able to make the repayment within its Expense Limitation Agreements. Under the Expense Limitation Agreements, such recoupments must be made within three years following the fiscal year in which the Adviser reduced its compensation and/or assumed expenses for the applicable Portfolio. The Adviser did not recoup any fees previously waived or reimbursed under the Expense Limitation Agreements during the year ended December 31, 2013. The table below indicates the amount of fees that the Adviser may recoup:
| | | Recovery Expiring on | |
| | 4/30/2017 | | | 4/30/2016 | | | 4/30/2015 | | | 4/30/2014 | |
| NGF | | $ | — | | | $ | — | | | $ | — | | | $ | — | |
| NAGF | | | — | | | | — | | | | — | | | | — | |
| NSCGF | | | 11,330 | | | | 1,464 | | | | — | | | | — | |
The Company and U.S. Bancorp Fund Services, LLC (the “Administrator”) are parties to a Fund Administration Servicing Agreement. The Administrator provides administrative and fund accounting services pursuant to this agreement and, in consideration of these services, receives a fee computed daily and paid monthly at an annual rate based on a percentage of the value of the Company’s assets. The Administrator is also compensated for any out of pocket expenses that are reasonably incurred in carrying out its duties under the Administration Agreement. The Administrator also provides transfer agent services pursuant to a Transfer Agent Servicing Agreement for additional fees.
Certain officers of the Company are also officers of the Adviser and/or Needham & Company, LLC (the “Distributor”). Such officers receive no fees from the Company for serving as officers of the Company. Each of the three Directors who is not an “interested person” (as defined in the 1940 Act) of the Company (each, an Independent Director) receives a quarterly retainer of $3,000 and a per-meeting fee of $500. Each Independent Director is also a member of the Audit Committee of the Company’s Board of Directors and receives a fee of $500 per meeting attended. The Adviser provides an employee to serve as Chief Compliance Officer for the Company and to provide certain related services. An affiliate of the Adviser, Needham & Company, LLC, pays the Chief Compliance Officer’s compensation and the Company reimburses this affiliate for the Company’s portion of the expense.
The Company has adopted an Amended and Restated Plan of Distribution pursuant to Rule 12b-1 under the 1940 Act. Under the Plan, each Portfolio pays the Distributor and any other distributor or financial institution with which the Company has an agreement with respect to each Portfolio, a fee at an annual rate of 0.25% of each Portfolio’s daily average net assets. For the year ended December 31, 2013, NGF, NAGF and NSCGF paid 12b-1 fees to the Distributor in the amount of $328,886, $162,285 and $122,609, respectively.
Notes to Financial Statements (Continued)
During the year ended December 31, 2013, NGF, NAGF and NSCGF incurred and paid brokerage commissions to the Distributor in the amount of $20,563, $21,834, and $36,718, respectively.
Each Portfolio may borrow from banks up to 25% of its total assets and may pledge its assets in connection with these borrowings, provided that no additional investments shall be made while borrowings exceed 5% of total assets.
The Portfolios did not engage in any temporary borrowings during the year ended December 31, 2013.
| 7. | Short Sale Transactions |
During the year ended December 31, 2013, each Portfolio sold securities short. Upon selling a security short, the Portfolios record an asset for the settlement amount and a corresponding liability, which is marked-to-market to reflect current value. Certain securities owned by each respective Portfolio are segregated as collateral while the short sales are outstanding. At December 31, 2013, the market value of securities separately segregated to cover short positions was $5,020,500, $7,171,765, and $482,430 for NGF, NAGF and NSCGF, respectively.
Additionally, the Portfolios had receivables for Deposit with Broker for Securities Sold Short of $5,578,776, $6,067,673 and $0 pledged as collateral with a broker in connection with open short positions for NGF, NAGF and NSCGF, respectively. Securities sold short at December 31, 2013 and their related market values and proceeds are set forth in the preceding Schedule of Securities Sold Short for each Portfolio.
| 8. | Investment Transactions |
The following summarizes the aggregate amount of the cost of purchases and proceeds from sales of investment securities and securities sold short, excluding short-term securities, during the year ended December 31, 2013:
| | | | | | | |
| | | Purchases | | | Sales | |
| NGF | | $ | 14,013,502 | | | $ | 25,626,297 | |
| NAGF | | | 13,309,160 | | | | 35,671,554 | |
| NSCGF | | | 25,946,994 | | | | 50,447,406 | |
There were no purchases or sales of U.S. government securities during the year ended December 31, 2013.
| 9. | Financial Instruments With Off-Balance Sheet Risk |
In the normal course of their business, the Portfolios may trade various financial instruments with off-balance sheet risk. These financial instruments include securities sold short, written options, futures, and forward currency contracts. Generally, these financial instruments represent future commitments to purchase or sell other financial instruments at specific terms at specified future dates. Each of these financial instruments contains varying degrees of off-balance sheet risk whereby changes in the market values of the securities underlying the financial instruments may be in excess of the amounts recognized in the financial statements.
Securities sold short represent obligations of the Portfolios to make future delivery of specific securities and, correspondingly, create an obligation to purchase the securities at market prices prevailing at a later delivery date (or to deliver the securities if already owned by the Portfolios). As a result, short sales create the risk that the Portfolios’ ultimate obligation to satisfy the delivery requirements may exceed the amount of the proceeds initially received on the liability recorded in the financial statements.
Under the Company’s organizational documents, its Directors and officers are indemnified against certain liabilities arising out of the performance of their duties to the Company. In addition, in the ordinary course of business, the Company enters into contracts that contain a variety of indemnifications. The Company’s maximum exposure under these arrangements is unknown. However, the Company has not had prior claims or losses pursuant to these contracts and expects the risk of loss to be remote.
No provision for federal income taxes is required since the Company intends to continue to qualify as a regulated investment company under Subchapter M of the Internal Revenue Code and distribute substantially all of its taxable income and capital gains to shareholders. Because income tax regulations differ from GAAP, the timing and character of income and capital gain distributions determined in accordance with tax regulations can differ from income and capital gains recognized for financial reporting purposes. Accordingly, the character of distributions and the composition of net assets for tax purposes can differ from those reflected in the financial statements. These book/tax differences may be temporary or permanent in nature. Temporary differences are generally due to differing book and tax treatment for the timing of the recognition of gains and losses on securities, including post-October losses (as described below). Permanent differences are generally due to differing treatment of net investment losses. To the extent these differences are permanent, they are charged or credited to paid-in capital, accumulated net realized gain (loss), or accumulated net investment income (loss), as appropriate, in the period in which the differences arise. These reclassifications have no effect on net assets or net asset value per share of each Portfolio.
Notes to Financial Statements (Continued)
As of December 31, 2013, the cost, gross unrealized appreciation, gross unrealized depreciation, and the net unrealized appreciation (depreciation) on securities, including proceeds from securities sold short for federal income tax purposes, were as follows:
| | | | | | Gross | | | Gross | | | Net | |
| | | | | | Unrealized | | | Unrealized | | | Unrealized | |
| | | Cost | | | Appreciation | | | Depreciation | | | Appreciation | |
| NGF | | $ | 71,172,844 | | | $ | 74,762,259 | | | $ | (3,830,211 | ) | | $ | 70,932,048 | |
| NAGF | | | 33,025,471 | | | | 36,254,053 | | | | (846,618 | ) | | | 35,407,435 | |
| NSCGF | | | 40,602,921 | | | | 6,710,547 | | | | (2,244,630 | ) | | | 4,465,917 | |
The difference between the tax cost of investments and the cost of investments for GAAP purposes is primarily due to the tax treatment for wash sale losses.
As of December 31, 2013, the components of distributable earnings (loss) on a tax basis were as follows:
| | | NGF | | | NAGF | | | NSCGF | |
| Undistributed ordinary | | | | | | | | | |
| income | | $ | — | | | $ | — | | | $ | 39,890 | |
| Undistributed long-term | | | | | | | | | | | | |
| capital gains | | | 3,618,987 | | | | — | | | | 501,807 | |
| Unrealized appreciation | | | 70,932,048 | | | | 35,407,435 | | | | 4,465,917 | |
| Total accumulated | | | | | | | | | | | | |
| earnings | | $ | 74,551,035 | | | $ | 35,407,435 | | | $ | 5,007,614 | |
The tax character of distributions paid during the fiscal year ended December 31, 2013 was as follows:
| | | NGF | | | NAGF | | | NSCGF | |
| Ordinary Income | | $ | — | | | $ | — | | | $ | — | |
| Net long-term capital gains | | | 820,726 | | | | — | | | | — | |
| Return of Capital | | | — | | | | — | | | | — | |
| Total distributions paid | | $ | 820,726 | | | $ | — | | | $ | — | |
As of December 31, 2013 the Portfolios had accumulated capital loss carryovers of:
| | | Capital Loss | | | | | | | |
| | | Carryover | | | Term | | | Expires | |
| NGF | | $ | — | | | | — | | | | — | |
| NAGF | | (4,580,325 | ) | | Short Term | | | | Unlimited | |
| NSCGF | | | — | | | | — | | | | — | |
The Regulated Investment Company Modernization Act of 2010 (the ‘‘Act’’) was enacted on December 22, 2010. The Act made changes to several tax rules impacting the Portfolios. In general, the provisions of the Act are effective for the Company’s fiscal year ending December 31, 2013. Although the Act provides several benefits, including the unlimited carryover of future capital losses, there may be a greater likelihood that all or a portion of each Portfolio’s pre-enactment capital loss carryovers may expire without being utilized due to the fact that post-enactment capital losses get utilized before pre-enactment capital loss carryovers.
The Act also changed the definition of post-October capital losses eligible for elective deferral to the greatest of a Regulated Investment Company’s (‘‘RIC’s’’) net capital loss attributable to the portion of the RIC’s taxable year after October 31, the RIC’s net long-term capital loss attributable to the portion of the RIC’s taxable year after October 31, or the RIC’s net short-term capital loss attributable to the portion of the RIC’s taxable year after October 31. As such, any post-October capital loss which a RIC has elected to defer is deemed to arise on the first day of the RIC’s following taxable year. The aggregate amount of the RIC’s anticipated deferred post-October capital losses would be included in the RIC’s tax basis accumulated loss carryforward, if applicable.
12. Subsequent Events
Management has evaluated subsequent events through the date of this filing. This evaluation did not result in any subsequent events that necessitated recognition or disclosures.
Report of Independent Registered Public Accounting Firm
The Board of Directors and Shareholders
The Needham Funds, Inc.:
We have audited the accompanying statements of assets and liabilities, including the schedules of investments and schedules of securities sold short, of the Needham Growth Fund, Needham Aggressive Growth Fund and Needham Small Cap Growth Fund, each a ‘‘Portfolio’’ of The Needham Funds, Inc. (collectively, the ‘‘Portfolios’’) as of December 31, 2013, and the related statements of operations for the year then ended, the statements of changes in net assets for each of the years in the two-year period then ended and financial highlights for each of the years in the three-year period then ended. These financial statements and financial highlights are the responsibility of the Portfolios’ management. Our responsibility is to express an opinion on these financial statements and financial highlights based on our audits. The financial highlights for each of the years in the two-year period ended December 31, 2010 were audited by other independent registered public accountants whose report thereon, dated February 28, 2011, expressed an unqualified opinion on those financial highlights.
We conducted our audits in accordance with the standards of the Public Company Accounting Oversight Board (United States). Those standards require that we plan and perform the audit to obtain reasonable assurance about whether the financial statements and financial highlights are free of material misstatement. An audit includes examining, on a test basis, evidence supporting the amounts and disclosures in the financial statements. Our procedures included confirmation of securities owned as of December 31, 2013, by correspondence with custodians and brokers. An audit also includes assessing the accounting principles used and significant estimates made by management, as well as evaluating the overall financial statement presentation. We believe that our audits provide a reasonable basis for our opinion.
In our opinion, the financial statements and financial highlights referred to above present fairly, in all material respects, the financial position of Needham Growth Fund, Needham Aggressive Growth Fund and Needham Small Cap Growth Fund as of December 31, 2013, the results of their operations for the year then ended, the changes in their net assets for each of the years in the two-year period then ended, and the financial highlights for each of the years in the three-year period then ended, in conformity with U.S. generally accepted accounting principles.
New York, New York
February 28, 2014
Information about Directors and Officers (Unaudited)
December 31, 2013
Information pertaining to the Directors and Officers of the Company is set forth below. The Statement of Additional Information (SAI) includes additional information about the Directors and is available without charge, upon request, by calling 800-625-7071.
The address of each individual is 445 Park Avenue, New York, NY 10022-2606. Each Director serves until the next annual shareholders meeting or until his successor is elected and qualified.
| | | | |
Name, Age and Position with the Fund | Term of Office and Length of Term Served by Director/Officer | Portfolios in the Fund Complex Overseen by Director/Officer | Principal Occupations(s) During Past 5 Years and Other Directorships Held by Director/Officer |
| Independent Directors |
| John W. Larson, 78, | Indefinite; | Three | Partner at the law firm of Morgan, Lewis & Bockius LLP from 2003 until retiring in December 2009. Partner at the law firm of Brobeck, Phleger & Harrison LLP from 1969 until retiring in January 2003. From July 1971 to September 1973 worked in government service as Assistant Secretary of the United States Depart- ment of the Interior and Counselor to George P. Schultz, Chairman of the Cost of Living Council. Director of Wage Works, Inc. (an employee benefits company) since 2000. Director of Sangamo BioSciences, Inc. since 1996. |
| Director | Since 2006 | |
| | | |
| | | |
| | | |
| | | |
| James P. Poitras, 71, | Indefinite; | Three | Currently retired. Director (since 2000) and Chairman (since 2001) of Kyma Technologies, Inc. (a specialty materials semiconductor company). Founder, Chairman, President and Chief Executive Officer of Integrated Silicon Systems (a computer software company) from 1985 to 1995. |
| Director | Since 1996 | |
| | | |
| F. Randall Smith, 75, | Indefinite; | Three | Founder and Chief Executive and Investment Officer of Capital Counsel LLC (a registered investment adviser) since September 1999. Co-founder and Managing Partner of Train, Smith Counsel (a registered investment adviser) from 1975 to 1999. |
| Director | Since 1996 | |
| | | |
| Interested Director |
| George A. Needham*, 70, | Indefinite; | Three | Chairman of the Board and Chief Executive Officer of The Needham Group, Inc. and Needham Holdings, LLC since December 2004. Chairman of the Board and Chief Executive Officer of Needham Asset Management, LLC since April 2006. Chairman of the Board from 1996 to December 2004 and Chief Executive Officer from 1985 to December 2004 of Needham & Company, LLC. |
| Chairman, President and | Since 1996 | |
| Director | | |
| | | |
| | | |
| Officers |
| John Barr, 57, | One year; | Two | Portfolio Manager of Needham Asset Management since 2010. Founding and Managing Member of Oliver Investment Management, LLC from 2008 to 2009. Manager and Analyst at Buckingham Capital from 2002 to 2008. Managing Direc- tor and a Senior Analyst at Robertson Stephens following semiconductor companies from 2000 to 2002. From 1995 to 2000, Managing Director and Senior Analyst at Needham and Company, also served as Director of Research. Director of Coventor, Inc. since 2009. |
| Executive Vice President and | Since 2010 | |
| Co-Portfolio Manager of | | |
| the Needham Growth Fund, | | |
| Executive Vice President | | |
| and Portfolio Manager of | | |
| the Needham Aggressive | | |
| Growth Fund. | | | |
| Chris Retzler, 42, | One year; | Two | Portfolio Manager of Needham Asset Management, LLC since 2008. Vice President of Needham Asset Management, LLC since 2005. Head of Winterkorn, a healthcare manufacturing and distribution company, from 2002 to 2005. |
| Executive Vice President and | Since 2008 | |
| Co-Portfolio Manager of | | |
| the Needham Growth Fund, | | | |
| Executive Vice President | | | |
| and Portfolio Manager of | | | |
| the Needham Small Cap | | | |
| Growth Fund. | | | |
| James W. Giangrasso, 51, | One year; | Three | Chief Financial Officer of Needham Asset Management, LLC since 2011. Principal and Controller of Needham Asset Management, LLC since 2006. |
| Chief Financial Officer, | Since 2011 | |
| Treasurer and Secretary | | | |
| | | | |
| James M. Abbruzzese, 44, | One year; | Three | Chief Compliance Officer of Needham Asset Management, LLC since April 2006 and Chief Compliance Officer and Managing Director of Needham & Company, LLC since July 1998. |
| Chief Compliance Officer | Since 2004 | |
| | | |
| * | An “interested person,” as defined in the 1940 Act, of the Company or the Company’s investment adviser. Mr. Needham is deemed to be an interested person because of his affiliation with the Adviser and the Distributor, and because he is an officer of the Company. |
Supplementary Information (Unaudited)
December 31, 2013
Federal Income Tax Information
During the year ended December 31, 2013, NGF declared and paid long-term realized gains distributions in the amounts of $820,726. NAGF and NSCGF did not declare any long-term realized gains distributions.
For the year ended December 31, 2013, NGF, NAGF, and NSCGF did not declare any ordinary income distributions.
For the fiscal year ended December 31, 2013, certain dividends paid by the Portfolios may be subject to a maximum tax rate of 15%. The percentage of dividends declared from ordinary income reported as qualified dividend income was as follows:
| NGF | | | 0.00 | % |
| NAGF | | | 0.00 | % |
| NSCGF | | | 0.00 | % |
For corporate shareholders, the percent of ordinary income distributions qualifying for the corporate dividends received deduction for the fiscal year ended December 31, 2013 was as follows:
| NGF | | | 0.00 | % |
| NAGF | | | 0.00 | % |
| NSCGF | | | 0.00 | % |
Privacy Policy
It is the policy of the Company to keep personally identifiable financial information about you as an individual (“nonpublic personal information”) confidential, and use or disclose it only as necessary to provide services to you or the Company or as otherwise required or permitted by law. We may collect the following nonpublic personal information about you:
| | ● | Information we receive from you on or in applications or other forms, correspondence, or conversations, including, but not limited to, your name, address, phone number, social security number, assets, income and date of birth; and |
| | | |
| | ● | Information about your transactions with us, our affiliates, or others, including, but not limited to, your account number and balance, payments history, parties to transactions, cost basis information, other financial information and information about how you vote your shares. |
We disclose nonpublic personal information about current and former shareholders to companies that provide necessary services to the Company. These companies include the transfer agent, distributor, administrator and investment adviser as well as other affiliates of the Company. We maintain physical, electronic and procedural safeguards that comply with federal standards to guard your nonpublic personal information and restrict access to this information to those persons who need it to provide services to you or the Company or who are otherwise permitted by law to receive it. In the event that you hold any shares of our funds through a financial intermediary, including, but not limited to, a broker-dealer, bank, or trust company, the privacy policy of your financial intermediary governs how your non-public personal information is shared with nonaf-filiated third parties.
If you have any questions concerning the Company’s Privacy Policy, please call 1-800-625-7071.
Disclosure of Portfolio Holdings
The Company files a Form N-Q with the Securities and Exchange Commission (the ‘‘SEC’’) no more than sixty days after the Company’s first and third fiscal quarters. For the Company, this would be for the fiscal quarters ending March 31 and September 30. Form N-Q includes a complete schedule of the Company’s portfolio holdings as of the end of those fiscal quarters. The Company’s N-Q filings can be found free of charge on the SEC’s website at http://www.sec.gov, or they may be reviewed and copied at the SEC’s Public Reference Room in Washington, D.C. (call 800-SEC-0330 for information on the operation of the Public Reference Room).
Voting Proxies on Company Portfolio Securities
A description of the policies and procedures that the Company uses to determine how to vote proxies relating to portfolio securities and information regarding how the Company voted proxies relating to portfolio securities during the most recent 12-month period ended June 30 are available without charge, upon request, by calling 800-625-7071 or on the SEC’s website at http://www.sec.gov.
Household Delivery of Shareholder Documents
To reduce expenses, the Company may mail only one copy of the Funds’ prospectuses, proxy statements, information statements, and each annual and semi-annual report to those addresses shared by two or more accounts. If you wish to receive individual copies of these documents, please call the Funds at 1-800-625-7071 or contact your financial institution. You will begin receiving individual copies thirty days after receiving your request.
Supplementary Information (Unaudited) (Continued)
December 31, 2013
Board Consideration and Approval of Investment Advisory Agreement
On October 16, 2013, at a meeting called for the purpose of voting on such approval, the Board of Directors (the “Board”), including all of the Independent Directors, approved the continuance of the Investment Advisory Agreement (the “Advisory Agreement”) between the Company and the Adviser with respect to NGF, NAGF and NSCGF. In doing so, the Board reviewed materials provided by the Adviser to assist them in making a determination (the ‘‘Board Materials’’). The Independent Directors were assisted in their review by independent legal counsel and met with counsel in executive session separate from representatives of the Adviser. In considering the renewal of the Advisory Agreement, the Board considered the nature, extent, and quality of the services to be provided by the Adviser; the investment performance of each Portfolio and the Adviser; the costs of the services to be provided and profits to be realized by the Adviser and its affiliates from the relationship with each Portfolio; the extent to which economies of scale would be realized as the Portfolios grow; and whether fee levels reflect these economies of scale for the benefit of investors.
The Directors stated that their consideration of the continuance of the Advisory Agreement included consideration of the peer-group comparisons in the Board Materials, noting that each Portfolio’s since inception performance was better than its respective peer group average and median and, except for NAGF, generally was above relevant Morningstar Universe averages and medians. For NAGF, the Directors noted that the Portfolio’s performance was above the peer group average and median performance in all periods and above the relevant Morn-ingstar Universe averages and medians year-to-date (ended September 30, 2013) and in the five- and ten-year periods. It was further noted that the Portfolios’ performance compared well to the longer term performance of their respective benchmark indices. With respect to NSCGF, the Directors noted the change in definition of a small capitalization company proposed by management, and previously approved by the Directors, to broaden the Portfolio’s investment universe in an effort to improve performance. In addition to reviewing each Portfolio’s performance and the profitability analysis of the Adviser, the Directors considered possible economies of scale, but did not believe material economies of scale to be present in light of the Portfolios’ asset size and growth trends.
In their deliberations, the Directors considered all factors they believed relevant, including the following: information comparing the performance of each of the Portfolios to other investment companies with similar investment objectives and to each Portfolio’s respective unmanaged index; the nature, extent and quality of services rendered by the Adviser; the costs borne by, and profitability of, and other benefits to, the Adviser and its affiliates in providing services to each Portfolio; comparative fee and expense data for each Portfolio and other investment companies with similar investment objectives (having been advised that the Adviser does not manage other accounts with investment objectives and strategies similar to those of the Portfolios except private investment funds with fee structures that include performance fees); whether expenses of NGF, NAGF and NSCGF might be expected to decline as a percentage of net assets as NGF, NAGF and NSCGF assets increase (although there had not been a significant increase in assets over the previous year); the professional experience and qualifications of each Portfolio’s management team and other personnel of the Adviser, including the fact that a high caliber of personnel was both needed and provided to meet the needs of NGF, NAGF and NSCGF specifically with respect to investments in securities sold short; and the terms of the Advisory Agreement. The Independent Directors confirmed that they had received adequate information to make a reasonable determination with respect to the approval of the Advisory Agreement. After full consideration of all the foregoing factors, the Board concluded that renewal of the Advisory Agreement was in the best interests of each Portfolio and its shareholders.
Item 2. Code of Ethics.
The registrant has adopted a code of ethics that applies to the registrant’s principal executive officer and principal financial officer. The registrant has made amendments to its code of ethics during the period covered by this report. The registrant has not granted any waivers from any provisions of the code of ethics during the period covered by this report.
A copy of the registrant’s Code of Ethics is filed herewith.
Item 3. Audit Committee Financial Expert.
The registrant’s board of directors has determined that there is at least one audit committee financial expert serving on its audit committee. F. Randall Smith is the “audit committee financial expert” and is considered to be “independent” as each term is defined in Item 3 of Form N-CSR.
Item 4. Principal Accountant Fees and Services.
The registrant has engaged its principal accountant to perform audit services, audit-related services, tax services and other services during the past two fiscal years. “Audit services” refer to performing an audit of the registrant's annual financial statements or services that are normally provided by the accountant in connection with statutory and regulatory filings or engagements for those fiscal years. “Audit-related services” refer to the assurance and related services by the principal accountant that are reasonably related to the performance of the audit. “Tax services” refer to professional services rendered by the principal accountant for tax compliance, tax advice, and tax planning. “Other services” provided by the principal accountant were not applicable. The following table details the aggregate fees billed or expected to be billed for each of the last two fiscal years for audit fees, audit-related fees, tax fees and other fees by the principal accountant.
The audit committee has adopted pre-approval policies and procedures that require the audit committee to pre-approve all audit and non-audit services of the registrant, including services provided to any entity affiliated with the registrant.
The percentage of fees billed by KPMG LLP applicable to non-audit services pursuant to waiver of pre-approval requirement were as follows:
All of the principal accountant’s hours spent on auditing the registrant’s financial statements were attributed to work performed by full-time permanent employees of the principal accountant.
Item 5. Audit Committee of Listed Registrants.
Not applicable to registrants who are not listed issuers (as defined in Rule 10A-3 under the Securities Exchange Act of 1934).
Item 6. Investments.
Item 7. Disclosure of Proxy Voting Policies and Procedures for Closed-End Management Investment Companies.
Not applicable to open-end investment companies.
Item 8. Portfolio Managers of Closed-End Management Investment Companies.
Not applicable to open-end investment companies.
Item 9. Purchases of Equity Securities by Closed-End Management Investment Company and Affiliated Purchasers.
Not applicable to open-end investment companies.
Item 10. Submission of Matters to a Vote of Security Holders.
Not Applicable.
Item 11. Controls and Procedures.
Item 12. Exhibits.
Pursuant to the requirements of the Securities Exchange Act of 1934 and the Investment Company Act of 1940, the registrant has duly caused this report to be signed on its behalf by the undersigned, thereunto duly authorized.
George A. Needham, President (Chief Executive Officer)
Pursuant to the requirements of the Securities Exchange Act of 1934 and the Investment Company Act of 1940, this report has been signed below by the following persons on behalf of the registrant and in the capacities and on the dates indicated.
George A. Needham, President (Chief Executive Officer)