ANNUAL REPORT OCTOBER 31, 2012
| President’s Letter | 2 |
| Independent Chairman’s Letter | 3 |
| Market Perspective | 4 |
| Performance | 5 |
| Portfolio Commentary | 6 |
| Fund Characteristics | 8 |
| Shareholder Fee Example | 9 |
| Schedule of Investments | 11 |
| Statement of Assets and Liabilities | 14 |
| Statement of Operations | 15 |
| Statement of Changes in Net Assets | 16 |
| Notes to Financial Statements | 17 |
| Financial Highlights | 22 |
| Report of Independent Registered Public Accounting Firm | 23 |
| Management | 24 |
| Approval of Management Agreement | 27 |
| Additional Information | 32 |
Any opinions expressed in this report reflect those of the author as of the date of the report, and do not necessarily represent the opinions of American Century Investments® or any other person in the American Century Investments organization. Any such opinions are subject to change at any time based upon market or other conditions and American Century Investments disclaims any responsibility to update such opinions. These opinions may not be relied upon as investment advice and, because investment decisions made by American Century Investments funds are based on numerous factors, may not be relied upon as an indication of trading intent on behalf of any American Century Investments fund. Security examples are used for representational purposes only and are not intended as recommendations to purchase or sell securities. Performance information for comparative indices and securities is provided to American Century Investments by third party vendors. To the best of American Century Investments’ knowledge, such information is accurate at the time of printing.
Dear Investor:
Thank you for reviewing this annual report for the 12 months ended October 31, 2012. Our report offers investment performance, market analysis, and portfolio information, presented with the expert perspective of our portfolio management team.
This report remains one of our most important vehicles for conveying information about fund returns, including key factors that affected fund performance. For additional, updated insights, we encourage you to visit our website, americancentury.com.
Favorable Fiscal-Year Returns for Most U.S. Stock and Bond Benchmarks
In a period fraught with concerns about factors such as the global economic recovery, European financial system stability, and the U.S. political picture, the 12-month returns for U.S. investors were generally favorable.
Both U.S. stocks and bonds rallied for much of the period, with U.S. equities generally outperforming their non-U.S. counterparts. The S&P 500 Index advanced 15.21%, compared with 4.61% for the MSCI EAFE (Europe, Australasia, Far East) Index. The Barclays U.S. Aggregate Bond Index returned 5.25%, and the 10-year U.S. Treasury note returned 7.47%, according to Barclays.
As it turned out, the overseas setbacks and the coordinated monetary policy response provided by prominent central banks around the world ultimately proved beneficial to the U.S. capital markets. Both U.S. stocks and bonds generally benefited from global investors’ trust in the U.S. financial system and from declining interest rates, helped by central bank purchases of government securities. The 10-year U.S. Treasury yield fell to a record low during the period, finishing at 1.69%.
The U.S. economy showed signs of improvement during the fiscal year, particularly the long-depressed housing market. However, the outlook for 2013 remains guarded, as the fragile recovery remains vulnerable to fiscal and financial factors that could trigger further slowdowns and market volatility.
Under these conditions, we continue to believe in a disciplined, diversified, long-term investment approach, using both stocks and bonds—as appropriate—for meeting financial goals. We appreciate your continued trust in us in this challenging environment.
Sincerely,
Jonathan Thomas
President and Chief Executive Officer
American Century Investments
Independent Chairman’s Letter |
Don Pratt
Dear Fellow Shareholders,
The board has once again completed its annual review of the advisory contract between the American Century Investments mutual funds overseen by the board and the funds’ advisor, American Century Investment Management, Inc. This process, often referred to as the 15(c) review, involves the independent directors considering all of the material monitored throughout the year and evaluating a wide range of factors to determine whether the management fee paid by each fund to the advisor is reasonable.
The independent directors’ rationale for this decision is provided in detail in this, or in a previous, report. However, there are several highlights that should be of interest to all shareholders.
| • | Fund performance and client service continue to be rated among theindustry’s best. |
| • | Target date and other asset allocation products continue to successfully gather assets and industry acclaim. |
| • | Compliance programs continue to function successfully with no issues impacting shareholder interests. |
| • | Fees were found to be within an acceptable competitive range, with minor fee waivers being negotiated on five funds. |
Knowing that most shareholders are long term investors, the board was particularly pleased with our succession planning review. Talented professionals are being added within portfolio management and experienced managers have been added to the senior management team.
Overall it was a very positive review for the American Century Investments mutual funds during a challenging market environment.
Best personal regards,
Don Pratt
By David Hollond, Chief Investment Officer, U.S. Growth Equity—Mid & Small Cap
Stocks Gained Amid Volatility
The U.S. stock market generated positive results for the 12-month period ended October 31, 2012, although it endured significant volatility along the way. As the reporting period began, stocks were in the midst of a rebound. Investors grew optimistic as signs of improving economic activity quashed recession fears; in particular, job growth began to exceed expectations, driving the unemployment rate to its lowest level in three years by February 2012. Another positive factor was promising news out of Europe, as the European Central Bank provided favorable long-term financing to the debt markets and support for the Continent’s banking sector.
The optimism proved to be short-lived, as headwinds returned to the equity market. Evidence of slowing economic activity in the U.S. and adverse developments in Europe—including political turmoil in Greece and troubled banks in Spain—weighed on investor confidence, sending stocks down sharply.
Late in the period, stocks reversed course once again. The Federal Reserve announced a third round of quantitative easing measures, as well as an extension of its near-zero interest rate policy until 2015. The European Central Bank, meanwhile, announced a plan under which it would purchase bonds to support financially troubled debt markets in Europe. These measures, as well as others taken by central banks around the world, helped to restore investor confidence and drive markets upward, despite some concerns about slowing corporate profits and the looming U.S. fiscal cliff.
As the table below illustrates, large-cap issues generated the strongest returns for the reporting period, outpacing mid- and small-cap shares. Value stocks outpaced growth shares across the market capitalization spectrum.
From a sector perspective, all sectors within the Russell 3000 Index delivered positive results; the telecommunication services sector fared the best. Health care, financials, consumer discretionary, and consumer staples all finished ahead of the Russell 3000 Index. On the other side, the energy and information technology sectors achieved more moderate gains.
| U.S. Stock Index Returns |
| For the 12 months ended October 31, 2012 |
| Russell 1000 Index (Large-Cap) | 14.97% | | Russell 2000 Index (Small-Cap) | 12.08% |
| Russell 1000 Growth Index | 13.02% | | Russell 2000 Growth Index | 9.70% |
| Russell 1000 Value Index | 16.89% | | Russell 2000 Value Index | 14.47% |
| Russell Midcap Index | 12.15% | | |
| Russell Midcap Growth Index | 9.09% | | | |
| Russell Midcap Value Index | 14.99% | | | |
| Total Returns as of October 31, 2012 |
| | | | Average Annual Returns | |
| | Ticker Symbol | 1 year | 5 years | 10 years | Since Inception | Inception Date |
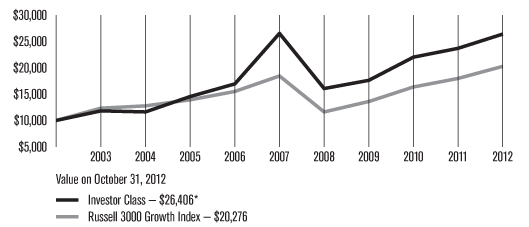
| Investor Class | AMVIX | 12.03% | -5.38% | 6.40% | 2.65% | 11/30/99 |
| Russell 3000 Index | — | 14.75% | 0.59% | 7.47% | 2.67% | — |
| Institutional Class | AVDIX | 12.18% | -5.18% | 6.60% | 1.32% | 8/1/00 |
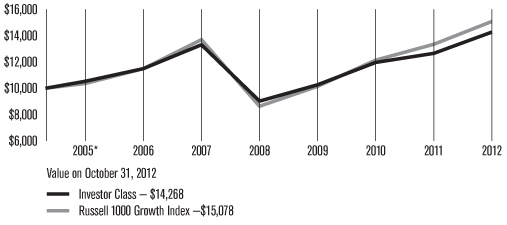
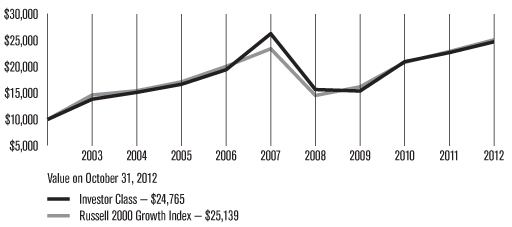
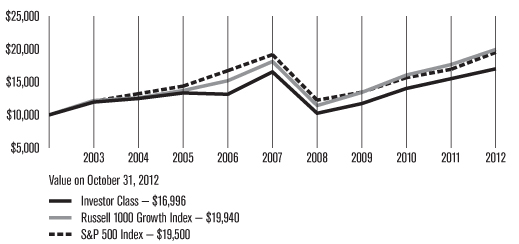
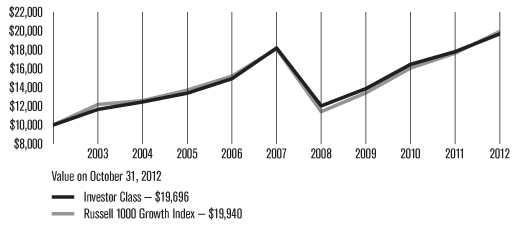
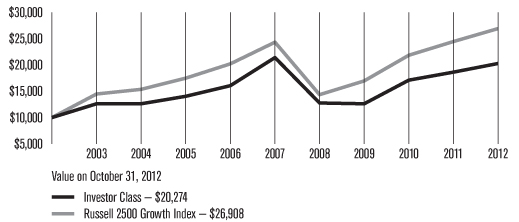
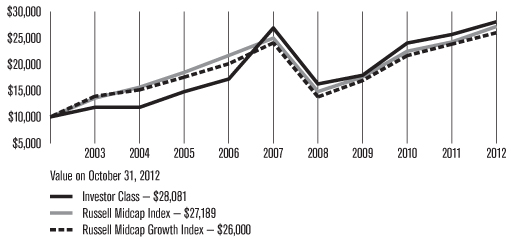
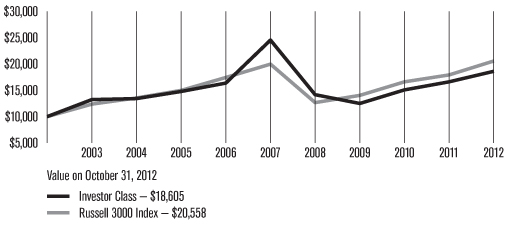
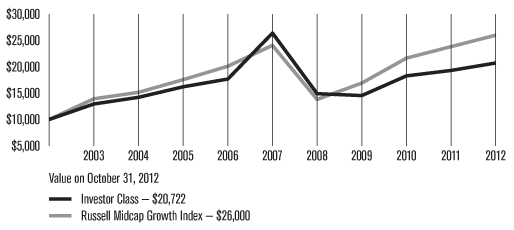
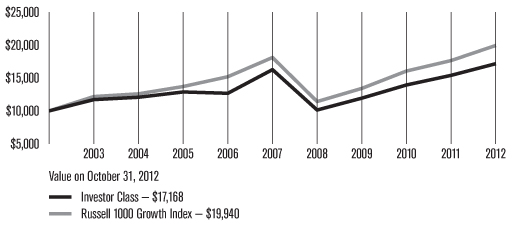
| Growth of $10,000 Over 10 Years |
| $10,000 investment made October 31, 2002 |
| Total Annual Fund Operating Expenses |
| Investor Class | Institutional Class |
| 1.25% | 1.05% |
The total annual fund operating expenses shown is as stated in the fund’s prospectus current as of the date of this report. The prospectus may vary from the expense ratio shown elsewhere in this report because it is based on a different time period, includes acquired fund fees and expenses, and, if applicable, does not include fee waivers or expense reimbursements.
Data presented reflect past performance. Past performance is no guarantee of future results. Current performance may be higher or lower than the performance shown. Investment return and principal value will fluctuate, and redemption value may be more or less than original cost. To obtain performance data current to the most recent month end, please call 1-800-345-2021 or visit americancentury.com. The fund’s investment process may result in high portfolio turnover, which could mean high transaction costs, affecting both performance and capital gains tax liabilities to investors. International investing involves special risks, such as political instability and currency fluctuations. Investing in emerging markets may accentuate these risks.
Unless otherwise indicated, performance reflects Investor Class shares; performance for other share classes will vary due to differences in fee structure. For information about other share classes available, please consult the prospectus. Data assumes reinvestment of dividends and capital gains, and none of the charts reflect the deduction of taxes that a shareholder would pay on fund distributions or the redemption of fund shares. Returns for the index are provided for comparison. The fund’s total returns include operating expenses (such as transaction costs and management fees) that reduce returns, while the total returns of the index do not.
Portfolio Managers: John Small, Jr. and Stephen Pool
Performance Summary
Veedot returned 12.03%* for the 12 months ended October 31, 2012, compared with its benchmark, the Russell 3000 Index, which returned 14.75% for the period.
As discussed in the Market Perspective on page 4, equity indices generally gained during the reporting period, although they struggled with the ongoing challenges of a tepid global economic recovery and continued sovereign debt concerns in Europe. Price momentum, a factor that the Veedot team looks for in portfolio holdings, came in and out of favor against a backdrop of high volatility during the reporting period. In this environment, Veedot’s highly systematic investment process delivered positive portfolio returns but lagged its benchmark.
Within the portfolio, stock selection in the information technology, industrials, and energy sectors accounted for the bulk of underperformance relative to Veedot’s benchmark. Those relative losses were partially offset by relative gains in the health care, materials, and consumer staples sectors.
Information Technology Drove Underperformance
The information technology sector was the largest source of Veedot’s underperformance relative to the benchmark, and the only sector from which the portfolio derived negative absolute results. Within the sector, a position in Japanese lens and camera manufacturer Canon detracted as the company’s performance lagged the market.
Within the software industry group, the portfolio held a position in Mitek Systems, a provider of Remote Deposit Capture used in mobile check deposit and other applications. The company’s share price sank in the period as it became involved in a lawsuit regarding patent infringement. Elsewhere in the sector, positioning in the computers and peripherals group detracted from performance versus the benchmark.
Also in the sector, though, China-based SouFun Holdings contributed. The company, which operates a real estate internet portal, increased its guidance for 2012 earnings.
Industrials, Energy Lagged
Within the industrials sector, a position in Pitney Bowes detracted from relative results. The provider of integrated mail services and processing equipment reported disappointing earnings as mail volume declined in favor of digital alternatives. Holdings in the air freight and logistics group also detracted, including an overweight stake in C.H. Robinson Worldwide, whose earnings declined as higher oil prices squeezed profit margins.
In the energy sector, underperformance was largely attributable to the oil, gas, and consumable fuels group. Here, the portfolio held positions in several non-benchmark companies that underperformed.
*All fund returns referenced in this commentary are for Investor Class shares.
Health Care, Materials, Consumer Staples Contributed
In the health care sector, the portfolio held an overweight stake in biotechnology company Pharmasset, which represented the largest individual contributor to relative returns. The maker of drugs for the treatment of Chronic Hepatitis C virus (HCV) was acquired by Gilead Sciences at a substantial premium over the company’s share price before the acquisition deal was struck. An overweight position in biopharmaceutical company Pharmacyclics also added meaningfully to performance versus the benchmark. The developer of blood cancer treatments reported better-than-expected earnings and saw a significant jump in its share price.
The materials sector was a source of relative outperformance. Here, Veedot held a number of positions in the metals and mining group that outpaced benchmark returns. In the chemicals group, the portfolio was rewarded for an overweight stake in Flotek Industries. The supplier of drilling and production-related services grew revenues and delivered better-than-expected earnings as it benefited from rising oil prices.
Within the consumer staples sector, retailer Wal-Mart contributed to absolute and relative returns. The company’s earnings rose as it attracted price-conscious shoppers in a difficult economic environment. Holdings in the food products group also added meaningfully to relative results.
Outlook
Using a systematic and technically-driven process, Veedot focuses on finding companies whose fundamental characteristics meet strict requirements for accelerating earnings and revenue growth. Such companies must also have historical stock price performance that suggests impending share price appreciation.
During the reporting period, conditions for growth and momentum oriented investment styles remained difficult, but showed signs of improvement. In this environment, the Veedot portfolio delivered solid results. Looking ahead, we remain confident that our systematic process of identifying companies with accelerating growth and price momentum will continue to successfully identify opportunities across industry sectors.
| OCTOBER 31, 2012 | |
| Top Ten Holdings | % of net assets |
| Wal-Mart Stores, Inc. | 3.3% |
| Ocwen Financial Corp. | 1.8% |
| Lockheed Martin Corp. | 1.4% |
| Abbott Laboratories | 1.3% |
| SouFun Holdings Ltd. ADR | 1.3% |
| Childrens Place Retail Stores, Inc. (The) | 1.3% |
| McKesson Corp. | 1.3% |
| UGI Corp. | 1.3% |
| Plains All American Pipeline LP | 1.3% |
| CNO Financial Group, Inc. | 1.2% |
| | |
| Top Five Industries | % of net assets |
| Oil, Gas and Consumable Fuels | 11.2% |
| Health Care Providers and Services | 7.8% |
| Food and Staples Retailing | 6.0% |
| Semiconductors and Semiconductor Equipment | 5.8% |
| Aerospace and Defense | 5.3% |
| | |
| Types of Investments in Portfolio | % of net assets |
| Domestic Common Stocks | 85.1% |
| Foreign Common Stocks* | 14.1% |
| Total Common Stocks | 99.2% |
| Temporary Cash Investments | 1.2% |
| Other Assets and Liabilities | (0.4)% |
*Includes depositary shares, dual listed securities and foreign ordinary shares.
Fund shareholders may incur two types of costs: (1) transaction costs, including sales charges (loads) on purchase payments and redemption/exchange fees; and (2) ongoing costs, including management fees; distribution and service (12b-1) fees; and other fund expenses. This example is intended to help you understand your ongoing costs (in dollars) of investing in your fund and to compare these costs with the ongoing cost of investing in other mutual funds.
The example is based on an investment of $1,000 made at the beginning of the period and held for the entire period from May 1, 2012 to October 31, 2012.
Actual Expenses
The table provides information about actual account values and actual expenses for each class. You may use the information, together with the amount you invested, to estimate the expenses that you paid over the period. First, identify the share class you own. Then simply divide your account value by $1,000 (for example, an $8,600 account value divided by $1,000 = 8.6), then multiply the result by the number under the heading “Expenses Paid During Period” to estimate the expenses you paid on your account during this period.
If you hold Investor Class shares of any American Century Investments fund, or Institutional Class shares of the American Century Diversified Bond Fund, in an American Century Investments account (i.e., not a financial intermediary or retirement plan account), American Century Investments may charge you a $12.50 semiannual account maintenance fee if the value of those shares is less than $10,000. We will redeem shares automatically in one of your accounts to pay the $12.50 fee. In determining your total eligible investment amount, we will include your investments in all personal accounts (including American Century Investments Brokerage accounts) registered under your Social Security number. Personal accounts include individual accounts, joint accounts, UGMA/UTMA accounts, personal trusts, Coverdell Education Savings Accounts and IRAs (including traditional, Roth, Rollover, SEP-, SARSEP- and SIMPLE-IRAs), and certain other retirement accounts. If you have only business, business retirement, employer-sponsored or American Century Investments Brokerage accounts, you are currently not subject to this fee. If you are subject to the Account Maintenance Fee, your account value could be reduced by the fee amount.
Hypothetical Example for Comparison Purposes
The table also provides information about hypothetical account values and hypothetical expenses based on the actual expense ratio of each class of your fund and an assumed rate of return of 5% per year before expenses, which is not the actual return of a fund’s share class. The hypothetical account values and expenses may not be used to estimate the actual ending account balance or expenses you paid for the period. You may use this information to compare the ongoing costs of investing in your fund and other funds. To do so, compare this 5% hypothetical example with the 5% hypothetical examples that appear in the shareholder reports of the other funds.
Please note that the expenses shown in the table are meant to highlight your ongoing costs only and do not reflect any transactional costs, such as sales charges (loads) or redemption/exchange fees. Therefore, the table is useful in comparing ongoing costs only, and will not help you determine the relative total costs of owning different funds. In addition, if these transactional costs were included, your costs would have been higher.
| | Beginning Account Value 5/1/12 | Ending Account Value 10/31/12 | Expenses Paid During Period(1) 5/1/12 – 10/31/12 | Annualized Expense Ratio(1) |
| Actual | | | | |
| Investor Class | $1,000 | $1,020.70 | $6.45 | 1.27% |
| Institutional Class | $1,000 | $1,021.80 | $5.44 | 1.07% |
| Hypothetical | | | | |
| Investor Class | $1,000 | $1,018.75 | $6.44 | 1.27% |
| Institutional Class | $1,000 | $1,019.76 | $5.43 | 1.07% |
| (1) | Expenses are equal to the class’s annualized expense ratio listed in the table above, multiplied by the average account value over the period, multiplied by 184, the number of days in the most recent fiscal half-year, divided by 366, to reflect the one-half year period. |
| | | Shares | | | Value | |
| Common Stocks — 99.2% | |
| AEROSPACE AND DEFENSE — 5.3% | |
| Boeing Co. (The) | | | 10,167 | | | | $716,163 | |
| General Dynamics Corp. | | | 11,600 | | | | 789,728 | |
| Lockheed Martin Corp. | | | 10,877 | | | | 1,018,849 | |
| Northrop Grumman Corp. | | | 9,551 | | | | 656,058 | |
| Raytheon Co. | | | 11,369 | | | | 643,031 | |
| | | | | | | | 3,823,829 | |
| AIR FREIGHT AND LOGISTICS — 1.0% | |
| United Parcel Service, Inc., Class B | | | 10,206 | | | | 747,589 | |
| AIRLINES — 1.0% | |
Alaska Air Group, Inc.(1) | | | 19,849 | | | | 759,026 | |
| BIOTECHNOLOGY — 0.5% | |
Medivation, Inc.(1) | | | 6,583 | | | | 336,523 | |
| COMMERCIAL BANKS — 1.9% | |
Banco Macro SA ADR(1) | | | 51,952 | | | | 701,871 | |
| Bank of Hawaii Corp. | | | 7,710 | | | | 340,474 | |
| F.N.B. Corp. | | | 30,653 | | | | 328,907 | |
| | | | | | | | 1,371,252 | |
| COMMERCIAL SERVICES AND SUPPLIES — 2.6% | |
Portfolio Recovery Associates, Inc.(1) | | | 4,216 | | | | 441,204 | |
Stericycle, Inc.(1) | | | 7,808 | | | | 739,886 | |
| Waste Management, Inc. | | | 20,662 | | | | 676,474 | |
| | | | | | | | 1,857,564 | |
| COMMUNICATIONS EQUIPMENT — 1.1% | |
Arris Group, Inc.(1) | | | 44,817 | | | | 615,786 | |
Research In Motion Ltd.(1) | | | 21,710 | | | | 172,160 | |
| | | | | | | | 787,946 | |
| COMPUTERS AND PERIPHERALS — 3.3% | |
| Apple, Inc. | | | 1,214 | | | | 722,452 | |
| Dell, Inc. | | | 78,574 | | | | 725,238 | |
| Hewlett-Packard Co. | | | 38,834 | | | | 537,851 | |
| Seagate Technology plc | | | 14,454 | | | | 394,883 | |
| | | | | | | | 2,380,424 | |
| CONSUMER FINANCE — 0.8% | |
Credit Acceptance Corp.(1) | | | 7,543 | | | | 615,886 | |
| DIVERSIFIED FINANCIAL SERVICES — 1.1% | |
PHH Corp.(1) | | | 36,843 | | | | 766,703 | |
| DIVERSIFIED TELECOMMUNICATION SERVICES — 0.9% | |
| BCE, Inc. | | | 12,442 | | | | 543,218 | |
| Neutral Tandem, Inc. | | | 23,429 | | | | 108,242 | |
| | | | | | | | 651,460 | |
| ELECTRIC UTILITIES — 1.4% | |
| NextEra Energy, Inc. | | | 9,750 | | | | 683,085 | |
| Southern Co. | | | 7,497 | | | | 351,159 | |
| | | | | | | | 1,034,244 | |
| ELECTRICAL EQUIPMENT — 1.1% | |
| Emerson Electric Co. | | | 16,045 | | | | 777,059 | |
| ELECTRONIC EQUIPMENT, INSTRUMENTS AND COMPONENTS — 2.0% | |
SYNNEX Corp.(1) | | | 22,947 | | | | 743,253 | |
| TE Connectivity Ltd. | | | 22,565 | | | | 726,142 | |
| | | | | | | | 1,469,395 | |
| FOOD AND STAPLES RETAILING — 6.0% | |
| CVS Caremark Corp. | | | 18,263 | | | | 847,403 | |
| Safeway, Inc. | | | 19,858 | | | | 323,884 | |
| Wal-Mart Stores, Inc. | | | 31,500 | | | | 2,363,130 | |
| Walgreen Co. | | | 24,000 | | | | 845,520 | |
| | | | | | | | 4,379,937 | |
| FOOD PRODUCTS — 2.9% | |
| Campbell Soup Co. | | | 20,672 | | | | 729,101 | |
| General Mills, Inc. | | | 20,489 | | | | 821,199 | |
| Kellogg Co. | | | 10,403 | | | | 544,285 | |
| | | | | | | | 2,094,585 | |
| GAS UTILITIES — 1.3% | |
| UGI Corp. | | | 28,623 | | | | 924,237 | |
| HEALTH CARE EQUIPMENT AND SUPPLIES — 1.0% | |
| Becton, Dickinson and Co. | | | 9,653 | | | | 730,539 | |
| HEALTH CARE PROVIDERS AND SERVICES — 7.8% | |
| AmerisourceBergen Corp. | | | 19,904 | | | | 785,014 | |
Amsurg Corp.(1) | | | 11,713 | | | | 334,055 | |
| Cardinal Health, Inc. | | | 20,758 | | | | 853,776 | |
| Humana, Inc. | | | 10,664 | | | | 792,015 | |
| McKesson Corp. | | | 9,951 | | | | 928,528 | |
Tenet Healthcare Corp.(1) | | | 14,806 | | | | 349,422 | |
| UnitedHealth Group, Inc. | | | 14,130 | | | | 791,280 | |
| WellPoint, Inc. | | | 13,335 | | | | 817,169 | |
| | | | | | | | 5,651,259 | |
| HOTELS, RESTAURANTS AND LEISURE — 1.4% | |
| McDonald’s Corp. | | | 8,144 | | | | 706,899 | |
Multimedia Games Holding Co., Inc.(1) | | | 17,395 | | | | 276,581 | |
| | | | | | | | 983,480 | |
| HOUSEHOLD DURABLES — 1.0% | |
PulteGroup, Inc.(1) | | | 42,380 | | | | 734,869 | |
| INSURANCE — 5.0% | |
| ACE Ltd. | | | 9,242 | | | | 726,883 | |
Alleghany Corp.(1) | | | 2,158 | | | | 750,121 | |
| CNO Financial Group, Inc. | | | 94,548 | | | | 905,770 | |
| | | | | | | | | |
| | | | Shares | | | | Value | |
| Marsh & McLennan Cos., Inc. | | | 19,953 | | | | $679,001 | |
| MetLife, Inc. | | | 9,124 | | | | 323,811 | |
| Unum Group | | | 10,730 | | | | 217,604 | |
| | | | | | | | 3,603,190 | |
| INTERNET SOFTWARE AND SERVICES — 2.1% | |
Demand Media, Inc.(1) | | | 25,403 | | | | 216,688 | |
| SouFun Holdings Ltd. ADR | | | 53,734 | | | | 970,973 | |
ValueClick, Inc.(1) | | | 19,025 | | | | 317,147 | |
| | | | | | | | 1,504,808 | |
| IT SERVICES — 2.0% | |
CACI International, Inc., Class A(1) | | | 11,405 | | | | 575,154 | |
| International Business Machines Corp. | | | 1,635 | | | | 318,056 | |
| MAXIMUS, Inc. | | | 9,837 | | | | 542,806 | |
| | | | | | | | 1,436,016 | |
| LEISURE EQUIPMENT AND PRODUCTS — 0.7% | |
Smith & Wesson Holding Corp.(1) | | | 51,551 | | | | 494,890 | |
| MACHINERY — 1.0% | |
| Caterpillar, Inc. | | | 8,573 | | | | 727,076 | |
| MEDIA — 3.4% | |
| Cablevision Systems Corp., Class A | | | 35,343 | | | | 615,675 | |
Madison Square Garden Co. (The), Class A(1) | | | 12,545 | | | | 516,352 | |
| Time Warner Cable, Inc. | | | 5,474 | | | | 542,528 | |
| Viacom, Inc., Class B | | | 15,630 | | | | 801,350 | |
| | | | | | | | 2,475,905 | |
| METALS AND MINING — 3.6% | |
| AngloGold Ashanti Ltd. ADR | | | 18,383 | | | | 624,654 | |
| Barrick Gold Corp. | | | 19,401 | | | | 785,741 | |
New Gold, Inc.(1) | | | 49,555 | | | | 581,280 | |
| Newmont Mining Corp. | | | 11,115 | | | | 606,323 | |
| | | | | | | | 2,597,998 | |
| MULTI-UTILITIES — 1.2% | |
| Consolidated Edison, Inc. | | | 12,148 | | | | 733,496 | |
| MDU Resources Group, Inc. | | | 7,725 | | | | 167,864 | |
| | | | | | | | 901,360 | |
| MULTILINE RETAIL — 2.8% | |
Dollar General Corp.(1) | | | 15,835 | | | | 769,898 | |
| Macy’s, Inc. | | | 12,267 | | | | 467,004 | |
| Target Corp. | | | 11,968 | | | | 762,960 | |
| | | | | | | | 1,999,862 | |
| OIL, GAS AND CONSUMABLE FUELS — 11.2% | |
| BreitBurn Energy Partners LP | | | 38,035 | | | | 766,786 | |
| Chevron Corp. | | | 7,594 | | | | 836,935 | |
Cloud Peak Energy, Inc.(1) | | | 4,192 | | | | 88,451 | |
| Devon Energy Corp. | | | 11,384 | | | | 662,663 | |
| Enerplus Corp. | | | 41,363 | | | | 665,117 | |
| Exxon Mobil Corp. | | | 9,588 | | | | 874,138 | |
| Kinder Morgan Energy Partners LP | | | 2,904 | | | | 242,949 | |
| Kinder Morgan, Inc. | | | 20,780 | | | | 721,274 | |
| MarkWest Energy Partners LP | | | 7,191 | | | | 389,968 | |
| Occidental Petroleum Corp. | | | 8,570 | | | | 676,687 | |
| Plains All American Pipeline LP | | | 20,032 | | | | 909,052 | |
SandRidge Energy, Inc.(1) | | | 111,951 | | | | 696,335 | |
| Valero Energy Corp. | | | 11,002 | | | | 320,158 | |
| Vanguard Natural Resources LLC | | | 7,852 | | | | 233,361 | |
| | | | | | | | 8,083,874 | |
| PHARMACEUTICALS — 1.3% | |
| Abbott Laboratories | | | 14,928 | | | | 978,083 | |
| REAL ESTATE INVESTMENT TRUSTS (REITs) — 5.0% | |
| BioMed Realty Trust, Inc. | | | 31,634 | | | | 604,842 | |
| Campus Crest Communities, Inc. | | | 68,371 | | | | 758,235 | |
| CommonWealth REIT | | | 7,504 | | | | 102,880 | |
| DuPont Fabros Technology, Inc. | | | 30,502 | | | | 654,573 | |
| Essex Property Trust, Inc. | | | 4,972 | | | | 745,800 | |
| Regency Centers Corp. | | | 15,415 | | | | 740,228 | |
| | | | | | | | 3,606,558 | |
| SEMICONDUCTORS AND SEMICONDUCTOR EQUIPMENT — 5.8% | |
| Applied Materials, Inc. | | | 68,010 | | | | 720,906 | |
| Cabot Microelectronics Corp. | | | 24,227 | | | | 721,965 | |
| Intel Corp. | | | 33,927 | | | | 733,671 | |
| STMicroelectronics NV | | | 100,549 | | | | 592,234 | |
| Taiwan Semiconductor Manufacturing Co. Ltd. ADR | | | 46,714 | | | | 742,753 | |
| United Microelectronics Corp. ADR | | | 380,906 | | | | 716,103 | |
| | | | | | | | 4,227,632 | |
| SOFTWARE — 1.0% | |
| Microsoft Corp. | | | 26,764 | | | | 763,711 | |
| SPECIALTY RETAIL — 3.2% | |
Childrens Place Retail Stores, Inc. (The)(1) | | | 16,343 | | | | 954,922 | |
Genesco, Inc.(1) | | | 11,013 | | | | 631,045 | |
| Ross Stores, Inc. | | | 11,931 | | | | 727,194 | |
| | | | | | | | 2,313,161 | |
| THRIFTS AND MORTGAGE FINANCE — 1.8% | |
Ocwen Financial Corp.(1) | | | 33,007 | | | | 1,273,080 | |
| TOBACCO — 1.0% | |
| Lorillard, Inc. | | | 6,323 | | | | 733,531 | |
| WIRELESS TELECOMMUNICATION SERVICES — 1.7% | |
| China Mobile Ltd. ADR | | | 15,456 | | | | $856,108 | |
| VimpelCom Ltd. ADR | | | 36,273 | | | | 399,728 | |
| | | | | | | | 1,255,836 | |
TOTAL COMMON STOCKS (Cost $69,716,638) | | | | 71,854,377 | |
| Temporary Cash Investments — 1.2% | |
Repurchase Agreement, Bank of America Merrill Lynch, (collateralized by various U.S. Treasury obligations, 1.50% – 2.00%, 1/31/16 – 6/30/16, valued at $374,074), in a joint trading account at 0.23%, dated 10/31/12, due 11/1/12 (Delivery value $366,536) | | | | 366,534 | |
Repurchase Agreement, Credit Suisse First Boston, Inc., (collateralized by various U.S. Treasury obligations, 3.125% – 3.75%, 8/15/41 – 2/15/42, valued at $374,944), in a joint trading account at 0.20%, dated 10/31/12, due 11/1/12 (Delivery value $366,536) | | | | 366,534 | |
Repurchase Agreement, Goldman Sachs & Co., (collateralized by various U.S. Treasury obligations, 4.625%, 2/15/40, valued at $155,701), in a joint trading account at 0.16%, dated 10/31/12, due 11/1/12 (Delivery value $152,675) | | | | 152,674 | |
TOTAL TEMPORARY CASH INVESTMENTS (Cost $885,742) | | | | 885,742 | |
TOTAL INVESTMENT SECURITIES — 100.4% (Cost $70,602,380) | | | | 72,740,119 | |
| OTHER ASSETS AND LIABILITIES — (0.4)% | | | | (270,584 | ) |
| TOTAL NET ASSETS — 100.0% | | | | $72,469,535 | |
| Geographic Diversification |
| (as a % of net assets) | |
| United States | 85.1% |
| Canada | 3.7% |
| Switzerland | 2.8% |
| Taiwan (Republic of China) | 2.0% |
| People’s Republic of China | 1.4% |
| Hong Kong | 1.2% |
| Argentina | 1.0% |
| South Africa | 0.9% |
| Ireland | 0.6% |
| Netherlands | 0.5% |
| Cash and Equivalents* | 0.8% |
*Includes temporary cash investments and other assets and liabilities.
Notes to Schedule of Investments
ADR = American Depositary Receipt
See Notes to Financial Statements.
Statement of Assets and Liabilities |
| OCTOBER 31, 2012 | |
| Assets | |
| Investment securities, at value (cost of $70,602,380) | | | $72,740,119 | |
| Receivable for investments sold | | | 9,104,491 | |
| Receivable for capital shares sold | | | 7,109 | |
| Dividends and interest receivable | | | 85,235 | |
| | | | 81,936,954 | |
| | | | | |
| Liabilities | | | | |
| Payable for investments purchased | | | 9,016,026 | |
| Payable for capital shares redeemed | | | 366,396 | |
| Accrued management fees | | | 78,205 | |
| Other liabilities | | | 6,792 | |
| | | | 9,467,419 | |
| | | | | |
| Net Assets | | | $72,469,535 | |
| | | | | |
| Net Assets Consist of: | | | | |
| Capital (par value and paid-in surplus) | | | $94,166,871 | |
| Undistributed net investment income | | | 893,721 | |
| Accumulated net realized loss | | | (24,728,796 | ) |
| Net unrealized appreciation | | | 2,137,739 | |
| | | | $72,469,535 | |
| | Net assets | Shares outstanding | Net asset value per share |
| Investor Class, $0.01 Par Value | $72,311,094 | 10,484,605 | $6.90 |
| Institutional Class, $0.01 Par Value | $158,441 | 22,545 | $7.03 |
See Notes to Financial Statements.
| YEAR ENDED OCTOBER 31, 2012 | |
| Investment Income (Loss) | |
| Income: | | | |
| Dividends (net of foreign taxes withheld of $30,473) | | | $1,964,678 | |
| Interest | | | 568 | |
| | | | 1,965,246 | |
| | | | | |
| Expenses: | | | | |
| Management fees | | | 941,318 | |
| Directors’ fees and expenses | | | 2,770 | |
| Other expenses | | | 7,358 | |
| | | | 951,446 | |
| | | | | |
| Net investment income (loss) | | | 1,013,800 | |
| | | | | |
| Realized and Unrealized Gain (Loss) | | | | |
| Net realized gain (loss) on: | | | | |
| Investment transactions | | | 5,596,664 | |
| Foreign currency transactions | | | 5,053 | |
| | | | 5,601,717 | |
| | | | | |
| Change in net unrealized appreciation (depreciation) on investments | | | 1,553,975 | |
| | | | | |
| Net realized and unrealized gain (loss) | | | 7,155,692 | |
| | | | | |
| Net Increase (Decrease) in Net Assets Resulting from Operations | | | $8,169,492 | |
See Notes to Financial Statements.
Statement of Changes in Net Assets |
| YEARS ENDED OCTOBER 31, 2012 AND OCTOBER 31, 2011 | |
| Increase (Decrease) in Net Assets | | October 31, 2012 | | | October 31, 2011 | |
| Operations | |
| Net investment income (loss) | | | $1,013,800 | | | | $661,634 | |
| Net realized gain (loss) | | | 5,601,717 | | | | 20,605,823 | |
| Change in net unrealized appreciation (depreciation) | | | 1,553,975 | | | | (12,997,900 | ) |
| Net increase (decrease) in net assets resulting from operations | | | 8,169,492 | | | | 8,269,557 | |
| | | | | | | | | |
| Distributions to Shareholders | | | | | | | | |
| From net investment income: | | | | | | | | |
| Investor Class | | | (1,049,869 | ) | | | (95,981 | ) |
| Institutional Class | | | (2,838 | ) | | | (9,897 | ) |
| Decrease in net assets from distributions | | | (1,052,707 | ) | | | (105,878 | ) |
| | | | | | | | | |
| Capital Share Transactions | | | | | | | | |
| Net increase (decrease) in net assets from capital share transactions | | | (7,672,085 | ) | | | (16,567,847 | ) |
| | | | | | | | | |
| Redemption Fees | | | | | | | | |
| Increase in net assets from redemption fees | | | 4,869 | | | | 2,072 | |
| | | | | | | | | |
| Net increase (decrease) in net assets | | | (550,431 | ) | | | (8,402,096 | ) |
| | | | | | | | | |
| Net Assets | | | | | | | | |
| Beginning of period | | | 73,019,966 | | | | 81,422,062 | |
| End of period | | | $72,469,535 | | | | $73,019,966 | |
| | | | | | | | | |
| Undistributed net investment income | | | $893,721 | | | | $516,856 | |
See Notes to Financial Statements.
Notes to Financial Statements |
OCTOBER 31, 2012
1. Organization
American Century Mutual Funds, Inc. (the corporation) is registered under the Investment Company Act of 1940, as amended (the 1940 Act), as an open-end management investment company and is organized as a Maryland corporation. Veedot Fund (the fund) is one fund in a series issued by the corporation. The fund is nondiversified as defined under the 1940 Act. The fund’s investment objective is to seek long-term capital growth. The fund pursues its objective by using an approach to common stock investing developed by American Century Investments. This approach relies heavily on quantitative tools to identify attractive investment opportunities, regardless of company size, industry type or geographic location, on a disciplined, consistent basis.
The fund offers the Investor Class and the Institutional Class. The share classes differ principally in their respective distribution and shareholder servicing expenses and arrangements. The Institutional Class is made available to institutional shareholders or through financial intermediaries whose clients do not require the same level of shareholder and administrative services as shareholders of other classes. As a result, the Institutional Class is charged a lower unified management fee.
2. Significant Accounting Policies
The following is a summary of significant accounting policies consistently followed by the fund in preparation of its financial statements. The financial statements are prepared in conformity with accounting principles generally accepted in the United States of America, which may require management to make certain estimates and assumptions at the date of the financial statements. Actual results could differ from these estimates.
Investment Valuations — The fund determines the fair value of its investments and computes its net asset value per share as of the close of regular trading (usually 4 p.m. Eastern time) on the New York Stock Exchange (NYSE) on each day the NYSE is open.
Equity securities that are listed or traded on a domestic securities exchange are valued at the last reported sales price or at the official closing price as provided by the exchange. Equity securities traded on foreign securities exchanges are typically valued at the closing price on the exchange where primarily traded or as of the close of the NYSE, if that is earlier. If no last sales price is reported, or if local convention or regulation so provides, the mean of the latest bid and asked prices is used. Depending on local convention or regulation, securities traded over-the-counter are valued at the mean of the latest bid and asked prices, the last sales price, or the official closing price. In its determination of fair value, the fund may review several factors including: market information specific to a security; news developments in U.S. and foreign markets; the performance of particular U.S. and foreign securities, indices, comparable securities, American Depositary Receipts, Exchange-Traded Funds, and other relevant market indicators.
Debt securities maturing within 60 days at the time of purchase may be valued at cost, plus or minus any amortized discount or premium or at the evaluated mean as provided by an independent pricing service. Evaluated mean prices are commonly derived through utilization of market models, which may consider, among other factors, trade data, quotations from dealers and active market makers, relevant yield curve and spread data, related sector levels, creditworthiness, and other relevant market information on the same or comparable securities.
Investments in open-end management investment companies are valued at the reported net asset value per share. Repurchase agreements are valued at cost.
The value of investments initially expressed in foreign currencies is translated into U.S. dollars at prevailing exchange rates.
If the fund determines that the market price for a portfolio security is not readily available or the valuation methods mentioned above do not reflect a security’s fair value, such security is valued as determined in good faith by the Board of Directors or its designee, in accordance with procedures adopted by the Board of Directors. Circumstances that may cause the fund to use these procedures to value a security include, but are not limited to: a security has been declared in default; trading in a security has been halted during the trading day; there is a foreign market holiday and no trading occurred; or an event occurred between the close of a foreign exchange and the NYSE that may affect the value of a security.
Security Transactions — Security transactions are accounted for as of the trade date. Net realized gains and losses are determined on the identified cost basis, which is also used for federal income tax purposes.
Investment Income — Dividend income less foreign taxes withheld, if any, is recorded as of the ex-dividend date. Distributions received on securities that represent a return of capital or capital gain are recorded as a reduction of cost of investments and/or as a realized gain. The fund estimates the components of distributions received that may be considered nontaxable distributions or capital gain distributions for income tax purposes. Interest income is recorded on the accrual basis and includes accretion of discounts and amortization of premiums.
Foreign Currency Translations — All assets and liabilities initially expressed in foreign currencies are translated into U.S. dollars at prevailing exchange rates at period end. The fund may enter into spot foreign currency exchange contracts to facilitate transactions denominated in a foreign currency. Purchases and sales of investment securities, dividend and interest income, spot foreign currency exchange contracts, and expenses are translated at the rates of exchange prevailing on the respective dates of such transactions. Net realized and unrealized foreign currency exchange gains or losses related to investment securities are a component of net realized gain (loss) on investment transactions and change in net unrealized appreciation (depreciation) on investments, respectively.
Repurchase Agreements — The fund may enter into repurchase agreements with institutions that American Century Investment Management, Inc. (ACIM) (the investment advisor) has determined are creditworthy pursuant to criteria adopted by the Board of Directors. The fund requires that the collateral, represented by securities, received in a repurchase transaction be transferred to the custodian in a manner sufficient to enable the fund to obtain those securities in the event of a default under the repurchase agreement. ACIM monitors, on a daily basis, the securities transferred to ensure the value, including accrued interest, of the securities under each repurchase agreement is equal to or greater than amounts owed to the fund under each repurchase agreement.
Joint Trading Account — Pursuant to an Exemptive Order issued by the Securities and Exchange Commission, the fund, along with certain other funds in the American Century Investments family of funds, may transfer uninvested cash balances into a joint trading account. These balances are invested in one or more repurchase agreements that are collateralized by U.S. Treasury or Agency obligations.
Income Tax Status — It is the fund’s policy to distribute substantially all net investment income and net realized gains to shareholders and to otherwise qualify as a regulated investment company under provisions of the Internal Revenue Code. The fund is no longer subject to examination by tax authorities for years prior to 2009. At this time, management believes there are no uncertain tax positions which, based on their technical merit, would not be sustained upon examination and for which it is reasonably possible that the total amounts of unrecognized tax benefits will significantly change in the next twelve months. Accordingly, no provision has been made for federal or state income taxes.
Multiple Class — All shares of the fund represent an equal pro rata interest in the net assets of the class to which such shares belong, and have identical voting, dividend, liquidation and other rights and the same terms and conditions, except for class specific expenses and exclusive rights to vote on matters affecting only individual classes. Income, non-class specific expenses, and realized and unrealized capital gains and losses of the fund are allocated to each class of shares based on their relative net assets.
Distributions to Shareholders — Distributions from net investment income and net realized gains, if any, are generally declared and paid annually.
Redemption — The fund may impose a 2.00% redemption fee on shares held less than 60 days. The fee may not be applicable to all classes. The redemption fee is retained by the fund and helps cover transaction costs that long-term investors may bear when the fund sells securities to meet investor redemptions. Prior to November 14, 2011, the redemption fee applied to shares held less than 180 days.
Indemnifications — Under the corporation’s organizational documents, its officers and directors are indemnified against certain liabilities arising out of the performance of their duties to the fund. In addition, in the normal course of business, the fund enters into contracts that provide general indemnifications. The maximum exposure under these arrangements is unknown as this would involve future claims that may be made against a fund. The risk of material loss from such claims is considered by management to be remote.
3. Fees and Transactions with Related Parties
Management Fees — The corporation has entered into a management agreement with ACIM, under which ACIM provides the fund with investment advisory and management services in exchange for a single, unified management fee (the fee) per class. The agreement provides that all expenses of managing and operating the fund, except distribution and service fees, brokerage expenses, taxes, interest, fees and expenses of the independent directors (including legal counsel fees), and extraordinary expenses, will be paid by ACIM. The fee is computed and accrued daily based on each class’s daily net assets and paid monthly in arrears. The rate of the fee is determined by applying a fee rate calculation formula. This formula takes into account the fund’s assets as well as certain assets, if any, of other clients of the investment advisor outside the American Century Investments family of funds (such as subadvised funds and separate accounts) that have very similar investment teams and investment strategies (strategy assets). The annual management fee schedule ranges from 1.000% to 1.250% for the Investor Class. The Institutional Class is 0.200% less at each point within the range. The effective annual management fee for each class for the year ended October 31, 2012 was 1.25% and 1.05% for the Investor Class and Institutional Class, respectively.
Related Parties — Certain officers and directors of the corporation are also officers and/or directors of American Century Companies, Inc., the parent of the corporation’s investment advisor, ACIM, the distributor of the corporation, American Century Investment Services, Inc., and the corporation’s transfer agent, American Century Services, LLC.
4. Investment Transactions
Purchases and sales of investment securities, excluding short-term investments, for the year ended October 31, 2012 were $190,930,194 and $198,610,288, respectively.
5. Capital Share Transactions
Transactions in shares of the fund were as follows:
| | | Year ended October 31, 2012 | | | Year ended October 31, 2011 | |
| | | Shares | | | Amount | | | Shares | | | Amount | |
| Investor Class/Shares Authorized | | | 200,000,000 | | | | | | | 200,000,000 | | | | |
| Sold | | | 1,064,167 | | | | $7,149,708 | | | | 609,907 | | | | $3,792,990 | |
| Issued in reinvestment of distributions | | | 164,796 | | | | 1,018,441 | | | | 15,435 | | | | 93,224 | |
| Redeemed | | | (2,398,214 | ) | | | (15,808,396 | ) | | | (2,786,705 | ) | | | (17,345,567 | ) |
| | | | (1,169,251 | ) | | | (7,640,247 | ) | | | (2,161,363 | ) | | | (13,459,353 | ) |
| Institutional Class/Shares Authorized | | | 100,000,000 | | | | | | | | 100,000,000 | | | | | |
| Sold | | | 6,618 | | | | 44,677 | | | | 33,847 | | | | 215,520 | |
| Issued in reinvestment of distributions | | | 451 | | | | 2,838 | | | | 1,612 | | | | 9,897 | |
| Redeemed | | | (11,136 | ) | | | (79,353 | ) | | | (524,367 | ) | | | (3,333,911 | ) |
| | | | (4,067 | ) | | | (31,838 | ) | | | (488,908 | ) | | | (3,108,494 | ) |
| Net increase (decrease) | | | (1,173,318 | ) | | | $(7,672,085 | ) | | | (2,650,271 | ) | | | $(16,567,847 | ) |
6. Fair Value Measurements
The fund’s securities valuation process is based on several considerations and may use multiple inputs to determine the fair value of the positions held by the fund. In conformity with accounting principles generally accepted in the United States of America, the inputs used to determine a valuation are classified into three broad levels as follows:
| • | Level 1 valuation inputs consist of unadjusted quoted prices in an active market for identical securities; |
| • | Level 2 valuation inputs consist of direct or indirect observable market data (including quoted prices for similar securities, evaluations of subsequent market events, interest rates, prepayment speeds, credit risk, etc.); or |
| • | Level 3 valuation inputs consist of unobservable data (including a fund’s own assumptions). |
The level classification is based on the lowest level input that is significant to the fair valuation measurement. The valuation inputs are not necessarily an indication of the risks associated with investing in these securities or other financial instruments.
The following is a summary of the level classifications as of period end. The Schedule of Investments provides additional information on the fund’s portfolio holdings.
| | | Level 1 | | | Level 2 | | | Level 3 | |
| Investment Securities | |
| Domestic Common Stocks | | | $61,654,529 | | | | — | | | | — | |
| Foreign Common Stocks | | | 10,199,848 | | | | — | | | | — | |
| Temporary Cash Investments | | | — | | | | $885,742 | | | | — | |
| Total Value of Investment Securities | | | $71,854,377 | | | | $885,742 | | | | — | |
7. Risk Factors
The fund’s investment process may result in high portfolio turnover, which could mean high transaction costs, affecting both performance and capital gains tax liabilities to investors.
There are certain risks involved in investing in foreign securities. These risks include those resulting from future adverse political, social and economic developments, fluctuations in currency exchange rates, the possible imposition of exchange controls, and other foreign laws or restrictions. Investing in emerging markets may accentuate these risks.
8. Federal Tax Information
The tax character of distributions paid during the years ended October 31, 2012 and October 31, 2011 were as follows:
| | | 2012 | | | 2011 | |
| Distributions Paid From | | | | | | |
| Ordinary income | | | $1,052,707 | | | | $105,878 | |
| Long-term capital gains | | | — | | | | — | |
The book-basis character of distributions made during the year from net investment income or net realized gains may differ from their ultimate characterization for federal income tax purposes. These differences reflect the differing character of certain income items and net realized gains and losses for financial statement and tax purposes, and may result in reclassification among certain capital accounts on the financial statements.
As of October 31, 2012, the federal tax cost of investments and the components of distributable earnings on a tax-basis were as follows:
| Federal tax cost of investments | | | $70,658,268 | |
| Gross tax appreciation of investments | | | $4,373,769 | |
| Gross tax depreciation of investments | | | (2,291,918 | ) |
| Net tax appreciation (depreciation) of investments | | | $2,081,851 | |
| Undistributed ordinary income | | | $893,721 | |
| Accumulated short-term capital losses | | | $(24,672,908 | ) |
The difference between book-basis and tax-basis cost and unrealized appreciation (depreciation) is attributable primarily to the tax deferral of losses on wash sales.
Accumulated capital losses represent net capital loss carryovers that may be used to offset future realized capital gains for federal income tax purposes. Future capital loss carryover utilization in any given year may be subject to Internal Revenue Code limitations. Capital loss carryovers of $(1,988,145) and $(22,684,763) expire in 2017 and 2018, respectively.
| For a Share Outstanding Throughout the Years Ended October 31 (except as noted) | |
| Per-Share Data | | | Ratios and Supplemental Data | |
| | | | | | Income From Investment Operations: | | | | | | | | | | Ratio to Average Net Assets of: | | | | | | |
| | | Net Asset Value, Beginning of Period | | | Net Investment Income (Loss)(1) | | | Net Realized and Unrealized Gain (Loss) | | | Total From Investment Operations | | Distributions From Net Investment Income | | Net Asset Value, End of Period | | | Total Return(2) | | | Operating Expenses | | | Net Investment Income (Loss) | | Portfolio Turnover Rate | | Net Assets, End of Period (in thousands) | |
| Investor Class | |
| 2012 | | | $6.25 | | | | 0.09 | | | | 0.65 | | | | 0.74 | | | | (0.09 | ) | | | $6.90 | | | | 12.03 | % | | | 1.26 | % | | | 1.35 | % | | | 257 | % | | | $72,311 | |
| 2011 | | | $5.68 | | | | 0.05 | | | | 0.53 | | | | 0.58 | | | | (0.01 | ) | | | $6.25 | | | | 10.16 | % | | | 1.25 | % | | | 0.82 | % | | | 280 | % | | | $72,851 | |
| 2010 | | | $4.71 | | | | — | (3) | | | 0.97 | | | | 0.97 | | | | — | (3) | | | $5.68 | | | | 20.66 | % | | | 1.26 | % | | | (0.06 | )% | | | 260 | % | | | $78,441 | |
| 2009 | | | $5.34 | | | | — | (3) | | | (0.63 | ) | | | (0.63 | ) | | | — | | | | $4.71 | | | | (11.80 | )% | | | 1.25 | % | | | (0.03 | )% | | | 320 | % | | | $75,603 | |
| 2008 | | | $9.25 | | | | (0.02 | ) | | | (3.89 | ) | | | (3.91 | ) | | | — | | | | $5.34 | | | | (42.27 | )% | | | 1.25 | % | | | (0.27 | )% | | | 257 | % | | | $98,991 | |
| Institutional Class | |
| 2012 | | | $6.37 | | | | 0.10 | | | | 0.66 | | | | 0.76 | | | | (0.10 | ) | | | $7.03 | | | | 12.18 | % | | | 1.06 | % | | | 1.55 | % | | | 257 | % | | | $158 | |
| 2011 | | | $5.78 | | | | 0.06 | | | | 0.55 | | | | 0.61 | | | | (0.02 | ) | | | $6.37 | | | | 10.55 | % | | | 1.05 | % | | | 1.02 | % | | | 280 | % | | | $169 | |
| 2010 | | | $4.79 | | | | 0.01 | | | | 0.99 | | | | 1.00 | | | | (0.01 | ) | | | $5.78 | | | | 20.97 | % | | | 1.06 | % | | | 0.14 | % | | | 260 | % | | | $2,981 | |
| 2009 | | | $5.43 | | | | 0.01 | | | | (0.65 | ) | | | (0.64 | ) | | | — | | | | $4.79 | | | | (11.79 | )% | | | 1.05 | % | | | 0.17 | % | | | 320 | % | | | $3,089 | |
| 2008 | | | $9.38 | | | | (0.01 | ) | | | (3.94 | ) | | | (3.95 | ) | | | — | | | | $5.43 | | | | (42.11 | )% | | | 1.05 | % | | | (0.07 | )% | | | 257 | % | | | $4,864 | |
Notes to Financial Highlights
| (1) | Computed using average shares outstanding throughout the period. |
| (2) | Total returns are calculated based on the net asset value of the last business day. Total returns for periods less than one year are not annualized. |
| (3) | Per-share amount was less than $0.005. |
See Notes to Financial Statements.
Report of Independent Registered Public Accounting Firm |
The Board of Directors and Shareholders of
American Century Mutual Funds, Inc.:
We have audited the accompanying statement of assets and liabilities, including the schedule of investments, of Veedot Fund, one of the funds constituting American Century Mutual Funds, Inc. (the “Corporation”) as of October 31, 2012, and the related statement of operations for the year then ended, the statement of changes in net assets for each of the two years in the period then ended, and the financial highlights for each of the five years in the period then ended. These financial statements and financial highlights are the responsibility of the Corporation’s management. Our responsibility is to express an opinion on these financial statements and financial highlights based on our audits.
We conducted our audits in accordance with the standards of the Public Company Accounting Oversight Board (United States). Those standards require that we plan and perform the audit to obtain reasonable assurance about whether the financial statements and financial highlights are free of material misstatement. The Corporation is not required to have, nor were we engaged to perform, an audit of its internal control over financial reporting. Our audits included consideration of internal control over financial reporting as a basis for designing audit procedures that are appropriate in the circumstances, but not for the purpose of expressing an opinion on the effectiveness of the Corporation’s internal control over financial reporting. Accordingly, we express no such opinion. An audit also includes examining, on a test basis, evidence supporting the amounts and disclosures in the financial statements, assessing the accounting principles used and significant estimates made by management, as well as evaluating the overall financial statement presentation. Our procedures included confirmation of securities owned as of October 31, 2012, by correspondence with the custodian and brokers; where replies were not received from brokers, we performed other auditing procedures. We believe that our audits provide a reasonable basis for our opinion.
In our opinion, the financial statements and financial highlights referred to above present fairly, in all material respects, the financial position of Veedot Fund of American Century Mutual Funds, Inc., as of October 31, 2012, the results of its operations for the year then ended, the changes in its net assets for each of the two years in the period then ended, and the financial highlights for each of the five years in the period then ended, in conformity with accounting principles generally accepted in the United States of America.
Deloitte & Touche LLP
Kansas City, Missouri
December 19, 2012
The individuals listed below serve as directors of the funds. Each director will continue to serve in this capacity until death, retirement, resignation or removal from office. The mandatory retirement age for directors who are not “interested persons,” as that term is defined in the Investment Company Act (independent directors), is 72. However, the mandatory retirement age for an individual director may be extended with the approval of the remaining independent directors.
Mr. Thomas is an “interested person” because he currently serves as President and Chief Executive Officer of American Century Companies, Inc. (ACC), the parent company of American Century Investment Management, Inc. (ACIM or the advisor). Mr. Fink is an “interested person” because he currently serves as Executive Vice President of ACC.
The other directors (more than three-fourths of the total number) are independent; that is, they have never been employees, directors or officers of, and have no financial interest in, ACC or any of its wholly owned, direct or indirect, subsidiaries, including ACIM, American Century Investment Services, Inc. (ACIS) and American Century Services, LLC (ACS). The directors serve in this capacity for seven (in the case of Mr. Thomas, 15) registered investment companies in the American Century Investments family of funds.
The following table presents additional information about the directors. The mailing address for each director is 4500 Main Street, Kansas City, Missouri 64111.
Name (Year of Birth) | | Position(s) Held with Funds | | Length of Time Served | | Principal Occupation(s) During Past 5 Years | | Number of American Century Portfolios Overseen by Director | | Other Directorships Held During Past 5 Years |
| Independent Directors |
Thomas A. Brown (1940) | | Director | | Since 1980 | | Managing Member, Associated Investments, LLC (real estate investment company); Brown Cascade Properties, LLC (real estate investment company) (2001 to 2009) | | 66 | | None |
Andrea C. Hall (1945) | | Director | | Since 1997 | | Retired | | 66 | | None |
Jan M. Lewis (1957) | | Director | | Since 2011 | | President and Chief Executive Officer, Catholic Charities of Northeast Kansas (human services organization) | | 66 | | None |
James A. Olson (1942) | | Director | | Since 2007 | | Member, Plaza Belmont LLC (private equity fund manager) | | 66 | | Saia, Inc. (2002 to 2012) and Entertainment Properties Trust |
Donald H. Pratt (1937) | | Director and Chairman of the Board | | Since 1995 (Chairman since 2005) | | Chairman and Chief Executive Officer, Western Investments, Inc. (real estate company) | | 66 | | None |
Name (Year of Birth) | | Position(s) Held with Funds | | Length of Time Served | | Principal Occupation(s) During Past 5 Years | | Number of American Century Portfolios Overseen by Director | | Other Directorships Held During Past 5 Years |
| Independent Directors |
M. Jeannine Strandjord (1945) | | Director | | Since 1994 | | Retired | | 66 | | Euronet Worldwide Inc.; Charming Shoppes, Inc. (2006 to 2010); and DST Systems Inc. (1996 to 2012) |
John R. Whitten (1946) | | Director | | Since 2008 | | Retired | | 66 | | Rudolph Technologies, Inc. |
Stephen E. Yates (1948) | | Director | | Since 2012 | | Retired; Executive Vice President, Technology & Operations, KeyCorp. (computer services) (2004 to 2010) | | 66 | | Applied Industrial Technologies, Inc. (2001 to 2010) |
| |
| Interested Directors |
Barry Fink (1955) | | Director and Executive Vice President | | Since 2012 (Executive Vice President since 2007) | | Executive Vice President, ACC (September 2007 to present); President, ACS (October 2007 to present); Chief Operating Officer, ACC (September 2007 to November 2012). Also serves as Manager, ACS | | 66 | | None |
Jonathan S. Thomas (1963) | | Director and President | | Since 2007 | | President and Chief Executive Officer, ACC (March 2007 to present). Also serves as Chief Executive Officer and Manager, ACS; Executive Vice President, ACIM; Director, ACC, ACIM and other ACC subsidiaries | | 108 | | None |
Officers
The following table presents certain information about the executive officers of the funds. Each officer serves as an officer for each of the 15 investment companies in the American Century family of funds, unless otherwise noted. No officer is compensated for his or her service as an officer of the funds. The listed officers are interested persons of the funds and are appointed or re-appointed on an annual basis. The mailing address for each officer listed below is 4500 Main Street, Kansas City, Missouri 64111.
Name (Year of Birth) | | Offices with the Funds | | Principal Occupation(s) During the Past Five Years |
Jonathan S. Thomas (1963) | | Director and President since 2007 | | President and Chief Executive Officer, ACC (March 2007 to present). Also serves as Chief Executive Officer and Manager, ACS; Executive Vice President, ACIM; Director, ACC, ACIM and other ACC subsidiaries |
Barry Fink (1955) | | Director since 2012 and Executive Vice President since 2007 | | Executive Vice President, ACC (September 2007 to present); President, ACS (October 2007 to present); Chief Operating Officer, ACC (September 2007 to November 2012). Also serves as Manager, ACS |
Maryanne L. Roepke (1956) | | Chief Compliance Officer since 2006 and Senior Vice President since 2000 | | Chief Compliance Officer, American Century funds, ACIM and ACS (August 2006 to present). Also serves as Senior Vice President, ACS |
Charles A. Etherington (1957) | | General Counsel since 2007 and Senior Vice President since 2006 | | Attorney, ACC (February 1994 to present); Vice President, ACC (November 2005 to present), General Counsel, ACC (March 2007 to present). Also serves as General Counsel, ACIM, ACS, ACIS and other ACC subsidiaries; and Senior Vice President, ACIM and ACS |
C. Jean Wade (1964) | | Vice President, Treasurer and Chief Financial Officer since 2012 | | Vice President, ACS (February 2000 to present) |
Robert J. Leach (1966) | | Vice President since 2006 and Assistant Treasurer since 2012 | | Vice President, ACS (February 2000 to present) |
David H. Reinmiller (1963) | | Vice President since 2000 | | Attorney, ACC (January 1994 to present); Associate General Counsel, ACC (January 2001 to present). Also serves as Vice President, ACIM and ACS |
Ward D. Stauffer (1960) | | Secretary since 2005 | | Attorney, ACC (June 2003 to present) |
The Statement of Additional Information has additional information about the fund’s directors and is available without charge, upon request, by calling 1-800-345-2021.
Approval of Management Agreement |
At a meeting held on June 21, 2012, the Fund’s Board of Directors unanimously approved the renewal of the management agreement pursuant to which American Century Investment Management, Inc. (the “Advisor”) acts as the investment advisor for the Fund. Under Section 15(c) of the Investment Company Act, contracts for investment advisory services are required to be reviewed, evaluated, and approved by a majority of a fund’s independent directors (the “Directors”) each year.
As a part of the approval process, the Board requested and reviewed extensive data and information compiled by the Advisor and certain independent providers of evaluation data concerning the Fund and the services provided to the Fund by the Advisor. This review was in addition to the oversight and evaluation undertaken by the Board and its committees on a continuous basis throughout the year and included, but was not limited to the following:
| • | the nature, extent, and quality of investment management, shareholder services, and other services provided by the Advisor to the Fund; |
| • | the wide range of other programs and services the Advisor provides to the Fund and its shareholders on a routine and non-routine basis; |
| • | the investment performance of the fund, including data comparing the Fund’s performance to appropriate benchmarks and/or a peer group of other mutual funds with similar investment objectives and strategies; |
| • | data comparing the cost of owning the Fund to the cost of owning similar funds; |
| • | the Advisor’s compliance policies, procedures, and regulatory experience; |
| • | financial data showing the cost of services provided to the Fund, the profitability of the Fund to the Advisor, and the overall profitability of the Advisor; |
| • | data comparing services provided and charges to other investment management clients of the Advisor; and |
| • | consideration of collateral benefits derived by the Advisor from the management of the Fund and any potential economies of scale relating thereto. |
In keeping with its practice, the Board held two in-person meetings and one telephonic meeting to review and discuss the information provided. The Directors also had the benefit of the advice of independent counsel throughout the period.
Factors Considered
The Directors considered all of the information provided by the Advisor, the independent data providers, and independent counsel, and evaluated such information for the Fund. In connection with their review, the Directors did not identify any single factor as being all-important or controlling, and each Director may have attributed different levels of importance to different factors. In deciding to renew the management agreement, the Board based its decision on a number of factors, including the following:
Nature, Extent and Quality of Services — Generally. Under the management agreement, the Advisor is responsible for providing or arranging for all services necessary for the operation of the Fund. The Board noted that under the management agreement, the Advisor provides or arranges at its own expense a wide variety of services including:
| • | constructing and designing the Fund |
| • | portfolio research and security selection |
| • | initial capitalization/funding |
| • | daily valuation of the Fund’s portfolio |
| • | shareholder servicing and transfer agency, including shareholder confirmations, recordkeeping, and communications |
| • | regulatory and portfolio compliance |
| • | marketing and distribution |
The Board noted that many of these services have expanded over time both in terms of quantity and complexity in response to shareholder demands, competition in the industry, changing distribution channels, and the changing regulatory environment.
Investment Management Services. The nature of the investment management services provided to the Fund is quite complex and allows Fund shareholders access to professional money management, instant diversification of their investments within an asset class, the opportunity to easily diversify among asset classes by investing in or exchanging among various American Century Investments funds, and liquidity. In evaluating investment performance, the Board expects the Advisor to manage the Fund in accordance with its investment objectives and approved strategies. Further, the Directors recognize that the Advisor has an obligation to monitor trading activities, and in particular to seek the best execution of fund trades, and to evaluate the use of and payment for research. In providing these services, the Advisor utilizes teams of investment professionals (portfolio managers, analysts, research assistants, and securities traders) who require extensive information technology, research, training, compliance and other systems to conduct their business. The Board, directly and through its Fund Performance Review Committee, regularly reviews investment performance information for the Fund, together with comparative information for appropriate benchmarks and/or peer groups of similarly-managed funds, over different time horizons.
The Directors also review detailed performance information during the management agreement approval process. If performance concerns are identified, the Fund receives special reviews until performance improves, during which the Board discusses with the Advisor the reasons for such results (e.g., market conditions, security selection) and any efforts being undertaken to improve performance. Taking all these factors into consideration, the Board found the investment management services provided by the Advisor to the Fund to meet or exceed industry standards. More detailed information about the Fund’s performance can be found in the Performance and Portfolio Commentary sections of this report.
Shareholder and Other Services. Under the management agreement, the Advisor provides the Fund with a comprehensive package of transfer agency, shareholder, and other services. The Board, directly and through various committees of the Board, regularly reviews reports and evaluations of such services at its regular meetings. These reports include, but are not limited to, information regarding the operational efficiency and accuracy of the shareholder and transfer agency services provided, staffing levels, shareholder satisfaction (as measured by external as well as internal sources), technology support, new products and services offered to Fund shareholders, securities trading activities, portfolio valuation services, auditing services, and legal and operational compliance activities. Certain aspects of shareholder and transfer agency service level efficiency and the quality of securities trading activities are measured by independent third party providers and are presented in comparison to other fund groups not managed by the Advisor. The Board found the services provided by the Advisor to the Fund under the management agreement to be competitive and of high quality.
Costs of Services and Profitability. The Advisor provides detailed information concerning its cost of providing various services to the Fund, its profitability in managing the Fund, its overall profitability, and its financial condition. The Directors have reviewed with the Advisor the methodology used to prepare this financial information. The financial information regarding the Advisor is considered in evaluating the Advisor’s financial condition, ability to continue to provide services under the management agreement, and the reasonableness of the current management fee. The Board concluded that the Advisor’s profits were reasonable in light of the services provided to the Fund.
Ethics. The Board generally considers the Advisor’s commitment to providing quality services to shareholders and to conducting its business ethically. They noted that the Advisor’s practices generally meet or exceed industry best practices.
Economies of Scale. The Board also reviewed information provided by the Advisor regarding the possible existence of economies of scale in connection with the management of the Fund. The Board concluded that economies of scale are difficult to measure and predict with precision, especially on a fund-by-fund basis. The Board concluded that the Advisor is appropriately sharing economies of scale through its competitive fee structure, offering competitive fees from fund inception, and through reinvestment in its business to provide shareholders additional content and services.
Comparison to Other Funds’ Fees. The management agreement provides that the Fund pay the Advisor a single, all-inclusive (or unified) management fee for providing all services necessary for the management and operation of the Fund, other than brokerage expenses, taxes, interest, extraordinary expenses, and the fees and expenses of the Fund’s independent directors (including their independent legal counsel) and expenses incurred in connection with the provision of shareholder services and distribution services under a plan adopted pursuant to Rule 12b-1 under the 1940 Act. Under the unified fee structure, the Advisor is responsible for providing all investment advisory, custody, audit, administrative, compliance, recordkeeping, marketing and shareholder services, or arranging and supervising third parties to provide such services. By contrast, most other funds are charged a variety of fees, including an investment advisory fee, a transfer agency fee, an administrative fee, distribution charges and other expenses. Other than their investment advisory fees and any applicable Rule 12b-1 distribution fees, all other components of the total fees charged by these other funds may be increased without shareholder approval. The Board believes the unified fee structure is a benefit to Fund shareholders because it clearly discloses to shareholders the cost of owning Fund shares, and, since the unified fee cannot be increased without a vote of Fund shareholders, it shifts to the Advisor the risk of increased costs of operating the Fund and provides a direct incentive to minimize administrative inefficiencies. Part of the Board’s analysis of fee levels involves reviewing certain evaluative data compiled by an independent provider and comparing the Fund’s unified fee to the total expense ratio of other funds in the Fund’s peer group. The Board concluded that the management fee paid by the Fund to the Advisor under the management agreement is reasonable in light of the services provided to the Fund.
Comparison to Fees and Services Provided to Other Clients of the Advisor. The Board also requested and received information from the Advisor concerning the nature of the services, fees, costs and profitability of its advisory services to advisory clients other than the Fund. They observed that these varying types of client accounts require different services and involve different regulatory and entrepreneurial risks than the management of the Fund. The Board analyzed this information and concluded that the fees charged and services provided to the Fund were reasonable by comparison.
Collateral or “Fall-Out” Benefits Derived by the Advisor. The Board considered the existence of collateral benefits the Advisor may receive as a result of its relationship with the Fund. They concluded that the Advisor’s primary business is managing mutual funds and it generally does not use fund or shareholder information to generate profits in other lines of business, and therefore does not derive any significant collateral benefits from them. The Board noted that the Advisor receives proprietary research from broker-dealers that execute fund portfolio transactions and concluded that this research is likely to benefit Fund shareholders. The Board also determined that the Advisor is able to provide investment management services to certain clients other than the Fund, at least in part, due to its existing infrastructure built to serve the fund complex. The Board concluded, however, that the assets of those other clients are not material to the analysis and, where applicable, may be included with the assets of the Fund to determine breakpoints in the management fee schedule.
Existing Relationship. The Board also considered whether there was any reason for not continuing the existing arrangement with the Advisor. In this regard, the Board was mindful of the potential disruptions of the Fund’s operations and various risks, uncertainties, and other effects that could occur as a result of a decision not to continue such relationship. In particular, the Board recognized that most shareholders have invested in the Fund on the strength of the Advisor’s industry standing and reputation and in the expectation that the Advisor will have a continuing role in providing advisory services to the Fund.
Conclusion of the Directors. As a result of this process, the Board, including all of the independent directors, taking into account all of the factors discussed above and the information provided by the Advisor and others, concluded that the management agreement between the Fund and the Advisor is fair and reasonable in light of the services provided and should be renewed.
Retirement Account Information
As required by law, distributions you receive from certain IRAs, or 403(b), 457 and qualified plans are subject to federal income tax withholding, unless you elect not to have withholding apply. Tax will be withheld on the total amount withdrawn even though you may be receiving amounts that are not subject to withholding, such as nondeductible contributions. In such case, excess amounts of withholding could occur. You may adjust your withholding election so that a greater or lesser amount will be withheld.
If you don’t want us to withhold on this amount, you must notify us to not withhold the federal income tax. You may notify us in writing or in certain situations by telephone or through other electronic means. You have the right to revoke your withholding election at any time and any election you make may remain in effect until revoked by filing a new election.
Remember, even if you elect not to have income tax withheld, you are liable for paying income tax on the taxable portion of your withdrawal. If you elect not to have income tax withheld or you don’t have enough income tax withheld, you may be responsible for payment of estimated tax. You may incur penalties under the estimated tax rules if your withholding and estimated tax payments are not sufficient. You can reduce or defer the income tax on a distribution by directly or indirectly rolling such distribution over to another IRA or eligible plan. You should consult your tax advisor for additional information.
State tax will be withheld if, at the time of your distribution, your address is within one of the mandatory withholding states and you have federal income tax withheld. State taxes will be withheld from your distribution in accordance with the respective state rules.
Proxy Voting Guidelines
American Century Investment Management, Inc., the fund’s investment advisor, is responsible for exercising the voting rights associated with the securities purchased and/or held by the fund. A description of the policies and procedures the advisor uses in fulfilling this responsibility is available without charge, upon request, by calling 1-800-345-2021. It is also available on American Century Investments’ website at americancentury.com and on the Securities and Exchange Commission’s website at sec.gov. Information regarding how the investment advisor voted proxies relating to portfolio securities during the most recent 12-month period ended June 30 is available on the “About Us” page at americancentury.com. It is also available at sec.gov.
Quarterly Portfolio Disclosure
The fund files its complete schedule of portfolio holdings with the Securities and Exchange Commission (SEC) for the first and third quarters of each fiscal year on Form N-Q. The fund’s Forms N-Q are available on the SEC’s website at sec.gov, and may be reviewed and copied at the SEC’s Public Reference Room in Washington, DC. Information on the operation of the Public Reference Room may be obtained by calling 1-800-SEC-0330. The fund also makes its complete schedule of portfolio holdings for the most recent quarter of its fiscal year available on its website at americancentury.com and, upon request, by calling 1-800-345-2021.
Other Tax Information
The following information is provided pursuant to provisions of the Internal Revenue Code.
The fund hereby designates up to the maximum amount allowable as qualified dividend income for the fiscal year ended October 31, 2012.
For corporate taxpayers, the fund hereby designates $1,052,707, or up to the maximum amount allowable, of ordinary income distributions paid during the fiscal year ended October 31, 2012 as qualified for the corporate dividends received deduction.
| Contact Us | americancentury.com |
| Automated Information Line | 1-800-345-8765 |
| Investor Services Representative | 1-800-345-2021 or 816-531-5575 |
| Investors Using Advisors | 1-800-378-9878 |
| Business, Not-For-Profit, Employer-Sponsored Retirement Plans | 1-800-345-3533 |
| Banks and Trust Companies, Broker-Dealers, Financial Professionals, Insurance Companies | 1-800-345-6488 |
| Telecommunications Device for the Deaf | 1-800-634-4113 |
American Century Mutual Funds, Inc.
Investment Advisor:
American Century Investment Management, Inc.
Kansas City, Missouri
This report and the statements it contains are submitted for the general information of our shareholders. The report is not authorized for distribution to prospective investors unless preceded or accompanied by an effective prospectus.
©2012 American Century Proprietary Holdings, Inc. All rights reserved.
CL-ANN-76903 1212
ANNUAL REPORT OCTOBER 31, 2012


| President’s Letter | 2 |
| Independent Chairman’s Letter | 3 |
| Market Perspective | 4 |
| Performance | 5 |
| Portfolio Commentary | 7 |
| Fund Characteristics | 9 |
| Shareholder Fee Example | 10 |
| Schedule of Investments | 12 |
| Statement of Assets and Liabilities | 15 |
| Statement of Operations | 16 |
| Statement of Changes in Net Assets | 17 |
| Notes to Financial Statements | 18 |
| Financial Highlights | 25 |
| Report of Independent Registered Public Accounting Firm | 27 |
| Management | 28 |
| Approval of Management Agreement | 31 |
| Additional Information | 36 |
Any opinions expressed in this report reflect those of the author as of the date of the report, and do not necessarily represent the opinions of American Century Investments® or any other person in the American Century Investments organization. Any such opinions are subject to change at any time based upon market or other conditions and American Century Investments disclaims any responsibility to update such opinions. These opinions may not be relied upon as investment advice and, because investment decisions made by American Century Investments funds are based on numerous factors, may not be relied upon as an indication of trading intent on behalf of any American Century Investments fund. Security examples are used for representational purposes only and are not intended as recommendations to purchase or sell securities. Performance information for comparative indices and securities is provided to American Century Investments by third party vendors. To the best of American Century Investments’ knowledge, such information is accurate at the time of printing.
Dear Investor:
Thank you for reviewing this annual report for the 12 months ended October 31, 2012. Our report offers investment performance, market analysis, and portfolio information, presented with the expert perspective of our portfolio management team.
This report remains one of our most important vehicles for conveying information about fund returns, including key factors that affected fund performance. For additional, updated insights, we encourage you to visit our website, americancentury.com.
Favorable Fiscal-Year Returns for Most U.S. Stock and Bond Benchmarks
In a period fraught with concerns about factors such as the global economic recovery, European financial system stability, and the U.S. political picture, the 12-month returns for U.S. investors were generally favorable.
Both U.S. stocks and bonds rallied for much of the period, with U.S. equities generally outperforming their non-U.S. counterparts. The S&P 500 Index advanced 15.21%, compared with 4.61% for the MSCI EAFE (Europe, Australasia, Far East) Index. The Barclays U.S. Aggregate Bond Index returned 5.25%, and the 10-year U.S. Treasury note returned 7.47%, according to Barclays.
As it turned out, the overseas setbacks and the coordinated monetary policy response provided by prominent central banks around the world ultimately proved beneficial to the U.S. capital markets. Both U.S. stocks and bonds generally benefited from global investors’ trust in the U.S. financial system and from declining interest rates, helped by central bank purchases of government securities. The 10-year U.S. Treasury yield fell to a record low during the period, finishing at 1.69%.
The U.S. economy showed signs of improvement during the fiscal year, particularly the long-depressed housing market. However, the outlook for 2013 remains guarded, as the fragile recovery remains vulnerable to fiscal and financial factors that could trigger further slowdowns and market volatility.
Under these conditions, we continue to believe in a disciplined, diversified, long-term investment approach, using both stocks and bonds—as appropriate—for meeting financial goals. We appreciate your continued trust in us in this challenging environment.
Sincerely,
Jonathan Thomas
President and Chief Executive Officer
American Century Investments
Independent Chairman’s Letter |
Don Pratt
Dear Fellow Shareholders,
The board has once again completed its annual review of the advisory contract between the American Century Investments mutual funds overseen by the board and the funds’ advisor, American Century Investment Management, Inc. This process, often referred to as the 15(c) review, involves the independent directors considering all of the material monitored throughout the year and evaluating a wide range of factors to determine whether the management fee paid by each fund to the advisor is reasonable.
The independent directors’ rationale for this decision is provided in detail in this, or in a previous, report. However, there are several highlights that should be of interest to all shareholders.
| • | Fund performance and client service continue to be rated among the industry’s best. |
| • | Target date and other asset allocation products continue to successfully gather assets and industry acclaim. |
| • | Compliance programs continue to function successfully with no issues impacting shareholder interests. |
| • | Fees were found to be within an acceptable competitive range, with minor fee waivers being negotiated on five funds. |
Knowing that most shareholders are long term investors, the board was particularly pleased with our succession planning review. Talented professionals are being added within portfolio management and experienced managers have been added to the senior management team.
Overall it was a very positive review for the American Century Investments mutual funds during a challenging market environment.
Best personal regards,
Don Pratt
By David Hollond, Chief Investment Officer, U.S. Growth Equity — Mid & Small Cap
Stocks Gained Amid Volatility
The U.S. stock market generated positive results for the 12-month period ended October 31, 2012, although it endured significant volatility along the way. As the reporting period began, stocks were in the midst of a rebound. Investors grew optimistic as signs of improving economic activity quashed recession fears; in particular, job growth began to exceed expectations, driving the unemployment rate to its lowest level in three years by February 2012. Another positive factor was promising news out of Europe, as the European Central Bank provided favorable long-term financing to the debt markets and support for the Continent’s banking sector.
The optimism proved to be short-lived, as headwinds returned to the equity market. Evidence of slowing economic activity in the U.S. and adverse developments in Europe—including political turmoil in Greece and troubled banks in Spain—weighed on investor confidence, sending stocks down sharply.
Late in the period, stocks reversed course once again. The Federal Reserve announced a third round of quantitative easing measures, as well as an extension of its near-zero interest rate policy until 2015. The European Central Bank, meanwhile, announced a plan under which it would purchase bonds to support financially troubled debt markets in Europe. These measures, as well as others taken by central banks around the world, helped to restore investor confidence and drive markets upward, despite some concerns about slowing corporate profits and the looming U.S. fiscal cliff.
As the table below illustrates, large-cap issues generated the strongest returns for the reporting period, outpacing mid- and small-cap shares. Value stocks outpaced growth shares across the market capitalization spectrum.
From a sector perspective, all sectors within the Russell 3000 Index delivered positive results; the telecommunication services sector fared the best. Health care, financials, consumer discretionary, and consumer staples all finished ahead of the Russell 3000 Index. On the other side, the energy and information technology sectors achieved more moderate gains.
| U.S. Stock Index Returns |
| For the 12 months ended October 31, 2012 |
| Russell 1000 Index (Large-Cap) | 14.97% | | Russell 2000 Index (Small-Cap) | 12.08% |
| Russell 1000 Growth Index | 13.02% | | Russell 2000 Growth Index | 9.70% |
| Russell 1000 Value Index | 16.89% | | Russell 2000 Value Index | 14.47% |
| Russell Midcap Index | 12.15% | | | |
| Russell Midcap Growth Index | 9.09% | | | |
| Russell Midcap Value Index | 14.99% | | | |
| Total Returns as of October 31, 2012 |
| | | | Average Annual Returns | |
| | Ticker Symbol | 1 year | 5 years | 10 years | Since Inception | Inception Date |
| Investor Class | TWCVX | 7.32% | -4.73% | 7.55% | 8.81% | 11/25/83 |
Russell Midcap Growth Index | — | 9.09% | 1.55% | 10.03% | N/A(1) | — |
| Institutional Class | TWVIX | 7.53% | -4.53% | 7.77% | 5.03% | 11/14/96 |
A Class(2) No sales charge* With sales charge* | TWVAX | 7.01% 0.85% | -4.96% -6.09% | 7.29% 6.66% | 4.08% 3.70% | 10/2/96 |
| C Class | AVNCX | 6.25% | — | — | 7.94% | 3/1/10 |
| R Class | AVTRX | 6.73% | -5.21% | — | 2.62% | 7/29/05 |
| * | Sales charges include initial sales charges and contingent deferred sales charges (CDSCs), as applicable. A Class shares have a 5.75% maximum initial sales charge and may be subject to a maximum CDSC of 1.00%. C Class shares redeemed within 12 months of purchase are subject to a maximum CDSC of 1.00%. The SEC requires that mutual funds provide performance information net of maximum sales charges in all cases where charges could be applied. |
| (1) | Benchmark data first available 12/31/85. |
| (2) | Prior to March 1, 2010, the A Class was referred to as the Advisor Class and did not have a front-end sales charge. Performance prior to that date has been adjusted to reflect this charge. |
Data presented reflect past performance. Past performance is no guarantee of future results. Current performance may be higher or lower than the performance shown. Investment return and principal value will fluctuate, and redemption value may be more or less than original cost. To obtain performance data current to the most recent month end, please call 1-800-345-2021 or visit americancentury.com. International investing involves special risks, such as political instability and currency fluctuations. Historically, small company stocks have been more volatile than the stocks of larger, more established companies.
Unless otherwise indicated, performance reflects Investor Class shares; performance for other share classes will vary due to differences in fee structure. For information about other share classes available, please consult the prospectus. Data assumes reinvestment of dividends and capital gains, and none of the charts reflect the deduction of taxes that a shareholder would pay on fund distributions or the redemption of fund shares. Returns for the index are provided for comparison. The fund’s total returns include operating expenses (such as transaction costs and management fees) that reduce returns, while the total returns of the index do not.
| Growth of $10,000 Over 10 Years |
| $10,000 investment made October 31, 2002 |
| Total Annual Fund Operating Expenses |
| Investor Class | Institutional Class | A Class | C Class | R Class |
| 1.03% | 0.83% | 1.28% | 2.03% | 1.53% |
The total annual fund operating expenses shown is as stated in the fund’s prospectus current as of the date of this report. The prospectus may vary from the expense ratio shown elsewhere in this report because it is based on a different time period, includes acquired fund fees and expenses, and, if applicable, does not include fee waivers or expense reimbursements.
Data presented reflect past performance. Past performance is no guarantee of future results. Current performance may be higher or lower than the performance shown. Investment return and principal value will fluctuate, and redemption value may be more or less than original cost. To obtain performance data current to the most recent month end, please call 1-800-345-2021 or visit americancentury.com. International investing involves special risks, such as political instability and currency fluctuations. Historically, small company stocks have been more volatile than the stocks of larger, more established companies.
Unless otherwise indicated, performance reflects Investor Class shares; performance for other share classes will vary due to differences in fee structure. For information about other share classes available, please consult the prospectus. Data assumes reinvestment of dividends and capital gains, and none of the charts reflect the deduction of taxes that a shareholder would pay on fund distributions or the redemption of fund shares. Returns for the index are provided for comparison. The fund’s total returns include operating expenses (such as transaction costs and management fees) that reduce returns, while the total returns of the index do not.
Portfolio Managers: Brad Eixmann and Bryan Unterhalter
Performance Summary
Vista returned 7.32%* for the 12 months ended October 31, 2012. By comparison, the Russell Midcap Growth Index (the fund’s benchmark), returned 9.09%.
In terms of Vista’s absolute returns during the fiscal year, the health care and consumer discretionary sectors contributed most. Energy was the only major sector to post negative absolute results. Relative to the benchmark, stock selection made the materials and industrial sectors the leading detractors. Positioning among telecommunication services, energy, and information technology shares contributed most to relative performance.
Stocks Positive but Volatile
Equity markets in recent years have tended to trade in broad “risk on/risk off” moves as perceptions of macroeconomic and market conditions changed. These sorts of conditions typically result in higher correlations between individual securities—that is, stocks tend to go up and down together with comparatively little differentiation among them. This makes it comparatively more difficult for active portfolio managers to outperform. However, despite the uncertain economic and market conditions, we have seen no shortage of attractive companies demonstrating accelerating earnings growth.
Materials, Industrials Detracted Most
In the materials sector, it hurt relative results to be underrepresented in a number of shares that did well during the fiscal year. Good examples were paint companies Sherwin-Williams and PPG Industries—two stocks to which Vista had less exposure than the benchmark—which outperformed as the housing sector improved.
In the industrial sector, a number of Vista’s holdings were affected by investor uncertainty around corporate earnings growth and pricing power resulting from worries about the health of the global economy. The leading detractor here was mining equipment manufacturer Joy Global, which suffered from declining metals prices and slower economic growth. In the electrical equipment industry group, Polypore, which manufactures lithium-ion separators used in electric vehicles, was hurt over competitor concern.
Among other leading individual detractors was information security software company Check Point Software Technologies. Check Point underperformed after announcing slower-than-expected license revenue growth, which the company attributed to a pause in orders ahead of a new operating system launch. China-based Focus Media Holding underperformed as a result of a critical third party research report.
*All fund returns referenced in this commentary are for Investor Class shares.
Contributions Broad Based
Looking at positive contributors to relative results, stock selection and allocation decisions drove outperformance in the telecommunication services sector. The leading contributor in this space was cellular tower operator SBA Communications. The company continues to benefit from a long-running trend toward the build-out of data networks for mobile phones.
Elsewhere, stock selection in the energy and information technology sectors drove outperformance. In the energy space, positioning in the oil, gas, and consumable fuels industry contributed most. Here, stock choices had a positive effect, and it helped to be underweight this comparatively poor-performing industry segment. Among information technology stocks, the IT services and semiconductor industries were sources of strength. A key contributor in the sector was business software provider NetSuite, which reported better-than-expected results and did very well late in the fiscal year.
The leading individual contributor in the portfolio for the fiscal year was pharmacy benefit manager SXC Health Solutions, which announced the acquisition of Catalyst Health Solutions in April 2012. The portfolio held positions in both SXC and Catalyst, and they each posted strong returns. The merger provides the combined entity, subsequently renamed Catamaran, with increased scale to target larger potential clients.
A number of other key contributors resided in the consumer discretionary sector, including PetSmart and Ulta Salon Cosmetics & Fragrance. Pet products retailer PetSmart reported improvement in same store sales, margins, and other key business metrics, while the stock further benefited from an aggressive share buyback plan. Ulta enjoyed attractive store growth and same store sales comparisons, as well as seeing its business mix evolve toward higher margin products. It also helped to own high-growth international retailer Michael Kors, which outperformed during the fiscal year following its initial public offering thanks to brand strength and exposure to luxury spending.
Commitment to Process
Vista’s investment process focuses on medium- and smaller-sized companies with accelerating growth rates and share price momentum. Within the process, in the current market environment, our team is placing increasing emphasis on the identification of companies benefiting from enduring secular—as opposed to cyclical—growth trends. Such secular trends are often the result of larger technological, social, or economic change that can last several years or more. Examples of secular changes underway at present are trends toward mobile and cloud computing, among others. Secular growers are particularly appealing investments because they offer more sustainable, enduring rates of earnings acceleration across the economic cycle. We believe that smart risk-taking and active investing in such companies will generate attractive absolute and relative investment performance over time.
| OCTOBER 31, 2012 |
| Top Ten Holdings | % of net assets |
| Alliance Data Systems Corp. | 3.0% |
| Catamaran Corp. | 2.4% |
| Whole Foods Market, Inc. | 2.3% |
| SBA Communications Corp., Class A | 2.2% |
| Kansas City Southern | 2.1% |
| Teradata Corp. | 1.9% |
| PetSmart, Inc. | 1.8% |
| Tractor Supply Co. | 1.7% |
| Alexion Pharmaceuticals, Inc. | 1.7% |
| Cabot Oil & Gas Corp. | 1.7% |
| |
| Top Five Industries | % of net assets |
| Specialty Retail | 10.7% |
| IT Services | 5.3% |
| Chemicals | 4.6% |
| Biotechnology | 3.6% |
| Food and Staples Retailing | 3.5% |
| |
| Types of Investments in Portfolio | % of net assets |
| Domestic Common Stocks | 91.5% |
| Foreign Common Stocks* | 6.2% |
| Total Common Stocks | 97.7% |
| Temporary Cash Investments | 2.6% |
| Other Assets and Liabilities | (0.3)% |
| *Includes depositary shares, dual listed securities and foreign ordinary shares. |
Fund shareholders may incur two types of costs: (1) transaction costs, including sales charges (loads) on purchase payments and redemption/exchange fees; and (2) ongoing costs, including management fees; distribution and service (12b-1) fees; and other fund expenses. This example is intended to help you understand your ongoing costs (in dollars) of investing in your fund and to compare these costs with the ongoing cost of investing in other mutual funds.
The example is based on an investment of $1,000 made at the beginning of the period and held for the entire period from May 1, 2012 to October 31, 2012.
Actual Expenses
The table provides information about actual account values and actual expenses for each class. You may use the information, together with the amount you invested, to estimate the expenses that you paid over the period. First, identify the share class you own. Then simply divide your account value by $1,000 (for example, an $8,600 account value divided by $1,000 = 8.6), then multiply the result by the number under the heading “Expenses Paid During Period” to estimate the expenses you paid on your account during this period.
If you hold Investor Class shares of any American Century Investments fund, or Institutional Class shares of the American Century Diversified Bond Fund, in an American Century Investments account (i.e., not a financial intermediary or retirement plan account), American Century Investments may charge you a $12.50 semiannual account maintenance fee if the value of those shares is less than $10,000. We will redeem shares automatically in one of your accounts to pay the $12.50 fee. In determining your total eligible investment amount, we will include your investments in all personal accounts (including American Century Investments Brokerage accounts) registered under your Social Security number. Personal accounts include individual accounts, joint accounts, UGMA/UTMA accounts, personal trusts, Coverdell Education Savings Accounts and IRAs (including traditional, Roth, Rollover, SEP-, SARSEP- and SIMPLE-IRAs), and certain other retirement accounts. If you have only business, business retirement, employer-sponsored or American Century Investments Brokerage accounts, you are currently not subject to this fee. If you are subject to the Account Maintenance Fee, your account value could be reduced by the fee amount.
Hypothetical Example for Comparison Purposes
The table also provides information about hypothetical account values and hypothetical expenses based on the actual expense ratio of each class of your fund and an assumed rate of return of 5% per year before expenses, which is not the actual return of a fund’s share class. The hypothetical account values and expenses may not be used to estimate the actual ending account balance or expenses you paid for the period. You may use this information to compare the ongoing costs of investing in your fund and other funds. To do so, compare this 5% hypothetical example with the 5% hypothetical examples that appear in the shareholder reports of the other funds.
Please note that the expenses shown in the table are meant to highlight your ongoing costs only and do not reflect any transactional costs, such as sales charges (loads) or redemption/exchange fees. Therefore, the table is useful in comparing ongoing costs only, and will not help you determine the relative total costs of owning different funds. In addition, if these transactional costs were included, your costs would have been higher.
| | Beginning Account Value 5/1/12 | Ending Account Value 10/31/12 | Expenses Paid During Period(1) 5/1/12 – 10/31/12 | Annualized Expense Ratio(1) |
| Actual |
| Investor Class | $1,000 | $952.60 | $4.91 | 1.00% |
| Institutional Class | $1,000 | $953.50 | $3.93 | 0.80% |
| A Class | $1,000 | $950.90 | $6.13 | 1.25% |
| C Class | $1,000 | $947.70 | $9.79 | 2.00% |
| R Class | $1,000 | $949.80 | $7.35 | 1.50% |
| Hypothetical |
| Investor Class | $1,000 | $1,020.11 | $5.08 | 1.00% |
| Institutional Class | $1,000 | $1,021.12 | $4.06 | 0.80% |
| A Class | $1,000 | $1,018.85 | $6.34 | 1.25% |
| C Class | $1,000 | $1,015.08 | $10.13 | 2.00% |
| R Class | $1,000 | $1,017.60 | $7.61 | 1.50% |
| (1) | Expenses are equal to the class’s annualized expense ratio listed in the table above, multiplied by the average account value over the period, multiplied by 184, the number of days in the most recent fiscal half-year, divided by 366, to reflect the one-half year period. |
| | | Shares | | | Value | |
| Common Stocks — 97.7% | |
| AEROSPACE AND DEFENSE — 1.8% | |
B/E Aerospace, Inc.(1) | | | 214,000 | | | | $9,649,260 | |
| TransDigm Group, Inc. | | | 117,000 | | | | 15,585,570 | |
| | | | | | | | 25,234,830 | |
| AUTO COMPONENTS — 1.4% | |
BorgWarner, Inc.(1) | | | 127,000 | | | | 8,359,140 | |
Delphi Automotive plc(1) | | | 364,000 | | | | 11,444,160 | |
| | | | | | | | 19,803,300 | |
| AUTOMOBILES — 0.6% | |
| Harley-Davidson, Inc. | | | 169,000 | | | | 7,902,440 | |
| BEVERAGES — 1.3% | |
| Beam, Inc. | | | 117,000 | | | | 6,500,520 | |
| Dr Pepper Snapple Group, Inc. | | | 166,000 | | | | 7,113,100 | |
Monster Beverage Corp.(1) | | | 106,000 | | | | 4,735,020 | |
| | | | | | | | 18,348,640 | |
| BIOTECHNOLOGY — 3.6% | |
Alexion Pharmaceuticals, Inc.(1) | | | 257,000 | | | | 23,227,660 | |
Grifols SA(1) | | | 279,000 | | | | 9,677,103 | |
Onyx Pharmaceuticals, Inc.(1) | | | 67,000 | | | | 5,250,120 | |
Regeneron Pharmaceuticals, Inc.(1) | | | 75,000 | | | | 10,672,500 | |
| | | | | | | | 48,827,383 | |
| BUILDING PRODUCTS — 0.9% | |
Fortune Brands Home & Security, Inc.(1) | | | 410,000 | | | | 11,660,400 | |
| CAPITAL MARKETS — 2.1% | |
Affiliated Managers Group, Inc.(1) | | | 145,000 | | | | 18,342,500 | |
| KKR & Co. LP | | | 663,000 | | | | 9,978,150 | |
| | | | | | | | 28,320,650 | |
| CHEMICALS — 4.6% | |
| Airgas, Inc. | | | 124,000 | | | | 11,032,280 | |
| Celanese Corp. | | | 110,000 | | | | 4,178,900 | |
| Cytec Industries, Inc. | | | 130,000 | | | | 8,946,600 | |
| Eastman Chemical Co. | | | 241,000 | | | | 14,276,840 | |
| FMC Corp. | | | 345,000 | | | | 18,464,400 | |
| Sherwin-Williams Co. (The) | | | 46,000 | | | | 6,558,680 | |
| | | | | | | | 63,457,700 | |
| COMMERCIAL SERVICES AND SUPPLIES — 1.2% | |
Stericycle, Inc.(1) | | | 177,000 | | | | 16,772,520 | |
| COMMUNICATIONS EQUIPMENT — 0.5% | |
Palo Alto Networks, Inc.(1) | | | 125,000 | | | | 6,872,500 | |
| CONSTRUCTION AND ENGINEERING — 1.9% | |
| Chicago Bridge & Iron Co. NV New York Shares | | | 194,000 | | | | 7,284,700 | |
| KBR, Inc. | | | 220,000 | | | | 6,129,200 | |
Quanta Services, Inc.(1) | | | 501,000 | | | | 12,990,930 | |
| | | | | | | | 26,404,830 | |
| CONSTRUCTION MATERIALS — 0.2% | |
| Eagle Materials, Inc. | | | 55,000 | | | | 2,913,350 | |
| CONSUMER FINANCE — 1.6% | |
| Discover Financial Services | | | 533,000 | | | | 21,853,000 | |
| DIVERSIFIED FINANCIAL SERVICES — 0.7% | |
| McGraw-Hill Cos., Inc. (The) | | | 172,000 | | | | 9,508,160 | |
| DIVERSIFIED TELECOMMUNICATION SERVICES — 0.7% | |
tw telecom, inc., Class A(1) | | | 353,000 | | | | 8,990,910 | |
| ELECTRICAL EQUIPMENT — 0.5% | |
| AMETEK, Inc. | | | 193,000 | | | | 6,861,150 | |
| ELECTRONIC EQUIPMENT, INSTRUMENTS AND COMPONENTS — 1.4% | |
Trimble Navigation Ltd.(1) | | | 406,000 | | | | 19,155,080 | |
| ENERGY EQUIPMENT AND SERVICES — 2.6% | |
Atwood Oceanics, Inc.(1) | | | 171,000 | | | | 8,173,800 | |
| National Oilwell Varco, Inc. | | | 112,000 | | | | 8,254,400 | |
| Oceaneering International, Inc. | | | 220,000 | | | | 11,512,600 | |
Oil States International, Inc.(1) | | | 115,000 | | | | 8,406,500 | |
| | | | | | | | 36,347,300 | |
| FOOD AND STAPLES RETAILING — 3.5% | |
| Costco Wholesale Corp. | | | 91,000 | | | | 8,957,130 | |
Fresh Market, Inc. (The)(1) | | | 119,000 | | | | 6,748,490 | |
| Whole Foods Market, Inc. | | | 337,000 | | | | 31,924,010 | |
| | | | | | | | 47,629,630 | |
| FOOD PRODUCTS — 2.7% | |
Hain Celestial Group, Inc. (The)(1) | | | 132,000 | | | | 7,629,600 | |
| McCormick & Co., Inc. | | | 182,000 | | | | 11,214,840 | |
| Mead Johnson Nutrition Co. | | | 289,000 | | | | 17,819,740 | |
| | | | | | | | 36,664,180 | |
| GAS UTILITIES — 1.1% | |
| ONEOK, Inc. | | | 310,000 | | | | 14,663,000 | |
| HEALTH CARE EQUIPMENT AND SUPPLIES — 3.1% | |
| Cooper Cos., Inc. (The) | | | 95,000 | | | | 9,118,100 | |
Edwards Lifesciences Corp.(1) | | | 70,000 | | | | 6,078,100 | |
IDEXX Laboratories, Inc.(1) | | | 118,000 | | | | 11,351,600 | |
Intuitive Surgical, Inc.(1) | | | 13,000 | | | | 7,048,860 | |
Mettler-Toledo International, Inc.(1) | | | 57,000 | | | | 9,654,090 | |
| | | | | | | | 43,250,750 | |
| HEALTH CARE PROVIDERS AND SERVICES — 3.4% | |
Catamaran Corp.(1) | | | 687,000 | | | | 32,398,920 | |
Express Scripts Holding Co.(1) | | | 232,000 | | | | 14,277,280 | |
| | | | | | | | 46,676,200 | |
| | |
| | | | Shares | | | | Value | |
| HEALTH CARE TECHNOLOGY — 0.9% | | | | | | | | |
Cerner Corp.(1) | | | 161,000 | | | | $12,266,590 | |
| HOTELS, RESTAURANTS AND LEISURE — 1.6% | |
| Dunkin’ Brands Group, Inc. | | | 207,000 | | | | 6,417,000 | |
Panera Bread Co., Class A(1) | | | 43,000 | | | | 7,251,520 | |
| Royal Caribbean Cruises Ltd. | | | 61,000 | | | | 2,053,870 | |
| Starwood Hotels & Resorts Worldwide, Inc. | | | 133,000 | | | | 6,896,050 | |
| | | | | | | | 22,618,440 | |
| HOUSEHOLD DURABLES — 1.7% | |
| Lennar Corp., Class A | | | 268,000 | | | | 10,041,960 | |
Toll Brothers, Inc.(1) | | | 395,000 | | | | 13,038,950 | |
| | | | | | | | 23,080,910 | |
| HOUSEHOLD PRODUCTS — 1.0% | |
| Church & Dwight Co., Inc. | | | 265,000 | | | | 13,451,400 | |
| INSURANCE — 0.1% | |
| Cincinnati Financial Corp. | | | 51,000 | | | | 2,031,840 | |
| INTERNET AND CATALOG RETAIL — 1.3% | |
| Expedia, Inc. | | | 133,000 | | | | 7,866,950 | |
priceline.com, Inc.(1) | | | 18,000 | | | | 10,327,860 | |
| | | | | | | | 18,194,810 | |
| INTERNET SOFTWARE AND SERVICES — 2.0% | |
Equinix, Inc.(1) | | | 33,000 | | | | 5,953,530 | |
LinkedIn Corp., Class A(1) | | | 85,000 | | | | 9,089,050 | |
Rackspace Hosting, Inc.(1) | | | 194,000 | | | | 12,355,860 | |
| | | | | | | | 27,398,440 | |
| IT SERVICES — 5.3% | |
Alliance Data Systems Corp.(1) | | | 288,000 | | | | 41,198,400 | |
Cognizant Technology Solutions Corp., Class A(1) | | | 99,000 | | | | 6,598,350 | |
Teradata Corp.(1) | | | 374,000 | | | | 25,547,940 | |
| | | | | | | | 73,344,690 | |
| MACHINERY — 2.5% | |
Chart Industries, Inc.(1) | | | 124,000 | | | | 8,777,960 | |
| Joy Global, Inc. | | | 107,000 | | | | 6,682,150 | |
| Trinity Industries, Inc. | | | 245,000 | | | | 7,663,600 | |
| Valmont Industries, Inc. | | | 82,000 | | | | 11,078,200 | |
| | | | | | | | 34,201,910 | |
| MEDIA — 2.3% | |
| CBS Corp., Class B | | | 274,000 | | | | 8,877,600 | |
Liberty Global, Inc. Class A(1) | | | 124,000 | | | | 7,443,720 | |
| Scripps Networks Interactive, Inc. Class A | | | 110,000 | | | | 6,679,200 | |
Sirius XM Radio, Inc.(1) | | | 3,129,000 | | | | 8,761,200 | |
| | | | | | | | 31,761,720 | |
| METALS AND MINING — 0.6% | |
| Carpenter Technology Corp. | | | 163,000 | | | | 7,923,430 | |
| MULTILINE RETAIL — 1.1% | |
Dollar Tree, Inc.(1) | | | 178,000 | | | | 7,096,860 | |
| Family Dollar Stores, Inc. | | | 126,000 | | | | 8,310,960 | |
| | | | | | | | 15,407,820 | |
| OIL, GAS AND CONSUMABLE FUELS — 3.2% | |
| Cabot Oil & Gas Corp. | | | 493,000 | | | | 23,161,140 | |
Concho Resources, Inc.(1) | | | 149,000 | | | | 12,831,880 | |
Kodiak Oil & Gas Corp.(1) | | | 819,000 | | | | 7,567,560 | |
| | | | | | | | 43,560,580 | |
| PHARMACEUTICALS — 2.7% | |
| Perrigo Co. | | | 194,000 | | | | 22,311,940 | |
Watson Pharmaceuticals, Inc.(1) | | | 174,000 | | | | 14,955,300 | |
| | | | | | | | 37,267,240 | |
| PROFESSIONAL SERVICES — 0.5% | |
IHS, Inc. Class A(1) | | | 74,000 | | | | 6,244,860 | |
| REAL ESTATE INVESTMENT TRUSTS (REITs) — 1.4% | |
| Digital Realty Trust, Inc. | | | 173,000 | | | | 10,627,390 | |
| Ventas, Inc. | | | 139,000 | | | | 8,794,530 | |
| | | | | | | | 19,421,920 | |
| REAL ESTATE MANAGEMENT AND DEVELOPMENT — 0.9% | |
CBRE Group, Inc.(1) | | | 606,000 | | | | 10,920,120 | |
Realogy Holdings Corp.(1) | | | 43,587 | | | | 1,549,082 | |
| | | | | | | | 12,469,202 | |
| ROAD AND RAIL — 3.0% | |
| Canadian Pacific Railway Ltd. | | | 104,000 | | | | 9,574,240 | |
Genesee & Wyoming, Inc. Class A(1) | | | 49,000 | | | | 3,551,030 | |
| Kansas City Southern | | | 357,000 | | | | 28,724,220 | |
| | | | | | | | 41,849,490 | |
| SEMICONDUCTORS AND SEMICONDUCTOR EQUIPMENT — 2.7% | |
| ARM Holdings plc | | | 1,046,000 | | | | 11,225,078 | |
| Avago Technologies Ltd. | | | 271,000 | | | | 8,951,130 | |
NXP Semiconductor NV(1) | | | 171,000 | | | | 4,148,460 | |
| Xilinx, Inc. | | | 404,000 | | | | 13,235,040 | |
| | | | | | | | 37,559,708 | |
| SOFTWARE — 3.0% | |
Citrix Systems, Inc.(1) | | | 289,000 | | | | 17,863,090 | |
CommVault Systems, Inc.(1) | | | 22,000 | | | | 1,374,340 | |
NetSuite, Inc.(1) | | | 248,000 | | | | 15,750,480 | |
Splunk, Inc.(1) | | | 229,000 | | | | 6,423,450 | |
| | | | | | | | 41,411,360 | |
| SPECIALTY RETAIL — 10.7% | |
Cabela’s, Inc.(1) | | | 228,000 | | | | 10,216,680 | |
| DSW, Inc., Class A | | | 207,000 | | | | 12,956,130 | |
| Gap, Inc. (The) | | | 222,000 | | | | 7,929,840 | |
| GNC Holdings, Inc. Class A | | | 401,000 | | | | $15,506,670 | |
Lumber Liquidators Holdings, Inc.(1) | | | 110,000 | | | | 6,140,200 | |
O’Reilly Automotive, Inc.(1) | | | 84,000 | | | | 7,197,120 | |
| PetSmart, Inc. | | | 368,000 | | | | 24,431,520 | |
| Ross Stores, Inc. | | | 251,000 | | | | 15,298,450 | |
Sally Beauty Holdings, Inc.(1) | | | 285,000 | | | | 6,862,800 | |
| Tractor Supply Co. | | | 244,000 | | | | 23,482,560 | |
| Ulta Salon Cosmetics & Fragrance, Inc. | | | 178,000 | | | | 16,415,160 | |
| | | | | | | | 146,437,130 | |
| TEXTILES, APPAREL AND LUXURY GOODS — 3.3% | |
Lululemon Athletica, Inc.(1) | | | 112,000 | | | | 7,729,120 | |
Michael Kors Holdings Ltd.(1) | | | 279,000 | | | | 15,258,510 | |
| PVH Corp. | | | 76,000 | | | | 8,359,240 | |
Under Armour, Inc. Class A(1) | | | 118,000 | | | | 6,166,680 | |
| VF Corp. | | | 47,000 | | | | 7,354,560 | |
| | | | | | | | 44,868,110 | |
| TOBACCO — 0.5% | |
| Lorillard, Inc. | | | 61,000 | | | | 7,076,610 | |
| TRADING COMPANIES AND DISTRIBUTORS — 1.8% | |
| Fastenal Co. | | | 209,000 | | | | 9,342,300 | |
United Rentals, Inc.(1) | | | 394,000 | | | | 16,020,040 | |
| | | | | | | | 25,362,340 | |
| WIRELESS TELECOMMUNICATION SERVICES — 2.2% | |
SBA Communications Corp., Class A(1) | | | 448,000 | | | | 29,850,240 | |
TOTAL COMMON STOCKS (Cost $1,046,073,992) | | | | 1,343,178,693 | |
| Temporary Cash Investments — 2.6% | |
Repurchase Agreement, Bank of America Merrill Lynch, (collateralized by various U.S. Treasury obligations, 1.50% – 2.00%, 1/31/16 – 6/30/16, valued at $15,027,499), in a joint trading account at 0.23%, dated 10/31/12, due 11/1/12 (Delivery value $14,724,685) | | | | $14,724,591 | |
Repurchase Agreement, Credit Suisse First Boston, Inc., (collateralized by various U.S. Treasury obligations, 3.125% – 3.75%, 8/15/41 – 2/15/42, valued at $15,062,436), in a joint trading account at 0.20%, dated 10/31/12, due 11/1/12 (Delivery value $14,724,674) | | | | 14,724,592 | |
Repurchase Agreement, Goldman Sachs & Co., (collateralized by various U.S. Treasury obligations, 4.625%, 2/15/40, valued at $6,254,898), in a joint trading account at 0.16%, dated 10/31/12, due 11/1/12 (Delivery value $6,133,310) | | | | 6,133,283 | |
| SSgA U.S. Government Money Market Fund | | | 24 | | | | 24 | |
TOTAL TEMPORARY CASH INVESTMENTS (Cost $35,582,490) | | | | 35,582,490 | |
TOTAL INVESTMENT SECURITIES — 100.3% (Cost $1,081,656,482) | | | | 1,378,761,183 | |
| OTHER ASSETS AND LIABILITIES — (0.3)% | | | | (4,228,636 | ) |
| TOTAL NET ASSETS — 100.0% | | | | $1,374,532,547 | |
| Forward Foreign Currency Exchange Contracts | |
| Contracts to Buy | Counterparty | Settlement Date | | Value | | | Unrealized Gain (Loss) | |
| | 168,929 | | GBP for USD | Credit Suisse AG | 11/30/12 | | | $272,583 | | | | $1,985 | |
| (Value on Settlement Date $270,598) | |
| | |
| Contracts to Sell | Counterparty | Settlement Date | | Value | | | Unrealized Gain (Loss) | |
| | 6,120,842 | | EUR for USD | UBS AG | 11/30/12 | | | $7,935,460 | | | | $(13,500 | ) |
| | 6,005,871 | | GBP for USD | Credit Suisse AG | 11/30/12 | | | 9,691,046 | | | | (24,297 | ) |
| | | | | | | | | $17,626,506 | | | | $(37,797 | ) |
| (Value on Settlement Date $17,588,709) | |
Notes to Schedule of Investments
EUR = Euro
GBP = British Pound
USD = United States Dollar
See Notes to Financial Statements.
Statement of Assets and Liabilities |
| OCTOBER 31, 2012 | |
| Assets | |
| Investment securities, at value (cost of $1,081,656,482) | | | $1,378,761,183 | |
| Foreign currency holdings, at value (cost of $28,075) | | | 28,189 | |
| Receivable for investments sold | | | 10,979,722 | |
| Receivable for capital shares sold | | | 1,043,799 | |
| Unrealized gain on forward foreign currency exchange contracts | | | 1,985 | |
| Dividends and interest receivable | | | 1,867,479 | |
| | | | 1,392,682,357 | |
| | | | | |
| Liabilities | |
| Payable for investments purchased | | | 15,880,975 | |
| Payable for capital shares redeemed | | | 1,027,596 | |
| Unrealized loss on forward foreign currency exchange contracts | | | 37,797 | |
| Accrued management fees | | | 1,177,270 | |
| Distribution and service fees payable | | | 26,172 | |
| | | | 18,149,810 | |
| | | | | |
| Net Assets | | | $1,374,532,547 | |
| | | | | |
| Net Assets Consist of: | |
| Capital (par value and paid-in surplus) | | | $1,161,159,681 | |
| Accumulated net investment loss | | | (2,816,763 | ) |
| Accumulated net realized loss | | | (80,919,901 | ) |
| Net unrealized appreciation | | | 297,109,530 | |
| | | | $1,374,532,547 | |
| | Net assets | Shares outstanding | Net asset value per share |
| Investor Class, $0.01 Par Value | $1,201,141,468 | 69,465,537 | $17.29 |
| Institutional Class, $0.01 Par Value | $65,754,988 | 3,684,241 | $17.85 |
| A Class, $0.01 Par Value | $94,622,392 | 5,681,423 | $16.65* |
| C Class, $0.01 Par Value | $80,636 | 4,789 | $16.84 |
| R Class, $0.01 Par Value | $12,933,063 | 776,156 | $16.66 |
| *Maximum offering price $17.67 (net asset value divided by 0.9425). |
See Notes to Financial Statements.
| YEAR ENDED OCTOBER 31, 2012 | |
| Investment Income (Loss) | |
| Income: | | | |
| Dividends (net of foreign taxes withheld of $15,930) | | | $10,978,716 | |
| Interest | | | 20,915 | |
| | | | 10,999,631 | |
| | | | | |
| Expenses: | | | | |
| Management fees | | | 14,165,052 | |
| Distribution and service fees: | | | | |
| A Class | | | 271,041 | |
| C Class | | | 823 | |
| R Class | | | 81,341 | |
| Directors’ fees and expenses | | | 57,843 | |
| Other expenses | | | 31 | |
| | | | 14,576,131 | |
| | | | | |
| Net investment income (loss) | | | (3,576,500 | ) |
| | | | | |
| Realized and Unrealized Gain (Loss) | |
| Net realized gain (loss) on: | | | | |
| Investment transactions | | | 100,461,098 | |
| Futures contract transactions | | | (3,584,516 | ) |
| Foreign currency transactions | | | 222,447 | |
| | | | 97,099,029 | |
| | | | | |
| Change in net unrealized appreciation (depreciation) on: | | | | |
| Investments | | | (2,474,966 | ) |
| Translation of assets and liabilities in foreign currencies | | | 168,989 | |
| | | | (2,305,977 | ) |
| | | | | |
| Net realized and unrealized gain (loss) | | | 94,793,052 | |
| | | | | |
| Net Increase (Decrease) in Net Assets Resulting from Operations | | | $91,216,552 | |
See Notes to Financial Statements.
Statement of Changes in Net Assets |
| YEARS ENDED OCTOBER 31, 2012 AND OCTOBER 31, 2011 | |
| Increase (Decrease) in Net Assets | | October 31, 2012 | | | October 31, 2011 | |
| Operations | |
| Net investment income (loss) | | | $(3,576,500 | ) | | | $(9,139,148 | ) |
| Net realized gain (loss) | | | 97,099,029 | | | | 342,241,037 | |
| Change in net unrealized appreciation (depreciation) | | | (2,305,977 | ) | | | (169,580,733 | ) |
| Net increase (decrease) in net assets resulting from operations | | | 91,216,552 | | | | 163,521,156 | |
| | | | | | | | | |
| Capital Share Transactions | |
| Net increase (decrease) in net assets from capital share transactions | | | (312,325,379 | ) | | | (695,555,495 | ) |
| | | | | | | | | |
| Net increase (decrease) in net assets | | | (221,108,827 | ) | | | (532,034,339 | ) |
| | | | | | | | | |
| Net Assets | |
| Beginning of period | | | 1,595,641,374 | | | | 2,127,675,713 | |
| End of period | | | $1,374,532,547 | | | | $1,595,641,374 | |
| | | | | | | | | |
| Accumulated undistributed net investment income (loss) | | | $(2,816,763 | ) | | | $232,336 | |
See Notes to Financial Statements.
Notes to Financial Statements |
OCTOBER 31, 2012
1. Organization
American Century Mutual Funds, Inc. (the corporation) is registered under the Investment Company Act of 1940, as amended (the 1940 Act), as an open-end management investment company and is organized as a Maryland corporation. Vista Fund (the fund) is one fund in a series issued by the corporation. The fund is diversified as defined under the 1940 Act. The fund’s investment objective is to seek long-term capital growth. The fund pursues its objective by investing primarily in stocks of medium-sized and smaller companies that management believes will increase in value over time.
The fund offers the Investor Class, the Institutional Class, the A Class, the C Class and the R Class. The A Class may incur an initial sales charge. The A Class and C Class may be subject to a contingent deferred sales charge. The share classes differ principally in their respective sales charges and distribution and shareholder servicing expenses and arrangements. The Institutional Class is made available to institutional shareholders or through financial intermediaries whose clients do not require the same level of shareholder and administrative services as shareholders of other classes. As a result, the Institutional Class is charged a lower unified management fee.
2. Significant Accounting Policies
The following is a summary of significant accounting policies consistently followed by the fund in preparation of its financial statements. The financial statements are prepared in conformity with accounting principles generally accepted in the United States of America, which may require management to make certain estimates and assumptions at the date of the financial statements. Actual results could differ from these estimates.
Investment Valuations — The fund determines the fair value of its investments and computes its net asset value per share as of the close of regular trading (usually 4 p.m. Eastern time) on the New York Stock Exchange (NYSE) on each day the NYSE is open.
Equity securities that are listed or traded on a domestic securities exchange are valued at the last reported sales price or at the official closing price as provided by the exchange. Equity securities traded on foreign securities exchanges are typically valued at the closing price on the exchange where primarily traded or as of the close of the NYSE, if that is earlier. If no last sales price is reported, or if local convention or regulation so provides, the mean of the latest bid and asked prices is used. Depending on local convention or regulation, securities traded over-the-counter are valued at the mean of the latest bid and asked prices, the last sales price, or the official closing price. In its determination of fair value, the fund may review several factors including: market information specific to a security; news developments in U.S. and foreign markets; the performance of particular U.S. and foreign securities, indices, comparable securities, American Depositary Receipts, Exchange-Traded Funds, and other relevant market indicators.
Debt securities maturing within 60 days at the time of purchase may be valued at cost, plus or minus any amortized discount or premium or at the evaluated mean as provided by an independent pricing service. Evaluated mean prices are commonly derived through utilization of market models, which may consider, among other factors, trade data, quotations from dealers and active market makers, relevant yield curve and spread data, related sector levels, creditworthiness, and other relevant market information on the same or comparable securities.
Investments in open-end management investment companies are valued at the reported net asset value per share. Repurchase agreements are valued at cost. Exchange-traded futures contracts are valued at the settlement price as provided by the appropriate clearing corporation. Forward foreign currency exchange contracts are valued at the mean of the latest bid and asked prices of the forward currency rates as provided by an independent pricing service.
The value of investments initially expressed in foreign currencies is translated into U.S. dollars at prevailing exchange rates.
If the fund determines that the market price for a portfolio security is not readily available or the valuation methods mentioned above do not reflect a security’s fair value, such security is valued as determined in good faith by the Board of Directors or its designee, in accordance with procedures adopted by the Board of Directors. Circumstances that may cause the fund to use these procedures to value a security include, but are not limited to: a security has been declared in default; trading in a security has been halted during the trading day; there is a foreign market holiday and no trading occurred; or an event occurred between the close of a foreign exchange and the NYSE that may affect the value of a security.
Security Transactions — Security transactions are accounted for as of the trade date. Net realized gains and losses are determined on the identified cost basis, which is also used for federal income tax purposes.
Investment Income — Dividend income less foreign taxes withheld, if any, is recorded as of the ex-dividend date. Distributions received on securities that represent a return of capital or capital gain are recorded as a reduction of cost of investments and/or as a realized gain. The fund estimates the components of distributions received that may be considered nontaxable distributions or capital gain distributions for income tax purposes. Interest income is recorded on the accrual basis and includes accretion of discounts and amortization of premiums.
Foreign Currency Translations — All assets and liabilities initially expressed in foreign currencies are translated into U.S. dollars at prevailing exchange rates at period end. The fund may enter into spot foreign currency exchange contracts to facilitate transactions denominated in a foreign currency. Purchases and sales of investment securities, dividend and interest income, spot foreign currency exchange contracts, and expenses are translated at the rates of exchange prevailing on the respective dates of such transactions. Net realized and unrealized foreign currency exchange gains or losses related to investment securities are a component of net realized gain (loss) on investment transactions and change in net unrealized appreciation (depreciation) on investments, respectively.
Business Development Companies — The fund may invest in securities of closed-end investment companies that have elected to be treated as a business development company under the 1940 Act. A business development company operates similar to an exchange-traded fund and represents a portfolio of securities. The fund may purchase a business development company to gain exposure to the securities in the underlying portfolio. The risks of owning a business development company generally reflect the risks of owning the underlying securities. Business development companies have expenses that reduce their value.
Repurchase Agreements — The fund may enter into repurchase agreements with institutions that American Century Investment Management, Inc. (ACIM) (the investment advisor) has determined are creditworthy pursuant to criteria adopted by the Board of Directors. The fund requires that the collateral, represented by securities, received in a repurchase transaction be transferred to the custodian in a manner sufficient to enable the fund to obtain those securities in the event of a default under the repurchase agreement. ACIM monitors, on a daily basis, the securities transferred to ensure the value, including accrued interest, of the securities under each repurchase agreement is equal to or greater than amounts owed to the fund under each repurchase agreement.
Joint Trading Account — Pursuant to an Exemptive Order issued by the Securities and Exchange Commission, the fund, along with certain other funds in the American Century Investments family of funds, may transfer uninvested cash balances into a joint trading account. These balances are invested in one or more repurchase agreements that are collateralized by U.S. Treasury or Agency obligations.
Segregated Assets — In accordance with the 1940 Act, the fund segregates assets on its books and records to cover futures contracts. ACIM monitors, on a daily basis, the securities segregated to ensure the fund designates a sufficient amount of liquid assets, marked-to-market daily. The fund may also receive assets or be required to pledge assets at the custodian bank or with a broker for margin requirements on futures contracts.
Income Tax Status — It is the fund’s policy to distribute substantially all net investment income and net realized gains to shareholders and to otherwise qualify as a regulated investment company under provisions of the Internal Revenue Code. The fund is no longer subject to examination by tax authorities for years prior to 2009. At this time, management believes there are no uncertain tax positions which, based on their technical merit, would not be sustained upon examination and for which it is reasonably possible that the total amounts of unrecognized tax benefits will significantly change in the next twelve months. Accordingly, no provision has been made for federal or state income taxes.
Multiple Class — All shares of the fund represent an equal pro rata interest in the net assets of the class to which such shares belong, and have identical voting, dividend, liquidation and other rights and the same terms and conditions, except for class specific expenses and exclusive rights to vote on matters affecting only individual classes. Income, non-class specific expenses, and realized and unrealized capital gains and losses of the fund are allocated to each class of shares based on their relative net assets.
Distributions to Shareholders — Distributions from net investment income and net realized gains, if any, are generally declared and paid annually.
Indemnifications — Under the corporation’s organizational documents, its officers and directors are indemnified against certain liabilities arising out of the performance of their duties to the fund. In addition, in the normal course of business, the fund enters into contracts that provide general indemnifications. The maximum exposure under these arrangements is unknown as this would involve future claims that may be made against a fund. The risk of material loss from such claims is considered by management to be remote.
3. Fees and Transactions with Related Parties
Management Fees — The corporation has entered into a management agreement with ACIM, under which ACIM provides the fund with investment advisory and management services in exchange for a single, unified management fee (the fee) per class. The agreement provides that all expenses of managing and operating the fund, except distribution and service fees, brokerage expenses, taxes, interest, fees and expenses of the independent directors (including legal counsel fees), and extraordinary expenses, will be paid by ACIM. The fee is computed and accrued daily based on each class’s daily net assets and paid monthly in arrears. The annual management fee is 1.00% for the Investor Class, A Class, C Class and R Class and 0.80% for the Institutional Class.
Distribution and Service Fees — The Board of Directors has adopted a separate Master Distribution and Individual Shareholder Services Plan for each of the A Class, C Class and R Class (collectively the plans), pursuant to Rule 12b-1 of the 1940 Act. The plans provide that the A Class will pay American Century Investment Services, Inc. (ACIS) an annual distribution and service fee of 0.25%. The plans provide that the C Class will pay ACIS an annual distribution and service fee of 1.00%, of which 0.25% is paid for individual shareholder services and 0.75% is paid for distribution services. The plans provide that the R Class will pay ACIS an annual distribution and service fee of 0.50%. The fees are computed and accrued daily based on each class’s daily net assets and paid monthly in arrears. The fees are used to pay financial intermediaries for distribution and individual shareholder services. Fees incurred under the plans during the year ended October 31, 2012 are detailed in the Statement of Operations.
Acquired Fund Fees and Expenses — The fund may invest in mutual funds, exchange-traded funds, and business development companies (the acquired funds). The fund will indirectly realize its pro rata share of the fees and expenses of the acquired funds in which it invests. These indirect fees and expenses are not paid out of the fund’s assets but are reflected in the return realized by the fund on its investment in the acquired funds.
Related Parties — Certain officers and directors of the corporation are also officers and/or directors of American Century Companies, Inc., the parent of the corporation’s investment advisor, ACIM, the distributor of the corporation, ACIS, and the corporation’s transfer agent, American Century Services, LLC. Various funds issued by American Century Asset Allocation Portfolios, Inc. own, in aggregate, 16% of the shares of the fund. These funds do not invest in the fund for the purpose of exercising management or control.
4. Investment Transactions
Purchases and sales of investment securities, excluding short-term investments, for the year ended October 31, 2012 were $1,008,361,991 and $1,343,720,829, respectively.
5. Capital Share Transactions
Transactions in shares of the fund were as follows:
| | Year ended October 31, 2012 | | | Year ended October 31, 2011 | |
| | Shares | | | Amount | | | Shares | | | Amount | |
| Investor Class/Shares Authorized | | 750,000,000 | | | | | | | 750,000,000 | | | | |
| Sold | | 4,873,333 | | | | $81,177,047 | | | | 8,621,805 | | | | $143,273,101 | |
| Redeemed | | (20,339,527 | ) | | | (324,033,168 | ) | | | (39,205,210 | ) | | | (673,000,417 | ) |
| | | (15,466,194 | ) | | | (242,856,121 | ) | | | (30,583,405 | ) | | | (529,727,316 | ) |
| Institutional Class/Shares Authorized | | 80,000,000 | | | | | | | | 80,000,000 | | | | | |
| Sold | | 886,541 | | | | 15,318,015 | | | | 1,888,308 | | | | 31,910,361 | |
| Redeemed | | (2,218,876 | ) | | | (39,285,626 | ) | | | (6,639,853 | ) | | | (114,083,570 | ) |
| | | (1,332,335 | ) | | | (23,967,611 | ) | | | (4,751,545 | ) | | | (82,173,209 | ) |
| A Class/Shares Authorized | | 310,000,000 | | | | | | | | 310,000,000 | | | | | |
| Sold | | 1,022,625 | | | | 16,651,054 | | | | 2,133,309 | | | | 34,631,696 | |
| Redeemed | | (3,331,130 | ) | | | (54,130,918 | ) | | | (6,781,320 | ) | | | (109,933,117 | ) |
| | | (2,308,505 | ) | | | (37,479,864 | ) | | | (4,648,011 | ) | | | (75,301,421 | ) |
| C Class/Shares Authorized | | 50,000,000 | | | | | | | | 50,000,000 | | | | | |
| Sold | | 238 | | | | 3,918 | | | | 3,649 | | | | 62,747 | |
| Redeemed | | (860 | ) | | | (14,472 | ) | | | (227 | ) | | | (3,470 | ) |
| | | (622 | ) | | | (10,554 | ) | | | 3,422 | | | | 59,277 | |
| R Class/Shares Authorized | | 10,000,000 | | | | | | | | 10,000,000 | | | | | |
| Sold | | 158,086 | | | | 2,624,418 | | | | 269,541 | | | | 4,389,911 | |
| Redeemed | | (644,443 | ) | | | (10,635,647 | ) | | | (805,128 | ) | | | (12,802,737 | ) |
| | | (486,357 | ) | | | (8,011,229 | ) | | | (535,587 | ) | | | (8,412,826 | ) |
| Net increase (decrease) | | (19,594,013 | ) | | | $(312,325,379 | ) | | | (40,515,126 | ) | | | $(695,555,495 | ) |
6. Fair Value Measurements
The fund’s securities valuation process is based on several considerations and may use multiple inputs to determine the fair value of the positions held by the fund. In conformity with accounting principles generally accepted in the United States of America, the inputs used to determine a valuation are classified into three broad levels as follows:
| • | Level 1 valuation inputs consist of unadjusted quoted prices in an active market for identical securities; |
| • | Level 2 valuation inputs consist of direct or indirect observable market data (including quoted prices for similar securities, evaluations of subsequent market events, interest rates, prepayment speeds, credit risk, etc.); or |
| • | Level 3 valuation inputs consist of unobservable data (including a fund’s own assumptions). |
The level classification is based on the lowest level input that is significant to the fair valuation measurement. The valuation inputs are not necessarily an indication of the risks associated with investing in these securities or other financial instruments.
The following is a summary of the level classifications as of period end. The Schedule of Investments provides additional information on the fund’s portfolio holdings.
| | | Level 1 | | | Level 2 | | | Level 3 | |
| Investment Securities | |
| Domestic Common Stocks | | | $1,257,886,192 | | | | — | | | | — | |
| Foreign Common Stocks | | | 64,390,320 | | | | $20,902,181 | | | | — | |
| Temporary Cash Investments | | | 24 | | | | 35,582,466 | | | | — | |
| Total Value of Investment Securities | | | $1,322,276,536 | | | | $56,484,647 | | | | — | |
| | | | | | | | | | | | | |
| Other Financial Instruments | |
Total Unrealized Gain (Loss) on Forward Foreign Currency Exchange Contracts | | | — | | | | $(35,812 | ) | | | — | |
7. Derivative Instruments
Equity Price Risk — The fund is subject to equity price risk in the normal course of pursuing its investment objectives. A fund may enter into futures contracts based on an equity index in order to manage its exposure to changes in market conditions. A fund may purchase futures contracts to gain exposure to increases in market value or sell futures contracts to protect against a decline in market value. Upon entering into a futures contract, a fund is required to deposit either cash or securities in an amount equal to a certain percentage of the contract value (initial margin). Subsequent payments (variation margin) are made or received daily, in cash, by a fund. The variation margin is equal to the daily change in the contract value and is recorded as unrealized gains and losses. A fund recognizes a realized gain or loss when the contract is closed or expires. Net realized and unrealized gains or losses occurring during the holding period of futures contracts are a component of net realized gain (loss) on futures contract transactions and change in net unrealized appreciation (depreciation) on futures contracts, respectively. One of the risks of entering into futures contracts is the possibility that the change in value of the contract may not correlate with the changes in value of the underlying securities. During the period, the fund infrequently purchased equity price risk derivative instruments for temporary investment purposes.
Foreign Currency Risk — The fund is subject to foreign currency exchange rate risk in the normal course of pursuing its investment objectives. The value of foreign investments held by a fund may be significantly affected by changes in foreign currency exchange rates. The dollar value of a foreign security generally decreases when the value of the dollar rises against the foreign currency in which the security is denominated and tends to increase when the value of the dollar declines against such foreign currency. A fund may enter into forward foreign currency exchange contracts to reduce a fund’s exposure to foreign currency exchange rate fluctuations. The net U.S. dollar value of foreign currency underlying all contractual commitments held by a fund and the resulting unrealized appreciation or depreciation are determined daily. Realized gain or loss is recorded upon the termination of the contract. Net realized and unrealized gains or losses occurring during the holding period of forward foreign currency exchange contracts are a component of net realized gain (loss) on foreign currency transactions and change in net unrealized appreciation (depreciation) on translation of assets and liabilities in foreign currencies, respectively. A fund bears the risk of an unfavorable change in the foreign currency exchange rate underlying the forward contract. Additionally, losses, up to the fair value, may arise if the counterparties do not perform under the contract terms. The foreign currency risk derivative instruments held at period end as disclosed on the Schedule of Investments are indicative of the fund’s typical volume during the period.
| Value of Derivative Instruments as of October 31, 2012 | |
| | Asset Derivatives | | Liability Derivatives | |
Type of Risk Exposure | Location on Statement of Assets and Liabilities | | Value | | Location on Statement of Assets and Liabilities | | Value | |
| Foreign Currency Risk | Unrealized gain on forward foreign currency exchange contracts | | | $1,985 | | Unrealized loss on forward foreign currency exchange contracts | | | $37,797 | |
| | |
| Effect of Derivative Instruments on the Statement of Operations for the Year Ended October 31, 2012 | |
| | |
| | Net Realized Gain (Loss) | | Change in Net Unrealized Appreciation (Depreciation) | |
Type of Risk Exposure | Location on Statement of Operations | | Value | | Location on Statement of Operations | | Value | |
| Equity Price Risk | Net realized gain (loss) on futures contract transactions | | | $(3,584,516 | ) | Change in net unrealized appreciation (depreciation) on futures contracts | | | — | |
| Foreign Currency Risk | Net realized gain (loss) on foreign currency transactions | | | 191,802 | | Change in net unrealized appreciation (depreciation) on translation of assets and liabilities in foreign currencies | | | $192,191 | |
| | | | | $(3,392,714 | ) | | | | $192,191 | |
8. Risk Factors
There are certain risks involved in investing in foreign securities. These risks include those resulting from future adverse political, social and economic developments, fluctuations in currency exchange rates, the possible imposition of exchange controls, and other foreign laws or restrictions.
The fund invests in common stocks of small companies. Because of this, it may be subject to greater risk and market fluctuations than a fund investing in larger, more established companies.
9. Federal Tax Information
The book-basis character of distributions made during the year from net investment income or net realized gains may differ from their ultimate characterization for federal income tax purposes. These differences reflect the differing character of certain income items and net realized gains and losses for financial statement and tax purposes, and may result in reclassification among certain capital accounts on the financial statements. There were no distributions paid by the fund during the years ended October 31, 2012 and October 31, 2011.
As of October 31, 2012, the federal tax cost of investments and the components of distributable earnings on a tax-basis were as follows:
| Federal tax cost of investments | | | $1,085,843,743 | |
| Gross tax appreciation of investments | | | $318,291,203 | |
| Gross tax depreciation of investments | | | (25,373,763 | ) |
| Net tax appreciation (depreciation) of investments | | | $292,917,440 | |
| Net tax appreciation (depreciation) on derivatives and translation of assets and liabilities in foreign currencies | | | $40,641 | |
| Net tax appreciation (depreciation) | | | $292,958,081 | |
| Undistributed ordinary income | | | — | |
| Accumulated short-term capital losses | | | $(76,732,640 | ) |
| Late-year ordinary loss deferral | | | $(2,852,575 | ) |
The difference between book-basis and tax-basis cost and unrealized appreciation (depreciation) is attributable primarily to the tax deferral of losses on wash sales and the realization for tax purposes of unrealized gains (losses) on certain foreign currency exchange contracts.
Accumulated capital losses represent net capital loss carryovers that may be used to offset future realized capital gains for federal income tax purposes. Future capital loss carryover utilization in any given year may be subject to Internal Revenue Code limitations. Capital loss carryovers expire in 2017.
Loss deferrals represent certain qualified losses that the fund has elected to treat as having been incurred in the following fiscal year for federal income tax purposes.
| For a Share Outstanding Throughout the Years Ended October 31 (except as noted) | |
| Per-Share Data | | | Ratios and Supplemental Data | |
| | | | | | Income From Investment Operations: | | | | | | | | | | | | Ratio to Average Net Assets of: | | | | | | | |
| | | Net Asset Value, Beginning of Period | | | Net Investment Income (Loss)(1) | | | Net Realized and Unrealized Gain (Loss) | | | Total From Investment Operations | | | Distributions From Net Realized Gains | | | Net Asset Value, End of Period | | | Total Return(2) | | | Operating Expenses(3) | | | Net Investment Income (Loss) | | | Portfolio Turnover Rate | | | Net Assets, End of Period (in thousands) | |
| Investor Class | |
| 2012 | | | $16.11 | | | | (0.04 | ) | | | 1.22 | | | | 1.18 | | | | — | | | | $17.29 | | | | 7.32 | % | | | 1.00 | % | | | (0.23 | )% | | | 71 | % | | | $1,201,141 | |
| 2011 | | | $15.25 | | | | (0.08 | ) | | | 0.94 | | | | 0.86 | | | | — | | | | $16.11 | | | | 5.64 | % | | | 1.00 | % | | | (0.44 | )% | | | 90 | % | | | $1,368,299 | |
| 2010 | | | $12.13 | | | | (0.06 | ) | | | 3.18 | | | | 3.12 | | | | — | | | | $15.25 | | | | 25.72 | % | | | 1.01 | % | | | (0.45 | )% | | | 132 | % | | | $1,761,319 | |
| 2009 | | | $12.43 | | | | (0.05 | ) | | | (0.25 | ) | | | (0.30 | ) | | | — | | | | $12.13 | | | | (2.41 | )% | | | 1.00 | % | | | (0.48 | )% | | | 183 | % | | | $1,690,576 | |
| 2008 | | | $24.24 | | | | (0.11 | ) | | | (9.61 | ) | | | (9.72 | ) | | | (2.09 | ) | | | $12.43 | | | | (43.58 | )% | | | 1.00 | % | | | (0.56 | )% | | | 167 | % | | | $1,800,788 | |
| Institutional Class | |
| 2012 | | | $16.60 | | | | (0.01 | ) | | | 1.26 | | | | 1.25 | | | | — | | | | $17.85 | | | | 7.53 | % | | | 0.80 | % | | | (0.03 | )% | | | 71 | % | | | $65,755 | |
| 2011 | | | $15.67 | | | | (0.04 | ) | | | 0.97 | | | | 0.93 | | | | — | | | | $16.60 | | | | 5.93 | % | | | 0.80 | % | | | (0.24 | )% | | | 90 | % | | | $83,261 | |
| 2010 | | | $12.45 | | | | (0.03 | ) | | | 3.25 | | | | 3.22 | | | | — | | | | $15.67 | | | | 25.86 | % | | | 0.81 | % | | | (0.25 | )% | | | 132 | % | | | $153,112 | |
| 2009 | | | $12.73 | | | | (0.03 | ) | | | (0.25 | ) | | | (0.28 | ) | | | — | | | | $12.45 | | | | (2.12 | )% | | | 0.80 | % | | | (0.28 | )% | | | 183 | % | | | $211,357 | |
| 2008 | | | $24.72 | | | | (0.07 | ) | | | (9.83 | ) | | | (9.90 | ) | | | (2.09 | ) | | | $12.73 | | | | (43.50 | )% | | | 0.80 | % | | | (0.36 | )% | | | 167 | % | | | $238,727 | |
A Class(4) | |
| 2012 | | | $15.56 | | | | (0.08 | ) | | | 1.17 | | | | 1.09 | | | | — | | | | $16.65 | | | | 7.01 | % | | | 1.25 | % | | | (0.48 | )% | | | 71 | % | | | $94,622 | |
| 2011 | | | $14.76 | | | | (0.11 | ) | | | 0.91 | | | | 0.80 | | | | — | | | | $15.56 | | | | 5.42 | % | | | 1.25 | % | | | (0.69 | )% | | | 90 | % | | | $124,296 | |
| 2010 | | | $11.77 | | | | (0.09 | ) | | | 3.08 | | | | 2.99 | | | | — | | | | $14.76 | | | | 25.40 | % | | | 1.26 | % | | | (0.70 | )% | | | 132 | % | | | $186,529 | |
| 2009 | | | $12.09 | | | | (0.08 | ) | | | (0.24 | ) | | | (0.32 | ) | | | — | | | | $11.77 | | | | (2.65 | )% | | | 1.25 | % | | | (0.73 | )% | | | 183 | % | | | $255,419 | |
| 2008 | | | $23.69 | | | | (0.15 | ) | | | (9.36 | ) | | | (9.51 | ) | | | (2.09 | ) | | | $12.09 | | | | (43.72 | )% | | | 1.25 | % | | | (0.81 | )% | | | 167 | % | | | $257,057 | |
| For a Share Outstanding Throughout the Years Ended October 31 (except as noted) | |
| Per-Share Data | | | Ratios and Supplemental Data | |
| | | | | | Income From Investment Operations: | | | | | | | | | | | | Ratio to Average Net Assets of: | | | | | | | |
| | | Net Asset Value, Beginning of Period | | | Net Investment Income (Loss)(1) | | | Net Realized and Unrealized Gain (Loss) | | | Total From Investment Operations | | | Distributions From Net Realized Gains | | | Net Asset Value, End of Period | | | Total Return(2) | | | Operating Expenses(3) | | | Net Investment Income (Loss) | | | Portfolio Turnover Rate | | | Net Assets, End of Period (in thousands) | |
| C Class | |
| 2012 | | | $15.85 | | | | (0.21 | ) | | | 1.20 | | | | 0.99 | | | | — | | | | $16.84 | | | | 6.25 | % | | | 2.00 | % | | | (1.23 | )% | | | 71 | % | | | $81 | |
| 2011 | | | $15.15 | | | | (0.25 | ) | | | 0.95 | | | | 0.70 | | | | — | | | | $15.85 | | | | 4.62 | % | | | 2.00 | % | | | (1.44 | )% | | | 90 | % | | | $86 | |
2010(5) | | | $13.73 | | | | (0.14 | ) | | | 1.56 | | | | 1.42 | | | | — | | | | $15.15 | | | | 10.34 | % | | | 2.01 | %(6) | | | (1.51 | )%(6) | | | 132 | %(7) | | | $30 | |
| R Class | |
| 2012 | | | $15.60 | | | | (0.12 | ) | | | 1.18 | | | | 1.06 | | | | — | | | | $16.66 | | | | 6.73 | % | | | 1.50 | % | | | (0.73 | )% | | | 71 | % | | | $12,933 | |
| 2011 | | | $14.84 | | | | (0.16 | ) | | | 0.92 | | | | 0.76 | | | | — | | | | $15.60 | | | | 5.19 | % | | | 1.50 | % | | | (0.94 | )% | | | 90 | % | | | $19,700 | |
| 2010 | | | $11.87 | | | | (0.13 | ) | | | 3.10 | | | | 2.97 | | | | — | | | | $14.84 | | | | 25.02 | % | | | 1.51 | % | | | (0.95 | )% | | | 132 | % | | | $26,686 | |
| 2009 | | | $12.22 | | | | (0.12 | ) | | | (0.23 | ) | | | (0.35 | ) | | | — | | | | $11.87 | | | | (2.86 | )% | | | 1.50 | % | | | (0.98 | )% | | | 183 | % | | | $22,618 | |
| 2008 | | | $23.98 | | | | (0.18 | ) | | | (9.49 | ) | | | (9.67 | ) | | | (2.09 | ) | | | $12.22 | | | | (43.87 | )% | | | 1.50 | % | | | (1.06 | )% | | | 167 | % | | | $11,423 | |
Notes to Financial Highlights
| (1) | Computed using average shares outstanding throughout the period. |
| (2) | Total returns are calculated based on the net asset value of the last business day and do not reflect applicable sales charges, if any. Total returns for periods less than one year are not annualized. |
| (3) | Ratio of operating expenses to average net assets does not include any fees and expenses of the acquired funds. |
| (4) | Prior to March 1, 2010, the A Class was referred to as the Advisor Class. |
| (5) | March 1, 2010 (commencement of sale) through October 31, 2010. |
| (7) | Portfolio turnover is calculated at the fund level. Percentage indicated was calculated for the year ended October 31, 2010. |
See Notes to Financial Statements.
Report of Independent Registered Public Accounting Firm |
The Board of Directors and Shareholders of
American Century Mutual Funds, Inc.:
We have audited the accompanying statement of assets and liabilities, including the schedule of investments, of Vista Fund, one of the funds constituting American Century Mutual Funds, Inc. (the “Corporation”) as of October 31, 2012, and the related statement of operations for the year then ended, the statement of changes in net assets for each of the two years in the period then ended, and the financial highlights for each of the periods presented. These financial statements and financial highlights are the responsibility of the Corporation’s management. Our responsibility is to express an opinion on these financial statements and financial highlights based on our audits.
We conducted our audits in accordance with the standards of the Public Company Accounting Oversight Board (United States). Those standards require that we plan and perform the audit to obtain reasonable assurance about whether the financial statements and financial highlights are free of material misstatement. The Corporation is not required to have, nor were we engaged to perform, an audit of its internal control over financial reporting. Our audits included consideration of internal control over financial reporting as a basis for designing audit procedures that are appropriate in the circumstances, but not for the purpose of expressing an opinion on the effectiveness of the Corporation’s internal control over financial reporting. Accordingly, we express no such opinion. An audit also includes examining, on a test basis, evidence supporting the amounts and disclosures in the financial statements, assessing the accounting principles used and significant estimates made by management, as well as evaluating the overall financial statement presentation. Our procedures included confirmation of securities owned as of October 31, 2012, by correspondence with the custodian and brokers; where replies were not received from brokers, we performed other auditing procedures. We believe that our audits provide a reasonable basis for our opinion.
In our opinion, the financial statements and financial highlights referred to above present fairly, in all material respects, the financial position of Vista Fund of American Century Mutual Funds, Inc., as of October 31, 2012, the results of its operations for the year then ended, the changes in its net assets for each of the two years in the period then ended, and the financial highlights for each of the periods presented, in conformity with accounting principles generally accepted in the United States of America.
Deloitte & Touche LLP
Kansas City, Missouri
December 19, 2012
The individuals listed below serve as directors of the funds. Each director will continue to serve in this capacity until death, retirement, resignation or removal from office. The mandatory retirement age for directors who are not “interested persons,” as that term is defined in the Investment Company Act (independent directors), is 72. However, the mandatory retirement age for an individual director may be extended with the approval of the remaining independent directors.
Mr. Thomas is an “interested person” because he currently serves as President and Chief Executive Officer of American Century Companies, Inc. (ACC), the parent company of American Century Investment Management, Inc. (ACIM or the advisor). Mr. Fink is an “interested person” because he currently serves as Executive Vice President of ACC.
The other directors (more than three-fourths of the total number) are independent; that is, they have never been employees, directors or officers of, and have no financial interest in, ACC or any of its wholly owned, direct or indirect, subsidiaries, including ACIM, American Century Investment Services, Inc. (ACIS) and American Century Services, LLC (ACS). The directors serve in this capacity for seven (in the case of Mr. Thomas, 15) registered investment companies in the American Century Investments family of funds.
The following table presents additional information about the directors. The mailing address for each director is 4500 Main Street, Kansas City, Missouri 64111.
Name (Year of Birth) | | Position(s) Held with Funds | | Length of Time Served | | Principal Occupation(s) During Past 5 Years | | Number of American Century Portfolios Overseen by Director | | Other Directorships Held During Past 5 Years |
| Independent Directors |
Thomas A. Brown (1940) | | Director | | Since 1980 | | Managing Member, Associated Investments, LLC (real estate investment company); Brown Cascade Properties, LLC (real estate investment company) (2001 to 2009) | | 66 | | None |
Andrea C. Hall (1945) | | Director | | Since 1997 | | Retired | | 66 | | None |
Jan M. Lewis (1957) | | Director | | Since 2011 | | President and Chief Executive Officer, Catholic Charities of Northeast Kansas (human services organization) | | 66 | | None |
James A. Olson (1942) | | Director | | Since 2007 | | Member, Plaza Belmont LLC (private equity fund manager) | | 66 | | Saia, Inc. (2002 to 2012) and Entertainment Properties Trust |
Donald H. Pratt (1937) | | Director and Chairman of the Board | | Since 1995 (Chairman since 2005) | | Chairman and Chief Executive Officer, Western Investments, Inc. (real estate company) | | 66 | | None |
Name (Year of Birth) | | Position(s) Held with Funds | | Length of Time Served | | Principal Occupation(s) During Past 5 Years | | Number of American Century Portfolios Overseen by Director | | Other Directorships Held During Past 5 Years |
| Independent Directors |
M. Jeannine Strandjord (1945) | | Director | | Since 1994 | | Retired | | 66 | | Euronet Worldwide Inc.; Charming Shoppes, Inc. (2006 to 2010); and DST Systems Inc. (1996 to 2012) |
John R. Whitten (1946) | | Director | | Since 2008 | | Retired | | 66 | | Rudolph Technologies, Inc. |
Stephen E. Yates (1948) | | Director | | Since 2012 | | Retired; Executive Vice President, Technology & Operations, KeyCorp. (computer services) (2004 to 2010) | | 66 | | Applied Industrial Technologies, Inc. (2001 to 2010) |
| |
| Interested Directors |
Barry Fink (1955) | | Director and Executive Vice President | | Since 2012 (Executive Vice President since 2007) | | Executive Vice President, ACC (September 2007 to present); President, ACS (October 2007 to present); Chief Operating Officer, ACC (September 2007 to November 2012). Also serves as Manager, ACS | | 66 | | None |
Jonathan S. Thomas (1963) | | Director and President | | Since 2007 | | President and Chief Executive Officer, ACC (March 2007 to present). Also serves as Chief Executive Officer and Manager, ACS; Executive Vice President, ACIM; Director, ACC, ACIM and other ACC subsidiaries | | 108 | | None |
Officers
The following table presents certain information about the executive officers of the funds. Each officer serves as an officer for each of the 15 investment companies in the American Century family of funds, unless otherwise noted. No officer is compensated for his or her service as an officer of the funds. The listed officers are interested persons of the funds and are appointed or re-appointed on an annual basis. The mailing address for each officer listed below is 4500 Main Street, Kansas City, Missouri 64111.
Name (Year of Birth) | | Offices with the Funds | | Principal Occupation(s) During the Past Five Years |
Jonathan S. Thomas (1963) | | Director and President since 2007 | | President and Chief Executive Officer, ACC (March 2007 to present). Also serves as Chief Executive Officer and Manager, ACS; Executive Vice President, ACIM; Director, ACC, ACIM and other ACC subsidiaries |
Barry Fink (1955) | | Director since 2012 and Executive Vice President since 2007 | | Executive Vice President, ACC (September 2007 to present); President, ACS (October 2007 to present); Chief Operating Officer, ACC (September 2007 to November 2012). Also serves as Manager, ACS |
Maryanne L. Roepke (1956) | | Chief Compliance Officer since 2006 and Senior Vice President since 2000 | | Chief Compliance Officer, American Century funds, ACIM and ACS (August 2006 to present). Also serves as Senior Vice President, ACS |
Charles A. Etherington (1957) | | General Counsel since 2007 and Senior Vice President since 2006 | | Attorney, ACC (February 1994 to present); Vice President, ACC (November 2005 to present), General Counsel, ACC (March 2007 to present). Also serves as General Counsel, ACIM, ACS, ACIS and other ACC subsidiaries; and Senior Vice President, ACIM and ACS |
C. Jean Wade (1964) | | Vice President, Treasurer and Chief Financial Officer since 2012 | | Vice President, ACS (February 2000 to present) |
Robert J. Leach (1966) | | Vice President since 2006 and Assistant Treasurer since 2012 | | Vice President, ACS (February 2000 to present) |
David H. Reinmiller (1963) | | Vice President since 2000 | | Attorney, ACC (January 1994 to present); Associate General Counsel, ACC (January 2001 to present). Also serves as Vice President, ACIM and ACS |
Ward D. Stauffer (1960) | | Secretary since 2005 | | Attorney, ACC (June 2003 to present) |
The Statement of Additional Information has additional information about the fund’s directors and is available without charge, upon request, by calling 1-800-345-2021.
Approval of Management Agreement |
At a meeting held on June 21, 2012, the Fund’s Board of Directors unanimously approved the renewal of the management agreement pursuant to which American Century Investment Management, Inc. (the “Advisor”) acts as the investment advisor for the Fund. Under Section 15(c) of the Investment Company Act, contracts for investment advisory services are required to be reviewed, evaluated, and approved by a majority of a fund’s independent directors (the “Directors”) each year.
As a part of the approval process, the Board requested and reviewed extensive data and information compiled by the Advisor and certain independent providers of evaluation data concerning the Fund and the services provided to the Fund by the Advisor. This review was in addition to the oversight and evaluation undertaken by the Board and its committees on a continuous basis throughout the year and included, but was not limited to the following:
| • | the nature, extent, and quality of investment management, shareholder services, and other services provided by the Advisor to the Fund; |
| • | the wide range of other programs and services the Advisor provides to the Fund and its shareholders on a routine and non-routine basis; |
| • | the investment performance of the fund, including data comparing the Fund’s performance to appropriate benchmarks and/or a peer group of other mutual funds with similar investment objectives and strategies; |
| • | data comparing the cost of owning the Fund to the cost of owning similar funds; |
| • | the Advisor’s compliance policies, procedures, and regulatory experience; |
| • | financial data showing the cost of services provided to the Fund, the profitability of the Fund to the Advisor, and the overall profitability of the Advisor; |
| • | data comparing services provided and charges to other investment management clients of the Advisor; and |
| • | consideration of collateral benefits derived by the Advisor from the management of the Fund and any potential economies of scale relating thereto. |
In keeping with its practice, the Board held two in-person meetings and one telephonic meeting to review and discuss the information provided. The Directors also had the benefit of the advice of independent counsel throughout the period.
Factors Considered
The Directors considered all of the information provided by the Advisor, the independent data providers, and independent counsel, and evaluated such information for the Fund. In connection with their review, the Directors did not identify any single factor as being all-important or controlling, and each Director may have attributed different levels of importance to different factors. In deciding to renew the management agreement, the Board based its decision on a number of factors, including the following:
Nature, Extent and Quality of Services — Generally. Under the management agreement, the Advisor is responsible for providing or arranging for all services necessary for the operation of the Fund. The Board noted that under the management agreement, the Advisor provides or arranges at its own expense a wide variety of services including:
| • | constructing and designing the Fund |
| • | portfolio research and security selection |
| • | initial capitalization/funding |
| • | daily valuation of the Fund’s portfolio |
| • | shareholder servicing and transfer agency, including shareholder confirmations, recordkeeping, and communications |
| • | regulatory and portfolio compliance |
| • | marketing and distribution |
The Board noted that many of these services have expanded over time both in terms of quantity and complexity in response to shareholder demands, competition in the industry, changing distribution channels, and the changing regulatory environment.
Investment Management Services. The nature of the investment management services provided to the Fund is quite complex and allows Fund shareholders access to professional money management, instant diversification of their investments within an asset class, the opportunity to easily diversify among asset classes by investing in or exchanging among various American Century Investments funds, and liquidity. In evaluating investment performance, the Board expects the Advisor to manage the Fund in accordance with its investment objectives and approved strategies. Further, the Directors recognize that the Advisor has an obligation to monitor trading activities, and in particular to seek the best execution of fund trades, and to evaluate the use of and payment for research. In providing these services, the Advisor utilizes teams of investment professionals (portfolio managers, analysts, research assistants, and securities traders) who require extensive information technology, research, training, compliance and other systems to conduct their business. The Board, directly and through its Fund Performance Review Committee, regularly reviews investment performance information for the Fund, together with comparative information for appropriate benchmarks and/or peer groups of similarly-managed funds, over different time
horizons. The Directors also review detailed performance information during the management agreement approval process. If performance concerns are identified, the Fund receives special reviews until performance improves, during which the Board discusses with the Advisor the reasons for such results (e.g., market conditions, security selection) and any efforts being undertaken to improve performance. Taking all these factors into consideration, the Board found the investment management services provided by the Advisor to the Fund to meet or exceed industry standards. More detailed information about the Fund’s performance can be found in the Performance and Portfolio Commentary sections of this report.
Shareholder and Other Services. Under the management agreement, the Advisor provides the Fund with a comprehensive package of transfer agency, shareholder, and other services. The Board, directly and through various committees of the Board, regularly reviews reports and evaluations of such services at its regular meetings. These reports include, but are not limited to, information regarding the operational efficiency and accuracy of the shareholder and transfer agency services provided, staffing levels, shareholder satisfaction (as measured by external as well as internal sources), technology support, new products and services offered to Fund shareholders, securities trading activities, portfolio valuation services, auditing services, and legal and operational compliance activities. Certain aspects of shareholder and transfer agency service level efficiency and the quality of securities trading activities are measured by independent third party providers and are presented in comparison to other fund groups not managed by the Advisor. The Board found the services provided by the Advisor to the Fund under the management agreement to be competitive and of high quality.
Costs of Services and Profitability. The Advisor provides detailed information concerning its cost of providing various services to the Fund, its profitability in managing the Fund, its overall profitability, and its financial condition. The Directors have reviewed with the Advisor the methodology used to prepare this financial information. The financial information regarding the Advisor is considered in evaluating the Advisor’s financial condition, ability to continue to provide services under the management agreement, and the reasonableness of the current management fee. The Board concluded that the Advisor’s profits were reasonable in light of the services provided to the Fund.
Ethics. The Board generally considers the Advisor’s commitment to providing quality services to shareholders and to conducting its business ethically. They noted that the Advisor’s practices generally meet or exceed industry best practices.
Economies of Scale. The Board also reviewed information provided by the Advisor regarding the possible existence of economies of scale in connection with the management of the Fund. The Board concluded that economies of scale are difficult to measure and predict with precision, especially on a fund-by-fund basis. The Board concluded that the Advisor is appropriately sharing economies of scale through its competitive fee structure, offering competitive fees from fund inception, and through reinvestment in its business to provide shareholders additional content and services.
Comparison to Other Funds’ Fees. The management agreement provides that the Fund pay the Advisor a single, all-inclusive (or unified) management fee for providing all services necessary for the management and operation of the Fund, other than brokerage expenses, taxes, interest, extraordinary expenses, and the fees and expenses of the Fund’s independent directors (including their independent legal counsel) and expenses incurred in connection with the provision of shareholder services and distribution services under a plan adopted pursuant to Rule 12b-1 under the 1940 Act. Under the unified fee structure, the Advisor is responsible for providing all investment advisory, custody, audit, administrative, compliance, recordkeeping, marketing and shareholder services, or arranging and supervising third parties to provide such services. By contrast, most other funds are charged a variety of fees, including an investment advisory fee, a transfer agency fee, an administrative fee, distribution charges and other expenses. Other than their investment advisory fees and any applicable Rule 12b-1 distribution fees, all other components of the total fees charged by these other funds may be increased without shareholder approval. The Board believes the unified fee structure is a benefit to Fund shareholders because it clearly discloses to shareholders the cost of owning Fund shares, and, since the unified fee cannot be increased without a vote of Fund shareholders, it shifts to the Advisor the risk of increased costs of operating the Fund and provides a direct incentive to minimize administrative inefficiencies. Part of the Board’s analysis of fee levels involves reviewing certain evaluative data compiled by an independent provider and comparing the Fund’s unified fee to the total expense ratio of other funds in the Fund’s peer group. The Board concluded that the management fee paid by the Fund to the Advisor under the management agreement is reasonable in light of the services provided to the Fund.
Comparison to Fees and Services Provided to Other Clients of the Advisor. The Board also requested and received information from the Advisor concerning the nature of the services, fees, costs and profitability of its advisory services to advisory clients other than the Fund. They observed that these varying types of client accounts require different services and involve different regulatory and entrepreneurial risks than the management of the Fund. The Board analyzed this information and concluded that the fees charged and services provided to the Fund were reasonable by comparison.
Collateral or “Fall-Out” Benefits Derived by the Advisor. The Board considered the existence of collateral benefits the Advisor may receive as a result of its relationship with the Fund. They concluded that the Advisor’s primary business is managing mutual funds and it generally does not use fund or shareholder information to generate profits in other lines of business, and therefore does not derive any significant collateral benefits from them. The Board noted that the Advisor receives proprietary research from broker-dealers that execute fund portfolio transactions and concluded that this research is likely to benefit Fund shareholders. The Board also determined that the Advisor is able to provide investment management services to certain clients other than the Fund, at least in part, due to its existing infrastructure built to serve the fund complex. The Board concluded, however, that the assets of those other clients are not material to the analysis and, where applicable, may be included with the assets of the Fund to determine breakpoints in the management fee schedule.
Existing Relationship. The Board also considered whether there was any reason for not continuing the existing arrangement with the Advisor. In this regard, the Board was mindful of the potential disruptions of the Fund’s operations and various risks, uncertainties, and other effects that could occur as a result of a decision not to continue such relationship. In particular, the Board recognized that most shareholders have invested in the Fund on the strength of the Advisor’s industry standing and reputation and in the expectation that the Advisor will have a continuing role in providing advisory services to the Fund.
Conclusion of the Directors. As a result of this process, the Board, including all of the independent directors, taking into account all of the factors discussed above and the information provided by the Advisor and others, concluded that the management agreement between the Fund and the Advisor is fair and reasonable in light of the services provided and should be renewed.
Retirement Account Information
As required by law, distributions you receive from certain IRAs, or 403(b), 457 and qualified plans are subject to federal income tax withholding, unless you elect not to have withholding apply. Tax will be withheld on the total amount withdrawn even though you may be receiving amounts that are not subject to withholding, such as nondeductible contributions. In such case, excess amounts of withholding could occur. You may adjust your withholding election so that a greater or lesser amount will be withheld.
If you don’t want us to withhold on this amount, you must notify us to not withhold the federal income tax. You may notify us in writing or in certain situations by telephone or through other electronic means. You have the right to revoke your withholding election at any time and any election you make may remain in effect until revoked by filing a new election.
Remember, even if you elect not to have income tax withheld, you are liable for paying income tax on the taxable portion of your withdrawal. If you elect not to have income tax withheld or you don’t have enough income tax withheld, you may be responsible for payment of estimated tax. You may incur penalties under the estimated tax rules if your withholding and estimated tax payments are not sufficient. You can reduce or defer the income tax on a distribution by directly or indirectly rolling such distribution over to another IRA or eligible plan. You should consult your tax advisor for additional information.
State tax will be withheld if, at the time of your distribution, your address is within one of the mandatory withholding states and you have federal income tax withheld. State taxes will be withheld from your distribution in accordance with the respective state rules.
Proxy Voting Guidelines
American Century Investment Management, Inc., the fund’s investment advisor, is responsible for exercising the voting rights associated with the securities purchased and/or held by the fund. A description of the policies and procedures the advisor uses in fulfilling this responsibility is available without charge, upon request, by calling 1-800-345-2021. It is also available on American Century Investments’ website at americancentury.com and on the Securities and Exchange Commission’s website at sec.gov. Information regarding how the investment advisor voted proxies relating to portfolio securities during the most recent 12-month period ended June 30 is available on the “About Us” page at americancentury.com. It is also available at sec.gov.
Quarterly Portfolio Disclosure
The fund files its complete schedule of portfolio holdings with the Securities and Exchange Commission (SEC) for the first and third quarters of each fiscal year on Form N-Q. The fund’s Forms N-Q are available on the SEC’s website at sec.gov, and may be reviewed and copied at the SEC’s Public Reference Room in Washington, DC. Information on the operation of the Public Reference Room may be obtained by calling 1-800-SEC-0330. The fund also makes its complete schedule of portfolio holdings for the most recent quarter of its fiscal year available on its website at americancentury.com and, upon request, by calling 1-800-345-2021.
| Contact Us | americancentury.com |
| Automated Information Line | 1-800-345-8765 |
| Investor Services Representative | 1-800-345-2021 or 816-531-5575 |
| Investors Using Advisors | 1-800-378-9878 |
| Business, Not-For-Profit, Employer-Sponsored Retirement Plans | 1-800-345-3533 |
| Banks and Trust Companies, Broker-Dealers, Financial Professionals, Insurance Companies | 1-800-345-6488 |
| Telecommunications Device for the Deaf | 1-800-634-4113 |
American Century Mutual Funds, Inc.
Investment Advisor:
American Century Investment Management, Inc.
Kansas City, Missouri
This report and the statements it contains are submitted for the general information of our shareholders. The report is not authorized for distribution to prospective investors unless preceded or accompanied by an effective prospectus.
©2012 American Century Proprietary Holdings, Inc. All rights reserved.
CL-ANN-76904 1212
ANNUAL REPORT OCTOBER 31, 2012
| President’s Letter | 2 |
| Independent Chairman’s Letter | 3 |
| Market Perspective | 4 |
| Performance | 5 |
| Portfolio Commentary | 6 |
| Fund Characteristics | 8 |
| Shareholder Fee Example | 9 |
| Schedule of Investments | 11 |
| Statement of Assets and Liabilities | 14 |
| Statement of Operations | 15 |
| Statement of Changes in Net Assets | 16 |
| Notes to Financial Statements | 17 |
| Financial Highlights | 22 |
| Report of Independent Registered Public Accounting Firm | 23 |
| Management | 24 |
| Approval of Management Agreement | 27 |
| Additional Information | 32 |
Any opinions expressed in this report reflect those of the author as of the date of the report, and do not necessarily represent the opinions of American Century Investments® or any other person in the American Century Investments organization. Any such opinions are subject to change at any time based upon market or other conditions and American Century Investments disclaims any responsibility to update such opinions. These opinions may not be relied upon as investment advice and, because investment decisions made by American Century Investments funds are based on numerous factors, may not be relied upon as an indication of trading intent on behalf of any American Century Investments fund. Security examples are used for representational purposes only and are not intended as recommendations to purchase or sell securities. Performance information for comparative indices and securities is provided to American Century Investments by third party vendors. To the best of American Century Investments’ knowledge, such information is accurate at the time of printing.
Dear Investor:
Thank you for reviewing this annual report for the 12 months ended October 31, 2012. Our report offers investment performance, market analysis, and portfolio information, presented with the expert perspective of our portfolio management team.
This report remains one of our most important vehicles for conveying information about fund returns, including key factors that affected fund performance. For additional, updated insights, we encourage you to visit our website, americancentury.com.
Favorable Fiscal-Year Returns for Most U.S. Stock and Bond Benchmarks
In a period fraught with concerns about factors such as the global economic recovery, European financial system stability, and the U.S. political picture, the 12-month returns for U.S. investors were generally favorable.
Both U.S. stocks and bonds rallied for much of the period, with U.S. equities generally outperforming their non-U.S. counterparts. The S&P 500 Index advanced 15.21%, compared with 4.61% for the MSCI EAFE (Europe, Australasia, Far East) Index. The Barclays U.S. Aggregate Bond Index returned 5.25%, and the 10-year U.S. Treasury note returned 7.47%, according to Barclays.
As it turned out, the overseas setbacks and the coordinated monetary policy response provided by prominent central banks around the world ultimately proved beneficial to the U.S. capital markets. Both U.S. stocks and bonds generally benefited from global investors’ trust in the U.S. financial system and from declining interest rates, helped by central bank purchases of government securities. The 10-year U.S. Treasury yield fell to a record low during the period, finishing at 1.69%.
The U.S. economy showed signs of improvement during the fiscal year, particularly the long-depressed housing market. However, the outlook for 2013 remains guarded, as the fragile recovery remains vulnerable to fiscal and financial factors that could trigger further slowdowns and market volatility.
Under these conditions, we continue to believe in a disciplined, diversified, long-term investment approach, using both stocks and bonds—as appropriate—for meeting financial goals. We appreciate your continued trust in us in this challenging environment.
Sincerely,
Jonathan Thomas
President and Chief Executive Officer
American Century Investments
Independent Chairman’s Letter |
Don Pratt
Dear Fellow Shareholders,
The board has once again completed its annual review of the advisory contract between the American Century Investments mutual funds overseen by the board and the funds’ advisor, American Century Investment Management, Inc. This process, often referred to as the 15(c) review, involves the independent directors considering all of the material monitored throughout the year and evaluating a wide range of factors to determine whether the management fee paid by each fund to the advisor is reasonable.
The independent directors’ rationale for this decision is provided in detail in this, or in a previous, report. However, there are several highlights that should be of interest to all shareholders.
| • | Fund performance and client service continue to be rated among the industry’s best. |
| • | Target date and other asset allocation products continue to successfully gather assets and industry acclaim. |
| • | Compliance programs continue to function successfully with no issues impacting shareholder interests. |
| • | Fees were found to be within an acceptable competitive range, with minor fee waivers being negotiated on five funds. |
Knowing that most shareholders are long term investors, the board was particularly pleased with our succession planning review. Talented professionals are being added within portfolio management and experienced managers have been added to the senior management team.
Overall it was a very positive review for the American Century Investments mutual funds during a challenging market environment.
Best personal regards,
Don Pratt
By Greg Woodhams, Chief Investment Officer, U.S. Growth Equity—Large Cap
Stocks Advanced in a Volatile Year
U.S. equities produced solid gains during a sometimes volatile 12 months ended October 31, 2012. Stocks began the period with gains, buoyed by continued improvement in the economy and corporate earnings. The unemployment rate fell to its lowest level in three years by February 2012, while consumer confidence and the housing sector both showed clear signs of recovery. Equity investors also got some promising news out of Europe, as the European Central Bank provided support for the Continent’s banking sector.
However, stocks declined sharply from about April to June. Evidence of slowing economic activity in the U.S. and increasing turmoil in Europe weighed on investor confidence. Indeed, austerity policies and high rates of joblessness weighed on growth, with many European countries in recession at some point during 2012. Nevertheless, equity markets finished the fiscal year with a sharp rebound after the economic data, particularly in the U.S., turned out to be not as bad as feared.
Value Outperformed Growth, Large Outperformed Small
In that environment, value-oriented shares outperformed growth across all capitalization ranges as measured by the various Russell indices (see accompanying returns table). In terms of returns by size, large-capitalization stocks did better than those of mid- and small-cap companies.
Looking at the major sectors in the Russell 1000 Growth Index, performance was positive, but widely divergent, reflecting the volatile nature of the reporting period. For example, traditionally economically sensitive sectors such as energy, materials, and industrials lagged amid the uncertain outlook for global growth. Stocks with exposure to powerful themes, such as mobile and cloud computing and wireless communication, did well. Indeed, telecommunication services was the top-performing sector in both the Russell 1000 and Midcap Growth indices, driven by gains among wireless providers.
| U.S. Stock Index Returns |
| For the 12 months ended October 31, 2012 |
| Russell 1000 Index (Large-Cap) | 14.97% | | Russell 2000 Index (Small-Cap) | 12.08% |
| Russell 1000 Growth Index | 13.02% | | Russell 2000 Growth Index | 9.70% |
| Russell 1000 Value Index | 16.89% | | Russell 2000 Value Index | 14.47% |
| Russell Midcap Index | 12.15% | | | |
| Russell Midcap Growth Index | 9.09% | | | |
| Russell Midcap Value Index | 14.99% | | | |
| Total Returns as of October 31, 2012 |
| | | | Average Annual Returns | |
| | Ticker Symbol | 1 year | 5 years | Since Inception | Inception Date |
| Institutional Class | ACLTX | 10.33% | 1.81% | 5.47% | 5/12/06 |
| Russell 1000 Growth Index | — | 13.02% | 1.95% | 4.83%(1) | — |
| (1) | Since 4/30/06, the date nearest the Institutional Class’s inception for which data are available. |
| Growth of $10,000 Over Life of Class |
| $10,000 investment made May 12, 2006 |
| * | From 5/12/06, the Institutional Class’s inception date. Index data from 4/30/06, the date nearest the Institutional Class’s inception for which data are available. Not annualized. |
| Total Annual Fund Operating Expenses |
Institutional Class 0.78% |
The total annual fund operating expenses shown is as stated in the fund’s prospectus current as of the date of this report. The prospectus may vary from the expense ratio shown elsewhere in this report because it is based on a different time period, includes acquired fund fees and expenses, and, if applicable, does not include fee waivers or expense reimbursements.
Data presented reflect past performance. Past performance is no guarantee of future results. Current performance may be higher or lower than the performance shown. Investment return and principal value will fluctuate, and redemption value may be more or less than original cost. To obtain performance data current to the most recent month end, please call 1-800-345-2021 or visit americancentury.com.
Data assumes reinvestment of dividends and capital gains, and none of the charts reflect the deduction of taxes that a shareholder would pay on fund distributions or the redemption of fund shares. Returns for the index are provided for comparison. The fund’s total returns include operating expenses (such as transaction costs and management fees) that reduce returns, while the total returns of the index do not.
Portfolio Managers: Greg Woodhams and Prescott LeGard
Performance Summary
NT Growth returned 10.33% in the 12 months ended October 31, 2012. By comparison, the Russell 1000 Growth Index (the fund’s benchmark) returned 13.02%.
In terms of NT Growth’s absolute returns, health care shares contributed most. No sector detracted in absolute terms. Relative to the benchmark, stock selection made the information technology (IT) sector the leading detractor. Stock choices meant health care shares contributed most to relative performance.
IT Detracted Most
Information technology stocks detracted most from performance relative to the Russell 1000 Growth Index. The sector was hit by worries about exposure to Europe and potential slowdown in the U.S. going forward. In the technology sector, stock selection made computers and peripherals firms the leading detractors. It hurt to hold a stake in storage hardware provider NetApp, which reported in-line results during the period but lowered its forward outlook because of a slowdown in the financial and government sectors. We reduced the position, but still believe NetApp will continue to gain market share from competitors Hewlett-Packard, Hitachi, and IBM.
Other notable detractors in the sector were communication equipment maker Cisco Systems and semiconductor company Marvell Technology Group. Cisco actually gained market share and reported solid results, but the company lowered forward earnings guidance marginally after evaluating the macroeconomic environment here and abroad. Similarly, Marvell Technology declined on concerns about its exposure to hard disk drives and Chinese handsets. We eliminated the position.
Industrials Detracted
A number of NT Growth’s industrial holdings were affected by investor uncertainty around corporate earnings growth and pricing power resulting from worries about a slowdown in the global economy. In addition, the portfolio tended to be underweight the sector because our analysis showed these companies to have high but declining margins amid slowing growth. The leading detractor in this space was capital equipment manufacturer Terex. We eliminated the position when we saw signs of a poor pricing environment for the company’s products.
Another notable individual detractor was auto component manufacturer BorgWarner, which underperformed as a result of weakness in Europe and slower automotive build rates in China.
Health Care Led Contributors
In the health care sector, the top contribution came from life sciences tools companies, led by a stake in Illumina. The maker of research and diagnostic tools received a buyout offer from Roche, valuing the company at a significant premium. In addition, it helped to hold a stake in pharmaceutical benefit manager Express Scripts, which acquired Medco Health Solutions during
the period. Other key individual contributors in the health care sector were biotechnology firm Gilead Sciences and medical equipment and supplies maker ResMed. Gilead made progress on its development of therapies for Hepatitis C, while ResMed benefited from regulatory changes that are likely to drive increased demand for its products used in the treatment of sleep apnea.
Telecommunication shares also contributed to performance due to stock selection and an overweight position among wireless telecommunication providers. The leading contributor for the fiscal year was cellular tower operator Crown Castle International. The company continues to benefit from a long-running trend by cellular network providers such as AT&T and Verizon to add capacity to their networks to handle increasing voice and data traffic.
In the energy sector, the portfolio’s outperformance was driven by stock selection decisions. It benefited performance to have little or no exposure to many of the poorest-performing stocks in the sector during the period, including equipment and services firms Halliburton and Baker Hughes, and oil and gas companies Peabody Energy and Consol Energy. However, these gains were partially offset by a stake in Occidental Petroleum, as concerns about the pace of the firm’s development program weighed on the shares.
Among other notable individual contributors were stakes in specialty retailers Lowe’s and Home Depot. These stocks benefited from the home building and remodeling recovery evident during the fiscal year.
Current Positioning
In our opinion, stock selection—rather than sector allocation or market timing via the use of cash—is the most efficient means of generating superior risk-adjusted returns. As a result of this approach, the portfolio’s sector and industry selection as well as capitalization range allocations are primarily a result of identifying what the managers believe to be superior individual securities. As of October 31, 2012, the consumer staples, energy, and telecommunication services sectors were the portfolio’s largest overweight positions relative to the benchmark. The most notable sector underweight positions were in industrial, consumer discretionary, and materials shares. Information technology shares were the portfolio’s single largest sector allocation on an absolute basis.
| OCTOBER 31, 2012 | |
| Top Ten Holdings | % of net assets |
| Apple, Inc. | 7.7% |
| Coca-Cola Co. (The) | 3.2% |
| Microsoft Corp. | 2.6% |
| Google, Inc., Class A | 2.5% |
| PepsiCo, Inc. | 2.5% |
| International Business Machines Corp. | 2.4% |
| Wal-Mart Stores, Inc. | 2.2% |
| Oracle Corp. | 2.2% |
| Schlumberger Ltd. | 2.2% |
| Amazon.com, Inc. | 1.8% |
| | |
| Top Five Industries | % of net assets |
| Computers and Peripherals | 9.9% |
| Beverages | 6.7% |
| Software | 6.2% |
| Pharmaceuticals | 5.5% |
| Aerospace and Defense | 5.3% |
| | |
| Types of Investments in Portfolio | % of net assets |
| Common Stocks | 99.1% |
| Exchange-Traded Funds | 0.4% |
| Total Equity Exposure | 99.5% |
| Temporary Cash Investments | 1.7% |
| Other Assets and Liabilities | (1.2)% |
Fund shareholders may incur two types of costs: (1) transaction costs, including sales charges (loads) on purchase payments and redemption/exchange fees; and (2) ongoing costs, including management fees; distribution and service (12b-1) fees; and other fund expenses. This example is intended to help you understand your ongoing costs (in dollars) of investing in your fund and to compare these costs with the ongoing cost of investing in other mutual funds.
The example is based on an investment of $1,000 made at the beginning of the period and held for the entire period from May 1, 2012 to October 31, 2012.
Actual Expenses
The table provides information about actual account values and actual expenses for each class. You may use the information, together with the amount you invested, to estimate the expenses that you paid over the period. First, identify the share class you own. Then simply divide your account value by $1,000 (for example, an $8,600 account value divided by $1,000 = 8.6), then multiply the result by the number under the heading “Expenses Paid During Period” to estimate the expenses you paid on your account during this period.
If you hold Investor Class shares of any American Century Investments fund, or Institutional Class shares of the American Century Diversified Bond Fund, in an American Century Investments account (i.e., not a financial intermediary or retirement plan account), American Century Investments may charge you a $12.50 semiannual account maintenance fee if the value of those shares is less than $10,000. We will redeem shares automatically in one of your accounts to pay the $12.50 fee. In determining your total eligible investment amount, we will include your investments in all personal accounts (including American Century Investments Brokerage accounts) registered under your Social Security number. Personal accounts include individual accounts, joint accounts, UGMA/UTMA accounts, personal trusts, Coverdell Education Savings Accounts and IRAs (including traditional, Roth, Rollover, SEP-, SARSEP- and SIMPLE-IRAs), and certain other retirement accounts. If you have only business, business retirement, employer-sponsored or American Century Investments Brokerage accounts, you are currently not subject to this fee. If you are subject to the Account Maintenance Fee, your account value could be reduced by the fee amount.
Hypothetical Example for Comparison Purposes
The table also provides information about hypothetical account values and hypothetical expenses based on the actual expense ratio of each class of your fund and an assumed rate of return of 5% per year before expenses, which is not the actual return of a fund’s share class. The hypothetical account values and expenses may not be used to estimate the actual ending account balance or expenses you paid for the period. You may use this information to compare the ongoing costs of investing in your fund and other funds. To do so, compare this 5% hypothetical example with the 5% hypothetical examples that appear in the shareholder reports of the other funds.
Please note that the expenses shown in the table are meant to highlight your ongoing costs only and do not reflect any transactional costs, such as sales charges (loads) or redemption/exchange fees. Therefore, the table is useful in comparing ongoing costs only, and will not help you determine the relative total costs of owning different funds. In addition, if these transactional costs were included, your costs would have been higher.
| | Beginning Account Value 5/1/12 | Ending Account Value 10/31/12 | Expenses Paid During Period(1) 5/1/12 – 10/31/12 | Annualized Expense Ratio(1) |
| Actual | | | | |
| Institutional Class | $1,000 | $968.80 | $3.81 | 0.77% |
| Hypothetical | | | | |
| Institutional Class | $1,000 | $1,021.27 | $3.91 | 0.77% |
| (1) | Expenses are equal to the class’s annualized expense ratio listed in the table above, multiplied by the average account value over the period, multiplied by 184, the number of days in the most recent fiscal half-year, divided by 366, to reflect the one-half year period. |
| | | Shares | | | Value | |
| Common Stocks — 99.1% | |
| AEROSPACE AND DEFENSE — 5.3% | |
| Boeing Co. (The) | | | 59,767 | | | | $4,209,987 | |
Hexcel Corp.(1) | | | 74,057 | | | | 1,892,897 | |
| Honeywell International, Inc. | | | 167,001 | | | | 10,227,141 | |
| Precision Castparts Corp. | | | 26,955 | | | | 4,665,102 | |
| Textron, Inc. | | | 144,460 | | | | 3,641,837 | |
| United Technologies Corp. | | | 113,661 | | | | 8,883,744 | |
| | | | | | | | 33,520,708 | |
| AIR FREIGHT AND LOGISTICS — 1.1% | |
| United Parcel Service, Inc., Class B | | | 91,159 | | | | 6,677,397 | |
| AUTO COMPONENTS — 0.3% | |
| Autoliv, Inc. | | | 29,252 | | | | 1,684,915 | |
| AUTOMOBILES — 0.7% | | | | | | | | |
| Harley-Davidson, Inc. | | | 91,299 | | | | 4,269,141 | |
| BEVERAGES — 6.7% | | | | | | | | |
| Beam, Inc. | | | 53,267 | | | | 2,959,515 | |
| Brown-Forman Corp., Class B | | | 26,116 | | | | 1,672,991 | |
| Coca-Cola Co. (The) | | | 548,349 | | | | 20,387,616 | |
Monster Beverage Corp.(1) | | | 46,969 | | | | 2,098,105 | |
| PepsiCo, Inc. | | | 227,388 | | | | 15,744,345 | |
| | | | | | | | 42,862,572 | |
| BIOTECHNOLOGY — 2.2% | | | | | | | | |
Alexion Pharmaceuticals, Inc.(1) | | | 25,105 | | | | 2,268,990 | |
| Amgen, Inc. | | | 44,574 | | | | 3,857,657 | |
Gilead Sciences, Inc.(1) | | | 119,006 | | | | 7,992,443 | |
| | | | | | | | 14,119,090 | |
| CHEMICALS — 2.5% | | | | | | | | |
| Agrium, Inc. | | | 34,064 | | | | 3,595,114 | |
| Monsanto Co. | | | 114,952 | | | | 9,893,919 | |
| Rockwood Holdings, Inc. | | | 49,097 | | | | 2,253,552 | |
| | | | | | | | 15,742,585 | |
| COMMERCIAL BANKS — 1.4% | |
| SunTrust Banks, Inc. | | | 174,343 | | | | 4,742,129 | |
| Wells Fargo & Co. | | | 122,304 | | | | 4,120,422 | |
| | | | | | | | 8,862,551 | |
| COMMERCIAL SERVICES AND SUPPLIES — 0.5% | |
| Tyco International Ltd. | | | 119,879 | | | | 3,221,149 | |
| COMMUNICATIONS EQUIPMENT — 2.1% | |
| Cisco Systems, Inc. | | | 166,231 | | | | 2,849,199 | |
Palo Alto Networks, Inc.(1) | | | 31,333 | | | | 1,722,688 | |
| QUALCOMM, Inc. | | | 97,545 | | | | 5,713,699 | |
Riverbed Technology, Inc.(1) | | | 165,210 | | | | 3,051,429 | |
| | | | | | | | 13,337,015 | |
| COMPUTERS AND PERIPHERALS — 9.9% | |
| Apple, Inc. | | | 82,452 | | | | 49,067,185 | |
EMC Corp.(1) | | | 399,838 | | | | 9,764,044 | |
NetApp, Inc.(1) | | | 151,555 | | | | 4,076,830 | |
| | | | | | | | 62,908,059 | |
| DISTRIBUTORS — 0.4% | | | | | | | | |
LKQ Corp.(1) | | | 119,124 | | | | 2,488,500 | |
| DIVERSIFIED TELECOMMUNICATION SERVICES — 1.1% | |
| Verizon Communications, Inc. | | | 151,597 | | | | 6,767,290 | |
| ELECTRONIC EQUIPMENT, INSTRUMENTS AND COMPONENTS — 0.3% | |
Trimble Navigation Ltd.(1) | | | 47,038 | | | | 2,219,253 | |
| ENERGY EQUIPMENT AND SERVICES — 3.2% | |
| Core Laboratories NV | | | 19,142 | | | | 1,984,260 | |
| Oceaneering International, Inc. | | | 90,052 | | | | 4,712,421 | |
| Schlumberger Ltd. | | | 196,726 | | | | 13,678,359 | |
| | | | | | | | 20,375,040 | |
| FOOD AND STAPLES RETAILING — 4.3% | |
| Costco Wholesale Corp. | | | 75,615 | | | | 7,442,784 | |
| CVS Caremark Corp. | | | 55,594 | | | | 2,579,562 | |
| Wal-Mart Stores, Inc. | | | 185,127 | | | | 13,888,228 | |
| Whole Foods Market, Inc. | | | 37,121 | | | | 3,516,472 | |
| | | | | | | | 27,427,046 | |
| FOOD PRODUCTS — 1.8% | | | | | | | | |
Annie’s, Inc.(1) | | | 20,497 | | | | 809,631 | |
| Hershey Co. (The) | | | 45,488 | | | | 3,131,849 | |
Kraft Foods Group, Inc.(1) | | | 78,538 | | | | 3,571,908 | |
| Mead Johnson Nutrition Co. | | | 67,192 | | | | 4,143,059 | |
| | | | | | | | 11,656,447 | |
| HEALTH CARE EQUIPMENT AND SUPPLIES — 1.7% | |
| Cooper Cos., Inc. (The) | | | 17,092 | | | | 1,640,490 | |
| Covidien plc | | | 35,647 | | | | 1,958,803 | |
| DENTSPLY International, Inc. | | | 42,369 | | | | 1,560,874 | |
Edwards Lifesciences Corp.(1) | | | 26,154 | | | | 2,270,952 | |
IDEXX Laboratories, Inc.(1) | | | 8,894 | | | | 855,603 | |
| ResMed, Inc. | | | 55,473 | | | | 2,215,591 | |
| | | | | | | | 10,502,313 | |
| HEALTH CARE PROVIDERS AND SERVICES — 2.3% | |
| AmerisourceBergen Corp. | | | 150,395 | | | | 5,931,579 | |
DaVita, Inc.(1) | | | 22,231 | | | | 2,501,432 | |
Express Scripts Holding Co.(1) | | | 99,085 | | | | 6,097,691 | |
| | | | | | | | 14,530,702 | |
| | |
| | | | Shares | | | | Value | |
| HOTELS, RESTAURANTS AND LEISURE — 2.3% | | | | | | | | |
| Marriott International, Inc. Class A | | | 107,260 | | | | $3,912,845 | |
| McDonald’s Corp. | | | 55,823 | | | | 4,845,436 | |
| Starbucks Corp. | | | 125,835 | | | | 5,775,827 | |
| | | | | | | | 14,534,108 | |
| HOUSEHOLD DURABLES — 1.2% | |
Mohawk Industries, Inc.(1) | | | 39,907 | | | | 3,331,037 | |
PulteGroup, Inc.(1) | | | 245,064 | | | | 4,249,410 | |
| | | | | | | | 7,580,447 | |
| HOUSEHOLD PRODUCTS — 1.7% | |
| Church & Dwight Co., Inc. | | | 19,767 | | | | 1,003,373 | |
| Colgate-Palmolive Co. | | | 95,738 | | | | 10,048,660 | |
| | | | | | | | 11,052,033 | |
| INDUSTRIAL CONGLOMERATES — 1.0% | |
| Danaher Corp. | | | 116,799 | | | | 6,042,012 | |
| INSURANCE — 0.7% | | | | | | | | |
| Travelers Cos., Inc. (The) | | | 66,900 | | | | 4,745,886 | |
| INTERNET AND CATALOG RETAIL — 1.8% | |
Amazon.com, Inc.(1) | | | 50,290 | | | | 11,708,518 | |
| INTERNET SOFTWARE AND SERVICES — 4.0% | |
eBay, Inc.(1) | | | 201,470 | | | | 9,728,986 | |
Google, Inc., Class A(1) | | | 23,184 | | | | 15,759,788 | |
| | | | | | | | 25,488,774 | |
| IT SERVICES — 4.8% | | | | | | | | |
| Automatic Data Processing, Inc. | | | 95,910 | | | | 5,542,639 | |
| International Business Machines Corp. | | | 79,487 | | | | 15,462,606 | |
| MasterCard, Inc., Class A | | | 20,217 | | | | 9,318,622 | |
| | | | | | | | 30,323,867 | |
| LIFE SCIENCES TOOLS AND SERVICES — 0.2% | |
Waters Corp.(1) | | | 16,221 | | | | 1,327,040 | |
| MACHINERY — 1.4% | | | | | | | | |
| Deere & Co. | | | 36,565 | | | | 3,124,114 | |
| Illinois Tool Works, Inc. | | | 90,873 | | | | 5,573,241 | |
| | | | | | | | 8,697,355 | |
| MEDIA — 3.7% | | | | | | | | |
| CBS Corp., Class B | | | 97,800 | | | | 3,168,720 | |
| Comcast Corp., Class A | | | 283,431 | | | | 10,631,497 | |
| Scripps Networks Interactive, Inc. Class A | | | 63,123 | | | | 3,832,828 | |
| Viacom, Inc., Class B | | | 117,225 | | | | 6,010,126 | |
| | | | | | | | 23,643,171 | |
| METALS AND MINING — 0.3% | |
| Nucor Corp. | | | 54,620 | | | | 2,191,900 | |
| MULTI-UTILITIES — 0.3% | | | | | | | | |
| DTE Energy Co. | | | 33,317 | | | | 2,068,986 | |
| MULTILINE RETAIL — 1.3% | |
Dollar General Corp.(1) | | | 84,776 | | | | 4,121,809 | |
| Macy’s, Inc. | | | 112,710 | | | | 4,290,870 | |
| | | | | | | | 8,412,679 | |
| OIL, GAS AND CONSUMABLE FUELS — 2.5% | |
| EOG Resources, Inc. | | | 55,276 | | | | 6,439,101 | |
| Noble Energy, Inc. | | | 57,588 | | | | 5,471,436 | |
| Occidental Petroleum Corp. | | | 46,743 | | | | 3,690,827 | |
| | | | | | | | 15,601,364 | |
| PERSONAL PRODUCTS — 0.7% | |
| Estee Lauder Cos., Inc. (The), Class A | | | 71,451 | | | | 4,402,811 | |
| PHARMACEUTICALS — 5.5% | |
| Abbott Laboratories | | | 158,240 | | | | 10,367,885 | |
| Allergan, Inc. | | | 84,363 | | | | 7,585,921 | |
| Bristol-Myers Squibb Co. | | | 130,088 | | | | 4,325,426 | |
| Eli Lilly & Co. | | | 46,423 | | | | 2,257,550 | |
| Johnson & Johnson | | | 149,504 | | | | 10,587,873 | |
| | | | | | | | 35,124,655 | |
| REAL ESTATE INVESTMENT TRUSTS (REITs) — 1.5% | |
| American Campus Communities, Inc. | | | 59,033 | | | | 2,674,785 | |
| Simon Property Group, Inc. | | | 45,312 | | | | 6,896,940 | |
| | | | | | | | 9,571,725 | |
| REAL ESTATE MANAGEMENT AND DEVELOPMENT — 0.4% | |
CBRE Group, Inc.(1) | | | 129,100 | | | | 2,326,382 | |
| ROAD AND RAIL — 1.6% | | | | | | | | |
| Union Pacific Corp. | | | 85,257 | | | | 10,489,169 | |
| SEMICONDUCTORS AND SEMICONDUCTOR EQUIPMENT — 3.1% | |
| Broadcom Corp., Class A | | | 158,401 | | | | 4,995,176 | |
| Intel Corp. | | | 213,312 | | | | 4,612,872 | |
| Linear Technology Corp. | | | 121,705 | | | | 3,804,498 | |
Teradyne, Inc.(1) | | | 60,824 | | | | 889,247 | |
| Xilinx, Inc. | | | 169,062 | | | | 5,538,471 | |
| | | | | | | | 19,840,264 | |
| SOFTWARE — 6.2% | | | | | | | | |
Cadence Design Systems, Inc.(1) | | | 256,956 | | | | 3,253,063 | |
CommVault Systems, Inc.(1) | | | 26,860 | | | | 1,677,944 | |
| Microsoft Corp. | | | 585,273 | | | | 16,700,765 | |
| Oracle Corp. | | | 445,171 | | | | 13,822,560 | |
ServiceNow, Inc.(1) | | | 37,533 | | | | 1,150,386 | |
Splunk, Inc.(1) | | | 58,670 | | | | 1,645,693 | |
Workday, Inc.(1) | | | 18,897 | | | | 916,505 | |
| | | | | | | | 39,166,916 | |
| SPECIALTY RETAIL — 3.2% | |
| GNC Holdings, Inc. Class A | | | 99,798 | | | | $3,859,189 | |
| Home Depot, Inc. (The) | | | 74,514 | | | | 4,573,669 | |
| Lowe’s Cos., Inc. | | | 202,474 | | | | 6,556,108 | |
| Tractor Supply Co. | | | 16,673 | | | | 1,604,609 | |
Urban Outfitters, Inc.(1) | | | 100,988 | | | | 3,611,331 | |
| | | | | | | | 20,204,906 | |
| WIRELESS TELECOMMUNICATION SERVICES — 1.9% | |
Crown Castle International Corp.(1) | | | 98,249 | | | | 6,558,121 | |
SBA Communications Corp., Class A(1) | | | 87,530 | | | | 5,832,124 | |
| | | | | | | | 12,390,245 | |
TOTAL COMMON STOCKS (Cost $531,489,706) | | | | 630,106,986 | |
| Exchange-Traded Funds — 0.4% | |
iShares Russell 1000 Growth Index Fund (Cost $2,395,935) | | | 36,869 | | | | 2,387,268 | |
| Temporary Cash Investments — 1.7% | |
Repurchase Agreement, Bank of America Merrill Lynch, (collateralized by various U.S. Treasury obligations, 1.50% - 2.00%, 1/31/16 - 6/30/16, valued at $4,561,008), in a joint trading account at 0.23%, dated 10/31/12, due 11/1/12 (Delivery value $4,469,101) | | | | 4,469,072 | |
| | | Value | |
Repurchase Agreement, Credit Suisse First Boston, Inc., (collateralized by various U.S. Treasury obligations, 3.125% - 3.75%, 8/15/41 - 2/15/42, valued at $4,571,611), in a joint trading account at 0.20%, dated 10/31/12, due 11/1/12 (Delivery value $4,469,097) | | | 4,469,072 | |
Repurchase Agreement, Goldman Sachs & Co., (collateralized by various U.S. Treasury obligations, 4.625%, 2/15/40, valued at $1,898,429), in a joint trading account at 0.16%, dated 10/31/12, due 11/1/12 (Delivery value $1,861,529) | | | 1,861,521 | |
TOTAL TEMPORARY CASH INVESTMENTS (Cost $10,799,665) | | | 10,799,665 | |
TOTAL INVESTMENT SECURITIES — 101.2% (Cost $544,685,306) | | | 643,293,919 | |
| OTHER ASSETS AND LIABILITIES — (1.2)% | | | (7,387,454 | ) |
| TOTAL NET ASSETS — 100.0% | | | $635,906,465 | |
Notes to Schedule of Investments
See Notes to Financial Statements.
Statement of Assets and Liabilities |
| OCTOBER 31, 2012 | |
| Assets | |
| Investment securities, at value (cost of $544,685,306) | | | $643,293,919 | |
| Receivable for investments sold | | | 2,682,724 | |
| Receivable for capital shares sold | | | 117,610 | |
| Dividends and interest receivable | | | 410,269 | |
| | | | 646,504,522 | |
| | | | | |
| Liabilities | | | | |
| Payable for investments purchased | | | 10,188,653 | |
| Accrued management fees | | | 409,404 | |
| | | | 10,598,057 | |
| | | | | |
| Net Assets | | | $635,906,465 | |
| | | | | |
| Institutional Class Capital Shares, $0.01 Par Value | | | | |
| Shares authorized | | | 150,000,000 | |
| Shares outstanding | | | 49,979,951 | |
| | | | | |
| Net Asset Value Per Share | | | $12.72 | |
| | | | | |
| Net Assets Consist of: | | | | |
| Capital (par value and paid-in surplus) | | | $521,282,039 | |
| Undistributed net investment income | | | 2,938,469 | |
| Undistributed net realized gain | | | 13,076,385 | |
| Net unrealized appreciation | | | 98,609,572 | |
| | | | $635,906,465 | |
See Notes to Financial Statements.
| YEAR ENDED OCTOBER 31, 2012 | |
| Investment Income (Loss) | |
| Income: | | | |
| Dividends (net of foreign taxes withheld of $2,870) | | | $8,234,119 | |
| Interest | | | 7,101 | |
| | | | 8,241,220 | |
| | | | | |
| Expenses: | | | | |
| Management fees | | | 4,265,215 | |
| Directors’ fees and expenses | | | 20,398 | |
| | | | 4,285,613 | |
| | | | | |
| Net investment income (loss) | | | 3,955,607 | |
| | | | | |
| Realized and Unrealized Gain (Loss) | | | | |
| Net realized gain (loss) on: | | | | |
| Investment transactions | | | 18,717,619 | |
| Futures contract transactions | | | (142,001 | ) |
| Foreign currency transactions | | | (245 | ) |
| | | | 18,575,373 | |
| | | | | |
| Change in net unrealized appreciation (depreciation) on: | | | | |
| Investments | | | 26,570,566 | |
| Translation of assets and liabilities in foreign currencies | | | (200 | ) |
| | | | 26,570,366 | |
| | | | | |
| Net realized and unrealized gain (loss) | | | 45,145,739 | |
| | | | | |
| Net Increase (Decrease) in Net Assets Resulting from Operations | | | $49,101,346 | |
See Notes to Financial Statements.
Statement of Changes in Net Assets |
| YEARS ENDED OCTOBER 31, 2012 AND OCTOBER 31, 2011 | |
| Increase (Decrease) in Net Assets | | October 31, 2012 | | | October 31, 2011 | |
| Operations | | | | | | |
| Net investment income (loss) | | | $3,955,607 | | | | $3,241,841 | |
| Net realized gain (loss) | | | 18,575,373 | | | | 18,719,430 | |
| Change in net unrealized appreciation (depreciation) | | | 26,570,366 | | | | 6,731,577 | |
| Net increase (decrease) in net assets resulting from operations | | | 49,101,346 | | | | 28,692,848 | |
| | | | | | | | | |
| Distributions to Shareholders | | | | | | | | |
| From net investment income | | | (3,102,332 | ) | | | (2,311,137 | ) |
| From net realized gains | | | (11,931,445 | ) | | | — | |
| Decrease in net assets from distributions | | | (15,033,777 | ) | | | (2,311,137 | ) |
| | | | | | | | | |
| Capital Share Transactions | | | | | | | | |
| Proceeds from shares sold | | | 204,409,917 | | | | 112,894,557 | |
| Proceeds from reinvestment of distributions | | | 15,033,777 | | | | 2,311,137 | |
| Payments for shares redeemed | | | (79,449,649 | ) | | | (20,159,480 | ) |
| Net increase (decrease) in net assets from capital share transactions | | | 139,994,045 | | | | 95,046,214 | |
| | | | | | | | | |
| Net increase (decrease) in net assets | | | 174,061,614 | | | | 121,427,925 | |
| | | | | | | | | |
| Net Assets | | | | | | | | |
| Beginning of period | | | 461,844,851 | | | | 340,416,926 | |
| End of period | | | $635,906,465 | | | | $461,844,851 | |
| | | | | | | | | |
| Undistributed net investment income | | | $2,938,469 | | | | $2,208,459 | |
| | | | | | | | | |
| Transactions in Shares of the Fund | | | | | | | | |
| Sold | | | 16,207,107 | | | | 9,513,850 | |
| Issued in reinvestment of distributions | | | 1,326,900 | | | | 196,358 | |
| Redeemed | | | (6,301,169 | ) | | | (1,751,186 | ) |
| Net increase (decrease) in shares of the fund | | | 11,232,838 | | | | 7,959,022 | |
See Notes to Financial Statements.
Notes to Financial Statements |
OCTOBER 31, 2012
1. Organization
American Century Mutual Funds, Inc. (the corporation) is registered under the Investment Company Act of 1940, as amended (the 1940 Act), as an open-end management investment company and is organized as a Maryland corporation. NT Growth Fund (the fund) is one fund in a series issued by the corporation. The fund is diversified as defined under the 1940 Act. The fund’s investment objective is to seek long-term capital growth. The fund pursues its objective by investing primarily in stocks of larger-sized companies that management believes will increase in value over time. The fund is not permitted to invest in any securities issued by companies assigned the Global Industry Classification Standard for the tobacco industry.
2. Significant Accounting Policies
The following is a summary of significant accounting policies consistently followed by the fund in preparation of its financial statements. The financial statements are prepared in conformity with accounting principles generally accepted in the United States of America, which may require management to make certain estimates and assumptions at the date of the financial statements. Actual results could differ from these estimates.
Investment Valuations — The fund determines the fair value of its investments and computes its net asset value per share as of the close of regular trading (usually 4 p.m. Eastern time) on the New York Stock Exchange (NYSE) on each day the NYSE is open.
Equity securities that are listed or traded on a domestic securities exchange are valued at the last reported sales price or at the official closing price as provided by the exchange. Equity securities traded on foreign securities exchanges are typically valued at the closing price on the exchange where primarily traded or as of the close of the NYSE, if that is earlier. If no last sales price is reported, or if local convention or regulation so provides, the mean of the latest bid and asked prices is used. Depending on local convention or regulation, securities traded over-the-counter are valued at the mean of the latest bid and asked prices, the last sales price, or the official closing price. In its determination of fair value, the fund may review several factors including: market information specific to a security; news developments in U.S. and foreign markets; the performance of particular U.S. and foreign securities, indices, comparable securities, American Depositary Receipts, Exchange-Traded Funds, and other relevant market indicators.
Debt securities maturing within 60 days at the time of purchase may be valued at cost, plus or minus any amortized discount or premium or at the evaluated mean as provided by an independent pricing service. Evaluated mean prices are commonly derived through utilization of market models, which may consider, among other factors, trade data, quotations from dealers and active market makers, relevant yield curve and spread data, related sector levels, creditworthiness, and other relevant market information on the same or comparable securities.
Investments in open-end management investment companies are valued at the reported net asset value per share. Repurchase agreements are valued at cost. Exchange-traded futures contracts are valued at the settlement price as provided by the appropriate clearing corporation.
The value of investments initially expressed in foreign currencies is translated into U.S. dollars at prevailing exchange rates.
If the fund determines that the market price for a portfolio security is not readily available or the valuation methods mentioned above do not reflect a security’s fair value, such security is valued as determined in good faith by the Board of Directors or its designee, in accordance with procedures adopted by the Board of Directors. Circumstances that may cause the fund to use these procedures to value a security include, but are not limited to: a security has been declared in default; trading in a security has been halted during the trading day; there is a foreign market holiday and no trading occurred; or an event occurred between the close of a foreign exchange and the NYSE that may affect the value of a security.
Security Transactions — Security transactions are accounted for as of the trade date. Net realized gains and losses are determined on the identified cost basis, which is also used for federal income tax purposes.
Investment Income — Dividend income less foreign taxes withheld, if any, is recorded as of the ex-dividend date. Distributions received on securities that represent a return of capital or capital gain are recorded as a reduction of cost of investments and/or as a realized gain. The fund estimates the components of distributions received that may be considered nontaxable distributions or capital gain distributions for income tax purposes. Interest income is recorded on the accrual basis and includes accretion of discounts and amortization of premiums.
Foreign Currency Translations — All assets and liabilities initially expressed in foreign currencies are translated into U.S. dollars at prevailing exchange rates at period end. The fund may enter into spot foreign currency exchange contracts to facilitate transactions denominated in a foreign currency. Purchases and sales of investment securities, dividend and interest income, spot foreign currency exchange contracts, and expenses are translated at the rates of exchange prevailing on the respective dates of such transactions. Net realized and unrealized foreign currency exchange gains or losses related to investment securities are a component of net realized gain (loss) on investment transactions and change in net unrealized appreciation (depreciation) on investments, respectively.
Repurchase Agreements — The fund may enter into repurchase agreements with institutions that American Century Investment Management, Inc. (ACIM) (the investment advisor) has determined are creditworthy pursuant to criteria adopted by the Board of Directors. The fund requires that the collateral, represented by securities, received in a repurchase transaction be transferred to the custodian in a manner sufficient to enable the fund to obtain those securities in the event of a default under the repurchase agreement. ACIM monitors, on a daily basis, the securities transferred to ensure the value, including accrued interest, of the securities under each repurchase agreement is equal to or greater than amounts owed to the fund under each repurchase agreement.
Joint Trading Account — Pursuant to an Exemptive Order issued by the Securities and Exchange Commission, the fund, along with certain other funds in the American Century Investments family of funds, may transfer uninvested cash balances into a joint trading account. These balances are invested in one or more repurchase agreements that are collateralized by U.S. Treasury or Agency obligations.
Segregated Assets — In accordance with the 1940 Act, the fund segregates assets on its books and records to cover futures contracts. ACIM monitors, on a daily basis, the securities segregated to ensure the fund designates a sufficient amount of liquid assets, marked-to-market daily. The fund may also receive assets or be required to pledge assets at the custodian bank or with a broker for margin requirements on futures contracts.
Income Tax Status — It is the fund’s policy to distribute substantially all net investment income and net realized gains to shareholders and to otherwise qualify as a regulated investment company under provisions of the Internal Revenue Code. The fund is no longer subject to examination by tax authorities for years prior to 2009. At this time, management believes there are no uncertain tax positions which, based on their technical merit, would not be sustained upon examination and for which it is reasonably possible that the total amounts of unrecognized tax benefits will significantly change in the next twelve months. Accordingly, no provision has been made for federal or state income taxes.
Distributions to Shareholders — Distributions from net investment income and net realized gains, if any, are generally declared and paid annually.
Indemnifications — Under the corporation’s organizational documents, its officers and directors are indemnified against certain liabilities arising out of the performance of their duties to the fund. In addition, in the normal course of business, the fund enters into contracts that provide general indemnifications. The maximum exposure under these arrangements is unknown as this would involve future claims that may be made against a fund. The risk of material loss from such claims is considered by management to be remote.
3. Fees and Transactions with Related Parties
Management Fees — The corporation has entered into a management agreement with ACIM, under which ACIM provides the fund with investment advisory and management services in exchange for a single, unified management fee (the fee). The agreement provides that all expenses of managing and operating the fund, except distribution and service fees, brokerage expenses, taxes, interest, fees and expenses of the independent directors (including legal counsel fees), and extraordinary expenses, will be paid by ACIM. The fee is computed and accrued daily based on the daily net assets of the fund and paid monthly in arrears. The rate of the fee is determined by applying a fee rate calculation formula. This formula takes into account the fund’s assets as well as certain assets, if any, of other clients of the investment advisor outside the American Century Investments family of funds (such as subadvised funds and separate accounts) that have very similar investment teams and investment strategies (strategy assets). The strategy assets of the fund include the assets of Growth Fund, one fund in a series issued by the corporation. The annual management fee schedule ranges from 0.600% to 0.800%. The effective annual management fee for the year ended October 31, 2012 was 0.77%.
Related Parties — Certain officers and directors of the corporation are also officers and/or directors of American Century Companies, Inc., the parent of the corporation’s investment advisor, ACIM, the distributor of the corporation, American Century Investment Services, Inc., and the corporation’s transfer agent, American Century Services, LLC. Various funds issued by American Century Asset Allocation Portfolios, Inc. own, in aggregate, 100% of the shares of the fund. These funds do not invest in the fund for the purpose of exercising management or control.
4. Investment Transactions
Purchases and sales of investment securities, excluding short-term investments, for the year ended October 31, 2012 were $610,311,059 and $478,042,550, respectively.
5. Fair Value Measurements
The fund’s securities valuation process is based on several considerations and may use multiple inputs to determine the fair value of the positions held by the fund. In conformity with accounting principles generally accepted in the United States of America, the inputs used to determine a valuation are classified into three broad levels as follows:
| • | Level 1 valuation inputs consist of unadjusted quoted prices in an active market for identical securities; |
| • | Level 2 valuation inputs consist of direct or indirect observable market data (including quoted prices for similar securities, evaluations of subsequent market events, interest rates, prepayment speeds, credit risk, etc.); or |
| • | Level 3 valuation inputs consist of unobservable data (including a fund’s own assumptions). |
The level classification is based on the lowest level input that is significant to the fair valuation measurement. The valuation inputs are not necessarily an indication of the risks associated with investing in these securities or other financial instruments.
The following is a summary of the level classifications as of period end. The Schedule of Investments provides additional information on the fund’s portfolio holdings.
| | | Level 1 | | | Level 2 | | | Level 3 | |
| Investment Securities | | | | | | | | | |
| Common Stocks | | | $630,106,986 | | | | — | | | | — | |
| Exchange-Traded Funds | | | 2,387,268 | | | | — | | | | — | |
| Temporary Cash Investments | | | — | | | | $10,799,665 | | | | — | |
| Total Value of Investment Securities | | | $632,494,254 | | | | $10,799,665 | | | | — | |
6. Derivative Instruments
Equity Price Risk — The fund is subject to equity price risk in the normal course of pursuing its investment objectives. A fund may enter into futures contracts based on an equity index in order to manage its exposure to changes in market conditions. A fund may purchase futures contracts to gain exposure to increases in market value or sell futures contracts to protect against a decline in market value. Upon entering into a futures contract, a fund is required to deposit either cash or securities in an amount equal to a certain percentage of the contract value (initial margin). Subsequent payments (variation margin) are made or received daily, in cash, by a fund. The variation margin is equal to the daily change in the contract value and is recorded as unrealized gains and losses. A fund recognizes a realized gain or loss when the contract is closed or expires. Net realized and unrealized gains or losses occurring during the holding period of futures contracts are a component of net realized gain (loss) on futures contract transactions and change in net unrealized appreciation (depreciation) on futures contracts, respectively. One of the risks of entering into futures contracts is the possibility that the change in value of the contract may not correlate with the changes in value of the underlying securities. During the period, the fund infrequently purchased equity price risk derivative instruments for temporary investment purposes.
At period end, the fund did not have any derivative instruments disclosed on the Statement of Assets and Liabilities. For the year ended October 31, 2012, the effect of equity price risk derivative instruments on the Statement of Operations was $(142,001) in net realized gain (loss) on futures contract transactions.
7. Federal Tax Information
The tax character of distributions paid during the years ended October 31, 2012 and October 31, 2011 were as follows:
| | | 2012 | | | 2011 | |
| Distributions Paid From | | | | | | |
| Ordinary income | | | $3,102,332 | | | | $2,311,137 | |
| Long-term capital gains | | | $11,931,445 | | | | — | |
The book-basis character of distributions made during the year from net investment income or net realized gains may differ from their ultimate characterization for federal income tax purposes. These differences reflect the differing character of certain income items and net realized gains and losses for financial statement and tax purposes, and may result in reclassification among certain capital accounts on the financial statements.
As of October 31, 2012, the federal tax cost of investments and the components of distributable earnings on a tax-basis were as follows:
| Federal tax cost of investments | | | $552,646,489 | |
| Gross tax appreciation of investments | | | $97,584,889 | |
| Gross tax depreciation of investments | | | (6,937,459 | ) |
| Net tax appreciation (depreciation) of investments | | | $90,647,430 | |
| Net tax appreciation (depreciation) on derivatives and translation of assets and liabilities in foreign currencies | | | $960 | |
| Net tax appreciation (depreciation) | | | $90,648,390 | |
| Undistributed ordinary income | | | $2,938,469 | |
| Accumulated long-term gains | | | $21,037,567 | |
The difference between book-basis and tax-basis cost and unrealized appreciation (depreciation) is attributable primarily to the tax deferral of losses on wash sales.
| For a Share Outstanding Throughout the Years Ended October 31 (except as noted) | |
| Per-Share Data | | | Ratios and Supplemental Data | |
| | | | | | Income From Investment Operations: | | | Distributions From: | | | | | | | | | Ratio to Average Net Assets of: | | | | | | | |
| | | Net Asset Value, Beginning of Period | | | Net Investment Income (Loss)(1) | | | Net Realized and Unrealized Gain (Loss) | | | Total From Investment Operations | | | Net Investment Income | | | Net Realized Gains | | | Total Distributions | | | Net Asset Value, End of Period | | | Total Return(2) | | | Operating Expenses | | | Net Investment Income (Loss) | | | Portfolio Turnover Rate | | | Net Assets, End of Period (in thousands) | |
| Institutional Class | |
| 2012 | | | $11.92 | | | | 0.09 | | | | 1.09 | | | | 1.18 | | | | (0.08 | ) | | | (0.30 | ) | | | (0.38 | ) | | | $12.72 | | | | 10.33 | % | | | 0.77 | % | | | 0.71 | % | | | 87 | % | | | $635,906 | |
| 2011 | | | $11.06 | | | | 0.09 | | | | 0.85 | | | | 0.94 | | | | (0.08 | ) | | | — | | | | (0.08 | ) | | | $11.92 | | | | 8.48 | % | | | 0.78 | % | | | 0.78 | % | | | 95 | % | | | $461,845 | |
| 2010 | | | $9.34 | | | | 0.06 | | | | 1.71 | | | | 1.77 | | | | (0.05 | ) | | | — | | | | (0.05 | ) | | | $11.06 | | | | 18.94 | % | | | 0.79 | % | | | 0.63 | % | | | 95 | % | | | $340,417 | |
| 2009 | | | $8.13 | | | | 0.06 | | | | 1.21 | | | | 1.27 | | | | (0.06 | ) | | | — | | | | (0.06 | ) | | | $9.34 | | | | 15.88 | % | | | 0.80 | % | | | 0.67 | % | | | 132 | % | | | $208,337 | |
| 2008 | | | $12.87 | | | | 0.04 | | | | (4.19 | ) | | | (4.15 | ) | | | (0.03 | ) | | | (0.56 | ) | | | (0.59 | ) | | | $8.13 | | | | (33.68 | )% | | | 0.80 | % | | | 0.38 | % | | | 136 | % | | | $83,440 | |
Notes to Financial Highlights
| (1) | Computed using average shares outstanding throughout the period. |
| (2) | Total returns are calculated based on the net asset value of the last business day. Total returns for periods less than one year are not annualized. |
See Notes to Financial Statements.
Report of Independent Registered Public Accounting Firm |
The Board of Directors and Shareholders of
American Century Mutual Funds, Inc.:
We have audited the accompanying statement of assets and liabilities, including the schedule of investments, of NT Growth Fund, one of the funds constituting American Century Mutual Funds, Inc. (the “Corporation”) as of October 31, 2012, and the related statement of operations for the year then ended, the statement of changes in net assets for each of the two years in the period then ended, and the financial highlights for each of the five years in the period then ended. These financial statements and financial highlights are the responsibility of the Corporation’s management. Our responsibility is to express an opinion on these financial statements and financial highlights based on our audits.
We conducted our audits in accordance with the standards of the Public Company Accounting Oversight Board (United States). Those standards require that we plan and perform the audit to obtain reasonable assurance about whether the financial statements and financial highlights are free of material misstatement. The Corporation is not required to have, nor were we engaged to perform, an audit of its internal control over financial reporting. Our audits included consideration of internal control over financial reporting as a basis for designing audit procedures that are appropriate in the circumstances, but not for the purpose of expressing an opinion on the effectiveness of the Corporation’s internal control over financial reporting. Accordingly, we express no such opinion. An audit also includes examining, on a test basis, evidence supporting the amounts and disclosures in the financial statements, assessing the accounting principles used and significant estimates made by management, as well as evaluating the overall financial statement presentation. Our procedures included confirmation of securities owned as of October 31, 2012, by correspondence with the custodian and brokers; where replies were not received from brokers, we performed other auditing procedures. We believe that our audits provide a reasonable basis for our opinion.
In our opinion, the financial statements and financial highlights referred to above present fairly, in all material respects, the financial position of NT Growth Fund of American Century Mutual Funds, Inc., as of October 31, 2012, the results of its operations for the year then ended, the changes in its net assets for each of the two years in the period then ended, and the financial highlights for each of the five years in the period then ended, in conformity with accounting principles generally accepted in the United States of America.
Deloitte & Touche LLP
Kansas City, Missouri
December 19, 2012
The Board of Directors
The individuals listed below serve as directors of the funds. Each director will continue to serve in this capacity until death, retirement, resignation or removal from office. The mandatory retirement age for directors who are not “interested persons,” as that term is defined in the Investment Company Act (independent directors), is 72. However, the mandatory retirement age for an individual director may be extended with the approval of the remaining independent directors.
Mr. Thomas is an “interested person” because he currently serves as President and Chief Executive Officer of American Century Companies, Inc. (ACC), the parent company of American Century Investment Management, Inc. (ACIM or the advisor). Mr. Fink is an “interested person” because he currently serves as Executive Vice President of ACC.
The other directors (more than three-fourths of the total number) are independent; that is, they have never been employees, directors or officers of, and have no financial interest in, ACC or any of its wholly owned, direct or indirect, subsidiaries, including ACIM, American Century Investment Services, Inc. (ACIS) and American Century Services, LLC (ACS). The directors serve in this capacity for seven (in the case of Mr. Thomas, 15) registered investment companies in the American Century Investments family of funds.
The following table presents additional information about the directors. The mailing address for each director is 4500 Main Street, Kansas City, Missouri 64111.
Name (Year of Birth) | | Position(s) Held with Funds | | Length of Time Served | | Principal Occupation(s) During Past 5 Years | | Number of American Century Portfolios Overseen by Director | | Other Directorships Held During Past 5 Years |
| Independent Directors |
Thomas A. Brown (1940) | | Director | | Since 1980 | | Managing Member, Associated Investments, LLC (real estate investment company); Brown Cascade Properties, LLC (real estate investment company) (2001 to 2009) | | 66 | | None |
Andrea C. Hall (1945) | | Director | | Since 1997 | | Retired | | 66 | | None |
Jan M. Lewis (1957) | | Director | | Since 2011 | | President and Chief Executive Officer, Catholic Charities of Northeast Kansas (human services organization) | | 66 | | None |
James A. Olson (1942) | | Director | | Since 2007 | | Member, Plaza Belmont LLC (private equity fund manager) | | 66 | | Saia, Inc. (2002 to 2012) and Entertainment Properties Trust |
Donald H. Pratt (1937) | | Director and Chairman of the Board | | Since 1995 (Chairman since 2005) | | Chairman and Chief Executive Officer, Western Investments, Inc. (real estate company) | | 66 | | None |
Name (Year of Birth) | | Position(s) Held with Funds | | Length of Time Served | | Principal Occupation(s) During Past 5 Years | | Number of American Century Portfolios Overseen by Director | | Other Directorships Held During Past 5 Years |
| Independent Directors |
M. Jeannine Strandjord (1945) | | Director | | Since 1994 | | Retired | | 66 | | Euronet Worldwide Inc.; Charming Shoppes, Inc. (2006 to 2010); and DST Systems Inc. (1996 to 2012) |
John R. Whitten (1946) | | Director | | Since 2008 | | Retired | | 66 | | Rudolph Technologies, Inc. |
Stephen E. Yates (1948) | | Director | | Since 2012 | | Retired; Executive Vice President, Technology & Operations, KeyCorp. (computer services)(2004 to 2010) | | 66 | | Applied Industrial Technologies, Inc. (2001 to 2010) |
| | | | | | | | | | | |
| Interested Directors |
Barry Fink (1955) | | Director and Executive Vice President | | Since 2012 (Executive Vice President since 2007) | | Executive Vice President, ACC (September 2007 to present); President, ACS (October 2007 to present); Chief Operating Officer, ACC (September 2007 to November 2012). Also serves as Manager, ACS | | 66 | | None |
Jonathan S. Thomas (1963) | | Director and President | | Since 2007 | | President and Chief Executive Officer, ACC (March 2007 to present). Also serves as Chief Executive Officer and Manager, ACS; Executive Vice President, ACIM; Director, ACC, ACIM and other ACC subsidiaries | | 108 | | None |
Officers
The following table presents certain information about the executive officers of the funds. Each officer serves as an officer for each of the 15 investment companies in the American Century family of funds, unless otherwise noted. No officer is compensated for his or her service as an officer of the funds. The listed officers are interested persons of the funds and are appointed or re-appointed on an annual basis. The mailing address for each officer listed below is 4500 Main Street, Kansas City, Missouri 64111.
Name (Year of Birth) | | Offices with the Funds | | Principal Occupation(s) During the Past Five Years |
Jonathan S. Thomas (1963) | | Director and President since 2007 | | President and Chief Executive Officer, ACC (March 2007 to present). Also serves as Chief Executive Officer and Manager, ACS; Executive Vice President, ACIM; Director, ACC, ACIM and other ACC subsidiaries |
Barry Fink (1955) | | Director since 2012 and Executive Vice President since 2007 | | Executive Vice President, ACC (September 2007 to present); President, ACS (October 2007 to present); Chief Operating Officer, ACC (September 2007 to November 2012). Also serves as Manager, ACS |
Maryanne L. Roepke (1956) | | Chief Compliance Officer since 2006 and Senior Vice President since 2000 | | Chief Compliance Officer, American Century funds, ACIM and ACS (August 2006 to present). Also serves as Senior Vice President, ACS |
Charles A. Etherington (1957) | | General Counsel since 2007 and Senior Vice President since 2006 | | Attorney, ACC (February 1994 to present); Vice President, ACC (November 2005 to present), General Counsel, ACC (March 2007 to present). Also serves as General Counsel, ACIM, ACS, ACIS and other ACC subsidiaries; and Senior Vice President, ACIM and ACS |
C. Jean Wade (1964) | | Vice President, Treasurer and Chief Financial Officer since 2012 | | Vice President, ACS (February 2000 to present) |
Robert J. Leach (1966) | | Vice President since 2006 and Assistant Treasurer since 2012 | | Vice President, ACS (February 2000 to present) |
David H. Reinmiller (1963) | | Vice President since 2000 | | Attorney, ACC (January 1994 to present); Associate General Counsel, ACC (January 2001 to present). Also serves as Vice President, ACIM and ACS |
Ward D. Stauffer (1960) | | Secretary since 2005 | | Attorney, ACC (June 2003 to present) |
The Statement of Additional Information has additional information about the fund’s directors and is available without charge, upon request, by calling 1-800-345-2021.
Approval of Management Agreement |
At a meeting held on June 21, 2012, the Fund’s Board of Directors unanimously approved the renewal of the management agreement pursuant to which American Century Investment Management, Inc. (the “Advisor”) acts as the investment advisor for the Fund. Under Section 15(c) of the Investment Company Act, contracts for investment advisory services are required to be reviewed, evaluated, and approved by a majority of a fund’s independent directors (the “Directors”) each year.
As a part of the approval process, the Board requested and reviewed extensive data and information compiled by the Advisor and certain independent providers of evaluation data concerning the Fund and the services provided to the Fund by the Advisor. This review was in addition to the oversight and evaluation undertaken by the Board and its committees on a continuous basis throughout the year and included, but was not limited to the following:
| • | the nature, extent, and quality of investment management, shareholder services, and other services provided by the Advisor to the Fund; |
| • | the wide range of other programs and services the Advisor provides to the Fund and its shareholders on a routine and non-routine basis; |
| • | the investment performance of the fund, including data comparing the Fund’s performance to appropriate benchmarks and/or a peer group of other mutual funds with similar investment objectives and strategies; |
| • | data comparing the cost of owning the Fund to the cost of owning similar funds; |
| • | the Advisor’s compliance policies, procedures, and regulatory experience; |
| • | financial data showing the cost of services provided to the Fund, the profitability of the Fund to the Advisor, and the overall profitability of the Advisor; |
| • | data comparing services provided and charges to other investment management clients of the Advisor; and |
| • | consideration of collateral benefits derived by the Advisor from the management of the Fund and any potential economies of scale relating thereto. |
In keeping with its practice, the Board held two in-person meetings and one telephonic meeting to review and discuss the information provided. The Directors also had the benefit of the advice of independent counsel throughout the period.
Factors Considered
The Directors considered all of the information provided by the Advisor, the independent data providers, and independent counsel, and evaluated such information for the Fund. In connection with their review, the Directors did not identify any single factor as being all-important or controlling, and each Director may have attributed different levels of importance to different factors. In deciding to renew the management agreement, the Board based its decision on a number of factors, including the following:
Nature, Extent and Quality of Services - Generally. Under the management agreement, the Advisor is responsible for providing or arranging for all services necessary for the operation of the Fund. The Board noted that under the management agreement, the Advisor provides or arranges at its own expense a wide variety of services including:
| • | constructing and designing the Fund |
| • | portfolio research and security selection |
| • | initial capitalization/funding |
| • | daily valuation of the Fund’s portfolio |
| • | shareholder servicing and transfer agency, including shareholder confirmations, recordkeeping, and communications |
| • | regulatory and portfolio compliance |
| • | marketing and distribution |
The Board noted that many of these services have expanded over time both in terms of quantity and complexity in response to shareholder demands, competition in the industry, changing distribution channels, and the changing regulatory environment.
Investment Management Services. The nature of the investment management services provided to the Fund is quite complex and allows Fund shareholders access to professional money management, instant diversification of their investments within an asset class, the opportunity to easily diversify among asset classes by investing in or exchanging among various American Century Investments funds, and liquidity. In evaluating investment performance, the Board expects the Advisor to manage the Fund in accordance with its investment objectives and approved strategies. Further, the Directors recognize that the Advisor has an obligation to monitor trading activities, and in particular to seek the best execution of fund trades, and to evaluate the use of and payment for research. In providing these services, the Advisor utilizes teams of investment professionals (portfolio managers, analysts, research assistants, and securities traders) who require extensive information technology, research, training, compliance and other systems to conduct their business. The Board, directly and through its Fund Performance Review Committee, regularly reviews investment performance information for the Fund, together with comparative information for appropriate benchmarks and/or peer groups of similarly-managed funds, over different
time horizons. The Directors also review detailed performance information during the management agreement approval process. If performance concerns are identified, the Fund receives special reviews until performance improves, during which the Board discusses with the Advisor the reasons for such results (e.g., market conditions, security selection) and any efforts being undertaken to improve performance. Taking all these factors into consideration, the Board found the investment management services provided by the Advisor to the Fund to meet or exceed industry standards. More detailed information about the Fund’s performance can be found in the Performance and Portfolio Commentary sections of this report.
Shareholder and Other Services. Under the management agreement, the Advisor provides the Fund with a comprehensive package of transfer agency, shareholder, and other services. The Board, directly and through various committees of the Board, regularly reviews reports and evaluations of such services at its regular meetings. These reports include, but are not limited to, information regarding the operational efficiency and accuracy of the shareholder and transfer agency services provided, staffing levels, shareholder satisfaction (as measured by external as well as internal sources), technology support, new products and services offered to Fund shareholders, securities trading activities, portfolio valuation services, auditing services, and legal and operational compliance activities. Certain aspects of shareholder and transfer agency service level efficiency and the quality of securities trading activities are measured by independent third party providers and are presented in comparison to other fund groups not managed by the Advisor. The Board found the services provided by the Advisor to the Fund under the management agreement to be competitive and of high quality.
Costs of Services and Profitability. The Advisor provides detailed information concerning its cost of providing various services to the Fund, its profitability in managing the Fund, its overall profitability, and its financial condition. The Directors have reviewed with the Advisor the methodology used to prepare this financial information. The financial information regarding the Advisor is considered in evaluating the Advisor’s financial condition, ability to continue to provide services under the management agreement, and the reasonableness of the current management fee. The Board concluded that the Advisor’s profits were reasonable in light of the services provided to the Fund.
Ethics. The Board generally considers the Advisor’s commitment to providing quality services to shareholders and to conducting its business ethically. They noted that the Advisor’s practices generally meet or exceed industry best practices.
Economies of Scale. The Board also reviewed information provided by the Advisor regarding the possible existence of economies of scale in connection with the management of the Fund. The Board concluded that economies of scale are difficult to measure and predict with precision, especially on a fund-by-fund basis. The Board concluded that the Advisor is appropriately sharing economies of scale through its competitive fee structure, offering competitive fees from fund inception, and through reinvestment in its business to provide shareholders additional content and services.
Comparison to Other Funds’ Fees. The management agreement provides that the Fund pay the Advisor a single, all-inclusive (or unified) management fee for providing all services necessary for the management and operation of the Fund, other than brokerage expenses, taxes, interest, extraordinary expenses, and the fees and expenses of the Fund’s independent directors (including their independent legal counsel) and expenses incurred in connection with the provision of shareholder services and distribution services under a plan adopted pursuant to Rule 12b-1 under the 1940 Act. Under the unified fee structure, the Advisor is responsible for providing all investment advisory, custody, audit, administrative, compliance, recordkeeping, marketing and shareholder services, or arranging and supervising third parties to provide such services. By contrast, most other funds are charged a variety of fees, including an investment advisory fee, a transfer agency fee, an administrative fee, distribution charges and other expenses. Other than their investment advisory fees and any applicable Rule 12b-1 distribution fees, all other components of the total fees charged by these other funds may be increased without shareholder approval. The Board believes the unified fee structure is a benefit to Fund shareholders because it clearly discloses to shareholders the cost of owning Fund shares, and, since the unified fee cannot be increased without a vote of Fund shareholders, it shifts to the Advisor the risk of increased costs of operating the Fund and provides a direct incentive to minimize administrative inefficiencies. Part of the Board’s analysis of fee levels involves reviewing certain evaluative data compiled by an independent provider and comparing the Fund’s unified fee to the total expense ratio of other funds in the Fund’s peer group. The Board concluded that the management fee paid by the Fund to the Advisor under the management agreement is reasonable in light of the services provided to the Fund.
Comparison to Fees and Services Provided to Other Clients of the Advisor. The Board also requested and received information from the Advisor concerning the nature of the services, fees, costs and profitability of its advisory services to advisory clients other than the Fund. They observed that these varying types of client accounts require different services and involve different regulatory and entrepreneurial risks than the management of the Fund. The Board analyzed this information and concluded that the fees charged and services provided to the Fund were reasonable by comparison.
Collateral or “Fall-Out” Benefits Derived by the Advisor. The Board considered the existence of collateral benefits the Advisor may receive as a result of its relationship with the Fund. They concluded that the Advisor’s primary business is managing mutual funds and it generally does not use fund or shareholder information to generate profits in other lines of business, and therefore does not derive any significant collateral benefits from them. The Board noted that the Advisor receives proprietary research from broker-dealers that execute fund portfolio transactions and concluded that this research is likely to benefit Fund shareholders. The Board also determined that the Advisor is able to provide investment management services to certain clients other than the Fund, at least in part, due to its existing infrastructure built to serve the fund complex. The Board concluded, however, that the assets of those other clients are not material to the analysis and, where applicable, may be included with the assets of the Fund to determine breakpoints in the management fee schedule.
Existing Relationship. The Board also considered whether there was any reason for not continuing the existing arrangement with the Advisor. In this regard, the Board was mindful of the potential disruptions of the Fund’s operations and various risks, uncertainties, and other effects that could occur as a result of a decision not to continue such relationship. In particular, the Board recognized that most shareholders have invested in the Fund on the strength of the Advisor’s industry standing and reputation and in the expectation that the Advisor will have a continuing role in providing advisory services to the Fund.
Conclusion of the Directors. As a result of this process, the Board, including all of the independent directors, taking into account all of the factors discussed above and the information provided by the Advisor and others, concluded that the management agreement between the Fund and the Advisor is fair and reasonable in light of the services provided and should be renewed.
Retirement Account Information
As required by law, distributions you receive from certain IRAs, or 403(b), 457 and qualified plans are subject to federal income tax withholding, unless you elect not to have withholding apply. Tax will be withheld on the total amount withdrawn even though you may be receiving amounts that are not subject to withholding, such as nondeductible contributions. In such case, excess amounts of withholding could occur. You may adjust your withholding election so that a greater or lesser amount will be withheld.
If you don’t want us to withhold on this amount, you must notify us to not withhold the federal income tax. You may notify us in writing or in certain situations by telephone or through other electronic means. You have the right to revoke your withholding election at any time and any election you make may remain in effect until revoked by filing a new election.
Remember, even if you elect not to have income tax withheld, you are liable for paying income tax on the taxable portion of your withdrawal. If you elect not to have income tax withheld or you don’t have enough income tax withheld, you may be responsible for payment of estimated tax. You may incur penalties under the estimated tax rules if your withholding and estimated tax payments are not sufficient. You can reduce or defer the income tax on a distribution by directly or indirectly rolling such distribution over to another IRA or eligible plan. You should consult your tax advisor for additional information.
State tax will be withheld if, at the time of your distribution, your address is within one of the mandatory withholding states and you have federal income tax withheld. State taxes will be withheld from your distribution in accordance with the respective state rules.
Proxy Voting Guidelines
American Century Investment Management, Inc., the fund’s investment advisor, is responsible for exercising the voting rights associated with the securities purchased and/or held by the fund. A description of the policies and procedures the advisor uses in fulfilling this responsibility is available without charge, upon request, by calling 1-800-345-2021. It is also available on American Century Investments’ website at americancentury.com and on the Securities and Exchange Commission’s website at sec.gov. Information regarding how the investment advisor voted proxies relating to portfolio securities during the most recent 12-month period ended June 30 is available on the “About Us” page at americancentury.com. It is also available at sec.gov.
Quarterly Portfolio Disclosure
The fund files its complete schedule of portfolio holdings with the Securities and Exchange Commission (SEC) for the first and third quarters of each fiscal year on Form N-Q. The fund’s Forms N-Q are available on the SEC’s website at sec.gov, and may be reviewed and copied at the SEC’s Public Reference Room in Washington, DC. Information on the operation of the Public Reference Room may be obtained by calling 1-800-SEC-0330. The fund also makes its complete schedule of portfolio holdings for the most recent quarter of its fiscal year available on its website at americancentury.com and, upon request, by calling 1-800-345-2021.
Other Tax Information
The following information is provided pursuant to provisions of the Internal Revenue Code.
The fund hereby designates up to the maximum amount allowable as qualified dividend income for the fiscal year ended October 31, 2012.
For corporate taxpayers, the fund hereby designates $3,102,332, or up to the maximum amount allowable, of ordinary income distributions paid during the fiscal year ended October 31, 2012 as qualified for the corporate dividends received deduction.
The fund hereby designates $11,931,445, or up to the maximum amount allowable, as long-term capital gain distributions for the fiscal year ended October 31, 2012.
| Contact Us | americancentury.com |
| Automated Information Line | 1-800-345-8765 |
| Investor Services Representative | 1-800-345-2021 or 816-531-5575 |
| Investors Using Advisors | 1-800-378-9878 |
| Business, Not-For-Profit, Employer-Sponsored Retirement Plans | 1-800-345-3533 |
| Banks and Trust Companies, Broker-Dealers, Financial Professionals, Insurance Companies | 1-800-345-6488 |
| Telecommunications Device for the Deaf | 1-800-634-4113 |
American Century Mutual Funds, Inc.
Investment Advisor:
American Century Investment Management, Inc.
Kansas City, Missouri
This report and the statements it contains are submitted for the general information of our shareholders. The report is not authorized for distribution to prospective investors unless preceded or accompanied by an effective prospectus.
©2012 American Century Proprietary Holdings, Inc. All rights reserved.
CL-ANN-76907 1212
ANNUAL REPORT OCTOBER 31, 2012
| President’s Letter | 2 |
| Independent Chairman’s Letter | 3 |
| Market Perspective | 4 |
| Performance | 5 |
| Portfolio Commentary | 7 |
| Fund Characteristics | 9 |
| Shareholder Fee Example | 10 |
| Schedule of Investments | 12 |
| Statement of Assets and Liabilities | 15 |
| Statement of Operations | 16 |
| Statement of Changes in Net Assets | 17 |
| Notes to Financial Statements | 18 |
| Financial Highlights | 24 |
| Report of Independent Registered Public Accounting Firm | 26 |
| Management | 27 |
| Approval of Management Agreement | 30 |
| Additional Information | 35 |
Any opinions expressed in this report reflect those of the author as of the date of the report, and do not necessarily represent the opinions of American Century Investments® or any other person in the American Century Investments organization. Any such opinions are subject to change at any time based upon market or other conditions and American Century Investments disclaims any responsibility to update such opinions. These opinions may not be relied upon as investment advice and, because investment decisions made by American Century Investments funds are based on numerous factors, may not be relied upon as an indication of trading intent on behalf of any American Century Investments fund. Security examples are used for representational purposes only and are not intended as recommendations to purchase or sell securities. Performance information for comparative indices and securities is provided to American Century Investments by third party vendors. To the best of American Century Investments’ knowledge, such information is accurate at the time of printing.
Dear Investor:
Thank you for reviewing this annual report for the 12 months ended October 31, 2012. Our report offers investment performance, market analysis, and portfolio information, presented with the expert perspective of our portfolio management team.
This report remains one of our most important vehicles for conveying information about fund returns, including key factors that affected fund performance. For additional, updated insights, we encourage you to visit our website, americancentury.com.
Favorable Fiscal-Year Returns for Most U.S. Stock and Bond Benchmarks
In a period fraught with concerns about factors such as the global economic recovery, European financial system stability, and the U.S. political picture, the 12-month returns for U.S. investors were generally favorable.
Both U.S. stocks and bonds rallied for much of the period, with U.S. equities generally outperforming their non-U.S. counterparts. The S&P 500 Index advanced 15.21%, compared with 4.61% for the MSCI EAFE (Europe, Australasia, Far East) Index. The Barclays U.S. Aggregate Bond Index returned 5.25%, and the 10-year U.S. Treasury note returned 7.47%, according to Barclays.
As it turned out, the overseas setbacks and the coordinated monetary policy response provided by prominent central banks around the world ultimately proved beneficial to the U.S. capital markets. Both U.S. stocks and bonds generally benefited from global investors’ trust in the U.S. financial system and from declining interest rates, helped by central bank purchases of government securities. The 10-year U.S. Treasury yield fell to a record low during the period, finishing at 1.69%.
The U.S. economy showed signs of improvement during the fiscal year, particularly the long-depressed housing market. However, the outlook for 2013 remains guarded, as the fragile recovery remains vulnerable to fiscal and financial factors that could trigger further slowdowns and market volatility.
Under these conditions, we continue to believe in a disciplined, diversified, long-term investment approach, using both stocks and bonds—as appropriate—for meeting financial goals. We appreciate your continued trust in us in this challenging environment.
Sincerely,
Jonathan Thomas
President and Chief Executive Officer
American Century Investments
Independent Chairman’s Letter |
Don Pratt
Dear Fellow Shareholders,
The board has once again completed its annual review of the advisory contract between the American Century Investments mutual funds overseen by the board and the funds’ advisor, American Century Investment Management, Inc. This process, often referred to as the 15(c) review, involves the independent directors considering all of the material monitored throughout the year and evaluating a wide range of factors to determine whether the management fee paid by each fund to the advisor is reasonable.
The independent directors’ rationale for this decision is provided in detail in this, or in a previous, report. However, there are several highlights that should be of interest to all shareholders.
| • | Fund performance and client service continue to be rated among theindustry’s best. |
| • | Target date and other asset allocation products continue to successfully gather assets and industry acclaim. |
| • | Compliance programs continue to function successfully with no issues impacting shareholder interests. |
| • | Fees were found to be within an acceptable competitive range, with minor fee waivers being negotiated on five funds. |
Knowing that most shareholders are long term investors, the board was particularly pleased with our succession planning review. Talented professionals are being added within portfolio management and experienced managers have been added to the senior management team.
Overall it was a very positive review for the American Century Investments mutual funds during a challenging market environment.
Best personal regards,
Don Pratt
By Greg Woodhams, Chief Investment Officer, U.S. Growth Equity — Large Cap
Stocks Advanced in a Volatile Year
U.S. equities produced solid gains during a sometimes volatile 12 months ended October 31, 2012. Stocks began the period with gains, buoyed by continued improvement in the economy and corporate earnings. The unemployment rate fell to its lowest level in three years by February 2012, while consumer confidence and the housing sector both showed clear signs of recovery. Equity investors also got some promising news out of Europe, as the European Central Bank provided support for the Continent’s banking sector.
However, stocks declined sharply from about April to June. Evidence of slowing economic activity in the U.S. and increasing turmoil in Europe weighed on investor confidence. Indeed, austerity policies and high rates of joblessness weighed on growth, with many European countries in recession at some point during 2012. Nevertheless, equity markets finished the fiscal year with a sharp rebound after the economic data, particularly in the U.S., turned out to be not as bad as feared.
Value Outperformed Growth, Large Outperformed Small
In that environment, value-oriented shares outperformed growth across all capitalization ranges as measured by the various Russell indices (see accompanying returns table). In terms of returns by size, large-capitalization stocks did better than those of mid- and small-cap companies.
Looking at the major sectors in the Russell 1000 Growth Index, performance was positive, but widely divergent, reflecting the volatile nature of the reporting period. For example, traditionally economically sensitive sectors such as energy, materials, and industrials lagged amid the uncertain outlook for global growth. Stocks with exposure to powerful themes, such as mobile and cloud computing and wireless communication, did well. Indeed, telecommunication services was the top-performing sector in both the Russell 1000 and Midcap Growth indices, driven by gains among wireless providers.
| U.S. Stock Index Returns |
| For the 12 months ended October 31, 2012 |
| Russell 1000 Index (Large-Cap) | 14.97% | | Russell 2000 Index (Small-Cap) | 12.08% |
| Russell 1000 Growth Index | 13.02% | | Russell 2000 Growth Index | 9.70% |
| Russell 1000 Value Index | 16.89% | | Russell 2000 Value Index | 14.47% |
| Russell Midcap Index | 12.15% | | |
| Russell Midcap Growth Index | 9.09% | | | |
| Russell Midcap Value Index | 14.99% | | | |
| Total Returns as of October 31, 2012 |
| | | | Average Annual Returns | |
| | Ticker Symbol | 1 year | 5 years | 10 years | Since Inception | Inception Date |
| Investor Class | TWCIX | 11.50% | 1.08% | 5.55% | 12.02% | 6/30/71(1) |
| Russell 1000 Growth Index | — | 13.02% | 1.95% | 7.15% | N/A(2) | — |
| Institutional Class | TWSIX | 11.73% | 1.29% | 5.76% | 5.02% | 3/13/97 |
A Class(3) No sales charge* With sales charge* | TWCAX | 11.22% 4.83% | 0.83% -0.36% | 5.29% 4.67% | 3.34% 2.94% | 8/8/97 |
| C Class | ACSLX | 10.37% | 0.08% | — | 5.07% | 1/31/03 |
| R Class | ASERX | 10.92% | 0.58% | — | 3.04% | 7/29/05 |
| * | Sales charges include initial sales charges and contingent deferred sales charges (CDSCs), as applicable. A Class shares have a 5.75% maximum initial sales charge and may be subject to a maximum CDSC of 1.00%. C Class shares redeemed within 12 months of purchase are subject to a maximum CDSC of 1.00%. The SEC requires that mutual funds provide performance information net of maximum sales charges in all cases where charges could be applied. |
| (1) | Although the fund’s actual inception date was 10/31/58, this inception date corresponds with the investment advisor’s implementation of its current investment philosophy and practices. |
| (2) | Benchmark data first available 12/29/78. |
| (3) | Prior to September 4, 2007, the A Class was referred to as the Advisor Class and did not have a front-end sales charge. Performance prior to that date has been adjusted to reflect this charge. |
Data presented reflect past performance. Past performance is no guarantee of future results. Current performance may be higher or lower than the performance shown. Investment return and principal value will fluctuate, and redemption value may be more or less than original cost. To obtain performance data current to the most recent month end, please call 1-800-345-2021 or visit americancentury.com. International investing involves special risks, such as political instability and currency fluctuations.
Unless otherwise indicated, performance reflects Investor Class shares; performance for other share classes will vary due to differences in fee structure. For information about other share classes available, please consult the prospectus. Data assumes reinvestment of dividends and capital gains, and none of the charts reflect the deduction of taxes that a shareholder would pay on fund distributions or the redemption of fund shares. Returns for the index are provided for comparison. The fund’s total returns include operating expenses (such as transaction costs and management fees) that reduce returns, while the total returns of the index do not.
| Growth of $10,000 Over 10 Years |
| $10,000 investment made October 31, 2002 |
| Total Annual Fund Operating Expenses |
| Investor Class | Institutional Class | A Class | C Class | R Class |
| 1.00% | 0.80% | 1.25% | 2.00% | 1.50% |
The total annual fund operating expenses shown is as stated in the fund’s prospectus current as of the date of this report. The prospectus may vary from the expense ratio shown elsewhere in this report because it is based on a different time period, includes acquired fund fees and expenses, and, if applicable, does not include fee waivers or expense reimbursements.
Data presented reflect past performance. Past performance is no guarantee of future results. Current performance may be higher or lower than the performance shown. Investment return and principal value will fluctuate, and redemption value may be more or less than original cost. To obtain performance data current to the most recent month end, please call 1-800-345-2021 or visit americancentury.com. International investing involves special risks, such as political instability and currency fluctuations.
Unless otherwise indicated, performance reflects Investor Class shares; performance for other share classes will vary due to differences in fee structure. For information about other share classes available, please consult the prospectus. Data assumes reinvestment of dividends and capital gains, and none of the charts reflect the deduction of taxes that a shareholder would pay on fund distributions or the redemption of fund shares. Returns for the index are provided for comparison. The fund’s total returns include operating expenses (such as transaction costs and management fees) that reduce returns, while the total returns of the index do not.
Portfolio Managers: Keith Lee and Michael Li
Performance Summary
Select returned 11.50%* for the 12 months ended October 31, 2012, compared with the 13.02% return of its benchmark, the Russell 1000 Growth Index, and the 15.21%** return of the S&P 500 Index, a broader market measure.
As discussed in the Market Perspective on page 4, equity indices generally gained during the reporting period, although they struggled with the challenges of a tepid global economic recovery and continued sovereign debt concerns in Europe. Despite this challenging environment, Select delivered solid results for the period.
Select derived positive absolute results from every sector in which it invested. Relative to the benchmark, security selection in the consumer discretionary and industrials sectors accounted for the bulk of Select’s underperformance. Stock selection in the information technology, consumer staples, and health care sectors added to relative returns.
Consumer Discretionary, Industrials Detracted
Select’s consumer discretionary holdings collectively underperformed benchmark returns for the sector. In particular, a position in retail company J.C. Penney Co. detracted. In its effort to transform the company from a discount retailer to a uniquely positioned company, the new management team underestimated the challenges related to change in customer behavior and had several execution missteps. As a result, the financial performance deteriorated further.
An overweight position in Fossil also detracted from results versus the benchmark. The watch retailer, which had been a top contributor early in the period with solid performance in the domestic market and tremendous growth in international countries, saw its share price decline as it lowered guidance due to weakness in Europe. Handbag retailer Coach underperformed, as it experienced disappointing sales results.
A position in Netflix hurt relative performance. The company reported a loss in the first quarter of 2012 due to higher costs of entering foreign markets and less-than-expected subscriber growth forecasted for the future. The position was eliminated. Also in the consumer discretionary sector, the portfolio held an underweight allocation to the media industry, a decision that hurt relative results. As optimism grew about the economic environment, advertising spending grew, helping companies in the industry group.
The industrials sector was a source of underperformance, largely attributable to stock selection in the electrical equipment industry group. Positioning in the aerospace and defense group also curbed relative results.
*All fund returns referenced in this commentary are for Investor Class shares.
**The S&P 500 Index average annual returns were 0.36% and 6.91% for the five- and 10-year periods ended October 31, 2012, respectively.
Information Technology, Consumer Staples, Health Care Helped
The information technology sector was the largest source of relative outperformance. Here, an overweight position in Apple added significantly to results, as the company unveiled its much-anticipated iPhone 5 in September, selling more than five million units in its debut weekend. Apple also won a patent lawsuit against Samsung, their major rival in the smart phone market. Also in the sector, stock selection in the semiconductor group helped results versus the benchmark.
The consumer staples sector added to absolute and relative results. Here, the portfolio benefited from positioning in the beverages group, including alcoholic beverage distributor Diageo. The company benefited from its emerging market sales along with higher profitability, and has produced steady, high growth among the lower growth staples companies. Holdings in the personal products group also contributed.
In the health care sector, Select was rewarded for its overweight position in Gilead Sciences. The company made progress on its development of therapies for Hepatitis C. Several positions among health care providers also benefited returns relative to the benchmark.
Starting Point for Next Reporting Period
The environment for growth and momentum oriented investment styles continued to be challenging during the reporting period. Although Select’s investment process experienced a headwind, the portfolio delivered sound positive results. Going forward, we remain confident in our investment beliefs that stocks which exhibit high quality, accelerating fundamentals, positive relative strength and attractive valuations will outperform in the long term.
| OCTOBER 31, 2012 |
| Top Ten Holdings | % of net assets |
| Apple, Inc. | 9.7% |
| Google, Inc., Class A | 4.6% |
| Gilead Sciences, Inc. | 2.9% |
| Costco Wholesale Corp. | 2.6% |
| Philip Morris International, Inc. | 2.6% |
| Teradata Corp. | 2.5% |
| Monsanto Co. | 2.4% |
| EMC Corp. | 2.4% |
| TJX Cos., Inc. (The) | 2.3% |
| MasterCard, Inc., Class A | 2.3% |
| | |
| Top Five Industries | % of net assets |
| Computers and Peripherals | 12.1% |
| Internet Software and Services | 6.2% |
| Biotechnology | 5.7% |
| Specialty Retail | 5.1% |
| IT Services | 4.8% |
| | |
| Types of Investments in Portfolio | % of net assets |
| Domestic Common Stocks | 93.3% |
| Foreign Common Stocks* | 5.0% |
| Total Common Stocks | 98.3% |
| Temporary Cash Investments | 1.8% |
| Other Assets and Liabilities | (0.1)% |
*Includes depositary shares, dual listed securities and foreign ordinary shares.
Fund shareholders may incur two types of costs: (1) transaction costs, including sales charges (loads) on purchase payments and redemption/exchange fees; and (2) ongoing costs, including management fees; distribution and service (12b-1) fees; and other fund expenses. This example is intended to help you understand your ongoing costs (in dollars) of investing in your fund and to compare these costs with the ongoing cost of investing in other mutual funds.
The example is based on an investment of $1,000 made at the beginning of the period and held for the entire period from May 1, 2012 to October 31, 2012.
Actual Expenses
The table provides information about actual account values and actual expenses for each class. You may use the information, together with the amount you invested, to estimate the expenses that you paid over the period. First, identify the share class you own. Then simply divide your account value by $1,000 (for example, an $8,600 account value divided by $1,000 = 8.6), then multiply the result by the number under the heading “Expenses Paid During Period” to estimate the expenses you paid on your account during this period.
If you hold Investor Class shares of any American Century Investments fund, or Institutional Class shares of the American Century Diversified Bond Fund, in an American Century Investments account (i.e., not a financial intermediary or retirement plan account), American Century Investments may charge you a $12.50 semiannual account maintenance fee if the value of those shares is less than $10,000. We will redeem shares automatically in one of your accounts to pay the $12.50 fee. In determining your total eligible investment amount, we will include your investments in all personal accounts (including American Century Investments Brokerage accounts) registered under your Social Security number. Personal accounts include individual accounts, joint accounts, UGMA/UTMA accounts, personal trusts, Coverdell Education Savings Accounts and IRAs (including traditional, Roth, Rollover, SEP-, SARSEP- and SIMPLE-IRAs), and certain other retirement accounts. If you have only business, business retirement, employer-sponsored or American Century Investments Brokerage accounts, you are currently not subject to this fee. If you are subject to the Account Maintenance Fee, your account value could be reduced by the fee amount.
Hypothetical Example for Comparison Purposes
The table also provides information about hypothetical account values and hypothetical expenses based on the actual expense ratio of each class of your fund and an assumed rate of return of 5% per year before expenses, which is not the actual return of a fund’s share class. The hypothetical account values and expenses may not be used to estimate the actual ending account balance or expenses you paid for the period. You may use this information to compare the ongoing costs of investing in your fund and other funds. To do so, compare this 5% hypothetical example with the 5% hypothetical examples that appear in the shareholder reports of the other funds.
Please note that the expenses shown in the table are meant to highlight your ongoing costs only and do not reflect any transactional costs, such as sales charges (loads) or redemption/exchange fees. Therefore, the table is useful in comparing ongoing costs only, and will not help you determine the relative total costs of owning different funds. In addition, if these transactional costs were included, your costs would have been higher.
| | Beginning Account Value 5/1/12 | Ending Account Value 10/31/12 | Expenses Paid During Period(1) 5/1/12 – 10/31/12 | Annualized Expense Ratio(1) |
| Actual | | | | |
| Investor Class | $1,000 | $978.20 | $4.97 | 1.00% |
| Institutional Class | $1,000 | $979.10 | $3.98 | 0.80% |
| A Class | $1,000 | $977.00 | $6.21 | 1.25% |
| C Class | $1,000 | $973.30 | $9.92 | 2.00% |
| R Class | $1,000 | $975.60 | $7.45 | 1.50% |
| Hypothetical | | | | |
| Investor Class | $1,000 | $1,020.11 | $5.08 | 1.00% |
| Institutional Class | $1,000 | $1,021.12 | $4.06 | 0.80% |
| A Class | $1,000 | $1,018.85 | $6.34 | 1.25% |
| C Class | $1,000 | $1,015.08 | $10.13 | 2.00% |
| R Class | $1,000 | $1,017.60 | $7.61 | 1.50% |
| (1) | Expenses are equal to the class’s annualized expense ratio listed in the table above, multiplied by the average account value over the period, multiplied by 184, the number of days in the most recent fiscal half-year, divided by 366, to reflect the one-half year period. |
| | | Shares | | | Value | |
| Common Stocks — 98.3% | |
| AEROSPACE AND DEFENSE — 2.8% | |
| General Dynamics Corp. | | | 383,100 | | | | $26,081,448 | |
| Rockwell Collins, Inc. | | | 520,000 | | | | 27,861,600 | |
| | | | | | | | 53,943,048 | |
| AIR FREIGHT AND LOGISTICS — 1.8% | |
| United Parcel Service, Inc., Class B | | | 476,000 | | | | 34,867,000 | |
| BEVERAGES — 1.9% | |
| Diageo plc | | | 1,309,695 | | | | 37,430,425 | |
| BIOTECHNOLOGY — 5.7% | |
Biogen Idec, Inc.(1) | | | 251,900 | | | | 34,817,618 | |
Gilead Sciences, Inc.(1) | | | 831,101 | | | | 55,816,743 | |
Vertex Pharmaceuticals, Inc.(1) | | | 414,400 | | | | 19,990,656 | |
| | | | | | | | 110,625,017 | |
| CAPITAL MARKETS — 1.9% | |
| Franklin Resources, Inc. | | | 279,800 | | | | 35,758,440 | |
| CHEMICALS — 3.6% | |
| Monsanto Co. | | | 548,000 | | | | 47,166,360 | |
| Potash Corp. of Saskatchewan, Inc. | | | 576,200 | | | | 23,261,194 | |
| | | | | | | | 70,427,554 | |
| COMMUNICATIONS EQUIPMENT — 2.1% | |
| QUALCOMM, Inc. | | | 685,600 | | | | 40,159,020 | |
| COMPUTERS AND PERIPHERALS — 12.1% | |
| Apple, Inc. | | | 316,600 | | | | 188,408,660 | |
EMC Corp.(1) | | | 1,880,700 | | | | 45,926,694 | |
| | | | | | | | 234,335,354 | |
| DIVERSIFIED FINANCIAL SERVICES — 1.9% | |
| CME Group, Inc. | | | 174,900 | | | | 9,782,157 | |
| Hong Kong Exchanges and Clearing Ltd. | | | 601,508 | | | | 9,926,758 | |
| JPMorgan Chase & Co. | | | 418,900 | | | | 17,459,752 | |
| | | | | | | | 37,168,667 | |
| ELECTRICAL EQUIPMENT — 1.5% | |
| Emerson Electric Co. | | | 589,900 | | | | 28,568,857 | |
| ENERGY EQUIPMENT AND SERVICES — 2.8% | |
| Diamond Offshore Drilling, Inc. | | | 143,800 | | | | 9,956,712 | |
| National Oilwell Varco, Inc. | | | 192,900 | | | | 14,216,730 | |
| Schlumberger Ltd. | | | 428,300 | | | | 29,779,699 | |
| | | | | | | | 53,953,141 | |
| FOOD AND STAPLES RETAILING — 3.2% | |
| Costco Wholesale Corp. | | | 511,500 | | | | 50,346,945 | |
| PriceSmart, Inc. | | | 148,200 | | | | 12,299,118 | |
| | | | | | | | 62,646,063 | |
| FOOD PRODUCTS — 2.2% | |
| Hershey Co. (The) | | | 202,700 | | | | 13,955,895 | |
| Mead Johnson Nutrition Co. | | | 361,600 | | | | 22,296,256 | |
Smart Balance, Inc.(1) | | | 439,000 | | | | 5,224,100 | |
| | | | | | | | 41,476,251 | |
| HEALTH CARE EQUIPMENT AND SUPPLIES — 1.2% | |
Intuitive Surgical, Inc.(1) | | | 43,400 | | | | 23,532,348 | |
| HEALTH CARE PROVIDERS AND SERVICES — 4.0% | |
Express Scripts Holding Co.(1) | | | 559,200 | | | | 34,413,168 | |
| UnitedHealth Group, Inc. | | | 781,200 | | | | 43,747,200 | |
| | | | | | | | 78,160,368 | |
| HOTELS, RESTAURANTS AND LEISURE — 1.5% | |
| McDonald’s Corp. | | | 325,000 | | | | 28,210,000 | |
| HOUSEHOLD DURABLES — 0.7% | |
| Harman International Industries, Inc. | | | 320,400 | | | | 13,434,372 | |
| INSURANCE — 1.2% | |
| Travelers Cos., Inc. (The) | | | 331,000 | | | | 23,481,140 | |
| INTERNET AND CATALOG RETAIL — 1.7% | |
Amazon.com, Inc.(1) | | | 138,400 | | | | 32,222,288 | |
| INTERNET SOFTWARE AND SERVICES — 6.2% | |
Baidu, Inc. ADR(1) | | | 195,100 | | | | 20,801,562 | |
Facebook, Inc. Class A(1) | | | 322,400 | | | | 6,807,476 | |
Google, Inc., Class A(1) | | | 131,700 | | | | 89,525,709 | |
Responsys, Inc.(1) | | | 307,300 | | | | 2,747,262 | |
| | | | | | | | 119,882,009 | |
| IT SERVICES — 4.8% | |
| MasterCard, Inc., Class A | | | 96,700 | | | | 44,571,931 | |
Teradata Corp.(1) | | | 691,300 | | | | 47,222,703 | |
| | | | | | | | 91,794,634 | |
| LEISURE EQUIPMENT AND PRODUCTS — 0.8% | |
| Hasbro, Inc. | | | 453,900 | | | | 16,335,861 | |
| MACHINERY — 4.3% | |
| Graco, Inc. | | | 308,600 | | | | 14,831,316 | |
| Nordson Corp. | | | 279,900 | | | | 16,522,497 | |
| Parker-Hannifin Corp. | | | 411,700 | | | | 32,384,322 | |
| Xylem, Inc. | | | 774,400 | | | | 18,786,944 | |
| | | | | | | | 82,525,079 | |
| MEDIA — 2.1% | |
| Walt Disney Co. (The) | | | 829,100 | | | | 40,683,937 | |
| METALS AND MINING — 0.5% | |
| Freeport-McMoRan Copper & Gold, Inc. | | | 247,200 | | | | 9,611,136 | |
| MULTILINE RETAIL — 0.5% | |
| J.C. Penney Co., Inc. | | | 379,700 | | | | 9,116,597 | |
| | |
| | | | Shares | | | | Value | |
| OIL, GAS AND CONSUMABLE FUELS — 2.9% | | | | | | | | |
| Exxon Mobil Corp. | | | 333,700 | | | | $30,423,429 | |
| Occidental Petroleum Corp. | | | 322,400 | | | | 25,456,704 | |
| | | | | | | | 55,880,133 | |
| PERSONAL PRODUCTS — 2.2% | |
| Estee Lauder Cos., Inc. (The), Class A | | | 697,500 | | | | 42,979,950 | |
| PHARMACEUTICALS — 3.3% | |
| Allergan, Inc. | | | 343,200 | | | | 30,860,544 | |
| Bristol-Myers Squibb Co. | | | 811,800 | | | | 26,992,350 | |
| Teva Pharmaceutical Industries Ltd. ADR | | | 128,100 | | | | 5,177,802 | |
| | | | | | | | 63,030,696 | |
| PROFESSIONAL SERVICES — 1.0% | |
IHS, Inc. Class A(1) | | | 123,200 | | | | 10,396,848 | |
Verisk Analytics, Inc. Class A(1) | | | 175,300 | | | | 8,940,300 | |
| | | | | | | | 19,337,148 | |
| REAL ESTATE INVESTMENT TRUSTS (REITs) — 1.3% | |
| American Tower Corp. | | | 335,300 | | | | 25,244,737 | |
| SEMICONDUCTORS AND SEMICONDUCTOR EQUIPMENT — 3.0% | |
| Broadcom Corp., Class A | | | 884,800 | | | | 27,902,168 | |
| Linear Technology Corp. | | | 969,900 | | | | 30,319,074 | |
| | | | | | | | 58,221,242 | |
| SOFTWARE — 2.2% | |
| Microsoft Corp. | | | 292,000 | | | | 8,332,220 | |
| Oracle Corp. | | | 1,109,200 | | | | 34,440,660 | |
| | | | | | | | 42,772,880 | |
| SPECIALTY RETAIL — 5.1% | |
AutoZone, Inc.(1) | | | 55,800 | | | | 20,925,000 | |
| Limited Brands, Inc. | | | 672,900 | | | | 32,225,181 | |
| TJX Cos., Inc. (The) | | | 1,076,800 | | | | 44,827,184 | |
| | | | | | | | 97,977,365 | |
| TEXTILES, APPAREL AND LUXURY GOODS — 1.7% | |
| Coach, Inc. | | | 488,700 | | | | 27,391,635 | |
Tumi Holdings, Inc.(1) | | | 258,600 | | | | 5,792,640 | |
| | | | | | | | 33,184,275 | |
| TOBACCO — 2.6% | |
| Philip Morris International, Inc. | | | 559,700 | | | | 49,567,032 | |
TOTAL COMMON STOCKS (Cost $1,253,657,342) | | | | 1,898,544,064 | |
| Temporary Cash Investments — 1.8% | |
Repurchase Agreement, Bank of America Merrill Lynch, (collateralized by various U.S. Treasury obligations, 1.50% – 2.00%, 1/31/16 – 6/30/16, valued at $14,179,837), in a joint trading account at 0.23%, dated 10/31/12, due 11/1/12 (Delivery value $13,894,105) | | | | 13,894,016 | |
Repurchase Agreement, Credit Suisse First Boston, Inc., (collateralized by various U.S. Treasury obligations, 3.125% – 3.75%, 8/15/41 – 2/15/42, valued at $14,212,803), in a joint trading account at 0.20%, dated 10/31/12, due 11/1/12 (Delivery value $13,894,092) | | | | 13,894,015 | |
Repurchase Agreement, Goldman Sachs & Co., (collateralized by various U.S. Treasury obligations, 4.625%, 2/15/40, valued at $5,902,075), in a joint trading account at 0.16%, dated 10/31/12, due 11/1/12 (Delivery value $5,787,347) | | | | 5,787,321 | |
| SSgA U.S. Government Money Market Fund | | | 61,238 | | | | 61,238 | |
TOTAL TEMPORARY CASH INVESTMENTS (Cost $33,636,590) | | | | 33,636,590 | |
TOTAL INVESTMENT SECURITIES — 100.1% (Cost $1,287,293,932) | | | | 1,932,180,654 | |
| OTHER ASSETS AND LIABILITIES — (0.1)% | | | | (1,331,113 | ) |
| TOTAL NET ASSETS — 100.0% | | | | $1,930,849,541 | |
| Forward Foreign Currency Exchange Contracts |
| Contracts to Sell | Counterparty | Settlement Date | Value | Unrealized Gain (Loss) |
| 19,587,471 | GBP for USD | Credit Suisse AG | 11/30/12 | $31,606,257 | $(79,243) |
(Value on Settlement Date $31,527,014)
Notes to Schedule of Investments
ADR = American Depositary Receipt
GBP = British Pound
USD = United States Dollar
See Notes to Financial Statements.
Statement of Assets and Liabilities |
| OCTOBER 31, 2012 | |
| Assets | |
| Investment securities, at value (cost of $1,287,293,932) | | | $1,932,180,654 | |
| Foreign currency holdings, at value (cost of $707,449) | | | 712,131 | |
| Receivable for capital shares sold | | | 997,452 | |
| Dividends and interest receivable | | | 1,123,226 | |
| | | | 1,935,013,463 | |
| | | | | |
| Liabilities | | | | |
| Payable for investments purchased | | | 1,129,842 | |
| Payable for capital shares redeemed | | | 1,258,198 | |
| Unrealized loss on forward foreign currency exchange contracts | | | 79,243 | |
| Accrued management fees | | | 1,681,315 | |
| Distribution and service fees payable | | | 15,324 | |
| | | | 4,163,922 | |
| | | | | |
| Net Assets | | | $1,930,849,541 | |
| | | | | |
| Net Assets Consist of: | | | | |
| Capital (par value and paid-in surplus) | | | $1,403,429,384 | |
| Undistributed net investment income | | | 8,629,252 | |
| Accumulated net realized loss | | | (126,021,256 | ) |
| Net unrealized appreciation | | | 644,812,161 | |
| | | | $1,930,849,541 | |
| | Net assets | Shares outstanding | Net asset value per share |
| Investor Class, $0.01 Par Value | $1,861,545,483 | 42,773,590 | $43.52 |
| Institutional Class, $0.01 Par Value | $16,828,100 | 382,096 | $44.04 |
| A Class, $0.01 Par Value | $45,354,679 | 1,058,437 | $42.85* |
| C Class, $0.01 Par Value | $5,665,619 | 139,035 | $40.75 |
| R Class, $0.01 Par Value | $1,455,660 | 33,961 | $42.86 |
*Maximum offering price $45.46 (net asset value divided by 0.9425).
See Notes to Financial Statements.
| YEAR ENDED OCTOBER 31, 2012 | |
| Investment Income (Loss) | |
| Income: | | | |
| Dividends (net of foreign taxes withheld of $86,477) | | | $26,824,161 | |
| Interest | | | 24,166 | |
| | | | 26,848,327 | |
| | | | | |
| Expenses: | | | | |
| Management fees | | | 19,014,710 | |
| Distribution and service fees: | | | | |
| A Class | | | 91,025 | |
| C Class | | | 27,975 | |
| R Class | | | 3,539 | |
| Directors’ fees and expenses | | | 71,594 | |
| Other expenses | | | 162 | |
| | | | 19,209,005 | |
| | | | | |
| Net investment income (loss) | | | 7,639,322 | |
| | | | | |
| Realized and Unrealized Gain (Loss) | | | | |
| Net realized gain (loss) on: | | | | |
| Investment transactions | | | 50,271,841 | |
| Foreign currency transactions | | | 917,240 | |
| | | | 51,189,081 | |
| | | | | |
| Change in net unrealized appreciation (depreciation) on: | | | | |
| Investments | | | 142,308,002 | |
| Translation of assets and liabilities in foreign currencies | | | 99,729 | |
| | | | 142,407,731 | |
| | | | | |
| Net realized and unrealized gain (loss) | | | 193,596,812 | |
| | | | | |
| Net Increase (Decrease) in Net Assets Resulting from Operations | | | $201,236,134 | |
See Notes to Financial Statements.
Statement of Changes in Net Assets |
| YEARS ENDED OCTOBER 31, 2012 AND OCTOBER 31, 2011 | |
| Increase (Decrease) in Net Assets | | October 31, 2012 | | | October 31, 2011 | |
| Operations | |
| Net investment income (loss) | | | $7,639,322 | | | | $4,688,472 | |
| Net realized gain (loss) | | | 51,189,081 | | | | 39,129,701 | |
| Change in net unrealized appreciation (depreciation) | | | 142,407,731 | | | | 138,891,678 | |
| Net increase (decrease) in net assets resulting from operations | | | 201,236,134 | | | | 182,709,851 | |
| | | | | | | | | |
| Distributions to Shareholders | | | | | | | | |
| From net investment income: | | | | | | | | |
| Investor Class | | | (4,659,009 | ) | | | (5,930,534 | ) |
| Institutional Class | | | (23,035 | ) | | | (25,646 | ) |
| A Class | | | (7,931 | ) | | | (17,175 | ) |
| Decrease in net assets from distributions | | | (4,689,975 | ) | | | (5,973,355 | ) |
| | | | | | | | | |
| Capital Share Transactions | | | | | | | | |
| Net increase (decrease) in net assets from capital share transactions | | | (61,750,287 | ) | | | (130,244,559 | ) |
| | | | | | | | | |
| Net increase (decrease) in net assets | | | 134,795,872 | | | | 46,491,937 | |
| | | | | | | | | |
| Net Assets | | | | | | | | |
| Beginning of period | | | 1,796,053,669 | | | | 1,749,561,732 | |
| End of period | | | $1,930,849,541 | | | | $1,796,053,669 | |
| | | | | | | | | |
| Undistributed net investment income | | | $8,629,252 | | | | $4,867,506 | |
See Notes to Financial Statements.
Notes to Financial Statements |
OCTOBER 31, 2012
1. Organization
American Century Mutual Funds, Inc. (the corporation) is registered under the Investment Company Act of 1940, as amended (the 1940 Act), as an open-end management investment company and is organized as a Maryland corporation. Select Fund (the fund) is one fund in a series issued by the corporation. The fund is diversified as defined under the 1940 Act. The fund’s investment objective is to seek long-term capital growth. The fund pursues its objective by investing primarily in stocks of larger-sized companies that management believes will increase in value over time.
The fund offers the Investor Class, the Institutional Class, the A Class, the C Class and the R Class. The A Class may incur an initial sales charge. The A Class and C Class may be subject to a contingent deferred sales charge. The share classes differ principally in their respective sales charges and distribution and shareholder servicing expenses and arrangements. The Institutional Class is made available to institutional shareholders or through financial intermediaries whose clients do not require the same level of shareholder and administrative services as shareholders of other classes. As a result, the Institutional Class is charged a lower unified management fee. On October 21, 2011, all outstanding B Class shares were converted to A Class shares and the fund discontinued offering the B Class.
2. Significant Accounting Policies
The following is a summary of significant accounting policies consistently followed by the fund in preparation of its financial statements. The financial statements are prepared in conformity with accounting principles generally accepted in the United States of America, which may require management to make certain estimates and assumptions at the date of the financial statements. Actual results could differ from these estimates.
Investment Valuations — The fund determines the fair value of its investments and computes its net asset value per share as of the close of regular trading (usually 4 p.m. Eastern time) on the New York Stock Exchange (NYSE) on each day the NYSE is open.
Equity securities that are listed or traded on a domestic securities exchange are valued at the last reported sales price or at the official closing price as provided by the exchange. Equity securities traded on foreign securities exchanges are typically valued at the closing price on the exchange where primarily traded or as of the close of the NYSE, if that is earlier. If no last sales price is reported, or if local convention or regulation so provides, the mean of the latest bid and asked prices is used. Depending on local convention or regulation, securities traded over-the-counter are valued at the mean of the latest bid and asked prices, the last sales price, or the official closing price. In its determination of fair value, the fund may review several factors including: market information specific to a security; news developments in U.S. and foreign markets; the performance of particular U.S. and foreign securities, indices, comparable securities, American Depositary Receipts, Exchange-Traded Funds, and other relevant market indicators.
Debt securities maturing within 60 days at the time of purchase may be valued at cost, plus or minus any amortized discount or premium or at the evaluated mean as provided by an independent pricing service. Evaluated mean prices are commonly derived through utilization of market models, which may consider, among other factors, trade data, quotations from dealers and active market makers, relevant yield curve and spread data, related sector levels, creditworthiness, and other relevant market information on the same or comparable securities.
Investments in open-end management investment companies are valued at the reported net asset value per share. Repurchase agreements are valued at cost. Forward foreign currency exchange contracts are valued at the mean of the latest bid and asked prices of the forward currency rates as provided by an independent pricing service.
The value of investments initially expressed in foreign currencies is translated into U.S. dollars at prevailing exchange rates.
If the fund determines that the market price for a portfolio security is not readily available or the valuation methods mentioned above do not reflect a security’s fair value, such security is valued as determined in good faith by the Board of Directors or its designee, in accordance with procedures adopted by the Board of Directors. Circumstances that may cause the fund to use these procedures to value a security include, but are not limited to: a security has been declared in default; trading in a security has been halted during the trading day; there is a foreign market holiday and no trading occurred; or an event occurred between the close of a foreign exchange and the NYSE that may affect the value of a security.
Security Transactions — Security transactions are accounted for as of the trade date. Net realized gains and losses are determined on the identified cost basis, which is also used for federal income tax purposes.
Investment Income — Dividend income less foreign taxes withheld, if any, is recorded as of the ex-dividend date. Distributions received on securities that represent a return of capital or capital gain are recorded as a reduction of cost of investments and/or as a realized gain. The fund estimates the components of distributions received that may be considered nontaxable distributions or capital gain distributions for income tax purposes. Interest income is recorded on the accrual basis and includes accretion of discounts and amortization of premiums.
Foreign Currency Translations — All assets and liabilities initially expressed in foreign currencies are translated into U.S. dollars at prevailing exchange rates at period end. The fund may enter into spot foreign currency exchange contracts to facilitate transactions denominated in a foreign currency. Purchases and sales of investment securities, dividend and interest income, spot foreign currency exchange contracts, and expenses are translated at the rates of exchange prevailing on the respective dates of such transactions. Net realized and unrealized foreign currency exchange gains or losses related to investment securities are a component of net realized gain (loss) on investment transactions and change in net unrealized appreciation (depreciation) on investments, respectively.
Repurchase Agreements — The fund may enter into repurchase agreements with institutions that American Century Investment Management, Inc. (ACIM) (the investment advisor) has determined are creditworthy pursuant to criteria adopted by the Board of Directors. The fund requires that the collateral, represented by securities, received in a repurchase transaction be transferred to the custodian in a manner sufficient to enable the fund to obtain those securities in the event of a default under the repurchase agreement. ACIM monitors, on a daily basis, the securities transferred to ensure the value, including accrued interest, of the securities under each repurchase agreement is equal to or greater than amounts owed to the fund under each repurchase agreement.
Joint Trading Account — Pursuant to an Exemptive Order issued by the Securities and Exchange Commission, the fund, along with certain other funds in the American Century Investments family of funds, may transfer uninvested cash balances into a joint trading account. These balances are invested in one or more repurchase agreements that are collateralized by U.S. Treasury or Agency obligations.
Income Tax Status — It is the fund’s policy to distribute substantially all net investment income and net realized gains to shareholders and to otherwise qualify as a regulated investment company under provisions of the Internal Revenue Code. The fund is no longer subject to examination by tax authorities for years prior to 2009. At this time, management believes there are no uncertain tax positions which, based on their technical merit, would not be sustained upon examination and for which it is reasonably possible that the total amounts of unrecognized tax benefits will significantly change in the next twelve months. Accordingly, no provision has been made for federal or state income taxes.
Multiple Class — All shares of the fund represent an equal pro rata interest in the net assets of the class to which such shares belong, and have identical voting, dividend, liquidation and other rights and the same terms and conditions, except for class specific expenses and exclusive rights to vote on matters affecting only individual classes. Income, non-class specific expenses, and realized and unrealized capital gains and losses of the fund are allocated to each class of shares based on their relative net assets.
Distributions to Shareholders — Distributions from net investment income and net realized gains, if any, are generally declared and paid annually.
Indemnifications — Under the corporation’s organizational documents, its officers and directors are indemnified against certain liabilities arising out of the performance of their duties to the fund. In addition, in the normal course of business, the fund enters into contracts that provide general indemnifications. The maximum exposure under these arrangements is unknown as this would involve future claims that may be made against a fund. The risk of material loss from such claims is considered by management to be remote.
3. Fees and Transactions with Related Parties
Management Fees — The corporation has entered into a management agreement with ACIM, under which ACIM provides the fund with investment advisory and management services in exchange for a single, unified management fee (the fee) per class. The agreement provides that all expenses of managing and operating the fund, except distribution and service fees, brokerage expenses, taxes, interest, fees and expenses of the independent directors (including legal counsel fees), and extraordinary expenses, will be paid by ACIM. The fee is computed and accrued daily based on each class’s daily net assets and paid monthly in arrears. The rate of the fee is determined by applying a fee rate calculation formula. This formula takes into account the fund’s assets as well as certain assets, if any, of other clients of the investment advisor outside the American Century Investments family of funds (such as subadvised funds and separate accounts) that have very similar investment teams and investment strategies (strategy assets). The annual management fee schedule ranges from 0.800% to 1.000% for the Investor Class, A Class, C Class and R Class. The Institutional Class is 0.200% less at each point within the range. The effective annual management fee for each class for the year ended October 31, 2012 was 1.00% for the Investor Class, A Class, C Class and R Class and 0.80% for the Institutional Class.
Distribution and Service Fees — The Board of Directors has adopted a separate Master Distribution and Individual Shareholder Services Plan for each of the A Class, C Class and R Class (collectively the plans), pursuant to Rule 12b-1 of the 1940 Act. The plans provide that the A Class will pay American Century Investment Services, Inc. (ACIS) an annual distribution and service fee of 0.25%. The plans provide that the C Class will pay ACIS an annual distribution and service fee of 1.00%, of which 0.25% is paid for individual shareholder services and 0.75% is paid for distribution services. The plans provide that the R Class will pay ACIS an annual distribution and service fee of 0.50%. The fees are computed and accrued daily based on each class’s daily net assets and paid monthly in arrears. The fees are used to pay financial intermediaries for distribution and individual shareholder services. Fees incurred under the plans during the year ended October 31, 2012 are detailed in the Statement of Operations.
Related Parties — Certain officers and directors of the corporation are also officers and/or directors of American Century Companies, Inc., the parent of the corporation’s investment advisor, ACIM, the distributor of the corporation, ACIS, and the corporation’s transfer agent, American Century Services, LLC.
4. Investment Transactions
Purchases and sales of investment securities, excluding short-term investments, for the year ended October 31, 2012 were $319,850,395 and $375,030,367, respectively.
5. Capital Share Transactions
Transactions in shares of the fund were as follows:
| | | Year ended October 31, 2012 | | | Year ended October 31, 2011 | |
| | | Shares | | | Amount | | | Shares | | | Amount | |
| Investor Class/Shares Authorized | | | 300,000,000 | | | | | | | 300,000,000 | | | | |
| Sold | | | 2,187,738 | | | | $93,774,628 | | | | 1,326,866 | | | | $51,400,404 | |
| Issued in reinvestment of distributions | | | 117,261 | | | | 4,458,282 | | | | 150,928 | | | | 5,679,445 | |
| Redeemed | | | (4,641,009 | ) | | | (195,137,515 | ) | | | (4,831,149 | ) | | | (187,400,425 | ) |
| | | | (2,336,010 | ) | | | (96,904,605 | ) | | | (3,353,355 | ) | | | (130,320,576 | ) |
| Institutional Class/Shares Authorized | | | 40,000,000 | | | | | | | | 40,000,000 | | | | | |
| Sold | | | 285,373 | | | | 12,571,675 | | | | 32,761 | | | | 1,267,331 | |
| Issued in reinvestment of distributions | | | 596 | | | | 22,905 | | | | 670 | | | | 25,466 | |
| Redeemed | | | (33,480 | ) | | | (1,449,400 | ) | | | (30,754 | ) | | | (1,223,056 | ) |
| | | | 252,489 | | | | 11,145,180 | | | | 2,677 | | | | 69,741 | |
| A Class/Shares Authorized | | | 75,000,000 | | | | | | | | 75,000,000 | | | | | |
| Sold | | | 614,826 | | | | 25,736,761 | | | | 163,231 | | | | 6,203,697 | |
| Issued in reinvestment of distributions | | | 209 | | | | 7,821 | | | | 454 | | | | 16,873 | |
| Redeemed | | | (194,157 | ) | | | (8,068,061 | ) | | | (116,745 | ) | | | (4,454,011 | ) |
| | | | 420,878 | | | | 17,676,521 | | | | 46,940 | | | | 1,766,559 | |
| B Class/Shares Authorized | | | N/A | | | | | | | | 25,000,000 | | | | | |
| Sold | | | | | | | | | | | 1,180 | | | | 44,854 | |
| Redeemed | | | | | | | | | | | (53,880 | ) | | | (1,958,733 | ) |
| | | | | | | | | | | | (52,700 | ) | | | (1,913,879 | ) |
| C Class/Shares Authorized | | | 25,000,000 | | | | | | | | 25,000,000 | | | | | |
| Sold | | | 135,986 | | | | 5,492,534 | | | | 9,157 | | | | 319,498 | |
| Redeemed | | | (12,415 | ) | | | (502,300 | ) | | | (5,253 | ) | | | (194,203 | ) |
| | | | 123,571 | | | | 4,990,234 | | | | 3,904 | | | | 125,295 | |
| R Class/Shares Authorized | | | 50,000,000 | | | | | | | | 50,000,000 | | | | | |
| Sold | | | 34,430 | | | | 1,429,554 | | | | 1,023 | | | | 40,053 | |
| Redeemed | | | (2,001 | ) | | | (87,171 | ) | | | (303 | ) | | | (11,752 | ) |
| | | | 32,429 | | | | 1,342,383 | | | | 720 | | | | 28,301 | |
| Net increase (decrease) | | | (1,506,643 | ) | | | $(61,750,287 | ) | | | (3,351,814 | ) | | | $(130,244,559 | ) |
6. Fair Value Measurements
The fund’s securities valuation process is based on several considerations and may use multiple inputs to determine the fair value of the positions held by the fund. In conformity with accounting principles generally accepted in the United States of America, the inputs used to determine a valuation are classified into three broad levels as follows:
| • | Level 1 valuation inputs consist of unadjusted quoted prices in an active market for identical securities; |
| • | Level 2 valuation inputs consist of direct or indirect observable market data (including quoted prices for similar securities, evaluations of subsequent market events, interest rates, prepayment speeds, credit risk, etc.); or |
| • | Level 3 valuation inputs consist of unobservable data (including a fund’s own assumptions). |
The level classification is based on the lowest level input that is significant to the fair valuation measurement. The valuation inputs are not necessarily an indication of the risks associated with investing in these securities or other financial instruments.
The following is a summary of the level classifications as of period end. The Schedule of Investments provides additional information on the fund’s portfolio holdings.
| | | Level 1 | | | Level 2 | | | Level 3 | |
| Investment Securities | |
| Domestic Common Stocks | | | $1,801,946,323 | | | | — | | | | — | |
| Foreign Common Stocks | | | 49,240,558 | | | | $47,357,183 | | | | — | |
| Temporary Cash Investments | | | 61,238 | | | | 33,575,352 | | | | — | |
| Total Value of Investment Securities | | | $1,851,248,119 | | | | $80,932,535 | | | | — | |
| | | | | | | | | | | | | |
| Other Financial Instruments | |
| Total Unrealized Gain (Loss) on Forward Foreign Currency Exchange Contracts | | | — | | | | $(79,243 | ) | | | — | |
7. Derivative Instruments
Foreign Currency Risk — The fund is subject to foreign currency exchange rate risk in the normal course of pursuing its investment objectives. The value of foreign investments held by a fund may be significantly affected by changes in foreign currency exchange rates. The dollar value of a foreign security generally decreases when the value of the dollar rises against the foreign currency in which the security is denominated and tends to increase when the value of the dollar declines against such foreign currency. A fund may enter into forward foreign currency exchange contracts to reduce a fund’s exposure to foreign currency exchange rate fluctuations. The net U.S. dollar value of foreign currency underlying all contractual commitments held by a fund and the resulting unrealized appreciation or depreciation are determined daily. Realized gain or loss is recorded upon the termination of the contract. Net realized and unrealized gains or losses occurring during the holding period of forward foreign currency exchange contracts are a component of net realized gain (loss) on foreign currency transactions and change in net unrealized appreciation (depreciation) on translation of assets and liabilities in foreign currencies, respectively. A fund bears the risk of an unfavorable change in the foreign currency exchange rate underlying the forward contract. Additionally, losses, up to the fair value, may arise if the counterparties do not perform under the contract terms. The foreign currency risk derivative instruments held at period end as disclosed on the Schedule of Investments are indicative of the fund’s typical volume during the period.
The value of foreign currency risk derivative instruments as of October 31, 2012, is disclosed on the Statement of Assets and Liabilities as a liability of $79,243 in unrealized loss on forward foreign currency exchange contracts. For the year ended October 31, 2012, the effect of foreign currency risk derivative instruments on the Statement of Operations was $912,088 in net realized gain (loss) on foreign currency transactions and $101,288 in change in net unrealized appreciation (depreciation) on translation of assets and liabilities in foreign currencies.
8. Risk Factors
There are certain risks involved in investing in foreign securities. These risks include those resulting from future adverse political, social and economic developments, fluctuations in currency exchange rates, the possible imposition of exchange controls, and other foreign laws or restrictions.
9. Federal Tax Information
The tax character of distributions paid during the years ended October 31, 2012 and October 31, 2011 were as follows:
| | | 2012 | | | 2011 | |
| Distributions Paid From | | | | | | |
| Ordinary income | | | $4,689,975 | | | | $5,973,355 | |
| Long-term capital gains | | | — | | | | — | |
The book-basis character of distributions made during the year from net investment income or net realized gains may differ from their ultimate characterization for federal income tax purposes. These differences reflect the differing character of certain income items and net realized gains and losses for financial statement and tax purposes, and may result in reclassification among certain capital accounts on the financial statements.
As of October 31, 2012, the federal tax cost of investments and the components of distributable earnings on a tax-basis were as follows:
| Federal tax cost of investments | | | $1,290,459,793 | |
| Gross tax appreciation of investments | | | $659,575,935 | |
| Gross tax depreciation of investments | | | (17,855,074 | ) |
| Net tax appreciation (depreciation) of investments | | | $641,720,861 | |
| Net tax appreciation (depreciation) on derivatives and translation of assets and liabilities in foreign currencies | | | $4,682 | |
| Net tax appreciation (depreciation) | | | $641,725,543 | |
| Undistributed ordinary income | | | $8,550,009 | |
| Accumulated short-term capital losses | | | $(122,855,395 | ) |
The difference between book-basis and tax-basis cost and unrealized appreciation (depreciation) is attributable primarily to the tax deferral of losses on wash sales and the realization for tax purposes of unrealized gains (losses) on certain foreign currency exchange contracts.
Accumulated capital losses represent net capital loss carryovers that may be used to offset future realized capital gains for federal income tax purposes. Future capital loss carryover utilization in any given year may be subject to Internal Revenue Code limitations. Capital loss carryovers of $(102,366,341) and $(20,489,054) expire in 2017 and 2018, respectively.
| For a Share Outstanding Throughout the Years Ended October 31 (except as noted) | |
| Per-Share Data | | | Ratios and Supplemental Data | |
| | | | | Income From Investment Operations: | | | Distributions From: | | | | | | | | | Ratio to Average Net Assets of: | | | | | | | |
| | | Net Asset Value, Beginning of Period | | Net Investment Income (Loss)(1) | | | Net Realized and Unrealized Gain (Loss) | | | Total From Investment Operations | | | Net Investment Income | | | Net Realized Gains | | | Total Distributions | | | Net Asset Value, End of Period | | | Total Return(2) | | | Operating Expenses | | | Net Investment Income (Loss) | | | Portfolio Turnover Rate | | | Net Assets, End of Period (in thousands) | |
| Investor Class | |
| 2012 | | $39.14 | | 0.17 | | | 4.31 | | | 4.48 | | | (0.10 | ) | | — | | | (0.10 | ) | | $43.52 | | | 11.50 | % | | 1.00 | % | | 0.41 | % | | 17 | % | | $1,861,545 | |
| 2011 | | $35.54 | | 0.10 | | | 3.62 | | | 3.72 | | | (0.12 | ) | | — | | | (0.12 | ) | | $39.14 | | | 10.49 | % | | 1.00 | % | | 0.26 | % | | 17 | % | | $1,765,718 | |
| 2010 | | $30.58 | | 0.11 | | | 5.01 | | | 5.12 | | | (0.16 | ) | | — | | | (0.16 | ) | | $35.54 | | | 16.78 | % | | 1.01 | % | | 0.34 | % | | 35 | % | | $1,722,138 | |
| 2009 | | $26.25 | | 0.19 | | | 4.40 | | | 4.59 | | | (0.26 | ) | | — | | | (0.26 | ) | | $30.58 | | | 17.77 | % | | 1.00 | % | | 0.75 | % | | 31 | % | | $1,591,621 | |
| 2008 | | $45.58 | | 0.07 | | | (16.10 | ) | | (16.03 | ) | | — | | | (3.30 | ) | | (3.30 | ) | | $26.25 | | | (37.71 | )% | | 1.00 | % | | 0.19 | % | | 64 | % | | $1,448,954 | |
| Institutional Class | |
| 2012 | | $39.60 | | 0.24 | | | 4.38 | | | 4.62 | | | (0.18 | ) | | — | | | (0.18 | ) | | $44.04 | | | 11.73 | % | | 0.80 | % | | 0.61 | % | | 17 | % | | $16,828 | |
| 2011 | | $35.95 | | 0.18 | | | 3.67 | | | 3.85 | | | (0.20 | ) | | — | | | (0.20 | ) | | $39.60 | | | 10.73 | % | | 0.80 | % | | 0.46 | % | | 17 | % | | $5,133 | |
| 2010 | | $30.94 | | 0.18 | | | 5.06 | | | 5.24 | | | (0.23 | ) | | — | | | (0.23 | ) | | $35.95 | | | 17.02 | % | | 0.81 | % | | 0.54 | % | | 35 | % | | $4,563 | |
| 2009 | | $26.56 | | 0.28 | | | 4.41 | | | 4.69 | | | (0.31 | ) | | — | | | (0.31 | ) | | $30.94 | | | 18.00 | % | | 0.80 | % | | 0.95 | % | | 31 | % | | $3,950 | |
| 2008 | | $45.98 | | 0.15 | | | (16.27 | ) | | (16.12 | ) | | — | | | (3.30 | ) | | (3.30 | ) | | $26.56 | | | (37.60 | )% | | 0.80 | % | | 0.39 | % | | 64 | % | | $94,419 | |
| A Class | |
| 2012 | | $38.54 | | 0.06 | | | 4.26 | | | 4.32 | | | (0.01 | ) | | — | | | (0.01 | ) | | $42.85 | | | 11.22 | % | | 1.25 | % | | 0.16 | % | | 17 | % | | $45,355 | |
| 2011 | | $34.99 | | — | (3) | | 3.58 | | | 3.58 | | | (0.03 | ) | | — | | | (0.03 | ) | | $38.54 | | | 10.23 | % | | 1.25 | % | | 0.01 | % | | 17 | % | | $24,573 | |
| 2010 | | $30.11 | | 0.03 | | | 4.93 | | | 4.96 | | | (0.08 | ) | | — | | | (0.08 | ) | | $34.99 | | | 16.48 | % | | 1.26 | % | | 0.09 | % | | 35 | % | | $20,666 | |
| 2009 | | $25.85 | | 0.13 | | | 4.33 | | | 4.46 | | | (0.20 | ) | | — | | | (0.20 | ) | | $30.11 | | | 17.47 | % | | 1.25 | % | | 0.50 | % | | 31 | % | | $19,824 | |
| 2008 | | $45.05 | | (0.02 | ) | | (15.88 | ) | | (15.90 | ) | | — | | | (3.30 | ) | | (3.30 | ) | | $25.85 | | | (37.88 | )% | | 1.25 | % | | (0.06 | )% | | 64 | % | | $19,450 | |
| For a Share Outstanding Throughout the Years Ended October 31 (except as noted) | |
| Per-Share Data | | | Ratios and Supplemental Data | |
| | | | | Income From Investment Operations: | | | Distributions From: | | | | | | | | | Ratio to Average Net Assets of: | | | | | | | |
| | | Net Asset Value, Beginning of Period | | Net Investment Income (Loss)(1) | | | Net Realized and Unrealized Gain (Loss) | | | Total From Investment Operations | | | Net Investment Income | | | Net Realized Gains | | | Total Distributions | | | Net Asset Value, End of Period | | | Total Return(2) | | | Operating Expenses | | | Net Investment Income (Loss) | | | Portfolio Turnover Rate | | | Net Assets, End of Period (in thousands) | |
| C Class | |
| 2012 | | $36.92 | | (0.25 | ) | | 4.08 | | | 3.83 | | | — | | | — | | | — | | | $40.75 | | | 10.37 | % | | 2.00 | % | | (0.59 | )% | | 17 | % | | $5,666 | |
| 2011 | | $33.74 | | (0.28 | ) | | 3.46 | | | 3.18 | | | — | | | — | | | — | | | $36.92 | | | 9.43 | % | | 2.00 | % | | (0.74 | )% | | 17 | % | | $571 | |
| 2010 | | $29.19 | | (0.20 | ) | | 4.75 | | | 4.55 | | | — | | | — | | | — | | | $33.74 | | | 15.63 | % | | 2.01 | % | | (0.66 | )% | | 35 | % | | $390 | |
| 2009 | | $25.05 | | (0.06 | ) | | 4.22 | | | 4.16 | | | (0.02 | ) | | — | | | (0.02 | ) | | $29.19 | | | 16.58 | % | | 2.00 | % | | (0.25 | )% | | 31 | % | | $314 | |
| 2008 | | $44.07 | | (0.29 | ) | | (15.43 | ) | | (15.72 | ) | | — | | | (3.30 | ) | | (3.30 | ) | | $25.05 | | | (38.34 | )% | | 2.00 | % | | (0.81 | )% | | 64 | % | | $394 | |
| R Class | |
| 2012 | | $38.64 | | (0.06 | ) | | 4.28 | | | 4.22 | | | — | | | — | | | — | | | $42.86 | | | 10.92 | % | | 1.50 | % | | (0.09 | )% | | 17 | % | | $1,456 | |
| 2011 | | $35.14 | | (0.08 | ) | | 3.58 | | | 3.50 | | | — | | | — | | | — | | | $38.64 | | | 9.96 | % | | 1.50 | % | | (0.24 | )% | | 17 | % | | $59 | |
| 2010 | | $30.24 | | (0.05 | ) | | 4.95 | | | 4.90 | | | — | | | — | | | — | | | $35.14 | | | 16.20 | % | | 1.51 | % | | (0.16 | )% | | 35 | % | | $29 | |
| 2009 | | $25.96 | | 0.06 | | | 4.36 | | | 4.42 | | | (0.14 | ) | | — | | | (0.14 | ) | | $30.24 | | | 17.17 | % | | 1.50 | % | | 0.25 | % | | 31 | % | | $43 | |
| 2008 | | $45.33 | | (0.11 | ) | | (15.96 | ) | | (16.07 | ) | | — | | | (3.30 | ) | | (3.30 | ) | | $25.96 | | | (38.03 | )% | | 1.50 | % | | (0.31 | )% | | 64 | % | | $32 | |
Notes to Financial Highlights
| (1) | Computed using average shares outstanding throughout the period. |
| (2) | Total returns are calculated based on the net asset value of the last business day and do not reflect applicable sales charges, if any. Total returns for periods less than one year are not annualized. |
| (3) | Per-share amount was less than $0.005. |
See Notes to Financial Statements.
Report of Independent Registered Public Accounting Firm |
The Board of Directors and Shareholders of
American Century Mutual Funds, Inc.:
We have audited the accompanying statement of assets and liabilities, including the schedule of investments, of Select Fund, one of the funds constituting American Century Mutual Funds, Inc. (the “Corporation”) as of October 31, 2012, and the related statement of operations for the year then ended, the statement of changes in net assets for each of the two years in the period then ended, and the financial highlights for each of the five years in the period then ended. These financial statements and financial highlights are the responsibility of the Corporation’s management. Our responsibility is to express an opinion on these financial statements and financial highlights based on our audits.
We conducted our audits in accordance with the standards of the Public Company Accounting Oversight Board (United States). Those standards require that we plan and perform the audit to obtain reasonable assurance about whether the financial statements and financial highlights are free of material misstatement. The Corporation is not required to have, nor were we engaged to perform, an audit of its internal control over financial reporting. Our audits included consideration of internal control over financial reporting as a basis for designing audit procedures that are appropriate in the circumstances, but not for the purpose of expressing an opinion on the effectiveness of the Corporation’s internal control over financial reporting. Accordingly, we express no such opinion. An audit also includes examining, on a test basis, evidence supporting the amounts and disclosures in the financial statements, assessing the accounting principles used and significant estimates made by management, as well as evaluating the overall financial statement presentation. Our procedures included confirmation of securities owned as of October 31, 2012, by correspondence with the custodian and brokers; where replies were not received from brokers, we performed other auditing procedures. We believe that our audits provide a reasonable basis for our opinion.
In our opinion, the financial statements and financial highlights referred to above present fairly, in all material respects, the financial position of Select Fund of American Century Mutual Funds, Inc., as of October 31, 2012, the results of its operations for the year then ended, the changes in its net assets for each of the two years in the period then ended, and the financial highlights for each of the five years in the period then ended, in conformity with accounting principles generally accepted in the United States of America.
Deloitte & Touche LLP
Kansas City, Missouri
December 19, 2012
The individuals listed below serve as directors of the funds. Each director will continue to serve in this capacity until death, retirement, resignation or removal from office. The mandatory retirement age for directors who are not “interested persons,” as that term is defined in the Investment Company Act (independent directors), is 72. However, the mandatory retirement age for an individual director may be extended with the approval of the remaining independent directors.
Mr. Thomas is an “interested person” because he currently serves as President and Chief Executive Officer of American Century Companies, Inc. (ACC), the parent company of American Century Investment Management, Inc. (ACIM or the advisor). Mr. Fink is an “interested person” because he currently serves as Executive Vice President of ACC.
The other directors (more than three-fourths of the total number) are independent; that is, they have never been employees, directors or officers of, and have no financial interest in, ACC or any of its wholly owned, direct or indirect, subsidiaries, including ACIM, American Century Investment Services, Inc. (ACIS) and American Century Services, LLC (ACS). The directors serve in this capacity for seven (in the case of Mr. Thomas, 15) registered investment companies in the American Century Investments family of funds.
The following table presents additional information about the directors. The mailing address for each director is 4500 Main Street, Kansas City, Missouri 64111.
Name (Year of Birth) | | Position(s) Held with Funds | | Length of Time Served | | Principal Occupation(s) During Past 5 Years | | Number of American Century Portfolios Overseen by Director | | Other Directorships Held During Past 5 Years |
| Independent Directors |
Thomas A. Brown (1940) | | Director | | Since 1980 | | Managing Member, Associated Investments, LLC (real estate investment company); Brown Cascade Properties, LLC (real estate investment company) (2001 to 2009) | | 66 | | None |
Andrea C. Hall (1945) | | Director | | Since 1997 | | Retired | | 66 | | None |
Jan M. Lewis (1957) | | Director | | Since 2011 | | President and Chief Executive Officer, Catholic Charities of Northeast Kansas (human services organization) | | 66 | | None |
James A. Olson (1942) | | Director | | Since 2007 | | Member, Plaza Belmont LLC (private equity fund manager) | | 66 | | Saia, Inc. (2002 to 2012) and Entertainment Properties Trust |
Donald H. Pratt (1937) | | Director and Chairman of the Board | | Since 1995 (Chairman since 2005) | | Chairman and Chief Executive Officer, Western Investments, Inc. (real estate company) | | 66 | | None |
Name (Year of Birth) | | Position(s) Held with Funds | | Length of Time Served | | Principal Occupation(s) During Past 5 Years | | Number of American Century Portfolios Overseen by Director | | Other Directorships Held During Past 5 Years |
| Independent Directors |
M. Jeannine Strandjord (1945) | | Director | | Since 1994 | | Retired | | 66 | | Euronet Worldwide Inc.; Charming Shoppes, Inc. (2006 to 2010); and DST Systems Inc. (1996 to 2012) |
John R. Whitten (1946) | | Director | | Since 2008 | | Retired | | 66 | | Rudolph Technologies, Inc. |
Stephen E. Yates (1948) | | Director | | Since 2012 | | Retired; Executive Vice President, Technology & Operations, KeyCorp. (computer services) (2004 to 2010) | | 66 | | Applied Industrial Technologies, Inc. (2001 to 2010) |
| |
| Interested Directors |
Barry Fink (1955) | | Director and Executive Vice President | | Since 2012 (Executive Vice President since 2007) | | Executive Vice President, ACC (September 2007 to present); President, ACS (October 2007 to present); Chief Operating Officer, ACC (September 2007 to November 2012). Also serves as Manager, ACS | | 66 | | None |
Jonathan S. Thomas (1963) | | Director and President | | Since 2007 | | President and Chief Executive Officer, ACC (March 2007 to present). Also serves as Chief Executive Officer and Manager, ACS; Executive Vice President, ACIM; Director, ACC, ACIM and other ACC subsidiaries | | 108 | | None |
Officers
The following table presents certain information about the executive officers of the funds. Each officer serves as an officer for each of the 15 investment companies in the American Century family of funds, unless otherwise noted. No officer is compensated for his or her service as an officer of the funds. The listed officers are interested persons of the funds and are appointed or re-appointed on an annual basis. The mailing address for each officer listed below is 4500 Main Street, Kansas City, Missouri 64111.
Name (Year of Birth) | | Offices with the Funds | | Principal Occupation(s) During the Past Five Years |
Jonathan S. Thomas (1963) | | Director and President since 2007 | | President and Chief Executive Officer, ACC (March 2007 to present). Also serves as Chief Executive Officer and Manager, ACS; Executive Vice President, ACIM; Director, ACC, ACIM and other ACC subsidiaries |
Barry Fink (1955) | | Director since 2012 and Executive Vice President since 2007 | | Executive Vice President, ACC (September 2007 to present); President, ACS (October 2007 to present); Chief Operating Officer, ACC (September 2007 to November 2012). Also serves as Manager, ACS |
Maryanne L. Roepke (1956) | | Chief Compliance Officer since 2006 and Senior Vice President since 2000 | | Chief Compliance Officer, American Century funds, ACIM and ACS (August 2006 to present). Also serves as Senior Vice President, ACS |
Charles A. Etherington (1957) | | General Counsel since 2007 and Senior Vice President since 2006 | | Attorney, ACC (February 1994 to present); Vice President, ACC (November 2005 to present), General Counsel, ACC (March 2007 to present). Also serves as General Counsel, ACIM, ACS, ACIS and other ACC subsidiaries; and Senior Vice President, ACIM and ACS |
C. Jean Wade (1964) | | Vice President, Treasurer and Chief Financial Officer since 2012 | | Vice President, ACS (February 2000 to present) |
Robert J. Leach (1966) | | Vice President since 2006 and Assistant Treasurer since 2012 | | Vice President, ACS (February 2000 to present) |
David H. Reinmiller (1963) | | Vice President since 2000 | | Attorney, ACC (January 1994 to present); Associate General Counsel, ACC (January 2001 to present). Also serves as Vice President, ACIM and ACS |
Ward D. Stauffer (1960) | | Secretary since 2005 | | Attorney, ACC (June 2003 to present) |
The Statement of Additional Information has additional information about the fund’s directors and is available without charge, upon request, by calling 1-800-345-2021.
Approval of Management Agreement |
At a meeting held on June 21, 2012, the Fund’s Board of Directors unanimously approved the renewal of the management agreement pursuant to which American Century Investment Management, Inc. (the “Advisor”) acts as the investment advisor for the Fund. Under Section 15(c) of the Investment Company Act, contracts for investment advisory services are required to be reviewed, evaluated, and approved by a majority of a fund’s independent directors (the “Directors”) each year.
As a part of the approval process, the Board requested and reviewed extensive data and information compiled by the Advisor and certain independent providers of evaluation data concerning the Fund and the services provided to the Fund by the Advisor. This review was in addition to the oversight and evaluation undertaken by the Board and its committees on a continuous basis throughout the year and included, but was not limited to the following:
| • | the nature, extent, and quality of investment management, shareholder services, and other services provided by the Advisor to the Fund; |
| • | the wide range of other programs and services the Advisor provides to the Fund and its shareholders on a routine and non-routine basis; |
| • | the investment performance of the fund, including data comparing the Fund’s performance to appropriate benchmarks and/or a peer group of other mutual funds with similar investment objectives and strategies; |
| • | data comparing the cost of owning the Fund to the cost of owning similar funds; |
| • | the Advisor’s compliance policies, procedures, and regulatory experience; |
| • | financial data showing the cost of services provided to the Fund, the profitability of the Fund to the Advisor, and the overall profitability of the Advisor; |
| • | data comparing services provided and charges to other investment management clients of the Advisor; and |
| • | consideration of collateral benefits derived by the Advisor from the management of the Fund and any potential economies of scale relating thereto. |
In keeping with its practice, the Board held two in-person meetings and one telephonic meeting to review and discuss the information provided. The Directors also had the benefit of the advice of independent counsel throughout the period.
Factors Considered
The Directors considered all of the information provided by the Advisor, the independent data providers, and independent counsel, and evaluated such information for the Fund. In connection with their review, the Directors did not identify any single factor as being all-important or controlling, and each Director may have attributed different levels of importance to different factors. In deciding to renew the management agreement, the Board based its decision on a number of factors, including the following:
Nature, Extent and Quality of Services — Generally. Under the management agreement, the Advisor is responsible for providing or arranging for all services necessary for the operation of the Fund. The Board noted that under the management agreement, the Advisor provides or arranges at its own expense a wide variety of services including:
| • | constructing and designing the Fund |
| • | portfolio research and security selection |
| • | initial capitalization/funding |
| • | daily valuation of the Fund’s portfolio |
| • | shareholder servicing and transfer agency, including shareholder confirmations, recordkeeping, and communications |
| • | regulatory and portfolio compliance |
| • | marketing and distribution |
The Board noted that many of these services have expanded over time both in terms of quantity and complexity in response to shareholder demands, competition in the industry, changing distribution channels, and the changing regulatory environment.
Investment Management Services. The nature of the investment management services provided to the Fund is quite complex and allows Fund shareholders access to professional money management, instant diversification of their investments within an asset class, the opportunity to easily diversify among asset classes by investing in or exchanging among various American Century Investments funds, and liquidity. In evaluating investment performance, the Board expects the Advisor to manage the Fund in accordance with its investment objectives and approved strategies. Further, the Directors recognize that the Advisor has an obligation to monitor trading activities, and in particular to seek the best execution of fund trades, and to evaluate the use of and payment for research. In providing these services, the Advisor utilizes teams of investment professionals (portfolio managers, analysts, research assistants, and securities traders) who require extensive information technology, research, training, compliance and other systems to conduct their business. The Board, directly and through its Fund Performance Review Committee, regularly reviews investment performance information for the Fund, together with comparative information for appropriate benchmarks and/or peer groups of similarly-managed funds, over different time horizons.
The Directors also review detailed performance information during the management agreement approval process. If performance concerns are identified, the Fund receives special reviews until performance improves, during which the Board discusses with the Advisor the reasons for such results (e.g., market conditions, security selection) and any efforts being undertaken to improve performance. Taking all these factors into consideration, the Board found the investment management services provided by the Advisor to the Fund to meet or exceed industry standards. More detailed information about the Fund’s performance can be found in the Performance and Portfolio Commentary sections of this report.
Shareholder and Other Services. Under the management agreement, the Advisor provides the Fund with a comprehensive package of transfer agency, shareholder, and other services. The Board, directly and through various committees of the Board, regularly reviews reports and evaluations of such services at its regular meetings. These reports include, but are not limited to, information regarding the operational efficiency and accuracy of the shareholder and transfer agency services provided, staffing levels, shareholder satisfaction (as measured by external as well as internal sources), technology support, new products and services offered to Fund shareholders, securities trading activities, portfolio valuation services, auditing services, and legal and operational compliance activities. Certain aspects of shareholder and transfer agency service level efficiency and the quality of securities trading activities are measured by independent third party providers and are presented in comparison to other fund groups not managed by the Advisor. The Board found the services provided by the Advisor to the Fund under the management agreement to be competitive and of high quality.
Costs of Services and Profitability. The Advisor provides detailed information concerning its cost of providing various services to the Fund, its profitability in managing the Fund, its overall profitability, and its financial condition. The Directors have reviewed with the Advisor the methodology used to prepare this financial information. The financial information regarding the Advisor is considered in evaluating the Advisor’s financial condition, ability to continue to provide services under the management agreement, and the reasonableness of the current management fee. The Board concluded that the Advisor’s profits were reasonable in light of the services provided to the Fund.
Ethics. The Board generally considers the Advisor’s commitment to providing quality services to shareholders and to conducting its business ethically. They noted that the Advisor’s practices generally meet or exceed industry best practices.
Economies of Scale. The Board also reviewed information provided by the Advisor regarding the possible existence of economies of scale in connection with the management of the Fund. The Board concluded that economies of scale are difficult to measure and predict with precision, especially on a fund-by-fund basis. The Board concluded that the Advisor is appropriately sharing economies of scale through its competitive fee structure, offering competitive fees from fund inception, and through reinvestment in its business to provide shareholders additional content and services.
Comparison to Other Funds’ Fees. The management agreement provides that the Fund pay the Advisor a single, all-inclusive (or unified) management fee for providing all services necessary for the management and operation of the Fund, other than brokerage expenses, taxes, interest, extraordinary expenses, and the fees and expenses of the Fund’s independent directors (including their independent legal counsel) and expenses incurred in connection with the provision of shareholder services and distribution services under a plan adopted pursuant to Rule 12b-1 under the 1940 Act. Under the unified fee structure, the Advisor is responsible for providing all investment advisory, custody, audit, administrative, compliance, recordkeeping, marketing and shareholder services, or arranging and supervising third parties to provide such services. By contrast, most other funds are charged a variety of fees, including an investment advisory fee, a transfer agency fee, an administrative fee, distribution charges and other expenses. Other than their investment advisory fees and any applicable Rule 12b-1 distribution fees, all other components of the total fees charged by these other funds may be increased without shareholder approval. The Board believes the unified fee structure is a benefit to Fund shareholders because it clearly discloses to shareholders the cost of owning Fund shares, and, since the unified fee cannot be increased without a vote of Fund shareholders, it shifts to the Advisor the risk of increased costs of operating the Fund and provides a direct incentive to minimize administrative inefficiencies. Part of the Board’s analysis of fee levels involves reviewing certain evaluative data compiled by an independent provider and comparing the Fund’s unified fee to the total expense ratio of other funds in the Fund’s peer group. The Board concluded that the management fee paid by the Fund to the Advisor under the management agreement is reasonable in light of the services provided to the Fund.
Comparison to Fees and Services Provided to Other Clients of the Advisor. The Board also requested and received information from the Advisor concerning the nature of the services, fees, costs and profitability of its advisory services to advisory clients other than the Fund. They observed that these varying types of client accounts require different services and involve different regulatory and entrepreneurial risks than the management of the Fund. The Board analyzed this information and concluded that the fees charged and services provided to the Fund were reasonable by comparison.
Collateral or “Fall-Out” Benefits Derived by the Advisor. The Board considered the existence of collateral benefits the Advisor may receive as a result of its relationship with the Fund. They concluded that the Advisor’s primary business is managing mutual funds and it generally does not use fund or shareholder information to generate profits in other lines of business, and therefore does not derive any significant collateral benefits from them. The Board noted that the Advisor receives proprietary research from broker-dealers that execute fund portfolio transactions and concluded that this research is likely to benefit Fund shareholders. The Board also determined that the Advisor is able to provide investment management services to certain clients other than the Fund, at least in part, due to its existing infrastructure built to serve the fund complex. The Board concluded, however, that the assets of those other clients are not material to the analysis and, where applicable, may be included with the assets of the Fund to determine breakpoints in the management fee schedule.
Existing Relationship. The Board also considered whether there was any reason for not continuing the existing arrangement with the Advisor. In this regard, the Board was mindful of the potential disruptions of the Fund’s operations and various risks, uncertainties, and other effects that could occur as a result of a decision not to continue such relationship. In particular, the Board recognized that most shareholders have invested in the Fund on the strength of the Advisor’s industry standing and reputation and in the expectation that the Advisor will have a continuing role in providing advisory services to the Fund.
Conclusion of the Directors. As a result of this process, the Board, including all of the independent directors, taking into account all of the factors discussed above and the information provided by the Advisor and others, concluded that the management agreement between the Fund and the Advisor is fair and reasonable in light of the services provided and should be renewed.
Retirement Account Information
As required by law, distributions you receive from certain IRAs, or 403(b), 457 and qualified plans are subject to federal income tax withholding, unless you elect not to have withholding apply. Tax will be withheld on the total amount withdrawn even though you may be receiving amounts that are not subject to withholding, such as nondeductible contributions. In such case, excess amounts of withholding could occur. You may adjust your withholding election so that a greater or lesser amount will be withheld.
If you don’t want us to withhold on this amount, you must notify us to not withhold the federal income tax. You may notify us in writing or in certain situations by telephone or through other electronic means. You have the right to revoke your withholding election at any time and any election you make may remain in effect until revoked by filing a new election.
Remember, even if you elect not to have income tax withheld, you are liable for paying income tax on the taxable portion of your withdrawal. If you elect not to have income tax withheld or you don’t have enough income tax withheld, you may be responsible for payment of estimated tax. You may incur penalties under the estimated tax rules if your withholding and estimated tax payments are not sufficient. You can reduce or defer the income tax on a distribution by directly or indirectly rolling such distribution over to another IRA or eligible plan. You should consult your tax advisor for additional information.
State tax will be withheld if, at the time of your distribution, your address is within one of the mandatory withholding states and you have federal income tax withheld. State taxes will be withheld from your distribution in accordance with the respective state rules.
Proxy Voting Guidelines
American Century Investment Management, Inc., the fund’s investment advisor, is responsible for exercising the voting rights associated with the securities purchased and/or held by the fund. A description of the policies and procedures the advisor uses in fulfilling this responsibility is available without charge, upon request, by calling 1-800-345-2021. It is also available on American Century Investments’ website at americancentury.com and on the Securities and Exchange Commission’s website at sec.gov. Information regarding how the investment advisor voted proxies relating to portfolio securities during the most recent 12-month period ended June 30 is available on the “About Us” page at americancentury.com. It is also available at sec.gov.
Quarterly Portfolio Disclosure
The fund files its complete schedule of portfolio holdings with the Securities and Exchange Commission (SEC) for the first and third quarters of each fiscal year on Form N-Q. The fund’s Forms N-Q are available on the SEC’s website at sec.gov, and may be reviewed and copied at the SEC’s Public Reference Room in Washington, DC. Information on the operation of the Public Reference Room may be obtained by calling 1-800-SEC-0330. The fund also makes its complete schedule of portfolio holdings for the most recent quarter of its fiscal year available on its website at americancentury.com and, upon request, by calling 1-800-345-2021.
Other Tax Information
The following information is provided pursuant to provisions of the Internal Revenue Code.
The fund hereby designates up to the maximum amount allowable as qualified dividend income for the fiscal year ended October 31, 2012.
For corporate taxpayers, the fund hereby designates $4,689,975, or up to the maximum amount allowable, of ordinary income distributions paid during the fiscal year ended October 31, 2012 as qualified for the corporate dividends received deduction.
| Contact Us | americancentury.com |
| Automated Information Line | 1-800-345-8765 |
| Investor Services Representative | 1-800-345-2021 or 816-531-5575 |
| Investors Using Advisors | 1-800-378-9878 |
| Business, Not-For-Profit, Employer-Sponsored Retirement Plans | 1-800-345-3533 |
| Banks and Trust Companies, Broker-Dealers, Financial Professionals, Insurance Companies | 1-800-345-6488 |
| Telecommunications Device for the Deaf | 1-800-634-4113 |
American Century Mutual Funds, Inc.
Investment Advisor:
American Century Investment Management, Inc.
Kansas City, Missouri
This report and the statements it contains are submitted for the general information of our shareholders. The report is not authorized for distribution to prospective investors unless preceded or accompanied by an effective prospectus.
©2012 American Century Proprietary Holdings, Inc. All rights reserved.
CL-ANN-76895 1212
ANNUAL REPORT OCTOBER 31, 2012
| President’s Letter | 2 |
| Independent Chairman’s Letter | 3 |
| Market Perspective | 4 |
| Performance | 5 |
| Portfolio Commentary | 6 |
| Fund Characteristics | 8 |
| Shareholder Fee Example | 9 |
| Schedule of Investments | 11 |
| Statement of Assets and Liabilities | 15 |
| Statement of Operations | 16 |
| Statement of Changes in Net Assets | 17 |
| Notes to Financial Statements | 18 |
| Financial Highlights | 24 |
| Report of Independent Registered Public Accounting Firm | 25 |
| Management | 26 |
| Approval of Management Agreement | 29 |
| Additional Information | 34 |
Any opinions expressed in this report reflect those of the author as of the date of the report, and do not necessarily represent the opinions of American Century Investments® or any other person in the American Century Investments organization. Any such opinions are subject to change at any time based upon market or other conditions and American Century Investments disclaims any responsibility to update such opinions. These opinions may not be relied upon as investment advice and, because investment decisions made by American Century Investments funds are based on numerous factors, may not be relied upon as an indication of trading intent on behalf of any American Century Investments fund. Security examples are used for representational purposes only and are not intended as recommendations to purchase or sell securities. Performance information for comparative indices and securities is provided to American Century Investments by third party vendors. To the best of American Century Investments’ knowledge, such information is accurate at the time of printing.
Dear Investor:
Thank you for reviewing this annual report for the 12 months ended October 31, 2012. Our report offers investment performance, market analysis, and portfolio information, presented with the expert perspective of our portfolio management team.
This report remains one of our most important vehicles for conveying information about fund returns, including key factors that affected fund performance. For additional, updated insights, we encourage you to visit our website, americancentury.com.
Favorable Fiscal-Year Returns for Most U.S. Stock and Bond Benchmarks
In a period fraught with concerns about factors such as the global economic recovery, European financial system stability, and the U.S. political picture, the 12-month returns for U.S. investors were generally favorable.
Both U.S. stocks and bonds rallied for much of the period, with U.S. equities generally outperforming their non-U.S. counterparts. The S&P 500 Index advanced 15.21%, compared with 4.61% for the MSCI EAFE (Europe, Australasia, Far East) Index. The Barclays U.S. Aggregate Bond Index returned 5.25%, and the 10-year U.S. Treasury note returned 7.47%, according to Barclays.
As it turned out, the overseas setbacks and the coordinated monetary policy response provided by prominent central banks around the world ultimately proved beneficial to the U.S. capital markets. Both U.S. stocks and bonds generally benefited from global investors’ trust in the U.S. financial system and from declining interest rates, helped by central bank purchases of government securities. The 10-year U.S. Treasury yield fell to a record low during the period, finishing at 1.69%.
The U.S. economy showed signs of improvement during the fiscal year, particularly the long-depressed housing market. However, the outlook for 2013 remains guarded, as the fragile recovery remains vulnerable to fiscal and financial factors that could trigger further slowdowns and market volatility.
Under these conditions, we continue to believe in a disciplined, diversified, long-term investment approach, using both stocks and bonds—as appropriate—for meeting financial goals. We appreciate your continued trust in us in this challenging environment.
Sincerely,
Jonathan Thomas
President and Chief Executive Officer
American Century Investments
Independent Chairman’s Letter |
Don Pratt
Dear Fellow Shareholders,
The board has once again completed its annual review of the advisory contract between the American Century Investments mutual funds overseen by the board and the funds’ advisor, American Century Investment Management, Inc. This process, often referred to as the 15(c) review, involves the independent directors considering all of the material monitored throughout the year and evaluating a wide range of factors to determine whether the management fee paid by each fund to the advisor is reasonable.
The independent directors’ rationale for this decision is provided in detail in this, or in a previous, report. However, there are several highlights that should be of interest to all shareholders.
| • | Fund performance and client service continue to be rated among the industry’s best. |
| • | Target date and other asset allocation products continue to successfully gather assets and industry acclaim. |
| • | Compliance programs continue to function successfully with no issues impacting shareholder interests. |
| • | Fees were found to be within an acceptable competitive range, with minor fee waivers being negotiated on five funds. |
Knowing that most shareholders are long term investors, the board was particularly pleased with our succession planning review. Talented professionals are being added within portfolio management and experienced managers have been added to the senior management team.
Overall it was a very positive review for the American Century Investments mutual funds during a challenging market environment.
Best personal regards,
Don Pratt
By David Hollond, Chief Investment Officer, U.S. Growth Equity — Mid & Small Cap
Stocks Gained Amid Volatility
The U.S. stock market generated positive results for the 12-month period ended October 31, 2012, although it endured significant volatility along the way. As the reporting period began, stocks were in the midst of a rebound. Investors grew optimistic as signs of improving economic activity quashed recession fears; in particular, job growth began to exceed expectations, driving the unemployment rate to its lowest level in three years by February 2012. Another positive factor was promising news out of Europe, as the European Central Bank provided favorable long-term financing to the debt markets and support for the Continent’s banking sector.
The optimism proved to be short-lived, as headwinds returned to the equity market. Evidence of slowing economic activity in the U.S. and adverse developments in Europe—including political turmoil in Greece and troubled banks in Spain—weighed on investor confidence, sending stocks down sharply.
Late in the period, stocks reversed course once again. The Federal Reserve announced a third round of quantitative easing measures, as well as an extension of its near-zero interest rate policy until 2015. The European Central Bank, meanwhile, announced a plan under which it would purchase bonds to support financially troubled debt markets in Europe. These measures, as well as others taken by central banks around the world, helped to restore investor confidence and drive markets upward, despite some concerns about slowing corporate profits and the looming U.S. fiscal cliff.
As the table below illustrates, large-cap issues generated the strongest returns for the reporting period, outpacing mid- and small-cap shares. Value stocks outpaced growth shares across the market capitalization spectrum.
From a sector perspective, all sectors within the Russell 3000 Index delivered positive results; the telecommunication services sector fared the best. Health care, financials, consumer discretionary, and consumer staples all finished ahead of the Russell 3000 Index. On the other side, the energy and information technology sectors achieved more moderate gains.
| U.S. Stock Index Returns |
| For the 12 months ended October 31, 2012 |
| Russell 1000 Index (Large-Cap) | 14.97% | | Russell 2000 Index (Small-Cap) | 12.08% |
| Russell 1000 Growth Index | 13.02% | | Russell 2000 Growth Index | 9.70% |
| Russell 1000 Value Index | 16.89% | | Russell 2000 Value Index | 14.47% |
| Russell Midcap Index | 12.15% | | | |
| Russell Midcap Growth Index | 9.09% | | | |
| Russell Midcap Value Index | 14.99% | | | |
| Total Returns as of October 31, 2012 |
| | | | Average Annual Returns | |
| | Ticker Symbol | 1 year | 5 years | Since Inception | Inception Date |
| Institutional Class | ACLWX | 7.59% | -4.22% | 1.22% | 5/12/06 |
| Russell Midcap Growth Index | — | 9.09% | 1.55% | 3.94%(1) | — |
| (1) | Since 4/30/06, the date nearest the Institutional Class’s inception for which data are available. |
| Growth of $10,000 Over Life of Class |
| $10,000 investment made May 12, 2006 |
| * | From 5/12/06, the Institutional Class’s inception date. Index data from 4/30/06, the date nearest the Institutional Class’s inception for which data are available. Not annualized. |
| Total Annual Fund Operating Expenses |
Institutional Class 0.83% |
The total annual fund operating expenses shown is as stated in the fund’s prospectus current as of the date of this report. The prospectus may vary from the expense ratio shown elsewhere in this report because it is based on a different time period, includes acquired fund fees and expenses, and, if applicable, does not include fee waivers or expense reimbursements.
Data presented reflect past performance. Past performance is no guarantee of future results. Current performance may be higher or lower than the performance shown. Investment return and principal value will fluctuate, and redemption value may be more or less than original cost. To obtain performance data current to the most recent month end, please call 1-800-345-2021 or visit americancentury.com. International investing involves special risks, such as political instability and currency fluctuations. Historically, small company stocks have been more volatile than the stocks of larger, more established companies.
Data assumes reinvestment of dividends and capital gains, and none of the charts reflect the deduction of taxes that a shareholder would pay on fund distributions or the redemption of fund shares. Returns for the index are provided for comparison. The fund’s total returns include operating expenses (such as transaction costs and management fees) that reduce returns, while the total returns of the index do not.
Portfolio Managers: Brad Eixmann and Bryan Unterhalter
Performance Summary
NT Vista returned 7.59% for the 12 months ended October 31, 2012. By comparison, the Russell Midcap Growth Index (the fund’s benchmark), returned 9.09%.
In terms of NT Vista’s absolute returns during the fiscal year, the health care and consumer discretionary sectors contributed most. Energy was the only major sector to post negative absolute results. Relative to the benchmark, stock selection made the materials and industrial sectors the leading detractors. Positioning among telecommunication services, energy, and information technology shares contributed most to relative performance.
Stocks Positive but Volatile
Equity markets in recent years have tended to trade in broad “risk on/risk off” moves as perceptions of macroeconomic and market conditions changed. These sorts of conditions typically result in higher correlations between individual securities—that is, stocks tend to go up and down together with comparatively little differentiation among them. This makes it comparatively more difficult for active portfolio managers to outperform. However, despite the uncertain economic and market conditions, we have seen no shortage of attractive companies demonstrating accelerating earnings growth.
Materials, Industrials Detracted Most
In the materials sector, it hurt relative results to be underrepresented in a number of shares that did well during the fiscal year. Good examples were paint companies Sherwin-Williams and PPG Industries—two stocks to which NT Vista had less exposure than the benchmark—which outperformed as the housing sector improved.
In the industrial sector, a number of NT Vista’s holdings were affected by investor uncertainty around corporate earnings growth and pricing power resulting from worries about the health of the global economy. The leading detractor here was mining equipment manufacturer Joy Global, which suffered from declining metals prices and slower economic growth. In the electrical equipment industry group, Polypore, which manufactures lithium-ion separators used in electric vehicles, was hurt over competitor concern.
Among other leading individual detractors was information security software company Check Point Software Technologies. Check Point underperformed after announcing slower-than-expected license revenue growth, which the company attributed to a pause in orders ahead of a new operating system launch. China-based Focus Media Holding underperformed as a result of a critical third party research report.
Contributions Broad Based
Looking at positive contributors to relative results, stock selection and allocation decisions drove outperformance in the telecommunication services sector. The leading contributor in this space was cellular tower operator SBA Communications. The company continues to benefit from a long-running trend toward the build-out of data networks for mobile phones.
Elsewhere, stock selection in the energy and information technology sectors drove outperformance. In the energy space, positioning in the oil, gas, and consumable fuels industry contributed most. Here, stock choices had a positive effect, and it helped to be underweight this comparatively poor-performing industry segment. Among information technology stocks, the IT services and semiconductor industries were sources of strength. A key contributor in the sector was business software provider NetSuite, which reported better-than-expected results and did very well late in the fiscal year.
The leading individual contributor in the portfolio for the fiscal year was pharmacy benefit manager SXC Health Solutions, which announced the acquisition of Catalyst Health Solutions in April 2012. The portfolio held positions in both SXC and Catalyst, and they each posted strong returns. The merger provides the combined entity, subsequently renamed Catamaran, with increased scale to target larger potential clients.
A number of other key contributors resided in the consumer discretionary sector, including PetSmart and Ulta Salon Cosmetics & Fragrance. Pet products retailer PetSmart reported improvement in same store sales, margins, and other key business metrics, while the stock further benefited from an aggressive share buyback plan. Ulta enjoyed attractive store growth and same store sales comparisons, as well as seeing its business mix evolve toward higher margin products. It also helped to own high-growth international retailer Michael Kors, which outperformed during the fiscal year following its initial public offering thanks to brand strength and exposure to luxury spending.
Commitment to Process
NT Vista’s investment process focuses on medium-and smaller-sized companies with accelerating growth rates and share price momentum. Within the process, in the current market environment, our team is placing increasing emphasis on the identification of companies benefiting from enduring secular—as opposed to cyclical—growth trends. Such secular trends are often the result of larger technological, social, or economic change that can last several years or more. Examples of secular changes underway at present are trends toward mobile and cloud computing, among others. Secular growers are particularly appealing investments because they offer more sustainable, enduring rates of earnings acceleration across the economic cycle. We believe that smart risk-taking and active investing in such companies will generate attractive absolute and relative investment performance over time.
| OCTOBER 31, 2012 | |
| Top Ten Holdings | % of net assets |
| Alliance Data Systems Corp. | 3.0% |
| Catamaran Corp. | 2.4% |
| Whole Foods Market, Inc. | 2.3% |
| SBA Communications Corp., Class A | 2.2% |
| Kansas City Southern | 2.1% |
| Teradata Corp. | 1.9% |
| PetSmart, Inc. | 1.8% |
| Tractor Supply Co. | 1.7% |
| Alexion Pharmaceuticals, Inc. | 1.7% |
| Cabot Oil & Gas Corp. | 1.7% |
| | |
| Top Five Industries | % of net assets |
| Specialty Retail | 10.7% |
| IT Services | 5.3% |
| Chemicals | 4.6% |
| Biotechnology | 3.6% |
| Food and Staples Retailing | 3.5% |
| | |
| Types of Investments in Portfolio | % of net assets |
| Domestic Common Stocks | 91.5% |
| Foreign Common Stocks* | 6.2% |
| Total Common Stocks | 97.7% |
| Temporary Cash Investments | 4.1% |
| Other Assets and Liabilities | (1.8)% |
| *Includes depositary shares, dual listed securities and foreign ordinary shares. | |
Fund shareholders may incur two types of costs: (1) transaction costs, including sales charges (loads) on purchase payments and redemption/exchange fees; and (2) ongoing costs, including management fees; distribution and service (12b-1) fees; and other fund expenses. This example is intended to help you understand your ongoing costs (in dollars) of investing in your fund and to compare these costs with the ongoing cost of investing in other mutual funds.
The example is based on an investment of $1,000 made at the beginning of the period and held for the entire period from May 1, 2012 to October 31, 2012.
Actual Expenses
The table provides information about actual account values and actual expenses for each class. You may use the information, together with the amount you invested, to estimate the expenses that you paid over the period. First, identify the share class you own. Then simply divide your account value by $1,000 (for example, an $8,600 account value divided by $1,000 = 8.6), then multiply the result by the number under the heading “Expenses Paid During Period” to estimate the expenses you paid on your account during this period.
If you hold Investor Class shares of any American Century Investments fund, or Institutional Class shares of the American Century Diversified Bond Fund, in an American Century Investments account (i.e., not a financial intermediary or retirement plan account), American Century Investments may charge you a $12.50 semiannual account maintenance fee if the value of those shares is less than $10,000. We will redeem shares automatically in one of your accounts to pay the $12.50 fee. In determining your total eligible investment amount, we will include your investments in all personal accounts (including American Century Investments Brokerage accounts) registered under your Social Security number. Personal accounts include individual accounts, joint accounts, UGMA/UTMA accounts, personal trusts, Coverdell Education Savings Accounts and IRAs (including traditional, Roth, Rollover, SEP-, SARSEP- and SIMPLE-IRAs), and certain other retirement accounts. If you have only business, business retirement, employer-sponsored or American Century Investments Brokerage accounts, you are currently not subject to this fee. If you are subject to the Account Maintenance Fee, your account value could be reduced by the fee amount.
Hypothetical Example for Comparison Purposes
The table also provides information about hypothetical account values and hypothetical expenses based on the actual expense ratio of each class of your fund and an assumed rate of return of 5% per year before expenses, which is not the actual return of a fund’s share class. The hypothetical account values and expenses may not be used to estimate the actual ending account balance or expenses you paid for the period. You may use this information to compare the ongoing costs of investing in your fund and other funds. To do so, compare this 5% hypothetical example with the 5% hypothetical examples that appear in the shareholder reports of the other funds.
Please note that the expenses shown in the table are meant to highlight your ongoing costs only and do not reflect any transactional costs, such as sales charges (loads) or redemption/exchange fees. Therefore, the table is useful in comparing ongoing costs only, and will not help you determine the relative total costs of owning different funds. In addition, if these transactional costs were included, your costs would have been higher.
| | Beginning Account Value 5/1/12 | Ending Account Value 10/31/12 | Expenses Paid During Period(1) 5/1/12 – 10/31/12 | Annualized Expense Ratio(1) |
| Actual | | | | |
| Institutional Class | $1,000 | $954.10 | $3.98 | 0.81% |
| Hypothetical | | | | |
| Institutional Class | $1,000 | $1,021.06 | $4.12 | 0.81% |
| (1) | Expenses are equal to the class’s annualized expense ratio listed in the table above, multiplied by the average account value over the period, multiplied by 184, the number of days in the most recent fiscal half-year, divided by 366, to reflect the one-half year period. |
| | | Shares | | | Value | |
| Common Stocks — 97.7% | |
| AEROSPACE AND DEFENSE — 1.9% | |
B/E Aerospace, Inc.(1) | | | 46,600 | | | | $2,101,194 | |
| TransDigm Group, Inc. | | | 25,600 | | | | 3,410,176 | |
| | | | | | | | 5,511,370 | |
| AUTO COMPONENTS — 1.4% | |
BorgWarner, Inc.(1) | | | 27,702 | | | | 1,823,346 | |
Delphi Automotive plc(1) | | | 79,200 | | | | 2,490,048 | |
| | | | | | | | 4,313,394 | |
| AUTOMOBILES — 0.6% | | | | | | | | |
| Harley-Davidson, Inc. | | | 36,800 | | | | 1,720,768 | |
| BEVERAGES — 1.3% | | | | | | | | |
| Beam, Inc. | | | 25,400 | | | | 1,411,224 | |
| Dr Pepper Snapple Group, Inc. | | | 36,100 | | | | 1,546,885 | |
Monster Beverage Corp.(1) | | | 23,000 | | | | 1,027,410 | |
| | | | | | | | 3,985,519 | |
| BIOTECHNOLOGY — 3.6% | | | | | | | | |
Alexion Pharmaceuticals, Inc.(1) | | | 55,965 | | | | 5,058,117 | |
Grifols SA(1) | | | 59,800 | | | | 2,074,160 | |
Onyx Pharmaceuticals, Inc.(1) | | | 14,600 | | | | 1,144,056 | |
Regeneron Pharmaceuticals, Inc.(1) | | | 16,300 | | | | 2,319,490 | |
| | | | | | | | 10,595,823 | |
| BUILDING PRODUCTS — 0.9% | |
Fortune Brands Home & Security, Inc.(1) | | | 89,200 | | | | 2,536,848 | |
| CAPITAL MARKETS — 2.1% | |
Affiliated Managers Group, Inc.(1) | | | 31,700 | | | | 4,010,050 | |
| KKR & Co. LP | | | 144,300 | | | | 2,171,715 | |
| | | | | | | | 6,181,765 | |
| CHEMICALS — 4.6% | | | | | | | | |
| Airgas, Inc. | | | 26,800 | | | | 2,384,396 | |
| Celanese Corp. | | | 23,900 | | | | 907,961 | |
| Cytec Industries, Inc. | | | 28,300 | | | | 1,947,606 | |
| Eastman Chemical Co. | | | 52,800 | | | | 3,127,872 | |
| FMC Corp. | | | 74,700 | | | | 3,997,944 | |
| Sherwin-Williams Co. (The) | | | 10,000 | | | | 1,425,800 | |
| | | | | | | | 13,791,579 | |
| COMMERCIAL SERVICES AND SUPPLIES — 1.2% | |
Stericycle, Inc.(1) | | | 38,600 | | | | 3,657,736 | |
| COMMUNICATIONS EQUIPMENT — 0.5% | |
Palo Alto Networks, Inc.(1) | | | 27,273 | | | | 1,499,470 | |
| CONSTRUCTION AND ENGINEERING — 1.9% | |
| Chicago Bridge & Iron Co. NV New York Shares | | | 42,200 | | | | 1,584,610 | |
| KBR, Inc. | | | 47,900 | | | | 1,334,494 | |
Quanta Services, Inc.(1) | | | 109,100 | | | | 2,828,963 | |
| | | | | | | | 5,748,067 | |
| CONSTRUCTION MATERIALS — 0.2% | |
| Eagle Materials, Inc. | | | 12,000 | | | | 635,640 | |
| CONSUMER FINANCE — 1.6% | |
| Discover Financial Services | | | 116,100 | | | | 4,760,100 | |
| DIVERSIFIED FINANCIAL SERVICES — 0.7% | |
| McGraw-Hill Cos., Inc. (The) | | | 37,400 | | | | 2,067,472 | |
| DIVERSIFIED TELECOMMUNICATION SERVICES — 0.7% | |
tw telecom, inc., Class A(1) | | | 76,800 | | | | 1,956,096 | |
| ELECTRICAL EQUIPMENT — 0.5% | |
| AMETEK, Inc. | | | 42,000 | | | | 1,493,100 | |
| ELECTRONIC EQUIPMENT, INSTRUMENTS AND COMPONENTS — 1.4% | |
Trimble Navigation Ltd.(1) | | | 88,600 | | | | 4,180,148 | |
| ENERGY EQUIPMENT AND SERVICES — 2.7% | |
Atwood Oceanics, Inc.(1) | | | 37,200 | | | | 1,778,160 | |
| National Oilwell Varco, Inc. | | | 24,200 | | | | 1,783,540 | |
| Oceaneering International, Inc. | | | 47,900 | | | | 2,506,607 | |
Oil States International, Inc.(1) | | | 25,000 | | | | 1,827,500 | |
| | | | | | | | 7,895,807 | |
| FOOD AND STAPLES RETAILING — 3.5% | |
| Costco Wholesale Corp. | | | 19,800 | | | | 1,948,914 | |
Fresh Market, Inc. (The)(1) | | | 25,900 | | | | 1,468,789 | |
| Whole Foods Market, Inc. | | | 73,200 | | | | 6,934,236 | |
| | | | | | | | 10,351,939 | |
| FOOD PRODUCTS — 2.7% | | | | | | | | |
Hain Celestial Group, Inc. (The)(1) | | | 28,800 | | | | 1,664,640 | |
| McCormick & Co., Inc. | | | 39,600 | | | | 2,440,152 | |
| Mead Johnson Nutrition Co. | | | 62,500 | | | | 3,853,750 | |
| | | | | | | | 7,958,542 | |
| GAS UTILITIES — 1.1% | | | | | | | | |
| ONEOK, Inc. | | | 67,700 | | | | 3,202,210 | |
| HEALTH CARE EQUIPMENT AND SUPPLIES — 3.2% | |
| Cooper Cos., Inc. (The) | | | 20,700 | | | | 1,986,786 | |
Edwards Lifesciences Corp.(1) | | | 15,200 | | | | 1,319,816 | |
IDEXX Laboratories, Inc.(1) | | | 25,600 | | | | 2,462,720 | |
Intuitive Surgical, Inc.(1) | | | 2,800 | | | | 1,518,216 | |
Mettler-Toledo International, Inc.(1) | | | 12,300 | | | | 2,083,251 | |
| | | | | | | | 9,370,789 | |
| | |
| | | | Shares | | | | Value | |
| HEALTH CARE PROVIDERS AND SERVICES — 3.4% | | | | | | | | |
Catamaran Corp.(1) | | | 149,000 | | | | $7,026,840 | |
Express Scripts Holding Co.(1) | | | 50,600 | | | | 3,113,924 | |
| | | | | | | | 10,140,764 | |
| HEALTH CARE TECHNOLOGY — 0.9% | |
Cerner Corp.(1) | | | 35,000 | | | | 2,666,650 | |
| HOTELS, RESTAURANTS AND LEISURE — 1.6% | |
| Dunkin’ Brands Group, Inc. | | | 45,100 | | | | 1,398,100 | |
Panera Bread Co., Class A(1) | | | 9,300 | | | | 1,568,352 | |
| Royal Caribbean Cruises Ltd. | | | 13,300 | | | | 447,811 | |
| Starwood Hotels & Resorts Worldwide, Inc. | | | 28,800 | | | | 1,493,280 | |
| | | | | | | | 4,907,543 | |
| HOUSEHOLD DURABLES — 1.7% | |
| Lennar Corp., Class A | | | 58,300 | | | | 2,184,501 | |
Toll Brothers, Inc.(1) | | | 86,200 | | | | 2,845,462 | |
| | | | | | | | 5,029,963 | |
| HOUSEHOLD PRODUCTS — 1.0% | |
| Church & Dwight Co., Inc. | | | 58,000 | | | | 2,944,080 | |
| INSURANCE — 0.1% | | | | | | | | |
| Cincinnati Financial Corp. | | | 11,100 | | | | 442,224 | |
| INTERNET AND CATALOG RETAIL — 1.3% | |
| Expedia, Inc. | | | 29,000 | | | | 1,715,350 | |
priceline.com, Inc.(1) | | | 3,900 | | | | 2,237,703 | |
| | | | | | | | 3,953,053 | |
| INTERNET SOFTWARE AND SERVICES — 2.0% | |
Equinix, Inc.(1) | | | 7,100 | | | | 1,280,911 | |
LinkedIn Corp., Class A(1) | | | 18,500 | | | | 1,978,205 | |
Rackspace Hosting, Inc.(1) | | | 42,000 | | | | 2,674,980 | |
| | | | | | | | 5,934,096 | |
| IT SERVICES — 5.3% | | | | | | | | |
Alliance Data Systems Corp.(1) | | | 62,200 | | | | 8,897,710 | |
Cognizant Technology Solutions Corp., Class A(1) | | | 21,500 | | | | 1,432,975 | |
Teradata Corp.(1) | | | 81,500 | | | | 5,567,265 | |
| | | | | | | | 15,897,950 | |
| MACHINERY — 2.5% | | | | | | | | |
Chart Industries, Inc.(1) | | | 26,900 | | | | 1,904,251 | |
| Joy Global, Inc. | | | 23,300 | | | | 1,455,085 | |
| Trinity Industries, Inc. | | | 53,300 | | | | 1,667,224 | |
| Valmont Industries, Inc. | | | 17,800 | | | | 2,404,780 | |
| | | | | | | | 7,431,340 | |
| MEDIA — 2.3% | | | | | | | | |
| CBS Corp., Class B | | | 59,300 | | | | 1,921,320 | |
Liberty Global, Inc. Class A(1) | | | 26,900 | | | | 1,614,807 | |
| Scripps Networks Interactive, Inc. Class A | | | 23,900 | | | | 1,451,208 | |
Sirius XM Radio, Inc.(1) | | | 680,900 | | | | 1,906,520 | |
| | | | | | | | 6,893,855 | |
| METALS AND MINING — 0.6% | |
| Carpenter Technology Corp. | | | 35,500 | | | | 1,725,655 | |
| MULTILINE RETAIL — 1.1% | |
Dollar Tree, Inc.(1) | | | 38,700 | | | | 1,542,969 | |
| Family Dollar Stores, Inc. | | | 27,300 | | | | 1,800,708 | |
| | | | | | | | 3,343,677 | |
| OIL, GAS AND CONSUMABLE FUELS — 3.2% | |
| Cabot Oil & Gas Corp. | | | 107,500 | | | | 5,050,350 | |
Concho Resources, Inc.(1) | | | 32,600 | | | | 2,807,512 | |
Kodiak Oil & Gas Corp.(1) | | | 178,200 | | | | 1,646,568 | |
| | | | | | | | 9,504,430 | |
| PHARMACEUTICALS — 2.7% | |
| Perrigo Co. | | | 42,300 | | | | 4,864,923 | |
Watson Pharmaceuticals, Inc.(1) | | | 38,100 | | | | 3,274,695 | |
| | | | | | | | 8,139,618 | |
| PROFESSIONAL SERVICES — 0.5% | |
IHS, Inc. Class A(1) | | | 16,070 | | | | 1,356,147 | |
| REAL ESTATE INVESTMENT TRUSTS (REITs) — 1.4% | |
| Digital Realty Trust, Inc. | | | 37,645 | | | | 2,312,532 | |
| Ventas, Inc. | | | 30,300 | | | | 1,917,081 | |
| | | | | | | | 4,229,613 | |
| REAL ESTATE MANAGEMENT AND DEVELOPMENT — 0.9% | |
CBRE Group, Inc.(1) | | | 131,800 | | | | 2,375,036 | |
Realogy Holdings Corp.(1) | | | 9,004 | | | | 320,002 | |
| | | | | | | | 2,695,038 | |
| ROAD AND RAIL — 3.1% | | | | | | | | |
| Canadian Pacific Railway Ltd. | | | 22,600 | | | | 2,080,556 | |
Genesee & Wyoming, Inc. Class A(1) | | | 10,735 | | | | 777,966 | |
| Kansas City Southern | | | 77,800 | | | | 6,259,788 | |
| | | | | | | | 9,118,310 | |
| SEMICONDUCTORS AND SEMICONDUCTOR EQUIPMENT — 2.7% | |
| ARM Holdings plc | | | 224,200 | | | | 2,405,987 | |
| Avago Technologies Ltd. | | | 58,900 | | | | 1,945,467 | |
NXP Semiconductor NV(1) | | | 37,200 | | | | 902,472 | |
| Xilinx, Inc. | | | 88,100 | | | | 2,886,156 | |
| | | | | | | | 8,140,082 | |
| SOFTWARE — 3.0% | | | | | | | | |
Citrix Systems, Inc.(1) | | | 62,900 | | | | 3,887,849 | |
CommVault Systems, Inc.(1) | | | 4,800 | | | | 299,856 | |
NetSuite, Inc.(1) | | | 54,200 | | | | $3,442,242 | |
Splunk, Inc.(1) | | | 49,809 | | | | 1,397,143 | |
| | | | | | | | 9,027,090 | |
| SPECIALTY RETAIL — 10.7% | |
Cabela’s, Inc.(1) | | | 49,600 | | | | 2,222,576 | |
| DSW, Inc., Class A | | | 45,300 | | | | 2,835,327 | |
| Gap, Inc. (The) | | | 48,300 | | | | 1,725,276 | |
| GNC Holdings, Inc. Class A | | | 87,479 | | | | 3,382,813 | |
Lumber Liquidators Holdings, Inc.(1) | | | 23,900 | | | | 1,334,098 | |
O’Reilly Automotive, Inc.(1) | | | 18,300 | | | | 1,567,944 | |
| PetSmart, Inc. | | | 80,110 | | | | 5,318,503 | |
| Ross Stores, Inc. | | | 54,800 | | | | 3,340,060 | |
Sally Beauty Holdings, Inc.(1) | | | 61,700 | | | | 1,485,736 | |
| Tractor Supply Co. | | | 53,200 | | | | 5,119,968 | |
| Ulta Salon Cosmetics & Fragrance, Inc. | | | 38,900 | | | | 3,587,358 | |
| | | | | | | | 31,919,659 | |
| TEXTILES, APPAREL AND LUXURY GOODS — 3.3% | |
Lululemon Athletica, Inc.(1) | | | 24,300 | | | | 1,676,943 | |
Michael Kors Holdings Ltd.(1) | | | 60,760 | | | | 3,322,964 | |
| PVH Corp. | | | 16,500 | | | | 1,814,835 | |
Under Armour, Inc. Class A(1) | | | 25,600 | | | | 1,337,856 | |
| VF Corp. | | | 10,200 | | | | 1,596,096 | |
| | | | | | | | 9,748,694 | |
| TRADING COMPANIES AND DISTRIBUTORS — 1.9% | |
| Fastenal Co. | | | 45,500 | | | | 2,033,850 | |
United Rentals, Inc.(1) | | | 86,000 | | | | 3,496,760 | |
| | | | | | | | 5,530,610 | |
| WIRELESS TELECOMMUNICATION SERVICES — 2.2% | |
SBA Communications Corp., Class A(1) | | | 97,502 | | | | 6,496,558 | |
TOTAL COMMON STOCKS (Cost $237,015,644) | | | | 290,630,881 | |
| Temporary Cash Investments — 4.1% | |
Repurchase Agreement, Bank of America Merrill Lynch, (collateralized by various U.S. Treasury obligations, 1.50% - 2.00%, 1/31/16 - 6/30/16, valued at $5,099,257), in a joint trading account at 0.23%, dated 10/31/12, due 11/1/12 (Delivery value $4,996,503) | | | | 4,996,471 | |
Repurchase Agreement, Credit Suisse First Boston, Inc., (collateralized by various U.S. Treasury obligations, 3.125% - 3.75%, 8/15/41 - 2/15/42, valued at $5,111,112), in a joint trading account at 0.20%, dated 10/31/12, due 11/1/12 (Delivery value $4,996,500) | | | | 4,996,472 | |
Repurchase Agreement, Goldman Sachs & Co., (collateralized by various U.S. Treasury obligations, 4.625%, 2/15/40, valued at $2,122,464), in a joint trading account at 0.16%, dated 10/31/12, due 11/1/12 (Delivery value $2,081,211) | | | | 2,081,202 | |
TOTAL TEMPORARY CASH INVESTMENTS (Cost $12,074,145) | | | | 12,074,145 | |
TOTAL INVESTMENT SECURITIES — 101.8% (Cost $249,089,789) | | | | 302,705,026 | |
| OTHER ASSETS AND LIABILITIES — (1.8)% | | | | (5,275,651 | ) |
| TOTAL NET ASSETS — 100.0% | | | | $297,429,375 | |
| Forward Foreign Currency Exchange Contracts |
| Contracts to Buy | Counterparty | Settlement Date | Value | Unrealized Gain (Loss) |
| 36,208 | GBP for USD | Credit Suisse AG | 11/30/12 | $58,425 | $425 |
| (Value on Settlement Date $58,000) |
| | | | | |
| Contracts to Sell | Counterparty | Settlement Date | Value | Unrealized Gain (Loss) |
| 1,311,922 | EUR for USD | UBS AG | 11/30/12 | $1,700,862 | $(2,893) |
| 1,287,300 | GBP for USD | Credit Suisse AG | 11/30/12 | 2,077,182 | (5,208) |
| | | | | $3,778,044 | $(8,101) |
| (Value on Settlement Date $3,769,943) |
Notes to Schedule of Investments
EUR = Euro
GBP = British Pound
USD = United States Dollar
See Notes to Financial Statements.
Statement of Assets and Liabilities |
| OCTOBER 31, 2012 | |
| Assets | |
| Investment securities, at value (cost of $249,089,789) | | | $302,705,026 | |
| Receivable for investments sold | | | 2,046,699 | |
| Receivable for capital shares sold | | | 1,522 | |
| Unrealized gain on forward foreign currency exchange contracts | | | 425 | |
| Dividends and interest receivable | | | 353,319 | |
| | | | 305,106,991 | |
| | | | | |
| Liabilities | | | | |
| Payable for investments purchased | | | 7,466,919 | |
| Unrealized loss on forward foreign currency exchange contracts | | | 8,101 | |
| Accrued management fees | | | 198,857 | |
| Other liabilities | | | 3,739 | |
| | | | 7,677,616 | |
| | | | | |
| Net Assets | | | $297,429,375 | |
| | | | | |
| Institutional Class Capital Shares, $0.01 Par Value | | | | |
| Shares authorized | | | 150,000,000 | |
| Shares outstanding | | | 28,034,162 | |
| | | | | |
| Net Asset Value Per Share | | | $10.61 | |
| | | | | |
| Net Assets Consist of: | | | | |
| Capital (par value and paid-in surplus) | | | $248,027,878 | |
| Accumulated net investment loss | | | (36,846 | ) |
| Accumulated net realized loss | | | (4,169,517 | ) |
| Net unrealized appreciation | | | 53,607,860 | |
| | | | $297,429,375 | |
See Notes to Financial Statements.
| YEAR ENDED OCTOBER 31, 2012 | |
| Investment Income (Loss) | |
| Income: | | | |
| Dividends (net of foreign taxes withheld of $2,937) | | | $2,009,688 | |
| Interest | | | 5,758 | |
| | | | 2,015,446 | |
| Expenses: | | | | |
| Management fees | | | 2,065,395 | |
| Directors’ fees and expenses | | | 9,475 | |
| Other expenses | | | 3,801 | |
| | | | 2,078,671 | |
| | | | | |
| Net investment income (loss) | | | (63,225 | ) |
| | | | | |
| Realized and Unrealized Gain (Loss) | | | | |
| Net realized gain (loss) on: | | | | |
| Investment transactions | | | (1,565,648 | ) |
| Futures contract transactions | | | (212,977 | ) |
| Foreign currency transactions | | | 703 | |
| | | | (1,777,922 | ) |
| | | | | |
| Change in net unrealized appreciation (depreciation) on: | | | | |
| Investments | | | 19,888,864 | |
| Translation of assets and liabilities in foreign currencies | | | 18,523 | |
| | | | 19,907,387 | |
| | | | | |
| Net realized and unrealized gain (loss) | | | 18,129,465 | |
| | | | | |
| Net Increase (Decrease) in Net Assets Resulting from Operations | | | $18,066,240 | |
See Notes to Financial Statements.
Statement of Changes in Net Assets |
| YEARS ENDED OCTOBER 31, 2012 AND OCTOBER 31, 2011 | | | | | | |
| Increase (Decrease) in Net Assets | | October 31, 2012 | | | October 31, 2011 | |
| Operations | | | | | | |
| Net investment income (loss) | | | $(63,225 | ) | | | $(508,657 | ) |
| Net realized gain (loss) | | | (1,777,922 | ) | | | 9,902,344 | |
| Change in net unrealized appreciation (depreciation) | | | 19,907,387 | | | | 634,957 | |
| Net increase (decrease) in net assets resulting from operations | | | 18,066,240 | | | | 10,028,644 | |
| | | | | | | | | |
| Distributions to Shareholders | | | | | | | | |
| From net realized gains | | | (3,557,528 | ) | | | — | |
| | | | | | | | | |
| Capital Share Transactions | | | | | | | | |
| Proceeds from shares sold | | | 98,603,911 | | | | 65,778,540 | |
| Proceeds from reinvestment of distributions | | | 3,557,528 | | | | — | |
| Payments for shares redeemed | | | (34,300,835 | ) | | | (22,050,710 | ) |
| Net increase (decrease) in net assets from capital share transactions | | | 67,860,604 | | | | 43,727,830 | |
| | | | | | | | | |
| Net increase (decrease) in net assets | | | 82,369,316 | | | | 53,756,474 | |
| | | | | | | | | |
| Net Assets | | | | | | | | |
| Beginning of period | | | 215,060,059 | | | | 161,303,585 | |
| End of period | | | $297,429,375 | | | | $215,060,059 | |
| | | | | | | | | |
| Accumulated undistributed net investment income (loss) | | | $(36,846 | ) | | | $31,336 | |
| | | | | | | | | |
| Transactions in Shares of the Fund | | | | | | | | |
| Sold | | | 9,510,793 | | | | 6,541,903 | |
| Issued in reinvestment of distributions | | | 375,663 | | | | — | |
| Redeemed | | | (3,298,873 | ) | | | (2,177,130 | ) |
| Net increase (decrease) in shares of the fund | | | 6,587,583 | | | | 4,364,773 | |
See Notes to Financial Statements.
Notes to Financial Statements |
OCTOBER 31, 2012
1. Organization
American Century Mutual Funds, Inc. (the corporation) is registered under the Investment Company Act of 1940, as amended (the 1940 Act), as an open-end management investment company and is organized as a Maryland corporation. NT Vista Fund (the fund) is one fund in a series issued by the corporation. The fund is diversified as defined under the 1940 Act. The fund’s investment objective is to seek long-term capital growth. The fund pursues its objective by investing primarily in stocks of medium-sized and smaller companies that management believes will increase in value over time. The fund is not permitted to invest in any securities issued by companies assigned the Global Industry Classification Standard for the tobacco industry.
2. Significant Accounting Policies
The following is a summary of significant accounting policies consistently followed by the fund in preparation of its financial statements. The financial statements are prepared in conformity with accounting principles generally accepted in the United States of America, which may require management to make certain estimates and assumptions at the date of the financial statements. Actual results could differ from these estimates.
Investment Valuations — The fund determines the fair value of its investments and computes its net asset value per share as of the close of regular trading (usually 4 p.m. Eastern time) on the New York Stock Exchange (NYSE) on each day the NYSE is open.
Equity securities that are listed or traded on a domestic securities exchange are valued at the last reported sales price or at the official closing price as provided by the exchange. Equity securities traded on foreign securities exchanges are typically valued at the closing price on the exchange where primarily traded or as of the close of the NYSE, if that is earlier. If no last sales price is reported, or if local convention or regulation so provides, the mean of the latest bid and asked prices is used. Depending on local convention or regulation, securities traded over-the-counter are valued at the mean of the latest bid and asked prices, the last sales price, or the official closing price. In its determination of fair value, the fund may review several factors including: market information specific to a security; news developments in U.S. and foreign markets; the performance of particular U.S. and foreign securities, indices, comparable securities, American Depositary Receipts, Exchange-Traded Funds, and other relevant market indicators.
Debt securities maturing within 60 days at the time of purchase may be valued at cost, plus or minus any amortized discount or premium or at the evaluated mean as provided by an independent pricing service. Evaluated mean prices are commonly derived through utilization of market models, which may consider, among other factors, trade data, quotations from dealers and active market makers, relevant yield curve and spread data, related sector levels, creditworthiness, and other relevant market information on the same or comparable securities.
Investments in open-end management investment companies are valued at the reported net asset value per share. Repurchase agreements are valued at cost. Exchange-traded futures contracts are valued at the settlement price as provided by the appropriate clearing corporation. Forward foreign currency exchange contracts are valued at the mean of the latest bid and asked prices of the forward currency rates as provided by an independent pricing service.
The value of investments initially expressed in foreign currencies is translated into U.S. dollars at prevailing exchange rates.
If the fund determines that the market price for a portfolio security is not readily available or the valuation methods mentioned above do not reflect a security’s fair value, such security is valued as determined in good faith by the Board of Directors or its designee, in accordance with procedures adopted by the Board of Directors. Circumstances that may cause the fund to use these procedures to value a security
include, but are not limited to: a security has been declared in default; trading in a security has been halted during the trading day; there is a foreign market holiday and no trading occurred; or an event occurred between the close of a foreign exchange and the NYSE that may affect the value of a security.
Security Transactions — Security transactions are accounted for as of the trade date. Net realized gains and losses are determined on the identified cost basis, which is also used for federal income tax purposes.
Investment Income — Dividend income less foreign taxes withheld, if any, is recorded as of the ex-dividend date. Distributions received on securities that represent a return of capital or capital gain are recorded as a reduction of cost of investments and/or as a realized gain. The fund estimates the components of distributions received that may be considered nontaxable distributions or capital gain distributions for income tax purposes. Interest income is recorded on the accrual basis and includes accretion of discounts and amortization of premiums.
Foreign Currency Translations — All assets and liabilities initially expressed in foreign currencies are translated into U.S. dollars at prevailing exchange rates at period end. The fund may enter into spot foreign currency exchange contracts to facilitate transactions denominated in a foreign currency. Purchases and sales of investment securities, dividend and interest income, spot foreign currency exchange contracts, and expenses are translated at the rates of exchange prevailing on the respective dates of such transactions. Net realized and unrealized foreign currency exchange gains or losses related to investment securities are a component of net realized gain (loss) on investment transactions and change in net unrealized appreciation (depreciation) on investments, respectively.
Business Development Companies — The fund may invest in securities of closed-end investment companies that have elected to be treated as a business development company under the 1940 Act. A business development company operates similar to an exchange-traded fund and represents a portfolio of securities. The fund may purchase a business development company to gain exposure to the securities in the underlying portfolio. The risks of owning a business development company generally reflect the risks of owning the underlying securities. Business development companies have expenses that reduce their value.
Repurchase Agreements — The fund may enter into repurchase agreements with institutions that American Century Investment Management, Inc. (ACIM) (the investment advisor) has determined are creditworthy pursuant to criteria adopted by the Board of Directors. The fund requires that the collateral, represented by securities, received in a repurchase transaction be transferred to the custodian in a manner sufficient to enable the fund to obtain those securities in the event of a default under the repurchase agreement. ACIM monitors, on a daily basis, the securities transferred to ensure the value, including accrued interest, of the securities under each repurchase agreement is equal to or greater than amounts owed to the fund under each repurchase agreement.
Joint Trading Account — Pursuant to an Exemptive Order issued by the Securities and Exchange Commission, the fund, along with certain other funds in the American Century Investments family of funds, may transfer uninvested cash balances into a joint trading account. These balances are invested in one or more repurchase agreements that are collateralized by U.S. Treasury or Agency obligations.
Segregated Assets — In accordance with the 1940 Act, the fund segregates assets on its books and records to cover futures contracts. ACIM monitors, on a daily basis, the securities segregated to ensure the fund designates a sufficient amount of liquid assets, marked-to-market daily. The fund may also receive assets or be required to pledge assets at the custodian bank or with a broker for margin requirements on futures contracts.
Income Tax Status — It is the fund’s policy to distribute substantially all net investment income and net realized gains to shareholders and to otherwise qualify as a regulated investment company under provisions of the Internal Revenue Code. The fund is no longer subject to examination by tax authorities for years prior to 2009. Additionally, non-U.S. tax returns filed by the fund due to investments in certain foreign securities remain subject to examination by the relevant taxing authority for seven years from the
date of filing. At this time, management believes there are no uncertain tax positions which, based on their technical merit, would not be sustained upon examination and for which it is reasonably possible that the total amounts of unrecognized tax benefits will significantly change in the next twelve months. Accordingly, no provision has been made for federal or state income taxes.
Distributions to Shareholders — Distributions from net investment income and net realized gains, if any, are generally declared and paid annually.
Indemnifications — Under the corporation’s organizational documents, its officers and directors are indemnified against certain liabilities arising out of the performance of their duties to the fund. In addition, in the normal course of business, the fund enters into contracts that provide general indemnifications. The maximum exposure under these arrangements is unknown as this would involve future claims that may be made against a fund. The risk of material loss from such claims is considered by management to be remote.
3. Fees and Transactions with Related Parties
Management Fees — The corporation has entered into a management agreement with ACIM, under which ACIM provides the fund with investment advisory and management services in exchange for a single, unified management fee (the fee). The agreement provides that all expenses of managing and operating the fund, except distribution and service fees, brokerage expenses, taxes, interest, fees and expenses of the independent directors (including legal counsel fees), and extraordinary expenses, will be paid by ACIM. The fee is computed and accrued daily based on the daily net assets of the fund and paid monthly in arrears. The annual management fee is 0.80%.
Acquired Fund Fees and Expenses — The fund may invest in mutual funds, exchange-traded funds, and business development companies (the acquired funds). The fund will indirectly realize its pro rata share of the fees and expenses of the acquired funds in which it invests. These indirect fees and expenses are not paid out of the fund’s assets but are reflected in the return realized by the fund on its investment in the acquired funds.
Related Parties — Certain officers and directors of the corporation are also officers and/or directors of American Century Companies, Inc., the parent of the corporation’s investment advisor, ACIM, the distributor of the corporation, American Century Investment Services, Inc., and the corporation’s transfer agent, American Century Services, LLC. Various funds issued by American Century Asset Allocation Portfolios, Inc. own, in aggregate, 100% of the shares of the fund. These funds do not invest in the fund for the purpose of exercising management or control.
4. Investment Transactions
Purchases and sales of investment securities, excluding short-term investments, for the year ended October 31, 2012 were $292,150,305 and $232,578,153, respectively.
5. Fair Value Measurements
The fund’s securities valuation process is based on several considerations and may use multiple inputs to determine the fair value of the positions held by the fund. In conformity with accounting principles generally accepted in the United States of America, the inputs used to determine a valuation are classified into three broad levels as follows:
| • | Level 1 valuation inputs consist of unadjusted quoted prices in an active market for identical securities; |
| • | Level 2 valuation inputs consist of direct or indirect observable market data (including quoted prices for similar securities, evaluations of subsequent market events, interest rates, prepayment speeds, credit risk, etc.); or |
| • | Level 3 valuation inputs consist of unobservable data (including a fund’s own assumptions). |
The level classification is based on the lowest level input that is significant to the fair valuation measurement. The valuation inputs are not necessarily an indication of the risks associated with investing in these securities or other financial instruments.
The following is a summary of the level classifications as of period end. The Schedule of Investments provides additional information on the fund’s portfolio holdings.
| | | Level 1 | | | Level 2 | | | Level 3 | |
| Investment Securities | | | | | | | | | |
| Domestic Common Stocks | | | $272,147,674 | | | | — | | | | — | |
| Foreign Common Stocks | | | 14,003,060 | | | | $4,480,147 | | | | — | |
| Temporary Cash Investments | | | — | | | | 12,074,145 | | | | — | |
| Total Value of Investment Securities | | | $286,150,734 | | | | $16,554,292 | | | | — | |
| | | | | | | | | | | | | |
| Other Financial Instruments | | | | | | | | | | | | |
Total Unrealized Gain (Loss) on Forward Foreign Currency Exchange Contracts | | | — | | | | $(7,676 | ) | | | — | |
6. Derivative Instruments
Equity Price Risk — The fund is subject to equity price risk in the normal course of pursuing its investment objectives. A fund may enter into futures contracts based on an equity index in order to manage its exposure to changes in market conditions. A fund may purchase futures contracts to gain exposure to increases in market value or sell futures contracts to protect against a decline in market value. Upon entering into a futures contract, a fund is required to deposit either cash or securities in an amount equal to a certain percentage of the contract value (initial margin). Subsequent payments (variation margin) are made or received daily, in cash, by a fund. The variation margin is equal to the daily change in the contract value and is recorded as unrealized gains and losses. A fund recognizes a realized gain or loss when the contract is closed or expires. Net realized and unrealized gains or losses occurring during the holding period of futures contracts are a component of net realized gain (loss) on futures contract transactions and change in net unrealized appreciation (depreciation) on futures contracts, respectively. One of the risks of entering into futures contracts is the possibility that the change in value of the contract may not correlate with the changes in value of the underlying securities. During the period, the fund infrequently purchased equity price risk derivative instruments for temporary investment purposes.
Foreign Currency Risk — The fund is subject to foreign currency exchange rate risk in the normal course of pursuing its investment objectives. The value of foreign investments held by a fund may be significantly affected by changes in foreign currency exchange rates. The dollar value of a foreign security generally decreases when the value of the dollar rises against the foreign currency in which the security is denominated and tends to increase when the value of the dollar declines against such foreign currency. A fund may enter into forward foreign currency exchange contracts to reduce a fund’s exposure to foreign currency exchange rate fluctuations. The net U.S. dollar value of foreign currency underlying all contractual commitments held by a fund and the resulting unrealized appreciation or depreciation are determined daily. Realized gain or loss is recorded upon the termination of the contract. Net realized and unrealized gains or losses occurring during the holding period of forward foreign currency exchange contracts are a component of net realized gain (loss) on foreign currency transactions and change in net unrealized appreciation (depreciation) on translation of assets and liabilities in foreign currencies, respectively. A fund bears the risk of an unfavorable change in the foreign currency exchange rate underlying the forward contract. Additionally, losses, up to the fair value, may arise if the counterparties do not perform under the contract terms. The foreign currency risk derivative instruments held at period end as disclosed on the Schedule of Investments are indicative of the fund’s typical volume during the period.
Value of Derivative Instruments as of October 31, 2012
| | Asset Derivatives | | Liability Derivatives |
| Type of Risk Exposure | Location on Statement of Assets and Liabilities | Value | | Location on Statement of Assets and Liabilities | Value |
| Foreign Currency Risk | Unrealized gain on forward foreign currency exchange contracts | $425 | | Unrealized loss on forward foreign currency exchange contracts | $8,101 |
Effect of Derivative Instruments on the Statement of Operations for the Year Ended October 31, 2012
| | Net Realized Gain (Loss) | | Change in Net Unrealized Appreciation (Depreciation) |
| Type of Risk Exposure | Location on Statement of Operations | Value | | Location on Statement of Operations | Value |
| Equity Price Risk | Net realized gain (loss) on futures contract transactions | $(212,977) | | Change in net unrealized appreciation (depreciation) on futures contracts | — |
| Foreign Currency Risk | Net realized gain (loss) on foreign currency transactions | (4,038) | | Change in net unrealized appreciation (depreciation) on translation of assets and liabilities in foreign currencies | $21,721 |
| | | $(217,015) | | | $21,721 |
7. Risk Factors
There are certain risks involved in investing in foreign securities. These risks include those resulting from future adverse political, social and economic developments, fluctuations in currency exchange rates, the possible imposition of exchange controls, and other foreign laws or restrictions.
The fund invests in common stocks of small companies. Because of this, it may be subject to greater risk and market fluctuations than a fund investing in larger, more established companies.
8. Federal Tax Information
The tax character of distributions paid during the years ended October 31, 2012 and October 31, 2011 were as follows:
| | | 2012 | | | 2011 | |
| Distributions Paid From | | | | | | |
| Ordinary income | | | — | | | | — | |
| Long-term capital gains | | | $3,557,528 | | | | — | |
The book-basis character of distributions made during the year from net investment income or net realized gains may differ from their ultimate characterization for federal income tax purposes. These differences reflect the differing character of certain income items and net realized gains and losses for financial statement and tax purposes, and may result in reclassification among certain capital accounts on the financial statements.
As of October 31, 2012, the federal tax cost of investments and the components of distributable earnings on a tax-basis were as follows:
| Federal tax cost of investments | | | $251,799,034 | |
| Gross tax appreciation of investments | | | $55,620,038 | |
| Gross tax depreciation of investments | | | (4,714,046 | ) |
| Net tax appreciation (depreciation) of investments | | | $50,905,992 | |
| Net tax appreciation (depreciation) on derivatives and translation of assets and liabilities in foreign currencies | | | $298 | |
| Net tax appreciation (depreciation) | | | $50,906,290 | |
| Undistributed ordinary income | | | — | |
| Accumulated short-term capital losses | | | $(1,460,271 | ) |
| Late-year ordinary loss deferral | | | $(44,522 | ) |
The difference between book-basis and tax-basis cost and unrealized appreciation (depreciation) is attributable primarily to the tax deferral of losses on wash sales and the realization for tax purposes of unrealized gains (losses) on certain foreign currency exchange contracts.
Accumulated capital losses represent net capital loss carryovers that may be used to offset future realized capital gains for federal income tax purposes. The capital loss carryovers may be carried forward for an unlimited period. Future capital loss carryover utilization in any given year may be subject to Internal Revenue Code limitations.
Loss deferrals represent certain qualified losses that the fund has elected to treat as having been incurred in the following fiscal year for federal income tax purposes.
| For a Share Outstanding Throughout the Years Ended October 31 (except as noted) | |
| Per-Share Data | | | | | | Ratios and Supplemental Data | |
| | | | | | Income From Investment Operations: | | | Distributions From: | | | | | | | | | Ratio to Average Net Assets of: | | | | | | | |
| | | Net Asset Value, Beginning of Period | | | Net Investment Income (Loss)(1) | | | Net Realized and Unrealized Gain (Loss) | | | Total From Investment Operations | | | Net Investment Income | | | Net Realized Gains | | | Total Distributions | | | Net Asset Value, End of Period | | | Total Return(2) | | | Operating Expenses(3) | | | Net Investment Income (Loss) | | | Portfolio Turnover Rate | | | Net Assets, End of Period (in thousands) | |
| Institutional Class | |
| 2012 | | | $10.03 | | | | — | (4) | | | 0.74 | | | | 0.74 | | | | — | | | | (0.16 | ) | | | (0.16 | ) | | | $10.61 | | | | 7.59 | % | | | 0.81 | % | | | (0.02 | )% | | | 92 | % | | | $297,429 | |
| 2011 | | | $9.44 | | | | (0.03 | ) | | | 0.62 | | | | 0.59 | | | | — | | | | — | | | | — | | | | $10.03 | | | | 6.25 | % | | | 0.80 | % | | | (0.27 | )% | | | 115 | % | | | $215,060 | |
| 2010 | | | $7.50 | | | | (0.02 | ) | | | 1.96 | | | | 1.94 | | | | — | (4) | | | — | | | | — | (4) | | | $9.44 | | | | 26.05 | % | | | 0.80 | % | | | (0.26 | )% | | | 152 | % | | | $161,304 | |
| 2009 | | | $7.62 | | | | (0.02 | ) | | | (0.10 | ) | | | (0.12 | ) | | | — | | | | — | | | | — | | | | $7.50 | | | | (1.71 | )% | | | 0.80 | % | | | (0.35 | )% | | | 190 | % | | | $91,237 | |
| 2008 | | | $13.42 | | | | (0.04 | ) | | | (5.73 | ) | | | (5.77 | ) | | | — | | | | (0.03 | ) | | | (0.03 | ) | | | $7.62 | | | | (43.09 | )% | | | 0.81 | % | | | (0.35 | )% | | | 183 | % | | | $40,136 | |
Notes to Financial Highlights
| (1) | Computed using average shares outstanding throughout the period. |
| (2) | Total returns are calculated based on the net asset value of the last business day. Total returns for periods less than one year are not annualized. |
| (3) | Ratio of operating expenses to average net assets does not include any fees and expenses of the acquired funds. |
| (4) | Per-share amount was less than $0.005. |
See Notes to Financial Statements.
Report of Independent Registered Public Accounting Firm |
The Board of Directors and Shareholders of
American Century Mutual Funds, Inc.:
We have audited the accompanying statement of assets and liabilities, including the schedule of investments, of NT Vista Fund, one of the funds constituting American Century Mutual Funds, Inc. (the “Corporation”) as of October 31, 2012, and the related statement of operations for the year then ended, the statement of changes in net assets for each of the two years in the period then ended, and the financial highlights for each of the five years in the period then ended. These financial statements and financial highlights are the responsibility of the Corporation’s management. Our responsibility is to express an opinion on these financial statements and financial highlights based on our audits.
We conducted our audits in accordance with the standards of the Public Company Accounting Oversight Board (United States). Those standards require that we plan and perform the audit to obtain reasonable assurance about whether the financial statements and financial highlights are free of material misstatement. The Corporation is not required to have, nor were we engaged to perform, an audit of its internal control over financial reporting. Our audits included consideration of internal control over financial reporting as a basis for designing audit procedures that are appropriate in the circumstances, but not for the purpose of expressing an opinion on the effectiveness of the Corporation’s internal control over financial reporting. Accordingly, we express no such opinion. An audit also includes examining, on a test basis, evidence supporting the amounts and disclosures in the financial statements, assessing the accounting principles used and significant estimates made by management, as well as evaluating the overall financial statement presentation. Our procedures included confirmation of securities owned as of October 31, 2012, by correspondence with the custodian and brokers; where replies were not received from brokers, we performed other auditing procedures. We believe that our audits provide a reasonable basis for our opinion.
In our opinion, the financial statements and financial highlights referred to above present fairly, in all material respects, the financial position of NT Vista Fund of American Century Mutual Funds, Inc., as of October 31, 2012, the results of its operations for the year then ended, the changes in its net assets for each of the two years in the period then ended, and the financial highlights for each of the five years in the period then ended, in conformity with accounting principles generally accepted in the United States of America.
Deloitte & Touche LLP
Kansas City, Missouri
December 19, 2012
The Board of Directors
The individuals listed below serve as directors of the funds. Each director will continue to serve in this capacity until death, retirement, resignation or removal from office. The mandatory retirement age for directors who are not “interested persons,” as that term is defined in the Investment Company Act (independent directors), is 72. However, the mandatory retirement age for an individual director may be extended with the approval of the remaining independent directors.
Mr. Thomas is an “interested person” because he currently serves as President and Chief Executive Officer of American Century Companies, Inc. (ACC), the parent company of American Century Investment Management, Inc. (ACIM or the advisor). Mr. Fink is an “interested person” because he currently serves as Executive Vice President of ACC.
The other directors (more than three-fourths of the total number) are independent; that is, they have never been employees, directors or officers of, and have no financial interest in, ACC or any of its wholly owned, direct or indirect, subsidiaries, including ACIM, American Century Investment Services, Inc. (ACIS) and American Century Services, LLC (ACS). The directors serve in this capacity for seven (in the case of Mr. Thomas, 15) registered investment companies in the American Century Investments family of funds.
The following table presents additional information about the directors. The mailing address for each director is 4500 Main Street, Kansas City, Missouri 64111.
Name (Year of Birth) | | Position(s) Held with Funds | | Length of Time Served | | Principal Occupation(s) During Past 5 Years | | Number of American Century Portfolios Overseen by Director | | Other Directorships Held During Past 5 Years |
| Independent Directors |
Thomas A. Brown (1940) | | Director | | Since 1980 | | Managing Member, Associated Investments, LLC (real estate investment company); Brown Cascade Properties, LLC (real estate investment company) (2001 to 2009) | | 66 | | None |
Andrea C. Hall (1945) | | Director | | Since 1997 | | Retired | | 66 | | None |
Jan M. Lewis (1957) | | Director | | Since 2011 | | President and Chief Executive Officer, Catholic Charities of Northeast Kansas (human services organization) | | 66 | | None |
James A. Olson (1942) | | Director | | Since 2007 | | Member, Plaza Belmont LLC (private equity fund manager) | | 66 | | Saia, Inc. (2002 to 2012) and Entertainment Properties Trust |
Donald H. Pratt (1937) | | Director and Chairman of the Board | | Since 1995 (Chairman since 2005) | | Chairman and Chief Executive Officer, Western Investments, Inc. (real estate company) | | 66 | | None |
Name (Year of Birth) | | Position(s) Held with Funds | | Length of Time Served | | Principal Occupation(s) During Past 5 Years | | Number of American Century Portfolios Overseen by Director | | Other Directorships Held During Past 5 Years |
| Independent Directors |
M. Jeannine Strandjord (1945) | | Director | | Since 1994 | | Retired | | 66 | | Euronet Worldwide Inc.; Charming Shoppes, Inc. (2006 to 2010); and DST Systems Inc. (1996 to 2012) |
John R. Whitten (1946) | | Director | | Since 2008 | | Retired | | 66 | | Rudolph Technologies, Inc. |
Stephen E. Yates (1948) | | Director | | Since 2012 | | Retired; Executive Vice President, Technology & Operations, KeyCorp. (computer services)(2004 to 2010) | | 66 | | Applied Industrial Technologies, Inc. (2001 to 2010) |
| | | | | | | | | | | |
| Interested Directors |
Barry Fink (1955) | | Director and Executive Vice President | | Since 2012 (Executive Vice President since 2007) | | Executive Vice President, ACC (September 2007 to present); President, ACS (October 2007 to present); Chief Operating Officer, ACC (September 2007 to November 2012). Also serves as Manager, ACS | | 66 | | None |
Jonathan S. Thomas (1963) | | Director and President | | Since 2007 | | President and Chief Executive Officer, ACC (March 2007 to present). Also serves as Chief Executive Officer and Manager, ACS; Executive Vice President, ACIM; Director, ACC, ACIM and other ACC subsidiaries | | 108 | | None |
Officers
The following table presents certain information about the executive officers of the funds. Each officer serves as an officer for each of the 15 investment companies in the American Century family of funds, unless otherwise noted. No officer is compensated for his or her service as an officer of the funds. The listed officers are interested persons of the funds and are appointed or re-appointed on an annual basis. The mailing address for each officer listed below is 4500 Main Street, Kansas City, Missouri 64111.
Name (Year of Birth) | | Offices with the Funds | | Principal Occupation(s) During the Past Five Years |
Jonathan S. Thomas (1963) | | Director and President since 2007 | | President and Chief Executive Officer, ACC (March 2007 to present). Also serves as Chief Executive Officer and Manager, ACS; Executive Vice President, ACIM; Director, ACC, ACIM and other ACC subsidiaries |
Barry Fink (1955) | | Director since 2012 and Executive Vice President since 2007 | | Executive Vice President, ACC (September 2007 to present); President, ACS (October 2007 to present); Chief Operating Officer, ACC (September 2007 to November 2012). Also serves as Manager, ACS |
Maryanne L. Roepke (1956) | | Chief Compliance Officer since 2006 and Senior Vice President since 2000 | | Chief Compliance Officer, American Century funds, ACIM and ACS (August 2006 to present). Also serves as Senior Vice President, ACS |
Charles A. Etherington (1957) | | General Counsel since 2007 and Senior Vice President since 2006 | | Attorney, ACC (February 1994 to present); Vice President, ACC (November 2005 to present), General Counsel, ACC (March 2007 to present). Also serves as General Counsel, ACIM, ACS, ACIS and other ACC subsidiaries; and Senior Vice President, ACIM and ACS |
C. Jean Wade (1964) | | Vice President, Treasurer and Chief Financial Officer since 2012 | | Vice President, ACS (February 2000 to present) |
Robert J. Leach (1966) | | Vice President since 2006 and Assistant Treasurer since 2012 | | Vice President, ACS (February 2000 to present) |
David H. Reinmiller (1963) | | Vice President since 2000 | | Attorney, ACC (January 1994 to present); Associate General Counsel, ACC (January 2001 to present). Also serves as Vice President, ACIM and ACS |
Ward D. Stauffer (1960) | | Secretary since 2005 | | Attorney, ACC (June 2003 to present) |
The Statement of Additional Information has additional information about the fund’s directors and is available without charge, upon request, by calling 1-800-345-2021.
Approval of Management Agreement |
At a meeting held on June 21, 2012, the Fund’s Board of Directors unanimously approved the renewal of the management agreement pursuant to which American Century Investment Management, Inc. (the “Advisor”) acts as the investment advisor for the Fund. Under Section 15(c) of the Investment Company Act, contracts for investment advisory services are required to be reviewed, evaluated, and approved by a majority of a fund’s independent directors (the “Directors”) each year.
As a part of the approval process, the Board requested and reviewed extensive data and information compiled by the Advisor and certain independent providers of evaluation data concerning the Fund and the services provided to the Fund by the Advisor. This review was in addition to the oversight and evaluation undertaken by the Board and its committees on a continuous basis throughout the year and included, but was not limited to the following:
| • | the nature, extent, and quality of investment management, shareholder services, and other services provided by the Advisor to the Fund; |
| • | the wide range of other programs and services the Advisor provides to the Fund and its shareholders on a routine and non-routine basis; |
| • | the investment performance of the fund, including data comparing the Fund’s performance to appropriate benchmarks and/or a peer group of other mutual funds with similar investment objectives and strategies; |
| • | data comparing the cost of owning the Fund to the cost of owning similar funds; |
| • | the Advisor’s compliance policies, procedures, and regulatory experience; |
| • | financial data showing the cost of services provided to the Fund, the profitability of the Fund to the Advisor, and the overall profitability of the Advisor; |
| • | data comparing services provided and charges to other investment management clients of the Advisor; and |
| • | consideration of collateral benefits derived by the Advisor from the management of the Fund and any potential economies of scale relating thereto. |
In keeping with its practice, the Board held two in-person meetings and one telephonic meeting to review and discuss the information provided. The Directors also had the benefit of the advice of independent counsel throughout the period.
Factors Considered
The Directors considered all of the information provided by the Advisor, the independent data providers, and independent counsel, and evaluated such information for the Fund. In connection with their review, the Directors did not identify any single factor as being all-important or controlling, and each Director may have attributed different levels of importance to different factors. In deciding to renew the management agreement, the Board based its decision on a number of factors, including the following:
Nature, Extent and Quality of Services - Generally. Under the management agreement, the Advisor is responsible for providing or arranging for all services necessary for the operation of the Fund. The Board noted that under the management agreement, the Advisor provides or arranges at its own expense a wide variety of services including:
| • | constructing and designing the Fund |
| • | portfolio research and security selection |
| • | initial capitalization/funding |
| • | daily valuation of the Fund’s portfolio |
| • | shareholder servicing and transfer agency, including shareholder confirmations, recordkeeping, and communications |
| • | regulatory and portfolio compliance |
| • | marketing and distribution |
The Board noted that many of these services have expanded over time both in terms of quantity and complexity in response to shareholder demands, competition in the industry, changing distribution channels, and the changing regulatory environment.
Investment Management Services. The nature of the investment management services provided to the Fund is quite complex and allows Fund shareholders access to professional money management, instant diversification of their investments within an asset class, the opportunity to easily diversify among asset classes by investing in or exchanging among various American Century Investments funds, and liquidity. In evaluating investment performance, the Board expects the Advisor to manage the Fund in accordance with its investment objectives and approved strategies. Further, the Directors recognize that the Advisor has an obligation to monitor trading activities, and in particular to seek the best execution of fund trades, and to evaluate the use of and payment for research. In providing these services, the Advisor utilizes teams of investment professionals (portfolio managers, analysts, research assistants, and securities traders) who require extensive information technology, research, training, compliance and other systems to conduct their business. The Board, directly and through its Fund Performance Review Committee, regularly reviews investment performance
information for the Fund, together with comparative information for appropriate benchmarks and/or peer groups of similarly-managed funds, over different time horizons. The Directors also review detailed performance information during the management agreement approval process. If performance concerns are identified, the Fund receives special reviews until performance improves, during which the Board discusses with the Advisor the reasons for such results (e.g., market conditions, security selection) and any efforts being undertaken to improve performance. Taking all these factors into consideration, the Board found the investment management services provided by the Advisor to the Fund to meet or exceed industry standards. More detailed information about the Fund’s performance can be found in the Performance and Portfolio Commentary sections of this report.
Shareholder and Other Services. Under the management agreement, the Advisor provides the Fund with a comprehensive package of transfer agency, shareholder, and other services. The Board, directly and through various committees of the Board, regularly reviews reports and evaluations of such services at its regular meetings. These reports include, but are not limited to, information regarding the operational efficiency and accuracy of the shareholder and transfer agency services provided, staffing levels, shareholder satisfaction (as measured by external as well as internal sources), technology support, new products and services offered to Fund shareholders, securities trading activities, portfolio valuation services, auditing services, and legal and operational compliance activities. Certain aspects of shareholder and transfer agency service level efficiency and the quality of securities trading activities are measured by independent third party providers and are presented in comparison to other fund groups not managed by the Advisor. The Board found the services provided by the Advisor to the Fund under the management agreement to be competitive and of high quality.
Costs of Services and Profitability. The Advisor provides detailed information concerning its cost of providing various services to the Fund, its profitability in managing the Fund, its overall profitability, and its financial condition. The Directors have reviewed with the Advisor the methodology used to prepare this financial information. The financial information regarding the Advisor is considered in evaluating the Advisor’s financial condition, ability to continue to provide services under the management agreement, and the reasonableness of the current management fee. The Board concluded that the Advisor’s profits were reasonable in light of the services provided to the Fund.
Ethics. The Board generally considers the Advisor’s commitment to providing quality services to shareholders and to conducting its business ethically. They noted that the Advisor’s practices generally meet or exceed industry best practices.
Economies of Scale. The Board also reviewed information provided by the Advisor regarding the possible existence of economies of scale in connection with the management of the Fund. The Board concluded that economies of scale are difficult to measure and predict with precision, especially on a fund-by-fund basis. The Board concluded that the Advisor is appropriately sharing economies of scale through its competitive fee structure, offering competitive fees from fund inception, and through reinvestment in its business to provide shareholders additional content and services.
Comparison to Other Funds’ Fees. The management agreement provides that the Fund pay the Advisor a single, all-inclusive (or unified) management fee for providing all services necessary for the management and operation of the Fund, other than brokerage expenses, taxes, interest, extraordinary expenses, and the fees and expenses of the Fund’s independent directors (including their independent legal counsel) and expenses incurred in connection with the provision of shareholder services and distribution services under a plan adopted pursuant to Rule 12b-1 under the 1940 Act. Under the unified fee structure, the Advisor is responsible for providing all investment advisory, custody, audit, administrative, compliance, recordkeeping, marketing and shareholder services, or arranging and supervising third parties to provide such services. By contrast, most other funds are charged a variety of fees, including an investment advisory fee, a transfer agency fee, an administrative fee, distribution charges and other expenses. Other than their investment advisory fees and any applicable Rule 12b-1 distribution fees, all other components of the total fees charged by these other funds may be increased without shareholder approval. The Board believes the unified fee structure is a benefit to Fund shareholders because it clearly discloses to shareholders the cost of owning Fund shares, and, since the unified fee cannot be increased without a vote of Fund shareholders, it shifts to the Advisor the risk of increased costs of operating the Fund and provides a direct incentive to minimize administrative inefficiencies. Part of the Board’s analysis of fee levels involves reviewing certain evaluative data compiled by an independent provider and comparing the Fund’s unified fee to the total expense ratio of other funds in the Fund’s peer group. The Board concluded that the management fee paid by the Fund to the Advisor under the management agreement is reasonable in light of the services provided to the Fund.
Comparison to Fees and Services Provided to Other Clients of the Advisor. The Board also requested and received information from the Advisor concerning the nature of the services, fees, costs and profitability of its advisory services to advisory clients other than the Fund. They observed that these varying types of client accounts require different services and involve different regulatory and entrepreneurial risks than the management of the Fund. The Board analyzed this information and concluded that the fees charged and services provided to the Fund were reasonable by comparison.
Collateral or “Fall-Out” Benefits Derived by the Advisor. The Board considered the existence of collateral benefits the Advisor may receive as a result of its relationship with the Fund. They concluded that the Advisor’s primary business is managing mutual funds and it generally does not use fund or shareholder information to generate profits in other lines of business, and therefore does not derive any significant collateral benefits from them. The Board noted that the Advisor receives proprietary research from broker-dealers that execute fund portfolio transactions and concluded that this research is likely to benefit Fund shareholders. The Board also determined that the Advisor is able to provide investment management services to certain clients other than the Fund, at least in part, due to its existing infrastructure built to serve the fund complex. The Board concluded, however, that the assets of those other clients are not material to the analysis and, where applicable, may be included with the assets of the Fund to determine breakpoints in the management fee schedule.
Existing Relationship. The Board also considered whether there was any reason for not continuing the existing arrangement with the Advisor. In this regard, the Board was mindful of the potential disruptions of the Fund’s operations and various risks, uncertainties, and other effects that could occur as a result of a decision not to continue such relationship. In particular, the Board recognized that most shareholders have invested in the Fund on the strength of the Advisor’s industry standing and reputation and in the expectation that the Advisor will have a continuing role in providing advisory services to the Fund.
Conclusion of the Directors. As a result of this process, the Board, including all of the independent directors, taking into account all of the factors discussed above and the information provided by the Advisor and others, concluded that the management agreement between the Fund and the Advisor is fair and reasonable in light of the services provided and should be renewed.
Retirement Account Information
As required by law, distributions you receive from certain IRAs, or 403(b), 457 and qualified plans are subject to federal income tax withholding, unless you elect not to have withholding apply. Tax will be withheld on the total amount withdrawn even though you may be receiving amounts that are not subject to withholding, such as nondeductible contributions. In such case, excess amounts of withholding could occur. You may adjust your withholding election so that a greater or lesser amount will be withheld.
If you don’t want us to withhold on this amount, you must notify us to not withhold the federal income tax. You may notify us in writing or in certain situations by telephone or through other electronic means. You have the right to revoke your withholding election at any time and any election you make may remain in effect until revoked by filing a new election.
Remember, even if you elect not to have income tax withheld, you are liable for paying income tax on the taxable portion of your withdrawal. If you elect not to have income tax withheld or you don’t have enough income tax withheld, you may be responsible for payment of estimated tax. You may incur penalties under the estimated tax rules if your withholding and estimated tax payments are not sufficient. You can reduce or defer the income tax on a distribution by directly or indirectly rolling such distribution over to another IRA or eligible plan. You should consult your tax advisor for additional information.
State tax will be withheld if, at the time of your distribution, your address is within one of the mandatory withholding states and you have federal income tax withheld. State taxes will be withheld from your distribution in accordance with the respective state rules.
Proxy Voting Guidelines
American Century Investment Management, Inc., the fund’s investment advisor, is responsible for exercising the voting rights associated with the securities purchased and/or held by the fund. A description of the policies and procedures the advisor uses in fulfilling this responsibility is available without charge, upon request, by calling 1-800-345-2021. It is also available on American Century Investments’ website at americancentury.com and on the Securities and Exchange Commission’s website at sec.gov. Information regarding how the investment advisor voted proxies relating to portfolio securities during the most recent 12-month period ended June 30 is available on the “About Us” page at americancentury.com. It is also available at sec.gov.
Quarterly Portfolio Disclosure
The fund files its complete schedule of portfolio holdings with the Securities and Exchange Commission (SEC) for the first and third quarters of each fiscal year on Form N-Q. The fund’s Forms N-Q are available on the SEC’s website at sec.gov, and may be reviewed and copied at the SEC’s Public Reference Room in Washington, DC. Information on the operation of the Public Reference Room may be obtained by calling 1-800-SEC-0330. The fund also makes its complete schedule of portfolio holdings for the most recent quarter of its fiscal year available on its website at americancentury.com and, upon request, by calling 1-800-345-2021.
Other Tax Information
The following information is provided pursuant to provisions of the Internal Revenue Code.
The fund hereby designates $3,557,528, or up to the maximum amount allowable, as long-term capital gain distributions for the fiscal year ended October 31, 2012.
The fund hereby designates $41,782, or up to the maximum amount allowable, as long-term capital gain distributions for the fiscal year ended October 31, 2011. The fund utilized earnings and profits of $41,782 distributed to shareholders on redemption of shares as part of the dividends paid deduction.
| Contact Us | americancentury.com |
| Automated Information Line | 1-800-345-8765 |
| Investor Services Representative | 1-800-345-2021 or 816-531-5575 |
| Investors Using Advisors | 1-800-378-9878 |
| Business, Not-For-Profit, Employer-Sponsored Retirement Plans | 1-800-345-3533 |
| Banks and Trust Companies, Broker-Dealers, Financial Professionals, Insurance Companies | 1-800-345-6488 |
| Telecommunications Device for the Deaf | 1-800-634-4113 |
American Century Mutual Funds, Inc.
Investment Advisor:
American Century Investment Management, Inc.
Kansas City, Missouri
This report and the statements it contains are submitted for the general information of our shareholders. The report is not authorized for distribution to prospective investors unless preceded or accompanied by an effective prospectus.
©2012 American Century Proprietary Holdings, Inc. All rights reserved.
CL-ANN-76908 1212
ITEM 2. CODE OF ETHICS.
| (a) | The registrant has adopted a Code of Ethics for Senior Financial Officers that applies to the registrant’s principal executive officer, principal financial officer, principal accounting officer, and persons performing similar functions. |
| (f) | The registrant’s Code of Ethics for Senior Financial Officers was filed as Exhibit 12 (a)(1) to American Century Asset Allocation Portfolios, Inc.’s Annual Certified Shareholder Report on Form N-CSR, File No. 811-21591, on September 29, 2005, and is incorporated herein by reference. |
ITEM 3. AUDIT COMMITTEE FINANCIAL EXPERT.
| (a)(1) | The registrant’s board has determined that the registrant has at least one audit committee financial expert serving on its audit committee. |
| (a)(2) | M. Jeannine Strandjord, James A. Olson, Andrea C. Hall and Stephen E. Yates are the registrant’s designated audit committee financial experts. They are “independent” as defined in Item 3 of Form N-CSR. |
ITEM 4. PRINCIPAL ACCOUNTANT FEES AND SERVICES.
The aggregate fees billed for each of the last two fiscal years for professional services rendered by the principal accountant for the audit of the registrant’s annual financial statements or services that are normally provided by the accountant in connection with statutory and regulatory filings or engagements for those fiscal years were as follows:
FY 2011: $285,752
FY 2012: $296,263
The aggregate fees billed in each of the last two fiscal years for assurance and related services by the principal accountant that are reasonably related to the performance of the audit of the registrant’s financial statements and are not reported under paragraph (a) of this Item were as follows:
| | For services rendered to the registrant: |
Fees required to be approved pursuant to paragraph (c)(7)(ii) of Rule 2-01 of Regulation S-X (relating to certain engagements for non-audit services with the registrant’s investment adviser and its affiliates):
The aggregate fees billed in each of the last two fiscal years for professional services rendered by the principal accountant for tax compliance, tax advice, and tax planning were as follows:
| | For services rendered to the registrant: |
FY 2011: $0
FY 2012: $0
Fees required to be approved pursuant to paragraph (c)(7)(ii) of Rule 2-01 of Regulation S-X (relating to certain engagements for non-audit services with the registrant’s investment adviser and its affiliates):
FY 2011: $0
FY 2012: $0
The aggregate fees billed in each of the last two fiscal years for products and services provided by the principal accountant, other than the services reported in paragraphs (a) through (c) of this Item were as follows:
| | For services rendered to the registrant: |
Fees required to be approved pursuant to paragraph (c)(7)(ii) of Rule 2-01 of Regulation S-X (relating to certain engagements for non-audit services with the registrant’s investment adviser and its affiliates):
| (e)(1) | In accordance with paragraph (c)(7)(i)(A) of Rule 2-01 of Regulation S-X, before the accountant is engaged by the registrant to render audit or non-audit services, the engagement is approved by the registrant’s audit committee. Pursuant to paragraph (c)(7)(ii) of Rule 2-01 of Regulation S-X, the registrant’s audit committee also pre-approves its accountant’s engagements for non-audit services with the registrant’s investment adviser, its parent company, and any entity controlled by, or under common control with the investment adviser that provides ongoing services to the registrant, if the engagement relates directly to the operations and financial reporting of the registrant. |
| (e)(2) | All services described in each of paragraphs (b) through (d) of this Item were pre-approved before the engagement by the registrant’s audit committee pursuant to paragraph (c)(7)(i)(A) of Rule 2-01 of Regulation S-X. Consequently, none of such services were required to be approved by the audit committee pursuant to paragraph (c)(7)(i)(C). |
| (f) | The percentage of hours expended on the principal accountant’s engagement to audit the registrant’s financial statements for the most recent fiscal year that were attributed to work performed by persons other than the principal accountant’s full-time, permanent employees was less than 50%. |
| (g) | The aggregate non-audit fees billed by the registrant’s accountant for services rendered to the registrant, and rendered to the registrant’s investment adviser (not including any sub-adviser whose role is primarily portfolio management and is subcontracted with or overseen by another investment adviser), and any entity controlling, controlled by, or under common control with the adviser that provides ongoing services to the registrant for each of the last two fiscal years of the registrant were as follows: |
FY 2011: $67,680
FY 2012: $68,768
| (h) | The registrant’s investment adviser and accountant have notified the registrant’s audit committee of all non-audit services that were rendered by the registrant’s accountant to the registrant’s investment adviser, its parent company, and any entity controlled by, or under common control with the investment adviser that provides services to the registrant, which services were not required to be pre-approved pursuant to paragraph (c)(7)(ii) of Rule 2-01 of Regulation S-X. The notification provided to the registrant’s audit committee included sufficient details regarding such services to allow the registrant’s audit committee to consider the continuing independence of its principal accountant. |
ITEM 5. AUDIT COMMITTEE OF LISTED REGISTRANTS.
Not applicable.
ITEM 6. INVESTMENTS.
| (a) | The schedule of investments is included as part of the report to stockholders filed under Item 1 of this Form. |
ITEM 7. DISCLOSURE OF PROXY VOTING POLICIES AND PROCEDURES FOR CLOSED-END MANAGEMENT INVESTMENT COMPANIES.
Not applicable.
ITEM 8. PORTFOLIO MANAGERS OF CLOSED-END MANAGEMENT INVESTMENT COMPANIES.
Not applicable.
ITEM 9. PURCHASES OF EQUITY SECURITIES BY CLOSED-END MANAGEMENT INVESTMENT COMPANY AND AFFILIATED PURCHASERS.
Not applicable.
ITEM 10. SUBMISSION OF MATTERS TO A VOTE OF SECURITY HOLDERS.
During the reporting period, there were no material changes to the procedures by which shareholders may recommend nominees to the registrant’s board.
ITEM 11. CONTROLS AND PROCEDURES.
| (a) | The registrant's principal executive officer and principal financial officer have concluded that the registrant's disclosure controls and procedures (as defined in Rule 30a-3(c) under the Investment Company Act of 1940) are effective based on their evaluation of these controls and procedures as of a date within 90 days of the filing date of this report. |
| (b) | There were no changes in the registrant's internal control over financial reporting (as defined in Rule 30a-3(d) under the Investment Company Act of 1940) that occurred during the registrant's second fiscal quarter of the period covered by this report that have materially affected, or are reasonably likely to materially affect, the registrant's internal control over financial reporting. |
ITEM 12. EXHIBITS.
| (a)(1) | Registrant’s Code of Ethics for Senior Financial Officers, which is the subject of the disclosure required by Item 2 of Form N-CSR, was filed as Exhibit 12(a)(1) to American Century Asset Allocation Portfolios, Inc.’s Certified Shareholder Report on Form N-CSR, File No. 811-21591, on September 29, 2005. |
| (a)(2) | Separate certifications by the registrant’s principal executive officer and principal financial officer, pursuant to Section 302 of the Sarbanes-Oxley Act of 2002 and Rule 30a-2(a) under the Investment Company Act of 1940, are filed and attached hereto as EX-99.CERT. |
| (b) | A certification by the registrant’s chief executive officer and chief financial officer, pursuant to Section 906 of the Sarbanes-Oxley Act of 2002, is furnished and attached hereto as EX-99.906CERT. |
SIGNATURES
Pursuant to the requirements of the Securities Exchange Act of 1934 and the Investment Company Act of 1940, the registrant has duly caused this report to be signed on its behalf by the undersigned, thereunto duly authorized.
| Registrant: | American Century Mutual Funds, Inc. | |
| | | | |
| | | | |
| By: | /s/ Jonathan S. Thomas | |
| | Name: | Jonathan S. Thomas | |
| | Title: | President | |
| | | | |
| Date: | December 28, 2012 | |
| | | |
Pursuant to the requirements of the Securities Exchange Act of 1934 and the Investment Company Act of 1940, this report has been signed below by the following persons on behalf of the registrant and in the capacities and on the dates indicated.
| By: | /s/ Jonathan S. Thomas | |
| | Name: | Jonathan S. Thomas | |
| | Title: | President | |
| | | (principal executive officer) | |
| | | | |
| | | | |
| Date: | December 28, 2012 | |
| By: | /s/ C. Jean Wade | |
| | Name: | C. Jean Wade | |
| | Title: | Vice President, Treasurer, and | |
| | | Chief Financial Officer | |
| | | (principal financial officer) | |
| | | | |
| Date: | December 28, 2012 | |