UNITED STATES |
SECURITIES AND EXCHANGE COMMISSION |
Washington, D.C. 20549 |
| |
FORM 10-Q |
| |
(Mark One) | |
[ü] QUARTERLY REPORT PURSUANT TO SECTION 13 OR 15(d) OF |
THE SECURITIES EXCHANGE ACT OF 1934 |
| |
| For the Quarterly Period Ended June 30, 2005 |
| |
OR |
| |
[ ] TRANSITION REPORT PURSUANT TO SECTION 13 OR 15(d) OF |
THE SECURITIES EXCHANGE ACT OF 1934 |
| |
| For the transition period from to |
| |
| Commission File Number 1-14174 |
| |
AGL RESOURCES INC. |
| (Exact name of registrant as specified in its charter) |
| |
Georgia | 58-2210952 |
| (State or other jurisdiction of incorporation or organization) | (I.R.S. Employer Identification No.) |
| |
Ten Peachtree Place NE, Atlanta, Georgia 30309 |
| (Address and zip code of principal executive offices) |
| |
404-584-4000 |
| (Registrant's telephone number, including area code) |
| |
Indicate by check mark whether the registrant (1) has filed all reports required to be filed by Section 13 or 15(d) of the Securities Exchange Act of 1934 during the preceding 12 months (or for such shorter period that the registrant was required to file such reports), and (2) has been subject to such filing requirements for the past 90 days. ü No __ |
| |
Indicate by check mark whether the registrant is an accelerated filer (as defined in Rule 12b-2 of the Exchange Act). Yes ü No __ |
| |
| Indicate the number of shares outstanding of each of the issuer's classes of common stock, as of the latest practicable date. |
| |
Class | Outstanding as of July 24, 2005 |
| Common Stock, $5.00 Par Value | 77,381,037 |
AGL RESOURCES INC.
Form 10-Q
For the Quarterly Period Ended June 30, 2005
Item Number | | Page(s) |
| | | |
| | PART I - FINANCIAL INFORMATION | 3-48 |
| | | |
| 1 | Condensed Consolidated Financial Statements (Unaudited) | 3-22 |
| | Condensed Consolidated Balance Sheets | 3 |
| | Condensed Consolidated Statements of Income | 4 |
| | Condensed Consolidated Statements of Common Shareholders’ Equity | 5 |
| | Condensed Consolidated Statements of Cash Flows | 6 |
| | Notes to Condensed Consolidated Financial Statements | 7-22 |
| | Note 1 - Accounting Policies and Methods of Application | 7-9 |
| | Note 2 - Acquisition Update | 9-10 |
| | Note 3 - Recent Accounting Pronouncements | 10 |
| | Note 4 - Risk Management | 10-12 |
| | Note 5 - Regulatory Assets and Liabilities | 13-15 |
| | Note 6 - Pension and Other Postretirement Benefits | 15-16 |
| | Note 7 - Compensation Plans | 16 |
| | Note 8 - Financing | 17 |
| | Note 9 - Commitments and Contingencies | 18 |
| | Note 10 - Segment Information | 19-22 |
| 2 | Management's Discussion and Analysis of Financial Condition and Results of Operation | 23-48 |
| | Cautionary Statement Regarding Forward-Looking Statements | 23 |
| | Overview | 23-26 |
| | Results of Operations | 26-42 |
| | AGL Resources | 26-29 |
| | Distribution Operations | 29-33 |
| | Retail Energy Operations | 33-34 |
| | Wholesale Services | 35-39 |
| | Energy Investments | 39-40 |
| | Corporate | 41-42 |
| | Liquidity and Capital Resources | 42-45 |
| | Critical Accounting Policies and Estimates | 45 |
| | Accounting Developments | 46 |
| 3 | Quantitative and Qualitative Disclosures About Market Risk | 46-48 |
| 4 | Controls and Procedures | 48 |
| | | |
| | PART II - OTHER INFORMATION | 49-50 |
| | | |
| 1 | Legal Proceedings | 49 |
| 2 | Unregistered Sales of Equity Securities and Use of Proceeds | 49 |
| 4 | Submission of Matters to a Vote of Security Holders | 50 |
| 6 | Exhibits | 50 |
| | | |
| | SIGNATURE | 51 |
PART I - Financial Information Item 1. Condensed Consolidated Financial Statements (Unaudited) | |
| |
CONDENSED CONSOLIDATED BALANCE SHEETS | |
(UNAUDITED) | |
| | | | | | | | |
In millions except share data | | June 30, 2005 | | December 31, 2004 | | June 30, 2004 | |
Current assets | | | | | | | |
| Cash and cash equivalents | | $ | 45 | | $ | 49 | | $ | 54 | |
| Receivables (less allowance for uncollectible accounts of $18 at June 30, 2005, $15 at Dec. 31, 2004 and $17 at June 30, 2004) | | | 511 | | | 737 | | | 414 | |
| Unbilled revenues | | | 54 | | | 152 | | | 42 | |
| Inventories | | | 381 | | | 332 | | | 259 | |
| Income tax receivable | | | 40 | | | 29 | | | - | |
| Unrecovered environmental remediation costs - current | | | 24 | | | 27 | | | 26 | |
| Unrecovered pipeline replacement program costs - current | | | 24 | | | 24 | | | 24 | |
| Energy marketing and risk management assets | | | 48 | | | 38 | | | 21 | |
| Other | | | 73 | | | 69 | | | 10 | |
| Total current assets | | | 1,200 | | | 1,457 | | | 850 | |
Property, plant and equipment | | | | | | | | | | |
| Property, plant and equipment | | | 4,665 | | | 4,615 | | | 3,476 | |
| Less accumulated depreciation | | | 1,458 | | | 1,437 | | | 1,067 | |
| Property, plant and equipment-net | | | 3,207 | | | 3,178 | | | 2,409 | |
Deferred debits and other assets | | | | | | | | | | |
| Goodwill | | | 401 | | | 354 | | | 177 | |
| Unrecovered pipeline replacement program costs | | | 333 | | | 337 | | | 381 | |
| Unrecovered environmental remediation costs | | | 188 | | | 173 | | | 141 | |
| Other | | | 116 | | | 141 | | | 52 | |
| Total deferred debits and other assets | | | 1,038 | | | 1,005 | | | 751 | |
Total assets | | $ | 5,445 | | $ | 5,640 | | $ | 4,010 | |
Current liabilities | | | | | | | | | | |
| Payables | | $ | 589 | | $ | 728 | | $ | 535 | |
| Accrued expenses | | | 95 | | | 65 | | | 53 | |
| Accrued pipeline replacement program costs - current | | | 41 | | | 85 | | | 90 | |
| Energy marketing and risk management liabilities | | | 37 | | | 15 | | | 11 | |
| Short-term debt | | | 172 | | | 334 | | | 195 | |
| Other | | | 212 | | | 250 | | | 132 | |
| Total current liabilities | | | 1,146 | | | 1,477 | | | 1,016 | |
Accumulated deferred income taxes | | | 425 | | | 437 | | | 413 | |
Long-term liabilities | | | | | | | | | | |
| Accrued pipeline replacement program costs | | | 277 | | | 242 | | | 285 | |
| Accumulated removal costs | | | 92 | | | 94 | | | 104 | |
| Accrued pension obligations | | | 89 | | | 84 | | | 27 | |
| Accrued environmental remediation costs | | | 86 | | | 63 | | | 25 | |
| Accrued postretirement benefit costs | | | 58 | | | 58 | | | 51 | |
| Other | | | 45 | | | 68 | | | 13 | |
| Total long-term liabilities | | | 647 | | | 609 | | | 505 | |
Deferred credits | | | 117 | | | 73 | | | 74 | |
Commitments and contingencies (Note 9) | | | | | | | | | | |
Minority interest | | | 32 | | | 36 | | | 29 | |
Capitalization | | | | | | | | | | |
| Long-term debt | | | 1,621 | | | 1,623 | | | 962 | |
| Shareholders’ equity (Common stock, $5 par value, 750 million shares authorized; 77.3 million shares issued and outstanding at June 30, 2005; 76.7 million shares issued and outstanding at December 31, 2004; 64.9 million shares issued and outstanding at June 30, 2004) | | | 1,457 | | | 1,385 | | | 1,011 | |
| Total capitalization | | | 3,078 | | | 3,008 | | | 1,973 | |
Total liabilities and capitalization | | $ | 5,445 | | $ | 5,640 | | $ | 4,010 | |
See Notes to Condensed Consolidated Financial Statements (Unaudited).
AGL RESOURCES INC. AND SUBSIDIARIES | |
CONDENSED CONSOLIDATED STATEMENTS OF INCOME | |
(UNAUDITED) | |
| | | | | | | | | | |
| | | Three months ended June 30, | | Six months ended June 30, | |
| | 2005 | | 2004 | | 2005 | | 2004 | |
| Operating revenues | | $ | 431 | | $ | 294 | | $ | 1,343 | | $ | 945 | |
| Operating expenses | | | | | | | | | | | | | |
| Cost of gas | | | 209 | | | 129 | | | 781 | | | 522 | |
| Operation and maintenance | | | 113 | | | 81 | | | 228 | | | 174 | |
| Depreciation and amortization | | | 33 | | | 24 | | | 66 | | | 48 | |
| Taxes other than income | | | 10 | | | 7 | | | 21 | | | 15 | |
| Total operating expenses | | | 365 | | | 241 | | | 1,096 | | | 759 | |
| Operating income | | | 66 | | | 53 | | | 247 | | | 186 | |
| Other income | | | 1 | | | 1 | | | 2 | | | 2 | |
| Interest expense | | | (26 | ) | | (16 | ) | | (52 | ) | | (32 | ) |
| Minority interest | | | (3 | ) | | (3 | ) | | (16 | ) | | (14 | ) |
| Earnings before income taxes | | | 38 | | | 35 | | | 181 | | | 142 | |
| Income taxes | | | 14 | | | 14 | | | 69 | | | 55 | |
| Net income | | $ | 24 | | $ | 21 | | $ | 112 | | $ | 87 | |
| | | | | | | | | | | | | | |
| Basic earnings per common share | | $ | 0.31 | | $ | 0.34 | | $ | 1.45 | | $ | 1.35 | |
| Diluted earnings per common share | | $ | 0.30 | | $ | 0.33 | | $ | 1.44 | | $ | 1.33 | |
| Weighted-average number of common shares outstanding | | | | | | | | | | | | | |
| Basic | | | 77.1 | | | 64.8 | | | 77.0 | | | 64.7 | |
| Diluted | | | 77.8 | | | 65.6 | | | 77.7 | | | 65.5 | |
See Notes to Condensed Consolidated Financial Statements (Unaudited).
AGL RESOURCES INC. AND SUBSIDIARIES | |
CONDENSED CONSOLIDATED STATEMENTS OF COMMON SHAREHOLDERS’ EQUITY | |
(UNAUDITED) | |
| | | | | | | | | | | | | | |
| | | | | | | Premium on | | | | Other | | | |
| | | Common Stock | | common | | Earnings | | comprehensive | | | |
In millions, except per share amount | | Shares | | Amount | | shares | | reinvested | | income | | Total | |
| Balance as of December 31, 2004 | | | 76.7 | | $ | 384 | | $ | 632 | | $ | 415 | | $ | (46 | ) | $ | 1,385 | |
| Comprehensive income: | | | | | | | | | | | | | | | | | | | |
| Net income | | | - | | | - | | | - | | | 112 | | | - | | | 112 | |
| Unrealized loss from hedging activities (net of taxes) | | | - | | | - | | | - | | | - | | | (4 | ) | | (4 | ) |
| Total comprehensive income | | | | | | | | | | | | | | | | | | 108 | |
| Dividends on common shares ($0.62 per share) | | | - | | | - | | | - | | | (48 | ) | | - | | | (48 | ) |
| Benefit, stock compensation, dividend reinvestment and share purchase plans | | | 0.6 | | | 3 | | | 9 | | | - | | | - | | | 12 | |
| Balance as of June 30, 2005 | | | 77.3 | | $ | 387 | | $ | 641 | | $ | 479 | | $ | (50 | ) | $ | 1,457 | |
See Notes to Condensed Consolidated Financial Statements (Unaudited).
| |
CONDENSED CONSOLIDATED STATEMENTS OF CASH FLOWS | |
(UNAUDITED) | |
| | | | |
| | | Six months ended | |
| | | June 30, | |
In millions | | 2005 | | 2004 | |
Cash flows from operating activities | | | | | |
| Net income | | $ | 112 | | $ | 87 | |
| Adjustments to reconcile net income to net cash flow provided by operating activities | | | | | | | |
| Depreciation and amortization | | | 66 | | | 48 | |
| Deferred income taxes | | | (12 | ) | | 37 | |
| Changes in certain assets and liabilities | | | | | | | |
| Receivables | | | 324 | | | 105 | |
| Payables | | | (139 | ) | | 74 | |
| Inventories | | | (49 | ) | | (21 | ) |
Change in risk management assets and liabilities | | | 12 | | | (14 | ) |
| Other | | | 31 | | | 28 | |
| Net cash flow provided by operating activities | | | 345 | | | 344 | |
Cash flows from investing activities | | | | | | | |
| Property, plant and equipment expenditures | | | (130 | ) | | (104 | ) |
| Sale of ownership interest in US Propane | | | - | | | 31 | |
| Other | | | 3 | | | 1 | |
| Net cash flow used in investing activities | | | (127 | ) | | (72 | ) |
Cash flows from financing activities | | | | | | | |
| Payments and borrowings of short-term debt | | | (162 | ) | | (151 | ) |
| Payments of Medium-Term notes | | | - | | | (49 | ) |
| Dividends paid on common shares | | | (48 | ) | | (37 | ) |
| Distribution to minority interest | | | (19 | ) | | (14 | ) |
| Other | | | 7 | | | 16 | |
| Net cash flow used in financing activities | | | (222 | ) | | (235 | ) |
| Net (decrease) increase in cash and cash equivalents | | | (4 | ) | | 37 | |
| Cash and cash equivalents at beginning of period | | | 49 | | | 17 | |
| Cash and cash equivalents at end of period | | $ | 45 | | $ | 54 | |
Cash paid during the period for | | | | | | | |
| Interest (net of allowance for funds used during construction) | | $ | 39 | | $ | 24 | |
| Income taxes | | $ | 23 | | $ | 22 | |
See Notes to Condensed Consolidated Financial Statements (Unaudited).
AGL RESOURCES INC. AND SUBSIDIARIES NOTES TO CONDENSED CONSOLIDATED FINANCIAL STATEMENTS (UNAUDITED)
Note 1
Accounting Policies and Methods of Application
General
AGL Resources Inc. is an energy services holding company that conducts substantially all of its operations through its subsidiaries. Unless the context requires otherwise, references to “we,”“us,”“our” or the “company” are intended to mean consolidated AGL Resources Inc. and its subsidiaries (AGL Resources).
We have prepared the accompanying unaudited condensed consolidated financial statements under the rules of the Securities and Exchange Commission (SEC). Under such rules and regulations, we have condensed or omitted certain information and notes normally included in financial statements prepared in conformity with accounting principles generally accepted in the United States of America (GAAP). However, the condensed consolidated financial statements reflect all adjustments that are, in the opinion of management, necessary for a fair presentation of our financial results for the interim periods. You should read these condensed consolidated financial statements in conjunction with our consolidated financial statements and related notes included in our Annual Report on Form 10-K for the year ended December 31, 2004, filed with the SEC on February 15, 2005, as updated in our Current Report on Form 8-K filed with the SEC on July 28, 2005. All subsequent references to our Form 8-K filed with the SEC on July 28, 2005 herein should also be considered with reference to our Form 10-K as filed on February 15, 2005.
Due to the seasonal nature of our business, our results of operations for the three and six months ended June 30, 2005 and 2004 and our financial position as of December 31, 2004 and June 30, 2005 and 2004 are not necessarily indicative of the results of operations and financial condition to be expected as of or for any other period.
Basis of Presentation
Our condensed consolidated financial statements as of and for the period ended June 30, 2005 include our accounts, the accounts of our majority-owned and controlled subsidiaries and the accounts of variable interest entities for which we are the primary beneficiary. All significant intercompany items have been eliminated in consolidation. Certain amounts for prior periods have been reclassified to conform to the current period presentation. The December 31, 2004 balance sheet amounts are derived from our audited balance sheet as of December 31, 2004.
We utilize the equity method to account for and report our 50% interest in Saltville Gas Storage Company, LLC (Saltville), where we exercise significant influence but do not control the entity and where we are not the primary beneficiary as defined by Financial Accounting Standards Board (FASB) Interpretation No. 46, “Consolidation of Variable Interest Entities” (FIN 46).
In accordance with FIN 46 as revised in December 2003 (FIN 46R), as of January 1, 2004 we consolidated all of the accounts of SouthStar Energy Services LLC (SouthStar), a variable interest entity of which we currently own a noncontrolling 70% financial interest, have a 75% interest in the earnings and have a 50% voting interest, with our subsidiaries’ accounts and eliminated any intercompany balances between segments. We recorded the portion of SouthStar’s earnings that are recognized by our joint venture partner, Piedmont Natural Gas Company, Inc. (Piedmont), as a minority interest in our consolidated statements of income, and we recorded Piedmont’s portion of SouthStar’s capital as a minority interest in our consolidated balance sheet. We determined that SouthStar is a variable interest entity as defined in FIN 46R because:
| · | Our equal voting rights with Piedmont are not proportional to our economic obligation to absorb 75% of any losses or residual returns from SouthStar, and |
| · | SouthStar obtains substantially all its transportation capacity for delivery of natural gas through our wholly-owned subsidiary, Atlanta Gas Light Company (Atlanta Gas Light). |
Comprehensive Income
Our comprehensive income includes net income plus other comprehensive income (OCI), which includes other gains and losses affecting shareholders’ equity that GAAP excludes from net income. Such items consist primarily of unrealized gains and losses on certain derivatives and minimum pension liability adjustments.
For the six months ended June 30, 2005, our OCI decreased by $4 million from December 31, 2004, reflecting our 75% ownership interest in SouthStar’s unrealized loss associated with its cash flow hedges.
Stock-based Compensation
We have several stock-based employee compensation plans and we account for these plans under the recognition and measurement principles of Accounting Principles Board Opinion No. 25, “Accounting for Stock Issued to Employees” (APB 25) and Statement of Financial Accounting Standards (SFAS) No. 123, “Accounting for Stock-Based Compensation” (SFAS 123). For our stock option plans, we generally do not reflect stock-based employee compensation cost in net income, as options granted under those plans have an exercise price equal to the market value of the underlying common stock on the date of grant. The following table illustrates the effect on our net income and earnings per share as if we had applied the optional fair value recognition provisions of SFAS 123:
| | | Three months ended June 30, | |
In millions, except per share amounts | | 2005 | | 2004 | |
| Net income, as reported | | $ | 24 | | $ | 21 | |
| Total stock-based employee compensation expense determined under fair value-based method for all awards, net of related tax effect | | | (1 | ) | | - | |
| Pro-forma net income | | $ | 23 | | $ | 21 | |
| | | | | | | | |
| Earnings per share: | | | | | | | |
| Basic - as reported | | $ | 0.31 | | $ | 0.34 | |
| Basic - pro-forma | | $ | 0.30 | | $ | 0.34 | |
| | | | | | | | |
| Fully diluted - as reported | | $ | 0.30 | | $ | 0.33 | |
| Fully diluted - pro-forma | | $ | 0.30 | | $ | 0.33 | |
| | | Six months ended June 30, | |
In millions, except per share amounts | | 2005 | | 2004 | |
| Net income, as reported | | $ | 112 | | $ | 87 | |
| Total stock-based employee compensation expense determined under fair value-based method for all awards, net of related tax effect | | | (1 | ) | | (1 | ) |
| Pro-forma net income | | $ | 111 | | $ | 86 | |
| | | | | | | | |
| Earnings per share: | | | | | | | |
| Basic - as reported | | $ | 1.45 | | $ | 1.35 | |
| Basic - pro-forma | | $ | 1.45 | | $ | 1.33 | |
| | | | | | | | |
| Fully diluted - as reported | | $ | 1.44 | | $ | 1.33 | |
| Fully diluted - pro-forma | | $ | 1.43 | | $ | 1.31 | |
Earnings per Common Share
We compute basic earnings per common share by dividing our net income available to common shareholders by the weighted average number of common shares outstanding daily. Diluted earnings per common share reflect the potential reduction in earnings per common share that could occur when potential dilutive common shares are added to common shares outstanding.
We derive our potential dilutive common shares by calculating the number of shares issuable under restricted share units and stock options. The future issuance of shares underlying the restricted share units depends on the satisfaction of certain performance criteria. The future issuance of shares underlying the outstanding stock options depends upon whether the exercise prices of the stock options are less than the average market price of the common shares for the respective periods. The following tables show the calculation of our diluted shares, assuming restricted stock units currently earned under the plan ultimately vest and stock options currently exercisable at prices below the average market prices are exercised. Our weighted average shares outstanding increased by 12 million from the first six months of 2004 to the first six months of 2005, primarily as a result of our 11 million share equity offering completed in November 2004.
| | | Three months ended June 30, | |
In millions | | 2005 | | 2004 | |
| Denominator for basic earnings per share (1) | | | 77.1 | | | 64.8 | |
| Assumed exercise of restricted stock units and stock options | | | 0.7 | | | 0.8 | |
| Denominator for diluted earnings per share | | | 77.8 | | | 65.6 | |
| (1) | Daily weighted average shares outstanding |
| | | Six months ended June 30, | |
In millions | | 2005 | | 2004 | |
| Denominator for basic earnings per share (1) | | | 77.0 | | | 64.7 | |
| Assumed exercise of restricted stock units and stock options | | | 0.7 | | | 0.8 | |
| Denominator for diluted earnings per share | | | 77.7 | | | 65.5 | |
| (1) | Daily weighted average shares outstanding |
Acquisition Update
On November 30, 2004 we acquired NUI Corporation (NUI) for approximately $825 million, including the assumption of $709 million in debt. During the six months ended June 30, 2005, we continued to adjust our purchase price allocation for additional known items. This resulted in an increase in goodwill of $49 million primarily during the first and second quarters of 2005 principally related to pension, severance and lease adjustments. As of June 30, 2005, goodwill related to the NUI acquisition was $205 million in total, and there remains significant open items, including certain environmental matters, valuation adjustments for the sales of certain assets acquired, lease adjustments related to NUI’s corporate offices and certain tax items. We anticipate completing our allocation within a year of the acquisition, with the majority of the remaining significant adjustments to our balance sheet expected to occur during the third quarter of 2005.
During the three months ended June 30, 2005, we recorded a liability of $18 million as a result of an unfavorable long-term lease related to the former headquarters of NUI. We currently occupy a portion of the building and sublease the remainder of the office space, and are evaluating our future options with respect to the property. We arrived at the liability amount based on the committed lease payments, and by assuming a certain level of sublease revenues, including those already contractually committed as well as any anticipated amounts, and assuming a discount rate based on a credit-adjusted risk-free rate of 5.39% on the property. We will revise this liability based on our actual ability to sublease additional space in subsequent periods.
Sale of Virginia assets On April 27, 2005, we announced our agreement to sell our 50% interest in Saltville and our wholly-owned subsidiaries Virginia Gas Pipeline and Virginia Gas Storage to a subsidiary of Duke Energy Corporation (Duke), the other 50% partner in Saltville. We acquired these Virginia assets in November 2004 with our purchase of NUI. The transaction does not include Virginia Gas Distribution Company, another NUI asset, which has 270 customers and annual throughput of 240,000 dekatherms.
We will receive, subject to working capital adjustments, $62 million in cash at closing and will utilize the proceeds to repay debt and for other general corporate purposes. The transaction is not expected to have a material impact on our earnings. Closing of the transaction, which is conditional upon regulatory approvals, including approval from the Virginia State Corporation Commission, is expected by September 30, 2005.
We are marketing certain other related NUI entities for sale with buyers actively being solicited. Excluding our equity investment in Saltville, which does not qualify for treatment as either assets held for sale or discontinued operations under SFAS 144, “Accounting for the Impairment or Disposal of Long-Lived Assets,” these remaining assets and liabilities are not separately classified on the accompanying balance sheet as held for sale due to materiality.
Note 3
Recent Accounting Pronouncements
Issued but not yet adopted
SFAS 123(R) In December 2004, the FASB issued SFAS No 123(R), “Accounting for Stock Based Compensation” (SFAS 123R). SFAS 123R revises the guidance in SFAS No. 123 and supersedes APB 25 and its related implementation guidance. SFAS 123R focuses primarily on the accounting for share-based payments to employees in exchange for services, and it requires a public entity to measure and recognize compensation cost for these payments. Our share-based payments are typically in the form of stock option and restricted share unit awards. The primary change in accounting is related to the requirement to recognize compensation cost for stock option awards that was not recognized under APB 25. Compensation cost will be measured based on the fair value of the equity or liability instruments issued. For stock option awards, fair value would be estimated using an option pricing model such as the Black-Scholes model. In April 2005, the SEC voted to delay the effective date of SFAS 123R from June 30, 2005 to January 1, 2006.
SFAS 154 In June 2005, the FASB issued SFAS No. 154, “Accounting Changes and Error Corrections,” a replacement of APB Opinion No. 20 and FASB Statement No. 3. SFAS 154 requires retrospective application to prior periods’ financial statements of a voluntary change in accounting principle, unless it is impractical. Opinion No. 20 previously required that most voluntary changes in accounting principle be recognized by including, in net income, for the period of the change, the cumulative effect of changing to the newly adopted accounting principle. SFAS 154 also requires that a change in the method of depreciation, amortization, or depletion for long-lived, non-financial assets be accounted for as a change in accounting estimate that is effected by a change in accounting principle. Opinion No. 20 previously required that such a change be reported as a change in accounting principle. SFAS 154 also requires that any errors in the financial statements of a prior period shall be reported as a prior-period adjustment by restating the prior period financial statements. SFAS 154 is effective for accounting changes and corrections of errors made in fiscal years beginning after December 15, 2005. We do not currently expect this statement to have an impact on our financial statements.
Risk Management
Our enterprise risk management activities are monitored by our Risk Management Committee (RMC). The RMC is, among other things, charged with the review and enforcement of risk management policies which place limitations on the use of derivative financial instruments and physical transactions. We use the following derivative financial instruments and physical transactions to manage commodity price risks:
| · | Storage and transportation capacity transactions |
Interest Rate Swaps
To maintain an effective capital structure, it is our policy to borrow funds using a mix of fixed-rate and variable-rate debt. We have entered into interest rate swap agreements through our wholly-owned subsidiary, AGL Capital Corporation (AGL Capital), for the purpose of hedging the interest rate risk associated with our fixed-rate and variable-rate debt obligations. We designated these interest rate swaps as fair value hedges and accounted for them using the “shortcut” method prescribed by SFAS No. 133, “Accounting for Derivative Instruments and Hedging Activities” (SFAS 133), which allows us to designate derivatives that hedge exposure to changes in the fair value of a recognized asset or liability. We record the gain or loss on fair value hedges in earnings in the period of change, together with the offsetting loss or gain on the hedged item attributable to the risk being hedged.
We adjust the carrying value of each interest rate swap to its fair value at the end of each period, with an offsetting and equal adjustment to the carrying value of the debt securities whose fair value is being hedged. Consequently, our earnings are not affected negatively or positively with changes in fair value of the interest swaps each quarter. As of June 30, 2005, a notional principal amount of $175 million of these interest rate swap agreements effectively converted the interest expense associated with a portion of our senior notes and notes payable to the Trusts from fixed rates to variable rates based on an interest rate equal to the London Interbank Offered Rate (LIBOR), plus a spread determined at the swap date. The floating rate swap range for our interest rate swaps for the six months ended June 30, 2005 was 3.61% to 6.27%.
Commodity-Related Derivative Instruments
Elizabethtown Gas A program mandated by the New Jersey Board of Public Utilities requires Elizabethtown Gas to utilize certain derivatives to hedge the impact of market fluctuations of natural gas prices associated with natural gas supply and inventory purchases. Pursuant to SFAS 133, such derivative products are marked-to-market each reporting period. In accordance with regulatory requirements, realized gains and losses related to these derivatives are reflected in purchased gas costs and ultimately included in billings to customers. Unrealized gains and losses are reflected as a regulatory asset (loss) or liability (gain), as appropriate, on our consolidated balance sheet. As of June 30, 2005, Elizabethtown Gas had entered into New York Mercantile Exchange (NYMEX) futures contracts to purchase approximately 9.2 billion cubic feet (Bcf) of natural gas. Approximately 90% of these contracts have duration of one year or less, and none of these contracts extends beyond November 2006.
Sequent We are exposed to risks associated with changes in the market price of natural gas. Our wholly-owned energy trading and marketing subsidiary, Sequent Energy Management, L.P. (Sequent), uses derivative financial instruments to reduce our exposure to the risk of changes in the prices of natural gas. The fair value of these derivative financial instruments reflects the estimated amounts that we would receive or pay to terminate or close the contracts at the reporting date, taking into account the current unrealized gains or losses on open contracts. We use external market quotes and indices to value substantially all of the financial instruments we utilize.
We mitigate substantially all of the commodity price risk associated with Sequent’s natural gas portfolio by locking in the economic margin at the time we enter into natural gas purchase transactions for our stored natural gas. We purchase natural gas for storage when the difference in the current market price we pay to buy natural gas plus the cost to store the natural gas is less than the market price we can receive in the future, resulting in a positive net profit margin. We use NYMEX futures contracts and other over the counter derivatives to sell natural gas at that future price to substantially lock in the profit margin we will ultimately realize when the stored gas is actually sold. These futures contracts meet the definition of derivatives under SFAS 133 and are recorded at fair value and marked-to-market in our condensed consolidated balance sheet, with changes in fair value recorded in earnings in the period of change. The purchase, storage and sale of natural gas are accounted for on a historical cost basis rather than on the mark-to-market basis we utilize for the derivatives used to mitigate the commodity price risk associated with our storage portfolio. This difference in accounting can result in volatility in our reported net income, even though the economic margin is essentially unchanged from the date the transactions were consummated.
At June 30, 2005, Sequent’s commodity-related derivative financial instruments, which exclude interest rate swaps, represented purchases (long) of 561 Bcf with maximum maturities less than 2 years. In addition, Sequent’s financial instruments included sales (short) of 589 Bcf with approximately 99% of these scheduled to mature in less than 2 years and the remaining 1% in 3-9 years. Sequent’s unrealized losses were $9 million for the six months ended June 30, 2005, and its unrealized gains were $15 million for the six months ended June 30, 2004.
SouthStar The commodity-related derivative financial instruments (futures, options and swaps) used by SouthStar manage exposures arising from changing commodity prices. SouthStar’s objective for holding these derivatives is to utilize the most effective method to reduce or eliminate the impacts of this exposure. A portion of SouthStar’s derivative transactions are designated as cash flow hedges under SFAS 133. Derivative gains or losses arising from cash flow hedges are recorded in OCI and are reclassified into earnings in the same period as the settlement of the underlying hedged item. Any hedge ineffectiveness, defined as when the gains or losses on the hedging instrument do not perfectly offset the losses or gains on the hedged item, is recorded in our cost of gas on our condensed consolidated income statement in the period in which it occurs. SouthStar currently has minimal hedge ineffectiveness. The remainder of SouthStar’s derivative instruments does not meet the hedge criteria under SFAS 133. Therefore, changes in their fair value are recorded in earnings in the period of change.
At June 30, 2005, the fair value of these SouthStar derivatives was reflected in our condensed consolidated financial statements as an asset and an equal liability of $6 million. The maximum maturity of open positions is 1 year and represents purchases of 6 Bcf and sales of 12 Bcf.
Concentration of Credit Risk
Wholesale Services Sequent has a concentration of credit risk for services it provides to marketers and to utility and industrial customers. This credit risk is measured by 30-day receivable exposure plus forward exposure, which is highly concentrated in 20 of its customers. Sequent evaluates the credit risk of its customers using the Standard & Poor’s Rating Services (S&P) equivalent credit rating which is determined by a process of converting the lower of the S&P or Moody’s Investor Service (Moody’s) rating to an internal rating ranging from 9.00 to 1.00, with 9.00 being equivalent to AAA/Aaa by S&P and Moody’s and 1.00 being equivalent to D or Default by S&P and Moody’s. A customer that does not have an external rating is assigned an internal rating based on Sequent’s analysis of the strength of its financial ratios. At June 30, 2005, Sequent’s top 20 customers represented approximately 61% of the total credit exposure of $211 million, derived by adding the top 20 customers’ exposures and dividing by the total of Sequent’s exposures. Sequent’s customers or the customers’ guarantors had a weighted average S&P equivalent rating of A- at June 30, 2005.
The weighted average credit rating is obtained by multiplying each customer’s assigned internal rating by its credit exposure and the individual results are then summed for all counterparties. That total is divided by the aggregate total exposure. This numeric value is converted to an S&P equivalent.
Sequent has established credit policies to determine and monitor the creditworthiness of counterparties, as well as the quality of pledged collateral. When Sequent is engaged in more than one outstanding derivative transaction with the same counterparty and it also has a legally enforceable netting agreement with that counterparty, the “net” mark-to-market exposure represents the netting of the positive and negative exposures with that counterparty and a reasonable measure of Sequent’s credit risk. Sequent also uses other netting agreements with certain counterparties with whom it conducts significant transactions.
Note 5
Regulatory Assets and Liabilities
We recorded regulatory assets and liabilities in our consolidated balance sheets in accordance with SFAS No. 71, “Accounting for the Effects of Certain Types of Regulation.” Our regulatory assets and liabilities, as well as the liabilities associated with our unrecovered pipeline replacement program (PRP) costs and unrecovered environmental remediation costs (ERC), are summarized in the table below:
In millions | | June 30, 2005 | | Dec. 31, 2004 | | June 30, 2004 | |
Regulatory assets | | | | | | | |
| Unrecovered PRP costs | | $ | 357 | | $ | 361 | | $ | 405 | |
| Unrecovered ERC | | | 212 | | | 200 | | | 167 | |
| Unrecovered postretirement benefit costs | | | 14 | | | 14 | | | 9 | |
| Unrecovered seasonal rates | | | - | | | 11 | | | - | |
| Unamortized purchased gas adjustment | | | 2 | | | 5 | | | - | |
| Regulatory tax asset | | | 1 | | | 2 | | | 3 | |
| Other | | | 6 | | | 20 | | | 7 | |
| Total regulatory assets | | $ | 592 | | $ | 613 | | $ | 591 | |
Regulatory liabilities | | | | | | | | | | |
| Accumulated removal costs | | $ | 92 | | $ | 94 | | $ | 104 | |
| Unamortized investment tax credit | | | 20 | | | 20 | | | 18 | |
| Deferred seasonal rates | | | 9 | | | - | | | 9 | |
| Deferred purchased gas adjustment | | | 57 | | | 37 | | | 36 | |
| Regulatory tax liability | | | 11 | | | 14 | | | 14 | |
| Other | | | - | | | 18 | | | 2 | |
| Total regulatory liabilities | | | 189 | | | 183 | | | 183 | |
Associated liabilities | | | | | | | | | | |
| PRP costs | | | 318 | | | 327 | | | 375 | |
| ERC | | | 96 | | | 90 | | | 62 | |
| Total associated liabilities | | | 414 | | | 417 | | | 437 | |
| Total regulatory and associated liabilities | | $ | 603 | | $ | 600 | | $ | 620 | |
| | | | | | | | | | | |
Our regulatory assets and liabilities are described in Note 5 to our Consolidated Financial Statements in our 2004 Annual Report on Form 10-K, as updated in our Current Report on Form 8-K, filed with the SEC on July 28, 2005. The following represent significant changes to our regulatory assets and liabilities during the six months ended June 30, 2005:
Pipeline Replacement Program
The PRP, ordered by the Georgia Public Service Commission (Georgia Commission), requires that Atlanta Gas Light replace all bare steel and cast iron pipe in its system within a 10-year period that began October 1, 1998. October 1, 2004 marked the beginning of the seventh year of the original 10-year PRP.
On June 10, 2005, Atlanta Gas Light and the Georgia Commission entered into a Settlement Agreement that, among other things, extends Atlanta Gas Light’s PRP by five years to require that all replacements be completed by December 2013, with the timing of such replacements to be subsequently determined through discussions with Georgia Commission staff. Under the Settlement Agreement, rates charged to customers will remain unchanged through April 30, 2010, but Atlanta Gas Light will recognize reduced base rate revenues of $5 million on an annual basis through April 30, 2010. The five-year total reduction in recognized base rate revenues of $25 million will be applied to the amount of costs incurred to replace pipe and subsequently recovered from customers.
The Settlement Agreement also allows Atlanta Gas Light to recover through the PRP $4.3 million of the $32 million capital costs associated with its purchase of 250 miles of pipeline in central Georgia from Southern Natural Gas (SNG), a subsidiary of El Paso Corporation. The remaining capital costs are included in Atlanta Gas Light’s rate base and collected through base rates.
Environmental Remediation Costs
We are subject to federal, state and local laws and regulations governing environmental quality and pollution control. These laws and regulations require us to remove or remedy the effect on the environment of the disposal or release of specified substances at current and former operating sites.
Atlanta Gas Light The presence of coal tar and certain other by-products of a natural gas manufacturing process used to produce natural gas prior to the 1950s has been identified at or near 13 former Atlanta Gas Light operating sites in Georgia and Florida. Atlanta Gas Light has active environmental remediation or monitoring programs in effect at 10 of these sites. Two sites in Florida are currently in the investigation or preliminary engineering design phase, and one Georgia site has been deemed compliant with state standards, subject to approval of a continuing action plan. The required soil remediation at our remaining Georgia sites is scheduled to be completed by August 2005. As of June 30, 2005, Atlanta Gas Light’s remediation program was approximately 96% complete.
Atlanta Gas Light has historically reported estimates of future remediation costs for these former sites based on probabilistic models of potential costs. These estimates are reported on an undiscounted basis. As cleanup options and plans mature and cleanup contracts are entered into, Atlanta Gas Light is increasingly able to provide conventional engineering estimates of the likely costs of many elements at its former sites. These estimates contain various engineering uncertainties, and Atlanta Gas Light continuously attempts to refine and update these engineering estimates.
Our current engineering estimate projects costs associated with Atlanta Gas Light’s engineering estimates and in-place contracts to be $21 million. This is a reduction of $41 million from last year’s estimate of projected engineering and in-place contracts, resulting from $42 million of program expenditures incurred in the twelve months ended March 31, 2005.
For those remaining elements of Atlanta Gas Light’s environmental remediation program where it is unable to perform engineering cost estimates at the current state of investigation, considerable variability remains in the estimates for future remediation costs. For these elements, the current estimate for the remaining cost of future actions at these former operating sites is $17 million, which may increase should additional active measures for groundwater be required. Atlanta Gas Light estimates certain other costs related to administering the remediation program and remediation of sites currently in the investigation phase. To date, Atlanta Gas Light estimates the administrative costs to be $2 million.
For those Florida sites currently in the investigation phase, Atlanta Gas Light’s estimate for remediation is $4 million to $11 million. This estimate is based on preliminary data received during 2004 and 2005 with respect to the existence of contamination at those sites.
The liability does not include other potential expenses, such as unasserted property damage claims, personal injury or natural resource damage claims, unbudgeted legal expenses or other costs for which Atlanta Gas Light may be held liable but with respect to which it cannot reasonably estimate an amount. As of June 30, 2005, the remediation expenditures expected to be incurred over the next 12 months are reflected as a current liability of $10 million.
The ERC liability is included in a corresponding regulatory asset, which is a combination of accrued ERC and unrecovered cash expenditures for investigation and cleanup costs. Atlanta Gas Light has three ways of recovering investigation and cleanup costs. First, the Georgia Commission has approved an ERC recovery rider. The ERC recovery mechanism allows for recovery of expenditures over a five-year period subsequent to the period in which the expenditures are incurred. Atlanta Gas Light expects to collect $24 million in revenues over the next 12 months under the ERC recovery rider, which is reflected as a current asset.
The second way to recover costs is by exercising the legal rights Atlanta Gas Light believes it has to recover a share of its costs from other potentially responsible parties, typically former owners or operators of these sites. The third way to recover costs is from the receipt of net profits from the sale of remediated property. There were no material recoveries from potentially responsible parties or remediated property sales during the six months ended June 30, 2005.
Elizabethtown Gas In New Jersey, Elizabethtown Gas is currently conducting remedial activities with oversight from the New Jersey Department of Environmental Protection. Although the actual total cost of future environmental investigation and remediation efforts cannot be estimated with precision, based on probabilistic models similar to those used at Atlanta Gas Light’s former operating sites, the range of reasonably probable costs is $57 million to $109 million. As of June 30, 2005, no value within this range is a better estimate than any other value, so we have recorded a liability equal to the low end of that range, or $57 million.
Elizabethtown Gas’ prudently incurred remediation costs for the New Jersey properties have been authorized by the New Jersey Board of Public Utilities to be recoverable in rates through its Remediation Adjustment Clause. As a result, Elizabethtown Gas has recorded a regulatory asset of approximately $64 million, inclusive of interest, as of June 30, 2005, reflecting the future recovery of both incurred costs and accrued carrying charges. Elizabethtown Gas has also been successful in recovering a portion of remediation costs incurred in New Jersey from its insurance carriers and continues to pursue additional recovery.
Other We also own a former NUI remediation site in Elizabeth City, North Carolina, which is subject to an order by the North Carolina Department of Energy and Natural Resources. We currently have only limited information regarding environmental impacts at the Elizabeth City site, and therefore quantitative cost estimates can be made only for limited components of a site cleanup, such as investigative efforts. However, experience at other similar sites suggests that costs for remediation of this site will likely range from $4 million to $19 million. As of June 30, 2005, we have recorded a liability of $4 million related to this site.
There is one other site in North Carolina where investigation and remediation is probable, although no regulatory order exists and we do not believe costs associated with this site can be reasonably estimated. In addition, there are as many as six other sites with which NUI had some association, although no basis for liability has been asserted, and accordingly we have not accrued any remediation liability. There are currently no cost recovery mechanisms for the environmental remediation sites in North Carolina. As a result, any change in estimate occurring after our purchase price allocation period ends could impact our reported earnings in future periods.
We are continually evaluating the estimates at Elizabethtown Gas and at NUI’s other former remediation sites. The differences between our estimates and actual costs could be significant, and any such difference within one year of the acquisition of NUI could affect the amount ultimately recorded as part of our purchase price of NUI.
Pension and Other Postretirement Benefits
Pension Benefits We sponsor two defined benefit retirement plans for our eligible employees: the AGL Resources Inc. Retirement Plan and the NUI Corporation Retirement Plan. A defined benefit plan specifies the amount of benefits an eligible participant eventually will receive using information about the participant. The following are the cost components of our two pension plans for the periods indicated:
| | | Three months ended | |
| | | June 30, | |
In millions | | 2005 | | 2004 | |
| Service cost | | $ | 2 | | $ | 1 | |
| Interest cost | | | 6 | | | 5 | |
| Expected return on plan assets | | | (8 | ) | | (6 | ) |
| Net amortization | | | - | | | - | |
| Recognized actuarial loss | | | 2 | | | 1 | |
| Net annual cost | | $ | 2 | | $ | 1 | |
| | | Six months ended | |
| | | June 30, | |
In millions | | 2005 | | 2004 | |
| Service cost | | $ | 5 | | $ | 3 | |
| Interest cost | | | 13 | | | 10 | |
| Expected return on plan assets | | | (16 | ) | | (12 | ) |
| Net amortization | | | (1 | ) | | (1 | ) |
| Recognized actuarial loss | | | 3 | | | 2 | |
| Net annual cost | | $ | 4 | | $ | 2 | |
Other Postretirement Benefits We sponsor two defined benefit postretirement health care plans for our eligible employees: the AGL Resources Inc. Postretirement Health Care Plan and the Employers’ Retirement Plan of NUI Corporation. Eligibility for these benefits is based on age and years of service. The following are the cost components of these two postretirement benefit plans for the periods indicated:
| | | Three months ended | |
| | | June 30, | |
In millions | | 2005 | | 2004 | |
| Service cost | | $ | - | | $ | 1 | |
| Interest cost | | | 2 | | | 2 | |
| Expected return on plan assets | | | (1 | ) | | (1 | ) |
| Net amortization | | | (1 | ) | | - | |
| Recognized actuarial loss | | | 1 | | | - | |
| Net annual cost | | $ | 1 | | $ | 2 | |
| | | Six months ended | |
| | | June 30, | |
In millions | | 2005 | | 2004 | |
| Service cost | | $ | 1 | | $ | 1 | |
| Interest cost | | | 3 | | | 4 | |
| Expected return on plan assets | | | (2 | ) | | (2 | ) |
| Net amortization | | | (2 | ) | | - | |
| Recognized actuarial loss | | | 1 | | | 1 | |
| Net annual cost | | $ | 1 | | $ | 4 | |
Note 7
Compensation Plans
Restricted Stock Units In general, a restricted stock unit is an award that represents the opportunity to receive a specified number of shares of company common stock, subject to the achievement of certain pre-established performance criteria.
In January 2005, we granted to a group of officers a total of 85,900 restricted stock units. The awards were made pursuant to our Amended and Restated Long-Term Incentive Plan (1999) (Incentive Plan), as amended.
The restricted stock units have a twelve-month performance measurement period. If the performance goal set forth in the restricted stock unit agreement is achieved, the performance units are converted to an equal number of shares of company common stock and thereafter are subject to the vesting schedule set forth in the restricted stock unit agreement. If the performance goal set forth in the agreement is not attained, the restricted units will be forfeited and returned to the company. The performance goal is related to management’s success in integrating its acquisitions and generating improvement in earnings from these acquired businesses.
Performance Cash Units In general, a performance cash unit award is an award that represents the opportunity to receive an incentive payment, in cash, subject to the achievement of certain pre-established performance criteria.
In January 2005, we granted performance cash units to a select group of officers pursuant to our Incentive Plan. The performance cash units represent a maximum aggregate payout of $5 million. The performance cash units have a performance measurement period that ranges from 12 to 36 months. The performance criteria relate to our internal measure of total shareholder return. Based on our anticipated performance and the related vesting schedules, as of June 30, 2005, we recorded a liability of $1 million for these performance cash units.
Note 8
Financing
Our financing consists of short and long-term debt as indicated in the following table. There have been no significant changes to our financing which was described in Note 8 to our Consolidated Financial Statements in our 2004 Annual Report on Form 10-K, as updated in our Current Report on Form 8-K filed with the SEC on July 28, 2005, other than the refinancing of our Gas Facility Revenue Bonds described below.
| | | | | | | Outstanding as of: | |
Dollars in millions | | Year(s) due | | Int. rate (1) | | June 30, 2005 | | Dec. 31, 2004 | | June 30, 2004 | |
Short-term debt | | | | | | | | | | | |
| Commercial paper | | | 2005 | | | 3.4%(2 | ) | $ | 156 | | $ | 314 | | $ | 161 | |
| Current portion of long-term debt | | | - | | | - | | | - | | | - | | | 34 | |
| Sequent line of credit | | | 2005 | | | 3.9(3 | ) | | 15 | | | 18 | | | - | |
| Current portion of capital leases | | | 2005 | | | 4.9 | | | 1 | | | 2 | | | - | |
Total short-term debt | | | | | | 3.4%(4 | ) | $ | 172 | | $ | 334 | | $ | 195 | |
Long-term debt - net of current portion | | | | | | | | | | | | | | | | |
| Medium-term notes | | | 2012-2027 | | | 6.6 - 9.1 | % | $ | 208 | | $ | 208 | | $ | 208 | |
| Senior notes | | | 2011-2034 | | | 4.5 - 7.1 | | | 975 | | | 975 | | | 525 | |
| Gas facility revenue bonds, net of unamortized issuance costs | | | 2022-2033 | | | 2.4 - 5.7 | | | 199 | | | 199 | | | - | |
| Notes payable to trusts | | | 2037-2041 | | | 8.0 - 8.2 | | | 232 | | | 232 | | | 232 | |
| Capital leases | | | 2013 | | | 4.9 | | | 7 | | | 8 | | | - | |
| Interest rate swaps | | | 2041 | | | 4.6 - 6.3 | | | - | | | 1 | | | (3 | ) |
Total long-term debt | | | | | | 5.9%(4 | ) | $ | 1,621 | | $ | 1,623 | | $ | 962 | |
| | | | | | | | | | | | | | | | | |
Total short-term and long-term debt | | | | | | 5.6%(4 | ) | $ | 1,793 | | $ | 1,957 | | $ | 1,157 | |
| (2) | The daily weighted average rate was 2.7% for the six months ended June 30, 2005. |
| (3) | The daily weighted average rate was 3.2% for the six months ended June 30, 2005. |
| (4) | Weighted average interest rate, including interest rate swaps if applicable and excluding debt issuance and other financing related costs. |
Gas Facility Revenue Bonds On April 19, 2005, our wholly-owned subsidiary Pivotal Utility Holdings, Inc. (Pivotal Utility) refinanced $20 million of its Gas Facility Revenue Bonds due October 1, 2024. The original bonds had a fixed interest rate of 6.4% per year and were refunded with $20 million of adjustable rate Gas Facility Revenue Bonds. The maturity date of these bonds remains October 1, 2024. The new bonds were issued at an initial annual interest rate of 2.8% and initially have a 35-day auction period where the interest rate will adjust every 35 days.
On May 5, 2005, Pivotal Utility refinanced an additional $47 million in Gas Facility Revenue Bonds due October 1, 2022 and bearing interest at an annual fixed rate of 6.35%. The new bonds were issued at an initial annual interest rate of 2.9% and initially have a 35-day auction period where the interest rate will adjust every 35 days. The maturity date remains October 1, 2022.
Note 9
Commitments and Contingencies
Contractual Obligations and Commitments We have incurred various contractual obligations and financial commitments in the normal course of our operations and financing activities. Contractual obligations include future cash payments required under existing contractual arrangements, such as debt and lease agreements. These obligations may result from both general financing activities and from commercial arrangements that are directly supported by related revenue-producing activities. There were no significant changes to our contractual obligations which were described in Note 10 to our Consolidated Financial Statements in our 2004 Annual Report on Form 10-K, as updated in our Current Report on Form 8-K, filed with the SEC on July 28, 2005.
SouthStar has natural gas purchase commitments related to the supply of minimum natural gas volumes to its customers. These commitments are priced on an index plus premium basis. At June 30, 2005, SouthStar had obligations under these arrangements for 8 Bcf through December 31, 2005. SouthStar also had capacity commitments related to the purchase of transportation rights on interstate pipelines.
We have also incurred various contingent financial commitments in the normal course of business. The following table illustrates our expected contingent financial commitments representing obligations that become payable only if certain pre-defined events occur, such as financial guarantees, reflecting the maximum potential amount of future payments that could be required of us as of June 30, 2005:
| | | | | Commitments due before December 31, | |
| | | | | | | 2006 & | | 2008 & | | 2010 & | |
In millions | | Total | | 2005 | | 2007 | | 2009 | | thereafter | |
| Guarantees (1) | | $ | 7 | | $ | 7 | | $ | - | | $ | - | | $ | - | |
| Standby letters of credit, performance / surety bonds | | | 20 | | | 17 | | | 3 | | | - | | | - | |
| Total | | $ | 27 | | $ | 24 | | $ | 3 | | $ | - | | $ | - | |
| (1) We provide guarantees on behalf of SouthStar. We guarantee 70% of SouthStar's obligations to SNG, under certain agreements between the parties, up to a maximum of $7 million if SouthStar fails to make payments to SNG. |
Litigation We are involved in litigation arising in the normal course of business. There has been no significant change in the litigation which was described in Note 10 to our Consolidated Financial Statements in our 2004 Annual Report on Form 10-K, as updated in our Current Report on Form 8-K, filed with the SEC on July 28, 2005. We believe the ultimate resolution of such litigation will not have a material adverse effect on our consolidated financial position, results of operations or cash flows.
Note 10
Segment Information
Prior to 2005 our business was organized into three operating segments based on similarities in economic characteristics, products and services, types of customers, methods of distribution and regulatory environments as well as the manner in which we manage these segments and our internal management information flows.
Beginning in 2005, we added an additional segment, retail energy operations, which consists of the operations of SouthStar, our retail gas marketing subsidiary that conducts business primarily in Georgia. We added this segment due to our application of accounting guidance in SFAS No. 131, “Disclosures About Segments of an Enterprise and Related Information” (SFAS 131) in consideration of the impact of our acquisitions of NUI and Jefferson Island Storage & Hub, LLC (Jefferson Island) in the fourth quarter of 2004. The addition of this segment also is consistent with our desire to provide transparency and visibility to SouthStar on a stand-alone basis and to provide additional visibility to the remaining businesses in the energy investments segment, principally Jefferson Island and Pivotal Propane of Virginia, Inc. (Pivotal Propane), which are more closely related in structure and operation.
We have recast the segment information for the three and six months ended June 30, 2004 in accordance with the guidance set forth in SFAS 131 as shown in the tables below. Additionally, we have recast the segment information for the years ended December 31, 2004, 2003 and 2002 in our Current Report on Form 8-K, filed with the SEC on July 28, 2005.
Our four operating segments are now as follows:
| · | Distribution operations consists primarily of: |
| o | Atlanta Gas Light Company |
| o | Virginia Natural Gas Company |
| o | Chattanooga Gas Company |
| · | Retail energy operations consists of SouthStar |
| · | Wholesale services consists of Sequent |
| · | Energy investments consists primarily of: |
| o | Pivotal Jefferson Island |
| o | Pivotal Propane of Virginia, Inc. |
| o | 50% ownership interest in Saltville Gas Storage Company, LLC |
We treat corporate, our fifth segment, as a non-operating business segment, and it includes AGL Resources Inc., AGL Services Company, Pivotal Energy Development, nonregulated financing subsidiaries and the effect of intercompany eliminations. We eliminated intersegment sales for the three and six months ended June 30, 2005 and 2004 from our condensed consolidated statements of income.
We evaluate segment performance based on earnings before interest and taxes (EBIT), which includes the effects of corporate expense allocations. EBIT is a non-GAAP measure that includes operating income, other income, minority interest and gain on sales of assets. Items that are not included in EBIT are financing costs, including interest and debt expense, income taxes and the cumulative effect of changes in accounting principles, each of which is evaluated at the consolidated level. Management believes EBIT is useful to investors as a measurement of our operating segments’ performance because it can be used to evaluate the effectiveness of our businesses from an operational perspective, exclusive of the costs to finance those activities and exclusive of income taxes, neither of which is directly relevant to the efficiency of those operations.
You should not consider EBIT as an alternative to, or a more meaningful indicator of our operating performance than, operating income or net income as determined in accordance with GAAP. In addition, our EBIT may not be comparable to a similarly titled measure of another company. The reconciliations of EBIT to operating income and net income for the three and six months ended June 30, 2005 and 2004 are presented in the following table.
| | | Three months ended June 30, | | Six months ended June 30, | |
In millions | | 2005 | | 2004 | | 2005 | | 2004 | |
| Operating revenues | | $ | 431 | | $ | 294 | | $ | 1,343 | | $ | 945 | |
| Operating expenses | | | 365 | | | 241 | | | 1,096 | | | 759 | |
| Operating income | | | 66 | | | 53 | | | 247 | | | 186 | |
| Other income | | | 1 | | | 1 | | | 2 | | | 2 | |
| Minority interest | | | (3 | ) | | (3 | ) | | (16 | ) | | (14 | ) |
| EBIT | | | 64 | | | 51 | | | 233 | | | 174 | |
| Interest expense | | | 26 | | | 16 | | | 52 | | | 32 | |
| Earnings before income taxes | | | 38 | | | 35 | | | 181 | | | 142 | |
| Income taxes | | | 14 | | | 14 | | | 69 | | | 55 | |
| Net income | | $ | 24 | | $ | 21 | | $ | 112 | | $ | 87 | |
Summarized income statement information and capital expenditures by segment for the periods indicated are shown in the following tables:
Three months ended June 30, 2005 | | | | | | | |
In millions | | Distribution operations | | Retail energy operations | | Wholesale services | | Energy investments | | Corporate and intersegment eliminations | | Consolidated AGL Resources | |
| Operating revenues from external parties | | $ | 245 | | $ | 160 | | $ | 9 | | $ | 17 | | $ | - | | $ | 431 | |
| Intersegment revenues (1) | | | 48 | | | - | | | - | | | - | | | (48 | ) | | - | |
| Total revenues | | | 293 | | | 160 | | | 9 | | | 17 | | | (48 | ) | | 431 | |
| Operating expenses | | | | | | | | | | | | | | | | | | | |
| Cost of gas | | | 114 | | | 136 | | | - | | | 5 | | | (46 | ) | | 209 | |
| Operation and maintenance | | | 91 | | | 14 | | | 6 | | | 5 | | | (3 | ) | | 113 | |
| Depreciation and amortization | | | 29 | | | 1 | | | 1 | | | 1 | | | 1 | | | 33 | |
| Taxes other than income taxes | | | 8 | | | - | | | - | | | 1 | | | 1 | | | 10 | |
| Total operating expenses | | | 242 | | | 151 | | | 7 | | | 12 | | | (47 | ) | | 365 | |
| Operating income (loss) | | | 51 | | | 9 | | | 2 | | | 5 | | | (1 | ) | | 66 | |
| Other income | | | 1 | | | - | | | - | | | - | | | - | | | 1 | |
| Minority interest | | | - | | | (3 | ) | | - | | | - | | | - | | | (3 | ) |
| EBIT | | $ | 52 | | $ | 6 | | $ | 2 | | $ | 5 | | $ | (1 | ) | $ | 64 | |
| | | | | | | | | | | | | | | | | | | | |
| Capital expenditures | | $ | 37 | | $ | 1 | | $ | - | | $ | 3 | | $ | 6 | | $ | 47 | |
Three months ended June 30, 2004 | | | | | | | |
In millions | | Distribution operations | | Retail energy operations | | Wholesale services | | Energy investments | | Corporate and intersegment eliminations | | Consolidated AGL Resources | |
| Operating revenues from external parties | | $ | 144 | | $ | 148 | | $ | 1 | | $ | 1 | | $ | - | | $ | 294 | |
| Intersegment revenues (1) | | | 40 | | | - | | | - | | | - | | | (40 | ) | | - | |
| Total revenues | | | 184 | | | 148 | | | 1 | | | 1 | | | (40 | ) | | 294 | |
| Operating expenses | | | | | | | | | | | | | | | | | | | |
| Cost of gas | | | 44 | | | 124 | | | 1 | | | - | | | (40 | ) | | 129 | |
| Operation and maintenance | | | 66 | | | 13 | | | 5 | | | - | | | (3 | ) | | 81 | |
| Depreciation and amortization | | | 21 | | | - | | | - | | | - | | | 3 | | | 24 | |
| Taxes other than income taxes | | | 5 | | | 1 | | | - | | | - | | | 1 | | | 7 | |
| Total operating expenses | | | 136 | | | 138 | | | 6 | | | - | | | (39 | ) | | 241 | |
| Operating income (loss) | | | 48 | | | 10 | | | (5 | ) | | 1 | | | (1 | ) | | 53 | |
| Other income | | | 1 | | | - | | | - | | | 1 | | | (1 | ) | | 1 | |
| Minority interest | | | - | | | (3 | ) | | - | | | - | | | - | | | (3 | ) |
| EBIT | | $ | 49 | | $ | 7 | | $ | (5 | ) | $ | 2 | | $ | (2 | ) | $ | 51 | |
| | | | | | | | | | | | | | | | | | | | |
| Capital expenditures | | $ | 49 | | $ | 3 | | $ | 2 | | $ | 4 | | $ | - | | $ | 58 | |
Six months ended June 30, 2005 | | | | | | | |
In millions | | Distribution operations | | Retail energy operations | | Wholesale services | | Energy investments | | Corporate and intersegment eliminations | | Consolidated AGL Resources | |
| Operating revenues from external parties | | $ | 820 | | $ | 474 | | $ | 20 | | $ | 29 | | $ | - | | $ | 1,343 | |
| Intersegment revenues (1) | | | 107 | | | - | | | - | | | - | | | (107 | ) | | - | |
| Total revenues | | | 927 | | | 474 | | | 20 | | | 29 | | | (107 | ) | | 1,343 | |
| Operating expenses | | | | | | | | | | | | | | | | | | | |
| Cost of gas | | | 495 | | | 384 | | | - | | | 8 | | | (106 | ) | | 781 | |
| Operation and maintenance | | | 184 | | | 27 | | | 13 | | | 8 | | | (4 | ) | | 228 | |
| Depreciation and amortization | | | 57 | | | 1 | | | 1 | | | 3 | | | 4 | | | 66 | |
| Taxes other than income taxes | | | 17 | | | - | | | - | | | 1 | | | 3 | | | 21 | |
| Total operating expenses | | | 753 | | | 412 | | | 14 | | | 20 | | | (103 | ) | | 1,096 | |
| Operating income (loss) | | | 174 | | | 62 | | | 6 | | | 9 | | | (4 | ) | | 247 | |
| Other income | | | 1 | | | - | | | - | | | 1 | | | - | | | 2 | |
| Minority interest | | | - | | | (16 | ) | | - | | | - | | | - | | | (16 | ) |
| EBIT | | $ | 175 | | $ | 46 | | $ | 6 | | $ | 10 | | $ | (4 | ) | $ | 233 | |
| | | | | | | | | | | | | | | | | | | | |
| Capital expenditures | | $ | 109 | | $ | 1 | | $ | 2 | | $ | 6 | | $ | 12 | | $ | 130 | |
Six months ended June 30, 2004 | | | | | | | |
In millions | | Distribution operations | | Retail energy operations | | Wholesale services | | Energy investments | | Corporate and intersegment eliminations | | Consolidated AGL Resources | |
| Operating revenues from external parties | | $ | 466 | | $ | 455 | | $ | 21 | | $ | 3 | | | - | | $ | 945 | |
| Intersegment revenues (1) | | | 107 | | | - | | | - | | | - | | | (107 | ) | | - | |
| Total revenues | | | 573 | | | 455 | | | 21 | | | 3 | | | (107 | ) | | 945 | |
| Operating expenses | | | | | | | | | | | | | | | | | | | |
| Cost of gas | | | 253 | | | 375 | | | 1 | | | - | | | (107 | ) | | 522 | |
| Operation and maintenance | | | 136 | | | 26 | | | 13 | | | 2 | | | (3 | ) | | 174 | |
| Depreciation and amortization | | | 42 | | | - | | | - | | | 1 | | | 5 | | | 48 | |
| Taxes other than income taxes | | | 12 | | | 1 | | | - | | | - | | | 2 | | | 15 | |
| Total operating expenses | | | 443 | | | 402 | | | 14 | | | 3 | | | (103 | ) | | 759 | |
| Operating income (loss) | | | 130 | | | 53 | | | 7 | | | - | | | (4 | ) | | 186 | |
| Other income | | | 1 | | | - | | | - | | | 2 | | | (1 | ) | | 2 | |
| Minority interest | | | - | | | (14 | ) | | - | | | - | | | - | | | (14 | ) |
| EBIT | | $ | 131 | | $ | 39 | | $ | 7 | | $ | 2 | | | (5 | ) | $ | 174 | |
| | | | | | | | | | | | | | | | | | | | |
| Capital expenditures | | $ | 85 | | $ | 6 | | $ | 5 | | $ | 7 | | $ | 1 | | $ | 104 | |
| (1) | Intersegment revenues - Wholesale services records its energy marketing and risk management revenues on a net basis. The following table provides information regarding wholesale services’ gross revenues from distribution operations and total gross revenues: |
| | | Three months ended June 30, | | Six months ended June 30, | |
In millions | | 2005 | | 2004 | | 2005 | | 2004 | |
| Third-party gross revenues | | $ | 1,186 | | $ | 1,013 | | $ | 2,469 | | $ | 2,056 | |
| Intersegment revenues | | | 162 | | | 101 | | | 249 | | | 197 | |
| Total gross revenues | | $ | 1,348 | | $ | 1,114 | | $ | 2,718 | | $ | 2,253 | |
Balance sheet information at June 30, 2005 and 2004 and December 31, 2004 by segment is shown in the following tables:
As of June 30, 2005 | | | | | | | | | | | | | |
In millions | | Distribution operations | | Retail energy operations | | Wholesale services | | Energy investments | | Corporate and intersegment eliminations (2) | | Consolidated AGL Resources | |
| | | | | | | | | | | | | | |
| Goodwill | | $ | 386 | | $ | 1 | | $ | - | | $ | 14 | | $ | - | | $ | 401 | |
| Identifiable assets (1) | | $ | 4,585 | | $ | 169 | | $ | 653 | | $ | 319 | | $ | (321 | ) | $ | 5,405 | |
| Investment in joint ventures | | | 35 | | | - | | | - | | | 28 | | | (23 | ) | | 40 | |
| Total assets | | $ | 4,620 | | $ | 169 | | $ | 653 | | $ | 347 | | $ | (344 | ) | $ | 5,445 | |
As of December 31, 2004 | | | | | | | | | | | | | |
In millions | | Distribution operations | | Retail energy operations | | Wholesale services | | Energy investments | | Corporate and intersegment eliminations (2) | | Consolidated AGL Resources | |
| | | | | | | | | | | | | | |
| Goodwill | | $ | 340 | | $ | - | | $ | - | | $ | 14 | | $ | - | | $ | 354 | |
| Identifiable assets (1) | | $ | 4,386 | | $ | 244 | | $ | 696 | | $ | 386 | | $ | (86 | ) | $ | 5,626 | |
| Investment in joint ventures | | | - | | | - | | | - | | | 235 | | | (221 | ) | | 14 | |
| Total assets | | $ | 4,386 | | $ | 244 | | $ | 696 | | $ | 621 | | $ | (307 | ) | $ | 5,640 | |
As of June 30, 2004 | | | | | | | | | | | | | |
In millions | | Distribution operations | | Retail energy operations | | Wholesale services | | Energy investments | | Corporate and intersegment eliminations (2) | | Consolidated AGL Resources | |
| | | | | | | | | | | | | | |
| Goodwill | | $ | 177 | | $ | - | | $ | - | | $ | - | | $ | - | | $ | 177 | |
| Identifiable assets (1) | | $ | 3,297 | | $ | 163 | | $ | 546 | | $ | 128 | | $ | (124 | ) | $ | 4,010 | |
| Investment in joint ventures | | | - | | | - | | | - | | | - | | | - | | | - | |
| Total assets | | $ | 3,297 | | $ | 163 | | $ | 546 | | $ | 128 | | $ | (124 | ) | $ | 4,010 | |
| (1) | Identifiable assets are those assets used in each segment’s operations. |
| (2) | Our corporate segment’s assets consist primarily of intercompany eliminations, cash and cash equivalents and property, plant and equipment. |
CAUTIONARY STATEMENT REGARDING FORWARD-LOOKING INFORMATION
Certain expectations and projections regarding our future performance referenced in this “Management’s Discussion and Analysis of Financial Condition and Results of Operation” section and elsewhere in this report, as well as in other reports and proxy statements we file with the Securities and Exchange Commission (SEC) are forward-looking statements. Officers and other key employees may also make verbal statements to analysts, investors, regulators, the media and others that are forward-looking.
Forward-looking statements involve matters that are not historical facts, and because these statements involve anticipated events or conditions, forward-looking statements often include words such as "anticipate," "assume," "can," "could," "estimate," "expect," "forecast," "future," "indicate," "intend," "may," "plan," "predict," "project, "seek," "should," "target," "will," "would," or similar expressions. Our expectations are not guarantees and are based on currently available competitive, financial and economic data along with our operating plans. While we believe that our expectations are reasonable in view of the currently available information, our expectations are subject to future events, risks and uncertainties, and there are several factors - many beyond our control - that could cause results to differ significantly from our expectations. Such events, risks and uncertainties include, but are not limited to, changes in price, supply and demand for natural gas and related products, impact of changes in state and federal legislation and regulation, actions taken by government agencies on rates and other matters, concentration of credit risk, utility and energy industry consolidation, impact of acquisitions and divestitures, direct or indirect effects on AGL Resources' business, financial condition or liquidity resulting from a change in our credit ratings or the credit ratings of our counterparties or competitors, interest rate fluctuations, financial market conditions and general economic conditions, uncertainties about environmental issues and the related impact of such issues, impacts of changes in weather upon the temperature-sensitive portions of the business, acts of war or terrorism, and other factors can be found in our filings with the SEC.
We caution readers that, in addition to the important factors described elsewhere in this report, the factors set forth in our 2004 Annual Report on Form 10-K, as updated in our Current Report on Form 8-K filed with the SEC on July 28, 2005 under “Management’s Discussion and Analysis of Financial Condition and Results of Operations” under the caption “Risk Factors,” among others, could cause our business, results of operations or financial condition in 2005 and thereafter to differ significantly from those expressed in any forward-looking statements. There also may be other factors not described in this report that could cause results to differ significantly from our expectations.
Forward-looking statements are only as of the date they are made, and we do not undertake any obligation to update these statements to reflect subsequent changes.
We are a Fortune 1000 energy services holding company whose principal business is the distribution of natural gas in six states - Florida, Georgia, Maryland, New Jersey, Tennessee and Virginia. Our six utilities serve more than 2.3 million end-use customers, making us the largest distributor of natural gas in the Southeast and mid-Atlantic regions of the United States based on customer count. We also are involved in various related businesses, including retail natural gas marketing to end-use customers in Georgia; natural gas asset management and related logistics activities for our own utilities as well as for other non-affiliated companies; natural gas storage arbitrage and related activities; operation of high-deliverability underground natural gas storage assets; and construction and operation of telecommunications conduit and fiber infrastructure within select metropolitan areas. We manage these businesses through four operating segments - distribution operations, retail energy operations, wholesale services and energy investments - and a non-operating corporate segment.
The distribution operations segment is the largest component of our business and is regulated by regulatory agencies in six states. These agencies approve rates designed to provide us the opportunity to generate revenues to recover the cost of natural gas delivered to our customers and our fixed and variable costs such as depreciation, interest, maintenance and overhead costs, and to earn a reasonable return for our shareholders. With the exception of Atlanta Gas Light Company (Atlanta Gas Light), our largest utility, the earnings of our regulated utilities are weather-sensitive to varying degrees. Although various regulatory mechanisms provide a reasonable opportunity to recover our fixed costs regardless of volumes sold, the effect of weather manifests itself in terms of higher earnings during periods of colder weather and lower earnings with warmer weather. Our retail energy operations segment, which consists of SouthStar Energy Services LLC (SouthStar), also is weather sensitive and uses a variety of hedging strategies to mitigate potential weather impacts.
We derived approximately 95% of our earnings before interest and taxes (EBIT) during the six months ended June 30, 2005 from our regulated natural gas distribution business and from the sale of natural gas to end-use customers in Georgia by SouthStar. This statistic is significant because it represents the portion of our earnings that results directly from the underlying business of supplying natural gas to retail customers. Although SouthStar is not subject to the same regulatory framework as our utilities, it is an integral part of the retail framework for providing gas service to end-use customers in the state of Georgia. For more information regarding our measurement of EBIT and the items it excludes from operating income and net income, see “Results of Operations - AGL Resources.”
The remaining 5% of our EBIT was principally derived from businesses that are complementary to our natural gas distribution business. We engage in natural gas asset management and operation of high deliverability natural gas underground storage as subordinate activities to our utility franchises. These businesses allow us to be opportunistic in capturing incremental value at the wholesale level, provide us with deepened business insight about natural gas market dynamics and facilitate our ability, in the case of asset management, to provide transparency to regulators as to how that value can be captured to benefit our utility customers through sharing arrangements. Given the volatile and changing nature of the natural gas resource base in North America and globally, we believe that participation in these related businesses strengthens our business vitality.
Industry Dynamics and Competition The natural gas industry continues to face a number of challenges related to ensuring adequate long-term supply of natural gas at affordable prices for consumers. A confluence of factors -- including higher peak demands across all customer classes, incremental demand for natural gas to fuel the production of electricity, and declining North American supply, particularly in the Gulf of Mexico region -- have resulted in sustained higher pricing levels for natural gas relative to historical averages.
These factors continue to challenge our industry to unlock new sources of natural gas supply to serve North American markets. Liquefied natural gas (LNG) continues to grow in importance as an incremental supply source to meet the expected growth in demand for natural gas. Expansion of existing LNG terminals and construction of new facilities both point toward significant import expansions throughout the rest of this decade. In addition to expansion of LNG supplies, access to previously restricted areas for natural gas drilling will be critical in meeting future supply needs. The challenge is magnified by the time lags and capital expenditures required to bring new LNG facilities and new drilling rigs online and by the absence of a comprehensive national energy policy designed to facilitate the construction and expansion process.
The natural gas distribution industry also continues to face significant competition from the electric utilities serving the residential and small commercial markets as the potential replacement of natural gas appliances with electric appliances becomes more prevalent. The primary competitive factors are the price of energy and the comfort of natural gas heating compared to electric heating and other energy sources. The increase in wholesale natural gas prices over the last several years has resulted in increases in the costs of natural gas billed to our customers and has affected, to some extent, our ability to retain customers, which remains one of our greater challenges in our southernmost utilities in 2005 and future years.
Regulatory Environment Our business goal is to become the preferred provider of gas distribution and related services in our markets by adopting the most advanced and lowest-cost business practices. We believe that we no longer can think of ourselves in terms of an insular, North American market. Global forces are at work -- both in terms of the worldwide market for our primary fuel, natural gas, and in terms of customers' demands for ever better, faster and cheaper service. This environment requires that we seek efficiencies more aggressively than ever before, and we recognize that our long-term viability depends on both our investors and our customers reaping the rewards of our efforts.
Against this backdrop, we continue to manage the ongoing challenge of operating in a regulatory environment that generally does not measure or reward, innovation and operational efficiency. In particular, traditional "cost of service" regulation, which was originally designed to simulate the actions of a competitive market, has not kept pace with the vast changes taking place in the natural gas industry, in technology utilization and in the global economy, all factors that to various degrees affect our company. The staffs of various state rate-setting agencies have argued for significantly lower rates of return on regulated investments without adequate attention to effects those lower returns might have on capital reinvestment in the company’s regulated asset base; the “opportunity cost” to customers of not providing better and more efficient services; and the disincentive to excellence in management and operations that such returns create. Much of the rate setting is done by states in adversarial proceedings where rules of evidence and due process can vary greatly among the states. As a result of these ongoing regulatory challenges, we will continue to work cooperatively with our regulators, legislators and others to seek, through rate freezes and performance-based rates, to create a framework in each jurisdiction that is more conducive to our business goals. Furthermore, we will continue to make strategic investments in energy-related businesses that either are not subject to traditional state and federal rate regulation or are subject to limited oversight in order to incrementally add value to our shareholders.
For more information regarding pending federal and state regulatory matters, see “Results of Operations - Distribution Operations” and “Results of Operations - Wholesale Services.”
Integration of NUI Corporation We have made significant progress in integrating the assets and operations of NUI Corporation (NUI), which we acquired on November 30, 2004, into our business operations. In the first and second quarters of 2005, we consolidated a number of NUI’s business technology platforms into our enterprise-wide systems, including the accounting, payroll, human resources and supply chain functions. We also consolidated the call center operation that previously served the NUI utilities into our centralized call center. The combination of system integrations and the application of our best-practice operational model in managing the NUI assets already has resulted in improvements in the metrics we use to measure our business results. Such metrics include the productivity of our field personnel, the speed of our response to customers, personal and system safety and system reliability.
AGL Services Company RestructuringAs a result of the NUI acquisition, the associated centralization of certain administrative and operational functions and our ongoing desire to operate as efficiently as possible, we began, during the first quarter of 2005, a review of certain functions within our AGL Services Company subsidiary. We expect this process to be part of an ongoing effort to optimize staffing levels and work processes across our entire company, including an ongoing review of functions within Atlanta Gas Light in part precipitated by its June 10, 2005 settlement related to base rates (see "Results of Operations - Distribution Operations" for more information).
The immediate effects of this effort are the restructuring of certain key corporate functions and the elimination of filled and vacant positions within AGL Services Company as of June 30, 2005. We expect to record a charge of approximately $3 million during the third quarter of 2005, primarily as a result of severance-related costs associated with the restructuring and elimination of the filled positions at AGL Services Company. We expect this charge to be earnings neutral in 2005, as it will be offset by payroll and benefits savings. Based on the efforts performed to date, as well as actual costs incurred to date and our original basis for the earnings guidance previously provided, we estimate the annual savings from these efforts to be in the range of $6 million to $10 million. While these savings will be reflected in the allocated costs to various business units, the most significant portion of the allocation is intended to be in our Georgia operations.
| | | July 15, 2005 | | Dec. 31, 2004 | | change | |
| Total employees | | | 2,670 | | | 2,970 | | | (10 | %) |
| Employees covered under collective bargaining agreements | | | 780 | | | 918 | | | (15 | %) |
For more information on the renewal of our collective bargaining agreements, see “Results of Operations - Distribution Operations.”
Internal Controls Section 404 of the Sarbanes-Oxley Act of 2002 and related rules of the SEC require management of public companies to assess the effectiveness of the company’s internal controls over financial reporting as of the end of each fiscal year. In our 2004 Annual Report on Form 10-K, as updated in our Current Report on Form 8-K filed with the SEC on July 28, 2005, we noted that for 2004, the scope of our assessment of our internal controls over financial reporting included all our consolidated entities except those falling under NUI, which we acquired on November 30, 2004, and Jefferson Island Storage & Hub, LLC (Jefferson Island), which we acquired on October 1, 2004. In accordance with the SEC’s published guidance, we excluded these entities from our assessment as they were acquired late in the year and it was not possible to conduct our assessment between the date of acquisition and the end of the year. SEC rules require that we complete our assessment of the internal control over financial reporting of these entities within one year from the date of acquisition.
We have initiated our efforts to assess the systems of internal control related to NUI’s and Jefferson Island’s businesses to comply with the SEC’s requirements under the Sarbanes-Oxley Act. During the first six months of 2005, we converted and integrated substantially all of NUI’s accounting systems and internal control processes into our corporate accounting systems and internal control processes. As part of this process, we are addressing and resolving the material deficiencies in internal controls for the NUI business identified by NUI’s external and internal auditors during audits performed in fiscal years 2003 and 2004, as more fully described in our 2004 Annual Report on Form 10-K as updated in our Current Report on Form 8-K filed with the SEC on July 28, 2005. While the conversion of financial systems and resulting integration of internal control processes into our internal control processes is a key step toward remediation of the control deficiencies, we still are in the process of documenting and assessing the internal control processes for the NUI businesses not covered by our internal control systems following the conversion, and we continue to remediate known deficiencies in the NUI internal controls.
Results of Operations
AGL Resources
We acquired Jefferson Island and NUI in the fourth quarter of 2004. As a result, these acquired operations are included in our results of operations for the three and six months ended June 30, 2005 but are not included for the same period in 2004.
Beginning in 2005, we added an additional segment, retail energy operations, which consists of the operations of SouthStar, our retail gas marketing subsidiary that conducts business primarily in Georgia. We added this segment due to our application of accounting guidance in Statement of Financial Accounting Standards (SFAS) No. 131, “Disclosures About Segments of an Enterprise and Related Information” (SFAS 131) in consideration of the impact of the NUI and Jefferson Island acquisitions. The addition of this segment also is consistent with our desire to provide transparency and visibility to SouthStar on a stand-alone basis and to provide additional visibility to the remaining businesses in the energy investments segment, principally Jefferson Island and Pivotal Propane of Virginia, Inc. (Pivotal Propane), which is more closely related in structure and operation.
We have recast the segment information for the three and six months ended June 30, 2004 in accordance with the guidance set forth in SFAS 131. Additionally, we have recast the segment information for the years ended December 31, 2004, 2003 and 2002 in our Current Report on Form 8-K, filed with the SEC on July 28, 2005.
Revenues We generate nearly all our operating revenues through the sale, distribution and storage of natural gas. We include in our consolidated revenues an estimate of revenues from natural gas distributed, but not yet billed, to residential and commercial customers from the latest meter reading date to the end of the reporting period. We record these estimated revenues as unbilled revenues on our consolidated balance sheet.
A significant portion of our operations is subject to variability associated with changes in commodity prices and seasonal fluctuations. During the heating season, primarily from November through March, natural gas usage and operating revenues are higher since generally more customers will be connected to our distribution systems and natural gas usage is higher in periods of colder weather than in periods of warmer weather. Commodity prices tend to be higher during this period as well. Our non-utility businesses principally use physical and financial arrangements to economically hedge the risks associated with seasonal fluctuations and changing commodity prices. Certain hedging and trading activities may require cash deposits to satisfy margin requirements. In addition, because these economic hedges do not generally qualify for hedge accounting treatment, our reported earnings for the wholesale services and retail energy operations segments reflect changes in the fair value of certain derivatives, and these values may change significantly from period to period.
Operating margin and EBIT We evaluate the performance of our operating segments using the measures of operating margin (operating revenues less cost of gas) and EBIT. We believe operating margin is a better indicator than revenues for the contribution resulting from customer growth in our distribution operations and retail energy operations segments since the cost of gas can vary significantly and is generally passed directly to our customers. We also consider operating margin to be a better indicator in our wholesale services and energy investments segments since it is a direct measure of gross profit before overhead costs. Management believes EBIT is useful to investors as a measurement of our operating segments’ performance because it can be used to evaluate the effectiveness of our businesses from an operational perspective, exclusive of the costs to finance those activities and exclusive of income taxes, neither of which affects the efficiency of the underlying operations.
Our operating margin and EBIT are not measures that are considered to be calculated in accordance with GAAP. You should not consider operating margin or EBIT an alternative to, or a more meaningful indicator of, our operating performance than operating income or net income as determined in accordance with GAAP. In addition, our operating margin or EBIT measures may not be comparable to a similarly titled measure of another company. The following are reconciliations of our operating margin and EBIT to operating income and net income, together with other consolidated financial information for the three and six months ended June 30, 2005 and 2004.
Second quarter 2005 compared to second quarter 2004
| | | Three months ended June 30, | |
In millions | | 2005 | | 2004 | | 2005 vs. 2004 | |
| Operating revenues | | $ | 431 | | $ | 294 | | | 47 | % |
| Cost of gas | | | 209 | | | 129 | | | 62 | |
| Operating margin | | | 222 | | | 165 | | | 35 | |
| Operating expenses | | | 156 | | | 112 | | | 39 | |
| Operating income | | | 66 | | | 53 | | | 25 | |
| Other income | | | 1 | | | 1 | | | - | |
| Minority interest | | | (3 | ) | | (3 | ) | | - | |
| EBIT | | | 64 | | | 51 | | | 25 | |
| Interest expense | | | 26 | | | 16 | | | 63 | |
| Earnings before income taxes | | | 38 | | | 35 | | | 9 | |
| Income taxes | | | 14 | | | 14 | | | - | |
| Net income | | $ | 24 | | $ | 21 | | | 14 | % |
| Basic earnings per common share | | $ | 0.31 | | $ | 0.34 | | | (9 | %) |
| Diluted earnings per common share | | $ | 0.30 | | $ | 0.33 | | | (6 | %) |
| Weighted average number of common shares outstanding | | | | | | | | | | |
| Basic | | | 77.1 | | | 64.8 | | | 19 | % |
| Diluted | | | 77.8 | | | 65.6 | | | 19 | % |
Segment information Operating revenues, operating margin and EBIT information for each of our segments are contained in the following table for the three months ended June 30, 2005 and 2004:
In millions | | Operating revenues | | Operating margin | | EBIT | |
2005 | | | | | | | |
| Distribution operations | | $ | 293 | | $ | 179 | | $ | 52 | |
| Retail energy operations | | | 160 | | | 24 | | | 6 | |
| Wholesale services | | | 9 | | | 9 | | | 2 | |
| Energy investments | | | 17 | | | 12 | | | 5 | |
| Corporate (1) | | | (48 | ) | | (2 | ) | | (1 | ) |
| Consolidated | | $ | 431 | | $ | 222 | | $ | 64 | |
2004 | | | | | | | | | | |
| Distribution operations | | $ | 184 | | $ | 140 | | $ | 49 | |
| Retail energy operations | | | 148 | | | 24 | | | 7 | |
| Wholesale services | | | 1 | | | - | | | (5 | ) |
| Energy investments | | | 1 | | | 1 | | | 2 | |
| Corporate (1) | | | (40 | ) | | - | | | (2 | ) |
| Consolidated | | $ | 294 | | $ | 165 | | $ | 51 | |
| (1) | Includes intercompany eliminations |
EBIT Consolidated EBIT for the quarter ended June 30, 2005 was $64 million, up $13 million from the previous year, of which $5 million relates to EBIT contributions from the acquisitions of NUI and Jefferson Island. The increase further reflects increased contributions from distribution operations (primarily Virginia Natural Gas), wholesale services, AGL Networks in energy investments and corporate. Retail energy operations’ EBIT decreased slightly as a result of increased operating expenses.
Operating Margin Operating margin increased $57 million, including a $39 million contribution from Distribution Operations, primarily as a result of the addition of the NUI assets. Also, Atlanta Gas Light Company (Atlanta Gas Light) had improved margin as a result of higher revenues for pipeline replacement and natural gas stored for marketers. Operating margin for SouthStar was flat year-over-year. Sequent’s operating margins improved primarily from affiliated asset management and origination activities. Energy Investments had a slight improvement in operating margin, resulting from the addition of Jefferson Island and improvements year-over-year for AGL Networks.
Operating Expenses Operating expenses increased $44 million for the quarter. Approximately $36 million of the increase is due to higher expenses in distribution operations ($35 million from the addition of NUI and $1 million from Atlanta Gas Light as a result of higher depreciation expense). Operating expenses were up $2 million in wholesale services, $1 million in retail energy operations, and $7 million in energy investments, primarily due to the NUI and Jefferson Island acquisitions.
Interest Expense Interest expense for the second quarter of 2005 was $26 million, compared with $16 million for the second quarter 2004. The $10 million increase reflects $8 million of additional interest expense associated with the NUI and Jefferson Island acquisition debt and $2 million from higher short-term interest rates. Average debt outstanding for the second quarter 2005 was $1.7 billion, a $0.6 billion increase over the prior year quarter’s average outstanding debt of $1.1 billion.
Shares Outstanding As a result of our 11 million share equity offering in November 2004, earnings results for the second quarter are based on weighted average shares outstanding of 77.1 million, while 2004 second quarter results were based on weighted average shares outstanding of 64.8 million.
Six months 2005 compared to six months 2004
| | | Six months ended June 30, | |
In millions | | 2005 | | 2004 | | 2005 vs. 2004 | |
| Operating revenues | | $ | 1,343 | | $ | 945 | | | 42 | % |
| Cost of gas | | | 781 | | | 522 | | | 50 | |
| Operating margin | | | 562 | | | 423 | | | 33 | |
| Operating expenses | | | 315 | | | 237 | | | 33 | |
| Operating income | | | 247 | | | 186 | | | 33 | |
| Other income | | | 2 | | | 2 | | | - | |
| Minority interest | | | (16 | ) | | (14 | ) | | (14 | ) |
| EBIT | | | 233 | | | 174 | | | 34 | |
| Interest expense | | | 52 | | | 32 | | | 63 | |
| Earnings before income taxes | | | 181 | | | 142 | | | 28 | |
| Income taxes | | | 69 | | | 55 | | | 25 | |
| Net income | | $ | 112 | | $ | 87 | | | 29 | % |
| Basic earnings per common share | | $ | 1.45 | | $ | 1.35 | | | 7 | % |
| Diluted earnings per common share | | $ | 1.44 | | $ | 1.33 | | | 8 | % |
| Weighted average number of common shares outstanding | | | | | | | | | | |
| Basic | | | 77.0 | | | 64.7 | | | 19 | % |
| Fully diluted | | | 77.7 | | | 65.5 | | | 19 | % |
Segment information Operating revenues, operating margin and EBIT information for each of our segments are contained in the following table for the six months ended June 30, 2005 and 2004:
In millions | | Operating revenues | | Operating margin | | EBIT | |
2005 | | | | | | | |
| Distribution operations | | $ | 927 | | $ | 432 | | $ | 175 | |
| Retail energy operations | | | 474 | | | 90 | | | 46 | |
| Wholesale services | | | 20 | | | 20 | | | 6 | |
| Energy investments | | | 29 | | | 21 | | | 10 | |
| Corporate (1) | | | (107 | ) | | (1 | ) | | (4 | ) |
| Consolidated | | $ | 1,343 | | $ | 562 | | $ | 233 | |
2004 | | | | | | | | | | |
| Distribution operations | | $ | 573 | | $ | 320 | | $ | 131 | |
| Retail energy operations | | | 455 | | | 80 | | | 39 | |
| Wholesale services | | | 21 | | | 20 | | | 7 | |
| Energy investments | | | 3 | | | 3 | | | 2 | |
| Corporate (1) | | | (107 | ) | | - | | | (5 | ) |
| Consolidated | | $ | 945 | | $ | 423 | | $ | 174 | |
| (1) | Includes intercompany eliminations |
EBIT Consolidated EBIT for the six months ended June 30, 2005, was $233 million, up $59 million or 34% from the previous year of which $42 million relates to EBIT contributions from the acquisitions of NUI and Jefferson Island . The increase further reflects increased contributions from Atlanta Gas Light, Virginia Natural Gas and Chattanooga Gas Company included in distribution operations, retail energy operations, AGL Networks in energy investments and Corporate. Wholesale services’ EBIT decreased slightly primarily due to increased operating expenses.
Operating Margin Operating margins increased $139 million or 33% for the six months ended June 30, 2005, from $423 million in the prior year to $562 million in 2005. The increase resulted primarily from the 2004 acquisitions of NUI and Jefferson Island Storage & Hub and improved margins from retail energy operations, AGL Networks and distribution operations as a result of higher pipeline replacement revenues and additional carrying costs charged to retail marketers in Georgia for volumes of gas in storage. Operating margin at wholesale services was relatively flat year-over-year.
Interest Expense Interest expense increased by $20 million from last year, primarily as a result of $574 million in additional debt related to the NUI and Jefferson Island acquisition ($17 million) and higher short-term interest rates ($3 million) as shown in the following table:
| | | Six months ended June 30, | |
Dollars in millions | | 2005 | | 2004 | | 2005 vs. 2004 | |
| Average debt outstanding (1) | | $ | 1,743 | | $ | 1,146 | | $ | 597 | |
| Average rate | | | 6.0 | % | | 5.6 | % | | 0.4 | % |
| (1) | Daily average of all outstanding debt. |
If, for the six months ended June 30, 2005, market interest rates on our variable rate debt (3.8% at June 30, 2005) had been 100 basis points higher or lower, our year-to-date pretax interest expense would have changed by $2 million.
Income Taxes Income taxes increased by $14 million, primarily as a result of the higher pre-tax income for the six months ended June 30, 2005. However, our effective tax rate decreased from 39% to 38%.
Distribution Operations
Distribution operations includes our natural gas local distribution utility companies, which construct, manage and maintain natural gas pipelines and distribution facilities and serve 2.3 million end-use customers. Our distribution utilities include:
| · | Atlanta Gas Light Company |
| · | Virginia Natural Gas Company, Inc. (Virginia Natural Gas) |
| · | Chattanooga Gas Company (Chattanooga Gas) |
Each utility operates subject to regulations of the state regulatory agencies in its service territories with respect to rates charged to our customers, maintenance of accounting records and various other service and safety matters. Rates charged to our customers vary according to customer class (residential, commercial or industrial) and rate jurisdiction. Rates are set at levels that should generally allow for the recovery of all prudently incurred costs, including a return on rate base sufficient to pay interest on debt and provide a reasonable return on common equity. Rate base consists generally of the original cost of utility plant in service, working capital, inventories and certain other assets; less accumulated depreciation on utility plant in service, net deferred income tax liabilities and certain other deductions. We continuously monitor the performance of our utilities to determine whether rates need to be adjusted through the regulatory process.
Atlanta Gas Light On June 10, 2005, the Georgia Public Service Commission (Georgia Commission) approved a Settlement Agreement with Atlanta Gas Light that freezes Atlanta Gas Light’s base rates billed to customers as of April 30, 2005 through April 30, 2010. The Settlement Agreement also requires Atlanta Gas Light to recognize reduced revenues of $25 million in total over the same period, to spend $2 million annually on energy conservation programs and to spend $1.5 million in increased social responsibility costs. The Settlement Agreement is effective for rates as of May 1, 2005.
Under the Settlement Agreement, Atlanta Gas Light will not seek a rate increase, nor will the Georgia Commission initiate a new rate proceeding during the agreement’s effective period. However, Atlanta Gas Light will file information equivalent to information that would be required for a general rate case on November 1, 2009, with new rates to be effective on May 1, 2010.
The Settlement Agreement extends Atlanta Gas Light’s Pipeline Replacement Program (PRP) by five years to require that all replacements be completed by December 2013, with the timing of such replacements to be subsequently determined through discussions with Georgia Commission staff. We will apply the five-year total reduction in recognized base rate revenues of $25 million to the amount of costs incurred to replace pipe and subsequently recovered from customers.
The monthly PRP charge collected from residential customers will remain at the present level of $1.29 per month through September 2008 and will be set at $1.95 per month for the remainder of the program. The Settlement Agreement includes a provision that allows for a true-up of any over or under recovery of PRP revenues that may result from a difference between PRP charges collected through fixed rates and actual PRP revenues recognized through the remainder of the program. The effect on customers’ bills during this five-year period can be seen in the table below.
| Stabilized Rates Under Settlement Agreement | |
| | | Typical monthly base charge | | Monthly PRP charge | | Total | | Change in monthly bill | |
| 2005 | | $ | 21.27 | | $ | 1.29 | | $ | 22.56 | | $ | 0.00 | |
| 2006 | | $ | 21.27 | | $ | 1.29 | | $ | 22.56 | | $ | 0.00 | |
| 2007 | | $ | 21.27 | | $ | 1.29 | | $ | 22.56 | | $ | 0.00 | |
| 2008 | | $ | 21.27 | | $ | 1.95 | | $ | 23.22 | | $ | 0.66 | |
| 2009 | | $ | 21.27 | | $ | 1.95 | | $ | 23.22 | | $ | 0.66 | |
The Settlement Agreement also establishes an authorized return on equity of 10.9% for Atlanta Gas Light, resulting in an overall rate of return of 8.53%. Prior to the settlement, Atlanta Gas Light’s authorized return on equity was 11% and its overall return was set at 9.16%.
The Settlement Agreement also allows Atlanta Gas Light to recover through the PRP $4.3 million of the $32 million in capital costs associated with its March 2005 purchase of 250 miles of pipeline in central Georgia from Southern Natural Gas Company (SNG), a subsidiary of El Paso Corporation. The acquisition will improve deliverable capacity and reliability of the storage capacity from our LNG facility in Macon to our markets in Atlanta. The remaining capital costs are included in Atlanta Gas Light’s rate base and collected through base rates.
We estimate that the annualized projected effect of the Settlement Agreement on our EBIT will be a reduction of approximately $10.5 million, which will result in reduced net income of approximately $6.5 million or $0.08 per share. The EBIT reduction consists of the $5 million reduction in recognized base rate revenues, $2 million in Energy Conservation Program expenditures, $1.5 million in increased social responsibility program costs and $2 million in lower carrying charges related to PRP expenditures to date and gas stored for marketers due to the lower authorized rate of return established in the Settlement Agreement compared to Atlanta Gas Light’s prior authorized return. The projected, partial year 2005 earnings impact is estimated to be an EBIT reduction of $7 million, resulting in a net income reduction of approximately $4.3 million or $0.06 per share for 2005.
Virginia Natural Gas In March 2005, the Virginia State Corporation Commission (Virginia Commission) staff issued a report alleging that Virginia Natural Gas’ rates were excessive and that its rates should be adjusted to produce a $15 million reduction in revenue. The staff also filed a motion requesting that Virginia Natural Gas’ rates be declared interim and subject to refund.
On April 11, 2005, Virginia Natural Gas responded to the staff’s report and motion, contested the allegations in the report and objected to the motion filed by the staff. On April 29, 2005, the Virginia Commission ordered the staff’s motion to be held in abeyance and directed Virginia Natural Gas to file a rate case by July 1, 2005.
On July 1, 2005, Virginia Natural Gas filed a Performance-Based Regulation (PBR) plan with the Virginia Commission and included the schedules required for a general rate case in support of its proposal. Under the PBR plan, Virginia Natural Gas proposes to freeze base rates at their 1996 levels for five additional years. This would provide Virginia Natural Gas’ customers an additional five years of rate stability, for a total of 14 years without a rate increase. If the Virginia Commission approves the proposal, Virginia Natural Gas will become the first Virginia natural gas utility to operate under a 1996 state law that authorized PBR plans for natural gas utilities.
Under a PBR rate plan, rates are designed using methods other than the traditional method that sets rates based on investment, return and cost-of-service as an incentive for utilities to promote cost containment, productivity and rate stability.
Also on July 1, 2005, to meet the requirements of the Virginia Commission’s April 29th order, Virginia Natural Gas filed schedules to support a $19 million per year rate increase that would be justified under a traditional rate case. This would increase base charges for gas distribution by more than $6 per month for the typical residential customer. Virginia Natural Gas is willing to forego such a rate increase in order to operate within a PBR rate plan
Based on the Virginia Commission’s scheduling order issued on July 14, 2005, current rates will not be effective on an interim basis and will stay in effect until the PBR is decided, and there is no impact on Virginia Natural Gas’ 2005 revenues. Based on this scheduling order the PBR proposal to freeze rates for another five years will be considered on the following timeframe:
| · | Virginia Commission staff will file its testimony and exhibits on or before December 15, 2005; |
| · | Virginia Natural Gas will file rebuttal testimony and exhibits on or before January 12, 2006; and |
| · | Public hearings will convene on January 24, 2006. |
If the PBR plan is not approved or is modified by the Virginia Commission in a manner that Virginia Natural Gas chooses not to accept, the Virginia Commission can take action in the general rate case filing. Virginia Natural Gas’ proposal would not affect its Virginia Commission-authorized Purchased Gas Cost, which passes gas commodity costs through to consumers. Consistent with state law, we have proposed two exceptions that allow for adjustments to frozen base rates. Virginia Natural Gas could request a rate adjustment in connection with (1) any changes in taxation by the Commonwealth of gas utility revenues and (2) any financial distress of Virginia Natural Gas beyond its control.
Elizabethtown Gas On April 26, 2005, Elizabethtown Gas presented the New Jersey Board of Public Utilities (NJBPU) with a proposal to accelerate the replacement of approximately 88 miles of 8” to 12” diameter elevated pressure cast iron pipe. Under the proposal, approximately $42 million in estimated capital costs incurred over a three year period would be recovered through a pipeline replacement rider similar to the program in effect at Atlanta Gas Light. If the program as proposed is approved, cost recovery would occur on a one-year lag basis, with collections starting on October 1, 2006 and extending through December 31, 2009, after which time the program would be rolled into base rates.
Chattanooga Gas In October 2004, the Tennessee Regulatory Authority (Tennessee Authority) denied Chattanooga Gas’ request for a $4 million rate increase, instead approving an increase of approximately $1 million based on a 10.2% return on equity and a capital structure of 35.5% common equity. In November 2004, the Tennessee Authority granted Chattanooga Gas’ motion for reconsideration of the rate increase and in December 2004 heard oral arguments on the issues of the appropriate capital structure and the return on equity to be used in setting Chattanooga Gas’ rates. In March 2005, Chattanooga Gas filed additional testimony and supporting documentation at the request of the Tennessee Authority.
On June 13, 2005, the Tennessee Authority voted 3-0 to uphold its previous order related to the reconsideration petition filed by Chattanooga Gas. Chattanooga Gas is reviewing its options with regard to the Tennessee Authority’s decision, including legal appeal and filing of a new rate case.
Florida City Gas In April 2005, approximately 53 of 77 Florida City Gas employees covered under collective bargaining agreements with Teamster’s locals 769 and 385 began a work stoppage for 39 days. The strike began on April 7, 2005 and ended on May 16, 2005 when a new agreement was reached. The new three-year agreement provides management additional tools to improve service for our customers. Florida City Gas was able to maintain the service levels at pre-strike levels throughout the strike through the use of both union and non-union workers.
Results of Operations for our distribution operations segment for the three and six months ended June 30, 2005 and 2004 are shown in the following tables:
Second quarter 2005 compared to second quarter 2004
| | | Three months ended June 30, | |
In millions | | 2005 | | 2004 | | 2005 vs. 2004 | |
| Operating revenues | | $ | 293 | | $ | 184 | | $ | 109 | |
| Cost of gas | | | 114 | | | 44 | | | 70 | |
| Operating margin | | | 179 | | | 140 | | | 39 | |
| Operation and maintenance | | | 91 | | | 66 | | | 25 | |
| Depreciation and amortization | | | 29 | | | 21 | | | 8 | |
| Taxes other than income | | | 8 | | | 5 | | | 3 | |
| Total operating expenses | | | 128 | | | 92 | | | 36 | |
| Operating income | | | 51 | | | 48 | | | 3 | |
| Other income | | | 1 | | | 1 | | | - | |
| EBIT | | $ | 52 | | $ | 49 | | $ | 3 | |
EBIT The $3 million increase in EBIT resulted primarily from an improvement in operating margin of $39 million, offset by an increase in operating expenses of $36 million. The NUI acquisition contributed approximately $2 million of the $3 million increase in EBIT.
Operating Margin The $39 million increase in operating margin was primarily the result of the addition of NUI’s operations, which contributed $36 million. The remainder was due primarily to higher operating margins at Atlanta Gas Light. The increase at Atlanta Gas Light resulted from higher PRP revenues and additional revenues from gas storage carrying charges billed to marketers. Margins for Virginia Natural Gas and Chattanooga Gas were relatively flat in 2005 as compared to last year.
Operating Expenses The increase in operating expenses of $36 million was primarily the result of the addition of NUI’s operations, which contributed $35 million. The additional increase of $1 million was due primarily to increases in depreciation expense at Atlanta Gas Light.
Six months 2005 compared to six months 2004
| | | Six months ended June 30, | |
In millions | | 2005 | | 2004 | | 2005 vs. 2004 | |
| Operating revenues | | $ | 927 | | $ | 573 | | $ | 354 | |
| Cost of gas | | | 495 | | | 253 | | | 242 | |
| Operating margin | | | 432 | | | 320 | | | 112 | |
| Operation and maintenance | | | 184 | | | 136 | | | 48 | |
| Depreciation and amortization | | | 57 | | | 42 | | | 15 | |
| Taxes other than income | | | 17 | | | 12 | | | 5 | |
| Total operating expenses | | | 258 | | | 190 | | | 68 | |
| Operating income | | | 174 | | | 130 | | | 44 | |
| Other income | | | 1 | | | 1 | | | - | |
| EBIT | | $ | 175 | | $ | 131 | | $ | 44 | |
| | | | | | | | | | | |
Metrics (includes information only for 2005 for utilities acquired from NUI) |
| Average end-use customers (in thousands) | | | 2,263 | | | 1,868 | | | 21 | % |
| Operation and maintenance expenses per customer | | $ | 81 | | $ | 73 | | | 11 | % |
| EBIT per customer | | $ | 77 | | $ | 70 | | | 10 | % |
| Throughput (in millions of dekatherms) | | | | | | | | | | |
| Firm | | | 137 | | | 113 | | | 21 | % |
| Interruptible | | | 63 | | | 52 | | | 21 | % |
| Total | | | 200 | | | 165 | | | 21 | % |
| Heating degree days | | | | | % Colder / (Warmer | ) |
| Florida | | | 401 | | | n/a | | | n/a | |
| Georgia | | | 1,595 | | | 1,660 | | | (4 | %) |
| Maryland | | | 3,255 | | | n/a | | | n/a | |
| New Jersey | | | 3,322 | | | n/a | | | n/a | |
| Tennessee | | | 1,781 | | | 1,930 | | | (8 | %) |
| Virginia | | | 2,329 | | | 2,076 | | | 12 | % |
EBIT A $44 million increase in EBIT was driven by increased operating margin of $112 million, offset by an increase in operating expenses of $68 million. The NUI acquisition contributed approximately $36 million of the $44 million increase in EBIT.
Operating Margin The increase in operating margin of $112 million was primarily a result of the addition of NUI’s operations, which contributed $107 million. The remainder resulted from the combination of higher operating margin at Atlanta Gas Light offset by lower operating margin at Virginia Natural Gas. The increase at Atlanta Gas Light was a result of higher PRP revenues and additional revenue from gas storage carrying charges billed to marketers. The decrease in operating margin for Virginia Natural Gas was due to lower usage per degree day.
Operating Expenses The increase in operating expenses of $68 million primarily resulted from the addition of NUI’s operations, which contributed $71 million. The decrease of $3 million was due primarily to decreases at Virginia Natural Gas while operating expenses at Atlanta Gas Light and Chattanooga Gas were relatively flat in 2005 compared to the same period in 2004.
Our retail energy operations segment consists of SouthStar, a joint venture owned by our subsidiary, Georgia Natural Gas Company and Piedmont Natural Gas Company, Inc. (Piedmont). SouthStar markets natural gas and related services to retail customers on an unregulated basis, principally in Georgia.
We currently own a non-controlling 70% financial interest in SouthStar, and Piedmont owns the remaining 30%. The SouthStar executive committee, which acts as the governing board, comprises six members, with three representatives from us and three from Piedmont. Under the partnership agreement, all significant management decisions require the unanimous approval of the SouthStar executive committee; accordingly, our 70% financial interest is considered to be non-controlling. Although our ownership interest in the SouthStar partnership is 70%, SouthStar's earnings are allocated 75% to us and 25% to Piedmont, under an amended and restated partnership agreement executed in March 2004.
SouthStar generates its operating margin primarily in two ways. The first is through the commodity sales of natural gas to retail customers in the residential, commercial and industrial sectors, mainly in Georgia. In addition to capturing a spread between wholesale and retail natural gas commodity prices, SouthStar also realizes a portion of its operating margin through the collection of a monthly service fee and customer late-payment fees. SouthStar’s operating margins are impacted by weather seasonality as well as by customer growth and its related market share in Georgia that traditionally ranges from 35 percent to 38 percent. SouthStar further employs a strategy to attract and retain a higher-quality customer base through the application of stringent credit requirements and enrollment of new customers with multiple natural gas burner tips. This strategy results in not only higher operating margin contributions as customers tend to utilize higher volumes of natural gas, but also higher EBIT through a reduction in bad debt expenses.
The second way in which SouthStar generates margin relates to the active management of storage positions through a variety of hedging transactions and derivative instruments, aimed at managing exposures arising from changing commodity prices. SouthStar uses these hedging instruments opportunistically to lock in economic margins (as spreads widen between periods) and minimize retail price exposure, but does not hold speculative positions.
SouthStar’s bad debt expense as a percentage of operating revenues for the second quarter of 2005 was 1.2% as compared to 1.5% for the second quarter of 2004, and 0.7% for the six months ended June 30, 2005 as compared to 1.4% for the six months ended June 30, 2004. Further, for the second quarter of 2005, SouthStar’s operating margin was comprised primarily of the commodity sale of natural gas with late payment fees contributing 14% in 2005 and 15% in 2004. On a year-to-date basis, late payment fees contributed 7% in 2005 and 9% in 2004.
SouthStar is actively seeking to improve its margin-generation capabilities by evaluating a number of growth opportunities, including incremental customer growth in Georgia and expansion of its retail model to other markets, either through organic growth or acquisition of an existing customer portfolio.
Results of operations for our retail energy operations segment for the three and six months ended June 30, 2005 and 2004 are shown in the following tables.
Second quarter 2005 compared to second quarter 2004
| | |
| | | Three months ended June 30, | |
In millions | | 2005 | | 2004 | | 2005 vs. 2004 | |
| Operating revenues | | $ | 160 | | $ | 148 | | $ | 12 | |
| Cost of sales | | | 136 | | | 124 | | | 12 | |
| Operating margin | | | 24 | | | 24 | | | - | |
| Operation and maintenance | | | 14 | | | 13 | | | 1 | |
| Depreciation and amortization | | | 1 | | | - | | | 1 | |
| Taxes other than income | | | - | | | 1 | | | (1 | ) |
| Total operating expenses | | | 15 | | | 14 | | | 1 | |
| Operating income | | | 9 | | | 10 | | | (1 | ) |
| Minority interest | | | (3 | ) | | (3 | ) | | - | |
| EBIT | | $ | 6 | | $ | 7 | | $ | (1 | ) |
EBIT EBIT decreased $1 million, primarily as a result of relatively flat operating margin coupled with higher operating expenses as discussed below.
Operating Margin Operating margin remained flat due to higher retail gas prices, partially offset by lower usage in 2005 compared to 2004 because of warmer than normal weather in 2005.
Operating Expenses Operating expenses increased $1 million in the second quarter of 2005 as compared to the same period in 2004, primarily as a result of increased marketing expenses.
Six months 2005 compared to six months 2004
| | | Six months ended June 30, | |
In millions | | 2005 | | 2004 | | 2005 vs. 2004 | |
| Operating revenues | | $ | 474 | | $ | 455 | | $ | 19 | |
| Cost of sales | | | 384 | | | 375 | | | 9 | |
| Operating margin | | | 90 | | | 80 | | | 10 | |
| Operation and maintenance | | | 27 | | | 26 | | | 1 | |
| Depreciation and amortization | | | 1 | | | - | | | 1 | |
| Taxes other than income | | | - | | | 1 | | | (1 | ) |
| Total operating expenses | | | 28 | | | 27 | | | 1 | |
| Operating income | | | 62 | | | 53 | | | 9 | |
| Minority interest | | | (16 | ) | | (14 | ) | | (2 | ) |
| EBIT | | $ | 46 | | $ | 39 | | $ | 7 | |
| | | | | | | | | | | |
Metrics | | | | | | | | | | |
| 12 month average customers (in thousands) | | | 531 | | | 542 | | | (2 | %) |
| Market share in Georgia | | | 35 | % | | 36 | % | | (3 | %) |
EBIT A $7 million increase in EBIT for the six months ended June 30, 2005 was driven primarily by a $10 million increase in operating margin, offset by a $1 million increase in operating expenses and a $2 million increase in minority interest as discussed below.
Operating Margin Operating margin increased $10 million primarily as a result of higher commodity margins partly offset by the impact of warmer weather in 2005.
Operating Expenses Operating expenses increased $1 million, reflecting higher customer care and marketing expenses, increased outside services costs.
Wholesale Services
Wholesale services consists of Sequent, our subsidiary involved in asset optimization, transportation, storage, producer and peaking services and wholesale marketing. Our asset optimization business focuses on capturing economic value from idle or underutilized natural gas assets, which are typically amassed by companies via investments in or contractual rights to natural gas transportation and storage assets. Margin is typically created in this business by participating in transactions that balance the needs of varying markets and time horizons.
Sequent provides its customers in the Eastern and Mid-Continental United States with natural gas from the major producing regions and market hubs in the country. Sequent also purchases transportation and storage capacity to meet its delivery requirements and customer obligations in the marketplace. Sequent’s customers benefit from its logistics expertise and ability to deliver natural gas at prices that are advantageous relative to other alternatives available to its end-use customers.
Asset Management Transactions Our asset management customers include our own utilities, nonaffiliated utilities, municipal utilities and large industrial customers. These customers must contract for transportation and storage services to meet their demands, and they typically contract for these services on a 365-day basis even though they may only need a portion of these services to meet their peak demands for a much shorter period. We enter into agreements with these customers, either through contract assignment or agency arrangement, whereby we use their rights to transportation and storage services during periods when they do not need them. We capture margin by optimizing the purchase, transportation, storage and sale of natural gas, and we typically either share profits with customers or pay them a fee for using their assets.
On April 1, 2005, in connection with the acquisition of NUI, Sequent commenced asset management responsibilities for Elizabethtown Gas, Florida City Gas and Elkton Gas. The following table summarizes Sequent’s asset management transactions with our affiliated utilities.
millions | | Duration of contract (in years) | | Expiration date | | Frequency of payment | | Profits shared / fees paid in 2005 | | Profits shared / fees paid in 2004 | |
| Virginia Natural Gas | | | 5 | | | Oct 2005 | | | Annually | | $ | - | | $ | 3 | |
| Atlanta Gas Light | | | 3 | | | Feb 2006 | | | Semi-annually | | | 3 | | | 4 | |
| Chattanooga Gas | | | 3 | | | Mar 2007 | | | Annually | | | 2 | | | 1 | |
| Elkton Gas | | | 2 | | | Mar 2007 | | | Monthly | | | - | | | - | |
| Elizabethtown Gas | | | 3 | | | Mar 2008 | | | Monthly | | | - | | | - | |
| Florida City Gas | | | 3 | | | Mar 2008 | | | Annually | | | - | | | - | |
| (1) | For the six months ended June 30, 2005. |
| (2) | For the twelve months ended December 31, 2004. |
Energy Marketing and Risk Management Activities The tables below illustrate the change in the net fair value of Sequent’s derivative instruments and energy-trading contracts during the three and six months ended June 30, 2005 and 2004 and provide details of the net fair value of contracts outstanding as of June 30, 2005. Sequent’s storage positions are affected by changes in the New York Mercantile Exchange, Inc. (NYMEX) average price.
| | | Three months ended June 30, | | Six months ended June 30, | |
In millions | | 2005 | | 2004 | | 2005 | | 2004 | |
| Net fair value of contracts outstanding at beginning of period | | $ | 11 | | $ | 10 | | $ | 17 | | $ | (5 | ) |
| Contracts realized or otherwise settled during period | | | 8 | | | 3 | | | 17 | | | 7 | |
| Change in net fair value of contracts | | | (11 | ) | | (3 | ) | | (26 | ) | | 8 | |
| Net fair value of contracts outstanding at end of period | | | 8 | | | 10 | | | 8 | | | 10 | |
| Less net fair value of contracts outstanding at beginning of period | | | 11 | | | 10 | | | 17 | | | (5 | ) |
| Unrealized (loss) gain related to changes in the fair value of derivative instruments | | $ | (3 | ) | $ | - | | $ | (9 | ) | $ | 15 | |
The sources of our net fair value at June 30, 2005 are as follows:
In millions | | Matures through June 2006 | | Matures through June 2009 | | Matures through June 2011 | | Matures after June 2012 | | Total net fair value | |
| Prices actively quoted (1) | | $ | 8 | | $ | 3 | | $ | - | | $ | - | | $ | 11 | |
| Prices provided by other external sources (1) | | | (5 | ) | | 2 | | | 1 | | | (1 | ) | | (3 | ) |
| (1) | The “prices actively quoted” category represents Sequent’s positions in natural gas, which are valued exclusively using NYMEX futures prices. “Prices provided by other external sources” are basis transactions that represent the cost to transport the commodity from a NYMEX delivery point to the contract delivery point. Sequent’s basis spreads are primarily based on quotes obtained either directly from brokers or through electronic trading platforms. |
Mark-to-Market versus Lower of Average Cost or Market We purchase natural gas for storage when the current market price we pay plus the cost for storage is less than the market price we could receive in the future. We attempt to mitigate substantially all of our commodity price risk associated with our storage portfolio. We use derivative instruments to reduce the risk associated with future changes in the price of natural gas. We sell NYMEX futures contracts or other over-the-counter derivatives in forward months to substantially lock-in the profit margin we will ultimately realize when the stored gas is actually sold.
Natural gas stored in inventory is accounted for differently than the derivatives we use to mitigate the commodity price risk associated with our storage portfolio. The difference in accounting can result in volatility in our reported net income, even though the profit margin is essentially unchanged from the date the transactions were consummated. Natural gas that we purchase and inject into storage is accounted for at the lower of average cost or market. The derivatives we use to mitigate commodity price risk are accounted for at fair value and marked to market each period. These differences in our accounting treatment result in volatility in our reported net income.
Earnings Volatility And Price Sensitivity The aforementioned timing differences also impact the comparability of our period-over-period results as changes in forward NYMEX prices do not increase and decrease on a consistent basis from year to year. During 2005 our first quarter results were negatively impacted by a decline in forward NYMEX prices during December 2004. This decline resulted in the recognition of unrealized gains in the fourth quarter of 2004 rather than in the first quarter of 2005 when the physical inventory was actually withdrawn. In addition, forward NYMEX prices increased during the first quarter of 2005 resulting in the recognition of unrealized losses in the quarterly results. During the second quarter of 2005, forward NYMEX prices decreased once again resulting in the recognition of unrealized gains in our reported results. In comparison, the reported results of first and second quarters of 2004 were not significantly impacted by changes in forward NYMEX prices. As a result, a comparison of the 2005 and 2004 reported quarterly results yields an unfavorable variance for the first quarter and a favorable variance for the second quarter. However, the June 30 year-to-date results are relatively consistent year over year due to the offsetting effect of the unrealized gains and losses in conjunction with improved commercial operations during 2005.
Based upon our storage positions at June 30, 2005, a $0.10 change in the forward NYMEX prices would result in a $1.2 million impact to Sequent’s EBIT.
Storage Inventory Outlook The NYMEX forward curve graph set forth below reflects the NYMEX natural gas prices as of March 31, 2005 and June 30, 2005 for the period of July 2005 through June 2006, and reflects the prices at which we could buy natural gas at the Henry Hub for delivery in the same time period. July 2005 futures expired on June 28, 2005; however they are included in the table below as they coincide with the July storage withdrawals. The Henry Hub, located in Louisiana, is the largest centralized point for natural gas spot and futures trading in the United States. NYMEX uses the Henry Hub as the point of delivery for its natural gas futures contracts. Many natural gas marketers also use the Henry Hub as their physical contract delivery point or their price benchmark for spot trades of natural gas.
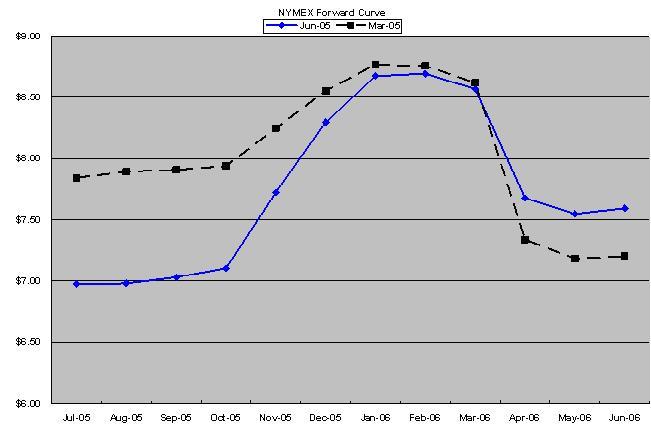
The NYMEX forward curve graph above displays the significant decrease in third quarter 2005 NYMEX prices experienced during the second quarter of 2005. As shown in the table below, a significant portion of our inventory in storage as of June 30, 2005 is scheduled for withdrawal during the third quarter of 2005 and the first quarter of 2006. Since we have NYMEX contracts in place, our original economic profit margin is unaffected. However, the decrease in NYMEX prices during the second quarter of 2005 resulted in unrealized gains associated with our NYMEX contracts. We did not experience the same phenomenon during the second quarter of 2004. See further discussions in “Results of Operations” below.
As shown in the table below, “Open futures NYMEX contracts” represents the volume in contract equivalents of the transactions we executed to lock in our storage inventory margin. Each contract equivalent represents 10,000 million British thermal units (MMBtu).The expected withdrawal schedule of this inventory as of June 30, 2005 is also reflected in the table. At June 30, 2005 the weighted average cost of gas (WACOG) in salt dome storage was $6.94 and the WACOG for gas in reservoir storage was $6.81.
The table also reflects that our storage inventory is fully hedged with futures as evidenced by the NYMEX short positions being equal to the physical long positions, which results in an overall locked-in margin, timing notwithstanding. "Expected gross margin after regulatory sharing" reflects the gross margin we would generate in future periods based on the forward curve and inventory withdrawal schedule at June 30, 2005.
Our current inventory level and pricing should result in gross margin of approximately $6 million through March 2006 and will likely change as we adjust our daily injection and withdrawal plans in response to changes in market conditions in future months.
Open Futures NYMEX Contracts | | | |
| | | | |
| | | July 2005 | | Aug 2005 | | Sep 2005 | | Oct 2005 | | Nov 2005 | | Dec 2005 | | Jan 2006 | | Feb 2006 | | Mar 2006 | | Total | |
| (A) | | | (120 | ) | | (667 | ) | | (345 | ) | | (324 | ) | | - | | | (38 | ) | | (21 | ) | | (127 | ) | | (104 | ) | | (1,746 | ) |
| | | | | | | | | | | | | | | | | | | | | | | | | | | | | | | | |
| (B) | | | 35 | | | 93 | | | - | | | - | | | - | | | - | | | - | | | - | | | - | | | 128 | |
| (C) | | | 85 | | | 574 | | | 345 | | | 324 | | | - | | | 38 | | | 21 | | | 127 | | | 104 | | | 1,618 | |
| Total | | | 120 | | | 667 | | | 345 | | | 324 | | | - | | | 38 | | | 21 | | | 127 | | | 104 | | | 1,746 | |
| (D) | | $ | 0.1 | | $ | 0.9 | | $ | 0.6 | | $ | 0.7 | | $ | - | | $ | 0.5 | | $ | 0.4 | | $ | 1.7 | | $ | 1.5 | | $ | 6.4 | |
(A) Open futures NYMEX contracts (short) long (in MMBtu)
(B) Physical salt dome withdrawal schedule (in MMBtu)
(C) Physical reservoir withdrawal schedule (in MMBtu)
(D) Expected gross margin, in millions, after regulatory sharing for withdrawal activity
Credit Rating Sequent has certain trade and credit contracts that have explicit credit rating trigger events in case of a credit rating downgrade. These rating triggers typically give counterparties the right to suspend or terminate credit if our credit ratings are downgraded to non-investment grade status. Under such circumstances, we would need to post collateral to continue transacting with some of our counterparties. Posting collateral would have a negative effect on our liquidity. If such collateral were not posted, our ability to continue transacting with these counterparties would be impaired. If at June 30, 2005, our credit ratings had been downgraded to non-investment grade, the required amounts to satisfy potential collateral demands under such agreements between Sequent and its counterparties would have totaled $9 million.
Results of Operations for our wholesale services segment for the three and six months ended June 30, 2005 and 2004 are as follows:
Second quarter 2005 compared to second quarter 2004
| | | Three months ended June 30, | |
In millions | | 2005 | | 2004 | | 2005 vs. 2004 | |
| Operating revenues | | $ | 9 | | $ | 1 | | $ | 8 | |
| Cost of sales | | | - | | | 1 | | | (1 | ) |
| Operating margin | | | 9 | | | - | | | 9 | |
| Operation and maintenance | | | 6 | | | 5 | | | 1 | |
| Depreciation and amortization | | | 1 | | | - | | | 1 | |
| Taxes other than income | | | - | | | - | | | - | |
| Total operating expenses | | | 7 | | | 5 | | | 2 | |
| Operating income | | | 2 | | | (5 | ) | | 7 | |
| Other income | | | - | | | - | | | - | |
| EBIT | | $ | 2 | | $ | (5 | ) | $ | 7 | |
| | | | | | | | | | | |
Metrics | | | | | | | | | | |
| Physical sales volumes (Bcf/day) | | | 2.13 | | | 2.00 | | | 7 | % |
EBIT The increase in EBIT of $7 million in 2005 as compared to 2004 was due to an increase in operating margin of $9 million, partially offset by an increase in operating expenses of $2 million.
Operating Margin The $9 million increase in operating margin was driven by improved results associated with our affiliated asset management and origination activities. During the second quarter of 2005 there was a significant decrease in forward NYMEX prices, specifically associated with the months of July through October of 2005. This decline in forward prices resulted in the recognition of unrealized gains associated with the financial instruments that we use to economically hedge our natural gas inventory held in storage. There was no corresponding impact during 2004. In addition, our market opportunities in the prior year were more heavily weighted towards the first quarter, with the second quarter being relatively flat. In 2005, the pricing environment allowed for more balance between the quarters. Also, during 2004 we were required to adjust our inventory balances to market value as it was below our average carrying cost. We were not required to make a similar adjustment in 2005.
Operating Expenses The $2 million increase in operating expenses reflects additional payroll costs associated with increased headcount and a modest increase in outside services costs. We also incurred additional depreciation expense in connection with our new energy trading and risk management system which was implemented during 2004.
| | | Six months ended June 30, | |
In millions | | 2005 | | 2004 | | 2005 vs. 2004 | |
| Operating revenues | | $ | 20 | | $ | 21 | | $ | (1 | ) |
| Cost of sales | | | - | | | 1 | | | (1 | ) |
| Operating margin | | | 20 | | | 20 | | | - | |
| Operation and maintenance | | | 13 | | | 13 | | | - | |
| Depreciation and amortization | | | 1 | | | - | | | 1 | |
| Taxes other than income | | | - | | | - | | | - | |
| Total operating expenses | | | 14 | | | 13 | | | 1 | |
| Operating income | | | 6 | | | 7 | | | (1 | ) |
| Other income | | | - | | | - | | | - | |
| EBIT | | $ | 6 | | $ | 7 | | $ | (1 | ) |
| | | | | | | | | | | |
Metrics | | | | | | | | | | |
| Physical sales volumes (Bcf/day) | | | 2.24 | | | 2.05 | | | 9 | % |
EBIT The decrease in EBIT of $1 million in 2005 as compared to 2004 was due to an increase in operating expenses.
Operating Margin The $1 million decrease in operating revenues reflects the net impact of a decline in first quarter results, partially offset by an increase in second quarter results, as compared to the corresponding periods in 2004. During the first quarter we experienced a $9 million reduction in operating revenues due to the negative impact of changes in forward NYMEX prices during late 2004 and early 2005, partially offset by improved origination operations during the 2005 period. The results for the first quarter of 2004 were not as significantly impacted by changes in forward NYMEX prices. During the second quarter we experienced an $8 million increase in operating revenues due to improved results from our affiliated asset management and origination activities. Contributing to the higher results were declines in forward NYMEX prices and the associated impact on our financial instruments that we use to economically hedge our natural gas inventory held in storage.
The $1 million decrease in cost of sales resulted from an adjustment that we were required to make to our inventory balances during the second quarter of 2004 when market values were below our average carrying cost. We were not required to make a similar adjustment in 2005.
Operating Expenses The $1 million increase in operating expenses is a result of additional depreciation expense in connection with our new ETRM system which was implemented during the prior year.
Energy Investments
Our energy investments segment includes:
| · | Pivotal Jefferson Island |
| · | Pivotal Propane of Virginia, Inc. |
| · | 50% ownership interest in Saltville Gas Storage Company, LLC (Saltville) |
Pivotal Jefferson Island We are evaluating alternatives for possible expansion of the facilities at Jefferson Island which will significantly enhance our flexibility with respect to storage opportunities.
Sale of Virginia assets On April 27, 2005, we announced our agreement to sell our 50% interest in Saltville and our wholly-owned subsidiaries Virginia Gas Pipeline and Virginia Gas Storage to a subsidiary of Duke Energy Corporation (Duke), the other 50% partner in Saltville. We acquired these Virginia assets in November 2004 with our purchase of NUI. The transaction does not include Virginia Gas Distribution Company, another NUI asset, which has 270 customers and annual throughput of 240,000 dekatherms.
We will receive, subject to working capital adjustments, $62 million in cash at closing and will utilize the proceeds to repay debt and for other general corporate purposes. The transaction is not expected to have a material impact on our earnings. Closing of the transaction, which is conditional upon regulatory approvals, including approval from the Virginia State Corporation Commission, is expected by September 30, 2005.
We are marketing certain other NUI entities for sale with buyers actively being solicited. Excluding our equity investment in Saltville which does not qualify for treatment as either assets held for sale or discontinued operations under SFAS 144, “Accounting for the Impairment or Disposal of Long-Lived Assets,” the remaining assets and liabilities are not separately classified on the accompanying balance sheet as held for sale due to materiality.
Results of operations for our energy investments segment for the three and six months ended June 30, 2005 and 2004 are shown in the following table.
Second quarter 2005 compared to second quarter 2004
| | |
| | | Three months ended June 30, | |
In millions | | 2005 | | 2004 | | 2005 vs. 2004 | |
| Operating revenues | | $ | 17 | | $ | 1 | | $ | 16 | |
| Cost of sales | | | 5 | | | - | | | 5 | |
| Operating margin | | | 12 | | | 1 | | | 11 | |
| Operation and maintenance | | | 5 | | | - | | | 5 | |
| Depreciation and amortization | | | 1 | | | - | | | 1 | |
| Taxes other than income | | | 1 | | | - | | | 1 | |
| Total operating expenses | | | 7 | | | - | | | 7 | |
| Operating income | | | 5 | | | 1 | | | 4 | |
| Other income | | | - | | | 1 | | | (1 | ) |
| EBIT | | $ | 5 | | $ | 2 | | $ | 3 | |
EBIT EBIT increased $3 million, primarily as a result of increased operating margin of $11 million, offset by higher operating expenses of $7 million.
Operating Margin Operating margin in the energy investments segment increased $11 million. The addition of Pivotal Jefferson Island contributed $3 million of the increase. Virginia Gas Company and AGL Networks each contributed $2 million of the increase, while Pivotal Propane of Virginia, which began commercial operation in April 2005, contributed $1 million.
Operating Expenses Operating expenses increased $7 million, primarily driven by the addition of Pivotal Jefferson Island, Virginia Gas Company and Saltville.
Six months 2005 compared to six months 2004
| | | Six months ended June 30, | |
In millions | | 2005 | | 2004 | | 2005 vs. 2004 | |
| Operating revenues | | $ | 29 | | $ | 3 | | $ | 26 | |
| Cost of sales | | | 8 | | | - | | | 8 | |
| Operating margin | | | 21 | | | 3 | | | 18 | |
| Operation and maintenance | | | 8 | | | 2 | | | 6 | |
| Depreciation and amortization | | | 3 | | | 1 | | | 2 | |
| Taxes other than income | | | 1 | | | - | | | 1 | |
| Total operating expenses | | | 12 | | | 3 | | | 9 | |
| Operating income | | | 9 | | | - | | | 9 | |
| Other income | | | 1 | | | 2 | | | (1 | ) |
| EBIT | | $ | 10 | | $ | 2 | | $ | 8 | |
| | | | | | | | | | | |
Metrics (excludes Saltville) | | | | | | | | | | |
| Gas storage capacity (dth) | | | 10 | | | - | | | n/a | |
| Dark fiber miles owned (thousands) | | | 68 | | | 60 | | | 13 | % |
| % dark fiber miles leased | | | 20 | % | | 10 | % | | 100 | % |
EBIT EBIT increased $8 million, primarily as a result of increased operating margin of $18 million, partially offset by higher operating expenses of $9 million.
Operating Margin Operating margin in the energy investments segment increased $18 million, primarily as a result of the addition of Pivotal Jefferson Island, which contributed $8 million of the increase. The Virginia Gas Company and Saltville assets, contributed an additional $5 million of margin. Pivotal Propane of Virginia, which began commercial operation in April 2005, contributed $1 million, and AGL Networks contributed $3 million.
Operating Expenses Operating expenses in the energy investments segment increased $9 million, primarily driven by the addition of Pivotal Jefferson Island, Virginia Gas Company and Saltville.
Corporate
Our corporate segment includes our nonoperating business units, including AGL Services Company (AGSC), AGL Capital Corporation (AGL Capital) and Pivotal Energy Development (Pivotal). AGSC is a service company established in accordance with the Public Utility Holding Company Act of 1935, as amended (PUHCA). AGL Capital provides for our ongoing financing needs through a commercial paper program, the issuance of various debt and hybrid securities, and other financing arrangements.
Pivotal coordinates, among our related operating segments, the development, construction or acquisition of assets in the Southeast and Mid-Atlantic regions in order to extend our natural gas capabilities and improve system reliability while enhancing service to our customers in those areas. The focus of Pivotal’s commercial activities is to improve the economics of system reliability and natural gas deliverability in these targeted regions.
We allocate substantially all of AGSC’s and AGL Capital’s operating expenses and interest costs to our operating segments in accordance with PUHCA and state regulations. Our corporate segment also includes intercompany eliminations for transactions between our operating business segments. Our EBIT results include the impact of these allocations to the various operating segments. The acquisition of additional assets, such as NUI and Jefferson Island, typically will enable us to allocate corporate costs across a larger number of businesses and, as a result, lower the relative allocations charged to those business units we owned prior to the acquisition of the new businesses.
Results of operations for our corporate segment for the three and six months ended June 30, 2005 and 2004 are as follows:
Second quarter 2005 compared to second quarter 2004
| | | Three months ended June 30, | |
In millions | | 2005 | | 2004 | | 2005 vs. 2004 | |
| Payroll | | $ | 15 | | $ | 12 | | $ | 3 | |
| Benefits and incentives | | | 6 | | | 5 | | | 1 | |
| Outside services | | | 10 | | | 7 | | | 3 | |
| Depreciation and amortization | | | 1 | | | 3 | | | (2 | ) |
| Taxes other than income | | | 1 | | | 1 | | | - | |
| Other | | | 13 | | | 7 | | | 6 | |
| Total operating expenses before allocations | | | 46 | | | 35 | | | 11 | |
| Allocation to operating segments | | | (45 | ) | | (34 | ) | | (11 | ) |
| Total operating expenses | | | (1 | ) | | (1 | ) | | - | |
| Other losses | | | - | | | (1 | ) | | 1 | |
| EBIT | | $ | (1 | ) | $ | (2 | ) | $ | 1 | |
| | | Six months ended June 30, | |
In millions | | 2005 | | 2004 | | 2005 vs. 2004 | |
| Payroll | | $ | 28 | | $ | 24 | | $ | 4 | |
| Benefits and incentives | | | 15 | | | 15 | | | - | |
| Outside services | | | 19 | | | 13 | | | 6 | |
| Depreciation and amortization | | | 4 | | | 5 | | | (1 | ) |
| Taxes other than income | | | 3 | | | 2 | | | 1 | |
| Other | | | 22 | | | 18 | | | 4 | |
| Total operating expenses before allocations | | | 91 | | | 77 | | | 14 | |
| Allocation to operating segments | | | (87 | ) | | (73 | ) | | (14 | ) |
| Total operating expenses | | | (4 | ) | | (4 | ) | | - | |
| Other losses | | | - | | | (1 | ) | | 1 | |
| EBIT | | $ | (4 | ) | $ | (5 | ) | $ | 1 | |
The corporate segment is a non-operating segment, and as such, comparative EBIT variances for the indicated periods reflect the relative change in various general and administrative expenses, such as payroll, benefits and incentives, insurance and outside services, none of which are individually material. The key drivers of our corporate expenses for the second quarter and year-to-date periods of 2005 and 2004 are detailed by line item in the table above.
Liquidity and Capital Resources
We rely on operating cash flow; short-term borrowings under our commercial paper program, which is backed by our supporting credit agreement (Credit Facility); and borrowings or stock issuances in the long-term capital markets to meet our capital and liquidity requirements. Our issuance of various securities, including long-term and short-term debt, is subject to customary approval or authorization by state and federal regulatory bodies including state public service commissions and the SEC. Furthermore, a substantial portion of our consolidated assets, earnings and cash flow is derived from the operation of our regulated utility subsidiaries, whose legal authority to pay dividends or make other distributions to us is subject to regulation.
The availability of borrowings under our Credit Facility is limited and subject to conditions specified within the Credit Facility, which we currently meet. These conditions specified within the Credit Facility include:
| · | compliance with certain financial covenants |
| · | the continued accuracy of representations and warranties contained in the agreement, and |
| · | our total debt-to-capital ratio |
Our total cash and available liquidity under our Credit Facility as of the dates indicated are represented in the table below.
In millions | | June 30, 2005 | | Dec. 31, 2004 | |
| Unused availability under the Credit Facility | | $ | 750 | | $ | 750 | |
| Cash and cash equivalents | | | 45 | | | 49 | |
| Total cash and available liquidity under the Credit Facility | | $ | 795 | | $ | 799 | |
We believe these sources will be sufficient for our working capital needs, debt service obligations and scheduled capital expenditures for the foreseeable future. The relatively stable operating cash flows of our distribution operations businesses currently contribute most of our cash flow from operations, and we anticipate this to continue in the future. However, we have historically had a working capital deficit, primarily as a result of our use of short-term debt to finance the purchase of long-term assets, principally property, plant and equipment. We will continue to evaluate our need to increase our available liquidity based on our view of natural gas prices, liquidity requirements established by the rating agencies and other factors. Additionally, our liquidity and capital resource requirements may change in the future due to a number of other factors, some of which we cannot control. These factors include:
| · | the seasonal nature of the natural gas business and our resulting short-term borrowing requirements, which typically peak during colder months |
| · | increased gas supplies required to meet our customers’ needs during cold weather |
| · | changes in wholesale prices and customer demand for our products and services |
| · | regulatory changes and changes in rate-making policies of regulatory commissions |
| · | contractual cash obligations and other commercial commitments |
| · | pension and postretirement funding requirements |
| · | changes in income tax laws |
| · | margin requirements resulting from significant increases or decreases in our commodity prices |
Seasonality The seasonal nature of our sales affects the comparison of certain balance sheet items at June 30, 2005 and December 31, 2004, such as receivables, unbilled revenue, inventories and short-term debt. We have presented the condensed consolidated balance sheet as of June 30, 2004 to provide comparisons of these items with the corresponding period of the preceding year.
Contractual Obligations and Commitments We have incurred various contractual obligations and financial commitments in the normal course of our operations and financing activities. Contractual obligations include future cash payments required under existing contractual arrangements, such as debt and lease agreements. These obligations may result from both general financing activities and from commercial arrangements that are directly supported by related revenue-producing activities.
We calculate any required pension contributions using an actuarial method called the projected unit credit cost method, and as a result of our calculations, we do not expect to make a pension contribution in 2005. The following table illustrates our expected future contractual obligations:
| | | | | Payments due before December 31, | |
| | | | | | | 2006 | | 2008 | | 2010 | |
| | | | | | | & | | & | | & | |
In millions | | Total | | 2005 | | 2007 | | 2009 | | thereafter | |
| Pipeline charges, storage capacity and gas supply (1) | | $ | 1,638 | | $ | 142 | | $ | 496 | | $ | 410 | | $ | 590 | |
| Long-term debt (2) (3) | | | 1,621 | | | - | | | 2 | | | 2 | | | 1,617 | |
| Pipeline replacement program costs (4) | | | 318 | | | 26 | | | 61 | | | 83 | | | 148 | |
| Operating leases (5) | | | 136 | | | 9 | | | 32 | | | 28 | | | 67 | |
| Commodity and transportation charges | | | 173 | | | 68 | | | 20 | | | 13 | | | 72 | |
| ERC (4) | | | 96 | | | 6 | | | 24 | | | 29 | | | 37 | |
| Short-term debt (3) | | | 172 | | | 172 | | | - | | | - | | | - | |
| Communication/network service and maintenance | | | 17 | | | 5 | | | 12 | | | - | | | - | |
| Total | | $ | 4,171 | | $ | 428 | | $ | 647 | | $ | 565 | | $ | 2,531 | |
(1) Charges recoverable through a purchased gas adjustment mechanism or alternatively billed to Georgia Commission certificated marketers selling retail natural gas in Georgia. Also includes demand charges associated with Sequent. (2) Includes $232 million of notes payable to trusts, callable in 2006 and 2007. (3) Does not include the interest expense associated with the long-term and short-term debt. (4) Charges recoverable through rate rider mechanisms. (5) We have certain operating leases with provisions for step rent or escalation payments, or certain lease concessions. We account for these leases by recognizing the future minimum lease payments on a straight-line basis over the respective minimum lease terms in accordance with SFAS No. 13, "Accounting for Leases." However, this accounting treatment does not affect the future annual operating lease cash obligations as shown herein. |
SouthStar has natural gas purchase commitments related to the supply of minimum natural gas volumes to its customers. These commitments are priced on an index plus premium basis. At June 30, 2005, SouthStar had obligations under these arrangements for 8 Bcf through December 31, 2005.
We have also incurred various contingent financial commitments in the normal course of business. The following table sets forth as of June 30, 2005 the maximum potential amount of our expected contingent financial commitments, representing obligations that become payable only if certain pre-defined events occur, such as financial guarantees:
| | | | | Commitments due before December 31, | |
| | | | | | | 2006 | | 2008 | | 2010 | |
| | | | | | | & | | & | | & | |
In millions | | Total | | 2005 | | 2007 | | 2009 | | thereafter | |
| Guarantees (1) | | $ | 7 | | $ | 7 | | $ | - | | $ | - | | $ | - | |
| Standby letters of credit, performance/ surety bonds | | | 20 | | | 17 | | | 3 | | | - | | | - | |
| Total | | $ | 27 | | $ | 24 | | $ | 3 | | $ | - | | $ | - | |
| (1) We provide guarantees on behalf of SouthStar. We guarantee 70% of SouthStar's obligations to SNG under certain agreements between the parties up to a maximum of $7 million if SouthStar fails to make a payment to SNG. |
Cash flow provided from operating activities Our condensed consolidated statements of cash flows are prepared using the indirect method. Under this method, net income is reconciled to cash flows from operating activities by adjusting net income for those items that impact net income but do not result in actual cash receipts or payments during the period. These reconciling items include depreciation, changes in deferred income taxes and changes in the balance sheet for working capital from the beginning to the end of the period.
Year-over-year changes in our operating cash flows are attributable primarily to working capital changes within our distribution operations and retail energy operations segments resulting from the impact of weather, the price of natural gas, the timing of customer collections, payments for natural gas purchases and deferred gas cost recoveries. In the first six months of 2005, our net cash flow provided from operating activities was $345 million an increase of $1 million from the same period last year.
The small increase was primarily a result of an increase in net income of $25 million and other working capital contributions offset by increased use of cash of $28 million for the injection of natural gas into our inventories in advance of the winter sales demand. The increase in net income was principally from the inclusion of the acquired NUI utilities in our operations and improved results at our retail energy operations and energy investment segments.
Cash flow used in investing activities Our cash used in investing activities consists primarily of property, plant and equipment expenditures. For the six months ended June 30, 2005, those expenditures were $130 million, an increase of $26 million or 25% from the same period last year.
The increase is primarily from higher expenditures at our distribution operations segment, including $32 million for the acquisition of a 250 mile pipeline in Georgia from SNG and approximately $9 million in expenditures at Elizabethtown Gas and Florida City Gas.
These increases were offset by reduced expenditures of $7 million at the Pivotal Propane plant in Virginia as most of the construction expenditures were incurred last year. In addition, there were reductions at Sequent of $3 million, primarily due to the completion of the Energy Trading and Risk Management System in 2004.
Cash flow used in financing activities Our financing activities primarily consist of borrowings and payments of short-term debt, payments of medium-term notes, borrowings of senior notes, distributions to minority interests, cash dividends on our common stock and issuances of common stock. Our capitalization and financing strategy is intended to ensure that we are properly capitalized with the appropriate mix of equity and debt securities. This strategy includes active management by us of the percentage of our total debt relative to our total capitalization, as well as the term and interest rate profile of our debt securities.
We also work to maintain or improve our credit ratings on our senior notes to effectively manage our existing financing costs and enhance our ability to raise additional capital on favorable terms. Factors considered important in assessing our credit ratings include our balance sheet leverage, capital spending, earnings, cash flow generation, available liquidity and overall business risks. We do not have any trigger events in our debt instruments that are tied to changes in our credit ratings or our stock price and have not entered into any transaction that would require us to issue equity based on credit ratings or other trigger events. As of July 2005, our senior unsecured debt ratings were BBB+ from Standard & Poor’s Rating Services (S&P), Baa1 from Moody’s Investor Service (Moody’s) and A- from Fitch Ratings.
Our credit ratings may be subject to revision or withdrawal at any time by the assigning rating organization, and each rating should be evaluated independently of any other rating. We cannot ensure that a rating will remain in effect for any given period of time or that a rating will not be lowered or withdrawn entirely by a rating agency if, in its judgment, circumstances so warrant. If the rating agencies downgrade our ratings, particularly below investment grade, it may significantly limit our access to the commercial paper market and our borrowing costs would increase. In addition, we would likely be required to pay a higher interest rate in future financings, and our potential pool of investors and funding sources would decrease.
Our debt instruments and other financial obligations include provisions that, if not complied with, could require early payment, additional collateral support or similar actions. Our most important default events include maintaining covenants with respect to maximum leverage ratio, minimum net worth, insolvency events, nonpayment of scheduled principal or interest payments, acceleration of other financial obligations and change of control provisions. Our Credit Facility’s financial covenants and our PUHCA financing authority require us to maintain a ratio of total debt-to-total capitalization of no greater than 70%; however, our goal is to maintain this ratio at levels between 50% and 60%. We are currently in compliance with all existing debt provisions and covenants.
We believe that accomplishing these capitalization objectives and maintaining sufficient cash flow are necessary to maintain our investment-grade credit ratings and to allow us access to capital at reasonable costs. The components of our capital structure, as of the dates indicated, are summarized in the following table:
In millions | | June 30, 2005 | | December 31, 2004 | | June 30, 2004 | |
| Short-term debt | | $ | 171 | | | 5 | % | $ | 334 | | | 10 | % | $ | 161 | | | 7 | % |
| Current portion of long-term debt | | | 1 | | | - | | | - | | | - | | | 34 | | | 2 | |
| Long-term debt (1) | | | 1,621 | | | 50 | | | 1,623 | | | 48 | | | 962 | | | 44 | |
| Total debt | | | 1,793 | | | 55 | | | 1,957 | | | 58 | | | 1,157 | | | 53 | |
| Minority interest | | | 32 | | | 1 | | | 36 | | | 1 | | | 29 | | | 1 | |
| Common equity | | | 1,457 | | | 44 | | | 1,385 | | | 41 | | | 1,011 | | | 46 | |
| Total capitalization | | $ | 3,282 | | | 100 | % | $ | 3,378 | | | 100 | % | $ | 2,197 | | | 100 | % |
| (1) | Net of interest rate swaps |
Short-term debt Our short-term debt is composed of borrowings under our commercial paper program, Sequent’s line of credit, the current portion of our capital lease obligation due within the next year and SouthStar’s line of credit. The decrease in our short-term debt of $162 million is primarily a result of payments on outstanding commercial paper from cash generated from strong operating results.
Refinancing of Gas Facility Revenue Bonds On April 19, 2005, our wholly-owned subsidiary Pivotal Utility Holdings, Inc. (Pivotal Utility) completed the refinancing of $20 million of its Gas Facility Revenue Bonds due October 1, 2024. The original bonds had a fixed interest rate of 6.4% per year and were refunded with $20 million of adjustable rate Gas Facility Revenue Bonds. The maturity date of these bonds remains October 1, 2024. The new bonds were issued at an initial interest rate of 2.8% per year and initially have a 35-day auction period where the interest rate will adjust every 35 days.
On May 5, 2005, Pivotal Utility refinanced an additional $47 million in Gas Facility Revenue Bonds due October 1, 2022 and bearing interest at a fixed rate of 6.35% per year. The new bonds were issued at an initial interest rate of 2.9% per year and initially have a 35-day auction period where the interest rate will adjust every 35 days. The maturity date remains October 1, 2022.
Dividends on Common Stock In February 2005, we announced a 7% increase in our common stock dividend, raising the quarterly dividend from $0.29 per share to $0.31 per share, which equates to an indicated annual dividend of $1.24 per share. The increase in our common stock dividend of $11 million for the six months ended June 30, 2005 as compared to the same period last year was a result of our increased quarterly dividend and the increase in the number of shares outstanding as a result of our November 2004 equity offering.
The preparation of our financial statements requires us to make estimates and judgments that affect the reported amounts of assets, liabilities, revenues and expenses and the related disclosures of contingent assets and liabilities. We base our estimates on historical experience and various other assumptions that we believe to be reasonable under the circumstances. We evaluate our estimates on an ongoing basis, and our actual results may differ from these estimates.
Our critical accounting policies used in the preparation of our consolidated financial statements are described in our Current Report on Form 8-K, filed with the SEC on July 28, 2005 and include the following:
| · | Pipeline Replacement Program |
| · | Environmental Remediation Liabilities |
| · | Purchase Price Allocation |
| · | Derivatives and Hedging Activities |
| · | Accounting for Contingencies |
| · | Allowance for Doubtful Accounts |
| · | Accounting for Pension Benefits |
Each of our critical accounting policies and estimates involves complex situations requiring a high degree of judgment either in the application and interpretation of existing literature or in the development of estimates that impact our financial statements. There have been no significant changes to our critical accounting policies from those disclosed in our Annual Report on Form 10-K, as updated in our Current Report on Form 8-K, filed with the SEC on July 28, 2005.
Accounting Developments
For information regarding accounting developments, see "Note 3 - Recent Accounting Pronouncements."
We are exposed to risks associated with commodity prices, interest rates and credit. Commodity price risk is defined as the potential loss that we may incur as a result of changes in the fair value of a particular instrument or commodity. Interest rate risk results from our portfolio of debt and equity instruments that we issue to provide financing and liquidity for our business. Credit risk results from the extension of credit throughout all aspects of our business, but is particularly concentrated at Atlanta Gas Light in distribution operations and in wholesale services.
Our Risk Management Committee (RMC) is responsible for the overall establishment of risk management policies and the monitoring of compliance with and adherence to the terms within these policies, including approval and authorization levels and delegation of these levels. Our RMC consists of senior executives who monitor commodity price risk positions, corporate exposures, credit exposures and overall results of our risk management activities. The RMC is chaired by our chief risk officer, who is responsible for ensuring that appropriate reporting mechanisms exist for the RMC to perform its monitoring functions. Our risk management activities and related accounting treatment are described in further detail in Note 4 to the condensed consolidated financial statements.
Commodity Price Risk
Wholesale Services This segment routinely utilizes various types of financial and other instruments to mitigate certain commodity price risks inherent in the natural gas industry. These instruments include a variety of exchange-traded and over-the-counter energy contracts, such as forward contracts, futures contracts, option contracts and financial swap agreements. The following table includes the fair values and average values of our energy marketing and risk management assets and liabilities as of June 30, 2005, December 31, 2004 and June 30, 2004. We based the average values on monthly averages for the six months ended June 30, 2005 and the twelve months ended December 31, 2004.
| | | | |
Natural gas contracts | |
| | | Average values | |
In millions | | Six months ended June 30, 2005 | | Twelve months ended Dec. 31, 2004 | |
| Asset | | $ | 40 | | $ | 28 | |
| Liability | | | 30 | | | 21 | |
| | | Value at: | |
In millions | | June 30, 2005 | | Dec. 31, 2004 | | June 30, 2004 | |
| Asset | | $ | 50 | | $ | 36 | | $ | 23 | |
| Liability | | | 42 | | | 19 | | | 13 | |
We employ a systematic approach to the evaluation and management of the risks associated with our contracts related to wholesale marketing and risk management, including value-at-risk (VaR). VaR is defined as the maximum potential loss in portfolio value over a specified time period that is not expected to be exceeded within a given degree of probability.
We use a 1-day and a 10-day holding period and a 95% confidence interval to evaluate our VaR exposure. A 95% confidence interval means there is a 5% probability that the actual change in portfolio value will be greater than the calculated VaR value over the holding period. We calculate VaR based on the variance-covariance technique. This technique requires several assumptions for the basis of the calculation, such as price volatility, confidence interval and holding period. Our VaR may not be comparable to a similarly titled measure of another company because, although VaR is a common metric in the energy industry, there is no established industry standard for calculating VaR or for the assumptions underlying such calculations.
Our open exposure is managed in accordance with established policies that limit market risk and require daily reporting of potential financial exposure to senior management, including the chief risk officer. Because we generally manage physical gas assets and economically protect our positions by hedging in the futures markets, our open exposure is generally minimal, permitting us to operate within relatively low VaR limits. We employ daily risk testing, using both VaR and stress testing, to evaluate the risks of our open positions.
Our management actively monitors open commodity positions and the resulting VaR. We continue to maintain a relatively matched book, where our total buy volume is close to our sell volume, with minimal open commodity risk. Based on a 95% confidence interval and employing a 1-day and a 10-day holding period for all positions, our portfolio of positions for the three and six months ended June 30, 2005 had the following 1-day and 10-day holding period VaRs:
| | | Three months ended June 30, 2005 | |
In millions | | 1-day | | 10-day | |
| Period end (1) | | $ | 0.1 | | $ | 0.3 | |
| Average | | | 0.1 | | | 0.4 | |
| High | | | 0.3 | | | 1.0 | |
| Low (1) | | | 0.0 | | | 0.0 | |
| (1) | $0.0 values represent amounts less than $0.1 million. |
| | | Six months ended June 30, 2005 | |
In millions | | 1-day | | 10-day | |
| Period end (1) | | $ | 0.1 | | $ | 0.3 | |
| Average | | | 0.1 | | | 0.5 | |
| High | | | 0.4 | | | 1.3 | |
| Low (1) | | | 0.0 | | | 0.0 | |
| (1) | $0.0 values represent amounts less than $0.1 million. |
We are currently refining the methodology associated with our VaR calculation and expect to apply the new methodology on a prospective basis during the third quarter of 2005. This refinement is not anticipated to produce significantly different VaR amounts.
Retail Energy Operations SouthStar’s use of derivatives is governed by a risk management policy which prohibits the use of derivatives for speculative purposes. This policy also establishes VaR limits of $0.5 million on a 1-day holding period and $0.7 million on a 10-day holding period. A 95% confidence interval is used to evaluate VaR exposure. The maximum VaR experienced during the three months and six ended June 30, 2005 was less than $0.2 million for the 1-day holding period and $0.5 million for the 10-day holding period.
Credit Risk
Sequent may require its counterparties to pledge additional collateral when deemed necessary. We conduct credit evaluations and obtain appropriate internal approvals for our counterparty’s line of credit before any transaction with the counterparty is executed. In most cases, the counterparty must have a minimum long-term debt rating of Baa3 from Moody’s and BBB- from S&P. Generally, we require credit enhancements by way of guaranty, cash deposit or letter of credit for transaction counterparties that do not meet the minimum ratings threshold. In addition to its collateral requirements and credit evaluation process, Sequent may, in certain instances, purchase credit insurance in order to mitigate its exposure to a counterparty that faces possible future business risks that are unknown or not quantifiable at the time of the initial credit evaluation.
Sequent evaluates the credit of its counterparties using the S&P equivalent credit rating which is determined by a process of converting the lower of the S&P or Moody’s rating to an internal rating ranging from 9.00 to 1.00, with 9.00 being equivalent to AAA/Aaa by S&P and Moody’s and 1.00 being equivalent to D or Default by S&P and Moody’s. A counterparty that does not have an external rating is assigned an internal rating based a variety of financial metrics.
The weighted average credit rating is obtained by multiplying each counterparty’s assigned internal rating by the counterparty’s credit exposure and the individual results are then summed for all counterparties. That total is divided by the aggregate total counterparties’ exposure. This numeric value is converted to an S&P equivalent. Under the refined methodology, Sequent’s counterparties, or the counterparties’ guarantors, had a weighted average S&P equivalent credit rating of A- at June 30, 2005, which is consistent with our previously reported rating of A- at December 31, 2004 and A- at June 30, 2004. For more information on Sequent’s counterparties credit ratings, see the discussion in “Results of Operations - Wholesale Services.” The following tables show Sequent’s commodity receivable and payable positions as of the dates indicated:
Gross receivables | | | | | |
In millions | | June 30, 2005 | | Dec. 31, 2004 | | June 30, 2004 | |
| Receivables with netting agreements in place: | | | | | | | |
| Counterparty is investment grade | | $ | 262 | | $ | 378 | | $ | 289 | |
| Counterparty is non-investment grade | | | 58 | | | 36 | | | 20 | |
| Counterparty has no external rating | | | 66 | | | 78 | | | 22 | |
| | | | | | | | | | | |
| Receivables without netting agreements in place: | | | | | | | | | | |
| Counterparty is investment grade | | | 10 | | | 16 | | | 19 | |
| Counterparty is non-investment grade | | | - | | | 6 | | | - | |
| Counterparty has no external rating | | | - | | | - | | | - | |
| Amount recorded on balance sheet | | $ | 396 | | $ | 514 | | $ | 350 | |
Gross payables | | | | | |
| Payables with netting agreements in place: | | | | | | | |
| Counterparty is investment grade | | $ | 255 | | $ | 291 | | $ | 215 | |
| Counterparty is non-investment grade | | | 62 | | | 45 | | | 65 | |
| Counterparty has no external rating | | | 107 | | | 139 | | | 91 | |
| | | | | | | | | | | |
| Payables without netting agreements in place: | | | | | | | | | | |
| Counterparty is investment grade | | | 42 | | | 40 | | | 50 | |
| Counterparty is non-investment grade | | | - | | | 6 | | | - | |
| Counterparty has no external rating | | | 1 | | | - | | | - | |
| Amount recorded on balance sheet | | $ | 467 | | $ | 521 | | $ | 421 | |
Item 4. Controls and Procedures
| (a) | Evaluation of disclosure controls and procedures. Under the supervision and with the participation of our management, including our principal executive officer and principal financial officer, we conducted an evaluation of our disclosure controls and procedures, as such term is defined in Rule 13a-15(e) promulgated under the Securities Exchange Act of 1934, as amended (the Exchange Act), as of June 30, 2005, the end of the period covered by this report, except, and in accordance with the Public Company Accounting Oversight Board’s Auditing Standard No. 2, An Audit of Internal Control Over Financial Reporting Performed in Conjunction With an Audit of Financial Statements, the disclosure controls and procedures of Jefferson Island and NUI were excluded from management’s evaluation, as Jefferson Island and NUI were acquired on October 1, 2004 and November 30, 2004, respectively. Based on this evaluation, our principal executive officer and our principal financial officer concluded that our disclosure controls and procedures were effective as of June 30, 2005 in providing a reasonable level of assurance that information we are required to disclose in reports that we file or submit under the Exchange Act is recorded, processed, summarized and reported within the time periods in SEC rules and forms, including a reasonable level of assurance that information required to be disclosed by us in such reports is accumulated and communicated to our management, including our principal executive officer and our principal financial officer, as appropriate to allow timely decisions regarding required disclosure. |
| (b) | Changes in internal controls over financial reporting. There were no changes in our internal control over financial reporting identified in connection with the evaluation described in paragraph (a) above that occurred during our most recent fiscal quarter that have materially affected, or are reasonably likely to materially affect, our internal controls over financial reporting. |
PART II -- OTHER INFORMATION
Item 1. Legal Proceedings
The nature of our business ordinarily results in periodic regulatory proceedings before various state and federal authorities and litigation incidental to the business. For information regarding pending federal and state regulatory matters, see "Results of Operations - Distribution Operations" contained in Item 2 of Part I under the caption "Management's Discussion and Analysis of Financial Condition and Results of Operations." With regard to other legal proceedings, we are a party, as both plaintiff and defendant, to a number of other suits, claims and counterclaims on an ongoing basis. Management believes that the outcome of all such other litigation in which it is involved will not have a material adverse effect on our consolidated financial statements.
Item 2. Unregistered Sales of Equity Securities and Use of Proceeds
The following table presents information about our purchases of our common stock during the second quarter of 2005.
Issuer Purchase of Equity Securities
Period | | Total Number of Shares Purchased | | Average Price Paid per Share | | Total Number of Shares Purchased as Part of Publicly Announced Plans or Programs (1) | | Maximum Number of Shares that May Yet Be Purchased Under the Plans or Programs | |
| | | | | | | | | | | | | | |
| April 1, 2005 - April 30, 2005 | | | - | | | - | | | - | | | | |
| May 1, 2005 - May 31, 2005 | | | 5,299 | | | 34.62 | | | N/A | | | N/A | |
| June 1, 2005 - June 30, 2005 | | | 1,197 | | | 35.88 | | | N/A | | | N/A | |
Total second quarter | | | 6,496 | | $ | 34.85 | | | N/A | | | N/A | |
(1) The total number of shares purchased reflects an aggregate of 6,496 shares surrendered to us to satisfy tax withholding obligations in connection with the vesting of shares of restricted stock and/or the exercise of stock options
Item 4. Submission of Matters to a Vote of Security Holders
We held our annual meeting of shareholders in Atlanta, Georgia on April 27, 2005. Holders of an aggregate of 76,996,757 shares of our common stock at the close of business on February 18, 2005 were entitled to vote at the meeting, of which 69,172,635 were represented in person or by proxy. At the annual meeting, our shareholders were presented with four proposals as set forth in our Proxy Statement. Our shareholders voted as follows:
Proposal 1
| | For | Withheld |
Election of Directors: | | |
| Thomas D. Bell, Jr. | 64,921,621 | 4,251,014 |
| Arthur E. Johnson | 68,527,481 | 645,154 |
| Paula Rosput Reynolds | 67,546,604 | 1,626,031 |
| James A. Rubright | 68,545,472 | 627,163 |
| Bettina M. Whyte | 68,524,616 | 648,019 |
Mr. Bell will hold office for a two-year term ending at the annual meeting of shareholders in 2007, and each of the remaining nominees will serve a three-year term expiring at our annual meeting of shareholders in 2008.
Proposal 2
| | For | Against | Abstain | Broker non-votes |
| Approval of amendment to AGL Resources’ articles of incorporation | 68,544,313 | 385,069 | 243,253 | - |
Proposal 3
| | For | Against | Abstain | Broker non-votes |
| Approval of AGL Resources’ Amended and Restated Employee Stock Purchase Plan | 56,891,015 | 843,735 | 389,976 | 11,047,909 |
Proposal 4
| | For | Against | Abstain | Broker non-votes |
| Ratification of the appointment of PricewaterhouseCoopers LLP as our independent auditor for 2005 | 68,038,445 | 933,475 | 200,714 | - |
| 3.1 | Amended and Restated Articles of Incorporation filed January 5, 1996, with the Secretary of State of the state of Georgia (incorporated herein by reference to Exhibit B, Proxy Statement and Prospectus filed as a part of Amendment No. 1 to AGL Resources Inc. Registration Statement on Form S-4, No. 33-99826). |
| 3.2.a | Articles of Amendment to the Amended and Restated Articles of Incorporation of AGL Resources Inc. |
| 3.2.b | Form of Amended and Restated Articles of Incorporation filed January 5, 1996 with the Secretary of State of the state of Georgia, as amended by the Articles of Amendment to the Amended and Restated Articles of Incorporation filed May 9, 2005 with the Secretary of State of the state of Georgia. |
| 3.3 | Bylaws, as amended on October 29, 2003 (incorporated herein by reference to Exhibit 3.2 of AGL Resources Inc. Annual Report on Form 10-K for the fiscal year ended December 31, 2003). |
| 31.1 | Certification of Paula Rosput Reynolds pursuant to Rule 13a - 14(a) |
| 31.2 | Certification of Richard T. O'Brien pursuant to Rule 13a - 14(a) |
| 32.1 | Certification of Paula Rosput Reynolds pursuant to 18 U.S.C. Section 1350 |
| 32.2 | Certification of Richard T. O'Brien pursuant to 18 U.S.C. Section 1350 |
Pursuant to the requirements of the Securities Exchange Act of 1934, the registrant has duly caused this report to be signed on its behalf by the undersigned thereunto duly authorized.
| | AGL RESOURCES INC. |
| | (Registrant) |
| | |
| Date: July 29, 2005 | /s/ Richard T. O'Brien |
| | Executive Vice President and Chief Financial Officer |