UNITED STATES |
SECURITIES AND EXCHANGE COMMISSION |
Washington, D.C. 20549 |
| |
FORM 10-Q |
| |
(Mark One) | |
[ü] QUARTERLY REPORT PURSUANT TO SECTION 13 OR 15(d) OF |
THE SECURITIES EXCHANGE ACT OF 1934 |
| |
| For the Quarterly Period Ended March 31, 2006 |
| |
OR |
| |
[ ] TRANSITION REPORT PURSUANT TO SECTION 13 OR 15(d) OF |
THE SECURITIES EXCHANGE ACT OF 1934 |
| |
| For the transition period from to |
| |
| Commission File Number 1-14174 |
| |
AGL RESOURCES INC. |
| (Exact name of registrant as specified in its charter) |
| |
Georgia | 58-2210952 |
| (State or other jurisdiction of incorporation or organization) | (I.R.S. Employer Identification No.) |
| |
Ten Peachtree Place NE, Atlanta, Georgia 30309 |
| (Address and zip code of principal executive offices) |
| |
404-584-4000 |
| (Registrant's telephone number, including area code) |
| |
Indicate by check mark whether the registrant (1) has filed all reports required to be filed by Section 13 or 15(d) of the Securities Exchange Act of 1934 during the preceding 12 months (or for such shorter period that the registrant was required to file such reports), and (2) has been subject to such filing requirements for the past 90 days. Yes [ ü] No [ ] |
| |
Indicate by check mark whether the registrant is a large accelerated filer, an accelerated filer, or a non-accelerated filer. (Check one): Large accelerated filer [ ü] Accelerated filer [ ] Non-accelerated filer [ ] |
| |
Indicate by check mark whether the registrant is a shell company (as defined in Exchange Act Rule 12b-2). Yes [ ] No [ü] |
| |
| Indicate the number of shares outstanding of each of the issuer's classes of common stock as of the latest practicable date. |
Class | Outstanding as of April 28, 2006 |
| Common Stock, $5.00 Par Value | 77,931,479 |
AGL RESOURCES INC.
Quarterly Report on Form 10-Q
For the Quarter Ended March 31, 2006
Item Number | | Page(s) |
| | | |
| | PART I - FINANCIAL INFORMATION | 3-40 |
| | | |
| 1 | Condensed Consolidated Financial Statements (Unaudited) | 3-19 |
| | Condensed Consolidated Balance Sheets | 3 |
| | Condensed Consolidated Statements of Income | 4 |
| | Condensed Consolidated Statements of Common Shareholders’ Equity | 5 |
| | Condensed Consolidated Statements of Cash Flows | 6 |
| | Notes to Condensed Consolidated Financial Statements | 7-19 |
| | Note 1 - Accounting Policies and Methods of Application | 7-8 |
| | Note 2 - Risk Management | 8 |
| | Note 3 - Regulatory Assets and Liabilities | 9-10 |
| | Note 4 - Employee Benefit Plans | 10-11 |
| | Note 5 - Stock-based Compensation Plans | 11-14 |
| | Note 6 - Common Shareholders’ Equity | 14 |
| | Note 7 - Debt | 15 |
| | Note 8 - Commitments and Contingencies | 16 |
| | Note 9 - Segment Information | 17-19 |
| 2 | Management's Discussion and Analysis of Financial Condition and Results of Operations | 20-36 |
| | Forward-Looking Statements | 20 |
| | Overview | 20-21 |
| | Results of Operations | 21-33 |
| | AGL Resources | 21-24 |
| | Distribution Operations | 24-26 |
| | Retail Energy Operations | 26-27 |
| | Wholesale Services | 28-31 |
| | Energy Investments | 31-32 |
| | Corporate | 32-33 |
| | Liquidity and Capital Resources | 33-36 |
| | Critical Accounting Policies and Estimates | 36 |
| | Accounting Developments | 36 |
| 3 | Quantitative and Qualitative Disclosures About Market Risk | 36-39 |
| 4 | Controls and Procedures | 40 |
| | | |
| | PART II - OTHER INFORMATION | 40-41 |
| | | |
| 1 | Legal Proceedings | 40 |
| 2 | Unregistered Sales of Equity Securities and Use of Proceeds | 41 |
| 6 | Exhibits | 41 |
| | | |
| | SIGNATURE | 42 |
PART I - Financial Information Item 1. Financial Statements | |
| |
CONDENSED CONSOLIDATED BALANCE SHEETS | |
(UNAUDITED) | |
| | | | | | | | |
In millions, except share data | | March 31, 2006 | | December 31, 2005 | | March 31, 2005 | |
Current assets | | | | | | | |
| Cash and cash equivalents | | $ | 18 | | $ | 30 | | $ | 24 | |
| Receivables (less allowance for uncollectible accounts of $21 at March 31, 2006, $15 at Dec. 31, 2005 and $18 at March 31, 2005) | | | 813 | | | 1,220 | | | 793 | |
| Inventories | | | 432 | | | 543 | | | 202 | |
| Unrecovered environmental remediation costs - current | | | 31 | | | 31 | | | 24 | |
| Unrecovered pipeline replacement program costs - current | | | 26 | | | 27 | | | 28 | |
| Energy marketing and risk management assets | | | 61 | | | 103 | | | 78 | |
| Other | | | 77 | | | 78 | | | 46 | |
| Total current assets | | | 1,458 | | | 2,032 | | | 1,195 | |
Property, plant and equipment | | | | | | | | | | |
| Property, plant and equipment | | | 4,831 | | | 4,791 | | | 4,681 | |
| Less accumulated depreciation | | | 1,484 | | | 1,458 | | | 1,395 | |
| Property, plant and equipment-net | | | 3,347 | | | 3,333 | | | 3,286 | |
Deferred debits and other assets | | | | | | | | | | |
| Goodwill | | | 422 | | | 422 | | | 381 | |
| Unrecovered pipeline replacement program costs | | | 273 | | | 276 | | | 353 | |
| Unrecovered environmental remediation costs | | | 157 | | | 165 | | | 166 | |
| Other | | | 79 | | | 85 | | | 119 | |
| Total deferred debits and other assets | | | 931 | | | 948 | | | 1,019 | |
Total assets | | $ | 5,736 | | $ | 6,313 | | $ | 5,500 | |
Current liabilities | | | | | | | | | | |
| Payables | | $ | 624 | | $ | 1,039 | | $ | 648 | |
| Short-term debt | | | 316 | | | 521 | | | 37 | |
| Current portion of long-term debt | | | 156 | | | 1 | | | 1 | |
| Accrued expenses | | | 126 | | | 105 | | | 139 | |
| Energy marketing and risk management liabilities | | | 46 | | | 117 | | | 71 | |
| Accrued pipeline replacement program costs - current | | | 35 | | | 30 | | | 97 | |
| Accrued environmental remediation costs - current | | | 12 | | | 13 | | | 12 | |
| Other | | | 146 | | | 133 | | | 228 | |
| Total current liabilities | | | 1,461 | | | 1,959 | | | 1,233 | |
Accumulated deferred income taxes | | | 427 | | | 423 | | | 423 | |
Long-term liabilities | | | | | | | | | | |
| Accrued pipeline replacement program costs | | | 226 | | | 235 | | | 249 | |
| Accumulated removal costs | | | 156 | | | 156 | | | 155 | |
| Accrued pension obligations | | | 90 | | | 88 | | | 86 | |
| Accrued environmental remediation costs | | | 84 | | | 84 | | | 62 | |
| Accrued postretirement benefit costs | | | 54 | | | 54 | | | 60 | |
| Other | | | 162 | | | 162 | | | 138 | |
| Total long-term liabilities | | | 772 | | | 779 | | | 750 | |
Commitments and contingencies (Note 8) | | | | | | | | | | |
Minority interest | | | 33 | | | 38 | | | 30 | |
Capitalization | | | | | | | | | | |
| Long-term debt | | | 1,458 | | | 1,615 | | | 1,618 | |
| Common shareholders’ equity, $5 par value; 750,000,000 shares authorized | | | 1,585 | | | 1,499 | | | 1,446 | |
| Total capitalization | | | 3,043 | | | 3,114 | | | 3,064 | |
Total liabilities and capitalization | | $ | 5,736 | | $ | 6,313 | | $ | 5,500 | |
See Notes to Condensed Consolidated Financial Statements (Unaudited).
AGL RESOURCES INC. AND SUBSIDIARIES | |
CONDENSED CONSOLIDATED STATEMENTS OF INCOME | |
(UNAUDITED) | |
| | | | |
| | | Three months ended | |
| | | March 31, | |
| | 2006 | | 2005 | |
| Operating revenues | | $ | 1,047 | | $ | 912 | |
| Operating expenses | | | | | | | |
| Cost of gas | | | 658 | | | 572 | |
| Operation and maintenance | | | 117 | | | 115 | |
| Depreciation and amortization | | | 34 | | | 33 | |
| Taxes other than income | | | 10 | | | 11 | |
| Total operating expenses | | | 819 | | | 731 | |
| Operating income | | | 228 | | | 181 | |
| Other (expense) income | | | (2 | ) | | 1 | |
| Interest expense | | | (30 | ) | | (26 | ) |
| Minority interest | | | (19 | ) | | (13 | ) |
| Earnings before income taxes | | | 177 | | | 143 | |
| Income taxes | | | 67 | | | 55 | |
| Net income | | $ | 110 | | $ | 88 | |
| | | | | | | | |
| Basic earnings per common share | | $ | 1.42 | | $ | 1.15 | |
| Diluted earnings per common share | | $ | 1.41 | | $ | 1.14 | |
| Cash dividends paid per common share | | $ | 0.37 | | $ | 0.31 | |
| Weighted-average number of common shares outstanding | | | | | | | |
| Basic | | | 77.9 | | | 76.9 | |
| Diluted | | | 78.2 | | | 77.6 | |
See Notes to Condensed Consolidated Financial Statements (Unaudited).
AGL RESOURCES INC. AND SUBSIDIARIES CONDENSED CONSOLIDATED STATEMENTS OF COMMON SHAREHOLDERS’ EQUITY (UNAUDITED) | |
| | | | | | | | | | | | | | | | |
| | | | | | | Premium on | | | | Other | | Shares | | | |
| | | Common Stock | | common | | Earnings | | comprehensive | | Held in | | | |
In millions, except per share amount | | Shares | | Amount | | shares | | reinvested | | income | | Treasury | | Total | |
| Balance as of December 31, 2005 | | | 77.8 | | $ | 389 | | $ | 655 | | $ | 508 | | $ | (53 | ) | $ | - | | $ | 1,499 | |
| Comprehensive income: | | | | | | | | | | | | | | | | | | | | | | |
| Net income | | | - | | | - | | | - | | | 110 | | | - | | | - | | | 110 | |
| Unrealized gain from hedging activities (net of taxes) | | | - | | | - | | | - | | | - | | | 2 | | | - | | | 2 | |
| Total comprehensive income | | | | | | | | | | | | | | | | | | | | | 112 | |
| Dividends on common shares ($0.37 per share) | | | - | | | - | | | - | | | (29 | ) | | - | | | - | | | (29 | ) |
| Benefit, dividend reinvestment and share purchase plans | | | 0.3 | | | 2 | | | 4 | | | - | | | - | | | (4 | ) | | 2 | |
| Stock-based compensation expense (net of tax benefit of $1) | | | - | | | - | | | 1 | | | - | | | - | | | - | | | 1 | |
| Balance as of March 31, 2006 | | | 78.1 | | $ | 391 | | $ | 660 | | $ | 589 | | $ | (51 | ) | $ | (4 | ) | $ | 1,585 | |
See Notes to Condensed Consolidated Financial Statements (Unaudited).
| |
CONDENSED CONSOLIDATED STATEMENTS OF CASH FLOWS | |
(UNAUDITED) | |
| | | | |
| | | Three months ended | |
| | | March 31, | |
In millions | | 2006 | | 2005 | |
Cash flows from operating activities | | | | | |
| Net income | | $ | 110 | | $ | 88 | |
| Adjustments to reconcile net income to net cash flow provided by operating activities | | | | | | | |
| Depreciation and amortization | | | 34 | | | 33 | |
| Minority interest | | | 19 | | | 13 | |
| Deferred income taxes | | | 4 | | | (14 | ) |
| Change in risk management assets and liabilities | | | (12 | ) | | 17 | |
| Changes in certain assets and liabilities | | | | | | | |
| Receivables | | | 407 | | | 96 | |
| Inventories | | | 111 | | | 129 | |
| Payables | | | (415 | ) | | (80 | ) |
| Other | | | 28 | | | 109 | |
| Net cash flow provided by operating activities | | | 286 | | | 391 | |
Cash flows from investing activities | | | | | | | |
| Property, plant and equipment expenditures | | | (47 | ) | | (81 | ) |
| Other | | | 5 | | | 3 | |
| Net cash flow used in investing activities | | | (42 | ) | | (78 | ) |
Cash flows from financing activities | | | | | | | |
| Payments and borrowings of short-term debt, net | | | (205 | ) | | (295 | ) |
| Dividends paid on common shares | | | (29 | ) | | (24 | ) |
| Distribution to minority interest | | | (22 | ) | | (19 | ) |
| Purchase of treasury shares | | | (4 | ) | | - | |
| Sale of common stock | | | 4 | | | - | |
| Net cash flow used in financing activities | | | (256 | ) | | (338 | ) |
| Net decrease in cash and cash equivalents | | | (12 | ) | | (25 | ) |
| Cash and cash equivalents at beginning of period | | | 30 | | | 49 | |
| Cash and cash equivalents at end of period | | $ | 18 | | $ | 24 | |
Cash paid during the period for | | | | | | | |
| Interest (net of allowance for funds used during construction) | | $ | 23 | | $ | 13 | |
| Income taxes | | $ | 12 | | $ | 1 | |
See Notes to Condensed Consolidated Financial Statements (Unaudited).
AGL RESOURCES INC. AND SUBSIDIARIES NOTES TO CONDENSED CONSOLIDATED FINANCIAL STATEMENTS (UNAUDITED)
Note 1
Accounting Policies and Methods of Application
General
AGL Resources Inc. is an energy services holding company that conducts substantially all of its operations through its subsidiaries. Unless the context requires otherwise, references to “we,” “us,” “our” or the “company” are intended to mean consolidated AGL Resources Inc. and its subsidiaries (AGL Resources).
We have prepared the accompanying unaudited condensed consolidated financial statements under the rules of the Securities and Exchange Commission (SEC). Under such rules and regulations, we have condensed or omitted certain information and notes normally included in financial statements prepared in conformity with accounting principles generally accepted in the United States of America (GAAP). However, the condensed consolidated financial statements reflect all adjustments that are, in the opinion of management, necessary for a fair presentation of our financial results for the interim periods. You should read these condensed consolidated financial statements in conjunction with our consolidated financial statements and related notes included in our Annual Report on Form 10-K for the year ended December 31, 2005, filed with the SEC on February 10, 2006.
Due to the seasonal nature of our business, our results of operations for the three months ended March 31, 2006 and 2005 and our financial position as of December 31, 2005 and March 31, 2006 and 2005 are not necessarily indicative of the results of operations and financial condition to be expected as of or for any other period.
Basis of Presentation
Our condensed consolidated financial statements include our accounts, the accounts of our majority-owned and controlled subsidiaries and the accounts of variable interest entities for which we are the primary beneficiary. All significant intersegment items have been eliminated in consolidation. Certain amounts from prior periods have been reclassified and revised to conform to the current period presentation. Specifically, $62 million of negative salvage previously presented at December 31, 2005 and March 31, 2005 in accumulated depreciation has been classified in accumulated removal costs for all balance sheet dates presented herein. The year-end December 31, 2005 condensed consolidated balance sheet amounts are derived from our audited balance sheet as of December 31, 2005.
Prior to our sale of Saltville Gas Storage Company, LLC (Saltville) in August 2005, we used the equity method to account for and report our 50% interest in Saltville. Saltville was a joint venture with Duke Energy Corporation to develop a high-deliverability natural gas storage facility in Saltville, Virginia. We used the equity method because we exercised significant influence over, but did not control, the entity and because we were not the primary beneficiary as defined by Financial Accounting Standards Board (FASB) Interpretation No. 46, “Consolidation of Variable Interest Entities,” as revised in December 2003 (FIN 46R).
Comprehensive Income
Our comprehensive income includes net income plus other comprehensive income (OCI), which includes other gains and losses affecting shareholders’ equity that GAAP excludes from net income. Such items consist primarily of unrealized gains and losses on certain derivatives designated as cash flow hedges. The following table illustrates our OCI activity for the three months ended March 31, 2006 and 2005.
In millions | | 2006 | | 2005 | |
| Cash flow hedges: | | | | | | | |
| Net derivative unrealized gains arising during the period (net of $5 and $1 in taxes) | | | 7 | | | 2 | |
| Less reclassification of realized gains included in income (net of $3 and $3 in taxes) | | | (5 | ) | | (5 | ) |
| Total | | $ | 2 | | $ | (3 | ) |
Earnings per Common Share
We compute basic earnings per common share by dividing our income available to common shareholders by the weighted-average number of common shares outstanding daily. Diluted earnings per common share reflect the potential reduction in earnings per common share that could occur when potential dilutive common shares are added to common shares outstanding.
We derive our potential dilutive common shares by calculating the number of shares issuable under restricted stock, restricted share units and stock options. The future issuance of shares underlying the restricted stock and restricted share units depends on the satisfaction of certain performance criteria. The future issuance of shares underlying the outstanding stock options depends upon whether the exercise prices of the stock options are less than the average market price of the common shares for the respective periods. The following table shows the calculation of our diluted shares, assuming restricted stock and restricted stock units currently awarded under the plan ultimately vest and stock options currently exercisable at prices below the average market prices are exercised.
| | | Three months ended March 31, | |
In millions | | 2006 | | 2005 | |
| Denominator for basic earnings per share (1) | | | 77.9 | | | 76.9 | |
| Assumed exercise of restricted stock, restricted stock units and stock options | | | 0.3 | | | 0.7 | |
| Denominator for diluted earnings per share | | | 78.2 | | | 77.6 | |
| (1) | Daily weighted-average shares outstanding |
Note 2
Risk Management
Our risk management activities are monitored by our Risk Management Committee (RMC). The RMC consists of members of senior management and is charged with reviewing our risk management activities and overseeing enforcement of our risk management policies. Our risk management policies limit the use of derivative financial instruments and physical transactions within predefined risk tolerances associated with pre-existing or anticipated physical natural gas sales and purchases and system use and storage. We use the following derivative financial instruments and physical transactions to manage commodity price risks:
| · | storage and transportation capacity transactions |
There have been no significant changes to our risk management activities, as described in Note 4 to our Consolidated Financial Statements in Item 8 of our Annual Report on Form 10-K for the year ended December 31, 2005.
Regulatory Assets and Liabilities
We have recorded regulatory assets and liabilities in our consolidated balance sheets in accordance with SFAS No. 71, “Accounting for the Effects of Certain Types of Regulation.” Our regulatory assets and liabilities, and associated liabilities for our unrecovered pipeline replacement program (PRP) costs and unrecovered environmental remediation costs (ERC), are summarized in the table below:
In millions | | March 31, 2006 | | Dec. 31, 2005 | | March 31, 2005 | |
Regulatory assets | | | | | | | |
| Unrecovered PRP costs | | $ | 299 | | $ | 303 | | $ | 381 | |
| Unrecovered ERC | | | 188 | | | 196 | | | 190 | |
| Unrecovered postretirement benefit costs | | | 13 | | | 14 | | | 14 | |
| Unrecovered seasonal rates | | | - | | | 11 | | | - | |
| Energy marketing and risk management | | | 3 | | | 17 | | | 17 | |
| Unrecovered purchased gas adjustment | | | - | | | 8 | | | - | |
| Other | | | 8 | | | 10 | | | 6 | |
Total regulatory assets | | $ | 511 | | $ | 559 | | $ | 608 | |
Regulatory liabilities | | | | | | | | | | |
| Accumulated removal costs | | $ | 156 | | $ | 156 | | $ | 155 | |
| Deferred purchased gas adjustment | | | 24 | | | 40 | | | 63 | |
| Deferred seasonal rates | | | 23 | | | - | | | 22 | |
| Unamortized investment tax credit | | | 19 | | | 19 | | | 20 | |
| Regulatory tax liability | | | 15 | | | 15 | | | 11 | |
| Energy marketing and risk management | | | 3 | | | 17 | | | 17 | |
| Other | | | 6 | | | 6 | | | - | |
| Total regulatory liabilities | | | 246 | | | 253 | | | 288 | |
Associated liabilities | | | | | | | | | | |
| PRP costs | | | 261 | | | 265 | | | 346 | |
| ERC | | | 96 | | | 97 | | | 74 | |
| Total associated liabilities | | | 357 | | | 362 | | | 420 | |
Total regulatory and associated liabilities | | $ | 603 | | $ | 615 | | $ | 708 | |
Our regulatory assets and liabilities are described in Note 5 to our Consolidated Financial Statements in Item 8 of our Annual Report on Form 10-K for the year ended December 31, 2005. The following represent significant changes to our regulatory assets and liabilities during the three months ended March 31, 2006:
Environmental Remediation Costs
We are subject to federal, state and local laws and regulations governing environmental quality and pollution control. These laws and regulations require us to remove or remedy the effect on the environment of the disposal or release of specified substances at current and former operating sites.
Atlanta Gas Light Atlanta Gas Light’s current engineering estimate projects costs of $12 million to complete site remediation in Georgia and at one Florida site, excluding monitoring. This represents no change from the estimated costs at December 31, 2005.
The current estimate for the remaining cost of future actions at these former operating sites is $15 million, which may change depending on whether future measures for groundwater will be required. Atlanta Gas Light estimates certain other costs related to administering the remediation program, including administrative costs, to be $2 million. As of March 31, 2006, the remediation expenditures expected to be incurred over the next 12 months are reflected as a current liability of $8 million.
These liabilities do not include other potential expenses, such as unasserted property damage claims, personal injury or natural resource damage claims, unbudgeted legal expenses or other costs for which Atlanta Gas Light may be held liable but with respect to which it cannot reasonably estimate an amount.
Elizabethtown Gas In New Jersey, Elizabethtown Gas is currently conducting remediation activities at some of its former operating sites with oversight from the New Jersey Department of Environmental Protection. Although we cannot estimate the actual total cost of future environmental investigation and remediation efforts with precision, based on probabilistic models similar to those used at Atlanta Gas Light’s former operating sites, the range of reasonably probable costs is $57 million to $104 million. As of March 31, 2006, no value within this range was a better estimate than any other value, so we have recorded a liability equal to the low end of that range, or $57 million.
Prudently incurred remediation costs for the New Jersey properties have been authorized by the New Jersey Board of Public Utilities (NJBPU) to be recoverable in rates through a remediation adjustment clause. As a result, Elizabethtown Gas has recorded a regulatory asset of approximately $63 million, inclusive of interest, as of March 31, 2006, reflecting the future recovery of both incurred costs and accrued carrying charges. Elizabethtown Gas has also been successful in recovering a portion of remediation costs incurred in New Jersey from its insurance carriers and continues to pursue additional recovery.
Sites in North Carolina We also own a remediation site in Elizabeth City, North Carolina that is subject to a remediation order by the North Carolina Department of Energy and Natural Resources. We currently have only partial information regarding environmental impacts at the Elizabeth City site, and therefore we can make quantitative cost estimates only for limited components of a site cleanup. However, experience at other similar sites suggests that costs for remediation of this site will likely range from $10 million to $17 million. As of March 31, 2006, we have recorded a liability of $10 million related to this site.
There is one other site in North Carolina where investigation and remediation is likely, although no remediation order exists. Limited information is available. As a result, we do not believe costs associated with this site can be reasonably estimated. In addition, there are as many as six other sites with which NUI Corporation (NUI), which we acquired in November 2004, had some association, although no basis for liability has been asserted, and accordingly we have not accrued any remediation liability. There are currently no cost recovery mechanisms for the environmental remediation sites in North Carolina.
Employee Benefit Plans
Pension Benefits We sponsor two tax qualified defined benefit retirement plans for our eligible employees: the AGL Resources Inc. Retirement Plan and the NUI Corporation Retirement Plan. A defined benefit plan specifies the amount of benefits an eligible participant eventually will receive using information about the participant. The following are the combined cost components of our two pension plans for the periods indicated:
| | | Three months ended | |
| | | March 31, | |
In millions | | 2006 | | 2005 | |
| Service cost | | $ | 2 | | $ | 2 | |
| Interest cost | | | 6 | | | 6 | |
| Expected return on plan assets | | | (8 | ) | | (8 | ) |
| Net amortization | | | - | | | - | |
| Recognized actuarial loss | | | 2 | | | 2 | |
| Net cost | | $ | 2 | | $ | 2 | |
Our employees do not contribute to the retirement plans. We fund the plans by contributing at least the minimum amount required by applicable regulations and as recommended by our actuary. However, we may also contribute in excess of the minimum required amount. We calculate the minimum amount of funding using the projected unit credit cost method. We are not required to make any contribution to our pension plans in 2006.
Postretirement Benefits We sponsor two defined benefit postretirement health care plans for our eligible employees: the AGL Resources Inc. Postretirement Health Care Plan and the NUI Corporation Postretirement Health Care Plan. Eligibility for these benefits is based on age and years of service. The following are the combined cost components of these two postretirement benefit plans for the periods indicated:
| | | Three months ended | |
| | | March 31, | |
In millions | | 2006 | | 2005 | |
| Service cost | | $ | - | | $ | - | |
| Interest cost | | | 2 | | | 2 | |
| Expected return on plan assets | | | (1 | ) | | (1 | ) |
| Prior service cost | | | (1 | ) | | (1 | ) |
| Recognized actuarial loss | | | - | | | - | |
| Net cost | | $ | - | | $ | - | |
Stock-based Compensation Plans
Effective January 1, 2006, we adopted Statement of Financial Accounting Standards (SFAS) No. 123(R), “Share-Based Payment” (SFAS 123R), using the modified prospective application transition method; accordingly, financial results for the prior period presented were not retroactively adjusted to reflect the effects of SFAS 123R. Because the fair value recognition provisions of SFAS No. 123, “Stock-Based Compensation” (SFAS 123), and SFAS 123R were materially consistent under our equity plans, the adoption of SFAS 123R did not have a significant impact on our financial position or our results of operations.
SFAS 123R requires us to measure and recognize stock-based compensation expense in our financial statements based on the estimated fair value at the date of grant for our share-based awards, which include performance shares and stock options. Performance share awards contain market conditions; both performance share and stock option awards contain a service condition. In accordance with SFAS 123R, we recognize compensation expense over the requisite service period for:
| · | awards granted on or after January 1, 2006; and |
| · | unvested awards previously granted and outstanding as of January 1, 2006. |
In addition, we estimate forfeitures over the requisite service period when recognizing compensation expense; these estimates are adjusted to the extent that actual forfeitures differ, or are expected to materially differ, from such estimates. Our net income for the three months ended March 31, 2006 includes $2 million of compensation costs and $1 million of income tax benefits related to our stock-based compensation awards.
Prior to January 1, 2006, we accounted for our share-based payment transactions in accordance with SFAS 123, as amended by SFAS No. 148, “Accounting for Stock-Based Compensation- Transition and Disclosure,” which allowed us to follow Accounting Principles Board (APB) Opinion No. 25, “Accounting for Stock Issued to Employees” (APB 25) and related interpretations in accounting for our stock-based compensation plans.
In accordance with APB 25, we did not record compensation expense related to our stock option grants in our financial statements in 2005. At the end of each reporting period, we did record compensation expense over the requisite service period for our other stock-based and cash unit awards to certain key employees based on certain criteria being met. Accordingly, our net income for the three months ended March 31, 2005 includes $1 million of compensation costs and $1 million of income tax benefits related to those performance shares.
Prior to our adoption of SFAS 123R, benefits of tax deductions in excess of recognized compensation costs were reported as operating cash flows. SFAS 123R requires excess tax benefits be reported as a financing cash inflow rather than as a reduction of taxes paid. For the three months ended March 31, 2006, our cash flow used in financing activities included an immaterial amount for benefits of tax deductions in excess of recognized compensation costs. For the same period last year, $1 million of such benefits was included in cash flow provided by operating activities.
If stock-based compensation expense for the three months ended March 31, 2005 had been determined and recorded based on the fair value of the awards at the grant dates consistent with the method prescribed by SFAS 123, which was superseded by SFAS 123R, our net income and earnings per share for the three months ended March 31, 2005 would have been reduced to the amounts shown in the following table:
| | | Three months ended | |
| In millions, except per share amounts | | March 31, 2005 | |
| Net income, as reported | | $ | 88 | |
| Deduct: Total stock-based employee compensation expense determined under fair value-based method for all awards, net of related tax effect | | | (1 | ) |
| Pro-forma net income | | $ | 87 | |
| | | | | |
| Earnings per share: | | | | |
| Basic - as reported | | $ | 1.15 | |
| Basic - pro-forma | | $ | 1.14 | |
| | | | | |
| Diluted - as reported | | $ | 1.14 | |
| Diluted - pro-forma | | $ | 1.13 | |
Incentive and Nonqualified Stock Options
We grant incentive and nonqualified stock options at the fair market value on the date of the grant. Stock options generally have a three year vesting period. As of March 31, 2006, our Board of Directors has authorized 10 million shares to be granted as stock options. The vesting of incentive options is subject to a statutory limitation of $100,000 per year under Section 422A of the Internal Revenue Code. Nonqualified options generally become fully exercisable not earlier than six months after the date of grant and generally expire 10 years after the date of grant. Participants realize value from option grants only to the extent that the fair market value of our common stock on the date of exercise of the option exceeds the fair market value of the common stock on the date of the grant. Compensation expense associated with stock options generally is recorded over the option vesting period. Provided, however, for unvested options that are granted to employees who are retirement eligible, the remaining compensation expense is recorded in the current period rather than over the remaining vesting period.
As of March 31, 2006, we had $6 million of total unrecognized compensation costs related to stock options. These costs are expected to be recognized over the remaining average vesting period of 3 years. Cash received from stock option exercises for the three months ended March 31, 2006 was $4 million, and the income tax benefit from stock option exercises was $1 million. The following table summarizes activity during the three months ended March 31, 2006 related to grants of stock options for key employees and nonemployee directors.
| | | Number of Options | | Weighted Average Exercise Price | | Remaining Term (in years) | | Aggregate Intrinsic Value (in millions) | |
| Outstanding - December 31, 2005 | | | 2,221,245 | | $ | 27.79 | | | 6.8 | | $ | 16.0 | |
| Granted | | | 899,252 | | | 35.79 | | | 9.9 | | | 0.2 | |
| Exercised | | | (165,616 | ) | | 24.98 | | | 5.9 | | | (1.8 | ) |
| Forfeited | | | (162,789 | ) | | 34.93 | | | 9.3 | | | (0.2 | ) |
| Outstanding - March 31, 2006 | | | 2,792,092 | | $ | 30.12 | | | 7.7 | | $ | 14.2 | |
| | | | | | | | | | | | | | |
| Exercisable - March 31, 2006 | | | 1,337,067 | | $ | 24.93 | | | 6.0 | | $ | 14.9 | |
| | | Number of Unvested Options | | Weighted Average Exercise Price | | Remaining Term (in years) | | Aggregate Intrinsic Value (in millions) | |
| Outstanding - December 31, 2005 | | | 937,019 | | $ | 33.64 | | | 9.1 | | $ | 2.3 | |
| Granted | | | 899,252 | | | 35.79 | | | 9.9 | | | 0.2 | |
| Forfeited | | | (160,337 | ) | | 34.95 | | | 9.3 | | | (0.2 | ) |
| Vested | | | (230,077 | ) | | 33.19 | | | 8.8 | | | (0.6 | ) |
| Outstanding - March 31, 2006 | | | 1,445,857 | | $ | 34.94 | | | 9.5 | | $ | 1.7 | |
In accordance with the fair value method of determining compensation expense, we used the Black-Scholes pricing model. Following is the per share value and information about the underlying assumptions used in developing the grant date value for each of the grants made during the three months ended March 31, 2006 and 2005.
| | | Three months ended March 31, | |
| | | 2006 | | 2005 | |
| Expected life (years) | | | 7 | | | 7 | |
| Risk-free interest rate (1) | | | 4.6 | % | | 4.0 | % |
| Expected volatility (2) | | | 15.8 | % | | 17.3 | % |
| Dividend yield | | | 4.1 | % | | 3.7 | % |
| | | | | | | | |
| Fair value of options granted (3) | | $ | 4.78 | | $ | 4.56 | |
| (1) | US Treasury constant maturity - 7 years |
(2) Volatility is measured over 7 years, the expected life of the options
(3) Represents per share value.
Stock and Restricted Stock Awards
Stock Awards Under the 1996 Non-Employee Directors Equity Compensation Plan (Directors Plan), each nonemployee director receives an annual retainer. The amount and form of the annual retainer is fixed by resolution of the Board. Effective in January 2006, the annual retainer was increased from $60,000 to $90,000, of which (1) $30,000 is payable in cash or, at the election of each director, in shares of our common stock or is deferred and invested in common stock equivalents under the 1998 Common Stock Equivalent Plan for Non-Employee Directors (CSE Plan) and (2) $60,000 is payable, at the election of each director, in shares of our common stock or deferred under the CSE Plan. Upon initial election to our Board of Directors, each nonemployee director receives 1,000 shares of common stock as of the first day of his or her service. Shares issued under the Directors Plan are 100% vested and nonforfeitable as of the date of grant.
Restricted Stock Awards In general, we refer to an award of our common stock that is subject to time-based vesting or achievement of performance measures as “restricted stock.” Restricted stock awards are subject to certain transfer restrictions and forfeiture upon termination of employment.
In March 2006 we granted to a select group of executive officers a total of 40,000 shares of our restricted stock. The following table summarizes activity during the three months ended March 31, 2006 related to restricted stock awards for our key employees and nonemployee directors.
| | | Number Restricted Stocks | | Weighted Average Exercise Price | | Remaining Life (in years) | |
| Outstanding - December 31, 2005 | | | 108,734 | | $ | 33.99 | | | 2.3 | |
| Issued | | | 93,200 | | | 35.25 | | | 3.7 | |
| Forfeited | | | (18,601 | ) | | 33.01 | | | 2.6 | |
| Vested | | | (333 | ) | | 34.81 | | | 2.8 | |
| Outstanding - March 31, 2006 (1) | | | 183,000 | | $ | 35.48 | | | 2.8 | |
(1) Includes 53,200 restricted stock units that vested in December 2005 and were converted to restricted shares in January 2006.
Performance Units
In general, a performance unit is an award of the right to receive either (1) an equal number of shares of company common stock or (2) cash, subject to the achievement of certain pre-established performance criteria. Performance units are subject to certain transfer restrictions and forfeiture upon termination of employment. In the first quarter of 2006, we granted restricted stock units and performance cash units to a select group of officers as described below.
Restricted Stock Units In general, a restricted stock unit is an award that represents the opportunity to receive a specified number of shares of our common stock, subject to the achievement of certain pre-established performance criteria.
In February 2006, we granted to a select group of officers a total of 64,700 restricted stock units under the LTIP of which all of these units were outstanding as of March 31, 2006. These restricted stock units have a 12-month performance measurement period related to an increase in earnings per share.
Performance Cash Units In general, a performance cash unit is an award that represents the opportunity to receive a cash award, subject to the achievement of certain pre-established performance criteria.
In January 2006, we granted performance cash units to a select group of officers under the Long-Term Incentive Plan (1999) (LTIP). The performance cash units represent a maximum aggregate payout of $2 million. The performance cash units have a 36-month performance measurement period and a performance measure that relates to our average annual growth in basic earnings per share plus the average dividend yield.
As of March 31, 2006, based on our anticipated performance, we had recorded a liability of less than a million dollars for these performance cash units.
Stock Appreciation Rights (SAR)
We have granted SARs, which are payable in cash, at fair market value on the date of grant. SARs generally become fully exercisable not earlier than 12 months after the date of grant and generally expire six years after that date. Participants realize value from SAR grants only to the extent that the fair market value of our common stock on the date of exercise of the SAR exceeds the fair market value of the common stock on the date of the grant. At March 31, 2006, we had approximately 27,000 SARs outstanding.
Note 6
Common Shareholder’ Equity
Share Repurchase Program
In February 2006, our Board of Directors authorized a plan to purchase up to 8 million shares of our outstanding common stock over a five-year period. These purchases are intended to principally offset share issuances under our employee and nonemployee director incentive compensation plans and our dividend reinvestment and stock purchase plans. Stock purchases under this program may be made in the open market or in private transactions at times and in amounts that we deem appropriate. There is no guarantee as to the exact number of shares that we may purchase, and we may terminate or limit the program at any time. We will hold the purchased shares as treasury shares. During the three months ended March 31, 2006, we repurchased 85,500 shares at a weighted average price of $35.42.
Note 7
Debt
Our issuance of long-term and short-term debt, including various forms of securities, is subject to customary approval or authorization by state and federal regulatory bodies, including state public service commissions and the SEC. Our financing consists of the short and long-term debt indicated in the following table. There have been no significant changes to our debt since December 31, 2005, which was described in Note 9 to our Consolidated Financial Statements in Item 8 of our Annual Report on Form 10-K for the year ended December 31, 2005.
| | | | | | | Outstanding as of: | |
Dollars in millions | | Year(s) due | | Int. rate (1) | | Mar. 31, 2006 | | Dec. 31, 2005 | | Mar. 31, 2005 | |
Short-term debt | | | | | | | | | | | |
| Commercial paper | | | 2006 | | | 4.9%(2 | ) | $ | 291 | | $ | 485 | | $ | 31 | |
| Notes payable to Trusts | | | 2006 | | | 8.0 | | | 155 | | | - | | | - | |
| Sequent lines of credit | | | 2006 | | | 5.5(3 | ) | | 25 | | | - | | | - | |
| Capital leases | | | 2006 | | | 4.9 | | | 1 | | | 1 | | | 1 | |
| SouthStar line of credit | | | 2006 | | | - | | | - | | | 36 | | | 6 | |
Total short-term debt | | | | | | 5.9%(4 | ) | $ | 472 | | $ | 522 | | $ | 38 | |
Long-term debt - net of current portion | | | | | | | | | | | | | | | | |
| Senior notes | | | 2011-2034 | | | 4.5 - 7.1 | % | $ | 975 | | $ | 975 | | $ | 975 | |
| Medium-term notes | | | 2012-2027 | | | 6.6 - 9.1 | | | 208 | | | 208 | | | 208 | |
| Gas facility revenue bonds, net of unamortized issuance costs | | | 2022-2033 | | | 3.0 - 5.7 | | | 199 | | | 199 | | | 199 | |
| Notes payable to Trusts | | | 2037 | | | 8.2 | | | 77 | | | 232 | | | 232 | |
| Capital leases | | | 2013 | | | 4.9 | | | 6 | | | 6 | | | 8 | |
| Interest rate swaps | | | 2011 | | | 8.1 | | | (7 | ) | | (5 | ) | | (4 | ) |
Total long-term debt | | | | | | 6.0%(4 | ) | $ | 1,458 | | $ | 1,615 | | $ | 1,618 | |
| | | | | | | | | | | | | | | | | |
Total short-term and long-term debt | | | | | | 6.0%(4 | ) | $ | 1,930 | | $ | 2,137 | | $ | 1,656 | |
| (1) | As of March 31, 2006. |
| (2) | The daily weighted average rate was 4.6% for the three months ended March 31, 2006. |
| (3) | The daily weighted average rate was 5.1% for the three months ended March 31, 2006. |
| (4) | Weighted average interest rate, including interest rate swaps if applicable and excluding debt issuance and other financing related costs. |
In March 2001, we established AGL Capital Trust II (Trust II), of which we own all of the common voting securities. In May 2001, Trust II issued and sold $150 million of 8.00% capital securities, and used the proceeds to purchase 8.00% junior subordinated deferrable interest debentures from us. In March 2006, we issued a notice to the Trustee of Trust II to redeem the $150 million of junior subordinated debentures on May 21, 2006. We have reclassified $155 million, which includes a $5 million note payable representing our investment in the Trusts, previously included in notes payable to Trusts, as current portion of long-term debt in our condensed consolidated balance sheet as of March 31, 2006.
Commitments and Contingencies
Contractual Obligations and Commitments We have incurred various contractual obligations and financial commitments in the normal course of our operations and financing activities. Contractual obligations include future cash payments required under existing contractual arrangements, such as debt and lease agreements. These obligations may result from both general financing activities and from commercial arrangements that are directly supported by related revenue-producing activities. There were no significant changes to our contractual obligations which were described in Note 10 to our Consolidated Financial Statements in Item 8 of our Annual Report on Form 10-K for the year ended December 31, 2005.
We also have incurred various financial commitments in the normal course of business. Contingent financial commitments represent obligations that become payable only if certain predefined events occur, such as financial guarantees, and include the nature of the guarantee and the maximum potential amount of future payments that could be required of us as the guarantor. The following table illustrates our expected contingent financial commitments as of March 31, 2006.
| | | | | Commitments due before Dec. 31, 2007 & | |
| | | | |
In millions | | Total | | 2006 | | thereafter | |
| Standby letters of credit and performance and surety bonds | | $ | 21 | | $ | 21 | | | - | |
Litigation We are involved in litigation arising in the normal course of business. There has been no significant change in the litigation which was described in Note 10 to our Consolidated Financial Statements in Item 8 of our Annual Report on Form 10-K for the year ended December 31, 2005. We believe the ultimate resolution of such litigation will not have a material adverse effect on our consolidated financial position, results of operations or cash flows.
Note 9
Segment Information
Our four operating segments are:
| · | Distribution operations, which consists primarily of: |
| · | Retail energy operations, which consists of SouthStar |
| · | Wholesale services, which consists primarily of Sequent |
| · | Energy investments, which consists primarily of: |
| o | Pivotal Jefferson Island |
We treat corporate, our fifth segment, as a non-operating business segment, and it includes AGL Resources Inc., AGL Services Company, nonregulated financing subsidiaries and the effect of intersegment eliminations. We eliminated intersegment sales for the three months ended March 31, 2006 and 2005 from our condensed consolidated statements of income.
We evaluate segment performance based primarily on the non-GAAP measure of earnings before interest and taxes (EBIT), which includes the effects of corporate expense allocations. EBIT is a non-GAAP measure that includes operating income, other income and minority interest. Items that we do not include in EBIT are financing costs, including interest and debt expense and income taxes, each of which we evaluate on a consolidated level. We believe EBIT is a useful measurement of our performance because it provides information that can be used to evaluate the effectiveness of our businesses from an operational perspective, exclusive of the costs to finance those activities and exclusive of income taxes, neither of which we believe is directly relevant to the efficiency of those operations.
You should not consider EBIT an alternative to, or a more meaningful indicator of our operating performance than, operating income or net income as determined in accordance with GAAP. In addition, our EBIT may not be comparable to a similarly titled measure of another company. The reconciliations of EBIT to operating income and net income for the three months ended March 31, 2006 and 2005 are presented below.
| | | Three months ended March 31, | |
In millions | | 2006 | | 2005 | |
| Operating revenues | | $ | 1,047 | | $ | 912 | |
| Operating expenses | | | 819 | | | 731 | |
| Operating income | | | 228 | | | 181 | |
| Other income | | | (2 | ) | | 1 | |
| Minority interest | | | (19 | ) | | (13 | ) |
| EBIT | | | 207 | | | 169 | |
| Interest expense | | | (30 | ) | | (26 | ) |
| Earnings before income taxes | | | 177 | | | 143 | |
| Income taxes | | | (67 | ) | | (55 | ) |
| Net income | | $ | 110 | | $ | 88 | |
Summarized income statement information and property, plant and equipment expenditures as of and for the three months ended March 31, 2006 and 2005 by segment are shown in the following tables:
| 2006 | | | | | | | | | | | | | |
In millions | | Distribution operations | | Retail energy operations | | Wholesale services | | Energy investments | | Corporate and intersegment eliminations | | Consolidated AGL Resources | |
| Operating revenues from external parties | | $ | 596 | | $ | 390 | | $ | 51 | | $ | 10 | | $ | - | | $ | 1,047 | |
| Intersegment revenues (1) | | | 44 | | | - | | | - | | | - | | | (44 | ) | | - | |
| Total operating revenues | | | 640 | | | 390 | | | 51 | | | 10 | | | (44 | ) | | 1,047 | |
| Operating expenses | | | | | | | | | | | | | | | | | | | |
| Cost of gas | | | 395 | | | 296 | | | 8 | | | 2 | | | (43 | ) | | 658 | |
| Operation and maintenance | | | 85 | | | 18 | | | 11 | | | 5 | | | (2 | ) | | 117 | |
| Depreciation and amortization | | | 29 | | | 1 | | | - | | | 1 | | | 3 | | | 34 | |
| Taxes other than income taxes | | | 8 | | | - | | | - | | | - | | | 2 | | | 10 | |
| Total operating expenses | | | 517 | | | 315 | | | 19 | | | 8 | | | (40 | ) | | 819 | |
| Operating income (loss) | | | 123 | | | 75 | | | 32 | | | 2 | | | (4 | ) | | 228 | |
| Other expenses | | | - | | | (2 | ) | | - | | | - | | | - | | | (2 | ) |
| Minority interest | | | - | | | (19 | ) | | - | | | - | | | - | | | (19 | ) |
| EBIT | | $ | 123 | | $ | 54 | | $ | 32 | | $ | 2 | | $ | (4 | ) | $ | 207 | |
| | | | | | | | | | | | | | | | | | | | |
| Property, plant and equipment expenditures | | $ | 33 | | $ | 1 | | $ | 1 | | $ | 1 | | $ | 11 | | $ | 47 | |
| 2005 | | | | | | | | | | | | | |
In millions | | Distribution operations | | Retail energy operations | | Wholesale services | | Energy investments | | Corporate and intersegment eliminations | | Consolidated AGL Resources | |
| Operating revenues from external parties | | $ | 575 | | $ | 314 | | $ | 11 | | $ | 12 | | $ | - | | $ | 912 | |
| Intersegment revenues (1) | | | 59 | | | - | | | - | | | - | | | (59 | ) | | - | |
| Total operating revenues | | | 634 | | | 314 | | | 11 | | | 12 | | | (59 | ) | | 912 | |
| Operating expenses | | | | | | | | | | | | | | | | | | | |
| Cost of gas | | | 381 | | | 248 | | | - | | | 3 | | | (60 | ) | | 572 | |
| Operation and maintenance | | | 93 | | | 13 | | | 7 | | | 3 | | | (1 | ) | | 115 | |
| Depreciation and amortization | | | 28 | | | - | | | - | | | 2 | | | 3 | | | 33 | |
| Taxes other than income taxes | | | 9 | | | - | | | - | | | - | | | 2 | | | 11 | |
| Total operating expenses | | | 511 | | | 261 | | | 7 | | | 8 | | | (56 | ) | | 731 | |
| Operating income (loss) | | | 123 | | | 53 | | | 4 | | | 4 | | | (3 | ) | | 181 | |
| Other income | | | - | | | - | | | - | | | 1 | | | - | | | 1 | |
| Minority interest | | | - | | | (13 | ) | | - | | | - | | | - | | | (13 | ) |
| EBIT | | $ | 123 | | $ | 40 | | $ | 4 | | $ | 5 | | | ($3 | ) | $ | 169 | |
| | | | | | | | | | | | | | | | | | | | |
| Property, plant and equipment expenditures | | $ | 72 | | $ | - | | $ | - | | $ | 3 | | $ | 6 | | $ | 81 | |
| (1) | Intersegment revenues - Wholesale services records its energy marketing and risk management revenue on a net basis. The following table provides detail of wholesale services’ total gross revenues and gross sales: |
| | | Three months ended March 31, | |
In millions | | 2006 | | 2005 | |
| Third-party gross revenues | | $ | 1,530 | | $ | 1,283 | |
| Intersegment revenues | | | 176 | | | 87 | |
| Total gross revenues | | $ | 1,706 | | $ | 1,370 | |
Balance sheet information at March 31, 2006 and 2005 and December 31, 2005 by segment is shown in the following tables:
| As of March 31, 2006 | | | | | | | | | | | | | |
In millions | | Distribution operations | | Retail energy operations | | Wholesale services | | Energy investments | | Corporate and intersegment eliminations (2) | | Consolidated AGL Resources | |
| | | | | | | | | | | | | | |
| Goodwill | | $ | 408 | | $ | - | | $ | - | | $ | 14 | | $ | - | | $ | 422 | |
| Identifiable and total assets (1) | | $ | 4,547 | | $ | 308 | | $ | 693 | | $ | 329 | | $ | (141 | ) | $ | 5,736 | |
| As of December 31, 2005 | | | | | | | | | | | | | |
In millions | | Distribution operations | | Retail energy operations | | Wholesale services | | Energy investments | | Corporate and intersegment eliminations (2) | | Consolidated AGL Resources | |
| | | | | | | | | | | | | | |
| Goodwill | | $ | 408 | | $ | - | | $ | - | | $ | 14 | | $ | - | | $ | 422 | |
| Identifiable and total assets (1) | | $ | 4,782 | | $ | 342 | | $ | 1,058 | | $ | 350 | | $ | (219 | ) | $ | 6,313 | |
| As of March 31, 2005 | | | | | | | | | | | | | |
In millions | | Distribution operations | | Retail energy operations | | Wholesale services | | Energy investments | | Corporate and intersegment eliminations (2) | | Consolidated AGL Resources | |
| | | | | | | | | | | | | | |
| Goodwill | | $ | 367 | | $ | - | | $ | - | | $ | 14 | | $ | - | | $ | 381 | |
| Identifiable assets (1) | | $ | 4,604 | | $ | 193 | | $ | 652 | | $ | 276 | | $ | (239 | ) | $ | 5,486 | |
| Investment in joint ventures | | | 42 | | | - | | | - | | | 3 | | | (31 | ) | | 14 | |
| Total assets | | $ | 4,646 | | $ | 193 | | $ | 652 | | $ | 279 | | $ | (270 | ) | $ | 5,500 | |
| (1) | Identifiable assets are those assets used in each segment’s operations. |
| (2) | Our corporate segment’s assets consist primarily of intersegment eliminations, cash and cash equivalents and property, plant and equipment. |
FORWARD-LOOKING STATEMENTS
Certain expectations and projections regarding our future performance referenced in this Management’s Discussion and Analysis of Financial Condition and Results of Operations section and elsewhere in this report, as well as in other reports and proxy statements we file with the Securities and Exchange Commission (SEC), are forward-looking statements. Officers and other employees may also make verbal statements to analysts, investors, regulators, the media and others that are forward-looking.
Forward-looking statements involve matters that are not historical facts, and because these statements involve anticipated events or conditions, forward-looking statements often include words such as "anticipate," "assume," "can," "could," "estimate," "expect," "forecast," "future," "indicate," "intend," "may," “outlook,” "plan," "predict," "project,” "seek," "should," "target," "will," "would," or similar expressions. Our expectations are not guarantees and are based on currently available competitive, financial and economic data along with our operating plans. While we believe that our expectations are reasonable in view of the currently available information, our expectations are subject to future events, risks and uncertainties, and there are several factors - many beyond our control - that could cause results to differ significantly from our expectations.
Such events, risks and uncertainties include, but are not limited to, changes in price, supply and demand for natural gas and related products; the impact of changes in state and federal legislation and regulation; actions taken by government agencies on rates and other matters; concentration of credit risk; utility and energy industry consolidation; the impact of acquisitions and divestitures; direct or indirect effects on AGL Resources' business, financial condition or liquidity resulting from a change in our credit ratings or the credit ratings of our counterparties or competitors; interest rate fluctuations; financial market conditions and general economic conditions; uncertainties about environmental issues and the related impact of such issues; the impact of changes in weather on the temperature-sensitive portions of our business; the impact of natural disasters such as hurricanes on the supply and price of natural gas; acts of war or terrorism; and other factors that are described in detail in our filings with the SEC.
We caution readers that, in addition to the important factors described elsewhere in this report, the factors set forth in the section Risk Factors in Item 7, “Management’s Discussion and Analysis of Financial Condition and Results of Operations” of our Annual Report on Form 10-K for the year ended December 31, 2005, among others, could cause our business, results of operations or financial condition in 2006 and thereafter to differ significantly from those expressed in any forward-looking statements. There also may be other factors that we cannot anticipate or that are not described in our Form 10-K or in this report that could cause results to differ significantly from our expectations.
Forward-looking statements are only as of the date they are made, and we do not undertake any obligation to update these statements to reflect subsequent circumstances or events.
We are a Fortune 1000 energy services holding company whose principal business is the distribution of natural gas in six states - Florida, Georgia, Maryland, New Jersey, Tennessee and Virginia. Our six utilities serve more than 2.2 million end-use customers, making us the largest distributor of natural gas in the southeastern and mid-Atlantic regions of the United States based on customer count. We also are involved in various related businesses, including retail natural gas marketing to end-use customers primarily in Georgia; natural gas asset management and related logistics activities for our own utilities as well as for other nonaffiliated companies; natural gas storage and related arbitrage activities; and construction and operation of telecommunications conduit and fiber infrastructure within selected metropolitan areas. We manage these businesses through four operating segments - distribution operations, retail energy operations, wholesale services and energy investments - and a nonoperating corporate segment.
The distribution operations segment is the largest component of our business and is regulated by regulatory agencies in six states. These agencies approve rates designed to provide us the opportunity to generate revenues to recover the cost of natural gas delivered to our customers and our fixed and variable costs such as depreciation, interest, maintenance and overhead costs, and to earn a reasonable return for our shareholders. With the exception of Atlanta Gas Light, our largest utility, the earnings of our regulated utilities are weather sensitive to varying degrees. Although various regulatory mechanisms provide us a reasonable opportunity to recover our fixed costs regardless of natural gas volumes sold, the effect of weather manifests itself in terms of higher earnings during periods of colder weather and lower earnings in warmer weather. Atlanta Gas Light charges rates to its customers primarily on monthly fixed charges. Our retail energy operations segment, which consists of SouthStar Energy Services LLC (SouthStar), also is weather sensitive and uses a variety of hedging strategies to mitigate potential weather impacts. Our Sequent Energy Management, L.P. (Sequent) subsidiary within our wholesale services segment is weather sensitive, with typically increased earnings opportunities during periods of extreme weather conditions.
During the three months ended March 31, 2006, we derived approximately 86% of our earnings before interest and taxes (EBIT) from our regulated natural gas distribution business and the sale of natural gas to end-use customers primarily in Georgia through SouthStar. This statistic is significant because it represents the portion of our earnings that directly results from the underlying business of supplying natural gas to retail customers. Although SouthStar is not subject to the same regulatory framework as our utilities, it is an integral part of the retail framework for providing gas service to end-use customers in the state of Georgia. For more information regarding our measurement of EBIT, see Results of Operations - AGL Resources.
The remaining 14% of our EBIT was principally derived from businesses that are complementary to our natural gas distribution business. We engage in natural gas asset management and the operation of high-deliverability natural gas underground storage as ancillary activities to our utility franchises. These businesses allow us to be opportunistic in capturing incremental value at the wholesale level, provide us with deepened business insight about natural gas market dynamics and facilitate our ability, in the case of asset management, to provide transparency to regulators as to how that value can be captured to benefit our utility customers through profit-sharing arrangements. Given the volatile and changing nature of the natural gas resource base in North America and globally, we believe that participation in these related businesses strengthens our business.
Regulatory Environment
In August 2005, the Energy Policy Act of 2005 (Energy Act) was enacted. The Energy Act authorized, among other things, the repeal of the Public Utility Holding Company Act of 1935, as amended (PUHCA). The effective date of the PUHCA repeal was February 8, 2006. The Energy Act gives the Federal Energy Regulatory Commission (FERC) increased authority over utility merger and acquisition activity, removes many of the geographic and structural restrictions on the ownership of public utilities and eliminates certain regulatory burdens. Some of the SEC reporting requirements, financing authorizations and affiliate relationship approvals that previously applied to us under the PUHCA were replaced by the requirements of the Energy Act.
In addition, the Energy Act requires a public utility holding company to maintain its books and records and make them available to the FERC and to comply with certain reporting requirements. However, the FERC may exempt a class of entities or class of transactions if the FERC finds that they are not relevant to the jurisdictional rate of a public utility or natural gas company. In February 2006, we requested exemption from the FERC, and in April 2006 our exemption from the regulations and reporting requirements under the Energy Act became effective.
Results of Operations
AGL Resources Inc.
Seasonality The operating revenues and EBIT of our distribution operations, retail energy operations and wholesale services segments are seasonal. During the heating season (October - March), natural gas usage and operating revenues are higher because generally more customers are connected to our distribution systems and because natural gas usage is higher in periods of colder weather than in periods of warmer weather. However, our base operating expenses, excluding cost of gas, interest expense and certain incentive compensation costs, are incurred relatively equally over any given year. Thus, our operating results vary significantly from quarter to quarter as a result of seasonality. Seasonality also affects the comparison of certain balance sheet items such as receivables, inventories and short-term debt across quarters.
Hedging Changes in commodity prices subject a significant portion of our operations to variability. Commodity prices tend to be higher in colder months. Our nonutility businesses principally use physical and financial arrangements to economically hedge the risks associated with both seasonal fluctuations and changing commodity prices. In addition, because these economic hedges are generally not designated for hedge accounting treatment, our reported earnings for the wholesale services and retail energy operations segments reflect changes in the fair values of certain derivatives; these values may change significantly from period to period.
Elizabethtown Gas utilizes certain derivatives in accordance with a mandated hedging program to hedge the impact of market fluctuations in natural gas prices. These derivative products are marked to market each reporting period. In accordance with regulatory requirements, realized gains and losses related to these derivatives are reflected in purchased gas costs and ultimately included in billings to customers. Unrealized gains and losses are reflected as a regulatory asset (loss) or liability (gain), as appropriate, in our consolidated balance sheets.
Revenues We generate nearly all our operating revenues through the sale, distribution and storage of natural gas. We include in our consolidated revenues an estimate of revenues from natural gas distributed, but not yet billed, to residential and commercial customers from the latest meter reading date to the end of the reporting period.
Operating Margin and EBIT We evaluate the performance of our operating segments using the measures of operating margin and EBIT. We believe operating margin is a better indicator than revenues for the contribution resulting from customer growth in our distribution operations segment since the cost of gas can vary significantly and is generally passed directly to our customers. We also consider operating margin to be a better indicator in our retail energy operations, wholesale services and energy investments segments since it is a direct measure of gross profit before overhead costs. We believe EBIT is a useful measurement of our operating segments’ performance because it provides information that can be used to evaluate the effectiveness of our businesses from an operational perspective, exclusive of the costs to finance those activities and exclusive of income taxes, neither of which is directly relevant to the efficiency of those operations.
Our operating margin and EBIT are not measures that are considered to be calculated in accordance with accounting principles generally accepted in the United States of America (GAAP). You should not consider operating margin or EBIT an alternative to, or a more meaningful indicator of, our operating performance than operating income or net income as determined in accordance with GAAP. In addition, our operating margin or EBIT measures may not be comparable to similarly titled measures of other companies. The following table sets forth a reconciliation of our operating margin and EBIT to our operating income and net income, together with other consolidated financial information for the three months ended March 31, 2006 and 2005.
| | | Three months ended March 31, | | | |
In millions, except per share amounts | | 2006 | | 2005 | | Change | |
| Operating revenues | | $ | 1,047 | | $ | 912 | | $ | 135 | |
| Cost of gas | | | 658 | | | 572 | | | 86 | |
| Operating margin | | | 389 | | | 340 | | | 49 | |
| Operating expenses | | | 161 | | | 159 | | | 2 | |
| Operating income | | | 228 | | | 181 | | | 47 | |
| Other (expense) income | | | (2 | ) | | 1 | | | (3 | ) |
| Minority interest | | | (19 | ) | | (13 | ) | | (6 | ) |
| EBIT | | | 207 | | | 169 | | | 38 | |
| Interest expense | | | (30 | ) | | (26 | ) | | (4 | ) |
| Earnings before income taxes | | | 177 | | | 143 | | | 34 | |
| Income taxes | | | (67 | ) | | (55 | ) | | (12 | ) |
| Net income | | $ | 110 | | $ | 88 | | $ | 22 | |
| Basic earnings per common share | | $ | 1.42 | | $ | 1.15 | | $ | 0.27 | |
| Diluted earnings per common share | | $ | 1.41 | | $ | 1.14 | | $ | 0.27 | |
| Weighted average number of common shares outstanding | | | | | | | | | | |
| Basic | | | 77.9 | | | 76.9 | | | 1.0 | |
| Diluted | | | 78.2 | | | 77.6 | | | 0.7 | |
Segment information Operating revenues, operating margin and EBIT information for each of our segments are contained in the following table for the three months ended March 31, 2006 and 2005:
2006 (in millions) | | Operating revenues | | Operating margin | | EBIT | |
| Distribution operations | | $ | 640 | | $ | 245 | | $ | 123 | |
| Retail energy operations | | | 390 | | | 94 | | | 54 | |
| Wholesale services | | | 51 | | | 43 | | | 32 | |
| Energy investments | | | 10 | | | 8 | | | 2 | |
| Corporate (1) | | | (44 | ) | | (1 | ) | | (4 | ) |
| Consolidated | | $ | 1,047 | | $ | 389 | | $ | 207 | |
2005 (in millions) | | | | | | | | | | |
| Distribution operations | | $ | 634 | | $ | 253 | | $ | 123 | |
| Retail energy operations | | | 314 | | | 66 | | | 40 | |
| Wholesale services | | | 11 | | | 11 | | | 4 | |
| Energy investments | | | 12 | | | 9 | | | 5 | |
| Corporate (1) | | | (59 | ) | | 1 | | | (3 | ) |
| Consolidated | | $ | 912 | | $ | 340 | | $ | 169 | |
| (1) | Includes intersegment eliminations |
First quarter 2006 compared to first quarter 2005
Our earnings per share and net income for the three months ended March 31, 2006 were higher than the prior year due to higher contributions from our wholesale services and retail energy operations businesses.
Consolidated EBIT for the first quarter of 2006 increased by $38 million or 22% from the same period last year, of which $14 million resulted from increased EBIT at our retail energy operations and $28 million resulted from increased EBIT at wholesale services. This was partially offset by decreased EBIT of $3 million at energy investments.
Operating Margin The increase in retail energy operations’ margin of $28 million was due primarily to improved optimization of storage and transportation assets and effective commodity risk management. Wholesale services’ operating margin increased $32 million primarily due to profits in its storage business. Distribution operations’ operating margins decreased $8 million primarily due to warmer weather in 2006 as compared to 2005. Energy investments’ margins decreased $1 million, primarily as a result of dispositions during 2005 of businesses that were acquired with our 2004 acquisition of NUI Corporation (NUI), which are not reflected in our 2006 results.
Operating Expenses The increase in operating expenses of $2 million or 1% was primarily a result of increased expenses of $6 million at retail energy operations and $4 million at wholesale services. The increase at retail energy operations was due primarily to higher bad debt expenses resulting primarily from increased commodity prices, higher outside services costs associated with technology projects and higher compensation costs due to the increase in earnings. The increase at wholesale services was due to increased payroll and employee incentive compensation costs resulting from its operational and financial growth. The increased operating expenses were offset by lower operating expenses at distribution operations of $8 million. This was a result of lower payroll expenses as we reduced the number of employees at Elizabethtown Gas following our acquisition of NUI Corporation, and from the sale of properties during the current year.
Interest Expense The increase of $4 million or 15% was due primarily to higher average debt balances and higher short-term interest rates. Average debt balances increased by $175 million as shown in the table below. This was due primarily to higher natural gas prices and working capital requirements during 2006. Our working capital requirements were higher primarily due to increased inventory balances as most of our utilities experienced a warmer winter than last year and consequently our utilities withdrew less volumes of natural gas inventory during the current quarter as compared to 2005.
| | | Three months ended March 31, | |
Dollars in millions | | 2006 | | 2005 | | Change | |
| Average debt outstanding (1) | | $ | 1,995 | | $ | 1,820 | | $ | 175 | |
| Average rate | | | 6.0 | % | | 5.7 | % | | 0.3 | % |
| (1) | Daily average of all outstanding debt. |
Based on $522 million of variable-rate debt, which includes $316 million of our short-term debt, $100 million of variable-rate senior notes and $106 million of variable-rate gas facility revenue bonds outstanding at March 31, 2006, a 100 basis point change in market interest rates from 5.2% to 6.2% would result in an increase in pretax interest expense for the three months ended March 31, 2006 of $1 million.
Income Taxes The increase in income tax expense of $12 million or 22% for 2006 compared to 2005 reflected additional income taxes of $13 million due to higher corporate earnings year over year offset by $1 million due to a slightly lower effective tax rate of 37.7% for 2006 as compared to 38.2% in 2005 due to the various tax rates in the states in which we earn income.
The state of New Jersey is considering an increase of its corporate income tax rate in 2006. If enacted, our overall effective income tax rate for the year ending December 31, 2006 likely would increase.
Distribution operations includes our natural gas local distribution utility companies, which construct, manage and maintain natural gas pipelines and distribution facilities and serve more than 2.2 million end-use customers. Our distribution utilities include:
Each utility is regulated by the state regulatory agency in its service territory with respect to rates charged to our customers, maintenance of accounting records and various other service and safety matters. Rates charged to our customers vary according to customer class (residential, commercial or industrial) and rate jurisdiction. Rates are set at levels that should generally allow for the recovery of all prudently incurred costs, including a return on rate base sufficient to pay interest on debt and provide a reasonable return on common equity. Rate base consists generally of the original cost of utility plant in service, working capital, inventories and certain other assets; less accumulated depreciation on utility plant in service, net deferred income tax liabilities and certain other deductions. We continuously monitor the performance of our utilities to determine whether rates need to be adjusted through the regulatory process.
Updates The following is a summary of significant developments with regard to our distribution operations segment that have occurred since we filed our 2005 Annual Report on Form 10-K on February 10, 2006.
Bad Debt During the three months ended March 31, 2006, bad debt expense in our distribution operations segment was $3 million, an increase of $1 million from the same period last year. This was due primarily to the impact of higher average natural gas prices which led to higher customer bills, partly offset by lower volumes sold due to warmer weather in 2006. Our customers experienced an average 34% increase in their natural gas bills during the 2005 / 2006 heating season as compared to the prior year and weather was on average 11% warmer than last year in the territories in which our distribution operations operate.
Increased prices of natural gas are being driven by increased demand that is exceeding the growth in available supply. The hurricanes in the Gulf Coast region during the late summer and early fall of 2005 impacted the availability of natural gas supply, causing a dramatic rise in natural gas prices.
An increase in natural gas commodity costs generally has no direct effect on our utilities’ net operating margin and net income due to the Purchased Gas Adjustment (PGA) mechanisms at our utilities, which pass commodity costs through to customers. However, net income may be reduced as a result of higher expenses that may be incurred for bad debt, as well as lower volumes of natural gas deliveries to customers due to customer conservation. We will continue to monitor and mitigate the impact of uncollectible receivables on our results of operation and financial condition.
We have been partnering with regulators and state agencies in each of our jurisdictions to educate customers about the impact of higher natural gas prices, and particularly to ensure that those who qualify for funds under the Low Income Home Energy Assistance Program and similar programs receive that assistance.
Elizabethtown Gas In April 2005, Elizabethtown Gas presented the NJBPU with a proposal to accelerate the replacement of approximately 88 miles of 8” to 12” diameter elevated-pressure cast iron pipe. Under the proposal, approximately $42 million in estimated capital costs incurred over a three-year period would be recovered through a pipeline replacement rider similar to the program in effect at Atlanta Gas Light. If the program as proposed is approved, cost recovery would occur on a one-year lag basis, with collections starting on October 1, 2006 and extending through December 31, 2009, after which time the program would be rolled into base rates. On December 7, 2005, Elizabethtown Gas filed testimony in support of its proposal. Testimony concerning Elizabethtown Gas’ proposal was filed by the Ratepayer Advocate. The parties have agreed to temporarily suspend hearings in order to discuss a possible settlement of the matter.
Virginia Natural Gas In March 2005, the Virginia State Corporation Commission (Virginia Commission) staff issued a report alleging that Virginia Natural Gas’ rates were excessive and that its rates should be adjusted to produce a $15 million reduction in revenue. The staff also filed a motion requesting that Virginia Natural Gas’ rates be declared interim and subject to refund.
In April 2005, Virginia Natural Gas responded to the staff’s report and motion, contesting the allegations in the report and objecting to the motion filed by the staff. On April 29, 2005, the Virginia Commission ordered the staff’s motion to be held in abeyance and directed Virginia Natural Gas to file a rate case by July 2005.
In July 2005, Virginia Natural Gas filed a performance-based rate (PBR) plan with the Virginia Commission and included schedules required for a general rate case. Under the PBR plan, Virginia Natural Gas proposes to freeze base rates at their 1996 levels for 5 additional years. This would provide Virginia Natural Gas customers an additional 5 years of rate stability, for a total of 14 years without a base rate increase.
On January 12, 2006, Virginia Natural Gas filed with the Virginia Commission a motion for approval of a proposed stipulation. If the proposed stipulation is approved by the Virginia Commission, the PBR plan would be implemented as modified by the proposed stipulation, which includes a requirement for Virginia Natural Gas to construct a pipeline that would connect Virginia Natural Gas’ northern system to its southern system. The Virginia Commission’s hearing examiner conducted a hearing on the proposed stipulation on January 30, 2006, and on February 3, 2006, the hearing examiner recommended that the Virginia Commission approve the proposed stipulation.
In accordance with the Virginia Commission’s order, the hearing examiner conducted a hearing on Virginia Natural Gas’ PBR plan and general rate case schedules beginning on February 21, 2006. The hearing examiner will submit a recommendation to the Virginia Commission and the Virginia Commission will then render its decision on whether it will adopt Virginia Natural Gas’ PBR Plan as modified by the proposed stipulation and / or adjust Virginia Natural Gas’ rates as proposed by the staff.
Results of Operations for our distribution operations segment for the three months ended March 31, 2006 and 2005 are as follows:
| | | Three months ended March 31, | |
In millions | | 2006 | | 2005 | | Change | |
| Operating revenues | | $ | 640 | | $ | 634 | | $ | 6 | |
| Cost of gas | | | 395 | | | 381 | | | 14 | |
| Operating margin | | | 245 | | | 253 | | | (8 | ) |
| Operating expenses | | | | | | | | | | |
| Operation and maintenance | | | 85 | | | 93 | | | (8 | ) |
| Depreciation and amortization | | | 29 | | | 28 | | | 1 | |
| Taxes other than income | | | 8 | | | 9 | | | (1 | ) |
| Total operating expenses | | | 122 | | | 130 | | | (8 | ) |
| Operating income | | | 123 | | | 123 | | | - | |
| Other income | | | - | | | - | | | - | |
| EBIT | | $ | 123 | | $ | 123 | | $ | - | |
| | | | | | | | | | | |
Metrics | | | | | | | | | | |
| Average end-use customers (in thousands) | | | 2,279 | | | 2,266 | | | 1 | % |
| Operation and maintenance expenses per customer | | $ | 37 | | $ | 41 | | | (10 | %) |
| EBIT per customer | | $ | 54 | | $ | 54 | | | - | |
| Throughput (in millions of dekatherms) | | | | | | | | | | |
| Firm | | | 91 | | | 106 | | | (14 | %) |
| Interruptible | | | 32 | | | 33 | | | (3 | %) |
| Total | | | 123 | | | 139 | | | (12 | %) |
| Heating degree days (1): | | | | | | | | | % Colder / (Warmer | ) |
| Florida | | | 490 | | | 490 | | | - | |
| Georgia | | | 1,393 | | | 1,396 | | | (0.2 | %) |
| Maryland | | | 2,254 | | | 2,684 | | | (16 | %) |
| New Jersey | | | 2,292 | | | 2,755 | | | (17 | %) |
| Tennessee | | | 1,558 | | | 1,545 | | | 1 | % |
| Virginia | | | 1,642 | | | 1,975 | | | (17 | %) |
| (1) | We measure the effects of weather on our businesses using “degree days.” The measure of degree days for a given day is the difference between the average daily actual temperature and the baseline temperature of 65 degrees Fahrenheit. Heating degree days result when the average daily actual temperature is less than 65-degrees. Generally, increased heating degree days result in greater demand for gas on our distribution systems. |
First quarter 2006 compared to first quarter 2005
Operating Margin Operating margin decreased $8 million in the three months ended March 31, 2006 as compared to the same period in 2005. The decrease included $2 million of lower operating margin at Virginia Natural Gas and $2 million at Elizabethtown Gas due primarily to lower gas usage by customers as a result of a warmer winter in 2006 than in 2005. Operating margin also decreased $2 million due to lower customer usage at Florida City Gas and Chattanooga Gas. There was also a margin decrease of $1 million as a result of the sale of our appliance businesses in the third and fourth quarters of 2005. These appliance businesses were part of the NUI acquisition in the fourth quarter of 2004. Operating margin at our Atlanta Gas Light was relatively flat in 2006 as compared to the same period in 2005 due to a $1 million reduction in operating revenues from the Georgia Public Service Commission’s June 2005 Rate Order offset by higher charges from natural gas stored for Marketers.
Operating Expenses Operating expenses decreased $8 million in 2006 as compared to the same period in 2005, primarily due to lower payroll expense, lower facilities expense and a gain in 2006 on the sale of properties, offset by increased bad debt expense.
Payroll expense decreased $5 million in 2006 as compared to the same period in 2005, primarily related to a restructure in 2005 of the workforce following our NUI acquisition. Facilities expense decreased $2 million in 2006 as compared to the same period in 2005 also as a result of this restructuring and elimination of unnecessary or redundant facilities.
These decreases were offset by a $1 million increase in bad debt expense primarily at Virginia Natural Gas and Elizabethtown Gas due to higher gas prices in 2006. Operating expenses also reflect a $3 million gain on the sale of properties in Georgia.
Retail Energy Operations
Our retail energy operations segment consists of SouthStar, a joint venture owned 70% by our subsidiary, Georgia Natural Gas Company, and 30% by Piedmont Natural Gas Company, Inc. (Piedmont). SouthStar markets natural gas and related services to retail customers on an unregulated basis, principally in Georgia. Although our ownership interest in the SouthStar partnership is 70%, SouthStar's earnings are allocated by contract 75% to us and 25% to Piedmont.
Operating Margin SouthStar generates its operating margin primarily in two ways. The first is through the sale of natural gas to retail customers in the residential, commercial and industrial sectors, primarily in Georgia where SouthStar captures a spread between wholesale and retail natural gas prices. The second is through the collection of a monthly service fee and customer late payment fees. The combination of these two retail price components are evaluated by SouthStar to ensure such pricing is structured to cover related retail customer costs, such as bad debt, and lost and unaccounted for gas, among others and to provide a reasonable profit. SouthStar’s operating margins are impacted by weather seasonality, natural gas prices, customer growth, and SouthStar’s related market share in Georgia, which has historically ranged from 35% to 38%. SouthStar employs a strategy to attract and retain a higher-quality customer base through the application of minimum credit requirements. This strategy results not only in higher operating margin contributions, as these customers tend to utilize higher volumes of natural gas, but also lower bad debt expenses from the higher credit quality of its customers.
SouthStar also generates margin through the optimization of storage and transportation assets, and through effective commodity risk management. The efficient management of these assets and effective risk management enable SouthStar to reduce its retail customer prices and realize profits. SouthStar is allocated storage and pipeline capacity on the Atlanta Gas Light distribution system that is utilized by SouthStar to provide gas supply to its customers in Georgia. Through hedging transactions, SouthStar manages exposures arising from changing commodity prices, utilizing natural gas storage transactions to capture margin from natural gas pricing differences that occur over time. SouthStar’s risk management policies allow the use of derivative instruments for hedging and risk management purposes, but prohibit the use of derivative instruments for speculative purposes.
Updates The following is a summary of significant developments with regard to our retail energy operations segment that have occurred since we filed our 2005 Annual Report on Form 10-K for the year ended December 31, 2005 on February 10, 2006.
Impact of High Natural Gas Prices SouthStar’s operating margin and EBIT from the sale of natural gas to retail customers during the three months ended March 31, 2006 were affected by lower customer usage, bad debt expenses and lost and unaccounted for gas as a result of higher natural gas prices in the 2005 - 2006 winter heating season. SouthStar’s bad debt was $5 million for the three months ended March 31, 2006, a $3 million or 150% increase from the same period last year. The increase includes $1 million relating to the application of aged customer deposits in the prior year which had the effect of reducing bad debt expense in 2005. Additionally, the increase in bad debt was impacted by an increase in the amount of accounts receivable balances past due more than 60 days. This was largely driven by SouthStar’s offering of payment arrangements to customers in its efforts to help customers with higher natural gas bills. SouthStar expects that these efforts will help mitigate the overall impact of bad debt expense as a percentage of operating revenues, which were 1.3% for the three months ended March 31, 2006 as compared to approximately 1% for the same period last year.
SouthStar also began seeing lower average usage per customer as compared to the same quarter last year in part due to the effects of customer conservation largely due to a number of potential factors including weather patterns, the efficiency and replacement of natural gas appliances and higher natural gas prices, among others. The impact was a $7 million decrease in operating margin as compared to last year and primarily occurred when natural gas prices were higher during the quarter.
Results of operations for our retail energy operations segment for the three months ended March 31, 2006 and 2005 are shown in the following table.
| | |
| | | Three months ended March 31, | |
In millions | | 2006 | | 2005 | | Change | |
| Operating revenues | | $ | 390 | | $ | 314 | | $ | 76 | |
| Cost of sales | | | 296 | | | 248 | | | 48 | |
| Operating margin | | | 94 | | | 66 | | | 28 | |
| Operating expenses | | | 19 | | | 13 | | | 6 | |
| Operating income | | | 75 | | | 53 | | | 22 | |
| Other expense | | | (2 | ) | | - | | | (2 | ) |
| Minority interest (1) | | | (19 | ) | | (13 | ) | | (6 | ) |
| EBIT | | $ | 54 | | $ | 40 | | $ | 14 | |
| Average customers (in thousands) | | | 536 | | | 538 | | | (0.4 | )% |
| Market share in Georgia | | | 35 | % | | 35 | % | | - | |
(1) Minority interest adjusts our earnings to reflect our 75% share of SouthStar’s earnings.
Operating Margin Operating margin increased $28 million or 42% largely driven by improved optimization of storage and transportation assets and effective commodity risk management of $26 million. Retail operating margins increased $2 million reflecting favorable retail price spreads partially offset by the current quarter impact of lower average customer usage and higher lost and unaccounted for gas.
Operating Expenses Operating expenses increased $6 million or 46% primarily due to higher bad debt of $3 million, higher variable benefit costs of $1 million as a result of continued earnings growth as compared to last year, and higher outside service costs of $1 million driven by the current year implementation of an Energy Trading and Risk Management system.
Other Expense The retail energy operations segment made a $2 million charitable contribution in 2006.
Minority Interest Minority interest increased as a result of increased operating income in 2006 as compared to 2005.
Wholesale Services
Wholesale services consists of Sequent, our subsidiary involved in asset management, transportation, storage, producer and peaking services and wholesale marketing. Our asset management business focuses on capturing economic value from idle or underutilized natural gas assets, which are typically amassed by companies via investments in or contractual rights to natural gas transportation and storage assets. Margin is typically created in this business by participating in transactions that balance the needs of varying markets and time horizons.
Sequent provides its customers with natural gas from the major producing regions and market hubs primarily in the Eastern and Mid-Continental United States. Sequent also purchases transportation and storage capacity to meet its delivery requirements and customer obligations in the marketplace. Sequent’s customers benefit from its logistics expertise and ability to deliver natural gas at prices that are advantageous relative to other alternatives available to its end-use customers.
Seasonality Fixed cost commitments are generally incurred evenly over the year, while margins generated through the use of the related assets are greatest in the winter heating season and occasionally in the summer due to peak usage by power generators in response to summer energy demands. This increases the seasonality of Sequent’s business, generally resulting in higher margins in the first and fourth quarters.
Updates The following is a summary of significant developments with regard to our wholesale services segment that have occurred since we filed our 2005 Annual Report on Form 10-K on February 10, 2006.
Asset Management Transactions Our asset management customers include our own utilities, nonaffiliated utilities, municipal utilities and large industrial customers. The following table provides information about the fees and profits that Sequent has paid to its affiliated utilities.
In millions | | Profits shared / fees paid in 2006 (1) | | Profits shared / fees paid in 2005 (2) | |
| Atlanta Gas Light | | $ | 6 | | $ | 4 | |
| Chattanooga Gas | | | 4 | | | 2 | |
| Elizabethtown Gas | | | 3 | | | - | |
| Elkton Gas | | | - | | | - | |
| Florida Gas | | | - | | | - | |
| Virginia Natural Gas | | | - | | | 5 | |
| (1) | For the three months ended March 31. |
| (2) | For the twelve months ended December 31. |
Transportation Transactions In our wholesale marketing and risk management business, Sequent contracts for natural gas transportation capacity. We participate in transactions to manage the natural gas commodity and transportation costs that result in the lowest cost to serve our various markets. We seek to optimize this process on a daily basis as market conditions change by evaluating all the natural gas supplies, transportation alternatives and markets to which we have access and identifying the least-cost alternatives to serve our various markets. This enables us to capture geographic pricing differences across these various markets as delivered gas prices change. During the first quarter of 2006, we entered into a contract for 35,000 million British thermal units (MMBtu’s) per day of firm transportation capacity for a term of five years with an estimated commencement date in late 2007. This contract is subject to our counterparty receiving regulatory approval. The contract contains an extension option which, if exercised, could increase the term of the contract by five years. Once the contract commences, our cost for the capacity will be approximately $3 million per year.
Energy Marketing and Risk Management Activities The tables below illustrate the change in the net fair value of Sequent’s derivative instruments and energy-trading contracts during the three months ended March 31, 2006 and 2005, and provide details of the net fair value of contracts outstanding as of March 31, 2006. Sequent’s storage positions are affected by changes in the NYMEX average price.
| | | Three months ended March 31, | |
In millions | | 2006 | | 2005 | |
| Net fair value of contracts outstanding at beginning of period | | $ | (13 | ) | $ | 17 | |
| Contracts realized or otherwise settled during period | | | 27 | | | 9 | |
| Change in net fair value of contracts | | | 6 | | | (15 | ) |
| Net fair value of contracts outstanding at end of period | | | 20 | | | 11 | |
| Less net fair value of contracts outstanding at beginning of period | | | (13 | ) | | 17 | |
| Unrealized gain (loss) related to changes in the fair value of derivative instruments | | $ | 33 | | $ | (6 | ) |
The sources of our net fair value at March 31, 2006 are as follows.
In millions | | Prices actively quoted | | Prices provided by other external sources | |
| Maturity less than one year | | $ | 11 | | $ | 7 | |
| Maturity 1-2 years | | | - | | | 2 | |
| Total net fair value | | $ | 11 | | $ | 9 | |
The “prices actively quoted” category represents Sequent’s positions in natural gas, which are valued exclusively using NYMEX futures prices. “Prices provided by other external sources” are transactions that represent the cost to transport the commodity from a NYMEX delivery point to the contract delivery point. Our basis spreads are primarily based on quotes obtained either directly from brokers or through electronic trading platforms.
At March 31, 2006, Sequent’s commodity-related derivative financial instruments represented purchases (long) of 572 billion cubic feet (Bcf) and sales (short) of 606 Bcf, with approximately 99% and 95% scheduled to mature in less than 2 years and the remaining 1% and 5% in three to nine years, respectively. At March 31, 2006, the fair value of these derivatives were reflected in our condensed consolidated balance sheet as an asset of $66 million and a liability of $46 million.
Storage Inventory Outlook The following graph presents the NYMEX forward natural gas prices as of December 31, 2005 and March 31, 2006 for the period April 2006 through March 2007, and reflects the prices at which Sequent could buy natural gas at the Henry Hub for delivery in the same time period. April 2006 futures expired on March 29, 2006; however they are included in the table below as they coincide with the April 2006 storage withdrawals. The Henry Hub, located in Louisiana, is the largest centralized point for natural gas spot and futures trading in the United States. NYMEX uses the Henry Hub as the point of delivery for its natural gas futures contracts. Many natural gas marketers also use the Henry Hub as their physical contract delivery point or their price benchmark for spot trades of natural gas.
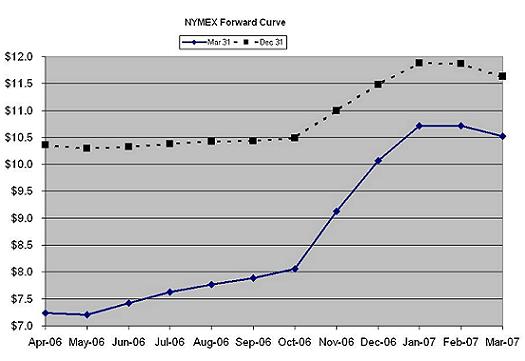
Sequent’s expected withdrawals from physical salt dome and reservoir storage are presented in the table below along with its expected gross margin. Sequent’s expected gross margin is net of the impact of regulatory sharing and reflects the amounts that we would expect to realize in future periods based on the inventory withdrawal schedule and forward natural gas prices at March 31, 2006. Sequent’s storage inventory is fully hedged with futures as its NYMEX short positions are equal to the physical long positions, which results in an overall locked-in margin, timing notwithstanding. Sequent’s physical salt dome and reservoir volumes are presented in increments of 10,000 million MMBtu.
| | | Apr 06 | | May 06 | | Jun 06 | | Jul 06 | | Aug 06 | | Sep 06 | | Oct 06 | | Nov 06 | | Dec 06 | | Jan 07 | | Feb 07 | | Mar 07 | | Total | |
Physical withdrawal schedule (in MMBtu) | | | | | | | | | | | | | | | | | | | | | | | | | | | |
| Salt dome | | | 4 | | | 42 | | | - | | | - | | | - | | | - | | | - | | | - | | | 13 | | | - | | | - | | | - | | | 59 | |
| Reservoir | | | 20 | | | 54 | | | 76 | | | 234 | | | 160 | | | 95 | | | 187 | | | - | | | 182 | | | 46 | | | 49 | | | 185 | | | 1,288 | |
| | | | 24 | | | 96 | | | 76 | | | 234 | | | 160 | | | 95 | | | 187 | | | - | | | 195 | | | 46 | | | 49 | | | 185 | | | 1,347 | |
Expected gross margin (in millions) | | $ | 0.1 | | $ | 0.1 | | $ | - | | $ | 1.0 | | $ | 0.8 | | $ | 0.2 | | $ | 0.9 | | $ | - | | $ | 4.3 | | $ | 0.8 | | $ | 1.2 | | $ | 4.0 | | $ | 13.4 | |
As of March 31, 2006, the weighted average cost of natural gas in inventory was $7.06 for physical salt dome storage and $7.49 for physical reservoir storage.
As noted above, Sequent’s inventory level and pricing as of March 31, 2006 should result in a gross margin of approximately $7 million in 2006 and $6 million in 2007 if all factors remain the same, but could change if Sequent adjusts its daily injection and withdrawal plans in response to changes in market conditions in future months. Based upon Sequent’s storage positions at March 31, 2006, a $1.00 change in the forward NYMEX prices would result in an $11 million impact to Sequent’s EBIT after regulatory sharing.
Results of Operations for our wholesale services segment for the three months ended March 31, 2006 and 2005 are as follows:
| | | Three months ended March 31, | |
In millions | | 2006 | | 2005 | | Change | |
| Operating revenues | | $ | 51 | | $ | 11 | | $ | 40 | |
| Cost of sales | | | 8 | | | - | | | 8 | |
| Operating margin | | | 43 | | | 11 | | | 32 | |
| Operating expenses | | | 11 | | | 7 | | | 4 | |
| Operating income | | | 32 | | | 4 | | | 28 | |
| Other income | | | - | | | - | | | - | |
| EBIT | | $ | 32 | | $ | 4 | | $ | 28 | |
| | | | | | | | | | | |
Metrics | | | | | | | | | | |
| Physical sales volumes (Bcf/day) | | | 2.1 | | | 2.3 | | | (9 | %) |
Operating Margin The $32 million increase in operating margin was a result of more opportunities for our asset management and trading operations to capture storage margins in both the current period and the forward markets. The improvement from the prior year period also was the result of changes in natural gas prices and the associated effect on the fair values of our derivatives and the recognition of these changes in our earnings.
During 2004, there was a significant decline in forward NYMEX prices, which resulted in the recognition of unrealized gains associated with the financial instruments used to hedge Sequent’s inventory held in storage. The majority of this inventory was scheduled for withdrawal during the first quarter of 2005 and, as a result, $5 million of margin that was originally anticipated to be recognized during the first quarter of 2005 was recognized in 2004.
Also, as a result of an increase in forward NYMEX prices during the first quarter of 2005, the results for that period reflect the recognition of $8 million of unrealized losses associated with our inventory hedges. In contrast, forward NYMEX prices declined during the first quarter of 2006, which resulted in the recognition of $5 million of unrealized gains associated with our storage hedges. Additionally, results for the first quarter of 2006 were positively impacted by the recognition of $10 million of additional economic value when inventory was withdrawn from storage. This value was carried over from 2005 and was associated with previously recognized inventory hedge losses of $7 million and lower-of-cost-or-market adjustments of $3 million. In addition, the declining price environment and slight reduction in sales volumes resulted in a reduction in our receivables, which reduced our required credit reserves by approximately $2 million during the first quarter of 2006. Our credit reserves remained relatively unchanged during the same period last year.
Operating Expenses Sequent’s operating expenses increased $4 million primarily due to higher costs associated with an increase in the number of employees to support Sequent’s growth and additional incentive compensation costs directly related to stronger first quarter financial performance, as well as higher corporate overhead costs. The increased expenses were partially offset by lower costs associated with outside services.
Our energy investments segment includes:
| · | Pivotal Jefferson Island Storage & Hub, LLC (Pivotal Jefferson Island) |
| · | Pivotal Propane of Virginia, Inc. (Pivotal Propane) |
| · | AGL Networks, LLC (AGL Networks) |
Pivotal Jefferson Island - Operating Margin Pivotal Jefferson Island generates operating margin primarily through entering into contracts with customers for the purchase of capacity in its salt dome caverns. Pivotal Jefferson Island’s capacity in its currently operational caverns is fully subscribed, with the terms of subscription contracts expiring at staggered dates from 2006 to 2012. Pivotal Jefferson Island also generates operating margin from interruptible customers when market conditions and the amount of available physical space in the caverns are conducive for customers to store gas in the caverns.
Sale of certain NUI assets Until their sale in August 2005, our energy investment segment included our 50% interest in Saltville Gas Storage Company, LLC (Saltville) and associated subsidiaries and our wholly-owned subsidiaries, Virginia Gas Pipeline and Virginia Gas Storage. These companies, which we acquired in our purchase of NUI in 2004, were sold to a subsidiary of Duke Energy Corporation, the other 50% partner in the Saltville joint venture.
Results of operations for our energy investments segment for the three months ended March 31, 2006 and 2005 are shown in the following table.
| | | Three months ended March 31, | |
In millions | | 2006 | | 2005 | | Change | |
| Operating revenues | | $ | 10 | | $ | 12 | | $ | (2 | ) |
| Cost of sales | | | 2 | | | 3 | | | (1 | ) |
| Operating margin | | | 8 | | | 9 | | | (1 | ) |
| Operating expenses | | | 6 | | | 5 | | | 1 | |
| Operating income | | | 2 | | | 4 | | | (2 | ) |
| Other income | | | - | | | 1 | | | (1 | ) |
| EBIT | | $ | 2 | | $ | 5 | | $ | (3 | ) |
Operating Margin Operating margin decreased $1 million largely due to the loss of $3 million of operating margin contributions from certain assets we acquired with the 2004 acquisition of NUI but later sold in 2005. Pivotal Jefferson Island’s operating margin decreased as compared to the prior year in part due to a decrease in interruptible margin opportunities, but this decrease was offset by a slight increase in AGL Networks’ operating margin contributions. Additionally, Pivotal Propane contributed a $1 million increase in the first quarter of 2006 as it did not become operational until April 2005.
Operating Expenses Operating expenses increased slightly as compared to last year due to Pivotal Propane becoming operational in April 2005, increased operating expenses at Pivotal Jefferson Island due to compressor related costs, and costs associated with our Pivotal Energy Development group being charged to the energy investments segment in the first quarter of 2006 that had been charged to our corporate segment in 2005. These costs were offset by decreased operating expenses resulting from the 2005 sales of certain assets that we originally acquired with the 2004 acquisition of NUI.
Other Income Other income decreased by $1 million due to the loss of earnings contributions from Saltville which was sold in 2005. We accounted for our investment in Saltville using the equity-method.
Corporate
Our corporate segment includes our nonoperating business units, including AGL Services Company (AGSC) and AGL Capital Corporation (AGL Capital).
We allocate substantially all of AGSC’s and AGL Capital’s operating expenses and interest costs to our operating segments in accordance with state regulations. Our corporate segment also includes intersegment eliminations for transactions between our operating business segments. Our EBIT results include the impact of these allocations to the various operating segments.
Results of operations for our corporate segment for the three months ended March 31, 2006 and 2005, detailed by expense line items, are detailed in the table below. The corporate segment is a non-operating segment, and as such, comparative EBIT variances for the indicated periods reflect the relative change in various general and administrative expenses, such as payroll, benefits and incentives, insurance, fleet services and outside services, none of which are individually material.
| | | Three months ended March 31, | |
In millions | | 2006 | | 2005 | | Change | |
| Payroll | | $ | 13 | | $ | 13 | | $ | - | |
| Benefits and incentives | | | 8 | | | 8 | | | - | |
| Outside services | | | 11 | | | 8 | | | 3 | |
| Depreciation and amortization | | | 3 | | | 3 | | | - | |
| Taxes other than income | | | 2 | | | 2 | | | - | |
| Other | | | 8 | | | 11 | | | (3 | ) |
| Total operating expenses before allocations | | | 45 | | | 45 | | | - | |
| Allocation to operating segments | | | (42 | ) | | (42 | ) | | - | |
| Total operating expenses | | | 3 | | | 3 | | | - | |
| Other losses | | | 1 | | | - | | | 1 | |
| EBIT | | $ | (4 | ) | $ | (3 | ) | $ | (1 | ) |
To meet our capital and liquidity requirements, we rely on operating cash flow; short-term borrowings under our commercial paper program, which is backed by our supporting credit agreement (Credit Facility); borrowings under Sequent’s and SouthStar’s lines of credit; and borrowings or stock issuances in the long-term capital markets. Our issuance of various securities, including long-term and short-term debt, is subject to customary approval or authorization by state and federal regulatory bodies, including state public service commissions and the SEC. Furthermore, a substantial portion of our consolidated assets, earnings and cash flow is derived from the operation of our regulated utility subsidiaries, whose legal authority to pay dividends or make other distributions to us is subject to regulation. The availability of borrowings under our Credit Facility is limited and subject to a total-debt-to-capital ratio financial covenant specified within the Credit Facility, which we currently meet.
We believe these sources will be sufficient for our working capital needs, debt service obligations and scheduled capital expenditures for the foreseeable future. The relatively stable operating cash flows of our distribution operations businesses currently contribute most of our cash flow from operations, and we anticipate this to continue in the future.
We will continue to evaluate the need to increase our available liquidity based on our view of working capital requirements, including the impact of changes in natural gas prices, liquidity requirements established by the rating agencies and other factors. Additionally, our liquidity and capital resource requirements may change in the future due to a number of other factors, some of which we cannot control. These factors include:
| · | the seasonal nature of the natural gas business and our resulting short-term borrowing requirements, which typically peak during colder months |
| · | increased gas supplies required to meet our customers’ needs during cold weather |
| · | changes in wholesale prices and customer demand for our products and services |
| · | regulatory changes and changes in ratemaking policies of regulatory commissions |
| · | contractual cash obligations and other commercial commitments |
| · | pension and postretirement funding requirements |
| · | changes in income tax laws |
| · | margin requirements resulting from significant increases or decreases in our commodity prices |
| · | the impact of natural disasters, including weather |
Seasonality The seasonal nature of our sales affects the comparison of certain balance sheet items at March 31, 2006 and December 31, 2005, such as receivables, inventories and short-term debt. We have presented the condensed consolidated balance sheet as of March 31, 2005 to provide comparisons of these items with the corresponding period of the preceding year.
Contractual Obligations and Commitments We have incurred various contractual obligations and financial commitments in the normal course of our operating and financing activities. Contractual obligations include future cash payments required under existing contractual arrangements, such as debt and lease agreements. These obligations may result from both general financing activities and from commercial arrangements that are directly supported by related revenue-producing activities.
We calculate any required pension contributions using the projected unit credit cost method. Under this method, we are not required to make any pension contribution in 2006. The following table illustrates our expected future contractual obligations as of March 31, 2006.
| | | | | Payments due before December 31, | |
| | | | | | | 2007 | | 2009 | | 2011 | |
| | | | | | | & | | & | | & | |
In millions | | Total | | 2006 | | 2008 | | 2010 | | thereafter | |
| Interest charges on outstanding debt (1) | | $ | 1,346 | | $ | 72 | | $ | 175 | | $ | 175 | | $ | 924 | |
| Pipeline charges, storage capacity and gas supply (2) (3) | | | 1,696 | | | 236 | | | 543 | | | 419 | | | 498 | |
| Long-term debt (4) | | | 1,458 | | | - | | | 2 | | | 2 | | | 1,454 | |
| Short-term debt (5) | | | 472 | | | 472 | | | - | | | - | | | - | |
| PRP costs (6) | | | 261 | | | 26 | | | 72 | | | 95 | | | 68 | |
| Operating leases (7) | | | 157 | | | 22 | | | 46 | | | 32 | | | 57 | |
| Commodity and transportation charges | | | 14 | | | 14 | | | - | | | - | | | - | |
| Environmental remediation costs (6) | | | 96 | | | 10 | | | 19 | | | 62 | | | 5 | |
| Total | | $ | 5,500 | | $ | 852 | | $ | 857 | | $ | 785 | | $ | 3,006 | |
(1) Floating rate debt is based on the interest rate as of March 31, 2006 and the maturity of the underlying debt instrument. Includes interest payment on $150 million of trust preferred securities through its stated 2041 maturity. The security will be redeemed in May 2006 and eventually refinanced with long-term debt securities. (2) Charges recoverable through a PGA mechanism or alternatively billed to Marketers. Also includes demand charges associated with Sequent. (3) A subsidiary of NUI entered into two 20-year agreements for the firm transportation and storage of natural gas during 2003 with annual aggregate demand charges of approximately $5 million. As a result of our acquisition of NUI and in accordance with SFAS No. 141, “Business Combinations,“ we valued the contracts at fair value and established a long-term liability that will be amortized over the remaining lives of the contracts in order to offset the income statement impact of the future payments. (4) Includes $77 million of notes payable to Trusts redeemable in 2007. (5) Includes $155 million of notes payable toTrusts redeemable in 2006. (6) Includes charges recoverable through rate rider mechanisms. (7) We have certain operating leases with provisions for step rent or escalation payments and certain lease concessions. We account for these leases by recognizing the future minimum lease payments on a straight-line basis over the respective minimum lease terms, in accordance with SFAS No. 13, “Accounting for Leases.” However, this accounting treatment does not affect the future annual operating lease cash obligations as shown herein. |
We also have incurred various financial commitments in the normal course of business. Contingent financial commitments represent obligations that become payable only if certain predefined events occur, such as financial guarantees, and include the nature of the guarantee and the maximum potential amount of future payments that could be required of us as the guarantor. The following table illustrates our expected contingent financial commitments as of March 31, 2006.
| | | | | Commitments due before Dec. 31, 2007 & | |
| | | | |
In millions | | Total | | 2006 | | thereafter | |
| Standby letters of credit and performance and surety bonds | | $ | 21 | | $ | 21 | | | - | |
Cash flow provided from operating activities In the first quarter of 2006, our net cash flow provided from operating activities was $286 million, a decrease of $105 million or 27% from the same period last year.
The decrease was primarily a result of increased working capital requirements, which was attributable to lower sales of gas from inventory of $18 million due to mild weather in 2006, higher payments for interest and taxes of $21 million, and lower recoveries of gas costs through the purchased gas adjustment mechanisms of our regulated utilities of $32 million, with the remainder of the decrease attributable to higher working capital requirements related to higher commodity prices.
Cash flow used in investing activities Our cash used in investing activities consists primarily of property, plant and equipment expenditures. We made investments of $47 million in the three months ended March 31, 2006 and $81 million in the same period in 2005.
The decrease of $34 million is primarily due to the $32 million acquisition of the 250-mile pipeline in Georgia from Southern Natural Gas in 2005 and decreased expenditures of $6 million on the pipeline replacement program. This was offset by higher expenditures of $5 million at our corporate segment on information technology projects.
In 2006, we received approximately $5 million for the sale of land associated with former operating sites.
Cash flow used in financing activities Our financing activities primarily consist of borrowings and payments of short-term debt, distributions to minority interests, cash dividends on our common stock and issuances of common stock. Our capitalization and financing strategy is intended to ensure that we are properly capitalized with the appropriate mix of equity and debt securities. This strategy includes active management by us of the percentage of our total debt relative to our total capitalization, as well as the term and interest rate profile of our debt securities.
We also work to maintain or improve our credit ratings on our senior notes to effectively manage our existing financing costs and enhance our ability to raise additional capital on favorable terms. Factors we consider important in assessing our credit ratings include our balance sheet leverage, capital spending, earnings, cash flow generation, available liquidity and overall business risks. We do not have any trigger events in our debt instruments that are tied to changes in our credit ratings or our stock price and have not entered into any transaction that would require us to issue equity based on credit ratings or other trigger events. As of April 2006, our senior unsecured debt ratings are BBB+ from Standard & Poor’s Ratings Services (S&P), Baa1 from Moody’s Investors Service (Moody’s) and A- from Fitch Ratings (Fitch).
Our debt instruments and other financial obligations include provisions that, if not complied with, could require early payment, additional collateral support or similar actions. Our most important default events include maintaining covenants with respect to maximum leverage ratio, insolvency events, nonpayment of scheduled principal or interest payments, and acceleration of other financial obligations and change of control provisions. Our Credit Facility’s financial covenants require us to maintain a ratio of total debt to total capitalization of no greater than 70%; however, our goal is to maintain debt levels between 50% and 60% of total capitalization. We are currently in compliance with all existing debt provisions and covenants.
We believe that accomplishing these capitalization objectives and maintaining sufficient cash flow are necessary to maintain our investment-grade credit ratings and to allow us access to capital at reasonable costs. The components of our capital structure, as of the dates indicated, are summarized in the following table:
$ in millions | | March 31, 2006 | | December 31, 2005 | | March 31, 2005 | |
| Short-term debt | | $ | 316 | | | 9 | % | $ | 521 | | | 14 | % | $ | 37 | | | 1 | % |
| Current portion of long-term debt | | | 156 | | | 4 | | | 1 | | | - | | | 1 | | | - | |
| Long-term debt (1) | | | 1,458 | | | 42 | | | 1,615 | | | 45 | | | 1,618 | | | 52 | |
| Total debt | | | 1,930 | | | 55 | | | 2,137 | | | 59 | | | 1,656 | | | 53 | |
| Common shareholders’ equity | | | 1,585 | | | 45 | | | 1,499 | | | 41 | | | 1,446 | | | 47 | |
| Total capitalization | | $ | 3,515 | | | 100 | % | $ | 3,636 | | | 100 | % | $ | 3,102 | | | 100 | % |
| (1) | Net of interest rate swaps |
In March 2001, we established AGL Capital Trust II (Trust II), of which we own all of the voting securities. In May 2001, Trust II issued and sold $150 million of 8.00% capital securities, and used the proceeds to purchase 8.00% junior subordinated deferrable interest securities from us. In March 2006, we issued a notice to the Trustee of Trust II to redeem the $150 million of junior subordinated debentures on May 21, 2006. We have reclassified the $155 million, which includes a $5 million note payable representing our investment in the Trusts, previously included in notes payable to Trusts, as current debt in our condensed consolidated balance sheet as of March 31, 2006. We anticipate initially financing the $155 million redemption with commercial paper and subsequently with long-term debt by June 30, 2006.
Critical Accounting Policies and Estimates
The preparation of our financial statements requires us to make estimates and judgments that affect the reported amounts of assets, liabilities, revenues and expenses and the related disclosures of contingent assets and liabilities. We base our estimates on historical experience and various other assumptions that we believe to be reasonable under the circumstances. We evaluate our estimates on an ongoing basis, and our actual results may differ from these estimates. Our critical accounting policies used in the preparation of our consolidated financial statements are described in our Annual Report on Form 10-K for the year ended December 31, 2005 and include the following:
| · | Pipeline Replacement Program |
| · | Environmental Remediation Liabilities |
| · | Derivatives and Hedging Activities |
| · | Accounting for Contingencies |
| · | Accounting for Pension and Other Postretirement Benefits |
Each of our critical accounting policies and estimates involves complex situations requiring a high degree of judgment either in the application and interpretation of existing literature or in the development of estimates that impact our financial statements. There have been no significant changes to our critical accounting policies from those disclosed in our Annual Report on Form 10-K for the year ended December 31, 2005.
Accounting Developments
For information regarding accounting developments, see "Note 5 - Stock-based Compensation Plans."
Item 3. Quantitative and Qualitative Disclosures About Market Risk
We are exposed to risks associated with commodity prices, interest rates and credit. Commodity price risk is defined as the potential loss that we may incur as a result of changes in the fair value of a particular instrument or commodity. Interest rate risk results from our portfolio of debt and equity instruments that we issue to provide financing and liquidity for our business. Credit risk results from the extension of credit throughout all aspects of our business but is particularly concentrated at Atlanta Gas Light in distribution operations and in wholesale services. Our risk management activities and related accounting treatments are described in further detail in Note 2, “Risk Management. “
Commodity Price Risk
We employ a systematic approach to evaluating and managing the risks associated with our contracts related to wholesale marketing and risk management, including Value at Risk (VaR). A 95% confidence interval is used to evaluate our exposures. A 95% confidence interval means there is a 5% probability that the actual change in portfolio value will be greater than the calculated VaR value over the holding period. We currently use 1-day and 10-day holding periods to evaluate our VaR exposure, and we calculate VaR based on the variance-covariance technique. Additionally, our calculation requires us to make a number of assumptions, regarding matters such as prices, volatilities, and positions. Our VaR may not be comparable to a similarly titled measure of another company because, although VaR is a common metric in the energy industry, there are no established industry standards for calculating VaR or for the assumptions underlying such calculations.
Retail Energy Operations SouthStar’s use of derivatives is governed by a risk management policy, created and monitored by its risk management committee, which prohibits the use of derivatives for speculative purposes. A 95% confidence interval is used to evaluate its VaR. The following table provides the quarterly average on SouthStar’s 1-day and 10-day holding period VaR for the three months ended March 31, 2006 and 2005.
In millions | | 1-day | | 10-day | |
| Avg. 2006 | | $ | 0.1 | | $ | 0.2 | |
SouthStar generates operating margin from the active management of storage positions through a variety of hedging transactions and derivative instruments aimed at managing exposures arising from changing commodity prices. SouthStar uses these hedging instruments to lock in economic margins (as spreads between wholesale and retail commodity prices widen between periods) and thereby minimize its exposure to declining operating margins.
Wholesale Services This segment routinely utilizes various types of financial and other instruments to mitigate certain commodity price risks inherent in the natural gas industry. These instruments include a variety of exchange-traded and over-the-counter energy contracts, such as forward contracts, futures contracts, options contracts and financial swap agreements. The following table includes the fair values and average values of our energy marketing and risk management assets and liabilities as of March 31, 2006, December 31, 2005 and March 31, 2005. We base the average values on monthly averages for the three months ended March 31, 2006 and 2005.
| | | Average values at March 31, | |
In millions | | 2006 | | 2005 | |
| Asset | | $ | 85 | | $ | 54 | |
| Liability | | | 60 | | | 38 | |
| | | Values at | |
In millions | | March 31, 2006 | | Dec. 31, 2005 | | March 31, 2005 | |
| Asset | | $ | 66 | | $ | 97 | | $ | 72 | |
| Liability | | | 46 | | | 110 | | | 61 | |
Sequent’s open exposure is managed in accordance with established policies that limit market risk and require daily reporting of potential financial exposure to senior management, including the chief risk officer. Because Sequent generally manages physical gas assets and economically protects its positions by hedging in the futures markets, its open exposure is generally immaterial, permitting Sequent to operate within relatively low VaR limits. Sequent employs daily risk testing, using both VaR and stress testing, to evaluate the risks of its open positions.
Sequent’s management actively monitors open commodity positions and the resulting VaR. Sequent continues to maintain a relatively matched book, where its total buy volume is close to sell volume. Based on a 95% confidence interval and employing 1-day and a 10-day holding periods for all positions, Sequent’s portfolio of positions for the three months ended March 31, 2006 and 2005 had the following 1-day and 10-day holding period VaRs.
In millions | | 1-day | | 10-day | |
| 2006 | | | | | |
| Period end | | $ | 0.9 | | $ | 3.0 | |
| Average | | | 0.9 | | | 2.7 | |
| High | | | 1.9 | | | 5.9 | |
| Low | | | 0.7 | | | 2.1 | |
| 2005 | | | | | |
| Period end | | $ | 0.0 | | $ | 0.1 | |
| Average | | | 0.2 | | | 0.5 | |
| High | | | 0.4 | | | 1.3 | |
| Low (1) | | | 0.0 | | | 0.0 | |
| (1) | $0.0 values represent amounts less than $0.1 million. |
During most of 2005 and the first quarter of 2006, Sequent experienced increases in its high, average and period end 1-day and 10-day VaR amounts compared to prior periods. These increases were directly associated with higher prices and related price volatility created by the Gulf Coast hurricanes during the third quarter of 2005 and their lingering effects through the fourth quarter of 2005 and the first quarter of 2006, as well as Sequent entering into additional storage and transportation positions. Sequent is currently refining the methodology associated with its VaR calculation to incorporate dynamic volatility factors. A new methodology will be applied on a prospective basis during the second quarter of 2006. We anticipate that this refinement will yield higher VaR amounts, especially during periods of increased volatility, and be more sensitive to the relative level of risk in Sequent’s business due to the increased levels of storage and transportation positions.
Interest Rate Risk
Interest rate fluctuations expose our variable-rate debt to changes in interest expense and cash flows. Our policy is to manage interest expense using a combination of fixed-rate and variable-rate debt. To facilitate the achievement of desired fixed-rate to variable-rate debt ratios, AGL Capital entered into interest rate swaps whereby it agreed to exchange, at specified intervals, the difference between fixed and variable amounts calculated by reference to agreed-on notional principal amounts. These swaps are designated to hedge the fair values of $100 million of the $300 million Senior Notes Due 2011.
In September 2005, we also executed five treasury-lock agreements totaling $125 million to hedge the interest rate risk associated with an anticipated 2006 financing. The agreements will result in a 4.10% interest rate on the 10-year United States Treasury bond, against which we will be measured in issuing our own debt instruments, and were designated as cash flow hedges against the future interest payments on the anticipated financing.
Credit Risk
Wholesale Services Sequent has established credit policies to determine and monitor the creditworthiness of counterparties, as well as the quality of pledged collateral. Sequent also utilizes master netting agreements whenever possible to mitigate exposure to counterparty credit risk. When Sequent is engaged in more than one outstanding derivative transaction with the same counterparty and it also has a legally enforceable netting agreement with that counterparty, the “net” mark-to-market exposure represents the netting of the positive and negative exposures with that counterparty and a reasonable measure of Sequent’s credit risk. Sequent also uses other netting agreements with certain counterparties with whom it conducts significant transactions.
Master netting agreements enable Sequent to net certain assets and liabilities by counterparty. Sequent also nets across product lines and against cash collateral, provided the master netting and cash collateral agreements include such provisions. Additionally, Sequent may require counterparties to pledge additional collateral when deemed necessary. Sequent conducts credit evaluations and obtains appropriate internal approvals for its counterparty’s line of credit before any transaction with the counterparty is executed. In most cases, the counterparty must have a minimum long-term debt rating of Baa3 from Moody’s and BBB- from S&P. Generally, Sequent requires credit enhancements by way of guaranty, cash deposit or letter of credit for transaction counterparties that do not meet the minimum ratings threshold.
Sequent, which provides services to marketers and utility and industrial customers, also has a concentration of credit risk as measured by its 30-day receivable exposure plus forward exposure. As of March 31, 2006, Sequent’s top 20 counterparties represented approximately 54% of the total counterparty exposure of $292 million, derived by adding together the top 20 counterparties’ exposures and dividing by the total of Sequent’s counterparties’ exposures.
As of March 31, 2006, Sequent’s counterparties, or the counterparties’ guarantors, had a weighted average S&P equivalent credit rating of A-, which is consistent with the prior year. The S&P equivalent credit rating is determined by a process of converting the lower of the S&P or Moody’s ratings to an internal rating ranging from 9 to 1, with 9 being equivalent to AAA/Aaa by S&P and Moody’s and 1 being D or Default by S&P and Moody’s. A counterparty that does not have an external rating is assigned an internal rating based on the strength of the financial ratios of that counterparty.
To arrive at the weighted average credit rating, each counterparty’s assigned internal rating is multiplied by the counterparty’s credit exposure and summed for all counterparties. That sum is divided by the aggregate total counterparties’ exposures, and this numeric value is then converted to an S&P equivalent. The following tables show Sequent’s commodity receivable and payable positions as of March 31, 2006, December 31, 2005 and March 31, 2005.
| | | Mar. 31, | | Dec. 31, | | Mar. 31, | |
In millions | | 2006 | | 2005 | | 2005 | |
Gross receivables | | | | | | | |
| Receivables with netting agreements in place: | | | | | | | | | | |
| Counterparty is investment grade | | $ | 283 | | $ | 462 | | $ | 295 | |
| Counterparty is non-investment grade | | | 40 | | | 66 | | | 28 | |
| Counterparty has no external rating | | | 71 | | | 113 | | | 59 | |
| Receivables without netting agreements in place: | | | | | | | | | | |
| Counterparty is investment grade | | | 10 | | | 34 | | | 12 | |
| Counterparty is non-investment grade | | | - | | | - | | | 2 | |
| Counterparty has no external rating | | | 1 | | | - | | | - | |
| Amount recorded on balance sheet | | $ | 405 | | $ | 675 | | $ | 396 | |
Gross payables | | | | | | | |
| Payables with netting agreements in place: | | | | | | | | | | |
| Counterparty is investment grade | | $ | 299 | | $ | 456 | | $ | 215 | |
| Counterparty is non-investment grade | | | 24 | | | 56 | | | 46 | |
| Counterparty has no external rating | | | 152 | | | 255 | | | 141 | |
| Payables without netting agreements in place: | | | | | | | | | | |
| Counterparty is investment grade | | | - | | | 4 | | | 37 | |
| Counterparty is non-investment grade | | | - | | | - | | | - | |
| Counterparty has no external rating | | | 1 | | | 4 | | | - | |
| Amount recorded on balance sheet | | $ | 476 | | $ | 775 | | $ | 439 | |
Sequent has certain trade and credit contracts that have explicit rating trigger events in case of a credit rating downgrade. These rating triggers typically give counterparties the right to suspend or terminate credit if our credit ratings are downgraded to non-investment grade status. Under such circumstances, Sequent would need to post collateral to continue transacting business with some of its counterparties. Posting collateral would have a negative effect on our liquidity. If such collateral were not posted, Sequent’s ability to continue transacting business with these counterparties would be impaired. If at March 31, 2006 Sequent’s credit ratings had been downgraded to non-investment grade status, the required amounts to satisfy potential collateral demands under such agreements between Sequent and its counterparties would have totaled $28 million.
| (a) | Evaluation of disclosure controls and procedures. Under the supervision and with the participation of our management, including our principal executive officer and principal financial officer, we conducted an evaluation of our disclosure controls and procedures, as such term is defined in Rule 13a-15(e) promulgated under the Securities Exchange Act of 1934, as amended (the Exchange Act), as of March 31, 2006, the end of the period covered by this report. Based on this evaluation, our principal executive officer and our principal financial officer concluded that our disclosure controls and procedures were effective as of March 31, 2006 in providing a reasonable level of assurance that information we are required to disclose in reports that we file or submit under the Exchange Act is recorded, processed, summarized and reported within the time periods in SEC rules and forms, including a reasonable level of assurance that information required to be disclosed by us in such reports is accumulated and communicated to our management, including our principal executive officer and our principal financial officer, as appropriate to allow timely decisions regarding required disclosure. |
| (b) | Changes in internal controls over financial reporting. There were no changes in our internal control over financial reporting during our most recent fiscal quarter that have materially affected, or are reasonably likely to materially affect, our internal control over financial reporting. |
PART II -- OTHER INFORMATION
Item 1. Legal Proceedings
Teamsters Local 528 represented approximately 300 Atlanta Gas Light employees under a collective bargaining agreement that was to expire on March 23, 2006. Atlanta Gas Light and the Teamsters were not able to finalize a new collective bargaining agreement prior to its expiration and, on March 23, 2006, the Teamsters disclaimed interest in representing the bargaining unit. On March 24, 2006, International Brotherhood of Electrical Workers (IBEW) Local 84 filed a representation petition with the National Labor Relations Board (NLRB) seeking an election to certify it as the representative of a bargaining unit of Atlanta Gas Light employees. The proposed bargaining unit consists primarily of employees formerly represented by the Teamsters. The NLRB has scheduled a representation election for May 4 and 5, 2006.
The nature of our business ordinarily results in periodic regulatory proceedings before various state and federal authorities and litigation incidental to the business. For information regarding pending federal and state regulatory matters, see "Results of Operations - Distribution Operations" contained in Item 2 of Part I under the caption "Management's Discussion and Analysis of Financial Condition and Results of Operations." With regard to other legal proceedings, we are a party, as both plaintiff and defendant, to a number of other suits, claims and counterclaims on an ongoing basis. Management believes that the outcome of all such other litigation in which it is involved will not have a material adverse effect on our consolidated financial statements.
Item 2. Unregistered Sales of Equity Securities and Use of Proceeds
The following table presents information about our purchases of our common stock during the first quarter of 2006:
Issuer Purchases of Equity Securities
Period | | Total Number of Shares Purchased | | Average Price Paid per Share | | Total Number of Shares Purchased as Part of Publicly Announced Plans or Programs (1) | | Maximum Number of Shares that May Yet Be Purchased Under the Plans or Programs | |
| January 2006 | | | 4,965(2 | ) | $ | 34.81 | | | - | | | - | |
| February 2006 | | | - | | | - | | | - | | | - | |
| March 2006 | | | 85,500(1 | ) | | 35.42 | | | 85,500 | | | 7,914,500 | |
Total first quarter | | | 90,465 | | $ | 35.39 | | | 85,500 | | | 7,914,500 | |
| | | | | | | | | | | | | | |
| (1) | On February 3, 2006, we announced that our Board of Directors authorized a plan to repurchase up to 8 million shares of our outstanding common stock over a five year period. |
| (2) | Pursuant to our stock-based compensation plans, participants may surrender shares of our common stock as payment of applicable tax withholding obligations in connection with the vesting of shares of restricted stock and/or the exercise of stock options. These shares are not repurchased pursuant to a publicly announced share repurchase program. |
Item 6. Exhibits
| 3.1 | Amended and Restated Articles of Incorporation filed November 2, 2005 with the Secretary of State of the state of Georgia (incorporated herein by reference to Exhibit 3.1, AGL Resources Inc. Form 8-K dated November 2, 2005). |
| | |
| 3.2 | Bylaws, as amended on October 29, 2003 (incorporated herein by reference to Exhibit 3.2 of AGL Resources Inc. Annual Report on Form 10-K for the fiscal year ended December 31, 2003). |
| | |
| 31.1 | Certification of John W. Somerhalder II pursuant to Rule 13a - 14(a) |
| | |
| 31.2 | Certification of Andrew W. Evans pursuant to Rule 13a - 14(a) |
| | |
| 32.1 | Certification of John W. Somerhalder II pursuant to 18 U.S.C. Section 1350 |
| | |
| 32.2 | Certification of Andrew W. Evans pursuant to 18 U.S.C. Section 1350 |
Pursuant to the requirements of the Securities Exchange Act of 1934, the registrant has duly caused this report to be signed on its behalf by the undersigned thereunto duly authorized.
| | AGL RESOURCES INC. |
| | (Registrant) |
| | |
| Date: May 3, 2006 | /s/ Andrew W. Evans |
| | Senior Vice President and Chief Financial Officer |