UNITED STATES
SECURITIES AND EXCHANGE COMMISSION
Washington, D.C. 20549
FORM N-CSR
CERTIFIED SHAREHOLDER REPORT
OF
REGISTERED MANAGEMENT COMPANY
| Investment Company Act file number: | 811-07443 |
| Name of Registrant: | Vanguard Whitehall Funds |
| Address of Registrant: | P.O. Box 2600
Valley Forge, PA 19482 |
| Name and address of agent for service: | Heidi Stam, Esquire
P.O. Box 876
Valley Forge, PA 19482 |
Registrant’s telephone number, including area code: (610) 669-1000
| Date of fiscal year end: | October 31 |
| Date of reporting period: | November 1, 2005 - October 31, 2006 |
| Item 1: | Reports to Shareholders |
Vanguard® Selected Value Fund |
| |
| |
> Annual Report | |
| |
| |
| |
| |
| |
October 31, 2006 | |
| |
| |
| 
|
| |
| |
| |
| |
| |
> | For the fiscal year ended October 31, 2006, Vanguard Selected Value Fund returned 19.4%, outperforming the returns of its average competitor, but trailing its benchmark by a small margin. |
> | As measured by the Dow Jones Wilshire 5000 Composite Index, the broad stock market returned 16.6% for the 12 months. Once again, value stocks outpaced growth issues for the period. |
> | Several of the fund’s top-ten holdings had impressive returns for the year, boosting the fund’s overall performance. |
Contents | |
| |
Your Fund’s Total Returns | 1 |
Chairman’s Letter | 2 |
Advisors’ Report | 6 |
Fund Profile | 9 |
Performance Summary | 10 |
Financial Statements | 12 |
Your Fund’s After-Tax Returns | 22 |
About Your Fund’s Expenses | 23 |
Glossary | 25 |
Please note: The opinions expressed in this report are just that—informed opinions. They should not be considered promises or advice. Also, please keep in mind that the information and opinions cover the period through the date on the cover of this report. Of course, the risks of investing in your fund are spelled out in the prospectus.
Your Fund’s Total Returns
Fiscal Year Ended October 31, 2006 | |
| Total |
| Returns |
Vanguard Selected Value Fund | 19.4% |
Russell Midcap Value Index | 20.5 |
Average Mid-Cap Value Fund1 | 16.8 |
Dow Jones Wilshire 5000 Index | 16.6 |
Your Fund’s Performance at a Glance | | | |
October 31, 2005–October 31, 2006 | | | | |
| | | Distributions Per Share |
| Starting | Ending | Income | Capital |
| Share Price | Share Price | Dividends | Gains |
Vanguard Selected Value Fund | $18.99 | $21.38 | $0.290 | $0.850 |
1 Derived from data provided by Lipper Inc.
1

Chairman’s Letter
Dear Shareholder,
For the 2006 fiscal year, Vanguard Selected Value Fund returned 19.4%, besting both the average return of its peers and the broad stock market, but trailing the performance of its benchmark by about 1 percentage point. During the 12 months, the market favored value-oriented stocks over growth-oriented issues, and small- and mid-capitalization stocks outperformed large-cap equities—both circumstances that worked to the advantage of your fund.
The fund held large positions in the financials, consumer discretionary, and health care sectors throughout the year, but underperformed the index in each of those sectors. The fund’s exposure to a number of strongly performing stocks in other sectors such as industrials, consumer staples, and energy helped to boost performance.
Stocks produced fitful rallies and familiar patterns
U.S. stock prices advanced in fits and starts during the past 12 months, reflecting the uncertainty that pervaded the market for much of the period. The broad market rallied at the start of the fiscal year, buoyed by strong corporate earnings growth and vigorous economic expansion. In mid-May, as investors responded to increasingly pungent whiffs of inflation, anxiety moved to the fore, and market indexes pulled back sharply. In late
2
summer, optimism regained the upper hand. The broad market staged a powerful rally to post a 12-month return of 16.6%.
As has been the case for much of the past five years, smaller-cap stocks outperformed large-caps, and value stocks bested their growth-stock counterparts. International stocks were especially strong performers; European and emerging-markets equities led the way.
Fed rate hikes and inflation concerns drove bonds
The fixed income markets reflected some of these same uncertainties, with the back-and-forth pattern most pronounced among the longest-maturity bonds. The Federal Reserve Board tightened monetary policy by raising its target for the federal funds rate six times during the fiscal year, to 5.25%, and the yields of short-term issues followed closely behind. The yields of longer-term securities, by contrast, dipped early in the year, rose sharply on inflation worries in May, then finished the period a bit above their starting point. The broad taxable bond market returned 5.2%. Corporate bonds generally outperformed government issues. Municipal bonds did better still.
Your fund’s major holdings produced healthy returns
From the standpoint of investment style, Vanguard Selected Value Fund occupied the market’s sweet spot during fiscal 2006. As a fund focused on stocks of mid-sized companies that the advisors consider to be undervalued, the market’s emphasis on smaller-sized “underdogs” was a good fit for the fund.
Market Barometer | | | |
| Average Annual Total Returns |
| Periods Ended October 31, 2006 |
| One Year | Three Years | Five Years |
Stocks | | | |
Russell 1000 Index (Large-caps) | 16.0% | 11.9% | 7.9% |
Russell 2000 Index (Small-caps) | 20.0 | 14.5 | 13.8 |
Dow Jones Wilshire 5000 Index (Entire market) | 16.6 | 12.4 | 8.9 |
MSCI All Country World Index ex USA (International) | 28.9 | 23.0 | 16.7 |
| | | |
Bonds | | | |
Lehman Aggregate Bond Index (Broad taxable market) | 5.2% | 3.9% | 4.5% |
Lehman Municipal Bond Index | 5.7 | 4.8 | 5.1 |
Citigroup 3-Month Treasury Bill Index | 4.5 | 2.8 | 2.3 |
| | | |
CPI | | | |
Consumer Price Index | 1.3% | 2.9% | 2.6% |
3
Although the fund held large positions in the financials, consumer discretionary, and health care sectors, the advisors’ stock selections in these sectors underperformed the index. However, favorable stock selection in a number of other, smaller sectors—including industrials, consumer staples, and energy—bolstered these subpar returns with sharp gains.
During a period when financial stocks produced robust returns, the fund paid a penalty for its below-benchmark exposure to the sector. And with no exposure to the telecommunication services sector, the fund also missed out on this sector’s performance.
On the other hand, several of the fund’s top-ten holdings had a stellar 12 months. Reynolds American (+56%) and Carolina Group (+46%) are just two examples of major holdings that produced impressive gains.
The fund’s long-term record has improved
Through its first ten years, the Selected Value Fund has generated an average annual return of 10.7%. Although the fund has outpaced the returns of the broad stock market during the decade, it trails its benchmark and the average return of its competitors.
Expense Ratios1 | | |
Your fund compared with its peer group | | |
| | Average |
| | Mid-Cap |
| Fund | Value Fund |
Selected Value Fund | 0.45% | 1.46% |
Total Returns | | |
Ten Years Ended October 31, 2006 | | |
| Average | Final Value of a $25,000 |
| Annual Return | Initial Investment |
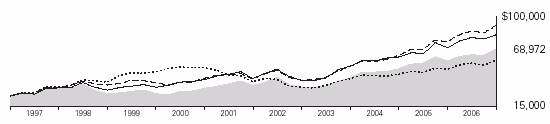
Selected Value Fund | 10.7% | $68,972 |
Russell Midcap Value Index | 13.8 | 91,208 |
Average Mid-Cap Value Fund | 12.6 | 82,219 |
Dow Jones Wilshire 5000 Index | 8.9 | 58,488 |
1 Fund expense ratio reflects the 12 months ended October 31, 2006. Peer-group expense ratio is derived from data provided by Lipper Inc. and captures information through year-end 2005.
4
An investment of $25,000 made in the Selected Value Fund ten years ago would have grown to $68,972 by October 31, 2006. The table on page 4 shows how the same investments in the fund’s comparative measures would have fared. Relative to those standards, the fund’s long-term underperformance is largely due to subpar returns during its first few years. Since then, the Selected Value Fund has been steadily gaining ground. Given the depth of experience and knowledge of the fund’s advisors, we remain optimistic about the fund’s performance prospects in the years ahead.
Diversification and a long-term perspective are important
A disciplined, bargain-hunting philosophy is at the heart of the advisors’ strategy for Vanguard Selected Value Fund. Central to this approach is the search for companies trading at prices that do not reflect their true value.
The Selected Value Fund has logged an impressive record in the past few years. Prior to that, the fund lagged its peers and the broad stock market. As an investor in the fund, you likely recognize that stretches of good performance can follow times of poor returns, so keeping a long-term view is critical.
As we have counseled investors through the years, sticking with a carefully considered, balanced portfolio of stock, bond, and money market mutual funds suited to your unique circumstances can be key to your long-term investing success. By providing you with exposure to mid-cap value stocks, the Selected Value Fund can play an important role in such a diversified portfolio.
Thank you for investing your assets with Vanguard.
Sincerely,

John J. Brennan
Chairman and Chief Executive Officer
November 10, 2006
5
Advisors’ Report
During the fiscal year ended October 31, 2006, Vanguard Selected Value Fund returned 19.4%. This performance reflected the combined efforts of your fund’s two independent advisors. The use of multiple advisors provides exposure to distinct, yet complementary, investment approaches, enhancing the fund’s diversification.
The advisors, the amount and percentage of fund assets each manages, and a brief description of their investment strategies are presented in the table below. The advisors have also prepared a discussion of the investment environment that existed during the fiscal year and of how their portfolio positioning reflects this assessment.
Barrow, Hanley, Mewhinney & Strauss, Inc.
Portfolio Managers:
James P. Barrow, Founding Partner
Mark Giambrone, Principal
The last 12 months have been an extremely robust period for both Vanguard Selected Value Fund and the market overall. Over this period, we lagged the benchmark but posted solid results. Some of the areas currently leading the market appear to be the least attractive (most expensive), and we are well-positioned for when more rational approaches to valuation return.
Vanguard Selected Value Fund Investment Advisors | |
| | | |
| Fund Assets Managed |
Investment Advisor | % | $ Million | Investment Strategy | |
Barrow, Hanley, Mewhinney & | 80 | $3,466 | Conducts fundamental research on | |
Strauss, Inc. | | | individual stocks exhibiting traditional | |
| | | value characteristics:price/earnings | |
| | | and price/book ratios below the market | |
| | | average and dividend yields above the | |
| | | market average. | |
Donald Smith & Co., Inc. | 16 | 695 | Conducts fundamental research on the | |
| | | lowest price-to-tangible-book- value | |
| | | companies.Research focuses on | |
| | | underlying quality of book value and | |
| | | assets, and on long-term earnings | |
| | | potential. | |
Cash Investments1 | 4 | 165 | — | |
| | | | | | |
1 These short-term reserves are invested by Vanguard in equity index products to simulate investment in stocks. Each advisor may also maintain a modest cash position.
6
At the fiscal year-end, we were underweight versus the benchmark in the financials, materials, and utilities sectors. Certain segments of financials (specificially, REITs and brokerages) that make up a meaningful portion of the benchmark have performed well, but we now see them as extremely unattractive. Utilities have also had a nice run, but as their valuations approach historically high levels, we view our underweighting as prudent. Lastly, due to a strong move in commodity prices, materials stocks have performed admirably; but we believe that the majority of the upward move in prices is now behind us.
As of October 31, we had significant overweightings relative to the benchmark in both the health care and consumer discretionary sectors. Our allocations to these areas hurt the fund’s performance over the last several months, but over a longer time frame, we believe these groups will represent tremendous value. Our overexposure to consumer discretionary does not ignore investors’ current concerns about housing or consumer spending, but does try to take advantage of the fact that the market is overly wary of some very good businesses with little or limited housing exposure, like Advance Auto Parts, Family Dollar Stores, Royal Caribbean Cruises, and Mattel.
We continue to find businesses with tremendous upside potential and over-looked value, and we are fortunate that three of those were acquired recently by other companies in this period for substantial premiums: GTECH Holdings, American Power Conversion, and WellChoice.
Donald Smith & Co., Inc.
Portfolio Managers:
Donald G. Smith, Chief Investment Officer
Richard L. Greenberg, CFA,
Senior Vice President
The portfolio as of October 31, 2006, met our criteria of owning a high concentration of low price-to-tangible-book-value stocks with attractive long-term earnings potential. As of the fiscal year-end, the portfolio was selling at 115% of tangible book value, 37% of revenues, and 10x “normalized” earnings. In contrast, the Standard & Poor’s 500 Index was selling at close to 500% of tangible book value, 160% of revenues, and 18x normalized earnings.
The portfolio’s largest industry weighting as of October 31 was insurance (20.7%), followed by technology (19.3%), utilities (13.6%), airlines (12.5%), paper products (10.1%), retail (8.3%), shipping (3.0%), auto parts (2.0%), and savings and loans (0.7%).
7
Energy stocks, the big market winners over the past two years, continued to be notable for their absence. Until recently, they sold at very high valuations that do not meet our strict investment criteria.
Many of the portfolio’s stocks would directly benefit from lower oil prices (airlines, auto parts, retailers). The prices of our tech stocks have historically been inversely related to the price of oil stocks, though tech companies are not direct beneficiaries of lower oil prices. As of October 31, the tech stocks we purchased for our portion of the Selected Value Fund were down substantially from their highs, were profitable or at least close to breaking even in cash, and had healthy balance sheets. The portfolio’s two insurance companies were selling at about book value, with price/earnings ratios of 10x–12x.
We added four new names to the portfolio over the last year: two semiconductor companies selling below book value (Spansion and Semiconductor Manufacturing International), one utility (Pinnacle West Capital), and one tanker company (Overseas Shipholding Group). We also added to a number of the existing positions. Three names were deleted from the portfolio, all at substantial gains: La Quinta Corp. REIT, Micron Technology, and U.S. Steel.
8
Fund Profile
As of October 31, 2006
Portfolio Characteristics | | |
| | Comparative | Broad |
| Fund | Index1 | Index2 |
Number of Stocks | 58 | 481 | 4,956 |
Median Market Cap | $4.8B | $7.6B | $28.7B |
Price/Earnings Ratio | 19.8x | 17.8x | 17.7x |
Price/Book Ratio | 2.0x | 2.0x | 2.6x |
Yield | 1.8% | 2.0% | 1.6% |
Return on Equity | 11.9% | 13.2% | 15.4% |
Earnings Growth Rate | 16.0% | 11.9% | 15.5% |
Foreign Holdings | 6.5% | 0.0% | 1.1% |
Turnover Rate | 37% | — | — |
Expense Ratio | 0.45% | — | — |
Short-Term Reserves | 4% | — | — |
| | | | |
Sector Diversification (% of portfolio) | |
| | Comparative | Broad |
| Fund | Index1 | Index2 |
Consumer Discretionary | 20% | 13% | 12% |
Consumer Staples | 7 | 7 | 9 |
Energy | 4 | 4 | 9 |
Financials | 23 | 33 | 22 |
Health Care | 12 | 4 | 12 |
Industrials | 11 | 8 | 11 |
Information Technology | 7 | 8 | 16 |
Materials | 2 | 6 | 3 |
Telecommunication | | | |
Services | 0 | 2 | 3 |
Utilities | 10 | 15 | 3 |
Short-Term Reserves | 4% | — | — |
| | | | |
Volatility Measures3 | |
| Fund Versus | Fund Versus |
| Comparative Index1 | Broad Index2 |
R-Squared | 0.76 | 0.76 |
Beta | 0.82 | 0.92 |
Ten Largest Holdings4 (% of portfolio) | |
| | |
Tech Data Corp. | technology | |
| distributors | 3.3% |
Pinnacle West | | |
Capital Corp. | electric utilities | 3.1 |
American Power | electrical | |
Conversion Corp. | components | |
| and equipment | 2.9 |
Carolina Group | tobacco | 2.9 |
Advance Auto Parts, Inc. | automotive retail | 2.6 |
Sherwin-Williams Co. | home improvement | |
| retail | 2.6 |
Whirlpool Corp. | household | |
| appliances | 2.5 |
Reynolds American Inc. | tobacco | 2.5 |
Xcel Energy, Inc. | multi-utilities | 2.4 |
Willis Group Holdings Ltd. | insurance brokers | 2.3 |
Top Ten | | 27.1% |
Investment Focus

1 | Russell Midcap Value Index. |
2 | Dow Jones Wilshire 5000 Index. |
3 | For an explanation of R-squared, beta, and other terms used here, see the Glossary on page 25. |
4 | “Ten Largest Holdings” excludes any temporary cash investments and equity index products. |
9
Performance Summary
All of the returns in this report represent past performance, which is not a guarantee of future results that may be achieved by the fund. (Current performance may be lower or higher than the performance data cited. For performance data current to the most recent month-end, visit our website at www.vanguard.com.) Note, too, that both investment returns and principal value can fluctuate widely, so an investor’s shares, when sold, could be worth more or less than their original cost. The returns shown do not reflect taxes that a shareholder would pay on fund distributions or on the sale of fund shares.
Cumulative Performance: October 31, 1996–October 31, 2006
Initial Investment of $25,000
| | | |
| | | | |
| Average Annual Total Returns | Final Value |
| Periods Ended October 31, 2006 | of a $25,000 |
| One Year | Five Years | Ten Years | Investment |
Selected Value Fund1 | 19.38% | 14.94% | 10.68% | $68,972 |
Dow Jones Wilshire 5000 Index | 16.61 | 8.89 | 8.87 | 58,488 |
Russell Midcap Value Index | 20.51 | 17.43 | 13.82 | 91,208 |
Average Mid-Cap Value Fund2 | 16.81 | 14.62 | 12.64 | 82,219 |
1 Total returns do not reflect the 1% fee assessed on redemptions after March 23, 2005, of shares held for less than one year, or the 1% fee assessed until March 23, 2005, on shares purchased on or after August 7, 2001, and held for less than five years.
2 Derived from data provided by Lipper Inc.
10
Fiscal-Year Total Returns (%): October 31, 1996–October 31, 2006

Average Annual Total Returns: Periods Ended September 30, 2006
This table presents average annual total returns through the latest calendar quarter—rather than through the end of the fiscal period. Securities and Exchange Commission rules require that we provide this information.
| Inception Date | One Year | Five Years | Ten Years |
Selected Value Fund1 | 2/15/1996 | 12.01% | 14.11% | 10.53% |
1 Total returns do not reflect the 1% fee assessed on redemptions after March 23, 2005, of shares held for less than one year, or the 1% fee assessed until March 23, 2005, on shares purchased on or after August 7, 2001, and held for less than five years.
Note: See Financial Highlights table on page 16 for dividend and capital gains information.
11
Financial Statements
Statement of Net Assets
As of October 31, 2006
The fund provides a complete list of its holdings four times in each fiscal year, at the quarter-ends. For the second and fourth fiscal quarters, the lists appear in the fund’s semiannual and annual reports to shareholders. For the first and third fiscal quarters, the fund files the lists with the Securities and Exchange Commission on Form N-Q. Shareholders can look up the fund’s Forms N-Q on the SEC’s website at www.sec.gov. Forms N-Q may also be reviewed and copied at the SEC’s Public Reference Room (see the back cover of this report for further information).
| | Market |
| | Value• |
| Shares | ($000) |
Common Stocks (92.2%)1 | | |
Consumer Discretionary (20.1%) | |
Advance Auto Parts, Inc. | 3,202,800 | 112,162 |
Sherwin-Williams Co. | 1,884,200 | 111,601 |
Whirlpool Corp. | 1,258,300 | 109,384 |
Royal Caribbean | | |
Cruises, Ltd. | 2,307,800 | 93,466 |
Family Dollar Stores, Inc. | 3,059,100 | 90,091 |
The Stanley Works | 1,861,900 | 88,720 |
2 ^Winnebago Industries, Inc. | 1,847,300 | 61,497 |
Dillard’s Inc. | 1,915,000 | 57,776 |
Genuine Parts Co. | 1,170,800 | 53,295 |
Mattel, Inc. | 1,951,500 | 44,162 |
Service Corp. International | 3,525,600 | 32,153 |
Magna International, Inc. | | |
Class A | 120,000 | 8,976 |
Dana Corp. | 2,976,400 | 4,837 |
| | 868,120 |
Consumer Staples (6.5%) | | |
Carolina Group | 2,158,100 | 124,781 |
^Reynolds American Inc. | 1,721,600 | 108,736 |
UST, Inc. | 923,400 | 49,457 |
| | 282,974 |
Energy (3.7%) | | |
Marathon Oil Corp. | 604,900 | 52,263 |
El Paso Corp. | 3,182,700 | 43,603 |
Murphy Oil Corp. | 904,800 | 42,670 |
Overseas Shipholding | | |
Group Inc. | 332,900 | 20,823 |
| | 159,359 |
Financials (21.8%) | | |
Commercial Banks (2.0%) | | |
The South Financial | | |
Group, Inc. | 3,235,900 | 85,848 |
Consumer Finance (1.8%) | | |
^The First | | |
Marblehead Corp. | 1,124,200 | 75,827 |
| Insurance (9.0%) | | |
| | | |
| Willis Group Holdings Ltd. | 2,662,600 | 101,259 |
| Axis Capital Holdings Ltd. | 2,481,900 | 81,530 |
| XL Capital Ltd. Class A | 896,400 | 63,241 |
| *CNA Financial Corp. | 1,687,200 | 63,186 |
| UnumProvident Corp. | 2,929,700 | 57,949 |
| American Financial | | |
| Group, Inc. | 269,200 | 12,884 |
| American National | | |
| Insurance Co. | 84,200 | 9,767 |
| | | |
| Real Estate Investment Trusts (3.6%) | |
| American Financial | | |
| Realty Trust REIT | 5,893,800 | 68,781 |
| First Industrial | | |
| Realty Trust REIT | 1,192,300 | 54,810 |
| Annaly Mortgage | | |
| Management Inc. REIT | 2,580,000 | 33,850 |
| | | |
| Thrifts & Mortgage Finance (5.4%) | |
| People’s Bank | 2,262,775 | 92,095 |
| Radian Group, Inc. | 1,555,200 | 82,892 |
| New York Community | | |
| Bancorp, Inc. | 3,382,100 | 55,297 |
| Hudson City Bancorp, Inc. | 330,000 | 4,531 |
| | | 943,747 |
Health Care (11.2%) | | |
| Hillenbrand Industries, Inc. | 1,703,375 | 99,954 |
| *Coventry Health Care Inc. | 1,987,000 | 93,290 |
| *Triad Hospitals, Inc. | 2,483,000 | 91,945 |
| *^HealthSouth Corp. | 2,989,700 | 72,500 |
| Omnicare, Inc. | 1,855,900 | 70,302 |
| Valeant Pharmaceuticals | | |
| International | 2,958,400 | 55,263 |
| | | 483,254 |
Industrials (10.6%) | | |
| American Power | | |
| Conversion Corp. | 4,154,500 | 125,591 |
| Goodrich Corp. | 2,083,200 | 91,848 |
12
| | | Market |
| | | Value• |
| | Shares | ($000) |
| Ryder System, Inc. | 1,659,900 | 87,394 |
| Air France KLM ADR | 2,441,700 | 87,120 |
| ITT Industries, Inc. | 1,221,900 | 66,459 |
| | | 458,412 |
Information Technology (6.9%) | |
*2 | Tech Data Corp. | 3,670,509 | 144,435 |
* | Solectron Corp. | 19,324,700 | 64,545 |
| MasterCard, Inc. Class A | 828,700 | 61,407 |
* ^Spansion Inc. Class A | 1,082,500 | 15,436 |
* ^Semiconductor | | |
| Manufacturing | | |
| International Corp. ADR | 2,479,200 | 14,280 |
| | | 300,103 |
Materials (1.6%) | | |
* ^Domtar Inc. | 10,743,200 | 70,368 |
| | | |
Utilities (9.8%) | | |
| Pinnacle West | | |
| Capital Corp. | 2,836,800 | 135,627 |
| Xcel Energy, Inc. | 4,798,100 | 105,894 |
| MDU Resources | | |
| Group, Inc. | 3,032,400 | 77,872 |
* | Reliant Energy, Inc. | 4,096,200 | 51,940 |
| CenterPoint Energy Inc. | 3,329,800 | 51,545 |
| | | 422,878 |
Total Common Stocks | | |
(Cost $3,219,150) | | 3,989,215 |
Temporary Cash Investments (9.9%)1 | |
Money Market Fund (9.7%) | | |
3 | Vanguard Market | | |
| Liquidity Fund, 5.289% | 337,238,127 | 337,238 |
3 | Vanguard Market | | |
| Liquidity Fund, | | |
| 5.289%—Note G | 81,001,300 | 81,001 |
| | | 418,239 |
U.S. Agency Obligation (0.2%) | | |
4 Federal Home Loan | | |
Mortgage Corp. | | |
5 5.150%, 12/26/06 | 8,000 | 7,938 |
Total Temporary Cash Investments | |
(Cost $426,177) | | 426,177 |
Total Investments (102.1%) | | |
(Cost $3,645,327) | | 4,415,392 |
Other Assets and Liabilities (–2.1%) | |
Other Assets—Note C | | 12,555 |
Liabilities—Note G | | (101,704) |
| | (89,149) |
Net Assets (100%) | | |
Applicable to 202,375,695 outstanding $.001 |
par value shares of beneficial interest | |
(unlimited authorization) | | 4,326,243 |
| | | | | |
Net Asset Value Per Share | | $21.38 |
| | |
| | |
| | |
At October 31, 2006, net assets consisted of:6 |
| Amount | Per |
| ($000) | Share |
Paid-in Capital | 3,296,932 | $16.29 |
Undistributed Net | | |
Investment Income | 44,653 | .22 |
Accumulated Net | | |
Realized Gains | 209,200 | 1.03 |
Unrealized Appreciation | | |
Investment Securities | 770,065 | 3.81 |
Futures Contracts | 5,393 | .03 |
Net Assets | 4,326,243 | $21.38 |
• | See Note A in Notes to Financial Statements. |
* | Non-income-producing security. |
^ | Part of security position is on loan to broker-dealers. See Note G in Notes to Financial Statements. |
1 The fund invests a portion of its cash reserves in equity markets through the use of index futures contracts. After giving effect to futures investments, the fund’s effective common stock and temporary cash investment positions represent 96.0% and 6.1%, respectively, of net assets. See Note E in Notes to Financial Statements.
2 Considered an affiliated company of the fund as the fund owns more than 5% of the outstanding voting securities of such company. See Note I in Notes to Financial Statements.
3 Affiliated money market fund available only to Vanguard funds and certain trusts and accounts managed by Vanguard. Rate shown is the 7-day yield.
4 The issuer operates under a congressional charter; its securities are neither issued nor guaranteed by the U.S. government. If needed, access to additional funding from the U.S. Treasury (beyond the issuer’s line of credit) would require congressional action.
5 | Securities with a value of $7,938,000 have been segregated as initial margin for open futures contracts. |
6 | See Note E in Notes to Financial Statements for the tax-basis components of net assets. |
ADR—American Depositary Receipt.
REIT—Real Estate Investment Trust.
13
Statement of Operations
| Year Ended |
| October 31, 2006 |
| ($000) |
Investment Income | |
Income | |
Dividends1 | 71,962 |
Interest1 | 12,895 |
Security Lending | 1,831 |
Total Income | 86,688 |
Expenses | |
Investment Advisory Fees—Note B | |
Basic Fee | 9,076 |
Performance Adjustment | (2,010) |
The Vanguard Group—Note C | |
Management and Administrative | 9,640 |
Marketing and Distribution | 967 |
Custodian Fees | 55 |
Auditing Fees | 23 |
Shareholders’ Reports | 85 |
Trustees’ Fees and Expenses | 4 |
Total Expenses | 17,840 |
Expenses Paid Indirectly—Note D | (531) |
Net Expenses | 17,309 |
Net Investment Income | 69,379 |
Realized Net Gain (Loss) | |
Investment Securities Sold1 | 230,653 |
Futures Contracts | 1,924 |
Realized Net Gain (Loss) | 232,577 |
Change in Unrealized Appreciation (Depreciation) | |
Investment Securities | 394,215 |
Futures Contracts | 6,617 |
Change in Unrealized Appreciation (Depreciation) | 400,832 |
Net Increase (Decrease) in Net Assets Resulting from Operations | 702,788 |
1 Dividend income, interest income, and realized net gain (loss) from affiliated companies of the fund were $771,000, $12,542,000, and ($1,802,000), respectively.
14
Statement of Changes in Net Assets
| Year Ended October 31, |
| 2006 | 2005 |
| ($000) | ($000) |
Increase (Decrease) in Net Assets | | |
Operations | | |
Net Investment Income | 69,379 | 53,516 |
Realized Net Gain (Loss) | 232,577 | 218,323 |
Change in Unrealized Appreciation (Depreciation) | 400,832 | 31,014 |
Net Increase (Decrease) in Net Assets Resulting from Operations | 702,788 | 302,853 |
Distributions | | |
Net Investment Income | (57,290) | (32,156) |
Realized Capital Gain1 | (167,917) | — |
Total Distributions | (225,207) | (32,156) |
Capital Share Transactions—Note H | | |
Issued | 838,408 | 1,772,470 |
Issued in Lieu of Cash Distributions | 197,996 | 27,953 |
Redeemed2 | (894,260) | (289,111) |
Net Increase (Decrease) from Capital Share Transactions | 142,144 | 1,511,312 |
Total Increase (Decrease) | 619,725 | 1,782,009 |
Net Assets | | |
Beginning of Period | 3,706,518 | 1,924,509 |
End of Period3 | 4,326,243 | 3,706,518 |
1 Includes fiscal 2006 and 2005 short-term gain distributions totaling $48,400,000 and $0, respectively. Short-term gain distributions are treated as ordinary income dividends for tax purposes.
2 Net of redemption fees of $1,774,000 and $985,000.
3 Net Assets—End of Period includes undistributed net investment income of $44,653,000 and $39,642,000.
15
Financial Highlights
| Year Ended October 31, |
For a Share Outstanding Throughout Each Period | 2006 | 2005 | 2004 | 2003 | 2002 |
Net Asset Value, Beginning of Period | $18.99 | $16.76 | $14.10 | $11.27 | $12.07 |
Investment Operations | | | | | |
Net Investment Income | .35 | .30 | .26 | .25 | .21 |
Net Realized and Unrealized Gain (Loss) | | | | | |
on Investments1 | 3.18 | 2.19 | 2.66 | 2.82 | (.84) |
Total from Investment Operations | 3.53 | 2.49 | 2.92 | 3.07 | (.63) |
Distributions | | | | | |
Dividends from Net Investment Income | (.29) | (.26) | (.26) | (.24) | (.17) |
Distributions from Realized Capital Gains | (.85) | — | — | — | — |
Total Distributions | (1.14) | (.26) | (.26) | (.24) | (.17) |
Net Asset Value, End of Period | $21.38 | $18.99 | $16.76 | $14.10 | $11.27 |
| | | | | |
Total Return2 | 19.38% | 14.96% | 20.94% | 27.74% | –5.38% |
| | | | | |
Ratios/Supplemental Data | | | | | |
Net Assets, End of Period (Millions) | $4,326 | $3,707 | $1,925 | $1,265 | $1,058 |
Ratio of Total Expenses to | | | | | |
Average Net Assets3 | 0.45% | 0.51% | 0.60% | 0.78% | 0.74% |
Ratio of Net Investment Income to | | | | | |
Average Net Assets | 1.75% | 1.81% | 1.78% | 2.05% | 1.63% |
Portfolio Turnover Rate | 37% | 28% | 35% | 40% | 50% |
1 Includes increases from redemption fees of $.01, $.01, $.01, $.01, and $.01.
2 Total returns do not reflect the 1% fee assessed on redemptions after March 23, 2005, of shares held for less than one year, or the 1% fee assessed until March 23, 2005, on shares purchased on or after August 7, 2001, and held for less than five years.
3 Includes performance-based investment advisory fee increases (decreases) of (0.05%), (0.02%), 0.01%, 0.11%, and 0.06%. See accompanying Notes, which are an integral part of the Financial Statements.
16
Notes to Financial Statements
Vanguard Selected Value Fund is registered under the Investment Company Act of 1940 as an open-end investment company, or mutual fund. The fund files reports with the SEC under the company name Vanguard Whitehall Funds.
A. The following significant accounting policies conform to generally accepted accounting principles for U.S. mutual funds. The fund consistently follows such policies in preparing its financial statements.
1. Security Valuation: Securities are valued as of the close of trading on the New York Stock Exchange (generally 4:00 p.m. Eastern time) on the valuation date. Equity securities are valued at the latest quoted sales prices or official closing prices taken from the primary market in which each security trades; such securities not traded on the valuation date are valued at the mean of the latest quoted bid and asked prices. Securities for which market quotations are not readily available, or whose values have been materially affected by events occurring before the fund’s pricing time but after the close of the securities’ primary markets, are valued by methods deemed by the board of trustees to represent fair value. Investments in Vanguard Market Liquidity Fund are valued at that fund’s net asset value. Temporary cash investments acquired over 60 days to maturity are valued using the latest bid prices or using valuations based on a matrix system (which considers such factors as security prices, yields, maturities, and ratings), both as furnished by independent pricing services. Other temporary cash investments are valued at amortized cost, which approximates market value.
2. Futures Contracts: The fund uses index futures contracts to a limited extent, with the objective of maintaining full exposure to the stock market while maintaining liquidity. The fund may purchase or sell futures contracts to achieve a desired level of investment, whether to accommodate portfolio turnover or cash flows from capital share transactions. The primary risks associated with the use of futures contracts are imperfect correlation between changes in market values of stocks held by the fund and the prices of futures contracts, and the possibility of an illiquid market.
Futures contracts are valued at their quoted daily settlement prices. The aggregate principal amounts of the contracts are not recorded in the Statement of Net Assets. Fluctuations in the value of the contracts are recorded in the Statement of Net Assets as an asset (liability) and in the Statement of Operations as unrealized appreciation (depreciation) until the contracts are closed, when they are recorded as realized futures gains (losses).
3. Federal Income Taxes: The fund intends to continue to qualify as a regulated investment company and distribute all of its taxable income. Accordingly, no provision for federal income taxes is required in the financial statements.
4. Distributions: Distributions to shareholders are recorded on the ex-dividend date.
5. Security Lending: The fund may lend its securities to qualified institutional borrowers to earn additional income. Security loans are required to be secured at all times by collateral at least equal to the market value of securities loaned. The fund invests cash collateral received in Vanguard Market Liquidity Fund, and records a liability for the return of the collateral, during the period the securities are on loan. Security lending income represents the income earned on investing cash collateral, less expenses associated with the loan.
17
6. Other: Dividend income is recorded on the ex-dividend date. Interest income includes income distributions received from Vanguard Market Liquidity Fund and is accrued daily. Security transactions are accounted for on the date securities are bought or sold. Costs used to determine realized gains (losses) on the sale of investment securities are those of the specific securities sold. Fees assessed on redemptions of capital shares are credited to paid-in capital.
B. Barrow, Hanley, Mewhinney & Strauss, Inc. and Donald Smith & Co., Inc. each provide investment advisory services to a portion of the fund for a fee calculated at an annual percentage rate of average net assets managed by the advisor. The basic fee for Barrow, Hanley, Mewhinney & Strauss, Inc. is subject to quarterly adjustments based on performance for the preceding three years relative to the Russell Midcap Value Index. The basic fee for Donald Smith & Co., Inc is subject to quarterly adjustments based on performance since July 31, 2005, relative to the MSCI Investable Market 2500 Index.
The Vanguard Group manages the cash reserves of the fund on an at-cost basis.
For the year ended October 31, 2006, the aggregate investment advisory fee represented an effective annual basic rate of 0.23% of the fund’s average net assets before a decrease of $2,010,000 (0.05%) based on performance.
C. The Vanguard Group furnishes at cost corporate management, administrative, marketing, and distribution services. The costs of such services are allocated to the fund under methods approved by the board of trustees. The fund has committed to provide up to 0.40% of its net assets in capital contributions to Vanguard. At October 31, 2006, the fund had contributed capital of $431,000 to Vanguard (included in Other Assets), representing 0.01% of the fund’s net assets and 0.43% of Vanguard’s capitalization. The fund’s trustees and officers are also directors and officers of Vanguard.
D. The fund has asked its investment advisors to direct certain security trades, subject to obtaining the best price and execution, to brokers who have agreed to rebate to the fund part of the commissions generated. Such rebates are used solely to reduce the fund’s management and administrative expenses. The fund’s custodian bank has also agreed to reduce its fees when the fund maintains cash on deposit in the non-interest-bearing custody account. For the year ended October 31, 2006, these arrangements reduced the fund’s management and administrative expenses by $489,000 and custodian fees by $42,000. The total expense reduction represented an effective annual rate of 0.01% of the fund’s average net assets.
E. Distributions are determined on a tax basis and may differ from net investment income and realized capital gains for financial reporting purposes. Differences may be permanent or temporary. Permanent differences are reclassified among capital accounts in the financial statements to reflect their tax character. Temporary differences arise when certain items of income, expense, gain, or loss are recognized in different periods for financial statement and tax purposes; these differences will reverse at some time in the future. Differences in classification may also result from the treatment of short-term gains as ordinary income for tax purposes.
The fund used a tax accounting practice to treat a portion of the price of capital shares redeemed during the year as distributions from net investment income and realized capital gains. Accordingly, the fund has reclassified $7,078,000 from undistributed net investment income, and $24,207,000 from accumulated net realized gains, to paid-in capital.
18
For tax purposes, at October 31, 2006, the fund had $73,544,000 of ordinary income and $189,613,000 of long-term capital gains available for distribution.
At October 31, 2006, the cost of investment securities for tax purposes was $3,645,327,000. Net unrealized appreciation of investment securities for tax purposes was $770,065,000, consisting of unrealized gains of $844,459,000 on securities that had risen in value since their purchase and $74,394,000 in unrealized losses on securities that had fallen in value since their purchase.
At October 31, 2006, the aggregate settlement value of open futures contracts expiring in December 2006 and the related unrealized appreciation (depreciation) were:
| | ($000) |
| | Aggregate | Unrealized |
| Number of | Settlement | Appreciation |
Futures Contracts | Long Contracts | Value | (Depreciation) |
S&P 500 Index | 264 | 91,291 | 4,181 |
E-mini S&P 500 Index | 1,064 | 73,586 | 1,212 |
Unrealized appreciation (depreciation) on open futures contracts is required to be treated as realized gain (loss) for tax purposes.
F. During the year ended October 31, 2006, the fund purchased $1,388,864,000 of investment securities and sold $1,543,340,000 of investment securities, other than temporary cash investments.
G. The market value of securities on loan to broker-dealers at October 31, 2006, was $74,503,000, for which the fund received cash collateral of $81,001,000.
H. Capital shares issued and redeemed were:
| Year Ended October 31, |
| 2006 | 2005 |
| Shares | Shares |
| (000) | (000) |
Issued | 42,799 | 94,115 |
Issued in Lieu of Cash Distributions | 10,487 | 1,569 |
Redeemed | (46,100) | (15,288) |
Net Increase (Decrease) in Shares Outstanding | 7,186 | 80,396 |
19
I. Certain of the fund’s investments are in companies that are considered to be affiliated companies of the fund because the fund owns more than 5% of the outstanding voting securities of the company. Transactions during the period in securities of these companies were as follows:
| | Current Period Transactions | |
| Oct. 31, 2005 | | Proceeds from | | Oct. 31, 2006 |
| Market | Purchases | Securities | Dividend | Market |
| Value | at Cost | Sold | Income | Value |
| ($000) | ($000) | ($000) | ($000) | ($000) |
Domtar Inc. | 50,215 | — | 8,080 | — | n/a1 |
Tech Data Corp. | 114,675 | 20,815 | 8,466 | — | 144,435 |
Winnebago Industries, Inc. | 64,671 | — | 10,005 | 771 | 61,497 |
| 229,561 | | | 771 | 205,932 |
J. In June 2006, the Financial Accounting Standards Board issued Interpretation No. 48 (“FIN 48”), “Accounting for Uncertainty in Income Taxes.” FIN 48 establishes the minimum threshold for recognizing, and a system for measuring, the benefits of tax-return positions in financial statements. FIN 48 will be effective for the fund’s fiscal year beginning November 1, 2007. Management is in the process of analyzing the fund’s tax positions for purposes of implementing FIN 48; based on the analysis completed to date, management does not believe the adoption of FIN 48 will result in any material impact to the fund’s financial statements.
1 At October 31, 2006, the security is still held but the issuer is no longer an affiliated company of the fund.
20
Report of Independent Registered Public Accounting Firm
To the Trustees of Vanguard Whitehall Funds and the Shareholders of Vanguard Selected Value Fund:
In our opinion, the accompanying statement of net assets and the related statements of operations and of changes in net assets and the financial highlights present fairly, in all material respects, the financial position of Vanguard Selected Value Fund (the “Fund”) at October 31, 2006, the results of its operations for the year then ended, the changes in its net assets for each of the two years in the period then ended and the financial highlights for each of the five years in the period then ended, in conformity with accounting principles generally accepted in the United States of America. These financial statements and financial highlights (hereafter referred to as “financial statements”) are the responsibility of the Fund’s management; our responsibility is to express an opinion on these financial statements based on our audits. We conducted our audits of these financial statements in accordance with the standards of the Public Company Accounting Oversight Board (United States). Those standards require that we plan and perform the audit to obtain reasonable assurance about whether the financial statements are free of material misstatement. An audit includes examining, on a test basis, evidence supporting the amounts and disclosures in the financial statements, assessing the accounting principles used and significant estimates made by management, and evaluating the overall financial statement presentation. We believe that our audits, which included confirmation of securities at October 31, 2006 by correspondence with the custodian and broker, and by agreement to the underlying ownership records for Vanguard Market Liquidity Fund, provide a reasonable basis for our opinion.
PricewaterhouseCoopers LLP
Philadelphia, Pennsylvania
December 11, 2006
Special 2006 tax information (unaudited) for Vanguard Selected Value Fund
This information for the fiscal year ended October 31, 2006, is included pursuant to provisions of the Internal Revenue Code.
The fund distributed $140,925,000 as capital gain dividends (from net long-term capital gains) to shareholders during the fiscal year.
The fund distributed $56,791,000 of qualified dividend income to shareholders during the fiscal year.
For corporate shareholders, 56.9% of investment income (dividend income plus short-term gains, if any) qualifies for the dividends-received deduction.
21
Your Fund’s After-Tax Returns
This table presents returns for your fund both before and after taxes. The after-tax returns are shown in two ways: (1) assuming that an investor owned the fund during the entire period and paid taxes on the fund’s distributions, and (2) assuming that an investor paid taxes on the fund’s distributions and sold all shares at the end of each period.
Calculations are based on the highest individual federal income tax and capital gains tax rates in effect at the times of the distributions and the hypothetical sales. State and local taxes were not considered. After-tax returns reflect any qualified dividend income, using actual prior-year figures and estimates for 2006. (In the example, returns after the sale of fund shares may be higher than those assuming no sale. This occurs when the sale would have produced a capital loss. The calculation assumes that the investor received a tax deduction for the loss.)
Please note that your actual after-tax returns will depend on your tax situation and may differ from those shown. Also note that if you own the fund in a tax-deferred account, such as an individual retirement account or a 401(k) plan, this information does not apply to you. Such accounts are not subject to current taxes.
Finally, keep in mind that a fund’s performance—whether before or after taxes—does not guarantee future results.
Average Annual Total Returns: Selected Value Fund1 |
Periods Ended October 31, 2006 | | | |
| One | Five | Ten |
| Year | Years | Years |
Returns Before Taxes | 19.38% | 14.94% | 10.68% |
Returns After Taxes on Distributions | 18.07 | 14.28 | 9.88 |
Returns After Taxes on Distributions and Sale of Fund Shares | 13.44 | 12.79 | 9.02 |
1 Total returns do not reflect the 1% fee assessed on redemptions after March 23, 2005, of shares held for less than one year, or the 1% fee assessed until March 23, 2005, on shares purchased on or after August 7, 2001, and held for less than five years.
22
About Your Fund’s Expenses
As a shareholder of the fund, you incur ongoing costs, which include costs for portfolio management, administrative services, and shareholder reports (like this one), among others. Operating expenses, which are deducted from a fund’s gross income, directly reduce the investment return of the fund.
A fund’s expenses are expressed as a percentage of its average net assets. This figure is known as the expense ratio. The following examples are intended to help you understand the ongoing costs (in dollars) of investing in your fund and to compare these costs with those of other mutual funds. The examples are based on an investment of $1,000 made at the beginning of the period shown and held for the entire period.
The table below illustrates your fund’s costs in two ways:
• Based on actual fund return. This section helps you to estimate the actual expenses that you paid over the period. The “Ending Account Value” shown is derived from the fund’s actual return, and the third column shows the dollar amount that would have been paid by an investor who started with $1,000 in the fund. You may use the information here, together with the amount you invested, to estimate the expenses that you paid over the period.
To do so, simply divide your account value by $1,000 (for example, an $8,600 account value divided by $1,000 = 8.6), then multiply the result by the number given for your fund under the heading “Expenses Paid During Period.”
• Based on hypothetical 5% yearly return. This section is intended to help you compare your fund’s costs with those of other mutual funds. It assumes that the fund had a yearly return of 5% before expenses, but that the expense ratio is unchanged. In this case—because the return used is not the fund’s actual return—the results do not apply to your investment. The example is useful in making comparisons because the Securities and Exchange Commission requires all mutual funds to calculate expenses based on a 5% return. You can assess your fund’s costs by comparing this hypothetical example with the hypothetical examples that appear in shareholder reports of other funds.
Six Months Ended October 31, 2006 | | | |
| Beginning | Ending | Expenses |
| Account Value | Account Value | Paid During |
Selected Value Fund | 4/30/2006 | 10/31/2006 | Period1 |
Based on Actual Fund Return | $1,000.00 | $1,085.28 | $2.37 |
Based on Hypothetical 5% Yearly Return | 1,000.00 | 1,022.94 | 2.29 |
Note that the expenses shown in the table are meant to highlight and help you compare ongoing costs only; they do not include your fund’s low-balance fee or the 1% fee assessed on redemptions of shares held for less than one year. These fees are fully described in the prospectus. If the fees were applied to your account, your costs would be higher. Your fund does not carry a “sales load.”
1 The calculations are based on expenses incurred in the most recent six-month period. The fund’s annualized six-month expense ratios for that period are 0.45%. The dollar amounts shown as “Expenses Paid” are equal to the annualized expense ratio multiplied by the average account value over the period, multiplied by the number of days in the most recent six month period, then divided by the number of days in the most recent 12-month period.
23
The calculations assume no shares were bought or sold during the period. Your actual costs may have been higher or lower, depending on the amount of your investment and the timing of any purchases or redemptions.
You can find more information about the fund’s expenses, including annual expense ratios for the past five years, in the Financial Statements section of this report. For additional information on operating expenses and other shareholder costs, please refer to the appropriate fund prospectus.
24
Glossary
Beta. A measure of the magnitude of a fund’s past share-price fluctuations in relation to the ups and downs of a given market index. The index is assigned a beta of 1.00. Compared with a given index, a fund with a beta of 1.20 typically would have seen its share price rise or fall by 12% when the index rose or fell by 10%. A fund’s beta should be reviewed in conjunction with its R-squared (see definition below). The lower the R-squared, the less correlation there is between the fund and the index, and the less reliable beta is as an indicator of volatility.
Earnings Growth Rate. The average annual rate of growth in earnings over the past five years for the stocks now in a fund.
Expense Ratio. The percentage of a fund’s average net assets used to pay its annual administrative and advisory expenses. These expenses directly reduce returns to investors.
Foreign Holdings. The percentage of a fund represented by stocks or depositary receipts of companies based outside the United States.
Median Market Cap. An indicator of the size of companies in which a fund invests; the midpoint of market capitalization (market price x shares outstanding) of a fund’s stocks, weighted by the proportion of the fund’s assets invested in each stock. Stocks representing half of the fund’s assets have market capitalizations above the median, and the rest are below it.
Price/Book Ratio. The share price of a stock divided by its net worth, or book value, per share. For a fund, the weighted average price/book ratio of the stocks it holds.
Price/Earnings Ratio. The ratio of a stock’s current price to its per-share earnings over the past year. For a fund, the weighted average P/E of the stocks it holds. P/E is an indicator of market expectations about corporate prospects; the higher the P/E, the greater the expectations for a company’s future growth.
R-Squared. A measure of how much of a fund’s past returns can be explained by the returns from the market in general, as measured by a given index. If a fund’s total returns were precisely synchronized with an index’s returns, its R-squared would be 1.00. If the fund’s returns bore no relationship to the index’s returns, its R-squared would be 0.
Return on Equity. The annual average rate of return generated by a company during the past five years for each dollar of shareholder’s equity (net income divided by shareholder’s equity). For a fund, the weighted average return on equity for the companies whose stocks it holds.
Short-Term Reserves. The percentage of a fund invested in highly liquid, short-term securities that can be readily converted to cash.
Turnover Rate. An indication of the fund’s trading activity. Funds with high turnover rates incur higher transaction costs and may be more likely to distribute capital gains (which may be taxable to investors). The turnover rate excludes in-kind transactions, which have minimal impact on costs.
Yield. A snapshot of a fund’s income from interest and dividends. The yield, expressed as a percentage of the fund’s net asset value, is based on income earned over the past 30 days and is annualized, or projected forward for the coming year. The index yield is based on the current annualized rate of income provided by securities in the index.
25
This page intentionally left blank.
This page intentionally left blank.
The People Who Govern Your Fund
The trustees of your mutual fund are there to see that the fund is operated and managed in your best interests since, as a shareholder, you are a part owner of the fund. Your fund’s trustees also serve on the board of directors of The Vanguard Group, Inc., which is owned by the Vanguard funds and provides services to them on an at-cost basis.
A majority of Vanguard’s board members are independent, meaning that they have no affiliation with Vanguard or the funds they oversee, apart from the sizable personal investments they have made as private individuals.
Our independent board members bring distinguished backgrounds in business, academia, and public service to their task of working with Vanguard officers to establish the policies and oversee the activities of the funds. Among board members’ responsibilities are selecting investment advisors for the funds; monitoring fund operations, performance, and costs; reviewing contracts; nominating and selecting new trustees/directors; and electing Vanguard officers.
Each trustee serves a fund until its termination; or until the trustee’s retirement, resignation, or death; or otherwise as specified in the fund’s organizational documents. Any trustee may be removed at a shareholders’ meeting by a vote representing two-thirds of the net asset value of all shares of the fund together with shares of other Vanguard funds organized within the same trust. The table on these two pages shows information for each trustee and executive officer of the fund. The mailing address of the trustees and officers is P.O. Box 876, Valley Forge, PA 19482.
Chairman of the Board, Chief Executive Officer, and Trustee |
| |
John J. Brennan1 | |
Born 1954 | Principal Occupation(s) During the Past Five Years: Chairman of the Board, Chief Executive |
Trustee since May 1987; | Officer, and Director/Trustee of The Vanguard Group, Inc., and of each of the investment |
Chairman of the Board and | companies served by The Vanguard Group. |
Chief Executive Officer | |
144 Vanguard Funds Overseen | |
| |
Independent Trustees | |
| |
Charles D. Ellis | |
Born 1937 | Principal Occupation(s) During the Past Five Years: Applecore Partners (pro bono ventures |
Trustee since January 2001 | in education); Senior Advisor to Greenwich Associates (international business strategy |
144 Vanguard Funds Overseen | consulting); Successor Trustee of Yale University; Overseer of the Stern School of Business |
| at New York University; Trustee of the Whitehead Institute for Biomedical Research. |
| |
Rajiv L. Gupta | |
Born 1945 | Principal Occupation(s) During the Past Five Years: Chairman and Chief Executive Officer |
Trustee since December 20012 | of Rohm and Haas Co. (chemicals); Board Member of the American Chemistry Council; |
144 Vanguard Funds Overseen | Director of Tyco International, Ltd. (diversified manufacturing and services) since 2005; |
| Trustee of Drexel University and of the Chemical Heritage Foundation. |
| |
Amy Gutmann | |
Born 1949 | Principal Occupation(s) During the Past Five Years: President of the University of |
Trustee since June 2006 | Pennsylvania since 2004; Professor in the School of Arts and Sciences, Annenberg School |
144 Vanguard Funds Overseen | for Communication, and Graduate School of Education of the University of Pennsylvania |
| since 2004; Provost (2001–2004) and Laurance S. Rockefeller Professor of Politics and the |
| University Center for Human Values (1990–2004), Princeton University; Director of Carnegie |
| Corporation of New York since 2005 and of Schuylkill River Development Corporation and |
| Greater Philadelphia Chamber of Commerce since 2004. |
JoAnn Heffernan Heisen | |
Born 1950 | Principal Occupation(s) During the Past Five Years: Corporate Vice President and Chief |
Trustee since July 1998 | Global Diversity Officer since 2006, Vice President and Chief Information Officer |
144 Vanguard Funds Overseen | (1997–2005), and Member of the Executive Committee of Johnson & Johnson |
| (pharmaceuticals/consumer products); Director of the University Medical Center |
| at Princeton and Women’s Research and Education Institute. |
| |
André F. Perold | |
Born 1952 | Principal Occupation(s) During the Past Five Years: George Gund Professor of Finance |
Trustee since December 2004 | and Banking, Harvard Business School; Senior Associate Dean, Director of Faculty |
144 Vanguard Funds Overseen | Recruiting, and Chair of Finance Faculty, Harvard Business School; Director and Chairman |
| of UNX, Inc. (equities trading firm) since 2003; Chair of the Investment Committee of |
| HighVista Strategies LLC (private investment firm) since 2005; Director of registered |
| investment companies advised by Merrill Lynch Investment Managers and affiliates |
| (1985–2004), Genbel Securities Limited (South African financial services firm) |
| (1999–2003), Gensec Bank (1999–2003), Sanlam, Ltd. (South African insurance |
| company) (2001–2003), and Stockback, Inc. (credit card firm) (2000–2002). |
Alfred M. Rankin, Jr. | |
Born 1941 | Principal Occupation(s) During the Past Five Years: Chairman, President, Chief Executive |
Trustee since January 1993 | Officer, and Director of NACCO Industries, Inc. (forklift trucks/housewares/lignite); Director |
144 Vanguard Funds Overseen | of Goodrich Corporation (industrial products/aircraft systems and services). |
| |
J. Lawrence Wilson | |
Born 1936 | Principal Occupation(s) During the Past Five Years: Retired Chairman and Chief Executive |
Trustee since April 1985 | Officer of Rohm and Haas Co. (chemicals); Director of Cummins Inc. (diesel engines), |
144 Vanguard Funds Overseen | MeadWestvaco Corp. (packaging products), and AmerisourceBergen Corp. (pharmaceutical |
| distribution); Trustee of Vanderbilt University and of Culver Educational Foundation. |
| |
Executive Officers1 | |
| |
Heidi Stam | |
Born 1956 | Principal Occupation(s) During the Past Five Years: Managing Director since 2006, |
Secretary since July 2005 | General Counsel since 2005, and Secretary of The Vanguard Group, Inc., and of each |
144 Vanguard Funds Overseen | of the investment companies served by The Vanguard Group since 2005; Principal of |
| The Vanguard Group (1997–2006). |
| |
Thomas J. Higgins | |
Born 1957 | Principal Occupation(s) During the Past Five Years: Principal of The Vanguard Group, Inc.; |
Treasurer since July 1998 | Treasurer of each of the investment companies served by The Vanguard Group. |
144 Vanguard Funds Overseen | |
Vanguard Senior Management Team | | |
| | |
R. Gregory Barton | Kathleen C. Gubanich | Michael S. Miller |
Mortimer J. Buckley | Paul A. Heller | Ralph K. Packard |
James H. Gately | F. William McNabb, III | George U. Sauter |
| | |
Founder | | |
| | |
John C. Bogle | | |
Chairman and Chief Executive Officer, 1974–1996 | | |
1 | Officers of the funds are “interested persons” as defined in the Investment Company Act of 1940. |
2 | December 2002 for Vanguard Equity Income Fund, Vanguard Growth Equity Fund, the Vanguard Municipal Bond Funds, and the Vanguard State Tax-Exempt Funds. |
More information about the trustees is in the Statement of Additional Information, available from The Vanguard Group.
| | | |
| | | 
|
| | | P.O. Box 2600 |
| | | Valley Forge, PA 19482-2600 |
| | | |
| | | |
| | | |
Connect with Vanguard™>www.vanguard.com | |
| | | |
| | | |
| | | |
Fund Information > 800-662-7447 | | Vanguard, Connect with Vanguard, and the ship |
| | | logo are trademarks of The Vanguard Group, Inc. |
Direct Investor Account Services > 800-662-2739 |
| | | |
Institutional Investor Services > 800-523-1036 | All other marks are the exclusive property of their |
| | | respective owners. |
Text Telephone > 800-952-3335 | | |
| | | All comparative mutual fund data are from Lipper Inc. |
| | | or Morningstar, Inc., unless otherwise noted. |
| | | |
| | | |
| |
| | | You can obtain a free copy of Vanguard’s proxy voting |
This material may be used in conjunction | guidelines by visiting our website, www.vanguard.com, |
with the offering of shares of any Vanguard | | and searching for “proxy voting guidelines,” or by calling |
fund only if preceded or accompanied by | Vanguard at 800-662-2739. They are also available from |
the fund’s current prospectus. | the SEC’s website, www.sec.gov. In addition, you may |
| | | obtain a free report on how your fund voted the proxies for |
| | | securities it owned during the 12 months ended June 30. |
| | | To get the report, visit either www.vanguard.com |
| | | or www.sec.gov. |
| | | |
| | | You can review and copy information about your fund |
| | | at the SEC’s Public Reference Room in Washington, D.C. |
| | | To find out more about this public service, call the SEC |
| | | at 202-551-8090. Information about your fund is also |
| | | available on the SEC’s website, and you can receive |
| | | copies of this information, for a fee, by sending a |
| | | request in either of two ways: via e-mail addressed to |
| | | publicinfo@sec.gov or via regular mail addressed to the |
| | | Public Reference Section, Securities and Exchange |
| | | Commission, Washington, DC 20549-0102. |
| | | |
| | | |
| | | |
| | | |
| | | © 2006 The Vanguard Group, Inc. |
| | | All rights reserved. |
| | | Vanguard Marketing Corporation, Distributor. |
| | | |
| | | Q9340 122006 |
| | | | |
|
|
Vanguard® Mid-Cap Growth Fund |
|
|
> Annual Report |
|
|
|
|
|
October 31, 2006 |
|
|
> | For the fiscal year ended October 31, 2006, Vanguard Mid-Cap Growth |
| Fund returned 15.4%, besting the performance of its benchmark and the |
| average return of peer funds. |
| |
> | As of June 8, 2006, the fund’s assets were reallocated equally between |
| two investment advisors: Chartwell Investment Partners, L.P., and |
| William Blair &Company, L.L.C. |
| |
> | As measured by the Dow Jones Wilshire 5000 Composite Index, the |
| broad stock market returned 16.6% for the 12-month period. Once again, |
| growth stocks were outpaced by value issues. |
Contents | |
| |
Your Fund’s Total Returns | 1 |
Chairman’s Letter | 2 |
Advisors’ Report | 6 |
Fund Profile | 9 |
Performance Summary | 10 |
Financial Statements | 12 |
Your Fund’s After-Tax Returns | 22 |
About Your Fund’s Expenses | 23 |
Trustees Approve Advisory Agreement | 25 |
Glossary | 26 |
Please note: The opinions expressed in this report are just that—informed opinions. They should not be considered promises or advice. Also, please keep in mind that the information and opinions cover the period through the date on the cover of this report. Of course, the risks of investing in your fund are spelled out in the prospectus.
Your Fund’s Total Returns
Fiscal Year Ended October 31, 2006 | |
| Total |
| Returns |
Vanguard Mid-Cap Growth Fund | 15.4% |
Russell Midcap Growth Index | 14.5 |
Average Mid-Cap Growth Fund1 | 11.5 |
Dow Jones Wilshire 5000 Index | 16.6 |
Your Fund’s Performance at a Glance | | | | | |
October 31, 2005–October 31, 2006 | | | | | |
| | | | Distributions Per Share |
| Starting | Ending | | Income | Capital |
| Share Price | Share Price | | Dividends | Gains |
Vanguard Mid-Cap Growth Fund | $16.58 | $19.12 | | $0.005 | $0.000 |
1 | Derived from data provided by Lipper Inc. |
1

Chairman’s Letter
Dear Shareholder,
Vanguard Mid-Cap Growth Fund returned 15.4% for the 12 months ended October 31, 2006. Your fund bested the return of its benchmark index, and outpaced the average return of its peers by nearly 4 percentage points. The fund’s weighty commitment to the information technology sector produced the largest share of its total returns.
During the year, the fund’s board of trustees announced important changes in the fund’s management. As of June 8, the fund’s assets were reallocated equally between Chartwell Investment Partners and William Blair & Company. Provident Investment Counsel is no longer part of the fund’s investment management team.
Stocks produced fitful rallies and familiar patterns
U.S. stock prices advanced in fits and starts during the past 12 months, reflecting the uncertainty that pervaded the market for much of the period. The broad market rallied at the start of the fiscal year, buoyed by strong corporate earnings growth and vigorous economic expansion. In mid-May, as investors responded to increasingly pungent whiffs of inflation, anxiety moved to the fore, and market indexes pulled back sharply. In late summer, optimism regained the upper hand. The broad market staged a powerful rally to post a 12-month return of 16.6%.
2
As has been the case for much of the past five years, smaller-capitalization stocks outperformed large-caps, and value-oriented stocks bested their growth-oriented counterparts. International stocks were especially strong performers; European and emerging-markets stocks led the way.
Rate hikes and inflation concerns drove the bond market
The fixed income markets reflected some of these same uncertainties, with the back-and-forth pattern most pronounced among the longest-maturity bonds. The Federal Reserve Board tightened monetary policy by raising its target for the federal funds rate six times during the fiscal year, to 5.25%, and the yields of short-term issues followed closely behind. The yields of longer-term securities, by contrast, dipped early in the year, rose sharply on inflation worries in May, then finished the period a bit above their starting point. The broad taxable bond market returned 5.2%. Corporate bonds generally outperformed government issues. Municipal bonds did better still.
Your fund’s return came from several sectors
During the year, Vanguard Mid-Cap Growth Fund trailed the performance of the broad U.S. stock market by a slim margin, but outperformed both its benchmark and its peer-fund average. The fund held large positions in the information technology, consumer discretionary, health care, and industrials sectors, which together accounted for nearly 70% of its assets, on average.
Market Barometer | | | |
| Average Annual Total Returns |
| Periods Ended October 31, 2006 |
| One Year | Three Years | Five Years |
Stocks | | | |
Russell 1000 Index (Large-caps) | 16.0% | 11.9% | 7.9% |
Russell 2000 Index (Small-caps) | 20.0 | 14.5 | 13.8 |
Dow Jones Wilshire 5000 Index (Entire market) | 16.6 | 12.4 | 8.9 |
MSCI All Country World Index ex USA (International) | 28.9 | 23.0 | 16.7 |
| | | |
Bonds | | | |
Lehman Aggregate Bond Index (Broad taxable market) | 5.2% | 3.9% | 4.5% |
Lehman Municipal Bond Index | 5.7 | 4.8 | 5.1 |
Citigroup 3-Month Treasury Bill Index | 4.5 | 2.8 | 2.3 |
| | | |
CPI | | | |
Consumer Price Index | 1.3% | 2.9% | 2.6% |
3
The Mid-Cap Growth Fund’s performance in the health care and consumer discretionary sectors was modest. Despite the fund’s sizable weightings relative to its benchmark, subpar stock selection caused the fund to underperform the index in both sectors. Information technology, the fund’s biggest sector, was a bright spot for the fund. Positive performance by software, services, and semiconductor holdings drove performance, and the sector produced the largest share of the fund’s total returns. The industrials sector also produced healthy gains.
Interestingly, smaller sector commitments by the fund’s advisors produced noteworthy gains: Though the financials and energy sectors each made up about 10% of the portfolio, they contributed strongly to the fund’s overall performance. The advisors’ stock selection among oil and gas drilling and coal stocks paid off handsomely, as did their insurance and real estate picks.
Long term, the fund’s performance has been impressive
The table below shows that a hypothetical investment of $10,000 in the Mid-Cap Growth Fund at the fund’s inception would have grown to $26,439 by October 31, 2006. This result compares quite favorably with the results of the fund’s benchmark, its peer-group average, and the broad U.S. stock market. The fund outperformed each of these measures by a considerable margin. We’re confident that the fund’s current managers can continue to produce competitive long-term results.
Expense Ratios1 | | |
Your fund compared with its peer group | | |
| | Average |
| | Mid-Cap |
| Fund | Growth Fund |
Mid-Cap Growth Fund | 0.50% | 1.59% |
Total Returns | | |
December 31, 1997,2 through October 31, 2006 | | |
| Average | Final Value of a $10,000 |
| Annual Return | Initial Investment |
Mid-Cap Growth Fund | 11.6% | $26,439 |
Russell Midcap Growth Index | 7.0 | 18,106 |
Average Mid-Cap Growth Fund | 6.9 | 18,052 |
Dow Jones Wilshire 5000 Index | 6.1 | 16,903 |
1 Fund expense ratio reflects the 12 months ended October 31, 2006. Peer-group expense ratio is derived from data provided by Lipper Inc. and captures information through year-end 2005.
2 Inception date.
4
That said, the fund’s strong average annual return of 11.6% since its inception includes stretches of outstanding returns and stretches of poor performance. This record illustrates an important point about long-term investment success: to reap an investment’s rewards, you need to be able to ride out the inevitable bumps in the road. Your fund’s below-average expense ratio of 0.50% helps by allowing you to keep a greater share of the fund’s returns.
A long-term perspective and diversification are important
Vanguard Mid-Cap Growth Fund seeks to identify and invest in areas of potential growth among mid-capitalization stocks. The fund has a relatively large exposure to traditional growth areas such as the information technology and health care sectors, as well as to the consumer discretionary sector. The IT sector did well this year, and Mid-Cap Growth Fund followed suit.
As you know, different sectors, investment styles, and asset classes come into and pass out of favor in the market. Thus, there will be times when technology and other growth-oriented stocks do not outperform—times when value-oriented investments may experience greater relative returns. Trying to time various market swings by hopping from one fund to the next is not the solution—the better answer lies in diversification.
Sticking with a carefully considered, balanced portfolio of stock, bond, and money market mutual funds suited to your unique circumstances is key to your long-term investing success. By providing you with exposure to mid-cap growth stocks, Mid-Cap Growth Fund can play a useful role in such a balanced investment plan.
Thank you for investing your assets with Vanguard.
Sincerely,

John J. Brennan
Chairman and Chief Executive Officer
November 10, 2006
5
Advisors’ Report
During the fiscal year ended
October 31, 2006, Vanguard Mid-Cap Growth Fund returned 15.4%. This performance reflected the combined efforts of your fund’s two independent advisors. The use of multiple advisors provides exposure to distinct, yet complementary, investment approaches, enhancing the fund’s diversification.
The advisors, the amount and percentage of fund assets each manages, and a brief description of their investment strategies are presented in the table below. The advisors have also prepared a discussion of the investment environment that existed during the fiscal year and of how their portfolio positioning reflects this assessment.
William Blair & Company, L.L.C.
Portfolio Managers:
Harvey H. Bundy, CFA, Principal
Robert C.Lanphier, Principal
David Ricci, CFA, Principal
For the nearly five months ended October 31, 2006, since we began co-managing the portfolio, domestic equity markets turned in strong results. The Federal Reserve Board’s decision to hold interest rates steady at its August 8 meeting proved to be a pivotal point for the market, as most of the returns for the entire five months came after that date. Although growth stocks underperformed value stocks within the mid-capitalization arena during the period, growth stocks outperformed after the August Fed
Vanguard Mid-Cap Growth Fund Investment Advisors |
| | | |
| Fund Assets Managed | |
Investment Advisor | % | $ Million | Investment Strategy |
William Blair & Company, L.L.C. | 49% | $389 | Uses a fundamental investment approach in |
| | | pursuit of superior long-term investment results |
| | | from growth-oriented companies with leadership |
| | | positions and strong market presence. |
Chartwell Investment Partners, L.P. | 48 | 379 | Uses a bottom-up, fundamental, research-driven |
| | | stock-selection strategy focusing on companies |
| | | with sustainable growth, strong management |
| | | teams, competitive positions, and outstanding |
| | | product and service offerings. These companies |
| | | should continually demonstrate growth in earnings per share. |
Cash Investments1 | 3 | 25 | — |
| | | | |
1 | These short-term reserves are invested by Vanguard in equity index products to simulate investment in stocks. Each advisor may also maintain a modest cash position. |
6
meeting. This turning point in the market was even more pronounced from a market-cap perspective, as small-caps resumed leadership over large (they were laggards in the earlier part of the period). However, mid-cap stocks underperformed both their small- and large-cap counterparts for the five months.
The financials and utilities sectors realized solid appreciation, explaining much of the strong performance of value stocks during the first half of the period. The change in interest rate sentiment in the second half of the period encouraged investors to shift money into the more typical growth sectors of information technology and consumer discretionary. Until late summer, both weak housing-market data and the uncertainty of future Fed moves had depressed the outlook for consumer spending.
We can see now that investors were a bit too pessimistic, and that any potential consumer and economic downturn in upcoming months is unlikely to be severe. However, we feel that continuing our selective approach to identifying consumer stocks is prudent, given the recent run-up of these stocks combined with our belief that the effect on consumers of the housing market’s slowdown will unfold over the next 12 to 18 months. We are currently underweight in the consumer discretionary sector versus the Russell Midcap Growth Index, as we have become increasingly critical of our holdings from a bottom-up perspective.
Corporate executives have been quite disciplined with respect to cash-flow reinvestment and capital spending throughout the current business cycle; these controls have both smoothed and extended the cycle’s duration. The recent strength in technology stocks is partly attributable to this disciplined capital investment cycle, as businesses are beginning to upgrade systems while continuing to seek increased corporate efficiency through various information technology solutions. Our overweighting in IT remains in place with the usual bias toward software and service companies that we feel offer a higher value proposition to customers and therefore less cyclical, and more consistent, earnings streams.
With respect to the portfolio’s performance during the five months, relative strength came primarily from strong stock selection across most of our IT holdings. Stock selection in energy, especially in the exploration and production industry, drove positive performance as well. Health care holdings were the largest drag on relative and absolute performance. Stock selection in the industrials sector also detracted from both the portfolio’s relative and absolute return.
Over the last few years, corporate-earnings growth has been very robust, at a consistent double-digit annual pace. Although earnings growth remains healthy, a slower and more sustainable growth level should be expected in the coming years. Investors will look for more durable
7
business models that can grow despite the macro environment—a dynamic that should benefit our quality growth style of investing. From our perspective, stock picking will become increasingly crucial to investment success as the easy money made over the last few years of broad-based earnings growth is most likely behind us.
Chartwell Investment Partners, L.P.
Portfolio Managers:
Edward N. Antoian, CFA, CPA,
Managing Partner
Mark J. Cunneen, Managing Partner
The past 12 months once again proved relatively strong for U.S. equity markets, with most indexes showing double-digit returns. For the better part of the last year, the market fought its way higher, despite rising interest rates, rising energy prices, weakening consumer confidence, and peaking home sales. The markets did pause in the summer months as questions about economic growth and the ensuing political elections were at the forefront of investors’ minds. Still, investor confidence was renewed in late summer/early fall as energy prices eased, the Fed stopped raising interest rates, and consumers continued to spend despite falling home values. In addition, many companies reported robust results and issued cautiously optimistic outlooks for the coming year.
In the current environment, we see investment opportunities across many sectors of the mid-cap universe. (Please note that we use index sectors that differ from the Global Industry Classification System employed by Vanguard funds and reflected in the Fund Profile.) Within the business services area, we are focused on consulting companies of various specialties, as well as companies benefiting from the continued growth of transaction processing. In financial services, we highlight companies participating in the growth and automation of the exchanges. In addition, we see strength in pricing for the insurance industry. In consumer services, many of our investments have been in lodging, where demand continues to far outpace growth in supply. In health care services, we have favored outsourced pharmaceutical research and laboratory services, as well as drug discovery.
We think the backdrop for our fundamental approach to growth investing continues to be favorable. Three basic themes emerge from all of the market chatter: The economy is growing at a good pace, which supports business plans of many midsized companies; an end to rising interest rates may be at hand; and cost pressures from energy markets have stabilized.
Looking ahead, this is a market environment in which well-managed, midsized companies with good products can do well. We are alert to volatility, which could arise from changes in interest rate or gross domestic product forecasts, or even the usual short-term profit-taking that can follow quick increases in stock price. Yet we continue to own a diverse collection of companies that can grow profits at relatively fast rates over time.
8
Fund Profile | | | |
As of October 31, 2006 | | | |
| | | |
Portfolio Characteristics | | |
| Comparative | Broad |
| Fund | Index1 | Index2 |
Number of Stocks | 117 | 537 | 4,956 |
Median Market Cap | $4.8B | $7.2B | $28.7B |
Price/Earnings Ratio | 27.1x | 23.7x | 17.7x |
Price/Book Ratio | 4.3x | 4.0x | 2.6x |
Yield | 0.3% | 0.8% | 1.6% |
Return on Equity | 16.5% | 17.5% | 15.4% |
Earnings Growth Rate | 28.3% | 21.0% | 15.5% |
Foreign Holdings | 1.3% | 0.0% | 1.1% |
Turnover Rate | 159% | — | — |
Expense Ratio | 0.50% | — | — |
Short-Term Reserves | 5% | — | — |
Sector Diversification (% of portfolio) | |
| Comparative | Broad |
| Fund | Index1 | Index2 |
Consumer Discretionary | 17% | 22% | 12% |
Consumer Staples | 0 | 4 | 9 |
Energy | 8 | 8 | 9 |
Financials | 10 | 9 | 22 |
Health Care | 16 | 15 | 12 |
Industrials | 17 | 15 | 11 |
Information Technology | 24 | 19 | 16 |
Materials | 1 | 4 | 3 |
Telecommunication Services | 2 | 2 | 3 |
Utilities | 0 | 2 | 3 |
Short-Term Reserves | 5% | — | — |
Volatility Measures3 | |
| Fund Versus | Fund Versus | |
| Comparative Index1 | Broad Index2 | |
R-Squared | 0.91 | 0.72 | |
Beta | 1.12 | 1.39 | |
| | | | |
Ten Largest Holdings4(% of total net assets) | |
| | |
Paychex, Inc. | data processing and outsourced services | 2.8% |
Fastenal Co. | trading companies and distributors | 2.1 |
MedImmune Inc. | biotechnology | 2.0 |
The Corporate Executive Board Co. | diversified commercial and professional services | 2.0 |
Intercontinental Exchange Inc. | specialized finance | 1.8 |
Tractor Supply Co. | specialty stores | 1.7 |
Jabil Circuit, Inc. | electronic manufacturing services | 1.5 |
Laureate Education Inc. | education services | 1.5 |
F5 Networks, Inc. | communications equipment | 1.4 |
MSC Industrial Direct Co., Inc. Class A | trading companies and distributors | 1.3 |
Top Ten | | 18.1% |
| | | |
Investment Focus
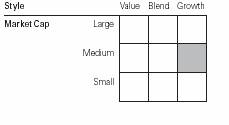
1 | Russell Midcap Growth Index. |
2 | Dow Jones Wilshire 5000 Index. |
3 | For an explanation of R-squared, beta, and other terms used here, see the Glossary on page 26. |
4 | “Ten Largest Holdings” excludes any temporary cash investments and equity index products. |
9
Performance Summary
All of the returns in this report represent past performance, which is not a guarantee of future results that may be achieved by the fund. (Current performance may be lower or higher than the performance data cited. For performance data current to the most recent month-end, visit our website at www.vanguard.com.) Note, too, that both investment returns and principal value can fluctuate widely, so an investor’s shares, when sold, could be worth more or less than their original cost. The returns shown do not reflect taxes that a shareholder would pay on fund distributions or on the sale of fund shares.
Cumulative Performance: December 31, 1997–October 31, 2006
Initial Investment of $10,000

| | | |
| | Average Annual Total Returns | |
| Periods Ended October 31, 2006 | Final Value |
| One | Five | Since | of a $10,000 |
| Year | Years | Inception1 | Investment |
Mid-Cap Growth Fund | 15.35% | 9.37% | 11.64% | $26,439 |
Dow Jones Wilshire 5000 Index | 16.61 | 8.89 | 6.12 | 16,903 |
Russell Midcap Growth Index | 14.51 | 10.62 | 6.95 | 18,106 |
Average Mid-Cap Growth Fund2 | 11.51 | 7.54 | 6.92 | 18,052 |
| | | | | | |
2 | Derived from data provided by Lipper Inc. |
10
Fiscal Year Total Returns (%): December 31, 1997–October 31, 2006
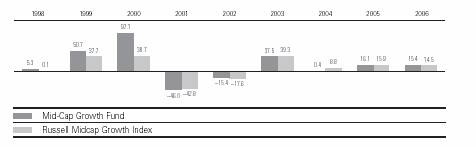
Average Annual Total Returns: Periods Ended September 30, 2006
This table presents average annual total returns through the latest calendar quarter—rather than through the end of the fiscal period. Securities and Exchange Commission rules require that we provide this information.
| Inception Date | One Year | Five Years | Since Inception |
Mid-Cap Growth Fund | 12/31/1997 | 8.51% | 9.74% | 11.37% |
Note: See Financial Highlights table on page 17 for dividend and capital gains information.
11
Financial Statements
Statement of Net Assets
As of October 31, 2006
The fund provides a complete list of its holdings four times in each fiscal year, at the quarter-ends. For the second and fourth fiscal quarters, the lists appear in the fund’s semiannual and annual reports to shareholders. For the first and third fiscal quarters, the fund files the lists with the Securities and Exchange Commission on Form N-Q. Shareholders can look up the fund’s Forms N-Q on the SEC’s website at www.sec.gov. Forms N-Q may also be reviewed and copied at the SEC’s Public Reference Room (see the back cover of this report for further information).
| | | Market |
| | | Value• |
| | Shares | ($000) |
Common Stocks (92.9%)1 | | |
Consumer Discretionary (16.2%) | | |
* | Tractor Supply Co. | 283,002 | 13,703 |
* | Laureate Education Inc. | 229,053 | 12,076 |
* | Lamar Advertising Co.Class A | 184,281 | 10,629 |
* | Life Time Fitness, Inc. | 178,917 | 9,220 |
* | Gaylord Entertainment Co. | 151,025 | 7,029 |
* | O’Reilly Automotive, Inc. | 194,294 | 6,274 |
| Strayer Education, Inc. | 52,078 | 5,891 |
| Polo Ralph Lauren Corp. | 79,450 | 5,641 |
* | Scientific Games Corp. | 192,370 | 5,392 |
* | Dick’s Sporting Goods, Inc. | 98,472 | 4,900 |
| Hilton Hotels Corp. | 153,785 | 4,447 |
* | CarMax, Inc. | 88,131 | 3,904 |
* | IAC/InterActiveCorp | 123,485 | 3,826 |
| International Game Technology | 89,045 | 3,785 |
* | Penn National Gaming, Inc. | 102,370 | 3,744 |
* | Burger King Holdings Inc. | 221,785 | 3,722 |
| Tim Hortons, Inc. | 124,500 | 3,598 |
* | The Cheesecake Factory Inc. | 120,000 | 3,390 |
| PETsMART, Inc. | 112,825 | 3,247 |
| Fortune Brands, Inc. | 41,100 | 3,163 |
* | Urban Outfitters, Inc. | 149,760 | 2,621 |
^ | Garmin Ltd. | 41,584 | 2,221 |
* | Coldwater Creek Inc. | 67,515 | 2,059 |
* | Morningstar, Inc. | 46,395 | 1,899 |
| Tiffany & Co. | 52,935 | 1,891 |
| | | 128,272 |
Consumer Staples (0.3%) | | |
*^ | Bare Escentuals, Inc. | 89,075 | 2,728 |
| | | |
Energy (7.6%) | | |
| Smith International, Inc. | 245,871 | 9,707 |
* | Grant Prideco, Inc. | 236,385 | 8,928 |
| XTO Energy, Inc. | 161,208 | 7,522 |
* | Southwestern Energy Co. | 193,075 | 6,870 |
* | Superior Energy Services, Inc. | 159,375 | 4,988 |
* | Ultra Petroleum Corp. | 77,900 | 4,158 |
| ENSCO International, Inc. | 83,890 | 4,108 |
* | Complete Production Services, Inc. | 203,475 | 3,925 |
| Range Resources Corp. | 136,575 | 3,708 |
* | Forest Oil Corp. | 110,490 | 3,606 |
* | National Oilwell Varco Inc. | 39,035 | 2,358 |
| | | 59,878 |
Financials (9.7%) | | |
* | IntercontinentalExchange Inc. | 171,218 | 14,454 |
* | E*TRADE Financial Corp. | 367,125 | 8,547 |
| Investors Financial Services Corp. | 216,034 | 8,494 |
* | Affiliated Managers Group, Inc. | 74,510 | 7,461 |
| Willis Group Holdings Ltd. | 180,070 | 6,848 |
| Aspen Insurance Holdings Ltd. | 256,135 | 6,357 |
* | Arch Capital Group Ltd. | 81,120 | 5,215 |
* | CB Richard Ellis Group, Inc. | 172,495 | 5,180 |
| Host Marriott Corp. REIT | 202,950 | 4,680 |
* | Nasdaq Stock Market Inc. | 127,420 | 4,553 |
| CapitalSource Inc. REIT | 120,325 | 3,338 |
* | Douglas Emmett, Inc. REIT | 79,020 | 1,885 |
| | | 77,012 |
Health Care (15.6%) | | |
* | MedImmune Inc. | 491,134 | 15,736 |
| Pharmaceutical Product Development, Inc. | 281,483 | 8,909 |
| C.R. Bard, Inc. | 104,409 | 8,557 |
* | ResMed Inc. | 188,724 | 8,302 |
* | DaVita, Inc. | 143,180 | 7,965 |
* | Express Scripts Inc. | 118,065 | 7,523 |
| IMS Health, Inc. | 256,505 | 7,144 |
* | Healthways, Inc. | 167,087 | 7,076 |
* | Gen-Probe Inc. | 131,240 | 6,282 |
12
| | | Market |
| | | Value• |
| | Shares | ($000) |
| Allergan, Inc. | 54,340 | 6,276 |
* | Kyphon Inc. | 157,989 | 6,241 |
* | Covance, Inc. | 106,180 | 6,212 |
* | Integra LifeSciences Holdings | 150,448 | 5,556 |
* | Patterson Cos. | 164,849 | 5,415 |
* | Celgene Corp. | 87,925 | 4,699 |
* | IDEXX Laboratories Corp. | 52,081 | 4,334 |
* | Henry Schein, Inc. | 84,015 | 4,175 |
| Brookdale Senior Living Inc. | 61,205 | 2,945 |
| | | 123,347 |
Industrials (16.6%) | | |
| Fastenal Co. | 418,481 | 16,840 |
| The Corporate Executive Board Co. | 173,803 | 15,611 |
| MSC Industrial Direct Co., Inc.Class A | 260,145 | 10,645 |
| Rockwell Collins, Inc. | 177,177 | 10,290 |
| Robert Half International, Inc. | 267,240 | 9,768 |
* | McDermott International, Inc. | 174,310 | 7,792 |
| Precision Castparts Corp. | 107,350 | 7,306 |
| Graco, Inc. | 169,664 | 6,916 |
* | Global Cash Access, Inc. | 394,430 | 6,291 |
* | American Commercial Lines Inc. | 95,447 | 6,123 |
| Ametek, Inc. | 129,330 | 6,037 |
| Harsco Corp. | 72,850 | 5,947 |
| Roper Industries Inc. | 124,210 | 5,943 |
* | Monster Worldwide Inc. | 124,884 | 5,059 |
| Oshkosh Truck Corp. | 107,530 | 4,861 |
| UTI Worldwide, Inc. | 148,785 | 3,846 |
| Southwest Airlines Co. | 178,120 | 2,677 |
| | | 131,952 |
Information Technology (23.6%) | |
| Communications Equipment (1.9%) | |
* | F5 Networks, Inc. | 167,725 | 11,102 |
* | Comverse Technology, Inc. | 163,435 | 3,558 |
| | | |
| Computers & Peripherals (1.0%) | |
* | Network Appliance, Inc. | 224,355 | 8,189 |
| | | |
| Electronic Equipment & Instruments (2.8%) |
| Jabil Circuit, Inc. | 423,645 | 12,163 |
* | FLIR Systems, Inc. | 215,880 | 6,895 |
| Amphenol Corp. | 48,750 | 3,310 |
| | | |
| Internet Software & Services (3.6%) | |
* | j2 Global Communications, Inc. | 348,377 | 9,559 |
* | ValueClick, Inc. | 325,005 | 6,110 |
* | WebEx Communications, Inc. | 141,495 | 5,441 |
* | Akamai Technologies, Inc. | 107,210 | 5,024 |
* | aQuantive, Inc. | 90,040 | 2,447 |
| | | Market |
| | | Value• |
| | Shares | ($000) |
| IT Services (5.7%) | | |
| Paychex, Inc. | 554,032 | 21,873 |
* | Iron Mountain, Inc. | 206,980 | 8,977 |
* | Cognizant Technology Solutions Corp. | 110,380 | 8,309 |
* | Alliance Data Systems Corp. | 66,655 | 4,047 |
| MasterCard, Inc. Class A | 26,195 | 1,941 |
| | | |
| Semiconductors & Semiconductor Equipment (4.3%) | |
| Maxim Integrated | | |
| Products, Inc. | 195,665 | 5,872 |
| Microchip Technology, Inc. | 162,974 | 5,367 |
* | LAM Research Corp. | 80,125 | 3,962 |
| Analog Devices, Inc. | 123,705 | 3,936 |
* | FormFactor Inc. | 99,655 | 3,805 |
| National Semiconductor Corp. | 142,130 | 3,452 |
* | MEMC Electronic Materials, Inc. | 88,935 | 3,157 |
* | Marvell Technology Group Ltd. | 116,280 | 2,126 |
* | Broadcom Corp. | 66,435 | 2,011 |
| | | |
| Software (4.3%) | | |
* | Intuit, Inc. | 277,424 | 9,793 |
* | Activision, Inc. | 605,604 | 9,338 |
| FactSet Research Systems Inc. | 146,110 | 7,437 |
* | Autodesk, Inc. | 107,085 | 3,935 |
* | Citrix Systems, Inc. | 130,580 | 3,856 |
| | | 186,992 |
Materials (1.0%) | | |
| Airgas, Inc. | 199,523 | 7,544 |
| | | |
Telecommunication Services (1.6%) | |
* | American Tower Corp.Class A | 177,205 | 6,383 |
* | NeuStar, Inc. Class A | 207,610 | 6,066 |
| | | 12,449 |
Exchange-Traded Fund (0.7%) | | |
2 Vanguard Mid-Cap ETF | 82,700 | 5,864 |
Total Common Stocks | | |
(Cost $683,378) | | 736,038 |
Temporary Cash Investments (7.5%)1 | |
Money Market Fund (7.0%) | | |
3 Vanguard Market Liquidity | | |
| Fund, 5.289% | 51,725,333 | 51,725 |
3 Vanguard Market Liquidity | | |
| Fund, 5.289%—Note G | 3,969,800 | 3,970 |
| | | 55,695 |
13
| Face | Market |
| Amount | Value• |
| ($000) | ($000) |
U.S. Agency Obligation (0.5%) | | |
4 Federal Home Loan | | |
Mortgage Corp. | | |
5 5.150%, 12/26/06 | 4,000 | 3,969 |
Total Temporary Cash Investments | |
(Cost $59,644) | | 59,664 |
Total Investments (100.4%) | | |
(Cost $743,022) | | 795,702 |
Other Assets and Liabilities (–0.4%) | |
Other Assets—Note C | | 8,904 |
Liabilities—Note G | | (11,886) |
| | (2,982) |
Net Assets (100%) | | |
Applicable to 41,456,013 outstanding | |
$.001 par value shares of beneficial | |
interest (unlimited authorization) | 792,720 |
Net Asset Value Per Share | | $19.12 |
At October 31, 2006, net assets consisted of:6 |
| Amount | Per |
| ($000) | Share |
Paid-in Capital | 627,580 | $15.14 |
Undistributed Net | | |
Investment Income | 1,244 | .03 |
Accumulated Net | | |
Realized Gains | 110,279 | 2.66 |
Unrealized Appreciation | | |
Investment Securities | 52,680 | 1.27 |
Futures Contracts | 937 | .02 |
Net Assets | 792,720 | $19.12 |
• | See Note A in Notes to Financial Statements. |
* | Non-income-producing security. |
^ | Part of security position is on loan to broker-dealers. See Note G in Notes to Financial Statements. |
1 | The fund invests a portion of its cash reserves in equity markets through the use of index futures contracts. After giving effect to futures investments, the fund’s effective common stock and temporary cash investment positions represent 95.3% and 5.1%, respectively, of net assets. See Note E in Notes to Financial Statements. |
2 | Considered an affiliated company of the fund as the issuer is another member of The Vanguard Group. |
3 | Affiliated money market fund available only to Vanguard funds and certain trusts and accounts managed by Vanguard. Rate shown is the 7-day yield. |
4 | The issuer operates under a congressional charter; its securities are neither issued nor guaranteed by the U.S. government. If needed, access to additional funding from the U.S. Treasury (beyond the issuer’s line of credit) would require congressional action. |
5 | Securities with a value of $3,969,000 have been segregated as initial margin for open futures contracts. |
6 | See Note E in Notes to Financial Statements for the tax-basis components of net assets. |
REIT—Real Estate Investment Trust.
14
Statement of Operations | |
| |
| Year Ended |
| October 31, 2006 |
| ($000) |
Investment Income | |
Income | |
Dividends1 | 2,438 |
Interest1 | 2,431 |
Security Lending | 222 |
Total Income | 5,091 |
Expenses | |
Investment Advisory Fees—Note B | |
Basic Fee | 1,694 |
Performance Adjustment | (299) |
The Vanguard Group—Note C | |
Management and Administrative | 1,868 |
Marketing and Distribution | 184 |
Custodian Fees | 5 |
Auditing Fees | 22 |
Shareholders’ Reports | 34 |
Trustees’ Fees and Expenses | 1 |
Total Expenses | 3,509 |
Expenses Paid Indirectly—Note D | (217) |
Net Expenses | 3,292 |
Net Investment Income | 1,799 |
Realized Net Gain (Loss) | |
Investment Securities Sold1 | 132,245 |
Futures Contracts | (4,503) |
Realized Net Gain (Loss) | 127,742 |
Change in Unrealized Appreciation (Depreciation) | |
Investment Securities | (45,139) |
Futures Contracts | 937 |
Change in Unrealized Appreciation (Depreciation) | (44,202) |
Net Increase (Decrease) in Net Assets Resulting from Operations | 85,339 |
1 Dividend income, interest income, and realized net gain (loss) from affiliated companies of the fund were $0, $2,266,000, and $0, respectively.
15
Statement of Changes in Net Assets
| Year Ended October 31, |
| 2006 | 2005 |
| ($000) | ($000) |
Increase (Decrease) in Net Assets | | |
Operations | | |
Net Investment Income | 1,799 | 56 |
Realized Net Gain (Loss) | 127,742 | 28,845 |
Change in Unrealized Appreciation (Depreciation) | (44,202) | 44,615 |
Net Increase (Decrease) in Net Assets Resulting from Operations | 85,339 | 73,516 |
Distributions | | |
Net Investment Income | (177) | — |
Realized Capital Gain | — | — |
Total Distributions | (177) | — |
Capital Share Transactions—Note H | | |
Issued | 344,941 | 205,023 |
Issued in Lieu of Cash Distributions | 163 | — |
Redeemed | (199,378) | (158,602) |
Net Increase (Decrease) from Capital Share Transactions | 145,726 | 46,421 |
Total Increase (Decrease) | 230,888 | 119,937 |
Net Assets | | |
Beginning of Period | 561,832 | 441,895 |
End of Period1 | 792,720 | 561,832 |
1 | Net Assets–End of Period includes undistributed (overdistributed) net investment income of $1,244,000 and ($171,000). |
16
Financial Highlights
| | | | Year Ended October 31, |
For a Share Outstanding Throughout Each Period | 2006 | 2005 | 2004 | 2003 | 20021 |
Net Asset Value, Beginning of Period | $16.58 | $14.28 | $14.22 | $10.34 | $12.22 |
Investment Operations | | | | | |
Net Investment Income (Loss) | .055 | .00 | (.01) | (.01) | (.10) |
Net Realized and Unrealized Gain (Loss)on Investments | 2.490 | 2.30 | .07 | 3.89 | (1.78) |
Total from Investment Operations | 2.545 | 2.30 | .06 | 3.88 | (1.88) |
Distributions | | | | | |
Dividends from Net Investment Income | (.005) | — | — | — | — |
Distributions from Realized Capital Gains | — | — | — | — | — |
Total Distributions | (.005) | — | — | — | — |
Net Asset Value, End of Period | $19.12 | $16.58 | $14.28 | $14.22 | $10.34 |
| | | | | |
Total Return | 15.35% | 16.11% | 0.42% | 37.52% | –15.38% |
| | | | | |
Ratios/Supplemental Data | | | | | |
Net Assets, End of Period (Millions) | $793 | $562 | $442 | $247 | $31 |
Ratio of Total Expenses to Average Net Assets2 | 0.50% | 0.44% | 0.45% | 0.63% | 1.24%3 |
Ratio of Net Investment Income (Loss) | | | | | |
to Average Net Assets | 0.26% | 0.01% | (0.05%) | (0.18%) | (1.02%) |
Portfolio Turnover Rate | 159% | 80% | 102% | 106% | 221% |
| | | | | | |
1 | Provident Investment Counsel Mid Cap Fund A reorganized into Vanguard Mid-Cap Growth Fund effective June 29, 2002. |
2 | Includes performance-based investment advisory fee increases (decreases) of (0.04) for 2006, (0.09%) for 2005, (0.05%) for 2004, (0.06%) for 2003, and 0.00% for 2002. |
3 | Includes the fund’s share of expenses, net of fees waived and expenses absorbed, allocated from Provident Investment Counsel Mid Cap Portfolio, which was the fund’s sole investment prior to June 29, 2002. The expense ratio before waivers and reimbursements of expenses was 1.68% for 2002. |
See accompanying Notes, which are an integral part of the Financial Statements.
17
Notes to Financial Statements
Vanguard Mid-Cap Growth Fund is registered under the Investment Company Act of 1940 as an open-end investment company, or mutual fund. The fund files reports with the SEC under the company name Vanguard Whitehall Funds.
A. The following significant accounting policies conform to generally accepted accounting principles for U.S. mutual funds. The fund consistently follows such policies in preparing its financial statements.
1. Security Valuation: Securities are valued as of the close of trading on the New York Stock Exchange (generally 4:00 p.m. Eastern time) on the valuation date. Equity securities are valued at the latest quoted sales prices or official closing prices taken from the primary market in which each security trades; such securities not traded on the valuation date are valued at the mean of the latest quoted bid and asked prices. Securities for which market quotations are not readily available, or whose values have been materially affected by events occurring before the fund’s pricing time but after the close of the securities’ primary markets, are valued by methods deemed by the board of trustees to represent fair value. Investments in Vanguard Market Liquidity Fund are valued at that fund’s net asset value. Temporary cash investments acquired over 60 days to maturity are valued using the latest bid prices or using valuations based on a matrix system (which considers such factors as security prices, yields, maturities, and ratings), both as furnished by independent pricing services. Other temporary cash investments are valued at amortized cost, which approximates market value.
2. Futures Contracts: The fund uses index futures contracts to a limited extent, with the objective of maintaining full exposure to the stock market while maintaining liquidity. The fund may purchase or sell futures contracts to achieve a desired level of investment, whether to accommodate portfolio turnover or cash flows from capital share transactions. The primary risks associated with the use of futures contracts are imperfect correlation between changes in market values of stocks held by the fund and the prices of futures contracts, and the possibility of an illiquid market.
Futures contracts are valued at their quoted daily settlement prices. The aggregate principal amounts of the contracts are not recorded in the Statement of Net Assets. Fluctuations in the value of the contracts are recorded in the Statement of Net Assets as an asset (liability) and in the Statement of Operations as unrealized appreciation (depreciation) until the contracts are closed, when they are recorded as realized futures gains (losses).
3. Federal Income Taxes: The fund intends to continue to qualify as a regulated investment company and distribute all of its taxable income. Accordingly, no provision for federal income taxes is required in the financial statements.
4. Distributions: Distributions to shareholders are recorded on the ex-dividend date.
5. Security Lending: The fund may lend its securities to qualified institutional borrowers to earn additional income. Security loans are required to be secured at all times by collateral at least equal to the market value of securities loaned. The fund invests cash collateral received in Vanguard Market Liquidity Fund, and records a liability for the return of the collateral, during the period the securities are on loan. Security lending income represents the income earned on investing cash collateral, less expenses associated with the loan.
6. Other: Dividend income is recorded on the ex-dividend date. Interest income includes income distributions received from Vanguard Market Liquidity Fund and is accrued daily. Security
18
transactions are accounted for on the date securities are bought or sold. Costs used to determine
realized gains (losses) on the sale of investment securities are those of the specific securities
sold.
B. Beginning February 1, 2006, Chartwell Investment Partners, L.P., and beginning June 8, 2006, William Blair & Company, L.L.C., each provide investment advisory services to a portion of the fund for fees calculated at an annual percentage rate of average net assets managed by the advisor. In accordance with the advisory contract entered into with Chartwell Investment Partners in February 2006, beginning in November 2006 the investment advisory fee will be subject to quarterly adjustments based on performance since January 31, 2006, relative to the Russell Midcap Growth Index. In accordance with the advisory contract entered into with William Blair & Company in June 2006, beginning in August 2007 the investment advisory fee will be subject to quarterly adjustments based on performance since July 31, 2006, relative to the Russell Midcap Growth Index.
Prior to June 8, 2006, Provident Investment Counsel served as an advisor to the fund. The basic fee was subject to quarterly adjustments based on performance for the preceding three years relative to the Russell Midcap Growth Index. Effective June 8, 2006, assets managed by Provident Investment Counsel were reallocated between Chartwell Investment Partners and William Blair & Company.
The Vanguard Group manages the cash reserves of the fund on an at-cost basis.
For the year ended October 31, 2006, the aggregate investment advisory fee represented an effective annual basic rate of 0.24% of the fund’s average net assets before a decrease of $299,000 (0.04%) based on performance.
C. The Vanguard Group furnishes at cost corporate management, administrative, marketing, and distribution services. The costs of such services are allocated to the fund under methods approved by the board of trustees. The fund has committed to provide up to 0.40% of its net assets in capital contributions to Vanguard. At October 31, 2006, the fund had contributed capital of $80,000 to Vanguard (included in Other Assets), representing 0.01% of the fund’s net assets and 0.08% of Vanguard’s capitalization. The fund’s trustees and officers are also directors and officers of Vanguard.
D. The fund has asked its investment advisors to direct certain security trades, subject to obtaining the best price and execution, to brokers who have agreed to rebate to the fund part of the commissions generated. Such rebates are used solely to reduce the fund’s management and administrative expenses. The fund’s custodian bank has also agreed to reduce its fees when the fund maintains cash on deposit in the non-interest-bearing custody account. For the year ended October 31, 2006, these arrangements reduced the fund’s management and administrative expenses by $216,000 and custodian fees by $1,000. The total expense reduction represented an effective annual rate of 0.03% of the fund’s average net assets.
E. Distributions are determined on a tax basis and may differ from net investment income and realized capital gains for financial reporting purposes. Differences may be permanent or temporary. Permanent differences are reclassified among capital accounts in the financial statements to reflect their tax character. Temporary differences arise when certain items of income, expense, gain, or loss are recognized in different periods for financial statement and tax purposes; these differences will reverse at some time in the future. Differences in classification may also result from the treatment of short-term gains as ordinary income for tax purposes.
The fund used a tax accounting practice to treat a portion of the price of capital shares redeemed during the year as distributions from net investment income and realized capital gains. Accordingly, the fund has reclassified $207,000 from undistributed net investment income, and $16,291,000 from accumulated net realized gains, to paid-in capital.
19
The fund used a capital loss carryforward of $1,172,000 to offset taxable capital gains realized during the year ended October 31, 2006, reducing the amount of capital gains that would otherwise be available to distribute to shareholders. For tax purposes, at October 31, 2006, the fund had $9,014,000 of ordinary income and $104,209,000 of long-term capital gains available for distribution.
At October 31, 2006, the cost of investment securities for tax purposes was $743,174,000. Net unrealized appreciation of investment securities for tax purposes was $52,528,000, consisting of unrealized gains of $73,707,000 on securities that had risen in value since their purchase and $21,179,000 in unrealized losses on securities that had fallen in value since their purchase.
At October 31, 2006, the aggregate settlement value of open futures contracts expiring in December 2006 and the related unrealized appreciation (depreciation) were:
| | | ($000) |
| | Aggregate | Unrealized |
| Number of | Settlement | Appreciation |
Futures Contracts | Long Contracts | Value | (Depreciation) |
S&P MidCap 400 Index | 36 | 14,197 | 748 |
E-mini NASDAQ 100 Index | 145 | 5,054 | 189 |
Unrealized appreciation (depreciation) on open futures contracts is required to be treated as realized gain (loss) for tax purposes.
F. During the year ended October 31, 2006, the fund purchased $1,140,409,000 of investment securities and sold $1,032,401,000 of investment securities, other than temporary cash investments.
G. The market value of securities on loan to broker-dealers at October 31, 2006, was $3,868,000, for which the fund received cash collateral of $3,970,000.
H. Capital shares issued and redeemed were:
| Year Ended October 31, |
| 2006 | 2005 |
| Shares | Shares |
| (000) | (000) |
Issued | 18,499 | 13,038 |
Issued in Lieu of Cash Distributions | 9 | — |
Redeemed | (10,943) | (10,099) |
Net Increase (Decrease) in Shares Outstanding | 7,565 | 2,939 |
I. In June 2006, the Financial Accounting Standards Board issued Interpretation No. 48 (“FIN 48”), “Accounting for Uncertainty in Income Taxes.” FIN 48 establishes the minimum threshold for recognizing, and a system for measuring, the benefits of tax-return positions in financial statements. FIN 48 will be effective for the fund’s fiscal year beginning November 1, 2007. Management is in the process of analyzing the fund’s tax positions for purposes of implementing FIN 48; based on the analysis completed to date, management does not believe the adoption of FIN 48 will result in any material impact to the fund’s financial statements.
20
Report of Independent Registered Public Accounting Firm
To the Trustees of Vanguard Whitehall Funds and the Shareholders of Vanguard Mid-Cap Growth Fund:
In our opinion, the accompanying statement of net assets and the related statements of operations and of changes in net assets and the financial highlights present fairly, in all material respects, the financial position of Vanguard Mid-Cap Growth Fund (the “Fund”) at October 31, 2006, the results of its operations for the year then ended, the changes in its net assets for each of the two years in the period then ended and the financial highlights for each of the five years in the period then ended, in conformity with accounting principles generally accepted in the United States of America. These financial statements and financial highlights (hereafter referred to as “financial statements”) are the responsibility of the Fund’s management; our responsibility is to express an opinion on these financial statements based on our audits. We conducted our audits of these financial statements in accordance with the standards of the Public Company Accounting Oversight Board (United States). Those standards require that we plan and perform the audit to obtain reasonable assurance about whether the financial statements are free of material misstatement. An audit includes examining, on a test basis, evidence supporting the amounts and disclosures in the financial statements, assessing the accounting principles used and significant estimates made by management, and evaluating the overall financial statement presentation. We believe that our audits, which included confirmation of securities at October 31, 2006 by correspondence with the custodian and broker, and by agreement to the underlying ownership records for Vanguard Market Liquidity Fund, provide a reasonable basis for our opinion.
PricewaterhouseCoopers LLP
Philadelphia, Pennsylvania
December 11, 2006
Special 2006 tax information (unaudited) for Vanguard Mid-Cap Growth Fund
This information for the fiscal year ended October 31, 2006, is included pursuant to provisions of the Internal Revenue Code.
The fund distributed $15,495,000 as capital gain dividends (from net long-term capital gains) to shareholders during the fiscal year.
The fund distributed $177,000 of qualified dividend income to shareholders during the fiscal year.
For corporate shareholders, 20.3% of investment income (dividend income plus short-term gains, if any) qualifies for the dividends-received deduction.
21
Your Fund’s After-Tax Returns
This table presents returns for your fund both before and after taxes. The after-tax returns are shown in two ways: (1) assuming that an investor owned the fund during the entire period and paid taxes on the fund’s distributions, and (2) assuming that an investor paid taxes on the fund’s distributions and sold all shares at the end of each period.
Calculations are based on the highest individual federal income tax and capital gains tax rates in effect at the times of the distributions and the hypothetical sales. State and local taxes were not considered. After-tax returns reflect any qualified dividend income, using actual prior-year figures and estimates for 2006. (In the example, returns after the sale of fund shares may be higher than those assuming no sale. This occurs when the sale would have produced a capital loss. The calculation assumes that the investor received a tax deduction for the loss.)
Please note that your actual after-tax returns will depend on your tax situation and may differ from those shown. Also note that if you own the fund in a tax-deferred account, such as an individual retirement account or a 401(k) plan, this information does not apply to you. Such accounts are not subject to current taxes.
Finally, keep in mind that a fund’s performance—whether before or after taxes—does not guarantee future results.
Average Annual Total Returns: Mid-Cap Growth Fund | | | |
Periods Ended October 31, 2006 | | | |
| One | Five | Since |
| Year | Years | Inception1 |
Returns Before Taxes | 15.35% | 9.37% | 11.64% |
Returns After Taxes on Distributions | 15.35 | 9.37 | 10.38 |
Returns After Taxes on Distributions and Sale of Fund Shares | 9.98 | 8.16 | 9.68 |
22
About Your Fund’s Expenses
As a shareholder of the fund, you incur ongoing costs, which include costs for portfolio management, administrative services, and shareholder reports (like this one), among others. Operating expenses, which are deducted from a fund’s gross income, directly reduce the investment return of the fund.
A fund’s expenses are expressed as a percentage of its average net assets. This figure is known as the expense ratio. The following examples are intended to help you understand the ongoing costs (in dollars) of investing in your fund and to compare these costs with those of other mutual funds. The examples are based on an investment of $1,000 made at the beginning of the period shown and held for the entire period.
The table below illustrates your fund’s costs in two ways:
• Based on actual fund return. This section helps you to estimate the actual expenses that you paid over the period. The “Ending Account Value” shown is derived from the fund’s actual return, and the third column shows the dollar amount that would have been paid by an investor who started with $1,000 in the fund. You may use the information here, together with the amount you invested, to estimate the expenses that you paid over the period.
To do so, simply divide your account value by $1,000 (for example, an $8,600 account value divided by $1,000 = 8.6), then multiply the result by the number given for your fund under the heading “Expenses Paid During Period.”
• Based on hypothetical 5% yearly return. This section is intended to help you compare your fund’s costs with those of other mutual funds. It assumes that the fund had a yearly return of 5% before expenses, but that the expense ratio is unchanged. In this case—because the return used is not the fund’s actual return—the results do not apply to your investment. The example is useful in making comparisons because the Securities and Exchange Commission requires all mutual funds to calculate expenses based on a 5% return. You can assess your fund’s costs by comparing this hypothetical example with the hypothetical examples that appear in shareholder reports of other funds.
Six Months Ended October 31, 2006 | | | |
| Beginning | Ending | Expenses |
| Account Value | Account Value | Paid During |
Mid-Cap Growth Fund | 4/30/2006 | 10/31/2006 | Period1 |
Based on Actual Fund Return | $1,000.00 | $967.12 | $2.63 |
Based on Hypothetical 5% Yearly Return | 1,000.00 | 1,022.53 | 2.70 |
1 | The calculations are based on expenses incurred in the most recent six-month period. The fund’s annualized six-month expense ratio for that period is 0.53%. The dollar amounts shown as “Expenses Paid” are equal to the annualized expense ratio multiplied by the average account value over the period, multiplied by the number of days in the most recent six-month period, then divided by the number of days in the most recent 12-month period. |
23
Note that the expenses shown in the table on page 23 are meant to highlight and help you compare ongoing costs only and do not reflect any transactional costs or account maintenance fees. They do not include your fund’s low-balance fee, which is described in the prospectus. If this fee were applied to your account, your costs would be higher. Your fund does not charge transaction fees, such as purchase or redemption fees, nor does it carry a “sales load.”
The calculations assume no shares were bought or sold during the period. Your actual costs may have been higher or lower, depending on the amount of your investment and the timing of any purchases or redemptions.
You can find more information about the fund’s expenses, including annual expense ratios, in the Financial Statements section of this report. For additional information on operating expenses and other shareholder costs, please refer to the appropriate fund prospectus.
24
Trustees Approve Advisory Agreement
The board of trustees of Vanguard Mid-Cap Growth Fund has added William Blair & Company, L.L.C., to the fund’s investment advisory team. The board determined that the addition of William Blair was in the best interests of the fund and its shareholders. The board previously approved its advisory arrangement with Chartwell Investment Partners, L.P., the fund’s other advisor. Please see the fund’s semiannual report dated April 30, 2006, for more information.
The board based its decision upon an evaluation of William Blair’s investment staff, portfolio management process, and performance. The trustees considered the factors discussed below, among others. However, no single factor determined whether the board approved the agreement. Rather, it was the totality of the circumstances that drove the board’s decision.
Nature, extent, and quality of services
The board considered the quality of the firm’s investment management and took into account the organizational depth and stability of the firm.
The board noted that William Blair, founded in 1935, is an experienced growth-oriented advisory firm with a solid track record. The board also noted that the firm is an independently owned full-service investment firm that has a deep and talented pool of investment professionals consisting of 31 portfolio managers averaging over 25 years of experience.
The board concluded that the advisor’s experience, stability, depth, and performance, among other factors, warranted approval of the advisory agreement.
Investment performance
The board considered the performance of other mid-cap growth investment products managed by William Blair. The trustees concluded that the investment performance of William Blair’s mid-cap growth strategy was competitive compared with that of the fund, the average mid-cap growth fund, and the Russell Midcap Growth Index, and that the firm’s mid-cap growth strategy has produced solid returns that have outpaced the average return of its peers. The board further concluded that the combination of William Blair and Chartwell would provide beneficial diversification.
Cost
The board considered the cost of services to be provided, including consideration of competitive fee rates and the fact that, after the implementation of the agreement with William Blair, the fund’s advisory fee rate and expense ratio remain below the advisory fee rates and expense ratios of the fund’s peers. Information about the fund’s expense ratio appears in the About Your Fund’s Expenses section of this report as well as in the Financial Statements section.
The board did not consider profitability of William Blair in determining whether to approve the advisory fee, because the firm is independent of Vanguard, and the advisory fee is the result of arm’s-length negotiations.
The benefit of economies of scale
The board concluded that the fund’s shareholders benefit from economies of scale because of breakpoints in the advisory fee schedule. The breakpoints reduce the effective rate of the fees as the fund’s assets managed by William Blair increase.
The board will consider whether to renew the advisory agreement after a one-year period.
25
Glossary
Beta. A measure of the magnitude of a fund’s past share-price fluctuations in relation to the ups and downs of a given market index. The index is assigned a beta of 1.00. Compared with a given index, a fund with a beta of 1.20 typically would have seen its share price rise or fall by 12% when the index rose or fell by 10%. A fund’s beta should be reviewed in conjunction with its R-squared (see definition below). The lower the R-squared, the less correlation there is between the fund and the index, and the less reliable beta is as an indicator of volatility.
Earnings Growth Rate. The average annual rate of growth in earnings over the past five years for the stocks now in a fund.
Expense Ratio. The percentage of a fund’s average net assets used to pay its annual administrative and advisory expenses. These expenses directly reduce returns to investors.
Foreign Holdings. The percentage of a fund represented by stocks or depositary receipts of companies based outside the United States.
Median Market Cap. An indicator of the size of companies in which a fund invests; the midpoint of market capitalization (market price x shares outstanding) of a fund’s stocks, weighted by the proportion of the fund’s assets invested in each stock. Stocks representing half of the fund’s assets have market capitalizations above the median, and the rest are below it.
Price/Book Ratio. The share price of a stock divided by its net worth, or book value, per share. For a fund, the weighted average price/book ratio of the stocks it holds.
Price/Earnings Ratio. The ratio of a stock’s current price to its per-share earnings over the past year. For a fund, the weighted average P/E of the stocks it holds. P/E is an indicator of market expectations about corporate prospects; the higher the P/E, the greater the expectations for a company’s future growth.
R-Squared. A measure of how much of a fund’s past returns can be explained by the returns from the market in general, as measured by a given index. If a fund’s total returns were precisely synchronized with an index’s returns, its R-squared would be 1.00. If the fund’s returns bore no relationship to the index’s returns, its R-squared would be 0.
Return on Equity. The annual average rate of return generated by a company during the past five years for each dollar of shareholder’s equity (net income divided by shareholder’s equity). For a fund, the weighted average return on equity for the companies whose stocks it holds.
Short-Term Reserves. The percentage of a fund invested in highly liquid, short-term securities that can be readily converted to cash.
Turnover Rate. An indication of the fund’s trading activity. Funds with high turnover rates incur higher transaction costs and may be more likely to distribute capital gains (which may be taxable to investors). The turnover rate excludes in-kind transactions, which have minimal impact on costs.
Yield. A snapshot of a fund’s income from interest and dividends. The yield, expressed as a percentage of the fund’s net asset value, is based on income earned over the past 30 days and is annualized, or projected forward for the coming year. The index yield is based on the current annualized rate of income provided by securities in the index.
26
This page intentionally left blank.
The People Who Govern Your Fund
The trustees of your mutual fund are there to see that the fund is operated and managed in your best interests since, as a shareholder, you are a part owner of the fund. Your fund’s trustees also serve on the board of directors of The Vanguard Group, Inc., which is owned by the Vanguard funds and provides services to them on an at-cost basis.
A majority of Vanguard’s board members are independent, meaning that they have no affiliation with Vanguard or the funds they oversee, apart from the sizable personal investments they have made as private individuals.
Our independent board members bring distinguished backgrounds in business, academia, and public service to their task of working with Vanguard officers to establish the policies and oversee the activities of the funds. Among board members’ responsibilities are selecting investment advisors for the funds; monitoring fund operations, performance, and costs; reviewing contracts; nominating and selecting new trustees/directors; and electing Vanguard officers.
Each trustee serves a fund until its termination; or until the trustee’s retirement, resignation, or death; or otherwise as specified in the fund’s organizational documents. Any trustee may be removed at a shareholders’ meeting by a vote representing two-thirds of the net asset value of all shares of the fund together with shares of other Vanguard funds organized within the same trust. The table on these two pages shows information for each trustee and executive officer of the fund. The mailing address of the trustees and officers is P.O. Box 876, Valley Forge, PA 19482.
Chairman of the Board, Chief Executive Officer, and Trustee |
| |
John J. Brennan1 | |
Born 1954 | Principal Occupation(s) During the Past Five Years: Chairman of the Board, Chief |
Trustee since May 1987; | Executive Officer, and Director/Trustee of The Vanguard Group, Inc., and of each |
Chairman of the Board and | of the investment companies served by The Vanguard Group. |
Chief Executive Officer | |
144 Vanguard Funds Overseen |
| |
Independent Trustees | |
| |
Charles D. Ellis | |
Born 1937 | Principal Occupation(s) During the Past Five Years: Applecore Partners (pro bono ventures |
Trustee since January 2001 | in education); Senior Advisor to Greenwich Associates (international business strategy |
144 Vanguard Funds Overseen | consulting); Successor Trustee of Yale University; Overseer of the Stern School of Business |
| at New York University; Trustee of the Whitehead Institute for Biomedical Research. |
| |
Rajiv L. Gupta | |
Born 1945 | Principal Occupation(s) During the Past Five Years: Chairman and Chief Executive Officer |
Trustee since December 20012 | of Rohm and Haas Co. (chemicals); Board Member of the American Chemistry Council; |
144 Vanguard Funds Overseen | Director of Tyco International, Ltd. (diversified manufacturing and services) (since 2005); |
| Trustee of Drexel University and of the Chemical Heritage Foundation. |
| |
Amy Gutmann | |
Born 1949 | Principal Occupation(s) During the Past Five Years: President of the University of |
Trustee since June 2006 | Pennsylvania since 2004; Professor in the School of Arts and Sciences, Annenberg School |
144 Vanguard Funds Overseen | for Communication, and Graduate School of Education of the University of Pennsylvania |
| since 2004; Provost (2001–2004) and Laurance S. Rockefeller Professor of Politics and the |
| University Center for Human Values (1990–2004), Princeton University; Director of Carnegie |
| Corporation of New York and of Philadelphia 2016 (since 2005) and of Schuylkill River |
| Development Corporation and Greater Philadelphia Chamber of Commerce (since 2004). |
JoAnn Heffernan Heisen | |
Born 1950 | Principal Occupation(s) During the Past Five Years: Corporate Vice President and Chief |
Trustee since July 1998 | Global Diversity Officer (since January 2006), Vice President and Chief Information |
144 Vanguard Funds Overseen | Officer (1997–2005), and Member of the Executive Committee of Johnson & Johnson |
| (pharmaceuticals/consumer products); Director of the University Medical Center at |
| Princeton and Women’s Research and Education Institute. |
| |
André F. Perold | |
Born 1952 | Principal Occupation(s) During the Past Five Years: George Gund Professor of Finance and |
Trustee since December 2004 | Banking, Harvard Business School (since 2000); Senior Associate Dean, Director of Faculty |
144 Vanguard Funds Overseen | Recruiting, and Chair of Finance Faculty, Harvard Business School; Director and Chairman |
| of UNX, Inc. (equities trading firm) (since 2003); Director of registered investment |
| companies advised by Merrill Lynch Investment Managers and affiliates (1985–2004), |
| Genbel Securities Limited (South African financial services firm) (1999–2003), Gensec |
| Bank (1999–2003), Sanlam, Ltd. (South African insurance company) (2001–2003), and |
| Stockback, Inc. (credit card firm) (2000–2002). |
| |
Alfred M. Rankin, Jr. | |
Born 1941 | Principal Occupation(s) During the Past Five Years: Chairman, President, Chief Executive |
Trustee since January 1993 | Officer, and Director of NACCO Industries, Inc. (forklift trucks/housewares/ lignite); |
144 Vanguard Funds Overseen | Director of Goodrich Corporation (industrial products/aircraft systems and services). |
| |
J. Lawrence Wilson | |
Born 1936 | Principal Occupation(s) During the Past Five Years: Retired Chairman and Chief Executive |
Trustee since April 1985 | Officer of Rohm and Haas Co. (chemicals); Director of Cummins Inc. (diesel engines), |
144 Vanguard Funds Overseen | MeadWestvaco Corp. (packaging products), and AmerisourceBergen Corp. (pharmaceutical |
| distribution); Trustee of Vanderbilt University and of Culver Educational Foundation. |
| |
Executive Officers1 | |
| |
Heidi Stam | |
Born 1956 | Principal Occupation(s) During the Past Five Years: Principal of The Vanguard Group, Inc., |
Secretary since July 2005 | since November 1997; General Counsel of The Vanguard Group since July 2005; |
144 Vanguard Funds Overseen | Secretary of The Vanguard Group and of each of the investment companies served |
| by The Vanguard Group since July 2005. |
| |
Thomas J. Higgins | |
Born 1957 | Principal Occupation(s) During the Past Five Years: Principal of The Vanguard Group, Inc.; |
Treasurer since July 1998 | Treasurer of each of the investment companies served by The Vanguard Group. |
144 Vanguard Funds Overseen | |
| |
Vanguard Senior Management Team |
| |
R. Gregory Barton | Kathleen C. Gubanich | Michael S. Miller |
Mortimer J. Buckley | Paul A. Heller | Ralph K. Packard |
James H. Gately | F. William McNabb, III | George U. Sauter |
| |
Founder | |
| |
John C. Bogle | |
Chairman and Chief Executive Officer, 1974–1996 |
1 Officers of the funds are “interested persons” as defined in the Investment Company Act of 1940.
2 December 2002 for Vanguard Equity Income Fund, Vanguard Growth Equity Fund, the Vanguard Municipal Bond Funds, and the Vanguard State Tax-Exempt Funds.
More information about the trustees is in the Statement of Additional Information, available from The Vanguard Group.
| 
|
| P.O. Box 2600 |
| Valley Forge, PA 19482-2600 |
Connect with Vanguard™ > www.vanguard.com
Fund Information > 800-662-7447 | Vanguard, Connect with Vanguard, VIPER, and the ship |
| logo are trademarks of The Vanguard Group, Inc. |
Direct Investor Account Services > 800-662-2739 | |
| All other marks are the exclusive property of their |
Institutional Investor Services > 800-523-1036 | respective owners. |
| |
Text Telephone > 800-952-3335 | All comparative mutual fund data are from Lipper Inc. |
| or Morningstar, Inc., unless otherwise noted. |
| |
| |
| |
| |
This material may be used in conjunction | You can obtain a free copy of Vanguard’s proxy voting |
with the offering of shares of any Vanguard | guidelines by visiting our website, www.vanguard.com, |
fund only if preceded or accompanied by | and searching for “proxy voting guidelines,” or by calling |
the fund’s current prospectus. | Vanguard at 800-662-2739. They are also available from |
| the SEC’s website, www.sec.gov. In addition, you may |
| obtain a free report on how your fund voted the proxies for |
| securities it owned during the 12 months ended June 30. |
| To get the report, visit either www.vanguard.com |
| or www.sec.gov. |
| |
| You can review and copy information about your fund |
| at the SEC’s Public Reference Room in Washington, D.C. |
| To find out more about this public service, call the SEC |
| at 202-551-8090. Information about your fund is also |
| available on the SEC’s website, and you can receive |
| copies of this information, for a fee, by sending a |
| request in either of two ways: via e-mail addressed to |
| publicinfo@sec.gov or via regular mail addressed to the |
| Public Reference Section, Securities and Exchange |
| Commission, Washington, DC 20549-0102. |
| |
| |
| |
| |
| © 2006 The Vanguard Group, Inc. |
| All rights reserved. |
| Vanguard Marketing Corporation, Distributor. |
| |
| Q3010 122006 |
Vanguard® International Explorer™ Fund |
| |
| |
| |
| |
> Annual Report | |
| |
| |
| |
October 31, 2006 | |
| |
| |
| |
|
|
| |
| |
| |
| |
| |
| |
| |
| |
| |
| |
> | Vanguard International Explorer Fund gained 31.3% during its fiscal year, ahead of the average return for its peer group but slightly behind its index. |
> | The fund’s greatest gains came among financial and industrial companies that are benefiting from strong growth in emerging markets. |
> | U.S. investors’ gains were boosted by the dollar’s weakening against major currencies. |
Contents | |
| |
Your Fund’s Total Returns | 1 |
Chairman’s Letter | 2 |
Advisor’s Report | 7 |
Fund Profile | 9 |
Performance Summary | 11 |
Financial Statements | 13 |
Your Fund’s After-Tax Returns | 24 |
About Your Fund’s Expenses | 25 |
Trustees Approve Advisory Agreement | 27 |
Glossary | 29 |
Please note: The opinions expressed in this report are just that—informed opinions. They should not be considered promises or advice. Also, please keep in mind that the information and opinions cover the period through the date on the cover of this report. Of course, the risks of investing in your fund are spelled out in the prospectus.
Your Fund’s Total Returns
Fiscal Year Ended October 31, 2006 | |
| Total |
| Returns |
Vanguard International Explorer Fund | 31.3% |
S&P/Citigroup EM EPAC Index1 | 32.1 |
Average International Small-Cap Fund2 | 29.8 |
MSCI All Country World Index ex USA | 28.9 |
Your Fund’s Performance at a Glance |
October 31, 2005–October 31, 2006 |
| | | Distributions Per Share |
| Starting | Ending | Income | Capital |
| Share Price | Share Price | Dividends | Gains |
Vanguard International Explorer Fund | $17.99 | $21.50 | $0.40 | $1.35 |
1 Standard & Poor’s/Citigroup Extended Market Europe & Pacific Index.
2 Derived from data provided by Lipper Inc.
1

Chairman’s Letter
Dear Shareholder,
Strong earnings, declining oil prices, and robust economic growth provided a perfect environment for international markets, where stocks are on track to beat the U.S. market for the fifth straight calendar year. During Vanguard International Explorer Fund’s fiscal year ended October 31, 2006, the fund soared 31.3%, putting it ahead of the average return among peer funds but slightly behind its benchmark index.
Small-capitalization international stocks bested their large-cap brethren. The fund’s gains were enhanced for U.S. investors by a weakened U.S. dollar, which boosts returns as stronger foreign currencies buy more dollars.
Most of International Explorer’s gains came from European holdings, although the fund’s exposure in soaring emerging markets also added significantly to returns.
If you own the fund in a taxable account, you may want to see page 24 for a report on its after-tax returns.
International markets served up stronger gains than the U.S. market
International stocks turned in excellent results during the 12 months. European and emerging markets led the rally. In Europe, a surge in corporate mergers and acquisitions drove markets higher in many nations. Emerging economies continued to benefit both from outsourcing by developed countries and from increasingly
2
strong domestic consumer markets. The Japanese market was a somewhat weak performer over the year.
In the United States, stock prices advanced in fits and starts during the 12 months, reflecting the uncertainty that pervaded the market for much of the period. The broad market rallied at the start of the fiscal year, buoyed by strong corporate earnings growth and vigorous economic expansion. In mid-May, inflation fears moved to the fore, and market indexes pulled back sharply. Optimism regained the upper hand in late summer, when the broad market rallied to post a 12-month return of 16.6%.
As has been the case for much of the past five years, smaller-capitalization stocks outperformed large-caps, and value-oriented stocks bested their growth-oriented counterparts.
Rate hikes and inflation concerns drove the U.S. bond market
The U.S. fixed income markets reflected some of these same uncertainties, with the back-and-forth pattern most pronounced among the longest-maturity bonds. The Federal Reserve Board tightened monetary policy by raising its target for the federal funds rate six times during the fiscal year, to 5.25%, and the yields of short-term issues followed closely behind. The yields of longer-term securities, by contrast, dipped early in the year, rose sharply on inflation worries in May, then finished the period a bit above their starting point.
The broad taxable bond market returned 5.2%. Corporate bonds generally outperformed government issues. Municipal bonds did better still.
Market Barometer | | | |
| Average Annual Total Returns |
| Periods Ended October 31, 2006 |
| One Year | Three Years | Five Years |
Stocks | | | |
MSCI All Country World Index ex USA (International) | 28.9% | 23.0% | 16.7% |
Dow Jones Wilshire 5000 Index (Entire market) | 16.6 | 12.4 | 8.9 |
Russell 1000 Index (Large-caps) | 16.0 | 11.9 | 7.9 |
Russell 2000 Index (Small-caps) | 20.0 | 14.5 | 13.8 |
| | | |
Bonds | | | |
Lehman Aggregate Bond Index (Broad taxable market) | 5.2% | 3.9% | 4.5% |
Lehman Municipal Bond Index | 5.7 | 4.8 | 5.1 |
Citigroup 3-Month Treasury Bill Index | 4.5 | 2.8 | 2.3 |
| | | |
CPI | | | |
Consumer Price Index | 1.3% | 2.9% | 2.6% |
3
Developed and emerging markets contributed to the fund’s gains
The fund’s focus on small-cap stocks takes it around the globe: Swiss and German providers of chemicals and engineering services mixed in the portfolio with banks in emerging Asian countries, such as Indonesia and Thailand. The advisor of International Explorer Fund—Schroder Investment Management North America Inc.—seeks small-cap companies that are poised for rapid earnings growth and trade at attractive valuations.
During the fund’s fiscal year, earnings-growth stories were common among companies in financial services, transportation, construction, and consumer products. Well over half of the fund’s return can be attributed to Schroder’s stock selection within the industrials and financials sectors. Within industrials, top contributors included Swiss firm Geberit, which supplies sanitary and piping systems to commercial builders, and Britain’s Babcock International, which manages assets ranging from oil and gas facilities to rail and telecommunication networks. Danish insurer Topdanmark and Greek banking and brokerage firm Marfin Financial Group also performed very well.
The fund’s 8% exposure to emerging markets also aided returns. South Korea represented more than half of the weighting, and the advisor’s selections among banks and engineering firms there performed well.
Relative to the benchmark, the fund’s return was restrained by lighter weightings, on average, in Germany and France, which were among the stronger markets in Europe, and by weak stock selection in Japan. Japanese information technology firms Enplas and Arisawa Manufacturing
Total Returns | | |
November 4, 19961, Through October 31, 2006 |
| Average | Final Value of a $25,000 |
| Annual Return | Initial Investment |
International Explorer Fund | 14.8% | $99,380 |
S&P/Citigroup EM EPAC Index | 9.3 | 60,981 |
Average International Small-Cap Fund | 12.6 | 81,846 |
MSCI All Country World Index ex USA | 7.7 | 52,548 |
The figures shown represent past performance, which is not a guarantee of future results. (Current performance may be lower or higher than the performance data cited. For performance data current to the most recent month-end, visit our website at www.vanguard.com.) Note, too, that both investment returns and principal value can fluctuate widely, so an investor’s shares, when sold, could be worth more or less than their original cost.
1 The fund’s inception date.
4
and broker H.S. Securities were among the fund’s largest detractors. After a heady 2005, the Japanese economy showed signs of cooling in 2006, creating investor uncertainty that tarnished many stocks.
For more details on the advisor’s portfolio positioning and outlook, see the Advisor’s Report on page 7.
Advisor’s skill, fund’s low costs have led to long-term benefits
Since its inception in 1996, the International Explorer Fund has averaged a 14.8% annual return, a result that puts it more than two percentage points ahead of its comparative standard. To put that distinction in dollar terms: A hypothetical investment of $25,000 in the fund at inception would have grown to $99,380 over the ensuing decade. The same investment in a fund achieving the average return among international small-cap funds would have produced about $17,500 less.
Schroder’s skill in selecting stocks and markets deserves much of the credit for the fund’s competitive long-term returns. The portfolio manager, Matthew Dobbs, has been in investment management for 25 years. Another factor in the fund’s favor: Vanguard’s traditionally low costs. As you can see in the table below, the fund’s expenses are less than one-quarter the industry average, a remarkably low cost of entry to international small-cap investing.
The virtues of investing abroad
As investors have learned over the years, the stock and bond markets can harbor many uncertainties. There is no way to know what will happen year by year, much less day to day. The best way to approach
Expense Ratios1 | | |
Your fund compared with its peer group | | |
| | Average |
| | International |
| Fund | Small-Cap Fund |
International Explorer Fund | 0.44% | 1.79% |
1 Fund expense ratio reflects the 12 months ended October 31, 2006. Peer-group expense ratio is derived from data provided by Lipper Inc. and captures information through year-end 2005.
5
a long-term commitment to investing is to select an appropriate, diversified mix of stock, bond, and money market mutual funds that fits your goals, time horizon, and risk tolerance.
You can add diversification to the stock portion of your portfolio by making a modest commitment of assets to a broad-based international stock fund—Vanguard suggests 20% as a reasonable target—permitting you to share in economic growth outside the United States. By combining diversified U.S. stock funds with international stock funds, as well as bond and money market funds, you can do much to insulate your portfolio from a capricious market that can smile on one asset class and frown on another at any given time.
We believe that the International Explorer Fund can serve well as part of a diversified investment plan that will help you move along the road to your long-term investing goals.
Thank you for your ongoing confidence in Vanguard.
Sincerely,

John J. Brennan
Chairman and Chief Executive Officer
November 16, 2006
6
Advisor’s Report
Over the 12 months ended October 31, 2006, Vanguard International Explorer Fund returned 31.3%, while the S&P/Citigroup Extended Market Europe & Pacific (EM EPAC) Index, a broad measure of the performance of smaller non-U.S. stocks, rose 32.1%.
The investment environment
Most of the fund’s return came in the first six months, when equities were supported by strong momentum in global economic activity, healthy corporate results, and relatively easy liquidity conditions. A sharp stock sell-off in May and June was triggered by concerns about tightening liquidity and increased doubt about prospects for global growth (investors focused mainly on the weakening U.S. housing market, but also reacted to economic data from Europe and Japan). This was followed by a gradual return to previous market levels, aided by a drop in energy prices.
Over the period as a whole, smaller companies continued to outperform larger ones, and, perhaps even more impressively, the lead of smaller firms did not appear to be primarily a result of the higher proportion of cyclical sectors among smaller-cap stocks. The exception, however, was Japan, where smaller companies rose only 0.7% in U.S. dollar terms, the worst returns anywhere over the year.
Our successes
We continued to see a useful contribution from the portfolio’s exposure to emerging markets, most notably holdings in Indonesia and, to a lesser extent, Thailand. This was complemented by good stock selection in some of the smaller Asian markets, such as Singapore, Hong Kong, and South Korea. Our focus on companies benefiting from the strong momentum of domestic growth has paid dividends, particularly in sectors such as construction, financials, transport, and consumer products.
Overall regional positioning also added value in comparison with the benchmark index; for example, it was good to have a lower weighting than the index did in Japan. The fund further benefited from an overweighted position in continental European markets, and especially from its focus on the faster-growing peripheral economies such as Greece, Ireland, Denmark, and Sweden.
Our shortfalls
Overall stock selection was disappointing for the year as a whole. The key detractors were holdings in continental Europe, with shortfalls in the industrial, financial, consumer cyclical, and information technology sectors more than offsetting strong selections in health care, consumer staples, and materials. Stock selection in Japan also left us behind the benchmark, with the biggest impact coming from our holdings in the information technology and industrial sectors.
The fund’s positioning
Weakness in U.S. housing and consumption has become a well-aired theme, yet employment and household income trends remain robust, and the recent declines in oil prices may help both to underpin consumption and to provide short-term comfort for those
7
worrying about inflation. The past six months were a period of consolidation; now, with equity valuations remaining reasonable and corporate profitability continuing to grow, we expect positive returns in the coming months.
This should prove a supportive environment for small-cap equities, although we continue to feel that their valuations are sufficiently high to limit their scope for outperforming large-caps materially. However, we take comfort from the fact that, across every region, our own portfolio’s holdings are, in aggregate, offering better prospective growth than the large-cap average.
Compared with our benchmark, we remain overweighted in the smaller Asian markets, which are also the regional focus of the fund’s emerging-markets exposure. We acknowledge that a deceleration in export growth is inevitable over the next 12 months, and this will have some impact on domestic confidence within these countries. However, valuations in the Asian region remain among the cheapest in our universe, and any cessation in the rise in U.S. interest rates will feed through to improve liquidity in the region. We also continue to identify attractively valued companies that should benefit from expanding regional demand and wealth, particularly in areas such as financials, transportation, infrastructure, and consumer products.
We continue to feel that European small-cap stocks offer an attractive combination of growth and valuation characteristics. Although recent sentiment indicators point to some modest slowing in growth, themes more specific to smaller companies remain attractive, including the superior growth of peripheral economies, opportunities in Eastern Europe, infrastructure investment, merger activity, and development of a more sophisticated financial sector. The principal risk lies in the extent to which the European Central Bank may tighten liquidity, although this possibility appears to have been taken into account already by investors.
We remain cautious regarding the United Kingdom because of the relatively extended valuations of small-cap stocks versus large-caps together with the subdued outlook for domestic consumption. Although smaller Japanese companies have performed very poorly in 2006, at this point they haven’t fallen far enough to tempt us to add to our exposure, and we remain underweighted there. Small-company valuations in Japan, while lower than previously, are still significantly above those in all other regions; further, domestic economic indicators have come in below expectations, and the outlook for exports has deteriorated.
Matthew Dobbs, Senior Vice President
Schroder Investment Management
North America Inc.
November 22, 2006
8
Fund Profile
As of October 31, 2006
Portfolio Characteristics | | |
| | Comparative |
| Fund | Index1 |
Number of Stocks | 231 | 4,138 |
Turnover Rate | 32% | — |
Expense Ratio | 0.44% | — |
Short-Term Reserves | 3% | — |
Volatility Measures2 | |
| Fund Versus |
| Comparative |
| Index1 |
R-Squared | 0.95 |
Beta | 1.01 |
Sector Diversification (% of portfolio) |
| | Comparative |
| Fund | Index1 |
Consumer Discretionary | 16% | 20% |
Consumer Staples | 4 | 5 |
Energy | 4 | 3 |
Financials | 21 | 22 |
Health Care | 3 | 6 |
Industrials | 31 | 22 |
Information Technology | 6 | 7 |
Materials | 7 | 11 |
Telecommunication Services | 0 | 1 |
Utilities | 5 | 3 |
Short-Term Reserves | 3% | — |
| | | |
Ten Largest Holdings3 (% of total net assets) | |
| | | |
Sika Finanz AG (Bearer) | specialty chemicals | 1.5% |
Hochtief AG | construction | |
| and engineering | 1.5 |
Bilfinger Berger AG | construction | |
| and engineering | 1.4 |
Geberit AG | building products | 1.3 |
Red Electrica de | | |
Espana SA | electric utilities | 1.3 |
Nexity | homebuilding | 1.3 |
MTU Aero Engines | aerospace | |
Holdings AG | and defense | 1.2 |
Enagas SA | gas utilities | 1.2 |
YIT Oyj | construction | |
| and engineering | 1.2 |
ACEA SpA | multi-utilities | 1.2 |
Top Ten | | 13.1% |
| | | |
Allocation by Region (% of portfolio)
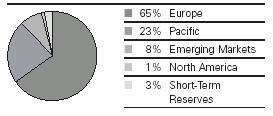
1 S&P/Citigroup EM EPAC Index.
2 For an explanation of R-squared, beta, and other terms used here, see the Glossary on page 29.
3 “Ten Largest Holdings” excludes any temporary cash investments and equity index products.
9
Country Diversification (% of portfolio) | |
| | Comparative |
| Fund | Index1 |
Europe | | |
United Kingdom | 19% | 22% |
Germany | 9 | 8 |
Switzerland | 8 | 6 |
France | 6 | 9 |
Italy | 5 | 5 |
Finland | 4 | 2 |
Sweden | 3 | 3 |
Greece | 3 | 1 |
Spain | 2 | 4 |
Netherlands | 2 | 4 |
Denmark | 1 | 1 |
Belgium | 1 | 1 |
Austria | 1 | 1 |
Ireland | 1 | 1 |
Subtotal | 65% | 68% |
Pacific | | |
Japan | 18% | 20% |
Australia | 2 | 5 |
Singapore | 2 | 1 |
Hong Kong | 1 | 2 |
Subtotal | 23% | 28% |
Emerging Markets | | |
South Korea | 5% | 4% |
Indonesia | 2 | 0 |
Taiwan | 1 | 0 |
Subtotal | 8% | 4% |
North America | | |
Canada | 1% | — |
Short-Term Reserves | 3% | — |
| | | | |
1 S&P/Citigroup EM EPAC Index.
10
Performance Summary
All of the returns in this report represent past performance, which is not a guarantee of future results that may be achieved by the fund. (Current performance may be lower or higher than the performance data cited. For performance data current to the most recent month-end, visit our website at www.vanguard.com.) Note, too, that both investment returns and principal value can fluctuate widely, so an investor’s shares, when sold, could be worth more or less than their original cost. The returns shown do not reflect taxes that a shareholder would pay on fund distributions or on the sale of fund shares.
Cumulative Performance: November 4, 1996–October 31, 2006
Initial Investment of $25,000
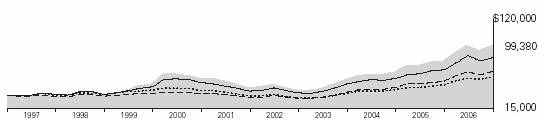
| Average Annual Total Returns | |
| Periods Ended October 31, 2006 | Final Value |
| One | Five | Since | of a $25,000 |
| Year | Years | Inception1 | Investment |
International Explorer Fund2 | 31.31% | 22.59% | 14.82% | $99,380 |
MSCI All Country World Index ex USA | 28.91 | 16.67 | 7.72 | 52,548 |
S&P/Citigroup EM EPAC Index | 32.14 | 22.47 | 9.34 | 60,981 |
Average International Small-Cap Fund3 | 29.75 | 20.95 | 12.61 | 81,846 |
1 November 4, 1996.
2 Total returns do not reflect the 2% fee assessed on redemptions of shares purchased on or after June 27, 2003, and held for less than two months.
3 Derived from data provided by Lipper Inc.
11
Fiscal-Year Total Returns (%): November 4, 1996–October 31, 2006
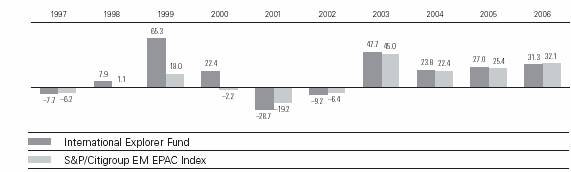
Average Annual Total Returns: Periods Ended September 30, 2006
This table presents average annual total returns through the latest calendar quarter—rather than through the end of the fiscal period. Securities and Exchange Commission rules require that we provide this information.
| Inception Date | One Year | Five Years | Since Inception |
International Explorer Fund1 | 11/4/1996 | 21.47% | 22.47% | 14.54% |
1 Total returns do not reflect the 2% fee assessed on redemptions of shares purchased on or after June 27, 2003, and held for less than two months.
Note: See Financial Highlights table on page 19 for dividend and capital gains information.
12
Financial Statements
Statement of Net Assets
As of October 31, 2006
The fund provides a complete list of its holdings four times in each fiscal year, at the quarter-ends. For the second and fourth fiscal quarters, the lists appear in the fund’s semiannual and annual reports to shareholders. For the first and third fiscal quarters, the fund files the lists with the Securities and Exchange Commission on Form N-Q. Shareholders can look up the fund’s Forms N-Q on the SEC’s website at www.sec.gov. Forms N-Q may also be reviewed and copied at the SEC’s Public Reference Room (see the back cover of this report for further information).
| | Market |
| | Value• |
| Shares | ($000) |
Common Stocks (96.6%) | | |
Australia (2.0%) | | |
James Hardie | | |
Industries NV | 2,344,838 | 14,304 |
^Ansell Ltd. | 1,483,284 | 12,734 |
Just Group Ltd. | 3,254,735 | 9,887 |
Lion Nathan Ltd. | 1,530,706 | 9,810 |
^Computershare Ltd. | 800,000 | 4,760 |
^Sonic Healthcare Ltd. | 250,000 | 2,543 |
| | 54,038 |
Austria (0.9%) | | |
* Austriamicrosystems AG | 246,423 | 15,668 |
Schoeller-Bleckmann | | |
Oilfield Equipment AG | 200,000 | 8,020 |
| | 23,688 |
Belgium (1.3%) | | |
Compagnie Nationale a | | |
Portefeuille | 40,000 | 14,620 |
Fluxys-D | 4,000 | 13,823 |
Sofina SA | 65,000 | 6,473 |
| | 34,916 |
Brazil (0.1%) | | |
Lojas Americanas SA Pfd. | 50,000,000 | 2,268 |
| | |
Canada (0.5%) | | |
Niko Resources Ltd. | 230,000 | 13,959 |
| | |
China (0.4%) | | |
^Shenzhen | | |
Expressway Co. Ltd. | 13,400,000 | 7,531 |
^The Guangshen | | |
Railway Co., Ltd. | 6,800,000 | 3,197 |
| | 10,728 |
| | |
Denmark (1.4%) | | |
^Trygvesta AS | 330,000 | 21,279 |
* ^Jyske Bank A/S | 280,800 | 16,720 |
| | 37,999 |
Finland (3.5%) | | |
^YIT Oyj | 1,261,074 | 31,343 |
^OKO Bank | | |
(Osuuspankkien | | |
Keskuspankki Oyj) | 1,450,000 | 24,501 |
Kone Oyj | 350,000 | 16,563 |
^Uponor Oyj | 376,382 | 11,413 |
Cargotec Corp. | 200,000 | 9,098 |
| | 92,918 |
France (6.1%) | | |
Nexity | 500,000 | 34,432 |
^Groupe Bourbon SA | 557,967 | 30,051 |
Saft Groupe SA | 920,000 | 27,739 |
^Rodriguez Group | 300,000 | 16,646 |
Kaufman & Broad SA | 270,000 | 15,545 |
* Groupe Partouche SA | 437,551 | 11,189 |
* Cegereal | 222,906 | 8,853 |
* Carrere Group | 220,000 | 5,834 |
* Amboise a et BSA | 421,192 | 5,629 |
* Store Promesses | 306,041 | 3,982 |
HF Company | 100,000 | 2,613 |
Virbac SA | 17,093 | 1,049 |
* ^CBo Territoria | 138,387 | 467 |
| | 164,029 |
Germany (8.5%) | | |
^Hochtief AG | 600,000 | 39,250 |
^Bilfinger Berger AG | 600,000 | 37,502 |
MTU Aero Engines | | |
Holdings AG | 800,000 | 32,889 |
^HCI Capital AG | 1,100,000 | 20,741 |
Rheinmetall AG | 260,000 | 18,717 |
^Schwarz Pharma AG | 150,000 | 17,546 |
^Techem AG | 227,158 | 14,513 |
* cash.life AG | 360,000 | 12,152 |
^Grenkeleasing AG | 220,000 | 9,074 |
* ^Aareal Bank AG | 200,000 | 8,532 |
IDS Scheer AG | 450,000 | 8,351 |
* C.A.T. Oil AG | 293,490 | 6,430 |
* CENTROTEC Sustainable AG | 31,604 | 929 |
| | 226,626 |
| | | | |
13
| | Market |
| | Value• |
| Shares | ($000) |
Greece (3.1%) | | |
Babis Vovos International | 800,000 | 21,330 |
Public Power Corp. | 800,000 | 20,427 |
Marfin Financial Group SA | 280,000 | 14,103 |
Hellenic Exchanges SA | 770,000 | 13,511 |
* Postal Savings Bank | 291,546 | 6,657 |
Fourlis SA | 300,000 | 5,813 |
| | 81,841 |
Hong Kong (1.2%) | | |
^Dah Sing Financial Group | 2,000,400 | 17,495 |
^ASM Pacific | | |
Technology Ltd. | 1,400,000 | 7,247 |
Hopewell Holdings Ltd. | 2,060,000 | 6,114 |
| | 30,856 |
India (0.2%) | | |
* 1 Indian Petrochemicals | | |
Corp. Ltd. Warrants | | |
Exp. 1/20/10 | 750,000 | 4,849 |
| | |
Indonesia (1.5%) | | |
PT Bank Central | | |
Asia Tbk | 47,924,500 | 24,401 |
PT Bank Rakyat | | |
Indonesia Tbk | 31,000,000 | 16,629 |
| | 41,030 |
Ireland (0.8%) | | |
DCC PLC | 750,000 | 20,292 |
| | |
Italy (5.4%) | | |
^ACEA SpA | 1,800,000 | 30,965 |
^Azimut Holding SpA | 2,300,000 | 26,005 |
Compagnie Industriali | | |
Riunite SpA | 8,000,000 | 25,142 |
^Beni Stabili SpA | 17,000,000 | 19,290 |
Italmobiliare SpA | 120,000 | 11,554 |
^Mondadori (Arnoldo) | | |
Editore SpA | 1,000,000 | 9,736 |
Italmobiliare SpA | | |
Non-Convertible Risp. | 125,000 | 9,505 |
^Ergo Previdenza SpA | 1,122,825 | 7,095 |
Autostrada | | |
Torino-Milano SpA | 200,000 | 4,248 |
| | 143,540 |
Japan (17.7%) | | |
^Nippon Sanso Corp. | 1,800,000 | 15,769 |
Obic Co., Ltd. | 70,000 | 14,819 |
Dowa Mining Co. Ltd. | 1,740,000 | 14,619 |
^Union Tool Co. | 300,000 | 13,577 |
^Tokyo Ohka | | |
Kogyo Co., Ltd. | 500,000 | 13,498 |
^Santen | | |
Pharmaceutical Co. Ltd. | 500,000 | 13,022 |
Aica Kogyo Co., Ltd. | 1,000,000 | 12,641 |
^Musashi Seimitsu | | |
Industry Co., Ltd. | 480,000 | 12,110 |
KOA Corp. | 900,000 | 11,984 |
Nichicon Corp. | 920,000 | 11,830 |
^Nipro Corp. | 650,000 | 11,619 |
Tsubaki | | |
Nakashima Co., Ltd. | 767,000 | 11,442 |
Tsuruha Holdings, Inc. | 287,000 | 11,301 |
^Kissei Pharmaceutical Co. | 640,000 | 11,174 |
^Tokyo Leasing Co., Ltd. | 789,600 | 10,367 |
^Nissan Chemical | | |
Industries, Ltd. | 780,000 | 9,983 |
NAFCO Co., Ltd. | 350,000 | 9,686 |
^Arisawa Mfg. Co., Ltd. | 800,000 | 9,623 |
^Lintec Corp. | 420,000 | 9,562 |
^Ushio Inc. | 450,000 | 9,346 |
^Circle K Sunkus Co., Ltd. | 478,000 | 9,101 |
^Enplas Corp. | 651,000 | 9,090 |
^Fullcast Co., Ltd. | 2,858 | 8,407 |
Right On Co. Ltd. | 240,000 | 8,080 |
The Tokyo Tomin Bank, Ltd. | 191,000 | 7,751 |
^OBIC Business | | |
Consultants Co., Ltd. | 100,000 | 7,503 |
^Paris Miki Inc. | 450,000 | 7,403 |
Sumida Corp. | 360,000 | 7,342 |
The Hiroshima Bank, Ltd. | 1,200,000 | 7,150 |
^TOC Co., Ltd. | 1,300,000 | 7,079 |
^Net One Systems Co., Ltd. | 4,550 | 6,938 |
Bank of Okinawa, Ltd. | 172,000 | 6,703 |
Sumitomo Forestry Co. | 595,000 | 6,522 |
Sato Corp. | 340,000 | 6,436 |
Chugoku Marine | | |
Paints, Ltd. | 993,000 | 6,213 |
^Sumisho Lease Co., Ltd. | 103,000 | 6,116 |
^Saizeriya Co., Ltd. | 450,000 | 5,883 |
Exedy Corp. | 200,000 | 5,847 |
Koito Manufacturing | | |
Co., Ltd. | 400,000 | 5,644 |
^Daido Steel Co., Ltd. | 850,000 | 5,521 |
H.I.S Co., Ltd. | 230,000 | 5,494 |
^Maeda Corp. | 1,300,000 | 5,387 |
^ARRK Corp. | 400,000 | 5,334 |
Ryosan Co., Ltd. | 208,000 | 5,296 |
Inaba Denki | | |
Sangyo Co., Ltd. | 160,000 | 4,926 |
Furukawa-Sky | | |
Aluminum Corp. | 1,041,000 | 4,907 |
^Nifco Inc. | 230,000 | 4,709 |
The Musashino Bank, Ltd. | 90,000 | 4,562 |
Nissin Healthcare | | |
Food Service Co. Ltd. | 350,000 | 4,407 |
^Belluna Co., Ltd. | 263,615 | 4,013 |
^ALPHA Corp. | 132,600 | 3,787 |
Japan Airport | | |
Terminal Co., Ltd. | 314,000 | 3,699 |
^H.S. Securities Co., Ltd. | 400,000 | 3,151 |
Kureha Chemical | | |
Industry Co. | 700,000 | 3,142 |
14
| | Market |
| | Value• |
| Shares | ($000) |
^eAccess Ltd. | 5,000 | 2,878 |
^Plenus Co. Ltd. | 115,000 | 2,874 |
Nagase & Co., Ltd. | 230,000 | 2,796 |
NEC Leasing Ltd. | 130,000 | 2,717 |
Fujikura Kasei | | |
Co., Ltd. | 250,000 | 2,469 |
^Tamura Taiko Holdings, Inc. | 700,000 | 2,257 |
AUCNET Inc. | 120,000 | 1,867 |
The Higashi-Nippon | | |
Bank, Ltd. | 450,000 | 1,851 |
Nitta Corp. | 100,000 | 1,830 |
Icom Inc. | 59,000 | 1,687 |
HARD OFF | | |
CORPORATION Co., Ltd. | 200,000 | 1,534 |
^The Minato Bank, Ltd. | 630,000 | 1,505 |
^Thine Electronics Inc. | 600 | 1,194 |
Chiyoda Co., Ltd. | 50,000 | 1,012 |
* Dowa Mining Co., Ltd. | | |
Bonus Rights Exp. | | |
1/26/10 | 2,300,000 | 965 |
^Nidec Copal Corp. | 56,700 | 699 |
Gunze Ltd. | 98,000 | 514 |
| | 472,164 |
Netherlands (2.0%) | | |
^Fugro NV | 450,000 | 19,493 |
Heijmans NV | 350,000 | 17,926 |
^Koninklijke Ten Cate NV | 400,000 | 11,344 |
^Stork NV | 46,848 | 2,318 |
Arcadis NV | 20,000 | 977 |
* Funcom NV | 193,294 | 714 |
| | 52,772 |
Singapore (1.7%) | | |
ComfortDelGro Corp. Ltd. | 15,318,000 | 16,047 |
Singapore Exchange Ltd. | 5,000,000 | 14,420 |
Sembcorp Industries Ltd. | 4,230,000 | 9,927 |
SIA Engineering Co. Ltd. | 1,865,000 | 4,486 |
| | 44,880 |
| | |
South Korea (4.4%) | | |
Samsung Corp. | 726,140 | 24,202 |
* Amorepacific Corp. | 46,643 | 24,158 |
Hite Brewery Co., Ltd. | 160,600 | 19,070 |
Kumkang Korea | | |
Chemical Co., Ltd. | 48,060 | 14,069 |
Pusan Bank | 1,096,710 | 14,065 |
Daegu Bank | 807,820 | 13,347 |
Yuhan Corp. | 55,090 | 9,253 |
| | 118,164 |
Spain (2.5%) | | |
^Red Electrica de | | |
Espana SA | 900,000 | 34,931 |
Enagas SA | 1,300,000 | 31,506 |
| | 66,437 |
Sweden (3.4%) | | |
^Transcom WorldWide SA | 2,176,015 | 22,558 |
Swedish Match AB | 1,150,000 | 18,375 |
Saab AB | 550,000 | 15,502 |
D. Carnegie & Co. AB | 792,120 | 15,108 |
Munters AB | 250,000 | 9,674 |
Oriflame Cosmetics SA | 260,000 | 9,401 |
| | 90,618 |
Switzerland (8.1%) | | |
Sika Finanz AG (Bearer) | 31,510 | 41,043 |
Geberit AG | 27,000 | 35,154 |
^Schindler Holding AG | 430,000 | 24,673 |
BKW FMB Energie AG | 250,000 | 24,194 |
Kuoni Reisen | | |
Holding AG (Registered) | 36,000 | 19,659 |
Helvetia Patria Holding AG | 60,000 | 18,963 |
Jelmoli Holding AG | 9,000 | 18,481 |
Publigroupe SA | 54,000 | 17,397 |
Bank Sarasin & Cie AG | 3,000 | 8,644 |
Mobilezone Holding AG | 1,500,000 | 8,526 |
| | 216,734 |
Taiwan (0.6%) | | |
* 1 Catcher Technology | | |
Warrants Exp. | | |
11/29/10 | 1,397,529 | 12,104 |
* 1 Basso Industry | | |
Warrants Exp. 5/3/11 | 2,795,854 | 3,177 |
| | 15,281 |
Thailand (0.4%) | | |
Bank of Ayudhya | | |
PLC (Foreign) | 22,500,000 | 11,674 |
| | |
United Kingdom (18.9%) | | |
SIG PLC | 1,300,000 | 24,723 |
Babcock International | | |
Group PLC | 3,250,000 | 23,172 |
Carillion PLC | 2,900,000 | 21,242 |
J.D. Wetherspoon PLC | 1,900,000 | 20,270 |
Inchcape PLC | 1,860,000 | 18,318 |
Findel PLC | 1,600,000 | 17,712 |
WS Atkins PLC | 950,000 | 15,814 |
Bellway PLC | 600,000 | 15,385 |
Meggitt PLC | 2,174,643 | 13,837 |
Forth Ports PLC | 380,000 | 13,276 |
Balfour Beatty PLC | 1,700,000 | 13,104 |
Quintain Estates & | | |
Development PLC | 900,000 | 12,921 |
Redrow PLC | 1,100,000 | 12,850 |
Alfred McAlpine | | |
Group PLC | 1,248,635 | 12,812 |
Speedy Hire PLC | 640,000 | 12,616 |
Headlam Group PLC | 1,200,000 | 12,411 |
* Premier Oil PLC | 481,503 | 11,788 |
Wilson Bowden PLC | 340,000 | 11,299 |
Close Brothers Group PLC | 600,000 | 11,082 |
15
| | | Market |
| | | Value• |
| | Shares | ($000) |
| Whatman PLC | 2,001,504 | 11,059 |
| The Go-Ahead Group PLC | 280,000 | 10,735 |
| Domestic & General | | |
| Group PLC | 555,000 | 10,298 |
| Shaftesbury PLC | 850,000 | 10,160 |
| ICAP PLC | 1,000,000 | 9,683 |
| John Laing PLC | 1,230,706 | 9,269 |
| National Express | | |
| Group PLC | 500,000 | 9,269 |
| London Merchant | | |
| Securities PLC | 1,700,000 | 9,059 |
| Paragon Group Cos. PLC | 700,000 | 8,955 |
| Chrysalis Group PLC | 3,460,000 | 8,930 |
| William Hill PLC | 700,000 | 8,672 |
| First Choice Holidays PLC | 1,800,000 | 7,730 |
| Ultra Electronics | | |
| Holdings PLC | 350,000 | 7,448 |
* | CSR PLC | 450,000 | 6,495 |
* | Imperial Energy Corp. PLC | 491,848 | 6,366 |
* | I-Mate PLC | 1,900,000 | 5,921 |
| Nestor Healthcare | | |
| Group PLC | 2,349,235 | 5,811 |
| Intermediate Capital | | |
| Group PLC | 200,000 | 5,570 |
| BPP Holdings PLC | 600,000 | 5,431 |
| John Wood Group PLC | 1,200,000 | 5,377 |
| Alexon Group PLC | 1,900,000 | 5,356 |
| Stagecoach Group PLC | 2,000,000 | 5,300 |
| Lawrence PLC | 900,000 | 5,087 |
| Goldshield Group PLC | 1,025,601 | 4,849 |
* | AEA Technology PLC | 2,559,950 | 4,724 |
| The Future Network PLC | 7,200,000 | 4,657 |
| Enterprise PLC | 525,000 | 4,616 |
* | Leo Capital PLC | 2,649,831 | 3,765 |
| RM PLC | 1,000,000 | 3,239 |
| Devro PLC | 1,400,947 | 3,221 |
| Liontrust Asset | | |
| Management PLC | 428,549 | 2,875 |
* | Pinnacle Staffing Group PLC | 1,349,235 | 253 |
| Grainger Trust PLC | 33,000 | 408 |
| | | 505,220 |
Total Common Stocks | | |
(Cost $1,812,227) | | 2,577,521 |
Temporary Cash Investments (11.7%) | |
2 Vanguard Market | | |
Liquidity Fund, 5.289% | 86,274,765 | 86,275 |
2 Vanguard Market | | |
Liquidity Fund, | | |
5.289%—Note G | 225,347,550 | 225,348 |
Total Temporary Cash Investments | |
(Cost $311,623) | | 311,623 |
Total Investments (108.3%) | | |
| | | | |
(Cost $2,123,850) | | 2,889,144 |
Other Assets and Liabilities (–8.3%) | |
Other Assets—Note C | | 28,126 |
Security Lending Collateral | | |
Payable to Brokers—Note G | (225,348) |
Other Liabilities | | (23,772) |
| | (220,994) |
Net Assets (100%) | | |
Applicable to 124,126,546 outstanding $.001 |
par value shares of beneficial interest | |
(unlimited authorization) | | 2,668,150 |
Net Asset Value Per Share | | $21.50 |
| | |
| | |
| | |
At October 31, 2006, net assets consisted of:3 |
| Amount | Per |
| ($000) | Share |
Paid-in Capital | 1,648,756 | $13.28 |
Undistributed Net | | |
Investment Income | 49,835 | .40 |
Accumulated Net | | |
Realized Gains | 204,269 | 1.65 |
Unrealized Appreciation | | |
(Depreciation) | | |
Investment Securities | 765,294 | 6.17 |
Foreign Currencies | (4) | — |
Net Assets | 2,668,150 | $21.50 |
• See Note A in Notes to Financial Statements.
* Non-income-producing security.
^ Part of security position is on loan to broker-dealers. See Note G in Notes to Financial Statements.
1 Security exempt from registration under Rule 144A of the Securities Act of 1933. Such securities may be sold in transactions exempt from registration, normally to qualified institutional buyers. At October 31, 2006, the aggregate value of these securities was $20,130,000, representing 0.8% of net assets.
2 Affiliated money market fund available only to Vanguard funds and certain trusts and accounts managed by Vanguard. Rate shown is the 7-day yield.
3 See Note E in Notes to Financial Statements for the tax-basis components of net assets.
16
Statement of Operations
| Year Ended |
| October 31, 2006 |
| ($000) |
Investment Income | |
Income | |
Dividends1 | 69,879 |
Interest2 | 2,796 |
Security Lending | 2,041 |
Total Income | 74,716 |
Expenses | |
Investment Advisory Fees—Note B | |
Basic Fee | 4,899 |
Performance Adjustment | 614 |
The Vanguard Group—Note C | |
Management and Administrative | 3,909 |
Marketing and Distribution | 476 |
Custodian Fees | 1,030 |
Auditing Fees | 26 |
Shareholders’ Reports | 39 |
Trustees’ Fees and Expenses | 2 |
Total Expenses | 10,995 |
Expenses Paid Indirectly—Note D | (169) |
Net Expenses | 10,826 |
Net Investment Income | 63,890 |
Realized Net Gain (Loss) | |
Investment Securities Sold | 223,022 |
Foreign Currencies | 227 |
Realized Net Gain (Loss) | 223,249 |
Change in Unrealized Appreciation (Depreciation) | |
Investment Securities | 360,272 |
Foreign Currencies | 92 |
Change in Unrealized Appreciation (Depreciation) | 360,364 |
Net Increase (Decrease) in Net Assets Resulting from Operations | 647,503 |
1 Dividends are net of foreign withholding taxes of $3,241,000.
2 Interest income from an affiliated company of the fund was $2,796,000.
17
Statement of Changes in Net Assets
| Year Ended October 31, |
| 2006 | 2005 |
| ($000) | ($000) |
Increase (Decrease) in Net Assets | | |
Operations | | |
Net Investment Income | 63,890 | 43,159 |
Realized Net Gain (Loss) | 223,249 | 167,169 |
Change in Unrealized Appreciation (Depreciation) | 360,364 | 228,403 |
Net Increase (Decrease) in Net Assets Resulting from Operations | 647,503 | 438,731 |
Distributions | | |
Net Investment Income | (46,929) | (26,364) |
Realized Capital Gain1 | (158,384) | (31,856) |
Total Distributions | (205,313) | (58,220) |
Capital Share Transactions—Note H | | |
Issued | 274,427 | 350,261 |
Issued in Lieu of Cash Distributions | 181,737 | 51,862 |
Redeemed2 | (360,598) | (229,461) |
Net Increase (Decrease) from Capital Share Transactions | 95,566 | 172,662 |
Total Increase (Decrease) | 537,756 | 553,173 |
Net Assets | | |
Beginning of Period | 2,130,394 | 1,577,221 |
End of Period3 | 2,668,150 | 2,130,394 |
1 Includes fiscal 2006 and 2005 short-term gain distributions totaling $45,755,000 and $20,871,000, respectively. Short-term gain distributions are treated as ordinary income dividends for tax purposes.
2 Net of redemption fees of $96,000 and $28,000.
3 Net Assets—End of Period includes undistributed net investment income of $49,835,000 and $35,697,000.
18
Financial Highlights
| Year Ended October 31, |
For a Share Outstanding Throughout Each Period | 2006 | 2005 | 2004 | 2003 | 20021 |
Net Asset Value, Beginning of Period | $17.99 | $14.64 | $11.89 | $8.11 | $9.07 |
Investment Operations | | | | | |
Net Investment Income | .52 | .37 | .2732 | .142 | .08 |
Net Realized and Unrealized Gain | | | | | |
(Loss) on Investments | 4.74 | 3.51 | 2.544 | 3.70 | (.90) |
Total from Investment Operations | 5.26 | 3.88 | 2.817 | 3.84 | (.82) |
Distributions | | | | | |
Dividends from Net Investment Income | (.40) | (.24) | (.067) | (.06) | (.14) |
Distributions from Realized Capital Gains | (1.35) | (.29) | — | — | — |
Total Distributions | (1.75) | (.53) | (.067) | (.06) | (.14) |
Net Asset Value, End of Period | $21.50 | $17.99 | $14.64 | $11.89 | $8.11 |
| | | | | |
Total Return3 | 31.31% | 27.04% | 23.79% | 47.70% | –9.24% |
| | | | | |
Ratios/Supplemental Data | | | | | |
Net Assets, End of Period (Millions) | $2,668 | $2,130 | $1,577 | $420 | $96 |
Ratio of Expenses to Average Net Assets4 | 0.44% | 0.50% | 0.57% | 0.73% | 1.04%5 |
Ratio of Net Investment Income | | | | | |
to Average Net Assets | 2.56% | 2.17% | 1.96% | 1.52% | 1.13% |
Portfolio Turnover Rate | 32% | 38% | 21% | 60% | 40% |
1 Schroder International Smaller Companies Fund reorganized into Vanguard International Explorer Fund effective June 29, 2002.
2 Calculated based on average shares outstanding.
3 Total returns do not reflect the 2% fee assessed on redemptions of shares purchased on or after June 27, 2003, and held for less than two months.
4 Includes performance-based investment advisory fee increases (decreases) of 0.02% for 2006, 0.02% for 2005, 0.00% for 2004, and 0.00% for 2003.
5 The expense ratio before waivers and reimbursements of expenses was 1.55% for 2002.
19
Notes to Financial Statements
Vanguard International Explorer Fund is registered under the Investment Company Act of 1940 as an open-end investment company, or mutual fund. The fund files reports with the SEC under the company name Vanguard Whitehall Funds. The fund invests in securities of foreign issuers, which may subject it to investment risks not normally associated with investing in securities of United States corporations.
A. The following significant accounting policies conform to generally accepted accounting principles for U.S. mutual funds. The fund consistently follows such policies in preparing its financial statements.
1. Security Valuation: Securities are valued as of the close of trading on the New York Stock Exchange (generally 4:00 p.m. Eastern time) on the valuation date. Equity securities are valued at the latest quoted sales prices or official closing prices taken from the primary market in which each security trades; such securities not traded on the valuation date are valued at the mean of the latest quoted bid and asked prices. Securities for which market quotations are not readily available, or whose values have been affected by events occurring before the fund’s pricing time but after the close of the securities’ primary markets, are valued at their fair values calculated according to procedures adopted by the board of trustees. These procedures include obtaining quotations from an independent pricing service, monitoring news to identify significant market- or security-specific events, and evaluating changes in the values of foreign market proxies (for example, ADRs, futures contracts, or exchange-traded funds) between the time the foreign markets close and the fund’s pricing time. When fair-value pricing is employed, the prices of securities used by a fund to calculate its net asset value may differ from quoted or published prices for the same securities. Investments in Vanguard Market Liquidity Fund are valued at that fund’s net asset value.
2. Foreign Currency: Securities and other assets and liabilities denominated in foreign currencies are translated into U.S. dollars at the exchange rates on the valuation date as employed by Morgan Stanley Capital International (MSCI) in the calculation of its indexes. As part of the fund’s fair-value procedures, exchange rates may be adjusted if they change significantly before the fund’s pricing time but after the time at which the MSCI rates are determined (generally 11:00 a.m. Eastern time).
Realized gains (losses) and unrealized appreciation (depreciation) on investment securities include the effects of changes in exchange rates since the securities were purchased, combined with the effects of changes in security prices. Fluctuations in the value of other assets and liabilities resulting from changes in exchange rates are recorded as unrealized foreign currency gains (losses) until the asset or liability is settled in cash, when they are recorded as realized foreign currency gains (losses).
3. Federal Income Taxes: The fund intends to continue to qualify as a regulated investment company and distribute all of its taxable income. Accordingly, no provision for federal income taxes is required in the financial statements.
4. Distributions: Distributions to shareholders are recorded on the ex-dividend date.
5. Security Lending: The fund may lend its securities to qualified institutional borrowers to earn additional income. Security loans are required to be secured at all times by collateral at least equal to the market value of securities loaned. The fund invests cash collateral received in Vanguard Market Liquidity Fund, and records a liability for the return of the collateral, during the period the securities are on loan. Security lending income represents the income earned on investing cash collateral, less expenses associated with the loan.
20
6. Other: Dividend income is recorded on the ex-dividend date. Interest income includes income distributions received from Vanguard Market Liquidity Fund and is accrued daily. Security transactions are accounted for on the date securities are bought or sold. Costs used to determine realized gains (losses) on the sale of investment securities are those of the specific securities sold. Fees assessed on redemptions of capital shares are credited to paid-in capital.
B. Schroder Investment Management North America Inc. provides investment advisory services to the fund for a fee calculated at an annual percentage rate of average net assets. The basic fee is subject to quarterly adjustments based on the fund’s performance for the preceding three years, relative to the S&P/Citigroup Extended Market Europe & Pacific Index. For the year ended October 31, 2006, the investment advisory fee represented an effective annual basic rate of 0.20% of the fund’s average net assets, before an increase of $614,000 (0.02%) based on performance.
C. The Vanguard Group furnishes at cost corporate management, administrative, marketing, and distribution services. The costs of such services are allocated to the fund under methods approved by the board of trustees. The fund has committed to provide up to 0.40% of its net assets in capital contributions to Vanguard. At October 31, 2006, the fund had contributed capital of $268,000 to Vanguard (included in Other Assets), representing 0.01% of the fund’s net assets and 0.27% of Vanguard’s capitalization. The fund’s trustees and officers are also directors and officers of Vanguard.
D. The fund has asked its investment advisor to direct certain security trades, subject to obtaining the best price and execution, to brokers who have agreed to rebate to the fund part of the commissions generated. Such rebates are used solely to reduce the fund’s management and administrative expenses. For the year ended October 31, 2006, these arrangements reduced the fund’s expenses by $169,000 (an annual rate of 0.01% of average net assets).
E. Distributions are determined on a tax basis and may differ from net investment income and realized capital gains for financial reporting purposes. Differences may be permanent or temporary. Permanent differences are reclassified among capital accounts in the financial statements to reflect their tax character. Temporary differences arise when certain items of income, expense, gain, or loss are recognized in different periods for financial statement and tax purposes; these differences will reverse at some time in the future. Differences in classification may also result from the treatment of short-term gains as ordinary income for tax purposes.
During the year ended October 31, 2006, the fund realized net foreign currency gains of $227,000, which increased distributable net income for tax purposes; accordingly, such gains have been reclassified from accumulated net realized gains to undistributed net investment income. Certain of the fund’s investments are in securities considered to be “passive foreign investment companies,” for which any unrealized appreciation and/or realized gains are required to be included in distributable net income for tax purposes. During the year ended October 31, 2006, the fund realized gains on sales of “passive foreign investment companies” of $2,430,000, which have been included in current and prior periods’ taxable income; accordingly such gains have been reclassified from accumulated net realized gains to undistributed net investment income. Unrealized appreciation on the fund’s passive foreign investment company holdings at October 31, 2006, was $17,388,000, of which $8,647,000 has been distributed and is reflected in the balance of undistributed net investment income.
21
The fund used a tax accounting practice to treat a portion of the price of capital shares redeemed during the year as distributions from net investment income and realized capital gains. Accordingly, the fund has reclassified $5,480,000 from undistributed net investment income, and $15,879,000 from accumulated net realized gains, to paid-in capital.
For tax purposes, at October 31, 2006, the fund had $72,290,000 of ordinary income and $201,290,000 of long-term capital gains available for distribution.
At October 31, 2006, the cost of investment securities for tax purposes was $2,141,238,000. Net unrealized appreciation of investment securities for tax purposes was $747,906,000, consisting of unrealized gains of $830,305,000 on securities that had risen in value since their purchase and $82,399,000 in unrealized losses on securities that had fallen in value since their purchase.
F. During the year ended October 31, 2006, the fund purchased $789,940,000 of investment securities and sold $907,121,000 of investment securities other than temporary cash investments.
G. The market value of securities on loan to broker-dealers at October 31, 2006, was $214,688,000, for which the fund received cash collateral of $225,348,000.
H. Capital shares issued and redeemed were:
| Year Ended October 31, |
| 2006 | 2005 |
| Shares | Shares |
| (000) | (000) |
Issued | 13,898 | 20,996 |
Issued in Lieu of Cash Distributions | 10,250 | 3,314 |
Redeemed | (18,420) | (13,608) |
Net Increase (Decrease) in Shares Outstanding | 5,728 | 10,702 |
I. In June 2006, the Financial Accounting Standards Board issued Interpretation No. 48 (“FIN 48”), “Accounting for Uncertainty in Income Taxes.” FIN 48 establishes the minimum threshold for recognizing, and a system for measuring, the benefits of tax-return positions in financial statements. FIN 48 will be effective for the fund’s fiscal year beginning November 1, 2007. Management is in the process of analyzing the fund’s tax positions for purposes of implementing FIN 48; based on the analysis completed to date, management does not believe the adoption of FIN 48 will result in any material impact to the fund’s financial statements.
22
Report of Independent Registered
Public Accounting Firm
To the Trustees of Vanguard Whitehall Funds and the Shareholders of Vanguard International Explorer Fund:
In our opinion, the accompanying statement of net assets and the related statements of operations and of changes in net assets and the financial highlights present fairly, in all material respects, the financial position of Vanguard International Explorer Fund (the “Fund”) at October 31, 2006, the results of its operations for the year then ended, the changes in its net assets for each of the two years in the period then ended and the financial highlights for each of the five years in the period then ended, in conformity with accounting principles generally accepted in the United States of America. These financial statements and financial highlights (hereafter referred to as “financial statements”) are the responsibility of the Fund’s management; our responsibility is to express an opinion on these financial statements based on our audits. We conducted our audits of these financial statements in accordance with the standards of the Public Company Accounting Oversight Board (United States). Those standards require that we plan and perform the audit to obtain reasonable assurance about whether the financial statements are free of material misstatement. An audit includes examining, on a test basis, evidence supporting the amounts and disclosures in the financial statements, assessing the accounting principles used and significant estimates made by management, and evaluating the overall financial statement presentation. We believe that our audits, which included confirmation of securities at October 31, 2006 by correspondence with the custodian and broker, and by agreement to the underlying ownership records for Vanguard Market Liquidity Fund, provide a reasonable basis for our opinion.
PricewaterhouseCoopers LLP Philadelphia, Pennsylvania
December 18, 2006
Special 2006 tax information (unaudited) for Vanguard International Explorer Fund
This information for the fiscal year ended October 31, 2006, is included pursuant to provisions of the Internal Revenue Code.
The fund distributed $128,281,000 as capital gain dividends (from net long-term capital gains) to shareholders during the fiscal year.
The fund distributed $32,939,000 of qualified dividend income to shareholders during the fiscal year.
The fund will pass through to shareholders foreign source income of $73,120,000 and foreign taxes paid of $3,241,000. The pass-through of foreign taxes paid will affect only shareholders on the dividend record date in December 2006. Shareholders will receive more detailed information along with their Form 1099-DIV in January 2007.
23
Your Fund’s After-Tax Returns
This table presents returns for your fund both before and after taxes. The after-tax returns are shown in two ways: (1) assuming that an investor owned the fund during the entire period and paid taxes on the fund’s distributions, and (2) assuming that an investor paid taxes on the fund’s distributions and sold all shares at the end of each period.
Calculations are based on the highest individual federal income tax and capital gains tax rates in effect at the times of the distributions and the hypothetical sales. State and local taxes were not considered. After-tax returns reflect any qualified dividend income, using actual prior-year figures and estimates for 2006. (In the example, returns after the sale of fund shares may be higher than those assuming no sale. This occurs when the sale would have produced a capital loss. The calculation assumes that the investor received a tax deduction for the loss.)
Please note that your actual after-tax returns will depend on your tax situation and may differ from those shown. Also note that if you own the fund in a tax-deferred account, such as an individual retirement account or a 401(k) plan, this information does not apply to you. Such accounts are not subject to current taxes.
Finally, keep in mind that a fund’s performance—whether before or after taxes—does not guarantee future results.
Average Annual Total Returns: International Explorer Fund1 |
Periods Ended October 31, 2006 | | | |
| One | Five | Since |
| Year | Years | Inception2 |
Returns Before Taxes | 31.31% | 22.59% | 14.82% |
Returns After Taxes on Distributions | 28.85 | 21.72 | 12.67 |
Returns After Taxes on Distributions and Sale of Fund Shares | 21.45 | 19.61 | 11.80 |
1 Total returns do not reflect the 2% fee assessed on redemptions of shares purchased on or after June 27, 2003, and held for less than two months.
2 November 4, 1996.
24
About Your Fund’s Expenses
As a shareholder of the fund, you incur ongoing costs, which include costs for portfolio management, administrative services, and shareholder reports (like this one), among others. Operating expenses, which are deducted from a fund’s gross income, directly reduce the investment return of the fund.
A fund’s expenses are expressed as a percentage of its average net assets. This figure is known as the expense ratio. The following examples are intended to help you understand the ongoing costs (in dollars) of investing in your fund and to compare these costs with those of other mutual funds. The examples are based on an investment of $1,000 made at the beginning of the period shown and held for the entire period.
The table below illustrates your fund’s costs in two ways:
• Based on actual fund return. This section helps you to estimate the actual expenses that you paid over the period. The “Ending Account Value” shown is derived from the fund’s actual return, and the third column shows the dollar amount that would have been paid by an investor who started with $1,000 in the fund. You may use the information here, together with the amount you invested, to estimate the expenses that you paid over the period.
To do so, simply divide your account value by $1,000 (for example, an $8,600 account value divided by $1,000 = 8.6), then multiply the result by the number given for your fund under the heading “Expenses Paid During Period.”
• Based on hypothetical 5% yearly return. This section is intended to help you compare your fund’s costs with those of other mutual funds. It assumes that the fund had a yearly return of 5% before expenses, but that the expense ratio is unchanged. In this case—because the return used is not the fund’s actual return—the results do not apply to your investment. The example is useful in making comparisons because the Securities and Exchange Commission requires all mutual funds to calculate expenses based on a 5% return. You can assess your fund’s costs by comparing this hypothetical example with the hypothetical examples that appear in shareholder reports of other funds.
Six Months Ended October 31, 2006 | | | |
| Beginning | Ending | Expenses |
| Account Value | Account Value | Paid During |
International Explorer Fund | 4/30/2006 | 10/31/2006 | Period1 |
Based on Actual Fund Return | $1,000.00 | $1,000.00 | $1.92 |
Based on Hypothetical 5% Yearly Return | 1,000.00 | 1,023.29 | 1.94 |
1 These calculations are based on expenses incurred in the most recent six-month period. The fund’s annualized six-month expense ratio for that period is 0.38%. The dollar amounts shown as “Expenses Paid” are equal to the annualized expense ratio multiplied by the average account value over the period, multiplied by the number of days in the most recent six-month period, then divided by the number of days in the most recent 12-month period.
25
Note that the expenses shown in the table are meant to highlight and help you compare ongoing costs only; they do not include your fund’s low-balance fee or the 2% redemption fee that applies to shares held for less than two months. These fees are fully described in the prospectus. If the fees were applied to your account, your costs would be higher. Your fund does not carry a “sales load.”
The calculations assume no shares were bought or sold during the period. Your actual costs may have been higher or lower, depending on the amount of your investment and the timing of any purchases or redemptions.
You can find more information about the fund’s expenses, including annual expense ratios for the past five years, in the Financial Statements section of this report. For additional information on operating expenses and other shareholder costs, please refer to the appropriate fund prospectus.
26
Trustees Approve Advisory Agreement
The board of trustees of Vanguard International Explorer Fund has renewed the fund’s investment advisory agreement with Schroder Investment Management North America Inc. and a sub-advisory agreement with Schroder Investment Management North America Limited. The board determined that the retention of the advisor and the sub-advisor (“Schroder”) was in the best interests of the fund and its shareholders.
The board based its decision upon an evaluation of Schroder’s investment staff, portfolio management process, and performance. The trustees considered the factors discussed below, among others. However, no single factor determined whether the board approved the agreement. Rather, it was the totality of the circumstances that drove the board’s decision.
Nature, extent, and quality of services
The board considered the quality of the fund’s investment management over both short- and long-term periods and took into account Schroder’s organizational depth and stability. The board noted that Schroder has a long history as a successful investment manager. Schroder’s parent company has existed for more than 200 years and has investment-management experience dating back to 1926. The fund is managed by an experienced five-member team—the Schroder International Smallcap Investment Committee—led, since 2000, by Matthew Dobbs. Mr. Dobbs has been with Schroder since 1981.
The board concluded that Schroder’s experience, stability, depth, and performance, among other factors, warranted continuation of the advisory and sub-advisory agreements.
Investment performance
The board considered the short- and long-term performance of the fund, including any periods of outperformance or underperformance of a relevant benchmark and peer group. The board concluded that Schroder has carried out the fund’s investment strategy in disciplined fashion. The board noted that the growth-oriented International Explorer Fund has outperformed its more blended benchmark, the S&P/Citigroup EM EPAC Index, over the last one- and three-year periods. Although the fund’s short-term performance has lagged the average return for its international small-cap fund peers (as defined by Lipper), the fund’s longer-term performance has been competitive versus the peer-group average. Information about the fund’s most recent performance can be found in the Performance Summary section of this report.
Cost
The board noted that the fund’s advisory fee was well below the peer-group average and that the fund’s expense ratio was below the average expense ratio charged by funds in its peer group. Information about the fund’s expense ratio appears in the About Your Fund’s Expenses section of this report as well as in the Financial Statements section, which also includes information about the advisory fee rate. The board did not consider profitability of Schroder in determining whether to approve the advisory fee, because Schroder is independent of Vanguard, and the advisory fee is the result of arm’s-length negotiations.
27
The benefit of economies of scale
The board concluded that the fund’s shareholders benefit from economies of scale because of breakpoints in the fund’s advisory fee schedule. The breakpoints reduce the effective rate of the fee as the fund’s assets increase.
The board also approved a change to the process for the quarterly calculation of Schroder’s asset-based advisory fee. The calculation now will be based on the average daily net assets of the fund rather than the average month-end net assets.
The advisory and sub-advisory agreements will continue for one year and are renewable by the fund’s board for successive one-year periods.
28
Glossary
Beta. A measure of the magnitude of a fund’s past share-price fluctuations in relation to the ups and downs of a given market index. The index is assigned a beta of 1.00. Compared with a given index, a fund with a beta of 1.20 typically would have seen its share price rise or fall by 12% when the index rose or fell by 10%. A fund’s beta should be reviewed in conjunction with its R-squared (see definition below). The lower the R-squared, the less correlation there is between the fund and the index, and the less reliable beta is as an indicator of volatility.
Expense Ratio. The percentage of a fund��s average net assets used to pay its annual administrative and advisory expenses. These expenses directly reduce returns to investors.
R-Squared. A measure of how much of a fund’s past returns can be explained by the returns from the market in general, as measured by a given index. If a fund’s total returns were precisely synchronized with an index’s returns, its R-squared would be 1.00. If the fund’s returns bore no relationship to the index’s returns, its R-squared would be 0.
Short-Term Reserves. The percentage of a fund invested in highly liquid, short-term securities that can be readily converted to cash.
Turnover Rate. An indication of the fund’s trading activity. Funds with high turnover rates incur higher transaction costs and may be more likely to distribute capital gains (which may be taxable to investors). The turnover rate excludes in-kind transactions, which have minimal impact on costs.
29
This page intentionally left blank.
This page intentionally left blank.
The People Who Govern Your Fund
The trustees of your mutual fund are there to see that the fund is operated and managed in your best interests since, as a shareholder, you are a part owner of the fund. Your fund’s trustees also serve on the board of directors of The Vanguard Group, Inc., which is owned by the Vanguard funds and provides services to them on an at-cost basis.
A majority of Vanguard’s board members are independent, meaning that they have no affiliation with Vanguard or the funds they oversee, apart from the sizable personal investments they have made as private individuals.
Our independent board members bring distinguished backgrounds in business, academia, and public service to their task of working with Vanguard officers to establish the policies and oversee the activities of the funds. Among board members’ responsibilities are selecting investment advisors for the funds; monitoring fund operations, performance, and costs; reviewing contracts; nominating and selecting new trustees/directors; and electing Vanguard officers.
Each trustee serves a fund until its termination; or until the trustee’s retirement, resignation, or death; or otherwise as specified in the fund’s organizational documents. Any trustee may be removed at a shareholders’ meeting by a vote representing two-thirds of the net asset value of all shares of the fund together with shares of other Vanguard funds organized within the same trust. The table on these two pages shows information for each trustee and executive officer of the fund. The mailing address of the trustees and officers is P.O. Box 876, Valley Forge, PA 19482.
Chairman of the Board, Chief Executive Officer, and Trustee |
| |
John J. Brennan1 | |
Born 1954 | Principal Occupation(s) During the Past Five Years: Chairman of the Board, Chief Executive |
Trustee since May 1987; | Officer, and Director/Trustee of The Vanguard Group, Inc., and of each of the investment |
Chairman of the Board and | companies served by The Vanguard Group. |
Chief Executive Officer | |
144 Vanguard Funds Overseen | |
| |
Independent Trustees | |
| |
Charles D. Ellis | |
Born 1937 | Principal Occupation(s) During the Past Five Years: Applecore Partners (pro bono ventures |
Trustee since January 2001 | in education); Senior Advisor to Greenwich Associates (international business strategy |
144 Vanguard Funds Overseen | consulting); Successor Trustee of Yale University; Overseer of the Stern School of Business |
| at New York University; Trustee of the Whitehead Institute for Biomedical Research. |
| |
Rajiv L. Gupta | |
Born 1945 | Principal Occupation(s) During the Past Five Years: Chairman and Chief Executive Officer |
Trustee since December 20012 | of Rohm and Haas Co. (chemicals); Board Member of the American Chemistry Council; |
144 Vanguard Funds Overseen | Director of Tyco International, Ltd. (diversified manufacturing and services) since 2005; |
| Trustee of Drexel University and of the Chemical Heritage Foundation. |
| |
Amy Gutmann | |
Born 1949 | Principal Occupation(s) During the Past Five Years: President of the University of |
Trustee since June 2006 | Pennsylvania since 2004; Professor in the School of Arts and Sciences, Annenberg School |
144 Vanguard Funds Overseen | for Communication, and Graduate School of Education of the University of Pennsylvania |
| since 2004; Provost (2001–2004) and Laurance S. Rockefeller Professor of Politics and the |
| University Center for Human Values (1990–2004), Princeton University; Director of Carnegie |
| Corporation of New York since 2005 and of Schuylkill River Development Corporation and |
| Greater Philadelphia Chamber of Commerce since 2004. |
JoAnn Heffernan Heisen | |
Born 1950 | Principal Occupation(s) During the Past Five Years: Corporate Vice President and Chief |
Trustee since July 1998 | Global Diversity Officer since 2006, Vice President and Chief Information Officer |
144 Vanguard Funds Overseen | (1997–2005), and Member of the Executive Committee of Johnson & Johnson |
| (pharmaceuticals/consumer products); Director of the University Medical Center |
| at Princeton and Women’s Research and Education Institute. |
| |
André F. Perold | |
Born 1952 | Principal Occupation(s) During the Past Five Years: George Gund Professor of Finance |
Trustee since December 2004 | and Banking, Harvard Business School; Senior Associate Dean, Director of Faculty |
144 Vanguard Funds Overseen | Recruiting, and Chair of Finance Faculty, Harvard Business School; Director and Chairman |
| of UNX, Inc. (equities trading firm) since 2003; Chair of the Investment Committee of |
| HighVista Strategies LLC (private investment firm) since 2005; Director of registered |
| investment companies advised by Merrill Lynch Investment Managers and affiliates |
| (1985–2004), Genbel Securities Limited (South African financial services firm) |
| (1999–2003), Gensec Bank (1999–2003), Sanlam, Ltd. (South African insurance |
| company) (2001–2003), and Stockback, Inc. (credit card firm) (2000–2002). |
| |
Alfred M. Rankin, Jr. | |
Born 1941 | Principal Occupation(s) During the Past Five Years: Chairman, President, Chief Executive |
Trustee since January 1993 | Officer, and Director of NACCO Industries, Inc. (forklift trucks/housewares/lignite); Director |
144 Vanguard Funds Overseen | of Goodrich Corporation (industrial products/aircraft systems and services). |
| |
J. Lawrence Wilson | |
Born 1936 | Principal Occupation(s) During the Past Five Years: Retired Chairman and Chief Executive |
Trustee since April 1985 | Officer of Rohm and Haas Co. (chemicals); Director of Cummins Inc. (diesel engines), |
144 Vanguard Funds Overseen | MeadWestvaco Corp. (packaging products), and AmerisourceBergen Corp. (pharmaceutical |
| distribution); Trustee of Vanderbilt University and of Culver Educational Foundation. |
| |
Executive Officers1 | |
| |
Heidi Stam | |
Born 1956 | Principal Occupation(s) During the Past Five Years: Managing Director since 2006, |
Secretary since July 2005 | General Counsel since 2005, and Secretary of The Vanguard Group, Inc., and of each |
144 Vanguard Funds Overseen | of the investment companies served by The Vanguard Group since 2005; Principal of |
| The Vanguard Group (1997–2006). |
| |
Thomas J. Higgins | |
Born 1957 | Principal Occupation(s) During the Past Five Years: Principal of The Vanguard Group, Inc.; |
Treasurer since July 1998 | Treasurer of each of the investment companies served by The Vanguard Group. |
144 Vanguard Funds Overseen | |
Vanguard Senior Management Team | | |
| | |
R. Gregory Barton | Kathleen C. Gubanich | Michael S. Miller |
Mortimer J. Buckley | Paul A. Heller | Ralph K. Packard |
James H. Gately | F. William McNabb, III | George U. Sauter |
| | |
Founder | | |
| | |
John C. Bogle | | |
Chairman and Chief Executive Officer, 1974–1996 | |
1 Officers of the funds are “interested persons” as defined in the Investment Company Act of 1940.
2 December 2002 for Vanguard Equity Income Fund, Vanguard Growth Equity Fund, the Vanguard Municipal Bond Funds, and the Vanguard State Tax-Exempt Funds.
More information about the trustees is in the Statement of Additional Information, available from The Vanguard Group.
| | |
|
| | | P.O. Box 2600 |
| | | Valley Forge, PA 19482-2600 |
| | | |
| | | |
| | | |
| | | |
| | | |
| | | |
| | | |
Connect with Vanguard™ > www.vanguard.com |
| | | |
| | | |
| | | |
Fund Information > 800-662-7447 | | Vanguard, Explorer, Connect with Vanguard, and the ship |
| | | logo are trademarks of The Vanguard Group, Inc. |
Direct Investor Account Services > 800-662-2739 |
| | | All other marks are the exclusive property of their |
Institutional Investor Services > 800-523-1036 | | respective owners. |
|
Text Telephone > 800-952-3335 | | |
| | | |
| | | |
This material may be used in conjunction | |
with the offering of shares of any Vanguard |
fund only if preceded or accompanied by |
the fund’s current prospectus. |
| | All comparative mutual fund data are from Lipper Inc. |
| | or Morningstar, Inc., unless otherwise noted. |
| | You can obtain a free copy of Vanguard’s proxy voting |
| guidelines by visiting our website, www.vanguard.com, |
| | | and searching for “proxy voting guidelines,” or by calling |
| Vanguard at 800-662-2739. They are also available from |
| the SEC’s website, www.sec.gov. In addition, you may |
| | | obtain a free report on how your fund voted the proxies for |
| | | securities it owned during the 12 months ended June 30. |
| | | To get the report, visit either www.vanguard.com |
| | | or www.sec.gov. |
| | | |
| | | You can review and copy information about your fund |
| | | at the SEC’s Public Reference Room in Washington, D.C. |
| | | To find out more about this public service, call the SEC |
| | | at 202-551-8090. Information about your fund is also |
| | | available on the SEC’s website, and you can receive |
| | | copies of this information, for a fee, by sending a |
| | | request in either of two ways: via e-mail addressed to |
| | | publicinfo@sec.gov or via regular mail addressed to the |
| | | Public Reference Section, Securities and Exchange |
| | | Commission, Washington, DC 20549-0102. |
| | | |
| | | |
| | | |
| | | |
| | | © 2006 The Vanguard Group, Inc. |
| | | All rights reserved. |
| | | Vanguard Marketing Corporation, Distributor. |
| | | |
| | | Q1260 122006 |
Item 2: Code of Ethics. The Registrant has adopted a code of ethics that applies to the Registrant's principal executive officer, principal financial officer, principal accounting officer or controller or persons performing similar functions. The Code of Ethics was amended during the reporting period covered by this report to make certain technical, non-material changes.
Item 3: Audit Committee Financial Expert. The following members of the Audit Committee have been determined by the Registrant’s Board of Trustees to be Audit Committee Financial Experts serving on its Audit Committee, and to be independent: Charles D. Ellis, Rajiv L. Gupta, JoAnn Heffernan Heisen, André F. Perold, Alfred M. Rankin, Jr., and J. Lawrence Wilson.
Item 4: Principal Accountant Fees and Services.
(a) Audit Fees.
Audit Fees of the Registrant
Fiscal Year Ended October 31, 2006: $71,000
Fiscal Year Ended October 31, 2005: $55,000
Aggregate Audit Fees of Registered Investment Companies in the Vanguard Group
Fiscal Year Ended October 31, 2006: $2,347,620
Fiscal Year Ended October 31, 2005: $2,152,740
(b) Audit-Related Fees.
Fiscal Year Ended October 31, 2006: $530,000
Fiscal Year Ended October 31, 2005: $382,200
Includes fees billed in connection with assurance and related services provided to the Registrant, The Vanguard Group, Inc., Vanguard Marketing Corporation, and other registered investment companies in the Vanguard Group.
(c) Tax Fees.
Fiscal Year Ended October 31, 2006: $101,300
Fiscal Year Ended October 31, 2005: $98,400
Includes fees billed in connection with tax compliance, planning and advice services provided to the Registrant, The Vanguard Group, Inc., Vanguard Marketing Corporation, and other registered investment companies in the Vanguard Group and related to income and excise taxes.
(d) All Other Fees.
Fiscal Year Ended October 31, 2006: $0
Fiscal Year Ended October 31, 2005: $0
Includes fees billed for services related to risk management and privacy matters. Services were provided to the Registrant, The Vanguard Group, Inc., Vanguard Marketing Corporation, and other registered investment companies in the Vanguard Group.
(e) (1) Pre-Approval Policies. The policy of the Registrant’s Audit Committee is to consider and, if appropriate, approve before the principal accountant is engaged for such services, all specific audit and non-audit services provided to: (1) the Registrant; (2) The Vanguard Group, Inc.; (3) other entities controlled by The Vanguard Group, Inc. that provide ongoing services to the Registrant; and (4) other registered investment companies in the Vanguard Group. In making a determination, the Audit Committee considers whether the services are consistent with maintaining the principal accountant’s independence.
In the event of a contingency situation in which the principal accountant is needed to provide services in between scheduled Audit Committee meetings, the Chairman of the Audit Committee would be called on to consider and, if appropriate, pre-approve audit or permitted non-audit services in an amount sufficient to complete services through the next Audit Committee meeting, and to determine if such services would be consistent with maintaining the accountant’s independence. At the next scheduled Audit Committee meeting, services and fees would be presented to the Audit Committee for formal consideration, and, if appropriate, approval by the entire Audit Committee. The Audit Committee would again consider whether such services and fees are consistent with maintaining the principal accountant’s independence.
The Registrant’s Audit Committee is informed at least annually of all audit and non-audit services provided by the principal accountant to the Vanguard complex, whether such services are provided to: (1) the Registrant; (2) The Vanguard Group, Inc.; (3) other entities controlled by The Vanguard Group, Inc. that provide ongoing services to the Registrant; or other registered investment companies in the Vanguard Group.
(2) No percentage of the principal accountant’s fees or services were approved pursuant to the waiver provision of paragraph (c)(7)(i)(C) of Rule 2-01 of Regulation S-X.
(f) For the most recent fiscal year, over 50% of the hours worked under the principal accountant’s engagement were not performed by persons other than full-time, permanent employees of the principal accountant.
(g) Aggregate Non-Audit Fees.
Fiscal Year Ended October 31, 2006: $101,300
Fiscal Year Ended October 31, 2005: $98,400
Includes fees billed for non-audit services provided to the Registrant, The Vanguard Group, Inc., Vanguard Marketing Corporation, and other registered investment companies in the Vanguard Group.
(h) For the most recent fiscal year, the Audit Committee has determined that the provision of all non-audit services was consistent with maintaining the principal accountant’s independence.
Item 5: Not applicable.
Item 6: Not applicable.
Item 7: Not applicable.
Item 8: Not applicable.
Item 9: Not applicable.
Item 10: Not applicable
Item 11: Controls and Procedures.
(a) Disclosure Controls and Procedures. The Principal Executive and Financial Officers concluded that the Registrant’s Disclosure Controls and Procedures are effective based on their evaluation of the Disclosure Controls and Procedures as of a date within 90 days of the filing date of this report.
(b) Internal Control Over Financial Reporting. There were no significant changes in Registrant’s internal control over financial reporting or in other factors that could significantly affect this control subsequent to the date of the evaluation, including any corrective actions with regard to significant deficiencies and material weaknesses.
Item 12: Exhibits.
(a) Code of Ethics.
(b) Certifications.
Pursuant to the requirements of the Securities Exchange Act of 1934 and the Investment Company Act of 1940, the registrant has duly caused this report to be signed on its behalf by the undersigned, thereunto duly authorized.
| VANGUARD WHITEHALL FUNDS
|
| BY: | (signature)
|
| (HEIDI STAM)
JOHN J. BRENNAN*
CHIEF EXECUTIVE OFFICER |
Pursuant to the requirements of the Securities Exchange Act of 1934 and the Investment Company Act of 1940, this report has been signed below by the following persons on behalf of the registrant and in the capacities and on the dates indicated.
| VANGUARD WHITEHALL FUNDS
|
| BY: | (signature)
|
| (HEIDI STAM)
JOHN J. BRENNAN*
CHIEF EXECUTIVE OFFICER |
| VANGUARD WHITEHALL FUNDS
|
| BY: | (signature)
|
| (HEIDI STAM)
THOMAS J. HIGGINS*
TREASURER |
* By Power of Attorney. See File Number 002-65955-99, filed on July 27, 2006. Incorporated by Reference.
