UNITED STATES
SECURITIES AND EXCHANGE COMMISSION
Washington, D.C. 20549
FORM N-CSR
CERTIFIED SHAREHOLDER REPORT
OF
REGISTERED MANAGEMENT INVESTMENT COMPANIES
Investment Company Act file number: 811-07443
Name of Registrant:
Vanguard Whitehall Funds
Address of Registrant:
P.O. Box 2600
Valley Forge, PA 19482
Name and address of agent for service:
Heidi Stam, Esquire
P.O. Box 876
Valley Forge, PA 19482
Registrant’s telephone number, including area code: (610) 669-1000
Date of fiscal year end: October 31
Date of reporting period: November 1, 2008 – October 31, 2009
Item 1: Reports to Shareholders
 |
| Vanguard Selected Value Fund |
| Annual Report |
|
|
| October 31, 2009 |
|
 |
|
|
> Vanguard Selected Value Fund returned more than 22% for the 12 months ended October 31, 2009, significantly outperforming its comparative standards.
> Financial and consumer discretionary stocks—two of the fund’s largest sectors—contributed the most to its success.
> Over the past ten years, the fund’s average annual return of about 8% was ahead of the comparable return of the Russell Midcap Value Index and the average result for peer funds.
| |
| Contents | |
| Your Fund’s Total Returns | 1 |
| President’s Letter | 2 |
| Advisors’ Report | 8 |
| Results of Proxy Voting | 11 |
| Fund Profile | 12 |
| Performance Summary | 13 |
| Financial Statements | 15 |
| Your Fund’s After-Tax Returns | 25 |
| About Your Fund’s Expenses | 26 |
| Glossary | 28 |
The figures shown represent past performance, which is not a guarantee of future results. (Current performance may be lower or higher than the performance data cited. For performance data current to the most recent month-end, visit our website at www.vanguard.com/performance.)
Please note: The opinions expressed in this report are just that—informed opinions. They should not be considered promises or advice. Also, please keep in mind that the information and opinions cover the period through the date on the front of this report. Of course, the risks of investing in your fund are spelled out in the prospectus.
Cover photograph: Veronica Coia.
| | | | |
| Your Fund’s Total Returns | | | |
| |
| |
| |
| |
| Fiscal Year Ended October 31, 2009 | | | | |
| | | | Ticker | Total |
| | | | Symbol | Returns |
| Vanguard Selected Value Fund | | | VASVX | 22.77% |
| Russell Midcap Value Index | | | | 14.52 |
| Mid-Cap Value Funds Average1 | | | | 18.37 |
| |
| |
| Your Fund’s Performance at a Glance | | | | |
| October 31, 2008–October 31, 2009 | | | | |
| | | | Distributions Per Share |
| | Starting | Ending | Income | Capital |
| | Share Price | Share Price | Dividends | Gains |
| Vanguard Selected Value Fund | $12.48 | $14.78 | $0.417 | $0.000 |
1 Derived from data provided by Lipper Inc.
1

President’s Letter
Dear Shareholder,
Vanguard Selected Value Fund returned 22.77% for the 12 months ended October 31, 2009—its third-best fiscal year ever. This is especially welcome coming on the heels of last year’s performance, the fund’s (and the markets’) worst showing since its inception in 1996. The fund handily outperformed the 14.52% return of its benchmark—the Russell Midcap Value Index—and the 18.37% average return of peer funds for the period.
Much of the fund’s success can be attributed to the stock-selection skills of its advisors—Barrow, Hanley, Mewhinney & Strauss, Inc., and Donald Smith & Co., Inc.—especially in financial and consumer discretionary stocks. These two sizable sectors benefited as investors became more confident about credit markets and the economy.
If you hold shares in a taxable account, you may wish to review the table and discussion on after-tax returns for the fiscal year that appear later in this report.
A vicious bear market quickly turned bullish
A year ago, the global financial system stood on the brink of collapse as the expanding U.S. credit crisis precipitated the deepest worldwide recession since World War II. Since then, markets have pulled back from the depths and, in fact, have rallied impressively. Although U.S. unemployment has risen to double digits
2
and signs of a robust recovery are hard to find, the global economy has begun to revive. For the first time in more than a year, U.S. gross domestic product registered growth, as reported by the Commerce Department for the third quarter of calendar 2009.
U.S. stocks recorded positive returns for the fiscal year ended October 31 as the market’s losses during the first four months of the period—marking the final plunge of a historic bear market—were erased by a remarkable rally beginning in March. Global stocks did even better, thanks to some renewed strength in developed markets and a powerful upswing in emerging markets that actually had some prognosticators worrying about a new asset bubble. Reminders of the markets’ travails are nevertheless apparent in the index returns for the past three years, where negative figures are the rule. Even the five-year returns for U.S. stocks as of October 31 were barely positive, further evidence of the long-term damage done by the collapse of the real estate bubble.
The bond market experienced an equally dramatic turnaround
The stock market’s rapid fall and recovery were matched by an equally dramatic turnaround in the bond market. At the end of 2008, as the credit markets virtually shut down, risk-averse investors flocked to U.S. Treasury bonds. The effect was to widen the difference between the lower yields of Treasuries and the higher yields of corporate bonds to a margin not seen since the Great Depression.
| | | |
| Market Barometer | | | |
| | | Average Annual Total Returns |
| | | Periods Ended October 31, 2009 |
| | One Year | Three Years | Five Years |
| Stocks | | | |
| Russell 1000 Index (Large-caps) | 11.20% | –6.84% | 0.71% |
| Russell 2000 Index (Small-caps) | 6.46 | –8.51 | 0.59 |
| Dow Jones U.S. Total Stock Market Index | 11.34 | –6.55 | 1.06 |
| MSCI All Country World Index ex USA (International) | 34.79 | –2.49 | 7.58 |
| |
| Bonds | | | |
| Barclays Capital U.S. Aggregate Bond Index | | | |
| (Broad taxable market) | 13.79% | 6.35% | 5.05% |
| Barclays Capital Municipal Bond Index | 13.60 | 4.17 | 4.15 |
| Citigroup 3-Month Treasury Bill Index | 0.28 | 2.50 | 2.94 |
| |
| CPI | | | |
| Consumer Price Index | –0.18% | 2.32% | 2.52% |
3
Central banks around the world responded to the economic slowdown by lowering interest rates and implementing other aggressive stimulus programs. Meanwhile, governments boosted spending in hopes of reversing the recessionary tide. As fears of a worldwide depression eased, investors’ appetite for risk returned to more normal levels. The receding pessimism increased demand for corporate bonds, raising their prices and bringing down their yields.
Over the past 12 months, both taxable and municipal bonds returned more than 13%.
However, the Fed’s easy-money campaign had a predictable effect on short-term savings vehicles such as money market funds, whose yields track prevailing short-term rates. In December 2008, the Fed reduced its target for the federal funds rate, a benchmark for the interest rates paid by money market instruments and other very short-term securities, to between 0% and 0.25%. The Fed has said it expects to maintain its target at this level “for an extended period.”
Favorable stock selection boosted performance
Every stock sector in the fund advanced for the year, in many cases overcoming first-half losses on the way to significant double-digit gains. The advisors’ stock selection was rewarding in most sectors, especially two of the largest—financials and consumer discretionary. These two sectors were responsible for more than half of the fund’s 12-month return.
| | |
| Expense Ratios1 | | |
| Your Fund Compared With Its Peer Group | | |
| | | Mid-Cap |
| | | Value Funds |
| | Fund | Average |
| Selected Value Fund | 0.45% | 1.41% |
1 The fund expense ratio shown is from the prospectus dated February 27, 2009, and represents estimated costs for the current fiscal year based on the fund's net assets as of the prospectus date. For the fiscal year ended October 31, 2009, the fund's expense ratio was 0.52%.
The peer-group expense ratio is derived from data provided by Lipper Inc. and captures information through year-end 2008.
4
For some time, the advisors have maintained relatively light exposure to the financial sector. This positioning helped the fund sidestep some of the damage to this sector over much of the last two years. And when financial stocks began to recover, the fund managed to be in the right place at the right time: Its relatively limited selection of financial services stocks returned about 20%, while the index’s financial sector declined. For example, the share price of consumer-finance company Capital One Financial—the fund’s largest holding on October 31—approximately doubled after the stock was added to the portfolio during the first half of the fiscal year.
The advisors’ above-benchmark exposure to consumer discretionary stocks proved rewarding throughout the year. During the first half, while stock prices were still falling, the fund profited from investments in some retailers that were well-positioned among cost-conscious consumers. With the spring rally under way, and consumers regaining some confidence, recreation-oriented companies posted strong gains. Top-ten holding Royal Caribbean Cruises, for example, benefited from signs that price-discounting pressure is starting to ease.
In Selected Value’s relatively concentrated portfolio of about 60 stocks, the performance of any single holding can have an outsized impact on the fund’s total return. This can be a plus: Propelled by rising gold prices, shares of Canadian mining company Yamana Gold
| |
| Total Returns | |
| Ten Years Ended October 31, 2009 | |
| | Average |
| | Annual Return |
| Selected Value Fund | 8.06% |
| Russell Midcap Value Index | 6.59 |
| Mid-Cap Value Funds Average1 | 6.35�� |
The figures shown represent past performance, which is not a guarantee of future results. (Current performance may be lower or higher than the performance data cited. For performance data current to the most recent month-end, visit our website at www.vanguard.com/performance.) Note, too, that both investment returns and principal value can fluctuate widely, so an investor’s shares, when sold, could be worth more or less than their original cost.
1 Derived from data provided by Lipper Inc.
5
more than doubled in value, making it one of the fund’s best-performing stocks (the company is not included in the all-U.S. benchmark index). On the other hand, the shortfalls are equally apparent in a small portfolio. Among the detractors were Hill-Rom Holdings (medical technologies), Omnicare (pharmaceutical services for long-term care facilities), and New York Community Bancorp.
For more information on the fund’s positioning and performance during the year, please see the Advisors’ Report that follows this letter.
In ten-year performance, the fund is ahead of the pack
Bolstered by especially strong results in fiscal year 2009, the Selected Value Fund has put some distance between its long-term performance and that of its comparative standards. For the ten years ended October 31, the fund’s 8.06% average annual return was more than a percentage point higher than the comparable returns of its benchmark index and peer-group average.
In a decade that included two major bear markets, the fund significantly outpaced the broad U.S. stock market, which was essentially flat. (The Dow Jones U.S. Total Stock Market Index returned 0.06% per year, on average.) It’s worth remembering, however, that the advisors’ focus on a small number of out-of-favor, medium-sized companies often produces results that differ meaningfully from those of the market as a whole.
A word on expenses
The fund’s expense ratio has risen over the past fiscal year. The explanation is threefold.
First, the fund’s average net assets, the asset base used in calculating the expense ratio, declined from the average level in the prior fiscal year. With a smaller denominator, the fund’s fixed expenses have accounted for a modestly higher percentage of fund assets.
Second, the Vanguard funds’ contracts with external advisors typically include breakpoint pricing. As assets rise above a breakpoint threshold, advisory fees are paid at a lower rate. When assets fall, as they have during fiscal 2009, a smaller portion of assets is subject to the lower rate, causing the overall rate to increase. Over time, breakpoint pricing has helped shareholders benefit from the economies of scale produced by growth in the fund’s assets.
Finally, Vanguard’s contracts with external advisors generally include an incentive-fee provision that is contingent on the advisors’ performance relative to their benchmarks. This fee structure helps to ensure that the interests of the fund shareholders and advisors remain aligned. Over the past year, the advisory fee increased as the fund’s relative performance improved. The fund’s financial statements include more information about Vanguard Selected Value Fund’s incentive fee.
Timeless principles work well in today’s changeable markets
Over the last two years, stocks have taken investors on a roller-coaster ride. After soaring to record highs in October 2007, the U.S. stock market in 2008 suffered its worst calendar year since the 1930s, then turned around this past spring. Investors were given a strong dose of reality—not only by the volatile stock market but also by the demise of some major financial institutions and the persistence of the longest recession in seven decades.
What lessons did we learn? We were reminded of the value of some timeless investment principles—including diversification, balance, and taking a long-term view. Although diversification didn’t immunize investors from the market declines, it certainly insulated them from the worst of it. And patience is often rewarded: Many investors who did not panic and sell out as stocks sank have recovered a substantial share of their paper losses.
Now that the economy and the markets have pulled back from the brink, it’s a good time to reevaluate your long-term investment objectives, time frame, and risk tolerance, and to make sure your investments are appropriately diversified. Within such a portfolio, Vanguard Selected Value Fund—with its advisors’ disciplined, low-turnover strategy—can provide low-cost exposure to the potential opportunities associated with under-appreciated midsized companies.
Thank you for entrusting your assets to Vanguard.
Sincerely,

F. William McNabb III
President and Chief Executive Officer
November 12, 2009
7
Advisors’ Report
For the fiscal year ended October 31, 2009, Vanguard Selected Value Fund returned 22.77%. Your fund is managed by two independent advisors. This provides exposure to distinct, yet complementary, investment approaches, enhancing the fund’s diversification. It is not uncommon for different advisors to have different views about individual securities or the broader investment environment.
The advisors, the percentage and amount of fund assets each manages, and a brief description of their investment strategies are presented in the table below. The advisors have also prepared a discussion of the investment environment that existed during the fiscal period and of
how portfolio positioning reflects this assessment. These comments were prepared on November 16, 2009.
Barrow, Hanley, Mewhinney & Strauss, Inc.
Portfolio Managers:
James P. Barrow, Founding Partner
Mark Giambrone, Partner
This past year has been an extremely volatile period for the equity markets. We began last November amid substantial fear about the depths of the economic downturn and a critical need for meaningful government intervention, which led to a substantial sell-off in the markets. The fiscal year ended with a growing belief that things have stabilized,
| | | |
| Vanguard Selected Value Fund Investment Advisors | |
| |
| | Fund Assets Managed | |
| Investment Advisor | % | $ Million | Investment Strategy |
| Barrow, Hanley, Mewhinney | 71 | 2,032 | Conducts fundamental research on individual stocks |
| & Strauss, Inc. | | | exhibiting traditional value characteristics: price/ |
| | | | earnings and price/book ratios below the market |
| | | | average and dividend yields above the market average. |
| Donald Smith & Co., Inc. | 25 | 710 | Conducts fundamental research on the lowest price- |
| | | | to-tangible-book value companies. Research focuses |
| | | | on underlying quality of book value and assets, and |
| | | | on long-term earnings potential. |
| Cash Investments | 4 | 109 | These short-term reserves are invested by Vanguard |
| | | | in equity index products to simulate investment in |
| | | | stocks. Each advisor may also maintain a modest |
| | | | cash position. |
8
liquidity is returning to the debt markets, and improvement may be on the horizon—all leading to a substantial recovery in the markets. We are pleased with our portfolio’s performance over this time frame, as it has substantially outperformed its benchmark.
As we noted earlier in the year, the dramatic sell-off created opportunities for us to invest in high-quality companies that we believed would not only weather the storm but would also recover significantly when they emerged on the other side. This approach led us to companies such as Capital One Financial, Newell Rubbermaid, Computer Sciences, and International Game Technology, whose performance benefited the portfolio. More recently we’ve found different opportunities in more stable, high-quality businesses that were left behind in the recent rally but that we believe represent tremendous value, such as insurer Chubb, food distributor Sysco, Fidelity National Financial, and PNC Financial Services Group.
We continue to be overweighted in sectors that have tremendous valuation potential and should achieve earnings stability or a meaningful rebound in earnings as the economy continues to stabilize, such as industrials, consumer discretionary, and health care. Our overweighted position in health care detracted from performance for the fiscal year because of concerns about potential health care reform in Washington. We think current valuations reflect a worst-case scenario and believe these valuations will lift once the outcome of the debate is clear in late 2009 or in 2010. While we have been underweighted in financials, we continue to find selective opportunities in the sector and our position is steadily increasing.
We continue to be underweighted in sectors where valuations don’t seem to be much favored by the current and future economic environment or where company fundamentals do not match our investment parameters. These include materials, telecommunication services, consumer staples, and information technology.
Donald Smith & Co., Inc.
Portfolio Managers: Donald G. Smith, Chief Investment Officer
Richard L. Greenberg, CFA, Senior Vice President
At the end of October 2009, we continued to hold a concentrated portfolio of low price-to-tangible-book value stocks with attractive long-term earnings potential. As a group, the portfolio stocks were selling at 83% of tangible book value and 7.5 times our estimate of “normalized earnings,” which have been smoothed for the ups and downs of the economy and the business cycle. In contrast, the S&P 500 Index sells at about 345% of tangible book value and 14.8 times normalized earnings.
Our universe of low price-to-book value stocks has performed much better since the market hit bottom in March, and we are pleased that our portfolio returned more than its benchmark. Depressed cyclical industries, such as technology,
9
paper and paper products, retailers, and travel (airlines and cruise operators) have rebounded as economic prospects brightened.
Our top-performing stocks over the past year included apparel and home furnishings retailer Dillard’s, Yamana Gold, paper manufacturer Domtar, and three technology companies: Flextronics International, Micron Technology, and Semiconductor Manufacturing International. The two insurance companies whose book values had been hurt by temporary portfolio markdowns, CNA Financial and Unum Group, experienced substantial price appreciation as rebounding financial markets helped book values to recover. We added to our holdings of both companies earlier in the fiscal year.
We eliminated our positions in five stocks: Ashland, American Financial Group, Puget Energy, Qimonda, and Spansion. (Puget Energy was acquired by an investor group in February.) We scaled back our holdings in Flextronics International, Micron Technology, Pinnacle West Capital (which owns an Arizona utility and develops real estate), Royal Caribbean Cruises, and Yamana Gold. On the purchases side, we participated in a secondary offering of Transatlantic Holdings and then sold the stock after 23.5%
appreciation. We also added Aspen Insurance Holdings, Southwest Airlines, and Tesoro (an oil refiner and marketer) to the portfolio over the past year, all at discounts to tangible book value. In general, we sold stocks that had performed well and added to our positions in underperformers that met our investment criteria.
Our largest industry weightings at the fiscal year-end included insurance, technology, airlines, and utilities. As mentioned, the book values of insurance companies have rebounded substantially. CNA Financial, the largest holding in our portfolio, has seen tangible book value grow from about $20 per share last December to $35 per share as of September 30, a 75% appreciation. The stock was selling at $21.77 on October 31—only 62% of book value.
Overall, our portfolio remains attractively valued, though large moves in many of the stocks and in the overall market have made it more difficult to find new, attractively valued companies that meet our strict investment criteria. As opportunities emerge, however, our portfolio’s sizable allocation to cash will put us in a position to take advantage of them.
10
Results of Proxy Voting
At a special meeting of shareholders on July 2, 2009, fund shareholders approved the following two proposals:
Proposal 1—Elect trustees for each fund.*
The individuals listed in the table below were elected as trustees for each fund. All trustees with the exception of Messrs. McNabb and Volanakis (both of whom already served as directors of The Vanguard Group, Inc.) served as trustees to the funds prior to the shareholder meeting.
| | | |
| | | | Percentage |
| Trustee | For | Withheld | For |
| John J. Brennan | 267,380,786 | 8,631,474 | 96.9% |
| Charles D. Ellis | 256,520,935 | 19,491,324 | 92.9% |
| Emerson U. Fullwood | 257,085,311 | 18,926,948 | 93.1% |
| Rajiv L. Gupta | 266,612,131 | 9,400,128 | 96.6% |
| Amy Gutmann | 267,915,925 | 8,096,335 | 97.1% |
| JoAnn Heffernan Heisen | 266,998,335 | 9,013,925 | 96.7% |
| F. William McNabb III | 267,044,346 | 8,967,914 | 96.8% |
| André F. Perold | 256,971,735 | 19,040,525 | 93.1% |
| Alfred M. Rankin, Jr. | 266,847,723 | 9,164,536 | 96.7% |
| Peter F. Volanakis | 266,899,599 | 9,112,660 | 96.7% |
| * Results are for all funds within the same trust. | | | |
Proposal 2—Update and standardize the funds’ fundamental policies regarding:
(a) Purchasing and selling real estate.
(b) Issuing senior securities.
(c) Borrowing money.
(d) Making loans.
(e) Purchasing and selling commodities.
(f) Concentrating investments in a particular industry or group of industries.
(g) Eliminating outdated fundamental investment policies not required by law.
The revised fundamental policies are clearly stated and simple, yet comprehensive, making oversight and compliance more efficient than under the former policies. The revised fundamental policies will allow the funds to respond more quickly to regulatory and market changes, while avoiding the costs and delays associated with successive shareholder meetings.
| | | | | |
| | | | | Broker | Percentage |
| Selected Value Fund | For | Abstain | Against | Non-Votes | For |
| 2a | 118,113,958 | 2,668,089 | 3,934,973 | 6,724,883 | 89.9% |
| 2b | 117,628,170 | 2,972,266 | 4,116,582 | 6,724,884 | 89.5% |
| 2c | 114,478,655 | 2,877,848 | 7,360,517 | 6,724,882 | 87.1% |
| 2d | 115,008,695 | 2,852,851 | 6,855,472 | 6,724,884 | 87.5% |
| 2e | 114,940,879 | 2,883,130 | 6,893,009 | 6,724,884 | 87.4% |
| 2f | 117,599,707 | 2,849,677 | 4,267,636 | 6,724,882 | 89.5% |
| 2g | 118,910,580 | 2,843,751 | 2,962,689 | 6,724,882 | 90.5% |
11
Selected Value Fund
Fund Profile
As of October 31, 2009
| | | |
| Portfolio Characteristics | | |
| | | Comparative | Broad |
| | Fund | Index1 | Index2 |
| Number of Stocks | 64 | 549 | 4,310 |
| Median Market Cap | $5.3B | $4.9B | $28.3B |
| Price/Earnings Ratio | 40.2x | 149.8x | 30.3x |
| Price/Book Ratio | 1.2x | 1.4x | 2.1x |
| Yield3 | 1.8% | 2.3% | 1.9% |
| Return on Equity | 13.7% | 12.0% | 19.4% |
| Earnings Growth Rate | 3.8% | 1.0% | 9.3% |
| Foreign Holdings | 4.3% | 0.0% | 0.0% |
| Turnover Rate | 30% | — | — |
| Expense Ratio4 | 0.45% | — | — |
| Short-Term Reserves | 8.7% | — | —- |
| | | |
| Sector Diversification (% of equity exposure) |
| | | Comparative | Broad |
| | Fund | Index1 | Index2 |
| Consumer Discretionary | 16.3% | 12.4% | 10.0% |
| Consumer Staples | 5.1 | 6.5 | 10.3 |
| Energy | 6.0 | 9.6 | 11.6 |
| Financials | 27.2 | 28.0 | 16.3 |
| Health Care | 9.0 | 4.2 | 11.9 |
| Industrials | 17.4 | 10.9 | 10.4 |
| Information Technology | 6.1 | 6.9 | 19.1 |
| Materials | 3.0 | 7.4 | 3.8 |
| Telecommunication | | | |
| Services | 0.1 | 2.4 | 2.8 |
| Utilities | 9.8 | 11.7 | 3.8 |
| | |
| Volatility Measures5 | |
| | Fund Versus | Fund Versus |
| | Comparative Index1 | Broad Index2 |
| R-Squared | 0.95 | 0.92 |
| Beta | 0.82 | 1.01 |
| | |
| Ten Largest Holdings6 (% of total net assets) |
| Capital One | | |
| Financial Corp. | consumer finance | 2.5% |
| Pinnacle West | | |
| Capital Corp. | electric utilities | 2.3 |
| Newell Rubbermaid Inc. | housewares and | |
| | specialties | 2.3 |
| Eaton Corp. | industrial machinery | 2.2 |
| PNC Financial Services | | |
| Group Inc. | regional banks | 2.2 |
| Royal Caribbean | hotels, resorts, and | |
| Cruises Ltd. | cruise lines | 2.2 |
| Stanley Works | industrial machinery | 2.2 |
| Computer Sciences Corp. | data processing and | |
| | outsourced services | 2.2 |
| International Game | | |
| Technology | casinos and gaming | 2.1 |
| MDU Resources | | |
| Group Inc. | multi-utilities | 2.0 |
| Top Ten | | 22.2% |
Investment Focus
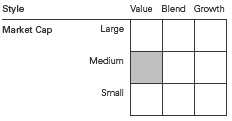
1 Russell Midcap Value Index.
2 Dow Jones U.S. Total Stock Market Index.
3 30-day SEC yield for the fund; annualized dividend yield for the indexes. See the Glossary.
4 The expense ratio shown is from the prospectus dated February 27, 2009, and represents estimated costs for the current fiscal year based on the fund’s net assets as of the prospectus date. For the fiscal year ended October 31, 2009, the fund’s expense ratio was 0.52%.
5 For an explanation of R-squared, beta, and other terms used here, see the Glossary.
6 The holdings listed exclude any temporary cash investments and equity index products.
12
Selected Value Fund
Performance Summary
All of the returns in this report represent past performance, which is not a guarantee of future results that may be achieved by the fund. (Current performance may be lower or higher than the performance data cited. For performance data current to the most recent month-end, visit our website at www.vanguard.com/performance.) Note, too, that both investment returns and principal value can fluctuate widely, so an investor’s shares, when sold, could be worth more or less than their original cost. The returns shown do not reflect taxes that a shareholder would pay on fund distributions or on the sale of fund shares.
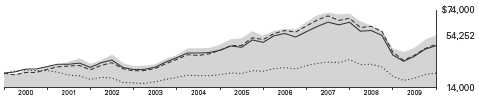
Cumulative Performance: October 31, 1999–October 31, 2009
Initial Investment of $25,000
| | | | |
| | | Average Annual Total Returns | Final Value |
| | | Periods Ended October 31, 2009 | of a $25,000 |
| | One Year | Five Years | Ten Years | Investment |
| Selected Value Fund1 | 22.77% | 2.92% | 8.06% | $54,252 |
| Dow Jones U.S. Total Stock Market Index | 11.34 | 1.06 | 0.06 | 25,140 |
| Russell Midcap Value Index | 14.52 | 2.05 | 6.59 | 47,343 |
| Mid-Cap Value Funds Average2 | 18.37 | 1.60 | 6.35 | 46,276 |
1 Total returns do not reflect the 1% fee assessed on redemptions after March 23, 2005, of shares held for less than one year; the 1% fee assessed until March 23, 2005, on shares purchased on or after August 7, 2001, and held for less than five years; or the account service fee that may be applicable to certain accounts with balances below $10,000.
2 Derived from data provided by Lipper Inc.
13
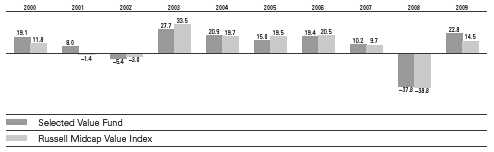
Selected Value Fund
Fiscal-Year Total Returns (%): October 31, 1999–October 31, 2009
Average Annual Total Returns: Periods Ended September 30, 2009
This table presents average annual total returns through the latest calendar quarter—rather than through the end
of the fiscal period. Securities and Exchange Commission rules require that we provide this information.
| | | | |
| | Inception Date | One Year | Five Years | Ten Years |
| Selected Value Fund1 | 2/15/1996 | 3.05% | 3.97% | 8.02% |
1 Total returns do not reflect the 1% fee assessed on redemptions after March 23, 2005, of shares held for less than one year; the 1% fee assessed until March 23, 2005, on shares purchased on or after August 7, 2001, and held for less than five years; or the account service fee that may be applicable to certain accounts with balances below $10,000.
Note: See Financial Highlights table for dividend and capital gains information.
14
Selected Value Fund
Financial Statements
Statement of Net Assets
As of October 31, 2009
The fund reports a complete list of its holdings in regulatory filings four times in each fiscal year, at the quarter-ends. For the second and fourth fiscal quarters, the lists appear in the fund’s semiannual and annual reports to shareholders. For the first and third fiscal quarters, the fund files the lists with the Securities and Exchange Commission on Form N-Q. Shareholders can look up the fund’s Forms N-Q on the SEC’s website at www.sec.gov. Forms N-Q may also be reviewed and copied at the SEC’s Public Reference Room (see the back cover of this report for further information).
| | | |
| | | | Market |
| | | | Value• |
| | | Shares | ($000) |
| Common Stocks (87.4%)1 | | |
| Consumer Discretionary (14.5%) | |
| | Newell Rubbermaid Inc. | 4,500,000 | 65,295 |
| * | Royal Caribbean | | |
| | Cruises Ltd. | 3,130,020 | 63,320 |
| | International Game | | |
| | Technology | 3,319,100 | 59,213 |
| * | Hanesbrands Inc. | 2,316,400 | 50,081 |
| * | GameStop Corp. Class A | 2,011,000 | 48,847 |
| | Family Dollar Stores Inc. | 1,476,700 | 41,791 |
| | Advance Auto Parts Inc. | 911,300 | 33,955 |
| | Dillard’s Inc. Class A | 2,451,900 | 33,395 |
| | Service Corp. | | |
| | International | 2,486,200 | 17,080 |
| | | | 412,977 |
| Consumer Staples (4.2%) | | |
| | Sysco Corp. | 1,648,400 | 43,600 |
| | Reynolds American Inc. | 794,000 | 38,493 |
| | Lorillard Inc. | 487,800 | 37,912 |
| | | | 120,005 |
| Energy (5.1%) | | |
| | Murphy Oil Corp. | 876,400 | 53,583 |
| | Spectra Energy Corp. | 1,575,700 | 30,127 |
| | El Paso Corp. | 2,628,600 | 25,787 |
| | Overseas Shipholding | | |
| | Group Inc. | 472,900 | 18,561 |
| | Tesoro Corp. | 1,090,600 | 15,421 |
| | | | 143,479 |
| Financials (24.2%) | | |
| | Capital One Financial | | |
| | Corp. | 1,955,900 | 71,585 |
| | PNC Financial Services | | |
| | Group Inc. | 1,297,212 | 63,485 |
| | Annaly Capital | | |
| | Management Inc. | 3,411,900 | 57,695 |
| | Willis Group Holdings Ltd. | 2,076,800 | 56,074 |
| | Axis Capital Holdings Ltd. | 1,746,900 | 50,468 |
| * | CNA Financial Corp. | 2,312,035 | 50,333 |
| | Fidelity National | | |
| | Financial Inc. Class A | 3,385,400 | 45,940 |
| | | |
| | | | Market |
| | | | Value• |
| | | Shares | ($000) |
| | Chubb Corp. | 827,300 | 40,141 |
| * | SLM Corp. | 4,012,400 | 38,920 |
| | Fifth Third Bancorp | 3,756,400 | 33,582 |
| | Unum Group | 1,517,200 | 30,268 |
| | New York Community | | |
| | Bancorp Inc. | 2,764,500 | 29,829 |
| | Validus Holdings Ltd. | 1,114,173 | 28,188 |
| | Ameriprise Financial Inc. | 635,300 | 22,026 |
| | People’s United | | |
| | Financial Inc. | 1,335,897 | 21,414 |
| | SunTrust Banks Inc. | 1,039,500 | 19,865 |
| | XL Capital Ltd. Class A | 900,100 | 14,771 |
| | American National | | |
| | Insurance Co. | 140,326 | 11,716 |
| | Aspen Insurance | | |
| | Holdings Ltd. | 141,000 | 3,638 |
| | | | 689,938 |
| Health Care (7.7%) | | |
| | Omnicare Inc. | 2,378,900 | 51,551 |
| | Quest Diagnostics Inc. | 870,700 | 48,698 |
| | Cardinal Health Inc. | 1,315,500 | 37,281 |
| | CIGNA Corp. | 1,303,400 | 36,287 |
| * | Coventry Health Care Inc. | 1,807,600 | 35,845 |
| * | CareFusion Corp. | 457,750 | 10,240 |
| | | | 219,902 |
| Industrials (15.5%) | | |
| | Eaton Corp. | 1,058,600 | 63,992 |
| | Stanley Works | 1,395,700 | 63,128 |
| | Goodrich Corp. | 1,039,400 | 56,491 |
| | L-3 Communications | | |
| | Holdings Inc. | 654,700 | 47,328 |
| | ITT Corp. | 919,900 | 46,639 |
| * | Air France-KLM ADR | 2,952,913 | 45,180 |
| | Ryder System Inc. | 1,050,700 | 42,606 |
| | SPX Corp. | 540,400 | 28,522 |
| | Avery Dennison Corp. | 756,100 | 26,955 |
| | Southwest Airlines Co. | 2,603,371 | 21,868 |
| | | | 442,709 |
15
| | | | |
| Selected Value Fund | | | |
| |
| |
| |
| | | | | Market |
| | | | | Value• |
| | | | Shares | ($000) |
| Information Technology (4.8%) | |
| * | Computer Sciences Corp. | 1,237,800 | 62,769 |
| * | Micron Technology Inc. | 6,468,416 | 43,921 |
| * | Flextronics International | | |
| | Ltd. | | 2,978,613 | 19,301 |
| * | Semiconductor | | | |
| | Manufacturing | | | |
| | International Corp. ADR | 4,626,200 | 11,195 |
| | | | | 137,186 |
| Materials (2.6%) | | | |
| | Yamana Gold Inc. | | 3,588,100 | 38,213 |
| * | Domtar Corp. | | 861,316 | 36,081 |
| | | | | 74,294 |
| Utilities (8.8%) | | | |
| | Pinnacle West | | | |
| | Capital Corp. | | 2,133,059 | 66,807 |
| | MDU Resources | | | |
| | Group Inc. | | 2,803,600 | 58,175 |
| | Xcel Energy Inc. | | 2,853,900 | 53,825 |
| | Centerpoint Energy Inc. | 3,633,600 | 45,783 |
| * | RRI Energy Inc. | | 2,846,200 | 15,000 |
| | NV Energy Inc. | | 1,035,700 | 11,869 |
| | | | | 251,459 |
| Total Common Stocks | | | |
| (Cost $2,552,324) | | | 2,491,949 |
| Temporary Cash Investments (12.5%)1 | |
| Money Market Fund (12.1%) | | |
| 2 | Vanguard Market Liquidity | | |
| | Fund, 0.225% | 345,201,555 | 345,202 |
| | | |
| | | Face | Market |
| | | Amount | Value• |
| | | ($000) | ($000) |
| U.S. Government and Agency Obligations (0.4%) |
| 3,4 | Fannie Mae | | |
| | Discount Notes, | | |
| | 0.351%, 11/12/09 | 1,500 | 1,500 |
| 3,4 | Fannie Mae | | |
| | Discount Notes, | | |
| | 0.180%, 3/10/10 | 1,000 | 1,000 |
| 3,4 | Freddie Mac | | |
| | Discount Notes, | | |
| | 0.260%, 12/22/09 | 8,000 | 7,999 |
| | | | 10,499 |
| Total Temporary Cash Investments | |
| (Cost $355,698) | | 355,701 |
| Total Investments (99.9%) | | |
| (Cost $2,908,022) | | 2,847,650 |
| Other Assets and Liabilities (0.1%) | |
| Other Assets | | 18,202 |
| Liabilities | | (14,435) |
| | | | 3,767 |
| Net Assets (100%) | | |
| Applicable to 192,964,917 outstanding | |
| $.001 par value shares of beneficial | |
| interest (unlimited authorization) | 2,851,417 |
| Net Asset Value Per Share | | $14.78 |
| |
| |
| At October 31, 2009, net assets consisted of: |
| | | | Amount |
| | | | ($000) |
| Paid-in Capital | | 3,326,643 |
| Undistributed Net | | |
| Investment Income | | 29,601 |
| Accumulated Net | | |
| Realized Losses | | (444,432) |
| Unrealized Appreciation | | |
| (Depreciation) | | |
| Investment Securities | | (60,372) |
| Futures Contracts | | (23) |
| Net Assets | | 2,851,417 |
• See Note A in Notes to Financial Statements.
* Non-income-producing security.
1 The fund invests a portion of its cash reserves in equity markets through the use of index futures contracts. After giving effect to futures investments, the fund’s effective common stock and temporary cash investment positions represent 91.2% and 8.7%, respectively, of net assets.
2 Affiliated money market fund available only to Vanguard funds and certain trusts and accounts managed by Vanguard. Rate shown is the 7-day yield.
3 The issuer operates under a congressional charter; its securities are not backed by the full faith and credit of the U.S. government.
4 Securities with a value of $10,499,000 have been segregated as initial margin for open futures contracts.
ADR—American Depositary Receipt.
See accompanying Notes, which are an integral part of the Financial Statements.
16
| |
| Selected Value Fund | |
| |
| |
| Statement of Operations | |
| |
| | Year Ended |
| | October 31, 2009 |
| | ($000) |
| Investment Income | |
| Income | |
| Dividends1 | 56,328 |
| Interest2 | 1,979 |
| Security Lending | 275 |
| Total Income | 58,582 |
| Expenses | |
| Investment Advisory Fees—Note B | |
| Basic Fee | 5,906 |
| Performance Adjustment | 1,085 |
| The Vanguard Group—Note C | |
| Management and Administrative | 4,674 |
| Marketing and Distribution | 661 |
| Custodian Fees | 36 |
| Auditing Fees | 24 |
| Shareholders’ Reports and Proxies | 128 |
| Trustees’ Fees and Expenses | 5 |
| Total Expenses | 12,519 |
| Expenses Paid Indirectly | (288) |
| Net Expenses | 12,231 |
| Net Investment Income | 46,351 |
| Realized Net Gain (Loss) | |
| Investment Securities Sold | (257,146) |
| Futures Contracts | 9,896 |
| Foreign Currencies | 144 |
| Realized Net Gain (Loss) | (247,106) |
| Change in Unrealized Appreciation (Depreciation) | |
| Investment Securities | 701,531 |
| Futures Contracts | 2,355 |
| Change in Unrealized Appreciation (Depreciation) | 703,886 |
| Net Increase (Decrease) in Net Assets Resulting from Operations | 503,131 |
1 Dividends are net of foreign withholding taxes of $33,000.
2 Interest income from an affiliated company of the fund was $1,869,000.
See accompanying Notes, which are an integral part of the Financial Statements.
17
| | |
| Selected Value Fund | | |
| |
| |
| Statement of Changes in Net Assets | | |
| |
| | Year Ended October 31, |
| | 2009 | 2008 |
| | ($000) | ($000) |
| Increase (Decrease) in Net Assets | | |
| Operations | | |
| Net Investment Income | 46,351 | 82,975 |
| Realized Net Gain (Loss) | (247,106) | (192,386) |
| Change in Unrealized Appreciation (Depreciation) | 703,886 | (1,518,492) |
| Net Increase (Decrease) in Net Assets Resulting from Operations | 503,131 | (1,627,903) |
| Distributions | | |
| Net Investment Income | (78,192) | (80,704) |
| Realized Capital Gain1 | — | (338,084) |
| Total Distributions | (78,192) | (418,788) |
| Capital Share Transactions | | |
| Issued | 465,114 | 428,618 |
| Issued in Lieu of Cash Distributions | 69,913 | 371,336 |
| Redeemed2 | (531,001) | (1,321,353) |
| Net Increase (Decrease) from Capital Share Transactions | 4,026 | (521,399) |
| Total Increase (Decrease) | 428,965 | (2,568,090) |
| Net Assets | | |
| Beginning of Period | 2,422,452 | 4,990,542 |
| End of Period3 | 2,851,417 | 2,422,452 |
1 Includes fiscal 2008 short-term gain distributions totaling $35,553,000. Short-term gain distributions are treated as ordinary income dividends for tax purposes.
2 Net of redemption fees for fiscal 2009 and 2008 of $297,000 and $1,028,000, respectively.
3 Net Assets—End of Period includes undistributed net investment income of $29,601,000 and $61,298,000.
See accompanying Notes, which are an integral part of the Financial Statements.
18
| | | | | |
| Selected Value Fund | | | | | |
| |
| |
| Financial Highlights | | | | | |
| |
| |
| For a Share Outstanding | | | Year Ended October 31, |
| Throughout Each Period | 2009 | 2008 | 2007 | 2006 | 2005 |
| Net Asset Value, Beginning of Period | $12.48 | $22.11 | $21.38 | $18.99 | $16.76 |
| Investment Operations | | | | | |
| Net Investment Income | .254 | .3901 | .400 | .350 | .300 |
| Net Realized and Unrealized Gain (Loss) | | | | | |
| on Investments | 2.463 | (8.100) | 1.700 | 3.180 | 2.190 |
| Total from Investment Operations | 2.717 | (7.710) | 2.100 | 3.530 | 2.490 |
| Distributions | | | | | |
| Dividends from Net Investment Income | (.417) | (.370) | (.320) | (.290) | (.260) |
| Distributions from Realized Capital Gains | — | (1.550) | (1.050) | (.850) | — |
| Total Distributions | (.417) | (1.920) | (1.370) | (1.140) | (.260) |
| Net Asset Value, End of Period | $14.78 | $12.48 | $22.11 | $21.38 | $18.99 |
| |
| Total Return2 | 22.77% | –37.79% | 10.15% | 19.38% | 14.96% |
| |
| Ratios/Supplemental Data | | | | | |
| Net Assets, End of Period (Millions) | $2,851 | $2,422 | $4,991 | $4,326 | $3,707 |
| Ratio of Total Expenses to | | | | | |
| Average Net Assets3 | 0.52% | 0.38% | 0.42% | 0.45% | 0.51% |
| Ratio of Net Investment Income to | | | | | |
| Average Net Assets | 1.93% | 2.21% | 1.74% | 1.75% | 1.81% |
| Portfolio Turnover Rate | 30% | 23% | 33% | 37% | 28% |
1 Calculated based on average shares outstanding.
2 Total returns do not reflect the 1% fee assessed on redemptions after March 23, 2005, of shares held for less than one year; the 1% fee assessed until March 23, 2005, on shares purchased on or after August 7, 2001, and held for less than five years; or the account service fee that may be applicable to certain accounts with balances below $10,000.
3 Includes performance-based investment advisory fee increases (decreases) of 0.05%, (0.03%), (0.02%), (0.05%), and (0.02%).
See accompanying Notes, which are an integral part of the Financial Statements.
19
Selected Value Fund
Notes to Financial Statements
Vanguard Selected Value Fund is registered under the Investment Company Act of 1940 as an open-end investment company, or mutual fund.
A. The following significant accounting policies conform to generally accepted accounting principles for U.S. mutual funds. The fund consistently follows such policies in preparing its financial statements.
1. Security Valuation: Securities are valued as of the close of trading on the New York Stock Exchange (generally 4 p.m., Eastern time) on the valuation date. Equity securities are valued at the latest quoted sales prices or official closing prices taken from the primary market in which each security trades; such securities not traded on the valuation date are valued at the mean of the latest quoted bid and asked prices. Securities for which market quotations are not readily available, or whose values have been affected by events occurring before the fund’s pricing time but after the close of the securities’ primary markets, are valued at their fair values calculated according to procedures adopted by the board of trustees. These procedures include obtaining quotations from an independent pricing service, monitoring news to identify significant market- or security-specific events, and evaluating changes in the va lues of foreign market proxies (for example, ADRs, futures contracts, or exchange-traded funds), between the time the foreign markets close and the fund’s pricing time. When fair-value pricing is employed, the prices of securities used by a fund to calculate its net asset value may differ from quoted or published prices for the same securities. Investments in Vanguard Market Liquidity Fund are valued at that fund’s net asset value. Temporary cash investments acquired over 60 days to maturity are valued using the latest bid prices or using valuations based on a matrix system (which considers such factors as security prices, yields, maturities, and ratings), both as furnished by independent pricing services. Other temporary cash investments are valued at amortized cost, which approximates market value.
2. Foreign Currency: Securities and other assets and liabilities denominated in foreign currencies are translated into U.S. dollars using exchange rates obtained from an independent third party as of the fund’s pricing time on the valuation date. Realized gains (losses) and unrealized appreciation (depreciation) on investment securities include the effects of changes in exchange rates since the securities were purchased, combined with the effects of changes in security prices. Fluctuations in the value of other assets and liabilities resulting from changes in exchange rates are recorded as unrealized foreign currency gains (losses) until the assets or liabilities are settled in cash, at which time they are recorded as realized foreign currency gains (losses).
3. Futures Contracts: The fund uses index futures contracts to a limited extent, with the objective of maintaining full exposure to the stock market while maintaining liquidity. The fund may purchase or sell futures contracts to achieve a desired level of investment, whether to accommodate portfolio turnover or cash flows from capital share transactions. The primary risks associated with the use of futures contracts are imperfect correlation between changes in market values of stocks held by the fund and the prices of futures contracts, and the possibility of an illiquid market.
Futures contracts are valued at their quoted daily settlement prices. The aggregate principal amounts of the contracts are not recorded in the Statement of Net Assets. Fluctuations in the value of the contracts are recorded in the Statement of Net Assets as an asset (liability) and in the Statement of Operations as unrealized appreciation (depreciation) until the contracts are closed, when they are recorded as realized futures gains (losses).
20
Selected Value Fund
4. Federal Income Taxes: The fund intends to continue to qualify as a regulated investment company and distribute all of its taxable income. Management has analyzed the fund’s tax positions taken for all open federal income tax years (October 31, 2006–2009), and has concluded that no provision for federal income tax is required in the fund’s financial statements.
5. Distributions: Distributions to shareholders are recorded on the ex-dividend date.
6. Security Lending: The fund may lend its securities to qualified institutional borrowers to earn additional income. Security loans are required to be secured at all times by collateral at least equal to the market value of securities loaned. The fund invests cash collateral received in Vanguard Market Liquidity Fund, and records a liability for the return of the collateral, during the period the securities are on loan. Security lending income represents the income earned on investing cash collateral, less expenses associated with the loan.
7. Other: Dividend income is recorded on the ex-dividend date. Interest income includes income distributions received from Vanguard Market Liquidity Fund and is accrued daily. Security transactions are accounted for on the date securities are bought or sold. Costs used to determine realized gains (losses) on the sale of investment securities are those of the specific securities sold. Fees assessed on redemptions of capital shares are credited to paid-in capital.
B. Barrow, Hanley, Mewhinney & Strauss, Inc., and Donald Smith & Co., Inc., each provide investment advisory services to a portion of the fund for a fee calculated at an annual percentage rate of average net assets managed by the advisor. The basic fee of Barrow, Hanley, Mewhinney & Strauss, Inc., is subject to quarterly adjustments based on performance for the preceding three years relative to the Russell Midcap Value Index. The basic fee of Donald Smith & Co., Inc., is subject to quarterly adjustments based on performance since July 31, 2005, relative to the MSCI Investable Market 2500 Index.
The Vanguard Group manages the cash reserves of the fund on an at-cost basis.
For the year ended October 31, 2009, the aggregate investment advisory fee represented an effective annual basic rate of 0.25% of the fund’s average net assets, before an increase of $1,085,000 (0.05%) based on performance.
C. The Vanguard Group furnishes at cost corporate management, administrative, marketing, and distribution services. The costs of such services are allocated to the fund under methods approved by the board of trustees. The fund has committed to provide up to 0.40% of its net assets in capital contributions to Vanguard. At October 31, 2009, the fund had contributed capital of $609,000 to Vanguard (included in Other Assets), representing 0.02% of the fund’s net assets and 0.24% of Vanguard’s capitalization. The fund’s trustees and officers are also directors and officers of Vanguard.
D. The fund has asked its investment advisors to direct certain security trades, subject to obtaining the best price and execution, to brokers who have agreed to rebate to the fund part of the commissions generated. Such rebates are used solely to reduce the fund’s management and administrative expenses. For the year ended October 31, 2009, these arrangements reduced the fund’s expenses by $288,000 (an annual rate of 0.01% of average net assets).
E. Various inputs may be used to determine the value of the fund’s investments. These inputs are summarized in three broad levels for financial statement purposes. The inputs or methodologies used to value securities are not necessarily an indication of the risk associated with investing in those securities.
21
Selected Value Fund
Level 1—Quoted prices in active markets for identical securities.
Level 2—Other significant observable inputs (including quoted prices for similar securities, interest rates, prepayment speeds, credit risk, etc.).
Level 3—Significant unobservable inputs (including the fund’s own assumptions used to determine the fair value of investments).
The following table summarizes the fund’s investments as of October 31, 2009, based on the inputs
used to value them:
| | | |
| | Level 1 | Level 2 | Level 3 |
| Investments | ($000) | ($000) | ($000) |
| Common Stocks | 2,491,949 | — | — |
| Temporary Cash Investments | 345,202 | 10,499 | — |
| Futures Contracts—Liabilities1 | (3,005) | — | — |
| Total | 2,834,146 | 10,499 | — |
| 1 Represents variation margin on the last day of the reporting period. | | | |
F. At October 31, 2009, the aggregate settlement value of open futures contracts and the related unrealized appreciation (depreciation) were:
| | | | |
| | | | | ($000) |
| | | Number of | Aggregate | Unrealized |
| | | Long (Short) | Settlement | Appreciation |
| Futures Contracts | Expiration | Contracts | Value | (Depreciation) |
| S&P 500 Index | December 2009 | 352 | 90,904 | 451 |
| E-mini S&P 500 Index | December 2009 | 352 | 18,181 | (474) |
Unrealized appreciation (depreciation) on open futures contracts is required to be treated as realized gain (loss) for tax purposes.
G. Distributions are determined on a tax basis and may differ from net investment income and realized capital gains for financial reporting purposes. Differences may be permanent or temporary. Permanent differences are reclassified among capital accounts in the financial statements to reflect their tax character. Temporary differences arise when certain items of income, expense, gain, or loss are recognized in different periods for financial statement and tax purposes; these differences will reverse at some time in the future. Differences in classification may also result from the treatment of short-term gains as ordinary income for tax purposes.
During the year ended October 31, 2009, the fund realized net foreign currency gains of $144,000, which increased distributable net income for tax purposes; accordingly, such gains have been reclassified from accumulated net realized losses to undistributed net investment income.
For tax purposes, at October 31, 2009, the fund had $35,499,000 of ordinary income available for distribution. The fund had available capital loss carryforwards totaling $443,851,000 to offset future net capital gains of $194,512,000 through October 31, 2016, and $249,339,000 through October 31, 2017.
22
Selected Value Fund
At October 31, 2009, the cost of investment securities for tax purposes was $2,908,022,000. Net unrealized depreciation of investment securities for tax purposes was $60,372,000, consisting of unrealized gains of $388,438,000 on securities that had risen in value since their purchase and $448,810,000 in unrealized losses on securities that had fallen in value since their purchase.
H. During the year ended October 31, 2009, the fund purchased $623,727,000 of investment securities and sold $745,625,000 of investment securities, other than temporary cash investments.
| | |
| I. Capital shares issued and redeemed were: | | |
| | Year Ended October 31, |
| | 2009 | 2008 |
| | Shares | Shares |
| | (000) | (000) |
| Issued | 36,852 | 24,952 |
| Issued in Lieu of Cash Distributions | 6,144 | 19,762 |
| Redeemed | (44,143) | (76,343) |
| Net Increase (Decrease) in Shares Outstanding | (1,147) | (31,629) |
J. In preparing the financial statements as of October 31, 2009, management considered the impact of subsequent events occurring through December 8, 2009, for potential recognition or disclosure in these financial statements.
23
Report of Independent Registered Public Accounting Firm
To the Trustees of Vanguard Whitehall Funds and the Shareholders of Vanguard Selected Value Fund:
In our opinion, the accompanying statement of net assets and the related statements of operations and of changes in net assets and the financial highlights present fairly, in all material respects, the financial position of Vanguard Selected Value Fund (the "Fund") at October 31, 2009, the results of its operations for the year then ended, the changes in its net assets for each of the two years in the period then ended and the financial highlights for each of the five years in the period then ended, in conformity with accounting principles generally accepted in the United States of America. These financial statements and financial highlights (hereafter referred to as "financial statements") are the responsibility of the Fund's management; our responsibility is to express an opinion on these financial statements based on our audits. We conducted our audits of these financial statements in accordance with the standards of th e Public Company Accounting Oversight Board (United States). Those standards require that we plan and perform the audit to obtain reasonable assurance about whether the financial statements are free of material misstatement. An audit includes examining, on a test basis, evidence supporting the amounts and disclosures in the financial statements, assessing the accounting principles used and significant estimates made by management, and evaluating the overall financial statement presentation. We believe that our audits, which included confirmation of securities at October 31, 2009 by correspondence with the custodian and broker and by agreement to the underlying ownership records of Vanguard Market Liquidity Fund, provide a reasonable basis for our opinion.
PricewaterhouseCoopers LLP
Philadelphia, Pennsylvania
December 8, 2009
|
| Special 2009 tax information (unaudited) for Vanguard Selected Value Fund |
This information for the fiscal year ended October 31, 2009, is included pursuant to provisions of the Internal Revenue Code.
The fund distributed $66,651,000 of qualified dividend income to shareholders during the fiscal year.
For corporate shareholders, 96.0% of investment income (dividend income plus short-term gains, if any) qualifies for the dividends-received deduction.
24
Your Fund’s After-Tax Returns
This table presents returns for your fund both before and after taxes. The after-tax returns are shown in two ways: (1) assuming that an investor owned the fund during the entire period and paid taxes on the fund’s distributions, and (2) assuming that an investor paid taxes on the fund’s distributions and sold all shares at the end of each period.
Calculations are based on the highest individual federal income tax and capital gains tax rates in effect at the times of the distributions and the hypothetical sales. State and local taxes were not considered. After-tax returns reflect any qualified dividend income, using actual prior-year figures and estimates for 2009. (In the example, returns after the sale of fund shares may be higher than those assuming no sale. This occurs when the sale would have produced a capital loss. The calculation assumes that the investor received a tax deduction for the loss.)
Please note that your actual after-tax returns will depend on your tax situation and may differ from those shown. Also note that if you own the fund in a tax-deferred account, such as an individual retirement account or a 401(k) plan, this information does not apply to you. Such accounts are not subject to current taxes.
Finally, keep in mind that a fund’s performance—whether before or after taxes—does not guarantee future results.
| | | |
| Average Annual Total Returns: Selected Value Fund1 | | | |
| Periods Ended October 31, 2009 | | | |
| | One | Five | Ten |
| | Year | Years | Years |
| Returns Before Taxes | 22.77% | 2.92% | 8.06% |
| Returns After Taxes on Distributions | 21.99 | 1.97 | 7.23 |
| Returns After Taxes on Distributions and Sale of Fund Shares | 15.25 | 2.43 | 6.85 |
1 Total returns do not reflect the 1% fee assessed on redemptions after March 23, 2005, of shares held for less than one year; the 1% fee assessed until March 23, 2005, on shares purchased on or after August 7, 2001, and held for less than five years; or the account service fee that may be applicable to certain accounts with balances below $10,000.
25
About Your Fund’s Expenses
As a shareholder of the fund, you incur ongoing costs, which include costs for portfolio management, administrative services, and shareholder reports (like this one), among others. Operating expenses, which are deducted from a fund’s gross income, directly reduce the investment return of the fund.
A fund’s expenses are expressed as a percentage of its average net assets. This figure is known as the expense ratio. The following examples are intended to help you understand the ongoing costs (in dollars) of investing in your fund and to compare these costs with those of other mutual funds. The examples are based on an investment of $1,000 made at the beginning of the period shown and held for the entire period.
The accompanying table illustrates your fund’s costs in two ways:
• Based on actual fund return. This section helps you to estimate the actual expenses that you paid over the period. The “Ending Account Value” shown is derived from the fund’s actual return, and the third column shows the dollar amount that would have been paid by an investor who started with $1,000 in the fund. You may use the information here, together with the amount you invested, to estimate the expenses that you paid over the period.
To do so, simply divide your account value by $1,000 (for example, an $8,600 account value divided by $1,000 = 8.6), then multiply the result by the number given for your fund under the heading “Expenses Paid During Period.”
• Based on hypothetical 5% yearly return. This section is intended to help you compare your fund’s costs with those of other mutual funds. It assumes that the fund had a yearly return of 5% before expenses, but that the expense ratio is unchanged. In this case—because the return used is not the fund’s actual return—the results do not apply to your investment. The example is useful in making comparisons because the Securities and Exchange Commission requires all mutual funds to calculate expenses based on a 5% return. You can assess your fund’s costs by comparing this hypothetical example with the hypothetical examples that appear in shareholder reports of other funds.
| | | |
| Six Months Ended October 31, 2009 | | | |
| | Beginning | Ending | Expenses |
| | Account Value | Account Value | Paid During |
| Selected Value Fund | 4/30/2009 | 10/31/2009 | Period1 |
| Based on Actual Fund Return | $1,000.00 | $1,220.48 | $2.80 |
| Hypothetical 5% Yearly Return | 1,000.00 | 1,022.68 | 2.55 |
Note that the expenses shown in the table are meant to highlight and help you compare ongoing costs only and do not reflect transaction costs incurred by the fund for buying and selling securities. Further, the expenses do not include the 1% fee on redemptions of shares held for less than one year, nor do they include the account service fee described in the prospectus. If such fees were applied to your account, your costs would be higher. Your fund does not carry a “sales load.”
1 The calculations are based on expenses incurred in the most recent six-month period. The fund’s annualized six-month expense ratio for that period is 0.50%. The dollar amounts shown as “Expenses Paid” are equal to the annualized expense ratio multiplied by the average account value over the period, multiplied by the number of days in the most recent six-month period, then divided by the number of days in the most recent 12-month period.
26
The calculations assume no shares were bought or sold during the period. Your actual costs may have been higher or lower, depending on the amount of your investment and the timing of any purchases or redemptions.
You can find more information about the fund’s expenses, including annual expense ratios, in the Financial Statements section of this report. For additional information on operating expenses and other shareholder costs, please refer to your fund’s current prospectus.
27
Glossary
Beta. A measure of the magnitude of a fund’s past share-price fluctuations in relation to the ups and downs of a given market index. The index is assigned a beta of 1.00. Compared with a given index, a fund with a beta of 1.20 typically would have seen its share price rise or fall by 12% when the index rose or fell by 10%. For this report, beta is based on returns over the past 36 months for both the fund and the index. Note that a fund’s beta should be reviewed in conjunction with its R-squared (see definition). The lower the R-squared, the less correlation there is between the fund and the index, and the less reliable beta is as an indicator of volatility.
Earnings Growth Rate. The average annual rate of growth in earnings over the past five years for the stocks now in a fund.
Equity Exposure. A measure that reflects a fund’s investments in stocks and stock futures. Any holdings in short-term reserves are excluded.
Expense Ratio. The percentage of a fund’s average net assets used to pay its annual administrative and advisory expenses. These expenses directly reduce returns to investors.
Foreign Holdings. The percentage of a fund represented by stocks or depositary receipts of companies based outside the United States.
Inception Date. The date on which the assets of a fund (or one of its share classes) are first invested in accordance with the fund’s investment objective. For funds with a subscription period, the inception date is the day after that period ends. Investment performance is measured from the inception date.
Median Market Cap. An indicator of the size of companies in which a fund invests; the midpoint of market capitalization (market price x shares outstanding) of a fund’s stocks, weighted by the proportion of the fund’s assets invested in each stock. Stocks representing half of the fund’s assets have market capitalizations above the median, and the rest are below it.
Price/Book Ratio. The share price of a stock divided by its net worth, or book value, per share. For a fund, the weighted average price/book ratio of the stocks it holds.
Price/Earnings Ratio. The ratio of a stock’s current price to its per-share earnings over the past year. For a fund, the weighted average P/E of the stocks it holds. P/E is an indicator of market expectations about corporate prospects; the higher the P/E, the greater the expectations for a company’s future growth.
R-Squared. A measure of how much of a fund’s past returns can be explained by the returns from the market in general, as measured by a given index. If a fund’s total returns were precisely synchronized with an index’s returns, its R-squared would be 1.00. If the fund’s returns bore no relationship to the index’s returns, its R-squared would be 0. For this report, R-squared is based on returns over the past 36 months for both the fund and the index.
Return on Equity. The annual average rate of return generated by a company during the past five years for each dollar of shareholder’s equity (net income divided by shareholder’s equity). For a fund, the weighted average return on equity for the companies whose stocks it holds.
Short-Term Reserves. The percentage of a fund invested in highly liquid, short-term securities that can be readily converted to cash.
28
Turnover Rate. An indication of the fund’s trading activity. Funds with high turnover rates incur higher transaction costs and may be more likely to distribute capital gains (which may be taxable to investors). The turnover rate excludes in-kind transactions, which have minimal impact on costs.
Yield. A fund’s 30-day SEC yield is derived using a formula specified by the U.S. Securities and Exchange Commission. Under the formula, data related to the fund’s security holdings in the previous 30 days are used to calculate the fund’s hypothetical net income for that period, which is then annualized and divided by the fund’s estimated average net assets over the calculation period. For the purposes of this calculation, a security’s income is based on its current market yield to maturity (in the case of bonds) or its projected dividend yield (for stocks). Because the SEC yield represents hypothetical annualized income, it will differ—at times significantly—from the fund’s actual experience. As a result, the fund’s income distributions may be higher or lower than implied by the SEC yield.
29
This page intentionally left blank.
This page intentionally left blank.
The People Who Govern Your Fund
The trustees of your mutual fund are there to see that the fund is operated and managed in your best interests since, as a shareholder, you are a part owner of the fund. Your fund’s trustees also serve on the board of directors of The Vanguard Group, Inc., which is owned by the Vanguard funds and provides services to them on an at-cost basis.
A majority of Vanguard’s board members are independent, meaning that they have no affiliation with Vanguard or the funds they oversee, apart from the sizable personal investments they have made as private individuals. The independent board members have distinguished backgrounds in business, academia, and public service. Each of the trustees and executive officers oversees 156 Vanguard funds.
The following table provides information for each trustee and executive officer of the fund. More information about the trustees is in the Statement of Additional Information, which can be obtained, without charge, by contacting Vanguard at 800-662-7447, or online at www.vanguard.com.
| |
| Interested Trustees | Emerson U. Fullwood |
| | Born 1948. Trustee Since January 2008. Principal |
| John J. Brennan1 | Occupation(s) During the Past Five Years: Executive |
| Born 1954. Trustee Since May 1987. Chairman of | Chief Staff and Marketing Officer for North America |
| the Board. Principal Occupation(s) During the Past | and Corporate Vice President (retired 2008) of Xerox |
| Five Years: Chairman of the Board and Director/Trustee | Corporation (photocopiers and printers); Director of |
| of The Vanguard Group, Inc., and of each of the | SPX Corporation (multi-industry manufacturing), the |
| investment companies served by The Vanguard Group; | United Way of Rochester, the Boy Scouts of America, |
| Chief Executive Officer (1996–2008) and President | Amerigroup Corporation (direct health and medical |
| (1989–2008) of The Vanguard Group and of each of the | insurance carriers), and Monroe Community College |
| investment companies served by The Vanguard Group; | Foundation. |
| Chairman of the Financial Accounting Foundation; | |
| Governor of the Financial Industry Regulatory Authority | Rajiv L. Gupta |
| (FINRA); Director of United Way of Southeastern | Born 1945. Trustee Since December 2001.2 Principal |
| Pennsylvania. | Occupation(s) During the Past Five Years: Chairman |
| | and Chief Executive Officer (retired 2009) and President |
| F. William McNabb III1 | (2006–2008) of Rohm and Haas Co. (chemicals); Board |
| Born 1957. Trustee Since July 2009. Principal | Member of American Chemistry Council; Director of |
| Occupation(s) During the Past Five Years: Director of | Tyco International, Ltd. (diversified manufacturing and |
| The Vanguard Group, Inc., since 2008; Chief Executive | services) and Hewlett-Packard Co. (electronic computer |
| Officer and President of The Vanguard Group and of | manufacturing); Trustee of The Conference Board. |
| each of the investment companies served by The | |
| Vanguard Group since 2008; Director of Vanguard | Amy Gutmann |
| Marketing Corporation; Managing Director of The | Born 1949. Trustee Since June 2006. Principal |
| Vanguard Group (1995–2008). | Occupation(s) During the Past Five Years: President of |
| | the University of Pennsylvania; Christopher H. Browne |
| | Distinguished Professor of Political Science in the School |
| Independent Trustees | of Arts and Sciences with secondary appointments |
| | at the Annenberg School for Communication and the |
| Charles D. Ellis | Graduate School of Education of the University of |
| Born 1937. Trustee Since January 2001. Principal | Pennsylvania; Director of Carnegie Corporation of |
| Occupation(s) During the Past Five Years: Applecore | New York, Schuylkill River Development Corporation, |
| Partners (pro bono ventures in education); Senior | and Greater Philadelphia Chamber of Commerce; |
| Advisor to Greenwich Associates (international business | Trustee of the National Constitution Center. |
| strategy consulting); Successor Trustee of Yale University; | |
| Overseer of the Stern School of Business at New York | |
| University; Trustee of the Whitehead Institute for | |
| Biomedical Research. | |
| | |
| JoAnn Heffernan Heisen | Executive Officers | |
| Born 1950. Trustee Since July 1998. Principal | | |
| Occupation(s) During the Past Five Years: Corporate | Thomas J. Higgins1 | |
| Vice President and Chief Global Diversity Officer since | Born 1957. Chief Financial Officer Since September |
| 2006 (retired 2008) and Member of the Executive | 2008. Principal Occupation(s) During the Past Five |
| Committee (retired 2008) of Johnson & Johnson | Years: Principal of The Vanguard Group, Inc.; Chief |
| (pharmaceuticals/consumer products); Vice President | Financial Officer of each of the investment companies |
| and Chief Information Officer of Johnson & Johnson | served by The Vanguard Group since 2008; Treasurer |
| (1997–2005); Director of the University Medical Center | of each of the investment companies served by The |
| at Princeton and Women’s Research and Education | Vanguard Group (1998–2008). |
| Institute; Member of the Advisory Board of the Maxwell | | |
| School of Citizenship and Public Affairs at Syracuse | | |
| University. | Kathryn J. Hyatt1 | |
| | Born 1955. Treasurer Since November 2008. Principal |
| | Occupation(s) During the Past Five Years: Principal of |
| F. Joseph Loughrey | The Vanguard Group, Inc.; Treasurer of each of the |
| Born 1949. Trustee Since October 2009. Principal | investment companies served by The Vanguard |
| Occupation(s) During the Past Five Years: President and | Group since 2008; Assistant Treasurer of each of the |
| Chief Operating Officer since 2005 (retired 2009) and | investment companies served by The Vanguard Group |
| Vice Chairman of the Board (2008–2009) of Cummins | (1988–2008). | |
| Inc. (industrial machinery); Director of SKF AB (industrial | | |
| machinery), Hillenbrand, Inc. (specialized consumer | | |
| services), Sauer-Danfoss Inc. (machinery), the Lumina | Heidi Stam1 | |
| Foundation for Education, and the Columbus Community | Born 1956. Secretary Since July 2005. Principal |
| Education Coalition; Chairman of the Advisory Council | Occupation(s) During the Past Five Years: Managing |
| for the College of Arts and Letters at the University of | Director of The Vanguard Group, Inc., since 2006; |
| Notre Dame. | General Counsel of The Vanguard Group since 2005; |
| | Secretary of The Vanguard Group and of each of the |
| | investment companies served by The Vanguard Group |
| André F. Perold | since 2005; Director and Senior Vice President of |
| Born 1952. Trustee Since December 2004. Principal | Vanguard Marketing Corporation since 2005; Principal |
| Occupation(s) During the Past Five Years: George Gund | of The Vanguard Group (1997–2006). |
| Professor of Finance and Banking, Harvard Business | | |
| School; Chair of the Investment Committee of HighVista | | |
| Strategies LLC (private investment firm). | Vanguard Senior Management Team |
| |
| Alfred M. Rankin, Jr. | R. Gregory Barton | Michael S. Miller |
| Born 1941. Trustee Since January 1993. Principal | Mortimer J. Buckley | James M. Norris |
| Occupation(s) During the Past Five Years: Chairman, | Kathleen C. Gubanich | Glenn W. Reed |
| President, and Chief Executive Officer of NACCO | Paul A. Heller | George U. Sauter |
| Industries, Inc. (forklift trucks/housewares/lignite); | | |
| Director of Goodrich Corporation (industrial products/ | | |
| aircraft systems and services); Deputy Chairman of | Founder | |
| the Federal Reserve Bank of Cleveland; Trustee of | | |
| University Hospitals of Cleveland, The Cleveland | | |
| Museum of Art, and Case Western Reserve University. | John C. Bogle | |
| | Chairman and Chief Executive Officer, 1974–1996 |
| |
| Peter F. Volanakis | | |
| Born 1955. Trustee Since July 2009. Principal | | |
| Occupation(s) During the Past Five Years: President | | |
| since 2007 and Chief Operating Officer since 2005 | | |
| of Corning Incorporated (communications equipment); | | |
| President of Corning Technologies (2001–2005); Director | | |
| of Corning Incorporated and Dow Corning; Trustee of | | |
| the Corning Incorporated Foundation and the Corning | | |
| Museum of Glass; Overseer of the Amos Tuck School | | |
| of Business Administration at Dartmouth College. | | |
1 These individuals are “interested persons” as defined in the Investment Company Act of 1940.
2 December 2002 for Vanguard Equity Income Fund, Vanguard Growth Equity Fund, the Vanguard Municipal Bond Funds, and the Vanguard
State Tax-Exempt Funds.
|  |
| P.O. Box 2600 |
| Valley Forge, PA 19482-2600 |
Connect with Vanguard® > www.vanguard.com
| |
| Fund Information > 800-662-7447 | All comparative mutual fund data are from Lipper Inc. |
| | or Morningstar, Inc., unless otherwise noted. |
| Direct Investor Account Services > 800-662-2739 | |
| | |
| Institutional Investor Services > 800-523-1036 | You can obtain a free copy of Vanguard’s proxy voting |
| | guidelines by visiting our website, www.vanguard.com, |
| Text Telephone for People | and searching for “proxy voting guidelines,” or by |
| With Hearing Impairment > 800-749-7273 | calling Vanguard at 800-662-2739. The guidelines are |
| | also available from the SEC’s website, www.sec.gov. |
| | In addition, you may obtain a free report on how your |
| | fund voted the proxies for securities it owned during |
| This material may be used in conjunction | the 12 months ended June 30. To get the report, visit |
| with the offering of shares of any Vanguard | either www.vanguard.com or www.sec.gov. |
| fund only if preceded or accompanied by | |
| the fund’s current prospectus. | You can review and copy information about your fund |
| | at the SEC’s Public Reference Room in Washington, D.C. |
| CFA® is a trademark owned by CFA Institute. | To find out more about this public service, call the SEC |
| | at 202-551-8090. Information about your fund is also |
| | available on the SEC’s website, and you can receive |
| | copies of this information, for a fee, by sending a |
| | request in either of two ways: via e-mail addressed to |
| | publicinfo@sec.gov or via regular mail addressed to the |
| | Public Reference Section, Securities and Exchange |
| | Commission, Washington, DC 20549-1520. |
| |
| |
| |
| |
| | © 2009 The Vanguard Group, Inc. |
| | All rights reserved. |
| | Vanguard Marketing Corporation, Distributor. |
| | Q9340 122009 |
 |
| Vanguard Mid-Cap Growth Fund |
| Annual Report |
|
|
| October 31, 2009 |
|
 |
|
|
> Vanguard Mid-Cap Growth Fund returned about 18% for the 12 months ended October 31, 2009.
> The fund’s return outpaced the average return for mid-cap growth funds but lagged behind the return of its benchmark, the Russell Midcap Growth Index.
> Holdings in the consumer discretionary and information technology sectors boosted fund returns.
| |
| Contents | |
| Your Fund’s Total Returns | 1 |
| President’s Letter | 2 |
| Advisors’ Report | 7 |
| Results of Proxy Voting | 10 |
| Fund Profile | 11 |
| Performance Summary | 12 |
| Financial Statements | 14 |
| Your Fund’s After-Tax Returns | 24 |
| About Your Fund’s Expenses | 25 |
| Glossary | 27 |
Please note: The opinions expressed in this report are just that—informed opinions. They should not be considered promises or advice. Also, please keep in mind that the information and opinions cover the period through the date on the front of this report. Of course, the risks of investing in your fund are spelled out in the prospectus.
Cover photograph: Veronica Coia.
| | | | |
| Your Fund’s Total Returns | | | |
| |
| |
| |
| |
| Fiscal Year Ended October 31, 2009 | | | | |
| | | | Ticker | Total |
| | | | Symbol | Returns |
| Vanguard Mid-Cap Growth Fund | | | VMGRX | 17.70% |
| Russell Midcap Growth Index | | | | 22.48 |
| Mid-Cap Growth Funds Average1 | | | | 16.45 |
| |
| |
| Your Fund’s Performance at a Glance | | | | |
| October 31, 2008–October 31, 2009 | | | | |
| | | | Distributions Per Share |
| | Starting | Ending | Income | Capital |
| | Share Price | Share Price | Dividends | Gains |
| Vanguard Mid-Cap Growth Fund | $11.82 | $13.86 | $0.040 | $0.000 |
1 Derived from data provided by Lipper Inc.
1

President’s Letter
Dear Shareholder,
Vanguard Mid-Cap Growth Fund returned about 18% for the fiscal year ended October 31, 2009. The fund trailed its benchmark, the Russell Midcap Growth Index, which returned about 22% for the period, but outperformed its peer group.
For the 12-month period, the majority of the fund’s returns came from two sectors: consumer discretionary and information technology. Meanwhile, industrials and health care weighed heavily on the portfolio. If you own shares of the fund in a taxable account, you may wish to review the section on the fund’s after-tax returns that appears later in this report.
A vicious bear market quickly turned bullish
A year ago, the global financial system stood on the brink of collapse as the expanding U.S. credit crisis precipitated the deepest worldwide recession since World War II. Since then, markets have pulled back from the depths and, in fact, have rallied impressively. Although U.S. unemployment has risen to double digits and signs of a robust recovery are hard to find, the global economy has begun to revive. For the first time in more than a year, U.S. gross domestic product registered growth, as reported by the Commerce Department for the third quarter of calendar 2009.
2
U.S. stocks recorded positive returns for the fiscal year ended October 31 as the market’s losses during the first four months of the period—marking the final plunge of a historic bear market—were erased by a remarkable rally beginning in March. Global stocks did even better, thanks to some renewed strength in developed markets and a powerful upswing in emerging markets that actually had some prognosticators worrying about a new asset bubble. Reminders of the markets’ travails are nevertheless apparent in the index returns for the past three years, where negative figures are the rule. Even the five-year returns for U.S. stocks as of October 31 are barely positive, further evidence of the long-term damage done by the collapse of the real estate bubble.
The bond market experienced an equally dramatic turnaround
The stock market’s rapid fall and recovery were matched by an equally dramatic turnaround in the bond market. At the end of 2008, as the credit markets virtually shut down, risk-averse investors flocked to U.S. Treasury bonds. The effect was to widen the difference between the lower yields of Treasuries and the higher yields of corporate bonds to a margin not seen since the Great Depression.
Central banks around the world responded to the economic slowdown by lowering interest rates and implementing other aggressive stimulus programs. Meanwhile, governments boosted spending in hopes of reversing the recessionary tide. As fears of a worldwide depression eased,
| | | |
| Market Barometer | | | |
| | | Average Annual Total Returns |
| | | Periods Ended October 31, 2009 |
| | One Year | Three Years | Five Years |
| Stocks | | | |
| Russell 1000 Index (Large-caps) | 11.20% | –6.84% | 0.71% |
| Russell 2000 Index (Small-caps) | 6.46 | –8.51 | 0.59 |
| Dow Jones U.S. Total Stock Market Index | 11.34 | –6.55 | 1.06 |
| MSCI All Country World Index ex USA (International) | 34.79 | –2.49 | 7.58 |
| |
| Bonds | | | |
| Barclays Capital U.S. Aggregate Bond Index | | | |
| (Broad taxable market) | 13.79% | 6.35% | 5.05% |
| Barclays Capital Municipal Bond Index | 13.60 | 4.17 | 4.15 |
| Citigroup 3-Month Treasury Bill Index | 0.28 | 2.50 | 2.94 |
| |
| CPI | | | |
| Consumer Price Index | –0.18% | 2.32% | 2.52% |
3
investors’ appetite for risk returned to more normal levels. The receding pessimism raised demand for corporate bonds, raising their prices and bringing down their yields. Over the past 12 months, both taxable and municipal bonds returned more than 13%.
However, the Fed’s easy-money campaign had a predictable effect on short-term savings vehicles such as money market funds, whose yields track prevailing short-term rates. In December 2008, the Fed reduced its target for the federal funds rate, a benchmark for the interest rates paid by money market instruments and other very short-term securities, to between 0% and 0.25%. The Fed has said it expects to maintain its target at this level “for an extended period.”
Mid-cap growth stocks make a strong comeback
The 12-month period covered in this report was an extremely volatile time for the U.S. markets. The period began amid a swift and steep decline in stock prices. In March, stocks rallied and the market began to rebound. Since the upswing began, mid-capitalization growth companies have been among those that have reaped the rewards, helping to lift the Mid-Cap Growth Fund to its return of about 18%.
Consumer discretionary stocks were among the fund’s main contributors to performance during the 12 months. Restaurants, hotels, and retailers saw their stocks spike as consumers tiptoed back into restaurants and shopping malls. The portfolio benefited from shoppers’
| | |
| Expense Ratios1 | | |
| Your Fund Compared With Its Peer Group | | |
| | | Mid-Cap |
| | | Growth Funds |
| | Fund | Average |
| Mid-Cap Growth Fund | 0.61% | 1.49% |
1 The fund expense ratio shown is from the prospectus dated February 27, 2009, and represents estimated costs for the current fiscal year based on the fund’s net assets as of the prospectus date. For the fiscal year ended October 31, 2009, the expense ratio was 0.60%. The peer-group expense ratio is derived from data provided by Lipper Inc. and captures information through year-end 2008.
4
guarded optimism, with the sector contributing almost ten percentage points to the fund’s total return.
The fund also had strong returns in the information technology sector. Technology stocks gained as corporations seemed ready to resume spending on communications equipment, computer hardware, and computer software. In financials, the fund benefited from good stock selection, particularly in asset management firms and investment banks. These stocks rebounded sharply as asset prices began to rise.
Holdings in industrial and health care stocks were the portfolio’s biggest disappointments for the period. Poor stock selection in industrial conglomerates and professional services within the industrial sector weighed on fund returns. In the health care arena, biotechnology stocks in particular hindered results.
Long-term advantage was diminished, but not erased, by the downturn
When evaluating a fund, Vanguard encourages investors to look at long-term performance. Even the long-term track record of an investment can be distorted, for better or worse, by the most recent short-term results. Although the Mid-Cap Growth Fund delivered strong returns for the most recent 12-month period, the big losses that preceded this rebound have taken some of the shine off its long-term record.
| |
| Total Returns | |
| Ten Years Ended October 31, 2009 | |
| | Average |
| | Annual Return |
| Mid-Cap Growth Fund | 4.04% |
| Russell Midcap Growth Index | 1.01 |
| Mid-Cap Growth Funds Average1 | –0.04 |
The figures shown represent past performance, which is not a guarantee of future results. (Current performance may be lower or higher than the performance data cited. For performance data current to the most recent month-end, visit our website at www.vanguard.com/performance.) Note, too, that both investment returns and principal value can fluctuate widely, so an investor's shares, when sold, could be worth more or less than their original cost.
1 Derived from data provided by Lipper Inc.
5
Over the past decade, the Mid-Cap Growth Fund has returned an average of about 4%. Just two years ago, at the end of the 2007 fiscal year, the fund had returned about 13% in the nearly ten years since its inception. Although the fund’s long-term results have obviously been affected by the market’s recent downturn, Mid-Cap Growth has performed significantly better than both its benchmark and peer group over the past ten years.
We have confidence in the fund’s advisors and their approach to investing, and we believe that the fund will continue to produce competitive returns over the long term.
Keep your sights set on long-term goals
Although recent months have brought good news for both stock prices and investors, the hardships of the not-so-distant past won’t be easily forgotten, an all-too-vivid reminder of the market’s short-term unpredictability.
Uncertainty is the one thing that we can count on in the financial markets. Because of this, Vanguard encourages investors to put these timeless rules of investing into practice: Maintain a long-term perspective and stay focused on your future goals. By creating a well-balanced and diversified portfolio that is consistent with your long-term goals and tolerance for risk, you’ll have a much better chance of sticking to these guidelines.
We believe that the Mid-Cap Growth Fund, with its low costs and diversification across mid-cap growth companies, can play a valuable role in such a well-balanced portfolio.
Thank you for entrusting your assets to Vanguard.
Sincerely,

F. William McNabb III
President and Chief Executive Officer
November 13, 2009
6
Advisors’ Report
During the fiscal year ended October 31, 2009, Vanguard Mid-Cap Growth Fund returned about 18%. Your fund is managed by two independent advisors, a strategy that enhances the fund’s diversification by providing exposure to distinct, yet complementary, investment approaches. It’s not uncommon for different advisors to have different views about individual securities or the broader investment environment.
The advisors, the percentage of fund assets each manages, and brief descriptions of their investment strategies are presented in the table below. The advisors have also prepared a discussion of the investment environment that existed during the fiscal year and of how portfolio positioning reflects this assessment.
These comments were prepared on November 17, 2009.
William Blair & Company, L.L.C.
Portfolio Managers:
Robert C. Lanphier, Principal
David Ricci, CFA, Principal
The 12 months ended October 31 stand in stark contrast to the prior 12-month period. The Russell Midcap Growth Index returned about 22% for the trailing year, after rallying swiftly from its March low. The crisis in confidence that ensued after the Lehman Brothers collapse in September 2008 led
| | | |
| Vanguard Mid-Cap Growth Fund Investment Advisors |
| |
| Fund Assets Managed | |
| Investment Advisor | % | $ Million | Investment Strategy |
| William Blair & Company, L.L.C. | 49 | 598 | Uses a fundamental investment approach in pursuit of |
| | | | superior long-term investment results from growth- |
| | | | oriented companies with leadership positions and |
| | | | strong market presence. |
| Chartwell Investment Partners, L.P. | 48 | 592 | Uses a bottom-up, fundamental, research-driven |
| | | | stock-selection strategy focusing on companies with |
| | | | sustainable growth, strong management teams, |
| | | | competitive positions, and outstanding product and |
| | | | service offerings. These companies should continually |
| | | | demonstrate growth in earnings per share. |
| Cash Investments | 3 | 39 | These short-term reserves are invested by Vanguard |
| | | | in equity index products to simulate investment in |
| | | | stocks. Each advisor may also maintain a modest |
| | | | cash position. |
7
to a freeze in consumer and business spending, which led to further compression in stock valuations and draconian earnings expectations.
The fourth quarter of 2008 and first quarter of 2009 proved to be the worst, as the economic decline slowed and eventually improved, primarily in response to the massive amounts of government stimulus. From a sector perspective, the market was led by materials (+34%), information technology (+33%), and consumer discretionary (+28%). Lagging the overall market were financials (+13%), industrials (+14%), and consumer staples (17%).
The crisis in confidence discussed above provided an excellent opportunity to initiate or increase positions in some great companies whose end markets were cyclically depressed late last year and into 2009. These opportunities were most prevalent in the consumer discretionary sector (e.g., Chipotle Mexican Grill and Dick’s Sporting Goods), but also existed in other sectors, such as financials (e.g., Affiliated Managers Group). These purchases most assuredly benefited absolute and relative performance over the year.
However, the portfolio did not participate fully in the market rally over the last eight months. Since the market inflection point, stocks that had underperformed during the downturn have rallied the most. Some of our stocks have been out of favor on a relative basis during this rally. The main area of relative weakness over the year was the industrials sector, where some of our business service companies, such as Stericycle and Iron Mountain, did not keep pace with their more cyclically oriented industrial peers.
We believe that after the market appreciation that took place over the last eight months, fundamentals are much more likely to drive stock prices going forward. Investors have begun to value stocks based on “normalized earnings”—that is, based on what profit margins and earnings are likely to be in a more normal economic environment. The risk is that the “more normal” economic environment doesn’t materialize. However, we believe opportunities remain across sectors.
One particular area of the portfolio that has seen a meaningful increase is the industrials sector. Broadly speaking, investors have not gravitated to this sector as much as to other sectors that tend to respond earlier in an economic recovery.
We remain focused on finding great companies with solid competitive positions at attractive valuations. We believe these companies will be the ones to gain market share coming out of this recession and the ones that should sustain above-average growth over the long term.
8
Chartwell Investment Partners, L.P.
Portfolio Managers:
Edward N. Antoian, CFA, CPA, Managing Partner
John A. Heffern, Managing Partner and Senior Portfolio Manager
History shows that the encore to a broad-based rally led by lower-quality issues is not “more of the same.” Eventually, almost inevitably, investors shift to traditional measures of fundamental strength and growth in making their decisions about capital allocation. That approach is at the core of our time-tested mid-cap growth investment process, and we think it will serve us well in the quarters and years ahead, just as it has in years past.
Cost control amid still-tepid revenues has supported profit margins and fueled a rally in public market valuations. This focus on cost control is evident in the continued weakness in national employment data. Capital and labor are two fundamental economic inputs, and it is clear that capital and profits are being protected at the expense of labor. We expect continued stability in corporate margins, but a sluggish recovery overall. Our stock selection is based on our expectation that enhanced incremental margins will drive superior investment performance as the year draws to a close and we look to further recovery in 2010.
For the 12-month period, stock selection was strong in utilities and consumer services and staples. Wireless telecommunication towers were the focus of our investments in utilities; they have benefited from the need to build out wireless networks and infrastructure. Apparel companies like Guess? and Warnaco Group have rebounded nicely from their March lows as consumers are slowly regaining their confidence. An underweight position in consumer staples added value as the markets recovered and investors sought riskier investments. Our largest consumer holding, Jarden Corp., a manufacturer of consumer lifestyle products, performed particularly well.
Two areas of the market that were down on a relative basis were health care and basic industry. Within health care, biotechnology was especially disappointing. Positive binary outcomes during drug development are essential to the industry, but several outcomes we were looking for in firms we owned never came to fruition. In basic industry, we owned Delta Air Lines early in the period when fuel prices dropped dramatically. Unfortunately, the downturn in the economy reduced demand for air travel to anemic levels, offsetting the advantage of the lower cost structure.
9
Results of Proxy Voting
At a special meeting of shareholders on July 2, 2009, fund shareholders approved the following two proposals:
Proposal 1—Elect trustees for each fund.*
The individuals listed in the table below were elected as trustees for each fund. All trustees with the exception of Messrs. McNabb and Volanakis (both of whom already served as directors of The Vanguard Group, Inc.) served as trustees to the funds prior to the shareholder meeting.
| | | |
| | | | Percentage |
| Trustee | For | Withheld | For |
| John J. Brennan | 267,380,786 | 8,631,474 | 96.9% |
| Charles D. Ellis | 256,520,935 | 19,491,324 | 92.9% |
| Emerson U. Fullwood | 257,085,311 | 18,926,948 | 93.1% |
| Rajiv L. Gupta | 266,612,131 | 9,400,128 | 96.6% |
| Amy Gutmann | 267,915,925 | 8,096,335 | 97.1% |
| JoAnn Heffernan Heisen | 266,998,335 | 9,013,925 | 96.7% |
| F. William McNabb III | 267,044,346 | 8,967,914 | 96.8% |
| André F. Perold | 256,971,735 | 19,040,525 | 93.1% |
| Alfred M. Rankin, Jr. | 266,847,723 | 9,164,536 | 96.7% |
| Peter F. Volanakis | 266,899,599 | 9,112,660 | 96.7% |
| * Results are for all funds within the same trust. | | | |
Proposal 2—Update and standardize the funds’ fundamental policies regarding:
(a) Purchasing and selling real estate.
(b) Issuing senior securities.
(c) Borrowing money.
(d) Making loans.
(e) Purchasing and selling commodities.
(f) Concentrating investments in a particular industry or group of industries.
(g) Eliminating outdated fundamental investment policies not required by law.
The revised fundamental policies are clearly stated and simple, yet comprehensive, making oversight and compliance more efficient than under the former policies. The revised fundamental policies will allow the funds to respond more quickly to regulatory and market changes, while avoiding the costs and delays associated with successive shareholder meetings.
| | | | | |
| | | | | Broker | Percentage |
| Vanguard Fund | For | Abstain | Against | Non-Votes | For |
| Mid-Cap Growth Fund | | | | | |
| 2a | 50,179,185 | 1,280,718 | 785,675 | 3,731,050 | 89.6% |
| 2b | 50,037,011 | 1,379,505 | 829,062 | 3,731,050 | 89.4% |
| 2c | 49,744,486 | 1,308,553 | 1,192,540 | 3,731,049 | 88.9% |
| 2d | 49,777,611 | 1,296,706 | 1,171,263 | 3,731,049 | 88.9% |
| 2e | 49,989,988 | 1,283,678 | 971,913 | 3,731,049 | 89.3% |
| 2f | 50,058,640 | 1,304,161 | 882,777 | 3,731,050 | 89.4% |
| 2g | 50,154,056 | 1,343,157 | 748,367 | 3,731,049 | 89.6% |
10
Mid-Cap Growth Fund
Fund Profile
As of October 31, 2009
| | | |
| Portfolio Characteristics | | |
| | | Comparative | Broad |
| | Fund | Index1 | Index2 |
| Number of Stocks | 102 | 488 | 4,310 |
| Median Market Cap | $3.6B | $5.4B | $28.3B |
| Price/Earnings Ratio | 38.3x | 37.6x | 30.3x |
| Price/Book Ratio | 2.7x | 3.0x | 2.1x |
| Yield3 | 0.0% | 1.1% | 1.9% |
| Return on Equity | 17.7% | 19.8% | 19.4% |
| Earnings Growth Rate | 13.6% | 14.6% | 9.3% |
| Foreign Holdings | 1.4% | 0.0% | 0.0% |
| Turnover Rate | 125% | — | — |
| Expense Ratio4 | 0.61% | — | — |
| Short-Term Reserves | 1.3% | — | — |
| | | |
| Sector Diversification (% of equity exposure) |
| | Comparative | Broad |
| | Fund | Index1 | Index2 |
| Consumer Discretionary | 23.5% | 17.9% | 10.0% |
| Consumer Staples | 2.0 | 7.6 | 10.3 |
| Energy | 6.0 | 5.6 | 11.6 |
| Financials | 8.2 | 9.1 | 16.3 |
| Health Care | 11.5 | 13.5 | 11.9 |
| Industrials | 14.7 | 14.6 | 10.4 |
| Information Technology | 27.6 | 22.7 | 19.1 |
| Materials | 4.9 | 4.9 | 3.8 |
| Telecommunication | | | |
| Services | 1.4 | 1.0 | 2.8 |
| Utilities | 0.2 | 3.1 | 3.8 |
| | |
| Volatility Measures5 | |
| | Fund Versus | Fund Versus |
| | Comparative Index1 | Broad Index2 |
| R-Squared | 0.96 | 0.93 |
| Beta | 0.87 | 1.02 |
| | |
| Ten Largest Holdings6 (% of total net assets) |
| Cognizant Technology | information | |
| Solutions Corp. Class A | technology | |
| | consulting and | |
| | other services | 2.3% |
| DeVry Inc. | education services | 2.3 |
| Alliance Data | data processing and | |
| Systems Corp. | outsourced services | 2.2 |
| WMS Industries Inc. | casinos and gaming | 2.2 |
| Silicon Laboratories Inc. | semiconductors | 1.9 |
| O’Reilly Automotive Inc. | automotive retail | 1.8 |
| Mettler-Toledo | life sciences tools | |
| International Inc. | and services | 1.6 |
| Fastenal Co. | trading companies | |
| | and distributors | 1.5 |
| Chipotle Mexican Grill Inc. | | |
| Class B | restaurants | 1.5 |
| Dick’s Sporting Goods Inc. | specialty stores | 1.5 |
| Top Ten | | 18.8% |
Investment Focus
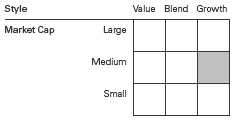
1 Russell Midcap Growth Index.
2 Dow Jones U.S. Total Stock Market Index.
3 30-day SEC yield for the fund; annualized dividend yield for the indexes. See the Glossary.
4 The expense ratio shown is from the prospectus dated February 27, 2009, and represents estimated costs for the current fiscal year based on the fund’s net assets as of the prospectus date. For the fiscal year ended October 31, 2009, the expense ratio was 0.60%.
5 For an explanation of R-squared, beta, and other terms used here, see the Glossary.
6 The holdings listed exclude any temporary cash investments and equity index products.
11
Mid-Cap Growth Fund
Performance Summary
All of the returns in this report represent past performance, which is not a guarantee of future results that may be achieved by the fund. (Current performance may be lower or higher than the performance data cited. For performance data current to the most recent month-end, visit our website at www.vanguard.com/performance.) Note, too, that both investment returns and principal value can fluctuate widely, so an investor’s shares, when sold, could be worth more or less than their original cost. The returns shown do not reflect taxes that a shareholder would pay on fund distributions or on the sale of fund shares.
Cumulative Performance: October 31, 1999–October 31, 2009
Initial Investment of $10,000
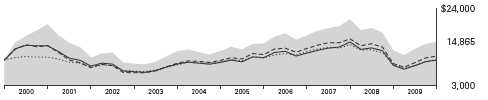
| | | | |
| | | Average Annual Total Returns | Final Value |
| | | Periods Ended October 31, 2009 | of a $10,000 |
| | One Year | Five Years | Ten Years | Investment |
| Mid-Cap Growth Fund1 | 17.70% | 3.63% | 4.04% | $14,865 |
| Dow Jones U.S. Total Stock Market Index | 11.34 | 1.06 | 0.06 | 10,056 |
| Russell Midcap Growth Index | 22.48 | 2.22 | 1.01 | 11,055 |
| Mid-Cap Growth Funds Average2 | 16.45 | 1.30 | –0.04 | 9,965 |
1 Total returns do not include the account service fee that may be applicable to certain accounts with balances below $10,000.
2 Derived from data provided by Lipper Inc.
12
Mid-Cap Growth Fund
Fiscal-Year Total Returns (%): October 31, 1999–October 31, 2009
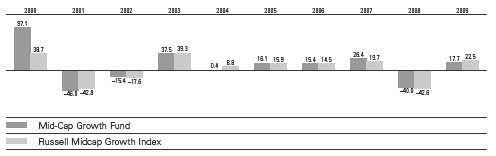
Average Annual Total Returns: Periods Ended September 30, 2009
This table presents average annual total returns through the latest calendar quarter—rather than through the end
of the fiscal period. Securities and Exchange Commission rules require that we provide this information.
| | | | |
| | Inception Date | One Year | Five Years | Ten Years |
| Mid-Cap Growth Fund1 | 12/31/1997 | –0.79% | 5.44% | 5.25% |
1 Total returns do not include the account service fee that may be applicable to certain accounts with balances below $10,000.
Note: See Financial Highlights table for dividend and capital gains information.
13
Mid-Cap Growth Fund
Financial Statements
Statement of Net Assets
As of October 31, 2009
The fund reports a complete list of its holdings in regulatory filings four times in each fiscal year, at the quarter-ends. For the second and fourth fiscal quarters, the lists appear in the fund’s semiannual and annual reports to shareholders. For the first and third fiscal quarters, the fund files the lists with the Securities and Exchange Commission on Form N-Q. Shareholders can look up the fund’s Forms N-Q on the SEC’s website at www.sec.gov. Forms N-Q may also be reviewed and copied at the SEC’s Public Reference Room (see the back cover of this report for further information).
| | | |
| | | | Market |
| | | | Value• |
| | | Shares | ($000) |
| Common Stocks (96.1%)1 | | |
| Consumer Discretionary (22.8%) | |
| | DeVry Inc. | 506,320 | 27,994 |
| * | WMS Industries Inc. | 667,950 | 26,705 |
| * | O’Reilly Automotive Inc. | 588,725 | 21,948 |
| * | Chipotle Mexican Grill Inc. | | |
| | Class B | 230,900 | 18,451 |
| * | Dick’s Sporting Goods Inc. | 804,600 | 18,256 |
| | Gentex Corp. | 1,006,900 | 16,121 |
| | Jarden Corp. | 583,822 | 15,991 |
| | Tiffany & Co. | 384,074 | 15,090 |
| * | Kohl’s Corp. | 255,950 | 14,646 |
| * | Bed Bath & Beyond Inc. | 380,000 | 13,380 |
| | Guess? Inc. | 325,185 | 11,886 |
| | Strayer Education Inc. | 57,503 | 11,671 |
| * | Warnaco Group Inc. | 274,840 | 11,139 |
| * | Education | | |
| | Management Corp. | 399,300 | 8,785 |
| | Ross Stores Inc. | 192,650 | 8,479 |
| * | Urban Outfitters Inc. | 268,875 | 8,437 |
| * | Bally Technologies Inc. | 201,925 | 7,954 |
| * | Gymboree Corp. | 176,000 | 7,492 |
| | Coach Inc. | 223,550 | 7,370 |
| * | CarMax Inc. | 262,500 | 5,163 |
| | Darden Restaurants Inc. | 97,000 | 2,940 |
| | | | 279,898 |
| Consumer Staples (1.8%) | | |
| | Church & Dwight Co. Inc. | 164,700 | 9,368 |
| | McCormick & Co. Inc. | 188,900 | 6,614 |
| * | Green Mountain Coffee | | |
| | Roasters Inc. | 98,800 | 6,575 |
| | | | 22,557 |
| Energy (5.8%) | | |
| * | Whiting Petroleum Corp. | 263,875 | 14,883 |
| * | Weatherford | | |
| | International Ltd. | 755,800 | 13,249 |
| * | Southwestern Energy Co. | 282,400 | 12,307 |
| | Cabot Oil & Gas Corp. | 295,725 | 11,377 |
| * | Newfield Exploration Co. | 170,100 | 6,977 |
| | | |
| | | | Market |
| | | | Value• |
| | | Shares | ($000) |
| | Range Resources Corp. | 137,300 | 6,872 |
| * | Denbury Resources Inc. | 359,900 | 5,254 |
| | | | 70,919 |
| Exchange-Traded Fund (0.4%) | | |
| 2 | Vanguard Mid-Cap ETF | 82,700 | 4,497 |
| |
| Financials (7.6%) | | |
| * | Affiliated Managers | | |
| | Group Inc. | 226,790 | 14,399 |
| * | TD Ameritrade | | |
| | Holding Corp. | 726,425 | 14,020 |
| * | MSCI Inc. Class A | 456,050 | 13,864 |
| | XL Capital Ltd. Class A | 840,050 | 13,785 |
| | Greenhill & Co. Inc. | 148,850 | 12,835 |
| | HCC Insurance | | |
| | Holdings Inc. | 452,800 | 11,950 |
| | Invesco Ltd. | 545,000 | 11,527 |
| | TCF Financial Corp. | 72,300 | 855 |
| | | | 93,235 |
| Health Care (11.0%) | | |
| * | Mettler-Toledo | | |
| | International Inc. | 203,750 | 19,866 |
| * | Idexx Laboratories Inc. | 287,702 | 14,707 |
| * | Life Technologies Corp. | 299,225 | 14,114 |
| * | Zimmer Holdings Inc. | 251,400 | 13,216 |
| * | Illumina Inc. | 379,230 | 12,173 |
| * | Express Scripts Inc. | 144,370 | 11,538 |
| * | Alexion Pharmaceuticals Inc. | 223,975 | 9,947 |
| * | athenahealth Inc. | 244,500 | 9,196 |
| * | Henry Schein Inc. | 168,695 | 8,912 |
| * | United Therapeutics Corp. | 151,500 | 6,445 |
| | CR Bard Inc. | 83,600 | 6,276 |
| * | Myriad Genetics Inc. | 207,060 | 5,027 |
| * | Intuitive Surgical Inc. | 12,270 | 3,023 |
| | | | 134,440 |
| Industrials (14.1%) | | |
| | Fastenal Co. | 537,507 | 18,544 |
| * | Stericycle Inc. | 288,390 | 15,103 |
| | Robert Half | | |
| | International Inc. | 580,300 | 13,463 |
14
Mid-Cap Growth Fund
| | | |
| | | | Market |
| | | | Value• |
| | | Shares | ($000) |
| | MSC Industrial Direct Co. | | |
| | Class A | 306,100 | 13,178 |
| * | Iron Mountain Inc. | 535,370 | 13,079 |
| | Roper Industries Inc. | 232,490 | 11,752 |
| | Ingersoll-Rand PLC | 350,325 | 11,067 |
| * | Gardner Denver Inc. | 254,100 | 9,125 |
| | TransDigm Group Inc. | 232,700 | 9,117 |
| * | FTI Consulting Inc. | 220,612 | 9,003 |
| | Manpower Inc. | 173,200 | 8,211 |
| ^ | Ritchie Bros | | |
| | Auctioneers Inc. | 374,200 | 8,202 |
| * | McDermott | | |
| | International Inc. | 367,750 | 8,175 |
| | Precision Castparts Corp. | 72,625 | 6,938 |
| | JB Hunt Transport | | |
| | Services Inc. | 227,840 | 6,849 |
| | Goodrich Corp. | 114,350 | 6,215 |
| | CH Robinson | | |
| | Worldwide Inc. | 101,595 | 5,599 |
| | | | 173,620 |
| Information Technology (26.6%) | |
| * | Cognizant Technology | | |
| | Solutions Corp. Class A | 746,110 | 28,837 |
| *,^ | Alliance Data Systems Corp. | 495,860 | 27,263 |
| * | Silicon Laboratories Inc. | 550,835 | 23,080 |
| * | Activision Blizzard Inc. | 1,645,978 | 17,826 |
| * | McAfee Inc. | 412,075 | 17,258 |
| | Amphenol Corp. Class A | 400,350 | 16,062 |
| * | Sybase Inc. | 334,000 | 13,213 |
| * | Equinix Inc. | 152,165 | 12,983 |
| * | BMC Software Inc. | 348,825 | 12,962 |
| * | NetApp Inc. | 468,145 | 12,663 |
| * | Concur Technologies Inc. | 343,557 | 12,244 |
| * | Marvell Technology | | |
| | Group Ltd. | 847,975 | 11,634 |
| * | PMC - Sierra Inc. | 1,268,252 | 10,806 |
| * | Genpact Ltd. | 876,600 | 10,440 |
| * | F5 Networks Inc. | 223,838 | 10,048 |
| * | Trimble Navigation Ltd. | 444,721 | 9,326 |
| * | Micros Systems Inc. | 326,072 | 8,778 |
| * | Nice Systems Ltd. ADR | 279,900 | 8,669 |
| * | Broadcom Corp. Class A | 324,300 | 8,630 |
| * | Microsemi Corp. | 646,675 | 8,607 |
| * | ON Semiconductor Corp. | 1,247,550 | 8,346 |
| * | VistaPrint NV | 161,100 | 8,224 |
| * | Brocade Communications | | |
| | Systems Inc. | 924,625 | 7,933 |
| | Solera Holdings Inc. | 231,700 | 7,465 |
| * | Dolby | | |
| | Laboratories Inc. Class A | 158,100 | 6,631 |
| * | Nuance | | |
| | Communications Inc. | 417,186 | 5,469 |
| * | Juniper Networks Inc. | 47,300 | 1,207 |
| | | | 326,604 |
| | |
| | | Market |
| | | Value• |
| | Shares | ($000) |
| Materials (4.6%) | | |
| Ecolab Inc. | 368,910 | 16,217 |
| Airgas Inc. | 269,823 | 11,970 |
| Greif Inc. Class A | 191,500 | 10,249 |
| Steel Dynamics Inc. | 706,220 | 9,456 |
| Ashland Inc. | 260,135 | 8,985 |
| | | 56,877 |
| Telecommunication Services (1.4%) | |
| * SBA Communications Corp. | |
| Class A | 610,000 | 17,208 |
| Total Common Stocks | | |
| (Cost $1,007,409) | | 1,179,855 |
| Temporary Cash Investments (5.1%)1 | |
| Money Market Fund (4.6%) | | |
| 3,4 Vanguard Market | | |
| Liquidity Fund, | | |
| 0.225% | 57,142,890 | 57,143 |
| |
| | Face | |
| | Amount | |
| | ($000) | |
| U.S. Government and Agency Obligations (0.5%) |
| 5,6 Federal Home | | |
| Loan Bank Discount | | |
| Notes, 0.220%, 3/26/10 | 6,000 | 5,997 |
| Total Temporary Cash Investments | |
| (Cost $63,136) | | 63,140 |
| Total Investments (101.2%) | | |
| (Cost $1,070,545) | | 1,242,995 |
| Other Assets and Liabilities (–1.2%) | |
| Other Assets | | 18,621 |
| Liabilities4 | | (33,110) |
| | | (14,489) |
| Net Assets (100%) | | |
| Applicable to 88,617,487 outstanding | |
| $.001 par value shares of beneficial | |
| interest (unlimited authorization) | 1,228,506 |
| Net Asset Value Per Share | | $13.86 |
Mid-Cap Growth Fund
| |
| At October 31, 2009, net assets consisted of: |
| | Amount |
| | ($000) |
| Paid-in Capital | 1,422,661 |
| Overdistributed Net Investment Income | (223) |
| Accumulated Net Realized Losses | (364,857) |
| Unrealized Appreciation (Depreciation) | |
| Investment Securities | 172,450 |
| Futures Contracts | (1,525) |
| Net Assets | 1,228,506 |
• See Note A in Notes to Financial Statements.
* Non-income-producing security.
^ Part of security position is on loan to broker-dealers. The total value of securities on loan is $11,172,000.
1 The fund invests a portion of its cash reserves in equity markets through the use of index futures contracts. After giving effect to futures investments, the fund’s effective common stock and temporary cash investment positions represent 98.9% and 2.3%, respectively, of net assets.
2 Considered an affiliated company of the fund as the issuer is another member of The Vanguard Group.
3 Affiliated money market fund available only to Vanguard funds and certain trusts and accounts managed by Vanguard. Rate shown is the 7-day yield.
4 Includes $11,741,000 of collateral received for securities on loan.
5 The issuer operates under a congressional charter; its securities are not backed by the full faith and credit of the U.S. government.
6 Securities with a value of $5,997,000 have been segregated as initial margin for open futures contracts.
ADR—American Depositary Receipt.
See accompanying Notes, which are an integral part of the Financial Statements.
16
| |
| Mid-Cap Growth Fund | |
| |
| |
| Statement of Operations | |
| |
| | Year Ended |
| | October 31, 2009 |
| | ($000) |
| Investment Income | |
| Income | |
| Dividends1 | 6,085 |
| Interest1 | 487 |
| Security Lending | 648 |
| Total Income | 7,220 |
| Expenses | |
| Investment Advisory Fees—Note B | |
| Basic Fee | 2,334 |
| Performance Adjustment | 228 |
| The Vanguard Group—Note C | |
| Management and Administrative | 2,874 |
| Marketing and Distribution | 294 |
| Custodian Fees | 22 |
| Auditing Fees | 24 |
| Shareholders’ Reports and Proxies | 85 |
| Trustees’ Fees and Expenses | 2 |
| Total Expenses | 5,863 |
| Expenses Paid Indirectly | (162) |
| Net Expenses | 5,701 |
| Net Investment Income | 1,519 |
| Realized Net Gain (Loss) | |
| Investment Securities Sold1 | (163,812) |
| Futures Contracts | 4,818 |
| Realized Net Gain (Loss) | (158,994) |
| Change in Unrealized Appreciation (Depreciation) | |
| Investment Securities | 329,039 |
| Futures Contracts | 4,442 |
| Change in Unrealized Appreciation (Depreciation) | 333,481 |
| Net Increase (Decrease) in Net Assets Resulting from Operations | 176,006 |
1 Dividend income, interest income, and realized net gain (loss) from affiliated companies of the fund were $78,000, $442,000, and $0,
respectively.
See accompanying Notes, which are an integral part of the Financial Statements.
17
| | |
| Mid-Cap Growth Fund | | |
| |
| |
| Statement of Changes in Net Assets | | |
| |
| | Year Ended October 31, |
| | 2009 | 2008 |
| | ($000) | ($000) |
| Increase (Decrease) in Net Assets | | |
| Operations | | |
| Net Investment Income | 1,519 | 2,371 |
| Realized Net Gain (Loss) | (158,994) | (202,806) |
| Change in Unrealized Appreciation (Depreciation) | 333,481 | (366,076) |
| Net Increase (Decrease) in Net Assets Resulting from Operations | 176,006 | (566,511) |
| Distributions | | |
| Net Investment Income | (2,949) | (2,868) |
| Realized Capital Gain1 | — | (66,660) |
| Total Distributions | (2,949) | (69,528) |
| Capital Share Transactions | | |
| Issued | 412,258 | 497,094 |
| Issued in Lieu of Cash Distributions | 2,849 | 67,456 |
| Redeemed | (240,237) | (336,629) |
| Net Increase (Decrease) from Capital Share Transactions | 174,870 | 227,921 |
| Total Increase (Decrease) | 347,927 | (408,118) |
| Net Assets | | |
| Beginning of Period | 880,579 | 1,288,697 |
| End of Period2 | 1,228,506 | 880,579 |
1 Includes fiscal 2008 short-term gain distributions totaling $36,070,000. Short-term gain distributions are treated as ordinary income dividends for tax purposes.
2 Net Assets—End of Period includes undistributed (overdistributed) net investment income of ($223,000) and $1,207,000.
See accompanying Notes, which are an integral part of the Financial Statements.
18
| | | | | |
| Mid-Cap Growth Fund | | | | | |
| |
| |
| Financial Highlights | | | | | |
| |
| |
| For a Share Outstanding | | | Year Ended October 31, |
| Throughout Each Period | 2009 | 2008 | 2007 | 2006 | 2005 |
| Net Asset Value, Beginning of Period | $11.82 | $20.90 | $19.12 | $16.58 | $14.28 |
| Investment Operations | | | | | |
| Net Investment Income | .0211 | .035 | .044 | .055 | — |
| Net Realized and Unrealized Gain (Loss) | | | | | |
| on Investments | 2.059 | (8.024) | 4.455 | 2.490 | 2.300 |
| Total from Investment Operations | 2.080 | (7.989) | 4.499 | 2.545 | 2.300 |
| Distributions | | | | | |
| Dividends from Net Investment Income | (.040) | (.045) | (.044) | (.005) | — |
| Distributions from Realized Capital Gains | — | (1.046) | (2.675) | — | — |
| Total Distributions | (.040) | (1.091) | (2.719) | (.005) | — |
| Net Asset Value, End of Period | $13.86 | $11.82 | $20.90 | $19.12 | $16.58 |
| |
| Total Return2 | 17.70% | –40.02% | 26.39% | 15.35% | 16.11% |
| |
| Ratios/Supplemental Data | | | | | |
| Net Assets, End of Period (Millions) | $1,229 | $881 | $1,289 | $793 | $562 |
| Ratio of Total Expenses to | | | | | |
| Average Net Assets3 | 0.60% | 0.55% | 0.56% | 0.50% | 0.44% |
| Ratio of Net Investment Income to | | | | | |
| Average Net Assets | 0.16%1 | 0.20% | 0.27% | 0.26% | 0.01% |
| Portfolio Turnover Rate | 125% | 85% | 70% | 159% | 80% |
1 Net investment income per share and the ratio of net investment income to average net assets include $0.02 and 0.19%, respectively, resulting from a special dividend from TransDigm Group Inc. in October 2009.
2 Total returns do not include the account service fee that may be applicable to certain accounts with balances below $10,000.
3 Includes performance-based investment advisory fee increases (decreases) of 0.02%, 0.03%, 0.03%, (0.04%), and (0.09%).
See accompanying Notes, which are an integral part of the Financial Statements.
19
Mid-Cap Growth Fund
Notes to Financial Statements
Vanguard Mid-Cap Growth Fund is registered under the Investment Company Act of 1940 as an open-end investment company, or mutual fund.
A. The following significant accounting policies conform to generally accepted accounting principles for U.S. mutual funds. The fund consistently follows such policies in preparing its financial statements.
1. Security Valuation: Securities are valued as of the close of trading on the New York Stock Exchange (generally 4 p.m., Eastern time) on the valuation date. Equity securities are valued at the latest quoted sales prices or official closing prices taken from the primary market in which each security trades; such securities not traded on the valuation date are valued at the mean of the latest quoted bid and asked prices. Securities for which market quotations are not readily available, or whose values have been materially affected by events occurring before the fund’s pricing time but after the close of the securities’ primary markets, are valued by methods deemed by the board of trustees to represent fair value. Investments in Vanguard Market Liquidity Fund are valued at that fund’s net asset value. Temporary cash investments acquired over 60 days to maturity are valued using the latest bid prices or using valuations based on a matrix system (which considers such factors as security prices, yields, maturities, and ratings), both as furnished by independent pricing services. Other temporary cash investments are valued at amortized cost, which approximates market value.
2. Futures Contracts: The fund uses index futures contracts to a limited extent, with the objective of maintaining full exposure to the stock market while maintaining liquidity. The fund may purchase or sell futures contracts to achieve a desired level of investment, whether to accommodate portfolio turnover or cash flows from capital share transactions. The primary risks associated with the use of futures contracts are imperfect correlation between changes in market values of stocks held by the fund and the prices of futures contracts, and the possibility of an illiquid market.
Futures contracts are valued at their quoted daily settlement prices. The aggregate principal amounts of the contracts are not recorded in the Statement of Net Assets. Fluctuations in the value of the contracts are recorded in the Statement of Net Assets as an asset (liability) and in the Statement of Operations as unrealized appreciation (depreciation) until the contracts are closed, when they are recorded as realized futures gains (losses).
3. Federal Income Taxes: The fund intends to continue to qualify as a regulated investment company and distribute all of its taxable income. Management has analyzed the fund’s tax positions taken for all open federal income tax years (October 31, 2006-2009), and has concluded that no provision for federal income tax is required in the fund’s financial statements.
4. Distributions: Distributions to shareholders are recorded on the ex-dividend date.
5. Security Lending: The fund may lend its securities to qualified institutional borrowers to earn additional income. Security loans are required to be secured at all times by collateral at least equal to the market value of securities loaned. The fund invests cash collateral received in Vanguard Market Liquidity Fund, and records a liability for the return of the collateral, during the period the securities are on loan. Security lending income represents the income earned on investing cash collateral, less expenses associated with the loan.
6. Other: Dividend income is recorded on the ex-dividend date. Interest income includes income distributions received from Vanguard Market Liquidity Fund and is accrued daily. Security transactions are accounted for on the date securities are bought or sold. Costs used to determine realized gains (losses) on the sale of investment securities are those of the specific securities sold.
20
Mid-Cap Growth Fund
B. William Blair & Company, L.L.C., and Chartwell Investment Partners, L.P., each provide investment advisory services to a portion of the fund for a fee calculated at an annual percentage rate of average net assets managed by the advisor. The basic fee for William Blair & Company, L.L.C., is subject to quarterly adjustments based on performance since July 31, 2006, relative to the Russell Midcap Growth Index. The basic fee for Chartwell Investment Partners, L.P., is subject to quarterly adjustments based on performance for the preceding three years relative to the Russell Midcap Growth Index.
The Vanguard Group manages the cash reserves of the fund on an at-cost basis.
For the year ended October 31, 2009, the aggregate investment advisory fee represented an effective annual basic rate of 0.24% of the fund’s average net assets, before an increase of $228,000 (0.02%) based on performance.
C. The Vanguard Group furnishes at cost corporate management, administrative, marketing, and distribution services. The costs of such services are allocated to the fund under methods approved by the board of trustees. The fund has committed to provide up to 0.40% of its net assets in capital contributions to Vanguard. At October 31, 2009, the fund had contributed capital of $267,000 to Vanguard (included in Other Assets), representing 0.02% of the fund’s net assets and 0.11% of Vanguard’s capitalization. The fund’s trustees and officers are also directors and officers of Vanguard.
D. The fund has asked its investment advisors to direct certain security trades, subject to obtaining the best price and execution, to brokers who have agreed to rebate to the fund part of the commissions generated. Such rebates are used solely to reduce the fund’s management and administrative expenses. For the year ended October 31, 2009, these arrangements reduced the fund’s expenses by $162,000 (an annual rate of 0.02% of average net assets).
E. Various inputs may be used to determine the value of the fund’s investments. These inputs are summarized in three broad levels for financial statement purposes. The inputs or methodologies used to value securities are not necessarily an indication of the risk associated with investing in those securities.
Level 1—Quoted prices in active markets for identical securities.
Level 2—Other significant observable inputs (including quoted prices for similar securities, interest rates, prepayment speeds, credit risk, etc.).
Level 3—Significant unobservable inputs (including the fund’s own assumptions used to determine the fair value of investments).
The following table summarizes the fund’s investments as of October 31, 2009, based on the inputs used to value them:
| | | |
| | Level 1 | Level 2 | Level 3 |
| Investments | ($000) | ($000) | ($000) |
| Common Stocks | 1,179,855 | — | — |
| Temporary Cash Investments | 57,143 | 5,997 | — |
| Futures Contracts—Liabilities1 | (908) | — | — |
| Total | 1,236,090 | 5,997 | — |
| 1 Represents variation margin on the last day of the reporting period. | | | |
Mid-Cap Growth Fund
F. At October 31, 2009, the aggregate settlement value of open futures contracts and the related unrealized appreciation (depreciation) were:
| | | | |
| | | | | ($000) |
| | | Number of | Aggregate | Unrealized |
| | | Long (Short) | Settlement | Appreciation |
| Futures Contracts | Expiration | Contracts | Value | (Depreciation) |
| S&P MidCap 400 Index | December 2009 | 65 | 21,365 | (1,027) |
| E-mini S&P MidCap 400 Index | December 2009 | 105 | 6,903 | (381) |
| E-mini NASDAQ 100 Index | December 2009 | 200 | 6,662 | (117) |
Unrealized appreciation (depreciation) on open futures contracts is required to be treated as realized gain (loss) for tax purposes.
G. Distributions are determined on a tax basis and may differ from net investment income and realized capital gains for financial reporting purposes. Differences may be permanent or temporary. Permanent differences are reclassified among capital accounts in the financial statements to reflect their tax character. Temporary differences arise when certain items of income, expense, gain, or loss are recognized in different periods for financial statement and tax purposes; these differences will reverse at some time in the future. Differences in classification may also result from the treatment of short-term gains as ordinary income for tax purposes.
For tax purposes, at October 31, 2009, the fund had $1,534,000 of ordinary income available for distribution. The fund had available capital loss carryforwards totaling $365,259,000 to offset future net capital gains of $205,366,000 through October 31, 2016, and $159,893,000 through October 31, 2017.
At October 31, 2009, the cost of investment securities for tax purposes was $1,071,493,000. Net unrealized appreciation of investment securities for tax purposes was $171,502,000, consisting of unrealized gains of $189,963,000 on securities that had risen in value since their purchase and $18,461,000 in unrealized losses on securities that had fallen in value since their purchase.
H. During the year ended October 31, 2009, the fund purchased $1,344,543,000 of investment securities and sold $1,149,184,000 of investment securities, other than temporary cash investments.
| | |
| I. Capital shares issued and redeemed were: | | |
| | Year Ended October 31, |
| | 2009 | 2008 |
| | Shares | Shares |
| | (000) | (000) |
| Issued | 34,005 | 29,689 |
| Issued in Lieu of Cash Distributions | 267 | 3,743 |
| Redeemed | (20,163) | (20,573) |
| Net Increase (Decrease) in Shares Outstanding | 14,109 | 12,859 |
J. In preparing the financial statements as of October 31, 2009, management considered the impact of subsequent events occurring through December 8, 2009, for potential recognition or disclosure in these financial statements.
22
Report of Independent Registered Public Accounting Firm
To the Trustees of Vanguard Whitehall Funds and the Shareholders of Vanguard Mid-Cap Growth Fund:
In our opinion, the accompanying statement of net assets and the related statements of operations and of changes in net assets and the financial highlights present fairly, in all material respects, the financial position of Vanguard Mid-Cap Growth Fund (the “Fund”) at October 31, 2009, the results of its operations for the year then ended, the changes in its net assets for each of the two years in the period then ended and the financial highlights for each of the five years in the period then ended, in conformity with accounting principles generally accepted in the United States of America. These financial statements and financial highlights (hereafter referred to as “financial statements”) are the responsibility of the Fund’s management; our responsibility is to express an opinion on these financial statements based on our audits. We conducted our audits of these financial statements in accordance with the standards of the Public Company Accounting Oversight Board (United States). Those standards require that we plan and perform the audit to obtain reasonable assurance about whether the financial statements are free of material misstatement. An audit includes examining, on a test basis, evidence supporting the amounts and disclosures in the financial statements, assessing the accounting principles used and significant estimates made by management, and evaluating the overall financial statement presentation. We believe that our audits, which included confirmation of securities at October 31, 2009 by correspondence with the custodian and broker and by agreement to the underlying ownership records of Vanguard Market Liquidity Fund, provide a reasonable basis for our opinion.
PricewaterhouseCoopers LLP
Philadelphia, Pennsylvania
December 8, 2009
|
| Special 2009 tax information (unaudited) for Vanguard Mid-Cap Growth Fund |
This information for the fiscal year ended October 31, 2009, is included pursuant to provisions of the Internal Revenue Code.
The fund distributed $2,949,000 of qualified dividend income to shareholders during the fiscal year.
For corporate shareholders, 100% of investment income (dividend income plus short-term gains, if any) qualifies for the dividends-received deduction.
23
Your Fund’s After-Tax Returns
This table presents returns for your fund both before and after taxes. The after-tax returns are shown in two ways: (1) assuming that an investor owned the fund during the entire period and paid taxes on the fund’s distributions, and (2) assuming that an investor paid taxes on the fund’s distributions and sold all shares at the end of each period.
Calculations are based on the highest individual federal income tax and capital gains tax rates in effect at the times of the distributions and the hypothetical sales. State and local taxes were not considered. After-tax returns reflect any qualified dividend income, using actual prior-year figures and estimates for 2009. (In the example, returns after the sale of fund shares may be higher than those assuming no sale. This occurs when the sale would have produced a capital loss. The calculation assumes that the investor received a tax deduction for the loss.)
Please note that your actual after-tax returns will depend on your tax situation and may differ from those shown. Also note that if you own the fund in a tax-deferred account, such as an individual retirement account or a 401(k) plan, this information does not apply to you. Such accounts are not subject to current taxes.
Finally, keep in mind that a fund’s performance—whether before or after taxes—does not guarantee future results.
| | | |
| Average Annual Total Returns: Mid-Cap Growth Fund1 | | | |
| Periods Ended October 31, 2009 | | | |
| | One | Five | Ten |
| | Year | Years | Years |
| Returns Before Taxes | 17.70% | 3.63% | 4.04% |
| Returns After Taxes on Distributions | 17.63 | 2.86 | 2.62 |
| Returns After Taxes on Distributions and Sale of Fund Shares | 11.56 | 3.06 | 2.96 |
1 Total returns do not include the account service fee that may be applicable to certain accounts with balances below $10,000.
24
About Your Fund’s Expenses
As a shareholder of the fund, you incur ongoing costs, which include costs for portfolio management, administrative services, and shareholder reports (like this one), among others. Operating expenses, which are deducted from a fund’s gross income, directly reduce the investment return of the fund.
A fund’s expenses are expressed as a percentage of its average net assets. This figure is known as the expense ratio. The following examples are intended to help you understand the ongoing costs (in dollars) of investing in your fund and to compare these costs with those of other mutual funds. The examples are based on an investment of $1,000 made at the beginning of the period shown and held for the entire period.
The accompanying table illustrates your fund’s costs in two ways:
• Based on actual fund return. This section helps you to estimate the actual expenses that you paid over the period. The “Ending Account Value” shown is derived from the fund’s actual return, and the third column shows the dollar amount that would have been paid by an investor who started with $1,000 in the fund. You may use the information here, together with the amount you invested, to estimate the expenses that you paid over the period.
To do so, simply divide your account value by $1,000 (for example, an $8,600 account value divided by $1,000 = 8.6), then multiply the result by the number given for your fund under the heading “Expenses Paid During Period.”
• Based on hypothetical 5% yearly return. This section is intended to help you compare your fund’s costs with those of other mutual funds. It assumes that the fund had a yearly return of 5% before expenses, but that the expense ratio is unchanged. In this case—because the return used is not the fund’s actual return—the results do not apply to your investment. The example is useful in making comparisons because the Securities and Exchange Commission requires all mutual funds to calculate expenses based on a 5% return. You can assess your fund’s costs by comparing this hypothetical example with the hypothetical examples that appear in shareholder reports of other funds.
| | | |
| Six Months Ended October 31, 2009 | | | |
| | Beginning | Ending | Expenses |
| | Account Value | Account Value | Paid During |
| Mid-Cap Growth Fund | 4/30/2009 | 10/31/2009 | Period1 |
| Based on Actual Fund Return | $1,000.00 | $1,144.51 | $3.62 |
| Based on Hypothetical 5% Yearly Return | 1,000.00 | 1,021.83 | 3.41 |
1 The calculations are based on expenses incurred in the most recent six-month period. The fund’s annualized six-month expense ratio for that period is 0.67%. The dollar amounts shown as “Expenses Paid” are equal to the annualized expense ratio multiplied by the average account value over the period, multiplied by the number of days in the most recent six-month period, then divided by the number of days in the most recent 12-month period.
25
Note that the expenses shown in the table are meant to highlight and help you compare ongoing costs only and do not reflect transaction costs incurred by the fund for buying and selling securities. Further, the expenses do not include the account service fee described in the prospectus. If such a fee were applied to your account, your costs would be higher. Your fund does not charge transaction fees, such as purchase or redemption fees, nor does it carry a “sales load.”
The calculations assume no shares were bought or sold during the period. Your actual costs may have been higher or lower, depending on the amount of your investment and the timing of any purchases or redemptions.
You can find more information about the fund’s expenses, including annual expense ratios, in the Financial Statements section of this report. For additional information on operating expenses and other shareholder costs, please refer to your fund’s current prospectus.
26
Glossary
Beta. A measure of the magnitude of a fund’s past share-price fluctuations in relation to the ups and downs of a given market index. The index is assigned a beta of 1.00. Compared with a given index, a fund with a beta of 1.20 typically would have seen its share price rise or fall by 12% when the index rose or fell by 10%. For this report, beta is based on returns over the past 36 months for both the fund and the index. Note that a fund’s beta should be reviewed in conjunction with its R-squared (see definition). The lower the R-squared, the less correlation there is between the fund and the index, and the less reliable beta is as an indicator of volatility.
Earnings Growth Rate. The average annual rate of growth in earnings over the past five years for the stocks now in a fund.
Equity Exposure. A measure that reflects a fund’s investments in stocks and stock futures. Any holdings in short-term reserves are excluded.
Expense Ratio. The percentage of a fund’s average net assets used to pay its annual administrative and advisory expenses. These expenses directly reduce returns to investors.
Foreign Holdings. The percentage of a fund represented by stocks or depositary receipts of companies based outside the United States.
Inception Date. The date on which the assets of a fund (or one of its share classes) are first invested in accordance with the fund’s investment objective. For funds with a subscription period, the inception date is the day after that period ends. Investment performance is measured from the inception date.
Median Market Cap. An indicator of the size of companies in which a fund invests; the midpoint of market capitalization (market price x shares outstanding) of a fund’s stocks, weighted by the proportion of the fund’s assets invested in each stock. Stocks representing half of the fund’s assets have market capitalizations above the median, and the rest are below it.
Price/Book Ratio. The share price of a stock divided by its net worth, or book value, per share. For a fund, the weighted average price/book ratio of the stocks it holds.
Price/Earnings Ratio. The ratio of a stock’s current price to its per-share earnings over the past year. For a fund, the weighted average P/E of the stocks it holds. P/E is an indicator of market expectations about corporate prospects; the higher the P/E, the greater the expectations for a company’s future growth.
R-Squared. A measure of how much of a fund’s past returns can be explained by the returns from the market in general, as measured by a given index. If a fund’s total returns were precisely synchronized with an index’s returns, its R-squared would be 1.00. If the fund’s returns bore no relationship to the index’s returns, its R-squared would be 0. For this report, R-squared is based on returns over the past 36 months for both the fund and the index.
Return on Equity. The annual average rate of return generated by a company during the past five years for each dollar of shareholder’s equity (net income divided by shareholder’s equity). For a fund, the weighted average return on equity for the companies whose stocks it holds.
Short-Term Reserves. The percentage of a fund invested in highly liquid, short-term securities that can be readily converted to cash.
27
Turnover Rate. An indication of the fund’s trading activity. Funds with high turnover rates incur higher transaction costs and may be more likely to distribute capital gains (which may be taxable to investors). The turnover rate excludes in-kind transactions, which have minimal impact on costs.
Yield. A fund’s 30-day SEC yield is derived using a formula specified by the U.S. Securities and Exchange Commission. Under the formula, data related to the fund’s security holdings in the previous 30 days are used to calculate the fund’s hypothetical net income for that period, which is then annualized and divided by the fund’s estimated average net assets over the calculation period. For the purposes of this calculation, a security’s income is based on its current market yield to maturity (in the case of bonds) or its projected dividend yield (for stocks). Because the SEC yield represents hypothetical annualized income, it will differ—at times significantly—from the fund’s actual experience. As a result, the fund’s income distributions may be higher or lower than implied by the SEC yield.
28
This page intentionally left blank.
This page intentionally left blank.
This page intentionally left blank.
The People Who Govern Your Fund
The trustees of your mutual fund are there to see that the fund is operated and managed in your best interests since, as a shareholder, you are a part owner of the fund. Your fund’s trustees also serve on the board of directors of The Vanguard Group, Inc., which is owned by the Vanguard funds and provides services to them on an at-cost basis.
A majority of Vanguard’s board members are independent, meaning that they have no affiliation with Vanguard or the funds they oversee, apart from the sizable personal investments they have made as private individuals. The independent board members have distinguished backgrounds in business, academia, and public service. Each of the trustees and executive officers oversees 156 Vanguard funds.
The following table provides information for each trustee and executive officer of the fund. More information about the trustees is in the Statement of Additional Information, which can be obtained, without charge, by contacting Vanguard at 800-662-7447, or online at www.vanguard.com.
| |
| Interested Trustees | Emerson U. Fullwood |
| | Born 1948. Trustee Since January 2008. Principal |
| John J. Brennan1 | Occupation(s) During the Past Five Years: Executive |
| Born 1954. Trustee Since May 1987. Chairman of | Chief Staff and Marketing Officer for North America |
| the Board. Principal Occupation(s) During the Past | and Corporate Vice President (retired 2008) of Xerox |
| Five Years: Chairman of the Board and Director/Trustee | Corporation (photocopiers and printers); Director of |
| of The Vanguard Group, Inc., and of each of the | SPX Corporation (multi-industry manufacturing), the |
| investment companies served by The Vanguard Group; | United Way of Rochester, the Boy Scouts of America, |
| Chief Executive Officer (1996–2008) and President | Amerigroup Corporation (direct health and medical |
| (1989–2008) of The Vanguard Group and of each of the | insurance carriers), and Monroe Community College |
| investment companies served by The Vanguard Group; | Foundation. |
| Chairman of the Financial Accounting Foundation; | |
| Governor of the Financial Industry Regulatory Authority | Rajiv L. Gupta |
| (FINRA); Director of United Way of Southeastern | Born 1945. Trustee Since December 2001.2 Principal |
| Pennsylvania. | Occupation(s) During the Past Five Years: Chairman |
| | and Chief Executive Officer (retired 2009) and President |
| F. William McNabb III1 | (2006–2008) of Rohm and Haas Co. (chemicals); Board |
| Born 1957. Trustee Since July 2009. Principal | Member of American Chemistry Council; Director of |
| Occupation(s) During the Past Five Years: Director of | Tyco International, Ltd. (diversified manufacturing and |
| The Vanguard Group, Inc., since 2008; Chief Executive | services) and Hewlett-Packard Co. (electronic computer |
| Officer and President of The Vanguard Group and of | manufacturing); Trustee of The Conference Board. |
| each of the investment companies served by The | |
| Vanguard Group since 2008; Director of Vanguard | Amy Gutmann |
| Marketing Corporation; Managing Director of The | Born 1949. Trustee Since June 2006. Principal |
| Vanguard Group (1995–2008). | Occupation(s) During the Past Five Years: President of |
| | the University of Pennsylvania; Christopher H. Browne |
| | Distinguished Professor of Political Science in the School |
| Independent Trustees | of Arts and Sciences with secondary appointments |
| | at the Annenberg School for Communication and the |
| Charles D. Ellis | Graduate School of Education of the University of |
| Born 1937. Trustee Since January 2001. Principal | Pennsylvania; Director of Carnegie Corporation of |
| Occupation(s) During the Past Five Years: Applecore | New York, Schuylkill River Development Corporation, |
| Partners (pro bono ventures in education); Senior | and Greater Philadelphia Chamber of Commerce; |
| Advisor to Greenwich Associates (international business | Trustee of the National Constitution Center. |
| strategy consulting); Successor Trustee of Yale University; | |
| Overseer of the Stern School of Business at New York | |
| University; Trustee of the Whitehead Institute for | |
| Biomedical Research. | |
| | |
| JoAnn Heffernan Heisen | Executive Officers | |
| Born 1950. Trustee Since July 1998. Principal | | |
| Occupation(s) During the Past Five Years: Corporate | Thomas J. Higgins1 | |
| Vice President and Chief Global Diversity Officer since | Born 1957. Chief Financial Officer Since September |
| 2006 (retired 2008) and Member of the Executive | 2008. Principal Occupation(s) During the Past Five |
| Committee (retired 2008) of Johnson & Johnson | Years: Principal of The Vanguard Group, Inc.; Chief |
| (pharmaceuticals/consumer products); Vice President | Financial Officer of each of the investment companies |
| and Chief Information Officer of Johnson & Johnson | served by The Vanguard Group since 2008; Treasurer |
| (1997–2005); Director of the University Medical Center | of each of the investment companies served by The |
| at Princeton and Women’s Research and Education | Vanguard Group (1998–2008). |
| Institute; Member of the Advisory Board of the Maxwell | | |
| School of Citizenship and Public Affairs at Syracuse | | |
| University. | Kathryn J. Hyatt1 | |
| | Born 1955. Treasurer Since November 2008. Principal |
| | Occupation(s) During the Past Five Years: Principal of |
| F. Joseph Loughrey | The Vanguard Group, Inc.; Treasurer of each of the |
| Born 1949. Trustee Since October 2009. Principal | investment companies served by The Vanguard |
| Occupation(s) During the Past Five Years: President and | Group since 2008; Assistant Treasurer of each of the |
| Chief Operating Officer since 2005 (retired 2009) and | investment companies served by The Vanguard Group |
| Vice Chairman of the Board (2008–2009) of Cummins | (1988–2008). | |
| Inc. (industrial machinery); Director of SKF AB (industrial | | |
| machinery), Hillenbrand, Inc. (specialized consumer | | |
| services), Sauer-Danfoss Inc. (machinery), the Lumina | Heidi Stam1 | |
| Foundation for Education, and the Columbus Community | Born 1956. Secretary Since July 2005. Principal |
| Education Coalition; Chairman of the Advisory Council | Occupation(s) During the Past Five Years: Managing |
| for the College of Arts and Letters at the University of | Director of The Vanguard Group, Inc., since 2006; |
| Notre Dame. | General Counsel of The Vanguard Group since 2005; |
| | Secretary of The Vanguard Group and of each of the |
| | investment companies served by The Vanguard Group |
| André F. Perold | since 2005; Director and Senior Vice President of |
| Born 1952. Trustee Since December 2004. Principal | Vanguard Marketing Corporation since 2005; Principal |
| Occupation(s) During the Past Five Years: George Gund | of The Vanguard Group (1997–2006). |
| Professor of Finance and Banking, Harvard Business | | |
| School; Chair of the Investment Committee of HighVista | | |
| Strategies LLC (private investment firm). | Vanguard Senior Management Team |
| |
| Alfred M. Rankin, Jr. | R. Gregory Barton | Michael S. Miller |
| Born 1941. Trustee Since January 1993. Principal | Mortimer J. Buckley | James M. Norris |
| Occupation(s) During the Past Five Years: Chairman, | Kathleen C. Gubanich | Glenn W. Reed |
| President, and Chief Executive Officer of NACCO | Paul A. Heller | George U. Sauter |
| Industries, Inc. (forklift trucks/housewares/lignite); | | |
| Director of Goodrich Corporation (industrial products/ | | |
| aircraft systems and services); Deputy Chairman of | Founder | |
| the Federal Reserve Bank of Cleveland; Trustee of | | |
| University Hospitals of Cleveland, The Cleveland | | |
| Museum of Art, and Case Western Reserve University. | John C. Bogle | |
| | Chairman and Chief Executive Officer, 1974–1996 |
| |
| Peter F. Volanakis | | |
| Born 1955. Trustee Since July 2009. Principal | | |
| Occupation(s) During the Past Five Years: President | | |
| since 2007 and Chief Operating Officer since 2005 | | |
| of Corning Incorporated (communications equipment); | | |
| President of Corning Technologies (2001–2005); Director | | |
| of Corning Incorporated and Dow Corning; Trustee of | | |
| the Corning Incorporated Foundation and the Corning | | |
| Museum of Glass; Overseer of the Amos Tuck School | | |
| of Business Administration at Dartmouth College. | | |
1 These individuals are “interested persons” as defined in the Investment Company Act of 1940.
2 December 2002 for Vanguard Equity Income Fund, Vanguard Growth Equity Fund, the Vanguard Municipal Bond Funds, and the Vanguard State Tax-Exempt Funds.
|  |
| P.O. Box 2600 |
| Valley Forge, PA 19482-2600 |
Connect with Vanguard® > www.vanguard.com
| |
| Fund Information > 800-662-7447 | All comparative mutual fund data are from Lipper Inc. |
| | or Morningstar, Inc., unless otherwise noted. |
| Direct Investor Account Services > 800-662-2739 | |
| | |
| Institutional Investor Services > 800-523-1036 | You can obtain a free copy of Vanguard’s proxy voting |
| | guidelines by visiting our website, www.vanguard.com, |
| Text Telephone for People | and searching for “proxy voting guidelines,” or by |
| With Hearing Impairment > 800-749-7273 | calling Vanguard at 800-662-2739. The guidelines are |
| | also available from the SEC’s website, www.sec.gov. |
| | In addition, you may obtain a free report on how your |
| | fund voted the proxies for securities it owned during |
| This material may be used in conjunction | the 12 months ended June 30. To get the report, visit |
| with the offering of shares of any Vanguard | either www.vanguard.com or www.sec.gov. |
| fund only if preceded or accompanied by | |
| the fund’s current prospectus. | You can review and copy information about your fund |
| | at the SEC’s Public Reference Room in Washington, D.C. |
| CFA® is a trademark owned by CFA Institute. | To find out more about this public service, call the SEC |
| | at 202-551-8090. Information about your fund is also |
| | available on the SEC’s website, and you can receive |
| | copies of this information, for a fee, by sending a |
| | request in either of two ways: via e-mail addressed to |
| | publicinfo@sec.gov or via regular mail addressed to the |
| | Public Reference Section, Securities and Exchange |
| | Commission, Washington, DC 20549-1520. |
| |
| |
| |
| |
| | © 2009 The Vanguard Group, Inc. |
| | All rights reserved. |
| | Vanguard Marketing Corporation, Distributor. |
| | Q3010 122009 |
 |
| Vanguard International Explorer™ Fund |
| Annual Report |
|
|
| October 31, 2009 |
|
 |
|
|
> As global stock markets rallied, Vanguard International Explorer Fund returned almost 48% for the 2009 fiscal year and outpaced its comparative standards.
> Emerging markets led the rebound and contributed to the fund’s outperformance.
> For the decade ended October 31, 2009, the fund’s average annual return was more than 7%, putting it ahead of the comparable return of its benchmark index and the peer-group average by about 1 to 2 percentage points.
| |
| Contents | |
| Your Fund’s Total Returns | 1 |
| President’s Letter | 2 |
| Advisor’s Report | 8 |
| Results of Proxy Voting | 11 |
| Fund Profile | 12 |
| Performance Summary | 14 |
| Financial Statements | 16 |
| Your Fund’s After-Tax Returns | 29 |
| About Your Fund’s Expenses | 30 |
| Trustees Approve Advisory Agreements | 32 |
| Glossary | 33 |
The figures shown represent past performance, which is not a guarantee of future results. (Current performance may be lower or higher than the performance data cited. For performance data current to the most recent month-end, visit our website at www.vanguard.com/performance.) Note, too, that both investment returns and principal value can fluctuate widely, so an investor’s shares, when sold, could be worth more or less than their original cost.
Please note: The opinions expressed in this report are just that—informed opinions. They should not be considered promises or advice. Also, please keep in mind that the information and opinions cover the period through the date on the front of this report. Of course, the risks of investing in your fund are spelled out in the prospectus.
Cover photograph: Veronica Coia.
| | | | |
| Your Fund’s Total Returns | | | |
| |
| |
| |
| |
| Fiscal Year Ended October 31, 2009 | | | | |
| | | | Ticker | Total |
| | | | Symbol | Returns |
| Vanguard International Explorer Fund | | | VINEX | 47.88% |
| S&P EPAC SmallCap Index1 | | | | 42.42 |
| International Small-Cap Funds Average2 | | | | 43.73 |
| |
| |
| Your Fund’s Performance at a Glance | | | | |
| October 31, 2008–October 31, 2009 | | | | |
| | | | Distributions Per Share |
| | Starting | Ending | Income | Capital |
| | Share Price | Share Price | Dividends | Gains |
| Vanguard International Explorer Fund | $9.52 | $13.55 | $0.356 | $0.000 |
1 Standard & Poor’s Europe and Pacific SmallCap Index.
2 Derived from data provided by Lipper Inc.
1

President’s Letter
Dear Shareholder,
After falling more steeply than U.S. stock markets during the severe 2008 bear market, international markets rallied even more robustly as aggressive and well-coordinated policy actions by many central banks helped to settle investors’ nerves. In this more favorable environment, Vanguard International Explorer Fund returned 47.88%, a few steps ahead of its benchmark (the Standard & Poor’s Europe and Pacific SmallCap Index) and peer group.
Favorable stock selections by the fund’s advisor, Schroder Investment Management North America Inc., boosted performance in most countries around the globe. And in a dramatic reversal of year-ago results, all ten business sectors notched double-digit gains, ranging from about 13% for the small utilities sector to about 76% for energy. U.S.-based investors in the fund benefited from the relative weakness of the U.S. dollar compared with the euro and Japanese yen, which lifted foreign-market returns when converted into dollars.
If you hold shares in a taxable account, you may wish to review the table and discussion on after-tax returns for the fiscal year later in this report.
A vicious bear marketquickly turned bullish
A year ago, the global financial system stood on the brink of collapse as the expanding U.S. credit crisis precipitated the deepest worldwide recession since World War II. Since then, markets have pulled back from the depths and, in fact,
2
have rallied impressively. Although U.S. unemployment has risen to double digits and signs of a robust recovery are hard to find, the global economy has begun to revive. For the first time in more than a year, U.S. gross domestic product registered growth, as reported by the Commerce Department for the third quarter of calendar 2009.
U.S. stocks recorded positive returns for the fiscal year ended October 31 as the market’s losses during the first four months of the period—marking the final plunge of a historic bear market—were erased by a remarkable rally beginning in March. Global stocks did even better, thanks to some renewed strength in developed markets and a powerful upswing in emerging markets that
actually had some prognosticators worrying about a new asset bubble. Reminders of the markets’ travails are nevertheless apparent in the index returns for the past three years, where negative figures are the rule. Even the five-year returns for U.S. stocks as of October 31 were barely positive, further evidence of the long-term damage done by the collapse of the real estate bubble.
The bond market experienced an equally dramatic turnaround
In late 2008, as the credit markets virtually shut down, risk-averse investors flocked to U.S. Treasury bonds. This widened the difference between the lower yields of Treasuries and the higher yields of corporate bonds to a margin not seen since the Great Depression.
| | | |
| Market Barometer | | | |
| | | Average Annual Total Returns |
| | | Periods Ended October 31, 2009 |
| | One Year | Three Years | Five Years |
| Stocks | | | |
| MSCI All Country World Index ex USA (International) | 34.79% | –2.49% | 7.58% |
| Russell 1000 Index (Large-caps) | 11.20 | –6.84 | 0.71 |
| Russell 2000 Index (Small-caps) | 6.46 | –8.51 | 0.59 |
| Dow Jones U.S. Total Stock Market Index | 11.34 | –6.55 | 1.06 |
| |
| Bonds | | | |
| Barclays Capital U.S. Aggregate Bond Index | | | |
| (Broad taxable market) | 13.79% | 6.35% | 5.05% |
| Barclays Capital Municipal Bond Index | 13.60 | 4.17 | 4.15 |
| Citigroup 3-Month Treasury Bill Index | 0.28 | 2.50 | 2.94 |
| |
| CPI | | | |
| Consumer Price Index | –0.18% | 2.32% | 2.52% |
3
Central banks around the world responded to the economic slowdown by lowering interest rates and implementing other aggressive stimulus programs. Meanwhile, governments boosted spending in hopes of reversing the recessionary tide. As fears of a worldwide depression eased, investors’ appetite for risk returned to more normal levels. The receding pessimism raised demand for corporate bonds, lifting their prices and bringing down their yields. Over the past 12 months, both taxable and municipal bonds returned more than 13%.
However, the Fed’s easy-money campaign had a predictable effect on short-term savings vehicles such as money market funds, whose yields track prevailing short-term rates. In December 2008, the Fed reduced its target for the federal funds rate, a benchmark for the interest rates paid by money market instruments and other very short-term securities, to between 0% and 0.25%. The Fed has said it expects to maintain its target at this level “for an extended period.”
A tale of two markets: emerging and developed
During the first half of the fiscal year, many of the major developed countries— including the United Kingdom, France, Germany, and Japan—mirrored the performance of the United States: Their economies continued to contract and their stock markets posted losses. In contrast, emerging markets began rebounding earlier and more vigorously, helping to ignite the global rally that continued in the
| | |
| Expense Ratios1 | | |
| Your Fund Compared With Its Peer Group | | |
| | | International |
| | | Small-Cap Funds |
| | Fund | Average |
| International Explorer Fund | 0.42% | 1.61% |
1 The fund expense ratio shown is from the prospectus dated February 27, 2009, and represents estimated costs for the current fiscal year based on the fund’s net assets as of the prospectus date. For the fiscal year ended October 31, 2009, the fund’s expense ratio was 0.45%.
The peer-group expense ratio is derived from data provided by Lipper Inc. and captures information through year-end 2008.
4
second half of the period. The International Explorer Fund advisor’s commitment to emerging markets (about 9% of the fund’s assets, on average, compared with about 4% in the benchmark index) boosted performance.
Often considered more fragile than those in the developed world, emerging-market economies—particularly China and India—weathered the financial crisis better than many countries with global banking centers, which suffered more from the unwinding of excessive leverage. Rising commodity prices—especially in the last six months—also gave a lift to resource-rich, export-dependent economies. And in April, developed countries agreed to increase the resources of the International Monetary Fund from $250 billion to $1 trillion—bolstering confidence in developing nations, which may tap IMF funds to shore up their economies.
China, representing about one-third of the fund’s emerging-market assets, on average, remained in the spotlight—not only for its still-healthy appetite for oil and other commodities but also for its economic success. The Chinese government responded aggressively to the global economic slowdown with an almost $600 billion program of infrastructure investment—adding heft to the world’s third-largest economy and creating demand for the raw materials and output of multinational companies. These investments helped the Chinese economy to
| |
| Total Returns | |
| Ten Years Ended October 31, 2009 | |
| | Average |
| | Annual Return |
| International Explorer Fund | 7.70% |
| S&P EPAC SmallCap Index | 6.31 |
| International Small-Cap Funds Average1 | 5.69 |
The figures shown represent past performance, which is not a guarantee of future results. (Current performance may be lower or higher than the performance data cited. For performance data current to the most recent month-end, visit our website at www.vanguard.com/performance.) Note, too, that both investment returns and principal value can fluctuate widely, so an investor’s shares, when sold, could be worth more or less than their original cost.
1 Derived from data provided by Lipper Inc.
5
grow in 2009, despite falling exports. This accomplishment helped China’s stock market, and the fund’s Chinese holdings, almost double for the fiscal year.
Another star performer was India, less dependent on exports than China but also benefiting from growing internal consumption. The fund’s Indian holdings returned more than 100%, as did those in Indonesia. Brazil, which is more sensitive to oil prices, was a comparative laggard: The fund’s Brazilian holdings advanced “only” about 67%, while those in Mexico lost value.
The fund’s European developed-market holdings anchored the portfolio, but represented a smaller share of total assets than last year. After a year of contraction, Germany and France reported modest economic growth for the April–June calendar quarter, seeming to turn the corner ahead of the United Kingdom (and the United States). Positive economic news and a return toward normalcy in the credit markets helped the fund’s European holdings post significant double-digit gains in all countries except Greece.
In the developed Pacific region, after more than a year of decline and many years of weakness, Japan’s economy—the world’s second-largest—also moved into the black for the calendar quarter ended in June. Even though the fund’s substantial holdings in Japan returned more than 37%, well above the index return in Japan, they were overshadowed by the fund’s other Pacific Rim holdings.
On a sector basis, the fund’s holdings posted double-digit gains in all sectors—and outpaced the benchmark in most sectors—led by energy. Niko Resources, the fund’s largest holding, gained almost 90%. This Canada-based oil and gas exploration company, which is not included in the benchmark index, is active in India, Pakistan, Indonesia, and elsewhere. And, in a turnabout from last year, stock selection among industrials and financials—the fund’s two largest sectors—notably boosted returns.
Advisor’s expertise and low costs kept fund ahead of the pack
Vanguard International Explorer Fund posted an average annual return of 7.70% for the decade ended October 31, ahead of its comparative standards. This is a tribute to Schroders’ disciplined approach to investing in smaller companies that appear to have superior growth prospects. And the fund’s low expense ratio helps shareholders keep more of the returns, a benefit that compounds over the years.
A word on expenses
The fund’s expense ratio has risen over the past fiscal year. The explanation is threefold. First, as the value of fund assets has declined, the fund’s fixed expenses have accounted for a modestly higher percentage of fund assets. Second, the Vanguard funds' contracts with external advisors typically include breakpoint pricing. As assets rise above a breakpoint threshold, advisory fees are paid at a lower rate. When assets fall, as they have during fiscal 2009, a smaller portion of assets is subject to
6
the lower rate, causing the overall rate to increase. Over time, breakpoint pricing has helped shareholders benefit from the economies of scale produced by growth in the fund’s assets.
Finally, Vanguard’s contracts with external advisors generally include incentive-fee provisions and penalties that are contingent on the advisors’ performance relative to their benchmarks. This fee structure helps to ensure that the interests of the fund shareholders and advisors remain aligned. Over the past year, the advisory fee increased as the fund’s relative performance improved. The fund’s financial statements include more information about Vanguard International Explorer Fund’s incentive fee.
Whether converging or decoupling, foreign stocks still have a role
After delivering superior returns for several years, international stocks were hit even harder than U.S. stocks by the most severe financial shock since the Great Depression. This led many investors to reconsider he merits of international investing and to retrench into U.S. assets. And it enlivened the debate between those who believe world markets are “con verging” (becoming more similar in performance through the tronger linkages of trade, finance, and banking) and those who believe markets are “decoupling.”
Research does show that when there is a bear market in U.S. stocks, other countries also tend to experience bear markets. Correlations among international equity markets tend to rise noticeably during global financial crises. This was especially evident in the relatively weak first-half returns of many developed markets.
However, the diversification benefits of international investing usually become more apparent once financial crises subside—as we began to see in the second half of this fiscal year. That’s when the economic and financial performance of various countries can be expected to differ, reflecting the heterogeneous nature of national economies, capital-flow sensitivities, commodity-price exposures, and monetary and fiscal policies.
The significant volatility and divergent returns of global stock and bond markets over the past two years underscore the importance of maintaining a portfolio that is diversified and balanced across classes—including international equities—in line with your goals. With its focus on small-cap stocks, Vanguard International Explorer Fund can play an important role by providing low-cost exposure to some of the potentially fastest-growing companies outside the United States.
Thank you for entrusting your assets to Vanguard.
Sincerely,

F. William McNabb III
President and Chief Executive Officer
November 13, 2009
7
Advisor’s Report
For the 12 months ended October 31, 2009, Vanguard International Explorer Fund returned 47.88%, compared with a return of 42.42% for its benchmark index, the Standard & Poor’s Europe and Pacific SmallCap Index, a broad measure of the performance of smaller non-U.S. stocks.
The investment environment
The fiscal year ended October 31 was one of widely contrasting market conditions. The initial months were dominated by investor nervousness over the ramifications of the worldwide financial crisis as the global economy started to contract and policy makers struggled to provide sufficient monetary and fiscal stimulus.
The concerted cutting of interest rates to historically low levels, quantitative easing, and a range of fiscal packages proved very effective in restoring a measure of confidence to the credit and equity markets. Economic activity has stabilized, aided by an end to the aggressive reduction in inventory seen in the fourth calendar quarter of 2008 and first quarter of 2009 and a strong recovery in emerging economies.
For the period as a whole, international equities have staged dramatic recoveries, with returns enhanced for U.S. investors by strength in foreign currencies, most notably the euro. Small-cap equities have more than participated, generating a rise of about 43% in dollar terms. This represents a sharper recovery than for larger-cap stocks, which, as measured by the MSCI EAFE Index, rose nearly 28%. Indeed, smaller companies outperformed in every major sector and region.
Within the international small-cap arena, the outstanding region was Pacific ex Japan, which returned nearly 87%. Japan, which had been a resilient performer in the previous fiscal year, rose “only” about 27%. In sector terms, the key outperformers in the index were more cyclical areas such as energy, materials, and information technology, while consumer staples and utilities lagged.
Our successes and shortfalls
Approximately two-thirds of the value we added for the fiscal year came from stock selection in the United Kingdom and Japan. Our most notable success in the United Kingdom was in the energy sector (partly thanks to takeover offers for two of our holdings), with smaller contributions from stocks held in the consumer discretionary, financial, and health care sectors. In Japan, the key contributions came from more cyclical growth stocks in the consumer discretionary and industrial sectors. Part of this can be attributed to improved performance by these stocks in general as compared with the previous fiscal year, but it also reflected growing investor appreciation of cost-cutting measures by management, and exposure to the global recovery.
Our overweighted position in the Pacific ex Japan region was also successful, most notably in Hong Kong-listed Chinese stocks—which have benefited from the strong growth momentum in that market. Exposure in countries not represented in the index also augmented returns, including emerging markets (India, Indonesia, China, and Brazil) and Canada.
There have been relatively few shortfalls. Although stock selection was positive in continental Europe, performance was hampered by the fund’s overweighting of, and underperformance in, the utility sector. Another small headwind came from our underweighted stance in the United Kingdom, where increased risk tolerance has supported small-cap performance.
The fund’s positioning
Nagging doubts remain about the sustain- ability of the current recovery, including the indebtedness of the western consumer, the growing fiscal deficits of some Organization for Economic Cooperation and Development (OECD) economies, and the fragility of the global banking system. However, the short-term outlook appears sound as credit conditions are likely to remain accommodative and leading indicators look supportive. Equity valuations for small-cap companies are reasonable, and do not suggest investor euphoria. Although some central banks, such as those in Australia, Norway, and Brazil, have signaled a desire to tighten credit, they remain a distinct minority.
The fund has been overweighted in the Pacific ex Japan region throughout the period, although we reduced the portfolio’s exposure somewhat in the second half as a number of holdings reached our assessment of fair value. Although large-cap stocks in the region have closed the valuation discount to other developed markets, this is not true of small-caps. We remain focused on companies and sectors that are benefiting from strong growth in domestic demand generated by expansion in household incomes and the low but growing penetration of credit. We have used some of the proceeds from sales in the Pacific ex Japan region to add to our holdings in South America.
We remain cautious on Japan given the longer-term structural constraints, such as demographics, fiscal weakness, and intense competitive pressures from manufacturing upgrades elsewhere in Asia. However, better value has emerged following the market’s recent underperformance, and there are signs that recoveries in exports and industrial production are having some second-round effects on employment and consumer confidence.
We remain cautiously positioned in the United Kingdom, reflecting our continued concerns over the headwinds to domestic demand presented by high consumer indebtedness, a growing fiscal deficit, and rising unemployment. Small-cap valuations remain expensive relative to larger peers,
9
and the challenge of raising new equity is likely to be a further depressant given continued constriction in access to credit. To a lesser extent, some of the same economic issues confront a number of regions and countries in continental Europe, and we remain underweighted in financial and consumer discretionary stocks across the area. We see better opportunities in the energy, information technology, and industrial sectors.
Matthew F. Dobbs
Head of Global Small Companies
Schroder Investment Management
North America Inc.
November 11, 2009
10
Results of Proxy Voting
At a special meeting of shareholders on July 2, 2009, fund shareholders approved the following two proposals:
Proposal 1—Elect trustees for each fund.*
The individuals listed in the table below were elected as trustees for each fund. All trustees with the exception of Messrs. McNabb and Volanakis (both of whom already served as directors of The Vanguard Group, Inc.) served as trustees to the funds prior to the shareholder meeting.
| | | |
| | | | Percentage |
| Trustee | For | Withheld | For |
| John J. Brennan | 267,380,786 | 8,631,474 | 96.9% |
| Charles D. Ellis | 256,520,935 | 19,491,324 | 92.9% |
| Emerson U. Fullwood | 257,085,311 | 18,926,948 | 93.1% |
| Rajiv L. Gupta | 266,612,131 | 9,400,128 | 96.6% |
| Amy Gutmann | 267,915,925 | 8,096,335 | 97.1% |
| JoAnn Heffernan Heisen | 266,998,335 | 9,013,925 | 96.7% |
| F. William McNabb III | 267,044,346 | 8,967,914 | 96.8% |
| André F. Perold | 256,971,735 | 19,040,525 | 93.1% |
| Alfred M. Rankin, Jr. | 266,847,723 | 9,164,536 | 96.7% |
| Peter F. Volanakis | 266,899,599 | 9,112,660 | 96.7% |
| * Results are for all funds within the same trust. | | | |
Proposal 2—Update and standardize the funds’ fundamental policies regarding:
(a) Purchasing and selling real estate.
(b) Issuing senior securities.
(c) Borrowing money.
(d) Making loans.
(e) Purchasing and selling commodities.
(f) Concentrating investments in a particular industry or group of industries.
(g) Eliminating outdated fundamental investment policies not required by law.
The revised fundamental policies are clearly stated and simple, yet comprehensive, making oversight and compliance more efficient than under the former policies. The revised fundamental policies will allow the funds to respond more quickly to regulatory and market changes, while avoiding the costs and delays associated with successive shareholder meetings.
| | | | | |
| | | | | Broker | Percentage |
| Vanguard Fund | For | Abstain | Against | Non-Votes | For |
| International Explorer Fund | | | | | |
| 2a | 68,399,495 | 2,081,188 | 2,534,606 | 3,618,011 | 89.3% |
| 2b | 68,044,153 | 2,265,188 | 2,705,948 | 3,618,011 | 88.8% |
| 2c | 67,408,469 | 2,248,552 | 3,358,266 | 3,618,013 | 88.0% |
| 2d | 67,562,324 | 2,288,402 | 3,164,561 | 3,618,013 | 88.2% |
| 2e | 67,872,063 | 2,203,272 | 2,939,952 | 3,618,012 | 88.6% |
| 2f | 68,173,819 | 2,146,537 | 2,694,932 | 3,618,012 | 89.0% |
| 2g | 68,779,031 | 2,166,537 | 2,069,721 | 3,618,011 | 89.8% |
11
International Explorer Fund
Fund Profile
As of October 31, 2009
| | |
| Portfolio Characteristics | | |
| | | Comparative |
| | Fund | Index1 |
| Number of Stocks | 243 | 3,002 |
| Turnover Rate | 52% | — |
| Expense Ratio2 | 0.42% | — |
| Short-Term Reserves | 5.2% | — |
| | |
| Sector Diversification (% of equity exposure) |
| | | Comparative |
| | Fund | Index1 |
| Consumer Discretionary | 12.3% | 18.2% |
| Consumer Staples | 4.5 | 5.6 |
| Energy | 9.0 | 4.3 |
| Financials | 14.6 | 19.1 |
| Health Care | 6.8 | 6.0 |
| Industrials | 28.8 | 24.1 |
| Information Technology | 9.3 | 9.1 |
| Materials | 10.0 | 9.9 |
| Telecommunication Services | 1.0 | 1.3 |
| Utilities | 3.7 | 2.4 |
| |
| Volatility Measures3 | |
| | Fund Versus |
| | Comparative Index1 |
| R-Squared | 0.98 |
| Beta | 0.97 |
| | |
| Ten Largest Holdings4 (% of total net assets) |
| Niko Resources Ltd. | oil & gas exploration | |
| | & production | 1.5% |
| Swedish Match AB | tobacco | 1.3 |
| Azimut Holding SPA | asset management | |
| | & custody banks | 1.2 |
| Bilfinger Berger AG | construction & | |
| | engineering | 1.2 |
| Rheinmetall AG | industrial | |
| | conglomerates | 1.1 |
| Andritz AG | industrial machinery | 1.1 |
| Red Electrica Corp. SA | electric | 1.1 |
| Acino Holding AG | pharmaceuticals | 1.1 |
| Helvetia Holding AG | multi-line insurance | 1.1 |
| Fugro NV | oil & gas equipment | |
| | & services | 1.0 |
| Total | | 11.7% |
Allocation by Region (% of equity exposure)
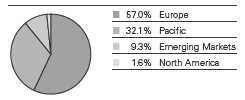
1 S&P EPAC SmallCap Index.
2 The expense ratio shown is from the prospectus dated February 27, 2009, and represents estimated costs for the current fiscal year based
on the fund’s net assets as of the prospectus date. For the fiscal year ended October 31, 2009, the fund’s expense ratio was 0.45%.
3 For an explanation of R-squared, beta, and other terms used here, see the Glossary.
4 The holdings listed exclude any temporary cash investments and equity index products.
12
International Explorer Fund
| | |
| Market Diversification (% of equity exposure) |
| | | Comparative |
| | Fund | Index1 |
| Europe | | |
| United Kingdom | 13.6% | 19.6% |
| Switzerland | 10.1 | 7.5 |
| Germany | 7.7 | 6.5 |
| France | 6.4 | 9.6 |
| Netherlands | 4.0 | 2.7 |
| Italy | 3.7 | 3.7 |
| Austria | 2.7 | 0.4 |
| Spain | 2.1 | 4.1 |
| Sweden | 1.9 | 2.4 |
| Denmark | 1.3 | 0.8 |
| Belgium | 1.2 | 1.2 |
| Other European Markets | 2.3 | 5.3 |
| Subtotal | 57.0% | 63.8% |
| Pacific | | |
| Japan | 20.3% | 21.4% |
| Australia | 6.7 | 6.9 |
| Hong Kong | 2.3 | 2.4 |
| Singapore | 1.8 | 1.2 |
| New Zealand | 1.0 | 0.2 |
| Subtotal | 32.1% | 32.1% |
| Emerging Markets | | |
| Brazil | 2.3% | 0.0 |
| China | 2.1 | 0.2 |
| South Korea | 1.1 | 3.9 |
| India | 1.0 | 0.0 |
| Other Emerging Markets | 2.8 | 0.0 |
| Subtotal | 9.3% | 4.1% |
| North America | | |
| Canada | 1.6% | 0.0% |
1 S&P EPAC SmallCap Index.
13
International Explorer Fund
Performance Summary
All of the returns in this report represent past performance, which is not a guarantee of future results that may be achieved by the fund. (Current performance may be lower or higher than the performance data cited. For performance data current to the most recent month-end, visit our website at www.vanguard.com/performance.) Note, too, that both investment returns and principal value can fluctuate widely, so an investor’s shares, when sold, could be worth more or less than their original cost. The returns shown do not reflect taxes that a shareholder would pay on fund distributions or on the sale of fund shares.
Cumulative Performance: October 31, 1999–October 31, 2009
Initial Investment of $25,000
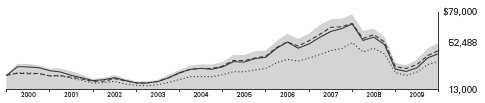
| | | | |
| | | Average Annual Total Returns | Final Value |
| | | Periods Ended October 31, 2009 | of a $25,000 |
| | One Year | Five Years | Ten Years | Investment |
| International Explorer Fund1 | 47.88% | 7.71% | 7.70% | $52,488 |
| MSCI All Country World Index ex USA | 34.79 | 7.58 | 3.95 | 36,834 |
| S&P EPAC SmallCap Index | 42.42 | 7.00 | 6.31 | 46,116 |
| International Small-Cap Funds Average2 | 43.73 | 6.20 | 5.69 | 43,472 |
1 Total returns do not reflect the 2% fee assessed on redemptions of shares purchased on or after June 27, 2003, and held for less than
two months, or the account service fee that may be applicable to certain accounts with balances below $10,000.
2 Derived from data provided by Lipper Inc.
14
International Explorer Fund
Fiscal-Year Total Returns (%): October 31, 1999–October 31, 2009
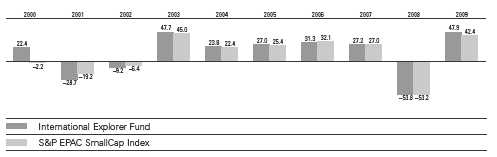
Average Annual Total Returns: Periods Ended September 30, 2009
This table presents average annual total returns through the latest calendar quarter—rather than through the end of the fiscal period. Securities and Exchange Commission rules require that we provide this information.
| | | | |
| | Inception Date | One Year | Five Years | Ten Years |
| International Explorer Fund1 | 11/4/1996 | 14.08% | 8.72% | 8.07% |
1 Total returns do not reflect the 2% fee assessed on redemptions of shares purchased on or after June 27, 2003, and held for less than two months, or the account service fee that may be applicable to certain accounts with balances below $10,000.
Note: See Financial Highlights table for dividend and capital gains information.
15
International Explorer Fund
Financial Statements
Statement of Net Assets
As of October 31, 2009
The fund reports a complete list of its holdings in regulatory filings four times in each fiscal year, at the quarter-ends. For the second and fourth fiscal quarters, the lists appear in the fund’s semiannual and annual reports to shareholders. For the first and third fiscal quarters, the fund files the lists with the Securities and Exchange Commission on Form N-Q. Shareholders can look up the fund’s Forms N-Q on the SEC’s website at www.sec.gov. Forms N-Q may also be reviewed and copied at the SEC’s Public Reference Room (see the back cover of this report for further information).
| | | |
| | | | Market |
| | | | Value• |
| | | Shares | ($000) |
| Common Stocks (93.9%) | | |
| Australia (6.3%) | | |
| | Computershare Ltd. | 1,751,935 | 17,009 |
| | Sonic Healthcare Ltd. | 1,199,408 | 14,974 |
| * | Iluka Resources Ltd. | 4,355,803 | 13,494 |
| | Boral Ltd. | 2,364,545 | 12,061 |
| | Ansell Ltd. | 1,275,078 | 11,781 |
| | Amcor Ltd. | 1,954,739 | 10,066 |
| | Crane Group Ltd. | 1,137,475 | 9,166 |
| | Mirvac Group | 6,534,377 | 8,556 |
| * | James Hardie | | |
| | Industries NV | 961,720 | 6,095 |
| *,^ | Elders Ltd. | 34,497,331 | 5,658 |
| * | Transpacific Industries | | |
| | Group Ltd. | 4,210,630 | 5,630 |
| ^ | Fairfax Media Ltd. | 3,691,519 | 5,231 |
| | | | 119,721 |
| Austria (2.5%) | | |
| | Andritz AG | 370,000 | 20,376 |
| | Kapsch TrafficCom AG | 261,662 | 9,200 |
| | Schoeller-Bleckmann | | |
| | Oilfield Equipment AG | 162,000 | 7,551 |
| | Rosenbauer | | |
| | International AG | 160,000 | 6,187 |
| | Oesterreichische Post AG | 155,000 | 4,523 |
| | | | 47,837 |
| Belgium (1.1%) | | |
| | Bekaert SA | 70,000 | 9,003 |
| | EVS Broadcast | | |
| | Equipment SA | 85,500 | 6,287 |
| | Telenet Group Holding NV | 230,000 | 6,130 |
| | | | 21,420 |
| Brazil (2.1%) | | |
| | Redecard SA | 1,127,202 | 16,547 |
| | Cia Brasileira de | | |
| | Distribuicao Grupo Pao | | |
| | de Acucar ADR | 201,153 | 12,168 |
| | Localiza Rent A CAR | 1,116,938 | 11,698 |
| | | | 40,413 |
| | | |
| | | | Market |
| | | | Value• |
| | | Shares | ($000) |
| Canada (1.5%) | | |
| | Niko Resources Ltd. | 356,816 | 28,887 |
| |
| China (2.0%) | | |
| *,^ | China Taiping Insurance | | |
| | Holdings Co. Ltd. | 2,704,000 | 9,530 |
| |
| | Lenovo Group Ltd. | 9,728,000 | 5,416 |
| | China Resources Gas | | |
| | Group Ltd. | 5,244,195 | 5,075 |
| * | Sohu.com Inc. | 69,738 | 3,877 |
| *,^ | China Southern | | |
| | Airlines Co. Ltd. | 13,214,000 | 3,844 |
| | China Everbright Ltd. | 1,354,000 | 3,192 |
| | Shenzhen | | |
| | Expressway Co. Ltd. | 5,442,000 | 2,612 |
| | Citic Pacific Ltd. | 864,000 | 2,227 |
| * | Shanda Games Ltd. ADR | 221,700 | 2,208 |
| | | | 37,981 |
| Denmark (1.2%) | | |
| * | Topdanmark A/S | 80,000 | 11,535 |
| | TrygVesta AS | 160,000 | 11,529 |
| | | | 23,064 |
| Finland (0.3%) | | |
| | Elisa Oyj | 260,000 | 5,035 |
| |
| France (6.0%) | | |
| ^ | Bourbon SA | 460,000 | 19,131 |
| * | Alten Ltd. | 550,000 | 13,798 |
| | Ipsen SA | 260,000 | 13,247 |
| | Saft Groupe SA | 242,000 | 12,565 |
| | Neopost SA | 110,000 | 9,627 |
| | Sword Group | 250,000 | 8,663 |
| | Rubis | 78,439 | 7,201 |
| | Virbac SA | 73,000 | 6,869 |
| * | Store Electronic | 390,000 | 6,798 |
| | IPSOS | 200,000 | 6,124 |
| * | Meetic | 155,000 | 4,538 |
16
| | | |
| International Explorer Fund | | |
| |
| |
| |
| | | | Market |
| | | | Value• |
| | | Shares | ($000) |
| * | SeLoger.com | 105,800 | 3,705 |
| *,^ | Easydentic | 104,133 | 1,082 |
| ^ | Compagnie des Alpes | 28,822 | 1,060 |
| | | | 114,408 |
| Germany (7.2%) | | |
| | Bilfinger Berger AG | 350,000 | 22,538 |
| | Rheinmetall AG | 400,000 | 21,743 |
| | MTU Aero Engines | | |
| | Holding AG | 390,000 | 17,722 |
| | GFK SE | 400,000 | 12,655 |
| | Grenkeleasing AG | 305,011 | 11,812 |
| | Demag Cranes AG | 320,000 | 11,090 |
| | Wirecard AG | 460,000 | 5,984 |
| | Tognum AG | 380,000 | 5,808 |
| | Bauer AG | 130,000 | 5,153 |
| * | Morphosys AG | 190,000 | 4,978 |
| ^ | Hawesko Holding AG | 154,339 | 4,314 |
| * | Centrotherm | | |
| | Photovoltaics AG | 70,000 | 3,195 |
| | Tipp24 SE | 66,719 | 2,718 |
| * | United Internet AG | 200,586 | 2,612 |
| | Symrise AG | 100,000 | 1,813 |
| | Medion AG | 167,081 | 1,752 |
| * | XING AG | 24,540 | 1,267 |
| * | Air Berlin PLC | 250,000 | 1,263 |
| | | | 138,417 |
| Greece (0.6%) | | |
| | JUMBO SA | 470,000 | 5,876 |
| | Aegean Airlines SA | 458,183 | 2,805 |
| | Eurobank Properties Real | | |
| | Estate Investment Co. | 160,000 | 2,013 |
| | | | 10,694 |
| Hong Kong (2.1%) | | |
| | Lee & Man Paper | | |
| | Manufacturing Ltd. | 4,538,000 | 8,950 |
| | Kerry Properties Ltd. | 1,257,500 | 7,012 |
| | MTR Corp. | 1,750,000 | 6,198 |
| *,^ | Dah Sing Banking | | |
| | Group Ltd. | 4,030,000 | 5,587 |
| ^ | Techtronic Industries Co. | 5,643,500 | 4,533 |
| * | Beijing Enterprises | | |
| | Water Group Ltd. | 16,990,000 | 4,124 |
| | Citic 1616 Holdings Ltd. | 12,452,000 | 4,114 |
| | | | 40,518 |
| India (1.0%) | | |
| * | Cairn India Ltd. | 1,917,727 | 10,620 |
| | Shriram Transport | | |
| | Finance Co. Ltd. | 951,549 | 7,876 |
| | | | 18,496 |
| Indonesia (0.6%) | | |
| | Bank Rakyat Indonesia | 9,487,000 | 6,904 |
| | Bank Central Asia Tbk PT | 11,011,000 | 5,185 |
| | | | 12,089 |
| | | |
| | | | Market |
| | | | Value• |
| | | Shares | ($000) |
| Ireland (0.7%) | | |
| | DCC PLC | 550,000 | 14,483 |
| |
| Italy (3.5%) | | |
| | Azimut Holding SPA | 1,930,915 | 23,297 |
| * | CIR-Compagnie Industriali | | |
| | Riunite SPA | 8,500,000 | 19,126 |
| | ACEA SPA | 640,000 | 7,487 |
| | Zignago Vetro SPA | 1,200,000 | 6,966 |
| * | Natuzzi SPA ADR | 1,708,450 | 5,433 |
| | Buzzi Unicem SPA | 450,000 | 4,436 |
| | | | 66,745 |
| Japan (19.1%) | | |
| | Musashi Seimitsu | | |
| | Industry Co. Ltd. | 849,300 | 17,623 |
| | Nabtesco Corp. | 1,455,000 | 16,751 |
| | Nifco Inc./Japan | 691,500 | 14,151 |
| | Obic Co. Ltd. | 79,980 | 13,524 |
| | Chugoku Marine | | |
| | Paints Ltd. | 1,834,000 | 12,863 |
| | Arcs Co. Ltd. | 820,900 | 12,059 |
| | Nippon Thompson | | |
| | Co. Ltd. | 2,202,000 | 11,549 |
| | Nichi-iko Pharmaceutical | | |
| | Co. Ltd. | 374,400 | 11,137 |
| | Miura Co. Ltd. | 391,100 | 10,922 |
| | Modec Inc. | 542,300 | 10,776 |
| | Tsuruha Holdings Inc. | 266,800 | 10,399 |
| | Trusco Nakayama Corp. | 663,700 | 10,341 |
| | Nitta Corp. | 679,000 | 9,907 |
| | HIS Co. Ltd. | 448,400 | 9,637 |
| | Tokai Tokyo | | |
| | Financial Holdings | 2,941,000 | 9,531 |
| ^ | Union Tool Co. | 316,700 | 9,236 |
| | Seven Bank Ltd. | 3,633 | 8,875 |
| | Shinmaywa Industries Ltd. | 2,411,000 | 8,689 |
| ^ | Moshi Moshi Hotline Inc. | 469,900 | 8,538 |
| ^ | Nihon Parkerizing Co. Ltd. | 714,000 | 8,465 |
| | Glory Ltd. | 380,900 | 8,381 |
| ^ | Takasago | | |
| | International Corp. | 1,556,000 | 8,128 |
| | Exedy Corp. | 391,600 | 8,052 |
| | Tsumura & Co. | 218,300 | 7,512 |
| | JSP Corp. | 777,400 | 7,433 |
| | Dowa Holdings Co., Ltd. | 1,273,000 | 7,432 |
| | Lintec Corp. | 404,800 | 7,168 |
| | Aica Kogyo Co. Ltd. | 744,200 | 7,120 |
| | Tsutsumi Jewelry Co. Ltd. | 271,000 | 6,379 |
| | Kuroda Electric Co. Ltd. | 429,400 | 6,208 |
| | NEC Networks & System | | |
| | Integration Corp. | 509,900 | 6,196 |
| | Daido Steel Co. Ltd. | 1,819,000 | 6,191 |
| ^ | Nidec Copal Corp. | 374,700 | 5,618 |
17
International Explorer Fund
| | | |
| | | | Market |
| | | | Value• |
| | | Shares | ($000) |
| | Nishimatsuya | | |
| | Chain Co. Ltd. | 527,800 | 5,286 |
| | Sumida Corp. | 797,400 | 5,272 |
| | Tokyo Tomin Bank Ltd. | 343,900 | 5,014 |
| | Hisaka Works Ltd. | 459,000 | 4,803 |
| | Nafco Co. Ltd. | 215,300 | 4,053 |
| * | Shinko Plantech Co. Ltd. | 382,700 | 3,911 |
| | Icom Inc. | 160,900 | 3,885 |
| | Koito Manufacturing | | |
| | Co. Ltd. | 250,000 | 3,584 |
| | Daihatsu Diesel | | |
| | Manufacturing Co. Ltd. | 780,000 | 3,394 |
| | Sumitomo Osaka | | |
| | Cement Co. Ltd. | 1,604,000 | 2,810 |
| | Fujikura Kasei Co. Ltd. | 527,900 | 2,727 |
| | DC Co. Ltd. | 446,500 | 1,381 |
| * | Minato Bank Ltd. | 968,000 | 1,218 |
| | Nishio Rent All Co. Ltd. | 149,600 | 1,119 |
| * | Dowa Mining Co. Ltd. | | |
| | Rights Exp. 1/29/10 | 731,000 | 219 |
| | Ryosan Co. Ltd. | 8,500 | 203 |
| | | | 365,670 |
| Mexico (0.5%) | | |
| * | Desarrolladora Homex | | |
| | SAB de CV ADR | 280,000 | 9,957 |
| |
| Netherlands (3.8%) | | |
| | Fugro NV | 351,000 | 19,550 |
| ^ | Ten Cate NV | 732,000 | 17,137 |
| | SBM Offshore NV | 786,000 | 15,052 |
| | Imtech NV | 350,000 | 8,897 |
| | Smit Internationale NV | 80,000 | 6,289 |
| *,^ | Smartrac NV | 240,000 | 4,149 |
| | Exact Holding NV | 44,875 | 1,237 |
| | | | 72,311 |
| New Zealand (1.0%) | | |
| | Fletcher Building Ltd. | 2,559,956 | 15,122 |
| | Fisher & Paykel | | |
| | Healthcare Corp. Ltd. | 1,445,403 | 3,203 |
| | | | 18,325 |
| Norway (0.5%) | | |
| *,^ | Pronova BioPharma AS | 1,700,000 | 5,274 |
| * | Dockwise Ltd. | 3,486,780 | 5,129 |
| | | | 10,403 |
| Philippines (0.8%) | | |
| | Semirara Mining Corp. | | |
| | Class A | 10,814,500 | 8,998 |
| | Aboitiz Equity | | |
| | Ventures Inc. | 37,949,000 | 6,551 |
| | | | 15,549 |
| | | |
| | | | Market |
| | | | Value• |
| | | Shares | ($000) |
| Singapore (1.7%) | | |
| | Singapore Airport | | |
| | Terminal Services Ltd. | 4,124,000 | 7,207 |
| | Singapore Exchange Ltd. | 1,024,000 | 5,803 |
| ^ | Keppel Land Ltd. | 2,783,000 | 5,535 |
| | Wing Tai Holdings Ltd. | 3,411,000 | 3,993 |
| ^ | Olam International Ltd. | 1,869,000 | 3,588 |
| | SembCorp Industries Ltd. | 1,500,000 | 3,534 |
| | Suntec Real Estate | | |
| | Investment Trust | 3,949,000 | 3,359 |
| | | | 33,019 |
| South Korea (1.1%) | | |
| | Samsung SDI Co. Ltd. | 47,706 | 5,446 |
| | Doosan Infracore Co. Ltd. | 380,300 | 5,412 |
| | Hite Brewery Co. Ltd. | 24,625 | 3,351 |
| | Yuhan Corp. | 20,100 | 3,237 |
| | Daegu Bank | 143,280 | 1,901 |
| | Samsung C&T Corp. | 28,674 | 1,167 |
| | | | 20,514 |
| Spain (2.0%) | | |
| | Red Electrica Corp. SA | 390,000 | 20,143 |
| | Enagas | 630,000 | 12,959 |
| ^ | Laboratorios | | |
| | Farmaceuticos Rovi SA | 313,000 | 3,537 |
| * | Baron de Ley | 28,461 | 1,381 |
| | | | 38,020 |
| Sweden (1.8%) | | |
| | Swedish Match AB | 1,200,000 | 24,628 |
| | Saab AB Class B | 700,000 | 9,190 |
| | Mekonomen AB | 5,356 | 104 |
| | | | 33,922 |
| Switzerland (9.5%) | | |
| | Acino Holding AG | 122,500 | 20,103 |
| | Helvetia Holding AG | 63,000 | 20,087 |
| | Bank Sarasin & Cie AG | | |
| | Class B | 470,000 | 18,715 |
| | Banque Cantonale | | |
| | Vaudoise | 41,000 | 15,443 |
| | Sika AG | 10,000 | 13,557 |
| * | Dufry Group | 208,645 | 13,179 |
| | BKW FMB Energie AG | 160,000 | 13,161 |
| | Mobilezone Holding AG | 1,300,000 | 9,986 |
| | GAM Holding Ltd. | 800,000 | 9,760 |
| | Partners Group Holding AG | 70,000 | 8,586 |
| * | Gategroup Holding AG | 300,000 | 7,914 |
| | Bucher Industries AG | 60,000 | 6,304 |
| | Kuoni Reisen Holding AG | 18,000 | 6,102 |
| | Lonza Group AG | 75,000 | 5,832 |
| *,^ | Temenos Group AG | 180,000 | 4,108 |
18
| | | |
| International Explorer Fund | | |
| |
| |
| |
| | | | Market |
| | | | Value• |
| | | Shares | ($000) |
| | Valora Holding AG | 17,000 | 4,053 |
| | Gurit Holding AG | 5,000 | 2,759 |
| | Compagnie Financiere | | |
| | Tradition SA | 17,790 | 2,206 |
| | | | 181,855 |
| Taiwan (0.6%) | | |
| | Hung Poo Real Estate | | |
| | Development Corp. | 2,807,000 | 4,050 |
| * | Far Eastern | | |
| | International Bank | 11,822,000 | 4,001 |
| * | Tatung Co. Ltd. | 15,131,000 | 3,333 |
| | | | 11,384 |
| United Kingdom (12.8%) | | |
| | Carillion PLC | 3,700,000 | 17,824 |
| | Babcock | | |
| | International Group | 1,375,000 | 13,651 |
| * | Premier Oil PLC | 670,504 | 12,928 |
| | Ultra Electronics Holdings | 500,000 | 10,793 |
| | Meggitt PLC | 2,600,000 | 10,410 |
| | Wetherspoon (J.D.) PLC | 1,300,000 | 9,798 |
| | SIG PLC | 4,214,212 | 8,201 |
| * | Dechra | | |
| | Pharmaceuticals PLC | 1,059,719 | 7,975 |
| | Atkins WS PLC | 825,000 | 7,630 |
| * | Gulfsands Petroleum PLC | 2,005,645 | 7,569 |
| * | CSR PLC | 1,006,976 | 7,350 |
| | Wellstream Holdings PLC | 800,000 | 6,701 |
| | Homeserve PLC | 239,076 | 6,327 |
| | William Hill PLC | 2,300,082 | 6,316 |
| | Go-Ahead Group PLC | 253,964 | 5,915 |
| | Findel PLC | 9,144,945 | 5,843 |
| * | Inchcape PLC | 12,000,000 | 5,755 |
| | Booker Group PLC | 7,440,022 | 5,438 |
| * | Sports Direct | | |
| | International PLC | 3,250,000 | 5,189 |
| | Eco Animal | | |
| | Health Group PLC | 1,478,568 | 5,175 |
| | Paragon Group of | | |
| | Cos. PLC | 2,099,762 | 4,988 |
| | Informa PLC | 1,000,000 | 4,797 |
| | Investec PLC | 600,000 | 4,283 |
| | Millennium & | | |
| | Copthorne Hotels PLC | 764,652 | 4,227 |
| | QinetiQ Group PLC | 1,527,498 | 4,105 |
| | PV Crystalox Solar PLC | 3,800,000 | 4,066 |
| * | Leo Capital PLC | 6,150,108 | 3,981 |
| | Derwent London PLC | 180,000 | 3,666 |
| | HMV Group PLC | 1,959,794 | 3,561 |
| | | | |
| | | | | Market |
| | | | | Value• |
| | | | Shares | ($000) |
| | Headlam Group PLC | 597,569 | 3,035 |
| | Telecom Plus PLC | | 600,000 | 3,000 |
| | Nestor Healthcare | | | |
| | Group PLC | | 3,520,445 | 2,741 |
| | John Wood Group PLC | 500,000 | 2,619 |
| | Hunting PLC | | 300,000 | 2,577 |
| | Speedy Hire PLC | | 4,250,668 | 2,524 |
| | Future PLC | | 7,510,000 | 2,518 |
| | National Express | | | |
| | Group PLC | | 452,750 | 2,408 |
| | RM PLC | | 1,000,000 | 2,395 |
| * | Chrysalis Group PLC | 1,400,000 | 2,332 |
| | Forth Ports PLC | | 127,658 | 2,311 |
| * | AEA Technology PLC | 3,854,276 | 1,832 |
| | Devro plc | | 838,646 | 1,655 |
| | Provident Financial PLC | 100,000 | 1,525 |
| | Alexon Group PLC | | 2,259,341 | 1,520 |
| | Helphire PLC | | 1,601,852 | 1,507 |
| * | Punch Taverns PLC | | 1,000,000 | 1,360 |
| | Record PLC | | 633,333 | 847 |
| | Domino Printing Sciences | 150,000 | 731 |
| * | Pinnacle Staffing | | | |
| | Group plc | | 723,983 | 36 |
| * | I-Mate PLC | | 2,100,000 | 4 |
| | | | | 243,939 |
| Total Common Stocks | | | |
| (Cost $1,631,303) | | | 1,795,076 |
| Temporary Cash Investment (7.2%) | |
| Money Market Fund (7.2%) | | |
| 1,2 | Vanguard Market | | | |
| | Liquidity Fund, 0.225% | | |
| | (Cost $137,929) | 137,929,463 | 137,929 |
| Total Investments (101.1%) | | |
| (Cost $1,769,232) | | | 1,933,005 |
| Other Assets and Liabilities (–1.1%) | |
| Other Assets | | | 38,257 |
| Liabilities2 | | | (59,780) |
| | | | | (21,523) |
| Net Assets (100%) | | | |
| Applicable to 141,109,571 outstanding | |
| $.001 par value shares of beneficial | |
| interest (unlimited authorization) | 1,911,482 |
| Net Asset Value Per Share | | $13.55 |
19
International Explorer Fund
| |
| At October 31, 2009, net assets consisted of: |
| | Amount |
| | ($000) |
| Paid-in Capital | 1,945,454 |
| Undistributed Net Investment Income | 19,402 |
| Accumulated Net Realized Losses | (217,251) |
| Unrealized Appreciation (Depreciation) | |
| Investment Securities | 163,773 |
| Foreign Currencies | 104 |
| Net Assets | 1,911,482 |
• See Note A in Notes to Financial Statements.
* Non-income-producing security.
^ Part of security position is on loan to broker-dealers. The total value of securities on loan is $36,718,000.
1 Affiliated money market fund available only to Vanguard funds and certain trusts and accounts managed by Vanguard. Rate shown is the 7-day yield.
2 Includes $39,691,000 of collateral received for securities on loan.
ADR—American Depositary Receipt.
See accompanying Notes, which are an integral part of the Financial Statements.
20
| |
| International Explorer Fund | |
| |
| |
| Statement of Operations | |
| |
| | Year Ended |
| | October 31, 2009 |
| | ($000) |
| Investment Income | |
| Income | |
| Dividends1 | 30,871 |
| Interest2 | 257 |
| Security Lending | 1,128 |
| Total Income | 32,256 |
| Expenses | |
| Investment Advisory Fees—Note B | |
| Basic Fee | 2,956 |
| Performance Adjustment | — |
| The Vanguard Group—Note C | |
| Management and Administrative | 2,126 |
| Marketing and Distribution | 287 |
| Custodian Fees | 239 |
| Auditing Fees | 29 |
| Shareholders’ Reports and Proxies | 67 |
| Trustees’ Fees and Expenses | 2 |
| Total Expenses | 5,706 |
| Expenses Paid Indirectly | (57) |
| Net Expenses | 5,649 |
| Net Investment Income | 26,607 |
| Realized Net Gain (Loss) | |
| Investment Securities Sold | (138,828) |
| Foreign Currencies | 455 |
| Realized Net Gain (Loss) | (138,373) |
| Change in Unrealized Appreciation (Depreciation) | |
| Investment Securities | 623,405 |
| Foreign Currencies | 224 |
| Change in Unrealized Appreciation (Depreciation) | 623,629 |
| Net Increase (Decrease) in Net Assets Resulting from Operations | 511,863 |
1 Dividends are net of foreign withholding taxes of $2,333,000.
2 Interest income from an affiliated company of the fund was $257,000.
See accompanying Notes, which are an integral part of the Financial Statements.
21
| | |
| International Explorer Fund | | |
| |
| |
| Statement of Changes in Net Assets | | |
| |
| | Year Ended October 31, |
| | 2009 | 2008 |
| | ($000) | ($000) |
| Increase (Decrease) in Net Assets | | |
| Operations | | |
| Net Investment Income | 26,607 | 56,946 |
| Realized Net Gain (Loss) | (138,373) | (59,891) |
| Change in Unrealized Appreciation (Depreciation) | 623,629 | (1,472,051) |
| Net Increase (Decrease) in Net Assets Resulting from Operations | 511,863 | (1,474,996) |
| Distributions | | |
| Net Investment Income | (37,635) | (79,257) |
| Realized Capital Gain1 | — | (373,252) |
| Total Distributions | (37,635) | (452,509) |
| Capital Share Transactions | | |
| Issued | 642,115 | 106,562 |
| Issued in Lieu of Cash Distributions | 32,939 | 396,475 |
| Redeemed2 | (317,000) | (748,736) |
| Net Increase (Decrease) from Capital Share Transactions | 358,054 | (245,699) |
| Total Increase (Decrease) | 832,282 | (2,173,204) |
| Net Assets | | |
| Beginning of Period | 1,079,200 | 3,252,404 |
| End of Period3 | 1,911,482 | 1,079,200 |
1 Includes fiscal 2008 short-term gain distributions totaling $36,430,000. Short-term gain distributions are treated as ordinary income dividends for tax purposes.
2 Net of redemption fees for fiscal 2009 and 2008 of $170,000 and $33,000, respectively.
3 Net Assets—End of Period includes undistributed net investment income of $19,402,000 and $23,100,000.
See accompanying Notes, which are an integral part of the Financial Statements.
22
| | | | | |
| International Explorer Fund | | | | | |
| |
| |
| Financial Highlights | | | | | |
| |
| |
| For a Share Outstanding | | | Year Ended October 31, |
| Throughout Each Period | 2009 | 2008 | 2007 | 2006 | 2005 |
| Net Asset Value, Beginning of Period | $9.52 | $24.70 | $21.50 | $17.99 | $14.64 |
| Investment Operations | | | | | |
| Net Investment Income | .238 | .470 | .480 | .520 | .370 |
| Net Realized and Unrealized Gain (Loss) | | | | | |
| on Investments | 4.148 | (12.110) | 4.950 | 4.740 | 3.510 |
| Total from Investment Operations | 4.386 | (11.640) | 5.430 | 5.260 | 3.880 |
| Distributions | | | | | |
| Dividends from Net Investment Income | (.356) | (.620) | (.580) | (.400) | (.240) |
| Distributions from Realized Capital Gains | — | (2.920) | (1.650) | (1.350) | (.290) |
| Total Distributions | (.356) | (3.540) | (2.230) | (1.750) | (.530) |
| Net Asset Value, End of Period | $13.55 | $9.52 | $24.70 | $21.50 | $17.99 |
| |
| Total Return1 | 47.88% | –53.80% | 27.18% | 31.31% | 27.04% |
| |
| Ratios/Supplemental Data | | | | | |
| Net Assets, End of Period (Millions) | $1,911 | $1,079 | $3,252 | $2,668 | $2,130 |
| Ratio of Expenses to Average Net Assets2 | 0.45% | 0.36% | 0.35% | 0.44% | 0.50% |
| Ratio of Net Investment Income to | | | | | |
| Average Net Assets | 2.10% | 2.59% | 1.99% | 2.56% | 2.17% |
| Portfolio Turnover Rate | 52% | 29% | 45% | 32% | 38% |
1 Total returns do not reflect the 2% fee assessed on redemptions of shares held for less than two months, or the account service fee that may be applicable to certain accounts with balances below $10,000.
2 Includes performance-based investment advisory fee increases (decreases) of 0.00%, (0.01%), 0.00%, 0.02%, and 0.02%.
See accompanying Notes, which are an integral part of the Financial Statements.
23
International Explorer Fund
Notes to Financial Statements
Vanguard International Explorer Fund is registered under the Investment Company Act of 1940 as an open-end investment company, or mutual fund. The fund invests in securities of foreign issuers, which may subject it to investment risks not normally associated with investing in securities of United States corporations.
A. The following significant accounting policies conform to generally accepted accounting principles for U.S. mutual funds. The fund consistently follows such policies in preparing its financial statements.
1. Security Valuation: Securities are valued as of the close of trading on the New York Stock Exchange (generally 4 p.m., Eastern time) on the valuation date. Equity securities are valued at the latest quoted sales prices or official closing prices taken from the primary market in which each security trades; such securities not traded on the valuation date are valued at the mean of the latest quoted bid and asked prices. Securities for which market quotations are not readily available, or whose values have been affected by events occurring before the fund’s pricing time but after the close of the securities’ primary markets, are valued at their fair values calculated according to procedures adopted by the board of trustees. These procedures include obtaining quotations from an independent pricing service, monitoring news to identify significant market- or security-specific events, and evaluating changes in the va lues of foreign market proxies (for example, ADRs, futures contracts, or exchange-traded funds), between the time the foreign markets close and the fund’s pricing time. When fair-value pricing is employed, the prices of securities used by a fund to calculate its net asset value may differ from quoted or published prices for the same securities. Investments in Vanguard Market Liquidity Fund are valued at that fund’s net asset value.
2. Foreign Currency: Securities and other assets and liabilities denominated in foreign currencies are translated into U.S. dollars using exchange rates obtained from an independent third party as of the fund’s pricing time on the valuation date. Realized gains (losses) and unrealized appreciation (depreciation) on investment securities include the effects of changes in exchange rates since the securities were purchased, combined with the effects of changes in security prices. Fluctuations in the value of other assets and liabilities resulting from changes in exchange rates are recorded as unrealized foreign currency gains (losses) until the assets or liabilities are settled in cash, at which time they are recorded as realized foreign currency gains (losses).
3. Federal Income Taxes: The fund intends to continue to qualify as a regulated investment company and distribute all of its taxable income. Management has analyzed the fund’s tax positions taken for all open federal income tax years (October 31, 2006–2009), and has concluded that no provision for federal income tax is required in the fund’s financial statements.
4. Distributions: Distributions to shareholders are recorded on the ex-dividend date.
5. Security Lending: The fund may lend its securities to qualified institutional borrowers to earn additional income. Security loans are required to be secured at all times by collateral at least equal to the market value of securities loaned. The fund invests cash collateral received in Vanguard Market Liquidity Fund, and records a liability for the return of the collateral, during the period the securities are on loan. Security lending income represents the income earned on investing cash collateral, less expenses associated with the loan.
6. Other: Dividend income is recorded on the ex-dividend date. Interest income includes income distributions received from Vanguard Market Liquidity Fund and is accrued daily. Security transactions are accounted for on the date securities are bought or sold. Costs used to determine realized gains (losses) on the sale of investment securities are those of the specific securities sold. Fees assessed on redemptions of capital shares are credited to paid-in capital.
24
International Explorer Fund
B. Schroder Investment Management North America Inc. provides investment advisory services to the fund for a fee calculated at an annual percentage rate of average net assets. The basic fee is subject to quarterly adjustments based on the fund’s performance for the preceding three years relative to the S&P EPAC SmallCap Index. For the year ended October 31, 2009, the investment advisory fee represented an effective annual basic rate of 0.23% of the fund’s average net assets, with no adjustment required based on performance.
C. The Vanguard Group furnishes at cost corporate management, administrative, marketing, and distribution services. The costs of such services are allocated to the fund under methods approved by the board of trustees. The fund has committed to provide up to 0.40% of its net assets in capital contributions to Vanguard. At October 31, 2009, the fund had contributed capital of $386,000 to Vanguard (included in Other Assets), representing 0.02% of the fund’s net assets and 0.15% of Vanguard’s capitalization. The fund’s trustees and officers are also directors and officers of Vanguard.
D. The fund has asked its investment advisor to direct certain security trades, subject to obtaining the best price and execution, to brokers who have agreed to rebate to the fund part of the commissions generated. Such rebates are used solely to reduce the fund’s management and administrative expenses. For the year ended October 31, 2009, these arrangements reduced the fund’s expenses by $57,000 (an annual rate of 0.00% of average net assets).
E. Various inputs may be used to determine the value of the fund’s investments. These inputs are summarized in three broad levels for financial statement purposes. The inputs or methodologies used to value securities are not necessarily an indication of the risk associated with investing in those securities.
Level 1—Quoted prices in active markets for identical securities.
Level 2—Other significant observable inputs (including quoted prices for similar securities, interest rates, prepayment speeds, credit risk, etc.).
Level 3—Significant unobservable inputs (including the fund’s own assumptions used to determine the fair value of investments).
The following table summarizes the fund’s investments as of October 31, 2009, based on the inputs used to value them:
| | | |
| | Level 1 | Level 2 | Level 3 |
| Investments | ($000) | ($000) | ($000) |
| Common Stocks | 90,776 | 1,704,296 | 4 |
| Temporary Cash Investments | 137,929 | — | — |
| Total | 228,705 | 1,704,296 | 4 |
25
International Explorer Fund
The following table summarizes changes in investments valued based on Level 3 inputs during the year ended October 31, 2009:
| |
| | Investments in |
| | Common Stocks |
| Amount Valued Based on Level 3 Inputs | ($000) |
| Balance as of October 31, 2008 | — |
| Transfers into Level 3 | 4 |
| Balance as of October 31, 2009 | 4 |
F. Distributions are determined on a tax basis and may differ from net investment income and realized capital gains for financial-reporting purposes. Differences may be permanent or temporary. Permanent differences are reclassified among capital accounts in the financial statements to reflect their tax character. Temporary differences arise when certain items of income, expense, gain, or loss are recognized in different periods for financial statement and tax purposes; these differences will reverse at some time in the future. Differences in classification may also result from the treatment of short-term gains as ordinary income for tax purposes.
During the year ended October 31, 2009, the fund realized net foreign currency gains of $455,000, which increased distributable net income for tax purposes; accordingly, such gains have been reclassified from accumulated net realized losses to undistributed net investment income. The fund’s realized losses for the year ended October 31, 2009, include $157,000 of capital gain tax paid on sales of Indian securities; this tax is treated as a decrease to taxable income; accordingly, this amount has been reclassified from accumulated net realized losses to undistributed net investment income.
Certain of the fund’s investments are in securities considered to be “passive foreign investment companies,” for which any unrealized appreciation and/or realized gains are required to be included in distributable net income for tax purposes. Unrealized appreciation of $8,803,000 on the fund’s passive foreign investment company holdings at October 31, 2008, has been distributed and is reflected in the balance of undistributed net investment income. During the year ended October 31, 2009, the fund realized gains on the sale of passive foreign investment companies of $7,032,000, which have been included in current and prior periods’ taxable income; accordingly, such gains have been reclassified from accumulated net realized losses to undistributed net investment income. Unrealized appreciation on the fund’s passive foreign investment company holdings at October 31, 2009, was $4,126,000.
For tax purposes, at October 31, 2009, the fund had $27,573,000 of ordinary income available for distribution. The fund had available capital loss carryforwards totaling $216,126,000 to offset future net capital gains of $63,847,000 through October 31, 2016, and $152,279,000 through October 31, 2017.
At October 31, 2009, the cost of investment securities for tax purposes was $1,774,886,000. Net unrealized appreciation of investment securities for tax purposes was $158,119,000, consisting of unrealized gains of $332,160,000 on securities that had risen in value since their purchase and $174,041,000 in unrealized losses on securities that had fallen in value since their purchase.
G. During the year ended October 31, 2009, the fund purchased $893,711,000 of investment securities and sold $637,577,000 of investment securities, other than temporary cash investments.
26
International Explorer Fund
| | |
| H. Capital shares issued and redeemed were: | | |
| | Year Ended October 31, |
| | 2009 | 2008 |
| | Shares | Shares |
| | (000) | (000) |
| Issued | 56,374 | 6,522 |
| Issued in Lieu of Cash Distributions | 3,608 | 22,249 |
| Redeemed | (32,257) | (47,062) |
| Net Increase (Decrease) in Shares Outstanding | 27,725 | (18,291) |
I. In preparing the financial statements as of October 31, 2009, management considered the impact of subsequent events occurring through December 8, 2009, for potential recognition or disclosure in these financial statements.
27
Report of Independent Registered Public Accounting Firm
To the Trustees of Vanguard Whitehall Funds and the Shareholders of Vanguard International Explorer Fund:
In our opinion, the accompanying statement of net assets and the related statements of operations and of changes in net assets and the financial highlights present fairly, in all material respects, the financial position of Vanguard International Explorer Fund (the “Fund”) at October 31, 2009, the results of its operations for the year then ended, the changes in its net assets for each of the two years in the period then ended and the financial highlights for each of the five years in the period then ended, in conformity with accounting principles generally accepted in the United States of America. These financial statements and financial highlights (hereafter referred to as “financial statements”) are the responsibility of the Fund’s management; our responsibility is to express an opinion on these financial statements based on our audits. We conducted our audits of these financial statements in ac cordance with the standards of the Public Company Accounting Oversight Board (United States). Those standards require that we plan and perform the audit to obtain reasonable assurance about whether the financial statements are free of material misstatement. An audit includes examining, on a test basis, evidence supporting the amounts and disclosures in the financial statements, assessing the accounting principles used and significant estimates made by management, and evaluating the overall financial statement presentation. We believe that our audits, which included confirmation of securities at October 31, 2009 by correspondence with the custodian and by agreement to the underlying ownership records of Vanguard Market Liquidity Fund, provide a reasonable basis for our opinion.
PricewaterhouseCoopers LLP
Philadelphia, Pennsylvania
December 8, 2009
|
| Special 2009 tax information (unaudited) for Vanguard International Explorer Fund |
This information for the fiscal year ended October 31, 2009, is included pursuant to provisions of the Internal Revenue Code.
The fund distributed $37,635,000 of qualified dividend income to shareholders during the fiscal year.
The fund will pass through foreign source income of $33,165,000 and foreign taxes paid of $2,293,000 to shareholders. The pass-through of foreign taxes paid will affect only shareholders on the fund’s dividend record date in December 2009. Shareholders will receive more detailed information along with their Form 1099-DIV in January 2010.
28
Your Fund’s After-Tax Returns
This table presents returns for your fund both before and after taxes. The after-tax returns are shown in two ways: (1) assuming that an investor owned the fund during the entire period and paid taxes on the fund’s distributions, and (2) assuming that an investor paid taxes on the fund’s distributions and sold all shares at the end of each period.
Calculations are based on the highest individual federal income tax and capital gains tax rates in effect at the times of the distributions and the hypothetical sales. State and local taxes were not considered. After-tax returns reflect any qualified dividend income, using actual prior-year figures and estimates for 2009. (In the example, returns after the sale of fund shares may be higher than those assuming no sale. This occurs when the sale would have produced a capital loss. The calculation assumes that the investor received a tax deduction for the loss.)
Please note that your actual after-tax returns will depend on your tax situation and may differ from those shown. Also note that if you own the fund in a tax-deferred account, such as an individual retirement account or a 401(k) plan, this information does not apply to you. Such accounts are not subject to current taxes.
Finally, keep in mind that a fund’s performance—whether before or after taxes—does not guarantee future results.
| | | |
| Average Annual Total Returns: International Explorer Fund1 | | | |
| Periods Ended October 31, 2009 | | | |
| | One | Five | Ten |
| | Year | Years | Years |
| Returns Before Taxes | 47.88% | 7.71% | 7.70% |
| Returns After Taxes on Distributions | 47.51 | 6.12 | 5.76 |
| Returns After Taxes on Distributions and Sale of Fund Shares | 32.10 | 6.57 | 5.94 |
1 Total returns do not reflect the 2% fee assessed on redemptions of shares purchased on or after June 27, 2003, and held for less than two months, or the account service fee that may be applicable to certain accounts with balances below $10,000.
29
About Your Fund’s Expenses
As a shareholder of the fund, you incur ongoing costs, which include costs for portfolio management, administrative services, and shareholder reports (like this one), among others. Operating expenses, which are deducted from a fund’s gross income, directly reduce the investment return of the fund.
A fund’s expenses are expressed as a percentage of its average net assets. This figure is known as the expense ratio. The following examples are intended to help you understand the ongoing costs (in dollars) of investing in your fund and to compare these costs with those of other mutual funds. The examples are based on an investment of $1,000 made at the beginning of the period shown and held for the entire period.
The accompanying table illustrates your fund’s costs in two ways:
• Based on actual fund return. This section helps you to estimate the actual expenses that you paid over the period. The “Ending Account Value” shown is derived from the fund’s actual return, and the third column shows the dollar amount that would have been paid by an investor who started with $1,000 in the fund. You may use the information here, together with the amount you invested, to estimate the expenses that you paid over the period.
To do so, simply divide your account value by $1,000 (for example, an $8,600 account value divided by $1,000 = 8.6), then multiply the result by the number given for your fund under the heading “Expenses Paid During Period.”
• Based on hypothetical 5% yearly return. This section is intended to help you compare your fund’s costs with those of other mutual funds. It assumes that the fund had a yearly return of 5% before expenses, but that the expense ratio is unchanged. In this case—because the return used is not the fund’s actual return—the results do not apply to your investment. The example is useful in making comparisons because the Securities and Exchange Commission requires all mutual funds to calculate expenses based on a 5% return. You can assess your fund’s costs by comparing this hypothetical example with the hypothetical examples that appear in shareholder reports of other funds.
| | | |
| Six Months Ended October 31, 2009 | | | |
| | Beginning | Ending | Expenses |
| | Account Value | Account Value | Paid During |
| International Explorer Fund | 4/30/2009 | 10/31/2009 | Period1 |
| Based on Actual Fund Return | $1,000.00 | $1,372.85 | $2.51 |
| Based on Hypothetical 5% Yearly Return | 1,000.00 | 1,023.09 | 2.14 |
1 The calculations are based on expenses incurred in the most recent six-month period. The fund’s annualized six-month expense ratio for that period is 0.42%. The dollar amounts shown as “Expenses Paid” are equal to the annualized expense ratio multiplied by the average account value over the period, multiplied by the number of days in the most recent six-month period, then divided by the number of days in the most recent 12-month period.
30
Note that the expenses shown in the table are meant to highlight and help you compare ongoing costs only and do not reflect transaction costs incurred by the fund for buying and selling securities. Further, the expenses do not include the 2% fee on redemptions of shares held for less than two months, nor do they include the account service fee described in the prospectus. If such fees were applied to your account, your costs would be higher. Your fund does not carry a “sales load.”
The calculations assume no shares were bought or sold during the period. Your actual costs may have been higher or lower, depending on the amount of your investment and the timing of any purchases or redemptions.
You can find more information about the fund’s expenses, including annual expense ratios, in the Financial Statements section of this report. For additional information on operating expenses and other shareholder costs, please refer to your fund’s current prospectus.
31
Trustees Approve Advisory Agreements
The board of trustees of Vanguard International Explorer Fund has renewed the fund’s investment advisory agreement with Schroder Investment Management North America Inc. and a sub-advisory agreement with Schroder Investment Management North America Limited. The board determined that the retention of the advisor and the sub-advisor (collectively, Schroder) was in the best interests of the fund and its shareholders.
The board based its decision upon an evaluation of Schroder’s investment staff, portfolio management process, and performance. The trustees considered the factors discussed below, among others. However, no single factor determined whether the board approved the agreements. Rather, it was the totality of the circumstances that drove the board’s decision.
Nature, extent, and quality of services
The board considered the quality of the fund’s investment management over both the short and long term, and took into account the organizational depth and stability of Schroder. Schroder’s parent company, Schroders plc, has existed for more than 200 years and has investment management experience dating back to 1926. Schroder continues to employ a sound process, selecting attractive small-cap growth stocks from developed and emerging markets outside the United States. The Schroder International Smallcap Investment Committee is responsible for management of the fund. The Committee, composed of senior small-cap specialists, determines the country allocation of the fund. Stocks are selected by senior regional small-cap portfolio managers, using a bottom-up approach, supported by Schroder’s worldwide network of analysts, economists, and strategists.
The board concluded that Schroder’s experience, stability, depth, and performance, among other factors, warranted continuation of the advisory agreements.
Investment performance
The board considered the short- and long-term performance of the fund, including any periods of outperformance or underperformance of a relevant benchmark and peer group. The board concluded that the advisor has carried out the fund’s investment strategy in disciplined fashion, and the performance results have been consistently competitive. Information about the fund’s most recent performance can be found in the Performance Summary section of this report.
Cost
The board concluded that the fund’s expense ratio was well below the average expense ratio charged by funds in its peer group and that the fund’s advisory fee rate was also well below its peer-group average. Information about the fund’s expense ratio appears in the About Your Fund’s Expenses section of this report as well as in the Financial Statements section, which also includes information about the fund’s advisory fee rate.
The board did not consider profitability of Schroder in determining whether to approve the advisory fee, because Schroder is independent of Vanguard, and the advisory fee is the result of arm’slength negotiations.
The benefit of economies of scale
The board concluded that the fund’s shareholders benefit from economies of scale because of breakpoints in the advisory fee schedule. The breakpoints reduce the effective rate of the fee as the fund’s assets increase.
The board will consider whether to renew the advisory agreements again after a one-year period.
32
Glossary
Beta. A measure of the magnitude of a fund’s past share-price fluctuations in relation to the ups and downs of a given market index. The index is assigned a beta of 1.00. Compared with a given index, a fund with a beta of 1.20 typically would have seen its share price rise or fall by 12% when the index rose or fell by 10%. For this report, beta is based on returns over the past 36 months for both the fund and the index. Note that a fund’s beta should be reviewed in conjunction with its R-squared (see definition). The lower the R-squared, the less correlation there is between the fund and the index, and the less reliable beta is as an indicator of volatility.
Equity Exposure. A measure that reflects a fund’s investments in stocks and stock futures. Any holdings in short-term reserves are excluded.
Expense Ratio. The percentage of a fund’s average net assets used to pay its annual administrative and advisory expenses. These expenses directly reduce returns to investors.
Inception Date. The date on which the assets of a fund (or one of its share classes) are first invested in accordance with the fund’s investment objective. For funds with a subscription period, the inception date is the day after that period ends. Investment performance is measured from the inception date.
R-Squared. A measure of how much of a fund’s past returns can be explained by the returns from the market in general, as measured by a given index. If a fund’s total returns were precisely synchronized with an index’s returns, its R-squared would be 1.00. If the fund’s returns bore no relationship to the index’s returns, its R-squared would be 0. For this report, R-squared is based on returns over the past 36 months for both the fund and the index.
Short-Term Reserves. The percentage of a fund invested in highly liquid, short-term securities that can be readily converted to cash.
Turnover Rate. An indication of the fund’s trading activity. Funds with high turnover rates incur higher transaction costs and may be more likely to distribute capital gains (which may be taxable to investors). The turnover rate excludes in-kind transactions, which have minimal impact on costs.
33
This page intentionally left blank.
This page intentionally left blank.
The People Who Govern Your Fund
The trustees of your mutual fund are there to see that the fund is operated and managed in your best interests since, as a shareholder, you are a part owner of the fund. Your fund’s trustees also serve on the board of directors of The Vanguard Group, Inc., which is owned by the Vanguard funds and provides services to them on an at-cost basis.
A majority of Vanguard’s board members are independent, meaning that they have no affiliation with Vanguard or the funds they oversee, apart from the sizable personal investments they have made as private individuals. The independent board members have distinguished backgrounds in business, academia, and public service. Each of the trustees and executive officers oversees 156 Vanguard funds.
The following table provides information for each trustee and executive officer of the fund. More information about the trustees is in the Statement of Additional Information, which can be obtained, without charge, by contacting Vanguard at 800-662-7447, or online at www.vanguard.com.
| |
| Interested Trustees | Emerson U. Fullwood |
| | Born 1948. Trustee Since January 2008. Principal |
| John J. Brennan1 | Occupation(s) During the Past Five Years: Executive |
| Born 1954. Trustee Since May 1987. Chairman of | Chief Staff and Marketing Officer for North America |
| the Board. Principal Occupation(s) During the Past | and Corporate Vice President (retired 2008) of Xerox |
| Five Years: Chairman of the Board and Director/Trustee | Corporation (photocopiers and printers); Director of |
| of The Vanguard Group, Inc., and of each of the | SPX Corporation (multi-industry manufacturing), the |
| investment companies served by The Vanguard Group; | United Way of Rochester, the Boy Scouts of America, |
| Chief Executive Officer (1996–2008) and President | Amerigroup Corporation (direct health and medical |
| (1989–2008) of The Vanguard Group and of each of the | insurance carriers), and Monroe Community College |
| investment companies served by The Vanguard Group; | Foundation. |
| Chairman of the Financial Accounting Foundation; | |
| Governor of the Financial Industry Regulatory Authority | Rajiv L. Gupta |
| (FINRA); Director of United Way of Southeastern | Born 1945. Trustee Since December 2001.2 Principal |
| Pennsylvania. | Occupation(s) During the Past Five Years: Chairman |
| | and Chief Executive Officer (retired 2009) and President |
| F. William McNabb III1 | (2006–2008) of Rohm and Haas Co. (chemicals); Board |
| Born 1957. Trustee Since July 2009. Principal | Member of American Chemistry Council; Director of |
| Occupation(s) During the Past Five Years: Director of | Tyco International, Ltd. (diversified manufacturing and |
| The Vanguard Group, Inc., since 2008; Chief Executive | services) and Hewlett-Packard Co. (electronic computer |
| Officer and President of The Vanguard Group and of | manufacturing); Trustee of The Conference Board. |
| each of the investment companies served by The | |
| Vanguard Group since 2008; Director of Vanguard | Amy Gutmann |
| Marketing Corporation; Managing Director of The | Born 1949. Trustee Since June 2006. Principal |
| Vanguard Group (1995–2008). | Occupation(s) During the Past Five Years: President of |
| | the University of Pennsylvania; Christopher H. Browne |
| | Distinguished Professor of Political Science in the School |
| Independent Trustees | of Arts and Sciences with secondary appointments |
| | at the Annenberg School for Communication and the |
| Charles D. Ellis | Graduate School of Education of the University of |
| Born 1937. Trustee Since January 2001. Principal | Pennsylvania; Director of Carnegie Corporation of |
| Occupation(s) During the Past Five Years: Applecore | New York, Schuylkill River Development Corporation, |
| Partners (pro bono ventures in education); Senior | and Greater Philadelphia Chamber of Commerce; |
| Advisor to Greenwich Associates (international business | Trustee of the National Constitution Center. |
| strategy consulting); Successor Trustee of Yale University; | |
| Overseer of the Stern School of Business at New York | |
| University; Trustee of the Whitehead Institute for | |
| Biomedical Research. | |
| | |
| JoAnn Heffernan Heisen | Executive Officers | |
| Born 1950. Trustee Since July 1998. Principal | | |
| Occupation(s) During the Past Five Years: Corporate | Thomas J. Higgins1 | |
| Vice President and Chief Global Diversity Officer since | Born 1957. Chief Financial Officer Since September |
| 2006 (retired 2008) and Member of the Executive | 2008. Principal Occupation(s) During the Past Five |
| Committee (retired 2008) of Johnson & Johnson | Years: Principal of The Vanguard Group, Inc.; Chief |
| (pharmaceuticals/consumer products); Vice President | Financial Officer of each of the investment companies |
| and Chief Information Officer of Johnson & Johnson | served by The Vanguard Group since 2008; Treasurer |
| (1997–2005); Director of the University Medical Center | of each of the investment companies served by The |
| at Princeton and Women’s Research and Education | Vanguard Group (1998–2008). |
| Institute; Member of the Advisory Board of the Maxwell | | |
| School of Citizenship and Public Affairs at Syracuse | | |
| University. | Kathryn J. Hyatt1 | |
| | Born 1955. Treasurer Since November 2008. Principal |
| | Occupation(s) During the Past Five Years: Principal of |
| F. Joseph Loughrey | The Vanguard Group, Inc.; Treasurer of each of the |
| Born 1949. Trustee Since October 2009. Principal | investment companies served by The Vanguard |
| Occupation(s) During the Past Five Years: President and | Group since 2008; Assistant Treasurer of each of the |
| Chief Operating Officer since 2005 (retired 2009) and | investment companies served by The Vanguard Group |
| Vice Chairman of the Board (2008–2009) of Cummins | (1988–2008). | |
| Inc. (industrial machinery); Director of SKF AB (industrial | | |
| machinery), Hillenbrand, Inc. (specialized consumer | | |
| services), Sauer-Danfoss Inc. (machinery), the Lumina | Heidi Stam1 | |
| Foundation for Education, and the Columbus Community | Born 1956. Secretary Since July 2005. Principal |
| Education Coalition; Chairman of the Advisory Council | Occupation(s) During the Past Five Years: Managing |
| for the College of Arts and Letters at the University of | Director of The Vanguard Group, Inc., since 2006; |
| Notre Dame. | General Counsel of The Vanguard Group since 2005; |
| | Secretary of The Vanguard Group and of each of the |
| | investment companies served by The Vanguard Group |
| André F. Perold | since 2005; Director and Senior Vice President of |
| Born 1952. Trustee Since December 2004. Principal | Vanguard Marketing Corporation since 2005; Principal |
| Occupation(s) During the Past Five Years: George Gund | of The Vanguard Group (1997–2006). |
| Professor of Finance and Banking, Harvard Business | | |
| School; Chair of the Investment Committee of HighVista | | |
| Strategies LLC (private investment firm). | Vanguard Senior Management Team |
| |
| Alfred M. Rankin, Jr. | R. Gregory Barton | Michael S. Miller |
| Born 1941. Trustee Since January 1993. Principal | Mortimer J. Buckley | James M. Norris |
| Occupation(s) During the Past Five Years: Chairman, | Kathleen C. Gubanich | Glenn W. Reed |
| President, and Chief Executive Officer of NACCO | Paul A. Heller | George U. Sauter |
| Industries, Inc. (forklift trucks/housewares/lignite); | | |
| Director of Goodrich Corporation (industrial products/ | | |
| aircraft systems and services); Deputy Chairman of | Founder | |
| the Federal Reserve Bank of Cleveland; Trustee of | | |
| University Hospitals of Cleveland, The Cleveland | | |
| Museum of Art, and Case Western Reserve University. | John C. Bogle | |
| | Chairman and Chief Executive Officer, 1974–1996 |
| |
| Peter F. Volanakis | | |
| Born 1955. Trustee Since July 2009. Principal | | |
| Occupation(s) During the Past Five Years: President | | |
| since 2007 and Chief Operating Officer since 2005 | | |
| of Corning Incorporated (communications equipment); | | |
| President of Corning Technologies (2001–2005); Director | | |
| of Corning Incorporated and Dow Corning; Trustee of | | |
| the Corning Incorporated Foundation and the Corning | | |
| Museum of Glass; Overseer of the Amos Tuck School | | |
| of Business Administration at Dartmouth College. | | |
1 These individuals are “interested persons” as defined in the Investment Company Act of 1940.
2 December 2002 for Vanguard Equity Income Fund, Vanguard Growth Equity Fund, the Vanguard Municipal Bond Funds, and the Vanguard State Tax-Exempt Funds.
|  |
| P.O. Box 2600 |
| Valley Forge, PA 19482-2600 |
Connect with Vanguard® > www.vanguard.com
| |
| Fund Information > 800-662-7447 | All comparative mutual fund data are from Lipper Inc. |
| | or Morningstar, Inc., unless otherwise noted. |
| Direct Investor Account Services > 800-662-2739 | |
| | |
| Institutional Investor Services > 800-523-1036 | You can obtain a free copy of Vanguard’s proxy voting |
| | guidelines by visiting our website, www.vanguard.com, |
| Text Telephone for People | and searching for “proxy voting guidelines,” or by |
| With Hearing Impairment > 800-749-7273 | calling Vanguard at 800-662-2739. The guidelines are |
| | also available from the SEC’s website, www.sec.gov. |
| | In addition, you may obtain a free report on how your |
| | fund voted the proxies for securities it owned during |
| This material may be used in conjunction | the 12 months ended June 30. To get the report, visit |
| with the offering of shares of any Vanguard | either www.vanguard.com or www.sec.gov. |
| fund only if preceded or accompanied by | |
| the fund’s current prospectus. | You can review and copy information about your fund |
| | at the SEC’s Public Reference Room in Washington, D.C. |
| | To find out more about this public service, call the SEC |
| | at 202-551-8090. Information about your fund is also |
| | available on the SEC’s website, and you can receive |
| | copies of this information, for a fee, by sending a |
| | request in either of two ways: via e-mail addressed to |
| | publicinfo@sec.gov or via regular mail addressed to the |
| | Public Reference Section, Securities and Exchange |
| | Commission, Washington, DC 20549-1520. |
| |
| |
| |
| |
| | © 2009 The Vanguard Group, Inc. |
| | All rights reserved. |
| | Vanguard Marketing Corporation, Distributor. |
| | Q1260 122009 |
 |
|
| Vanguard High Dividend Yield |
| Index Fund Annual Report |
|
|
| October 31, 2009 |
|
 |
|
|
> For the fiscal year ended October 31, 2009, Vanguard High Dividend Yield Index Fund returned about 3%, in line with the return of its benchmark index.
> The fund’s 30-day SEC yield for Investor Shares stood at 2.89% as of October 31, about 1 percentage point above a comparable yield measure for stocks in general.
> Positive returns in most of the fund’s sectors offset the disappointing returns from financial and utilities stocks.
| |
| Contents | |
| Your Fund’s Total Returns | 1 |
| President’s Letter | 2 |
| Results of Proxy Voting | 7 |
| Fund Profile | 8 |
| Performance Summary | 9 |
| Financial Statements | 11 |
| Your Fund’s After-Tax Returns | 26 |
| About Your Fund’s Expenses | 27 |
| Glossary | 29 |
Please note: The opinions expressed in this report are just that—informed opinions. They should not be considered promises or advice. Also, please keep in mind that the information and opinions cover the period through the date on the front of this report. Of course, the risks of investing in your fund are spelled out in the prospectus.
Cover photograph: Veronica Coia.
| | | | |
| Your Fund’s Total Returns | | | |
| |
| |
| |
| |
| Fiscal Year Ended October 31, 2009 | | | | |
| | | | Ticker | Total |
| | | | Symbol | Returns |
| Vanguard High Dividend Yield Index Fund | | | | |
| Investor Shares | | | VHDYX | 3.27% |
| ETF Shares1 | | | VYM | |
| Market Price | | | | 3.05 |
| Net Asset Value | | | | 3.38 |
| FTSE High Dividend Yield Index | | | | 3.39 |
| Equity Income Funds Average2 | | | | 9.22 |
| |
| |
| Your Fund’s Performance at a Glance | | | | |
| October 31, 2008–October 31, 2009 | | | | |
| | | | Distributions Per Share |
| | Starting | Ending | Income | Capital |
| | Share Price | Share Price | Dividends | Gains |
| Vanguard High Dividend Yield Index Fund | | | | |
| Investor Shares | $14.20 | $14.15 | $0.448 | $0.000 |
| ETF Shares | 35.84 | 35.70 | 1.177 | 0.000 |
1 These Vanguard ETF® Shares are traded on the NYSE Arca exchange and are available only through brokers. The table shows the ETF returns based on both the NYSE Arca market price and the net asset value for a share. U.S. Pat. No. 6,879,964 B2; 7,337,138.
2 Derived from data provided by Lipper Inc.
1

President’s Letter
Dear Shareholder,
The robust stock market turnaround that began in March 2009 has had a favorable impact on Vanguard High Dividend Yield Index Fund, although the fund’s holdings in the battered financial sector continued to weigh on performance. In contrast to its double-digit loss in fiscal 2008, the fund returned about 3% for the 12 months ended October 31, 2009.
The High Dividend Yield Index Fund’s return was in line with that of its benchmark. It trailed the average result of peer-group funds, many of which invest in assets other than stocks, in contrast to the Vanguard fund’s stock-only approach.
The 30-day SEC yield of the High Dividend Yield Index Fund Investor Shares stood at 2.89% as of October 31, above the 1.78% yield of the broad stock market, as measured by the 30-day SEC yield of Vanguard Total Stock Market Fund’s Investor Shares. The figures were lower than year-earlier yields (4.04% and 2.61%, respectively). The fiscal 2009 yields reflected the declines and suspensions of dividend payouts by financial and other firms that have been hard hit by the worldwide credit and economic crises. Indeed, Standard & Poor’s reported that in the three months ended September 30, 2009, 113 U.S. companies cut their dividends, the highest number since the third quarter of 1982.
2
A vicious bear market quickly turned bullish
A year ago, the global financial system stood on the brink of collapse as the expanding U.S. credit crisis precipitated the deepest worldwide recession since World War II. Since then, markets have pulled back from the depths and, in fact, have rallied impressively. Although U.S. unemployment has risen to double digits and signs of a robust recovery are hard to find, the global economy has begun to revive. For the first time in more than a year, U.S. gross domestic product registered growth, as reported by the Commerce Department for the third quarter of calendar 2009.
U.S. stocks recorded positive returns for the fiscal year ended October 31 as the market’s losses during the first four months of the period—marking the final plunge of a historic bear market—were erased by a remarkable rally beginning in March. Global stocks did even better, thanks to some renewed strength in developed markets and a powerful upswing in emerging markets that actually had some prognosticators worrying about a new asset bubble. Reminders of the markets’ travails are nevertheless apparent in the index returns for the past three years, where negative figures are the rule. Even the five-year returns for U.S. stocks as of October 31 were barely positive, further evidence of the long-term damage done by the collapse of the real estate bubble.
| | | |
| Market Barometer | | | |
| | | Average Annual Total Returns |
| | | Periods Ended October 31, 2009 |
| | One Year | Three Years | Five Years |
| Stocks | | | |
| Russell 1000 Index (Large-caps) | 11.20% | –6.84% | 0.71% |
| Russell 2000 Index (Small-caps) | 6.46 | –8.51 | 0.59 |
| Dow Jones U.S. Total Stock Market Index | 11.34 | –6.55 | 1.06 |
| MSCI All Country World Index ex USA (International) | 34.79 | –2.49 | 7.58 |
| |
| Bonds | | | |
| Barclays Capital U.S. Aggregate Bond Index | | | |
| (Broad taxable market) | 13.79% | 6.35% | 5.05% |
| Barclays Capital Municipal Bond Index | 13.60 | 4.17 | 4.15 |
| Citigroup 3-Month Treasury Bill Index | 0.28 | 2.50 | 2.94 |
| |
| CPI | | | |
| Consumer Price Index | –0.18% | 2.32% | 2.52% |
3
The bond market experienced an equally dramatic turnaround
The stock market’s rapid fall and recovery were matched by an equally dramatic turnaround in the bond market. At the end of 2008, as the credit markets virtually shut down, risk-averse investors flocked to U.S. Treasury bonds. The effect was to widen the difference between the lower yields of Treasuries and the higher yields of corporate bonds to a margin not seen since the Great Depression.
Central banks around the world responded to the economic slowdown by lowering interest rates and implementing other aggressive stimulus programs. Meanwhile, governments boosted spending in hopes of reversing the recessionary tide. As fears of a worldwide depression eased, investors’ appetite for risk returned to more normal levels. The receding pessimism raised demand for corpo rate bonds, raising their prices and bringing down their yields. Over the past 12 months, both taxable and municipal bonds returned more than 13%.
However, the Fed’s easy-money campaign had a predictable effect on short-term savings vehicles such as money market funds, whose yields track prevailing short-term rates. In December 2008, the Fed reduced its target for the federal funds rate, a benchmark for the interest rates paid by money market instruments and other very short-term securities, to between 0% and 0.25%. The Fed has said it expects to maintain its target at this level “for an extended period.”
| | | |
| Expense Ratios1 | | | |
| Your Fund Compared With Its Peer Group | | | |
| | | | Equity |
| | Investor | ETF | Income Funds |
| | Shares | Shares | Average |
| High Dividend Yield Index Fund | 0.35% | 0.20% | 1.34% |
1 The fund expense ratios shown are from the prospectuses dated February 27, 2009, and represent estimated costs for the current fiscal year based on the fund’s net assets as of the prospectus date. For the fiscal year ended October 31, 2009, the expense ratios were 0.35% for Investor Shares and 0.20% for ETF Shares. The peer-group expense ratio is derived from data provided by Lipper Inc. and captures information through year-end 2008.
4
A once dividend-rich sector seeks to conserve its cash
Just as a rising tide lifts all boats, a strong equity rally lifts all mutual funds. How high, however, depends on the composition of the fund—which is why the High Dividend Yield Index Fund returned about 3% compared with a broad-market return of about 11%.
Because the High Dividend Yield Index Fund tracks an index made up of stocks with higher-than-average yields, it has higher-than-average allocations to dividend-rich sectors, such as financials and utilities. Compared with a year earlier, when every sector of the fund’s portfolio experienced a double-digit decline, the only losses amid the latest fiscal year’s stock-market rally came from the fund’s holdings in those two sectors, particularly financials. A consequence of these heavy weightings is lower-than-average allocations in other sectors, such as information technology—the major beneficiary of the rally. Rather than pay out dividends, tech firms (with some notable exceptions) tend to reinvest their cash flow in their relatively fast-growing businesses.
The financial sector’s lagging response to the robust rally isn’t surprising, given the massive restructuring of several major U.S. financial institutions in the wake of the credit crisis and the added uncertainty it created for the entire financial system. In addition, in an effort to conserve cash to bolster their capital positions, many financial firms (60 in calendar 2009 through October, according to Standard and Poor’s) have decreased their dividend payouts, and others, such as Citigroup and CIT Group, actually suspended them.
Among the financial sector’s bright spots was JPMorgan Chase, which produced a small positive return (despite a cut in its quarterly dividend to $0.20 per share, from $1.52 per share). But this and the few other positive additions to return were overwhelmed by declines at other giant financial services companies and a variety of commercial banks.
The fund’s utilities stocks also generally sat out the rally, but most likely for a different reason: Utilities, which are highly regulated, typically have strong balance sheets, and the general market turnaround has been propelled by lower-quality, higher-risk nonfinancial stocks. In addition to technology stocks, the fund got a boost from its consumer holdings. In consumer staples, for example, the fund benefited from dividend increases from companies as varied as Altria Group, Clorox, and J.M. Smucker.
A lesson learned from a challenging time
The past year’s market tumult—a sharp decline followed by a strong rebound—has provided a powerful, unwelcome lesson in the critical importance of balance, diversification, and a commitment to a long-term plan. When the stock market tumbled in late 2008 and early 2009, the diversification benefits of a bond allocation became crystal clear.
5
For the six months through October 31, the stock market’s powerful rally has underscored the benefit of sticking with your long-term plan through the inevitable moments of anxiety and doubt.
Where do we go from here? Although it seems as if the worst is behind us, the financial markets’ short-term direction is impossible to forecast with accuracy. The best response to this uncertainty is, again, a plan based on reasonable long-term return and risk expectations that you can stick with through periods of market turmoil. For income-oriented investors, Vanguard High Dividend Yield Index Fund—with its goal of producing higher-than-average yields—can play an important role in such a plan.
As always, thank you for entrusting your assets to Vanguard.
Sincerely,

F. William McNabb III
President and Chief Executive Officer
November 11, 2009
6
Results of Proxy Voting
At a special meeting of shareholders on July 2, 2009, fund shareholders approved the following two proposals:
Proposal 1—Elect trustees for each fund.*
The individuals listed in the table below were elected as trustees for each fund. All trustees with the exception of Messrs. McNabb and Volanakis (both of whom already served as directors of The Vanguard Group, Inc.) served as trustees to the funds prior to the shareholder meeting.
| | | |
| | | | Percentage |
| Trustee | For | Withheld | For |
| John J. Brennan | 267,380,786 | 8,631,474 | 96.9% |
| Charles D. Ellis | 256,520,935 | 19,491,324 | 92.9% |
| Emerson U. Fullwood | 257,085,311 | 18,926,948 | 93.1% |
| Rajiv L. Gupta | 266,612,131 | 9,400,128 | 96.6% |
| Amy Gutmann | 267,915,925 | 8,096,335 | 97.1% |
| JoAnn Heffernan Heisen | 266,998,335 | 9,013,925 | 96.7% |
| F. William McNabb III | 267,044,346 | 8,967,914 | 96.8% |
| André F. Perold | 256,971,735 | 19,040,525 | 93.1% |
| Alfred M. Rankin, Jr. | 266,847,723 | 9,164,536 | 96.7% |
| Peter F. Volanakis | 266,899,599 | 9,112,660 | 96.7% |
| * Results are for all funds within the same trust. | | | |
Proposal 2—Update and standardize the funds’ fundamental policies regarding:
(a) Purchasing and selling real estate.
(b) Issuing senior securities.
(c) Borrowing money.
(d) Making loans.
(e) Purchasing and selling commodities.
(f) Concentrating investments in a particular industry or group of industries.
(g) Eliminating outdated fundamental investment policies not required by law.
The revised fundamental policies are clearly stated and simple, yet comprehensive, making oversight and compliance more efficient than under the former policies. The revised fundamental policies will allow the funds to respond more quickly to regulatory and market changes, while avoiding the costs and delays associated with successive shareholder meetings.
| | | | | |
| | | | | Broker | Percentage |
| Vanguard Fund | For | Abstain | Against | Non-Votes | For |
| High Dividend Yield Index Fund | | | | | |
| 2a | 9,529,547 | 160,226 | 274,988 | 1,995,668 | 79.68% |
| 2b | 9,520,166 | 165,010 | 279,583 | 1,995,670 | 79.60% |
| 2c | 9,435,768 | 164,649 | 364,344 | 1,995,668 | 78.89% |
| 2d | 9,471,230 | 166,034 | 327,496 | 1,995,669 | 79.19% |
| 2e | 9,475,168 | 162,755 | 326,839 | 1,995,668 | 79.22% |
| 2f | 9,502,950 | 173,550 | 288,259 | 1,995,670 | 79.45% |
| 2g | 9,544,182 | 166,840 | 253,738 | 1,995,669 | 79.80% |
7
High Dividend Yield Index Fund
Fund Profile
As of October 31, 2009
| | | |
| Portfolio Characteristics | | |
| | | Target | Broad |
| | Fund | Index1 | Index2 |
| Number of Stocks | 485 | 483 | 4,310 |
| Median Market Cap | $42.6B | $42.6B | $28.3B |
| Price/Earnings Ratio | 24.3x | 24.6x | 30.3x |
| Price/Book Ratio | 1.8x | 1.7x | 2.1x |
| Yield3 | | 3.2% | 1.9% |
| Investor Shares | 2.9% | | |
| ETF Shares | 3.0% | | |
| Return on Equity | 17.9% | 17.8% | 19.4% |
| Earnings Growth Rate | –1.8% | –1.9% | 9.3% |
| Foreign Holdings | 0.0% | 0.0% | 0.0% |
| Turnover Rate | 20% | — | — |
| Expense Ratio4 | | — | — |
| Investor Shares | 0.35% | | |
| ETF Shares | 0.20% | | |
| Short-Term Reserves | 0.0% | — | — |
| | | |
| Sector Diversification (% of equity exposure) |
| | | Target | Broad |
| | Fund | Index1 | Index2 |
| Consumer Discretionary | 7.7% | 7.8% | 10.0% |
| Consumer Staples | 11.1 | 11.2 | 10.3 |
| Energy | 7.4 | 7.4 | 11.6 |
| Financials | 23.6 | 23.4 | 16.3 |
| Health Care | 11.1 | 11.2 | 11.9 |
| Industrials | 13.9 | 14.0 | 10.4 |
| Information Technology | 5.2 | 5.0 | 19.1 |
| Materials | 4.8 | 4.8 | 3.8 |
| Telecommunication | | | |
| Services | 6.4 | 6.4 | 2.8 |
| Utilities | 8.8 | 8.8 | 3.8 |
| | |
| Ten Largest Holdings5 (% of total net assets) |
| |
| Johnson & Johnson | pharmaceuticals | 4.0% |
| JPMorgan Chase & Co. | diversified financial | |
| | services | 4.0 |
| Chevron Corp. | integrated oil | |
| | and gas | 3.8 |
| AT&T Inc. | integrated | |
| | telecommunication | |
| | services | 3.8 |
| General Electric Co. | industrial | |
| | conglomerates | 3.7 |
| Pfizer Inc. | pharmaceuticals | 3.4 |
| Wells Fargo & Co. | diversified banks | 3.2 |
| Bank of America Corp. | diversified financial | |
| | services | 3.1 |
| Coca-Cola Co. | soft drinks | 3.0 |
| Intel Corp. | semiconductors | 2.6 |
| Top Ten | | 34.6% |
Investment Focus
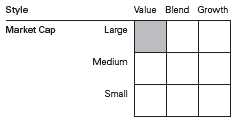
1 FTSE High Dividend Yield Index.
2 Dow Jones U.S. Total Stock Market Index.
3 30-day SEC yield for the fund, annualized dividend yield for the indexes. See the Glossary.
4 The expense ratios shown are from the prospectuses dated February 27, 2009, and represent estimated costs for the current fiscal year based on the fund’s net assets as of the prospectus date. For the fiscal year ended October 31, 2009, the expense ratios were 0.35% for Investor Shares and 0.20% for ETF Shares.
5 The holdings listed exclude any temporary cash investments and equity index products.
See the glossary of investment terms.
8
High Dividend Yield Index Fund
Performance Summary
All of the returns in this report represent past performance, which is not a guarantee of future results that may be achieved by the fund. (Current performance may be lower or higher than the performance data cited. For performance data current to the most recent month-end, visit our website at www.vanguard.com/performance.) Note, too, that both investment returns and principal value can fluctuate widely, so an investor’s shares, when sold, could be worth more or less than their original cost. The returns shown do not reflect taxes that a shareholder would pay on fund distributions or on the sale of fund shares.
Cumulative Performance: November 16, 2006–October 31, 2009
Initial Investment of $10,000
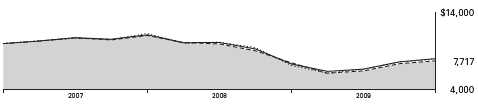
| | | |
| | Average Annual Total Returns | |
| | Periods Ended October 31, 2009 | Final Value |
| | | Since | of a $10,000 |
| | One Year | Inception1 | Investment |
| High Dividend Yield Index Fund | | | |
| Investor Shares2 | 3.27% | –8.40% | $7,717 |
| Dow Jones U.S. Total Stock Market Index | 11.34 | –7.28 | 7,997 |
| FTSE High Dividend Yield Index | 3.39 | –8.19 | 7,769 |
| Equity Income Funds Average3 | 9.22 | –7.09 | 8,047 |
| | | |
| | | | Final Value |
| | | Since | of a $10,000 |
| | One Year | Inception1 | Investment |
| High Dividend Yield Index Fund | | | |
| ETF Shares Net Asset Value4 | 3.38% | –7.96% | $7,814 |
| Dow Jones U.S. Total Stock Market Index | 11.34 | –6.75 | 8,125 |
| FTSE High Dividend Yield Index | 3.39 | –7.88 | 7,834 |
1 Performance for the fund and its comparative standards is calculated since the following inception dates: November 16, 2006, for Investor
Shares and November 10, 2006, for ETF Shares.
2 Total returns do not include the account service fee that may be applicable to certain accounts with balances below $10,000.
3 Derived from data provided by Lipper Inc.
4 For more information about how the ETF Shares’ market prices have compared with their net asset value, visit www.vanguard.com, select
your ETF, and then select the Performance tab. The Premium/Discount table there shows the percentages of days on which the ETF Shares’
market price was above or below the NAV.
9
| | |
| High Dividend Yield Index Fund | | |
| |
| |
| |
| |
| Cumulative Returns of ETF Shares: November 10, 2006–October 31, 2009 | | |
| | | Cumulative |
| | | Since |
| | One Year | Inception |
| High Dividend Yield Index Fund ETF Shares Market Price | 3.05% | –21.90% |
| High Dividend Yield Index Fund ETF Shares Net Asset Value | 3.38 | –21.86 |
| FTSE High Dividend Yield Index | 3.39 | –21.66 |
Fiscal Year Total Returns (%): November 16, 2006–October 31, 2009
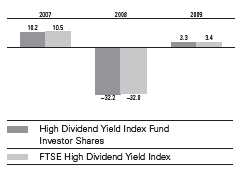
Average Annual Total Returns: Periods Ended September 30, 2009
This table presents average annual total returns through the latest calendar quarter—rather than through the end of the fiscal period. Securities and Exchange Commission rules require that we provide this information.
| | | |
| | | | Since |
| | Inception Date | One Year | Inception |
| Investor Shares1 | 11/16/2006 | –9.15% | –7.70% |
| ETF Shares | 11/10/2006 | | |
| Market Price | | –9.44 | –7.30 |
| Net Asset Value | | –9.01 | –7.25 |
1 Total returns do not include the account service fee that may be applicable to certain accounts with balances below $10,000.
Note: See Financial Highlights tables for dividend and capital gains information.
10
High Dividend Yield Index Fund
Financial Statements
Statement of Net Assets
As of October 31, 2009
The fund reports a complete list of its holdings in regulatory filings four times in each fiscal year, at the quarter-ends. For the second and fourth fiscal quarters, the lists appear in the fund’s semiannual and annual reports to shareholders. For the first and third fiscal quarters, the fund files the lists with the Securities and Exchange Commission on Form N-Q. Shareholders can look up the fund’s Forms N-Q on the SEC’s website at www.sec.gov. Forms N-Q may also be reviewed and copied at the SEC’s Public Reference Room (see the back cover of this report for further information).
| | |
| | | Market |
| | | Value• |
| | Shares | ($000) |
| Common Stocks (99.9%) | | |
| Consumer Discretionary (7.7%) | | |
| McDonald’s Corp. | 157,131 | 9,209 |
| Home Depot Inc. | 243,117 | 6,100 |
| Johnson Controls Inc. | 96,373 | 2,305 |
| McGraw-Hill Cos. Inc. | 45,728 | 1,316 |
| VF Corp. | 16,047 | 1,140 |
| JC Penney Co. Inc. | 33,954 | 1,125 |
| Macy’s Inc. | 60,489 | 1,063 |
| CBS Corp. Class B | 90,054 | 1,060 |
| Nordstrom Inc. | 31,229 | 992 |
| Mattel Inc. | 52,109 | 986 |
| H&R Block Inc. | 48,109 | 882 |
| Fortune Brands Inc. | 21,586 | 841 |
| Harley-Davidson Inc. | 33,522 | 835 |
| Ltd Brands Inc. | 46,380 | 816 |
| Genuine Parts Co. | 22,955 | 803 |
| Starwood Hotels & | | |
| Resorts Worldwide Inc. | 26,874 | 781 |
| International Game | | |
| Technology | 42,486 | 758 |
| Whirlpool Corp. | 10,584 | 758 |
| Tiffany & Co. | 17,855 | 702 |
| Virgin Media Inc. | 47,155 | 659 |
| Garmin Ltd. | 21,639 | 655 |
| Darden Restaurants Inc. | 20,077 | 609 |
| Newell Rubbermaid Inc. | 39,868 | 579 |
| Hasbro Inc. | 20,043 | 547 |
| DR Horton Inc. | 45,184 | 495 |
| Wyndham Worldwide Corp. | 25,714 | 438 |
| Leggett & Platt Inc. | 22,489 | 435 |
| Abercrombie & Fitch Co. | 12,647 | 415 |
| Autoliv Inc. | 12,252 | 411 |
| Tupperware Brands Corp. | 9,068 | 408 |
| Black & Decker Corp. | 8,635 | 408 |
| American Eagle | | |
| Outfitters Inc. | 22,160 | 388 |
| Gannett Co. Inc. | 33,467 | 329 |
| Gentex Corp. | 19,921 | 319 |
| | | |
| | | | Market |
| | | | Value• |
| | | Shares | ($000) |
| | Williams-Sonoma Inc. | 15,330 | 288 |
| | Choice Hotels | | |
| | International Inc. | 8,747 | 261 |
| | Lennar Corp. Class A | 20,582 | 259 |
| | Foot Locker Inc. | 22,348 | 234 |
| | Regal Entertainment Group | | |
| | Class A | 18,367 | 232 |
| | Jones Apparel Group Inc. | 12,417 | 222 |
| | Polaris Industries Inc. | 4,719 | 199 |
| | Brinker International Inc. | 14,603 | 185 |
| | Hillenbrand Inc. | 9,033 | 180 |
| | New York Times Co. | | |
| | Class A | 21,024 | 168 |
| | MDC Holdings Inc. | 4,943 | 161 |
| | Sotheby’s | 9,599 | 152 |
| | Eastman Kodak Co. | 39,189 | 147 |
| | Dillard’s Inc. Class A | 10,075 | 137 |
| | Pool Corp. | 6,896 | 135 |
| | Cooper Tire & Rubber Co. | 8,512 | 130 |
| * | OfficeMax Inc. | 10,835 | 124 |
| | Bob Evans Farms Inc. | 4,427 | 116 |
| | Ryland Group Inc. | 6,253 | 116 |
| | Cracker Barrel Old Country | | |
| | Store Inc. | 3,201 | 106 |
| | American Greetings Corp. | | |
| | Class A | 5,200 | 106 |
| | Meredith Corp. | 3,860 | 104 |
| | Penske Auto Group Inc. | 6,474 | 101 |
| | Barnes & Noble Inc. | 6,081 | 101 |
| | Buckle Inc. | 3,303 | 99 |
| | NutriSystem Inc. | 4,534 | 98 |
| | National CineMedia Inc. | 5,975 | 96 |
| | ArvinMeritor Inc. | 10,724 | 84 |
| | Harte-Hanks Inc. | 6,784 | 80 |
| | Liz Claiborne Inc. | 13,607 | 78 |
| | Cato Corp. Class A | 3,962 | 78 |
| | CKE Restaurants Inc. | 7,815 | 68 |
| | Modine Manufacturing Co. | 6,398 | 66 |
| | PEP Boys– | | |
| | Manny Moe & Jack | 7,476 | 66 |
11
| | |
| High Dividend Yield Index Fund | |
| |
| |
| |
| | | Market |
| | | Value• |
| | Shares | ($000) |
| Stage Stores Inc. | 5,513 | 65 |
| Brown Shoe Co. Inc. | 6,118 | 63 |
| Belo Corp. Class A | 13,072 | 61 |
| Cinemark Holdings Inc. | 4,785 | 55 |
| Ethan Allen Interiors Inc. | 4,256 | 53 |
| Sonic Automotive Inc. | | |
| Class A | 5,700 | 51 |
| Superior Industries | | |
| International Inc. | 3,752 | 50 |
| Big 5 Sporting Goods Corp. | 3,185 | 47 |
| Oxford Industries Inc. | 2,381 | 46 |
| Marcus Corp. | 3,142 | 37 |
| American Axle & | | |
| Manufacturing Holdings Inc. | 5,981 | 36 |
| Blyth Inc. | 993 | 35 |
| Ambassadors Group Inc. | 2,751 | 35 |
| Talbots Inc. | 3,416 | 31 |
| Bebe Stores Inc. | 4,731 | 30 |
| Christopher & Banks Corp. | 4,778 | 29 |
| Jackson Hewitt Tax | | |
| Service Inc. | 3,895 | 19 |
| Marine Products Corp. | 1,716 | 8 |
| | | 45,095 |
| Consumer Staples (11.2%) | | |
| Coca-Cola Co. | 333,350 | 17,771 |
| Philip Morris | | |
| International Inc. | 278,519 | 13,191 |
| Kraft Foods Inc. | 211,935 | 5,832 |
| Altria Group Inc. | 296,556 | 5,371 |
| Kimberly-Clark Corp. | 59,783 | 3,656 |
| Sysco Corp. | 84,835 | 2,244 |
| Kellogg Co. | 40,906 | 2,108 |
| Avon Products Inc. | 61,446 | 1,969 |
| Lorillard Inc. | 23,778 | 1,848 |
| HJ Heinz Co. | 45,374 | 1,826 |
| Reynolds American Inc. | 31,471 | 1,526 |
| ConAgra Foods Inc. | 63,651 | 1,337 |
| Clorox Co. | 19,923 | 1,180 |
| Sara Lee Corp. | 100,143 | 1,131 |
| Hershey Co. | 24,154 | 913 |
| JM Smucker Co. | 16,980 | 895 |
| Pepsi Bottling Group Inc. | 23,057 | 863 |
| SUPERVALU Inc. | 30,523 | 484 |
| Nu Skin Enterprises Inc. | | |
| Class A | 6,935 | 158 |
| Universal Corp. | 3,530 | 147 |
| Lancaster Colony Corp. | 2,991 | 145 |
| Herbalife Ltd. | 3,485 | 117 |
| Lance Inc. | 4,555 | 110 |
| WD-40 Co. | 2,403 | 76 |
| Vector Group Ltd. | 5,016 | 73 |
| Weis Markets Inc. | 1,535 | 54 |
| | | 65,025 |
| | |
| | | Market |
| | | Value• |
| | Shares | ($000) |
| Energy (7.4%) | | |
| Chevron Corp. | 288,628 | 22,092 |
| ConocoPhillips | 214,645 | 10,771 |
| Marathon Oil Corp. | 101,583 | 3,248 |
| Spectra Energy Corp. | 92,626 | 1,771 |
| Valero Energy Corp. | 81,025 | 1,466 |
| Diamond Offshore | | |
| Drilling Inc. | 9,960 | 949 |
| Sunoco Inc. | 16,931 | 521 |
| Linn Energy LLC | 17,299 | 424 |
| Southern Union Co. | 17,871 | 350 |
| Patterson-UTI Energy Inc. | 22,363 | 348 |
| Tesoro Corp. | 19,936 | 282 |
| Nordic American | | |
| Tanker Shipping | 6,003 | 170 |
| Teekay Corp. | 7,723 | 160 |
| Holly Corp. | 5,332 | 155 |
| Overseas Shipholding | | |
| Group Inc. | 3,875 | 152 |
| Copano Energy LLC | 7,728 | 132 |
| Ship Finance | | |
| International Ltd. | 8,262 | 94 |
| Tsakos Energy | | |
| Navigation Ltd. | 3,884 | 60 |
| General Maritime Corp. | 8,233 | 57 |
| Knightsbridge Tankers Ltd. | 2,402 | 30 |
| Crosstex Energy Inc. | 4,867 | 27 |
| | | 43,259 |
| Financials (23.4%) | | |
| Capital Markets (1.9%) | | |
| Bank of New York | | |
| Mellon Corp. | 173,026 | 4,613 |
| T Rowe Price Group Inc. | 36,863 | 1,796 |
| Ameriprise Financial Inc. | 36,726 | 1,273 |
| Invesco Ltd. | 59,467 | 1,258 |
| Legg Mason Inc. | 23,219 | 676 |
| Eaton Vance Corp. | 16,812 | 477 |
| Waddell & | | |
| Reed Financial Inc. | 12,424 | 349 |
| Federated Investors Inc. | | |
| Class B | 11,188 | 294 |
| Greenhill & Co. Inc. | 3,062 | 264 |
| SWS Group Inc. | 3,931 | 53 |
| GFI Group Inc. | 8,613 | 44 |
| Cohen & Steers Inc. | 1,889 | 36 |
| GAMCO Investors Inc. | 753 | 32 |
| Calamos Asset | | |
| Management Inc. Class A | 2,862 | 30 |
| BGC Partners Inc. Class A | 5,529 | 27 |
| |
| Commercial Banks (7.3%) | | |
| Wells Fargo & Co. | 670,362 | 18,448 |
| US Bancorp | 273,210 | 6,344 |
12
High Dividend Yield Index Fund
| | |
| | | Market |
| | | Value• |
| | Shares | ($000) |
| PNC Financial Services | | |
| Group Inc. | 66,247 | 3,242 |
| BB&T Corp. | 98,923 | 2,365 |
| SunTrust Banks Inc. | 71,820 | 1,373 |
| M&T Bank Corp. | 16,983 | 1,067 |
| Fifth Third Bancorp | 114,508 | 1,024 |
| Regions Financial Corp. | 171,074 | 828 |
| Keycorp | 126,475 | 682 |
| Comerica Inc. | 21,611 | 600 |
| Marshall & Ilsley Corp. | 75,554 | 402 |
| Cullen/Frost Bankers Inc. | 8,508 | 398 |
| Huntington Bancshares Inc. | 103,303 | 394 |
| Bank of Hawaii Corp. | 6,880 | 305 |
| City National Corp. | 7,396 | 279 |
| Valley National Bancorp | 20,414 | 271 |
| BancorpSouth Inc. | 11,917 | 269 |
| Zions Bancorporation | 18,297 | 259 |
| Associated Banc-Corp | 18,136 | 232 |
| FirstMerit Corp. | 12,247 | 232 |
| TCF Financial Corp. | 18,542 | 219 |
| Fulton Financial Corp. | 25,047 | 207 |
| Popular Inc. | 92,250 | 199 |
| Trustmark Corp. | 8,365 | 159 |
| Synovus Financial Corp. | 69,241 | 154 |
| MB Financial Inc. | 7,336 | 131 |
| Old National Bancorp | 12,394 | 129 |
| CVB Financial Corp. | 15,140 | 121 |
| Wilmington Trust Corp. | 9,946 | 120 |
| Park National Corp. | 2,045 | 119 |
| FNB Corp. | 16,591 | 117 |
| Umpqua Holdings Corp. | 11,800 | 117 |
| Glacier Bancorp Inc. | 8,723 | 114 |
| United Bankshares Inc. | 6,160 | 110 |
| Webster Financial Corp. | 9,646 | 109 |
| Whitney Holding Corp. | 13,388 | 108 |
| NBT Bancorp Inc. | 4,869 | 106 |
| National Penn | | |
| Bancshares Inc. | 17,864 | 100 |
| Community Bank | | |
| System Inc. | 4,672 | 87 |
| Chemical Financial Corp. | 3,508 | 77 |
| PacWest Bancorp | 4,418 | 75 |
| First Midwest Bancorp Inc. | 7,023 | 73 |
| First Financial Bancorp | 5,622 | 71 |
| City Holding Co. | 2,313 | 71 |
| Susquehanna | | |
| Bancshares Inc. | 12,664 | 70 |
| First Commonwealth | | |
| Financial Corp. | 12,665 | 67 |
| Sterling Bancshares Inc. | 11,892 | 66 |
| Independent Bank Corp. | 3,114 | 66 |
| S&T Bancorp Inc. | 3,826 | 60 |
| Community Trust | | |
| Bancorp Inc. | 2,234 | 55 |
| | | |
| | | | Market |
| | | | Value• |
| | | Shares | ($000) |
| * | United Community | | |
| | Banks Inc. | 13,351 | 54 |
| | WesBanco Inc. | 3,774 | 53 |
| | Renasant Corp. | 3,101 | 45 |
| | Tompkins Financial Corp. | 1,036 | 45 |
| | Oriental Financial Group Inc. | 3,559 | 38 |
| | Washington Trust | | |
| | Bancorp Inc. | 2,390 | 36 |
| | First Busey Corp. | 7,651 | 30 |
| | First Community | | |
| | Bancshares Inc. | 2,425 | 28 |
| | Sandy Spring Bancorp Inc. | 2,248 | 26 |
| | First BanCorp/Puerto Rico | 13,250 | 25 |
| | Lakeland Bancorp Inc. | 3,134 | 19 |
| | First Merchants Corp. | 2,924 | 18 |
| ^ | UCBH Holdings Inc. | 17,173 | 17 |
| | Sterling Bancorp | 2,482 | 17 |
| | Peoples Bancorp Inc. | 1,494 | 16 |
| | Pacific Capital Bancorp NA | 6,453 | 8 |
| | Central Pacific | | |
| | Financial Corp. | 4,295 | 6 |
| * | Sterling Financial Corp. | 7,128 | 6 |
| |
| | Consumer Finance (1.0%) | | |
| | American Express Co. | 170,963 | 5,956 |
| | Advance America Cash | | |
| | Advance Centers Inc. | 8,781 | 44 |
| |
| | Diversified Financial Services (8.9%) | |
| | JPMorgan Chase & Co. | 561,681 | 23,461 |
| | Bank of America Corp. | 1,245,617 | 18,161 |
| | Citigroup Inc. | 2,174,207 | 8,893 |
| | NYSE Euronext | 37,435 | 968 |
| | Financial Federal Corp. | 3,616 | 74 |
| | CIT Group Inc. | 56,016 | 40 |
| | Teton Advisors Inc. Class B | 11 | — |
| |
| | Insurance (3.7%) | | |
| | Travelers Cos. Inc. | 81,717 | 4,069 |
| | MetLife Inc. | 117,848 | 4,010 |
| | Allstate Corp. | 77,167 | 2,282 |
| | Marsh & | | |
| | McLennan Cos. Inc. | 75,234 | 1,765 |
| | Hartford Financial | | |
| | Services Group Inc. | 55,326 | 1,357 |
| | Principal Financial | | |
| | Group Inc. | 45,824 | 1,147 |
| | Lincoln National Corp. | 43,229 | 1,030 |
| | XL Capital Ltd. Class A | 49,271 | 808 |
| | Willis Group Holdings Ltd. | 24,056 | 649 |
| | Cincinnati Financial Corp. | 23,497 | 596 |
| | Axis Capital Holdings Ltd. | 20,367 | 588 |
| | Fidelity National | | |
| | Financial Inc. Class A | 33,506 | 455 |
13
| | |
| High Dividend Yield Index Fund | |
| |
| |
| |
| | | Market |
| | | Value• |
| | Shares | ($000) |
| First American Corp. | 13,337 | 405 |
| Old Republic | | |
| International Corp. | 34,635 | 370 |
| Arthur J Gallagher & Co. | 14,427 | 322 |
| Aspen Insurance | | |
| Holdings Ltd. | 11,884 | 307 |
| Endurance Specialty | | |
| Holdings Ltd. | 8,244 | 297 |
| Protective Life Corp. | 12,415 | 239 |
| Delphi Financial Group Inc. | 6,805 | 148 |
| Mercury General Corp. | 3,864 | 141 |
| Harleysville Group Inc. | 3,914 | 123 |
| Zenith National | | |
| Insurance Corp. | 4,090 | 117 |
| Erie Indemnity Co. Class A | 2,922 | 103 |
| Safety Insurance Group Inc. 2,204 | 74 |
| Horace Mann | | |
| Educators Corp. | 5,707 | 71 |
| Phoenix Cos. Inc. | 16,953 | 54 |
| United Fire & Casualty Co. | 2,802 | 49 |
| FBL Financial Group Inc. | | |
| Class A | 2,185 | 44 |
| OneBeacon Insurance | | |
| Group Ltd. Class A | 3,466 | 41 |
| Baldwin & Lyons Inc. | 1,281 | 29 |
| Stewart Information | | |
| Services Corp. | 1,732 | 15 |
| |
| Thrifts & Mortgage Finance (0.6%) | |
| Hudson City Bancorp Inc. | 74,930 | 985 |
| People’s United | | |
| Financial Inc. | 49,469 | 793 |
| New York Community | | |
| Bancorp Inc. | 49,556 | 535 |
| First Niagara Financial | | |
| Group Inc. | 27,121 | 348 |
| Washington Federal Inc. | 16,189 | 278 |
| Astoria Financial Corp. | 13,970 | 139 |
| Capitol Federal Financial | 3,178 | 96 |
| Provident Financial | | |
| Services Inc. | 8,516 | 91 |
| Brookline Bancorp Inc. | 8,370 | 82 |
| Dime Community | | |
| Bancshares | 5,108 | 56 |
| Flushing Financial Corp. | 4,283 | 48 |
| Northwest Bancorp Inc. | 2,072 | 46 |
| Bank Mutual Corp. | 3,308 | 23 |
| | | 136,822 |
| Health Care (11.1%) | | |
| Johnson & Johnson | 399,476 | 23,589 |
| Pfizer Inc. | 1,159,584 | 19,748 |
| Merck & Co. Inc. | 304,395 | 9,415 |
| Bristol-Myers Squibb Co. | 283,105 | 6,172 |
| | | | |
| | | | | Market |
| | | | | Value• |
| | | | Shares | ($000) |
| | Eli Lilly & Co. | | 165,433 | 5,626 |
| | Quality Systems Inc. | | 3,033 | 185 |
| * | Brookdale Senior Living Inc. | 8,539 | 144 |
| | Landauer Inc. | | 1,377 | 71 |
| | Computer Programs & | | | |
| | Systems Inc. | | 773 | 33 |
| | | | | 64,983 |
| Industrials (13.9%) | | | |
| | General Electric Co. | 1,516,587 | 21,627 |
| | 3M Co. | | 100,639 | 7,404 |
| | United Parcel Service Inc. | | |
| | Class B | | 101,114 | 5,428 |
| | Boeing Co. | | 105,512 | 5,044 |
| | Caterpillar Inc. | | 89,453 | 4,925 |
| | Emerson Electric Co. | | 108,709 | 4,104 |
| | Honeywell International Inc. | 108,280 | 3,886 |
| | Illinois Tool Works Inc. | | 71,892 | 3,301 |
| | Deere & Co. | | 60,856 | 2,772 |
| | Northrop Grumman Corp. | 45,801 | 2,296 |
| | Tyco International Ltd. | | 68,364 | 2,294 |
| | Waste Management Inc. | 71,319 | 2,131 |
| | Ingersoll-Rand PLC | | 45,690 | 1,443 |
| | Eaton Corp. | | 23,700 | 1,433 |
| | Republic Services Inc. | | | |
| | Class A | | 54,445 | 1,411 |
| | Dover Corp. | | 26,776 | 1,009 |
| * | Cooper Industries PLC | | | |
| | Class A | | 24,008 | 929 |
| | Rockwell Automation Inc. | 20,374 | 834 |
| | Pitney Bowes Inc. | | 29,888 | 732 |
| | Textron Inc. | | 38,660 | 687 |
| | Masco Corp. | | 51,833 | 609 |
| | RR Donnelley & Sons Co. | 29,520 | 593 |
| | Avery Dennison Corp. | | 16,232 | 579 |
| | Stanley Works | | 11,285 | 510 |
| | Oshkosh Corp. | | 12,622 | 395 |
| | Harsco Corp. | | 11,566 | 364 |
| | Timken Co. | | 13,922 | 307 |
| | Snap-On Inc. | | 8,283 | 303 |
| | Hubbell Inc. Class B | | 7,021 | 299 |
| | Graco Inc. | | 8,660 | 239 |
| | Crane Co. | | 8,428 | 235 |
| * | DryShips Inc. | | 36,828 | 222 |
| | Watsco Inc. | | 3,964 | 203 |
| | GATX Corp. | | 6,705 | 182 |
| | Baldor Electric Co. | | 6,721 | 174 |
| | Alexander & Baldwin Inc. | 5,930 | 171 |
| | HNI Corp. | | 6,303 | 166 |
| | Briggs & Stratton Corp. | 7,025 | 131 |
| | Applied Industrial | | | |
| | Technologies Inc. | | 6,094 | 123 |
| | Healthcare Services | | | |
| | Group Inc. | | 6,240 | 123 |
14
| | | |
| High Dividend Yield Index Fund | |
| |
| |
| |
| | | | Market |
| | | | Value• |
| | | Shares | ($000) |
| | Corporate Executive | | |
| | Board Co. | 4,955 | 119 |
| | Otter Tail Corp. | 5,083 | 118 |
| | Deluxe Corp. | 7,307 | 104 |
| | ABM Industries Inc. | 5,433 | 102 |
| | Mine Safety Appliances Co. | 3,858 | 98 |
| | Genco Shipping & | | |
| | Trading Ltd. | 4,516 | 90 |
| | Barnes Group Inc. | 5,635 | 89 |
| | Seaspan Corp. | 9,695 | 84 |
| | Aircastle Ltd. | 8,555 | 68 |
| | Knoll Inc. | 6,885 | 68 |
| | McGrath RentCorp | 3,374 | 67 |
| | Albany International Corp. | 3,922 | 65 |
| | Ennis Inc. | 3,846 | 58 |
| | Apogee Enterprises Inc. | 3,970 | 53 |
| | Steelcase Inc. Class A | 8,538 | 49 |
| | Kelly Services Inc. Class A | 4,367 | 48 |
| | Excel Maritime Carriers Ltd. | | |
| | Class A | 8,348 | 47 |
| | Federal Signal Corp. | 7,039 | 43 |
| | Eagle Bulk Shipping Inc. | 8,839 | 42 |
| | Bowne & Co. Inc. | 5,315 | 35 |
| | American Ecology Corp. | 2,007 | 33 |
| | TAL International Group Inc. | 2,282 | 27 |
| | Kimball International Inc. | | |
| | Class B | 3,598 | 27 |
| | CDI Corp. | 2,082 | 25 |
| | Courier Corp. | 1,705 | 25 |
| * | Vicor Corp. | 3,363 | 23 |
| | Horizon Lines Inc. Class A | 3,496 | 18 |
| | Sauer-Danfoss Inc. | 2,201 | 16 |
| | | | 81,259 |
| Information Technology (5.2%) | | |
| | Intel Corp. | 800,804 | 15,303 |
| | Automatic Data | | |
| | Processing Inc. | 72,227 | 2,875 |
| | Motorola Inc. | 330,055 | 2,829 |
| | Paychex Inc. | 52,361 | 1,488 |
| | Tyco Electronics Ltd. | 65,943 | 1,401 |
| | Analog Devices Inc. | 41,771 | 1,071 |
| | Seagate Technology | 70,717 | 986 |
| | Xilinx Inc. | 39,802 | 866 |
| | Linear Technology Corp. | 31,815 | 823 |
| | KLA-Tencor Corp. | 24,313 | 790 |
| | Microchip Technology Inc. | 26,188 | 627 |
| | Jabil Circuit Inc. | 29,876 | 400 |
| | Diebold Inc. | 9,372 | 283 |
| | Intersil Corp. Class A | 17,714 | 222 |
| | Molex Inc. | 10,371 | 194 |
| | Cognex Corp. | 5,754 | 93 |
| | United Online Inc. | 9,085 | 73 |
| | Technitrol Inc. | 5,897 | 46 |
| | |
| | | Market |
| | | Value• |
| | Shares | ($000) |
| Methode Electronics Inc. | 5,636 | 41 |
| NAM TAI Electronics Inc. | 5,258 | 29 |
| Electro Rent Corp. | 2,656 | 28 |
| Agilysys Inc. | 3,616 | 17 |
| | | 30,485 |
| Materials (4.8%) | | |
| EI du Pont de | | |
| Nemours & Co. | 129,444 | 4,119 |
| Dow Chemical Co. | 164,656 | 3,866 |
| Air Products & | | |
| Chemicals Inc. | 30,330 | 2,339 |
| Nucor Corp. | 45,146 | 1,799 |
| Alcoa Inc. | 140,275 | 1,742 |
| International Paper Co. | 61,857 | 1,380 |
| PPG Industries Inc. | 23,805 | 1,343 |
| Southern Copper Corp. | 36,715 | 1,157 |
| Weyerhaeuser Co. | 30,167 | 1,096 |
| Vulcan Materials Co. | 17,823 | 820 |
| United States Steel Corp. | 20,634 | 712 |
| Lubrizol Corp. | 9,749 | 649 |
| MeadWestvaco Corp. | 24,592 | 561 |
| Eastman Chemical Co. | 10,445 | 549 |
| Allegheny Technologies Inc. | 14,032 | 433 |
| International Flavors & | | |
| Fragrances Inc. | 11,312 | 431 |
| Steel Dynamics Inc. | 30,848 | 413 |
| Bemis Co. Inc. | 15,588 | 403 |
| Sonoco Products Co. | 14,399 | 385 |
| Ashland Inc. | 10,678 | 369 |
| Valspar Corp. | 14,477 | 367 |
| RPM International Inc. | 18,592 | 328 |
| Commercial Metals Co. | 16,195 | 240 |
| Temple-Inland Inc. | 15,305 | 236 |
| Cabot Corp. | 9,358 | 205 |
| Packaging Corp. of America | 11,109 | 203 |
| Huntsman Corp. | 25,364 | 202 |
| Greif Inc. Class A | 3,487 | 187 |
| Sensient Technologies Corp. | 7,038 | 178 |
| Olin Corp. | 11,315 | 173 |
| Carpenter Technology Corp. | 6,475 | 136 |
| Worthington Industries Inc. | 11,342 | 125 |
| Schweitzer-Mauduit | | |
| International Inc. | 2,225 | 115 |
| Titanium Metals Corp. | 12,909 | 111 |
| Arch Chemicals Inc. | 3,562 | 99 |
| Kaiser Aluminum Corp. | 2,148 | 86 |
| AMCOL International Corp. | 3,294 | 86 |
| Koppers Holdings Inc. | 2,893 | 76 |
| Glatfelter | 6,563 | 69 |
| A Schulman Inc. | 3,790 | 66 |
| Wausau Paper Corp. | 6,889 | 60 |
| Innophos Holdings Inc. | 2,362 | 46 |
| Spartech Corp. | 4,415 | 42 |
15
| | |
| High Dividend Yield Index Fund | |
| |
| |
| |
| | | Market |
| | | Value• |
| | Shares | ($000) |
| Ferro Corp. | 6,194 | 38 |
| Myers Industries Inc. | 3,891 | 34 |
| | | 28,074 |
| Telecommunication Services (6.4%) | |
| AT&T Inc. | 855,372 | 21,957 |
| Verizon | | |
| Communications Inc. | 410,427 | 12,145 |
| CenturyTel Inc. | 42,527 | 1,380 |
| Qwest Communications | | |
| International Inc. | 248,189 | 891 |
| Windstream Corp. | 63,295 | 610 |
| Frontier | | |
| Communications Corp. | 44,851 | 322 |
| NTELOS Holdings Corp. | 4,601 | 69 |
| Alaska Communications | | |
| Systems Group Inc. | 6,508 | 51 |
| Iowa Telecommunications | | |
| Services Inc. | 3,454 | 41 |
| | | 37,466 |
| Utilities (8.8%) | | |
| Exelon Corp. | 95,021 | 4,462 |
| Southern Co. | 114,615 | 3,575 |
| Duke Energy Corp. | 186,700 | 2,954 |
| Dominion Resources Inc. | 84,941 | 2,896 |
| FPL Group Inc. | 58,815 | 2,888 |
| PG&E Corp. | 53,370 | 2,182 |
| Public Service Enterprise | | |
| Group Inc. | 73,223 | 2,182 |
| Entergy Corp. | 28,236 | 2,166 |
| FirstEnergy Corp. | 43,885 | 1,899 |
| Sempra Energy | 35,078 | 1,805 |
| Consolidated Edison Inc. | 39,397 | 1,603 |
| PPL Corp. | 54,143 | 1,594 |
| Progress Energy Inc. | 40,177 | 1,508 |
| Edison International | 46,910 | 1,493 |
| Xcel Energy Inc. | 65,605 | 1,237 |
| Constellation Energy | | |
| Group Inc. | 28,835 | 892 |
| DTE Energy Co. | 23,571 | 872 |
| Ameren Corp. | 33,621 | 818 |
| EQT Corp. | 18,681 | 782 |
| Centerpoint Energy Inc. | 52,610 | 663 |
| SCANA Corp. | 17,640 | 597 |
| Northeast Utilities | 25,215 | 581 |
| MDU Resources Group Inc. | 26,487 | 550 |
| Oneok Inc. | 15,162 | 549 |
| National Fuel Gas Co. | 11,566 | 524 |
| NiSource Inc. | 39,429 | 509 |
| Pepco Holdings Inc. | 31,817 | 475 |
| NSTAR | 15,271 | 473 |
| OGE Energy Corp. | 13,829 | 459 |
| Pinnacle West Capital Corp. | 14,490 | 454 |
| TECO Energy Inc. | 30,629 | 439 |
| Alliant Energy Corp. | 15,884 | 422 |
| | |
| | | Market |
| | | Value• |
| | Shares | ($000) |
| AGL Resources Inc. | 11,054 | 386 |
| Integrys Energy Group Inc. | 10,969 | 379 |
| UGI Corp. | 15,500 | 370 |
| Atmos Energy Corp. | 13,131 | 366 |
| American Water | | |
| Works Co. Inc. | 18,925 | 359 |
| Great Plains Energy Inc. | 19,490 | 337 |
| DPL Inc. | 12,613 | 320 |
| Westar Energy Inc. | 15,631 | 299 |
| Vectren Corp. | 11,736 | 264 |
| Piedmont Natural | | |
| Gas Co. Inc. | 10,527 | 245 |
| Nicor Inc. | 6,508 | 241 |
| WGL Holdings Inc. | 7,258 | 240 |
| Hawaiian Electric | | |
| Industries Inc. | 13,309 | 238 |
| Cleco Corp. | 8,611 | 213 |
| New Jersey Resources Corp. | 6,022 | 212 |
| Portland General Electric Co. | 10,755 | 200 |
| IDACORP Inc. | 6,867 | 193 |
| Allete Inc. | 4,861 | 165 |
| Southwest Gas Corp. | 6,341 | 158 |
| Northwest Natural Gas Co. | 3,781 | 158 |
| South Jersey Industries Inc. | 4,243 | 150 |
| Avista Corp. | 7,767 | 147 |
| Unisource Energy Corp. | 5,074 | 147 |
| Black Hills Corp. | 5,534 | 135 |
| PNM Resources Inc. | 12,256 | 131 |
| NorthWestern Corp. | 5,086 | 123 |
| UIL Holdings Corp. | 4,288 | 110 |
| CH Energy Group Inc. | 2,263 | 94 |
| Empire District Electric Co. | 4,941 | 89 |
| American States Water Co. | 2,595 | 86 |
| Central Vermont Public | | |
| Service Corp. | 1,788 | 35 |
| | | 51,093 |
| Total Common Stocks | | |
| (Cost $608,349) | | 583,561 |
| Temporary Cash Investment (0.0%) | |
| Money Market Fund (0.0%) | | |
| 1,2 Vanguard Market | | |
| Liquidity Fund, 0.225% | | |
| (Cost $15) | 15,202 | 15 |
| Total Investments (99.9%) | | |
| (Cost $608,364) | | 583,576 |
| Other Assets and Liabilities (0.1%) | |
| Other Assets | | 1,606 |
| Liabilities2 | | (748) |
| | | 858 |
| Net Assets (100%) | | 584,434 |
16
High Dividend Yield Index Fund
| |
| At October 31, 2009, net assets consisted of: |
| | Amount |
| | ($000) |
| Paid-in Capital | 632,536 |
| Undistributed Net Investment Income | 1,384 |
| Accumulated Net Realized Losses | (24,698) |
| Unrealized Appreciation (Depreciation) | (24,788) |
| Net Assets | 584,434 |
| |
| Investor Shares—Net Assets | |
| Applicable to 10,922,952 outstanding | |
| $.001 par value shares of beneficial | |
| interest (unlimited authorization) | 154,529 |
| Net Asset Value Per Share— | |
| Investor Shares | $14.15 |
| |
| ETF Shares—Net Assets | |
| Applicable to 12,042,539 outstanding | |
| $.001 par value shares of beneficial | |
| interest (unlimited authorization) | 429,905 |
| Net Asset Value Per Share— | |
| ETF Shares | $35.70 |
• See Note A in Notes to Financial Statements.
* Non-income-producing security.
^ Part of security position is on loan to broker-dealers. The total value of securities on loan is $7,000.
1 Affiliated money market fund available only to Vanguard funds and certain trusts and accounts managed by Vanguard. Rate shown is the
7-day yield.
2 Includes $15,000 of collateral received for securities on loan.
See accompanying Notes, which are an integral part of the Financial Statements.
17
| |
| High Dividend Yield Index Fund | |
| |
| |
| Statement of Operations | |
| |
| | Year Ended |
| | October 31, 2009 |
| | ($000) |
| Investment Income | |
| Income | |
| Dividends | 15,722 |
| Interest1 | 6 |
| Security Lending | 322 |
| Total Income | 16,050 |
| Expenses | |
| The Vanguard Group—Note B | |
| Investment Advisory Services | 57 |
| Management and Administrative—Investor Shares | 280 |
| Management and Administrative—ETF Shares | 294 |
| Marketing and Distribution—Investor Shares | 27 |
| Marketing and Distribution—ETF Shares | 77 |
| Custodian Fees | 159 |
| Auditing Fees | 23 |
| Shareholders’ Reports and Proxies—Investor Shares | 13 |
| Shareholders’ Reports and Proxies—ETF Shares | 41 |
| Trustees’ Fees and Expenses | 1 |
| Total Expenses | 972 |
| Net Investment Income | 15,078 |
| Realized Net Gain (Loss) on Investment Securities Sold | (17,744) |
| Change in Unrealized Appreciation (Depreciation) of Investment Securities | 47,491 |
| Net Increase (Decrease) in Net Assets Resulting from Operations | 44,825 |
| 1 Interest income from an affiliated company of the fund was $6,000. | |
See accompanying Notes, which are an integral part of the Financial Statements.
18
| | |
| High Dividend Yield Index Fund | | |
| |
| |
| Statement of Changes in Net Assets | | |
| |
| | Year Ended October 31, |
| | 2009 | 2008 |
| | ($000) | ($000) |
| Increase (Decrease) in Net Assets | | |
| Operations | | |
| Net Investment Income | 15,078 | 6,564 |
| Realized Net Gain (Loss) | (17,744) | 213 |
| Change in Unrealized Appreciation (Depreciation) | 47,491 | (79,033) |
| Net Increase (Decrease) in Net Assets Resulting from Operations | 44,825 | (72,256) |
| Distributions | | |
| Net Investment Income | | |
| Investor Shares | (3,790) | (2,229) |
| ETF Shares | (10,670) | (3,969) |
| Realized Capital Gain | | |
| Investor Shares | — | — |
| ETF Shares | — | — |
| Total Distributions | (14,460) | (6,198) |
| Capital Share Transactions | | |
| Investor Shares | 70,562 | 39,000 |
| ETF Shares | 244,830 | 96,649 |
| Net Increase (Decrease) from Capital Share Transactions | 315,392 | 135,649 |
| Total Increase (Decrease) | 345,757 | 57,195 |
| Net Assets | | |
| Beginning of Period | 238,677 | 181,482 |
| End of Period1 | 584,434 | 238,677 |
| 1 Net Assets—End of Period includes undistributed net investment income of $1,384,000 and $766,000. | | |
See accompanying Notes, which are an integral part of the Financial Statements.
19
| | | |
| High Dividend Yield Index Fund | | | |
| |
| |
| Financial Highlights | | | |
| |
| |
| Investor Shares | | | |
| | | | Nov. 16, |
| | Year Ended | 20061 to |
| | October 31, | Oct. 31, |
| For a Share Outstanding Throughout Each Period | 2009 | 2008 | 2007 |
| Net Asset Value, Beginning of Period | $14.20 | $21.61 | $20.00 |
| Investment Operations | | | |
| Net Investment Income | .4682 | .589 | .5422 |
| Net Realized and Unrealized Gain (Loss) on Investments | (.070) | (7.409) | 1.477 |
| Total from Investment Operations | .398 | (6.820) | 2.019 |
| Distributions | | | |
| Dividends from Net Investment Income | (.448) | (.590) | (.409) |
| Distributions from Realized Capital Gains | — | — | — |
| Total Distributions | (.448) | (.590) | (.409) |
| Net Asset Value, End of Period | $14.15 | $14.20 | $21.61 |
| |
| Total Return3 | 3.27% | –32.17% | 10.16% |
| |
| Ratios/Supplemental Data | | | |
| Net Assets, End of Period (Millions) | $155 | $77 | $67 |
| Ratio of Total Expenses to Average Net Assets | 0.35% | 0.35% | 0.40%4 |
| Ratio of Net Investment Income to Average Net Assets | 3.63% | 3.41% | 2.43%4 |
| Portfolio Turnover Rate5 | 20% | 11% | 11% |
1 Inception.
2 Calculated based on average shares outstanding.
3 Total returns do not include the account service fee that may be applicable to certain accounts with balances below $10,000.
4 Annualized.
5 Excludes the value of portfolio securities received or delivered as a result of in-kind purchases or redemptions of the fund’s capital shares, including ETF Creation Units.
See accompanying Notes, which are an integral part of the Financial Statements.
20
| | | |
| High Dividend Yield Index Fund | | | |
| |
| |
| Financial Highlights | | | |
| |
| |
| ETF Shares | | | |
| | | | Nov. 10, |
| | Year Ended | 20061 to |
| | October 31, | Oct. 31, |
| For a Share Outstanding Throughout Each Period | 2009 | 2008 | 2007 |
| Net Asset Value, Beginning of Period | $35.84 | $54.55 | $50.04 |
| Investment Operations | | | |
| Net Investment Income | 1.2352 | 1.553 | 1.4052 |
| Net Realized and Unrealized Gain (Loss) on Investments | (.198) | (18.703) | 4.190 |
| Total from Investment Operations | 1.037 | (17.150) | 5.595 |
| Distributions | | | |
| Dividends from Net Investment Income | (1.177) | (1.560) | (1.085) |
| Distributions from Realized Capital Gains | — | — | — |
| Total Distributions | (1.177) | (1.560) | (1.085) |
| Net Asset Value, End of Period | $35.70 | $35.84 | $54.55 |
| |
| Total Return | 3.38% | –32.07% | 11.26% |
| |
| Ratios/Supplemental Data | | | |
| Net Assets, End of Period (Millions) | $430 | $161 | $115 |
| Ratio of Total Expenses to Average Net Assets | 0.20% | 0.20% | 0.25%3 |
| Ratio of Net Investment Income to Average Net Assets | 3.78% | 3.56% | 2.58%3 |
| Portfolio Turnover Rate4 | 20% | 11% | 11% |
1 Inception.
2 Calculated based on average shares outstanding.
3 Annualized.
4 Excludes the value of portfolio securities received or delivered as a result of in-kind purchases or redemptions of the fund’s capital shares, including ETF Creation Units.
See accompanying Notes, which are an integral part of the Financial Statements.
21
High Dividend Yield Index Fund
Notes to Financial Statements
Vanguard High Dividend Yield Index Fund is registered under the Investment Company Act of 1940 as an open-end investment company, or mutual fund. The fund offers two classes of shares: Investor Shares and ETF Shares. Investor Shares are available to any investor who meets the fund’s minimum purchase requirements. ETF Shares are listed for trading on the NYSE Arca, Inc.; they can be purchased and sold through a broker.
A. The following significant accounting policies conform to generally accepted accounting principles for U.S. mutual funds. The fund consistently follows such policies in preparing its financial statements.
1. Security Valuation: Securities are valued as of the close of trading on the New York Stock Exchange (generally 4 p.m., Eastern time) on the valuation date. Equity securities are valued at the latest quoted sales prices or official closing prices taken from the primary market in which each security trades; such securities not traded on the valuation date are valued at the mean of the latest quoted bid and asked prices. Securities for which market quotations are not readily available, or whose values have been materially affected by events occurring before the fund’s pricing time but after the close of the securities’ primary markets, are valued by methods deemed by the board of trustees to represent fair value. Investments in Vanguard Market Liquidity Fund are valued at that fund’s net asset value.
2. Federal Income Taxes: The fund intends to continue to qualify as a regulated investment company and distribute all of its taxable income. Management has analyzed the fund’s tax positions taken for all open federal income tax years (October 31, 2007–2009), and has concluded that no provision for federal income tax is required in the fund’s financial statements.
3. Distributions: Distributions to shareholders are recorded on the ex-dividend date.
4. Security Lending: The fund may lend its securities to qualified institutional borrowers to earn additional income. Security loans are required to be secured at all times by collateral at least equal to the market value of securities loaned. The fund invests cash collateral received in Vanguard Market Liquidity Fund, and records a liability for the return of the collateral, during the period the securities are on loan. Security lending income represents the income earned on investing cash collateral, less expenses associated with the loan.
5. Other: Dividend income is recorded on the ex-dividend date. Interest income includes income distributions received from Vanguard Market Liquidity Fund and is accrued daily. Security transactions are accounted for on the date securities are bought or sold. Costs used to determine realized gains (losses) on the sale of investment securities are those of the specific securities sold.
Each class of shares has equal rights as to assets and earnings, except that each class separately bears certain class-specific expenses related to maintenance of shareholder accounts (included in Management and Administrative expenses), shareholder reporting, and proxies. Marketing and distribution expenses are allocated to each class of shares based on a method approved by the board of trustees. Income, other non-class-specific expenses, and gains and losses on investments are allocated to each class of shares based on its relative net assets.
22
High Dividend Yield Index Fund
B. The Vanguard Group furnishes at cost investment advisory, corporate management, administrative, marketing, and distribution services. The costs of such services are allocated to the fund under methods approved by the board of trustees. The fund has committed to provide up to 0.40% of its net assets in capital contributions to Vanguard. At October 31, 2009, the fund had contributed capital of $120,000 to Vanguard (included in Other Assets), representing 0.02% of the fund’s net assets and 0.05% of Vanguard’s capitalization. The fund’s trustees and officers are also directors and officers of Vanguard.
C. Various inputs may be used to determine the value of the fund’s investments. These inputs are summarized in three broad levels for financial statement purposes. The inputs or methodologies used to value securities are not necessarily an indication of the risk associated with investing in those securities.
Level 1—Quoted prices in active markets for identical securities.
Level 2—Other significant observable inputs (including quoted prices for similar securities, interest rates, prepayment speeds, credit risk, etc.).
Level 3—Significant unobservable inputs (including the fund’s own assumptions used to determine the fair value of investments).
At October 31, 2009, 100% of the fund’s investments were valued based on Level 1 inputs.
D. Distributions are determined on a tax basis and may differ from net investment income and realized capital gains for financial reporting purposes. Differences may be permanent or temporary. Permanent differences are reclassified among capital accounts in the financial statements to reflect their tax character. Temporary differences arise when certain items of income, expense, gain, or loss are recognized in different periods for financial statement and tax purposes; these differences will reverse at some time in the future. Differences in classification may also result from the treatment of short-term gains as ordinary income for tax purposes.
During the year ended October 31, 2009, the fund realized $966,000 of net capital gains resulting from in-kind redemptions—in which shareholders exchanged fund shares for securities held by the fund rather than for cash. Because such gains are not taxable to the fund, and are not distributed to shareholders, they have been reclassified from accumulated net realized losses to paid-in capital.
For tax purposes, at October 31, 2009, the fund had $1,671,000 of ordinary income available for distribution. The fund had available capital loss carryforwards totaling $22,973,000 to offset future net capital gains of $609,000 through October 31, 2015, $5,260,000 through October 31, 2016, and $17,104,000 through October 31, 2017.
At October 31, 2009, the cost of investment securities for tax purposes was $610,089,000. Net unrealized depreciation of investment securities for tax purposes was $26,513,000, consisting of unrealized gains of $32,301,000 on securities that had risen in value since their purchase and $58,814,000 in unrealized losses on securities that had fallen in value since their purchase.
E. During the year ended October 31, 2009, the fund purchased $406,308,000 of investment securities and sold $91,202,000 of investment securities, other than temporary cash investments.
23
High Dividend Yield Index Fund
| | | | |
| F. Capital share transactions for each class of shares were: | | | |
| | | | Year Ended October 31, |
| | | 2009 | | 2008 |
| | Amount | Shares | Amount | Shares |
| | ($000) | (000) | ($000) | (000) |
| Investor Shares | | | | |
| Issued | 110,481 | 8,716 | 67,493 | 3,933 |
| Issued in Lieu of Cash Distributions | 2,942 | 234 | 1,869 | 102 |
| Redeemed | (42,861) | (3,473) | (30,362) | (1,681) |
| Net Increase (Decrease)—Investor Shares | 70,562 | 5,477 | 39,000 | 2,354 |
| ETF Shares | | | | |
| Issued | 256,834 | 7,940 | 145,520 | 3,400 |
| Issued in Lieu of Cash Distributions | — | — | — | — |
| Redeemed | (12,004) | (400) | (48,871) | (1,000) |
| Net Increase (Decrease)—ETF Shares | 244,830 | 7,540 | 96,649 | 2,400 |
G. In preparing the financial statements as of October 31, 2009, management considered the impact of subsequent events occurring through December 8, 2009, for potential recognition or disclosure in these financial statements.
24
Report of Independent Registered Public Accounting Firm
To the Trustees of Vanguard Whitehall Funds and the Shareholders of Vanguard High Dividend Yield Index Fund:
In our opinion, the accompanying statement of net assets and the related statements of operations and of changes in net assets and the financial highlights present fairly, in all material respects, the financial position of Vanguard High Dividend Yield Index Fund (the “Fund”) at October 31, 2009, the results of its operations for the year then ended, and the changes in its net assets for each of the two years in the period then ended and the financial highlights for each of the periods indicated, in conformity with accounting principles generally accepted in the United States of America. These financial statements and financial highlights (hereafter referred to as “financial statements”) are the responsibility of the Fund’s management; our responsibility is to express an opinion on these financial statements based on our audits. We conducted our audits of these financial statements in accordance with the standards of the Public Company Accounting Oversight Board (United States). Those standards require that we plan and perform the audit to obtain reasonable assurance about whether the financial statements are free of material misstatement. An audit includes examining, on a test basis, evidence supporting the amounts and disclosures in the financial statements, assessing the accounting principles used and significant estimates made by management, and evaluating the overall financial statement presentation. We believe that our audits, which included confirmation of securities at October 31, 2009 by correspondence with the custodian and by agreement to the underlying ownership records of Vanguard Market Liquidity Fund, provide a reasonable basis for our opinion.
PricewaterhouseCoopers LLP
Philadelphia, Pennsylvania
December 8, 2009
|
| Special 2009 tax information (unaudited) for Vanguard High Dividend Yield Index Fund |
This information for the fiscal year ended October 31, 2009, is included pursuant to provisions of the Internal Revenue Code.
The fund distributed $14,460,000 of qualified dividend income to shareholders during the fiscal year.
For corporate shareholders, 100% of investment income (dividend income plus short-term gains, if any) qualifies for the dividends-received deduction.
25
Your Fund’s After-Tax Returns
This table presents returns for your fund both before and after taxes. The after-tax returns are shown in two ways: (1) assuming that an investor owned the fund during the entire period and paid taxes on the fund’s distributions, and (2) assuming that an investor paid taxes on the fund’s distributions and sold all shares at the end of each period.
Calculations are based on the highest individual federal income tax and capital gains tax rates in effect at the times of the distributions and the hypothetical sales. State and local taxes were not considered. After-tax returns reflect any qualified dividend income, using actual prior-year figures and estimates for 2009. (In the example, returns after the sale of fund shares may be higher than those assuming no sale. This occurs when the sale would have produced a capital loss. The calculation assumes that the investor received a tax deduction for the loss.)
The table shows returns for Investor Shares only; returns for other share classes will differ. Please note that your actual after-tax returns will depend on your tax situation and may differ from those shown. Also note that if you own the fund in a tax-deferred account, such as an individual retirement account or a 401(k) plan, this information does not apply to you. Such accounts are not subject to current taxes.
Finally, keep in mind that a fund’s performance—whether before or after taxes—does not guarantee future results.
| | |
| Average Annual Total Returns: High Dividend Yield Index Fund Investor Shares1 | | |
| Periods Ended October 31, 2009 | | |
| | One | Since |
| | Year | Inception2 |
| Returns Before Taxes | 3.27% | –8.40% |
| Returns After Taxes on Distributions | 2.72 | –8.80 |
| Returns After Taxes on Distributions and Sale of Fund Shares | 2.72 | –7.00 |
1 Total returns do not include the account service fee that may be applicable to certain accounts with balances below $10,000.
2 November 16, 2006.
26
About Your Fund’s Expenses
As a shareholder of the fund, you incur ongoing costs, which include costs for portfolio management, administrative services, and shareholder reports (like this one), among others. Operating expenses, which are deducted from a fund’s gross income, directly reduce the investment return of the fund.
A fund’s expenses are expressed as a percentage of its average net assets. This figure is known as the expense ratio. The following examples are intended to help you understand the ongoing costs (in dollars) of investing in your fund and to compare these costs with those of other mutual funds. The examples are based on an investment of $1,000 made at the beginning of the period shown and held for the entire period.
The table below illustrates your fund’s costs in two ways:
• Based on actual fund return. This section helps you to estimate the actual expenses that you paid over the period. The “Ending Account Value” shown is derived from the fund’s actual return, and the third column shows the dollar amount that would have been paid by an investor who started with $1,000 in the fund. You may use the information here, together with the amount you invested, to estimate the expenses that you paid over the period.
To do so, simply divide your account value by $1,000 (for example, an $8,600 account value divided by $1,000 = 8.6), then multiply the result by the number given for your fund under the heading “Expenses Paid During Period.”
• Based on hypothetical 5% yearly return. This section is intended to help you compare your fund’s costs with those of other mutual funds. It assumes that the fund had a yearly return of 5% before expenses, but that the expense ratio is unchanged. In this case—because the return used is not the fund’s actual return—the results do not apply to your investment. The example is useful in making comparisons because the Securities and Exchange Commission requires all mutual funds to calculate expenses based on a 5% return. You can assess your fund’s costs by comparing this hypothetical example with the hypothetical examples that appear in shareholder reports of other funds.
| | | |
| Six Months Ended October 31, 2009 | | | |
| | Beginning | Ending | Expenses |
| | Account Value | Account Value | Paid During |
| High Dividend Yield Index Fund | 4/30/2009 | 10/31/2009 | Period1 |
| Based on Actual Fund Return | | | |
| Investor Shares | $1,000.00 | $1,201.34 | $1.94 |
| ETF Shares | 1,000.00 | 1,202.05 | 1.11 |
| Based on Hypothetical 5% Yearly Return | | | |
| Investor Shares | $1,000.00 | $1,023.44 | $1.79 |
| ETF Shares | 1,000.00 | 1,024.20 | 1.02 |
1 The calculations are based on expenses incurred in the most recent six-month period. The fund’s annualized six-month expense ratios for that period are 0.35% for Investor Shares and 0.20% for ETF Shares. The dollar amounts shown as “Expenses Paid” are equal to the annualized expense ratio multiplied by the average account value over the period, multiplied by the number of days in the most recent six-month period, then divided by the number of days in the most recent 12-month period.
27
Note that the expenses shown in the table are meant to highlight and help you compare ongoing costs only and do not reflect transaction costs incurred by the fund for buying and selling securities. Further, the expenses do not include the account service fee described in the prospectus. If such a fee were applied to your account, your costs would be higher. Your fund does not charge transaction fees, such as purchase or redemption fees, nor does it carry a “sales load.”
The calculations assume no shares were bought or sold during the period. Your actual costs may have been higher or lower, depending on the amount of your investment and the timing of any purchases or redemptions.
You can find more information about the fund’s expenses, including annual expense ratios, in the Financial Statements section of this report. For additional information on operating expenses and other shareholder costs, please refer to your fund’s current prospectus.
28
Glossary
Earnings Growth Rate. The average annual rate of growth in earnings over the past five years for the stocks now in a fund.
Equity Exposure. A measure that reflects a fund’s investments in stocks and stock futures. Any holdings in short-term reserves are excluded.
Expense Ratio. The percentage of a fund’s average net assets used to pay its annual administrative and advisory expenses. These expenses directly reduce returns to investors.
Foreign Holdings. The percentage of a fund represented by stocks or depositary receipts of companies based outside the United States.
Inception Date. The date on which the assets of a fund (or one of its share classes) are first invested in accordance with the fund’s investment objective. For funds with a subscription period, the inception date is the day after that period ends. Investment performance is measured from the inception date.
Median Market Cap. An indicator of the size of companies in which a fund invests; the midpoint of market capitalization (market price x shares outstanding) of a fund’s stocks, weighted by the proportion of the fund’s assets invested in each stock. Stocks representing half of the fund’s assets have market capitalizations above the median, and the rest are below it.
Price/Book Ratio. The share price of a stock divided by its net worth, or book value, per share. For a fund, the weighted average price/book ratio of the stocks it holds.
Price/Earnings Ratio. The ratio of a stock’s current price to its per-share earnings over the past year. For a fund, the weighted average P/E of the stocks it holds. P/E is an indicator of market expectations about corporate prospects; the higher the P/E, the greater the expectations for a company’s future growth.
Return on Equity. The annual average rate of return generated by a company during the past five years for each dollar of shareholder’s equity (net income divided by shareholder’s equity). For a fund, the weighted average return on equity for the companies whose stocks it holds.
Short-Term Reserves. The percentage of a fund invested in highly liquid, short-term securities that can be readily converted to cash.
Turnover Rate. An indication of the fund’s trading activity. Funds with high turnover rates incur higher transaction costs and may be more likely to distribute capital gains (which may be taxable to investors). The turnover rate excludes in-kind transactions, which have minimal impact on costs.
Yield. A fund’s 30-day SEC yield is derived using a formula specified by the U.S. Securities and Exchange Commission. Under the formula, data related to the fund’s security holdings in the previous 30 days are used to calculate the fund’s hypothetical net income for that period, which is then annualized and divided by the fund’s estimated average net assets over the calculation period. For the purposes of this calculation, a security’s income is based on its current market yield to maturity (in the case of bonds) or its projected dividend yield (for stocks). Because the SEC yield represents hypothetical annualized income, it will differ—at times significantly—from the fund’s actual experience. As a result, the fund’s income distributions may be higher or lower than implied by the SEC y ield.
29
This page intentionally left blank.
This page intentionally left blank.
The People Who Govern Your Fund
The trustees of your mutual fund are there to see that the fund is operated and managed in your best interests since, as a shareholder, you are a part owner of the fund. Your fund’s trustees also serve on the board of directors of The Vanguard Group, Inc., which is owned by the Vanguard funds and provides services to them on an at-cost basis.
A majority of Vanguard’s board members are independent, meaning that they have no affiliation with Vanguard or the funds they oversee, apart from the sizable personal investments they have made as private individuals. The independent board members have distinguished backgrounds in business, academia, and public service. Each of the trustees and executive officers oversees 156 Vanguard funds.
The following table provides information for each trustee and executive officer of the fund. More information about the trustees is in the Statement of Additional Information, which can be obtained, without charge, by contacting Vanguard at 800-662-7447, or online at www.vanguard.com.
| |
| Interested Trustees | Emerson U. Fullwood |
| | Born 1948. Trustee Since January 2008. Principal |
| John J. Brennan1 | Occupation(s) During the Past Five Years: Executive |
| Born 1954. Trustee Since May 1987. Chairman of | Chief Staff and Marketing Officer for North America |
| the Board. Principal Occupation(s) During the Past | and Corporate Vice President (retired 2008) of Xerox |
| Five Years: Chairman of the Board and Director/Trustee | Corporation (photocopiers and printers); Director of |
| of The Vanguard Group, Inc., and of each of the | SPX Corporation (multi-industry manufacturing), the |
| investment companies served by The Vanguard Group; | United Way of Rochester, the Boy Scouts of America, |
| Chief Executive Officer (1996–2008) and President | Amerigroup Corporation (direct health and medical |
| (1989–2008) of The Vanguard Group and of each of the | insurance carriers), and Monroe Community College |
| investment companies served by The Vanguard Group; | Foundation. |
| Chairman of the Financial Accounting Foundation; | |
| Governor of the Financial Industry Regulatory Authority | Rajiv L. Gupta |
| (FINRA); Director of United Way of Southeastern | Born 1945. Trustee Since December 2001.2 Principal |
| Pennsylvania. | Occupation(s) During the Past Five Years: Chairman |
| | and Chief Executive Officer (retired 2009) and President |
| F. William McNabb III1 | (2006–2008) of Rohm and Haas Co. (chemicals); Board |
| Born 1957. Trustee Since July 2009. Principal | Member of American Chemistry Council; Director of |
| Occupation(s) During the Past Five Years: Director of | Tyco International, Ltd. (diversified manufacturing and |
| The Vanguard Group, Inc., since 2008; Chief Executive | services) and Hewlett-Packard Co. (electronic computer |
| Officer and President of The Vanguard Group and of | manufacturing); Trustee of The Conference Board. |
| each of the investment companies served by The | |
| Vanguard Group since 2008; Director of Vanguard | Amy Gutmann |
| Marketing Corporation; Managing Director of The | Born 1949. Trustee Since June 2006. Principal |
| Vanguard Group (1995–2008). | Occupation(s) During the Past Five Years: President of |
| | the University of Pennsylvania; Christopher H. Browne |
| | Distinguished Professor of Political Science in the School |
| Independent Trustees | of Arts and Sciences with secondary appointments |
| | at the Annenberg School for Communication and the |
| Charles D. Ellis | Graduate School of Education of the University of |
| Born 1937. Trustee Since January 2001. Principal | Pennsylvania; Director of Carnegie Corporation of |
| Occupation(s) During the Past Five Years: Applecore | New York, Schuylkill River Development Corporation, |
| Partners (pro bono ventures in education); Senior | and Greater Philadelphia Chamber of Commerce; |
| Advisor to Greenwich Associates (international business | Trustee of the National Constitution Center. |
| strategy consulting); Successor Trustee of Yale University; | |
| Overseer of the Stern School of Business at New York | |
| University; Trustee of the Whitehead Institute for | |
| Biomedical Research. | |
| | |
| JoAnn Heffernan Heisen | Executive Officers | |
| Born 1950. Trustee Since July 1998. Principal | | |
| Occupation(s) During the Past Five Years: Corporate | Thomas J. Higgins1 | |
| Vice President and Chief Global Diversity Officer since | Born 1957. Chief Financial Officer Since September |
| 2006 (retired 2008) and Member of the Executive | 2008. Principal Occupation(s) During the Past Five |
| Committee (retired 2008) of Johnson & Johnson | Years: Principal of The Vanguard Group, Inc.; Chief |
| (pharmaceuticals/consumer products); Vice President | Financial Officer of each of the investment companies |
| and Chief Information Officer of Johnson & Johnson | served by The Vanguard Group since 2008; Treasurer |
| (1997–2005); Director of the University Medical Center | of each of the investment companies served by The |
| at Princeton and Women’s Research and Education | Vanguard Group (1998–2008). |
| Institute; Member of the Advisory Board of the Maxwell | | |
| School of Citizenship and Public Affairs at Syracuse | | |
| University. | Kathryn J. Hyatt1 | |
| | Born 1955. Treasurer Since November 2008. Principal |
| | Occupation(s) During the Past Five Years: Principal of |
| F. Joseph Loughrey | The Vanguard Group, Inc.; Treasurer of each of the |
| Born 1949. Trustee Since October 2009. Principal | investment companies served by The Vanguard |
| Occupation(s) During the Past Five Years: President and | Group since 2008; Assistant Treasurer of each of the |
| Chief Operating Officer since 2005 (retired 2009) and | investment companies served by The Vanguard Group |
| Vice Chairman of the Board (2008–2009) of Cummins | (1988–2008). | |
| Inc. (industrial machinery); Director of SKF AB (industrial | | |
| machinery), Hillenbrand, Inc. (specialized consumer | | |
| services), Sauer-Danfoss Inc. (machinery), the Lumina | Heidi Stam1 | |
| Foundation for Education, and the Columbus Community | Born 1956. Secretary Since July 2005. Principal |
| Education Coalition; Chairman of the Advisory Council | Occupation(s) During the Past Five Years: Managing |
| for the College of Arts and Letters at the University of | Director of The Vanguard Group, Inc., since 2006; |
| Notre Dame. | General Counsel of The Vanguard Group since 2005; |
| | Secretary of The Vanguard Group and of each of the |
| | investment companies served by The Vanguard Group |
| André F. Perold | since 2005; Director and Senior Vice President of |
| Born 1952. Trustee Since December 2004. Principal | Vanguard Marketing Corporation since 2005; Principal |
| Occupation(s) During the Past Five Years: George Gund | of The Vanguard Group (1997–2006). |
| Professor of Finance and Banking, Harvard Business | | |
| School; Chair of the Investment Committee of HighVista | | |
| Strategies LLC (private investment firm). | Vanguard Senior Management Team |
| |
| Alfred M. Rankin, Jr. | R. Gregory Barton | Michael S. Miller |
| Born 1941. Trustee Since January 1993. Principal | Mortimer J. Buckley | James M. Norris |
| Occupation(s) During the Past Five Years: Chairman, | Kathleen C. Gubanich | Glenn W. Reed |
| President, and Chief Executive Officer of NACCO | Paul A. Heller | George U. Sauter |
| Industries, Inc. (forklift trucks/housewares/lignite); | | |
| Director of Goodrich Corporation (industrial products/ | | |
| aircraft systems and services); Deputy Chairman of | Founder | |
| the Federal Reserve Bank of Cleveland; Trustee of | | |
| University Hospitals of Cleveland, The Cleveland | | |
| Museum of Art, and Case Western Reserve University. | John C. Bogle | |
| | Chairman and Chief Executive Officer, 1974–1996 |
| |
| Peter F. Volanakis | | |
| Born 1955. Trustee Since July 2009. Principal | | |
| Occupation(s) During the Past Five Years: President | | |
| since 2007 and Chief Operating Officer since 2005 | | |
| of Corning Incorporated (communications equipment); | | |
| President of Corning Technologies (2001–2005); Director | | |
| of Corning Incorporated and Dow Corning; Trustee of | | |
| the Corning Incorporated Foundation and the Corning | | |
| Museum of Glass; Overseer of the Amos Tuck School | | |
| of Business Administration at Dartmouth College. | | |
1 These individuals are “interested persons” as defined in the Investment Company Act of 1940.
2 December 2002 for Vanguard Equity Income Fund, Vanguard Growth Equity Fund, the Vanguard Municipal Bond Funds, and the Vanguard State Tax-Exempt Funds.
|  |
| P.O. Box 2600 |
| Valley Forge, PA 19482-2600 |
Connect with Vanguard® > www.vanguard.com
| |
| Fund Information > 800-662-7447 | All comparative mutual fund data are from Lipper Inc. |
| | or Morningstar, Inc., unless otherwise noted. |
| Direct Investor Account Services > 800-662-2739 | |
| | |
| Institutional Investor Services > 800-523-1036 | You can obtain a free copy of Vanguard’s proxy voting |
| | guidelines by visiting our website, www.vanguard.com, |
| Text Telephone for People | and searching for “proxy voting guidelines,” or by |
| With Hearing Impairment > 800-749-7273 | calling Vanguard at 800-662-2739. The guidelines are |
| | also available from the SEC’s website, www.sec.gov. |
| | In addition, you may obtain a free report on how your |
| | fund voted the proxies for securities it owned during |
| This material may be used in conjunction | the 12 months ended June 30. To get the report, visit |
| with the offering of shares of any Vanguard | either www.vanguard.com or www.sec.gov. |
| fund only if preceded or accompanied by | |
| the fund’s current prospectus. | You can review and copy information about your fund |
| | at the SEC’s Public Reference Room in Washington, D.C. |
| “FTSE®” is a trademark jointly owned by the London | To find out more about this public service, call the SEC |
| Stock Exchange plc and The Financial Times Limited | at 202-551-8090. Information about your fund is also |
| and is used by FTSE International Limited under license. | available on the SEC’s website, and you can receive |
| The FTSE High Dividend Yield Index is calculated by | copies of this information, for a fee, by sending a |
| FTSE International Limited. FTSE International Limited | request in either of two ways: via e-mail addressed to |
| does not sponsor, endorse, or promote the fund; is not | publicinfo@sec.gov or via regular mail addressed to the |
| in any way connected to it; and does not accept any | Public Reference Section, Securities and Exchange |
| liability in relation to its issue, operation, and trading. | Commission, Washington, DC 20549-1520. |
| |
| |
| |
| |
| | © 2009 The Vanguard Group, Inc. |
| | All rights reserved. |
| | Vanguard Marketing Corporation, Distributor. |
| | Q6230 122009 |
Item 2: Code of Ethics. The Registrant has adopted a code of ethics that applies to the Registrant’s principal executive officer, principal financial officer, principal accounting officer or controller or persons performing similar functions. The Code of Ethics was amended during the reporting period covered by this report to make certain technical, non-material changes.
Item 3: Audit Committee Financial Expert. The following members of the Audit Committee have been determined by the Registrant’s Board of Trustees to be Audit Committee Financial Experts serving on its Audit Committee, and to be independent: Charles D. Ellis, Rajiv L. Gupta, JoAnn Heffernan Heisen, André F. Perold, and Alfred M. Rankin, Jr.
Item 4: Principal Accountant Fees and Services.
(a) Audit Fees.
Audit Fees of the Registrant
Fiscal Year Ended October 31, 2009: $100,000
Fiscal Year Ended October 31, 2008: $100,000
Aggregate Audit Fees of Registered Investment Companies in the Vanguard Group.
Fiscal Year Ended October 31, 2009: $3,354,640
Fiscal Year Ended October 31, 2008: $3,055,590
(b) Audit-Related Fees.
Fiscal Year Ended October 31, 2009: $876,210
Fiscal Year Ended October 31, 2008: $626,240
Includes fees billed in connection with assurance and related services provided to the Registrant, The Vanguard Group, Inc., Vanguard Marketing Corporation, and other registered investment companies in the Vanguard Group.
(c) Tax Fees.
Fiscal Year Ended October 31, 2009: $423,070
Fiscal Year Ended October 31, 2008: $230,400
Includes fees billed in connection with tax compliance, planning and advice services provided to the Registrant, The Vanguard Group, Inc., Vanguard Marketing Corporation, and other registered investment companies in the Vanguard Group and related to income and excise taxes.
(d) All Other Fees.
Fiscal Year Ended October 31, 2009: $0
Fiscal Year Ended October 31, 2008: $0
Includes fees billed for services related to risk management and privacy matters. Services were provided to the Registrant, The Vanguard Group, Inc., Vanguard Marketing Corporation, and other registered investment companies in the Vanguard Group.
(e) (1) Pre-Approval Policies. The policy of the Registrant’s Audit Committee is to consider and, if appropriate, approve before the principal accountant is engaged for such services, all specific audit and non-audit services provided to: (1) the Registrant; (2) The Vanguard Group, Inc.; (3) other entities controlled by The Vanguard Group, Inc. that provide ongoing services to the Registrant; and (4) other registered investment companies in the Vanguard Group. In making a determination, the Audit Committee considers whether the services are consistent with maintaining the principal accountant’s independence.
In the event of a contingency situation in which the principal accountant is needed to provide services in between scheduled Audit Committee meetings, the Chairman of the Audit Committee would be called on to consider and, if appropriate, pre-approve audit or permitted non-audit services in an amount sufficient to complete services through the next Audit Committee meeting, and to determine if such services would be consistent with maintaining the accountant’s independence. At the next scheduled Audit Committee meeting, services and fees would be presented to the Audit Committee for formal consideration, and, if appropriate, approval by the entire Audit Committee. The Audit Committee would again consider whether such services and fees are consistent with maintaining the principal accountant’s independence.
The Registrant’s Audit Committee is informed at least annually of all audit and non-audit services provided by the principal accountant to the Vanguard complex, whether such services are provided to: (1) the Registrant; (2) The Vanguard Group, Inc.; (3) other entities controlled by The Vanguard Group, Inc. that provide ongoing services to the Registrant; or (4) other registered investment companies in the Vanguard Group.
(2) No percentage of the principal accountant’s fees or services were approved pursuant to the waiver provision of paragraph (c)(7)(i)(C) of Rule 2-01 of Regulation S-X.
(f) For the most recent fiscal year, over 50% of the hours worked under the principal accountant’s engagement were not performed by persons other than full-time, permanent employees of the principal accountant.
(g) Aggregate Non-Audit Fees.
Fiscal Year Ended October 31, 2009: $423,070
Fiscal Year Ended October 31, 2008: $230,400
Includes fees billed for non-audit services provided to the Registrant, The Vanguard Group, Inc., Vanguard Marketing Corporation, and other registered investment companies in the Vanguard Group.
(h) For the most recent fiscal year, the Audit Committee has determined that the provision of all non-audit services was consistent with maintaining the principal accountant’s independence.
Item 5: Not Applicable.
Item 6: Not Applicable.
Item 7: Not Applicable.
Item 8: Not Applicable.
Item 9: Not Applicable.
Item 10: Not Applicable.
Item 11: Controls and Procedures.
(a) Disclosure Controls and Procedures. The Principal Executive and Financial Officers concluded that the Registrant's Disclosure Controls and Procedures are effective based on their evaluation of the Disclosure Controls and Procedures as of a date within 90 days of the filing date of this report.
(b) Internal Control Over Financial Reporting. There were no significant changes in Registrant’s Internal Control Over Financial Reporting or in other factors that could significantly affect this control subsequent to the date of the evaluation, including any corrective actions with regard to significant deficiencies and material weaknesses.
Item 12: Exhibits.
(a) Code of Ethics.
(b) Certifications.
Pursuant to the requirements of the Securities Exchange Act of 1934 and the Investment Company Act of 1940, the registrant has duly caused this report to be signed on its behalf by the undersigned, thereunto duly authorized.
| |
| | VANGUARD WHITEHALL FUNDS |
| |
| By: | /s/ F. WILLIAM MCNABB III* |
| | F. WILLIAM MCNABB III |
| | CHIEF EXECUTIVE OFFICER |
| |
| Date: December 18, 2009 |
Pursuant to the requirements of the Securities Exchange Act of 1934 and the Investment Company Act of 1940, this report has been signed below by the following persons on behalf of the registrant and in the capacities and on the dates indicated.
| |
| | VANGUARD WHITEHALL FUNDS |
| |
| By: | /s/ F. WILLIAM MCNABB III* |
| | F. WILLIAM MCNABB III |
| | CHIEF EXECUTIVE OFFICER |
| |
| Date: December 18, 2009 |
| |
| | VANGUARD WHITEHALL FUNDS |
| |
| By: | /s/ THOMAS J. HIGGINS* |
| | THOMAS J. HIGGINS |
| | CHIEF FINANCIAL OFFICER |
| |
| Date: December 18, 2009 |
*By: /s/ Heidi Stam
Heidi Stam, pursuant to a Power of Attorney filed on July 24, 2009, see File Number 2-88373,
and a Power of Attorney filed on October 16, 2009, see File Number 2-52698,
both Incorporated by Reference.