UNITED STATES
SECURITIES AND EXCHANGE COMMISSION
Washington, D.C. 20549
FORM N-CSR
CERTIFIED SHAREHOLDER REPORT
OF
REGISTERED MANAGEMENT INVESTMENT COMPANIES
Investment Company Act file number: 811-07443
Name of Registrant: Vanguard Whitehall Funds
Address of Registrant:
P.O. Box 2600
Valley Forge, PA 19482
Name and address of agent for service:
Heidi Stam, Esquire
P.O. Box 876
Valley Forge, PA
Registrant’s telephone number, including area code: (610) 669-1000
Date of fiscal year end: October 31
Date of reporting period: November 1, 2009 – October 31, 2010
Item 1: Reports to Shareholders
 |
|
| Vanguard Selected Value Fund |
| Annual Report |
|
|
| October 31, 2010 |
 |
> Vanguard Selected Value Fund returned nearly 22% for the 12 months ended October 31, 2010, but fell short of its comparative standards.
> All sectors in the fund’s portfolio posted strong gains, with consumer discretionary stocks leading the way.
> The fund’s long-term performance remains ahead of the comparable return of the Russell Midcap Value Index and the average result for peer funds.
| |
| Contents | |
| Your Fund’s Total Returns. | 1 |
| Chairman’s Letter. | 2 |
| Advisors’ Report. | 7 |
| Fund Profile. | 10 |
| Performance Summary. | 11 |
| Financial Statements. | 13 |
| Your Fund’s After-Tax Returns. | 23 |
| About Your Fund’s Expenses. | 24 |
| Glossary. | 26 |
Please note: The opinions expressed in this report are just that—informed opinions. They should not be considered promises or advice. Also, please keep in mind that the information and opinions cover the period through the date on the front of this report. Of course, the risks of investing in your fund are spelled out in the prospectus.
See the Glossary for definitions of investment terms used in this report.
Cover photograph: Jean Maher.
Your Fund’s Total Returns
Fiscal Year Ended October 31, 2010
| |
| | Total |
| | Returns |
| Vanguard Selected Value Fund | 21.75% |
| Russell Midcap Value Index | 27.49 |
| Mid-Cap Value Funds Average | 23.06 |
| Mid-Cap Value Funds Average: Derived from data provided by Lipper Inc. |
Your Fund’s Performance at a Glance
October 31, 2009, Through October 31, 2010
| | | | |
| | | | Distributions Per Share |
| | Starting | Ending | Income | Capital |
| | Share Price | Share Price | Dividends | Gains |
| Vanguard Selected Value Fund | $14.78 | $17.73 | $0.241 | $0.000 |
1

Chairman’s Letter
Dear Shareholder,
Vanguard Selected Value Fund returned 21.75% for the 12 months ended October 31, 2010, coming close to matching last year’s strong performance. However, the fund lagged the 27.49% return of its index benchmark and the 23.06% average return of peer funds for the period.
The advisors’ selections in the consumer discretionary sector had the largest role in the fund’s return. However, in other sectors the advisors favored stocks that didn’t keep pace with those that the market deemed to have better prospects, particularly in the health care and information technology sectors. Consequently, the fund didn’t gain as much as the Russell Midcap Value Index or the average return of peer funds.
If you hold shares in a taxable account, you may wish to review the information about after-tax returns for the fiscal year that appears later in this report.
Stock market performance was better than it felt
Global stock prices rallied at the start of the period, but struggled through the spring and summer, weighed down by Europe’s sovereign debt crisis and the slow pace of economic recovery in the United States. In the fiscal year’s final months, the mood
2
turned. Stock prices climbed on continued strength in corporate earnings. In the United States, stocks also seemed to get a boost from the Federal Reserve Board’s hints that it would try to stimulate the economy with a second round of U.S. Treasury bond purchases. (In early November, the Fed announced that it would buy as much as $600 billion in Treasuries.)
For the 12 months, the broad U.S. stock market returned about 19%, a performance that was better than it felt in a year of ups and downs. Small-capitalization stocks did even better. International stocks returned about 13% on the strength of a powerful rally in emerging markets and solid single-digit gains in developed markets in Europe and the Pacific region.
Despite shrinking yields, bonds attracted investor dollars
Although fixed income yields have fallen to generational lows, investors continued to bid up bond prices. The broad U.S. bond market produced a 12-month return of about 8% as the yield of the 10-year U.S. Treasury note fell from 3.39% at the start of the period to 2.61% at the close. Tax-exempt municipal bonds also rallied. Bond prices and yields move in opposite directions, of course, so abundant returns built on rising prices could mean leaner pickings in the years ahead.
The yields of money market securities hovered near 0%, consistent with the Federal Reserve Board’s target for short-term rates.
Market Barometer
| | | |
| | | Average Annual Total Returns |
| | | Periods Ended October 31, 2010 |
| | One | Three | Five |
| | Year | Years | Years |
| Stocks | | | |
| Russell 1000 Index (Large-caps) | 17.67% | -6.14% | 1.99% |
| Russell 2000 Index (Small-caps) | 26.58 | -3.91 | 3.07 |
| Dow Jones U.S. Total Stock Market Index | 19.04 | -5.55 | 2.52 |
| MSCI All Country World Index ex USA (International) | 13.08 | -7.62 | 6.21 |
| |
| Bonds | | | |
| Barclays Capital U.S. Aggregate Bond Index (Broad | | | |
| taxable market) | 8.01% | 7.23% | 6.45% |
| Barclays Capital Municipal Bond Index (Broad | | | |
| tax-exempt market) | 7.78 | 5.79 | 5.20 |
| Citigroup Three-Month U.S. Treasury Bill Index | 0.12 | 0.89 | 2.41 |
| |
| CPI | | | |
| Consumer Price Index | 1.17% | 1.54% | 1.89% |
3
The fund didn’t capture all of the market’s gains
In seeking midsized U.S. companies that have the best potential to provide investors with long-term capital appreciation and dividend income, the fund’s two advisors lean toward stable firms with strong fundamentals. Although the fund’s portfolio performed well on an absolute basis, its relative performance lagged as mid-cap investors preferred companies that were less financially sound but were viewed as having more promise.
The fund achieved nearly all of its advance in the first six months of the period, gave back a portion in the late spring and summer, then regained that lost ground by the end of October. As occurred in the previous fiscal year, every stock sector in the fund advanced. In fact, every sector’s percentage gains were in double digits. Also as in the previous year, the two largest sectors by weighting—financials and consumer discretionary—accounted for more than half of the fund’s return. This time, however, the advisors’ selections outperformed the index in only one of the two sectors rather than both, as before.
In the consumer discretionary sector, the advisors’ selections among stocks of department stores, apparel stores, and household appliance makers provided a measure of outperformance.
Expense Ratios
Your Fund Compared With Its Peer Group
| | |
| | | Peer Group |
| | Fund | Average |
| Selected Value Fund | 0.52% | 1.42% |
The fund expense ratio shown is from the prospectus dated February 25, 2010, and represents estimated costs for the current fiscal year. For the fiscal year ended October 31, 2010, the fund’s expense ratio was 0.47%. The peer-group expense ratio is derived from data provided by Lipper Inc. and captures information through year-end 2009.
Peer group: Mid-Cap Value Funds.
4
However, the fund’s financial holdings trailed the performance of the financial stocks in the benchmark. One key reason: Investors bid up the prices of real estate investment trusts, while the advisors deemphasized REITs and mostly missed out on their sizable gains. On the plus side, the fund’s holdings in midsize banks and asset managers did particularly well.
The industrial sector also contributed notably to the fund’s performance. Relative performance suffered most in the health care arena, where the advisors’ selections gained 13% but the benchmark’s stocks advanced about twice as much. The fund’s information technology holdings also trailed the performance of those in the index’s IT segment.
You can find more information on the fund’s positioning and performance during the year in the Advisors’ Report that follows this letter.
Over the past ten years, the fund’s track record is solid
Although the Selected Value Fund underperformed the average return of peer funds in the 2010 fiscal year, the fund’s long-term performance record continues to outpace the competition. For the ten years ended October 31, the fund’s 8.29% average annual return not only topped its benchmark’s 8.00% return but outdistanced the 6.58% average return from similar funds.
Total Returns
Ten Years Ended October 31, 2010
| |
| | Average |
| | Annual Return |
| Selected Value Fund | 8.29% |
| Russell Midcap Value Index | 8.00 |
| Mid-Cap Value Funds Average | 6.58 |
| Mid-Cap Value Funds Average: Derived from data provided by Lipper Inc. |
The figures shown represent past performance, which is not a guarantee of future results. (Current performance may be lower or higher than the performance data cited. For performance data current to the most recent month-end, visit our website at vanguard.com/performance.) Note, too, that both investment returns and principal value can fluctuate widely, so an investor’s shares, when sold, could be worth more or less than their original cost.
5
The past decade included two major bear markets that limited the Dow Jones U.S. Total Stock Market Index to an average return of about 1% per year. The fund’s much stronger performance over the ten years should be kept in perspective. The advisors’ focus on a relatively small number of out-of-favor, medium-sized companies can result in noticeable underperformance as well as superior results from time to time. In other words, active stock investing in one segment of the market means accepting higher risk along with the potential for higher returns. Fortunately, your advisors have had the advantages of their skill, their patience, and Vanguard’s low operating costs to aid their pursuit of market-beating returns.
During volatile markets, stick to a time-tested approach
The volatility of recent years has certainly tested the fortitude of long-term investors. Although the markets gave more than they took in the past year, periodic bouts of volatility can be expected as the global economy mends from the financial crisis and adjusts to new forces.
But when change seems to accelerate around us, it’s crucial to remember what doesn’t change—and for investors, that means sticking with time-tested principles, notably diversification across and within asset classes, long-term perspective, and low costs. These practices have proven to be effective over longer periods of time. Investors who followed this approach and didn’t alter their basic strategy amid the dramatic swings of recent years were partly insulated from the deepest losses and participated in the recovery.
Whether returns continue to be positive or not, the Selected Value Fund, with its disciplined focus on out-of-favor midsized companies and its low costs, can play a useful role as part of a well-diversified portfolio that also includes a variety of other large- and small-cap stock funds, bond funds, and short-term investments. This balanced approach has proven its mettle over time.
As always, we appreciate your confidence in Vanguard.
Sincerely,

F. William McNabb III
Chairman and Chief Executive Officer
November 15, 2010
6
Advisors’ Report
For the fiscal year ended October 31, 2010, Vanguard Selected Value Fund returned 21.75%. Your fund is managed by two independent advisors. This provides exposure to distinct, yet complementary, investment approaches, enhancing the fund’s diversification. It is not uncommon for different advisors to have different views about individual securities or the broader investment environment.
The advisors, the percentage and amount of fund assets each manages, and a brief description of their investment strategies are presented in the table below. The advisors have also prepared a discussion of the investment environment that existed during the fiscal year and of how portfolio positioning reflects this assessment. These comments were prepared on November 19, 2010.
Vanguard Selected Value Fund Investment Advisors
| | | |
| | Fund Assets Managed | |
| Investment Advisor | % | $ Million | Investment Strategy |
| Barrow, Hanley, Mewhinney & | 73 | 2,654 | Conducts fundamental research on individual stocks |
| Strauss, LLC | | | exhibiting traditional value characteristics: |
| | | | price/earnings and price/book ratios below the market |
| | | | average and dividend yields above the market average. |
| Donald Smith & Co., Inc. | 24 | 889 | Conducts fundamental research on the lowest |
| | | | price-to-tangible-book-value companies. Research |
| | | | focuses on underlying quality of book value and assets, |
| | | | and on long-term earnings potential. |
| Cash Investments | 3 | 96 | These short-term reserves are invested by Vanguard in |
| | | | equity index products to simulate investment in stocks. |
| | | | Each advisor may also maintain a modest cash |
| | | | position. |
7
Barrow, Hanley, Mewhinney & Strauss, LLC
Portfolio Managers: James P. Barrow, Executive Director
Mark Giambrone, Managing Director
The past year in the market has seen a strong, although volatile, recovery with substantial returns. Unfortunately, the year was dominated by what we call a “low-quality rally,” led by companies without meaningful earnings and often without dividends. Therefore, while absolute returns have been satisfactory, we have lagged our benchmark. Fortunately, toward the end of the fiscal year, the market began to focus more on fundamentals and lifted our portfolio in advance of the recent market climb. As we enter the new fiscal year, we are encouraged to see much of the political and macroeconomic focus subsiding and a focus on fundamentals increasing. The portfolio is well positioned with quality companies that have good earnings and cash-flow prospects, pay an above-market yield, and have below-market valuations.
Relative to our benchmark index, we continue to be overweighted in the industrial, consumer discretionary, and health care sectors—all areas that have tremendous valuation potential and should see earnings stabilize or improve as the economy mends. Our overweighting in health care was the largest detractor to performance during the fiscal year because of concerns that continue to surround the health care reform legislation. As these concerns are addressed over time, we expect valuations to improve. Although we have been underweighted in financials, we continue to find some opportunities there and our weighting is steadily increasing.
We also are finding unique opportunities in the information technology area, and have been adding to our stake in it. Xerox gives us exposure to a cheap technology company, with predictable cash flow, that now offers an improved growth profile and more diversified profit stream owing to the acquisition of Affiliated Computer Services, a business outsourcing provider. In Molex we own an attractively valued global manufacturer of electronic connectors, which are necessary for thousands of products in various end-markets such as consumer electronics, the automotive industry, telecommunications, and industrial companies.
We remain underweighted in materials, telecommunication services, consumer staples, and utilities. These are areas in which the current economic environment does not seem to favor valuations, or in which company fundamentals do not match our investment parameters.
8
Donald Smith & Co., Inc.
Portfolio Managers: Donald G. Smith, Chief Investment Officer
Richard L. Greenberg, CFA, Senior Vice President
Our portfolio at the end of October 2010 continued to be concentrated in low price-to-tangible-book-value stocks with attractive long-term earnings potential. In aggregate, the portfolio’s holdings were selling at 86% of tangible book value and 8.7 times our estimate of “normalized earnings.” In contrast, the S&P 500 Index sells at more than 400% of tangible book value and about 14 times normalized earnings.
During the year we maintained a substantial cash position, which weighed on our portfolio’s results in a strongly rising market. In general, companies that would benefit from a recovering economy, such as paper producers, retailers, and airlines, did well. With interest rates falling, insurance companies and utilities also outperformed. Top performers among our holdings included Domtar, Dillard’s, and Semiconductor Manufacturing International. Companies in industries suffering from overcapacity—RRI Energy, Overseas Shipholding Group, and Tesoro—declined most over the past year.
During the period, we initiated positions in Constellation Energy, Everest Re, Hyatt, Ingram Micro, JetBlue, Montpelier Re, and Noble Corporation. All of these stocks were purchased below tangible book value. We also increased our existing holdings in Air France, American National Insurance, Yamana Gold, CNA Financial, Micron Technology, RRI Energy, and Tesoro, and scaled back holdings in Dillard’s, Domtar, NV Energy, Pinnacle West, Semiconductor Manufacturing, and Unum. We eliminated positions in five stocks, all of which had appreciated substantially: Aspen Insurance Holdings, Hyatt (recently acquired, as noted above), Royal Caribbean Cruises, Southwest Airlines, and Validus Holdings.
At the fiscal year-end, our two largest industry weightings were insurance and technology. The insurance companies, all of which sell below book value, have seen strong growth in their equity as investment portfolio values have risen with declining interest rates. Some of them (Everest Re, Unum, Montpelier Re) have been aggressively buying back stock below book value. The two largest technology holdings, Micron and Ingram Micro, have generated strong cash flow over the past year that will enable them to either grow more rapidly in the future, reduce debt, or buy back stock. Other large positions include a gold company (Yamana), airlines (Air France and JetBlue), a retailer (Dillard’s), a refiner (Tesoro), and an electricity provider (Constellation).
9
Selected Value Fund
Fund Profile
As of October 31, 2010
| | | |
| Portfolio Characteristics | | |
| | | Russell | DJ |
| | | Midcap | U.S. Total |
| | | Value | Market |
| | Fund | Index | Index |
| Number of Stocks | 67 | 541 | 3,920 |
| Median Market Cap | $7.5B | $6.3B | $28.5B |
| Price/Earnings Ratio | 13.3x | 19.1x | 16.9x |
| Price/Book Ratio | 1.4x | 1.5x | 2.2x |
| Return on Equity | 13.3% | 10.9% | 19.2% |
| Earnings Growth Rate | -3.2% | 0.6% | 6.5% |
| Dividend Yield | 2.1% | 2.1% | 1.8% |
| Foreign Holdings | 5.9% | 0.0% | 0.0% |
| Turnover Rate | 22% | — | — |
| Ticker Symbol | VASVX | — | — |
| Expense Ratio1 | 0.52% | — | — |
| 30-Day SEC Yield | 1.27% | — | — |
| Short-Term Reserves | 7.8% | — | — |
| |
| Sector Diversification (% of equity exposure) |
| | | Russell | DJ |
| | | Midcap | U.S. Total |
| | | Value | Market |
| | Fund | Index | Index |
| Consumer | | | |
| Discretionary | 18.8% | 10.9% | 11.8% |
| Consumer Staples | 5.1 | 7.1 | 10.0 |
| Energy | 8.6 | 10.5 | 9.8 |
| Financials | 22.7 | 29.4 | 16.3 |
| Health Care | 9.0 | 5.3 | 11.0 |
| Industrials | 14.5 | 10.2 | 11.1 |
| Information | | | |
| Technology | 9.2 | 6.6 | 19.4 |
| Materials | 2.9 | 5.2 | 4.4 |
| Telecommunication | | | |
| Services | 0.1 | 2.1 | 2.8 |
| Utilities | 9.1 | 12.7 | 3.4 |
| | | |
| Volatility Measures | | | |
| | Russell | | |
| | Midcap | U.S. Total |
| | Value | | Market |
| | Index | | Index |
| R-Squared | 0.95 | | 0. |
| Beta | 0.84 | | 1. |
| These measures show the degree and timing of the fund’s fluctuations compared with the indexes over 36 months. |
| |
| |
| Ten Largest Holdings (% of total net assets) |
| Goodrich Corp. | Aerospace & | | |
| | Defense | | 2.5% |
| Stanley Black & Decker | Household | | |
| Inc. | Appliances | | 2.3 |
| Yamana Gold Inc. | Gold | | 2.2 |
| Murphy Oil Corp. | Integrated Oil & | |
| | Gas | | 2.2 |
| Newell Rubbermaid Inc. | Housewares & | |
| | Specialties | | 2.1 |
| Coventry Health Care | Managed Health | |
| Inc. | Care | | 2.1 |
| Family Dollar Stores Inc. | General | | |
| | Merchandise Stores | 2.0 |
| Ryder System Inc. | Trucking | | 2.0 |
| Willis Group Holdings plc | Insurance Brokers | 1.9 |
| CNA Financial Corp. | Property & Casualty | |
| | Insurance | | 1.9 |
| Top Ten | | | 21.2 |
| The holdings listed exclude any temporary cash investments and equity index products. |
Investment Focus
1 The expense ratio shown is from the prospectus dated February 25, 2010, and represents estimated costs for the current fiscal year. For the fiscal year ended October 31, 2010, the expense ratio was 0.47%.
10
Selected Value Fund
Performance Summary
All of the returns in this report represent past performance, which is not a guarantee of future results that may be achieved by the fund. (Current performance may be lower or higher than the performance data cited. For performance data current to the most recent month-end, visit our website at vanguard.com/performance.) Note, too, that both investment returns and principal value can fluctuate widely, so an investor’s shares, when sold, could be worth more or less than their original cost. The returns shown do not reflect taxes that a shareholder would pay on fund distributions or on the sale of fund shares.
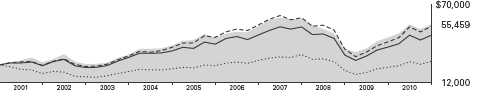
Cumulative Performance: October 31, 2000, Through October 31, 2010
Initial Investment of $25,000
| | | | |
| | Average Annual Total Returns | |
| | Periods Ended October 31, 2010 | |
| | | | | Final Value |
| | One | Five | Ten | of a $25,000 |
| | Year | Years | Years | Investment |
| Selected Value Fund | 21.75% | 4.11% | 8.29% | $55,459 |
| Dow Jones U.S. Total Stock Market | | | | |
| Index | 19.04 | 2.52 | 1.02 | 27,683 |
| Russell Midcap Value Index | 27.49 | 3.38 | 8.00 | 53,964 |
| Mid-Cap Value Funds Average | 23.06 | 3.09 | 6.58 | 47,293 |
Mid-Cap Value Funds Average: Derived from data provided by Lipper Inc.
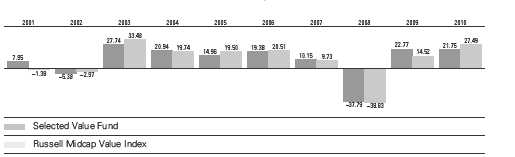
Fiscal-Year Total Returns (%): October 31, 2000, Through October 31, 2010
Vanguard fund returns do not reflect the 1% fee on redemptions of shares held for less than one year.
See Financial Highlights for dividend and capital gains information.
11
Selected Value Fund
Average Annual Total Returns: Periods Ended September 30, 2010
This table presents average annual total returns through the latest calendar quarter—rather than through the end of the fiscal period. Securities and Exchange Commission rules require that we provide this information.
| | | | |
| | Inception | One | Five | Ten |
| | Date | Year | Years | Years |
| Selected Value Fund | 2/15/1996 | 14.44% | 2.66% | 8.30% |
Vanguard fund returns do not reflect the 1% fee on redemptions of shares held for less than one year.
12
Selected Value Fund
Financial Statements
Statement of Net Assets
As of October 31, 2010
The fund reports a complete list of its holdings in regulatory filings four times in each fiscal year, at the quarter-ends. For the second and fourth fiscal quarters, the lists appear in the fund’s semiannual and annual reports to shareholders. For the first and third fiscal quarters, the fund files the lists with the Securities and Exchange Commission on Form N-Q. Shareholders can look up the fund’s Forms N-Q on the SEC’s website at sec.gov. Forms N-Q may also be reviewed and copied at the SEC’s Public Reference Room (see the back cover of this report for further information).
| | | |
| | | | Market |
| | | | Value |
| | | Shares | ($000) |
| Common Stocks (89.5%)1 | | |
| Consumer Discretionary (17.1%) | |
| | Stanley Black & | | |
| | Decker Inc. | 1,349,800 | 83,647 |
| | Newell Rubbermaid Inc. | 4,354,400 | 76,855 |
| | Family Dollar Stores Inc. | 1,560,300 | 72,039 |
| | Limited Brands Inc. | 2,342,900 | 68,858 |
| * | Royal Caribbean | | |
| | Cruises Ltd. | 1,693,700 | 66,969 |
| * | Hanesbrands Inc. | 2,447,500 | 60,698 |
| | Dillard’s Inc. Class A | 2,301,900 | 58,721 |
| | Advance Auto Parts Inc. | 872,600 | 56,702 |
| | International Game | | |
| | Technology | 3,507,000 | 54,674 |
| | Service Corp. | | |
| | International | 2,627,000 | 21,752 |
| | | | 620,915 |
| Consumer Staples (4.4%) | | |
| | Reynolds American Inc. | 839,000 | 54,451 |
| | Lorillard Inc. | 633,800 | 54,089 |
| | Sysco Corp. | 1,741,700 | 51,310 |
| | | | 159,850 |
| Energy (7.6%) | | |
| | Murphy Oil Corp. | 1,231,800 | 80,264 |
| *,^ | Seadrill Ltd. | 1,759,300 | 53,536 |
| | Tesoro Corp. | 3,421,000 | 44,336 |
| | Spectra Energy Corp. | 1,664,900 | 39,575 |
| | El Paso Corp. | 2,777,400 | 36,828 |
| | Overseas Shipholding | | |
| | Group Inc. | 472,900 | 15,809 |
| | Noble Corp. | 174,597 | 6,029 |
| | | | 276,377 |
| | | |
| | | | Market |
| | | | Value |
| | | Shares | ($000) |
| Financials (20.4%) | | |
| | Willis Group Holdings plc | 2,194,400 | 69,782 |
| * | CNA Financial Corp. | 2,513,182 | 69,665 |
| | Capital One | | |
| | Financial Corp. | 1,793,900 | 66,859 |
| | PNC Financial | | |
| | Services Group Inc. | 1,174,312 | 63,295 |
| * | SLM Corp. | 5,239,600 | 62,351 |
| | New York Community | | |
| | Bancorp Inc. | 3,526,600 | 59,705 |
| | Ameriprise Financial Inc. | 1,106,400 | 57,190 |
| | Fifth Third Bancorp | 4,240,400 | 53,259 |
| | Annaly Capital | | |
| | Management Inc. | 2,433,800 | 43,103 |
| | XL Group PLC Class A | 1,997,200 | 42,241 |
| | Axis Capital Holdings Ltd. | 1,188,200 | 40,411 |
| | Chubb Corp. | 682,200 | 39,581 |
| | Unum Group | 1,324,490 | 29,695 |
| | Everest Re Group Ltd. | 300,000 | 25,284 |
| | American National | | |
| | Insurance Co. | 164,858 | 12,932 |
| | Fidelity National | | |
| | Financial Inc. Class A | 347,100 | 4,648 |
| | Montpelier Re | | |
| | Holdings Ltd. | 245,863 | 4,504 |
| | | | 744,505 |
| Health Care (8.0%) | | |
| * | Coventry Health Care Inc. | 3,190,700 | 74,726 |
| | Omnicare Inc. | 2,513,600 | 60,628 |
| | Cardinal Health Inc. | 1,679,100 | 58,248 |
| | CIGNA Corp. | 1,510,700 | 53,161 |
| | Quest Diagnostics Inc. | 920,000 | 45,209 |
| | | | 291,972 |
13
Selected Value Fund
| | | | |
| | | | | Market |
| | | | | Value |
| | | | Shares | ($000) |
| Industrials (13.1%) | | | |
| | Goodrich Corp. | | 1,088,400 | 89,325 |
| | Ryder System Inc. | | 1,638,500 | 71,684 |
| | Eaton Corp. | | 776,100 | 68,941 |
| * | Air France-KLM ADR | 3,744,954 | 68,402 |
| | L-3 Communications | | |
| | Holdings Inc. | | 691,800 | 49,941 |
| | ITT Corp. | | 972,000 | 45,869 |
| | SPX Corp. | | 571,000 | 38,291 |
| | Dun & Bradstreet Corp. | 337,900 | 25,143 |
| * | JetBlue Airways Corp. | 2,715,765 | 18,956 |
| | | | | 476,552 |
| Information Technology (8.0%) | |
| * | Micron Technology Inc. | 7,729,916 | 63,926 |
| | Molex Inc. | | 3,062,300 | 62,165 |
| * | Ingram Micro Inc. | | 3,290,648 | 58,113 |
| | Xerox Corp. | | 3,445,600 | 40,313 |
| | Computer Sciences Corp. | 784,200 | 38,465 |
| * | Flextronics | | | |
| | International Ltd. | | 1,978,613 | 14,167 |
| * | Semiconductor | | | |
| | Manufacturing International | |
| | Corp. ADR | | 3,062,588 | 12,618 |
| | | | | 289,767 |
| Materials (2.6%) | | | |
| | Yamana Gold Inc. | | 7,338,300 | 80,648 |
| | Domtar Corp. | | 185,279 | 14,704 |
| | | | | 95,352 |
| Utilities (8.3%) | | | |
| | CenterPoint Energy Inc. | 3,839,300 | 63,579 |
| | Pinnacle West | | | |
| | Capital Corp. | | 1,523,259 | 62,697 |
| | Xcel Energy Inc. | | 2,535,300 | 60,492 |
| | MDU Resources | | | |
| | Group Inc. | | 2,962,300 | 59,039 |
| | Constellation Energy | | |
| | Group Inc. | | 1,151,737 | 34,829 |
| * | RRI Energy Inc. | | 3,095,218 | 11,638 |
| | NV Energy Inc. | | 668,340 | 9,129 |
| | | | | 301,403 |
| Total Common Stocks | | | |
| (Cost $2,716,595) | | | 3,256,693 |
| Temporary Cash Investments (10.6%)1 | |
| Money Market Fund (10.2%) | | |
| 2,3 | Vanguard Market Liquidity | | |
| | Fund, 0.237% | 370,202,509 | 370,203 |
| | | |
| | | Face | Market |
| | | Amount | Value |
| | | ($000) | ($000) |
| U.S. Government and Agency Obligations (0.4%) |
| 4,5 | Fannie Mae | | |
| | Discount Notes, | | |
| | 0.200%, 12/22/10 | 500 | 500 |
| 4 | Fannie Mae | | |
| | Discount Notes, | | |
| | 0.180%, 12/29/10 | 1,000 | 1,000 |
| 4,5 | Fannie Mae | | |
| | Discount Notes, | | |
| | 0.341%, 3/1/11 | 10,000 | 9,993 |
| 4,5 | Freddie Mac | | |
| | Discount Notes, | | |
| | 0.250%, 3/21/11 | 3,000 | 2,997 |
| 4,5 | Freddie Mac | | |
| | Discount Notes, | | |
| | 0.281%, 6/21/11 | 2,500 | 2,496 |
| | | | 16,986 |
| Total Temporary Cash Investments | |
| (Cost $387,183) | | 387,189 |
| Total Investments (100.1%) | | |
| (Cost $3,103,778) | | 3,643,882 |
| Other Assets and Liabilities (-0.1%) | |
| Other Assets | | 35,941 |
| Liabilities3 | | (40,591) |
| | | | (4,650) |
| Net Assets (100%) | | |
| Applicable to 205,256,066 outstanding | |
| $.001 par value shares of beneficial | |
| interest (unlimited authorization) | 3,639,232 |
| Net Asset Value Per Share | | $17.73 |
14
Selected Value Fund
At October 31, 2010, net assets consisted of:
| |
| | Amount |
| | ($000) |
| Paid-in Capital | 3,532,748 |
| Undistributed Net | |
| Investment Income | 33,329 |
| Accumulated Net | |
| Realized Losses | (470,944) |
| Unrealized Appreciation | |
| (Depreciation) | |
| Investment Securities | 540,104 |
| Futures Contracts | 3,995 |
| Net Assets | 3,639,232 |
See Note A in Notes to Financial Statements.
* Non-income-producing security.
^ Part of security position is on loan to broker-dealers. The total value of securities on loan is $7,769,000.
1 The fund invests a portion of its cash reserves in equity markets through the use of index futures contracts. After giving effect to futures investments, the fund’s effective common stock and temporary cash investment positions represent 92.0% and 8.1%, respectively, of net assets.
2 Affiliated money market fund available only to Vanguard funds and certain trusts and accounts managed by Vanguard. Rate shown is the 7-day yield.
3 Includes $7,914,000 of collateral received for securities on loan.
4 The issuer operates under a congressional charter; its securities are not backed by the full faith and credit of the U.S. government.
5 Securities with a value of $15,986,000 have been segregated as initial margin for open futures contracts.
ADR—American Depositary Receipt.
See accompanying Notes, which are an integral part of the Financial Statements.
15
Selected Value Fund
Statement of Operations
| |
| | Year Ended |
| | October 31, 2010 |
| | ($000) |
| Investment Income | |
| Income | |
| Dividends1 | 64,993 |
| Interest2 | 911 |
| Security Lending | 24 |
| Total Income | 65,928 |
| Expenses | |
| Investment Advisory Fees—Note B | |
| Basic Fee | 7,682 |
| Performance Adjustment | 1,512 |
| The Vanguard Group—Note C | |
| Management and Administrative | 5,444 |
| Marketing and Distribution | 721 |
| Custodian Fees | 48 |
| Auditing Fees | 27 |
| Shareholders’ Reports | 45 |
| Trustees’ Fees and Expenses | 6 |
| Total Expenses | 15,485 |
| Expenses Paid Indirectly | (154) |
| Net Expenses | 15,331 |
| Net Investment Income | 50,597 |
| Realized Net Gain (Loss) | |
| Investment Securities Sold | (40,345) |
| Futures Contracts | 13,833 |
| Realized Net Gain (Loss) | (26,512) |
| Change in Unrealized Appreciation (Depreciation) | |
| Investment Securities | 600,476 |
| Futures Contracts | 4,018 |
| Change in Unrealized Appreciation (Depreciation) | 604,494 |
| Net Increase (Decrease) in Net Assets Resulting from Operations | 628,579 |
| 1 Dividends are net of foreign withholding taxes of $55,000. |
| 2 Interest income from an affiliated company of the fund was $875,000. |
See accompanying Notes, which are an integral part of the Financial Statements.
16
Selected Value Fund
Statement of Changes in Net Assets
| | |
| | 2010 | 2009 |
| | ($000) | ($000) |
| Increase (Decrease) in Net Assets | | |
| Operations | | |
| Net Investment Income | 50,597 | 46,351 |
| Realized Net Gain (Loss) | (26,512) | (247,106) |
| Change in Unrealized Appreciation (Depreciation) | 604,494 | 703,886 |
| Net Increase (Decrease) in Net Assets Resulting from Operations | 628,579 | 503,131 |
| Distributions | | |
| Net Investment Income | (46,869) | (78,192) |
| Realized Capital Gain | — | — |
| Total Distributions | (46,869) | (78,192) |
| Capital Share Transactions | | |
| Issued | 628,925 | 465,114 |
| Issued in Lieu of Cash Distributions | 41,576 | 69,913 |
| Redeemed1 | (464,396) | (531,001) |
| Net Increase (Decrease) from Capital Share Transactions | 206,105 | 4,026 |
| Total Increase (Decrease) | 787,815 | 428,965 |
| Net Assets | | |
| Beginning of Period | 2,851,417 | 2,422,452 |
| End of Period2 | 3,639,232 | 2,851,417 |
1 Net of redemption fees for fiscal 2010 and 2009 of $459,000 and $297,000, respectively.
2 Net Assets—End of Period includes undistributed net investment income of $33,329,000 and $29,601,000.
See accompanying Notes, which are an integral part of the Financial Statements.
17
Selected Value Fund
Financial Highlights
| | | | | |
| For a Share Outstanding | | | Year Ended October 31, |
| Throughout Each Period | 2010 | 2009 | 2008 | 2007 | 2006 |
| Net Asset Value, Beginning of Period | $14.78 | $12.48 | $22.11 | $21.38 | $18.99 |
| Investment Operations | | | | | |
| Net Investment Income | .250 | .254 | .3901 | .400 | .350 |
| Net Realized and Unrealized Gain (Loss) | | | | | |
| on Investments | 2.941 | 2.463 | (8.100) | 1.700 | 3.180 |
| Total from Investment Operations | 3.191 | 2.717 | (7.710) | 2.100 | 3.530 |
| Distributions | | | | | |
| Dividends from Net Investment Income | (.241) | (.417) | (.370) | (.320) | (.290) |
| Distributions from Realized Capital Gains | — | — | (1.550) | (1.050) | (.850) |
| Total Distributions | (.241) | (.417) | (1.920) | (1.370) | (1.140) |
| Net Asset Value, End of Period | $17.73 | $14.78 | $12.48 | $22.11 | $21.38 |
| |
| Total Return2 | 21.75% | 22.77% | -37.79% | 10.15% | 19.38% |
| |
| Ratios/Supplemental Data | | | | | |
| Net Assets, End of Period (Millions) | $3,639 | $2,851 | $2,422 | $4,991 | $4,326 |
| Ratio of Total Expenses to | | | | | |
| Average Net Assets3 | 0.47% | 0.52% | 0.38% | 0.42% | 0.45% |
| Ratio of Net Investment Income to | | | | | |
| Average Net Assets | 1.52% | 1.93% | 2.21% | 1.74% | 1.75% |
| Portfolio Turnover Rate | 22% | 30% | 23% | 33% | 37% |
1 Calculated based on average shares outstanding.
2 Total returns do not include transaction or account service fees that may have applied in the periods shown. Fund prospectuses provide information about any applicable transaction and account service fees.
3 Includes performance-based investment advisory fee increases (decreases) of 0.05%, 0.05%, (0.03%), (0.02%), and (0.05%).
See accompanying Notes, which are an integral part of the Financial Statements.
18
Selected Value Fund
Notes to Financial Statements
Vanguard Selected Value Fund is registered under the Investment Company Act of 1940 as an open-end investment company, or mutual fund.
A. The following significant accounting policies conform to generally accepted accounting principles for U.S. mutual funds. The fund consistently follows such policies in preparing its financial statements.
1. Security Valuation: Securities are valued as of the close of trading on the New York Stock Exchange (generally 4 p.m., Eastern time) on the valuation date. Equity securities are valued at the latest quoted sales prices or official closing prices taken from the primary market in which each security trades; such securities not traded on the valuation date are valued at the mean of the latest quoted bid and asked prices. Securities for which market quotations are not readily available, or whose values have been affected by events occurring before the fund’s pricing time but after the close of the securities’ primary markets, are valued at their fair values calculated according to procedures adopted by the board of trustees. These procedures include obtaining quotations from an independent pricing service, monitoring news to identify significant market- or security-specific events, and evaluating changes in the values of foreign market proxies (for example, A DRs, futures contracts, or exchange-traded funds), between the time the foreign markets close and the fund’s pricing time. When fair-value pricing is employed, the prices of securities used by a fund to calculate its net asset value may differ from quoted or published prices for the same securities. Investments in Vanguard Market Liquidity Fund are valued at that fund��s net asset value. Temporary cash investments acquired over 60 days to maturity are valued using the latest bid prices or using valuations based on a matrix system (which considers such factors as security prices, yields, maturities, and ratings), both as furnished by independent pricing services. Other temporary cash investments are valued at amortized cost, which approximates market value.
2. Futures Contracts: The fund uses index futures contracts to a limited extent, with the objective of maintaining full exposure to the stock market while maintaining liquidity. The fund may purchase or sell futures contracts to achieve a desired level of investment, whether to accommodate portfolio turnover or cash flows from capital share transactions. The primary risks associated with the use of futures contracts are imperfect correlation between changes in market values of stocks held by the fund and the prices of futures contracts, and the possibility of an illiquid market.
Futures contracts are valued at their quoted daily settlement prices. The aggregate principal amounts of the contracts are not recorded in the Statement of Net Assets. Fluctuations in the value of the contracts are recorded in the Statement of Net Assets as an asset (liability) and in the Statement of Operations as unrealized appreciation (depreciation) until the contracts are closed, when they are recorded as realized futures gains (losses).
3. Federal Income Taxes: The fund intends to continue to qualify as a regulated investment company and distribute all of its taxable income. Management has analyzed the fund’s tax positions taken for all open federal income tax years (October 31, 2007–2010), and has concluded that no provision for federal income tax is required in the fund’s financial statements.
4. Distributions: Distributions to shareholders are recorded on the ex-dividend date.
5. Security Lending: The fund may lend its securities to qualified institutional borrowers to earn additional income. Security loans are required to be secured at all times by collateral at least equal to the market value of securities loaned. The fund invests cash collateral received in Vanguard Market Liquidity Fund, and records a liability for the return of the collateral, during the period the securities are on loan. Security lending income represents fees charged to borrowers plus income earned on investing cash collateral, less expenses associated with the loan.
19
Selected Value Fund
6. Other: Dividend income is recorded on the ex-dividend date. Interest income includes income distributions received from Vanguard Market Liquidity Fund and is accrued daily. Security transactions are accounted for on the date securities are bought or sold. Costs used to determine realized gains (losses) on the sale of investment securities are those of the specific securities sold. Fees assessed on redemptions of capital shares are credited to paid-in capital.
B. Barrow, Hanley, Mewhinney & Strauss, LLC, and Donald Smith & Co., Inc., each provide investment advisory services to a portion of the fund for a fee calculated at an annual percentage rate of average net assets managed by the advisor. The basic fee of Barrow, Hanley, Mewhinney & Strauss, LLC, is subject to quarterly adjustments based on performance for the preceding three years relative to the Russell Midcap Value Index. The basic fee of Donald Smith & Co., Inc., is subject to quarterly adjustments based on performance for the preceding five years relative to the MSCI Investable Market 2500 Index.
The Vanguard Group manages the cash reserves of the fund on an at-cost basis.
For the year ended October 31, 2010, the aggregate investment advisory fee represented an effective annual basic rate of 0.23% of the fund’s average net assets, before an increase of $1,512,000 (0.05%) based on performance.
C. The Vanguard Group furnishes at cost corporate management, administrative, marketing, and distribution services. The costs of such services are allocated to the fund under methods approved by the board of trustees. The fund has committed to provide up to 0.40% of its net assets in capital contributions to Vanguard. At October 31, 2010, the fund had contributed capital of $635,000 to Vanguard (included in Other Assets), representing 0.02% of the fund’s net assets and 0.25% of Vanguard’s capitalization. The fund’s trustees and officers are also directors and officers of Vanguard.
D. Various inputs may be used to determine the value of the fund’s investments. These inputs are summarized in three broad levels for financial statement purposes. The inputs or methodologies used to value securities are not necessarily an indication of the risk associated with investing in those securities.
Level 1—Quoted prices in active markets for identical securities.
Level 2—Other significant observable inputs (including quoted prices for similar securities, interest rates, prepayment speeds, credit risk, etc.).
Level 3—Significant unobservable inputs (including the fund’s own assumptions used to determine the fair value of investments).
The following table summarizes the fund’s investments as of October 31, 2010, based on the inputs used to value them:
| | | |
| | Level 1 | Level 2 | Level 3 |
| Investments | ($000) | ($000) | ($000) |
| Common Stocks | 3,256,693 | — | — |
| Temporary Cash Investments | 370,203 | 16,986 | — |
| Futures Contracts—Assets1 | 32 | — | — |
| Total | 3,626,928 | 16,986 | — |
| 1 Represents variation margin on the last day of the reporting period. |
20
Selected Value Fund
E. At October 31, 2010, the aggregate settlement value of open futures contracts and the related unrealized appreciation (depreciation) were:
| | | | |
| | | | | ($000) |
| | | | Aggregate | |
| | | Number of | Settlement | Unrealized |
| | | Long (Short) | Value | Appreciation |
| Futures Contracts | Expiration | Contracts | Long (Short) | (Depreciation) |
| S&P 500 Index | December 2010 | 215 | 63,409 | 3,433 |
| E-mini S&P 500 Index | December 2010 | 531 | 31,321 | 562 |
Unrealized appreciation (depreciation) on open futures contracts is required to be treated as realized gain (loss) for tax purposes.
F. Distributions are determined on a tax basis and may differ from net investment income and realized capital gains for financial reporting purposes. Differences may be permanent or temporary. Permanent differences are reclassified among capital accounts in the financial statements to reflect their tax character. Temporary differences arise when certain items of income, expense, gain, or loss are recognized in different periods for financial statement and tax purposes; these differences will reverse at some time in the future. Differences in classification may also result from the treatment of short-term gains as ordinary income for tax purposes.
For tax purposes, at October 31, 2010, the fund had $39,705,000 of ordinary income available for distribution. The fund had available capital loss carryforwards totaling $466,345,000 to offset future net capital gains of $194,512,000 through October 31, 2016, $249,339,000 through October 31, 2017, and $22,494,000 through October 31, 2018.
At October 31, 2010, the cost of investment securities for tax purposes was $3,103,778,000. Net unrealized appreciation of investment securities for tax purposes was $540,104,000, consisting of unrealized gains of $703,764,000 on securities that had risen in value since their purchase and $163,660,000 in unrealized losses on securities that had fallen in value since their purchase.
G. During the year ended October 31, 2010, the fund purchased $835,806,000 of investment securities and sold $630,691,000 of investment securities, other than temporary cash investments.
H. Capital shares issued and redeemed were:
| | |
| | Year Ended October 31, |
| | 2010 | 2009 |
| | Shares | Shares |
| | (000) | (000) |
| Issued | 37,789 | 36,852 |
| Issued in Lieu of Cash Distributions | 2,571 | 6,144 |
| Redeemed | (28,069) | (44,143) |
| Net Increase (Decrease) in Shares Outstanding | 12,291 | (1,147) |
I. The fund has asked its investment advisors to direct certain security trades, subject to obtaining the best price and execution, to brokers who have agreed to rebate to the fund part of the commissions generated. Such rebates are used solely to reduce the fund’s management and administrative expenses. For the year ended October 31, 2010, these arrangements reduced the fund’s expenses by $154,000 (an annual rate of 0.00% of average net assets).
J. In preparing the financial statements as of October 31, 2010, management considered the impact of subsequent events for potential recognition or disclosure in these financial statements.
21
Report of Independent Registered
Public Accounting Firm
To the Trustees of Vanguard Whitehall Funds and the Shareholders of Vanguard Selected Value Fund:
In our opinion, the accompanying statement of net assets and the related statements of operations and of changes in net assets and the financial highlights present fairly, in all material respects, the financial position of Vanguard Selected Value Fund (constituting a separate portfolio of Vanguard Whitehall Funds, hereafter referred to as the “Fund”) at October 31, 2010, the results of its operations for the year then ended, the changes in its net assets for each of the two years in the period then ended and the financial highlights for each of the five years in the period then ended, in conformity with accounting principles generally accepted in the United States of America. These financial statements and financial highlights (hereafter referred to as “financial statements”) are the responsibility of the Fund’s management; our responsibility is to express an opinion on these financial statements based on our audits. We conducted our audits o f these financial statements in accordance with the standards of the Public Company Accounting Oversight Board (United States). Those standards require that we plan and perform the audit to obtain reasonable assurance about whether the financial statements are free of material misstatement. An audit includes examining, on a test basis, evidence supporting the amounts and disclosures in the financial statements, assessing the accounting principles used and significant estimates made by management, and evaluating the overall financial statement presentation. We believe that our audits, which included confirmation of securities at October 31, 2010 by correspondence with the custodian and broker and by agreement to the underlying ownership records of Vanguard Market Liquidity Fund, provide a reasonable basis for our opinion.
PricewaterhouseCoopers LLP
Philadelphia, Pennsylvania
December 14, 2010
|
| Special 2010 tax information (unaudited) for Vanguard Selected Value Fund |
This information for the fiscal year ended October 31, 2010, is included pursuant to provisions of the Internal Revenue Code.
The fund distributed $46,869,000 of qualified dividend income to shareholders during the fiscal year.
For corporate shareholders, 100% of investment income (dividend income plus short-term gains, if any) qualifies for the dividends-received deduction.
22
Your Fund’s After-Tax Returns
This table presents returns for your fund both before and after taxes. The after-tax returns are shown in two ways: (1) assuming that an investor owned the fund during the entire period and paid taxes on the fund’s distributions, and (2) assuming that an investor paid taxes on the fund’s distributions and sold all shares at the end of each period.
Calculations are based on the highest individual federal income tax and capital gains tax rates in effect at the times of the distributions and the hypothetical sales. State and local taxes were not considered. After-tax returns reflect any qualified dividend income , using actual prior-year figures and estimates for 2010. (In the example, returns after the sale of fund shares may be higher than those assuming no sale. This occurs when the sale would have produced a capital loss. The calculation assumes that the investor received a tax deduction for the loss.) Please note that your actual after-tax returns will depend on your tax situation and may differ from those shown. Also note that if you own the fund in a tax-deferred account, such as an individual retirement account or a 401(k) plan, this information does not apply to you. Such accounts are not subject to current taxes.
Finally, keep in mind that a fund’s performance—whether before or after taxes—does not guarantee future results.
Average Annual Total Returns: Selected Value Fund
Periods Ended October 31, 2010
| | | |
| | One | Five | Ten |
| | Year | Years | Years |
| Returns Before Taxes | 21.75% | 4.11% | 8.29% |
| Returns After Taxes on Distributions | 21.48 | 3.14 | 7.51 |
| Returns After Taxes on Distributions and Sale of Fund Shares | 14.45 | 3.33 | 7.06 |
Returns do not reflect the 1% fee on redemptions of shares held for less than one year.
23
About Your Fund’s Expenses
As a shareholder of the fund, you incur ongoing costs, which include costs for portfolio management, administrative services, and shareholder reports (like this one), among others. Operating expenses, which are deducted from a fund’s gross income, directly reduce the investment return of the fund.
A fund’s expenses are expressed as a percentage of its average net assets. This figure is known as the expense ratio. The following examples are intended to help you understand the ongoing costs (in dollars) of investing in your fund and to compare these costs with those of other mutual funds. The examples are based on an investment of $1,000 made at the beginning of the period shown and held for the entire period.
The accompanying table illustrates your fund’s costs in two ways:
• Based on actual fund return. This section helps you to estimate the actual expenses that you paid over the period. The ”Ending Account Value“ shown is derived from the fund‘s actual return, and the third column shows the dollar amount that would have been paid by an investor who started with $1,000 in the fund. You may use the information here, together with the amount you invested, to estimate the expenses that you paid over the period.
To do so, simply divide your account value by $1,000 (for example, an $8,600 account value divided by $1,000 = 8.6), then multiply the result by the number given for your fund under the heading ”Expenses Paid During Period.“
• Based on hypothetical 5% yearly return. This section is intended to help you compare your fund‘s costs with those of other mutual funds. It assumes that the fund had a yearly return of 5% before expenses, but that the expense ratio is unchanged. In this case—because the return used is not the fund’s actual return—the results do not apply to your investment. The example is useful in making comparisons because the Securities and Exchange Commission requires all mutual funds to calculate expenses based on a 5% return. You can assess your fund’s costs by comparing this hypothetical example with the hypothetical examples that appear in shareholder reports of other funds.
Note that the expenses shown in the table are meant to highlight and help you compare ongoing costs only and do not reflect transaction costs incurred by the fund for buying and selling securities. Further, the expenses do not include the 1% fee on redemptions of shares held for less than one year, nor do they include the account service fee described in the prospectus. If such fees were applied to your account, your costs would be higher. Your fund does not carry a “sales load.” The calculations assume no shares were bought or sold during the period. Your actual costs may have been higher or lower, depending on the amount of your investment and the timing of any purchases or redemptions.
You can find more information about the fund’s expenses, including annual expense ratios, in the Financial Statements section of this report. For additional information on operating expenses and other shareholder costs, please refer to your fund’s current prospectus.
24
Six Months Ended October 31, 2010
| | | |
| | Beginning | Ending | Expenses |
| | Account Value | Account Value | Paid During |
| Selected Value Fund | 4/30/2010 | 10/31/2010 | Period |
| Based on Actual Fund Return | $1,000.00 | $1,001.69 | $2.22 |
| Based on Hypothetical 5% Yearly Return | 1,000.00 | 1,022.99 | 2.24 |
The calculations are based on expenses incurred in the most recent six-month period. The fund’s annualized six-month expense ratio for that period is 0.44%. The dollar amounts shown as “Expenses Paid” are equal to the annualized expense ratio multiplied by the average account value over the period, multiplied by the number of days in the most recent six-month period, then divided by the number of days in the most recent 12-month period.
25
Glossary
30-Day SEC Yield. A fund’s 30-day SEC yield is derived using a formula specified by the U.S. Securities and Exchange Commission. Under the formula, data related to the fund’s security holdings in the previous 30 days are used to calculate the fund’s hypothetical net income for that period, which is then annualized and divided by the fund’s estimated average net assets over the calculation period. For the purposes of this calculation, a security’s income is based on its current market yield to maturity (in the case of bonds) or its projected dividend yield (for stocks). Because the SEC yield represents hypothetical annualized income, it will differ—at times significantly—from the fund’s actual experience. As a result, the fund’s income distributions may be higher or lower than implied by the SEC yield.
Beta. A measure of the magnitude of a fund’s past share-price fluctuations in relation to the ups and downs of a given market index. The index is assigned a beta of 1.00. Compared with a given index, a fund with a beta of 1.20 typically would have seen its share price rise or fall by 12% when the index rose or fell by 10%. For this report, beta is based on returns over the past 36 months for both the fund and the index. Note that a fund’s beta should be reviewed in conjunction with its R-squared (see definition). The lower the R-squared, the less correlation there is between the fund and the index, and the less reliable beta is as an indicator of volatility.
Dividend Yield. Dividend income earned by stocks, expressed as a percentage of the aggregate market value (or of net asset value, for a fund). The yield is determined by dividing the amount of the annual dividends by the aggregate value (or net asset value) at the end of the period. For a fund, the dividend yield is based solely on stock holdings and does not include any income produced by other investments.
Earnings Growth Rate. The average annual rate of growth in earnings over the past five years for the stocks now in a fund.
Equity Exposure. A measure that reflects a fund’s investments in stocks and stock futures. Any holdings in short-term reserves are excluded.
Expense Ratio. The percentage of a fund’s average net assets used to pay its annual administrative and advisory expenses. These expenses directly reduce returns to investors.
Foreign Holdings. The percentage of a fund represented by stocks or depositary receipts of companies based outside the United States.
Inception Date. The date on which the assets of a fund (or one of its share classes) are first invested in accordance with the fund’s investment objective. For funds with a subscription period, the inception date is the day after that period ends. Investment performance is measured from the inception date.
Median Market Cap. An indicator of the size of companies in which a fund invests; the midpoint of market capitalization (market price x shares outstanding) of a fund’s stocks, weighted by the proportion of the fund’s assets invested in each stock. Stocks representing half of the fund’s assets have market capitalizations above the median, and the rest are below it.
Price/Book Ratio. The share price of a stock divided by its net worth, or book value, per share. For a fund, the weighted average price/book ratio of the stocks it holds.
26
Price/Earnings Ratio. The ratio of a stock’s current price to its per-share earnings over the past year. For a fund, the weighted average P/E of the stocks it holds. P/E is an indicator of market expectations about corporate prospects; the higher the P/E, the greater the expectations for a company’s future growth.
R-Squared. A measure of how much of a fund’s past returns can be explained by the returns from the market in general, as measured by a given index. If a fund’s total returns were precisely synchronized with an index’s returns, its R-squared would be 1.00. If the fund’s returns bore no relationship to the index’s returns, its R-squared would be 0. For this report, R-squared is based on returns over the past 36 months for both the fund and the index.
Return on Equity. The annual average rate of return generated by a company during the past five years for each dollar of shareholder’s equity (net income divided by shareholder’s equity). For a fund, the weighted average return on equity for the companies whose stocks it holds.
Short-Term Reserves. The percentage of a fund invested in highly liquid, short-term securities that can be readily converted to cash.
Turnover Rate. An indication of the fund’s trading activity. Funds with high turnover rates incur higher transaction costs and may be more likely to distribute capital gains (which may be taxable to investors). The turnover rate excludes in-kind transactions, which have minimal impact on costs.
27
The People Who Govern Your Fund
The trustees of your mutual fund are there to see that the fund is operated and managed in your best interests since, as a shareholder, you are a part owner of the fund. Your fund’s trustees also serve on the board of directors of The Vanguard Group, Inc., which is owned by the Vanguard funds and provides services to them on an at-cost basis.
A majority of Vanguard’s board members are independent, meaning that they have no affiliation with Vanguard or the funds they oversee, apart from the sizable personal investments they have made as private individuals. The independent board members have distinguished backgrounds in business, academia, and public service. Each of the trustees and executive officers oversees 178 Vanguard funds.
The following table provides information for each trustee and executive officer of the fund. More information about the trustees is in the Statement of Additional Information, which can be obtained, without charge, by contacting Vanguard at 800-662-7447, or online at vanguard.com.
| |
| Interested Trustee1 | Amy Gutmann |
| | Born 1949. Trustee Since June 2006. Principal |
| F. William McNabb III | Occupation(s) During the Past Five Years: President |
| Born 1957. Trustee Since July 2009. Chairman of the | of the University of Pennsylvania; Christopher H. |
| Board. Principal Occupation(s) During the Past Five | Browne Distinguished Professor of Political Science |
| Years: Chairman of the Board of The Vanguard Group, | in the School of Arts and Sciences with secondary |
| Inc., and of each of the investment companies served | appointments at the Annenberg School for Commu- |
| by The Vanguard Group, since January 2010; Director | nication and the Graduate School of Education |
| of The Vanguard Group since 2008; Chief Executive | of the University of Pennsylvania; Director of |
| Officer and President of The Vanguard Group and of | Carnegie Corporation of New York, Schuylkill River |
| each of the investment companies served by The | Development Corporation, and Greater Philadelphia |
| Vanguard Group since 2008; Director of Vanguard | Chamber of Commerce; Trustee of the National |
| Marketing Corporation; Managing Director of The | Constitution Center; Chair of the Presidential |
| Vanguard Group (1995–2008). | Commission for the Study of Bioethical Issues. |
| |
| | JoAnn Heffernan Heisen |
| Independent Trustees | Born 1950. Trustee Since July 1998. Principal |
| | Occupation(s) During the Past Five Years: Corporate |
| Emerson U. Fullwood | Vice President and Chief Global Diversity Officer |
| Born 1948. Trustee Since January 2008. Principal | since 2006 (retired 2008) and Member of the |
| Occupation(s) During the Past Five Years: Executive | Executive Committee (retired 2008) of Johnson & |
| Chief Staff and Marketing Officer for North America | Johnson (pharmaceuticals/consumer products); Vice |
| and Corporate Vice President (retired 2008) of Xerox | President and Chief Information Officer of Johnson & |
| Corporation (document management products and | Johnson (1997–2005); Director of the University |
| services); Director of SPX Corporation (multi-industry | Medical Center at Princeton and Women’s Research |
| manufacturing), the United Way of Rochester, | and Education Institute; Member of the Advisory |
| Amerigroup Corporation (managed health care), | Board of the Maxwell School of Citizenship and Public |
| the University of Rochester Medical Center, and | Affairs at Syracuse University. |
| Monroe Community College Foundation. | |
| | F. Joseph Loughrey |
| Rajiv L. Gupta | Born 1949. Trustee Since October 2009. Principal |
| Born 1945. Trustee Since December 2001.2 | Occupation(s) During the Past Five Years: President |
| Principal Occupation(s) During the Past Five Years: | and Chief Operating Officer since 2005 (retired 2009) |
| Chairman and Chief Executive Officer (retired 2009) | and Vice Chairman of the Board (2008–2009) of |
| and President (2006–2008) of Rohm and Haas Co. | Cummins Inc. (industrial machinery); Director of |
| (chemicals); Director of Tyco International, Ltd. | SKF AB (industrial machinery), Hillenbrand, Inc. |
| (diversified manufacturing and services) and Hewlett- | (specialized consumer services), Sauer-Danfoss Inc. |
| Packard Co. (electronic computer manufacturing); | (machinery), the Lumina Foundation for Education, |
| Trustee of The Conference Board; Member of the | and Oxfam America; Chairman of the Advisory |
| Board of Managers of Delphi Automotive LLP | Council for the College of Arts and Letters at the |
| (automotive components). | University of Notre Dame. |
| | |
| André F. Perold | Kathryn J. Hyatt | |
| Born 1952. Trustee Since December 2004. Principal | Born 1955. Treasurer Since November 2008. Principal |
| Occupation(s) During the Past Five Years: George | Occupation(s) During the Past Five Years: Principal |
| Gund Professor of Finance and Banking at the Harvard | of The Vanguard Group, Inc.; Treasurer of each of |
| Business School; Chair of the Investment Committee | the investment companies served by The Vanguard |
| of HighVista Strategies LLC (private investment firm). | Group since 2008; Assistant Treasurer of each of the |
| | investment companies served by The Vanguard Group |
| Alfred M. Rankin, Jr. | (1988–2008). | |
| Born 1941. Trustee Since January 1993. Principal | | |
| Occupation(s) During the Past Five Years: Chairman, | Heidi Stam | |
| President, and Chief Executive Officer of NACCO | Born 1956. Secretary Since July 2005. Principal |
| Industries, Inc. (forklift trucks/housewares/lignite); | Occupation(s) During the Past Five Years: Managing |
| Director of Goodrich Corporation (industrial products/ | Director of The Vanguard Group, Inc., since 2006; |
| aircraft systems and services); Chairman of the | General Counsel of The Vanguard Group since 2005; |
| Federal Reserve Bank of Cleveland; Trustee of The | Secretary of The Vanguard Group and of each of the |
| Cleveland Museum of Art. | investment companies served by The Vanguard Group |
| | since 2005; Director and Senior Vice President of |
| Peter F. Volanakis | Vanguard Marketing Corporation since 2005; |
| Born 1955. Trustee Since July 2009. Principal | Principal of The Vanguard Group (1997–2006). |
| Occupation(s) During the Past Five Years: President | | |
| since 2007 and Chief Operating Officer since 2005 | | |
| of Corning Incorporated (communications equipment); | Vanguard Senior Management Team |
| President of Corning Technologies (2001–2005); | | |
| Director of Corning Incorporated and Dow Corning; | R. Gregory Barton | Michael S. Miller |
| Trustee of the Corning Incorporated Foundation and | Mortimer J. Buckley | James M. Norris |
| the Corning Museum of Glass; Overseer of the | Kathleen C. Gubanich | Glenn W. Reed |
| Amos Tuck School of Business Administration at | Paul A. Heller | George U. Sauter |
| Dartmouth College. | | |
| |
| | Chairman Emeritus and Senior Advisor |
| Executive Officers | | |
| | John J. Brennan | |
| Glenn Booraem | Chairman, 1996–2009 | |
| Born 1967. Controller Since July 2010. Principal | Chief Executive Officer and President, 1996–2008 |
| Occupation(s) During the Past Five Years: Principal | | |
| of The Vanguard Group, Inc.; Controller of each of | | |
| the investment companies served by The Vanguard | Founder | |
| Group since 2010; Assistant Controller of each of | | |
| the investment companies served by The Vanguard | John C. Bogle | |
| Group (2001–2010). | Chairman and Chief Executive Officer, 1974–1996 |
| |
| Thomas J. Higgins | | |
| Born 1957. Chief Financial Officer Since September | | |
| 2008. Principal Occupation(s) During the Past Five | | |
| Years: Principal of The Vanguard Group, Inc.; Chief | | |
| Financial Officer of each of the investment companies | | |
| served by The Vanguard Group since 2008; Treasurer | | |
| of each of the investment companies served by The | | |
| Vanguard Group (1998–2008). | | |
1 Mr. McNabb is considered an “interested person,” as defined in the Investment Company Act of 1940, because he is an officer of the Vanguard funds.
2 December 2002 for Vanguard Equity Income Fund, Vanguard Growth Equity Fund, the Vanguard Municipal Bond Funds, and the Vanguard State Tax-Exempt Funds.
| |  |
| P.O. Box 2600 |
| Valley Forge, PA 19482-2600 |
Connect with Vanguard® > vanguard.com
| |
| Fund Information > 800-662-7447 | CFA® is a trademark owned by CFA Institute. |
| Direct Investor Account Services > 800-662-2739 | |
| Institutional Investor Services > 800-523-1036 | |
| Text Telephone for People | |
| With Hearing Impairment > 800-749-7273 | |
| |
| This material may be used in conjunction | |
| with the offering of shares of any Vanguard | |
| fund only if preceded or accompanied by | |
| the fund’s current prospectus. | |
| |
| All comparative mutual fund data are from Lipper Inc. or | |
| Morningstar, Inc., unless otherwise noted. | |
| |
| You can obtain a free copy of Vanguard’s proxy voting | |
| guidelines by visiting vanguard.com/proxyreporting or by | |
| calling Vanguard at 800-662-2739. The guidelines are | |
| also available from the SEC’s website, sec.gov. In | |
| addition, you may obtain a free report on how your fund | |
| voted the proxies for securities it owned during the 12 | |
| months ended June 30. To get the report, visit either | |
| vanguard.com/proxyreporting or sec.gov. | |
| |
| You can review and copy information about your fund at | |
| the SEC’s Public Reference Room in Washington, D.C. To | |
| find out more about this public service, call the SEC at | |
| 202-551-8090. Information about your fund is also | |
| available on the SEC’s website, and you can receive | |
| copies of this information, for a fee, by sending a | |
| request in either of two ways: via e-mail addressed to | |
| publicinfo@sec.gov or via regular mail addressed to the | |
| Public Reference Section, Securities and Exchange | |
| Commission, Washington, DC 20549-1520. | |
| |
| |
| | © 2010 The Vanguard Group, Inc. |
| | All rights reserved. |
| | Vanguard Marketing Corporation, Distributor. |
| |
| | Q9340 122010 |
 |
|
| Vanguard Mid-Cap Growth Fund |
| Annual Report |
|
| October 31, 2010 |
 |
|
> Vanguard Mid-Cap Growth Fund returned about 27% for the 12 months ended October 31, 2010.
> The fund’s return trailed that of its benchmark, the Russell Midcap Growth Index, but was in line with the average return of mid-cap growth funds.
> Holdings in the information technology and industrial sectors were among the fund’s strongest performers. Stock selection in the consumer discretionary and financial areas hurt the fund’s performance relative to the index.
| |
| Contents | |
| Your Fund’s Total Returns. | 1 |
| Chairman’s Letter. | 2 |
| Advisors’ Report. | 7 |
| Fund Profile. | 10 |
| Performance Summary. | 11 |
| Financial Statements. | 13 |
| Your Fund’s After-Tax Returns. | 23 |
| About Your Fund’s Expenses. | 24 |
| Glossary. | 26 |
Please note: The opinions expressed in this report are just that—informed opinions. They should not be considered promises or advice. Also, please keep in mind that the information and opinions cover the period through the date on the front of this report. Of course, the risks of investing in your fund are spelled out in the prospectus.
See the Glossary for definitions of investment terms used in this report.
Cover photograph: Jean Maher.
Your Fund’s Total Returns
Fiscal Year Ended October 31, 2010
| |
| | Total |
| | Returns |
| Vanguard Mid-Cap Growth Fund | 26.70% |
| Russell Midcap Growth Index | 28.03 |
| Mid-Cap Growth Funds Average | 27.16 |
| Mid-Cap Growth Funds Average: Derived from data provided by Lipper Inc. | |
Your Fund’s Performance at a Glance
October 31, 2009, Through October 31, 2010
| | | | |
| | | | Distributions Per Share |
| | Starting | Ending | Income | Capital |
| | Share Price | Share Price | Dividends | Gains |
| Vanguard Mid-Cap Growth Fund | $13.86 | $17.54 | $0.018 | $0.000 |
1

Chairman’s Letter
Dear Shareholder,
Vanguard Mid-Cap Growth Fund returned 26.70% for the fiscal year ended October 31, 2010. The fund was a step behind its benchmark, the Russell Midcap Growth Index, which returned 28.03% for the period, and the average return of its peer funds.
Despite a few bumps during the fiscal year, the fund’s mid-capitalization holdings placed it among the best-performing segments of the market. Mid-cap stocks overall outperformed shares of larger and smaller companies during the period. The fund further benefited from its focus on growth, as growth stocks in general beat their value counterparts.
For the 12 months, the fund’s information technology and industrial sectors were standout performers. The fund’s consumer discretionary and financial holdings weighed on its performance relative to its comparative standards.
If you own shares of the fund in a taxable account, you may wish to review information about the fund’s after-tax returns presented later in this report.
Stock market performance was better than it felt
Global stock prices rallied at the start of the period, but struggled through the spring and summer, weighed down by Europe’s sovereign debt crisis and the slow pace of economic recovery in the United States. In the fiscal year’s final months, the mood turned. Stock prices
2
climbed on continued strength in corporate earnings. In the United States, stocks also seemed to get a boost from the Federal Reserve Board’s hints that it would try to stimulate the economy with a second round of U.S. Treasury bond purchases. (In early November, the Fed announced that it would buy as much as $600 billion in Treasuries.)
For the 12 months, the broad U.S. stock market returned about 19%, a performance that was better than it felt in a year of ups and downs. Small-capitalization stocks did even better. International stocks returned about 13% on the strength of a powerful rally in emerging markets and solid single-digit gains in developed markets in Europe and the Pacific region.
Despite shrinking yields, bonds attracted investor dollars
Although fixed income yields have fallen to generational lows, investors continued to bid up bond prices. The broad U.S. bond market produced a 12-month return of about 8% as the yield of the 10-year U.S. Treasury note fell from 3.39% at the start of the period to 2.61% at the close. Tax-exempt municipal bonds also rallied. Bond prices and yields move in opposite directions, of course, so abundant returns built on rising prices could mean leaner pickings in the years ahead.
The yields of money market securities hovered near 0%, consistent with the Federal Reserve Board’s target for short-term rates.
Market Barometer
| | | |
| | | Average Annual Total Returns |
| | | Periods Ended October 31, 2010 |
| | One | Three | Five |
| | Year | Years | Years |
| Stocks | | | |
| Russell 1000 Index (Large-caps) | 17.67% | -6.14% | 1.99% |
| Russell 2000 Index (Small-caps) | 26.58 | -3.91 | 3.07 |
| Dow Jones U.S. Total Stock Market Index | 19.04 | -5.55 | 2.52 |
| MSCI All Country World Index ex USA (International) | 13.08 | -7.62 | 6.21 |
| |
| Bonds | | | |
| Barclays Capital U.S. Aggregate Bond Index (Broad | | | |
| taxable market) | 8.01% | 7.23% | 6.45% |
| Barclays Capital Municipal Bond Index (Broad | | | |
| tax-exempt market) | 7.78 | 5.79 | 5.20 |
| Citigroup Three-Month U.S. Treasury Bill Index | 0.12 | 0.89 | 2.41 |
| |
| CPI | | | |
| Consumer Price Index | 1.17% | 1.54% | 1.89% |
3
IT and industrial holdings propelled the fund’s return
The Mid-Cap Growth Fund’s advisors aim to invest in a broad range of high- quality midsized companies with strong growth prospects. The fund has focused on a handful of sectors—information technology, consumer discretionary, industrials, and health care—which together made up more than 75% of its assets, on average, during the fiscal year.
Each of the fund’s sectors posted strong returns for the year; in fact, all except financials produced double-digit percentage gains. Information technology, the largest sector holding, was a stellar performer, contributing about a third of the fund’s overall result for the period. As the U.S. economy continued to slowly recover, companies were more willing to invest in IT consulting and software products and services that could help them become more efficient and competitive. Among the fund’s holdings, the strongest results came from Gartner (+82%), a research and consulting firm, and Sybase (+63%), a software provider recently acquired by business software giant SAP.
Improvements in the economy also boosted the fund’s industrial holdings. Representing about 16% of the fund’s assets, on average, industrial stocks contributed nearly 20% of its total return for the fiscal period. A resurgence of U.S. manufacturing demand helped lift the stocks of aircraft-components
Expense Ratios
Your Fund Compared With Its Peer Group
| | |
| | | Peer Group |
| | Fund | Average |
| Mid-Cap Growth Fund | 0.60% | 1.47% |
The fund expense ratio shown is from the prospectus dated February 25, 2010, and represents estimated costs for the current fiscal year. For the fiscal year ended October 31, 2010, the fund’s expense ratio was 0.51%. The peer-group expense ratio is derived from data provided by Lipper Inc. and captures information through year-end 2009.
Peer group: Mid-Cap Growth Funds.
4
manufacturer TransDigm (+69%) and industrial distributor Fastenal (+52%), among others.
Rising consumer confidence supported a broad cross-section of consumer discretionary stocks, including specialty retailers and those involved in the hospitality industry. But the fund’s return for the sector would have been even stronger had the advisors chosen better among education service companies, discount retail chains, and department stores. The fund missed out on several opportunities by not owning stocks such as online movie retailer Netflix (+225%), which helped boost the return of the benchmark index.
Financial stocks were among the fund’s weakest performers. Poor stock selection among diversified financial services companies, including Moody’s (–23%), and investment banking and brokerage companies such as Greenhill (–8%) weighed on the fund’s results.
Market downturns have shadowed the fund’s long-term record
For the decade ended October 31, Vanguard Mid-Cap Growth Fund had an average annual return of –0.45%, better than the average return of peer funds (–0.89%) but behind the result of its benchmark index (+0.20%). Of course, an index incurs no expenses. These unsatisfying ten-year results for the fund and its comparative standards reflect a decade that spanned two severe bear markets.
Total Returns
Ten Years Ended October 31, 2010
| |
| | Average |
| | Annual Return |
| Mid-Cap Growth Fund | -0.45% |
| Russell Midcap Growth Index | 0.20 |
| Mid-Cap Growth Funds Average | -0.89 |
| Mid-Cap Growth Funds Average: Derived from data provided by Lipper Inc. | |
The figures shown represent past performance, which is not a guarantee of future results. (Current performance may be lower or higher than the performance data cited. For performance data current to the most recent month-end, visit our website at vanguard.com/performance.) Note, too, that both investment returns and principal value can fluctuate widely, so an investor’s shares, when sold, could be worth more or less than their original cost.
5
When evaluating a fund’s long-term track record, it’s helpful to remember that shifts in the starting and ending dates for the measurement period can have a significant impact on relative results. For example, for the ten years ended October 31, 2009, your fund’s average annual return was about 3 percentage points ahead of its benchmark index’s return—boosted by dramatic outperformance in fiscal year 2000. In that year the Mid-Cap Growth Fund had an extraordinary return of about 97%, compared with about 39% for the index; but fiscal 2000 has now dropped out of the ten-year performance calculation.
We remain confident that the skill and knowledge of your fund’s multiple advisors will enable it to continue producing competitive results over the long run.
As a shareholder, you also benefit from the fund’s low costs, which allow you to keep more of its returns.
Invest for the long term regardless of market conditions
Although the Mid-Cap Growth Fund’s results over the past year were strong, it’s impossible to predict the market’s direction down the road.
As seasoned investors understand, coping with the stock market’s ups and downs is an integral part of investing. And as you know, to reap the potential rewards of your investment, you must embrace risk.
Our experience suggests that an effective way to cope with market uncertainty is to focus on the long term and build a diversified, well-balanced portfolio. A portfolio with an appropriate mix of stock, bond, and short-term investments can help protect your assets from the markets’ worst outcomes while giving you the opportunity to participate in the best.
Vanguard Mid-Cap Growth Fund, with its wide exposure to midsized, growth-oriented companies and its low costs, can play an important supporting role in such a balanced portfolio.
Thank you for entrusting your assets to Vanguard.
Sincerely,

F. William McNabb III
Chairman and Chief Executive Officer
November 16, 2010
6
Advisors’ Report
During the fiscal year ended October 31, 2010, Vanguard Mid-Cap Growth Fund returned 26.70%. Your fund is managed by two independent advisors, a strategy that enhances the fund’s diversification by providing exposure to distinct, yet complementary, investment approaches. It’s not uncommon for different advisors to have different views about individual securities or the broader investment environment.
The advisors, the percentage of fund assets each manages, and brief descriptions of their investment strategies are presented in the table below. The advisors have also prepared a discussion of the investment environment that existed during the fiscal year and of how portfolio positioning reflects this assessment. These comments were prepared on November 19, 2010.
Vanguard Mid-Cap Growth Fund Investment Advisors
| | | |
| | Fund Assets Managed | |
| Investment Advisor | % | $ Million | Investment Strategy |
| Chartwell Investment Partners, | 49 | 756 | Uses a bottom-up, fundamental, research-driven |
| L.P. | | | stock-selection strategy focusing on companies with |
| | | | sustainable growth, strong management teams, |
| | | | competitive positions, and outstanding product and |
| | | | service offerings. These companies should continually |
| | | | demonstrate growth in earnings per share. |
| William Blair & Company, L.L.C. | 48 | 752 | Uses a fundamental investment approach in pursuit of |
| | | | superior long-term investment results from |
| | | | growth-oriented companies with leadership positions |
| | | | and strong market presence. |
| Cash Investments | 3 | 54 | These short-term reserves are invested by Vanguard in |
| | | | equity index products to simulate investment in stocks. |
| | | | Each advisor may also maintain a modest cash |
| | | | position. |
7
Chartwell Investment Partners, L.P.
Portfolio Managers:
Edward N. Antoian, CFA, CPA, Managing Partner
John A. Heffern, Managing Partner and Senior Portfolio Manager
Investment environment
Investors have become more discerning about quality and growth as the domestic and global economies labor along a path of uneven recovery. During the fiscal year, valuations normalized for many companies badly hurt in the recession, but now the market shows a renewed focus on identifying companies capable of maintaining sales growth and margin expansion into the coming year. The result could be a narrow group of companies leading market performance.
Our research remains oriented toward companies that executed well during the latest period of turbulence, emerged with stronger franchises and enhanced profit margins, and are well-positioned to maintain distance from competitors over time. These are the key characteristics of our time-tested, bottom-up approach to mid-cap growth investing.
Successes
Our selections among energy and basic industry stocks added value. An underweighted position in energy relative to the benchmark index also helped. Companies focusing on oil and gas production (Whiting Petroleum) and on industrial machinery (Gardner Denver) were significant contributors.
Shortfalls
Consumer services and financial services represented the only sectors that materially detracted from our portfolio’s performance. We were disappointed by our stock selections in consumer services, namely in recreational products (Bally Technologies), casinos/gaming, (WMS Industries), and department stores (Kohl’s). Overweighted exposure in financials hurt performance relative to the benchmark.
William Blair & Company, L.L.C.
Portfolio Managers:
Robert C. Lanphier, Principal
David Ricci, CFA, Principal
The past 12 months were extremely volatile, but ultimately rewarding, with multiple swings of roughly 20% in either direction. The period started with a continuation of the cyclical recovery in equities that began in March 2009. However, the market reversed course sharply in May and June of this year as a combination of factors—fears of a “double-dip” recession, European sovereign debt downgrades, and expiring stimulus programs—led to a spike in pessimism.
This macro-driven correction proved short-lived. Investors’ fears were eased in part by word that the Federal Reserve was considering further measures aimed at keeping mortgage and other borrowing rates low. Positive auto sales figures and what some believed to be more pro-business prospects in the November elections also contributed to the improved sentiment that closed the period.
8
Relative to the benchmark index, our portfolio suffered in the period primarily because of our more conservative investment approach (i.e., the portfolio typically has lower beta than the index). However, certain company-specific stock movements detracted from relative performance as well. This was most evident in health care, with Athenahealth, CareFusion, and QIAGEN detracting. Our selections among financial stocks, specifically Greenhill & Co. and HCC Insurance Holdings, also pulled down relative results, as did certain consumer discretionary stocks (WMS Industries, DeVry). On the upside, Green Mountain Coffee Roasters in the consumer staples sector, Airgas in materials, and both Transdigm Group and Fastenal in industrials all helped to raise relative performance.
As we look forward, the U.S. equity market appears to offer a relatively balanced risk-reward profile. Reasonable valuations and strong corporate cash flow create an attractive backdrop; on the other hand, lingering state and municipal budget woes and continued high levels of unemployment threaten to stall the current economic recovery. In the end, although forecasting the economic landscape is not what we spend our time on, we do believe that economic growth will be more contained over the coming years. Corporate earnings growth will be increasingly dependent on revenue growth rather than on cost-cutting. Investors are likely to look for companies that possess more internal growth drivers. Our strategy of finding solid quality growth companies, which “control their own destiny” to a greater degree and are less dependent on overall economic growth, should be beneficial in such an environment.
9
Mid-Cap Growth Fund
Fund Profile
As of October 31, 2010
| | | |
| Portfolio Characteristics | | |
| | | Russell | DJ |
| | | Midcap | U.S. Total |
| | | Growth | Market |
| | Fund | Index | Index |
| Number of Stocks | 100 | 492 | 3,920 |
| Median Market Cap | $5.9B | $6.9B | $28.5B |
| Price/Earnings Ratio | 25.5x | 22.6x | 16.9x |
| Price/Book Ratio | 3.4x | 3.7x | 2.2x |
| Return on Equity | 17.8% | 19.1% | 19.2% |
| Earnings Growth Rate 13.1% | 9.0% | 6.5% |
| Dividend Yield | 0.5% | 0.9% | 1.8% |
| Foreign Holdings | 1.7% | 0.0% | 0.0% |
| Turnover Rate | 88% | — | — |
| Ticker Symbol | VMGRX | — | — |
| Expense Ratio1 | 0.60% | — | — |
| 30-Day SEC Yield | 0.00% | — | — |
| Short-Term Reserves | 3.3% | — | — |
| |
| Sector Diversification (% of equity exposure) |
| | | Russell | DJ |
| | | Midcap | U.S. Total |
| | | Growth | Market |
| | Fund | Index | Index |
| Consumer | | | |
| Discretionary | 19.9% | 20.2% | 11.8% |
| Consumer Staples | 5.1 | 5.3 | 10.0 |
| Energy | 5.2 | 5.5 | 9.8 |
| Financials | 9.9 | 7.1 | 16.3 |
| Health Care | 16.3 | 12.5 | 11.0 |
| Industrials | 17.0 | 15.6 | 11.1 |
| Information | | | |
| Technology | 21.4 | 24.4 | 19.4 |
| Materials | 2.5 | 7.1 | 4.4 |
| Telecommunication | | | |
| Services | 2.5 | 2.0 | 2.8 |
| Utilities | 0.2 | 0.3 | 3.4 |
| | |
| Volatility Measures | | |
| | Russell | DJ |
| | Midcap | U.S. Total |
| | Growth | Market |
| | Index | Index |
| R-Squared | 0.97 | 0.93 |
| Beta | 0.89 | 1.03 |
| These measures show the degree and timing of the fund’s fluctuations compared with the indexes over 36 months. |
|
| |
| Ten Largest Holdings (% of total net assets) |
| SBA Communications | Wireless | |
| Corp. Class A | Telecommunication |
| | Services | 2.4% |
| O'Reilly Automotive Inc. | Automotive Retail | 2.1 |
| VeriSign Inc. | Internet Software & |
| | Services | 1.9 |
| Invesco Ltd. | Asset Management |
| | & Custody Banks | 1.9 |
| CH Robinson Worldwide | Air Freight & | |
| Inc. | Logistics | 1.8 |
| Discovery | Broadcasting | |
| Communications Inc. | | 1.8 |
| CarMax Inc. | Automotive Retail | 1.8 |
| Green Mountain Coffee | Packaged Foods & |
| Roasters Inc. | Meats | 1.7 |
| Gardner Denver Inc. | Industrial | |
| | Machinery | 1.7 |
| Stericycle Inc. | Environmental & | |
| | Facilities Services | 1.6 |
| Top Ten | | 18.7% |
| The holdings listed exclude any temporary cash investments and equity index products. |
Investment Focus
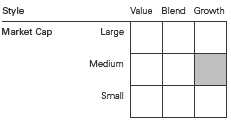
1 The expense ratio shown is from the prospectus dated February 25, 2010, and represents estimated costs for the current fiscal year. For the fiscal year ended October 31, 2010, the expense ratio was 0.51%.
10
Mid-Cap Growth Fund
Performance Summary
All of the returns in this report represent past performance, which is not a guarantee of future results that may be achieved by the fund. (Current performance may be lower or higher than the performance data cited. For performance data current to the most recent month-end, visit our website at vanguard.com/performance.) Note, too, that both investment returns and principal value can fluctuate widely, so an investor’s shares, when sold, could be worth more or less than their original cost. The returns shown do not reflect taxes that a shareholder would pay on fund distributions or on the sale of fund shares.
Cumulative Performance: October 31, 2000, Through October 31, 2010
Initial Investment of $10,000
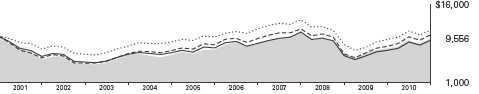
| | | | |
| | Average Annual Total Returns | |
| | Periods Ended October 31, 2010 | |
| | | | | Final Value |
| | One | Five | Ten | of a $10,000 |
| | Year | Years | Years | Investment |
| Mid-Cap Growth Fund | 26.70% | 5.45% | -0.45% | $9,556 |
| Dow Jones U.S. Total Stock Market | | | | |
| Index | 19.04 | 2.52 | 1.02 | 11,073 |
| Russell Midcap Growth Index | 28.03 | 4.28 | 0.20 | 10,206 |
| Mid-Cap Growth Funds Average | 27.16 | 3.56 | -0.89 | 9,140 |
Mid-Cap Growth Funds Average: Derived from data provided by Lipper Inc.
Fiscal-Year Total Returns (%): October 31, 2000, Through October 31, 2010
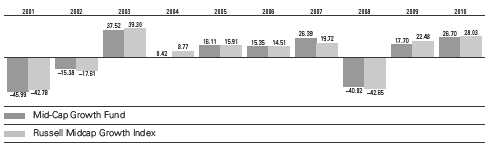
See Financial Highlights for dividend and capital gains information.
11
Mid-Cap Growth Fund
Average Annual Total Returns: Periods Ended September 30, 2010
This table presents average annual total returns through the latest calendar quarter—rather than through the end of the fiscal period. Securities and Exchange Commission rules require that we provide this information.
| | | | |
| | Inception | One | Five | Ten |
| | Date | Year | Years | Years |
| Mid-Cap Growth Fund | 12/31/1997 | 16.30% | 3.93% | -1.74% |
12
Mid-Cap Growth Fund
Financial Statements
Statement of Net Assets
As of October 31, 2010
The fund reports a complete list of its holdings in regulatory filings four times in each fiscal year, at the quarter-ends. For the second and fourth fiscal quarters, the lists appear in the fund’s semiannual and annual reports to shareholders. For the first and third fiscal quarters, the fund files the lists with the Securities and Exchange Commission on Form N-Q. Shareholders can look up the fund’s Forms N-Q on the SEC’s website at sec.gov. Forms N-Q may also be reviewed and copied at the SEC’s Public Reference Room (see the back cover of this report for further information).
| | | |
| | | | Market |
| | | | Value |
| | | Shares | ($000) |
| Common Stocks (94.0%)1 | | |
| Consumer Discretionary (18.9%) | |
| * | O’Reilly Automotive Inc. | 553,600 | 32,386 |
| * | CarMax Inc. | 887,100 | 27,491 |
| * | Warnaco Group Inc. | 371,940 | 19,754 |
| * | WMS Industries Inc. | 429,250 | 18,728 |
| * | Royal Caribbean | | |
| | Cruises Ltd. | 443,825 | 17,549 |
| * | Discovery | | |
| | Communications Inc. | | |
| | Class A | 370,800 | 16,541 |
| * | Kohl’s Corp. | 277,665 | 14,217 |
| | Tiffany & Co. | 265,099 | 14,050 |
| * | Dick’s Sporting Goods Inc. | 463,025 | 13,344 |
| * | Interpublic Group | | |
| | of Cos. Inc. | 1,207,100 | 12,494 |
| * | priceline.com Inc. | 31,175 | 11,747 |
| * | Discovery | | |
| | Communications Inc. | 287,725 | 11,181 |
| * | Bed Bath & Beyond Inc. | 253,300 | 11,120 |
| | DeVry Inc. | 223,300 | 10,687 |
| | Darden Restaurants Inc. | 214,310 | 9,796 |
| * | Ulta Salon Cosmetics & | | |
| | Fragrance Inc. | 277,925 | 8,530 |
| * | Harman International | | |
| | Industries Inc. | 251,300 | 8,431 |
| | Gentex Corp. | 393,800 | 7,868 |
| | Scripps Networks | | |
| | Interactive Inc. Class A | 153,700 | 7,822 |
| | Jarden Corp. | 232,122 | 7,442 |
| * | Hanesbrands Inc. | 285,050 | 7,069 |
| * | Chipotle Mexican Grill Inc. | | |
| | Class A | 30,500 | 6,411 |
| | | | 294,658 |
| Consumer Staples (4.9%) | | |
| * | Green Mountain Coffee | | |
| | Roasters Inc. | 825,745 | 27,241 |
| | McCormick & Co. Inc. | 487,600 | 21,562 |
| | Mead Johnson Nutrition Co. | 247,300 | 14,546 |
| | | |
| | | | Market |
| | | | Value |
| | | Shares | ($000) |
| | Church & Dwight Co. Inc. | 107,200 | 7,059 |
| | Flowers Foods Inc. | 218,000 | 5,555 |
| | | | 75,963 |
| Energy (4.8%) | | |
| * | Whiting Petroleum Corp. | 179,305 | 18,009 |
| | EXCO Resources Inc. | 943,954 | 13,999 |
| * | Newfield Exploration Co. | 186,500 | 11,119 |
| * | Denbury Resources Inc. | 629,800 | 10,719 |
| * | Cameron International Corp. | 181,200 | 7,928 |
| | Patterson-UTI Energy Inc. | 258,425 | 5,016 |
| | Range Resources Corp. | 118,400 | 4,427 |
| * | Southwestern Energy Co. | 129,500 | 4,384 |
| | | | 75,601 |
| Exchange-Traded Fund (0.4%) | |
| ^,2 | Vanguard Mid-Cap ETF | 82,700 | 5,708 |
| |
| Financials (8.9%) | | |
| | Invesco Ltd. | 1,301,850 | 29,943 |
| | Discover Financial | | |
| | Services | 1,289,089 | 22,752 |
| | Greenhill & Co. Inc. | 292,085 | 22,686 |
| * | Intercontinental- | | |
| | Exchange Inc. | 177,450 | 20,384 |
| | Assured Guaranty Ltd. | 851,985 | 16,230 |
| * | MSCI Inc. Class A | 420,450 | 15,073 |
| * | Affiliated Managers | | |
| | Group Inc. | 139,490 | 11,942 |
| | | | 139,010 |
| Health Care (15.4%) | | |
| * | Illumina Inc. | 425,830 | 23,127 |
| * | Varian Medical | | |
| | Systems Inc. | 323,500 | 20,452 |
| * | Bruker Corp. | 1,194,870 | 17,911 |
| * | IDEXX Laboratories Inc. | 268,155 | 16,079 |
| * | Express Scripts Inc. | 315,390 | 15,303 |
| * | HMS Holdings Corp. | 246,800 | 14,835 |
| * | Cerner Corp. | 168,467 | 14,796 |
| * | Mettler-Toledo | | |
| | International Inc. | 108,175 | 14,123 |
13
Mid-Cap Growth Fund
| | | |
| | | | Market |
| | | | Value |
| | | Shares | ($000) |
| * | CareFusion Corp. | 579,482 | 13,989 |
| | Perrigo Co. | 201,600 | 13,281 |
| * | Mylan Inc. | 580,500 | 11,796 |
| * | Life Technologies Corp. | 226,500 | 11,366 |
| * | American Medical Systems | | |
| | Holdings Inc. | 561,900 | 11,350 |
| * | QIAGEN NV | 539,748 | 10,153 |
| * | United Therapeutics Corp. | 163,000 | 9,780 |
| * | Alexion Pharmaceuticals Inc. | 111,265 | 7,599 |
| | AmerisourceBergen Corp. | | |
| | Class A | 227,300 | 7,460 |
| * | Intuitive Surgical Inc. | 19,700 | 5,180 |
| * | Human Genome | | |
| | Sciences Inc. | 85,275 | 2,292 |
| | | | 240,872 |
| Industrials (16.0%) | | |
| | CH Robinson | | |
| | Worldwide Inc. | 404,210 | 28,489 |
| | Gardner Denver Inc. | 458,475 | 26,509 |
| * | Stericycle Inc. | 353,490 | 25,359 |
| | Robert Half | | |
| | International Inc. | 896,500 | 24,304 |
| * | TransDigm Group Inc. | 301,200 | 19,960 |
| | Roper Industries Inc. | 232,490 | 16,142 |
| | Goodrich Corp. | 196,525 | 16,129 |
| | MSC Industrial Direct Co. | | |
| | Class A | 264,600 | 15,066 |
| | Fastenal Co. | 292,507 | 15,058 |
| | Kennametal Inc. | 426,650 | 14,566 |
| | Rockwell Automation Inc. | 189,400 | 11,813 |
| | Expeditors International | | |
| | of Washington Inc. | 202,100 | 9,976 |
| | Ingersoll-Rand plc | 245,150 | 9,637 |
| * | Babcock & Wilcox Co. | 397,337 | 9,067 |
| | Manpower Inc. | 144,800 | 7,925 |
| | | | 250,000 |
| | | | |
| | | | | Market |
| | | | | Value |
| | | | Shares | ($000) |
| Information Technology (20.2%) | |
| * | VeriSign Inc. | | 869,700 | 30,222 |
| * | Concur Technologies Inc. | 467,032 | 24,108 |
| * | Trimble Navigation Ltd. | 564,721 | 20,240 |
| * | Alliance Data | | | |
| | Systems Corp. | | 287,710 | 17,470 |
| * | Intuit Inc. | | 359,825 | 17,272 |
| * | NetApp Inc. | | 321,785 | 17,135 |
| * | Informatica Corp. | | 404,745 | 16,469 |
| * | NICE Systems Ltd. ADR | 481,700 | 16,132 |
| * | MICROS Systems Inc. | 351,972 | 15,976 |
| * | Gartner Inc. | | 501,225 | 15,884 |
| * | Silicon Laboratories Inc. | 356,138 | 14,210 |
| * | Cognizant Technology | | |
| | Solutions Corp. Class A | 210,655 | 13,732 |
| * | Marvell Technology | | | |
| | Group Ltd. | | 660,375 | 12,752 |
| * | Skyworks Solutions Inc. | 523,350 | 11,990 |
| * | Dolby Laboratories Inc. | | |
| | Class A | | 193,400 | 11,929 |
| * | Citrix Systems Inc. | | 182,100 | 11,667 |
| | Solera Holdings Inc. | 225,750 | 10,847 |
| * | Atheros | | | |
| | Communications Inc. | 333,700 | 10,358 |
| * | F5 Networks Inc. | | 82,138 | 9,668 |
| | Sapient Corp. | | 726,201 | 9,557 |
| *,^ | Rackspace Hosting Inc. | 304,425 | 7,598 |
| | | | | 315,216 |
| Materials (2.2%) | | | |
| | Ecolab Inc. | | 418,710 | 20,651 |
| | Greif Inc. Class A | | 235,600 | 13,839 |
| | | | | 34,490 |
| Telecommunication Services (2.3%) | |
| * | SBA Communications Corp. | | |
| | Class A | | 936,850 | 36,781 |
| Total Common Stocks | | | |
| (Cost $1,119,150) | | | 1,468,299 |
| Temporary Cash Investments (6.8%)1 | |
| Money Market Fund (6.5%) | | |
| 3,4 | Vanguard Market | | | |
| | Liquidity Fund, | | | |
| | 0.237% | | 101,663,810 | 101,664 |
14
Mid-Cap Growth Fund
| | | |
| | | Face | Market |
| | | Amount | Value |
| | | ($000) | ($000) |
| U.S. Government and Agency Obligations (0.3%) |
| 5,6 | Freddie Mac | | |
| | Discount Notes, | | |
| | 0.295%, 12/15/10 | 500 | 500 |
| 5,6 | Freddie Mac | | |
| | Discount Notes, | | |
| | 0.271%, 6/7/11 | 1,000 | 998 |
| 5,6 | Freddie Mac | | |
| | Discount Notes, | | |
| | 0.281%, 6/21/11 | 2,500 | 2,496 |
| | | | 3,994 |
| Total Temporary Cash Investments | |
| (Cost $105,656) | | 105,658 |
| Total Investments (100.8%) | | |
| (Cost $1,224,806) | | 1,573,957 |
| Other Assets and Liabilities (-0.8%) | |
| Other Assets | | 48,972 |
| Liabilities4 | | (61,169) |
| | | | (12,197) |
| Net Assets (100%) | | |
| Applicable to 89,026,915 outstanding | |
| $.001 par value shares of beneficial | |
| interest (unlimited authorization) | 1,561,760 |
| Net Asset Value Per Share | | $17.54 |
At October 31, 2010, net assets consisted of:
| |
| | Amount |
| | ($000) |
| Paid-in Capital | 1,432,166 |
| Overdistributed Net Investment Income | (1,753) |
| Accumulated Net Realized Losses | (220,632) |
| Unrealized Appreciation (Depreciation) | |
| Investment Securities | 349,151 |
| Futures Contracts | 2,828 |
| Net Assets | 1,561,760 |
See Note A in Notes to Financial Statements.
* Non-income-producing security.
^ Part of security position is on loan to broker-dealers. The total value of securities on loan is $6,287,000.
1 The fund invests a portion of its cash reserves in equity markets through the use of index futures contracts. After giving effect to futures investments, the fund’s effective common stock and temporary cash investment positions represent 97.0% and 3.8%, respectively, of net assets.
2 Considered an affiliated company of the fund as the issuer is another member of The Vanguard Group.
3 Affiliated money market fund available only to Vanguard funds and certain trusts and accounts managed by Vanguard. Rate shown is the 7-day yield.
4 Includes $6,500,000 of collateral received for securities on loan.
5 The issuer operates under a congressional charter; its securities are not backed by the full faith and credit of the U.S. government.
6 Securities with a value of $3,994,000 have been segregated as initial margin for open futures contracts.
ADR—American Depositary Receipt.
See accompanying Notes, which are an integral part of the Financial Statements.
15
Mid-Cap Growth Fund
Statement of Operations
| |
| | Year Ended |
| | October 31, 2010 |
| | ($000) |
| Investment Income | |
| Income | |
| Dividends1 | 6,799 |
| Interest1 | 191 |
| Security Lending | 127 |
| Total Income | 7,117 |
| Expenses | |
| Investment Advisory Fees—Note B | |
| Basic Fee | 3,221 |
| Performance Adjustment | (120) |
| The Vanguard Group—Note C | |
| Management and Administrative | 3,573 |
| Marketing and Distribution | 366 |
| Custodian Fees | 28 |
| Auditing Fees | 27 |
| Shareholders’ Reports | 26 |
| Trustees’ Fees and Expenses | 3 |
| Total Expenses | 7,124 |
| Expenses Paid Indirectly | (70) |
| Net Expenses | 7,054 |
| Net Investment Income | 63 |
| Realized Net Gain (Loss) | |
| Investment Securities Sold1 | 142,598 |
| Futures Contracts | 1,627 |
| Realized Net Gain (Loss) | 144,225 |
| Change in Unrealized Appreciation (Depreciation) | |
| Investment Securities | 176,701 |
| Futures Contracts | 4,353 |
| Change in Unrealized Appreciation (Depreciation) | 181,054 |
| Net Increase (Decrease) in Net Assets Resulting from Operations | 325,342 |
| 1 Dividend income, interest income, and realized net gain (loss) from affiliated companies of the fund were $58,000, $176,000, and $0, respectively. |
See accompanying Notes, which are an integral part of the Financial Statements.
16
Mid-Cap Growth Fund
Statement of Changes in Net Assets
| | |
| | Year Ended October 31, |
| | 2010 | 2009 |
| | ($000) | ($000) |
| Increase (Decrease) in Net Assets | | |
| Operations | | |
| Net Investment Income | 63 | 1,519 |
| Realized Net Gain (Loss) | 144,225 | (158,994) |
| Change in Unrealized Appreciation (Depreciation) | 181,054 | 333,481 |
| Net Increase (Decrease) in Net Assets Resulting from Operations | 325,342 | 176,006 |
| Distributions | | |
| Net Investment Income | (1,593) | (2,949) |
| Realized Capital Gain | — | — |
| Total Distributions | (1,593) | (2,949) |
| Capital Share Transactions | | |
| Issued | 315,543 | 412,258 |
| Issued in Lieu of Cash Distributions | 1,550 | 2,849 |
| Redeemed | (307,588) | (240,237) |
| Net Increase (Decrease) from Capital Share Transactions | 9,505 | 174,870 |
| Total Increase (Decrease) | 333,254 | 347,927 |
| Net Assets | | |
| Beginning of Period | 1,228,506 | 880,579 |
| End of Period1 | 1,561,760 | 1,228,506 |
| 1 Net Assets—End of Period includes undistributed (overdistributed) net investment income of ($1,753,000) and ($223,000). |
See accompanying Notes, which are an integral part of the Financial Statements.
17
Mid-Cap Growth Fund
Financial Highlights
| | | | | |
| For a Share Outstanding | | | Year Ended October 31, |
| Throughout Each Period | 2010 | 2009 | 2008 | 2007 | 2006 |
| Net Asset Value, Beginning of Period | $13.86 | $11.82 | $20.90 | $19.12 | $16.58 |
| Investment Operations | | | | | |
| Net Investment Income | .001 | .0211 | .035 | .044 | .055 |
| Net Realized and Unrealized Gain (Loss) | | | | | |
| on Investments | 3.697 | 2.059 | (8.024) | 4.455 | 2.490 |
| Total from Investment Operations | 3.698 | 2.080 | (7.989) | 4.499 | 2.545 |
| Distributions | | | | | |
| Dividends from Net Investment Income | (.018) | (.040) | (.045) | (.044) | (.005) |
| Distributions from Realized Capital Gains | — | — | (1.046) | (2.675) | — |
| Total Distributions | (.018) | (.040) | (1.091) | (2.719) | (.005) |
| Net Asset Value, End of Period | $17.54 | $13.86 | $11.82 | $20.90 | $19.12 |
| |
| Total Return2 | 26.70% | 17.70% | -40.02% | 26.39% | 15.35% |
| |
| Ratios/Supplemental Data | | | | | |
| Net Assets, End of Period (Millions) | $1,562 | $1,229 | $881 | $1,289 | $793 |
| Ratio of Total Expenses to | | | | | |
| Average Net Assets3 | 0.51% | 0.60% | 0.55% | 0.56% | 0.50% |
| Ratio of Net Investment Income to | | | | | |
| Average Net Assets | 0.00% | 0.16%1 | 0.20% | 0.27% | 0.26% |
| Portfolio Turnover Rate | 88% | 125% | 85% | 70% | 159% |
1 Net investment income per share and the ratio of net investment income to average net assets include $0.02 and 0.19%, respectively, resulting from a special dividend from TransDigm Group Inc. in October 2009.
2 Total returns do not include account service fees that may have applied in the periods shown. Fund prospectuses provide information about any applicable account service fees.
3 Includes performance-based investment advisory fee increases (decreases) of (0.01%), 0.02%, 0.03%, 0.03%, and (0.04%).
See accompanying Notes, which are an integral part of the Financial Statements.
18
Mid-Cap Growth Fund
Notes to Financial Statements
Vanguard Mid-Cap Growth Fund is registered under the Investment Company Act of 1940 as an open-end investment company, or mutual fund.
A. The following significant accounting policies conform to generally accepted accounting principles for U.S. mutual funds. The fund consistently follows such policies in preparing its financial statements.
1. Security Valuation: Securities are valued as of the close of trading on the New York Stock Exchange (generally 4 p.m., Eastern time) on the valuation date. Equity securities are valued at the latest quoted sales prices or official closing prices taken from the primary market in which each security trades; such securities not traded on the valuation date are valued at the mean of the latest quoted bid and asked prices. Securities for which market quotations are not readily available, or whose values have been materially affected by events occurring before the fund’s pricing time but after the close of the securities’ primary markets, are valued by methods deemed by the board of trustees to represent fair value. Investments in Vanguard Market Liquidity Fund are valued at that fund’s net asset value. Temporary cash investments acquired over 60 days to maturity are valued using the latest bid prices or using valuations based on a matrix system (which con siders such factors as security prices, yields, maturities, and ratings), both as furnished by independent pricing services. Other temporary cash investments are valued at amortized cost, which approximates market value.
2. Futures Contracts: The fund uses index futures contracts to a limited extent, with the objective of maintaining full exposure to the stock market while maintaining liquidity. The fund may purchase or sell futures contracts to achieve a desired level of investment, whether to accommodate portfolio turnover or cash flows from capital share transactions. The primary risks associated with the use of futures contracts are imperfect correlation between changes in market values of stocks held by the fund and the prices of futures contracts, and the possibility of an illiquid market.
Futures contracts are valued at their quoted daily settlement prices. The aggregate principal amounts of the contracts are not recorded in the Statement of Net Assets. Fluctuations in the value of the contracts are recorded in the Statement of Net Assets as an asset (liability) and in the Statement of Operations as unrealized appreciation (depreciation) until the contracts are closed, when they are recorded as realized futures gains (losses).
3. Federal Income Taxes: The fund intends to continue to qualify as a regulated investment company and distribute all of its taxable income. Management has analyzed the fund’s tax positions taken for all open federal income tax years (October 31, 2007–2010), and has concluded that no provision for federal income tax is required in the fund’s financial statements.
4. Distributions: Distributions to shareholders are recorded on the ex-dividend date.
5. Security Lending: The fund may lend its securities to qualified institutional borrowers to earn additional income. Security loans are required to be secured at all times by collateral at least equal to the market value of securities loaned. The fund invests cash collateral received in Vanguard Market Liquidity Fund, and records a liability for the return of the collateral, during the period the securities are on loan. Security lending income represents fees charged to borrowers plus income earned on investing cash collateral, less expenses associated with the loan.
6. Other: Dividend income is recorded on the ex-dividend date. Interest income includes income distributions received from Vanguard Market Liquidity Fund and is accrued daily. Security transactions are accounted for on the date securities are bought or sold. Costs used to determine realized gains (losses) on the sale of investment securities are those of the specific securities sold.
19
Mid-Cap Growth Fund
B. William Blair & Company, L.L.C., and Chartwell Investment Partners, L.P., each provide investment advisory services to a portion of the fund for a fee calculated at an annual percentage rate of average net assets managed by the advisor. The basic fee for William Blair & Company, L.L.C., is subject to quarterly adjustments based on performance since July 31, 2006, relative to the Russell Midcap Growth Index. The basic fee for Chartwell Investment Partners, L.P., is subject to quarterly adjustments based on performance for the preceding three years relative to the Russell Midcap Growth Index.
The Vanguard Group manages the cash reserves of the fund on an at-cost basis.
For the year ended October 31, 2010, the aggregate investment advisory fee represented an effective annual basic rate of 0.23% of the fund’s average net assets, before a decrease of $120,000 (0.01%) based on performance.
C. The Vanguard Group furnishes at cost corporate management, administrative, marketing, and distribution services. The costs of such services are allocated to the fund under methods approved by the board of trustees. The fund has committed to provide up to 0.40% of its net assets in capital contributions to Vanguard. At October 31, 2010, the fund had contributed capital of $269,000 to Vanguard (included in Other Assets), representing 0.02% of the fund’s net assets and 0.11% of Vanguard’s capitalization. The fund’s trustees and officers are also directors and officers of Vanguard.
D. The fund has asked its investment advisors to direct certain security trades, subject to obtaining the best price and execution, to brokers who have agreed to rebate to the fund part of the commissions generated. Such rebates are used solely to reduce the fund’s management and administrative expenses. For the year ended October 31, 2010, these arrangements reduced the fund’s expenses by $70,000 (an annual rate of 0.01% of average net assets).
E. Various inputs may be used to determine the value of the fund’s investments. These inputs are summarized in three broad levels for financial statement purposes. The inputs or methodologies used to value securities are not necessarily an indication of the risk associated with investing in those securities.
Level 1—Quoted prices in active markets for identical securities.
Level 2—Other significant observable inputs (including quoted prices for similar securities, interest rates, prepayment speeds, credit risk, etc.).
Level 3—Significant unobservable inputs (including the fund’s own assumptions used to determine the fair value of investments).
The following table summarizes the fund’s investments as of October 31, 2010, based on the inputs used to value them:
| | | |
| | Level 1 | Level 2 | Level 3 |
| Investments | ($000) | ($000) | ($000) |
| Common Stocks | 1,468,299 | — | — |
| Temporary Cash Investments | 101,664 | 3,994 | — |
| Futures Contracts—Assets1 | 246 | — | — |
| Total | 1,570,209 | 3,994 | — |
| 1 Represents variation margin on the last day of the reporting period. |
20
Mid-Cap Growth Fund
F. At October 31, 2010, the aggregate settlement value of open futures contracts and the related unrealized appreciation (depreciation) were:
| | | | |
| | | | | ($000) |
| | | Number of | Aggregate | Unrealized |
| | | Long (Short) | Settlement | Appreciation |
| Futures Contracts | Expiration | Contracts | Value | (Depreciation) |
| S&P MidCap 400 Index | December 2010 | 66 | 27,308 | 1,769 |
| E-mini Russell 2000 Index | December 2010 | 186 | 13,061 | 667 |
| E-mini S&P MidCap Index | December 2010 | 81 | 6,703 | 392 |
Unrealized appreciation (depreciation) on open futures contracts is required to be treated as realized gain (loss) for tax purposes.
G. Distributions are determined on a tax basis and may differ from net investment income and realized capital gains for financial reporting purposes. Differences may be permanent or temporary. Permanent differences are reclassified among capital accounts in the financial statements to reflect their tax character. Temporary differences arise when certain items of income, expense, gain, or loss are recognized in different periods for financial statement and tax purposes; these differences will reverse at some time in the future. Differences in classification may also result from the treatment of short-term gains as ordinary income for tax purposes.
For tax purposes, at October 31, 2010, the fund had $248,000 of ordinary income available for distribution. The fund had available capital loss carryforwards totaling $217,146,000 to offset future net capital gains of $57,252,000 through October 31, 2016, and $159,894,000 through October 31, 2017.
At October 31, 2010, the cost of investment securities for tax purposes was $1,225,289,000. Net unrealized appreciation of investment securities for tax purposes was $348,668,000, consisting of unrealized gains of $359,316,000 on securities that had risen in value since their purchase and $10,648,000 in unrealized losses on securities that had fallen in value since their purchase.
H. During the year ended October 31, 2010, the fund purchased $1,145,135,000 of investment securities and sold $1,175,872,000 of investment securities, other than temporary cash investments.
I. Capital shares issued and redeemed were:
| | |
| | Year Ended October 31, |
| | 2010 | 2009 |
| | Shares | Shares |
| | (000) | (000) |
| Issued | 20,103 | 34,005 |
| Issued in Lieu of Cash Distributions | 104 | 267 |
| Redeemed | (19,798) | (20,163) |
| Net Increase (Decrease) in Shares Outstanding | 409 | 14,109 |
J. In preparing the financial statements as of October 31, 2010, management considered the impact of subsequent events for potential recognition or disclosure in these financial statements.
21
Report of Independent Registered
Public Accounting Firm
To the Trustees of Vanguard Whitehall Funds and the Shareholders of Vanguard Mid-Cap Growth Fund:
In our opinion, the accompanying statement of net assets and the related statements of operations and of changes in net assets and the financial highlights present fairly, in all material respects, the financial position of Vanguard Mid-Cap Growth Fund (constituting a separate portfolio of Vanguard Whitehall Funds, hereafter referred to as the “Fund”) at October 31, 2010, the results of its operations for the year then ended, the changes in its net assets for each of the two years in the period then ended and the financial highlights for each of the five years in the period then ended, in conformity with accounting principles generally accepted in the United States of America. These financial statements and financial highlights (hereafter referred to as “financial statements”) are the responsibility of the Fund’s management; our responsibility is to express an opinion on these financial statements based on our audits. We conducted our audits o f these financial statements in accordance with the standards of the Public Company Accounting Oversight Board (United States). Those standards require that we plan and perform the audit to obtain reasonable assurance about whether the financial statements are free of material misstatement. An audit includes examining, on a test basis, evidence supporting the amounts and disclosures in the financial statements, assessing the accounting principles used and significant estimates made by management, and evaluating the overall financial statement presentation. We believe that our audits, which included confirmation of securities at October 31, 2010 by correspondence with the custodian and broker and by agreement to the underlying ownership records of Vanguard Market Liquidity Fund, provide a reasonable basis for our opinion.
PricewaterhouseCoopers LLP
Philadelphia, Pennsylvania
December 14, 2010
|
| Special 2010 tax information (unaudited) for Vanguard Mid-Cap Growth Fund |
This information for the fiscal year ended October 31, 2010, is included pursuant to provisions of the Internal Revenue Code.
The fund distributed $1,593,000 of qualified dividend income to shareholders during the fiscal year.
For corporate shareholders, 100% of investment income (dividend income plus short-term gains, if any) qualifies for the dividends-received deduction.
22
Your Fund’s After-Tax Returns
This table presents returns for your fund both before and after taxes. The after-tax returns are shown in two ways: (1) assuming that an investor owned the fund during the entire period and paid taxes on the fund’s distributions, and (2) assuming that an investor paid taxes on the fund’s distributions and sold all shares at the end of each period.
Calculations are based on the highest individual federal income tax and capital gains tax rates in effect at the times of the distributions and the hypothetical sales. State and local taxes were not considered. After-tax returns reflect any qualified dividend income , using actual prior-year figures and estimates for 2010. (In the example, returns after the sale of fund shares may be higher than those assuming no sale. This occurs when the sale would have produced a capital loss. The calculation assumes that the investor received a tax deduction for the loss.) Please note that your actual after-tax returns will depend on your tax situation and may differ from those shown. Also note that if you own the fund in a tax-deferred account, such as an individual retirement account or a 401(k) plan, this information does not apply to you. Such accounts are not subject to current taxes.
Finally, keep in mind that a fund’s performance—whether before or after taxes—does not guarantee future results.
Average Annual Total Returns: Mid-Cap Growth Fund
Periods Ended October 31, 2010
| | | |
| | One | Five | Ten |
| | Year | Years | Years |
| Returns Before Taxes | 26.70% | 5.45% | -0.45% |
| Returns After Taxes on Distributions | 26.68 | 4.67 | -1.64 |
| Returns After Taxes on Distributions and Sale of Fund Shares | 17.38 | 4.52 | -0.90 |
23
About Your Fund’s Expenses
As a shareholder of the fund, you incur ongoing costs, which include costs for portfolio management, administrative services, and shareholder reports (like this one), among others. Operating expenses, which are deducted from a fund’s gross income, directly reduce the investment return of the fund.
A fund’s expenses are expressed as a percentage of its average net assets. This figure is known as the expense ratio. The following examples are intended to help you understand the ongoing costs (in dollars) of investing in your fund and to compare these costs with those of other mutual funds. The examples are based on an investment of $1,000 made at the beginning of the period shown and held for the entire period.
The accompanying table illustrates your fund’s costs in two ways:
• Based on actual fund return. This section helps you to estimate the actual expenses that you paid over the period. The ”Ending Account Value“ shown is derived from the fund‘s actual return, and the third column shows the dollar amount that would have been paid by an investor who started with $1,000 in the fund. You may use the information here, together with the amount you invested, to estimate the expenses that you paid over the period.
To do so, simply divide your account value by $1,000 (for example, an $8,600 account value divided by $1,000 = 8.6), then multiply the result by the number given for your fund under the heading ”Expenses Paid During Period.“
• Based on hypothetical 5% yearly return. This section is intended to help you compare your fund‘s costs with those of other mutual funds. It assumes that the fund had a yearly return of 5% before expenses, but that the expense ratio is unchanged. In this case—because the return used is not the fund’s actual return—the results do not apply to your investment. The example is useful in making comparisons because the Securities and Exchange Commission requires all mutual funds to calculate expenses based on a 5% return. You can assess your fund’s costs by comparing this hypothetical example with the hypothetical examples that appear in shareholder reports of other funds.
Note that the expenses shown in the table are meant to highlight and help you compare ongoing costs only and do not reflect transaction costs incurred by the fund for buying and selling securities. Further, the expenses do not include the account service fee described in the prospectus. If such a fee were applied to your account, your costs would be higher. Your fund does not charge transaction fees, such as purchase or redemption fees, nor does it carry a “sales load.” The calculations assume no shares were bought or sold during the period. Your actual costs may have been higher or lower, depending on the amount of your investment and the timing of any purchases or redemptions.
You can find more information about the fund’s expenses, including annual expense ratios, in the Financial Statements section of this report. For additional information on operating expenses and other shareholder costs, please refer to your fund’s current prospectus.
24
Six Months Ended October 31, 2010
| | | |
| | Beginning | Ending | Expenses |
| | Account Value | Account Value | Paid During |
| Mid-Cap Growth Fund | 4/30/2010 | 10/31/2010 | Period |
| Based on Actual Fund Return | $1,000.00 | $1,046.54 | $2.42 |
| Based on Hypothetical 5% Yearly Return | 1,000.00 | 1,022.84 | 2.40 |
The calculations are based on expenses incurred in the most recent six-month period. The fund’s annualized six-month expense ratio for that period is 0.47%. The dollar amounts shown as “Expenses Paid” are equal to the annualized expense ratio multiplied by the average account value over the period, multiplied by the number of days in the most recent six-month period, then divided by the number of days in the most recent 12-month period.
25
Glossary
30-Day SEC Yield. A fund’s 30-day SEC yield is derived using a formula specified by the U.S. Securities and Exchange Commission. Under the formula, data related to the fund’s security holdings in the previous 30 days are used to calculate the fund’s hypothetical net income for that period, which is then annualized and divided by the fund’s estimated average net assets over the calculation period. For the purposes of this calculation, a security’s income is based on its current market yield to maturity (in the case of bonds) or its projected dividend yield (for stocks). Because the SEC yield represents hypothetical annualized income, it will differ—at times significantly—from the fund’s actual experience. As a result, the fund’s income distributions may be higher or lower than implied by the SEC yield.
Beta. A measure of the magnitude of a fund’s past share-price fluctuations in relation to the ups and downs of a given market index. The index is assigned a beta of 1.00. Compared with a given index, a fund with a beta of 1.20 typically would have seen its share price rise or fall by 12% when the index rose or fell by 10%. For this report, beta is based on returns over the past 36 months for both the fund and the index. Note that a fund’s beta should be reviewed in conjunction with its R-squared (see definition). The lower the R-squared, the less correlation there is between the fund and the index, and the less reliable beta is as an indicator of volatility.
Dividend Yield. Dividend income earned by stocks, expressed as a percentage of the aggregate market value (or of net asset value, for a fund). The yield is determined by dividing the amount of the annual dividends by the aggregate value (or net asset value) at the end of the period. For a fund, the dividend yield is based solely on stock holdings and does not include any income produced by other investments.
Earnings Growth Rate. The average annual rate of growth in earnings over the past five years for the stocks now in a fund.
Equity Exposure. A measure that reflects a fund’s investments in stocks and stock futures. Any holdings in short-term reserves are excluded.
Expense Ratio. The percentage of a fund’s average net assets used to pay its annual administrative and advisory expenses. These expenses directly reduce returns to investors.
Foreign Holdings. The percentage of a fund represented by stocks or depositary receipts of companies based outside the United States.
Inception Date. The date on which the assets of a fund (or one of its share classes) are first invested in accordance with the fund’s investment objective. For funds with a subscription period, the inception date is the day after that period ends. Investment performance is measured from the inception date.
Median Market Cap. An indicator of the size of companies in which a fund invests; the midpoint of market capitalization (market price x shares outstanding) of a fund’s stocks, weighted by the proportion of the fund’s assets invested in each stock. Stocks representing half of the fund’s assets have market capitalizations above the median, and the rest are below it.
Price/Book Ratio. The share price of a stock divided by its net worth, or book value, per share. For a fund, the weighted average price/book ratio of the stocks it holds.
26
Price/Earnings Ratio. The ratio of a stock’s current price to its per-share earnings over the past year. For a fund, the weighted average P/E of the stocks it holds. P/E is an indicator of market expectations about corporate prospects; the higher the P/E, the greater the expectations for a company’s future growth.
R-Squared. A measure of how much of a fund’s past returns can be explained by the returns from the market in general, as measured by a given index. If a fund’s total returns were precisely synchronized with an index’s returns, its R-squared would be 1.00. If the fund’s returns bore no relationship to the index’s returns, its R-squared would be 0. For this report, R-squared is based on returns over the past 36 months for both the fund and the index.
Return on Equity. The annual average rate of return generated by a company during the past five years for each dollar of shareholder’s equity (net income divided by shareholder’s equity). For a fund, the weighted average return on equity for the companies whose stocks it holds.
Short-Term Reserves. The percentage of a fund invested in highly liquid, short-term securities that can be readily converted to cash.
Turnover Rate. An indication of the fund’s trading activity. Funds with high turnover rates incur higher transaction costs and may be more likely to distribute capital gains (which may be taxable to investors). The turnover rate excludes in-kind transactions, which have minimal impact on costs.
27
The People Who Govern Your Fund
The trustees of your mutual fund are there to see that the fund is operated and managed in your best interests since, as a shareholder, you are a part owner of the fund. Your fund’s trustees also serve on the board of directors of The Vanguard Group, Inc., which is owned by the Vanguard funds and provides services to them on an at-cost basis.
A majority of Vanguard’s board members are independent, meaning that they have no affiliation with Vanguard or the funds they oversee, apart from the sizable personal investments they have made as private individuals. The independent board members have distinguished backgrounds in business, academia, and public service. Each of the trustees and executive officers oversees 178 Vanguard funds.
The following table provides information for each trustee and executive officer of the fund. More information about the trustees is in the Statement of Additional Information, which can be obtained, without charge, by contacting Vanguard at 800-662-7447, or online at vanguard.com.
| |
| Interested Trustee1 | Amy Gutmann |
| | Born 1949. Trustee Since June 2006. Principal |
| F. William McNabb III | Occupation(s) During the Past Five Years: President |
| Born 1957. Trustee Since July 2009. Chairman of the | of the University of Pennsylvania; Christopher H. |
| Board. Principal Occupation(s) During the Past Five | Browne Distinguished Professor of Political Science |
| Years: Chairman of the Board of The Vanguard Group, | in the School of Arts and Sciences with secondary |
| Inc., and of each of the investment companies served | appointments at the Annenberg School for Commu- |
| by The Vanguard Group, since January 2010; Director | nication and the Graduate School of Education |
| of The Vanguard Group since 2008; Chief Executive | of the University of Pennsylvania; Director of |
| Officer and President of The Vanguard Group and of | Carnegie Corporation of New York, Schuylkill River |
| each of the investment companies served by The | Development Corporation, and Greater Philadelphia |
| Vanguard Group since 2008; Director of Vanguard | Chamber of Commerce; Trustee of the National |
| Marketing Corporation; Managing Director of The | Constitution Center; Chair of the Presidential |
| Vanguard Group (1995–2008). | Commission for the Study of Bioethical Issues. |
| |
| | JoAnn Heffernan Heisen |
| Independent Trustees | Born 1950. Trustee Since July 1998. Principal |
| | Occupation(s) During the Past Five Years: Corporate |
| Emerson U. Fullwood | Vice President and Chief Global Diversity Officer |
| Born 1948. Trustee Since January 2008. Principal | since 2006 (retired 2008) and Member of the |
| Occupation(s) During the Past Five Years: Executive | Executive Committee (retired 2008) of Johnson & |
| Chief Staff and Marketing Officer for North America | Johnson (pharmaceuticals/consumer products); Vice |
| and Corporate Vice President (retired 2008) of Xerox | President and Chief Information Officer of Johnson & |
| Corporation (document management products and | Johnson (1997–2005); Director of the University |
| services); Director of SPX Corporation (multi-industry | Medical Center at Princeton and Women’s Research |
| manufacturing), the United Way of Rochester, | and Education Institute; Member of the Advisory |
| Amerigroup Corporation (managed health care), | Board of the Maxwell School of Citizenship and Public |
| the University of Rochester Medical Center, and | Affairs at Syracuse University. |
| Monroe Community College Foundation. | |
| | F. Joseph Loughrey |
| Rajiv L. Gupta | Born 1949. Trustee Since October 2009. Principal |
| Born 1945. Trustee Since December 2001.2 | Occupation(s) During the Past Five Years: President |
| Principal Occupation(s) During the Past Five Years: | and Chief Operating Officer since 2005 (retired 2009) |
| Chairman and Chief Executive Officer (retired 2009) | and Vice Chairman of the Board (2008–2009) of |
| and President (2006–2008) of Rohm and Haas Co. | Cummins Inc. (industrial machinery); Director of |
| (chemicals); Director of Tyco International, Ltd. | SKF AB (industrial machinery), Hillenbrand, Inc. |
| (diversified manufacturing and services) and Hewlett- | (specialized consumer services), Sauer-Danfoss Inc. |
| Packard Co. (electronic computer manufacturing); | (machinery), the Lumina Foundation for Education, |
| Trustee of The Conference Board; Member of the | and Oxfam America; Chairman of the Advisory |
| Board of Managers of Delphi Automotive LLP | Council for the College of Arts and Letters at the |
| (automotive components). | University of Notre Dame. |
| | |
| André F. Perold | Kathryn J. Hyatt | |
| Born 1952. Trustee Since December 2004. Principal | Born 1955. Treasurer Since November 2008. Principal |
| Occupation(s) During the Past Five Years: George | Occupation(s) During the Past Five Years: Principal |
| Gund Professor of Finance and Banking at the Harvard | of The Vanguard Group, Inc.; Treasurer of each of |
| Business School; Chair of the Investment Committee | the investment companies served by The Vanguard |
| of HighVista Strategies LLC (private investment firm). | Group since 2008; Assistant Treasurer of each of the |
| | investment companies served by The Vanguard Group |
| Alfred M. Rankin, Jr. | (1988–2008). | |
| Born 1941. Trustee Since January 1993. Principal | | |
| Occupation(s) During the Past Five Years: Chairman, | Heidi Stam | |
| President, and Chief Executive Officer of NACCO | Born 1956. Secretary Since July 2005. Principal |
| Industries, Inc. (forklift trucks/housewares/lignite); | Occupation(s) During the Past Five Years: Managing |
| Director of Goodrich Corporation (industrial products/ | Director of The Vanguard Group, Inc., since 2006; |
| aircraft systems and services); Chairman of the | General Counsel of The Vanguard Group since 2005; |
| Federal Reserve Bank of Cleveland; Trustee of The | Secretary of The Vanguard Group and of each of the |
| Cleveland Museum of Art. | investment companies served by The Vanguard Group |
| | since 2005; Director and Senior Vice President of |
| Peter F. Volanakis | Vanguard Marketing Corporation since 2005; |
| Born 1955. Trustee Since July 2009. Principal | Principal of The Vanguard Group (1997–2006). |
| Occupation(s) During the Past Five Years: President | | |
| since 2007 and Chief Operating Officer since 2005 | | |
| of Corning Incorporated (communications equipment); | Vanguard Senior Management Team |
| President of Corning Technologies (2001–2005); | | |
| Director of Corning Incorporated and Dow Corning; | R. Gregory Barton | Michael S. Miller |
| Trustee of the Corning Incorporated Foundation and | Mortimer J. Buckley | James M. Norris |
| the Corning Museum of Glass; Overseer of the | Kathleen C. Gubanich | Glenn W. Reed |
| Amos Tuck School of Business Administration at | Paul A. Heller | George U. Sauter |
| Dartmouth College. | | |
| |
| | Chairman Emeritus and Senior Advisor |
| Executive Officers | | |
| | John J. Brennan | |
| Glenn Booraem | Chairman, 1996–2009 | |
| Born 1967. Controller Since July 2010. Principal | Chief Executive Officer and President, 1996–2008 |
| Occupation(s) During the Past Five Years: Principal | | |
| of The Vanguard Group, Inc.; Controller of each of | | |
| the investment companies served by The Vanguard | Founder | |
| Group since 2010; Assistant Controller of each of | | |
| the investment companies served by The Vanguard | John C. Bogle | |
| Group (2001–2010). | Chairman and Chief Executive Officer, 1974–1996 |
| |
| Thomas J. Higgins | | |
| Born 1957. Chief Financial Officer Since September | | |
| 2008. Principal Occupation(s) During the Past Five | | |
| Years: Principal of The Vanguard Group, Inc.; Chief | | |
| Financial Officer of each of the investment companies | | |
| served by The Vanguard Group since 2008; Treasurer | | |
| of each of the investment companies served by The | | |
| Vanguard Group (1998–2008). | | |
1 Mr. McNabb is considered an “interested person,” as defined in the Investment Company Act of 1940, because he is an officer of the Vanguard funds.
2 December 2002 for Vanguard Equity Income Fund, Vanguard Growth Equity Fund, the Vanguard Municipal Bond Funds, and the Vanguard State Tax-Exempt Funds.
| 
|
| P.O. Box 2600 |
| Valley Forge, PA 19482-2600 |
| |
Connect with Vanguard® > vanguard.com | |
| |
| |
Fund Information > 800-662-7447 | CFA® is a trademark owned by CFA Institute. |
Direct Investor Account Services > 800-662-2739 | |
Institutional Investor Services > 800-523-1036 | |
Text Telephone for People | |
With Hearing Impairment > 800-749-7273 | |
|
This material may be used in conjunction | |
with the offering of shares of any Vanguard | |
fund only if preceded or accompanied by | |
the fund’s current prospectus. | |
|
All comparative mutual fund data are from Lipper Inc. or | |
Morningstar, Inc., unless otherwise noted. | |
|
You can obtain a free copy of Vanguard’s proxy voting | |
guidelines by visiting vanguard.com/proxyreporting or by | |
calling Vanguard at 800-662-2739. The guidelines are | |
also available from the SEC’s website, sec.gov. In | |
addition, you may obtain a free report on how your fund | |
voted the proxies for securities it owned during the 12 | |
months ended June 30. To get the report, visit either | |
vanguard.com/proxyreporting or sec.gov. | |
|
You can review and copy information about your fund at | |
the SEC’s Public Reference Room in Washington, D.C. To | |
find out more about this public service, call the SEC at | |
202-551-8090. Information about your fund is also | |
available on the SEC’s website, and you can receive | |
copies of this information, for a fee, by sending a | |
request in either of two ways: via e-mail addressed to | |
publicinfo@sec.gov or via regular mail addressed to the | |
Public Reference Section, Securities and Exchange | |
Commission, Washington, DC 20549-1520. | |
|
|
| © 2010 The Vanguard Group, Inc. |
| All rights reserved. |
| Vanguard Marketing Corporation, Distributor. |
|
| Q03010 122010 |
 |
|
| Vanguard International Explorer™ Fund |
| Annual Report |
|
| October 31, 2010 |
 |
> For the 12 months ended October 31, 2010, Vanguard International Explorer Fund returned 18.38%, beating its benchmark index by just over 4 percentage points but trailing the average return of its peers.
> Holdings in emerging markets led the fund’s outperformance versus its benchmark.
> The fund’s European portfolio was a slight drag on relative performance.
| |
| Contents | |
| Your Fund’s Total Returns. | 1 |
| Chairman’s Letter. | 2 |
| Advisors’ Report. | 8 |
| Fund Profile. | 12 |
| Performance Summary. | 14 |
| Financial Statements. | 16 |
| Your Fund’s After-Tax Returns. | 34 |
| About Your Fund’s Expenses. | 35 |
| Trustees Approve Advisory Agreements. | 37 |
| Glossary. | 38 |
Please note: The opinions expressed in this report are just that—informed opinions. They should not be considered promises or advice. Also, please keep in mind that the information and opinions cover the period through the date on the front of this report. Of course, the risks of investing in your fund are spelled out in the prospectus.
See the Glossary for definitions of investment terms used in this report.
Cover photograph: Jean Maher.
Your Fund’s Total Returns
Fiscal Year Ended October 31, 2010
| |
| | Total |
| | Returns |
| Vanguard International Explorer Fund | 18.38% |
| S&P EPAC SmallCap Index | 14.10 |
| International Small-Cap Funds Average | 21.54 |
| International Small-Cap Funds Average: Derived from data provided by Lipper Inc. |
Your Fund’s Performance at a Glance
October 31, 2009, Through October 31, 2010
| | | | |
| | | | Distributions Per Share |
| | Starting | Ending | Income | Capital |
| | Share Price | Share Price | Dividends | Gains |
| Vanguard International Explorer Fund | $13.55 | $15.81 | $0.202 | $0.000 |
1

Chairman’s Letter
Dear Shareholder,
During the 12 months ended October 31, the global economy continued to recover from a worldwide slump, and stocks did well almost everywhere. The International Explorer Fund returned 18.38% for the period, easily outdistancing the return of its market benchmark, the Standard & Poor’s Europe Pacific Asia Composite SmallCap Index.
However, the fund trailed the average return of its peer group. During the period, the U.S. dollar gained strength against some major currencies, such as the euro and the British pound, which dampened the returns of the European portfolio for U.S.-based investors. But the dollar declined against the Japanese yen and Australian dollar, boosting returns for U.S. investors holding stocks in those countries.
If you hold shares of the fund in a taxable account, you may wish to review the section on the fund’s after-tax returns that appears later in this report.
Stock market performance was better than it felt
Global stock prices rallied at the start of the period but struggled through the spring and summer, weighed down by Europe’s sovereign debt crisis and the slow pace of economic recovery in the United States. In the fiscal year’s final months, the mood turned. Stock prices climbed on continued
2
strength in corporate earnings. In the United States, stocks also seemed to get a boost from the Federal Reserve Board’s hints that it would try to stimulate the economy with a second round of U.S. Treasury bond purchases. (In early November, the Fed announced that it would buy as much as $600 billion in Treasuries.)
For the 12 months, the broad U.S. stock market returned about 19%, a performance that was better than it felt in a year of ups and downs. Small-capitalization stocks did even better. International stocks returned about 13% on the strength of a powerful rally in emerging markets and solid single-digit gains in developed markets in Europe and the Pacific region.
Despite shrinking yields, bonds attracted investor dollars
Although fixed income yields have fallen to generational lows, investors continued to bid up bond prices. The broad U.S. bond market produced a 12-month return of about 8% as the yield of the 10-year U.S. Treasury note fell from 3.39% at the start of the period to 2.61% at the close. Tax-exempt municipal bonds also rallied. Bond prices and yields move in opposite directions, of course, so abundant returns built on rising prices could mean leaner pickings in the years ahead.
The yields of money market securities hovered near 0%, consistent with the Federal Reserve Board’s target for short-term rates.
Market Barometer
| | | |
| | | Average Annual Total Returns |
| | | Periods Ended October 31, 2010 |
| | One | Three | Five |
| | Year | Years | Years |
| Stocks | | | |
| Russell 1000 Index (Large-caps) | 17.67% | -6.14% | 1.99% |
| Russell 2000 Index (Small-caps) | 26.58 | -3.91 | 3.07 |
| Dow Jones U.S. Total Stock Market Index | 19.04 | -5.55 | 2.52 |
| MSCI All Country World Index ex USA (International) | 13.08 | -7.62 | 6.21 |
| |
| Bonds | | | |
| Barclays Capital U.S. Aggregate Bond Index (Broad | | | |
| taxable market) | 8.01% | 7.23% | 6.45% |
| Barclays Capital Municipal Bond Index (Broad | | | |
| tax-exempt market) | 7.78 | 5.79 | 5.20 |
| Citigroup Three-Month U.S. Treasury Bill Index | 0.12 | 0.89 | 2.41 |
| |
| CPI | | | |
| Consumer Price Index | 1.17% | 1.54% | 1.89% |
3
Emerging markets were the fund’s best performers
Vanguard International Explorer Fund’s 18.38% return for the year beat that of its unmanaged benchmark index by more than 4 percentage points. Most of the outperformance came from the fund’s emerging-market holdings. Although they made up just 10% of assets, the advisors’ stock selections in these fast-growing countries rose 54%. The advisors allocated more than twice the benchmark’s percentage of assets to emerging markets, which also aided relative performance.
To illustrate the scope of the rebound in some of the less developed nations, just two Filipino stocks, a mining company and an industrial holding company, skyrocketed 430% and 364% respectively, generating about 2 percentage points, or more than 10%, of the fund’s total return for the year.
Other notable performers included Brazilian stocks, the fund’s largest emerging-market exposure, where industrial holdings were standouts. Stocks also outperformed in India and Indonesia, where financials did particularly well as consumer and business activity accelerated.
Holdings in China, the fund’s second-largest emerging-market position, returned about 7%, as impressive returns in the industrials and consumer discretionary sectors were offset somewhat by weakness in financials and health care.
Expense Ratios
Your Fund Compared With Its Peer Group
| | |
| | | Peer Group |
| | Fund | Average |
| International Explorer Fund | 0.45% | 1.60% |
The fund expense ratio shown is from the prospectus dated August 16, 2010, and represents estimated costs for the current fiscal year. For the fiscal year ended October 31, 2010, the fund’s expense ratio was 0.39%. The peer-group expense ratio is derived from data provided by Lipper Inc. and captures information through year-end 2009.
Peer group: International Small-Cap Funds.
4
Returns were more modest in the developed markets
Stocks in the more developed markets in the Pacific region, which made up almost one-third of fund assets on average during the 12 months, returned about 10%. In Japan, the fund’s largest country investment, the advisors’ selections in the industrials and materials sectors helped performance versus the benchmark. Elsewhere in the region, the fund’s Australian holdings trailed the results from that nation’s small-cap market, hurting relative performance.
Holdings in Europe, the fund’s largest investment region, returned about 17%, in line with the benchmark’s components in the region. Investor sentiment in Europe improved dramatically at summer’s end as concerns eased over the shaky fiscal status of Greece, Ireland, and Portugal. The advisors’ selections in Spain, Switzerland, the Netherlands, and Belgium far outperformed the overall results of small-cap markets in those countries, while holdings in the United Kingdom and France lagged.
Worldwide, stocks of small companies—the fund’s primary market—generally enjoyed stronger returns than their mid- and large-cap counterparts, as the Standard & Poor’s Europe Pacific Asia Composite LargeMidCap Index returned 9.65% for the period. As a U.S.-based fund, International Explorer’s returns were hurt by a strengthening U.S. dollar versus the euro and the British pound. On the
Total Returns
Ten Years Ended October 31, 2010
| |
| | Average |
| | Annual Return |
| International Explorer Fund | 7.34% |
| S&P EPAC SmallCap Index | 7.96 |
| International Small-Cap Funds Average | 6.20 |
| International Small-Cap Funds Average: Derived from data provided by Lipper Inc. | |
The figures shown represent past performance, which is not a guarantee of future results. (Current performance may be lower or higher than the performance data cited. For performance data current to the most recent month-end, visit our website at vanguard.com/performance.) Note, too, that both investment returns and principal value can fluctuate widely, so an investor’s shares, when sold, could be worth more or less than their original cost.
5
other hand, the Japanese yen and Australian dollar rose in value versus the greenback, boosting the bottom line.
The fund’s long-term record has been competitive
Over the long term, which we regard as the true test of any stock fund, the International Explorer Fund has been competitive, beating its benchmark in six out of the last 10 fiscal years. Nonetheless, its 7.34% average annual return for the 10 years ended October 31 trails that of the S&P EPAC SmallCap Index by slightly more than half of 1 percentage point, an amount almost equal to the fund’s expense ratio. Like any mutual fund, International Explorer measures itself against an index that has no operating expenses to deduct from returns. The fund remains well ahead of the 10-year average annual return of 6.20% generated by its peer group of similar small-cap international funds.
We expect the fund to continue to benefit from its low expenses and the talents of its two advisors. Schroder Investment Management North America has managed the fund since its inception in 1996. Wellington Management Company, llp was added as a second advisor in June. As we noted in your fund’s semiannual report six months ago, the addition of Wellington Management reflects Vanguard’s commitment to the multimanager structure, which can enhance a portfolio’s level of diversification.
Vanguard International Explorer Fund remains a primarily small-cap offering of non-U.S. equity securities. Both advisors seek to identify attractively priced small-company stocks outside the United States that have strong growth potential.
For more information on both advisors’ investment strategies, please see the Advisors’ Report following this letter.
International small-cap stocks offer useful diversification
Although not as volatile as the year before, the past year still delivered more than its share of ups and downs, particularly in Europe. While such periods can be a bit unnerving, the markets’ swings are an integral part of investing.
Vanguard International Explorer Fund will no doubt undergo sharp fluctuations in the future, but our experience suggests that including international small-cap stocks in a long-term portfolio can provide useful diversification to help temper overall volatility. In fact, our research indicates that the benefits of including international holdings in an investment program usually become more apparent in the long run, as differences emerge in the economic and financial performances of various countries.
6
As always, we encourage investors to develop a portfolio that includes stock, bond, and cash investments in proportions consistent with individual goals and risk tolerance. Such a balanced portfolio can help buffer your assets from the markets’ worst outcomes while giving you the opportunity to participate in the best.
Thank you for your confidence in Vanguard.
Sincerely,

F. William McNabb III
Chairman and Chief Executive Officer
November 17, 2010
7
Advisors’ Report
For the fiscal year ended October 31, 2010, Vanguard International Explorer Fund returned 18.38%. Your fund is managed by two independent advisors, a strategy that enhances the fund’s diversification by providing exposure to distinct, yet complementary, investment approaches. It is not uncommon for different advisors to have different views about individual securities or the broader investment environment. The advisors, the amount and percentage of fund assets each manages, and brief descriptions of their investment strategies are presented in the table below. The advisors have also prepared a discussion of the investment environment that existed during the fiscal year and of how their portfolio positioning reflects this assessment. These comments were prepared on November 19, 2010.
Vanguard International Explorer Fund Investment Advisors
| | | |
| | Fund Assets Managed | |
| Investment Advisor | % | $ Million | Investment Strategy |
| Schroder Investment | 97 | 2,348 | The advisor employs a fundamental investment |
| Management North America, Inc. | | | approach that considers macroeconomic factors while |
| | | | focusing primarily on company-specific factors, |
| | | | including a company’s potential for long-term growth, |
| | | | financial condition, quality of management, and |
| | | | sensitivity to cyclical factors. The advisor also |
| | | | considers the relative value of a company’s securities |
| | | | compared with those of other companies and the |
| | | | market as a whole. |
| Wellington Management | 1 | 32 | The advisor employs a traditional, bottom-up approach |
| Company, LLP | | | that is opportunistic in nature, relying on global and |
| | | | regional research resources to identify both |
| | | | growth-oriented and neglected or misunderstood |
| | | | companies. |
| Cash Investments | 2 | 55 | These short-term reserves are invested by Vanguard in |
| | | | equity index products to simulate investment in stocks. |
| | | | Each advisor also may maintain a modest cash |
| | | | position. |
8
Schroder Investment Management North America Inc.
Portfolio Manager:
Matthew F. Dobbs
Head of Global Small Companies
International equity markets continued to make progress during the fiscal year, though at a rather more sedate pace than in the previous 12 months. Currency moves have been a material factor over the period, with the Japanese yen continuing to strengthen versus the U.S. dollar but the euro remaining generally weak because of well-publicized concerns over debt levels of some of the smaller European countries such as Greece, Ireland, and Portugal. Encouragingly, smaller companies have continued to outperform, with the Standard & Poor’s Europe Pacific Asia Composite SmallCap Index up 14.10% in dollar terms, compared with an 8.36% rise in the MSCI EAFE Index.
Although smaller-company stocks performed well in general and particularly versus larger peers in the United Kingdom and continental Europe, they lagged in Japan, where overall returns continued to disappoint. The strongest sectors were materials, telecommunications, and information technology, while financials, health care, and utilities performed less well.
Relative returns have been strong, primarily because of stock selection in continental Europe and Japan and the portfolio’s exposure to emerging markets. In Europe, the main contributions came from stocks in the industrial, energy, and financial sectors, while in Japan, selection was particularly beneficial in industrials and materials. Among emerging markets, the best performers came from the Philippines, Brazil, India, and Indonesia, with prominent contributions from energy, industrials, and financials.
The one significant area of shortfall has been stock selection in the United Kingdom, where consumer cyclicals, industrials, and information technology holdings subtracted value. A less significant headwind came from selections in the Pacific region excluding Japan, most notably among consumer staples and industrial holdings in Australia.
Our focus remains on identifying companies that offer sustainable and relatively visible growth prospects along with sound balance sheets and strong management. We have identified many companies fitting these criteria across all regions, and while we sold many holdings that reached our assessment of fair value during the fiscal year, we found other opportunities into which to recycle the proceeds.
9
Regional allocations have changed modestly over the period. We remain relatively positive on smaller Asian markets excluding Japan and on other emerging markets, though we have switched some exposure from the former to the latter (most notably to Brazil). Elsewhere, reductions in exposure to Japan and continental Europe have funded additional holdings in the United Kingdom, where we feel the prospect of fiscal retrenchment has been increasingly discounted and there have been encouraging signs of a revival in merger and acquisition activity. In Europe, we remain cautious on the peripheral, primarily in southern European markets and economies.
Wellington Management Company, LLP
Portfolio Manager:
Simon H. Thomas
Vice President and Equity Portfolio Manager
During the period, global equities continued to rise as investor confidence grew amid better-than-expected corporate earnings, accommodative monetary policy, and improving economic conditions. Lingering sovereign risk concerns in several European countries and tightening credit conditions in China were not enough to derail optimism about rebounding corporate earnings growth.
For the abbreviated period since the inception of the fund’s two-manager structure in June, the portfolio benefited from positive stock selections in the consumer discretionary, industrial, and energy sectors. Allocation among sectors, which is largely a result of our bottom-up stock selection process, detracted modestly. An underweight position in the outperforming materials sector offset the benefit from overweight allocations to energy and industrials.
Top contributors to relative returns were industrial holdings China State Construction and NRW Holdings. The former, one of the largest construction contractors in China, rose during the period as Chinese infrastructure spending and residential home construction continued to grow. The latter, an Australia-based mining services provider, rebounded sharply after falling earlier in the year on concerns about the impact of Australia’s proposed Resource Super Profit Tax. The company is benefiting from a growing order book and price strength across the commodities complex. Another strong contributor was Dufry, an operator of duty-free airport shops, which benefited from growing expectations for passenger air travel as confidence in the economic recovery began to take hold. Other notable contributors to absolute returns included Gruppo Coin (consumer discretionary) and Whitehaven Coal (energy).
10
The largest detractors from relative performance during the period were Japanese drug-maker Shionogi (health care), Hampson Industries (industrials), and Yaskawa Electric (information technology). Shionogi fell because of poor performance by its U.S. subsidiary (formerly Sciele), which suffered from reduced wholesaler inventories and generic competition. Shares of Hampson Industries, a U.K.-based components and tooling services provider to the aerospace and automotive markets, dropped as the company lowered its profit guidance. The stock of Yaskawa Electric, a Japan-based supplier of factory automation equipment, fell modestly. Quarterly results disappointed investors who had expected a greater increase in operating margins. Other notable detractors from absolute returns included Japan-based women’s apparel retailer Point and Japanese truck and bus manufacturer Hino Motors.
Despite a surge in equities during the period, we believe that the macro environment remains uncertain. We continue to focus our analysis on the individual company level, seeking to identify companies with strong balance sheets, leading competitive positions, and solid free cash flows that are trading at attractive valuations.
At the end of the period, we were most overweighted in industrials, consumer discretionary, and energy stocks and most underweighted in financials relative to the benchmark. On a regional basis, our greatest underweight position at the end of the period was in Europe. This was offset by overweight positions in Japan and select emerging-market countries.
11
International Explorer Fund
Fund Profile
As of October 31, 2010
| | | |
| Portfolio Characteristics | | |
| | | S&P | MSCI AC |
| | | EPAC | World |
| | | SmallCap | Index |
| | Fund | Index | ex USA |
| Number of Stocks | 366 | 3,128 | 1,811 |
| Median Market Cap | $1.6B | $1.7B | $29.9B |
| Price/Earnings Ratio | 20.9x | 20.0x | 16.2x |
| Price/Book Ratio | 1.6x | 1.3x | 1.7x |
| Return on Equity | 13.8% | 12.3% | 18.2% |
| Earnings Growth Rate | 7.8% | 5.9% | 4.4% |
| Dividend Yield | 2.0% | 2.3% | 2.8% |
| Turnover Rate | 51% | — | — |
| Ticker Symbol | VINEX | — | — |
| Expense Ratio1 | 0.45% | — | — |
| Short-Term Reserves | 3.9% | — | — |
| |
| Sector Diversification (% of equity exposure) |
| | | S&P | MSCI AC |
| | | EPAC | World |
| | | SmallCap | Index |
| | Fund | Index | ex USA |
| Consumer | | | |
| Discretionary | 19.3% | 18.7% | 9.1% |
| Consumer Staples | 4.0 | 5.5 | 8.9 |
| Energy | 9.6 | 3.6 | 10.4 |
| Financials | 12.2 | 18.7 | 25.6 |
| Health Care | 4.0 | 5.9 | 6.0 |
| Industrials | 28.3 | 23.5 | 10.5 |
| Information | | | |
| Technology | 7.3 | 9.3 | 6.3 |
| Materials | 12.3 | 10.9 | 12.4 |
| Telecommunication | | | |
| Services | 1.5 | 1.6 | 6.2 |
| Utilities | 1.5 | 2.3 | 4.6 |
| | |
| Volatility Measures | | |
| | S&P | |
| | EPAC | MSCI AC |
| | SmallCap | World Index |
| | Index | ex USA |
| R-Squared | 0.98 | 0.96 |
| Beta | 0.98 | 1.02 |
| These measures show the degree and timing of the fund’s fluctuations compared with the indexes over 36 months. |
|
| |
| Ten Largest Holdings (% of total net assets) |
| |
| Semirara Mining Corp. | Coal & Consumable |
| Class A | Fuels | 1.4% |
| Niko Resources Ltd. | Oil & Gas | |
| | Exploration & | |
| | Production | 1.3 |
| Fugro NV | Oil & Gas | |
| | Equipment & | |
| | Services | 1.1 |
| Delta Lloyd NV | Life & Health | |
| | Insurance | 1.1 |
| Rheinmetall AG | Industrial | |
| | Conglomerates | 1.1 |
| Bourbon SA | Oil & Gas | |
| | Equipment & | |
| | Services | 1.1 |
| Gategroup Holding AG | Diversified Support |
| | Services | 1.0 |
| Imtech NV | Construction & | |
| | Engineering | 1.0 |
| Computershare Ltd. | Data Processing & |
| | Outsourced | |
| | Services | 1.0 |
| Helvetia Holding AG | Multi-line Insurance 1.0 |
| Top Ten | | 11.1% |
| The holdings listed exclude any temporary cash investments and equity index products. |
Allocation by Region (% of equity exposure)
1 The expense ratio shown is from the prospectus dated August 16, 2010, and represents estimated costs for the current fiscal year. For the fiscal year ended October 31, 2010, the expense ratio was 0.39%.
12
International Explorer Fund
| | | |
| Market Diversification (% of equity exposure) |
| | | S&P | MSCI AC |
| | | EPAC | World |
| | | SmallCap | Index |
| | Fund | Index | ex USA |
| Europe | | | |
| United Kingdom | 16.7% | 19.2% | 15.3% |
| Germany | 8.0 | 7.7 | 5.7 |
| Switzerland | 7.6 | 7.4 | 5.3 |
| France | 6.2 | 9.7 | 7.1 |
| Netherlands | 4.7 | 2.4 | 1.8 |
| Italy | 4.3 | 3.2 | 2.0 |
| Ireland | 2.1 | 0.4 | 0.2 |
| Austria | 2.0 | 0.4 | 0.2 |
| Norway | 1.4 | 1.0 | 0.6 |
| Belgium | 1.3 | 1.0 | 0.7 |
| Sweden | 1.0 | 2.9 | 2.1 |
| Other | 2.6 | 7.2 | 4.5 |
| Subtotal | 57.9% | 62.5% | 45.5% |
| Pacific | | | |
| Japan | 17.2% | 18.6% | 14.3% |
| Australia | 8.0 | 8.1 | 5.9 |
| Singapore | 1.7 | 1.5 | 1.2 |
| Hong Kong | 1.4 | 3.0 | 1.8 |
| Other | 0.9 | 0.2 | 0.1 |
| Subtotal | 29.2% | 31.4% | 23.3% |
| Emerging Markets | | | |
| Brazil | 2.9% | 0.0% | 3.8% |
| China | 2.1 | 0.3 | 4.3 |
| Philippines | 1.9 | 0.0 | 0.1 |
| South Korea | 1.2 | 4.9 | 3.1 |
| India | 1.1 | 0.0 | 1.9 |
| Other | 1.4 | 0.8 | 10.4 |
| Subtotal | 10.6% | 6.0% | 23.6% |
| North America | | | |
| Canada | 2.3% | 0.0% | 7.6% |
| Other | 0.0 | 0.1 | 0.0 |
| Subtotal | 2.3% | 0.1% | 7.6% |
13
International Explorer Fund
Performance Summary
All of the returns in this report represent past performance, which is not a guarantee of future results that may be achieved by the fund. (Current performance may be lower or higher than the performance data cited. For performance data current to the most recent month-end, visit our website at vanguard.com/performance.) Note, too, that both investment returns and principal value can fluctuate widely, so an investor’s shares, when sold, could be worth more or less than their original cost. The returns shown do not reflect taxes that a shareholder would pay on fund distributions or on the sale of fund shares.
Cumulative Performance: October 31, 2000, Through October 31, 2010
Initial Investment of $25,000
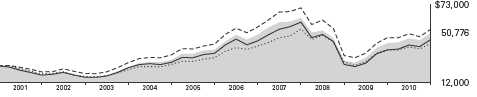
| | | | |
| | Average Annual Total Returns | |
| | Periods Ended October 31, 2010 | |
| | | | | Final Value |
| | One | Five | Ten | of a $25,000 |
| | Year | Years | Years | Investment |
| International Explorer Fund | 18.38% | 6.20% | 7.34% | $50,776 |
| MSCI All Country World Index ex USA | 13.08 | 6.21 | 5.46 | 42,531 |
| S&P EPAC SmallCap Index | 14.10 | 5.00 | 7.96 | 53,786 |
| International Small-Cap Funds Average | 21.54 | 5.52 | 6.20 | 45,632 |
International Small-Cap Funds Average: Derived from data provided by Lipper Inc.
Fiscal-Year Total Returns (%): October 31, 2000, Through October 31, 2010
Vanguard fund returns do not reflect the 2% fee on redemptions of shares held for less than two months.
See Financial Highlights for dividend and capital gains information.
14
International Explorer Fund
Average Annual Total Returns: Periods Ended September 30, 2010
This table presents average annual total returns through the latest calendar quarter—rather than through the end of the fiscal period. Securities and Exchange Commission rules require that we provide this information.
| | | | |
| | Inception | One | Five | Ten |
| | Date | Year | Years | Years |
| International Explorer Fund | 11/4/1996 | 12.28% | 4.55% | 5.98% |
Vanguard fund returns do not reflect the 2% fee on redemptions of shares held for less than two months.
15
International Explorer Fund
Financial Statements
Statement of Net Assets
As of October 31, 2010
The fund reports a complete list of its holdings in regulatory filings four times in each fiscal year, at the quarter-ends. For the second and fourth fiscal quarters, the lists appear in the fund’s semiannual and annual reports to shareholders. For the first and third fiscal quarters, the fund files the lists with the Securities and Exchange Commission on Form N-Q. Shareholders can look up the fund’s Forms N-Q on the SEC’s website at sec.gov. Forms N-Q may also be reviewed and copied at the SEC’s Public Reference Room (see the back cover of this report for further information).
| | | |
| | | | Market |
| | | | Value |
| | | Shares | ($000) |
| Common Stocks (93.6%)1 | | |
| Australia (7.0%) | | |
| | Computershare Ltd. | 2,425,846 | 24,087 |
| * | Iluka Resources Ltd. | 3,271,227 | 21,652 |
| | Amcor Ltd. | 3,249,196 | 21,411 |
| ^ | Fairfax Media Ltd. | 12,174,507 | 17,296 |
| ^ | Sims Metal | | |
| | Management Ltd. | 1,057,476 | 16,984 |
| | Ansell Ltd. | 1,212,737 | 16,121 |
| ^ | Crane Group Ltd. | 1,802,150 | 13,405 |
| ^ | Myer Holdings Ltd. | 3,092,443 | 11,651 |
| | Mirvac Group | 6,561,450 | 8,349 |
| * | James Hardie Industries | | |
| | SE | 1,382,832 | 7,329 |
| * | Transpacific Industries | | |
| | Group Ltd. | 5,452,279 | 6,601 |
| * | Dart Energy Ltd. | 2,981,767 | 3,359 |
| * | Karoon Gas Australia Ltd. | 37,899 | 350 |
| | WorleyParsons Ltd. | 14,421 | 325 |
| | Whitehaven Coal Ltd. | 40,523 | 276 |
| | NRW Holdings Ltd. | 130,723 | 229 |
| | Toll Holdings Ltd. | 33,803 | 206 |
| * | AJ Lucas Group Ltd. | 78,022 | 182 |
| | Nufarm Ltd. | 31,601 | 141 |
| ^ | Ausenco Ltd. | 54,343 | 136 |
| | | | 170,090 |
| Austria (1.9%) | | |
| | Mayr Melnhof Karton AG | 155,000 | 16,762 |
| * | RHI AG | 400,000 | 13,275 |
| | Kapsch TrafficCom AG | 200,000 | 11,537 |
| | Rosenbauer International | | |
| | AG | 135,000 | 5,799 |
| | Andritz AG | 2,754 | 211 |
| | | | 47,584 |
| Belgium (1.2%) | | |
| | Bekaert SA | 48,020 | 14,721 |
| ^ | Tessenderlo Chemie NV | 220,001 | 7,528 |
| ^ | EVS Broadcast Equipment | |
| | SA | 110,000 | 6,908 |
| | | |
| | | | Market |
| | | | Value |
| | | Shares | ($000) |
| | D’ieteren SA | 621 | 339 |
| | Cie d’Entreprises CFE | 3,923 | 245 |
| | UCB SA | 5,379 | 209 |
| | | | 29,950 |
| Brazil (2.8%) | | |
| | Localiza Rent a Car SA | 1,122,638 | 18,586 |
| | Cia Brasileira de | | |
| | Distribuicao Grupo Pao | | |
| | de Acucar ADR | 331,008 | 13,111 |
| | Cyrela Brazil Realty SA | | |
| | Empreendimentos e | | |
| | Participacoes | 769,733 | 10,584 |
| | Redecard SA | 772,039 | 9,985 |
| | Anhanguera Educacional | | |
| | Participacoes SA | 475,355 | 9,282 |
| | PDG Realty SA | | |
| | Empreendimentos e | | |
| | Participacoes | 481,717 | 5,964 |
| | Totvs SA | 2,700 | 245 |
| * | EcoRodovias Infraestrutura | |
| | e Logistica SA | 32,000 | 243 |
| * | Multiplus SA | 9,500 | 159 |
| | | | 68,159 |
| Canada (2.2%) | | |
| | Niko Resources Ltd. | 334,368 | 31,899 |
| * | Sino-Forest Corp. | 1,156,052 | 22,851 |
| | | | 54,750 |
| China (2.0%) | | |
| ^ | China National | | |
| | Materials Co. Ltd. | 11,578,000 | 10,335 |
| | Parkson Retail Group Ltd. | 4,903,500 | 8,877 |
| * | Beijing Enterprises Water | | |
| | Group Ltd. | 23,708,000 | 8,293 |
| * | Concord Medical Services | | |
| | Holdings Ltd. ADR | 847,938 | 5,995 |
| | Guangzhou Automobile | | |
| | Group Co. Ltd. | 3,469,870 | 5,282 |
| | Intime Department Store | | |
| | Group Co. Ltd. | 2,526,000 | 3,874 |
16
International Explorer Fund
| | | |
| | | | Market |
| | | | Value |
| | | Shares | ($000) |
| | China National Building | | |
| | Material Co. Ltd. | 1,320,000 | 3,233 |
| ^ | BaWang International | | |
| | Group Holding Ltd. | 5,808,000 | 2,451 |
| * | AsiaInfo-Linkage Inc. | 10,000 | 222 |
| | Vinda International | | |
| | Holdings Ltd. | 151,000 | 197 |
| | China Automation | | |
| | Group Ltd. | 241,000 | 189 |
| * | Yingde Gases | 155,000 | 133 |
| * | Evergreen International | | |
| | Holdings Ltd. | 175,000 | 104 |
| * | Hollysys Automation | | |
| | Technologies Ltd. | 7,200 | 91 |
| *,^ | Boshiwa International | | |
| | Holding Ltd. | 99,000 | 91 |
| * | Microport Scientific Corp. | 89,000 | 91 |
| | | | 49,458 |
| Denmark (0.7%) | | |
| | Tryg A/S | 220,000 | 11,085 |
| | Solar A/S Class B | 89,258 | 5,869 |
| | DSV A/S | 12,900 | 265 |
| | | | 17,219 |
| Finland (0.0%) | | |
| | Tieto Oyj | 8,500 | 163 |
| |
| France (5.6%) | | |
| ^ | Bourbon SA | 575,000 | 26,205 |
| | Saft Groupe SA | 512,764 | 19,598 |
| | Groupe Eurotunnel SA | 1,850,000 | 18,404 |
| | Rubis | 146,146 | 16,204 |
| | Alten Ltd. | 450,000 | 15,052 |
| *,^ | Club Mediterranee | 737,870 | 14,444 |
| | Meetic | 307,409 | 9,183 |
| | Sword Group | 179,000 | 6,595 |
| * | Store Electronic | 390,000 | 5,075 |
| | SeLoger.com | 79,246 | 3,978 |
| | CFAO SA | 7,079 | 315 |
| | Bollore | 1,387 | 311 |
| | Wendel | 3,858 | 299 |
| | Zodiac Aerospace | 3,355 | 237 |
| | Bureau Veritas SA | 3,203 | 237 |
| | Sechilienne-Sidec | 8,143 | 237 |
| | Imerys SA | 3,541 | 212 |
| | Seche Environnement SA | 2,545 | 205 |
| ^ | Eurofins Scientific | 3,216 | 199 |
| | Orpea | 3,788 | 191 |
| | ICADE | 1,490 | 164 |
| | | | 137,345 |
| Germany (7.5%) | | |
| | Rheinmetall AG | 364,720 | 26,247 |
| | Freenet AG | 1,850,000 | 23,457 |
| | Bilfinger Berger SE | 320,000 | 23,292 |
| | | |
| | | | Market |
| | | | Value |
| | | Shares | ($000) |
| | MTU Aero Engines | | |
| | Holding AG | 354,317 | 21,381 |
| * | Brenntag AG | 121,000 | 11,320 |
| | Grenkeleasing AG | 210,800 | 11,213 |
| ^ | Wirecard AG | 720,000 | 10,740 |
| * | KUKA AG | 457,604 | 9,573 |
| * | Tom Tailor Holding AG | 400,000 | 8,479 |
| * | Tipp24 SE | 200,000 | 8,031 |
| ^ | CompuGroup Medical AG | 500,000 | 6,577 |
| *,^ | XING AG | 110,000 | 4,832 |
| | Bijou Brigitte AG | 28,500 | 4,606 |
| * | Morphosys AG | 190,000 | 4,554 |
| * | SAF-Holland SA | 529,000 | 4,098 |
| * | Draegerwerk AG & Co. | | |
| | KGaA | 51,746 | 3,738 |
| * | Delticom AG | 3,006 | 240 |
| * | Stratec | | |
| | Biomedical Systems AG | 5,729 | 216 |
| | Rhoen Klinikum AG | 8,789 | 206 |
| | | | 182,800 |
| Greece (0.2%) | | |
| | Eurobank Properties Real | | |
| | Estate Investment Co. | 300,000 | 2,505 |
| | Aegean Airlines SA | 511,155 | 1,640 |
| | | | 4,145 |
| Hong Kong (1.4%) | | |
| ^ | Techtronic Industries Co. | 11,706,500 | 11,872 |
| | Johnson Electric | | |
| | Holdings Ltd. | 14,491,500 | 7,635 |
| | Dah Sing Banking | | |
| | Group Ltd. | 4,030,000 | 6,911 |
| *,^ | Fook Woo Group | | |
| | Holdings Ltd. | 17,628,000 | 6,250 |
| | Pacific Basin | | |
| | Shipping Ltd. | 343,000 | 251 |
| | ASM Pacific | | |
| | Technology Ltd. | 24,800 | 224 |
| | | | 33,143 |
| India (1.1%) | | |
| * | Cairn India Ltd. | 2,322,073 | 16,801 |
| | Shriram Transport | | |
| | Finance Co. Ltd. | 451,549 | 8,963 |
| * | Jyothy Laboratories Ltd. | 27,851 | 173 |
| | | | 25,937 |
| Indonesia (0.5%) | | |
| | Bank Rakyat Indonesia | | |
| | Persero Tbk PT | 5,222,000 | 6,686 |
| | Semen Gresik Persero | | |
| | Tbk PT | 4,873,500 | 5,358 |
| | | | 12,044 |
| Ireland (2.0%) | | |
| | DCC plc | 800,000 | 23,120 |
| * | Irish Continental Group plc | 317,283 | 6,716 |
| | Grafton Group plc | 1,500,000 | 6,404 |
17
International Explorer Fund
| | | |
| | | | Market |
| | | | Value |
| | | Shares | ($000) |
| * | Irish Life & Permanent | | |
| | Group Holdings plc | 2,626,410 | 5,557 |
| * | Governor & Co. | | |
| | of the Bank of Ireland | 4,800,000 | 3,585 |
| | IFG Group plc | 1,577,929 | 2,867 |
| | | | 48,249 |
| Israel (0.0%) | | |
| * | Bank Hapoalim BM | 47,136 | 214 |
| |
| Italy (4.1%) | | |
| | Azimut Holding SPA | 2,000,000 | 20,398 |
| | Prysmian SPA | 930,000 | 18,026 |
| | Davide Campari-Milano | | |
| | SPA | 2,464,000 | 15,628 |
| * | CIR-Compagnie Industriali | | |
| | Riunite SPA | 6,750,000 | 15,342 |
| | Ansaldo STS SPA | 814,781 | 11,238 |
| ^ | Landi Renzo SPA | 1,696,107 | 8,209 |
| * | Natuzzi SPA ADR | 1,708,450 | 5,706 |
| * | Gruppo Coin SPA | 423,283 | 4,451 |
| | DiaSorin SPA | 6,817 | 280 |
| | Immobiliare Grande | | |
| | Distribuzione | 99,766 | 200 |
| | | | 99,478 |
| Japan (15.7%) | | |
| | Nifco Inc. | 624,600 | 15,715 |
| | Musashi Seimitsu | | |
| | Industry Co. Ltd. | 622,900 | 14,853 |
| ^ | Modec Inc. | 970,000 | 13,842 |
| | Nichi-iko | | |
| | Pharmaceutical Co. Ltd. | 372,100 | 13,112 |
| | Nippon | | |
| | Thompson Co. Ltd. | 1,872,000 | 12,976 |
| | Tokai Tokyo Financial | | |
| | Holdings Inc. | 3,709,000 | 12,890 |
| | Lintec Corp. | 570,600 | 12,814 |
| | OSAKA Titanium | | |
| | Technologies Co. | 270,800 | 12,646 |
| | Nihon Parkerizing Co. Ltd. | 848,000 | 11,110 |
| | Koito | | |
| | Manufacturing Co. Ltd. | 829,000 | 10,791 |
| ^ | Asahi Diamond | | |
| | Industrial Co. Ltd. | 606,000 | 10,700 |
| | Arcs Co. Ltd. | 820,900 | 10,622 |
| | Tsuruha Holdings Inc. | 230,600 | 9,913 |
| | Nitta Corp. | 625,700 | 9,876 |
| ^ | Accordia Golf Co. Ltd. | 10,682 | 9,764 |
| | Kuroda Electric Co. Ltd. | 835,500 | 9,698 |
| | Seven Bank Ltd. | 5,386 | 9,695 |
| | Miura Co. Ltd. | 420,100 | 9,495 |
| | Glory Ltd. | 407,300 | 8,996 |
| | JSP Corp. | 777,400 | 8,950 |
| | Nabtesco Corp. | 482,800 | 8,555 |
| | Moshi Moshi Hotline Inc. | 366,500 | 8,546 |
| | | |
| | | | Market |
| | | | Value |
| | | Shares | ($000) |
| | Trusco Nakayama Corp. | 583,200 | 8,499 |
| | Daido Steel Co. Ltd. | 1,649,000 | 8,403 |
| | Shinko Plantech Co. Ltd. | 886,900 | 8,222 |
| | Tsumura & Co. | 250,000 | 7,685 |
| | Takasago | | |
| | International Corp. | 1,526,000 | 7,371 |
| | NEC Networks & | | |
| | System Integration Corp. | 619,300 | 7,224 |
| | Aica Kogyo Co. Ltd. | 626,000 | 7,033 |
| | Exedy Corp. | 216,900 | 6,768 |
| | Shinmaywa | | |
| | Industries Ltd. | 1,868,000 | 6,500 |
| ^ | Hisaka Works Ltd. | 562,000 | 6,465 |
| | Tsutsumi Jewelry Co. Ltd. | 271,000 | 6,378 |
| | Yushin Precision | | |
| | Equipment Co. Ltd. | 318,400 | 5,751 |
| | Works | | |
| | Applications Co. Ltd. | 13,395 | 5,620 |
| | Nidec Copal Corp. | 377,800 | 5,535 |
| | Sumida Corp. | 603,400 | 4,992 |
| | Nishimatsuya | | |
| | Chain Co. Ltd. | 424,800 | 4,080 |
| | HIS Co. Ltd. | 177,200 | 3,776 |
| | Obic Co. Ltd. | 19,440 | 3,589 |
| | Icom Inc. | 130,000 | 3,496 |
| | Fujikura Kasei Co. Ltd. | 486,200 | 2,914 |
| | Nafco Co. Ltd. | 156,200 | 2,550 |
| | Sumitomo Osaka | | |
| | Cement Co. Ltd. | 1,182,000 | 2,291 |
| ^ | Daihatsu Diesel | | |
| | Manufacturing Co. Ltd. | 560,000 | 1,751 |
| | Chugoku Marine | | |
| | Paints Ltd. | 57,000 | 413 |
| | Osaka Securities | | |
| | Exchange Co. Ltd. | 79 | 398 |
| * | Cosmos | | |
| | Pharmaceutical Corp. | 11,900 | 374 |
| | Fuji Heavy Industries Ltd. | 52,000 | 358 |
| | Sumitomo Rubber | | |
| | Industries Ltd. | 29,000 | 312 |
| | Shionogi & Co. Ltd. | 17,700 | 309 |
| | Benesse Holdings Inc. | 6,400 | 307 |
| | Square Enix | | |
| | Holdings Co. Ltd. | 14,500 | 303 |
| | Asics Corp. | 28,000 | 301 |
| | Teijin Ltd. | 74,000 | 274 |
| * | Hoshizaki Electric Co. Ltd. | 13,500 | 266 |
| | Showa Denko KK | 144,000 | 263 |
| *,^ | Start Today Co. Ltd. | 83 | 258 |
| ^ | Mori Seiki Co. Ltd. | 26,000 | 254 |
| | Yaskawa Electric Corp. | 31,000 | 242 |
| | Toyota Boshoku Corp. | 13,800 | 234 |
| | ABC-Mart Inc. | 6,800 | 231 |
| | Tokyo Ohka | | |
| | Kogyo Co. Ltd. | 12,500 | 231 |
18
International Explorer Fund
| | | |
| | | | Market |
| | | | Value |
| | | Shares | ($000) |
| | Nihon Nohyaku Co. Ltd. | 40,000 | 230 |
| | EPS Co. Ltd. | 89 | 219 |
| | Hitachi Metals Ltd. | 19,000 | 216 |
| | Nippon Denko Co. Ltd. | 29,000 | 215 |
| * | Yamaha Motor Co. Ltd. | 13,700 | 210 |
| | Pigeon Corp. | 6,800 | 203 |
| | Toyo Engineering Corp. | 61,000 | 195 |
| | Disco Corp. | 3,200 | 185 |
| | Towa | | |
| | Pharmaceutical Co. Ltd. | 3,400 | 185 |
| * | Dainippon Screen | | |
| | Manufacturing Co. Ltd. | 32,000 | 182 |
| | Hino Motors Ltd. | 42,000 | 181 |
| | Proto Corp. | 4,100 | 166 |
| | Kakaku.com Inc. | 34 | 164 |
| * | Message Co. Ltd. | 64 | 163 |
| | Sekisui House Ltd. | 17,000 | 160 |
| | Sumitomo | | |
| | Warehouse Co. Ltd. | 30,000 | 156 |
| ^ | Torishima Pump | | |
| | Manufacturing Co. Ltd. | 9,400 | 155 |
| | THK Co. Ltd. | 7,900 | 152 |
| | Amada Co. Ltd. | 23,000 | 151 |
| | Point Inc. | 3,360 | 140 |
| | Mitsui-Soko Co. Ltd. | 34,000 | 128 |
| | Jafco Co. Ltd. | 5,800 | 121 |
| | NSD Co. Ltd. | 11,300 | 120 |
| | Dowa Holdings Co. Ltd. | 350 | 2 |
| | | | 381,779 |
| Luxembourg (0.7%) | | |
| * | L’Occitane International | | |
| | SA | 5,449,000 | 16,070 |
| * | Reinet Investments SCA | 10,970 | 188 |
| | | | 16,258 |
| Mexico (0.3%) | | |
| * | Desarrolladora Homex | | |
| | SAB de CV ADR | 205,715 | 6,908 |
| |
| Netherlands (4.5%) | | |
| | Fugro NV | 380,000 | 26,902 |
| | Delta Lloyd NV | 1,300,000 | 26,878 |
| | Imtech NV | 750,000 | 25,197 |
| | Ten Cate NV | 630,000 | 20,799 |
| * | TomTom NV | 890,086 | 7,813 |
| *,^ | Gamma Holding NV | 40,453 | 1,227 |
| * | HAL Trust | 1,856 | 226 |
| | | | 109,042 |
| New Zealand (0.9%) | | |
| | Fletcher Building Ltd. | 3,365,840 | 21,089 |
| |
| Norway (1.3%) | | |
| * | Storebrand ASA | 1,100,000 | 8,020 |
| * | Morpol ASA | 2,100,000 | 7,637 |
| * | Statoil Fuel & Retail ASA | 854,340 | 6,054 |
| | | |
| | | | Market |
| | | | Value |
| | | Shares | ($000) |
| * | Dockwise Ltd. | 215,000 | 5,469 |
| * | Pronova BioPharma AS | 3,200,000 | 5,360 |
| * | Kongsberg Gruppen AS | 19,670 | 410 |
| | | | 32,950 |
| Philippines (1.8%) | | |
| | Semirara Mining Corp. | | |
| | Class A | 8,557,360 | 34,166 |
| | Aboitiz Equity | | |
| | Ventures Inc. | 12,949,000 | 10,097 |
| | | | 44,263 |
| Portugal (0.1%) | | |
| | Zon Multimedia Servicos | | |
| | de Telecomunicacoes e | | |
| | Multimedia SGPS SA | 385,000 | 2,055 |
| |
| Singapore (1.6%) | | |
| | SATS Ltd. | 4,124,000 | 9,093 |
| * | Biosensors International | | |
| | Group Ltd. | 6,834,000 | 5,930 |
| | SIA Engineering Co. Ltd. | 1,472,000 | 4,939 |
| | Yanlord Land Group Ltd. | 3,473,000 | 4,643 |
| *,^ | Neptune Orient Lines Ltd. | 2,754,000 | 4,578 |
| *,^ | Tiger Airways | | |
| | Holdings Ltd. | 2,815,000 | 4,051 |
| | SembCorp Industries Ltd. | 863,000 | 3,063 |
| * | Cache Logistics Trust | 3,034,000 | 2,345 |
| * | Indofood Agri | | |
| | Resources Ltd. | 161,000 | 325 |
| | CapitaCommercial Trust | 225,000 | 260 |
| | CapitaMalls Asia Ltd. | 131,000 | 217 |
| | Hyflux Ltd. | 68,000 | 166 |
| | | | 39,610 |
| South Africa (0.0%) | | |
| | Aquarius Platinum Ltd. | 36,851 | 213 |
| |
| South Korea (1.2%) | | |
| | Samsung SDI Co. Ltd. | 65,669 | 9,020 |
| | Glovis Co. Ltd. | 50,932 | 7,222 |
| | Hankook Tire Co. Ltd. | 195,190 | 5,084 |
| | Doosan Corp. | 23,741 | 3,203 |
| | Taewoong Co. Ltd. | 62,465 | 3,124 |
| | LG Household & | | |
| | Health Care Ltd. | 843 | 282 |
| * | Daum | | |
| | Communications Corp. | 2,415 | 168 |
| | OCI Co. Ltd. | 537 | 158 |
| | | | 28,261 |
| Spain (0.7%) | | |
| *,^ | Codere SA | 683,100 | 7,598 |
| | Enagas | 322,991 | 7,124 |
| | Pescanova SA | 82,274 | 2,684 |
| | Grifols SA | 9,736 | 158 |
| | | | 17,564 |
19
International Explorer Fund
| | | |
| | | | Market |
| | | | Value |
| | | Shares | ($000) |
| Sweden (1.0%) | | |
| *,^ | Byggmax Group AB | 2,207,018 | 17,709 |
| | Kungsleden AB | 810,718 | 6,426 |
| * | Bjoern Borg AB | 20,001 | 182 |
| | | | 24,317 |
| Switzerland (7.4%) | | |
| * | Gategroup Holding AG | 550,000 | 25,487 |
| | Helvetia Holding AG | 67,402 | 23,742 |
| | Kuoni Reisen Holding AG | 50,000 | 21,445 |
| * | GAM Holding AG | 1,083,480 | 17,118 |
| | Partners Group Holding | | |
| | AG | 73,000 | 13,354 |
| | Sika AG | 6,500 | 12,889 |
| | Banque Cantonale | | |
| | Vaudoise | 25,000 | 12,152 |
| | Bank Sarasin & Cie AG | | |
| | Class B | 326,000 | 11,930 |
| * | Orior AG | 220,000 | 10,364 |
| | Forbo Holding AG | 15,700 | 8,457 |
| | Valora Holding AG | 30,000 | 7,924 |
| | Implenia AG | 200,474 | 6,022 |
| | Gurit Holding AG | 9,763 | 5,330 |
| | VZ Holding AG | 19,000 | 2,018 |
| * | Dufry Group | 5,362 | 624 |
| | Newave Energy Holding | | |
| | SA | 12,450 | 575 |
| * | Temenos Group AG | 9,486 | 318 |
| | | | 179,749 |
| Taiwan (0.3%) | | |
| | Hung Poo Real Estate | | |
| | Development Corp. | 2,807,000 | 4,174 |
| * | Bank of Kaohsiung | 9,863,000 | 4,128 |
| | | | 8,302 |
| United Kingdom (15.9%) | | |
| * | Premier Oil plc | 775,000 | 20,875 |
| | Carillion plc | 3,200,000 | 17,654 |
| * | Gulfsands Petroleum plc | 3,200,000 | 16,946 |
| | Ultra Electronics | | |
| | Holdings plc | 510,227 | 15,206 |
| | Meggitt plc | 2,600,000 | 13,745 |
| * | Sports Direct | | |
| | International plc | 5,933,904 | 13,310 |
| * | CSR plc | 2,550,000 | 13,017 |
| | Dechra | | |
| | Pharmaceuticals plc | 1,483,982 | 12,614 |
| * | Homeserve plc | 1,692,870 | 12,295 |
| | Atkins WS plc | 985,000 | 11,893 |
| * | SIG plc | 5,658,663 | 10,282 |
| | Millennium & | | |
| | Copthorne Hotels plc | 1,145,315 | 10,002 |
| | JD Wetherspoon plc | 1,300,000 | 8,545 |
| | Elementis plc | 4,500,000 | 8,251 |
| * | Punch Taverns plc | 7,000,000 | 8,038 |
| * | Highland Gold Mining Ltd. | 3,000,000 | 7,643 |
| | | |
| | | | Market |
| | | | Value |
| | | Shares | ($000) |
| | Grainger plc | 4,474,033 | 7,630 |
| * | Inchcape plc | 1,300,000 | 7,265 |
| | BSS Group plc | 1,000,000 | 7,095 |
| * | London Mining plc | 1,391,608 | 7,062 |
| | Booker Group plc | 8,000,000 | 6,946 |
| | Telecom Plus plc | 1,100,000 | 6,866 |
| | Petropavlovsk plc | 441,115 | 6,837 |
| * | BTG plc | 1,753,961 | 6,795 |
| | Devro plc | 1,860,201 | 6,719 |
| * | National Express | | |
| | Group plc | 1,609,166 | 6,430 |
| | William Hill plc | 2,450,082 | 6,303 |
| | Pace plc | 1,886,770 | 6,189 |
| | Informa plc | 859,200 | 6,008 |
| | John Wood Group plc | 800,000 | 5,582 |
| | Go-Ahead Group plc | 253,964 | 5,549 |
| | RM plc | 2,034,198 | 5,535 |
| | Nestor | | |
| | Healthcare Group plc | 3,520,445 | 5,475 |
| | Eco Animal | | |
| | Health Group plc | 1,618,166 | 5,375 |
| | QinetiQ Group plc | 3,000,000 | 5,162 |
| | PV Crystalox Solar plc | 6,000,000 | 5,099 |
| * | LMS Capital plc | 6,150,108 | 5,014 |
| | CPP Group plc | 1,175,067 | 4,953 |
| | Paragon Group of | | |
| | Cos. plc | 2,016,938 | 4,910 |
| | Photo-Me | | |
| | International plc | 3,947,604 | 4,460 |
| | Lamprell plc | 700,000 | 3,769 |
| | Hunting plc | 317,094 | 3,273 |
| | Babcock | | |
| | International Group plc | 293,060 | 2,723 |
| ^ | HMV Group plc | 3,745,971 | 2,709 |
| | Forth Ports plc | 127,658 | 2,698 |
| | Future plc | 7,510,000 | 2,652 |
| * | Findel plc | 9,144,945 | 2,454 |
| | Wellstream Holdings plc | 200,000 | 2,370 |
| * | Alexon Group plc | 7,303,119 | 2,052 |
| | Speedy Hire plc | 5,000,000 | 1,980 |
| *,^ | Yell Group plc | 8,000,000 | 1,813 |
| * | Helphire plc | 5,200,000 | 1,808 |
| * | Chrysalis Group plc | 1,000,000 | 1,767 |
| | Moneysupermarket.com | | |
| | Group plc | 1,237,667 | 1,658 |
| * | Wolfson | | |
| | Microelectronics plc | 357,157 | 1,457 |
| *,2 | AEA Technology plc | 13,214,660 | 1,303 |
| | Record plc | 629,023 | 453 |
| | Domino’s Pizza UK & | | |
| | IRL plc | 57,438 | 449 |
| | Chemring Group plc | 6,748 | 324 |
| | IG Group Holdings plc | 37,171 | 314 |
| | N Brown Group plc | 64,925 | 313 |
| * | Debenhams plc | 239,758 | 293 |
20
International Explorer Fund
| | | |
| | | | Market |
| | | | Value |
| | | Shares | ($000) |
| | Rightmove plc | 21,464 | 274 |
| * | Jupiter Fund | | |
| | Management plc | 58,059 | 263 |
| | Ashmore Group plc | 42,488 | 261 |
| | James Fisher & Sons plc | 31,361 | 258 |
| | Mears Group plc | 50,345 | 245 |
| | Land Securities Group plc | 22,181 | 241 |
| | Close Brothers Group plc | 19,356 | 239 |
| | Kier Group plc | 10,820 | 230 |
| | Rotork plc | 8,226 | 221 |
| | AMEC plc | 12,009 | 209 |
| * | Cookson Group plc | 24,092 | 199 |
| | Hansteen Holdings plc | 168,761 | 195 |
| | Savills plc | 33,400 | 176 |
| * | Persimmon plc | 30,626 | 167 |
| | African Barrick Gold Ltd. | 17,953 | 157 |
| | Hampson Industries plc | 174,604 | 89 |
| * | Pinnacle | | |
| | Staffing Group plc | 723,983 | 19 |
| * | I-mate plc | 2,100,00 | 4 |
| | | | 387,654 |
| Total Common Stocks | | |
| (Cost $1,900,145) | | 2,280,742 |
| | | |
| | | | Market |
| | | | Value |
| | | Shares | ($000) |
| Temporary Cash Investments (10.0%)1 | |
| Money Market Fund (9.7%) | |
| 3,4 | Vanguard Market | | |
| | Liquidity Fund, | | |
| | 0.237% | 236,585,768 | 236,586 |
| |
| | | Face | |
| | | Amount | |
| | | ($000) | |
| Repurchase Agreement (0.1%) | |
| | Goldman, Sachs & Co. | |
| | 0.230%, 11/1/10 (Dated | |
| | 10/29/10, Repurchase Value | |
| | $1,400,000, collateralized | |
| | by Government National | |
| | Mortgage Assn. | | |
| | 5.000%, 8/15/39) | 1,400 | 1,400 |
| |
| U.S. Government and Agency Obligations (0.2%) |
| 5,6 | Fannie Mae Discount Notes, | |
| | 0.340%, 3/1/11 | 500 | 500 |
| 5,6 | Freddie Mac Discount Notes, | |
| | 0.295%, 12/15/10 | 4,000 | 3,999 |
| | | | 4,499 |
| Total Temporary Cash Investments | |
| (Cost $242,484) | | 242,485 |
| Total Investments (103.6%) | |
| (Cost $2,142,629) | | 2,523,227 |
| Other Assets and Liabilities (-3.6%) | |
| Other Assets | | 41,347 |
| Liabilities4 | | (128,911) |
| | | | (87,564) |
| Net Assets (100%) | | |
| Applicable to 154,042,008 outstanding | |
| $.001 par value shares of beneficial | |
| interest (unlimited authorization) | 2,435,663 |
| Net Asset Value Per Share | $15.81 |
21
International Explorer Fund
| |
| At October 31, 2010, net assets consisted of: |
| | Amount |
| | ($000) |
| Paid-in Capital | 2,132,614 |
| Undistributed Net Investment Income | 26,689 |
| Accumulated Net Realized Losses | (107,663) |
| Unrealized Appreciation (Depreciation) | |
| Investment Securities | 380,598 |
| Futures Contracts | (103) |
| Foreign Currencies and | |
| Forward Currency Contracts | 3,528 |
| Net Assets | 2,435,663 |
See Note A in Notes to Financial Statements.
* Non-income-producing security.
^ Part of security position is on loan to broker-dealers. The total value of securities on loan is $70,508,000.
1 The fund invests a portion of its cash reserves in equity markets through the use of index futures contracts. After giving effect to futures investments, the fund’s effective common stock and temporary cash investment positions represent 96.6% and 7.0%, respectively, of net assets.
2 Considered an affiliated company of the fund as the fund owns more than 5% of the outstanding voting securities of such company.
3 Affiliated money market fund available only to Vanguard funds and certain trusts and accounts managed by Vanguard. Rate shown is th 7-day yield.
4 Includes $74,228,000 of collateral received for securities on loan.
5 The issuer operates under a congressional charter; its securities are not backed by the full faith and credit of the U.S. government.
6 Securities with a value of $4,499,000 have been segregated as initial margin for open futures contracts.
ADR—American Depositary Receipt.
See accompanying Notes, which are an integral part of the Financial Statements.
22
International Explorer Fund
Statement of Operations
| |
| | Year Ended |
| | October 31, 2010 |
| | ($000) |
| Investment Income | |
| Income | |
| Dividends1 | 43,361 |
| Interest2 | 201 |
| Security Lending | 1,561 |
| Total Income | 45,123 |
| Expenses | |
| Investment Advisory Fees—Note B | 4,309 |
| The Vanguard Group—Note C | |
| Management and Administrative | 3,311 |
| Marketing and Distribution | 463 |
| Custodian Fees | 435 |
| Auditing Fees | 32 |
| Shareholders’ Reports | 23 |
| Trustees’ Fees and Expenses | 4 |
| Total Expenses | 8,577 |
| Expenses Paid Indirectly | (34) |
| Net Expenses | 8,543 |
| Net Investment Income | 36,580 |
| Realized Net Gain (Loss) | |
| Investment Securities Sold | 105,603 |
| Futures Contracts | 699 |
| Foreign Currencies and Forward Currency Contracts | 3,538 |
| Realized Net Gain (Loss) | 109,840 |
| Change in Unrealized Appreciation (Depreciation) | |
| Investment Securities | 216,825 |
| Futures Contracts | (103) |
| Foreign Currencies and Forward Currency Contracts | 3,424 |
| Change in Unrealized Appreciation (Depreciation) | 220,146 |
| Net Increase (Decrease) in Net Assets Resulting from Operations | 366,566 |
| 1 Dividends are net of foreign withholding taxes of $4,313,000. |
| 2 Interest income from an affiliated company of the fund was $191,000. |
See accompanying Notes, which are an integral part of the Financial Statements.
23
International Explorer Fund
Statement of Changes in Net Assets
| | |
| | Year Ended October 31, |
| | 2010 | 2009 |
| | ($000) | ($000) |
| Increase (Decrease) in Net Assets | | |
| Operations | | |
| Net Investment Income | 36,580 | 26,607 |
| Realized Net Gain (Loss) | 109,840 | (138,373) |
| Change in Unrealized Appreciation (Depreciation) | 220,146 | 623,629 |
| Net Increase (Decrease) in Net Assets Resulting from Operations | 366,566 | 511,863 |
| Distributions | | |
| Net Investment Income | (29,545) | (37,635) |
| Realized Capital Gain | — | — |
| Total Distributions | (29,545) | (37,635) |
| Capital Share Transactions | | |
| Issued | 661,913 | 642,115 |
| Issued in Lieu of Cash Distributions | 26,292 | 32,939 |
| Redeemed1 | (501,045) | (317,000) |
| Net Increase (Decrease) from Capital Share Transactions | 187,160 | 358,054 |
| Total Increase (Decrease) | 524,181 | 832,282 |
| Net Assets | | |
| Beginning of Period | 1,911,482 | 1,079,200 |
| End of Period2 | 2,435,663 | 1,911,482 |
| 1 Net of redemption fees for fiscal 2010 and 2009 of $215,000 and $170,000, respectively. |
| 2 Net Assets—End of Period includes undistributed net investment income of $26,689,000 and $19,402,000. |
See accompanying Notes, which are an integral part of the Financial Statements.
24
International Explorer Fund
Financial Highlights
| | | | | |
| For a Share Outstanding | | | Year Ended October 31, |
| Throughout Each Period | 2010 | 2009 | 2008 | 2007 | 2006 |
| Net Asset Value, Beginning of Period | $13.55 | $9.52 | $24.70 | $21.50 | $17.99 |
| Investment Operations | | | | | |
| Net Investment Income | .237 | .238 | .470 | .480 | .520 |
| Net Realized and Unrealized Gain (Loss) | | | | | |
| on Investments | 2.225 | 4.148 | (12.110) | 4.950 | 4.740 |
| Total from Investment Operations | 2.462 | 4.386 | (11.640) | 5.430 | 5.260 |
| Distributions | | | | | |
| Dividends from Net Investment Income | (.202) | (.356) | (.620) | (.580) | (.400) |
| Distributions from Realized Capital Gains | — | — | (2.920) | (1.650) | (1.350) |
| Total Distributions | (.202) | (.356) | (3.540) | (2.230) | (1.750) |
| Net Asset Value, End of Period | $15.81 | $13.55 | $9.52 | $24.70 | $21.50 |
| |
| Total Return1 | 18.38% | 47.88% | -53.80% | 27.18% | 31.31% |
| |
| Ratios/Supplemental Data | | | | | |
| Net Assets, End of Period (Millions) | $2,436 | $1,911 | $1,079 | $3,252 | $2,668 |
| Ratio of Total Expenses to | | | | | |
| Average Net Assets2 | 0.39% | 0.45% | 0.36% | 0.35% | 0.44% |
| Ratio of Net Investment Income to | | | | | |
| Average Net Assets | 1.67% | 2.10% | 2.59% | 1.99% | 2.56% |
| Portfolio Turnover Rate | 51% | 52% | 29% | 45% | 32% |
1 Total returns do not include transaction or account service fees that may have applied in the periods shown. Fund prospectuses provide information about any applicable transaction and account service fees.
2 Includes performance-based investment advisory fee increases (decreases) of 0.00%, 0.00%, (0.01%), 0.00%, and 0.02%.
See accompanying Notes, which are an integral part of the Financial Statements.
25
International Explorer Fund
Notes to Financial Statements
Vanguard International Explorer Fund is registered under the Investment Company Act of 1940 as an open-end investment company, or mutual fund. The fund invests in securities of foreign issuers, which may subject it to investment risks not normally associated with investing in securities of United States corporations.
A. The following significant accounting policies conform to generally accepted accounting principles for U.S. mutual funds. The fund consistently follows such policies in preparing its financial statements.
1. Security Valuation: Securities are valued as of the close of trading on the New York Stock Exchange (generally 4 p.m., Eastern time) on the valuation date. Equity securities are valued at the latest quoted sales prices or official closing prices taken from the primary market in which each security trades; such securities not traded on the valuation date are valued at the mean of the latest quoted bid and asked prices. Securities for which market quotations are not readily available, or whose values have been affected by events occurring before the fund’s pricing time but after the close of the securities’ primary markets, are valued at their fair values calculated according to procedures adopted by the board of trustees. These procedures include obtaining quotations from an independent pricing service, monitoring news to identify significant market- or security-specific events, and evaluating changes in the values of foreign market proxies (for example, A DRs, futures contracts, or exchange-traded funds), between the time the foreign markets close and the fund’s pricing time. When fair-value pricing is employed, the prices of securities used by a fund to calculate its net asset value may differ from quoted or published prices for the same securities. Investments in Vanguard Market Liquidity Fund are valued at that fund’s net asset value. Temporary cash investments acquired over 60 days to maturity are valued using the latest bid prices or using valuations based on a matrix system (which considers such factors as security prices, yields, maturities, and ratings), both as furnished by independent pricing services. Other temporary cash investments are valued at amortized cost, which approximates market value.
2. Foreign Currency: Securities and other assets and liabilities denominated in foreign currencies are translated into U.S. dollars using exchange rates obtained from an independent third party as of the fund’s pricing time on the valuation date. Realized gains (losses) and unrealized appreciation (depreciation) on investment securities include the effects of changes in exchange rates since the securities were purchased, combined with the effects of changes in security prices. Fluctuations in the value of other assets and liabilities resulting from changes in exchange rates are recorded as unrealized foreign currency gains (losses) until the assets or liabilities are settled in cash, at which time they are recorded as realized foreign currency gains (losses).
3. Futures and Forward Currency Contracts: The fund uses index futures contracts to a limited extent, with the objective of maintaining full exposure to the stock market while maintaining liquidity. The fund may purchase or sell futures contracts to achieve a desired level of investment, whether to accommodate portfolio turnover or cash flows from capital share transactions. The primary risks associated with the use of futures contracts are imperfect correlation between changes in market values of stocks held by the fund and the prices of futures contracts, and the possibility of an illiquid market.
26
International Explorer Fund
The fund also enters into forward currency contracts to provide the appropriate currency exposure related to any open futures contracts or to protect the value of securities and related receivables and payables against changes in foreign exchange rates. The primary risk associated with the fund’s use of these contracts is that a counterparty will fail to fulfill its obligation to pay gains due to the fund under the contracts. Counterparty risk is mitigated by entering into forward currency contracts only with highly rated counterparties, by a master netting arrangement between the fund and the counterparty, and by the posting of collateral by the counterparty. The forward currency contracts contain provisions whereby a counterparty may terminate open contracts if the fund’s net assets decline below a certain level, triggering a payment by the fund if the fund is in a net liability position at the time of the termination. The payment amount would be reduced b y any collateral the fund has posted. Any securities posted as collateral for open contracts are noted in the Statement of Net Assets.
Futures contracts are valued at their quoted daily settlement prices. Forward currency contracts are valued at their quoted daily prices obtained from an independent third party, adjusted for currency risk based on the expiration date of each contract. The aggregate principal amounts of the contracts are not recorded in the Statement of Net Assets. Fluctuations in the value of the contracts are recorded in the Statement of Net Assets as an asset (liability) and in the Statement of Operations as unrealized appreciation (depreciation) until the contracts are closed, when they are recorded as realized gains (losses) on futures or forward currency contracts.
4. Repurchase Agreements: The fund invests in repurchase agreements. Securities pledged as collateral for repurchase agreements are held by a custodian bank until the agreements mature. Each agreement requires that the market value of the collateral be sufficient to cover payments of interest and principal; however, in the event of default or bankruptcy by the other party to the agreement, retention of the collateral may be subject to legal proceedings.
5. Federal Income Taxes: The fund intends to continue to qualify as a regulated investment company and distribute all of its taxable income. Management has analyzed the fund’s tax positions taken for all open federal income tax years (October 31, 2007–2010), and has concluded that no provision for federal income tax is required in the fund’s financial statements.
6. Distributions: Distributions to shareholders are recorded on the ex-dividend date.
7. Security Lending: The fund may lend its securities to qualified institutional borrowers to earn additional income. Security loans are required to be secured at all times by collateral at least equal to the market value of securities loaned. The fund invests cash collateral received in Vanguard Market Liquidity Fund, and records a liability for the return of the collateral, during the period the securities are on loan. Security lending income represents fees charged to borrowers plus income earned on investing cash collateral, less expenses associated with the loan.
8. Other: Dividend income is recorded on the ex-dividend date. Interest income includes income distributions received from Vanguard Market Liquidity Fund and is accrued daily. Security transactions are accounted for on the date securities are bought or sold. Costs used to determine realized gains (losses) on the sale of investment securities are those of the specific securities sold. Fees assessed on redemptions of capital shares are credited to paid-in capital.
27
International Explorer Fund
B. Schroder Investment Management North America Inc., and beginning in June 2010, Wellington Management Company, LLP, each provide investment advisory services to a portion of the fund for a fee calculated at an annual percentage rate of average net assets managed by the advisor. The basic fee of Schroder Investment Management North America Inc. is subject to quarterly adjustments based on the fund’s performance for the preceding three years relative to the S&P EPAC SmallCap Index.
In accordance with the advisory contract entered into with Wellington Management Company, LLP, in June 2010, beginning May 1, 2011, the investment advisory fee will be subject to quarterly adjustments based on performance since July 31, 2010, relative to the S&P EPAC SmallCap Index.
The Vanguard Group manages the cash reserves of the fund on an at-cost basis.
For the year ended October 31, 2010, the aggregate investment advisory fee represented an effective annual basic rate of 0.20% of the fund’s average net assets, with no adjustment required based on performance.
C. The Vanguard Group furnishes at cost corporate management, administrative, marketing, and distribution services. The costs of such services are allocated to the fund under methods approved by the board of trustees. The fund has committed to provide up to 0.40% of its net assets in capital contributions to Vanguard. At October 31, 2010, the fund had contributed capital of $422,000 to Vanguard (included in Other Assets), representing 0.02% of the fund’s net assets and 0.17% of Vanguard’s capitalization. The fund’s trustees and officers are also directors and officers of Vanguard.
D. The fund has asked its investment advisors to direct certain security trades, subject to obtaining the best price and execution, to brokers who have agreed to rebate to the fund part of the commissions generated. Such rebates are used solely to reduce the fund’s management and administrative expenses. For the year ended October 31, 2010, these arrangements reduced the fund’s expenses by $34,000 (an annual rate of 0.00% of average net assets).
E. Various inputs may be used to determine the value of the fund’s investments. These inputs are summarized in three broad levels for financial statement purposes. The inputs or methodologies used to value securities are not necessarily an indication of the risk associated with investing in those securities.
Level 1—Quoted prices in active markets for identical securities.
Level 2—Other significant observable inputs (including quoted prices for similar securities, interest rates, prepayment speeds, credit risk, etc.).
Level 3—Significant unobservable inputs (including the fund’s own assumptions used to determine the fair value of investments).
The following table summarizes the fund’s investments as of October 31, 2010, based on the inputs used to value them:
| | | |
| | Level 1 | Level 2 | Level 3 |
| Investments | ($000) | ($000) | ($000) |
| Common Stocks | 141,831 | 2,138,907 | 4 |
| Temporary Cash Investments | 236,586 | 5,899 | — |
| Futures Contracts—Liabilities1 | (421) | — | — |
| Forward Currency Contracts----Assets | — | 2,841 | — |
| Total | 377,996 | 2,147,647 | 4 |
| 1 Represents variation margin on the last day of the reporting period. |
28
International Explorer Fund
The following table summarizes changes in investments valued based on Level 3 inputs during the year ended October 31, 2010:
| |
| | Investments in |
| | Common Stocks |
| Amount Valued Based on Level 3 Inputs | ($000) |
| Balance as of October 31, 2009 | 4 |
| Change in Unrealized Appreciation (Depreciation) | — |
| Balance as of October 31, 2010 | 4 |
F. At October 31, 2010, the fair values of derivatives were reflected in the Statement of Net Assets as follows:
| | | |
| | | Foreign | |
| | Equity | Exchange | |
| | Contracts | Contracts | Total |
| Statement of Net Assets Caption | ($000) | ($000) | ($000) |
| Other Assets | — | 2,841 | 2,841 |
| Liabilities1 | (421) | — | (421) |
| 1 Represents variation margin on the last day of the reporting period. |
Realized net gain (loss) and the change in unrealized appreciation (depreciation) on derivatives for the year ended October 31, 2010, were:
| | | |
| | | Foreign | |
| | Equity | Exchange | |
| | Contracts | Contracts | Total |
| Realized Net Gain (Loss) on Derivatives | ($000) | ($000) | ($000) |
| Futures Contracts | 699 | — | 699 |
| Forward Currency Contracts | — | 4,002 | 4,002 |
| Realized Net Gain (Loss) on Derivatives | 699 | 4,002 | 4,701 |
| |
| Change in Unrealized Appreciation (Depreciation) on Derivatives | | | |
| Futures Contracts | (103) | — | (103) |
| Forward Currency Contracts | — | 2,841 | 2,841 |
| Change in Unrealized Appreciation (Depreciation) on Derivatives | (103) | 2,841 | 2,738 |
29
International Explorer Fund
At October 31, 2010, the aggregate settlement value of open futures contracts and the related unrealized appreciation (depreciation) were:
| | | | |
| | | | | ($000) |
| | | | Aggregate | |
| | | Number of | Settlement | Unrealized |
| | | Long (Short) | Value | Appreciation |
| Futures Contracts | Expiration | Contracts | Long (Short) | (Depreciation) |
| Topix Index | December 2010 | 253 | 25,316 | (423) |
| Dow Jones EURO STOXX 50 Index | December 2010 | 529 | 20,874 | 268 |
| S&P ASX 200 Index | December 2010 | 161 | 18,334 | (58) |
| FTSE 100 Index | December 2010 | 95 | 8,598 | 110 |
Unrealized appreciation (depreciation) on open FTSE 100 Index futures contracts is required to be treated as realized gain (loss) for tax purposes.
At October 31, 2010, the fund had open forward currency contracts to receive and deliver currencies as follows. Unrealized appreciation (depreciation) on open forward currency contracts is treated as realized gain (loss) for tax purposes.
| | | | | | |
| | | | | | | Unrealized |
| | Contract | | | | | Appreciation |
| | Settlement | | | Contract Amount (000) | (Depreciation) |
| Counterparty | Date | | Receive | | Deliver | ($000) |
| Brown Brothers Harriman & Co. | 12/15/10 | JPY | 2,073,192 | USD | 25,764 | 780 |
| Brown Brothers Harriman & Co. | 12/22/10 | EUR | 14,826 | USD | 20,636 | 1,100 |
| Brown Brothers Harriman & Co. | 12/22/10 | AUD | 18,763 | USD | 18,379 | 694 |
| Brown Brothers Harriman & Co. | 12/22/10 | GBP | 5,310 | USD | 8,508 | 267 |
AUD—Australian dollar.
EUR—Euro.
GBP—British pound.
JPY—Japanese yen.
USD—U.S. dollar.
At October 31, 2010, the counterparty had deposited in a segregated account cash with a value sufficient to cover substantially all amounts due to the fund in connection with open forward currency contracts.
The fund had net unrealized foreign currency gains of $687,000 resulting from the translation of other assets and liabilities at October 31, 2010.
30
International Explorer Fund
G. Distributions are determined on a tax basis and may differ from net investment income and realized capital gains for financial reporting purposes. Differences may be permanent or temporary. Permanent differences are reclassified among capital accounts in the financial statements to reflect their tax character. Temporary differences arise when certain items of income, expense, gain, or loss are recognized in different periods for financial statement and tax purposes; these differences will reverse at some time in the future. Differences in classification may also result from the treatment of short-term gains as ordinary income for tax purposes.
During the year ended October 31, 2010, the fund realized net foreign currency losses of $464,000, which decreased distributable net income for tax purposes; accordingly, such losses have been reclassified from accumulated net realized losses to undistributed net investment income. Certain of the fund’s investments are in securities considered to be “passive foreign investment companies,” for which any unrealized appreciation and/or realized gains are required to be included in distributable net income for tax purposes. Unrealized appreciation of $4,126,000 on the fund’s passive foreign investment company holdings at October 31, 2009, has been distributed and is reflected in the balance of undistributed net investment income. During the year ended October 31, 2010, the fund realized gains on the sale of passive foreign investment companies of $1,288,000, which have been included in current and prior periods’ taxable income; accordingly, such g ains have been reclassified from accumulated net realized losses to undistributed net investment income. Unrealized appreciation on the fund’s passive foreign investment company holdings at October 31, 2010, was $2,608,000.
The fund’s realized losses for the year ended October 31, 2010, include $572,000 of capital gain tax paid on sales of Indian securities. This tax is treated as a decrease to taxable income; accordingly, this amount has been reclassified from accumulated net realized losses to undistributed net investment income.
For tax purposes, at October 31, 2010, the fund had $33,698,000 of ordinary income available for distribution. The fund had available capital loss carryforwards totaling $105,115,000 to offset future net capital gains through October 31, 2017.
At October 31, 2010, the cost of investment securities for tax purposes was $2,145,237,000. Net unrealized appreciation of investment securities for tax purposes was $377,990,000, consisting of unrealized gains of $537,417,000 on securities that had risen in value since their purchase and $159,427,000 in unrealized losses on securities that had fallen in value since their purchase.
H. During the year ended October 31, 2010, the fund purchased $1,184,103,000 of investment securities and sold $1,030,062,000 of investment securities, other than temporary cash investments.
I. The fund has invested in a company that is considered to be an affiliated company of the fund because the fund owns more than 5% of the outstanding voting securities of the company. Transactions during the period in securities of this company were as follows:
| | | | | |
| | | | Current Period Transactions | |
| | Oct. 31, 2009 | | Proceeds from | | Oct. 31, 2010 |
| | Market | Purchases | Securities | Dividend | Market |
| | Value | at Cost | Sold | Income | Value |
| | ($000) | ($000) | ($000) | ($000) | ($000) |
| AEA Technology plc | NA1 | 532 | — | — | 1,303 |
| 1 Not applicable—At October 31, 2009, the issuer was not an affiliated company of the fund. |
31
International Explorer Fund
J. Capital shares issued and redeemed were:
| | |
| | Year Ended October 31, |
| | 2010 | 2009 |
| | Shares | Shares |
| | (000) | (000) |
| Issued | 46,958 | 56,374 |
| Issued in Lieu of Cash Distributions | 1,900 | 3,608 |
| Redeemed | (35,926) | (32,257) |
| Net Increase (Decrease) in Shares Outstanding | 12,932 | 27,725 |
K. In preparing the financial statements as of October 31, 2010, management considered the impact of subsequent events for potential recognition or disclosure in these financial statements.
32
Report of Independent Registered Public Accounting Firm
To the Trustees of Vanguard Whitehall Funds and the Shareholders of Vanguard International Explorer Fund:
In our opinion, the accompanying statement of net assets and the related statements of operations and of changes in net assets and the financial highlights present fairly, in all material respects, the financial position of Vanguard International Explorer Fund (constituting a separate portfolio of Vanguard Whitehall Funds, hereafter referred to as the “Fund”) at October 31, 2010, the results of its operations for the year then ended, the changes in its net assets for each of the two years in the period then ended and the financial highlights for each of the five years in the period then ended, in conformity with accounting principles generally accepted in the United States of America. These financial statements and financial highlights (hereafter referred to as “financial statements”) are the responsibility of the Fund’s management; our responsibility is to express an opinion on these financial statements based on our audits. We con ducted our audits of these financial statements in accordance with the standards of the Public Company Accounting Oversight Board (United States). Those standards require that we plan and perform the audit to obtain reasonable assurance about whether the financial statements are free of material misstatement. An audit includes examining, on a test basis, evidence supporting the amounts and disclosures in the financial statements, assessing the accounting principles used and significant estimates made by management, and evaluating the overall financial statement presentation. We believe that our audits, which included confirmation of securities at October 31, 2010 by correspondence with the custodians and brokers and by agreement to the underlying ownership records of Vanguard Market Liquidity Fund, provide a reasonable basis for our opinion.
PricewaterhouseCoopers LLP
Philadelphia, Pennsylvania
December 14, 2010
|
| Special 2010 tax information (unaudited) for Vanguard International Explorer Fund |
This information for the fiscal year ended October 31, 2010, is included pursuant to provisions of the Internal Revenue Code.
The fund distributed $23,645,000 of qualified dividend income to shareholders during the fiscal year.
The fund designates to shareholders foreign source income of $47,698,000 and foreign taxes paid of $4,352,000. Shareholders will receive more detailed information with their Form 1099-DIV in January 2011 to determine the calendar-year amounts to be included on their 2010 tax returns.
33
Your Fund’s After-Tax Returns
This table presents returns for your fund both before and after taxes. The after-tax returns are shown in two ways: (1) assuming that an investor owned the fund during the entire period and paid taxes on the fund’s distributions, and (2) assuming that an investor paid taxes on the fund’s distributions and sold all shares at the end of each period.
Calculations are based on the highest individual federal income tax and capital gains tax rates in effect at the times of the distributions and the hypothetical sales. State and local taxes were not considered. After-tax returns reflect any qualified dividend income , using actual prior-year figures and estimates for 2010. (In the example, returns after the sale of fund shares may be higher than those assuming no sale. This occurs when the sale would have produced a capital loss. The calculation assumes that the investor received a tax deduction for the loss.) Please note that your actual after-tax returns will depend on your tax situation and may differ from those shown. Also note that if you own the fund in a tax-deferred account, such as an individual retirement account or a 401(k) plan, this information does not apply to you. Such accounts are not subject to current taxes.
Finally, keep in mind that a fund’s performance—whether before or after taxes—does not guarantee future results.
Average Annual Total Returns: International Explorer Fund
Periods Ended October 31, 2010
| | | |
| | One | Five | Ten |
| | Year | Years | Years |
| Returns Before Taxes | 18.38% | 6.20% | 7.34% |
| Returns After Taxes on Distributions | 18.15 | 4.75 | 5.88 |
| Returns After Taxes on Distributions and Sale of Fund Shares | 12.25 | 5.14 | 5.86 |
Returns do not reflect the 2% fee on redemptions of shares held for less than two months.
34
About Your Fund’s Expenses
As a shareholder of the fund, you incur ongoing costs, which include costs for portfolio management, administrative services, and shareholder reports (like this one), among others. Operating expenses, which are deducted from a fund’s gross income, directly reduce the investment return of the fund.
A fund’s expenses are expressed as a percentage of its average net assets. This figure is known as the expense ratio. The following examples are intended to help you understand the ongoing costs (in dollars) of investing in your fund and to compare these costs with those of other mutual funds. The examples are based on an investment of $1,000 made at the beginning of the period shown and held for the entire period.
The accompanying table illustrates your fund’s costs in two ways:
• Based on actual fund return. This section helps you to estimate the actual expenses that you paid over the period. The ”Ending Account Value“ shown is derived from the fund‘s actual return, and the third column shows the dollar amount that would have been paid by an investor who started with $1,000 in the fund. You may use the information here, together with the amount you invested, to estimate the expenses that you paid over the period.
To do so, simply divide your account value by $1,000 (for example, an $8,600 account value divided by $1,000 = 8.6), then multiply the result by the number given for your fund under the heading ”Expenses Paid During Period.“
• Based on hypothetical 5% yearly return. This section is intended to help you compare your fund‘s costs with those of other mutual funds. It assumes that the fund had a yearly return of 5% before expenses, but that the expense ratio is unchanged. In this case—because the return used is not the fund’s actual return—the results do not apply to your investment. The example is useful in making comparisons because the Securities and Exchange Commission requires all mutual funds to calculate expenses based on a 5% return. You can assess your fund’s costs by comparing this hypothetical example with the hypothetical examples that appear in shareholder reports of other funds.
Note that the expenses shown in the table are meant to highlight and help you compare ongoing costs only and do not reflect transaction costs incurred by the fund for buying and selling securities. Further, the expenses do not include the 2% fee on redemptions of shares held for less than two months, nor do they include the account service fee described in the prospectus. If such fees were applied to your account, your costs would be higher. Your fund does not carry a “sales load.” The calculations assume no shares were bought or sold during the period. Your actual costs may have been higher or lower, depending on the amount of your investment and the timing of any purchases or redemptions.
You can find more information about the fund’s expenses, including annual expense ratios, in the Financial Statements section of this report. For additional information on operating expenses and other shareholder costs, please refer to your fund’s current prospectus.
35
Six Months Ended October 31, 2010
| | | |
| | Beginning | Ending | Expenses |
| | Account Value | Account Value | Paid During |
| International Explorer Fund | 4/30/2010 | 10/31/2010 | Period |
| Based on Actual Fund Return | $1,000.00 | $1,089.59 | $2.05 |
| Based on Hypothetical 5% Yearly Return | 1,000.00 | 1,023.24 | 1.99 |
The calculations are based on expenses incurred in the most recent six-month period. The fund’s annualized six-month expense ratio for that period is 0.39%. The dollar amounts shown as “Expenses Paid” are equal to the annualized expense ratio multiplied by the average account value over the period, multiplied by the number of days in the most recent six-month period, then divided by the number of days in the most recent 12-month period.
36
Trustees Approve Advisory Agreements
The board of trustees of Vanguard International Explorer Fund has renewed the fund’s investment advisory agreement with Schroder Investment Management North America Inc. and a sub-advisory agreement with Schroder Investment Management North America Limited. The board determined that the retention of the advisor and the sub-advisor (collectively, Schroder) was in the best interests of the fund and its shareholders. The board also adopted a multimanager investment advisory approach for the fund and added Wellington Management Company, LLP as an additional investment advisor effective June 2010. Please see the semiannual report dated April 30, 2010, for additional information on the board’s approval of the arrangement with Wellington Management.
The board based its decision to retain Schroder upon an evaluation of Schroder’s investment staff, portfolio management process, and performance. The trustees considered the factors discussed below, among others. However, no single factor determined whether the board approved the agreements. Rather, it was the totality of the circumstances that drove the board’s decision.
Nature, extent, and quality of services
The board considered the quality of the fund’s investment management over both the short and long term, and took into account the organizational depth and stability of Schroder. Schroder’s parent company, Schroders plc, has existed for more than 200 years and has investment-management experience dating back to 1926. Schroder continues to employ a sound process, selecting attractive small-cap growth stocks from developed and emerging markets outside the United States. Schroder’s International Small Cap Investment Committee is responsible for the management of its portion of the fund. Stocks are selected using a bottom-up approach, supported by Schroder’s worldwide network of analysts, economists, and strategists.
The board concluded that Schroder’s experience, stability, depth, and performance, among other factors, warranted continuation of the advisory agreements.
Investment performance
The board considered the short- and long-term performance of the fund, including any periods of outperformance or underperformance of a relevant benchmark and peer group. The board concluded that Schroder has carried out the fund’s investment strategy in disciplined fashion, and the performance results have allowed the fund to remain competitive versus its benchmark and peer funds. Information about the fund’s most recent performance can be found in the Performance Summary section of this report.
Cost
The board concluded that the fund’s expense ratio was far below the average expense ratio charged by funds in its peer group. The board noted that the fund’s advisory fee rate was also well below its peer-group average. Information about the fund’s expense ratio appears in the About Your Fund’s Expenses section of this report as well as in the Financial Statements section, which also includes information about the fund’s advisory fee rate.
The board did not consider profitability of Schroder in determining whether to approve the advisory fee, because Schroder is independent of Vanguard, and the advisory fee is the result of arm’s-length negotiations.
The benefit of economies of scale
The board concluded that the fund’s shareholders benefit from economies of scale because of breakpoints in the advisory fee schedule for Schroder. The breakpoints reduce the effective rate of the fee as the fund’s assets managed by Schroder increase.
The board will consider whether to renew the advisory agreements again after a one-year period.
37
Glossary
Beta. A measure of the magnitude of a fund’s past share-price fluctuations in relation to the ups and downs of a given market index. The index is assigned a beta of 1.00. Compared with a given index, a fund with a beta of 1.20 typically would have seen its share price rise or fall by 12% when the index rose or fell by 10%. For this report, beta is based on returns over the past 36 months for both the fund and the index. Note that a fund’s beta should be reviewed in conjunction with its R-squared (see definition). The lower the R-squared, the less correlation there is between the fund and the index, and the less reliable beta is as an indicator of volatility.
Dividend Yield. Dividend income earned by stocks, expressed as a percentage of the aggregate market value (or of net asset value, for a fund). The yield is determined by dividing the amount of the annual dividends by the aggregate value (or net asset value) at the end of the period. For a fund, the dividend yield is based solely on stock holdings and does not include any income produced by other investments.
Earnings Growth Rate. The average annual rate of growth in earnings over the past five years for the stocks now in a fund.
Equity Exposure. A measure that reflects a fund’s investments in stocks and stock futures. Any holdings in short-term reserves are excluded.
Expense Ratio. The percentage of a fund’s average net assets used to pay its annual administrative and advisory expenses. These expenses directly reduce returns to investors.
Inception Date. The date on which the assets of a fund (or one of its share classes) are first invested in accordance with the fund’s investment objective. For funds with a subscription period, the inception date is the day after that period ends. Investment performance is measured from the inception date.
Median Market Cap. An indicator of the size of companies in which a fund invests; the midpoint of market capitalization (market price x shares outstanding) of a fund’s stocks, weighted by the proportion of the fund’s assets invested in each stock. Stocks representing half of the fund’s assets have market capitalizations above the median, and the rest are below it.
Price/Book Ratio. The share price of a stock divided by its net worth, or book value, per share. For a fund, the weighted average price/book ratio of the stocks it holds.
Price/Earnings Ratio. The ratio of a stock’s current price to its per-share earnings over the past year. For a fund, the weighted average P/E of the stocks it holds. P/E is an indicator of market expectations about corporate prospects; the higher the P/E, the greater the expectations for a company’s future growth.
R-Squared. A measure of how much of a fund’s past returns can be explained by the returns from the market in general, as measured by a given index. If a fund’s total returns were precisely synchronized with an index’s returns, its R-squared would be 1.00. If the fund’s returns bore no relationship to the index’s returns, its R-squared would be 0. For this report, R-squared is based on returns over the past 36 months for both the fund and the index.
Return on Equity. The annual average rate of return generated by a company during the past five years for each dollar of shareholder’s equity (net income divided by shareholder’s equity). For a fund, the weighted average return on equity for the companies whose stocks it holds.
38
Short-Term Reserves. The percentage of a fund invested in highly liquid, short-term securities that can be readily converted to cash.
Turnover Rate. An indication of the fund’s trading activity. Funds with high turnover rates incur higher transaction costs and may be more likely to distribute capital gains (which may be taxable to investors). The turnover rate excludes in-kind transactions, which have minimal impact on costs.
39
The People Who Govern Your Fund
The trustees of your mutual fund are there to see that the fund is operated and managed in your best interests since, as a shareholder, you are a part owner of the fund. Your fund’s trustees also serve on the board of directors of The Vanguard Group, Inc., which is owned by the Vanguard funds and provides services to them on an at-cost basis.
A majority of Vanguard’s board members are independent, meaning that they have no affiliation with Vanguard or the funds they oversee, apart from the sizable personal investments they have made as private individuals. The independent board members have distinguished backgrounds in business, academia, and public service. Each of the trustees and executive officers oversees 178 Vanguard funds.
The following table provides information for each trustee and executive officer of the fund. More information about the trustees is in the Statement of Additional Information, which can be obtained, without charge, by contacting Vanguard at 800-662-7447, or online at vanguard.com.
| |
| Interested Trustee1 | Amy Gutmann |
| | Born 1949. Trustee Since June 2006. Principal |
| F. William McNabb III | Occupation(s) During the Past Five Years: President |
| Born 1957. Trustee Since July 2009. Chairman of the | of the University of Pennsylvania; Christopher H. |
| Board. Principal Occupation(s) During the Past Five | Browne Distinguished Professor of Political Science |
| Years: Chairman of the Board of The Vanguard Group, | in the School of Arts and Sciences with secondary |
| Inc., and of each of the investment companies served | appointments at the Annenberg School for Commu- |
| by The Vanguard Group, since January 2010; Director | nication and the Graduate School of Education |
| of The Vanguard Group since 2008; Chief Executive | of the University of Pennsylvania; Director of |
| Officer and President of The Vanguard Group and of | Carnegie Corporation of New York, Schuylkill River |
| each of the investment companies served by The | Development Corporation, and Greater Philadelphia |
| Vanguard Group since 2008; Director of Vanguard | Chamber of Commerce; Trustee of the National |
| Marketing Corporation; Managing Director of The | Constitution Center; Chair of the Presidential |
| Vanguard Group (1995–2008). | Commission for the Study of Bioethical Issues. |
| |
| | JoAnn Heffernan Heisen |
| Independent Trustees | Born 1950. Trustee Since July 1998. Principal |
| | Occupation(s) During the Past Five Years: Corporate |
| Emerson U. Fullwood | Vice President and Chief Global Diversity Officer |
| Born 1948. Trustee Since January 2008. Principal | since 2006 (retired 2008) and Member of the |
| Occupation(s) During the Past Five Years: Executive | Executive Committee (retired 2008) of Johnson & |
| Chief Staff and Marketing Officer for North America | Johnson (pharmaceuticals/consumer products); Vice |
| and Corporate Vice President (retired 2008) of Xerox | President and Chief Information Officer of Johnson & |
| Corporation (document management products and | Johnson (1997–2005); Director of the University |
| services); Director of SPX Corporation (multi-industry | Medical Center at Princeton and Women’s Research |
| manufacturing), the United Way of Rochester, | and Education Institute; Member of the Advisory |
| Amerigroup Corporation (managed health care), | Board of the Maxwell School of Citizenship and Public |
| the University of Rochester Medical Center, and | Affairs at Syracuse University. |
| Monroe Community College Foundation. | |
| | F. Joseph Loughrey |
| Rajiv L. Gupta | Born 1949. Trustee Since October 2009. Principal |
| Born 1945. Trustee Since December 2001.2 | Occupation(s) During the Past Five Years: President |
| Principal Occupation(s) During the Past Five Years: | and Chief Operating Officer since 2005 (retired 2009) |
| Chairman and Chief Executive Officer (retired 2009) | and Vice Chairman of the Board (2008–2009) of |
| and President (2006–2008) of Rohm and Haas Co. | Cummins Inc. (industrial machinery); Director of |
| (chemicals); Director of Tyco International, Ltd. | SKF AB (industrial machinery), Hillenbrand, Inc. |
| (diversified manufacturing and services) and Hewlett- | (specialized consumer services), Sauer-Danfoss Inc. |
| Packard Co. (electronic computer manufacturing); | (machinery), the Lumina Foundation for Education, |
| Trustee of The Conference Board; Member of the | and Oxfam America; Chairman of the Advisory |
| Board of Managers of Delphi Automotive LLP | Council for the College of Arts and Letters at the |
| (automotive components). | University of Notre Dame. |
| | |
| André F. Perold | Kathryn J. Hyatt | |
| Born 1952. Trustee Since December 2004. Principal | Born 1955. Treasurer Since November 2008. Principal |
| Occupation(s) During the Past Five Years: George | Occupation(s) During the Past Five Years: Principal |
| Gund Professor of Finance and Banking at the Harvard | of The Vanguard Group, Inc.; Treasurer of each of |
| Business School; Chair of the Investment Committee | the investment companies served by The Vanguard |
| of HighVista Strategies LLC (private investment firm). | Group since 2008; Assistant Treasurer of each of the |
| | investment companies served by The Vanguard Group |
| Alfred M. Rankin, Jr. | (1988–2008). | |
| Born 1941. Trustee Since January 1993. Principal | | |
| Occupation(s) During the Past Five Years: Chairman, | Heidi Stam | |
| President, and Chief Executive Officer of NACCO | Born 1956. Secretary Since July 2005. Principal |
| Industries, Inc. (forklift trucks/housewares/lignite); | Occupation(s) During the Past Five Years: Managing |
| Director of Goodrich Corporation (industrial products/ | Director of The Vanguard Group, Inc., since 2006; |
| aircraft systems and services); Chairman of the | General Counsel of The Vanguard Group since 2005; |
| Federal Reserve Bank of Cleveland; Trustee of The | Secretary of The Vanguard Group and of each of the |
| Cleveland Museum of Art. | investment companies served by The Vanguard Group |
| | since 2005; Director and Senior Vice President of |
| Peter F. Volanakis | Vanguard Marketing Corporation since 2005; |
| Born 1955. Trustee Since July 2009. Principal | Principal of The Vanguard Group (1997–2006). |
| Occupation(s) During the Past Five Years: President | | |
| since 2007 and Chief Operating Officer since 2005 | | |
| of Corning Incorporated (communications equipment); | Vanguard Senior Management Team |
| President of Corning Technologies (2001–2005); | | |
| Director of Corning Incorporated and Dow Corning; | R. Gregory Barton | Michael S. Miller |
| Trustee of the Corning Incorporated Foundation and | Mortimer J. Buckley | James M. Norris |
| the Corning Museum of Glass; Overseer of the | Kathleen C. Gubanich | Glenn W. Reed |
| Amos Tuck School of Business Administration at | Paul A. Heller | George U. Sauter |
| Dartmouth College. | | |
| |
| | Chairman Emeritus and Senior Advisor |
| Executive Officers | | |
| | John J. Brennan | |
| Glenn Booraem | Chairman, 1996–2009 | |
| Born 1967. Controller Since July 2010. Principal | Chief Executive Officer and President, 1996–2008 |
| Occupation(s) During the Past Five Years: Principal | | |
| of The Vanguard Group, Inc.; Controller of each of | | |
| the investment companies served by The Vanguard | Founder | |
| Group since 2010; Assistant Controller of each of | | |
| the investment companies served by The Vanguard | John C. Bogle | |
| Group (2001–2010). | Chairman and Chief Executive Officer, 1974–1996 |
| |
| Thomas J. Higgins | | |
| Born 1957. Chief Financial Officer Since September | | |
| 2008. Principal Occupation(s) During the Past Five | | |
| Years: Principal of The Vanguard Group, Inc.; Chief | | |
| Financial Officer of each of the investment companies | | |
| served by The Vanguard Group since 2008; Treasurer | | |
| of each of the investment companies served by The | | |
| Vanguard Group (1998–2008). | | |
1 Mr. McNabb is considered an “interested person,” as defined in the Investment Company Act of 1940, because he is an officer of the Vanguard funds.
2 December 2002 for Vanguard Equity Income Fund, Vanguard Growth Equity Fund, the Vanguard Municipal Bond Funds, and the Vanguard State Tax-Exempt Funds.
|  |
| P.O. Box 2600 |
| Valley Forge, PA 19482-2600 |
Connect with Vanguard® > vanguard.com
| |
| Fund Information > 800-662-7447 | |
| Direct Investor Account Services > 800-662-2739 | |
| Institutional Investor Services > 800-523-1036 | |
| Text Telephone for People | |
| With Hearing Impairment > 800-749-7273 | |
| |
| This material may be used in conjunction | |
| with the offering of shares of any Vanguard | |
| fund only if preceded or accompanied by | |
| the fund’s current prospectus. | |
| |
| All comparative mutual fund data are from Lipper Inc. or | |
| Morningstar, Inc., unless otherwise noted. | |
| |
| You can obtain a free copy of Vanguard’s proxy voting | |
| guidelines by visiting vanguard.com/proxyreporting or by | |
| calling Vanguard at 800-662-2739. The guidelines are | |
| also available from the SEC’s website, sec.gov. In | |
| addition, you may obtain a free report on how your fund | |
| voted the proxies for securities it owned during the 12 | |
| months ended June 30. To get the report, visit either | |
| vanguard.com/proxyreporting or sec.gov. | |
| |
| You can review and copy information about your fund at | |
| the SEC’s Public Reference Room in Washington, D.C. To | |
| find out more about this public service, call the SEC at | |
| 202-551-8090. Information about your fund is also | |
| available on the SEC’s website, and you can receive | |
| copies of this information, for a fee, by sending a | |
| request in either of two ways: via e-mail addressed to | |
| publicinfo@sec.gov or via regular mail addressed to the | |
| Public Reference Section, Securities and Exchange | |
| Commission, Washington, DC 20549-1520. | |
| |
| |
| | © 2010 The Vanguard Group, Inc. |
| | All rights reserved. |
| | Vanguard Marketing Corporation, Distributor. |
| |
| | Q1260 122010 |
 |
|
| Vanguard High Dividend Yield |
| Index Fund Annual Report |
|
| October 31, 2010 |
 |
> Vanguard High Dividend Yield Index Fund returned about 16% for the fiscal year ended October 31, 2010.
> The fund’s return for the period closely tracked that of its benchmark index, the FTSE High Dividend Yield Index, and the average return of its peer funds.
> Industrials, consumer staples, and consumer discretionary stocks contributed most to the fund’s return.
| |
| Contents | |
| Your Fund’s Total Returns. | 1 |
| Chairman’s Letter. | 2 |
| Fund Profile. | 7 |
| Performance Summary. | 8 |
| Financial Statements. | 10 |
| Your Fund’s After-Tax Returns. | 25 |
| About Your Fund’s Expenses. | 26 |
| Glossary. | 28 |
Please note: The opinions expressed in this report are just that—informed opinions. They should not be considered promises or advice. Also, please keep in mind that the information and opinions cover the period through the date on the front of this report. Of course, the risks of investing in your fund are spelled out in the prospectus.
See the Glossary for definitions of investment terms used in this report.
Cover photograph: Jean Maher.
Your Fund’s Total Returns
Fiscal Year Ended October 31, 2010
| |
| | Total |
| | Returns |
| Vanguard High Dividend Yield Index Fund | |
| Investor Shares | 15.79% |
| ETF Shares | |
| Market Price | 16.04 |
| Net Asset Value | 15.93 |
| FTSE High Dividend Yield Index | 16.15 |
| Equity Income Funds Average | 16.15 |
| Equity Income Funds Average: Derived from data provided by Lipper Inc. |
The Vanguard ETF® Shares shown are traded on the NYSE Arca exchange and are available only through brokers. The table provides ETF returns based on both the NYSE Arca market price and the net asset value for a share. U.S. Pat. No. 6,879,964 B2; 7,337,138.
For the ETF Shares, the market price is determined by the midpoint of the bid-offer spread as of the closing time of the New York Stock Exchange (generally 4 p.m., Eastern time). The net asset value is also determined as of the NYSE closing time. For more information about how the ETF Shares' market prices have compared with their net asset value, visit vanguard.com, select your ETF, and then select the Price and Performance tab. The ETF premium/discount analysis there shows the percentages of days on which the ETF Shares' market price was above or below the NAV.
Your Fund’s Performance at a Glance
October 31, 2009, Through October 31, 2010
| | | | |
| | | | Distributions Per Share |
| | Starting | Ending | Income | Capital |
| | Share Price | Share Price | Dividends | Gains |
| Vanguard High Dividend Yield Index Fund | | | | |
| Investor Shares | $14.15 | $15.94 | $0.417 | $0.000 |
| ETF Shares | 35.70 | 40.22 | 1.099 | 0.000 |
1

Chairman’s Letter
Dear Shareholder,
After slashing, and even eliminating, dividends during the financial credit crisis, many U.S. companies resumed dividend payments over the past year.
As the stock market regained momentum, Vanguard High Dividend Yield Index Fund returned about 16% for the fiscal year ended October 31, 2010. The fund’s result was in line with that of its benchmark index, the FTSE High Dividend Yield Index, and the average return of its peer funds.
The 30-day SEC yield of the High Dividend Yield Index Fund Investor Shares stood at 2.53% as of October 31, more than one percentage point higher than the yield of the broader stock market as measured by Vanguard Total Stock Market Index Fund’s Investor Shares. The fund’s yield is slightly lower than its level a year ago, as investor enthusiasm for dividend-paying stocks has boosted share prices.
If you own shares of the fund in a taxable account, you may wish to review the fund’s after-tax returns presented later in this report.
2
Stock market performance was better than it felt
Global stock prices rallied at the start of the period, but struggled through the spring and summer, weighed down by Europe’s sovereign debt crisis and the slow pace of economic recovery in the United States. In the fiscal year’s final months, the mood turned. Stock prices climbed on continued strength in corporate earnings. In the United States, stocks also seemed to get a boost from the Federal Reserve Board’s hints that it would try to stimulate the economy with a second round of U.S. Treasury bondpurchases. (In early November, the Fed announced that it would buy as much as $600 billion in Treasuries.)
For the 12 months, the broad U.S. stock market returned about 19%, a performance that was better than it felt in a year of ups and downs. Small-capitalization stocks did even better. International stocks returned about 13% on the strength of a powerful rally in emerging markets and solid single-digit gains in developed markets in Europe and the Pacific region.
Despite shrinking yields, bonds attracted investor dollars
Although fixed income yields have fallen to generational lows, investors continued to bid up bond prices. The broad U.S. bond market produced a 12-month return of about 8% as the yield of the 10-year U.S. Treasury note fell from 3.39% at the start of the period to 2.61% at the close.
Market Barometer
| | | |
| | | Average Annual Total Returns |
| | | Periods Ended October 31, 2010 |
| | One | Three | Five |
| | Year | Years | Years |
| Stocks | | | |
| Russell 1000 Index (Large-caps) | 17.67% | -6.14% | 1.99% |
| Russell 2000 Index (Small-caps) | 26.58 | -3.91 | 3.07 |
| Dow Jones U.S. Total Stock Market Index | 19.04 | -5.55 | 2.52 |
| MSCI All Country World Index ex USA (International) | 13.08 | -7.62 | 6.21 |
| |
| Bonds | | | |
| Barclays Capital U.S. Aggregate Bond Index (Broad | | | |
| taxable market) | 8.01% | 7.23% | 6.45% |
| Barclays Capital Municipal Bond Index (Broad | | | |
| tax-exempt market) | 7.78 | 5.79 | 5.20 |
| Citigroup Three-Month U.S. Treasury Bill Index | 0.12 | 0.89 | 2.41 |
| |
| CPI | | | |
| Consumer Price Index | 1.17% | 1.54% | 1.89% |
3
Tax-exempt municipal bonds also rallied. Bond prices and yields move in opposite directions, of course, so abundant returns built on rising prices could mean leaner pickings in the years ahead.
The yields of money market securities hovered near 0%, consistent with the Federal Reserve Board’s target for short-term rates.
Industrials and consumer staples boosted the fund’s result
The recession of 2008–2009 drove many U.S. companies—even those in relatively good financial shape—to trim their dividends and conserve capital for even rainier days. As the stock market gained momentum over the past year, many of these companies have resumed paying dividends.
Although payouts have yet to return to their pre-crisis highs, dividends have been bouncing back, increasing enthusiasm for—and the share prices of—dividend-paying stocks.
All ten of the sectors in the fund and its target index produced positive returns, with seven posting double-digit gains.
Expense Ratios
Your Fund Compared With Its Peer Group
| | | |
| | Investor | ETF | Peer Group |
| | Shares | Shares | Average |
| High Dividend Yield Index Fund | 0.35% | 0.20% | 1.36% |
The fund expense ratios shown are from the prospectus dated February 25, 2010, and represent estimated costs for the current fiscal year. For the fiscal year ended October 31, 2010, the fund’s expense ratios were 0.30% for Investor Shares and 0.18% for ETF Shares. The peer-group expense ratio is derived from data provided by Lipper Inc. and captures information through year-end 2009.
Peer group: Equity Income Funds.
4
The fund’s strong performance for the year was fueled by its new sector heavyweights, industrials and consumer staples. Industrial stocks, among the first sectors to benefit from the rebound in manufacturing, were led by companies that produce heavy construction and farm machinery as well as those involved in aerospace and defense. In consumer staples, tobacco, beverage, and food products manufacturers boosted performance.
The third-largest contributor to the fund’s return came from consumer discretionary stocks. Restaurants, hotels, and retailers were among the biggest beneficiaries of rising investor confidence and an uptick in spending. The smallest gains came from information technology and financials. In IT, software and communications equipment companies were down for the period.
Total Returns
Inception Through October 31, 2010
| |
| | Average |
| | Annual Return |
| High Dividend Yield Index Fund Investor Shares (Returns since inception: 11/16/2006) | -2.81% |
| FTSE High Dividend Yield Index | -2.56 |
| Equity Income Funds Average | -1.69 |
| Equity Income Funds Average: Derived from data provided by Lipper Inc. | |
The figures shown represent past performance, which is not a guarantee of future results. (Current performance may be lower or higher than the performance data cited. For performance data current to the most recent month-end, visit our website at vanguard.com/performance.) Note, too, that both investment returns and principal value can fluctuate widely, so an investor’s shares, when sold, could be worth more or less than their original cost.
5
Maintain a balanced portfolio, regardless of market conditions
Vanguard High Dividend Yield Index Fund’s results over the past year ended on a high note, but it’s impossible to predict the market’s direction in the future.
Since its inception roughly four years ago, in fact, the fund has experienced a number of trials, notably the stock market’s 2008 collapse. The result has been an average annual return of -2.81% since November 2006.
Although it seems reasonable to hope for, even expect, better times ahead, risk is a fact of investing life. Our experience suggests that an effective way to cope with market uncertainty is to focus on the long term and build a diversified, well-balanced portfolio. A balanced portfolio with a mix of stock, bond, and short-term investments can help protect your assets from the markets’ worst outcomes while giving you the opportunity to participate in the best. Investing within and among asset classes can further enhance your diversification.
The High Dividend Yield Index Fund, with its objective of tracking an index composed of companies with higher-than-average yields, can play an important role in such a balanced plan. And the fund’s low costs can help investors keep more of its returns.
Thank you for entrusting your assets to Vanguard.
Sincerely,

F. William McNabb III
Chairman and Chief Executive Officer
November 16, 2010
6
High Dividend Yield Index Fund
Fund Profile
As of October 31, 2010
| | | |
| Share-Class Characteristics | | |
| |
| | Investor | | ETF |
| | Shares | | Shares |
| Ticker Symbol | VHDYX | | VYM |
| Expense Ratio1 | 0.35% | | 0.20% |
| 30-Day SEC Yield | 2.53% | | 2.65% |
| |
| Portfolio Characteristics | | |
| | FTSE High | DJ |
| | Dividend | U.S. Total |
| | | Yield | Market |
| | Fund | Index | Index |
| Number of Stocks | 552 | 552 | 3,920 |
| Median Market Cap $56.3B | $56.3B | $28.5B |
| Price/Earnings Ratio | 14.2x | 14.2x | 16.9x |
| Price/Book Ratio | 2.2x | 2.2x | 2.2x |
| Return on Equity | 21.3% | 21.3% | 19.2% |
| Earnings Growth Rate | 2.1% | 2.1% | 6.5% |
| Dividend Yield | 3.1% | 3.1% | 1.8% |
| Foreign Holdings | 0.0% | 0.0% | 0.0% |
| Turnover Rate | 34% | — | — |
| Short-Term Reserves | 0.1% | — | — |
| |
| Sector Diversification (% of equity exposure) |
| | FTSE High | DJ |
| | Dividend | U.S. Total |
| | | Yield | Market |
| | Fund | Index | Index |
| Consumer | | | |
| Discretionary | 8.4% | 8.4% | 11.8% |
| Consumer Staples | 17.7 | 17.7 | 10.0 |
| Energy | 11.3 | 11.3 | 9.8 |
| Financials | 10.1 | 10.0 | 16.3 |
| Health Care | 11.7 | 11.7 | 11.0 |
| Industrials | 15.6 | 15.6 | 11.1 |
| Information | | | |
| Technology | 8.9 | 9.0 | 19.4 |
| Materials | 4.0 | 4.0 | 4.4 |
| Telecommunication | | | |
| Services | 4.9 | 4.9 | 2.8 |
| Utilities | 7.4 | 7.4 | 3.4 |
| | | |
| Volatility Measures | | | |
| | FTSE High | | DJ |
| | Dividend | U.S. Total |
| | Yield | | Market |
| | Index | | Index |
| R-Squared | 1.00 | | 0.91 |
| Beta | 1.00 | | 0.93 |
| These measures show the degree and timing of the fund’s fluctuations compared with the indexes over 36 months. | |
| |
| |
| Ten Largest Holdings (% of total net assets) |
| Exxon Mobil Corp. | Integrated Oil & | |
| | Gas | | 5.5% |
| Microsoft Corp. | Systems Software | 3.7 |
| Procter & Gamble Co. | Household | | |
| | Products | | 2.9 |
| Johnson & Johnson | Pharmaceuticals | 2.9 |
| General Electric Co. | Industrial | | |
| | Conglomerates | 2.8 |
| AT&T Inc. | Integrated | | |
| | Telecommunication | |
| | Services | | 2.8 |
| Chevron Corp. | Integrated Oil & | |
| | Gas | | 2.7 |
| JPMorgan Chase & Co. | Diversified Financial | |
| | Services | | 2.4 |
| Wal-Mart Stores Inc. | Hypermarkets & | |
| | Super Centers | 2.4 |
| Coca-Cola Co. | Soft Drinks | | 2.3 |
| Top Ten | | | 30.4% |
| The holdings listed exclude any temporary cash investments and equity index products. |
Investment Focus
1 The expense ratios shown are from the prospectus dated February 25, 2010, and represent estimated costs for the current fiscal year. For the fiscal year ended October 31, 2010, the expense ratios were 0.30% for Investor Shares and 0.18% for ETF Shares.
7
High Dividend Yield Index Fund
Performance Summary
All of the returns in this report represent past performance, which is not a guarantee of future results that may be achieved by the fund. (Current performance may be lower or higher than the performance data cited. For performance data current to the most recent month-end, visit our website at vanguard.com/performance.) Note, too, that both investment returns and principal value can fluctuate widely, so an investor’s shares, when sold, could be worth more or less than their original cost. The returns shown do not reflect taxes that a shareholder would pay on fund distributions or on the sale of fund shares.
Cumulative Performance: November 16, 2006, Through October 31, 2010
Initial Investment of $10,000
| | | |
| | Average Annual Total Returns | |
| | Periods Ended October 31, 2010 | |
| | | Since | Final Value |
| | One | Inception | of a $10,000 |
| | Year | (11/16/2006) | Investment |
| High Dividend Yield Index Fund | | | |
| Investor Shares | 15.79% | -2.81% | $8,935 |
| Dow Jones U.S. Total Stock Market | | | |
| Index | 19.04 | -1.24 | 9,520 |
| FTSE High Dividend Yield Index | 16.15 | -2.56 | 9,023 |
| Equity Income Funds Average | 16.15 | -1.69 | 9,346 |
Equity Income Funds Average: Derived from data provided by Lipper Inc.
"Since Inception" performance is calculated from the Investor Shares’ inception date for both the fund and its comparative standards.
| | | |
| | | Since | Final Value |
| | One | Inception | of a $10,000 |
| | Year | (11/10/2006) | Investment |
| High Dividend Yield Index Fund | | | |
| ETF Shares Net Asset Value | 15.93% | -2.46% | $9,059 |
| Dow Jones U.S. Total Stock Market Index | 19.04 | -0.84 | 9,672 |
| FTSE High Dividend Yield Index | 16.15 | -2.35 | 9,099 |
| "Since Inception" performance is calculated from the ETF Shares’ inception date for both the fund and its comparative standards. |
See Financial Highlights for dividend and capital gains information.
8
High Dividend Yield Index Fund
Cumulative Returns of ETF Shares: November 10, 2006, Through October 31, 2010
| | |
| | | Since |
| | One | Inception |
| | Year | (11/10/2006) |
| High Dividend Yield Index Fund | | |
| ETF Shares Market Price | 16.04% | -9.37% |
| High Dividend Yield Index Fund | | |
| ETF Shares Net Asset Value | 15.93 | -9.41 |
| FTSE High Dividend Yield Index | 16.15 | -9.01 |
| "Since Inception" performance is calculated from the ETF Shares’ inception date for both the fund and its comparative standard. |
Fiscal-Year Total Returns (%): November 16, 2006, Through October 31, 2010

Average Annual Total Returns: Periods Ended September 30, 2010
This table presents average annual total returns through the latest calendar quarter—rather than through the end of the fiscal period. Securities and Exchange Commission rules require that we provide this information.
| | | |
| | Inception | One | Since |
| | Date | Year | Inception |
| Investor Shares | 11/16/2006 | 8.92% | -3.66% |
| ETF Shares | 11/10/2006 | | |
| Market Price | | 9.27 | -3.30 |
| Net Asset Value | | 9.09 | -3.30 |
9
High Dividend Yield Index Fund
Financial Statements
Statement of Net Assets
As of October 31, 2010
The fund reports a complete list of its holdings in regulatory filings four times in each fiscal year, at the quarter-ends. For the second and fourth fiscal quarters, the lists appear in the fund’s semiannual and annual reports to shareholders. For the first and third fiscal quarters, the fund files the lists with the Securities and Exchange Commission on Form N-Q. Shareholders can look up the fund’s Forms N-Q on the SEC’s website at sec.gov. Forms N-Q may also be reviewed and copied at the SEC’s Public Reference Room (see the back cover of this report for further information).
| | | |
| | | | Market |
| | | | Value |
| | | Shares | ($000) |
| Common Stocks (100.0%) | | |
| Consumer Discretionary (8.4%) | | |
| | McDonald’s Corp. | 204,373 | 15,894 |
| | Home Depot Inc. | 324,237 | 10,012 |
| | Comcast Corp. Class A | 395,347 | 8,136 |
| | Time Warner Inc. | 215,898 | 7,019 |
| | Lowe’s Cos. Inc. | 274,433 | 5,854 |
| | Johnson Controls Inc. | 128,454 | 4,511 |
| | Yum! Brands Inc. | 89,756 | 4,448 |
| | Comcast Corp. Class A | | |
| | Special Shares | 139,826 | 2,703 |
| | McGraw-Hill Cos. Inc. | 59,315 | 2,233 |
| | CBS Corp. Class B | 120,051 | 2,032 |
| | Stanley Black & Decker Inc. | 31,802 | 1,971 |
| | Limited Brands Inc. | 61,920 | 1,820 |
| | VF Corp. | 20,710 | 1,724 |
| | Mattel Inc. | 69,476 | 1,621 |
| | Nordstrom Inc. | 42,034 | 1,619 |
| | Fortune Brands Inc. | 29,150 | 1,576 |
| | Genuine Parts Co. | 30,249 | 1,448 |
| | JC Penney Co. Inc. | 45,255 | 1,411 |
| | Harley-Davidson Inc. | 45,262 | 1,389 |
| | Tiffany & Co. | 24,383 | 1,292 |
| | Cablevision Systems Corp. | | |
| | Class A | 48,165 | 1,288 |
| | Hasbro Inc. | 26,900 | 1,244 |
| | Darden Restaurants Inc. | 26,806 | 1,225 |
| | Family Dollar Stores Inc. | 25,509 | 1,178 |
| | Whirlpool Corp. | 14,605 | 1,107 |
| | Newell Rubbermaid Inc. | 53,174 | 939 |
| ^ | Garmin Ltd. | 28,088 | 922 |
| | H&R Block Inc. | 62,038 | 731 |
| | Abercrombie & Fitch Co. | 16,876 | 723 |
| | Williams-Sonoma Inc. | 20,614 | 667 |
| | DR Horton Inc. | 60,775 | 634 |
| | American Eagle | | |
| | Outfitters Inc. | 37,517 | 601 |
| | Leggett & Platt Inc. | 28,150 | 574 |
| | Tupperware Brands Corp. | 12,051 | 540 |
| | | |
| | | | Market |
| | | | Value |
| | | Shares | ($000) |
| | Gannett Co. Inc. | 45,551 | 540 |
| | Gentex Corp. | 26,824 | 536 |
| | Foot Locker Inc. | 29,882 | 476 |
| | Polaris Industries Inc. | 6,332 | 450 |
| | Choice Hotels | | |
| | International Inc. | 11,406 | 434 |
| | Service Corp. International | 47,465 | 393 |
| | Brinker International Inc. | 19,646 | 364 |
| | Regal Entertainment Group | | |
| | Class A | 25,120 | 339 |
| | Cinemark Holdings Inc. | 16,195 | 284 |
| | Wolverine World Wide Inc. | 9,562 | 278 |
| | Hillenbrand Inc. | 11,894 | 256 |
| * | Madison Square Garden Inc. | | |
| | Class A | 11,907 | 248 |
| | Weight Watchers | | |
| | International Inc. | 7,279 | 244 |
| | Cracker Barrel Old Country | | |
| | Store Inc. | 4,495 | 242 |
| | Cooper Tire & Rubber Co. | 11,653 | 229 |
| | Pool Corp. | 9,609 | 194 |
| | National CineMedia Inc. | 10,262 | 190 |
| | Washington Post Co. | | |
| | Class B | 457 | 184 |
| | Meredith Corp. | 5,145 | 175 |
| | MDC Holdings Inc. | 6,687 | 172 |
| | Bob Evans Farms Inc. | 5,840 | 168 |
| | Cato Corp. Class A | 5,381 | 142 |
| | American Greetings Corp. | | |
| | Class A | 6,992 | 135 |
| | Columbia Sportswear Co. | 2,549 | 133 |
| | Arbitron Inc. | 5,149 | 130 |
| | Buckle Inc. | 4,469 | 130 |
| ^ | Barnes & Noble Inc. | 8,394 | 126 |
| | PEP Boys-Manny Moe & Jack | 9,942 | 116 |
| | Harte-Hanks Inc. | 9,017 | 109 |
| | Stage Stores Inc. | 7,273 | 97 |
| | NutriSystem Inc. | 5,040 | 96 |
| | Brown Shoe Co. Inc. | 8,140 | 96 |
10
High Dividend Yield Index Fund
| | |
| | | Market |
| | | Value |
| | Shares | ($000) |
| Stewart Enterprises Inc. | | |
| Class A | 17,109 | 95 |
| Superior Industries | | |
| International Inc. | 5,114 | 92 |
| Ethan Allen Interiors Inc. | 5,534 | 84 |
| Ameristar Casinos Inc. | 4,510 | 81 |
| Oxford Industries Inc. | 3,067 | 71 |
| Marcus Corp. | 3,943 | 51 |
| Speedway Motorsports Inc. | 3,258 | 50 |
| Bebe Stores Inc. | 6,794 | 45 |
| Ambassadors Group Inc. | 3,646 | 40 |
| Christopher & Banks Corp. | 6,604 | 39 |
| | | 99,440 |
| Consumer Staples (17.7%) | | |
| Procter & Gamble Co. | 545,039 | 34,648 |
| Wal-Mart Stores Inc. | 523,712 | 28,369 |
| Coca-Cola Co. | 444,578 | 27,262 |
| Philip Morris | | |
| International Inc. | 351,945 | 20,589 |
| PepsiCo Inc. | 305,488 | 19,948 |
| Kraft Foods Inc. | 331,579 | 10,700 |
| Altria Group Inc. | 399,500 | 10,155 |
| Colgate-Palmolive Co. | 94,176 | 7,263 |
| Kimberly-Clark Corp. | 78,623 | 4,980 |
| General Mills Inc. | 125,101 | 4,696 |
| Archer-Daniels-Midland Co. | 123,524 | 4,116 |
| Sysco Corp. | 113,217 | 3,335 |
| HJ Heinz Co. | 60,543 | 2,973 |
| Kellogg Co. | 54,538 | 2,741 |
| Reynolds American Inc. | 42,009 | 2,726 |
| Lorillard Inc. | 29,336 | 2,504 |
| Avon Products Inc. | 81,929 | 2,495 |
| ConAgra Foods Inc. | 84,910 | 1,910 |
| Sara Lee Corp. | 126,901 | 1,818 |
| Clorox Co. | 26,872 | 1,788 |
| Campbell Soup Co. | 48,935 | 1,774 |
| Hershey Co. | 32,250 | 1,596 |
| JM Smucker Co. | 22,887 | 1,471 |
| Molson Coors Brewing Co. | | |
| Class B | 30,794 | 1,454 |
| Brown-Forman Corp. Class B | 17,306 | 1,052 |
| McCormick & Co. Inc. | 23,029 | 1,018 |
| Hormel Foods Corp. | 19,180 | 881 |
| Herbalife Ltd. | 11,345 | 724 |
| Corn Products | | |
| International Inc. | 14,450 | 615 |
| Del Monte Foods Co. | 37,217 | 534 |
| Flowers Foods Inc. | 17,589 | 448 |
| SUPERVALU Inc. | 40,741 | 440 |
| Nu Skin Enterprises Inc. | | |
| Class A | 11,918 | 365 |
| Ruddick Corp. | 7,035 | 246 |
| Lancaster Colony Corp. | 4,022 | 201 |
| Universal Corp. | 4,679 | 194 |
| | | |
| | | | Market |
| | | | Value |
| | | Shares | ($000) |
| | Pricesmart Inc. | 5,665 | 166 |
| | Lance Inc. | 6,309 | 143 |
| | Vector Group Ltd. | 7,275 | 136 |
| | WD-40 Co. | 3,137 | 116 |
| | Nash Finch Co. | 2,303 | 97 |
| | Cal-Maine Foods Inc. | 3,007 | 87 |
| | Weis Markets Inc. | 2,103 | 82 |
| | Farmer Bros Co. | 1,558 | 26 |
| | | | 208,882 |
| Energy (11.3%) | | |
| | Exxon Mobil Corp. | 981,120 | 65,215 |
| | Chevron Corp. | 384,934 | 31,799 |
| | ConocoPhillips | 286,264 | 17,004 |
| | Marathon Oil Corp. | 135,530 | 4,821 |
| | Spectra Energy Corp. | 123,601 | 2,938 |
| | Williams Cos. Inc. | 111,919 | 2,409 |
| | Valero Energy Corp. | 108,113 | 1,941 |
| | EQT Corp. | 28,575 | 1,070 |
| ^ | Linn Energy LLC | 28,424 | 994 |
| | Sunoco Inc. | 23,164 | 868 |
| | Arch Coal Inc. | 31,244 | 768 |
| | Southern Union Co. | 23,859 | 600 |
| | Tidewater Inc. | 9,924 | 458 |
| | Tesoro Corp. | 27,420 | 355 |
| | Copano Energy LLC | 12,599 | 352 |
| | Teekay Corp. | 10,433 | 332 |
| | Holly Corp. | 7,587 | 248 |
| | Nordic American | | |
| | Tanker Shipping | 9,046 | 236 |
| | Ship Finance | | |
| | International Ltd. | 11,250 | 226 |
| | Overseas Shipholding | | |
| | Group Inc. | 5,894 | 197 |
| | RPC Inc. | 7,466 | 164 |
| | Knightsbridge Tankers Ltd. | 4,524 | 98 |
| | General Maritime Corp. | 17,309 | 67 |
| | Tsakos Energy Navigation Ltd. | 5,446 | 56 |
| | Delek US Holdings Inc. | 3,456 | 25 |
| | Alon USA Energy Inc. | 3,139 | 18 |
| | | | 133,259 |
| Financials (10.1%) | | |
| | JPMorgan Chase & Co. | 762,890 | 28,708 |
| | American Express Co. | 230,668 | 9,564 |
| | MetLife Inc. | 174,114 | 7,022 |
| | Aflac Inc. | 90,430 | 5,054 |
| | Travelers Cos. Inc. | 90,275 | 4,983 |
| | Chubb Corp. | 60,423 | 3,506 |
| | Allstate Corp. | 102,976 | 3,140 |
| | BB&T Corp. | 131,822 | 3,086 |
| | T Rowe Price Group Inc. | 49,220 | 2,720 |
| | Marsh & McLennan | | |
| | Cos. Inc. | 103,828 | 2,594 |
| | Ameriprise Financial Inc. | 48,173 | 2,490 |
| | Northern Trust Corp. | 46,241 | 2,295 |
11
High Dividend Yield Index Fund
| | |
| | | Market |
| | | Value |
| | Shares | ($000) |
| Invesco Ltd. | 89,837 | 2,066 |
| M&T Bank Corp. | 22,614 | 1,690 |
| Principal Financial Group Inc. | 61,032 | 1,638 |
| NYSE Euronext | 49,948 | 1,530 |
| New York Community | | |
| Bancorp Inc. | 83,565 | 1,415 |
| Unum Group | 62,847 | 1,409 |
| XL Group plc Class A | 65,756 | 1,391 |
| Hudson City Bancorp Inc. | 101,218 | 1,179 |
| PartnerRe Ltd. | 14,502 | 1,150 |
| Willis Group Holdings plc | 32,528 | 1,034 |
| Cincinnati Financial Corp. | 31,389 | 924 |
| Everest Re Group Ltd. | 10,821 | 912 |
| People’s United | | |
| Financial Inc. | 71,801 | 884 |
| Assurant Inc. | 20,424 | 808 |
| Axis Capital Holdings Ltd. | 23,061 | 784 |
| Raymond James | | |
| Financial Inc. | 23,887 | 674 |
| Eaton Vance Corp. | 22,726 | 654 |
| RenaissanceRe Holdings Ltd. | 10,496 | 632 |
| Validus Holdings Ltd. | 21,475 | 609 |
| Cullen/Frost Bankers Inc. | 11,597 | 608 |
| Old Republic | | |
| International Corp. | 46,008 | 607 |
| Fidelity National Financial Inc. | |
| Class A | 44,166 | 591 |
| Commerce Bancshares Inc. | 15,939 | 587 |
| HCC Insurance Holdings Inc. | 22,109 | 585 |
| Arthur J Gallagher & Co. | 20,246 | 570 |
| Allied World Assurance Co. | | |
| Holdings Ltd. | 9,343 | 535 |
| Federated Investors Inc. | | |
| Class B | 19,770 | 492 |
| Waddell & Reed Financial Inc. | |
| Class A | 16,521 | 480 |
| First Niagara Financial | | |
| Group Inc. | 40,019 | 474 |
| Alterra Capital Holdings Ltd. | 22,723 | 459 |
| Aspen Insurance | | |
| Holdings Ltd. | 14,823 | 421 |
| Associated Banc-Corp | 33,123 | 420 |
| Erie Indemnity Co. Class A | 7,322 | 419 |
| Valley National Bancorp | 30,903 | 412 |
| Endurance Specialty | | |
| Holdings Ltd. | 9,957 | 412 |
| Bank of Hawaii Corp. | 9,197 | 397 |
| Protective Life Corp. | 16,528 | 396 |
| Hanover Insurance | | |
| Group Inc. | 8,643 | 391 |
| StanCorp Financial | | |
| Group Inc. | 8,980 | 385 |
| TCF Financial Corp. | 27,304 | 359 |
| Fulton Financial Corp. | 38,300 | 358 |
| | |
| | | Market |
| | | Value |
| | Shares | ($000) |
| FirstMerit Corp. | 20,686 | 355 |
| Greenhill & Co. Inc. | 4,247 | 330 |
| Synovus Financial Corp. | 149,633 | 323 |
| American Financial | | |
| Group Inc. | 10,422 | 319 |
| Westamerica Bancorporation | 5,642 | 282 |
| First American Financial Corp. | 19,810 | 278 |
| Trustmark Corp. | 12,146 | 268 |
| Iberiabank Corp. | 5,117 | 266 |
| NewAlliance Bancshares Inc. | 20,419 | 263 |
| Delphi Financial Group Inc. | 9,255 | 251 |
| Montpelier Re Holdings Ltd. | 13,349 | 245 |
| Umpqua Holdings Corp. | 21,954 | 242 |
| Northwest Bancshares Inc. | 21,052 | 239 |
| Astoria Financial Corp. | 18,467 | 229 |
| RLI Corp. | 3,982 | 229 |
| United Bankshares Inc. | 8,333 | 223 |
| Hancock Holding Co. | 7,060 | 222 |
| Mercury General Corp. | 5,177 | 220 |
| UMB Financial Corp. | 5,914 | 219 |
| Unitrin Inc. | 8,872 | 216 |
| BancorpSouth Inc. | 15,990 | 211 |
| TFS Financial Corp. | 23,456 | 205 |
| Park National Corp. | 2,936 | 192 |
| First Financial | | |
| Bankshares Inc. | 4,026 | 190 |
| FNB Corp. | 21,993 | 187 |
| First Financial Bancorp | 11,055 | 186 |
| Glacier Bancorp Inc. | 13,932 | 181 |
| Harleysville Group Inc. | 5,208 | 179 |
| BOK Financial Corp. | 3,866 | 179 |
| WP Carey & Co. LLC | 5,692 | 177 |
| Selective Insurance | | |
| Group Inc. | 10,309 | 174 |
| International | | |
| Bancshares Corp. | 9,647 | 165 |
| Old National Bancorp | 16,978 | 161 |
| CVB Financial Corp. | 20,563 | 156 |
| Community Bank | | |
| System Inc. | 6,280 | 147 |
| Provident Financial | | |
| Services Inc. | 11,605 | 147 |
| NBT Bancorp Inc. | 6,541 | 144 |
| Horace Mann Educators Corp. | 7,366 | 138 |
| Safety Insurance Group Inc. | 2,854 | 133 |
| Oriental Financial Group Inc. | 9,582 | 127 |
| American National | | |
| Insurance Co. | 1,517 | 119 |
| First Commonwealth | | |
| Financial Corp. | 20,036 | 117 |
| Brookline Bancorp Inc. | 11,058 | 108 |
| Chemical Financial Corp. | 5,154 | 105 |
| S&T Bancorp Inc. | 5,271 | 103 |
12
High Dividend Yield Index Fund
| | | |
| | | | Market |
| | | | Value |
| | | Shares | ($000) |
| Maiden Holdings Ltd. | | 13,422 | 103 |
| Capitol Federal Financial | 4,358 | 102 |
| Dime Community | | | |
| Bancshares Inc. | | 6,638 | 97 |
| City Holding Co. | | 3,011 | 95 |
| Independent Bank Corp. | 4,034 | 95 |
| Bank of the Ozarks Inc. | 2,388 | 91 |
| Simmons First National Corp. | |
| Class A | | 3,254 | 88 |
| Amtrust Financial Services Inc. 5,726 | 86 |
| WesBanco Inc. | | 5,133 | 85 |
| BGC Partners Inc. Class A | 12,144 | 84 |
| Community Trust | | | |
| Bancorp Inc. | | 2,956 | 81 |
| Trustco Bank Corp. NY | 14,807 | 80 |
| Renasant Corp. | | 4,862 | 79 |
| Flushing Financial Corp. | 5,963 | 78 |
| Republic Bancorp Inc. Class A 3,628 | 74 |
| United Fire & Casualty Co. | 3,695 | 74 |
| Provident New York Bancorp | 7,294 | 65 |
| Washington Trust Bancorp Inc. 3,214 | 65 |
| SY Bancorp Inc. | | 2,553 | 63 |
| Advance America Cash | | |
| Advance Centers Inc. | 12,381 | 62 |
| Tompkins Financial Corp. | 1,598 | 62 |
| 1st Source Corp. | | 3,375 | 60 |
| GFI Group Inc. | | 12,011 | 58 |
| First Financial Corp. | | 1,830 | 53 |
| Arrow Financial Corp. | | 2,114 | 52 |
| Bancfirst Corp. | | 1,176 | 48 |
| State Auto Financial Corp. | 2,949 | 46 |
| Suffolk Bancorp | | 1,777 | 46 |
| Calamos Asset | | | |
| Management Inc. Class A | 3,823 | 46 |
| First Community | | | |
| Bancshares Inc. | | 3,362 | 45 |
| Baldwin & Lyons Inc. | | 1,794 | 45 |
| SWS Group Inc. | | 6,497 | 45 |
| Bank Mutual Corp. | | 9,184 | 44 |
| First Bancorp | | 3,177 | 43 |
| Presidential Life Corp. | | 4,321 | 41 |
| Kearny Financial Corp. | | 4,165 | 36 |
| Capital City Bank Group Inc. | 2,576 | 31 |
| Wilshire Bancorp Inc. | | 4,526 | 30 |
| National Interstate Corp. | 1,234 | 27 |
| Kansas City Life Insurance Co. 734 | 23 |
| Student Loan Corp. | | 718 | 21 |
| | | | 118,602 |
| Health Care (11.7%) | | | |
| Johnson & Johnson | | 532,768 | 33,921 |
| Pfizer Inc. | 1,548,060 | 26,936 |
| Merck & Co. Inc. | | 590,186 | 21,412 |
| Abbott Laboratories | | 296,298 | 15,206 |
| | | | |
| | | | | Market |
| | | | | Value |
| | | | Shares | ($000) |
| | Bristol-Myers Squibb Co. | 328,707 | 8,842 |
| | Eli Lilly & Co. | | 220,566 | 7,764 |
| | Medtronic Inc. | | 207,950 | 7,322 |
| | Baxter International Inc. | 112,210 | 5,711 |
| | Becton Dickinson and Co. | 44,809 | 3,384 |
| | Alcon Inc. | | 17,169 | 2,880 |
| | Cardinal Health Inc. | | 67,469 | 2,341 |
| | Pharmaceutical Product | | |
| | Development Inc. | | 22,574 | 583 |
| | Hill-Rom Holdings Inc. | | 12,158 | 471 |
| | Teleflex Inc. | | 7,603 | 424 |
| | Owens & Minor Inc. | | 12,190 | 347 |
| | Quality Systems Inc. | | 4,112 | 264 |
| | Meridian Bioscience Inc. | 5,911 | 135 |
| | PDL BioPharma Inc. | | 23,012 | 120 |
| | Landauer Inc. | | 1,831 | 112 |
| | National Healthcare Corp. | 2,024 | 74 |
| | Computer Programs & | | |
| | Systems Inc. | | 1,092 | 50 |
| * | Furiex Pharmaceuticals Inc. | 1,737 | 20 |
| | | | | 138,319 |
| Industrials (15.6%) | | | |
| | General Electric Co. | 2,048,798 | 32,822 |
| | United Technologies Corp. | 180,025 | 13,460 |
| | 3M Co. | | 135,941 | 11,449 |
| | Boeing Co. | | 140,497 | 9,925 |
| | Caterpillar Inc. | | 120,629 | 9,481 |
| | United Parcel Service Inc. | | |
| | Class B | | 139,221 | 9,375 |
| | Emerson Electric Co. | | 145,023 | 7,962 |
| | Honeywell International Inc. | 148,279 | 6,985 |
| | Deere & Co. | | 81,143 | 6,232 |
| | General Dynamics Corp. | 73,066 | 4,977 |
| | Lockheed Martin Corp. | 69,629 | 4,964 |
| | Norfolk Southern Corp. | 75,013 | 4,613 |
| | CSX Corp. | | 72,857 | 4,477 |
| | Illinois Tool Works Inc. | 95,822 | 4,379 |
| | Tyco International Ltd. | 95,548 | 3,658 |
| | Northrop Grumman Corp. | 56,508 | 3,572 |
| | Raytheon Co. | | 71,847 | 3,311 |
| | Waste Management Inc. | 91,726 | 3,276 |
| | Eaton Corp. | | 32,207 | 2,861 |
| | Parker Hannifin Corp. | | 30,945 | 2,369 |
| | Republic Services Inc. | | | |
| | Class A | | 73,559 | 2,193 |
| | Goodrich Corp. | | 24,034 | 1,972 |
| | Dover Corp. | | 35,743 | 1,898 |
| | Rockwell Collins Inc. | | 30,362 | 1,837 |
| | Rockwell Automation Inc. | 27,144 | 1,693 |
| | WW Grainger Inc. | | 13,609 | 1,688 |
| | Cooper Industries plc | | 31,987 | 1,677 |
| | L-3 Communications | | | |
| | Holdings Inc. | | 21,978 | 1,587 |
13
High Dividend Yield Index Fund
| | |
| | | Market |
| | | Value |
| | Shares | ($000) |
| Fastenal Co. | 28,329 | 1,458 |
| Pall Corp. | 22,438 | 957 |
| Pitney Bowes Inc. | 39,826 | 874 |
| Robert Half International Inc. | 28,465 | 772 |
| Avery Dennison Corp. | 21,203 | 771 |
| Timken Co. | 18,580 | 770 |
| Masco Corp. | 69,226 | 738 |
| RR Donnelley & Sons Co. | 39,341 | 726 |
| SPX Corp. | 9,531 | 639 |
| Pentair Inc. | 18,927 | 619 |
| Snap-On Inc. | 11,115 | 567 |
| Hubbell Inc. Class B | 10,180 | 550 |
| Kennametal Inc. | 15,576 | 532 |
| Lincoln Electric Holdings Inc. | 8,170 | 488 |
| Ryder System Inc. | 10,057 | 440 |
| Crane Co. | 11,380 | 435 |
| Lennox International Inc. | 10,463 | 429 |
| IDEX Corp. | 11,641 | 420 |
| Carlisle Cos. Inc. | 11,695 | 410 |
| Graco Inc. | 11,549 | 397 |
| Baldor Electric Co. | 9,034 | 380 |
| Harsco Corp. | 15,491 | 359 |
| Watsco Inc. | 5,312 | 297 |
| Brady Corp. Class A | 9,440 | 290 |
| GATX Corp. | 8,758 | 277 |
| Alexander & Baldwin Inc. | 7,986 | 275 |
| AO Smith Corp. | 4,863 | 272 |
| Applied Industrial | | |
| Technologies Inc. | 8,176 | 249 |
| Kaydon Corp. | 6,443 | 225 |
| HNI Corp. | 8,595 | 212 |
| Corporate Executive | | |
| Board Co. | 6,598 | 206 |
| Deluxe Corp. | 9,817 | 201 |
| Healthcare Services | | |
| Group Inc. | 8,344 | 200 |
| Seaspan Corp. | 12,823 | 173 |
| Briggs & Stratton Corp. | 9,725 | 171 |
| ABM Industries Inc. | 7,518 | 170 |
| Barnes Group Inc. | 7,953 | 145 |
| Mine Safety Appliances Co. | 5,089 | 143 |
| Raven Industries Inc. | 3,438 | 141 |
| Kaman Corp. | 4,883 | 132 |
| Administaff Inc. | 5,018 | 132 |
| NACCO Industries Inc. | | |
| Class A | 1,290 | 128 |
| Tennant Co. | 3,675 | 123 |
| Franklin Electric Co. Inc. | 3,389 | 122 |
| Ameron International Corp. | 1,737 | 119 |
| McGrath Rentcorp | 4,647 | 118 |
| Albany International Corp. | 5,230 | 107 |
| Aircastle Ltd. | 11,336 | 104 |
| | |
| | | Market |
| | | Value |
| | Shares | ($000) |
| Steelcase Inc. Class A | 12,274 | 103 |
| Ennis Inc. | 4,997 | 90 |
| Navios Maritime | | |
| Holdings Inc. | 14,795 | 89 |
| Bowne & Co. Inc. | 7,699 | 87 |
| Textainer Group | | |
| Holdings Ltd. | 2,779 | 72 |
| Federal Signal Corp. | 12,064 | 68 |
| AAON Inc. | 2,393 | 59 |
| Apogee Enterprises Inc. | 5,582 | 59 |
| US Ecology Inc. | 2,735 | 44 |
| CDI Corp. | 2,696 | 39 |
| American Woodmark Corp. | 2,133 | 38 |
| | | 183,904 |
| Information Technology (8.9%) | |
| Microsoft Corp. | 1,661,641 | 44,266 |
| Intel Corp. | 1,068,005 | 21,435 |
| Texas Instruments Inc. | 229,535 | 6,787 |
| Accenture plc Class A | 122,319 | 5,469 |
| Automatic Data | | |
| Processing Inc. | 94,432 | 4,195 |
| Applied Materials Inc. | 257,979 | 3,189 |
| Xerox Corp. | 264,901 | 3,099 |
| Tyco Electronics Ltd. | 85,778 | 2,717 |
| Paychex Inc. | 69,861 | 1,935 |
| Analog Devices Inc. | 57,213 | 1,926 |
| Linear Technology Corp. | 42,989 | 1,386 |
| Xilinx Inc. | 49,739 | 1,334 |
| Maxim Integrated | | |
| Products Inc. | 57,154 | 1,238 |
| KLA-Tencor Corp. | 32,233 | 1,151 |
| Microchip Technology Inc. | 35,340 | 1,137 |
| Jabil Circuit Inc. | 41,536 | 637 |
| National Semiconductor | | |
| Corp. | 45,941 | 629 |
| Broadridge Financial | | |
| Solutions Inc. | 24,375 | 536 |
| CoreLogic Inc. | 22,413 | 394 |
| Diebold Inc. | 12,646 | 388 |
| Intersil Corp. Class A | 23,828 | 312 |
| Molex Inc. | 13,827 | 281 |
| Molex Inc. Class A | 15,080 | 257 |
| Blackbaud Inc. | 8,454 | 215 |
| Earthlink Inc. | 20,803 | 187 |
| Micrel Inc. | 8,992 | 107 |
| MTS Systems Corp. | 3,046 | 100 |
| United Online Inc. | 12,538 | 78 |
| Cohu Inc. | 4,678 | 67 |
| Methode Electronics Inc. | 6,902 | 64 |
| Electro Rent Corp. | 3,459 | 51 |
| Renaissance Learning Inc. | 2,414 | 34 |
| | | 105,601 |
14
High Dividend Yield Index Fund
| | | |
| | | | Market |
| | | | Value |
| | | Shares | ($000) |
| Materials (4.0%) | | | |
| EI du Pont de Nemours | | |
| & Co. | | 172,669 | 8,164 |
| Dow Chemical Co. | | 222,714 | 6,866 |
| Praxair Inc. | | 59,218 | 5,409 |
| Air Products & | | | |
| Chemicals Inc. | | 40,428 | 3,435 |
| PPG Industries Inc. | | 31,730 | 2,434 |
| Nucor Corp. | | 60,200 | 2,301 |
| Southern Copper Corp. | 48,952 | 2,095 |
| Sherwin-Williams Co. | | 21,038 | 1,535 |
| Lubrizol Corp. | | 12,980 | 1,330 |
| Eastman Chemical Co. | 13,928 | 1,094 |
| Allegheny Technologies Inc. | 18,912 | 996 |
| Vulcan Materials Co. | | 24,560 | 897 |
| MeadWestvaco Corp. | | 32,703 | 841 |
| International Flavors & | | |
| Fragrances Inc. | | 15,231 | 764 |
| Sealed Air Corp. | | 30,400 | 704 |
| Martin Marietta Materials Inc. 8,730 | 703 |
| Bemis Co. Inc. | | 21,030 | 668 |
| Sonoco Products Co. | | 19,245 | 645 |
| Valspar Corp. | | 18,995 | 610 |
| Steel Dynamics Inc. | | 41,600 | 604 |
| RPM International Inc. | 25,059 | 519 |
| Huntsman Corp. | | 34,165 | 473 |
| Cabot Corp. | | 12,552 | 427 |
| Temple-Inland Inc. | | 20,574 | 426 |
| Compass Minerals | | | |
| International Inc. | | 4,669 | 368 |
| Packaging Corp. of America | 14,965 | 366 |
| Sensient Technologies Corp. | 9,577 | 309 |
| Olin Corp. | | 15,238 | 305 |
| Carpenter Technology Corp. | 8,514 | 304 |
| Commercial Metals Co. | 21,734 | 302 |
| Greif Inc. Class A | | 4,742 | 279 |
| Worthington Industries Inc. | 14,883 | 229 |
| Arch Chemicals Inc. | | 4,742 | 168 |
| A Schulman Inc. | | 6,093 | 132 |
| AMCOL International Corp. | 4,448 | 123 |
| Kaiser Aluminum Corp. | 2,709 | 122 |
| Innophos Holdings Inc. | 3,048 | 112 |
| PH Glatfelter Co. | | 8,980 | 112 |
| Koppers Holdings Inc. | | 3,894 | 109 |
| Valhi Inc. | | 4,424 | 89 |
| Myers Industries Inc. | | 5,108 | 45 |
| NL Industries Inc. | | 1,633 | 19 |
| | | | 47,433 |
| Telecommunication Services (4.9%) | |
| AT&T Inc. | 1,140,780 | 32,512 |
| Verizon | | | |
| Communications Inc. | 547,372 | 17,773 |
| | |
| | | Market |
| | | Value |
| | Shares | ($000) |
| CenturyLink Inc. | 57,675 | 2,387 |
| Qwest Communications | | |
| International Inc. | 330,615 | 2,182 |
| Frontier | | |
| Communications Corp. | 189,853 | 1,667 |
| Windstream Corp. | 92,715 | 1,174 |
| NTELOS Holdings Corp. | 6,006 | 109 |
| Alaska Communications | | |
| Systems Group Inc. | 8,680 | 87 |
| Shenandoah | | |
| Telecommunications Co. | 4,534 | 83 |
| Consolidated Communications | |
| Holdings Inc. | 4,348 | 80 |
| | | 58,054 |
| Utilities (7.4%) | | |
| Southern Co. | 159,478 | 6,039 |
| Exelon Corp. | 126,730 | 5,173 |
| Dominion Resources Inc. | 113,158 | 4,918 |
| Duke Energy Corp. | 252,271 | 4,594 |
| NextEra Energy Inc. | 79,580 | 4,380 |
| PG&E Corp. | 75,025 | 3,588 |
| American Electric | | |
| Power Co. Inc. | 91,599 | 3,429 |
| Public Service Enterprise | | |
| Group Inc. | 97,591 | 3,157 |
| Consolidated Edison Inc. | 53,925 | 2,681 |
| Entergy Corp. | 35,836 | 2,671 |
| Sempra Energy | 47,278 | 2,528 |
| Progress Energy Inc. | 56,186 | 2,528 |
| PPL Corp. | 92,637 | 2,492 |
| Edison International | 62,593 | 2,310 |
| Xcel Energy Inc. | 92,592 | 2,209 |
| FirstEnergy Corp. | 58,494 | 2,125 |
| DTE Energy Co. | 32,316 | 1,511 |
| CenterPoint Energy Inc. | 81,058 | 1,342 |
| Wisconsin Energy Corp. | 22,456 | 1,337 |
| Ameren Corp. | 45,955 | 1,332 |
| Constellation Energy | | |
| Group Inc. | 38,506 | 1,164 |
| Northeast Utilities | 33,609 | 1,051 |
| Oneok Inc. | 20,440 | 1,018 |
| SCANA Corp. | 24,304 | 993 |
| NiSource Inc. | 53,250 | 922 |
| National Fuel Gas Co. | 15,737 | 868 |
| Pinnacle West Capital Corp. | 20,777 | 855 |
| NSTAR | 19,901 | 830 |
| Pepco Holdings Inc. | 42,809 | 824 |
| OGE Energy Corp. | 18,637 | 823 |
| CMS Energy Corp. | 44,063 | 810 |
| American Water | | |
| Works Co. Inc. | 33,442 | 799 |
| Integrys Energy Group Inc. | 14,809 | 788 |
15
High Dividend Yield Index Fund
| | |
| | | Market |
| | | Value |
| | Shares | ($000) |
| Alliant Energy Corp. | 21,205 | 775 |
| Allegheny Energy Inc. | 32,246 | 748 |
| TECO Energy Inc. | 40,918 | 720 |
| MDU Resources Group Inc. | 36,093 | 719 |
| UGI Corp. | 21,055 | 634 |
| NV Energy Inc. | 44,752 | 611 |
| ITC Holdings Corp. | 9,640 | 604 |
| AGL Resources Inc. | 14,839 | 583 |
| Aqua America Inc. | 26,218 | 564 |
| Westar Energy Inc. | 21,206 | 537 |
| Atmos Energy Corp. | 17,373 | 512 |
| Great Plains Energy Inc. | 26,016 | 495 |
| DPL Inc. | 17,200 | 449 |
| Vectren Corp. | 15,540 | 425 |
| Nicor Inc. | 8,685 | 414 |
| Piedmont Natural Gas | | |
| Co. Inc. | 13,807 | 407 |
| Hawaiian Electric | | |
| Industries Inc. | 17,945 | 404 |
| WGL Holdings Inc. | 9,762 | 376 |
| Cleco Corp. | 11,576 | 362 |
| IDACORP Inc. | 9,304 | 342 |
| New Jersey Resources Corp. | 7,968 | 323 |
| Southwest Gas Corp. | 8,742 | 304 |
| Portland General Electric Co. | 14,426 | 302 |
| South Jersey Industries Inc. | 5,720 | 288 |
| UIL Holdings Corp. | 9,713 | 281 |
| Northwest Natural Gas Co. | 5,073 | 250 |
| Allete Inc. | 6,870 | 250 |
| Unisource Energy Corp. | 7,038 | 247 |
| Black Hills Corp. | 7,485 | 238 |
| Avista Corp. | 10,588 | 231 |
| NorthWestern Corp. | 6,896 | 205 |
| PNM Resources Inc. | 16,725 | 197 |
| MGE Energy Inc. | 4,355 | 177 |
| Empire District Electric Co. | 8,029 | 169 |
| Laclede Group Inc. | 4,219 | 148 |
| California Water | | |
| Service Group | 3,955 | 148 |
| Otter Tail Corp. | 6,815 | 140 |
| CH Energy Group Inc. | 3,029 | 138 |
| American States Water Co. | 3,607 | 135 |
| SJW Corp. | 2,557 | 62 |
| Central Vermont Public | | |
| Service Corp. | 2,277 | 46 |
| | | 87,049 |
| Total Common Stocks | | |
| (Cost $1,070,759) | | 1,180,543 |
| | |
| | | Market |
| | | Value |
| | Shares | ($000) |
| Temporary Cash Investment (0.2%) | |
| Money Market Fund (0.2%) | |
| 1,2 Vanguard Market | | |
| Liquidity Fund, 0.237% | |
| (Cost $2,540) | 2,539,734 | 2,540 |
| Total Investments (100.2%) | |
| (Cost $1,073,299) | | 1,183,083 |
| Other Assets and Liabilities (-0.2%) | |
| Other Assets | | 3,252 |
| Liabilities2 | | (5,761) |
| | | (2,509) |
| Net Assets (100%) | | 1,180,574 |
At October 31, 2010, net assets consisted of:
| |
| | Amount |
| | ($000) |
| Paid-in Capital | 1,134,993 |
| Undistributed Net Investment Income | 2,298 |
| Accumulated Net Realized Losses | (66,501) |
| Unrealized Appreciation (Depreciation) | 109,784 |
| Net Assets | 1,180,574 |
| |
| |
| Investor Shares—Net Assets | |
| Applicable to 18,600,677 outstanding | |
| $.001 par value shares of beneficial | |
| interest (unlimited authorization) | 296,466 |
| Net Asset Value Per Share— | |
| Investor Shares | $15.94 |
| |
| |
| ETF Shares—Net Assets | |
| Applicable to 21,981,936 outstanding | |
| $.001 par value shares of beneficial | |
| interest (unlimited authorization) | 884,108 |
| Net Asset Value Per Share— | |
| ETF Shares | $40.22 |
See Note A in Notes to Financial Statements.
^ Part of security position is on loan to broker-dealers. The total value of securities on loan is $1,486,000.
* Non-income-producing security.
1 Affiliated money market fund available only to Vanguard funds and certain trusts and accounts managed by Vanguard. Rate shown is the 7-day yield.
2 Includes $1,517,000 of collateral received for securities on loan.
See accompanying Notes, which are an integral part of the Financial Statements.
16
High Dividend Yield Index Fund
Statement of Operations
| |
| | Year Ended |
| | October 31, 2010 |
| | ($000) |
| Investment Income | |
| Income | |
| Dividends | 25,849 |
| Interest1 | 2 |
| Security Lending | 41 |
| Total Income | 25,892 |
| Expenses | |
| The Vanguard Group—Note B | |
| Investment Advisory Services | 105 |
| Management and Administrative—Investor Shares | 496 |
| Management and Administrative—ETF Shares | 694 |
| Marketing and Distribution—Investor Shares | 50 |
| Marketing and Distribution—ETF Shares | 162 |
| Custodian Fees | 148 |
| Auditing Fees | 26 |
| Shareholders’ Reports—Investor Shares | 2 |
| Shareholders’ Reports—ETF Shares | 27 |
| Trustees’ Fees and Expenses | 1 |
| Total Expenses | 1,711 |
| Net Investment Income | 24,181 |
| Realized Net Gain (Loss) on Investment Securities Sold | (40,717) |
| Change in Unrealized Appreciation (Depreciation) of Investment Securities | 134,572 |
| Net Increase (Decrease) in Net Assets Resulting from Operations | 118,036 |
| 1 Interest income from an affiliated company of the fund was $2,000. |
See accompanying Notes, which are an integral part of the Financial Statements.
17
High Dividend Yield Index Fund
Statement of Changes in Net Assets
| | |
| | Year Ended October 31, |
| | 2010 | 2009 |
| | ($000) | ($000) |
| Increase (Decrease) in Net Assets | | |
| Operations | | |
| Net Investment Income | 24,181 | 15,078 |
| Realized Net Gain (Loss) | (40,717) | (17,744) |
| Change in Unrealized Appreciation (Depreciation) | 134,572 | 47,491 |
| Net Increase (Decrease) in Net Assets Resulting from Operations | 118,036 | 44,825 |
| Distributions | | |
| Net Investment Income | | |
| Investor Shares | (5,649) | (3,790) |
| ETF Shares | (17,618) | (10,670) |
| Realized Capital Gain | | |
| Investor Shares | — | — |
| ETF Shares | — | — |
| Total Distributions | (23,267) | (14,460) |
| Capital Share Transactions | | |
| Investor Shares | 117,470 | 70,562 |
| ETF Shares | 383,901 | 244,830 |
| Net Increase (Decrease) from Capital Share Transactions | 501,371 | 315,392 |
| Total Increase (Decrease) | 596,140 | 345,757 |
| Net Assets | | |
| Beginning of Period | 584,434 | 238,677 |
| End of Period1 | 1,180,574 | 584,434 |
| 1 Net Assets—End of Period includes undistributed net investment income of $2,298,000 and $1,384,000. |
See accompanying Notes, which are an integral part of the Financial Statements.
18
High Dividend Yield Index Fund
Financial Highlights
Investor Shares
| | | | |
| | | | | Nov. 16, |
| | | | | 20061 to |
| | Year Ended October 31, | Oct. 31, |
| For a Share Outstanding Throughout Each Period | 2010 | 2009 | 2008 | 2007 |
| Net Asset Value, Beginning of Period | $14.15 | $14.20 | $21.61 | $20.00 |
| Investment Operations | | | | |
| Net Investment Income | .415 | .4682 | .589 | .5422 |
| Net Realized and Unrealized Gain (Loss) on Investments | 1.792 | (.070) | (7.409) | 1.477 |
| Total from Investment Operations | 2.207 | .398 | (6.820) | 2.019 |
| Distributions | | | | |
| Dividends from Net Investment Income | (.417) | (.448) | (.590) | (.409) |
| Distributions from Realized Capital Gains | — | — | — | — |
| Total Distributions | (.417) | (.448) | (.590) | (.409) |
| Net Asset Value, End of Period | $15.94 | $14.15 | $14.20 | $21.61 |
| |
| Total Return3 | 15.79% | 3.27% | -32.17% | 10.16% |
| |
| Ratios/Supplemental Data | | | | |
| Net Assets, End of Period (Millions) | $296 | $155 | $77 | $67 |
| Ratio of Total Expenses to Average Net Assets | 0.30% | 0.35% | 0.35% | 0.40%4 |
| Ratio of Net Investment Income to | | | | |
| Average Net Assets | 2.86% | 3.63% | 3.41% | 2.43%4 |
| Portfolio Turnover Rate5 | 34% | 20% | 11% | 11% |
1 Inception.
2 Calculated based on average shares outstanding.
3 Total returns do not include account service fees that may have applied in the periods shown. Fund prospectuses provide information about any applicable account service fees.
4 Annualized.
5 Excludes the value of portfolio securities received or delivered as a result of in-kind purchases or redemptions of the fund’s capital shares, including ETF Creation Units.
See accompanying Notes, which are an integral part of the Financial Statements.
19
High Dividend Yield Index Fund
Financial Highlights
ETF Shares
| | | | |
| | | | | Nov. 10, |
| | | | | 20061 to |
| | Year Ended October 31, | Oct. 31, |
| For a Share Outstanding Throughout Each Period | 2010 | 2009 | 2008 | 2007 |
| Net Asset Value, Beginning of Period | $35.70 | $35.84 | $54.55 | $50.04 |
| Investment Operations | | | | |
| Net Investment Income | 1.092 | 1.2352 | 1.553 | 1.4052 |
| Net Realized and Unrealized Gain (Loss) on Investments | 4.527 | (.198) | (18.703) | 4.190 |
| Total from Investment Operations | 5.619 | 1.037 | (17.150) | 5.595 |
| Distributions | | | | |
| Dividends from Net Investment Income | (1.099) | (1.177) | (1.560) | (1.085) |
| Distributions from Realized Capital Gains | — | — | — | — |
| Total Distributions | (1.099) | (1.177) | (1.560) | (1.085) |
| Net Asset Value, End of Period | $40.22 | $35.70 | $35.84 | $54.55 |
| |
| Total Return | 15.93% | 3.38% | -32.07% | 11.26% |
| |
| Ratios/Supplemental Data | | | | |
| Net Assets, End of Period (Millions) | $884 | $430 | $161 | $115 |
| Ratio of Total Expenses to Average Net Assets | 0.18% | 0.20% | 0.20% | 0.25%3 |
| Ratio of Net Investment Income to Average Net Assets | 2.98% | 3.78% | 3.56% | 2.58%3 |
| Portfolio Turnover Rate4 | 34% | 20% | 11% | 11% |
1 Inception.
2 Calculated based on average shares outstanding.
3 Annualized.
4 Excludes the value of portfolio securities received or delivered as a result of in-kind purchases or redemptions of the fund’s capital shares, including ETF Creation Units.
See accompanying Notes, which are an integral part of the Financial Statements.
20
High Dividend Yield Index Fund
Notes to Financial Statements
Vanguard High Dividend Yield Index Fund is registered under the Investment Company Act of 1940 as an open-end investment company, or mutual fund. The fund offers two classes of shares: Investor Shares and ETF Shares. Investor Shares are available to any investor who meets the fund’s minimum purchase requirements. ETF Shares are listed for trading on the NYSE Arca, Inc.; they can be purchased and sold through a broker.
A. The following significant accounting policies conform to generally accepted accounting principles for U.S. mutual funds. The fund consistently follows such policies in preparing its financial statements.
1. Security Valuation: Securities are valued as of the close of trading on the New York Stock Exchange (generally 4 p.m., Eastern time) on the valuation date. Equity securities are valued at the latest quoted sales prices or official closing prices taken from the primary market in which each security trades; such securities not traded on the valuation date are valued at the mean of the latest quoted bid and asked prices. Securities for which market quotations are not readily available, or whose values have been materially affected by events occurring before the fund’s pricing time but after the close of the securities’ primary markets, are valued by methods deemed by the board of trustees to represent fair value. Investments in Vanguard Market Liquidity Fund are valued at that fund’s net asset value.
2. Federal Income Taxes: The fund intends to continue to qualify as a regulated investment company and distribute all of its taxable income. Management has analyzed the fund’s tax positions taken for all open federal income tax years (October 31, 2007–2010), and has concluded that no provision for federal income tax is required in the fund’s financial statements.
3. Distributions: Distributions to shareholders are recorded on the ex-dividend date.
4. Security Lending: The fund may lend its securities to qualified institutional borrowers to earn additional income. Security loans are required to be secured at all times by collateral at least equal to the market value of securities loaned. The fund invests cash collateral received in Vanguard Market Liquidity Fund, and records a liability for the return of the collateral, during the period the securities are on loan. Security lending income represents fees charged to borrowers plus income earned on investing cash collateral, less expenses associated with the loan.
5. Other: Dividend income is recorded on the ex-dividend date. Interest income includes income distributions received from Vanguard Market Liquidity Fund and is accrued daily. Security transactions are accounted for on the date securities are bought or sold. Costs used to determine realized gains (losses) on the sale of investment securities are those of the specific securities sold.
Each class of shares has equal rights as to assets and earnings, except that each class separately bears certain class-specific expenses related to maintenance of shareholder accounts (included in Management and Administrative expenses) and shareholder reporting. Marketing and distribution expenses are allocated to each class of shares based on a method approved by the board of trustees. Income, other non-class-specific expenses, and gains and losses on investments are allocated to each class of shares based on its relative net assets.
21
High Dividend Yield Index Fund
B. The Vanguard Group furnishes at cost investment advisory, corporate management, administrative, marketing, and distribution services. The costs of such services are allocated to the fund under methods approved by the board of trustees. The fund has committed to provide up to 0.40% of its net assets in capital contributions to Vanguard. At October 31, 2010, the fund had contributed capital of $186,000 to Vanguard (included in Other Assets), representing 0.02% of the fund’s net assets and 0.07% of Vanguard’s capitalization. The fund’s trustees and officers are also directors and officers of Vanguard.
C. Various inputs may be used to determine the value of the fund’s investments. These inputs are summarized in three broad levels for financial statement purposes. The inputs or methodologies used to value securities are not necessarily an indication of the risk associated with investing in those securities.
Level 1—Quoted prices in active markets for identical securities.
Level 2—Other significant observable inputs (including quoted prices for similar securities, interest rates, prepayment speeds, credit risk, etc.).
Level 3—Significant unobservable inputs (including the fund’s own assumptions used to determine the fair value of investments).
At October 31, 2010, 100% of the fund’s investments were valued based on Level 1 inputs.
D. Distributions are determined on a tax basis and may differ from net investment income and realized capital gains for financial reporting purposes. Differences may be permanent or temporary. Permanent differences are reclassified among capital accounts in the financial statements to reflect their tax character. Temporary differences arise when certain items of income, expense, gain, or loss are recognized in different periods for financial statement and tax purposes; these differences will reverse at some time in the future. Differences in classification may also result from the treatment of short-term gains as ordinary income for tax purposes.
During the year ended October 31, 2010, the fund realized $1,086,000 of net capital gains resulting from in-kind redemptions—in which shareholders exchanged fund shares for securities held by the fund rather than for cash. Because such gains are not taxable to the fund, and are not distributed to shareholders, they have been reclassified from accumulated net realized losses to paid-in capital.
For tax purposes, at October 31, 2010, the fund had $2,824,000 of ordinary income available for distribution. The fund had available capital loss carryforwards totaling $66,500,000 to offset future net capital gains of $609,000 through October 31, 2015, $5,260,000 through October 31, 2016, $17,104,000 through October 31, 2017, and $43,527,000 through October 31, 2018.
At October 31, 2010, the cost of investment securities for tax purposes was $1,073,301,000. Net unrealized appreciation of investment securities for tax purposes was $109,782,000, consisting of unrealized gains of $124,976,000 on securities that had risen in value since their purchase and $15,194,000 in unrealized losses on securities that had fallen in value since their purchase.
E. During the year ended October 31, 2010, the fund purchased $783,035,000 of investment securities and sold $279,889,000 of investment securities, other than temporary cash investments.
22
High Dividend Yield Index Fund
F. Capital share transactions for each class of shares were:
| | | | |
| | | | Year Ended October 31, |
| | | 2010 | | 2009 |
| | Amount | Shares | Amount | Shares |
| | ($000) | (000) | ($000) | (000) |
| Investor Shares | | | | |
| Issued | 172,365 | 11,302 | 110,481 | 8,716 |
| Issued in Lieu of Cash Distributions | 4,536 | 300 | 2,942 | 234 |
| Redeemed | (59,431) | (3,924) | (42,861) | (3,473) |
| Net Increase (Decrease)—Investor Shares | 117,470 | 7,678 | 70,562 | 5,477 |
| ETF Shares | | | | |
| Issued | 387,936 | 10,039 | 256,834 | 7,940 |
| Issued in Lieu of Cash Distributions | — | — | — | — |
| Redeemed | (4,035) | (100) | (12,004) | (400) |
| Net Increase (Decrease)—ETF Shares | 383,901 | 9,939 | 244,830 | 7,540 |
G. In preparing the financial statements as of October 31, 2010, management considered the impact of subsequent events for potential recognition or disclosure in these financial statements.
23
Report of Independent Registered
Public Accounting Firm
To the Trustees of Vanguard Whitehall Funds and the Shareholders of Vanguard High Dividend Yield Index Fund:
In our opinion, the accompanying statement of net assets and the related statements of operations and of changes in net assets and the financial highlights present fairly, in all material respects, the financial position of Vanguard High Dividend Yield Index Fund (constituting a separate portfolio of Vanguard Whitehall Funds, hereafter referred to as the “Fund”) at October 31, 2010, the results of its operations for the year then ended, the changes in its net assets for each of the two years in the period then ended and the financial highlights for each of the periods indicated, in conformity with accounting principles generally accepted in the United States of America. These financial statements and financial highlights (hereafter referred to as “financial statements”) are the responsibility of the Fund’s management; our responsibility is to express an opinion on these financial statements based on our audits. We conducted our audits of these financial statements in accordance with the standards of the Public Company Accounting Oversight Board (United States). Those standards require that we plan and perform the audit to obtain reasonable assurance about whether the financial statements are free of material misstatement. An audit includes examining, on a test basis, evidence supporting the amounts and disclosures in the financial statements, assessing the accounting principles used and significant estimates made by management, and evaluating the overall financial statement presentation. We believe that our audits, which included confirmation of securities at October 31, 2010 by correspondence with the custodian and by agreement to the underlying ownership records of Vanguard Market Liquidity Fund, provide a reasonable basis for our opinion.
PricewaterhouseCoopers LLP
Philadelphia, Pennsylvania
December 14, 2010
|
| Special 2010 tax information (unaudited) for Vanguard High Dividend Yield Index Fund |
This information for the fiscal year ended October 31, 2010, is included pursuant to provisions of the Internal Revenue Code.
The fund distributed $23,267,000 of qualified dividend income to shareholders during the fiscal year.
For corporate shareholders, 100% of investment income (dividend income plus short-term gains, if any) qualifies for the dividends-received deduction.
24
Your Fund’s After-Tax Returns
This table presents returns for your fund both before and after taxes. The after-tax returns are shown in two ways: (1) assuming that an investor owned the fund during the entire period and paid taxes on the fund’s distributions, and (2) assuming that an investor paid taxes on the fund’s distributions and sold all shares at the end of each period.
Calculations are based on the highest individual federal income tax and capital gains tax rates in effect at the times of the distributions and the hypothetical sales. State and local taxes were not considered. After-tax returns reflect any qualified dividend income , using actual prior-year figures and estimates for 2010. (In the example, returns after the sale of fund shares may be higher than those assuming no sale. This occurs when the sale would have produced a capital loss. The calculation assumes that the investor received a tax deduction for the loss.) The table shows returns for Investor Shares only; returns for other share classes will differ. Please note that your actual after-tax returns will depend on your tax situation and may differ from those shown. Also note that if you own the fund in a tax-deferred account, such as an individual retirement account or a 401(k) plan, this information does not apply to you. Such accounts are not subject to current taxe s.
Finally, keep in mind that a fund’s performance—whether before or after taxes—does not guarantee future results.
Average Annual Total Returns: High Dividend Yield Index Fund Investor Shares
Periods Ended October 31, 2010
| | |
| | | Since |
| | One | Inception |
| | Year | (11/16/2006) |
| Returns Before Taxes | 15.79% | -2.81% |
| Returns After Taxes on Distributions | 15.31 | -3.23 |
| Returns After Taxes on Distributions and Sale of Fund Shares | 10.84 | -2.38 |
25
About Your Fund’s Expenses
As a shareholder of the fund, you incur ongoing costs, which include costs for portfolio management, administrative services, and shareholder reports (like this one), among others. Operating expenses, which are deducted from a fund’s gross income, directly reduce the investment return of the fund.
A fund’s expenses are expressed as a percentage of its average net assets. This figure is known as the expense ratio. The following examples are intended to help you understand the ongoing costs (in dollars) of investing in your fund and to compare these costs with those of other mutual funds. The examples are based on an investment of $1,000 made at the beginning of the period shown and held for the entire period.
The accompanying table illustrates your fund’s costs in two ways:
• Based on actual fund return. This section helps you to estimate the actual expenses that you paid over the period. The ”Ending Account Value“ shown is derived from the fund‘s actual return, and the third column shows the dollar amount that would have been paid by an investor who started with $1,000 in the fund. You may use the information here, together with the amount you invested, to estimate the expenses that you paid over the period.
To do so, simply divide your account value by $1,000 (for example, an $8,600 account value divided by $1,000 = 8.6), then multiply the result by the number given for your fund under the heading ”Expenses Paid During Period.“
• Based on hypothetical 5% yearly return. This section is intended to help you compare your fund‘s costs with those of other mutual funds. It assumes that the fund had a yearly return of 5% before expenses, but that the expense ratio is unchanged. In this case—because the return used is not the fund’s actual return—the results do not apply to your investment. The example is useful in making comparisons because the Securities and Exchange Commission requires all mutual funds to calculate expenses based on a 5% return. You can assess your fund’s costs by comparing this hypothetical example with the hypothetical examples that appear in shareholder reports of other funds.
Note that the expenses shown in the table are meant to highlight and help you compare ongoing costs only and do not reflect transaction costs incurred by the fund for buying and selling securities. Further, the expenses do not include the account service fee described in the prospectus. If such a fee were applied to your account, your costs would be higher. Your fund does not charge transaction fees, such as purchase or redemption fees, nor does it carry a “sales load.” The calculations assume no shares were bought or sold during the period. Your actual costs may have been higher or lower, depending on the amount of your investment and the timing of any purchases or redemptions.
You can find more information about the fund’s expenses, including annual expense ratios, in the Financial Statements section of this report. For additional information on operating expenses and other shareholder costs, please refer to your fund’s current prospectus.
26
Six Months Ended October 31, 2010
| | | |
| | Beginning | Ending | Expenses |
| | Account Value | Account Value | Paid During |
| High Dividend Yield Index Fund | 4/30/2010 | 10/31/2010 | Period |
| Based on Actual Fund Return | | | |
| Investor Shares | $1,000.00 | $1,013.46 | $0.96 |
| ETF Shares | 1,000.00 | 1,013.82 | 0.71 |
| Based on Hypothetical 5% Yearly Return | | | |
| Investor Shares | $1,000.00 | $1,024.25 | $0.97 |
| ETF Shares | 1,000.00 | 1,024.50 | 0.71 |
The calculations are based on expenses incurred in the most recent six-month period. The fund’s annualized six-month expense ratios for that period are 0.19% for Investor Shares and 0.14% for ETF Shares. The dollar amounts shown as “Expenses Paid” are equal to the annualized expense ratio multiplied by the average account value over the period, multiplied by the number of days in the most recent six-month period, then divided by the number of days in the most recent 12-month period.
27
Glossary
30-Day SEC Yield. A fund’s 30-day SEC yield is derived using a formula specified by the U.S. Securities and Exchange Commission. Under the formula, data related to the fund’s security holdings in the previous 30 days are used to calculate the fund’s hypothetical net income for that period, which is then annualized and divided by the fund’s estimated average net assets over the calculation period. For the purposes of this calculation, a security’s income is based on its current market yield to maturity (in the case of bonds) or its projected dividend yield (for stocks). Because the SEC yield represents hypothetical annualized income, it will differ—at times significantly—from the fund’s actual experience. As a result, the fund’s income distributions may be higher or lower than implied by the SEC yield.
Beta. A measure of the magnitude of a fund’s past share-price fluctuations in relation to the ups and downs of a given market index. The index is assigned a beta of 1.00. Compared with a given index, a fund with a beta of 1.20 typically would have seen its share price rise or fall by 12% when the index rose or fell by 10%. For this report, beta is based on returns over the past 36 months for both the fund and the index. Note that a fund’s beta should be reviewed in conjunction with its R-squared (see definition). The lower the R-squared, the less correlation there is between the fund and the index, and the less reliable beta is as an indicator of volatility.
Dividend Yield. Dividend income earned by stocks, expressed as a percentage of the aggregate market value (or of net asset value, for a fund). The yield is determined by dividing the amount of the annual dividends by the aggregate value (or net asset value) at the end of the period. For a fund, the dividend yield is based solely on stock holdings and does not include any income produced by other investments.
Earnings Growth Rate. The average annual rate of growth in earnings over the past five years for the stocks now in a fund.
Equity Exposure. A measure that reflects a fund’s investments in stocks and stock futures. Any holdings in short-term reserves are excluded.
Expense Ratio. The percentage of a fund’s average net assets used to pay its annual administrative and advisory expenses. These expenses directly reduce returns to investors.
Foreign Holdings. The percentage of a fund represented by stocks or depositary receipts of companies based outside the United States.
Inception Date. The date on which the assets of a fund (or one of its share classes) are first invested in accordance with the fund’s investment objective. For funds with a subscription period, the inception date is the day after that period ends. Investment performance is measured from the inception date.
Median Market Cap. An indicator of the size of companies in which a fund invests; the midpoint of market capitalization (market price x shares outstanding) of a fund’s stocks, weighted by the proportion of the fund’s assets invested in each stock. Stocks representing half of the fund’s assets have market capitalizations above the median, and the rest are below it.
Price/Book Ratio. The share price of a stock divided by its net worth, or book value, per share. For a fund, the weighted average price/book ratio of the stocks it holds.
28
Price/Earnings Ratio. The ratio of a stock’s current price to its per-share earnings over the past year. For a fund, the weighted average P/E of the stocks it holds. P/E is an indicator of market expectations about corporate prospects; the higher the P/E, the greater the expectations for a company’s future growth.
R-Squared. A measure of how much of a fund’s past returns can be explained by the returns from the market in general, as measured by a given index. If a fund’s total returns were precisely synchronized with an index’s returns, its R-squared would be 1.00. If the fund’s returns bore no relationship to the index’s returns, its R-squared would be 0. For this report, R-squared is based on returns over the past 36 months for both the fund and the index.
Return on Equity. The annual average rate of return generated by a company during the past five years for each dollar of shareholder’s equity (net income divided by shareholder’s equity). For a fund, the weighted average return on equity for the companies whose stocks it holds.
Short-Term Reserves. The percentage of a fund invested in highly liquid, short-term securities that can be readily converted to cash.
Turnover Rate. An indication of the fund’s trading activity. Funds with high turnover rates incur higher transaction costs and may be more likely to distribute capital gains (which may be taxable to investors). The turnover rate excludes in-kind transactions, which have minimal impact on costs.
29
This page intentionally left blank.
This page intentionally left blank.
The People Who Govern Your Fund
The trustees of your mutual fund are there to see that the fund is operated and managed in your best interests since, as a shareholder, you are a part owner of the fund. Your fund’s trustees also serve on the board of directors of The Vanguard Group, Inc., which is owned by the Vanguard funds and provides services to them on an at-cost basis.
A majority of Vanguard’s board members are independent, meaning that they have no affiliation with Vanguard or the funds they oversee, apart from the sizable personal investments they have made as private individuals. The independent board members have distinguished backgrounds in business, academia, and public service. Each of the trustees and executive officers oversees 178 Vanguard funds.
The following table provides information for each trustee and executive officer of the fund. More information about the trustees is in the Statement of Additional Information, which can be obtained, without charge, by contacting Vanguard at 800-662-7447, or online at vanguard.com.
| |
| Interested Trustee1 | Amy Gutmann |
| | Born 1949. Trustee Since June 2006. Principal |
| F. William McNabb III | Occupation(s) During the Past Five Years: President |
| Born 1957. Trustee Since July 2009. Chairman of the | of the University of Pennsylvania; Christopher H. |
| Board. Principal Occupation(s) During the Past Five | Browne Distinguished Professor of Political Science |
| Years: Chairman of the Board of The Vanguard Group, | in the School of Arts and Sciences with secondary |
| Inc., and of each of the investment companies served | appointments at the Annenberg School for Commu- |
| by The Vanguard Group, since January 2010; Director | nication and the Graduate School of Education |
| of The Vanguard Group since 2008; Chief Executive | of the University of Pennsylvania; Director of |
| Officer and President of The Vanguard Group and of | Carnegie Corporation of New York, Schuylkill River |
| each of the investment companies served by The | Development Corporation, and Greater Philadelphia |
| Vanguard Group since 2008; Director of Vanguard | Chamber of Commerce; Trustee of the National |
| Marketing Corporation; Managing Director of The | Constitution Center; Chair of the Presidential |
| Vanguard Group (1995–2008). | Commission for the Study of Bioethical Issues. |
| |
| | JoAnn Heffernan Heisen |
| Independent Trustees | Born 1950. Trustee Since July 1998. Principal |
| | Occupation(s) During the Past Five Years: Corporate |
| Emerson U. Fullwood | Vice President and Chief Global Diversity Officer |
| Born 1948. Trustee Since January 2008. Principal | since 2006 (retired 2008) and Member of the |
| Occupation(s) During the Past Five Years: Executive | Executive Committee (retired 2008) of Johnson & |
| Chief Staff and Marketing Officer for North America | Johnson (pharmaceuticals/consumer products); Vice |
| and Corporate Vice President (retired 2008) of Xerox | President and Chief Information Officer of Johnson & |
| Corporation (document management products and | Johnson (1997–2005); Director of the University |
| services); Director of SPX Corporation (multi-industry | Medical Center at Princeton and Women’s Research |
| manufacturing), the United Way of Rochester, | and Education Institute; Member of the Advisory |
| Amerigroup Corporation (managed health care), | Board of the Maxwell School of Citizenship and Public |
| the University of Rochester Medical Center, and | Affairs at Syracuse University. |
| Monroe Community College Foundation. | |
| | F. Joseph Loughrey |
| Rajiv L. Gupta | Born 1949. Trustee Since October 2009. Principal |
| Born 1945. Trustee Since December 2001.2 | Occupation(s) During the Past Five Years: President |
| Principal Occupation(s) During the Past Five Years: | and Chief Operating Officer since 2005 (retired 2009) |
| Chairman and Chief Executive Officer (retired 2009) | and Vice Chairman of the Board (2008–2009) of |
| and President (2006–2008) of Rohm and Haas Co. | Cummins Inc. (industrial machinery); Director of |
| (chemicals); Director of Tyco International, Ltd. | SKF AB (industrial machinery), Hillenbrand, Inc. |
| (diversified manufacturing and services) and Hewlett- | (specialized consumer services), Sauer-Danfoss Inc. |
| Packard Co. (electronic computer manufacturing); | (machinery), the Lumina Foundation for Education, |
| Trustee of The Conference Board; Member of the | and Oxfam America; Chairman of the Advisory |
| Board of Managers of Delphi Automotive LLP | Council for the College of Arts and Letters at the |
| (automotive components). | University of Notre Dame. |
| | |
| André F. Perold | Kathryn J. Hyatt | |
| Born 1952. Trustee Since December 2004. Principal | Born 1955. Treasurer Since November 2008. Principal |
| Occupation(s) During the Past Five Years: George | Occupation(s) During the Past Five Years: Principal |
| Gund Professor of Finance and Banking at the Harvard | of The Vanguard Group, Inc.; Treasurer of each of |
| Business School; Chair of the Investment Committee | the investment companies served by The Vanguard |
| of HighVista Strategies LLC (private investment firm). | Group since 2008; Assistant Treasurer of each of the |
| | investment companies served by The Vanguard Group |
| Alfred M. Rankin, Jr. | (1988–2008). | |
| Born 1941. Trustee Since January 1993. Principal | | |
| Occupation(s) During the Past Five Years: Chairman, | Heidi Stam | |
| President, and Chief Executive Officer of NACCO | Born 1956. Secretary Since July 2005. Principal |
| Industries, Inc. (forklift trucks/housewares/lignite); | Occupation(s) During the Past Five Years: Managing |
| Director of Goodrich Corporation (industrial products/ | Director of The Vanguard Group, Inc., since 2006; |
| aircraft systems and services); Chairman of the | General Counsel of The Vanguard Group since 2005; |
| Federal Reserve Bank of Cleveland; Trustee of The | Secretary of The Vanguard Group and of each of the |
| Cleveland Museum of Art. | investment companies served by The Vanguard Group |
| | since 2005; Director and Senior Vice President of |
| Peter F. Volanakis | Vanguard Marketing Corporation since 2005; |
| Born 1955. Trustee Since July 2009. Principal | Principal of The Vanguard Group (1997–2006). |
| Occupation(s) During the Past Five Years: President | | |
| since 2007 and Chief Operating Officer since 2005 | | |
| of Corning Incorporated (communications equipment); | Vanguard Senior Management Team |
| President of Corning Technologies (2001–2005); | | |
| Director of Corning Incorporated and Dow Corning; | R. Gregory Barton | Michael S. Miller |
| Trustee of the Corning Incorporated Foundation and | Mortimer J. Buckley | James M. Norris |
| the Corning Museum of Glass; Overseer of the | Kathleen C. Gubanich | Glenn W. Reed |
| Amos Tuck School of Business Administration at | Paul A. Heller | George U. Sauter |
| Dartmouth College. | | |
| |
| | Chairman Emeritus and Senior Advisor |
| Executive Officers | | |
| | John J. Brennan | |
| Glenn Booraem | Chairman, 1996–2009 | |
| Born 1967. Controller Since July 2010. Principal | Chief Executive Officer and President, 1996–2008 |
| Occupation(s) During the Past Five Years: Principal | | |
| of The Vanguard Group, Inc.; Controller of each of | | |
| the investment companies served by The Vanguard | Founder | |
| Group since 2010; Assistant Controller of each of | | |
| the investment companies served by The Vanguard | John C. Bogle | |
| Group (2001–2010). | Chairman and Chief Executive Officer, 1974–1996 |
| |
| Thomas J. Higgins | | |
| Born 1957. Chief Financial Officer Since September | | |
| 2008. Principal Occupation(s) During the Past Five | | |
| Years: Principal of The Vanguard Group, Inc.; Chief | | |
| Financial Officer of each of the investment companies | | |
| served by The Vanguard Group since 2008; Treasurer | | |
| of each of the investment companies served by The | | |
| Vanguard Group (1998–2008). | | |
1 Mr. McNabb is considered an “interested person,” as defined in the Investment Company Act of 1940, because he is an officer of the Vanguard funds.
2 December 2002 for Vanguard Equity Income Fund, Vanguard Growth Equity Fund, the Vanguard Municipal Bond Funds, and the Vanguard State Tax-Exempt Funds.
|  |
| P.O. Box 2600 |
| Valley Forge, PA 19482-2600 |
Connect with Vanguard® > vanguard.com
| |
| “FTSE®” is a trademark jointly owned by the London |
| Fund Information > 800-662-7447 | Stock Exchange plc and The Financial Times Limited |
| Direct Investor Account Services > 800-662-2739 | and is used by FTSE International Limited under license. |
| Institutional Investor Services > 800-523-1036 | The FTSE High Dividend Yield Index is calculated by |
| Text Telephone for People | FTSE International Limited. FTSE International Limited |
| With Hearing Impairment > 800-749-7273 | does not sponsor, endorse, or promote the fund; is not |
| | in any way connected to it; and does not accept any |
| This material may be used in conjunction | liability in relation to its issue, operation, and trading. |
| with the offering of shares of any Vanguard | |
| fund only if preceded or accompanied by | |
| the fund’s current prospectus. | |
| |
| All comparative mutual fund data are from Lipper Inc. or | |
| Morningstar, Inc., unless otherwise noted. | |
| |
| You can obtain a free copy of Vanguard’s proxy voting | |
| guidelines by visiting vanguard.com/proxyreporting or by | |
| calling Vanguard at 800-662-2739. The guidelines are | |
| also available from the SEC’s website, sec.gov. In | |
| addition, you may obtain a free report on how your fund | |
| voted the proxies for securities it owned during the 12 | |
| months ended June 30. To get the report, visit either | |
| vanguard.com/proxyreporting or sec.gov. | |
| |
| You can review and copy information about your fund at | |
| the SEC’s Public Reference Room in Washington, D.C. To | |
| find out more about this public service, call the SEC at | |
| 202-551-8090. Information about your fund is also | |
| available on the SEC’s website, and you can receive | |
| copies of this information, for a fee, by sending a | |
| request in either of two ways: via e-mail addressed to | |
| publicinfo@sec.gov or via regular mail addressed to the | |
| Public Reference Section, Securities and Exchange | |
| Commission, Washington, DC 20549-1520. | |
| |
| |
| | © 2010 The Vanguard Group, Inc. |
| | All rights reserved. |
| | Vanguard Marketing Corporation, Distributor. |
| |
| | Q6230 122010 |
Item 2: Code of Ethics. The Registrant has adopted a code of ethics that applies to the Registrant’s principal executive officer, principal financial officer, principal accounting officer or controller or persons performing similar functions. The Code of Ethics was amended during the reporting period covered by this report to make certain technical, non-material changes.
Item 3: Audit Committee Financial Expert. The following members of the Audit Committee have been determined by the Registrant’s Board of Trustees to be Audit Committee Financial Experts serving on its Audit Committee, and to be independent: Charles D. Ellis, Rajiv L. Gupta, JoAnn Heffernan Heisen, André F. Perold, and Alfred M. Rankin, Jr.
Item 4: Principal Accountant Fees and Services.
(a) Audit Fees.
Audit Fees of the Registrant
Fiscal Year Ended October 31, 2010: $112,000
Fiscal Year Ended October 31, 2009: $100,000
Aggregate Audit Fees of Registered Investment Companies in the Vanguard Group.
Fiscal Year Ended October 31, 2010: $3,607,060
Fiscal Year Ended October 31, 2009: $3,354,640
(b) Audit-Related Fees.
Fiscal Year Ended October 31, 2010: $791,350
Fiscal Year Ended October 31, 2009: $876,210
Includes fees billed in connection with assurance and related services provided to the Registrant, The Vanguard Group, Inc., Vanguard Marketing Corporation, and other registered investment companies in the Vanguard Group.
(c) Tax Fees.
Fiscal Year Ended October 31, 2010: $336,090
Fiscal Year Ended October 31, 2009: $423,070
Includes fees billed in connection with tax compliance, planning and advice services provided to the Registrant, The Vanguard Group, Inc., Vanguard Marketing Corporation, and other registered investment companies in the Vanguard Group and related to income and excise taxes.
(d) All Other Fees.
Fiscal Year Ended October 31, 2010: $16,000
Fiscal Year Ended October 31, 2009: $0
Includes fees billed for services related to risk management and privacy matters. Services were provided to the Registrant, The Vanguard Group, Inc., Vanguard Marketing Corporation, and other registered investment companies in the Vanguard Group.
(e) (1) Pre-Approval Policies. The policy of the Registrant’s Audit Committee is to consider and, if appropriate, approve before the principal accountant is engaged for such services, all specific audit and non-audit services provided to: (1) the Registrant; (2) The Vanguard Group, Inc.; (3) other entities controlled by The Vanguard Group, Inc. that provide ongoing services to the Registrant; and (4) other registered investment
companies in the Vanguard Group. In making a determination, the Audit Committee considers whether the services are consistent with maintaining the principal accountant’s independence.
In the event of a contingency situation in which the principal accountant is needed to provide services in between scheduled Audit Committee meetings, the Chairman of the Audit Committee would be called on to consider and, if appropriate, pre-approve audit or permitted non-audit services in an amount sufficient to complete services through the next Audit Committee meeting, and to determine if such services would be consistent with maintaining the accountant’s independence. At the next scheduled Audit Committee meeting, services and fees would be presented to the Audit Committee for formal consideration, and, if appropriate, approval by the entire Audit Committee. The Audit Committee would again consider whether such services and fees are consistent with maintaining the principal accountant’s independence.
The Registrant’s Audit Committee is informed at least annually of all audit and non-audit services provided by the principal accountant to the Vanguard complex, whether such services are provided to: (1) the Registrant; (2) The Vanguard Group, Inc.; (3) other entities controlled by The Vanguard Group, Inc. that provide ongoing services to the Registrant; or (4) other registered investment companies in the Vanguard Group.
(2) No percentage of the principal accountant’s fees or services were approved pursuant to the waiver provision of paragraph (c)(7)(i)(C) of Rule 2-01 of Regulation S-X.
(f) For the most recent fiscal year, over 50% of the hours worked under the principal accountant’s engagement were not performed by persons other than full-time, permanent employees of the principal accountant.
(g) Aggregate Non-Audit Fees.
Fiscal Year Ended October 31, 2010: $352,090
Fiscal Year Ended October 31, 2009: $423,070
Includes fees billed for non-audit services provided to the Registrant, The Vanguard Group, Inc., Vanguard Marketing Corporation, and other registered investment companies in the Vanguard Group.
(h) For the most recent fiscal year, the Audit Committee has determined that the provision of all non-audit services was consistent with maintaining the principal accountant’s independence.
Item 5: Audit Committee of Listed Registrants. The Registrant is a listed issuer as defined in Rule 10A-3 under the Securities Exchange Act of 1934 (“Exchange Act”). The Registrant has a separately-designated standing audit committee established in accordance with Section 3(a)(58)(A) of the Exchange Act. The Registrant’s audit committee members are: Emerson U. Fullwood, Rajiv L. Gupta, Amy Gutmann, JoAnn Heffernan Heisen, F. Joseph Loughrey, André F. Perold, Alfred M. Rankin, Jr., and Peter F. Volanakis.
Item 6: Investments.
Not Applicable.
Item 7: Disclosure of Proxy Voting Policies and Procedures for Closed-End Management Investment Companies.
Not Applicable.
Item 8: Portfolio Managers of Closed-End Management Investment Companies.
Not Applicable.
Item 9: Purchase of Equity Securities by Closed-End Management Investment Company and Affiliated Purchasers.
Not Applicable.
Item 10: Submission of Matters to a Vote of Security Holders.
Not Applicable.
Item 11: Controls and Procedures.
(a) Disclosure Controls and Procedures. The Principal Executive and Financial Officers concluded that the Registrant's Disclosure Controls and Procedures are effective based on their evaluation of the Disclosure Controls and Procedures as of a date within 90 days of the filing date of this report.
(b) Internal Control Over Financial Reporting. There were no significant changes in Registrant’s Internal Control Over Financial Reporting or in other factors that could significantly affect this control subsequent to the date of the evaluation, including any corrective actions with regard to significant deficiencies and material weaknesses.
Item 12: Exhibits.
(a) Code of Ethics.
(b) Certifications.
Pursuant to the requirements of the Securities Exchange Act of 1934 and the Investment Company Act of 1940, the registrant has duly caused this report to be signed on its behalf by the undersigned, thereunto duly authorized.
| |
| | VANGUARD WHITEHALL FUNDS |
| |
| By: | /s/ F. WILLIAM MCNABB III* |
| | F. WILLIAM MCNABB III |
| | CHIEF EXECUTIVE OFFICER |
| |
| Date: December 20, 2010 |
Pursuant to the requirements of the Securities Exchange Act of 1934 and the Investment Company Act of 1940, this report has been signed below by the following persons on behalf of the registrant and in the capacities and on the dates indicated.
| |
| | VANGUARD WHITEHALL FUNDS |
| |
| By: | /s/ F. WILLIAM MCNABB III* |
| | F. WILLIAM MCNABB III |
| | CHIEF EXECUTIVE OFFICER |
| |
| Date: December 20, 2010 |
| |
| | VANGUARD WHITEHALL FUNDS |
| |
| By: | /s/ THOMAS J. HIGGINS* |
| | THOMAS J. HIGGINS |
| | CHIEF FINANCIAL OFFICER |
| |
| Date: December 20, 2010 |
* By: /s/ Heidi Stam
Heidi Stam, pursuant to a Power of Attorney filed on April 26, 2010, see file Number 33-53683, Incorporated by Reference.