UNITED STATES
SECURITIES AND EXCHANGE COMMISSION
Washington, D.C. 20549
FORM N-CSR
CERTIFIED SHAREHOLDER REPORT
OF
REGISTERED MANAGEMENT INVESTMENT COMPANIES
Investment Company Act file number: 811-07443
Name of Registrant: Vanguard Whitehall Funds
Address of Registrant:
P.O. Box 2600
Valley Forge, PA 19482
Name and address of agent for service:
Heidi Stam, Esquire
P.O. Box 876
Valley Forge, PA 19482
Registrant’s telephone number, including area code: (610) 669-1000
Date of fiscal year end: October 31
Date of reporting period: November 1, 2010 – October 31, 2011
Item 1: Reports to Shareholders

Annual Report | October 31, 2011
Vanguard Selected Value Fund
> For the fiscal year ended October 31, Vanguard Selected Value Fund returned almost 8%.
> The fund outperformed its benchmark index by almost 2 percentage points and the average return of its peer funds by more than 3 percentage points.
> Financial and health care holdings contributed most to the fund’s outperformance.
| |
| Contents | |
| Your Fund’s Total Returns. | 1 |
| Chairman’s Letter. | 2 |
| Advisors’ Report. | 7 |
| Fund Profile. | 11 |
| Performance Summary. | 12 |
| Financial Statements. | 14 |
| Your Fund’s After-Tax Returns. | 24 |
| About Your Fund’s Expenses. | 25 |
| Glossary. | 27 |
Please note: The opinions expressed in this report are just that—informed opinions. They should not be considered promises or advice.
Also, please keep in mind that the information and opinions cover the period through the date on the front of this report. Of course, the risks of investing in your fund are spelled out in the prospectus.
See the Glossary for definitions of investment terms used in this report.
About the cover: Vanguard was named for the HMS Vanguard, flagship of British Admiral Horatio Nelson. A ship—whose performance and safety depend on the work of all hands—has served as a fitting metaphor for the Vanguard crew as we strive to help clients reach their financial goals.
Your Fund’s Total Returns
| |
| Fiscal Year Ended October 31, 2011 | |
| |
| | Total |
| | Returns |
| Vanguard Selected Value Fund | 7.74% |
| Russell Midcap Value Index | 5.83 |
| Mid-Cap Value Funds Average | 4.09 |
| Mid-Cap Value Funds Average: Derived from data provided by Lipper Inc. |
Your Fund’s Performance at a Glance
October 31, 2010 , Through October 31, 2011
| | | | |
| | | | Distributions Per Share |
| | Starting | Ending | Income | Capital |
| | Share Price | Share Price | Dividends | Gains |
| Vanguard Selected Value Fund | $17.73 | $18.81 | $0.291 | $0.000 |
1

Chairman’s Letter
Dear Shareholder,
Despite extreme volatility in the financial markets, Vanguard Selected Value Fund returned 7.74% for the fiscal year ended October 31, 2011, ahead of both the 5.83% return of its benchmark, the Russell Midcap Value Index, and the 4.09% average return of its mid-cap value fund peers.
In large part, the fund’s solid performance was driven by its holdings in financials and health care. Consumer discretionary and utility stocks were also sources of strength; however, reversals among a number of information technology holdings dampened returns.
If you hold shares in a taxable account, you may wish to review the information about after-tax returns for the fiscal year that appears later in this report.
A positive finish
to an anxious 12 months
U.S. stock indexes ended the period with solid returns, though the gains were shadowed by anxiety in a volatile period. This turbulence was so pronounced, in fact, that a one-month change in the start date would have yielded a very different perspective on performance. For the 12 months through October 31, the broad U.S. stock market returned 7.67%. For the 12 months ended September 30, however, the return was a mere 0.31%.
2
Volatility has been a theme in international markets, too. International stock markets returned a combined –4.66% as stock prices retreated in Europe. Prices also fell in the Pacific region’s developed economies and emerging markets, where growth has moderated.
Unsteady yields reflected
fast-changing sentiment
Taxable bonds produced strong return and municipal bonds solid but unspectacular results, though as in the stock market, investor sentiment was volatile. The yield of the 10-year U.S. Treasury note, a benchmark for longer-term interest rates, began the 12 months at 2.61%, drifted higher as the economic expansion seemed to gather steam, then fluttered lower to close the period at 2.17%. The decline in Treasury yields (and rise in prices) was driven by Europe’s sovereign-debt dramas, underwhelming economic reports, and a flight to safety that was prompted, paradoxically, by a rating agency’s decision to downgrade the U.S. government debt. Vanguard’s confidence in the full faith and credit of the U.S. Treasury remains unshaken.
Taxable investment-grade bonds returned 5.00% for the full 12 months. It’s important to note, of course, that as yields decline, the opportunity for similarly strong returns diminishes. The broad municipal market returned 3.78%. The returns on money market instruments hovered near 0%, consistent with the Federal Reserve Board’s target for short-term interest rates.
| | | |
| Market Barometer | | | |
| |
| | | Average Annual Total Returns |
| | | Periods Ended October 31, 2011 |
| | One | Three | Five |
| | Year | Years | Years |
| Stocks | | | |
| Russell 1000 Index (Large-caps) | 8.01% | 12.22% | 0.54% |
| Russell 2000 Index (Small-caps) | 6.71 | 12.87 | 0.68 |
| Dow Jones U.S. Total Stock Market Index | 7.67 | 12.58 | 0.90 |
| MSCI All Country World Index ex USA (International) | -4.66 | 12.92 | -0.37 |
| |
| Bonds | | | |
| Barclays Capital U.S. Aggregate Bond Index (Broad | | | |
| taxable market) | 5.00% | 8.87% | 6.41% |
| Barclays Capital Municipal Bond Index (Broad | | | |
| tax-exempt market) | 3.78 | 8.31 | 4.80 |
| Citigroup Three-Month U.S. Treasury Bill Index | 0.10 | 0.15 | 1.53 |
| |
| CPI | | | |
| Consumer Price Index | 3.53% | 1.49% | 2.33% |
3
Security selection
drives performance
Vanguard Selected Value Fund invests in midsized companies that, in the advisors’ judgment, are significantly undervalued relative to their assets or earnings. When the advisors identify compelling candidates, they invest with conviction, producing a relatively concentrated portfolio. (While the fund’s benchmark index included more than 500 stocks at the end of the period, the fund held just 64.)
More than one-quarter of the fund’s assets were in financial stocks. Though this sector continued to wrestle with bad loans and a tough lending environment, the fund managed to avoid some associated potholes, such as regional banks. It also benefited from its very concentrated insurance company holdings and from credit card company stocks that remained unscathed by some of the problems plaguing the broader banking industry.
Health care was another bright spot for the fund. Its holdings in this sector, all in health care providers and services, boosted returns and outpaced their counterparts in the index. Consumer discretionary and utilities stocks together also added to relative returns. Stock selection in information technology, however, detracted from returns.
You can find more information on the fund’s positioning and performance during the fiscal year in the Advisors’ Report that follows this letter.
Expense Ratios
Your Fund Compared With Its Peer Group
| | |
| | | Peer Group |
| | Fund | Average |
| Selected Value Fund | 0.47% | 1.39% |
The fund expense ratio shown is from the prospectus dated February 24, 2011, and represents estimated costs for the current fiscal year. For the fiscal year ended October 31, 2011, the fund’s expense ratio was 0.45%. The peer-group expense ratio is derived from data provided by Lipper Inc. and captures information through year-end 2010.Peer group: Mid-Cap Value Funds.4
A decade of returns
attests to the fund’s strategy
The Selected Value Fund’s advisors seek very concentrated investments in midsized companies that are significantly undervalued and have the potential to appreciate substantially. This strategy involves considerable risk: When the advisors’ investment thesis pays off, the positive effect on returns can be significant; on the other hand, weakness in a handful of positions can have an outsized negative impact.
Over time, buying stocks with fundamental value at market discounts should result in good returns, and that has proven to be the case. Over the last ten years, the fund’s average annualized return was 8.27%, almost 4 percentage points more than the broad U.S. stock market. This strong result was less strong relative to the fund’s more finely calibrated comparative standards. The fund’s return trailed that of its benchmark index by a small amount but outpaced that of its mid-cap value fund peers.
A well-balanced portfolio
is your best approach
Diversification is a proven means of reducing risk in a portfolio, protecting it from the market’s inevitable downturns while also capturing its upswings. Investors may feel they are sufficiently diversified if they are invested in a fund pegged to a well-known large-cap index such as the S&P 500. However, by broadening their portfolio’s exposure to include a blend
Total Returns
Ten Years Ended October 31, 2011
| |
| | Average |
| | Annual Return |
| Selected Value Fund | 8.27% |
| Russell Midcap Value Index | 8.76 |
| Mid-Cap Value Funds Average | 7.23 |
| Mid-Cap Value Funds Average: Derived from data provided by Lipper Inc. |
The figures shown represent past performance, which is not a guarantee of future results. (Current performance may be lower or higher than the performance data cited. For performance data current to the most recent month-end, visit our website at vanguard.com/performance.) Note, too, that both investment returns and principal value can fluctuate widely, so an investor’s shares, when sold, could be worth more or less than their original cost.
5
of small-, mid-, and large-cap stocks, they can benefit additionally during those times when one asset class outperforms another.
At Vanguard, we advise investors to hold a balanced portfolio that includes stocks, bonds, and money market funds in a mix that matches their risk tolerance and time horizon. With its skilled advisors’ long experience in identifying attractively valued smaller companies, Vanguard Selected Value Fund can play an important role in such a plan.
As always, we appreciate your confidence in Vanguard.
Sincerely,

F. William McNabb III
Chairman and Chief Executive Officer
November 11, 2011
6
Advisors’ Report
For the fiscal year ended October 31, 2011, Vanguard Selected Value Fund returned 7.74%. Your fund is managed by two independent advisors. This provides exposure to distinct, yet complementary, investment approaches, enhancing the fund’s diversification. It is not uncommon for different advisors to have different views about individual securities or the broader investment environment.
The advisors, the percentage and amount of fund assets each manages, and a brief description of their investment strategies are presented in the table below. The advisors have also prepared a discussion of the investment environment that existed during the fiscal period and of how portfolio positioning reflects this assessment. These comments were prepared on November 19, 2011.
| | | |
| Vanguard Selected Value Fund Investment Advisors | |
| |
| | Fund Assets Managed | |
| Investment Advisor | % | $ Million | Investment Strategy |
| Barrow, Hanley, Mewhinney & | 73 | 2,895 | Conducts fundamental research on individual stocks |
| Strauss, LLC | | | exhibiting traditional value characteristics: |
| | | | price/earnings and price/book ratios below the market |
| | | | average and dividend yields above the market average. |
| Donald Smith & Co., Inc. | 25 | 977 | Conducts fundamental research on the lowest |
| | | | price-to-tangible-book-value companies. Research |
| | | | focuses on underlying quality of book value and assets, |
| | | | and on long-term earnings potential. |
| Cash Investments | 2 | 84 | These short-term reserves are invested by Vanguard in |
| | | | equity index products to simulate investment in stocks. |
| | | | Each advisor may also maintain a modest cash |
| | | | position. |
7
Barrow, Hanley, Mewhinney & Strauss, LLC
Portfolio Managers:
James P. Barrow, Executive Director
Mark Giambrone, Managing Director
The past year has been dominated by macro themes leading to dramatic volatility and uncertainty in markets, economies, and politics around the world. Through all of this, the market recorded a modest gain, and we were able to perform meaningfully better than our benchmark. Since we take no macro positions, our general perspective on the business environment is shaped by the many company management teams we meet with regularly. This may sound surprising, but their general theme is, “While the headlines are toxic, business is okay, and better than last year.” Although we pick stocks on a bottom-up basis, we consider this opinion when forecasting future business prospects, and our portfolio reflects that.
Accordingly, we are overweight in industrials, health care, energy, and consumer discretionary, and we have a significant weight in financials. Recently, we have been finding new opportunities in all of these sectors, and over the past year we have established new positions in all but health care. Consistently, we are underweight in consumer staples, utilities, information technology, and materials and are struggling to find value and new opportunities in these areas.
The global uncertainty has caused CEOs and companies to take a very conservative stance toward their balance sheets. While this is certainly understandable, corporate cash as a percent of total assets is at record levels, and management now appears more willing to either deploy excess cash to grow a business or return it to shareholders in the form of dividends and share repurchases. We have seen consistent increases in both dividends and share repurchases across all sectors.
We believe this portfolio is uniquely positioned to benefit from merger-and-acquisition activity; several of our holdings have already done so. We had a large position in Goodrich Corp., which was taken over by United Technologies at a substantial premium. Acquisitions by Stanley Black & Decker and Capital One will add nicely to earnings growth over the next few years and should lead to higher valuations. And ITT Corp. decided to break into three pieces, each of which is an attractive value candidate. Because of our focus on low valuations and high-quality business prospects, our portfolio has a long history of acquisition activity, and with all the cash now on large corporate balance sheets, we expect this to continue.
8
Although headlines are “toxic,” strong, solid companies are doing the right things to try to enhance shareholder value, and we expect to be direct beneficiaries of this. We believe our portfolio is well-positioned, made up of quality holdings with good earnings and cash-flow prospects that pay an above-market yield and have below-market valuations.
Donald Smith & Co., Inc.
Portfolio Managers:
Donald G. Smith, Chief Investment Officer
Richard L. Greenberg, CFA, Senior Vice President
Our portfolio at the end of October 2011 continues to meet our criteria of holding a concentrated group of low price-to-tangible-book-value stocks with attractive long-term earnings potential. The portfolio currently sells at 81% of tangible book value and 7.8 times our estimate of “normalized earnings.” In contrast, the S&P 500 Index sells at more than 400% of tangible book value and about 14 times normalized earnings.
The portfolio’s return over the past year exceeded that of the Russell Midcap Value Index. Dillard’s and Tesoro each appreciated in excess of 100%; both continue to show substantial progress in their turnaround plans. Dillard’s has been very aggressive in its stock buyback program. Yamana Gold (+36.2%) benefited from higher gold prices. Constellation Energy (+31.3%) agreed to merge with Exelon. Royal Caribbean, a recent purchase, rose from its depressed bottom. In general, companies not as subject to the direction of the economy, such as utilities and insurance, outperformed, and those hurt by a weaker economy and/or higher oil prices, such as technology, airlines, and shipping, underperformed. Our two airline stocks, Air France (–57.9%) and JetBlue (–35.8%), and the oil tanker company Overseas Shipholding (–62.7%) were the poorest performers. Micron Technology (–32.3%) has suffered from weak pricing in memory chips and concerns about a pending lawsuit decision.
We eliminated holdings in Flextronics and Semiconductor Manufacturing and added to several others, particularly in August, when the cash position was reduced by 46%. We greatly increased our position in stocks that have underperformed, including airlines and Micron Technology, and added three new stocks over the past year. We recently purchased Royal Caribbean Cruises, which we’d previously owned, at $23.73, or 50% below recent highs. This price was only about 70% of tangible book value and 8 times earnings. We initiated a small position in XL Group, a reinsurance company that sells at 69% of tangible book value. Like many other reinsurance companies, it has wisely been repurchasing stock at a discount to book
9
value. Our final purchase was in Southwest Airlines. The airline industry’s shrinking capacity has allowed for much improved pricing power, and Southwest has the best balance sheet in the industry.
The portfolio’s three largest industry positions are insurance (18.2%), technology (14.7%), and utilities (14.4%). The defensive nature of utilities and insurance helps to offset more cyclically oriented sectors, including technology and transportation. Our insurance firms all sell below book value and are overcapitalized; we are pleased that some have decided to return money to the shareholders through aggressive stock repurchase programs. Our technology holdings—Ingram Micro and Micron—while more sensitive to an economic slowdown, have superior balance sheets that ensure their survival. The portfolio overall is attractively valued at only 81% of tangible book value.
10
Selected Value Fund
Fund Profile
As of October 31, 2011
| | | |
| Portfolio Characteristics | | |
| | | Russell | DJ |
| | | Midcap | U.S. Total |
| | | Value | Market |
| | Fund | Index | Index |
| Number of Stocks | 64 | 528 | 3,749 |
| Median Market Cap | $7.2B | $6.7B | $30.4B |
| Price/Earnings Ratio | 13.2x | 15.3x | 14.9x |
| Price/Book Ratio | 1.3x | 1.4x | 2.1x |
| Return on Equity | 12.0% | 10.5% | 19.1% |
| Earnings Growth Rate | -1.6% | 0.6% | 7.2% |
| Dividend Yield | 2.4% | 2.4% | 2.0% |
| Foreign Holdings | 7.3% | 0.0% | 0.0% |
| Turnover Rate | 25% | — | — |
| Ticker Symbol | VASVX | — | — |
| Expense Ratio1 | 0.47% | — | — |
| 30-Day SEC Yield | 1.80% | — | — |
| Short-Term Reserves | 3.9% | — | — |
| |
| Sector Diversification (% of equity exposure) |
| | | Russell | DJ |
| | | Midcap | U.S. Total |
| | | Value | Market |
| | Fund | Index | Index |
| Consumer | | | |
| Discretionary | 13.5% | 11.2% | 12.4% |
| Consumer Staples | 4.2 | 6.8 | 10.1 |
| Energy | 8.6 | 6.7 | 10.7 |
| Financials | 26.2 | 31.0 | 15.1 |
| Health Care | 8.4 | 6.1 | 11.1 |
| Industrials | 14.9 | 10.5 | 10.9 |
| Information | | | |
| Technology | 9.2 | 8.3 | 19.3 |
| Materials | 3.8 | 4.5 | 4.3 |
| Telecommunication | | | |
| Services | 0.1 | 0.8 | 2.6 |
| Utilities | 11.1 | 14.1 | 3.5 |
| | |
| Volatility Measures | | |
| | Russell | DJ |
| | Midcap | U.S. Total |
| | Value | Market |
| | Index | Index |
| R-Squared | 0.95 | 0.95 |
| Beta | 0.84 | 1.01 |
| These measures show the degree and timing of the fund’s fluctuations compared with the indexes over 36 months. | |
| |
| |
| Ten Largest Holdings (% of total net assets) |
| Royal Caribbean Cruises | Hotels, Resorts & | |
| Ltd. | Cruise Lines | 3.5% |
| Constellation Energy | Independent Power | |
| Group Inc. | Producers & Energy | |
| | Traders | 2.6 |
| Yamana Gold Inc. | Gold | 2.5 |
| International Game | | |
| Technology | Casinos & Gaming | 2.4 |
| Discover Financial | | |
| Services | Consumer Finance | 2.3 |
| Coventry Health Care | Managed Health | |
| Inc. | Care | 2.3 |
| Capital One Financial | | |
| Corp. | Consumer Finance | 2.2 |
| Stanley Black & Decker | Industrial | |
| Inc. | Machinery | 2.1 |
| Essex Property Trust Inc. | Residential REITs | 2.1 |
| Molex Inc. | Electronic | |
| | Manufacturing | |
| | Services | 2.1 |
| Top Ten | | 24.1% |
| The holdings listed exclude any temporary cash investments and equity index products. |
| | |
Investment Focus
1 The expense ratio shown is from the prospectus dated February 24, 2011, and represents estimated costs for the current fiscal year. For the fiscal year ended October 31, 2011, the expense ratio was 0.45%.
11
Selected Value Fund
Performance Summary
All of the returns in this report represent past performance, which is not a guarantee of future results that may be achieved by the fund. (Current performance may be lower or higher than the performance data cited. For performance data current to the most recent month-end, visit our website at vanguard.com/performance.) Note, too, that both investment returns and principal value can fluctuate widely, so an investor’s shares, when sold, could be worth more or less than their original cost. The returns shown do not reflect taxes that a shareholder would pay on fund distributions or on the sale of fund shares.
Cumulative Performance: October 31, 2001, Through October 31, 2011
Initial Investment of $10,000
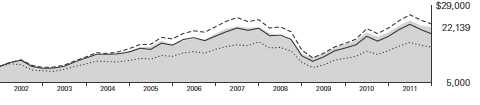
| | | | |
| | Average Annual Total Returns | |
| | Periods Ended October 31, 2011 | |
| | | | | Final Value |
| | One | Five | Ten | of a $10,000 |
| | Year | Years | Years | Investment |
| Selected Value Fund | 7.74% | 1.99% | 8.27% | $22,139 |
| Dow Jones U.S. Total Stock Market | | | | |
| Index | 7.67 | 0.90 | 4.82 | 16,011 |
| Russell Midcap Value Index | 5.83 | 0.73 | 8.76 | 23,164 |
| Mid-Cap Value Funds Average | 4.09 | 0.72 | 7.23 | 20,107 |
Mid-Cap Value Funds Average: Derived from data provided by Lipper Inc.
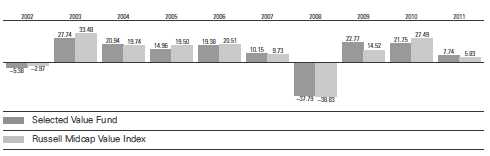
Fiscal-Year Total Returns (%): October 31, 2001, Through October 31, 2011
Vanguard fund returns do not reflect the 1% fee on redemptions of shares held for less than one year.
See Financial Highlights for dividend and capital gains information.
12
Selected Value Fund
Average Annual Total Returns: Periods Ended September 30, 2011
This table presents returns through the latest calendar quarter—rather than through the end of the fiscal period.
Securities and Exchange Commission rules require that we provide this information.
| | | | |
| | Inception | One | Five | Ten |
| | Date | Year | Years | Years |
| Selected Value Fund | 2/15/1996 | -1.29% | 0.10% | 6.88% |
Vanguard fund returns do not reflect the 1% fee on redemptions of shares held for less than one year.
13
Selected Value Fund
Financial Statements
Statement of Net Assets
As of October 31, 2011
The fund reports a complete list of its holdings in regulatory filings four times in each fiscal year, at the quarter-ends. For the second and fourth fiscal quarters, the lists appear in the fund’s semiannual and annual reports to shareholders. For the first and third fiscal quarters, the fund files the lists with the Securities and Exchange Commission on Form N-Q. Shareholders can look up the fund’s Forms N-Q on the SEC’s website at sec.gov. Forms N-Q may also be reviewed and copied at the SEC’s Public Reference Room (see the back cover of this report for further information).
| | | |
| | | | Market |
| | | | Value |
| | | Shares | ($000) |
| Common Stocks (94.3%)1 | | |
| Consumer Discretionary (12.7%) | |
| | Royal Caribbean Cruises | | |
| | Ltd. | 4,612,000 | 137,069 |
| | International Game | | |
| | Technology | 5,370,100 | 94,460 |
| | Newell Rubbermaid Inc. | 4,854,400 | 71,845 |
| * | Hanesbrands Inc. | 2,694,900 | 71,064 |
| | Dillard’s Inc. Class A | 1,121,927 | 57,813 |
| | Rent-A-Center Inc. | 1,340,017 | 45,762 |
| | Service Corp. | | |
| | International | 2,627,000 | 26,270 |
| | | | 504,283 |
| Consumer Staples (3.9%) | | |
| | Lorillard Inc. | 733,800 | 81,203 |
| | Reynolds American Inc. | 1,846,800 | 71,434 |
| | | | 152,637 |
| Energy (8.0%) | | |
| ^ | Seadrill Ltd. | 2,467,900 | 81,761 |
| | Golar LNG Ltd. | 1,698,147 | 68,656 |
| | Murphy Oil Corp. | 1,231,800 | 68,205 |
| | Spectra Energy Corp. | 1,664,900 | 47,666 |
| * | Tesoro Corp. | 1,437,184 | 37,281 |
| | Noble Corp. | 224,597 | 8,072 |
| ^ | Overseas Shipholding | | |
| | Group Inc. | 472,900 | 5,902 |
| | | | 317,543 |
| Financials (25.1%) | | |
| | Discover Financial | | |
| | Services | 3,914,600 | 92,228 |
| | Capital One Financial | | |
| | Corp. | 1,889,500 | 86,275 |
| | Essex Property Trust Inc. | 583,600 | 83,315 |
| | Willis Group Holdings plc | 2,242,900 | 81,440 |
| | SLM Corp. | 5,721,200 | 78,209 |
| | CNA Financial Corp. | 2,833,282 | 75,365 |
| | XL Group plc Class A | 3,431,300 | 74,596 |
| | | |
| | | | Market |
| | | | Value |
| | | Shares | ($000) |
| | Fifth Third Bancorp | 6,025,500 | 72,366 |
| | New York Community | | |
| | Bancorp Inc. | 4,330,300 | 57,636 |
| | PNC Financial Services | | |
| | Group Inc. | 1,055,712 | 56,702 |
| | Ameriprise Financial Inc. | 1,106,400 | 51,647 |
| | Everest Re Group Ltd. | 506,817 | 45,573 |
| | Chubb Corp. | 633,900 | 42,503 |
| | Annaly Capital | | |
| | Management Inc. | 2,320,500 | 39,100 |
| | Unum Group | 1,401,490 | 33,412 |
| | American National | | |
| | Insurance Co. | 164,858 | 11,781 |
| | Montpelier Re Holdings | | |
| | Ltd. | 566,863 | 9,920 |
| | | | 992,068 |
| Health Care (7.9%) | | |
| * | Coventry Health Care Inc. | 2,899,200 | 92,224 |
| | Omnicare Inc. | 2,648,200 | 78,969 |
| | Cardinal Health Inc. | 1,679,100 | 74,334 |
| | CIGNA Corp. | 1,510,700 | 66,984 |
| | | | 312,511 |
| Industrials (14.1%) | | |
| | Stanley Black & Decker | | |
| | Inc. | 1,317,300 | 84,110 |
| | Goodrich Corp. | 615,600 | 75,491 |
| | Eaton Corp. | 1,552,200 | 69,570 |
| | Masco Corp. | 5,836,700 | 56,032 |
| | L-3 Communications | | |
| | Holdings Inc. | 759,300 | 51,465 |
| | SPX Corp. | 871,500 | 47,593 |
| | ITT Corp. | 972,000 | 44,323 |
| * | Air France-KLM ADR | 5,177,864 | 39,326 |
| | Dun & Bradstreet Corp. | 529,500 | 35,402 |
| * | JetBlue Airways Corp. | 7,389,729 | 33,106 |
| | Southwest Airlines Co. | 2,600,000 | 22,230 |
| | | | 558,648 |
14
Selected Value Fund
| | | |
| | | | Market |
| | | | Value |
| | | Shares | ($000) |
| Information Technology (8.4%) | |
| | Molex Inc. | 3,364,700 | 83,074 |
| * | Ingram Micro Inc. | 4,190,311 | 74,923 |
| * | Micron Technology Inc. | 12,321,916 | 68,879 |
| | Western Union Co. | 3,087,500 | 53,939 |
| | Xerox Corp. | 6,548,400 | 53,566 |
| | | | 334,381 |
| Materials (3.6%) | | |
| | Yamana Gold Inc. | 6,630,900 | 99,264 |
| | Sonoco Products Co. | 1,033,700 | 32,448 |
| | Domtar Corp. | 112,570 | 9,221 |
| | | | 140,933 |
| Utilities (10.6%) | | |
| | Constellation Energy | | |
| | Group Inc. | 2,568,237 | 101,959 |
| | CenterPoint Energy Inc. | 3,839,300 | 80,011 |
| | Pinnacle West Capital | | |
| | Corp. | 1,513,505 | 68,986 |
| | Xcel Energy Inc. | 2,535,300 | 65,537 |
| | MDU Resources Group | | |
| | Inc. | 1,967,500 | 40,550 |
| | Oneok Inc. | 505,100 | 38,413 |
| | NV Energy Inc. | 788,340 | 12,645 |
| * | GenOn Energy Inc. | 3,553,218 | 10,837 |
| | | | 418,938 |
| Total Common Stocks | | |
| (Cost $3,154,211) | | 3,731,942 |
| Temporary Cash Investments (7.1%)1 | |
| Money Market Fund (6.9%) | | |
| 2,3 | Vanguard Market Liquidity | |
| | Fund, 0.128% | 271,055,290 | 271,055 |
| | | |
| | | Face | Market |
| | Amount | Value |
| | | ($000) | ($000) |
| U.S. Government and Agency Obligations (0.2%) |
| 4 | Fannie Mae | | |
| | Discount Notes, | | |
| | 0.080%, 12/19/11 | 850 | 850 |
| 5,6 | Federal Home Loan | | |
| | Bank Discount Notes, | | |
| | 0.075%, 11/16/11 | 2,000 | 2,000 |
| 5,6 | Federal Home Loan | | |
| | Bank Discount Notes, | | |
| | 0.040%, 12/9/11 | 5,000 | 5,000 |
| | | | 7,850 |
| Total Temporary Cash Investments | |
| (Cost $278,905) | | 278,905 |
| Total Investments (101.4%) | | |
| (Cost $3,433,116) | | 4,010,847 |
| Other Assets and Liabilities (-1.4%) | |
| Other Assets | | 5,775 |
| Liabilities3 | | (60,295) |
| | | | (54,520) |
| Net Assets (100%) | | |
| Applicable to 210,298,299 outstanding | |
| $.001 par value shares of beneficial | |
| interest (unlimited authorization) | | 3,956,327 |
| Net Asset Value Per Share | | $18.81 |
| |
| |
| At October 31, 2011, net assets consisted of: |
| | | | Amount |
| | | | ($000) |
| Paid-in Capital | | 3,634,781 |
| Undistributed Net | | |
| Investment Income | | 43,027 |
| Accumulated Net Realized Losses | | (302,882) |
| Unrealized Appreciation | | |
| (Depreciation) | | |
| Investment Securities | | 577,731 |
| Futures Contracts | | 3,670 |
| Net Assets | | 3,956,327 |
See Note A in Notes to Financial Statements.
* Non-income-producing security.
^ Part of security position is on loan to broker-dealers. The total value of securities on loan is $39,870,000.
1 The fund invests a portion of its cash reserves in equity markets through the use of index futures contracts. After giving effect to futures investments, the fund’s effective common stock and temporary cash investment positions represent 96.4% and 5.0%, respectively, of net assets.
2 Affiliated money market fund available only to Vanguard funds and certain trusts and accounts managed by Vanguard. Rate shown is the 7-day yield.
3 Includes $42,557,000 of collateral received for securities on loan.
4 The issuer is under federal conservatorship and is dependent upon the continued support of the U.S. Treasury to avoid receivership.
5 The issuer operates under a congressional charter; its securities are not backed by the full faith and credit of the U.S. government.
6 Securities with a value of $7,000,000 have been segregated as initial margin for open futures contracts.
ADR—American Depositary Receipt.
See accompanying Notes, which are an integral part of the Financial Statements.
15
Selected Value Fund
Statement of Operations
| |
| | Year Ended |
| | October 31, 2011 |
| | ($000) |
| Investment Income | |
| Income | |
| Dividends1 | 87,070 |
| Interest2 | 783 |
| Security Lending | 283 |
| Total Income | 88,136 |
| Expenses | |
| Investment Advisory Fees—Note B | |
| Basic Fee | 9,077 |
| Performance Adjustment | 1,539 |
| The Vanguard Group—Note C | |
| Management and Administrative | 6,615 |
| Marketing and Distribution | 903 |
| Custodian Fees | 50 |
| Auditing Fees | 29 |
| Shareholders’ Reports | 57 |
| Trustees’ Fees and Expenses | 8 |
| Total Expenses | 18,278 |
| Expenses Paid Indirectly | (250) |
| Net Expenses | 18,028 |
| Net Investment Income | 70,108 |
| Realized Net Gain (Loss) | |
| Investment Securities Sold | 162,314 |
| Futures Contracts | 5,748 |
| Realized Net Gain (Loss) | 168,062 |
| Change in Unrealized Appreciation (Depreciation) | |
| Investment Securities | 37,627 |
| Futures Contracts | (325) |
| Change in Unrealized Appreciation (Depreciation) | 37,302 |
| Net Increase (Decrease) in Net Assets Resulting from Operations | 275,472 |
1 Dividends are net of foreign withholding taxes of $42,000.
2 Interest income from an affiliated company of the fund was $755,000.
See accompanying Notes, which are an integral part of the Financial Statements.
16
Selected Value Fund
Statement of Changes in Net Assets
| | |
| | Year Ended October 31, |
| | 2011 | 2010 |
| | ($000) | ($000) |
| Increase (Decrease) in Net Assets | | |
| Operations | | |
| Net Investment Income | 70,108 | 50,597 |
| Realized Net Gain (Loss) | 168,062 | (26,512) |
| Change in Unrealized Appreciation (Depreciation) | 37,302 | 604,494 |
| Net Increase (Decrease) in Net Assets Resulting from Operations | 275,472 | 628,579 |
| Distributions | | |
| Net Investment Income | (60,410) | (46,869) |
| Realized Capital Gain | — | — |
| Total Distributions | (60,410) | (46,869) |
| Capital Share Transactions | | |
| Issued | 636,966 | 628,925 |
| Issued in Lieu of Cash Distributions | 54,298 | 41,576 |
| Redeemed1 | (589,231) | (464,396) |
| Net Increase (Decrease) from Capital Share Transactions | 102,033 | 206,105 |
| Total Increase (Decrease) | 317,095 | 787,815 |
| Net Assets | | |
| Beginning of Period | 3,639,232 | 2,851,417 |
| End of Period2 | 3,956,327 | 3,639,232 |
1 Net of redemption fees for fiscal 2011 and 2010 of $482,000 and $459,000, respectively.
2 Net Assets—End of Period includes undistributed net investment income of $43,027,000 and $33,329,000.
See accompanying Notes, which are an integral part of the Financial Statements.
17
Selected Value Fund
Financial Highlights
| | | | | |
| For a Share Outstanding | | | Year Ended October 31, |
| Throughout Each Period | 2011 | 2010 | 2009 | 2008 | 2007 |
| Net Asset Value, Beginning of Period | $17.73 | $14.78 | $12.48 | $22.11 | $21.38 |
| Investment Operations | | | | | |
| Net Investment Income | . 334 | . 250 | . 254 | . 3901 | .400 |
| Net Realized and Unrealized Gain (Loss) | | | | | |
| on Investments | 1.037 | 2.941 | 2.463 | (8.100) | 1.700 |
| Total from Investment Operations | 1.371 | 3.191 | 2.717 | (7.710) | 2.100 |
| Distributions | | | | | |
| Dividends from Net Investment Income | (. 291) | (. 241) | (. 417) | (. 370) | (. 320) |
| Distributions from Realized Capital Gains | — | — | — | (1.550) | (1.050) |
| Total Distributions | (. 291) | (. 241) | (. 417) | (1.920) | (1.370) |
| Net Asset Value, End of Period | $18.81 | $17.73 | $14.78 | $12.48 | $22.11 |
| |
| Total Return2 | 7.74% | 21.75% | 22.77% | -37.79% | 10.15% |
| |
| Ratios/Supplemental Data | | | | | |
| Net Assets, End of Period (Millions) | $3,956 | $3,639 | $2,851 | $2,422 | $4,991 |
| Ratio of Total Expenses to | | | | | |
| Average Net Assets3 | 0.45% | 0.47% | 0.52% | 0.38% | 0.42% |
| Ratio of Net Investment Income to | | | | | |
| Average Net Assets | 1.74% | 1.52% | 1.93% | 2.21% | 1.74% |
| Portfolio Turnover Rate | 25% | 22% | 30% | 23% | 33% |
1 Calculated based on average shares outstanding.
2 Total returns do not include transaction or account service fees that may have applied in the periods shown. Fund prospectuses provide information about any applicable transaction or account service fees.
3 Includes performance-based investment advisory fee increases (decreases) of 0.04%, 0.05%, 0.05%, (0.03%), and (0.02%).
See accompanying Notes, which are an integral part of the Financial Statements.
18
Selected Value Fund
Notes to Financial Statements
Vanguard Selected Value Fund is registered under the Investment Company Act of 1940 as an open-end investment company, or mutual fund.
A. The following significant accounting policies conform to generally accepted accounting principles for U.S. mutual funds. The fund consistently follows such policies in preparing its financial statements.
1. Security Valuation: Securities are valued as of the close of trading on the New York Stock Exchange (generally 4 p.m., Eastern time) on the valuation date. Equity securities are valued at the latest quoted sales prices or official closing prices taken from the primary market in which each security trades; such securities not traded on the valuation date are valued at the mean of the latest quoted bid and asked prices. Securities for which market quotations are not readily available, or whose values have been affected by events occurring before the fund’s pricing time but after the close of the securities’ primary markets, are valued at their fair values calculated according to procedures adopted by the board of trustees. These procedures include obtaining quotations from an independent pricing service, monitoring news to identify significant market- or security-specific events, and evaluating changes in the values of foreign market proxies (for example, ADRs, futures contracts, or exchange-traded funds), between the time the foreign markets close and the fund’s pricing time. When fair-value pricing is employed, the prices of securities used by a fund to calculate its net asset value may differ from quoted or published prices for the same securities. Investments in Vanguard Market Liquidity Fund are valued at that fund’s net asset value. Temporary cash investments acquired over 60 days to maturity are valued using the latest bid prices or using valuations based on a matrix system (which considers such factors as security prices, yields, maturities, and ratings), both as furnished by independent pricing services. Other temporary cash investments are valued at amortized cost, which approximates market value.
2. Futures Contracts: The fund uses index futures contracts to a limited extent, with the objective of maintaining full exposure to the stock market while maintaining liquidity. The fund may purchase or sell futures contracts to achieve a desired level of investment, whether to accommodate portfolio turnover or cash flows from capital share transactions. The primary risks associated with the use of futures contracts are imperfect correlation between changes in market values of stocks held by the fund and the prices of futures contracts, and the possibility of an illiquid market.
Futures contracts are valued at their quoted daily settlement prices. The aggregate principal amounts of the contracts are not recorded in the Statement of Net Assets. Fluctuations in the value of the contracts are recorded in the Statement of Net Assets as an asset (liability) and in the Statement of Operations as unrealized appreciation (depreciation) until the contracts are closed, when they are recorded as realized futures gains (losses).
3. Federal Income Taxes: The fund intends to continue to qualify as a regulated investment company and distribute all of its taxable income. Management has analyzed the fund’s tax positions taken for all open federal income tax years (October 31, 2008–2011), and has concluded that no provision for federal income tax is required in the fund’s financial statements.
4. Distributions: Distributions to shareholders are recorded on the ex-dividend date.
5. Security Lending: The fund may lend its securities to qualified institutional borrowers to earn additional income. Security loans are required to be secured at all times by collateral at least equal to the market value of securities loaned. The fund invests cash collateral received in Vanguard Market Liquidity Fund, and records a liability for the return of the collateral, during the period the securities are on loan. Security lending income represents fees charged to borrowers plus income earned on investing cash collateral, less expenses associated with the loan.
19
Selected Value Fund
6. Other: Dividend income is recorded on the ex-dividend date. Interest income includes income distributions received from Vanguard Market Liquidity Fund and is accrued daily. Security transactions are accounted for on the date securities are bought or sold. Costs used to determine realized gains (losses) on the sale of investment securities are those of the specific securities sold. Fees assessed on redemptions of capital shares are credited to paid-in capital.
B. Barrow, Hanley, Mewhinney & Strauss, LLC., and Donald Smith & Co., Inc., each provide investment advisory services to a portion of the fund for a fee calculated at an annual percentage rate of average net assets managed by the advisor. The basic fee of Barrow, Hanley, Mewhinney & Strauss, LLC, is subject to quarterly adjustments based on performance for the preceding three years relative to the Russell Midcap Value Index. The basic fee of Donald Smith & Co., Inc., is subject to quarterly adjustments based on performance for the preceding five years relative to the MSCI Investable Market 2500 Index.
The Vanguard Group manages the cash reserves of the fund on an at-cost basis.
For the year ended October 31, 2011, the aggregate investment advisory fee represented an effective annual basic rate of 0.23% of the fund’s average net assets, before an increase of $1,539,000 (0.04%) based on performance.
C. The Vanguard Group furnishes at cost corporate management, administrative, marketing, and distribution services. The costs of such services are allocated to the fund under methods approved by the board of trustees. The fund has committed to provide up to 0.40% of its net assets in capital contributions to Vanguard. At October 31, 2011, the fund had contributed capital of $609,000 to Vanguard (included in Other Assets), representing 0.02% of the fund’s net assets and 0.24% of Vanguard’s capitalization. The fund’s trustees and officers are also directors and officers of Vanguard.
D. The fund has asked its investment advisors to direct certain security trades, subject to obtaining the best price and execution, to brokers who have agreed to rebate to the fund part of the commissions generated. Such rebates are used solely to reduce the fund’s management and administrative expenses. For the year ended October 31, 2011, these arrangements reduced the fund’s expenses by $250,000 (an annual rate of 0.01% of average net assets).
E. Various inputs may be used to determine the value of the fund’s investments. These inputs are summarized in three broad levels for financial statement purposes. The inputs or methodologies used to value securities are not necessarily an indication of the risk associated with investing in those securities.
Level 1—Quoted prices in active markets for identical securities.
Level 2—Other significant observable inputs (including quoted prices for similar securities, interest rates, prepayment speeds, credit risk, etc.).
Level 3—Significant unobservable inputs (including the fund’s own assumptions used to determine the fair value of investments).
20
Selected Value Fund
The following table summarizes the market value of the fund’s investments as of October 31, 2011, based on the inputs used to value them:
| | | |
| | Level 1 | Level 2 | Level 3 |
| Investments | ($000) | ($000) | ($000) |
| Common Stocks | 3,731,942 | — | — |
| Temporary Cash Investments | 271,055 | 7,850 | — |
| Futures Contracts—Assets1 | 33 | — | — |
| Futures Contracts—Liabilities1 | (2,147) | — | — |
| Total | 4,000,883 | 7,850 | — |
| 1 Represents variation margin on the last day of the reporting period. |
F. At October 31, 2011, the aggregate settlement value of open futures contracts and the related unrealized appreciation (depreciation) were:
| | | | |
| | | | | ($000) |
| | | | Aggregate | |
| | | Number of | Settlement | Unrealized |
| | | Long (Short) | Value | Appreciation |
| Futures Contracts | Expiration | Contracts | Long (Short) | (Depreciation) |
| S&P 500 Index | December 2011 | 260 | 81,205 | 3,697 |
| E-mini S&P 500 Index | December 2011 | 17 | 1,062 | (27) |
Unrealized appreciation (depreciation) on open futures contracts is required to be treated as realized gain (loss) for tax purposes.
G. Distributions are determined on a tax basis and may differ from net investment income and realized capital gains for financial reporting purposes. Differences may be permanent or temporary. Permanent differences are reclassified among capital accounts in the financial statements to reflect their tax character. Temporary differences arise when certain items of income, expense, gain, or loss are recognized in different periods for financial statement and tax purposes; these differences will reverse at some time in the future. Differences in classification may also result from the treatment of short-term gains as ordinary income for tax purposes.
For tax purposes, at October 31, 2011, the fund had $49,735,000 of ordinary income available for distribution. The fund had available capital loss carryforwards totaling $298,609,000 to offset future net capital gains of $26,776,000 through October 31, 2016, $249,339,000 through October 31, 2017, and $22,494,000 through October 31, 2018.
At October 31, 2011, the cost of investment securities for tax purposes was $3,433,116,000. Net unrealized appreciation of investment securities for tax purposes was $577,731,000, consisting of unrealized gains of $793,277,000 on securities that had risen in value since their purchase and $215,546,000 in unrealized losses on securities that had fallen in value since their purchase.
H. During the year ended October 31, 2011, the fund purchased $1,183,534,000 of investment securities and sold $907,830,000 of investment securities, other than temporary cash investments.
21
Selected Value Fund
I. Capital shares issued and redeemed were:
| | |
| | Year Ended October 31, |
| | 2011 | 2010 |
| | Shares | Shares |
| | (000) | (000) |
| Issued | 33,349 | 37,789 |
| Issued in Lieu of Cash Distributions | 2,899 | 2,571 |
| Redeemed | (31,206) | (28,069) |
| Net Increase (Decrease) in Shares Outstanding | 5,042 | 12,291 |
J. In preparing the financial statements as of October 31, 2011, management considered the impact of subsequent events for potential recognition or disclosure in these financial statements.
22
Report of Independent Registered
Public Accounting Firm
To the Trustees of Vanguard Whitehall Funds and the Shareholders of Vanguard Selected Value Fund:
In our opinion, the accompanying statement of net assets and the related statements of operations and of changes in net assets and the financial highlights present fairly, in all material respects, the financial position of Vanguard Selected Value Fund (constituting a separate portfolio of Vanguard Whitehall Funds, hereafter referred to as the “Fund”) at October 31, 2011, the results of its operations for the year then ended, the changes in its net assets for each of the two years in the period then ended and the financial highlights for each of the five years in the period then ended, in conformity with accounting principles generally accepted in the United States of America. These financial statements and financial highlights (hereafter referred to as “financial statements”) are the responsibility of the Fund’s management; our responsibility is to express an opinion on these financial statements based on our audits. We conducted our audits of these financial statements in accordance with the standards of the Public Company Accounting Oversight Board (United States). Those standards require that we plan and perform the audit to obtain reasonable assurance about whether the financial statements are free of material misstatement. An audit includes examining, on a test basis, evidence supporting the amounts and disclosures in the financial statements, assessing the accounting principles used and significant estimates made by management, and evaluating the overall financial statement presentation. We believe that our audits, which included confirmation of securities at October 31, 2011 by correspondence with the custodian and broker and by agreement to the underlying ownership records of Vanguard Market Liquidity Fund, provide a reasonable basis for our opinion.
PricewaterhouseCoopers LLP
Philadelphia, Pennsylvania
December 12, 2011
|
| Special 2011 tax information (unaudited) for Vanguard Selected Value Fund |
This information for the fiscal year ended October 31, 2011, is included pursuant to provisions of the Internal Revenue Code.
The fund distributed $60,410,000 of qualified dividend income to shareholders during the fiscal year.
For corporate shareholders, 93.7% of investment income (dividend income plus short-term gains, if any) qualifies for the dividends-received deduction.
23
Your Fund’s After-Tax Returns
This table presents returns for your fund both before and after taxes. The after-tax returns are shown in two ways: (1) assuming that an investor owned the fund during the entire period and paid taxes on the fund’s distributions, and (2) assuming that an investor paid taxes on the fund’s distributions and sold all shares at the end of each period.
Calculations are based on the highest individual federal income tax and capital gains tax rates in effect at the times of the distributions and the hypothetical sales. State and local taxes were not considered. After-tax returns reflect any qualified dividend income, using actual prior-year figures and estimates for 2011. (In the example, returns after the sale of fund shares may be higher than those assuming no sale. This occurs when the sale would have produced a capital loss. The calculation assumes that the investor received a tax deduction for the loss.)
Please note that your actual after-tax returns will depend on your tax situation and may differ from those shown. Also note that if you own the fund in a tax-deferred account, such as an individual retirement account or a 401(k) plan, this information does not apply to you. Such accounts are not subject to current taxes.
Finally, keep in mind that a fund’s performance—whether before or after taxes—does not guarantee future results.
Average Annual Total Returns: Selected Value Fund
Periods Ended October 31, 2011
| | | |
| | One | Five | Ten |
| | Year | Years | Years |
| Returns Before Taxes | 7.74% | 1.99% | 8.27% |
| Returns After Taxes on Distributions | 7.49 | 1.23 | 7.55 |
| Returns After Taxes on Distributions and Sale of Fund Shares | 5.36 | 1.54 | 7.08 |
Returns do not reflect the 1% fee on redemptions of shares held for less than one year.
24
About Your Fund’s Expenses
As a shareholder of the fund, you incur ongoing costs, which include costs for portfolio management, administrative services, and shareholder reports (like this one), among others. Operating expenses, which are deducted from a fund’s gross income, directly reduce the investment return of the fund.
A fund’s expenses are expressed as a percentage of its average net assets. This figure is known as the expense ratio. The following examples are intended to help you understand the ongoing costs (in dollars) of investing in your fund and to compare these costs with those of other mutual funds. The examples are based on an investment of $1,000 made at the beginning of the period shown and held for the entire period.
The accompanying table illustrates your fund’s costs in two ways:
• Based on actual fund return. This section helps you to estimate the actual expenses that you paid over the period. The ”Ending Account Value“ shown is derived from the fund‘s actual return, and the third column shows the dollar amount that would have been paid by an investor who started with $1,000 in the fund. You may use the information here, together with the amount you invested, to estimate the expenses that you paid over the period.
To do so, simply divide your account value by $1,000 (for example, an $8,600 account value divided by $1,000 = 8.6), then multiply the result by the number given for your fund under the heading ”Expenses Paid During Period.“
• Based on hypothetical 5% yearly return. This section is intended to help you compare your fund‘s costs with those of other mutual funds. It assumes that the fund had a yearly return of 5% before expenses, but that the expense ratio is unchanged. In this case—because the return used is not the fund’s actual return—the results do not apply to your investment. The example is useful in making comparisons because the Securities and Exchange Commission requires all mutual funds to calculate expenses based on a 5% return. You can assess your fund’s costs by comparing this hypothetical example with the hypothetical examples that appear in shareholder reports of other funds.
Note that the expenses shown in the table are meant to highlight and help you compare ongoing costs only and do not reflect transaction costs incurred by the fund for buying and selling securities. Further, the expenses do not include any purchase, redemption, or account service fees described in the fund prospectus. If such fees were applied to your account, your costs would be higher. Your fund does not carry a “sales load.”
The calculations assume no shares were bought or sold during the period. Your actual costs may have been higher or lower, depending on the amount of your investment and the timing of any purchases or redemptions.
You can find more information about the fund’s expenses, including annual expense ratios, in the Financial Statements section of this report. For additional information on operating expenses and other shareholder costs, please refer to your fund’s current prospectus.
25
| | | |
| Six Months Ended October 31, 2011 | | | |
| | Beginning | Ending | Expenses |
| | Account Value | Account Value | Paid During |
| Selected Value Fund | 4/30/2011 | 10/31/2011 | Period |
| Based on Actual Fund Return | $1,000.00 | $912.66 | $2.17 |
| Based on Hypothetical 5% Yearly Return | 1,000.00 | 1,022.94 | 2.29 |
The calculations are based on expenses incurred in the most recent six-month period. The fund’s annualized six-month expense ratio for that period is 0.45%. The dollar amounts shown as “Expenses Paid” are equal to the annualized expense ratio multiplied by the average account value over the period, multiplied by the number of days in the most recent six-month period, then divided by the number of days in the most recent 12-month period.
26
Glossary
30-Day SEC Yield. A fund’s 30-day SEC yield is derived using a formula specified by the U.S. Securities and Exchange Commission. Under the formula, data related to the fund’s security holdings in the previous 30 days are used to calculate the fund’s hypothetical net income for that period, which is then annualized and divided by the fund’s estimated average net assets over the calculation period. For the purposes of this calculation, a security’s income is based on its current market yield to maturity (for bonds; excluding inflation for inflation-protected securities), its actual income (for asset-backed securities), or its projected dividend yield (for stocks). Because the SEC yield represents hypothetical annualized income, it will differ—at times significantly—from the fund’s actual experience. As a result, the fund’s income distributions may be higher or lower than implied by the SEC yield.
Beta. A measure of the magnitude of a fund’s past share-price fluctuations in relation to the ups and downs of a given market index. The index is assigned a beta of 1.00. Compared with a given index, a fund with a beta of 1.20 typically would have seen its share price rise or fall by 12% when the index rose or fell by 10%. For this report, beta is based on returns over the past 36 months for both the fund and the index. Note that a fund’s beta should be reviewed in conjunction with its R-squared (see definition). The lower the R-squared, the less correlation there is between the fund and the index, and the less reliable beta is as an indicator of volatility.
Dividend Yield. Dividend income earned by stocks, expressed as a percentage of the aggregate market value (or of net asset value, for a fund). The yield is determined by dividing the amount of the annual dividends by the aggregate value (or net asset value) at the end of the period. For a fund, the dividend yield is based solely on stock holdings and does not include any income produced by other investments.
Earnings Growth Rate. The average annual rate of growth in earnings over the past five years for the stocks now in a fund.
Equity Exposure. A measure that reflects a fund’s investments in stocks and stock futures. Any holdings in short-term reserves are excluded.
Expense Ratio. The percentage of a fund’s average net assets used to pay its annual administrative and advisory expenses. These expenses directly reduce returns to investors.
Foreign Holdings. The percentage of a fund represented by securities or depositary receipts of companies based outside the United States.
Inception Date. The date on which the assets of a fund (or one of its share classes) are first invested in accordance with the fund’s investment objective. For funds with a subscription period, the inception date is the day after that period ends. Investment performance is measured from the inception date.
Median Market Cap. An indicator of the size of companies in which a fund invests; the midpoint of market capitalization (market price x shares outstanding) of a fund’s stocks, weighted by the proportion of the fund’s assets invested in each stock. Stocks representing half of the fund’s assets have market capitalizations above the median, and the rest are below it.
Price/Book Ratio. The share price of a stock divided by its net worth, or book value, per share. For a fund, the weighted average price/book ratio of the stocks it holds.
27
Price/Earnings Ratio. The ratio of a stock’s current price to its per-share earnings over the past year. For a fund, the weighted average P/E of the stocks it holds. P/E is an indicator of market expectations about corporate prospects; the higher the P/E, the greater the expectations for a company’s future growth.
R-Squared. A measure of how much of a fund’s past returns can be explained by the returns from the market in general, as measured by a given index. If a fund’s total returns were precisely synchronized with an index’s returns, its R-squared would be 1.00. If the fund’s returns bore no relationship to the index’s returns, its R-squared would be 0. For this report, R-squared is based on returns over the past 36 months for both the fund and the index.
Return on Equity. The annual average rate of return generated by a company during the past five years for each dollar of shareholder’s equity (net income divided by shareholder’s equity). For a fund, the weighted average return on equity for the companies whose stocks it holds.
Short-Term Reserves. The percentage of a fund invested in highly liquid, short-term securities that can be readily converted to cash.
Turnover Rate. An indication of the fund’s trading activity. Funds with high turnover rates incur higher transaction costs and may be more likely to distribute capital gains (which may be taxable to investors). The turnover rate excludes in-kind transactions, which have minimal impact on costs.
28
This page intentionally left blank.
This page intentionally left blank.
This page intentionally left blank.
The People Who Govern Your Fund
The trustees of your mutual fund are there to see that the fund is operated and managed in your best interests since, as a shareholder, you are a part owner of the fund. Your fund’s trustees also serve on the board of directors of The Vanguard Group, Inc., which is owned by the Vanguard funds and provides services to them on an at-cost basis.
A majority of Vanguard’s board members are independent, meaning that they have no affiliation with Vanguard or the funds they oversee, apart from the sizable personal investments they have made as private individuals. The independent board members have distinguished backgrounds in business, academia, and public service. Each of the trustees and executive officers oversees 180 Vanguard funds.
The following table provides information for each trustee and executive officer of the fund. More information about the trustees is in the Statement of Additional Information, which can be obtained, without charge, by contacting Vanguard at 800-662-7447, or online at vanguard.com.
| |
| Interested Trustee1 | and President (2006–2008) of Rohm and Haas Co. |
| | (chemicals); Director of Tyco International, Ltd. |
| F. William McNabb III | (diversified manufacturing and services) and Hewlett- |
| Born 1957. Trustee Since July 2009. Chairman of the | Packard Co. (electronic computer manufacturing); |
| Board. Principal Occupation(s) During the Past Five | Senior Advisor at New Mountain Capital; Trustee |
| Years: Chairman of the Board of The Vanguard Group, | of The Conference Board; Member of the Board of |
| Inc., and of each of the investment companies served | Managers of Delphi Automotive LLP (automotive |
| by The Vanguard Group, since January 2010; Director | components). |
| of The Vanguard Group since 2008; Chief Executive | |
| Officer and President of The Vanguard Group and of | Amy Gutmann |
| each of the investment companies served by The | Born 1949. Trustee Since June 2006. Principal |
| Vanguard Group since 2008; Director of Vanguard | Occupation(s) During the Past Five Years: President |
| Marketing Corporation; Managing Director of The | of the University of Pennsylvania; Christopher H. |
| Vanguard Group (1995–2008). | Browne Distinguished Professor of Political Science |
| | in the School of Arts and Sciences with secondary |
| | appointments at the Annenberg School for Commu- |
| Independent Trustees | nication and the Graduate School of Education |
| | of the University of Pennsylvania; Director of |
| Emerson U. Fullwood | Carnegie Corporation of New York, Schuylkill River |
| Born 1948. Trustee Since January 2008. Principal | Development Corporation, and Greater Philadelphia |
| Occupation(s) During the Past Five Years: Executive | Chamber of Commerce; Trustee of the National |
| Chief Staff and Marketing Officer for North America | Constitution Center; Chair of the Presidential |
| and Corporate Vice President (retired 2008) of Xerox | Commission for the Study of Bioethical Issues. |
| Corporation (document management products and | |
| services); Executive in Residence and 2010 | JoAnn Heffernan Heisen |
| Distinguished Minett Professor at the Rochester | Born 1950. Trustee Since July 1998. Principal |
| Institute of Technology; Director of SPX Corporation | Occupation(s) During the Past Five Years: Corporate |
| (multi-industry manufacturing), the United Way of | Vice President and Chief Global Diversity Officer |
| Rochester, Amerigroup Corporation (managed health | (retired 2008) and Member of the Executive |
| care), the University of Rochester Medical Center, | Committee (1997–2008) of Johnson & Johnson |
| Monroe Community College Foundation, and North | (pharmaceuticals/consumer products); Director of |
| Carolina A&T University. | Skytop Lodge Corporation (hotels), the University |
| | Medical Center at Princeton, the Robert Wood |
| Rajiv L. Gupta | Johnson Foundation, and the Center for Work Life |
| Born 1945. Trustee Since December 2001.2 | Policy; Member of the Advisory Board of the |
| Principal Occupation(s) During the Past Five Years: | Maxwell School of Citizenship and Public Affairs |
| Chairman and Chief Executive Officer (retired 2009) | at Syracuse University. |
| | |
| F. Joseph Loughrey | Thomas J. Higgins | |
| Born 1949. Trustee Since October 2009. Principal | Born 1957. Chief Financial Officer Since September |
| Occupation(s) During the Past Five Years: President | 2008. Principal Occupation(s) During the Past Five |
| and Chief Operating Officer (retired 2009) and Vice | Years: Principal of The Vanguard Group, Inc.; Chief |
| Chairman of the Board (2008–2009) of Cummins Inc. | Financial Officer of each of the investment companies |
| (industrial machinery); Director of SKF AB (industrial | served by The Vanguard Group since 2008; Treasurer |
| machinery), Hillenbrand, Inc. (specialized consumer | of each of the investment companies served by The |
| services), the Lumina Foundation for Education, and | Vanguard Group (1998–2008). |
| Oxfam America; Chairman of the Advisory Council | | |
| for the College of Arts and Letters and Member | Kathryn J. Hyatt | |
| of the Advisory Board to the Kellogg Institute for | Born 1955. Treasurer Since November 2008. Principal |
| International Studies at the University of Notre Dame. | Occupation(s) During the Past Five Years: Principal |
| | of The Vanguard Group, Inc.; Treasurer of each of |
| André F. Perold | the investment companies served by The Vanguard |
| Born 1952. Trustee Since December 2004. Principal | Group since 2008; Assistant Treasurer of each of the |
| Occupation(s) During the Past Five Years: George | investment companies served by The Vanguard Group |
| Gund Professor of Finance and Banking at the Harvard | (1988–2008). | |
| Business School (retired July 2011); Chief Investment | | |
| Officer and co-Managing Partner of HighVista | Heidi Stam | |
| Strategies LLC (private investment firm); Director of | Born 1956. Secretary Since July 2005. Principal |
| Rand Merchant Bank; Overseer of the Museum of | Occupation(s) During the Past Five Years: Managing |
| Fine Arts Boston. | Director of The Vanguard Group, Inc., since 2006; |
| | General Counsel of The Vanguard Group since 2005; |
| Alfred M. Rankin, Jr. | Secretary of The Vanguard Group and of each of the |
| Born 1941. Trustee Since January 1993. Principal | investment companies served by The Vanguard Group |
| Occupation(s) During the Past Five Years: Chairman, | since 2005; Director and Senior Vice President of |
| President, and Chief Executive Officer of NACCO | Vanguard Marketing Corporation since 2005; |
| Industries, Inc. (forklift trucks/housewares/lignite); | Principal of The Vanguard Group (1997–2006). |
| Director of Goodrich Corporation (industrial products/ | | |
| aircraft systems and services) and the National | | |
| Association of Manufacturers; Chairman of the | Vanguard Senior Management Team |
| Federal Reserve Bank of Cleveland; Vice Chairman | | |
| of University Hospitals of Cleveland; President of | R. Gregory Barton | Chris D. McIsaac |
| the Board of The Cleveland Museum of Art. | Mortimer J. Buckley | Michael S. Miller |
| | Kathleen C. Gubanich | James M. Norris |
| Peter F. Volanakis | Paul A. Heller | Glenn W. Reed |
| Born 1955. Trustee Since July 2009. Principal | Martha G. King | George U. Sauter |
| Occupation(s) During the Past Five Years: President | | |
| and Chief Operating Officer (retired 2010) of Corning | | |
| Incorporated (communications equipment); Director of | Chairman Emeritus and Senior Advisor |
| Corning Incorporated (2000–2010) and Dow Corning | | |
| (2001–2010); Overseer of the Amos Tuck School of | John J. Brennan | |
| Business Administration at Dartmouth College. | Chairman, 1996–2009 | |
| | Chief Executive Officer and President, 1996–2008 |
| |
| Executive Officers | | |
| | Founder | |
| Glenn Booraem | | |
| Born 1967. Controller Since July 2010. Principal | John C. Bogle | |
| Occupation(s) During the Past Five Years: Principal | Chairman and Chief Executive Officer, 1974–1996 |
| of The Vanguard Group, Inc.; Controller of each of | | |
| the investment companies served by The Vanguard | | |
| Group since 2010; Assistant Controller of each of | | |
| the investment companies served by The Vanguard | | |
| Group (2001–2010). | | |
1 Mr. McNabb is considered an “interested person,” as defined in the Investment Company Act of 1940, because he is an officer of the Vanguard funds.
2 December 2002 for Vanguard Equity Income Fund, Vanguard Growth Equity Fund, the Vanguard Municipal Bond Funds, and the Vanguard State Tax-Exempt Funds.
|  |
| P.O. Box 2600 |
| Valley Forge, PA 19482-2600 |
Connect with Vanguard® > vanguard.com
| |
| Fund Information > 800-662-7447 | CFA® is a trademark owned by CFA Institute. |
| Direct Investor Account Services > 800-662-2739 | |
| Institutional Investor Services > 800-523-1036 | |
| Text Telephone for People | |
| With Hearing Impairment > 800-749-7273 | |
| |
| This material may be used in conjunction | |
| with the offering of shares of any Vanguard | |
| fund only if preceded or accompanied by | |
| the fund’s current prospectus. | |
| |
| All comparative mutual fund data are from Lipper Inc. or | |
| Morningstar, Inc., unless otherwise noted. | |
| |
| You can obtain a free copy of Vanguard’s proxy voting | |
| guidelines by visiting vanguard.com/proxyreporting or by | |
| calling Vanguard at 800-662-2739. The guidelines are | |
| also available from the SEC’s website, sec.gov. In | |
| addition, you may obtain a free report on how your fund | |
| voted the proxies for securities it owned during the 12 | |
| months ended June 30. To get the report, visit either | |
| vanguard.com/proxyreporting or sec.gov. | |
| |
| You can review and copy information about your fund at | |
| the SEC’s Public Reference Room in Washington, D.C. To | |
| find out more about this public service, call the SEC at | |
| 202-551-8090. Information about your fund is also | |
| available on the SEC’s website, and you can receive | |
| copies of this information, for a fee, by sending a | |
| request in either of two ways: via e-mail addressed to | |
| publicinfo@sec.gov or via regular mail addressed to the | |
| Public Reference Section, Securities and Exchange | |
| Commission, Washington, DC 20549-1520. | |
| |
| |
| | © 2011 The Vanguard Group, Inc. |
| | All rights reserved. |
| | Vanguard Marketing Corporation, Distributor. |
| |
| | Q9340 122011 |
Annual Report | October 31, 2011
Vanguard Mid-Cap Growth Fund
> Vanguard Mid-Cap Growth Fund returned 10.72% for the 12 months ended October 31, 2011.
> The fund outperformed its benchmark, the Russell Midcap Growth Index, and the average return of mid-cap growth funds.
> Strong stock selection in industrials, consumer staples, and materials helped the fund beat its benchmark.
| |
| Contents | |
| Your Fund’s Total Returns. | 1 |
| Chairman’s Letter. | 2 |
| Advisors’ Report. | 8 |
| Fund Profile. | 12 |
| Performance Summary. | 13 |
| Financial Statements. | 15 |
| Your Fund’s After-Tax Returns. | 26 |
| About Your Fund’s Expenses. | 27 |
| Glossary. | 29 |
Please note: The opinions expressed in this report are just that—informed opinions. They should not be considered promises or advice.
Also, please keep in mind that the information and opinions cover the period through the date on the front of this report. Of course, the risks of investing in your fund are spelled out in the prospectus.
See the Glossary for definitions of investment terms used in this report.
About the cover: Vanguard was named for the HMS Vanguard, flagship of British Admiral Horatio Nelson. A ship—whose performance and safety depend on the work of all hands—has served as a fitting metaphor for the Vanguard crew as we strive to help clients reach their financial goals.
Your Fund’s Total Returns
| |
| Fiscal Year Ended October 31, 2011 | |
| |
| | Total |
| | Returns |
| Vanguard Mid-Cap Growth Fund | 10.72% |
| Russell Midcap Growth Index | 10.08 |
| Mid-Cap Growth Funds Average | 8.00 |
| Mid-Cap Growth Funds Average: Derived from data provided by Lipper Inc. |
Your Fund’s Performance at a Glance
October 31, 2010 , Through October 31, 2011
| | | | |
| | | | Distributions Per Share |
| | Starting | Ending | Income | Capital |
| | Share Price | Share Price | Dividends | Gains |
| Vanguard Mid-Cap Growth Fund | $17.54 | $19.40 | $0.020 | $0.000 |
1

Chairman’s Letter
Dear Shareholder,
For the fiscal year ended October 31, 2011, Vanguard Mid-Cap Growth Fund returned 10.72%, ahead of its benchmark, the Russell Midcap Growth Index, and the average return of its peer funds.
The Mid-Cap Growth Fund benefited from the prevailing trends in the broad U.S. stock market throughout the year. Notably, growth stocks, especially the small- and mid-cap variety, fared considerably better than value stocks. The fund outperformed its market benchmark thanks in part to the advisors’ strong stock selection in the industrial, consumer staples, and materials sectors.
If you own shares of the fund in a taxable account, you may wish to review the information about after-tax returns presented later in this report.
A positive finish
to an anxious 12 months
U.S. stock indexes ended the 12 months with solid returns, though the gains were shadowed by anxiety in a volatile period. This turbulence was so pronounced, in fact, that a one-month change in the start date would have yielded a very different perspective on performance. For the 12months through October 31, the broad U.S. stock market returned 7.67%. For the 12 months ended September 30, however, the return was a mere 0.31%.
2
Volatility has been a theme in international markets, too. Global stock markets returned a combined –4.66% as stock prices retreated in Europe. Prices also fell in the Pacific region’s developed economies and emerging markets, where growth has moderated.
Unsteady yields reflected fast-changing sentiment
Taxable bonds produced strong returns and municipal bonds solid but unspectacular results, though as in the stock market, investor sentiment was volatile. The yield of the 10-year U.S. Treasury note, a benchmark for longer-term interest rates, began the 12 months at 2.61%, drifted higher as the economic expansion seemed to gather steam, then fluttered lower to close the period at 2.17%.
The decline in Treasury yields (and rise in prices) was driven by Europe’s sovereign-debt dramas, underwhelming economic reports, and a flight to safety that was prompted, paradoxically, by a rating agency’s decision to downgrade the U.S. government debt. Vanguard’s confidence in the full faith and credit of the U.S. Treasury remains unshaken.
Taxable investment-grade bonds returned 5.00% for the full 12 months. It’s important to note, of course, that as yields decline, the opportunity for similarly strong returns diminishes. The broad municipal market returned 3.78%. The returns on money market instruments hovered near 0%, consistent with the Federal Reserve Board’s target for short-term interest rates.
| | | |
| Market Barometer | | | |
| |
| | | Average Annual Total Returns |
| | | Periods Ended October 31, 2011 |
| | One | Three | Five |
| | Year | Years | Years |
| Stocks | | | |
| Russell 1000 Index (Large-caps) | 8.01% | 12.22% | 0.54% |
| Russell 2000 Index (Small-caps) | 6.71 | 12.87 | 0.68 |
| Dow Jones U.S. Total Stock Market Index | 7.67 | 12.58 | 0.90 |
| MSCI All Country World Index ex USA (International) | -4.66 | 12.92 | -0.37 |
| |
| Bonds | | | |
| Barclays Capital U.S. Aggregate Bond Index (Broad | | | |
| taxable market) | 5.00% | 8.87% | 6.41% |
| Barclays Capital Municipal Bond Index (Broad | | | |
| tax-exempt market) | 3.78 | 8.31 | 4.80 |
| Citigroup Three-Month U.S. Treasury Bill Index | 0.10 | 0.15 | 1.53 |
| |
| CPI | | | |
| Consumer Price Index | 3.53% | 1.49% | 2.33% |
3
Smaller sector holdings
drove the fund’s success
Vanguard Mid-Cap Growth Fund posted
strong returns in the first half of the fiscal
year, but then retreated as stock market
volatility spiked in the second half. In
October, markets suddenly surged upward
as European banks, at least temporarily,
seemed closer to reaching a deal with the
Greek government on ways to restructure
its debts. Despite the second-half setback,
mid-cap growth stocks managed to
generate double-digit gains for the full
12 months.
Six of the fund’s nine sectors (it didn’t hold any utilities, which tend to be larger companies) posted double-digit gains. Only two sectors turned in negative results.
The Mid-Cap Growth Fund typically focuses on four key sectors—information technology, consumer discretionary, industrials, and health care—which together represent about three quarters of its assets. Although these sectors produced generally strong absolute returns, much of the fund’s margin of advantage relative to the benchmark came from its investments in other areas.
On a relative basis, the fund’s top performers for the fiscal year were the industrial, consumer staples, and materials sectors. Industrials, which represented a little under a fifth of the fund’s assets, on average, during the period, returned more than 15%, roughly 9 percentage points more than the industrial stocks
Expense Ratios
Your Fund Compared With Its Peer Group
| | |
| | | Peer Group |
| | Fund | Average |
| Mid-Cap Growth Fund | 0.51% | 1.44% |
The fund expense ratio shown is from the prospectus dated February 24, 2011, and represents estimated costs for the current fiscal year. For the fiscal year ended October 31, 2011, the fund’s expense ratio was 0.53%. The peer-group expense ratio is derived from data provided by Lipper Inc. and captures information through year-end 2010.
Peer group: Mid-Cap Growth Funds.
4
in the benchmark. The fund’s holdings in aerospace and defense did best, as these stocks were lifted by merger-and-acquisition activity in the industry.
The consumer staples sector has a tiny portfolio weighting, but it produced the year’s highest sector return thanks to the fund’s substantial stake in a specialty coffee company. In materials, another small sector in the portfolio, the fund’s investment in specialty chemicals and industrial gas companies helped it produce benchmark-beating returns.
Health care was another area of strength relative to the benchmark. The fund’s pharmaceutical and health care technology stocks stood out. These companies benefited from increased demand for generic drugs and from the government’s push for greater use of electronic records as a way to reduce health care-related costs.
On the other hand, the fund’s large positions in information technology and consumer discretionary stocks trailed the returns of those sectors in the benchmark. The information technology sector, representing close to a quarter of the fund’s assets, on average, turned in one of the poorest results for the period. Tech stocks had started the fiscal year with impressive gains amid optimism that business investment was set to pick up. But the stocks surrendered those gains and more in the second half of the year, as economic indicators turned negative.
Total Returns
Ten Years Ended October 31, 2011
| |
| | Average |
| | Annual Return |
| Mid-Cap Growth Fund | 6.96% |
| Russell Midcap Growth Index | 6.98 |
| Mid-Cap Growth Funds Average | 5.05 |
| Mid-Cap Growth Funds Average: Derived from data provided by Lipper Inc. |
The figures shown represent past performance, which is not a guarantee of future results. (Current performance may be lower or higher than the performance data cited. For performance data current to the most recent month-end, visit our website at vanguard.com/performance.) Note, too, that both investment returns and principal value can fluctuate widely, so an investor’s shares, when sold, could be worth more or less than their original cost.
5
Consumer discretionary stocks delivered double-digit gains for the year, but trailed the benchmark in a few areas. The advisors’ selections among media companies fared poorly as advertisers and broadcasters struggled to cope with a slumping economy.
Financial stocks were the fund’s weakest performers. Poor selection in the investment banking and brokerage subsector weighed on the fund’s results.
The fund has performed solidly
throughout a turbulent decade
The Mid-Cap Growth Fund returned an average of 6.96% annually for the ten years ended October 31, 2011. As you can see in the table on page 5, the fund’s return was in line with that of its benchmark and better than the average return of peer funds. It’s a respectable long-term record given the turmoil in the stock markets over the past decade, including the financial crisis in 2008 and, more recently, the U.S. and European debt dramas.
The Mid-Cap Growth Fund has two advisors, each of which employs a fundamental stock selection methodology to identify midsized companies that have strong growth prospects. In addition to these advisors’ experience and skill, shareholders have benefited from the fund’s relatively low investment expenses. Keeping costs low, of course, helps you to keep more of your returns.
Diversification remains critical
amid volatile markets
As we’ve witnessed over the past year, stock markets can switch directions suddenly and without warning.
Such market volatility can be unsettling for investors, but it’s times like this that remind us how critical it is to maintain a well-balanced, diversified portfolio composed of stock, bond, and money market funds in proportions consistent with one’s goals, time horizon, and risk tolerance.
Recent Vanguard research* continues to show why diversification is important. One surprising finding: Over the past 85 years, a hypothetical portfolio made up of 50% stocks and 50% bonds would have produced statistically equivalent returns whether the U.S. economy was in or out of recession. Although we’d all like to see higher returns and a more stable marketplace, the simple fact is that diversified portfolios have provided reasonable returns through some incredible turmoil. Sticking with such a balanced portfolio through good times and bad has proved a productive approach.
* The commentary, Recessions and balanced portfolio returns, is available on vanguard.com.
6
It’s also important to diversify within an asset class, such as stocks; that way you get some access to whichever sectors or styles are in favor, and also some buffering when trends suddenly shift. Vanguard Mid-Cap Growth Fund, with its low costs and broad diversification among midsized companies with strong growth prospects, can play a useful role within the stock portion of a balanced portfolio.
Thank you for entrusting your assets to Vanguard.
Sincerely,

F. William McNabb III
Chairman and Chief Executive Officer
November 11, 2011
7
Advisors’ Report
During the fiscal year ended October 31, 2011, Vanguard Mid-Cap Growth Fund returned 10.72%. Your fund is managed by two independent advisors, a strategy that enhances the fund’s diversification by providing exposure to distinct, yet complementary, investment approaches. It’s not uncommon for different advisors to have different views about individual securities or the broader investment environment.
The advisors, the percentage of fund assets each manages, and brief descriptions of their investment strategies are presented in the table below. The advisors have also prepared a discussion of the investment environment that existed during the fiscal year and of how portfolio positioning reflects this assessment. These comments were prepared on November 18, 2011.
William Blair & Company, L.L.C.
Portfolio Managers:
Robert C. Lanphier, Principal
David Ricci, CFA, Principal
Although the Russell Midcap Growth Index gained a respectable 10.08% in our fiscal year, the months following July brought extreme volatility and price plunges. Investors reacted against a discouraging economic and political environment in the United States, elevated fears concerning European sovereign debt, and negative developments in China.
Vanguard Mid-Cap Growth Fund Investment Advisors
| | | |
| | Fund Assets Managed | |
| Investment Advisor | % | $ Million | Investment Strategy |
| William Blair & Company, L.L.C. | 49 | 881 | Uses a fundamental investment approach in pursuit of |
| | | | superior long-term investment results from |
| | | | growth-oriented companies with leadership positions |
| | | | and strong market presence. |
| Chartwell Investment Partners, | 48 | 870 | Uses a bottom-up, fundamental, research-driven |
| L.P. | | | stock-selection strategy focusing on companies with |
| | | | sustainable growth, strong management teams, |
| | | | competitive positions, and outstanding product and |
| | | | service offerings. These companies should continually |
| | | | demonstrate growth in earnings per share. |
| Cash Investments | 3 | 53 | These short-term reserves are invested by Vanguard in |
| | | | equity index products to simulate investment in stocks. |
| | | | Each advisor may also maintain a modest cash |
| | | | position. |
8
In this tumultuous environment, our portfolio benefited from strong stock selection, particularly in the consumer staples sector. Green Mountain Coffee Roasters, the single-cup coffee company, was our largest contributor both in absolute terms and relative to the benchmark for the 12-month period. Selection was also good in the industrial sector, where Fastenal (industrial supply distribution) and TransDigm (a supplier of engineered aircraft components) were the main contributors. Our picks among information technology and materials stocks also worked well.
On the other hand, stock selection in the consumer discretionary, energy, and financial sectors detracted from relative return. Weak performers included WMS Industries (slot machine manufacturer) and CarMax (used car retailer), both in the consumer discretionary sector, and Newfield Exploration (an oil and gas exploration firm) in the energy sector. Greenhill & Co. and Invesco were key detractors among financials.
Looking forward, one critical question is whether the deterioration in investor sentiment and the stock market’s volatility will translate into a decline in business confidence. If so, this could perpetuate lackluster hiring and capital expenditures along with the resulting domino effect on the rest of the economy. Such a crisis of confidence would be the biggest risk to corporate profits. Regarding the health of the global financial system, the European sovereign-debt problems and the uncertain prospects for emerging market growth are two of the largest macroeconomic risks.
Stock market valuations are attractive, however, and a reasonable amount of earnings deterioration has been priced in. Therefore, despite the heightened risk, we believe the market outlook remains balanced over the long haul, albeit with greater potential volatility in the short term.
For the long term, our philosophy remains steadfast. We seek to invest in quality growth companies that “control their own destiny” to a greater degree and are less dependent on overall economic growth than others. In the end, while we factor various economic scenarios into our stock-picking, we focus primarily on constructing the portfolio from a bottom-up perspective.
An indiscriminate sell-off across the entire market inevitably provides inefficiencies upon which we, as long-term investors, can capitalize. We continue to find good ideas across sectors, and we are confident that our portfolio consists of well-managed companies with solid competitive positions whose stocks are at attractive valuations compared to the growth and consistency of their business.
9
Chartwell Investment Partners, L.P.
Portfolio Managers:
Edward N. Antoian, CFA, CPA, Managing Partner
John A. Heffern, Managing Partner and Senior Portfolio Manager
Investment environment
The investment environment remains volatile as global financial markets wrestle with governments’ debt problems, decelerating corporate earnings, and the absence of international consensus on the way forward. Meanwhile, in the United States, it appears that the transition from government support and stimulus to fiscal discipline could have the effect of restraining near-term growth for the sake of securing our long-term economic foundation.
As tensions rise around the opposing forces, financial markets can seem to gyrate between relief and despair. Headlines, good and bad, are met with exaggerated market responses. This volatility leaves investors and corporations in a state of confusion over if, when, and where to invest. It argues for selectivity and for diversification, which should include continuing exposure to companies with long-term growth prospects that can eventually see them through the morass that is this unsettled financial market.
Against this backdrop, our portfolio decisions steadfastly reflect our bias toward quality, leadership, defensible profit margins, and a pattern of successful execution of growth-oriented business plans.
Successes. We had a number of stock selection successes within our top-performing sectors, industrials and health care. Goodrich, a supplier of aerospace components, systems, and services, was acquired by United Technologies to enhance its position in the aerospace and defense industry. We benefited from strength in specialty chemicals companies such as Airgas.
Watson Pharmaceuticals, a global specialty pharmaceuticals company with a major presence in the generics market, performed well thanks to its solid earnings, a strong product launch, and an earnings-enhancing acquisition. Overall, the company should continue to benefit from industry-wide tailwinds associated with long-term trends toward generic drugs.
Lastly, Ulta Salon, Cosmetics & Fragrance, a beauty-products retailer, experienced strong growth, meaningful margin expansion, and accelerating same-store sales despite the continuing worries within the consumer sectors about the level of Americans’ spending.
10
Shortfalls. The sectors detracting the most from performance were information technology and financial services. Earnings concerns led to some disappointments in technology, particularly among semiconductor companies (ON Semiconductor and NVIDIA) and telecommunications equipment makers (Polycom). Among our detractors in the financial sector were Assured Guaranty, which has been sold, and Affiliated Managers Group, which we still own.
In the consumer discretionary sector, Interpublic Group of Companies, an advertising agency that provides marketing, advertising, and media planning services, lagged its peers for a variety of reasons, including account losses that weighed on operating margins.
11
Mid-Cap Growth Fund
Fund Profile
As of October 31, 2011
| | | |
| Portfolio Characteristics | | |
| | | Russell | DJ |
| | | Midcap | U.S. Total |
| | | Growth | Market |
| | Fund | Index | Index |
| Number of Stocks | 122 | 469 | 3,749 |
| Median Market Cap | $6.4B | $7.8B | $30.4B |
| Price/Earnings Ratio | 22.7x | 19.9x | 14.9x |
| Price/Book Ratio | 3.4x | 3.6x | 2.1x |
| Return on Equity | 16.1% | 18.3% | 19.1% |
| Earnings Growth Rate 13.4% | 10.1% | 7.2% |
| Dividend Yield | 0.6% | 1.0% | 2.0% |
| Foreign Holdings | 2.8% | 0.0% | 0.0% |
| Turnover Rate | 127% | — | — |
| Ticker Symbol | VMGRX | — | — |
| Expense Ratio1 | 0.51% | — | — |
| 30-Day SEC Yield | 0.01% | — | — |
| Short-Term Reserves | 2.6% | — | — |
Sector Diversification (% of equity exposure)
| | | |
| | | Russell | DJ |
| | | Midcap | U.S. Total |
| | | Growth | Market |
| | Fund | Index | Index |
| Consumer | | | |
| Discretionary | 19.0% | 20.5% | 12.4% |
| Consumer Staples | 5.2 | 6.0 | 10.1 |
| Energy | 7.6 | 9.9 | 10.7 |
| Financials | 8.8 | 6.7 | 15.1 |
| Health Care | 14.2 | 13.2 | 11.1 |
| Industrials | 17.5 | 14.4 | 10.9 |
| Information | | | |
| Technology | 22.1 | 19.0 | 19.3 |
| Materials | 4.2 | 8.5 | 4.3 |
| Telecommunication | | | |
| Services | 1.3 | 1.5 | 2.6 |
| Utilities | 0.1 | 0.3 | 3.5 |
| | |
| Volatility Measures | | |
| | Russell | DJ |
| | Midcap | U.S. Total |
| | Growth | Market |
| | Index | Index |
| R-Squared | 0.97 | 0.91 |
| Beta | 0.90 | 0.96 |
These measures show the degree and timing of the fund’s fluctuations compared with the indexes over 36 months.
Ten Largest Holdings (% of total net assets)
| | |
| Airgas Inc. | Industrial Gases | 2.6% |
| TransDigm Group Inc. | Aerospace & | |
| | Defense | 2.2 |
| CarMax Inc. | Automotive Retail | 2.1 |
| Intercontinental | | |
| Exchange Inc. | Specialized Finance | 2.0 |
| Green Mountain Coffee | Packaged Foods & | |
| Roasters Inc. | Meats | 1.8 |
| Affiliated Managers | Asset Management | |
| Group Inc. | & Custody Banks | 1.7 |
| Mead Johnson Nutrition | Packaged Foods & | |
| Co. | Meats | 1.6 |
| Clean Harbors Inc. | Environmental & | |
| | Facilities Services | 1.6 |
| Silicon Laboratories Inc. | Semiconductors | 1.5 |
| Citrix Systems Inc. | Application | |
| | Software | 1.4 |
| Top Ten | | 18.5% |
The holdings listed exclude any temporary cash investments and equity index products.
Investment Focus
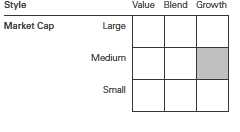
1 The expense ratio shown is from the prospectus dated February 24, 2011, and represents estimated costs for the current fiscal year. For the fiscal year ended October 31, 2011, the expense ratio was 0.53%.
12
Mid-Cap Growth Fund
Performance Summary
All of the returns in this report represent past performance, which is not a guarantee of future results that may be achieved by the fund. (Current performance may be lower or higher than the performance data cited. For performance data current to the most recent month-end, visit our website at vanguard.com/performance.) Note, too, that both investment returns and principal value can fluctuate widely, so an investor’s shares, when sold, could be worth more or less than their original cost. The returns shown do not reflect taxes that a shareholder would pay on fund distributions or on the sale of fund shares.
Cumulative Performance: October 31, 2001, Through October 31, 2011
Initial Investment of $10,000
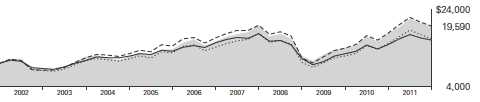
| | | | |
| | Average Annual Total Returns | |
| | Periods Ended October 31, 2011 | |
| | | | | Final Value |
| | One | Five | Ten | of a $10,000 |
| | Year | Years | Years | Investment |
| Mid-Cap Growth Fund | 10.72% | 4.59% | 6.96% | $19,590 |
| Dow Jones U.S. Total Stock Market | | | | |
| Index | 7.67 | 0.90 | 4.82 | 16,011 |
| Russell Midcap Growth Index | 10.08 | 3.46 | 6.98 | 19,636 |
| Mid-Cap Growth Funds Average | 8.00 | 2.89 | 5.05 | 16,364 |
Mid-Cap Growth Funds Average: Derived from data provided by Lipper Inc.
Fiscal-Year Total Returns (%): October 31, 2001, Through October 31, 2011
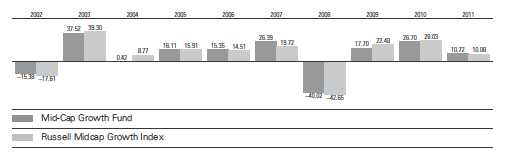
See Financial Highlights for dividend and capital gains information.
13
Mid-Cap Growth Fund
Average Annual Total Returns: Periods Ended September 30, 2011
This table presents returns through the latest calendar quarter—rather than through the end of the fiscal period.
Securities and Exchange Commission rules require that we provide this information.
| | | | |
| | Inception | One | Five | Ten |
| | Date | Year | Years | Years |
| Mid-Cap Growth Fund | 12/31/1997 | 3.20% | 2.89% | 6.26% |
14
Mid-Cap Growth Fund
Financial Statements
Statement of Net Assets
As of October 31, 2011
The fund reports a complete list of its holdings in regulatory filings four times in each fiscal year, at the quarter-ends. For the second and fourth fiscal quarters, the lists appear in the fund’s semiannual and annual reports to shareholders. For the first and third fiscal quarters, the fund files the lists with the Securities and Exchange Commission on Form N-Q. Shareholders can look up the fund’s Forms N-Q on the SEC’s website at sec.gov. Forms N-Q may also be reviewed and copied at the SEC’s Public Reference Room (see the back cover of this report for further information).
| | | |
| | | | Market |
| | | | Value |
| | | Shares | ($000) |
| Common Stocks (95.5%)1 | | |
| Consumer Discretionary (18.3%) | |
| * | CarMax Inc. | 1,264,445 | 38,009 |
| * | O’Reilly Automotive Inc. | 326,100 | 24,800 |
| * | Dick’s Sporting Goods Inc. | 613,525 | 23,983 |
| | Gentex Corp. | 680,600 | 20,500 |
| * | AutoZone Inc. | 56,725 | 18,356 |
| * | Bed Bath & Beyond Inc. | 267,300 | 16,530 |
| | Harman International | | |
| | Industries Inc. | 331,213 | 14,295 |
| | Tiffany & Co. | 177,470 | 14,150 |
| | Ross Stores Inc. | 155,180 | 13,614 |
| | Wyndham Worldwide Corp. | 393,260 | 13,241 |
| | Nordstrom Inc. | 243,700 | 12,353 |
| * | GNC Holdings Inc. Class A | 453,725 | 11,230 |
| * | Discovery | | |
| | Communications Inc. | | |
| | Class A | 249,550 | 10,845 |
| | Abercrombie & Fitch Co. | 138,650 | 10,315 |
| | Starwood Hotels & | | |
| | Resorts Worldwide Inc. | 193,005 | 9,671 |
| | Tractor Supply Co. | 124,645 | 8,842 |
| | Wynn Resorts Ltd. | 66,025 | 8,768 |
| | Family Dollar Stores Inc. | 148,520 | 8,708 |
| * | Chipotle Mexican Grill Inc. | | |
| | Class A | 23,375 | 7,857 |
| | VF Corp. | 56,740 | 7,843 |
| | Mattel Inc. | 257,425 | 7,270 |
| | Interpublic Group | | |
| | of Cos. Inc. | 750,295 | 7,113 |
| | Darden Restaurants Inc. | 108,437 | 5,192 |
| | DR Horton Inc. | 390,350 | 4,344 |
| * | Penn National Gaming Inc. | 115,670 | 4,164 |
| | Lennar Corp. Class A | 228,020 | 3,771 |
| * | Sally Beauty Holdings Inc. | 174,985 | 3,358 |
| | | | 329,122 |
| Consumer Staples (5.0%) | | |
| * | Green Mountain | | |
| | Coffee Roasters Inc. | 485,970 | 31,598 |
| | Mead Johnson Nutrition Co. | 406,357 | 29,196 |
| | | |
| | | | Market |
| | | | Value |
| | | Shares | ($000) |
| | McCormick & Co. Inc. | 281,400 | 13,665 |
| | Hershey Co. | 148,400 | 8,493 |
| | Herbalife Ltd. | 107,550 | 6,707 |
| | | | 89,659 |
| Energy (7.2%) | | |
| * | Cameron | | |
| | International Corp. | 388,200 | 19,076 |
| * | Oil States International Inc. | 270,260 | 18,813 |
| * | Southwestern Energy Co. | 371,400 | 15,614 |
| | Range Resources Corp. | 224,000 | 15,420 |
| * | Denbury Resources Inc. | 978,800 | 15,367 |
| * | Concho Resources Inc. | 127,075 | 12,037 |
| * | Whiting Petroleum Corp. | 253,835 | 11,816 |
| * | Key Energy Services Inc. | 876,350 | 11,331 |
| | Cabot Oil & Gas Corp. | 85,275 | 6,628 |
| * | FMC Technologies Inc. | 100,500 | 4,504 |
| | | | 130,606 |
| Exchange-Traded Fund (0.3%) | | |
| ^,2 | Vanguard Mid-Cap ETF | 82,700 | 6,089 |
| |
| Financials (8.1%) | | |
| * | IntercontinentalExchange | | |
| | Inc. | 274,268 | 35,622 |
| * | Affiliated Managers | | |
| | Group Inc. | 337,965 | 31,299 |
| | Discover Financial Services | 744,174 | 17,533 |
| | Webster Financial Corp. | 711,772 | 13,979 |
| | T Rowe Price Group Inc. | 249,700 | 13,194 |
| | Essex Property Trust Inc. | 86,145 | 12,298 |
| * | LPL Investment | | |
| | Holdings Inc. | 362,700 | 10,522 |
| | TD Ameritrade | | |
| | Holding Corp. | 474,600 | 7,964 |
| | Ares Capital Corp. | 283,400 | 4,384 |
| | | | 146,795 |
| Health Care (13.5%) | | |
| | Perrigo Co. | 275,850 | 24,904 |
| * | Watson | | |
| | Pharmaceuticals Inc. | 321,610 | 21,599 |
| * | Cerner Corp. | 326,206 | 20,691 |
15
| | | |
| Mid-Cap Growth Fund | | |
| |
| |
| |
| | | | Market |
| | | | Value |
| | | Shares | ($000) |
| * | HMS Holdings Corp. | 783,100 | 19,139 |
| * | IDEXX Laboratories Inc. | 225,655 | 16,245 |
| | AmerisourceBergen Corp. | | |
| | Class A | 394,235 | 16,085 |
| * | DaVita Inc. | 203,500 | 14,245 |
| * | Agilent Technologies Inc. | 378,715 | 14,039 |
| * | Sirona Dental Systems Inc. | 282,130 | 13,514 |
| | Humana Inc. | 145,500 | 12,352 |
| * | Illumina Inc. | 355,730 | 10,893 |
| * | Catalyst Health | | |
| | Solutions Inc. | 196,730 | 10,814 |
| * | CareFusion Corp. | 372,182 | 9,528 |
| * | ResMed Inc. | 296,100 | 8,380 |
| | Universal Health | | |
| | Services Inc. Class B | 185,150 | 7,400 |
| * | Intuitive Surgical Inc. | 14,925 | 6,475 |
| * | Mylan Inc. | 328,075 | 6,420 |
| * | Bruker Corp. | 263,435 | 3,801 |
| * | Mettler-Toledo | | |
| | International Inc. | 24,125 | 3,706 |
| * | SXC Health Solutions Corp. | 55,225 | 2,586 |
| * | Human Genome | | |
| | Sciences Inc. | 138,250 | 1,418 |
| | | | 244,234 |
| Industrials (16.7%) | | |
| * | TransDigm Group Inc. | 424,425 | 39,862 |
| * | Clean Harbors Inc. | 496,761 | 28,946 |
| | Fastenal Co. | 639,614 | 24,363 |
| | Gardner Denver Inc. | 311,160 | 24,062 |
| | Rockwell Automation Inc. | 290,400 | 19,645 |
| | Donaldson Co. Inc. | 272,175 | 17,433 |
| | AMETEK Inc. | 413,415 | 16,338 |
| * | United Rentals Inc. | 678,095 | 15,874 |
| * | Polypore International Inc. | 278,000 | 14,581 |
| * | Jacobs Engineering | | |
| | Group Inc. | 363,200 | 14,092 |
| * | Nielsen Holdings NV | 447,500 | 13,134 |
| * | WESCO International Inc. | 269,850 | 13,077 |
| | Timken Co. | 284,900 | 12,000 |
| * | Stericycle Inc. | 130,290 | 10,890 |
| | CH Robinson | | |
| | Worldwide Inc. | 144,600 | 10,040 |
| | Dover Corp. | 179,700 | 9,979 |
| | Expeditors International | | |
| | of Washington Inc. | 213,600 | 9,740 |
| ^ | Ritchie Bros | | |
| | Auctioneers Inc. | 341,061 | 6,801 |
| | | | 300,857 |
| Information Technology (21.1%) | |
| * | Silicon Laboratories Inc. | 643,485 | 27,509 |
| * | Citrix Systems Inc. | 357,900 | 26,066 |
| * | Trimble Navigation Ltd. | 599,421 | 24,223 |
| * | Cognizant Technology | | |
| | Solutions Corp. Class A | 332,425 | 24,184 |
| | Solera Holdings Inc. | 397,741 | 21,729 |
| * | MICROS Systems Inc. | 393,407 | 19,363 |
| | | |
| | | | Market |
| | | | Value |
| | | Shares | ($000) |
| * | Genpact Ltd. | 1,080,174 | 17,445 |
| | VeriSign Inc. | 511,900 | 16,427 |
| * | FleetCor Technologies Inc. | 564,660 | 15,788 |
| * | Informatica Corp. | 325,330 | 14,802 |
| | Amphenol Corp. Class A | 297,500 | 14,128 |
| | TE Connectivity Ltd. | 377,400 | 13,417 |
| | Intuit Inc. | 245,075 | 13,153 |
| | FLIR Systems Inc. | 471,000 | 12,387 |
| | Avago Technologies Ltd. | 355,780 | 12,015 |
| * | Cavium Inc. | 344,400 | 11,258 |
| | Cypress | | |
| | Semiconductor Corp. | 550,055 | 10,511 |
| * | Polycom Inc. | 602,951 | 9,967 |
| * | TIBCO Software Inc. | 340,300 | 9,831 |
| * | Fiserv Inc. | 161,900 | 9,531 |
| * | Concur Technologies Inc. | 195,757 | 9,107 |
| | Activision Blizzard Inc. | 666,275 | 8,921 |
| * | Ariba Inc. | 267,342 | 8,469 |
| * | VeriFone Systems Inc. | 168,700 | 7,121 |
| | Altera Corp. | 180,450 | 6,843 |
| * | Teradata Corp. | 89,550 | 5,343 |
| * | ANSYS Inc. | 82,700 | 4,496 |
| * | Nuance | | |
| | Communications Inc. | 161,150 | 4,267 |
| * | Acme Packet Inc. | 61,750 | 2,236 |
| | | | 380,537 |
| Materials (4.0%) | | |
| | Airgas Inc. | 690,140 | 47,585 |
| | Ecolab Inc. | 451,010 | 24,283 |
| | | | 71,868 |
| Telecommunication Services (1.3%) | |
| * | SBA Communications | | |
| | Corp. Class A | 602,100 | 22,934 |
| Total Common Stocks | | |
| (Cost $1,476,379) | | 1,722,701 |
| Temporary Cash Investments (5.6%)1 | |
| Money Market Fund (5.2%) | | |
| 3,4 | Vanguard Market | | |
| | Liquidity Fund, | | |
| | 0.128% | 93,834,151 | 93,834 |
16
| | | |
| Mid-Cap Growth Fund | | |
| |
| |
| |
| | | Face | Market |
| | | Amount | Value |
| | | ($000) | ($000) |
| U.S. Government and Agency Obligations (0.4%) |
| 5,6 | Fannie Mae | | |
| | Discount Notes, | | |
| | 0.050%, 12/5/11 | 2,500 | 2,500 |
| 5 | Fannie Mae | | |
| | Discount Notes, | | |
| | 0.045%, 12/14/11 | 2,630 | 2,629 |
| 5,6 | Fannie Mae | | |
| | Discount Notes, | | |
| | 0.025%, 12/28/11 | 200 | 200 |
| 6,7 | Federal Home Loan | | |
| | Bank Discount Notes, | | |
| | 0.025%, 12/2/11 | 300 | 300 |
| 6,7 | Federal Home Loan | | |
| | Bank Discount Notes, | | |
| | 0.040%, 1/27/12 | 500 | 500 |
| 5,6 | Freddie Mac Discount | | |
| | Notes, 0.050%, 12/15/11 | 110 | 110 |
| 5,6 | Freddie Mac Discount | | |
| | Notes, 0.035%, 12/27/11 | 100 | 100 |
| | | | 6,339 |
| Total Temporary Cash Investments | |
| (Cost $100,174) | | 100,173 |
| Total Investments (101.1%) | | |
| (Cost $1,576,553) | | 1,822,874 |
| Other Assets and Liabilities (-1.1%) | |
| Other Assets | | 20,901 |
| Liabilities4 | | (40,172) |
| | | | (19,271) |
| Net Assets (100%) | | |
| Applicable to 92,987,549 outstanding | |
| $.001 par value shares of beneficial | |
| interest (unlimited authorization) | 1,803,603 |
| Net Asset Value Per Share | | $19.40 |
| |
| At October 31, 2011, net assets consisted of: |
| | Amount |
| | ($000) |
| Paid-in Capital | 1,526,821 |
| Overdistributed Net Investment Income | (456) |
| Accumulated Net Realized Gains | 27,750 |
| Unrealized Appreciation (Depreciation) | |
| Investment Securities | 246,321 |
| Futures Contracts | 3,167 |
| Net Assets | 1,803,603 |
See Note A in Notes to Financial Statements.
* Non-income-producing security.
^ Part of security position is on loan to broker-dealers. The total value of securities on loan is $6,020,000.
1 The fund invests a portion of its cash reserves in equity markets through the use of index futures contracts. After giving effect to futures investments, the fund’s effective common stock and temporary cash investment positions represent 98.1% and 3.0%, respectively, of net assets.
2 Considered an affiliated company of the fund as the issuer is another member of The Vanguard Group.
3 Affiliated money market fund available only to Vanguard funds and certain trusts and accounts managed by Vanguard. Rate shown is the 7-day yield.
4 Includes $6,402,000 of collateral received for securities on loan.
5 The issuer is under federal conservatorship and is dependent upon the continued support of the U.S. Treasury to avoid receivership.
6 Securities with a value of $3,460,000 have been segregated as initial margin for open futures contracts.
7 The issuer operates under a congressional charter; its securities are not backed by the full faith and credit of the U.S. government.
See accompanying Notes, which are an integral part of the Financial Statements.
17
Mid-Cap Growth Fund
Statement of Operations
| |
| | Year Ended |
| | October 31, 2011 |
| | ($000) |
| Investment Income | |
| Income | |
| Dividends1 | 12,738 |
| Interest1 | 159 |
| Security Lending | 40 |
| Total Income | 12,937 |
| Expenses | |
| Investment Advisory Fees—Note B | |
| Basic Fee | 4,038 |
| Performance Adjustment | 235 |
| The Vanguard Group—Note C | |
| Management and Administrative | 4,682 |
| Marketing and Distribution | 435 |
| Custodian Fees | 44 |
| Auditing Fees | 29 |
| Shareholders’ Reports | 34 |
| Trustees’ Fees and Expenses | 4 |
| Total Expenses | 9,501 |
| Expenses Paid Indirectly | (101) |
| Net Expenses | 9,400 |
| Net Investment Income | 3,537 |
| Realized Net Gain (Loss)1 | |
| Investment Securities Sold | 254,892 |
| Futures Contracts | (1,886) |
| Realized Net Gain (Loss) | 253,006 |
| Change in Unrealized Appreciation (Depreciation) | |
| Investment Securities | (102,830) |
| Futures Contracts | 339 |
| Change in Unrealized Appreciation (Depreciation) | (102,491) |
| Net Increase (Decrease) in Net Assets Resulting from Operations | 154,052 |
1 Dividend income, interest income, and realized net gain (loss) from affiliated companies of the fund were $73,000, $147,000, and $0, respectively.
See accompanying Notes, which are an integral part of the Financial Statements.
18
Mid-Cap Growth Fund
Statement of Changes in Net Assets
| | |
| | Year Ended October 31, |
| | 2011 | 2010 |
| | ($000) | ($000) |
| Increase (Decrease) in Net Assets | | |
| Operations | | |
| Net Investment Income | 3,537 | 63 |
| Realized Net Gain (Loss) | 253,006 | 144,225 |
| Change in Unrealized Appreciation (Depreciation) | (102,491) | 181,054 |
| Net Increase (Decrease) in Net Assets Resulting from Operations | 154,052 | 325,342 |
| Distributions | | |
| Net Investment Income | (1,806) | (1,593) |
| Realized Capital Gain | — | — |
| Total Distributions | (1,806) | (1,593) |
| Capital Share Transactions | | |
| Issued | 603,585 | 315,543 |
| Issued in Lieu of Cash Distributions | 1,759 | 1,550 |
| Redeemed | (515,747) | (307,588) |
| Net Increase (Decrease) from Capital Share Transactions | 89,597 | 9,505 |
| Total Increase (Decrease) | 241,843 | 333,254 |
| Net Assets | | |
| Beginning of Period | 1,561,760 | 1,228,506 |
| End of Period1 | 1,803,603 | 1,561,760 |
1 Net Assets—End of Period includes undistributed (overdistributed) net investment income of ($456,000) and ($1,753,000).
See accompanying Notes, which are an integral part of the Financial Statements.
19
Mid-Cap Growth Fund
Financial Highlights
| | | | | |
| For a Share Outstanding | | | Year Ended October 31, |
| Throughout Each Period | 2011 | 2010 | 2009 | 2008 | 2007 |
| Net Asset Value, Beginning of Period | $17.54 | $13.86 | $11.82 | $20.90 | $19.12 |
| Investment Operations | | | | | |
| Net Investment Income | .0401 | .001 | .0212 | .035 | .044 |
| Net Realized and Unrealized Gain (Loss) | | | | | |
| on Investments | 1.840 | 3.697 | 2.059 | (8.024) | 4.455 |
| Total from Investment Operations | 1.880 | 3.698 | 2.080 | (7.989) | 4.499 |
| Distributions | | | | | |
| Dividends from Net Investment Income | (.020) | (.018) | (.040) | (.045) | (.044) |
| Distributions from Realized Capital Gains | — | — | — | (1.046) | (2.675) |
| Total Distributions | (.020) | (.018) | (.040) | (1.091) | (2.719) |
| Net Asset Value, End of Period | $19.40 | $17.54 | $13.86 | $11.82 | $20.90 |
| |
| Total Return3 | 10.72% | 26.70% | 17.70% | -40.02% | 26.39% |
| |
| Ratios/Supplemental Data | | | | | |
| Net Assets, End of Period (Millions) | $1,804 | $1,562 | $1,229 | $881 | $1,289 |
| Ratio of Total Expenses to | | | | | |
| Average Net Assets4 | 0.53% | 0.51% | 0.60% | 0.55% | 0.56% |
| Ratio of Net Investment Income to | | | | | |
| Average Net Assets | 0.20%1 | 0.00% | 0.16%2 | 0.20% | 0.27% |
| Portfolio Turnover Rate | 127% | 88% | 125% | 85% | 70% |
1 Net investment income per share and the ratio of net investment income to average net assets include $0.02 and 0.11%, respectively, resulting from a special dividend from Verisign Inc. in December 2010.
2 Net investment income per share and the ratio of net investment income to average net assets include $0.02 and 0.19%, respectively, resulting from a special dividend from TransDigm Group Inc. in October 2009.
3 Total returns do not include account service fees that may have applied in the periods shown. Fund prospectuses provide information about any applicable account service fees.
4 Includes performance-based investment advisory fee increases (decreases) of 0.01%, (0.01%), 0.02%, 0.03%, and 0.03%.
See accompanying Notes, which are an integral part of the Financial Statements.
20
Mid-Cap Growth Fund
Notes to Financial Statements
Vanguard Mid-Cap Growth Fund is registered under the Investment Company Act of 1940 as an open-end investment company, or mutual fund.
A. The following significant accounting policies conform to generally accepted accounting principles for U.S. mutual funds. The fund consistently follows such policies in preparing its financial statements.
1. Security Valuation: Securities are valued as of the close of trading on the New York Stock Exchange (generally 4 p.m., Eastern time) on the valuation date. Equity securities are valued at the latest quoted sales prices or official closing prices taken from the primary market in which each security trades; such securities not traded on the valuation date are valued at the mean of the latest quoted bid and asked prices. Securities for which market quotations are not readily available, or whose values have been materially affected by events occurring before the fund’s pricing time but after the close of the securities’ primary markets, are valued by methods deemed by the board of trustees to represent fair value. Investments in Vanguard Market Liquidity Fund are valued at that fund’s net asset value. Temporary cash investments acquired over 60 days to maturity are valued using the latest bid prices or using valuations based on a matrix system (which considers such factors as security prices, yields, maturities, and ratings), both as furnished by independent pricing services. Other temporary cash investments are valued at amortized cost, which approximates market value.
2. Futures Contracts: The fund uses index futures contracts to a limited extent, with the objective of maintaining full exposure to the stock market while maintaining liquidity. The fund may purchase or sell futures contracts to achieve a desired level of investment, whether to accommodate portfolio turnover or cash flows from capital share transactions. The primary risks associated with the use of futures contracts are imperfect correlation between changes in market values of stocks held by the fund and the prices of futures contracts, and the possibility of an illiquid market.
Futures contracts are valued at their quoted daily settlement prices. The aggregate principal amounts of the contracts are not recorded in the Statement of Net Assets. Fluctuations in the value of the contracts are recorded in the Statement of Net Assets as an asset (liability) and in the Statement of Operations as unrealized appreciation (depreciation) until the contracts are closed, when they are recorded as realized futures gains (losses).
3. Federal Income Taxes: The fund intends to continue to qualify as a regulated investment company and distribute all of its taxable income. Management has analyzed the fund’s tax positions taken for all open federal income tax years (October 31, 2008–2011), and has concluded that no provision for federal income tax is required in the fund’s financial statements.
4. Distributions: Distributions to shareholders are recorded on the ex-dividend date.
5. Security Lending: The fund may lend its securities to qualified institutional borrowers to earn additional income. Security loans are required to be secured at all times by collateral at least equal to the market value of securities loaned. The fund invests cash collateral received in Vanguard Market Liquidity Fund, and records a liability for the return of the collateral, during the period the securities are on loan. Security lending income represents fees charged to borrowers plus income earned on investing cash collateral, less expenses associated with the loan.
21
Mid-Cap Growth Fund
6. Other: Dividend income is recorded on the ex-dividend date. Interest income includes income distributions received from Vanguard Market Liquidity Fund and is accrued daily. Security transactions are accounted for on the date securities are bought or sold. Costs used to determine realized gains (losses) on the sale of investment securities are those of the specific securities sold.
B. William Blair & Company, L.L.C., and Chartwell Investment Partners, L.P., each provide investment advisory services to a portion of the fund for a fee calculated at an annual percentage rate of average net assets managed by the advisor. The basic fee for William Blair & Company, L.L.C., is subject to quarterly adjustments based on performance for the preceding five years relative to the Russell Midcap Growth Index. The basic fee for Chartwell Investment Partners, L.P., is subject to quarterly adjustments based on performance for the preceding three years relative to the Russell Midcap Growth Index.
The Vanguard Group manages the cash reserves of the fund on an at-cost basis.
For the year ended October 31, 2011, the aggregate investment advisory fee represented an effective annual basic rate of 0.22% of the fund’s average net assets, before an increase of $235,000 (0.01%) based on performance.
C. The Vanguard Group furnishes at cost corporate management, administrative, marketing, and distribution services. The costs of such services are allocated to the fund under methods approved by the board of trustees. The fund has committed to provide up to 0.40% of its net assets in capital contributions to Vanguard. At October 31, 2011, the fund had contributed capital of $280,000 to Vanguard (included in Other Assets), representing 0.02% of the fund’s net assets and 0.11% of Vanguard’s capitalization. The fund’s trustees and officers are also directors and officers of Vanguard.
D. The fund has asked its investment advisors to direct certain security trades, subject to obtaining the best price and execution, to brokers who have agreed to rebate to the fund part of the commissions generated. Such rebates are used solely to reduce the fund’s management and administrative expenses. For the year ended October 31, 2011, these arrangements reduced the fund’s expenses by $101,000 (an annual rate of 0.01% of average net assets).
E. Various inputs may be used to determine the value of the fund’s investments. These inputs are summarized in three broad levels for financial statement purposes. The inputs or methodologies used to value securities are not necessarily an indication of the risk associated with investing in those securities.
Level 1—Quoted prices in active markets for identical securities.
Level 2—Other significant observable inputs (including quoted prices for similar securities, interest rates, prepayment speeds, credit risk, etc.).
Level 3—Significant unobservable inputs (including the fund’s own assumptions used to determine the fair value of investments).
22
Mid-Cap Growth Fund
The following table summarizes the market value of the fund’s investments as of October 31, 2011, based on the inputs used to value them:
| | | |
| | Level 1 | Level 2 | Level 3 |
| Investments | ($000) | ($000) | ($000) |
| Common Stocks | 1,722,701 | — | — |
| Temporary Cash Investments | 93,834 | 6,339 | — |
| Futures Contracts—Liabilities1 | (1,209) | — | — |
| Total | 1,815,326 | 6,339 | — |
| 1 Represents variation margin on the last day of the reporting period. |
F. At October 31, 2011, the aggregate settlement value of open futures contracts and the related unrealized appreciation (depreciation) were:
| | | | |
| | | | | ($000) |
| | | | Aggregate | |
| | | Number of | Settlement | Unrealized |
| | | Long (Short) | Value | Appreciation |
| Futures Contracts | Expiration | Contracts | Long (Short) | (Depreciation) |
| E-mini S&P MidCap 400 Index | December 2011 | 399 | 35,355 | 2,258 |
| E-mini Russell 2000 Index | December 2011 | 148 | 10,942 | 909 |
Unrealized appreciation (depreciation) on open futures contracts is required to be treated as realized gain (loss) for tax purposes.
G. Distributions are determined on a tax basis and may differ from net investment income and realized capital gains for financial reporting purposes. Differences may be permanent or temporary. Permanent differences are reclassified among capital accounts in the financial statements to reflect their tax character. Temporary differences arise when certain items of income, expense, gain, or loss are recognized in different periods for financial statement and tax purposes; these differences will reverse at some time in the future. Differences in classification may also result from the treatment of short-term gains as ordinary income for tax purposes.
The fund used a tax accounting practice to treat a portion of the price of capital shares redeemed during the year as distributions from net investment income and realized capital gains. Accordingly, the fund has reclassified $434,000 from overdistributed net investment income, and $4,624,000 from accumulated net realized gains, to paid-in capital.
The fund used a capital loss carryforward of $217,146,000 to offset taxable capital gains realized during the year ended October 31, 2011, reducing the amount of capital gains that would otherwise be available to distribute to shareholders. For tax purposes, at October 31, 2011, the fund had $2,350,000 of ordinary income and $32,997,000 of long-term capital gains available for distribution.
23
Mid-Cap Growth Fund
At October 31, 2011, the cost of investment securities for tax purposes was $1,578,458,000.
Net unrealized appreciation of investment securities for tax purposes was $244,416,000, consisting of unrealized gains of $293,225,000 on securities that had risen in value since their purchase and $48,809,000 in unrealized losses on securities that had fallen in value since their purchase.
H. During the year ended October 31, 2011, the fund purchased $2,277,799,000 of investment securities and sold $2,174,513,000 of investment securities, other than temporary cash investments.
I. Capital shares issued and redeemed were:
| | |
| | Year Ended October 31, |
| | 2011 | 2010 |
| | Shares | Shares |
| | (000) | (000) |
| Issued | 30,883 | 20,103 |
| Issued in Lieu of Cash Distributions | 93 | 104 |
| Redeemed | (27,015) | (19,798) |
| Net Increase (Decrease) in Shares Outstanding | 3,961 | 409 |
J. In preparing the financial statements as of October 31, 2011, management considered the impact of subsequent events for potential recognition or disclosure in these financial statements.
24
Report of Independent Registered
Public Accounting Firm
To the Trustees of Vanguard Whitehall Funds and the Shareholders of Vanguard Mid-Cap Growth Fund:
In our opinion, the accompanying statement of net assets and the related statements of operations and of changes in net assets and the financial highlights present fairly, in all material respects, the financial position of Vanguard Mid-Cap Growth Fund (constituting a separate portfolio of Vanguard Whitehall Funds, hereafter referred to as the “Fund”) at October 31, 2011, the results of its operations for the year then ended, the changes in its net assets for each of the two years in the period then ended and the financial highlights for each of the five years in the period then ended, in conformity with accounting principles generally accepted in the United States of America. These financial statements and financial highlights (hereafter referred to as “financial statements”) are the responsibility of the Fund’s management; our responsibility is to express an opinion on these financial statements based on our audits. We conducted our audits of these financial statements in accordance with the standards of the Public Company Accounting Oversight Board (United States). Those standards require that we plan and perform the audit to obtain reasonable assurance about whether the financial statements are free of material misstatement. An audit includes examining, on a test basis, evidence supporting the amounts and disclosures in the financial statements, assessing the accounting principles used and significant estimates made by management, and evaluating the overall financial statement presentation. We believe that our audits, which included confirmation of securities at October 31, 2011 by correspondence with the custodian and broker and by agreement to the underlying ownership records of Vanguard Market Liquidity Fund, provide a reasonable basis for our opinion.
PricewaterhouseCoopers LLP
Philadelphia, Pennsylvania
December 12, 2011
|
| Special 2011 tax information (unaudited) for Vanguard Mid-Cap Growth Fund |
This information for the fiscal year ended October 31, 2011, is included pursuant to provisions of the Internal Revenue Code.
The fund distributed $4,624,000 as capital gain dividends (from net long-term capital gains) to shareholders during the fiscal year.
The fund distributed $1,806,000 of qualified dividend income to shareholders during the fiscal year.
For corporate shareholders, 100% of investment income (dividend income plus short-term gains, if any) qualifies for the dividends-received deduction.
25
Your Fund’s After-Tax Returns
This table presents returns for your fund both before and after taxes. The after-tax returns are shown in two ways: (1) assuming that an investor owned the fund during the entire period and paid taxes on the fund’s distributions, and (2) assuming that an investor paid taxes on the fund’s distributions and sold all shares at the end of each period.
Calculations are based on the highest individual federal income tax and capital gains tax rates in effect at the times of the distributions and the hypothetical sales. State and local taxes were not considered. After-tax returns reflect any qualified dividend income, using actual prior-year figures and estimates for 2011. (In the example, returns after the sale of fund shares may be higher than those assuming no sale. This occurs when the sale would have produced a capital loss. The calculation assumes that the investor received a tax deduction for the loss.)
Please note that your actual after-tax returns will depend on your tax situation and may differ from those shown. Also note that if you own the fund in a tax-deferred account, such as an individual retirement account or a 401(k) plan, this information does not apply to you. Such accounts are not subject to current taxes.
Finally, keep in mind that a fund’s performance—whether before or after taxes—does not guarantee future results.
Average Annual Total Returns: Mid-Cap Growth Fund
Periods Ended October 31, 2011
| | | |
| | One | Five | Ten |
| | Year | Years | Years |
| Returns Before Taxes | 10.72% | 4.59% | 6.96% |
| Returns After Taxes on Distributions | 10.70 | 3.81 | 6.55 |
| Returns After Taxes on Distributions and Sale of Fund Shares | 6.99 | 3.72 | 6.02 |
26
About Your Fund’s Expenses
As a shareholder of the fund, you incur ongoing costs, which include costs for portfolio management, administrative services, and shareholder reports (like this one), among others. Operating expenses, which are deducted from a fund’s gross income, directly reduce the investment return of the fund.
A fund’s expenses are expressed as a percentage of its average net assets. This figure is known as the expense ratio. The following examples are intended to help you understand the ongoing costs (in dollars) of investing in your fund and to compare these costs with those of other mutual funds. The examples are based on an investment of $1,000 made at the beginning of the period shown and held for the entire period.
The accompanying table illustrates your fund’s costs in two ways:
• Based on actual fund return. This section helps you to estimate the actual expenses that you paid over the period. The ”Ending Account Value“ shown is derived from the fund‘s actual return, and the third column shows the dollar amount that would have been paid by an investor who started with $1,000 in the fund. You may use the information here, together with the amount you invested, to estimate the expenses that you paid over the period.
To do so, simply divide your account value by $1,000 (for example, an $8,600 account value divided by $1,000 = 8.6), then multiply the result by the number given for your fund under the heading ”Expenses Paid During Period.“
• Based on hypothetical 5% yearly return. This section is intended to help you compare your fund‘s costs with those of other mutual funds. It assumes that the fund had a yearly return of 5% before expenses, but that the expense ratio is unchanged. In this case—because the return used is not the fund’s actual return—the results do not apply to your investment. The example is useful in making comparisons because the Securities and Exchange Commission requires all mutual funds to calculate expenses based on a 5% return. You can assess your fund’s costs by comparing this hypothetical example with the hypothetical examples that appear in shareholder reports of other funds.
Note that the expenses shown in the table are meant to highlight and help you compare ongoing costs only and do not reflect transaction costs incurred by the fund for buying and selling securities. Further, the expenses do not include any purchase, redemption, or account service fees described in the fund prospectus. If such fees were applied to your account, your costs would be higher. Your fund does not carry a “sales load.”
The calculations assume no shares were bought or sold during the period. Your actual costs may have been higher or lower, depending on the amount of your investment and the timing of any purchases or redemptions.
You can find more information about the fund’s expenses, including annual expense ratios, in the Financial Statements section of this report. For additional information on operating expenses and other shareholder costs, please refer to your fund’s current prospectus.
27
| | | |
| Six Months Ended October 31, 2011 | | | |
| | Beginning | Ending | Expenses |
| | Account Value | Account Value | Paid During |
| Mid-Cap Growth Fund | 4/30/2011 | 10/31/2011 | Period |
| Based on Actual Fund Return | $1,000.00 | $912.08 | $2.60 |
| Based on Hypothetical 5% Yearly Return | 1,000.00 | 1,022.48 | 2.75 |
The calculations are based on expenses incurred in the most recent six-month period. The fund’s annualized six-month expense ratio for that period is 0.54%. The dollar amounts shown as “Expenses Paid” are equal to the annualized expense ratio multiplied by the average account value over the period, multiplied by the number of days in the most recent six-month period, then divided by the number of days in the most recent 12-month period.
28
Glossary
30-Day SEC Yield. A fund’s 30-day SEC yield is derived using a formula specified by the U.S. Securities and Exchange Commission. Under the formula, data related to the fund’s security holdings in the previous 30 days are used to calculate the fund’s hypothetical net income for that period, which is then annualized and divided by the fund’s estimated average net assets over the calculation period. For the purposes of this calculation, a security’s income is based on its current market yield to maturity (for bonds; excluding inflation for inflation-protected securities), its actual income (for asset-backed securities), or its projected dividend yield (for stocks). Because the SEC yield represents hypothetical annualized income, it will differ—at times significantly—from the fund’s actual experience. As a result, the fund’s income distributions may be higher or lower than implied by the SEC yield.
Beta. A measure of the magnitude of a fund’s past share-price fluctuations in relation to the ups and downs of a given market index. The index is assigned a beta of 1.00. Compared with a given index, a fund with a beta of 1.20 typically would have seen its share price rise or fall by 12% when the index rose or fell by 10%. For this report, beta is based on returns over the past 36 months for both the fund and the index. Note that a fund’s beta should be reviewed in conjunction with its R-squared (see definition). The lower the R-squared, the less correlation there is between the fund and the index, and the less reliable beta is as an indicator of volatility.
Dividend Yield. Dividend income earned by stocks, expressed as a percentage of the aggregate market value (or of net asset value, for a fund). The yield is determined by dividing the amount of the annual dividends by the aggregate value (or net asset value) at the end of the period. For a fund, the dividend yield is based solely on stock holdings and does not include any income produced by other investments.
Earnings Growth Rate. The average annual rate of growth in earnings over the past five years for the stocks now in a fund.
Equity Exposure. A measure that reflects a fund’s investments in stocks and stock futures. Any holdings in short-term reserves are excluded.
Expense Ratio. The percentage of a fund’s average net assets used to pay its annual administrative and advisory expenses. These expenses directly reduce returns to investors.
Foreign Holdings. The percentage of a fund represented by securities or depositary receipts of companies based outside the United States.
Inception Date. The date on which the assets of a fund (or one of its share classes) are first invested in accordance with the fund’s investment objective. For funds with a subscription period, the inception date is the day after that period ends. Investment performance is measured from the inception date.
Median Market Cap. An indicator of the size of companies in which a fund invests; the midpoint of market capitalization (market price x shares outstanding) of a fund’s stocks, weighted by the proportion of the fund’s assets invested in each stock. Stocks representing half of the fund’s assets have market capitalizations above the median, and the rest are below it.
Price/Book Ratio. The share price of a stock divided by its net worth, or book value, per share. For a fund, the weighted average price/book ratio of the stocks it holds.
29
Price/Earnings Ratio. The ratio of a stock’s current price to its per-share earnings over the past year. For a fund, the weighted average P/E of the stocks it holds. P/E is an indicator of market expectations about corporate prospects; the higher the P/E, the greater the expectations for a company’s future growth.
R-Squared. A measure of how much of a fund’s past returns can be explained by the returns from the market in general, as measured by a given index. If a fund’s total returns were precisely synchronized with an index’s returns, its R-squared would be 1.00. If the fund’s returns bore no relationship to the index’s returns, its R-squared would be 0. For this report, R-squared is based on returns over the past 36 months for both the fund and the index.
Return on Equity. The annual average rate of return generated by a company during the past five years for each dollar of shareholder’s equity (net income divided by shareholder’s equity). For a fund, the weighted average return on equity for the companies whose stocks it holds.
Short-Term Reserves. The percentage of a fund invested in highly liquid, short-term securities that can be readily converted to cash.
Turnover Rate. An indication of the fund’s trading activity. Funds with high turnover rates incur higher transaction costs and may be more likely to distribute capital gains (which may be taxable to investors). The turnover rate excludes in-kind transactions, which have minimal impact on costs.
30
This page intentionally left blank.
The People Who Govern Your Fund
The trustees of your mutual fund are there to see that the fund is operated and managed in your best interests since, as a shareholder, you are a part owner of the fund. Your fund’s trustees also serve on the board of directors of The Vanguard Group, Inc., which is owned by the Vanguard funds and provides services to them on an at-cost basis.
A majority of Vanguard’s board members are independent, meaning that they have no affiliation with Vanguard or the funds they oversee, apart from the sizable personal investments they have made as private individuals. The independent board members have distinguished backgrounds in business, academia, and public service. Each of the trustees and executive officers oversees 180 Vanguard funds.
The following table provides information for each trustee and executive officer of the fund. More information about the trustees is in the Statement of Additional Information, which can be obtained, without charge, by contacting Vanguard at 800-662-7447, or online at vanguard.com.
| |
| Interested Trustee1 | and President (2006–2008) of Rohm and Haas Co. |
| | (chemicals); Director of Tyco International, Ltd. |
| F. William McNabb III | (diversified manufacturing and services) and Hewlett- |
| Born 1957. Trustee Since July 2009. Chairman of the | Packard Co. (electronic computer manufacturing); |
| Board. Principal Occupation(s) During the Past Five | Senior Advisor at New Mountain Capital; Trustee |
| Years: Chairman of the Board of The Vanguard Group, | of The Conference Board; Member of the Board of |
| Inc., and of each of the investment companies served | Managers of Delphi Automotive LLP (automotive |
| by The Vanguard Group, since January 2010; Director | components). |
| of The Vanguard Group since 2008; Chief Executive | |
| Officer and President of The Vanguard Group and of | Amy Gutmann |
| each of the investment companies served by The | Born 1949. Trustee Since June 2006. Principal |
| Vanguard Group since 2008; Director of Vanguard | Occupation(s) During the Past Five Years: President |
| Marketing Corporation; Managing Director of The | of the University of Pennsylvania; Christopher H. |
| Vanguard Group (1995–2008). | Browne Distinguished Professor of Political Science |
| | in the School of Arts and Sciences with secondary |
| | appointments at the Annenberg School for Commu- |
| Independent Trustees | nication and the Graduate School of Education |
| | of the University of Pennsylvania; Director of |
| Emerson U. Fullwood | Carnegie Corporation of New York, Schuylkill River |
| Born 1948. Trustee Since January 2008. Principal | Development Corporation, and Greater Philadelphia |
| Occupation(s) During the Past Five Years: Executive | Chamber of Commerce; Trustee of the National |
| Chief Staff and Marketing Officer for North America | Constitution Center; Chair of the Presidential |
| and Corporate Vice President (retired 2008) of Xerox | Commission for the Study of Bioethical Issues. |
| Corporation (document management products and | |
| services); Executive in Residence and 2010 | JoAnn Heffernan Heisen |
| Distinguished Minett Professor at the Rochester | Born 1950. Trustee Since July 1998. Principal |
| Institute of Technology; Director of SPX Corporation | Occupation(s) During the Past Five Years: Corporate |
| (multi-industry manufacturing), the United Way of | Vice President and Chief Global Diversity Officer |
| Rochester, Amerigroup Corporation (managed health | (retired 2008) and Member of the Executive |
| care), the University of Rochester Medical Center, | Committee (1997–2008) of Johnson & Johnson |
| Monroe Community College Foundation, and North | (pharmaceuticals/consumer products); Director of |
| Carolina A&T University. | Skytop Lodge Corporation (hotels), the University |
| | Medical Center at Princeton, the Robert Wood |
| Rajiv L. Gupta | Johnson Foundation, and the Center for Work Life |
| Born 1945. Trustee Since December 2001.2 | Policy; Member of the Advisory Board of the |
| Principal Occupation(s) During the Past Five Years: | Maxwell School of Citizenship and Public Affairs |
| Chairman and Chief Executive Officer (retired 2009) | at Syracuse University. |
| | |
| F. Joseph Loughrey | Thomas J. Higgins | |
| Born 1949. Trustee Since October 2009. Principal | Born 1957. Chief Financial Officer Since September |
| Occupation(s) During the Past Five Years: President | 2008. Principal Occupation(s) During the Past Five |
| and Chief Operating Officer (retired 2009) and Vice | Years: Principal of The Vanguard Group, Inc.; Chief |
| Chairman of the Board (2008–2009) of Cummins Inc. | Financial Officer of each of the investment companies |
| (industrial machinery); Director of SKF AB (industrial | served by The Vanguard Group since 2008; Treasurer |
| machinery), Hillenbrand, Inc. (specialized consumer | of each of the investment companies served by The |
| services), the Lumina Foundation for Education, and | Vanguard Group (1998–2008). |
| Oxfam America; Chairman of the Advisory Council | | |
| for the College of Arts and Letters and Member | Kathryn J. Hyatt | |
| of the Advisory Board to the Kellogg Institute for | Born 1955. Treasurer Since November 2008. Principal |
| International Studies at the University of Notre Dame. | Occupation(s) During the Past Five Years: Principal |
| | of The Vanguard Group, Inc.; Treasurer of each of |
| André F. Perold | the investment companies served by The Vanguard |
| Born 1952. Trustee Since December 2004. Principal | Group since 2008; Assistant Treasurer of each of the |
| Occupation(s) During the Past Five Years: George | investment companies served by The Vanguard Group |
| Gund Professor of Finance and Banking at the Harvard | (1988–2008). | |
| Business School (retired July 2011); Chief Investment | | |
| Officer and co-Managing Partner of HighVista | Heidi Stam | |
| Strategies LLC (private investment firm); Director of | Born 1956. Secretary Since July 2005. Principal |
| Rand Merchant Bank; Overseer of the Museum of | Occupation(s) During the Past Five Years: Managing |
| Fine Arts Boston. | Director of The Vanguard Group, Inc., since 2006; |
| | General Counsel of The Vanguard Group since 2005; |
| Alfred M. Rankin, Jr. | Secretary of The Vanguard Group and of each of the |
| Born 1941. Trustee Since January 1993. Principal | investment companies served by The Vanguard Group |
| Occupation(s) During the Past Five Years: Chairman, | since 2005; Director and Senior Vice President of |
| President, and Chief Executive Officer of NACCO | Vanguard Marketing Corporation since 2005; |
| Industries, Inc. (forklift trucks/housewares/lignite); | Principal of The Vanguard Group (1997–2006). |
| Director of Goodrich Corporation (industrial products/ | | |
| aircraft systems and services) and the National | | |
| Association of Manufacturers; Chairman of the | Vanguard Senior Management Team |
| Federal Reserve Bank of Cleveland; Vice Chairman | | |
| of University Hospitals of Cleveland; President of | R. Gregory Barton | Chris D. McIsaac |
| the Board of The Cleveland Museum of Art. | Mortimer J. Buckley | Michael S. Miller |
| | Kathleen C. Gubanich | James M. Norris |
| Peter F. Volanakis | Paul A. Heller | Glenn W. Reed |
| Born 1955. Trustee Since July 2009. Principal | Martha G. King | George U. Sauter |
| Occupation(s) During the Past Five Years: President | | |
| and Chief Operating Officer (retired 2010) of Corning | | |
| Incorporated (communications equipment); Director of | Chairman Emeritus and Senior Advisor |
| Corning Incorporated (2000–2010) and Dow Corning | | |
| (2001–2010); Overseer of the Amos Tuck School of | John J. Brennan | |
| Business Administration at Dartmouth College. | Chairman, 1996–2009 | |
| | Chief Executive Officer and President, 1996–2008 |
| |
| Executive Officers | | |
| | Founder | |
| Glenn Booraem | | |
| Born 1967. Controller Since July 2010. Principal | John C. Bogle | |
| Occupation(s) During the Past Five Years: Principal | Chairman and Chief Executive Officer, 1974–1996 |
| of The Vanguard Group, Inc.; Controller of each of | | |
| the investment companies served by The Vanguard | | |
| Group since 2010; Assistant Controller of each of | | |
| the investment companies served by The Vanguard | | |
| Group (2001–2010). | | |
1 Mr. McNabb is considered an “interested person,” as defined in the Investment Company Act of 1940, because he is an officer of the Vanguard funds.
2 December 2002 for Vanguard Equity Income Fund, Vanguard Growth Equity Fund, the Vanguard Municipal Bond Funds, and the Vanguard State Tax-Exempt Funds.
|  |
| P.O. Box 2600 |
| Valley Forge, PA 19482-2600 |
Connect with Vanguard® > vanguard.com
| |
| Fund Information > 800-662-7447 | CFA® is a trademark owned by CFA Institute. |
| Direct Investor Account Services > 800-662-2739 | |
| Institutional Investor Services > 800-523-1036 | |
| Text Telephone for People | |
| With Hearing Impairment > 800-749-7273 | |
| |
| This material may be used in conjunction | |
| with the offering of shares of any Vanguard | |
| fund only if preceded or accompanied by | |
| the fund’s current prospectus. | |
| |
| All comparative mutual fund data are from Lipper Inc. or | |
| Morningstar, Inc., unless otherwise noted. | |
| |
| You can obtain a free copy of Vanguard’s proxy voting | |
| guidelines by visiting vanguard.com/proxyreporting or by | |
| calling Vanguard at 800-662-2739. The guidelines are | |
| also available from the SEC’s website, sec.gov. In | |
| addition, you may obtain a free report on how your fund | |
| voted the proxies for securities it owned during the 12 | |
| months ended June 30. To get the report, visit either | |
| vanguard.com/proxyreporting or sec.gov. | |
| |
| You can review and copy information about your fund at | |
| the SEC’s Public Reference Room in Washington, D.C. To | |
| find out more about this public service, call the SEC at | |
| 202-551-8090. Information about your fund is also | |
| available on the SEC’s website, and you can receive | |
| copies of this information, for a fee, by sending a | |
| request in either of two ways: via e-mail addressed to | |
| publicinfo@sec.gov or via regular mail addressed to the | |
| Public Reference Section, Securities and Exchange | |
| Commission, Washington, DC 20549-1520. | |
| |
| |
| | © 2011 The Vanguard Group, Inc. |
| | All rights reserved. |
| | Vanguard Marketing Corporation, Distributor. |
| |
| | Q3010 122011 |

Annual Report | October 31, 2011
Vanguard International ExplorerTMFund
> Vanguard International Explorer Fund returned –7.60% for the 12 months ended October 31, 2011, lagging its benchmark index and the average return of its peers.
> International stocks trailed their U.S. counterparts as Europe’s debt crisis worsened.
> Consumer discretionary and energy sector stocks hurt fund performance most, while telecommunications holdings produced the highest return.
| |
| Contents | |
| Your Fund’s Total Returns. | 1 |
| Chairman’s Letter. | 2 |
| Advisors’ Report. | 8 |
| Fund Profile. | 12 |
| Performance Summary. | 14 |
| Financial Statements. | 16 |
| Your Fund’s After-Tax Returns. | 32 |
| About Your Fund’s Expenses. | 33 |
| Trustees Approve Advisory Agreements. | 35 |
| Glossary. | 37 |
Please note: The opinions expressed in this report are just that—informed opinions. They should not be considered promises or advice.
Also, please keep in mind that the information and opinions cover the period through the date on the front of this report. Of course, the risks of investing in your fund are spelled out in the prospectus.
See the Glossary for definitions of investment terms used in this report.
About the cover: Vanguard was named for the HMS Vanguard, flagship of British Admiral Horatio Nelson. A ship—whose performance and safety depend on the work of all hands—has served as a fitting metaphor for the Vanguard crew as we strive to help clients reach their financial goals.
Your Fund’s Total Returns
| |
| Fiscal Year Ended October 31, 2011 | |
| |
| | Total |
| | Returns |
| Vanguard International Explorer Fund | -7.60% |
| S&P EPAC SmallCap Index | -2.42 |
| International Small-Cap Funds Average-g | -4.66 |
| International Small-Cap Funds Average: Derived from data provided by Lipper Inc. |
Your Fund’s Performance at a Glance
October 31, 2010 , Through October 31, 2011
| | | | |
| | | | Distributions Per Share |
| | Starting | Ending | Income | Capital |
| | Share Price | Share Price | Dividends | Gains |
| Vanguard International Explorer Fund | $15.81 | $14.41 | $0.224 | $0.000 |
1

Chairman’s Letter
Dear Shareholder,
Global financial markets ignored a spate of bad news and steadily rose through the first six months of the fiscal year behind solid corporate earnings and an economic recovery that appeared tobe on track. But the news turned from bad to worse in the second half, and global markets sank as Europe’s debt problems mounted.
Vanguard International Explorer Fund, which marked its fifteenth anniversary in November, just after the close of its fiscal year, returned –7.60% under these gloomy conditions. This result trailed that of the fund’s benchmark, the Standard & Poor’s Europe Pacific Asia Composite SmallCap Index, and the average return of its international small-capitalization peers.
In a challenging market environment in which the European debt crisis intensified as the period continued, the advisors’ investment decisions in Europe hurt the fund’s performance relative to the benchmark index. Among the industry sectors, consumer discretionary and energy lagged most, while the top performer was telecommunication services.
If you own this fund in a taxable account, you may wish to review the table and discussion on after-tax returns for the fiscal year later in this report.
2
For the markets,
an anxious 12 months
International stock markets returned a combined –4.66% for the period, as stock prices retreated in Europe and in the Pacific region’s developed economies and emerging markets, where growth has moderated.
U.S. stock indexes ended the 12 months with solid returns, though the gains were shadowed by anxiety. This turbulence was so pronounced, in fact, that a one-month change in the start date would have yielded a very different perspective on performance. For the 12 months through October 31, the broad U.S. stock market returned 7.67%. For the 12 months ended September 30, however, the return was a mere 0.31%.
Unsteady yields reflected
fast-changing sentiment
Taxable bonds produced strong returns and municipal bonds solid but unspectacular results, though as in the stock market, investor sentiment was volatile. The yield of the 10-year U.S. Treasury note, a benchmark for longer- term interest rates, began the 12 months at 2.61%, drifted higher as the economic expansion seemed to gather steam, then fluttered lower to close the period at 2.17%. The decline in Treasury yields (and rise in prices) was driven by Europe’s sovereign-debt dramas, underwhelming economic reports, and a flight to safety that was prompted, paradoxically, by a rating agency’s decision to downgrade the
| | | |
| Market Barometer | | | |
| |
| | | Average Annual Total Returns |
| | | Periods Ended October 31, 2011 |
| | One | Three | Five |
| | Year | Years | Years |
| Stocks | | | |
| Russell 1000 Index (Large-caps) | 8.01% | 12.22% | 0.54% |
| Russell 2000 Index (Small-caps) | 6.71 | 12.87 | 0.68 |
| Dow Jones U.S. Total Stock Market Index | 7.67 | 12.58 | 0.90 |
| MSCI All Country World Index ex USA (International) | -4.66 | 12.92 | -0.37 |
| |
| Bonds | | | |
| Barclays Capital U.S. Aggregate Bond Index (Broad | | | |
| taxable market) | 5.00% | 8.87% | 6.41% |
| Barclays Capital Municipal Bond Index (Broad | | | |
| tax-exempt market) | 3.78 | 8.31 | 4.80 |
| Citigroup Three-Month U.S. Treasury Bill Index | 0.10 | 0.15 | 1.53 |
| |
| CPI | | | |
| Consumer Price Index | 3.53% | 1.49% | 2.33% |
3
U.S. government debt. Vanguard’s confidence in the full faith and credit of the U.S. Treasury remains unshaken.
Taxable investment-grade bonds returned 5.00% for the full 12 months. It’s important to note, of course, that as yields decline, the opportunity for similarly strong returns diminishes. The broad municipal market returned 3.78%. The returns on money market instruments hovered near 0%, consistent with the Federal Reserve Board’s target for short-term interest rates.
Advance turns to retreat
on Europe’s troubles
Vanguard International Explorer Fund’s advisors, Schroder Investment Management North America Inc. and Wellington Management Company, LLP, search for small-capitalization companies with superior earnings and cash flow at attractive valuations. At times, the fund’s investment landscape can seem lush with opportunities. In this 12-month period, however, conditions grew increasingly harsh as the year wore on. The fund performed impressively through the first half despite a series of geopolitical problems and events: turmoil in the Middle East and North Africa, the tragic earthquake and nuclear disaster in Japan, and continued sovereign-debt concerns in Europe. But the early gains were more than offset in the second half as the debt crisis deepened and the global economy stumbled.
Expense Ratios
Your Fund Compared With Its Peer Group
| | |
| | | Peer Group |
| | Fund | Average |
| International Explorer Fund | 0.39% | 1.57% |
The fund expense ratio shown is from the prospectus dated February 24, 2011, and represents estimated costs for the current fiscal year. For the fiscal year ended October 31, 2011, the fund’s expense ratio was 0.42%. The peer-group expense ratio is derived from data provided by Lipper Inc. and captures information through year-end 2010.
Peer group: International Small-Cap Funds.
4
Developed markets in Europe represented more than half the fund’s assets and were the largest holding by region. The negative effect of this large allocation was compounded by disappointing stock choices that were a leading cause of the fund’s underperformance relative to its benchmark index. While the fund’s exposure to Greece was much less than 1%, the nation’s debt problems reverberated across the region. The poorest results came from France and the United Kingdom, but Norway and Ireland were also trouble spots. French materials firms and British energy companies were among the worst performers. Subpar stock selection in the region’s consumer discretionary sector also restrained returns.
The fund’s holdings in the Pacific region’s developed markets, which accounted for approximately one-third of assets, returned about 7% and outperformed their counterparts in the index. The largest contribution in the region came from Australia, where a rise in commodity prices drove the materials sector. Although Japan, the fund’s largest country weighting, was struck by the tragic earthquake and nuclear crisis in March, its stocks managed to climb about 9%. Japan’s materials and industrial sectors drove the gains as the nation rebounded from catastrophe.
Emerging markets, which make up about 11% of the fund’s assets, had a rougher time. China and Brazil, growth leaders in past years and the two largest emerging
Total Returns
Ten Years Ended October 31, 2011
| |
| | Average |
| | Annual Return |
| International Explorer Fund | 10.16% |
| S&P EPAC SmallCap Index | 10.01 |
| International Small-Cap Funds Average | 9.42 |
| International Small-Cap Funds Average: Derived from data provided by Lipper Inc. |
The figures shown represent past performance, which is not a guarantee of future results. (Current performance may be lower or higher than the performance data cited. For performance data current to the most recent month-end, visit our website at vanguard.com/performance.) Note, too, that both investment returns and principal value can fluctuate widely, so an investor’s shares, when sold, could be worth more or less than their original cost.
5
markets holdings, both stumbled. China’s stocks returned about –32% and Brazil’s about –20%; the leading culprit for both countries was the consumer discretionary sector.
Although the Philippines represents just a sliver of the fund’s assets, a rise of about 32% in its energy stocks offset some of the problems incurred by other emerging markets countries. On the other end of the spectrum, the fund’s tiny allocation to the North American region plunged, returning about –61% on bad news from Canadian-listed materials and energy stocks.
Across the sectors, telecommunication services stocks rose about 28% and made up for some of the shortfalls in other areas, notably consumer discretionary, energy, and financials. Small-cap financial stocks held up better than their large-cap counterparts, which included the giant diversified financial firms that continued to struggle in the wake of the financial crisis.
Over the long haul,
the fund’s record shines
Vanguard’s consistent view is that shareholders are better served by taking a long-term approach, and International Explorer’s performance is most impressive when viewed through that lens.
For the past ten years, the fund has recorded an average annual return of 10.16%, a bit better than the 10.01% annualized return of its benchmark and the 9.42% average annual return of its peers. As I mentioned earlier in this report, International Explorer celebrated its fifteenth anniversary in November. Since November 30, 1996, the fund has posted an average annual return of 9.34%, surpassing the 5.76% average annual return of its benchmark and the 7.80% result of its peers.
Schroder deserves most of the credit for the fund’s competitive long-term results. The firm’s skill and experience in selecting stocks has been an advantage, along with Vanguard’s traditionally low costs, which allow shareholders to keep more of the fund’s return. Wellington was added as a second advisor in 2010, an addition that confirms Vanguard’s commitment to the multimanager structure and the diversification it can add to a well-balanced portfolio.
For more information on both advisors’ investment strategies, please see the Advisors’ Report following this letter.
Lessons of diversification
apply to foreign stocks
While international and U.S. stock markets are linked by the global economy, they don’t move in tandem. Experience indicates that bear markets are contagious, but even within that framework, international regions behave differently from each other and U.S. markets. Research shows the divergences are more pronounced during bull markets.
In the short-term, it’s impossible to know which way the markets are headed next or which sector, style, or market capitalization range will take the lead. That’s why Vanguard counsels investors to build a
6
portfolio that is diversified within and across asset classes––including international equities––and that fits their time horizon, goals, and risk tolerance.
The International Explorer Fund, with its focus on small-cap stocks, can add diversification to your portfolio by providing low-cost exposure to foreign companies with prospects for long-term growth.
Thank you for your confidence in Vanguard.
Sincerely,

F. William McNabb III
Chairman and Chief Executive Officer
November 14, 2011
7
Advisors’ Report
For the fiscal year ended October 31, 2011, Vanguard International Explorer Fund returned –7.60%. Your fund is managed by two independent advisors, a strategy that enhances the fund’s diversification by providing exposure to distinct, yet complementary, investment approaches. It is not uncommon for different advisors to have different views about individual securities or the broader investment
environment. The advisors, the amount and percentage of fund assets each manages, and brief descriptions of their investment strategies are presented in the table below. The advisors have also prepared a discussion of the investment environment that existed during the fiscal year and of how their portfolio positioning reflects this assessment. These comments were prepared on November 21, 2011.
Vanguard International Explorer Fund Investment Advisors
| | | |
| | Fund Assets Managed | |
| Investment Advisor | % | $ Million | Investment Strategy |
| Schroder Investment | 94 | 2,052 | The advisor employs a fundamental investment |
| Management North America Inc. | | | approach that considers macroeconomic factors while |
| | | | focusing primarily on company-specific factors, |
| | | | including a company’s potential for long-term growth, |
| | | | financial condition, quality of management, and |
| | | | sensitivity to cyclical factors. The advisor also |
| | | | considers the relative value of a company’s securities |
| | | | compared with those of other companies and the |
| | | | market as a whole. |
| Wellington Management | 4 | 94 | The advisor employs a traditional, bottom-up approach |
| Company, LLP | | | that is opportunistic in nature, relying on global and |
| | | | regional research resources to identify both |
| | | | growth-oriented and neglected or misunderstood |
| | | | companies. |
| Cash Investments | 2 | 41 | These short-term reserves are invested by Vanguard in |
| | | | equity index products to simulate investment in stocks. |
| | | | Each advisor also may maintain a modest cash |
| | | | position. |
8
Schroder Investment Management
North America Inc.
Portfolio Manager:
Matthew F. Dobbs
Head of Global Small Companies
Despite a significant correction in the final quarter of the fiscal year, international small-cap equities were only modestly down over the 12-month period and outperformed their larger peers. The S&P EPAC SmallCap Index returned –2.42% and the S&P EPAC LargeMidCap Index returned –3.19% for the period.
Investor sentiment was buoyed in the first half of the year by the November 2010 confirmation of further quantitative easing by the U.S. Federal Reserve and the accompanying fiscal package. Strains in the Eurozone were somewhat quiescent as investors anticipated a healthy recovery in developed economies in line with improvements in leading indicators. However, the mood changed in the second half amid slowing global growth, inflationary pressures, and credit tightening in a number of emerging economies, as well as intensified concerns over peripheral European debt problems.
In terms of regional divergences, Japan was the best-performing market, as outperformance by smaller companies was most significant. Small-caps underperformed in other regions, and the continental European markets offered the weakest absolute returns. In sector terms, consumer staples and utilities offered positive returns, while financials and information technology lagged.
Our stock selection in Europe was disappointing. In the United Kingdom, key areas of weakness were in industrials, energy (Gulfsands Petroleum), and information technology (CSR, PV Crystalox). Selections also fell short in the rest of Europe, most notably in consumer cyclicals (BYGGmax, TomTom), energy (Bourbon), and materials (Aperam, Smurfit Kappa).
Regional allocation had a negative impact, as well. We underweighted Japan, which performed relatively well because of the strength of the yen and anticipation of the impact of the fiscal packages announced in the wake of the March earthquake and tsunami. Our two Canadian holdings, Sino-Forest and Niko Resources, and our Latin American exposure also detracted.
Our holdings in other Pacific-region countries generally added value; notable contributors included Australian zircon producer Iluka Resources, Philippine coal and electric power company Semirara, and Australian-based packaging group Amcor. Stocks sensitive to domestic demand in China, such as Ports Design and Evergreen International, were areas of weakness.
Our focus remains on identifying companies that offer sustainable and relatively visible long-term growth prospects, with sound balance sheets and strong management. These can be found in a wide range of regions and sectors, and the portfolio continues to exhibit a high degree of diversification. Regional positioning remained fairly stable over the year, although we added modestly to our holdings in Pacific countries other
9
than Japan and trimmed our allocation to the United Kingdom and Canada. Key overweighted positions at year-end were Pacific ex-Japan and emerging markets; we were underweighted in Europe.
In sector terms, we added to materials, consumer cyclicals, health care, and financials (although the last remains our biggest underweighting relative to the index) and reduced our holdings in industrials and information technology. At year-end, energy and materials were key overweightings, balanced by underweightings in financials and information technology.
Wellington Management Company, LLP
Portfolio Manager:
Simon H. Thomas
Senior Vice President and Equity Portfolio Manager
Global equities fell for the period amid heightened volatility as unrest in North Africa and the Middle East, the devastating earthquake and tsunami in Japan, and the European sovereign-debt crisis increased investor uncertainty.
Our portfolio enjoyed strong performance among consumer discretionary and information technology holdings. Allocation among sectors, largely a result of our bottom-up stock selection process, was modestly positive. At a regional level, our stock selection in and underweighted allocation to Europe during a particularly volatile time in the region’s equity markets aided relative performance. The fund’s overweighting to Japan also contributed, as the equity market rebounded after the natural disasters in that country.
Top contributors to relative returns were Start Today, Cosmos Pharmaceutical, and Hotel Shilla. Shares of Start Today, a Japan-based online retail company and service provider for third-party e-commerce operations, advanced sharply during the period. The firm is benefiting from rising e-commerce volumes as online purchases constitute a greater share of overall retail spending. In addition to achieving strong transaction volumes domestically, the company also announced its entry into China.
Shares of Cosmos Pharmaceutical, a Japan-based regional drugstore chain operator, rose as the company’s results beat earlier estimates and raised its earnings projections. Cosmos Pharmaceutical’s stores dominate regionally with strong foot traffic and low pricing, making it less economically sensitive and therefore relatively defensive in a volatile market environment. Shares of Hotel Shilla, an operator of hotels and duty-free shops in South Korea, increased in price as the company benefited from an increase in tourism from China, which rose by 19% year-over-year between June and August. Other notable contributors to absolute returns were Germany-based tire retailer Delticom and Japan-based electronic commerce company Kakaku.com.
The largest detractors from relative performance during the period were Thomas Cook Group, Indofood Agri
10
Resources, and Temenos Group. Shares of Thomas Cook Group, a U.K.-based travel agent and provider of leisure travel services, dropped as investors worried about declining consumer spending in Europe, rising online competition, and the company’s rising debt level. We take confidence from the fact that a significant portion of Thomas Cook’s revenues comes from Scandinavian and German customers, who continue to spend. Also, the company’s banks extended the maturity and lowered the rate of its loans, which we view as a positive sign.
Shares of palm oil producer Indofood Agri Resources lagged the market following the announcement of a corporate restructuring plan. Shares of Temenos Group, a Switzerland-based provider of risk management software to retail banks, fell as uncertainty and confusion in the European financial markets combined with a delay in some of the company’s orders worried the market. Other notable detractors included Australian energy provider Karoon Gas and China-based systems and engineering firm China Automation Group.
As recent market volatility reflects, the macroeconomic environment remains uncertain, and geopolitical tension, inflation, and sovereign-debt concerns still overhang financial markets. We continue to focus our research on the individual company level. Our portfolio holds a diversified mixture of relatively inexpensive companies with above-average growth, strong market positions, skilled management teams, and solid balance sheets. We believe these holdings are well-positioned to perform across a number of different economic scenarios.
At the end of the period, we were most overweighted in the consumer discretionary, energy, health care, and industrial sectors and most underweighted in financials and information technology relative to the benchmark. On a regional basis, our most underweighted position at the end of the period was Europe, which was offset by overweightings in Japan and select emerging-market countries.
11
International Explorer Fund
Fund Profile
As of October 31, 2011
| | | |
| Portfolio Characteristics | | |
| | | S&P | MSCI AC |
| | | EPAC | World |
| | | SmallCap | Index |
| | Fund | Index | ex USA |
| Number of Stocks | 351 | 3,373 | 1,861 |
| Median Market Cap | $1.6B | $1.4B | $27.3B |
| Price/Earnings Ratio | 15.3x | 13.9x | 11.6x |
| Price/Book Ratio | 1.3x | 1.2x | 1.4x |
| Return on Equity | 13.8% | 11.5% | 17.8% |
| Earnings Growth Rate | 5.8% | 3.9% | 2.5% |
| Dividend Yield | 2.5% | 2.9% | 3.4% |
| Turnover Rate | 43% | — | — |
| Ticker Symbol | VINEX | — | — |
| Expense Ratio1 | 0.39% | — | — |
| Short-Term Reserves | 3.0% | — | — |
Sector Diversification (% of equity exposure)
| | | |
| | | S&P | MSCI AC |
| | | EPAC | World |
| | | SmallCap | Index |
| | Fund | Index | ex USA |
| Consumer | | | |
| Discretionary | 20.5% | 18.0% | 9.1% |
| Consumer Staples | 5.6 | 6.2 | 9.6 |
| Energy | 8.1 | 3.3 | 11.5 |
| Financials | 13.1 | 18.7 | 23.5 |
| Health Care | 5.2 | 5.7 | 6.7 |
| Industrials | 24.1 | 23.9 | 10.4 |
| Information | | | |
| Technology | 5.6 | 9.4 | 6.4 |
| Materials | 14.3 | 11.1 | 12.3 |
| Telecommunication | | | |
| Services | 2.7 | 1.5 | 6.4 |
| Utilities | 0.8 | 2.2 | 4.1 |
| | |
| Volatility Measures | | |
| | S&P | |
| | EPAC | MSCI AC |
| | SmallCap | World Index |
| | Index | ex USA |
| R-Squared | 0.98 | 0.96 |
| Beta | 0.98 | 1.00 |
These measures show the degree and timing of the fund’s fluctuations compared with the indexes over 36 months.
Ten Largest Holdings (% of total net assets)
| | |
| Freenet AG | Wireless | |
| | Telecommunication | |
| | Services | 1.4% |
| DCC plc | Industrial | |
| | Conglomerates | 1.3 |
| Delta Lloyd NV | Life & Health | |
| | Insurance | 1.2 |
| Imtech NV | Construction & | |
| | Engineering | 1.1 |
| Fletcher Building Ltd. | Construction | |
| | Materials | 1.1 |
| Helvetia Holding AG | Multi-Line | |
| | Insurance | 1.1 |
| Fugro NV | Oil & Gas | |
| | Equipment & | |
| | Services | 1.1 |
| Amcor Ltd. | Paper Packaging | 1.1 |
| Computershare Ltd. | Data Processing & | |
| | Outsourced | |
| | Services | 1.0 |
| Kuoni Reisen Holding AG | Hotels, Resorts & | |
| | Cruise Lines | 1.0 |
| Top Ten | | 11.4% |
The holdings listed exclude any temporary cash investments and equity index products.
Allocation by Region (% of equity exposure)
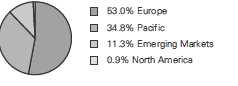
1 The expense ratio shown is from the prospectus dated February 24, 2011, and represents estimated costs for the current fiscal year. For the fiscal year ended October 31, 2011, the expense ratio was 0.42%.
12
International Explorer Fund
Market Diversification (% of equity exposure)
| | | |
| | | S&P | MSCI AC |
| | | EPAC | World |
| | | SmallCap | Index |
| | Fund | Index | ex USA |
| Europe | | | |
| United Kingdom | 16.2% | 19.6% | 14.8% |
| Germany | 8.5 | 7.2 | 5.5 |
| France | 5.4 | 8.0 | 7.0 |
| Netherlands | 4.8 | 2.1 | 1.6 |
| Switzerland | 4.2 | 7.8 | 5.6 |
| Ireland | 2.9 | 0.4 | 0.2 |
| Italy | 2.4 | 2.5 | 1.8 |
| Norway | 2.2 | 1.1 | 0.7 |
| Denmark | 2.1 | 0.9 | 0.8 |
| Belgium | 1.3 | 1.0 | 0.6 |
| Austria | 1.0 | 0.4 | 0.2 |
| Sweden | 1.0 | 3.2 | 2.1 |
| Other | 1.0 | 4.8 | 3.4 |
| Subtotal | 53.0% | 59.0% | 44.3% |
| Pacific | | | |
| Japan | 20.6% | 20.9% | 13.6% |
| Australia | 9.6 | 8.7 | 6.1 |
| Singapore | 2.9 | 1.6 | 1.2 |
| New Zealand | 1.2 | 0.2 | 0.1 |
| Other | 0.5 | 2.6 | 2.4 |
| Subtotal | 34.8% | 34.0% | 23.4% |
| Emerging Markets | | | |
| China | 2.9% | 0.5% | 4.1% |
| South Korea | 2.2 | 5.6 | 3.9 |
| Brazil | 2.1 | 0.0 | 3.9 |
| Indonesia | 1.6 | 0.0 | 0.7 |
| India | 1.2 | 0.0 | 2.1 |
| Other | 1.3 | 0.0 | 10.1 |
| Subtotal | 11.3% | 6.1% | 24.8% |
| North America | 0.9% | 0.1% | 7.0% |
| Middle East | 0.0% | 0.8% | 0.5% |
13
International Explorer Fund
Performance Summary
All of the returns in this report represent past performance, which is not a guarantee of future results that may be achieved by the fund. (Current performance may be lower or higher than the performance data cited. For performance data current to the most recent month-end, visit our website at vanguard.com/performance.) Note, too, that both investment returns and principal value can fluctuate widely, so an investor’s shares, when sold, could be worth more or less than their original cost. The returns shown do not reflect taxes that a shareholder would pay on fund distributions or on the sale of fund shares.
Cumulative Performance: October 31, 2001, Through October 31, 2011
Initial Investment of $10,000
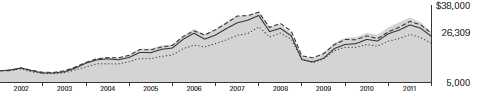
| | | | |
| | Average Annual Total Returns | |
| | Periods Ended October 31, 2011 | |
| | | | | Final Value |
| | One | Five | Ten | of a $10,000 |
| | Year | Years | Years | Investment |
| International Explorer Fund | -7.60% | -1.01% | 10.16% | $26,309 |
| MSCI All Country World Index ex USA | -4.25 | 0.08 | 8.05 | 21,698 |
| S&P EPAC SmallCap Index | -2.42 | -1.18 | 10.01 | 25,968 |
| International Small-Cap Funds Average | -4.66 | -0.54 | 9.42 | 24,598 |
International Small-Cap Funds Average: Derived from data provided by Lipper Inc.
Fiscal-Year Total Returns (%): October 31, 2001, Through October 31, 2011
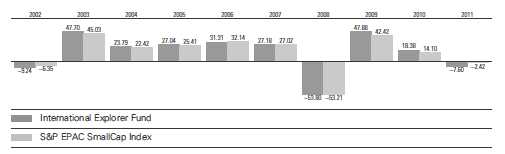
Vanguard fund returns do not reflect the 2% fee on redemptions of shares held for less than two months.
See Financial Highlights for dividend and capital gains information.
14
International Explorer Fund
Average Annual Total Returns: Periods Ended September 30, 2011
This table presents returns through the latest calendar quarter—rather than through the end of the fiscal period.
Securities and Exchange Commission rules require that we provide this information.
| | | | |
| | Inception | One | Five | Ten |
| | Date | Year | Years | Years |
| International Explorer Fund | 11/4/1996 | -11.45% | -1.85% | 9.64% |
Vanguard fund returns do not reflect the 2% fee on redemptions of shares held for less than two months.
15
International Explorer Fund
Financial Statements
Statement of Net Assets
As of October 31, 2011
The fund reports a complete list of its holdings in regulatory filings four times in each fiscal year, at the quarter-ends. For the second and fourth fiscal quarters, the lists appear in the fund’s semiannual and annual reports to shareholders. For the first and third fiscal quarters, the fund files the lists with the Securities and Exchange Commission on Form N-Q. Shareholders can look up the fund’s Forms N-Q on the SEC’s website at sec.gov. Forms N-Q may also be reviewed and copied at the SEC’s Public Reference Room (see the back cover of this report for further information).
| | | |
| | | | Market |
| | | | Value |
| | | Shares | ($000) |
| Common Stocks (94.7%)1 | | |
| Australia (8.8%) | | |
| | Amcor Ltd. | 3,209,621 | 23,482 |
| | Computershare Ltd. | 2,903,648 | 22,947 |
| | Ansell Ltd. | 1,509,948 | 22,085 |
| ^ | Myer Holdings Ltd. | 5,798,890 | 15,827 |
| | Iluka Resources Ltd. | 894,309 | 14,868 |
| | Coca-Cola Amatil Ltd. | 1,130,897 | 14,599 |
| | Sims Metal | | |
| | Management Ltd. | 981,703 | 14,159 |
| | Incitec Pivot Ltd. | 2,785,350 | 10,089 |
| * | Dart Energy Ltd. | 15,642,543 | 10,068 |
| * | James Hardie | | |
| | Industries SE | 1,382,832 | 8,957 |
| | Mirvac Group | 6,561,450 | 8,592 |
| ^ | Fairfax Media Ltd. | 7,105,856 | 6,890 |
| | Transfield Services Ltd. | 2,763,958 | 6,596 |
| ^,* | Mesoblast Ltd. | 617,926 | 5,254 |
| | NRW Holdings Ltd. | 507,198 | 1,290 |
| | WorleyParsons Ltd. | 31,865 | 925 |
| | Challenger Ltd. | 163,141 | 778 |
| | Domino’s Pizza | | |
| | Enterprises Ltd. | 98,195 | 692 |
| | Seek Ltd. | 101,941 | 661 |
| * | Karoon Gas Australia Ltd. | 135,172 | 624 |
| | SAI Global Ltd. | 123,705 | 616 |
| | Whitehaven Coal Ltd. | 84,171 | 521 |
| | Skilled Group Ltd. | 229,760 | 438 |
| | Cochlear Ltd. | 6,788 | 417 |
| | | | 191,375 |
| Austria (1.0%) | | |
| | Mayr Melnhof Karton AG | 155,000 | 14,349 |
| | Rosenbauer | | |
| | International AG | 113,000 | 4,658 |
| | Andritz AG | 11,657 | 1,030 |
| | Zumtobel AG | 31,692 | 657 |
| | Schoeller-Bleckmann | | |
| | Oilfield Equipment AG | 7,184 | 568 |
| | | | 21,262 |
| | |
| | | Market |
| | | Value |
| | Shares | ($000) |
| Belgium (1.3%) | | |
| Tessenderlo Chemie NV | 340,000 | 10,550 |
| Nyrstar | 950,000 | 8,308 |
| D’ieteren SA/NV | 53,059 | 3,020 |
| EVS Broadcast | | |
| Equipment SA | 55,000 | 2,815 |
| ^ Melexis NV | 95,000 | 1,336 |
| UCB SA | 24,256 | 1,066 |
| Cie d’Entreprises CFE | 10,865 | 610 |
| * Nyrstar | 350,000 | — |
| * Tessenderlo Chemie NV | 500 | — |
| | | 27,705 |
| Brazil (2.0%) | | |
| Localiza Rent a Car SA | 723,673 | 10,862 |
| Cyrela Brazil Realty SA | | |
| Empreendimentos | | |
| e Participacoes | 1,129,037 | 9,956 |
| PDG Realty SA | | |
| Empreendimentos | | |
| e Participacoes | 1,766,747 | 7,800 |
| Hypermarcas SA | 1,170,309 | 6,367 |
| ^ Cia Brasileira de | | |
| Distribuicao Grupo Pao | | |
| de Acucar ADR | 99,014 | 3,880 |
| Anhanguera Educacional | | |
| Participacoes SA | 236,278 | 3,511 |
| Arezzo Industria | | |
| e Comercio SA | 83,700 | 1,107 |
| CETIP SA - Balcao | | |
| Organizado de Ativos | | |
| e Derivativos | 42,791 | 586 |
| Brasil Insurance | | |
| Participacoes | | |
| e Administracao SA | 30,000 | 292 |
| | | 44,361 |
| Canada (0.9%) | | |
| Niko Resources Ltd. | 334,368 | 18,393 |
| Pacific Rubiales | | |
| Energy Corp. | 13,300 | 310 |
| | | 18,703 |
16
International Explorer Fund
| | | |
| | | | Market |
| | | | Value |
| | | Shares | ($000) |
| China (2.8%) | | |
| | Ports Design Ltd. | 5,670,000 | 10,111 |
| | Beijing Capital | | |
| | International Airport | | |
| | Co. Ltd. | 22,472,000 | 10,091 |
| | Parkson Retail Group Ltd. | 5,593,500 | 7,117 |
| | Yuexiu Transport | | |
| | Infrastructure Ltd. | 15,190,000 | 6,557 |
| ^ | Leoch International | | |
| | Technology Ltd. | 17,090,000 | 5,586 |
| ^ | West China Cement Ltd. | 28,628,000 | 5,306 |
| ^ | Shougang Concord | | |
| | International | | |
| | Enterprises Co. Ltd. | 56,068,000 | 3,897 |
| | Guangzhou Automobile | | |
| | Group Co. Ltd. | 3,469,870 | 3,462 |
| | Concord Medical Services | | |
| | Holdings Ltd. ADR | 804,038 | 2,943 |
| | Evergreen International | | |
| | Holdings Ltd. | 10,475,000 | 2,930 |
| | Daphne International | | |
| | Holdings Ltd. | 784,000 | 819 |
| * | Ctrip.com | | |
| | International Ltd. ADR | 16,600 | 579 |
| | Microport Scientific Corp. | 913,000 | 516 |
| ^,* | Hollysys Automation | | |
| | Technologies Ltd. | 38,300 | 333 |
| | China Automation | | |
| | Group Ltd. | 857,000 | 298 |
| | | | 60,545 |
| Denmark (2.1%) | | |
| | Sydbank A/S | 770,000 | 14,260 |
| | Tryg A/S | 250,000 | 13,899 |
| * | Jyske Bank A/S | 440,000 | 12,789 |
| | Solar A/S Class B | 84,614 | 3,485 |
| | DSV A/S | 40,629 | 814 |
| | | | 45,247 |
| Finland (0.1%) | | |
| | Nokian Renkaat Oyj | 20,563 | 753 |
| | Tikkurila Oyj | 36,978 | 719 |
| | | | 1,472 |
| France (5.0%) | | |
| | Groupe Eurotunnel SA | 2,300,000 | 20,718 |
| * | Club Mediterranee | 1,000,000 | 18,903 |
| ^ | Bourbon SA | 569,000 | 15,793 |
| ^ | Rubis | 235,598 | 13,389 |
| | Saft Groupe SA | 350,000 | 10,634 |
| | Medica SA | 450,000 | 8,963 |
| * | Store Electronic | 315,000 | 4,599 |
| | Pierre & Vacances | 97,463 | 3,798 |
| | IPSOS | 80,000 | 2,618 |
| | Alten Ltd. | 76,000 | 2,164 |
| | Lectra | 250,000 | 1,884 |
| ^ | Bollore | 5,119 | 1,177 |
| | CFAO SA | 22,438 | 867 |
| | | |
| | | | Market |
| | | | Value |
| | | Shares | ($000) |
| | Imerys SA | 13,076 | 744 |
| | Wendel SA | 8,715 | 646 |
| | Eurazeo | 13,043 | 622 |
| | ICADE | 6,538 | 585 |
| | Eurofins Scientific | 5,311 | 477 |
| | Sechilienne-Sidec | 21,836 | 407 |
| | Accor SA | 10,209 | 334 |
| | Sword Group | 16,666 | 300 |
| | | | 109,622 |
| Germany (8.1%) | | |
| ^ | Freenet AG | 2,400,000 | 30,940 |
| | MTU Aero Engines | | |
| | Holding AG | 317,964 | 21,292 |
| | Rheinmetall AG | 400,713 | 21,251 |
| | Bilfinger Berger SE | 230,000 | 20,529 |
| * | Kabel Deutschland | | |
| | Holding AG | 220,000 | 12,478 |
| | Wirecard AG | 648,000 | 10,307 |
| * | SAF-Holland SA | 1,440,000 | 8,880 |
| * | Tipp24 SE | 180,000 | 8,379 |
| | Grenkeleasing AG | 140,000 | 7,705 |
| | Takkt AG | 498,200 | 6,336 |
| * | Tom Tailor Holding AG | 400,000 | 6,224 |
| | XING AG | 54,221 | 4,537 |
| | CompuGroup Medical AG | 315,000 | 4,054 |
| | STRATEC Biomedical AG | 99,285 | 4,031 |
| * | RIB Software AG | 500,000 | 3,101 |
| * | Prime Office REIT AG | 381,761 | 2,525 |
| | Cewe Color Holding AG | 45,000 | 1,750 |
| | Delticom AG | 9,987 | 1,113 |
| | Rhoen Klinikum AG | 32,470 | 648 |
| * | Gildemeister AG | 31,758 | 461 |
| | | | 176,541 |
| Hong Kong (0.5%) | | |
| | Kerry Properties Ltd. | 1,601,500 | 5,877 |
| | Dah Sing Banking | | |
| | Group Ltd. | 4,433,000 | 4,313 |
| ^ | Techtronic Industries Co. | 852,000 | 737 |
| | ASM Pacific | | |
| | Technology Ltd. | 42,400 | 466 |
| | | | 11,393 |
| India (1.2%) | | |
| * | Cairn India Ltd. | 2,322,073 | 14,127 |
| | Shriram Transport | | |
| | Finance Co. Ltd. | 966,144 | 12,092 |
| | Jyothy Laboratories Ltd. | 51,374 | 150 |
| | | | 26,369 |
| Indonesia (1.5%) | | |
| | Semen Gresik | | |
| | Persero Tbk PT | 11,066,000 | 11,775 |
| | Ciputra Property TBK PT | 166,055,500 | 8,654 |
| | Bank Mandiri Tbk PT | 8,164,000 | 6,512 |
| | United Tractors Tbk PT | 2,287,833 | 6,293 |
| | | | 33,234 |
17
| | | |
| International Explorer Fund | | |
| |
| |
| |
| | | | Market |
| | | | Value |
| | | Shares | ($000) |
| Ireland (2.8%) | | |
| | DCC plc | 1,000,000 | 27,667 |
| | Irish Continental Group plc | 550,000 | 11,218 |
| | Grafton Group plc | 2,600,000 | 10,032 |
| * | Smurfit Kappa Group plc | 1,300,000 | 8,915 |
| | IFG Group plc | 2,400,000 | 3,749 |
| | | | 61,581 |
| Italy (2.3%) | | |
| | Prysmian SPA | 1,350,000 | 20,408 |
| | Azimut Holding SPA | 2,200,000 | 17,149 |
| * | Natuzzi SPA ADR | 1,705,086 | 4,212 |
| * | Sorin SPA | 1,960,000 | 4,097 |
| | DiaSorin SPA | 54,000 | 1,748 |
| * | Salvatore Ferragamo Italia | | |
| | SPA | 85,314 | 1,382 |
| | Iren SPA | 593,412 | 718 |
| | Immobiliare Grande | | |
| | Distribuzione | 368,683 | 551 |
| | | | 50,265 |
| Japan (19.1%) | | |
| | Modec Inc. | 1,077,700 | 18,814 |
| | Musashi Seimitsu | | |
| | Industry Co. Ltd. | 774,400 | 18,306 |
| | Koito Manufacturing | | |
| | Co. Ltd. | 1,002,000 | 15,103 |
| | Nifco Inc. | 570,300 | 14,874 |
| ^ | Arcs Co. Ltd. | 770,300 | 13,715 |
| | Tokai Tokyo Financial | | |
| | Holdings Inc. | 4,861,000 | 13,501 |
| ^ | Nichi-iko | | |
| | Pharmaceutical Co. Ltd. | 562,500 | 13,271 |
| | Nihon Parkerizing Co. Ltd. | 939,000 | 12,641 |
| | OSAKA Titanium | | |
| | Technologies Co. | 227,200 | 12,514 |
| | NEC Networks & System | | |
| | Integration Corp. | 812,400 | 12,215 |
| | Nippon Thompson | | |
| | Co. Ltd. | 1,872,000 | 12,057 |
| | Kureha Corp. | 2,642,000 | 11,800 |
| | Glory Ltd. | 545,000 | 11,665 |
| | Tsuruha Holdings Inc. | 221,800 | 11,332 |
| | Accordia Golf Co. Ltd. | 15,276 | 11,247 |
| | Tsumura & Co. | 399,400 | 11,233 |
| ^ | Toyo Tanso Co. Ltd. | 236,000 | 10,950 |
| | Nippon Soda Co. Ltd. | 2,336,000 | 10,753 |
| | Daido Steel Co. Ltd. | 1,767,000 | 10,708 |
| | Lintec Corp. | 504,900 | 10,666 |
| | Nitta Corp. | 578,700 | 10,505 |
| | Trusco Nakayama Corp. | 560,900 | 10,392 |
| | Hitachi Transport | | |
| | System Ltd. | 578,100 | 10,059 |
| | Kuroda Electric Co. Ltd. | 881,000 | 9,593 |
| | JSP Corp. | 633,400 | 9,297 |
| | | |
| | | | Market |
| | | | Value |
| | | Shares | ($000) |
| | Asahi Diamond Industrial | | |
| | Co. Ltd. | 627,600 | 9,242 |
| | Nabtesco Corp. | 357,800 | 7,836 |
| | Exedy Corp. | 265,300 | 7,686 |
| | Yushin Precision | | |
| | Equipment Co. Ltd. | 375,200 | 7,237 |
| | Shinko Plantech Co. Ltd. | 785,400 | 6,976 |
| | Takasago | | |
| | International Corp. | 1,405,000 | 6,561 |
| | Tsutsumi Jewelry Co. Ltd. | 263,900 | 6,149 |
| | Aica Kogyo Co. Ltd. | 437,800 | 5,923 |
| | Miura Co. Ltd. | 206,900 | 5,551 |
| | Sumida Corp. | 580,400 | 4,505 |
| | Nidec Copal Corp. | 384,400 | 4,074 |
| | Shinmaywa Industries Ltd. | 927,000 | 3,134 |
| | Icom Inc. | 126,600 | 3,094 |
| | Nafco Co. Ltd. | 135,800 | 2,315 |
| | Fujikura Kasei Co. Ltd. | 448,200 | 2,107 |
| | Unipres Corp. | 70,400 | 1,920 |
| | Benesse Holdings Inc. | 32,600 | 1,416 |
| | Kakaku.com Inc. | 31,200 | 1,235 |
| | Hino Motors Ltd. | 202,000 | 1,186 |
| | Cosmos | | |
| | Pharmaceutical Corp. | 22,300 | 1,034 |
| | Shionogi & Co. Ltd. | 73,200 | 996 |
| | Message Co. Ltd. | 306 | 990 |
| | Pigeon Corp. | 26,700 | 987 |
| | Nikkiso Co. Ltd. | 115,000 | 956 |
| | Dena Co. Ltd. | 20,400 | 881 |
| | Sega Sammy Holdings Inc. | 38,100 | 828 |
| * | Acom Co. Ltd. | 44,780 | 786 |
| | IHI Corp. | 328,000 | 747 |
| | IBJ Leasing Co. Ltd. | 32,600 | 730 |
| | Tokyo Ohka Kogyo Co. Ltd. | 34,100 | 709 |
| | CyberAgent Inc. | 208 | 701 |
| | Teijin Ltd. | 196,000 | 684 |
| | Hitachi Metals Ltd. | 60,000 | 681 |
| | Fuji Heavy Industries Ltd. | 106,000 | 672 |
| | Hoshizaki Electric Co. Ltd. | 28,700 | 641 |
| | Mitsubishi Gas | | |
| | Chemical Co. Inc. | 98,000 | 640 |
| | Osaka Securities | | |
| | Exchange Co. Ltd. | 134 | 634 |
| * | Kenedix Inc. | 4,226 | 627 |
| | Matsui Securities Co. Ltd. | 132,700 | 625 |
| | Start Today Co. Ltd. | 29,100 | 616 |
| | Square Enix Holdings | | |
| | Co. Ltd. | 30,500 | 580 |
| | Amada Co. Ltd. | 83,000 | 551 |
| | Nihon Nohyaku Co. Ltd. | 123,000 | 541 |
| | Jafco Co. Ltd. | 25,400 | 521 |
| | Nippon Denko Co. Ltd. | 97,000 | 517 |
| | Proto Corp. | 15,200 | 516 |
| | Mori Seiki Co. Ltd. | 55,300 | 502 |
| | Mitsui-Soko Co. Ltd. | 140,000 | 490 |
18
| | | |
| International Explorer Fund | | |
| |
| |
| |
| | | | Market |
| | | | Value |
| | | Shares | ($000) |
| | Disco Corp. | 9,100 | 481 |
| | Yamato Kogyo Co. Ltd. | 18,000 | 455 |
| | Japan Petroleum | | |
| | Exploration Co. | 10,900 | 431 |
| | Yaskawa Electric Corp. | 44,000 | 378 |
| | Torishima Pump | | |
| | Manufacturing Co. Ltd. | 27,200 | 376 |
| | Denki Kagaku Kogyo KK | 89,000 | 339 |
| | Konami Corp. | 9,400 | 306 |
| | Makino Milling Machine | | |
| | Co. Ltd. | 44,000 | 292 |
| | | | 418,799 |
| Luxembourg (0.1%) | | |
| * | Reinet Investments SCA | 53,608 | 922 |
| 2 | O’Key Group SA GDR | 88,261 | 646 |
| | | | 1,568 |
| Malaysia (0.5%) | | |
| | Axiata Group Bhd. | 6,711,700 | 10,608 |
| | Media Prima Bhd. | 1,202,900 | 991 |
| | | | 11,599 |
| Mexico (0.1%) | | |
| * | Desarrolladora Homex | | |
| | SAB de CV ADR | 205,715 | 3,078 |
| |
| Netherlands (4.6%) | | |
| ^ | Delta Lloyd NV | 1,472,011 | 25,848 |
| | Imtech NV | 850,000 | 25,111 |
| | Fugro NV | 400,000 | 23,492 |
| ^,* | TomTom NV | 2,600,000 | 12,971 |
| | Koninklijke Ten Cate NV | 267,833 | 9,194 |
| ^,* | LBi International NV | 1,466,670 | 3,168 |
| | DOCdata NV | 35,716 | 590 |
| | | | 100,374 |
| New Zealand (1.1%) | | |
| | Fletcher Building Ltd. | 3,825,586 | 20,400 |
| ^ | Fletcher Building Ltd. | | |
| | (Australia Shares) | 757,764 | 4,049 |
| | | | 24,449 |
| Norway (2.1%) | | |
| | Statoil Fuel & Retail ASA | 2,200,000 | 17,413 |
| | Storebrand ASA | 2,386,562 | 14,581 |
| * | Morpol ASA | 2,310,000 | 4,604 |
| * | Dockwise Ltd. | 262,776 | 4,281 |
| * | Pronova BioPharma AS | 3,200,000 | 2,876 |
| | Kongsberg Gruppen AS | 67,059 | 1,437 |
| * | Petroleum | | |
| | Geo-Services ASA | 53,469 | 581 |
| | | | 45,773 |
| Philippines (0.1%) | | |
| | Semirara Mining Corp. | | |
| | Class A | 383,550 | 1,903 |
| |
| Russia (0.0%) | | |
| * | Pharmstandard OJSC GDR | 34,591 | 614 |
| | | |
| | | | Market |
| | | | Value |
| | | Shares | ($000) |
| Singapore (2.8%) | | |
| | First Resources Ltd. | 13,749,000 | 15,393 |
| | Mapletree Industrial Trust | 8,975,880 | 8,256 |
| | STX OSV Holdings Ltd. | 8,862,000 | 7,842 |
| | UOL Group Ltd. | 2,188,000 | 7,735 |
| * | Biosensors International | | |
| | Group Ltd. | 6,834,000 | 7,618 |
| | SembCorp Industries Ltd. | 2,192,000 | 7,227 |
| | Yanlord Land Group Ltd. | 3,473,000 | 2,818 |
| | SIA Engineering Co. Ltd. | 877,000 | 2,564 |
| * | Indofood Agri | | |
| | Resources Ltd. | 616,000 | 670 |
| | Sakari Resources Ltd. | 354,000 | 661 |
| | | | 60,784 |
| South Africa (0.0%) | | |
| | Aquarius Platinum Ltd. | 130,938 | 390 |
| |
| South Korea (2.1%) | | |
| | Hankook Tire Co. Ltd. | 321,870 | 12,847 |
| * | BS Financial Group Inc. | 958,010 | 10,544 |
| | Mando Corp. | 47,885 | 8,202 |
| | Seoul | | |
| | Semiconductor Co. Ltd. | 279,010 | 5,703 |
| | Hyundai Development Co. | 246,210 | 5,085 |
| * | Taewoong Co. Ltd. | 88,288 | 2,572 |
| | Hotel Shilla Co. Ltd. | 27,490 | 925 |
| | Green Cross Corp. | 4,117 | 636 |
| | | | 46,514 |
| Spain (0.7%) | | |
| | Pescanova SA | 160,000 | 5,511 |
| * | Codere SA | 450,000 | 5,146 |
| * | Distribuidora Internacional | | |
| | de Alimentacion SA | 711,683 | 3,255 |
| * | Grifols SA | 24,845 | 462 |
| | | | 14,374 |
| Sweden (0.9%) | | |
| | Byggmax Group AB | 2,795,000 | 13,077 |
| | Kungsleden AB | 730,000 | 5,582 |
| * | FinnvedenBulten AB | 240,000 | 1,435 |
| | Bjoern Borg AB | 66,982 | 395 |
| | | | 20,489 |
| Switzerland (4.1%) | | |
| | Helvetia Holding AG | 65,000 | 23,750 |
| | Kuoni Reisen Holding AG | 66,250 | 22,596 |
| * | Gategroup Holding AG | 450,000 | 15,274 |
| | Orior AG | 225,000 | 12,158 |
| | Forbo Holding AG | 18,000 | 8,506 |
| * | Temenos Group AG | 216,436 | 4,116 |
| * | Dufry AG | 18,477 | 1,978 |
| | Adecco SA | 11,395 | 547 |
| | | | 88,925 |
| Taiwan (0.4%) | | |
| | Largan Precision Co. Ltd. | 271,000 | 6,058 |
| | Bank of Kaohsiung | 8,735,445 | 2,817 |
| | | | 8,875 |
19
| | | |
| International Explorer Fund | | |
| |
| |
| |
| | | | Market |
| | | | Value |
| | | Shares | ($000) |
| Thailand (0.2%) | | |
| | Big C Supercenter PCL | 866,500 | 3,092 |
| | Quality Houses PCL | 43,810,300 | 1,906 |
| | | | 4,998 |
| United Kingdom (15.4%) | | |
| * | Premier Oil plc | 3,100,000 | 18,250 |
| * | Sports Direct | | |
| | International plc | 4,711,842 | 17,357 |
| | Ultra Electronics | | |
| | Holdings plc | 544,747 | 13,899 |
| | Elementis plc | 5,800,000 | 13,390 |
| | Telecom Plus plc | 1,096,552 | 13,040 |
| | Millennium & Copthorne | | |
| | Hotels plc | 1,669,270 | 11,935 |
| | Dechra | | |
| | Pharmaceuticals plc | 1,483,982 | 11,711 |
| * | Gulfsands Petroleum plc | 3,581,812 | 10,730 |
| * | London Mining plc | 2,016,210 | 10,336 |
| | Atkins WS plc | 1,100,000 | 10,119 |
| | Booker Group plc | 8,000,000 | 9,635 |
| | Highland Gold Mining Ltd. | 3,000,000 | 9,230 |
| | CPP Group plc | 3,855,275 | 9,000 |
| | William Hill plc | 2,450,082 | 8,504 |
| | CSR plc | 2,769,413 | 8,032 |
| | SIG plc | 5,000,000 | 7,704 |
| | John Wood Group plc | 772,222 | 7,646 |
| | Devro plc | 1,860,201 | 7,347 |
| | Lamprell plc | 1,791,277 | 6,944 |
| | Inchcape plc | 1,300,000 | 6,788 |
| | Grainger plc | 4,915,405 | 6,624 |
| | Premier Farnell plc | 2,200,000 | 6,172 |
| | National Express | | |
| | Group plc | 1,609,166 | 5,944 |
| | Petropavlovsk plc | 500,000 | 5,885 |
| * | LMS Capital plc | 6,150,108 | 5,807 |
| | Eco Animal Health | | |
| | Group plc | 1,618,166 | 5,685 |
| | Go-Ahead Group plc | 253,964 | 5,660 |
| | QinetiQ Group plc | 3,000,000 | 5,623 |
| * | Spirit Pub Co. plc | 7,000,000 | 5,374 |
| | Paragon Group of | | |
| | Cos. plc | 1,905,916 | 4,961 |
| | Hunting plc | 461,410 | 4,915 |
| | Micro Focus | | |
| | International plc | 850,630 | 4,602 |
| | Informa plc | 768,152 | 4,461 |
| | Photo-Me | | |
| | International plc | 4,197,604 | 4,167 |
| * | BTG plc | 895,883 | 3,972 |
| | Halma plc | 700,000 | 3,762 |
| | | |
| | | | Market |
| | | | Value |
| | | Shares | ($000) |
| | Travis Perkins plc | 258,937 | 3,571 |
| | Morgan Crucible Co. plc | 750,000 | 3,404 |
| | Pace plc | 2,533,282 | 3,216 |
| | Regus plc | 2,500,000 | 3,034 |
| | International Personal | | |
| | Finance plc | 500,000 | 2,195 |
| | RM plc | 2,034,198 | 2,189 |
| * | Findel plc | 32,007,307 | 1,967 |
| | Babcock International | | |
| | Group plc | 160,810 | 1,817 |
| | Speedy Hire plc | 4,500,000 | 1,483 |
| * | Wolfson | | |
| | Microelectronics plc | 761,873 | 1,433 |
| | Domino’s Pizza UK | | |
| | & IRL plc | 182,102 | 1,336 |
| | Homeserve plc | 227,366 | 1,277 |
| | Future plc | 7,510,000 | 1,272 |
| * | Punch Taverns plc | 7,000,000 | 1,179 |
| | Chemring Group plc | 142,331 | 1,165 |
| | Kier Group plc | 44,933 | 1,013 |
| | PV Crystalox Solar plc | 6,769,272 | 828 |
| | Persimmon plc | 102,017 | 813 |
| | James Fisher & Sons plc | 90,750 | 808 |
| | Debenhams plc | 690,226 | 719 |
| | Savills plc | 143,783 | 716 |
| | Thomas Cook Group plc | 795,353 | 660 |
| | Rightmove plc | 31,524 | 660 |
| | Hansteen Holdings plc | 528,568 | 655 |
| * | AEA Technology plc | 20,225,045 | 647 |
| | Close Brothers Group plc | 55,903 | 635 |
| | Mears Group plc | 138,879 | 591 |
| | IG Group Holdings plc | 72,624 | 542 |
| | Hays plc | 394,734 | 501 |
| * | APR Energy plc | 26,786 | 483 |
| | N Brown Group plc | 113,006 | 479 |
| * | Bumi plc | 30,761 | 366 |
| * | Alexon Group plc | 7,203,119 | 327 |
| * | Helphire plc | 5,116,692 | 234 |
| * | Hampson Industries plc | 468,311 | 60 |
| * | Pinnacle Staffing Group plc | 673,983 | 9 |
| | | | 337,495 |
| Total Common Stocks | | |
| (Cost $2,073,675) | | 2,070,676 |
| Temporary Cash Investments (9.1%)1 | |
| Money Market Fund (8.7%) | | |
| 3,4 | Vanguard Market | | |
| | Liquidity Fund, | | |
| | 0.128% | 189,155,651 | 189,156 |
20
| | | |
| International Explorer Fund | | |
| |
| |
| |
| | | Face | Market |
| | | Amount | Value• |
| | | ($000) | ($000) |
| Repurchase Agreement (0.1%) | | |
| | Goldman, Sachs & Co. | | |
| | 0.110%, 11/1/11 | | |
| | (Dated 10/31/11, | | |
| | Repurchase Value | | |
| | $1,800,000, collateralized | | |
| | by Federal Home Loan | | |
| | Mortgage Corp | | |
| | 4.500%–6.500%, | | |
| | 4/1/19–6/1/41, and | | |
| | Federal National | | |
| | Mortgage Assn. | | |
| | 4.500%–7.000%, | | |
| | 3/1/23–4/1/41) | 1,800 | 1,800 |
| |
| U.S. Government and Agency Obligations (0.3%) |
| 5 | Fannie Mae | | |
| | Discount Notes, | | |
| | 0.045%, 12/14/11 | 1,000 | 1,000 |
| 6,7 | Federal Home Loan | | |
| | Bank Discount Notes, | | |
| | 0.075%, 11/16/11 | 5,000 | 5,000 |
| 5,7 | Freddie Mac Discount | | |
| | Notes, 0.080%, 12/1/11 | 300 | 300 |
| 5,7 | Freddie Mac Discount | | |
| | Notes, 0.050%, 12/15/11 | 700 | 700 |
| 5,7 | Freddie Mac Discount | | |
| | Notes, 0.045%, 12/16/11 | 500 | 500 |
| | | | 7,500 |
| Total Temporary Cash Investments | |
| (Cost $198,455) | | 198,456 |
| Total Investments (103.8%) | | |
| (Cost $2,272,130) | | 2,269,132 |
| |
| | Market |
| | Value• |
| | ($000) |
| Other Assets and Liabilities (-3.8%) | |
| Other Assets | 22,991 |
| Liabilities4 | (105,214) |
| | (82,223) |
| Net Assets (100%) | |
| Applicable to 151,808,970 outstanding | |
| $.001 par value shares of beneficial | |
| interest (unlimited authorization) | 2,186,909 |
| Net Asset Value Per Share | $14.41 |
| |
| |
| At October 31, 2011, net assets consisted of: |
| | Amount |
| | ($000) |
| Paid-in Capital | 2,119,053 |
| Undistributed Net Investment Income | 37,020 |
| Accumulated Net Realized Gains | 29,566 |
| Unrealized Appreciation (Depreciation) | |
| Investment Securities | (2,998) |
| Futures Contracts | 2,791 |
| Forward Currency Contracts | 922 |
| Foreign Currencies | 555 |
| Net Assets | 2,186,909 |
• See Note A in Notes to Financial Statements.
^ Part of security position is on loan to broker-dealers. The total value of securities on loan is $83,484,000.
* Non-income-producing security.
1 The fund invests a portion of its cash reserves in equity markets through the use of index futures contracts. After giving effect to futures investments, the fund’s effective common stock and temporary cash investment positions represent 96.7% and 7.1%, respectively, of net assets.
2 Security exempt from registration under Rule 144A of the Securities Act of 1933. Such securities may be sold in transactions exempt from registration, normally to qualified institutional buyers. At October 31, 2011, the value of this security represented 0.0% of net assets.
3 Affiliated money market fund available only to Vanguard funds and certain trusts and accounts managed by Vanguard. Rate shown is the 7-day yield.
4 Includes $89,527,000 of collateral received for securities on loan.
5 The issuer is under federal conservatorship and is dependent upon the continued support of the U.S. Treasury to avoid receivership.
6 The issuer operates under a congressional charter; its securities are not backed by the full faith and credit of the U.S. government.
7 Securities with a value of $6,000,000 have been segregated as initial margin for open futures contracts.
ADR—American Depositary Receipt.
GDR—Global Depositary Receipt.
REIT—Real Estate Investment Trust.
See accompanying Notes, which are an integral part of the Financial Statements.
21
International Explorer Fund
Statement of Operations
| |
| | Year Ended |
| | October 31, 2011 |
| | ($000) |
| Investment Income | |
| Income | |
| Dividends1,2 | 57,535 |
| Interest2 | 249 |
| Security Lending | 2,596 |
| Total Income | 60,380 |
| Expenses | |
| Investment Advisory Fees—Note B | |
| Basic Fee | 4,956 |
| Performance Adjustment | 741 |
| The Vanguard Group—Note C | |
| Management and Administrative | 3,921 |
| Marketing and Distribution | 598 |
| Custodian Fees | 545 |
| Auditing Fees | 34 |
| Shareholders’ Reports | 26 |
| Trustees’ Fees and Expenses | 5 |
| Total Expenses | 10,826 |
| Expenses Paid Indirectly | (54) |
| Net Expenses | 10,772 |
| Net Investment Income | 49,608 |
| Realized Net Gain (Loss) | |
| Investment Securities Sold2 | 145,502 |
| Futures Contracts | (8,931) |
| Foreign Currencies and Forward Currency Contracts | 7,319 |
| Realized Net Gain (Loss) | 143,890 |
| Change in Unrealized Appreciation (Depreciation) | |
| Investment Securities | (383,596) |
| Futures Contracts | 2,894 |
| Foreign Currencies and Forward Currency Contracts | (2,051) |
| Change in Unrealized Appreciation (Depreciation) | (382,753) |
| Net Increase (Decrease) in Net Assets Resulting from Operations | (189,255) |
1 Dividends are net of foreign withholding taxes of $3,398,000.
2 Dividend income, interest income, and realized net gain (loss) from affiliated companies of the fund were $0, $234,000, and ($2,054,000).
See accompanying Notes, which are an integral part of the Financial Statements.
22
International Explorer Fund
Statement of Changes in Net Assets
| | |
| | Year Ended October 31, |
| | 2011 | 2010 |
| | ($000) | ($000) |
| Increase (Decrease) in Net Assets | | |
| Operations | | |
| Net Investment Income | 49,608 | 36,580 |
| Realized Net Gain (Loss) | 143,890 | 109,840 |
| Change in Unrealized Appreciation (Depreciation) | (382,753) | 220,146 |
| Net Increase (Decrease) in Net Assets Resulting from Operations | (189,255) | 366,566 |
| Distributions | | |
| Net Investment Income | (35,218) | (29,545) |
| Realized Capital Gain | — | — |
| Total Distributions | (35,218) | (29,545) |
| Capital Share Transactions | | |
| Issued | 477,122 | 661,913 |
| Issued in Lieu of Cash Distributions | 31,579 | 26,292 |
| Redeemed1 | (532,982) | (501,045) |
| Net Increase (Decrease) from Capital Share Transactions | (24,281) | 187,160 |
| Total Increase (Decrease) | (248,754) | 524,181 |
| Net Assets | | |
| Beginning of Period | 2,435,663 | 1,911,482 |
| End of Period2 | 2,186,909 | 2,435,663 |
1 Net of redemption fees for fiscal 2011 and 2010 of $79,000 and $215,000, respectively.
2 Net Assets—End of Period includes undistributed net investment income of $37,020,000 and $26,689,000.
See accompanying Notes, which are an integral part of the Financial Statements.
23
International Explorer Fund
Financial Highlights
| | | | | |
| For a Share Outstanding | | | Year Ended October 31, |
| Throughout Each Period | 2011 | 2010 | 2009 | 2008 | 2007 |
| Net Asset Value, Beginning of Period | $15.81 | $13.55 | $9.52 | $24.70 | $21.50 |
| Investment Operations | | | | | |
| Net Investment Income | .322 | .237 | .238 | .470 | .480 |
| Net Realized and Unrealized Gain (Loss) | | | | | |
| on Investments | (1.498) | 2.225 | 4.148 | (12.110) | 4.950 |
| Total from Investment Operations | (1.176) | 2.462 | 4.386 | (11.640) | 5.430 |
| Distributions | | | | | |
| Dividends from Net Investment Income | (.224) | (.202) | (.356) | (.620) | (.580) |
| Distributions from Realized Capital Gains | — | — | — | (2.920) | (1.650) |
| Total Distributions | (.224) | (.202) | (.356) | (3.540) | (2.230) |
| Net Asset Value, End of Period | $14.41 | $15.81 | $13.55 | $9.52 | $24.70 |
| |
| Total Return1 | -7.60% | 18.38% | 47.88% | -53.80% | 27.18% |
| |
| Ratios/Supplemental Data | | | | | |
| Net Assets, End of Period (Millions) | $2,187 | $2,436 | $1,911 | $1,079 | $3,252 |
| Ratio of Total Expenses to | | | | | |
| Average Net Assets2 | 0.42% | 0.39% | 0.45% | 0.36% | 0.35% |
| Ratio of Net Investment Income to | | | | | |
| Average Net Assets | 1.93% | 1.67% | 2.10% | 2.59% | 1.99% |
| Portfolio Turnover Rate | 43% | 51% | 52% | 29% | 45% |
1 Total returns do not include transaction or account service fees that may have applied in the periods shown. Fund prospectuses provide information about any applicable transaction and account service fees.
2 Includes performance-based investment advisory fee increases (decreases) of 0.03%, 0.00%, 0.00%, (0.01%), and 0.00%.
See accompanying Notes, which are an integral part of the Financial Statements.
24
International Explorer Fund
Notes to Financial Statements
Vanguard International Explorer Fund is registered under the Investment Company Act of 1940 as an open-end investment company, or mutual fund. The fund invests in securities of foreign issuers, which may subject it to investment risks not normally associated with investing in securities of United States corporations.
A. The following significant accounting policies conform to generally accepted accounting principles for U.S. mutual funds. The fund consistently follows such policies in preparing its financial statements.
1. Security Valuation: Securities are valued as of the close of trading on the New York Stock Exchange (generally 4 p.m., Eastern time) on the valuation date. Equity securities are valued at the latest quoted sales prices or official closing prices taken from the primary market in which each security trades; such securities not traded on the valuation date are valued at the mean of the latest quoted bid and asked prices. Securities for which market quotations are not readily available, or whose values have been affected by events occurring before the fund’s pricing time but after the close of the securities’ primary markets, are valued at their fair values calculated according to procedures adopted by the board of trustees. These procedures include obtaining quotations from an independent pricing service, monitoring news to identify significant market- or security-specific events, and evaluating changes in the values of foreign market proxies (for example, ADRs, futures contracts, or exchange-traded funds), between the time the foreign markets close and the fund’s pricing time. When fair-value pricing is employed, the prices of securities used by a fund to calculate its net asset value may differ from quoted or published prices for the same securities. Investments in Vanguard Market Liquidity Fund are valued at that fund’s net asset value. Temporary cash investments acquired over 60 days to maturity are valued using the latest bid prices or using valuations based on a matrix system (which considers such factors as security prices, yields, maturities, and ratings), both as furnished by independent pricing services. Other temporary cash investments are valued at amortized cost, which approximates market value.
2. Foreign Currency: Securities and other assets and liabilities denominated in foreign currencies are translated into U.S. dollars using exchange rates obtained from an independent third party as of the fund’s pricing time on the valuation date. Realized gains (losses) and unrealized appreciation (depreciation) on investment securities include the effects of changes in exchange rates since the securities were purchased, combined with the effects of changes in security prices. Fluctuations in the value of other assets and liabilities resulting from changes in exchange rates are recorded as unrealized foreign currency gains (losses) until the assets or liabilities are settled in cash, at which time they are recorded as realized foreign currency gains (losses).
3. Futures and Forward Currency Contracts: The fund uses index futures contracts to a limited extent, with the objective of maintaining full exposure to the stock market while maintaining liquidity. The fund may purchase or sell futures contracts to achieve a desired level of investment, whether to accommodate portfolio turnover or cash flows from capital share transactions. The primary risks associated with the use of futures contracts are imperfect correlation between changes in market values of stocks held by the fund and the prices of futures contracts, and the possibility of an illiquid market.
The fund also enters into forward currency contracts to provide the appropriate currency exposure related to any open futures contracts or to protect the value of securities and related receivables and payables against changes in foreign exchange rates. The primary risk associated with the fund’s use of these contracts is that a counterparty will fail to fulfill its obligation to pay gains due to the fund under the contracts. Counterparty risk is mitigated by entering into forward currency contracts only with highly rated counterparties, by a master netting arrangement between the fund and the counterparty,
25
International Explorer Fund
and by the posting of collateral by the counterparty. The forward currency contracts contain provisions whereby a counterparty may terminate open contracts if the fund’s net assets decline below a certain level, triggering a payment by the fund if the fund is in a net liability position at the time of the termination. The payment amount would be reduced by any collateral the fund has posted. Any securities posted as collateral for open contracts are noted in the Statement of Net Assets.
Futures contracts are valued at their quoted daily settlement prices. Forward currency contracts are valued at their quoted daily prices obtained from an independent third party, adjusted for currency risk based on the expiration date of each contract. The aggregate principal amounts of the contracts are not recorded in the Statement of Net Assets. Fluctuations in the value of the contracts are recorded in the Statement of Net Assets as an asset (liability) and in the Statement of Operations as unrealized appreciation (depreciation) until the contracts are closed, when they are recorded as realized gains (losses) on futures or forward currency contracts.
4. Repurchase Agreements: The fund may enter into repurchase agreements. Securities pledged as collateral for repurchase agreements are held by a custodian bank until the agreements mature. Each agreement requires that the market value of the collateral be sufficient to cover payments of interest and principal. In the event of default or bankruptcy by the other party to the agreement, the fund may sell or retain the collateral; however, such action may be subject to legal proceedings.
5. Federal Income Taxes: The fund intends to continue to qualify as a regulated investment company and distribute all of its taxable income. Management has analyzed the fund’s tax positions taken for all open federal income tax years (October 31, 2008–2011), and has concluded that no provision for federal income tax is required in the fund’s financial statements.
6. Distributions: Distributions to shareholders are recorded on the ex-dividend date.
7. Security Lending: The fund may lend its securities to qualified institutional borrowers to earn additional income. Security loans are required to be secured at all times by collateral at least equal to the market value of securities loaned. The fund invests cash collateral received in Vanguard Market Liquidity Fund, and records a liability for the return of the collateral, during the period the securities are on loan. Security lending income represents fees charged to borrowers plus income earned on investing cash collateral, less expenses associated with the loan.
8. Other: Dividend income is recorded on the ex-dividend date. Interest income includes income distributions received from Vanguard Market Liquidity Fund and is accrued daily. Security transactions are accounted for on the date securities are bought or sold. Costs used to determine realized gains (losses) on the sale of investment securities are those of the specific securities sold. Fees assessed on redemptions of capital shares are credited to paid-in capital.
B. Schroder Investment Management North America Inc., and Wellington Management Co., LLP, each provide investment advisory services to a portion of the fund for a fee calculated at an annual percentage rate of average net assets managed by the advisor. The basic fee of Schroder Investment Management North America Inc. is subject to quarterly adjustments based on the fund’s performance for the preceding three years relative to the S&P EPAC SmallCap Index. The basic fee of Wellington Management Co., LLP, is subject to quarterly adjustments based on performance since July 31, 2010, relative to the S&P EPAC SmallCap Index.
The Vanguard Group manages the cash reserves of the fund on an at-cost basis.
For the year ended October 31, 2011, the aggregate investment advisory fee represented an effective annual basic rate of 0.19% of the fund’s average net assets, before an increase of $741,000 (0.03%) based on performance.
26
International Explorer Fund
C. The Vanguard Group furnishes at cost corporate management, administrative, marketing, and distribution services. The costs of such services are allocated to the fund under methods approved by the board of trustees. The fund has committed to provide up to 0.40% of its net assets in capital contributions to Vanguard. At October 31, 2011, the fund had contributed capital of $355,000 to Vanguard (included in Other Assets), representing 0.02% of the fund’s net assets and 0.14% of Vanguard’s capitalization. The fund’s trustees and officers are also directors and officers of Vanguard.
D. The fund has asked its investment advisors to direct certain security trades, subject to obtaining the best price and execution, to brokers who have agreed to rebate to the fund part of the commissions generated. Such rebates are used solely to reduce the fund’s management and administrative expenses. For the year ended October 31, 2011, these arrangements reduced the fund’s expenses by $54,000 (an annual rate of 0.00% of average net assets).
E. Various inputs may be used to determine the value of the fund’s investments. These inputs are summarized in three broad levels for financial statement purposes. The inputs or methodologies used to value securities are not necessarily an indication of the risk associated with investing in those securities.
Level 1—Quoted prices in active markets for identical securities.
Level 2—Other significant observable inputs (including quoted prices for similar securities, interest rates, prepayment speeds, credit risk, etc.).
Level 3—Significant unobservable inputs (including the fund’s own assumptions used to determine the fair value of investments).
The following table summarizes the fund’s investments as of October 31, 2011, based on the inputs used to value them:
| | | |
| | Level 1 | Level 2 | Level 3 |
| Investments | ($000) | ($000) | ($000) |
| Common Stocks | 74,208 | 1,996,468 | — |
| Temporary Cash Investments | 189,156 | 9,300 | — |
| Futures Contracts—Liabilities1 | (1,162) | — | — |
| Forward Currency Contracts—Assets | — | 1,117 | — |
| Forward Currency Contracts—Liabilities | — | (195) | — |
| Total | 262,202 | 2,006,690 | — |
| 1 Represents variation margin on the last day of the reporting period. |
The following table summarizes changes in investments valued based on Level 3 inputs during the year ended October 31, 2011. Transfers into or out of Level 3 are recognized based on values as of the date of transfer.
| |
| | Investments in |
| | Common Stocks |
| Amount Valued Based on Level 3 Inputs | ($000) |
| Balance as of October 31, 2010 | 4 |
| Change in Unrealized Appreciation (Depreciation) | 8,138 |
| Net Realized Gain (Loss) | (8,142) |
| Balance as of October 31, 2011 | — |
27
International Explorer Fund
F. At October 31, 2011, the fair values of derivatives were reflected in the Statement of Net Assets as follows:
| | | |
| | | Foreign | |
| | Equity | Exchange | |
| | Contracts | Contracts | Total |
| Statement of Net Assets Caption | ($000) | ($000) | ($000) |
| Other Assets | — | 1,117 | 1,117 |
| Liabilities | (1,162) | (195) | (1,357) |
Realized net gain (loss) and the change in unrealized appreciation (depreciation) on derivatives for the year ended October 31, 2011, were:
| | | |
| | | Foreign | |
| | Equity | Exchange | |
| | Contracts | Contracts | Total |
| Realized Net Gain (Loss) on Derivatives | ($000) | ($000) | ($000) |
| Futures Contracts | (8,931) | — | (8,931) |
| Forward Currency Contracts | — | 7,492 | 7,492 |
| Realized Net Gain (Loss) on Derivatives | (8,931) | 7,492 | (1,439) |
| |
| Change in Unrealized Appreciation (Depreciation) on Derivatives | | | |
| Futures Contracts | 2,894 | — | 2,894 |
| Forward Currency Contracts | — | (1,920) | (1,920) |
| Change in Unrealized Appreciation (Depreciation) on Derivatives | 2,894 | (1,920) | 974 |
At October 31, 2011, the aggregate settlement value of open futures contracts and the related unrealized appreciation (depreciation) were:
| | | | |
| | | | | ($000) |
| | | | Aggregate | |
| | | Number of | Settlement | Unrealized |
| | | Long (Short) | Value | Appreciation |
| Futures Contracts | Expiration | Contracts | Long (Short) | (Depreciation) |
| Topix Index | December 2011 | 151 | 14,698 | 232 |
| Dow Jones EURO STOXX 50 Index | December 2011 | 363 | 12,091 | 1,444 |
| S&P ASX 200 Index | December 2011 | 95 | 10,795 | 711 |
| FTSE 100 Index | December 2011 | 57 | 5,095 | 404 |
Unrealized appreciation (depreciation) on open FTSE 100 Index futures contracts is required to be treated as realized gain (loss) for tax purposes.
28
International Explorer Fund
At October 31, 2011, the fund had open forward currency contracts to receive and deliver currencies as follows. Unrealized appreciation (depreciation) on open forward currency contracts is treated as realized gain (loss) for tax purposes.
| | | | | | |
| | | | | | | Unrealized |
| | Contract | | | | | Appreciation |
| | Settlement | | | Contract Amount (000) | (Depreciation) |
| Counterparty | Date | | Receive | | Deliver | ($000) |
| Brown Brothers Harriman & Co. | 12/14/11 | JPY | 1,121,934 | USD | 14,401 | (195) |
| Brown Brothers Harriman & Co. | 12/21/11 | EUR | 6,666 | USD | 9,294 | 249 |
| Brown Brothers Harriman & Co. | 12/21/11 | AUD | 9,388 | USD | 9,898 | 732 |
| Brown Brothers Harriman & Co. | 12/21/11 | GBP | 2,798 | USD | 4,513 | 136 |
AUD—Australian dollar.
EUR—Euro.
GBP—British pound.
JPY—Japanese yen.
USD—U.S. dollar.
At October 31, 2011, the counterparty had deposited in a segregated account cash with a value sufficient to cover substantially all amounts due to the fund in connection with open forward currency contracts.
G. Distributions are determined on a tax basis and may differ from net investment income and realized capital gains for financial reporting purposes. Differences may be permanent or temporary. Permanent differences are reclassified among capital accounts in the financial statements to reflect their tax character. Temporary differences arise when certain items of income, expense, gain, or loss are recognized in different periods for financial statement and tax purposes; these differences will reverse at some time in the future. Differences in classification may also result from the treatment of short-term gains as ordinary income for tax purposes.
During the year ended October 31, 2011, the fund realized net foreign currency losses of $173,000, which decreased distributable net income for tax purposes; accordingly, such losses have been reclassified from accumulated net realized gains to undistributed net investment income. Certain of the fund’s investments are in securities considered to be “passive foreign investment companies,” for which any unrealized appreciation and/or realized gains are required to be included in distributable net income for tax purposes. During the year ended October 31, 2011, the fund realized gains on the sale of passive foreign investment companies of $1,542,000, which have been included in current and prior periods’ taxable income; accordingly, such gains have been reclassified from accumulated net realized gains to undistributed net investment income. Passive foreign investment companies held at October 31, 2011, had unrealized appreciation of $5,638,000, of which $2,608,000 has been distributed and is reflected in the balance of undistributed net investment income.
The fund used a tax accounting practice to treat a portion of the price of capital shares redeemed during the year as distributions from net investment income and realized capital gains. Accordingly, the fund has reclassified $5,428,000 from undistributed net investment income, and $5,292,000 from accumulated net realized gains, to paid-in capital.
29
International Explorer Fund
The fund used a capital loss carryforward of $105,115,000 to offset taxable capital gains realized during the year ended October 31, 2011, reducing the amount of capital gains that would otherwise be available to distribute to shareholders. For tax purposes, at October 31, 2011, the fund had $47,330,000 of ordinary income and $30,489,000 of long-term capital gains available for distribution.
At October 31, 2011, the cost of investment securities for tax purposes was $2,277,768,000. Net unrealized depreciation of investment securities for tax purposes was $8,636,000, consisting of unrealized gains of $292,096,000 on securities that had risen in value since their purchase and $300,732,000 in unrealized losses on securities that had fallen in value since their purchase.
H. During the year ended October 31, 2011, the fund purchased $1,067,375,000 of investment securities and sold $1,030,274,000 of investment securities, other than temporary cash investments.
I. The fund invested in a company that was considered to be an affiliated company of the fund because the fund owned more than 5% of the outstanding voting securities of the company. Transactions during the period in securities of this company were as follows:
| | | | | |
| | | | Current Period Transactions | |
| | Oct. 31, 2010 | | Proceeds from | | Oct. 31, 2011 |
| | Market | Purchases | Securities | Dividend | Market |
| | Value | at Cost | Sold | Income | Value |
| | ($000) | ($000) | ($000) | ($000) | ($000) |
| AEA Technology plc | 1,303 | 734 | 123 | — | NA1 |
1 Not applicable—At October 31, 2011, the security was still held, but the issuer was no longer an affiliated company of the fund.
J. Capital shares issued and redeemed were:
| | |
| | Year Ended October 31, |
| | 2011 | 2010 |
| | Shares | Shares |
| | (000) | (000) |
| Issued | 29,247 | 46,958 |
| Issued in Lieu of Cash Distributions | 1,940 | 1,900 |
| Redeemed | (33,420) | (35,926) |
| Net Increase (Decrease) in Shares Outstanding | (2,233) | 12,932 |
K. In preparing the financial statements as of October 31, 2011, management considered the impact of subsequent events for potential recognition or disclosure in these financial statements.
30
Report of Independent Registered
Public Accounting Firm
To the Trustees of Vanguard Whitehall Funds and the Shareholders of Vanguard International Explorer Fund:
In our opinion, the accompanying statement of net assets and the related statements of operations and of changes in net assets and the financial highlights present fairly, in all material respects, the financial position of Vanguard International Explorer Fund (constituting a separate portfolio of Vanguard Whitehall Funds, hereafter referred to as the “Fund”) at October 31, 2011, the results of its operations for the year then ended, the changes in its net assets for each of the two years in the period then ended and the financial highlights for each of the five years in the period then ended, in conformity with accounting principles generally accepted in the United States of America. These financial statements and financial highlights (hereafter referred to as “financial statements”) are the responsibility of the Fund’s management; our responsibility is to express an opinion on these financial statements based on our audits. We conducted our audits of these financial statements in accordance with the standards of the Public Company Accounting Oversight Board (United States). Those standards require that we plan and perform the audit to obtain reasonable assurance about whether the financial statements are free of material misstatement. An audit includes examining, on a test basis, evidence supporting the amounts and disclosures in the financial statements, assessing the accounting principles used and significant estimates made by management, and evaluating the overall financial statement presentation. We believe that our audits, which included confirmation of securities at October 31, 2011 by correspondence with the custodians and brokers and by agreement to the underlying ownership records of Vanguard Market Liquidity Fund, provide a reasonable basis for our opinion.
PricewaterhouseCoopers LLP
Philadelphia, Pennsylvania
December 12, 2011
|
| Special 2011 tax information (unaudited) for Vanguard International Explorer Fund |
The fund distributed $5,293,000 as capital gain dividends (from net long-term capital gains) to shareholders during the fiscal year.
The fund distributed $29,051,000 of qualified dividend income to shareholders during the fiscal year.
The fund designates to shareholders foreign source income of $52,431,000 and foreign taxes paid of $3,350,000. Shareholders will receive more detailed information with their Form 1099-DIV in January 2012 to determine the calendar-year amounts to be included on their 2011 tax returns.
31
Your Fund’s After-Tax Returns
This table presents returns for your fund both before and after taxes. The after-tax returns are shown in two ways: (1) assuming that an investor owned the fund during the entire period and paid taxes on the fund’s distributions, and (2) assuming that an investor paid taxes on the fund’s distributions and sold all shares at the end of each period.
Calculations are based on the highest individual federal income tax and capital gains tax rates in effect at the times of the distributions and the hypothetical sales. State and local taxes were not considered. After-tax returns reflect any qualified dividend income, using actual prior-year figures and estimates for 2011. (In the example, returns after the sale of fund shares may be higher than those assuming no sale. This occurs when the sale would have produced a capital loss. The calculation assumes that the investor received a tax deduction for the loss.)
Please note that your actual after-tax returns will depend on your tax situation and may differ from those shown. Also note that if you own the fund in a tax-deferred account, such as an individual retirement account or a 401(k) plan, this information does not apply to you. Such accounts are not subject to current taxes.
Finally, keep in mind that a fund’s performance—whether before or after taxes—does not guarantee future results.
Average Annual Total Returns: International Explorer Fund
Periods Ended October 31, 2011
| | | |
| | One | Five | Ten |
| | Year | Years | Years |
| Returns Before Taxes | -7.60% | -1.01% | 10.16% |
| Returns After Taxes on Distributions | -7.77 | -2.03 | 9.21 |
| Returns After Taxes on Distributions and Sale of Fund Shares | -4.62 | -0.84 | 8.90 |
Returns do not reflect the 2% fee on redemptions of shares held for less than two months.
32
About Your Fund’s Expenses
As a shareholder of the fund, you incur ongoing costs, which include costs for portfolio management, administrative services, and shareholder reports (like this one), among others. Operating expenses, which are deducted from a fund’s gross income, directly reduce the investment return of the fund.
A fund’s expenses are expressed as a percentage of its average net assets. This figure is known as the expense ratio. The following examples are intended to help you understand the ongoing costs (in dollars) of investing in your fund and to compare these costs with those of other mutual funds. The examples are based on an investment of $1,000 made at the beginning of the period shown and held for the entire period.
The accompanying table illustrates your fund’s costs in two ways:
• Based on actual fund return. This section helps you to estimate the actual expenses that you paid over the period. The ”Ending Account Value“ shown is derived from the fund‘s actual return, and the third column shows the dollar amount that would have been paid by an investor who started with $1,000 in the fund. You may use the information here, together with the amount you invested, to estimate the expenses that you paid over the period.
To do so, simply divide your account value by $1,000 (for example, an $8,600 account value divided by $1,000 = 8.6), then multiply the result by the number given for your fund under the heading ”Expenses Paid During Period.“
• Based on hypothetical 5% yearly return. This section is intended to help you compare your fund‘s costs with those of other mutual funds. It assumes that the fund had a yearly return of 5% before expenses, but that the expense ratio is unchanged. In this case—because the return used is not the fund’s actual return—the results do not apply to your investment. The example is useful in making comparisons because the Securities and Exchange Commission requires all mutual funds to calculate expenses based on a 5% return. You can assess your fund’s costs by comparing this hypothetical example with the hypothetical examples that appear in shareholder reports of other funds.
Note that the expenses shown in the table are meant to highlight and help you compare ongoing costs only and do not reflect transaction costs incurred by the fund for buying and selling securities. Further, the expenses do not include any purchase, redemption, or account service fees described in the fund prospectus. If such fees were applied to your account, your costs would be higher. Your fund does not carry a “sales load.”
The calculations assume no shares were bought or sold during the period. Your actual costs may have been higher or lower, depending on the amount of your investment and the timing of any purchases or redemptions.
You can find more information about the fund’s expenses, including annual expense ratios, in the Financial Statements section of this report. For additional information on operating expenses and other shareholder costs, please refer to your fund’s current prospectus.
33
| | | |
| Six Months Ended October 31, 2011 | | | |
| | Beginning | Ending | Expenses |
| | Account Value | Account Value | Paid During |
| International Explorer Fund | 4/30/2011 | 10/31/2011 | Period |
| Based on Actual Fund Return | $1,000.00 | $804.13 | $1.91 |
| Based on Hypothetical 5% Yearly Return | 1,000.00 | 1,023.09 | 2.14 |
The calculations are based on expenses incurred in the most recent six-month period. The fund’s annualized six-month expense ratio for that period is 0.42%. The dollar amounts shown as “Expenses Paid” are equal to the annualized expense ratio multiplied by the average account value over the period, multiplied by the number of days in the most recent six-month period, then divided by the number of days in the most recent 12-month period.
34
Trustees Approve Advisory Agreements
The board of trustees of Vanguard International Explorer Fund has renewed the fund’s investment advisory agreements with Schroder Investment Management North America Inc. and Wellington Management Company, LLP, as well as a sub-advisory agreement with Schroder Investment Management North America Limited. The board determined that the retention of the advisors was in the best interests of the fund and its shareholders.
The board based its decisions upon an evaluation of each advisor’s investment staff, portfolio management process, and performance. The trustees considered the factors discussed below, among others. However, no single factor determined whether the board approved the agreements. Rather, it was the totality of the circumstances that drove the board’s decision.
Nature, extent, and quality of services
The board considered the quality of the fund’s investment management over both the short and long term, and took into account the organizational depth and stability of each advisor. The board noted the following:
Schroder Investment Management North America. Schroders plc, the parent company of Schroder Investment Management, has existed for more than 200 years and has investment management experience dating back to 1926. Schroder continues to employ a sound process, selecting attractive small-cap growth stocks from developed and emerging markets outside the United States. Schroders’ International Small Cap Investment Committee is responsible for the management of its portion of the fund. Stocks are selected using a bottom-up approach, supported by Schroder’s worldwide network of analysts, economists, and strategists. The firm has advised the fund since 1996.
Wellington Management Company, LLP. Wellington Management, founded in 1928, is among the nation’s oldest and most respected institutional investment managers. Wellington Management’s international small-cap team uses a fundamental investment process and has achieved solid performance results. The team employs a traditional, bottom-up process that attempts to discover a company’s intrinsic value. In valuing a company, it believes that the same valuation metric should be applied on an industry-by-industry basis. Although the team’s valuation discipline is essential to the process, its philosophy is not biased towards growth or value as it invests in both extended growth opportunities and neglected or misunderstood companies. The firm has advised a portion of the fund since 2010.
The board concluded that each advisor’s experience, stability, depth, and performance, among other factors, warranted continuation of the advisory agreements.
Investment performance
The board considered the short- and long-term performance of the fund, including any periods of outperformance or underperformance of a relevant benchmark and peer group. The board concluded that each advisor has carried out the fund’s investment strategy in disciplined fashion, and the performance results have allowed the fund to remain competitive versus its benchmark and peer group. Information about the fund’s most recent performance can be found in the Performance Summary section of this report.
35
Cost
The board concluded that the fund’s expense ratio was well below the average expense ratio charged by funds in its peer group and that the fund’s advisory fee rate was also well below its peer-group average. Information about the fund’s expenses appears in the About Your Fund’s Expenses section of this report as well as in the Financial Statements section, which also includes information about the fund’s advisory fee rate.
The board did not consider profitability of Schroder and Wellington Management in determining whether to approve the advisory fees, because the firms are independent of Vanguard, and the advisory fee is the result of arm’s-length negotiations.
The benefit of economies of scale
The board concluded that the fund’s shareholders benefit from economies of scale because of breakpoints in the advisory fee schedule for Schroder and Wellington Management. The breakpoints reduce the effective rate of the fee as the fund’s assets managed by each advisor increase.
The board will consider whether to renew the advisory agreements again after a one-year period.
36
Glossary
Beta. A measure of the magnitude of a fund’s past share-price fluctuations in relation to the ups and downs of a given market index. The index is assigned a beta of 1.00. Compared with a given index, a fund with a beta of 1.20 typically would have seen its share price rise or fall by 12% when the index rose or fell by 10%. For this report, beta is based on returns over the past 36 months for both the fund and the index. Note that a fund’s beta should be reviewed in conjunction with its R-squared (see definition). The lower the R-squared, the less correlation there is between the fund and the index, and the less reliable beta is as an indicator of volatility.
Dividend Yield. Dividend income earned by stocks, expressed as a percentage of the aggregate market value (or of net asset value, for a fund). The yield is determined by dividing the amount of the annual dividends by the aggregate value (or net asset value) at the end of the period. For a fund, the dividend yield is based solely on stock holdings and does not include any income produced by other investments.
Earnings Growth Rate. The average annual rate of growth in earnings over the past five years for the stocks now in a fund.
Equity Exposure. A measure that reflects a fund’s investments in stocks and stock futures. Any holdings in short-term reserves are excluded.
Expense Ratio. The percentage of a fund’s average net assets used to pay its annual administrative and advisory expenses. These expenses directly reduce returns to investors.
Inception Date. The date on which the assets of a fund (or one of its share classes) are first invested in accordance with the fund’s investment objective. For funds with a subscription period, the inception date is the day after that period ends. Investment performance is measured from the inception date.
Median Market Cap. An indicator of the size of companies in which a fund invests; the midpoint of market capitalization (market price x shares outstanding) of a fund’s stocks, weighted by the proportion of the fund’s assets invested in each stock. Stocks representing half of the fund’s assets have market capitalizations above the median, and the rest are below it.
Price/Book Ratio. The share price of a stock divided by its net worth, or book value, per share. For a fund, the weighted average price/book ratio of the stocks it holds.
Price/Earnings Ratio. The ratio of a stock’s current price to its per-share earnings over the past year. For a fund, the weighted average P/E of the stocks it holds. P/E is an indicator of market expectations about corporate prospects; the higher the P/E, the greater the expectations for a company’s future growth.
R-Squared. A measure of how much of a fund’s past returns can be explained by the returns from the market in general, as measured by a given index. If a fund’s total returns were precisely synchronized with an index’s returns, its R-squared would be 1.00. If the fund’s returns bore no relationship to the index’s returns, its R-squared would be 0. For this report, R-squared is based on returns over the past 36 months for both the fund and the index.
Return on Equity. The annual average rate of return generated by a company during the past five years for each dollar of shareholder’s equity (net income divided by shareholder’s equity). For a fund, the weighted average return on equity for the companies whose stocks it holds.
37
Short-Term Reserves. The percentage of a fund invested in highly liquid, short-term securities that can be readily converted to cash.
Turnover Rate. An indication of the fund’s trading activity. Funds with high turnover rates incur higher transaction costs and may be more likely to distribute capital gains (which may be taxable to investors). The turnover rate excludes in-kind transactions, which have minimal impact on costs.
38
This page intentionally left blank.
The People Who Govern Your Fund
The trustees of your mutual fund are there to see that the fund is operated and managed in your best interests since, as a shareholder, you are a part owner of the fund. Your fund’s trustees also serve on the board of directors of The Vanguard Group, Inc., which is owned by the Vanguard funds and provides services to them on an at-cost basis.
A majority of Vanguard’s board members are independent, meaning that they have no affiliation with Vanguard or the funds they oversee, apart from the sizable personal investments they have made as private individuals. The independent board members have distinguished backgrounds in business, academia, and public service. Each of the trustees and executive officers oversees 180 Vanguard funds.
The following table provides information for each trustee and executive officer of the fund. More information about the trustees is in the Statement of Additional Information, which can be obtained, without charge, by contacting Vanguard at 800-662-7447, or online at vanguard.com.
| |
| Interested Trustee1 | and President (2006–2008) of Rohm and Haas Co. |
| | (chemicals); Director of Tyco International, Ltd. |
| F. William McNabb III | (diversified manufacturing and services) and Hewlett- |
| Born 1957. Trustee Since July 2009. Chairman of the | Packard Co. (electronic computer manufacturing); |
| Board. Principal Occupation(s) During the Past Five | Senior Advisor at New Mountain Capital; Trustee |
| Years: Chairman of the Board of The Vanguard Group, | of The Conference Board; Member of the Board of |
| Inc., and of each of the investment companies served | Managers of Delphi Automotive LLP (automotive |
| by The Vanguard Group, since January 2010; Director | components). |
| of The Vanguard Group since 2008; Chief Executive | |
| Officer and President of The Vanguard Group and of | Amy Gutmann |
| each of the investment companies served by The | Born 1949. Trustee Since June 2006. Principal |
| Vanguard Group since 2008; Director of Vanguard | Occupation(s) During the Past Five Years: President |
| Marketing Corporation; Managing Director of The | of the University of Pennsylvania; Christopher H. |
| Vanguard Group (1995–2008). | Browne Distinguished Professor of Political Science |
| | in the School of Arts and Sciences with secondary |
| | appointments at the Annenberg School for Commu- |
| Independent Trustees | nication and the Graduate School of Education |
| | of the University of Pennsylvania; Director of |
| Emerson U. Fullwood | Carnegie Corporation of New York, Schuylkill River |
| Born 1948. Trustee Since January 2008. Principal | Development Corporation, and Greater Philadelphia |
| Occupation(s) During the Past Five Years: Executive | Chamber of Commerce; Trustee of the National |
| Chief Staff and Marketing Officer for North America | Constitution Center; Chair of the Presidential |
| and Corporate Vice President (retired 2008) of Xerox | Commission for the Study of Bioethical Issues. |
| Corporation (document management products and | |
| services); Executive in Residence and 2010 | JoAnn Heffernan Heisen |
| Distinguished Minett Professor at the Rochester | Born 1950. Trustee Since July 1998. Principal |
| Institute of Technology; Director of SPX Corporation | Occupation(s) During the Past Five Years: Corporate |
| (multi-industry manufacturing), the United Way of | Vice President and Chief Global Diversity Officer |
| Rochester, Amerigroup Corporation (managed health | (retired 2008) and Member of the Executive |
| care), the University of Rochester Medical Center, | Committee (1997–2008) of Johnson & Johnson |
| Monroe Community College Foundation, and North | (pharmaceuticals/consumer products); Director of |
| Carolina A&T University. | Skytop Lodge Corporation (hotels), the University |
| | Medical Center at Princeton, the Robert Wood |
| Rajiv L. Gupta | Johnson Foundation, and the Center for Work Life |
| Born 1945. Trustee Since December 2001.2 | Policy; Member of the Advisory Board of the |
| Principal Occupation(s) During the Past Five Years: | Maxwell School of Citizenship and Public Affairs |
| Chairman and Chief Executive Officer (retired 2009) | at Syracuse University. |
| | |
| F. Joseph Loughrey | Thomas J. Higgins | |
| Born 1949. Trustee Since October 2009. Principal | Born 1957. Chief Financial Officer Since September |
| Occupation(s) During the Past Five Years: President | 2008. Principal Occupation(s) During the Past Five |
| and Chief Operating Officer (retired 2009) and Vice | Years: Principal of The Vanguard Group, Inc.; Chief |
| Chairman of the Board (2008–2009) of Cummins Inc. | Financial Officer of each of the investment companies |
| (industrial machinery); Director of SKF AB (industrial | served by The Vanguard Group since 2008; Treasurer |
| machinery), Hillenbrand, Inc. (specialized consumer | of each of the investment companies served by The |
| services), the Lumina Foundation for Education, and | Vanguard Group (1998–2008). |
| Oxfam America; Chairman of the Advisory Council | | |
| for the College of Arts and Letters and Member | Kathryn J. Hyatt | |
| of the Advisory Board to the Kellogg Institute for | Born 1955. Treasurer Since November 2008. Principal |
| International Studies at the University of Notre Dame. | Occupation(s) During the Past Five Years: Principal |
| | of The Vanguard Group, Inc.; Treasurer of each of |
| André F. Perold | the investment companies served by The Vanguard |
| Born 1952. Trustee Since December 2004. Principal | Group since 2008; Assistant Treasurer of each of the |
| Occupation(s) During the Past Five Years: George | investment companies served by The Vanguard Group |
| Gund Professor of Finance and Banking at the Harvard | (1988–2008). | |
| Business School (retired July 2011); Chief Investment | | |
| Officer and co-Managing Partner of HighVista | Heidi Stam | |
| Strategies LLC (private investment firm); Director of | Born 1956. Secretary Since July 2005. Principal |
| Rand Merchant Bank; Overseer of the Museum of | Occupation(s) During the Past Five Years: Managing |
| Fine Arts Boston. | Director of The Vanguard Group, Inc., since 2006; |
| | General Counsel of The Vanguard Group since 2005; |
| Alfred M. Rankin, Jr. | Secretary of The Vanguard Group and of each of the |
| Born 1941. Trustee Since January 1993. Principal | investment companies served by The Vanguard Group |
| Occupation(s) During the Past Five Years: Chairman, | since 2005; Director and Senior Vice President of |
| President, and Chief Executive Officer of NACCO | Vanguard Marketing Corporation since 2005; |
| Industries, Inc. (forklift trucks/housewares/lignite); | Principal of The Vanguard Group (1997–2006). |
| Director of Goodrich Corporation (industrial products/ | | |
| aircraft systems and services) and the National | | |
| Association of Manufacturers; Chairman of the | Vanguard Senior Management Team |
| Federal Reserve Bank of Cleveland; Vice Chairman | | |
| of University Hospitals of Cleveland; President of | R. Gregory Barton | Chris D. McIsaac |
| the Board of The Cleveland Museum of Art. | Mortimer J. Buckley | Michael S. Miller |
| | Kathleen C. Gubanich | James M. Norris |
| Peter F. Volanakis | Paul A. Heller | Glenn W. Reed |
| Born 1955. Trustee Since July 2009. Principal | Martha G. King | George U. Sauter |
| Occupation(s) During the Past Five Years: President | | |
| and Chief Operating Officer (retired 2010) of Corning | | |
| Incorporated (communications equipment); Director of | Chairman Emeritus and Senior Advisor |
| Corning Incorporated (2000–2010) and Dow Corning | | |
| (2001–2010); Overseer of the Amos Tuck School of | John J. Brennan | |
| Business Administration at Dartmouth College. | Chairman, 1996–2009 | |
| | Chief Executive Officer and President, 1996–2008 |
| |
| Executive Officers | | |
| | Founder | |
| Glenn Booraem | | |
| Born 1967. Controller Since July 2010. Principal | John C. Bogle | |
| Occupation(s) During the Past Five Years: Principal | Chairman and Chief Executive Officer, 1974–1996 |
| of The Vanguard Group, Inc.; Controller of each of | | |
| the investment companies served by The Vanguard | | |
| Group since 2010; Assistant Controller of each of | | |
| the investment companies served by The Vanguard | | |
| Group (2001–2010). | | |
1 Mr. McNabb is considered an “interested person,” as defined in the Investment Company Act of 1940, because he is an officer of the Vanguard funds.
2 December 2002 for Vanguard Equity Income Fund, Vanguard Growth Equity Fund, the Vanguard Municipal Bond Funds, and the Vanguard State Tax-Exempt Funds.
|  |
| P.O. Box 2600 |
| Valley Forge, PA 19482-2600 |
Connect with Vanguard® > vanguard.com
| |
| Fund Information > 800-662-7447 | |
| Direct Investor Account Services > 800-662-2739 | |
| Institutional Investor Services > 800-523-1036 | |
| Text Telephone for People | |
| With Hearing Impairment > 800-749-7273 | |
| |
| This material may be used in conjunction | |
| with the offering of shares of any Vanguard | |
| fund only if preceded or accompanied by | |
| the fund’s current prospectus. | |
| |
| All comparative mutual fund data are from Lipper Inc. or | |
| Morningstar, Inc., unless otherwise noted. | |
| |
| You can obtain a free copy of Vanguard’s proxy voting | |
| guidelines by visiting vanguard.com/proxyreporting or by | |
| calling Vanguard at 800-662-2739. The guidelines are | |
| also available from the SEC’s website, sec.gov. In | |
| addition, you may obtain a free report on how your fund | |
| voted the proxies for securities it owned during the 12 | |
| months ended June 30. To get the report, visit either | |
| vanguard.com/proxyreporting or sec.gov. | |
| |
| You can review and copy information about your fund at | |
| the SEC’s Public Reference Room in Washington, D.C. To | |
| find out more about this public service, call the SEC at | |
| 202-551-8090. Information about your fund is also | |
| available on the SEC’s website, and you can receive | |
| copies of this information, for a fee, by sending a | |
| request in either of two ways: via e-mail addressed to | |
| publicinfo@sec.gov or via regular mail addressed to the | |
| Public Reference Section, Securities and Exchange | |
| Commission, Washington, DC 20549-1520. | |
| |
| |
| | © 2011 The Vanguard Group, Inc. |
| | All rights reserved. |
| | Vanguard Marketing Corporation, Distributor. |
| |
| | Q1260 122011 |

Annual Report | October 31, 2011
Vanguard High Dividend Yield Index Fund
> For the fiscal year ended October 31, 2011, Vanguard High Dividend Yield Index Fund returned nearly 12%, closely tracking the performance of its benchmark index.
> Despite a stormy stretch through the spring and summer, the broad stock market posted respectable results for the 12 months. Growth stocks outperformed their value counterparts for the period.
> Energy stocks were the largest contributor to the fund’s return; only the battered financial sector failed to record a positive result.
| |
| Contents | |
| Your Fund’s Total Returns. | 1 |
| Chairman’s Letter. | 2 |
| Fund Profile. | 7 |
| Performance Summary. | 8 |
| Financial Statements. | 10 |
| Your Fund’s After-Tax Returns. | 24 |
| About Your Fund’s Expenses. | 25 |
| Glossary. | 27 |
Please note: The opinions expressed in this report are just that—informed opinions. They should not be considered promises or advice.
Also, please keep in mind that the information and opinions cover the period through the date on the front of this report. Of course, the risks of investing in your fund are spelled out in the prospectus.
See the Glossary for definitions of investment terms used in this report.
About the cover: Vanguard was named for the HMS Vanguard, flagship of British Admiral Horatio Nelson. A ship—whose performance and safety depend on the work of all hands—has served as a fitting metaphor for the Vanguard crew as we strive to help clients reach their financial goals.
Your Fund’s Total Returns
| |
| Fiscal Year Ended October 31, 2011 | |
| |
| | Total |
| | Returns |
| Vanguard High Dividend Yield Index Fund | |
| Investor Shares | 11.70% |
| ETF Shares | |
| Market Price | 11.89 |
| Net Asset Value | 11.88 |
| FTSE High Dividend Yield Index | 12.03 |
| Equity Income Funds Average | 7.22 |
Equity Income Funds Average: Derived from data provided by Lipper Inc.
The Vanguard ETF® Shares shown are traded on the NYSE Arca exchange and are available only through brokers. The table provides ETF returns based on both the NYSE Arca market price and the net asset value for a share. U.S. Pat. No. 6,879,964 B2; 7,337,138; 7,720,749; 7,925,573.
For the ETF Shares, the market price is determined by the midpoint of the bid-offer spread as of the closing time of the New York Stock Exchange (generally 4 p.m., Eastern time). The net asset value is also determined as of the NYSE closing time. For more information about how the ETF Shares' market prices have compared with their net asset value, visit vanguard.com, select your ETF, and then select the Price and Performance tab. The ETF premium/discount analysis there shows the percentages of days on which the ETF Shares' market price was above or below the NAV.
Your Fund’s Performance at a Glance
October 31, 2010 , Through October 31, 2011
| | | | |
| | | | Distributions Per Share |
| | Starting | Ending | Income | Capital |
| | Share Price | Share Price | Dividends | Gains |
| Vanguard High Dividend Yield Index Fund | | | | |
| Investor Shares | $15.94 | $17.30 | $0.484 | $0.000 |
| ETF Shares | 40.22 | 43.68 | 1.265 | 0.000 |
1

Chairman’s Letter
Dear Shareholder,
Over a period that included powerful rallies and sharp plunges, dividend-oriented stocks weathered the storm better than most. For the fiscal year ended October 31, 2011, Vanguard High Dividend Yield Index Fund returned 11.70% for Investor Shares and 11.88% for ETF Shares based on net asset value. Both share classes achieved their goal of closely tracking the performance of the FTSE High Dividend Yield Index and surpassed the average return of peer funds.
On October 31, the 30-day SEC yield of the fund’s Investor Shares stood at 3.19%, which is higher than a year ago and also above the 1.87% yield of the broad stock market, as measured by the Investor Shares of Vanguard Total Stock Market Index Fund.
If you own shares of the fund in a taxable account, you may wish to review the fund’s after-tax returns presented later in this report.
A positive finish
to an anxious 12 months
U.S. stock indexes ended the 12 months with solid returns, though the gains were shadowed by anxiety in a volatile period. This turbulence was so pronounced, in fact, that a one-month change in the start date would have yielded a very different perspective on performance. For the 12 months through October 31, the broad
2
U.S. stock market returned 7.67%. For the 12 months ended September 30, however, the return was a mere 0.31%.
Volatility has been a theme in international markets, too. International stock markets returned a combined –4.66% as stock prices retreated in Europe. Prices also fell in the Pacific region’s developed economies and emerging markets, where growth has moderated.
Unsteady yields reflected
fast-changing sentiment
Taxable bonds produced strong returns and municipal bonds solid but unspectacular results, though as in the stock market, investor sentiment was volatile. The yieldof the 10-year U.S. Treasury note, a benchmark for longer-term interest rates, began the 12 months at 2.61%, drifted higher as the economic expansion seemed to gather steam, then fluttered lower to close the period at 2.17%. The decline in Treasury yields (and rise in prices) was driven by Europe’s sovereign debt dramas, underwhelming economic reports, and a flight to safety that was prompted, paradoxically, by a rating agency’s decision to downgrade the U.S. government debt. Vanguard’s confidence in the full faith and credit of the U.S. Treasury remains unshaken.
Taxable investment-grade bonds returned 5.00% for the full 12 months. It’s important to note, of course, that as yields decline, the opportunity for similarly strong returns diminishes. The broad municipal market returned 3.78%. The returns on
| | | |
| Market Barometer | | | |
| |
| | | Average Annual Total Returns |
| | | Periods Ended October 31, 2011 |
| | One | Three | Five |
| | Year | Years | Years |
| Stocks | | | |
| Russell 1000 Index (Large-caps) | 8.01% | 12.22% | 0.54% |
| Russell 2000 Index (Small-caps) | 6.71 | 12.87 | 0.68 |
| Dow Jones U.S. Total Stock Market Index | 7.67 | 12.58 | 0.90 |
| MSCI All Country World Index ex USA (International) | -4.66 | 12.92 | -0.37 |
| |
| Bonds | | | |
| Barclays Capital U.S. Aggregate Bond Index (Broad | | | |
| taxable market) | 5.00% | 8.87% | 6.41% |
| Barclays Capital Municipal Bond Index (Broad | | | |
| tax-exempt market) | 3.78 | 8.31 | 4.80 |
| Citigroup Three-Month U.S. Treasury Bill Index | 0.10 | 0.15 | 1.53 |
| |
| CPI | | | |
| Consumer Price Index | 3.53% | 1.49% | 2.33% |
3
money market instruments hovered near 0%, consistent with the Federal Reserve Board’s target for short-term interest rates.
Payouts prove popular
in shaky markets
Although the stock market has been volatile and the economic recovery questionable, there have been few doubts about dividends over the recent fiscal year. Companies have continued to increase their dividends, and risk-averse and yield-starved investors have flocked to dividend-paying funds.
Many of these funds invest primarily in stocks of large, stable companies with healthy balance sheets, which endured the spring and summer market turmoil better than some of their less established brethren. Also, investors identified dividend-paying stocks as a viable (ableit much riskier) income source in an environment in which the yields available from traditional fixed income investments remained at historic lows.
Vanguard High Dividend Yield Index Fund benefited from this favorable climate. Nine of the fund’s ten industry sectors recorded positive returns, five of those in double digits. Only the beaten-down financial sector (–0.7%) finished in negative territory.
Energy stocks powered the fund’s performance. Fear of oil shortages as a result of political troubles in North Africa and the Middle East kept demand and
Expense Ratios
Your Fund Compared With Its Peer Group
| | | |
| | Investor | ETF | Peer Group |
| | Shares | Shares | Average |
| High Dividend Yield Index Fund | 0.30% | 0.18% | 1.35% |
The fund expense ratios shown are from the prospectus dated February 24, 2011, and represent estimated costs for the current fiscal year. For the fiscal year ended October 31, 2011, the fund’s expense ratios were 0.25% for Investor Shares and 0.13% for ETF Shares. The peer-group expense ratio is derived from data provided by Lipper Inc. and captures information through year-end 2010.
Peer group: Equity Income Funds.
4
prices high for crude oil and its abundance of by-products. Although energy stocks rose across the board, the giant integrated oil and gas companies were responsible for most of the fund’s return in the sector.
The consumer staples sector, the fund’s largest allocation, also significantly boosted results. Tobacco companies, traditionally among the most generous dividend payers, helped the most. Food, household products, and beverage firms also made solid contributions as investors targeted the market’s safer havens.
Although one of the fund’s smaller segments, consumer discretionary returned nearly 20% on strong results from home improvement stores and fast food restaurants. The fund’s utilities and telecommunication services stocks also posted double-digit returns. Financial stocks, the fund’s laggards, struggled for a variety of reasons: regulatory concerns, Europe’s debt crisis, and continued mortgage-related woes.
Fund builds a record
of successful index tracking
The performance of the High Dividend Yield Index Fund’s Investor Shares has been essentially flat since their launch on November 16, 2006, with an average annual return since inception of –0.04% through October 31. The fund’s benchmark recorded an annualized return of 0.22%
Total Returns
Inception Through October 31, 2011
| |
| | Average |
| | Annual Return |
| High Dividend Yield Index Fund Investor Shares (Returns since inception: 11/16/2006) | -0.04% |
| FTSE High Dividend Yield Index | 0.22 |
| Equity Income Funds Average | 0.04 |
| Equity Income Funds Average: Derived from data provided by Lipper Inc. |
The figures shown represent past performance, which is not a guarantee of future results. (Current performance may be lower or higher than the performance data cited. For performance data current to the most recent month-end, visit our website at vanguard.com/performance.) Note, too, that both investment returns and principal value can fluctuate widely, so an investor’s shares, when sold, could be worth more or less than their original cost.
5
for the same period, a difference consistent with the costs of managing a real-world portfolio.
Completing purchases and sales during times of stock market volatility is always a challenge for index fund advisors, whose goal is to minimize the gap between fund and index returns. Vanguard Quantitative Equity Group, the fund’s advisor, met this challenge through sophisticated portfolio construction and management techniques.
A sound investment plan
can prevent rash decisions
The stock market traced a pattern that nobody could have predicted at the start of the fiscal year: a steady rise despite the distant drumbeat of turmoil abroad, five straight months of declines capped by a late summer swoon, and, finally, a swift rise in October. Investors, fueled by emotion, sometimes feel compelled to react when the markets make huge moves, and the media adds to the tumult with big headlines and conflicting opinions from various experts and analysts.
At Vanguard, our experience tells us that emotional decisions can be counterproductive and that investors can put themselves in a position to resist temptation by creating a sound investment plan. Such a plan should be diversified within and across asset classes and tailored to your specific goals, time horizon, and risk tolerance.
Vanguard High Dividend Yield Index Fund, with its focus on stocks with above-average dividend yields and its low costs, can be an important part of such a well-diversified, long-term portfolio.
Sincerely,

F. William McNabb III
Chairman and Chief Executive Officer
November 11, 2011
6
High Dividend Yield Index Fund
Fund Profile
As of October 31, 2011
| | | |
| Share-Class Characteristics | | |
| |
| | Investor | | ETF |
| | Shares | | Shares |
| Ticker Symbol | VHDYX | | VYM |
| Expense Ratio1 | 0.30% | | 0.18% |
| 30-Day SEC Yield | 3.19% | | 3.31% |
| |
| Portfolio Characteristics | | |
| | FTSE High | DJ |
| | Dividend | U.S. Total |
| | | Yield | Market |
| | Fund | Index | Index |
| Number of Stocks | 425 | 425 | 3,749 |
| Median Market Cap $71.4B | $71.4B | $30.4B |
| Price/Earnings Ratio | 13.3x | 13.3x | 14.9x |
| Price/Book Ratio | 2.3x | 2.3x | 2.1x |
| Return on Equity | 22.1% | 22.1% | 19.1% |
| Earnings Growth Rate | 3.5% | 3.5% | 7.2% |
| Dividend Yield | 3.5% | 3.5% | 2.0% |
| Foreign Holdings | 0.0% | 0.0% | 0.0% |
| Turnover Rate | 16% | — | — |
| Short-Term Reserves | 0.0% | — | — |
Sector Diversification (% of equity exposure)
| | | |
| | | FTSE High | DJ |
| | | Dividend | U.S. Total |
| | | Yield | Market |
| | Fund | Index | Index |
| Consumer | | | |
| Discretionary | 6.6% | 6.6% | 12.4% |
| Consumer Staples | 19.8 | 19.8 | 10.1 |
| Energy | 13.9 | 13.9 | 10.7 |
| Financials | 5.1 | 5.1 | 15.1 |
| Health Care | 12.8 | 12.8 | 11.1 |
| Industrials | 14.7 | 14.7 | 10.9 |
| Information | | | |
| Technology | 9.3 | 9.3 | 19.3 |
| Materials | 3.2 | 3.2 | 4.3 |
| Telecommunication | | | |
| Services | 5.6 | 5.6 | 2.6 |
| Utilities | 9.0 | 9.0 | 3.5 |
| | |
| Volatility Measures | | |
| | FTSE High | DJ |
| | Dividend | U.S. Total |
| | Yield | Market |
| | Index | Index |
| R-Squared | 1.00 | 0.92 |
| Beta | 1.00 | 0.95 |
These measures show the degree and timing of the fund’s fluctuations compared with the indexes over 36 months.
Ten Largest Holdings (% of total net assets)
| | |
| Exxon Mobil Corp. | Integrated Oil & | |
| | Gas | 6.7% |
| Microsoft Corp. | Systems Software | 4.0 |
| Chevron Corp. | Integrated Oil & | |
| | Gas | 3.7 |
| General Electric Co. | Industrial | |
| | Conglomerates | 3.2 |
| Johnson & Johnson | Pharmaceuticals | 3.1 |
| Procter & Gamble Co. | Household | |
| | Products | 3.1 |
| AT&T Inc. | Integrated | |
| | Telecommunication | |
| | Services | 3.1 |
| Coca-Cola Co. | Soft Drinks | 2.8 |
| Pfizer Inc. | Pharmaceuticals | 2.7 |
| Wal-Mart Stores Inc. | Hypermarkets & | |
| | Super Centers | 2.6 |
| Top Ten | | 35.0% |
The holdings listed exclude any temporary cash investments and equity index products.
Investment Focus
1 The expense ratios shown are from the prospectus dated February 24, 2011, and represent estimated costs for the current fiscal year. For the fiscal year ended October 31, 2011, the expense ratios were 0.25% for Investor Shares and 0.13% for ETF Shares.
7
High Dividend Yield Index Fund
Performance Summary
All of the returns in this report represent past performance, which is not a guarantee of future results that may be achieved by the fund. (Current performance may be lower or higher than the performance data cited. For performance data current to the most recent month-end, visit our website at vanguard.com/performance.) Note, too, that both investment returns and principal value can fluctuate widely, so an investor’s shares, when sold, could be worth more or less than their original cost. The returns shown do not reflect taxes that a shareholder would pay on fund distributions or on the sale of fund shares.
Cumulative Performance: November 16, 2006, Through October 31, 2011
Initial Investment of $10,000
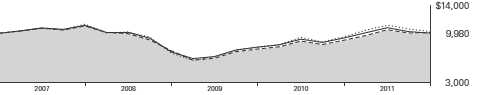
| | | |
| | Average Annual Total Returns | |
| | Periods Ended October 31, 2011 | |
| | | Since | Final Value |
| | One | Inception | of a $10,000 |
| | Year | (11/16/2006) | Investment |
| High Dividend Yield Index Fund | | | |
| Investor Shares | 11.70% | -0.04% | $9,980 |
| Dow Jones U.S. Total Stock Market | | | |
| Index | 7.67 | 0.50 | 10,250 |
| |
| FTSE High Dividend Yield Index | 12.03 | 0.22 | 10,109 |
| Equity Income Funds Average | 7.22 | 0.04 | 10,021 |
Equity Income Funds Average: Derived from data provided by Lipper Inc.
"Since Inception" performance is calculated from the Investor Shares’ inception date for both the fund and its comparative standards.
| | | |
| | | Since | Final Value |
| | One | Inception | of a $10,000 |
| | Year | (11/10/2006) | Investment |
| High Dividend Yield Index Fund | | | |
| ETF Shares Net Asset Value | 11.88% | 0.27% | $10,136 |
| Dow Jones U.S. Total Stock Market Index | 7.67 | 0.82 | 10,414 |
| FTSE High Dividend Yield Index | 12.03 | 0.39 | 10,194 |
"Since Inception" performance is calculated from the ETF Shares’ inception date for both the fund and its comparative standards.
See Financial Highlights for dividend and capital gains information.
8
High Dividend Yield Index Fund
Cumulative Returns of ETF Shares: November 10, 2006, Through October 31, 2011
| | |
| | | Since |
| | One | Inception |
| | Year | (11/10/2006) |
| High Dividend Yield Index Fund | | |
| ETF Shares Market Price | 11.89% | 1.40% |
| High Dividend Yield Index Fund | | |
| ETF Shares Net Asset Value | 11.88 | 1.36 |
| FTSE High Dividend Yield Index | 12.03 | 1.94 |
"Since Inception" performance is calculated from the ETF Shares’ inception date for both the fund and its comparative standards.
Fiscal-Year Total Returns (%): November 16, 2006, Through October 31, 2011

Average Annual Total Returns: Periods Ended September 30, 2011
This table presents returns through the latest calendar quarter—rather than through the end of the fiscal period.
Securities and Exchange Commission rules require that we provide this information.
| | | |
| | Inception | One | Since |
| | Date | Year | Inception |
| Investor Shares | 11/16/2006 | 6.58% | -1.64% |
| ETF Shares | 11/10/2006 | | |
| Market Price | | 6.72 | -1.33 |
| Net Asset Value | | 6.67 | -1.34 |
9
High Dividend Yield Index Fund
Financial Statements
Statement of Net Assets
As of October 31, 2011
The fund reports a complete list of its holdings in regulatory filings four times in each fiscal year, at the quarter-ends. For the second and fourth fiscal quarters, the lists appear in the fund’s semiannual and annual reports to shareholders. For the first and third fiscal quarters, the fund files the lists with the Securities and Exchange Commission on Form N-Q. Shareholders can look up the fund’s Forms N-Q on the SEC’s website at sec.gov. Forms N-Q may also be reviewed and copied at the SEC’s Public Reference Room (see the back cover of this report for further information).
| | | |
| | | | Market |
| | | | Value |
| | | Shares | ($000) |
| Common Stocks (100.0%) | | |
| Consumer Discretionary (6.6%) | | |
| | McDonald’s Corp. | 500,903 | 46,509 |
| | Home Depot Inc. | 773,019 | 27,674 |
| | Time Warner Inc. | 507,231 | 17,748 |
| | Yum! Brands Inc. | 227,067 | 12,164 |
| | Time Warner Cable Inc. | 157,875 | 10,055 |
| | Comcast Corp. | 326,442 | 7,508 |
| | VF Corp. | 53,111 | 7,341 |
| | McGraw-Hill Cos. Inc. | 146,285 | 6,217 |
| | Mattel Inc. | 166,479 | 4,701 |
| | Genuine Parts Co. | 76,535 | 4,395 |
| | JC Penney Co. Inc. | 103,448 | 3,319 |
| | Darden Restaurants Inc. | 65,309 | 3,127 |
| ^ | Garmin Ltd. | 75,757 | 2,605 |
| | Hasbro Inc. | 65,232 | 2,483 |
| | H&R Block Inc. | 148,013 | 2,263 |
| | Polaris Industries Inc. | 33,360 | 2,113 |
| | Whirlpool Corp. | 36,939 | 1,877 |
| | Tupperware Brands Corp. | 29,410 | 1,663 |
| | Foot Locker Inc. | 74,673 | 1,632 |
| | Leggett & Platt Inc. | 69,458 | 1,521 |
| | Weight Watchers | | |
| | International Inc. | 17,859 | 1,333 |
| | American Eagle | | |
| | Outfitters Inc. | 94,841 | 1,245 |
| | Service Corp. International | 115,227 | 1,152 |
| | Cinemark Holdings Inc. | 55,129 | 1,140 |
| | Brinker International Inc. | 41,134 | 942 |
| | Regal Entertainment | | |
| | Group Class A | 63,515 | 917 |
| | Washington Post Co. | | |
| | Class B | 2,437 | 829 |
| | Pool Corp. | 23,382 | 683 |
| | Hillenbrand Inc. | 30,329 | 640 |
| | Choice Hotels | | |
| | International Inc. | 14,415 | 516 |
| | Buckle Inc. | 11,479 | 511 |
| | Strayer Education Inc. | 5,816 | 496 |
| | Bob Evans Farms Inc. | 14,732 | 485 |
| | |
| | | Market |
| | | Value |
| | Shares | ($000) |
| MDC Holdings Inc. | 17,361 | 389 |
| Meredith Corp. | 13,348 | 358 |
| Cato Corp. Class A | 13,458 | 345 |
| National CineMedia Inc. | 26,804 | 324 |
| American Greetings Corp. | | |
| Class A | 18,480 | 296 |
| Ameristar Casinos Inc. | 15,794 | 292 |
| Stewart Enterprises Inc. | | |
| Class A | 42,482 | 274 |
| Barnes & Noble Inc. | 21,809 | 268 |
| CTC Media Inc. | 22,633 | 260 |
| Superior Industries | | |
| International Inc. | 13,174 | 241 |
| Harte-Hanks Inc. | 23,252 | 204 |
| Brown Shoe Co. Inc. | 21,805 | 194 |
| Nutrisystem Inc. | 13,410 | 166 |
| HOT Topic Inc. | 21,800 | 165 |
| Speedway Motorsports Inc. | 8,224 | 107 |
| Christopher & Banks Corp. | 18,178 | 61 |
| | | 181,748 |
| Consumer Staples (19.8%) | | |
| Procter & Gamble Co. | 1,334,002 | 85,363 |
| Coca-Cola Co. | 1,111,401 | 75,931 |
| Wal-Mart Stores Inc. | 1,254,974 | 71,182 |
| Philip Morris | | |
| International Inc. | 852,760 | 59,582 |
| PepsiCo Inc. | 772,379 | 48,621 |
| Kraft Foods Inc. | 857,425 | 30,164 |
| Altria Group Inc. | 1,010,076 | 27,828 |
| Colgate-Palmolive Co. | 237,356 | 21,450 |
| Kimberly-Clark Corp. | 190,738 | 13,296 |
| General Mills Inc. | 310,865 | 11,978 |
| Archer-Daniels-Midland Co. | 328,099 | 9,495 |
| HJ Heinz Co. | 155,725 | 8,322 |
| Reynolds American Inc. | 212,253 | 8,210 |
| Sysco Corp. | 282,906 | 7,842 |
| Lorillard Inc. | 67,211 | 7,438 |
| Kellogg Co. | 132,132 | 7,163 |
| ConAgra Foods Inc. | 201,289 | 5,099 |
| Sara Lee Corp. | 284,073 | 5,056 |
| Hershey Co. | 80,986 | 4,635 |
10
High Dividend Yield Index Fund
| | | |
| | | | Market |
| | | | Value |
| | | Shares | ($000) |
| | Clorox Co. | 64,746 | 4,334 |
| | JM Smucker Co. | 55,542 | 4,278 |
| | Dr Pepper Snapple | | |
| | Group Inc. | 105,381 | 3,946 |
| | Campbell Soup Co. | 116,662 | 3,879 |
| | Avon Products Inc. | 207,241 | 3,788 |
| | Molson Coors Brewing Co. | | |
| | Class B | 78,624 | 3,329 |
| | Hormel Foods Corp. | 97,044 | 2,860 |
| | McCormick & Co. Inc. | 58,132 | 2,823 |
| | Flowers Foods Inc. | 65,808 | 1,329 |
| | SUPERVALU Inc. | 102,653 | 823 |
| | Lancaster Colony Corp. | 10,013 | 666 |
| | Snyders-Lance Inc. | 24,356 | 517 |
| | Universal Corp. | 11,254 | 482 |
| | WD-40 Co. | 8,009 | 352 |
| | Vector Group Ltd. | 19,167 | 337 |
| | Weis Markets Inc. | 5,262 | 208 |
| | Nash Finch Co. | 5,989 | 158 |
| | | | 542,764 |
| Energy (13.9%) | | |
| | Exxon Mobil Corp. | 2,360,483 | 184,330 |
| | Chevron Corp. | 973,238 | 102,239 |
| | ConocoPhillips | 666,588 | 46,428 |
| | Spectra Energy Corp. | 315,709 | 9,039 |
| | Marathon Oil Corp. | 346,648 | 9,023 |
| | Williams Cos. Inc. | 285,909 | 8,609 |
| | Marathon Petroleum Corp. | 171,273 | 6,149 |
| | EQT Corp. | 72,403 | 4,598 |
| | Linn Energy LLC | 85,787 | 3,322 |
| | Southern Union Co. | 60,130 | 2,527 |
| | Tidewater Inc. | 25,033 | 1,232 |
| | Copano Energy LLC | 32,022 | 1,035 |
| | Teekay Corp. | 26,335 | 678 |
| ^ | Ship Finance | | |
| | International Ltd. | 28,626 | 410 |
| | Nordic American | | |
| | Tankers Ltd. | 22,914 | 330 |
| | Crosstex Energy Inc. | 17,245 | 225 |
| ^ | Knightsbridge Tankers Ltd. | 11,741 | 198 |
| | Overseas Shipholding | | |
| | Group Inc. | 14,883 | 186 |
| | Delek US Holdings Inc. | 8,524 | 123 |
| | Tsakos Energy | | |
| | Navigation Ltd. | 16,666 | 100 |
| | | | 380,781 |
| Financials (5.1%) | | |
| | Travelers Cos. Inc. | 203,364 | 11,866 |
| | Aflac Inc. | 228,584 | 10,307 |
| | Chubb Corp. | 138,817 | 9,308 |
| | Marsh & | | |
| | McLennan Cos. Inc. | 262,976 | 8,052 |
| | BB&T Corp. | 337,233 | 7,871 |
| | Allstate Corp. | 250,829 | 6,607 |
| | Northern Trust Corp. | 116,986 | 4,734 |
| | M&T Bank Corp. | 60,981 | 4,641 |
| | |
| | | Market |
| | | Value |
| | Shares | ($000) |
| Invesco Ltd. | 218,935 | 4,394 |
| NYSE Euronext | 126,148 | 3,352 |
| XL Group plc Class A | 144,543 | 3,142 |
| Willis Group Holdings plc | 83,973 | 3,049 |
| New York Community | | |
| Bancorp Inc. | 211,335 | 2,813 |
| Everest Re Group Ltd. | 26,333 | 2,368 |
| People’s United | | |
| Financial Inc. | 182,810 | 2,331 |
| Cincinnati Financial Corp. | 79,133 | 2,290 |
| PartnerRe Ltd. | 32,774 | 2,039 |
| Axis Capital Holdings Ltd. | 62,890 | 1,972 |
| Arthur J Gallagher & Co. | 54,505 | 1,684 |
| Fidelity National | | |
| Financial Inc. Class A | 108,460 | 1,675 |
| Commerce Bancshares Inc. | 42,284 | 1,641 |
| Hudson City Bancorp Inc. | 255,769 | 1,599 |
| Eaton Vance Corp. | 57,314 | 1,507 |
| Cullen/Frost Bankers Inc. | 29,675 | 1,455 |
| HCC Insurance Holdings Inc. | 53,484 | 1,423 |
| Erie Indemnity Co. Class A | 17,736 | 1,400 |
| Validus Holdings Ltd. | 48,152 | 1,317 |
| First Niagara | | |
| Financial Group Inc. | 143,166 | 1,316 |
| Hancock Holding Co. | 41,037 | 1,243 |
| Waddell & Reed | | |
| Financial Inc. Class A | 41,798 | 1,159 |
| Alterra Capital Holdings Ltd. | 51,484 | 1,116 |
| Old Republic | | |
| International Corp. | 125,268 | 1,107 |
| Federated Investors Inc. | | |
| Class B | 50,450 | 986 |
| Valley National Bancorp | 82,033 | 984 |
| Bank of Hawaii Corp. | 22,901 | 967 |
| Aspen Insurance | | |
| Holdings Ltd. | 34,432 | 912 |
| Capitol Federal Financial Inc. | 81,346 | 902 |
| American Financial | | |
| Group Inc. | 24,377 | 873 |
| Hanover Insurance | | |
| Group Inc. | 21,997 | 839 |
| Protective Life Corp. | 41,082 | 764 |
| Iberiabank Corp. | 14,638 | 757 |
| FirstMerit Corp. | 52,966 | 742 |
| StanCorp Financial | | |
| Group Inc. | 21,649 | 735 |
| Endurance Specialty | | |
| Holdings Ltd. | 19,644 | 731 |
| RLI Corp. | 10,139 | 713 |
| Trustmark Corp. | 30,886 | 684 |
| Northwest Bancshares Inc. | 49,942 | 623 |
| FNB Corp. | 61,371 | 619 |
| Westamerica | | |
| Bancorporation | 13,795 | 618 |
| Kemper Corp. | 22,055 | 593 |
| United Bankshares Inc. | 24,248 | 576 |
11
| | |
| High Dividend Yield Index Fund | | |
| |
| |
| |
| | | Market |
| | | Value |
| | Shares | ($000) |
| Mercury General Corp. | 13,141 | 569 |
| UMB Financial Corp. | 14,801 | 546 |
| Old National Bancorp | 45,939 | 532 |
| Montpelier Re Holdings Ltd. | 29,830 | 522 |
| BOK Financial Corp. | 9,927 | 518 |
| CVB Financial Corp. | 51,274 | 498 |
| First Financial | | |
| Bankshares Inc. | 15,156 | 481 |
| First Financial Bancorp | 28,102 | 461 |
| Community Bank | | |
| System Inc. | 17,874 | 457 |
| International | | |
| Bancshares Corp. | 24,655 | 447 |
| Park National Corp. | 7,404 | 442 |
| Selective Insurance | | |
| Group Inc. | 26,097 | 418 |
| Greenhill & Co. Inc. | 10,543 | 398 |
| Astoria Financial Corp. | 47,967 | 398 |
| Glacier Bancorp Inc. | 34,754 | 395 |
| BancorpSouth Inc. | 40,290 | 394 |
| Harleysville Group Inc. | 6,627 | 389 |
| Provident Financial | | |
| Services Inc. | 29,236 | 379 |
| Oritani Financial Corp. | 27,245 | 353 |
| NBT Bancorp Inc. | 16,220 | 349 |
| Safety Insurance Group Inc. | 7,265 | 310 |
| BGC Partners Inc. Class A | 42,991 | 295 |
| Maiden Holdings Ltd. | 34,912 | 285 |
| American National | | |
| Insurance Co. | 3,876 | 277 |
| Independent Bank Corp. | 10,482 | 272 |
| Chemical Financial Corp. | 13,383 | 269 |
| WesBanco Inc. | 12,949 | 257 |
| Advance America Cash | | |
| Advance Centers Inc. | 30,265 | 255 |
| S&T Bancorp Inc. | 13,445 | 251 |
| City Holding Co. | 7,358 | 242 |
| Brookline Bancorp Inc. | 28,622 | 239 |
| Trustco Bank Corp. | 45,615 | 226 |
| Simmons First | | |
| National Corp. Class A | 8,413 | 218 |
| 1st Source Corp. | 8,917 | 214 |
| Community Trust | | |
| Bancorp Inc. | 7,389 | 209 |
| Dime Community | | |
| Bancshares Inc. | 16,756 | 200 |
| Washington Trust | | |
| Bancorp Inc. | 7,924 | 186 |
| Flushing Financial Corp. | 15,148 | 186 |
| Republic Bancorp Inc. | | |
| Class A | 8,871 | 180 |
| United Fire & Casualty Co. | 9,496 | 179 |
| Renasant Corp. | 11,998 | 173 |
| First Financial Corp. | 4,792 | 158 |
| Tompkins Financial Corp. | 3,901 | 154 |
| SY Bancorp Inc. | 6,561 | 135 |
| | |
| | | Market |
| | | Value |
| | Shares | ($000) |
| Arrow Financial Corp. | 5,679 | 133 |
| Provident New York Bancorp | 18,668 | 130 |
| GFI Group Inc. | 29,569 | 128 |
| Calamos Asset | | |
| Management Inc. Class A | 9,879 | 123 |
| Bancfirst Corp. | 2,985 | 116 |
| State Auto Financial Corp. | 7,908 | 105 |
| Presidential Life Corp. | 10,586 | 105 |
| First Community | | |
| Bancshares Inc. | 8,486 | 102 |
| Baldwin & Lyons Inc. | 4,385 | 101 |
| Kearny Financial Corp. | 9,863 | 96 |
| | | 140,851 |
| Health Care (12.8%) | | |
| Johnson & Johnson | 1,333,267 | 85,849 |
| Pfizer Inc. | 3,787,824 | 72,954 |
| Merck & Co. Inc. | 1,492,190 | 51,481 |
| Abbott Laboratories | 749,145 | 40,356 |
| Bristol-Myers Squibb Co. | 831,010 | 26,252 |
| Eli Lilly & Co. | 557,834 | 20,729 |
| Medtronic Inc. | 519,174 | 18,036 |
| Baxter International Inc. | 276,917 | 15,225 |
| Becton Dickinson and Co. | 106,205 | 8,308 |
| Cardinal Health Inc. | 170,490 | 7,548 |
| Pharmaceutical Product | | |
| Development Inc. | 55,015 | 1,815 |
| Teleflex Inc. | 19,744 | 1,182 |
| Lincare Holdings Inc. | 45,271 | 1,066 |
| Owens & Minor Inc. | 30,744 | 920 |
| Computer Programs & | | |
| Systems Inc. | 5,335 | 272 |
| Meridian Bioscience Inc. | 14,921 | 272 |
| Landauer Inc. | 4,553 | 233 |
| National Healthcare Corp. | 4,967 | 190 |
| | | 352,688 |
| Industrials (14.7%) | | |
| General Electric Co. | 5,180,048 | 86,559 |
| United Technologies Corp. | 441,171 | 34,403 |
| Caterpillar Inc. | 312,992 | 29,565 |
| 3M Co. | 343,708 | 27,160 |
| United Parcel Service Inc. | | |
| Class B | 358,191 | 25,159 |
| Boeing Co. | 359,791 | 23,671 |
| Honeywell International Inc. | 378,769 | 19,847 |
| Emerson Electric Co. | 361,548 | 17,398 |
| Norfolk Southern Corp. | 189,574 | 14,027 |
| Lockheed Martin Corp. | 162,943 | 12,367 |
| Illinois Tool Works Inc. | 238,582 | 11,602 |
| General Dynamics Corp. | 175,634 | 11,274 |
| Tyco International Ltd. | 227,669 | 10,370 |
| Northrop Grumman Corp. | 134,551 | 7,770 |
| Raytheon Co. | 171,680 | 7,587 |
| Waste Management Inc. | 229,186 | 7,547 |
| Eaton Corp. | 165,656 | 7,425 |
| Stanley Black & Decker Inc. | 81,622 | 5,212 |
12
| | | |
| High Dividend Yield Index Fund | |
| |
| |
| |
| | | | Market |
| | | | Value |
| | | Shares | ($000) |
| | Republic Services Inc. | | |
| | Class A | 182,811 | 5,203 |
| | Rockwell Automation Inc. | 70,061 | 4,740 |
| | Cooper Industries plc | 79,835 | 4,188 |
| | L-3 Communications | | |
| | Holdings Inc. | 51,490 | 3,490 |
| | Pitney Bowes Inc. | 98,827 | 2,014 |
| | Pentair Inc. | 47,826 | 1,719 |
| | Masco Corp. | 174,702 | 1,677 |
| | Hubbell Inc. Class B | 25,628 | 1,532 |
| | Snap-on Inc. | 28,161 | 1,511 |
| | RR Donnelley & Sons Co. | 91,200 | 1,487 |
| | Avery Dennison Corp. | 51,895 | 1,380 |
| | Graco Inc. | 29,554 | 1,269 |
| | Ryder System Inc. | 24,772 | 1,262 |
| | Crane Co. | 28,377 | 1,252 |
| | Harsco Corp. | 39,057 | 900 |
| | GATX Corp. | 22,571 | 857 |
| | Watsco Inc. | 13,687 | 844 |
| | Alexander & Baldwin Inc. | 20,008 | 831 |
| | Brady Corp. Class A | 23,908 | 734 |
| † | Huntington Ingalls | | |
| | Industries Inc. | 23,847 | 703 |
| | Applied Industrial | | |
| | Technologies Inc. | 20,594 | 692 |
| | Deluxe Corp. | 24,744 | 584 |
| | Healthcare Services | | |
| | Group Inc. | 31,877 | 553 |
| | HNI Corp. | 21,902 | 527 |
| | Kaydon Corp. | 15,698 | 494 |
| | Seaspan Corp. | 32,925 | 467 |
| | Mine Safety Appliances Co. | 13,342 | 448 |
| | Kaman Corp. | 12,704 | 422 |
| | ABM Industries Inc. | 19,332 | 391 |
| | Briggs & Stratton Corp. | 24,107 | 352 |
| | Aircastle Ltd. | 27,187 | 330 |
| | McGrath Rentcorp | 11,762 | 314 |
| | Albany International Corp. | 13,470 | 304 |
| | AZZ Inc. | 6,109 | 273 |
| | NACCO Industries Inc. | | |
| | Class A | 3,288 | 270 |
| | TAL International Group Inc. | 8,088 | 225 |
| | Textainer Group Holdings Ltd. | 7,014 | 193 |
| | Ennis Inc. | 12,778 | 187 |
| | Apogee Enterprises Inc. | 13,669 | 149 |
| | Federal Signal Corp. | 29,912 | 141 |
| | Navios Maritime | | |
| | Holdings Inc. | 37,049 | 139 |
| | US Ecology Inc. | 6,579 | 119 |
| | CDI Corp. | 6,971 | 92 |
| | | | 404,202 |
| Information Technology (9.3%) | | |
| | Microsoft Corp. | 4,079,237 | 108,630 |
| | Intel Corp. | 2,574,049 | 63,167 |
| | Accenture plc Class A | 315,035 | 18,984 |
| | |
| | | Market |
| | | Value |
| | Shares | ($000) |
| Automatic Data | | |
| Processing Inc. | 242,605 | 12,696 |
| Applied Materials Inc. | 640,574 | 7,892 |
| TE Connectivity Ltd. | 210,414 | 7,480 |
| Analog Devices Inc. | 144,532 | 5,286 |
| Paychex Inc. | 176,568 | 5,145 |
| Xilinx Inc. | 128,773 | 4,309 |
| KLA-Tencor Corp. | 81,526 | 3,839 |
| Maxim Integrated | | |
| Products Inc. | 143,210 | 3,746 |
| Linear Technology Corp. | 110,057 | 3,556 |
| Microchip Technology Inc. | 92,478 | 3,344 |
| Broadridge Financial | | |
| Solutions Inc. | 59,773 | 1,330 |
| Diebold Inc. | 31,216 | 1,008 |
| Molex Inc. | 34,709 | 857 |
| Molex Inc. Class A | 38,424 | 784 |
| Intersil Corp. Class A | 60,908 | 729 |
| Comtech | | |
| Telecommunications | | |
| Corp. | 12,698 | 420 |
| Earthlink Inc. | 52,020 | 365 |
| MTS Systems Corp. | 7,553 | 277 |
| United Online Inc. | 31,895 | 188 |
| Methode Electronics Inc. | 17,670 | 164 |
| Electro Rent Corp. | 8,793 | 141 |
| | | 254,337 |
| Materials (3.2%) | | |
| EI du Pont de | | |
| Nemours & Co. | 450,877 | 21,674 |
| Praxair Inc. | 147,254 | 14,971 |
| Air Products & | | |
| Chemicals Inc. | 102,878 | 8,862 |
| PPG Industries Inc. | 76,789 | 6,635 |
| Nucor Corp. | 152,235 | 5,751 |
| Southern Copper Corp. | 123,854 | 3,800 |
| Eastman Chemical Co. | 68,676 | 2,698 |
| International Flavors & | | |
| Fragrances Inc. | 39,058 | 2,365 |
| MeadWestvaco Corp. | 82,870 | 2,313 |
| Vulcan Materials Co. | 62,609 | 1,959 |
| Sealed Air Corp. | 93,285 | 1,660 |
| Temple-Inland Inc. | 52,141 | 1,659 |
| Sonoco Products Co. | 48,335 | 1,517 |
| RPM International Inc. | 63,177 | 1,420 |
| Bemis Co. Inc. | 50,252 | 1,413 |
| Huntsman Corp. | 87,847 | 1,031 |
| Packaging Corp. of America | 37,310 | 973 |
| Cabot Corp. | 31,730 | 958 |
| Sensient Technologies Corp. | 24,347 | 900 |
| Olin Corp. | 38,610 | 728 |
| Commercial Metals Co. | 56,149 | 698 |
| Worthington Industries Inc. | 35,215 | 608 |
| Greif Inc. Class A | 11,989 | 537 |
| Innophos Holdings Inc. | 7,884 | 347 |
| AMCOL International Corp. | 11,412 | 345 |
13
| | |
| High Dividend Yield Index Fund | |
| |
| |
| |
| | | Market |
| | | Value |
| | Shares | ($000) |
| PH Glatfelter Co. | 22,158 | 332 |
| Koppers Holdings Inc. | 9,907 | 328 |
| A Schulman Inc. | 15,043 | 318 |
| Myers Industries Inc. | 12,774 | 156 |
| | | 86,956 |
| Telecommunication Services (5.6%) | |
| AT&T Inc. | 2,884,274 | 84,538 |
| Verizon | | |
| Communications Inc. | 1,383,945 | 51,178 |
| CenturyLink Inc. | 299,281 | 10,553 |
| Windstream Corp. | 247,511 | 3,012 |
| Frontier Communications | | |
| Corp. | 480,558 | 3,008 |
| NTELOS Holdings Corp. | 15,274 | 291 |
| Atlantic Tele-Network Inc. | 5,512 | 209 |
| Consolidated | | |
| Communications | | |
| Holdings Inc. | 10,826 | 205 |
| ^ Alaska Communications | | |
| Systems Group Inc. | 21,802 | 154 |
| | | 153,148 |
| Utilities (9.0%) | | |
| Southern Co. | 416,382 | 17,988 |
| Dominion Resources Inc. | 276,350 | 14,257 |
| Exelon Corp. | 320,413 | 14,223 |
| Duke Energy Corp. | 645,295 | 13,177 |
| NextEra Energy Inc. | 204,371 | 11,527 |
| American Electric | | |
| Power Co. Inc. | 233,909 | 9,188 |
| FirstEnergy Corp. | 203,014 | 9,128 |
| PG&E Corp. | 195,292 | 8,378 |
| Public Service | | |
| Enterprise Group Inc. | 246,911 | 8,321 |
| PPL Corp. | 280,187 | 8,229 |
| Consolidated Edison Inc. | 141,054 | 8,163 |
| Progress Energy Inc. | 142,049 | 7,401 |
| Edison International | 158,185 | 6,422 |
| Sempra Energy | 116,572 | 6,263 |
| Xcel Energy Inc. | 233,935 | 6,047 |
| Entergy Corp. | 86,403 | 5,976 |
| CenterPoint Energy Inc. | 204,785 | 4,268 |
| DTE Energy Co. | 81,784 | 4,262 |
| Constellation Energy | | |
| Group Inc. | 97,287 | 3,862 |
| Oneok Inc. | 50,292 | 3,825 |
| Ameren Corp. | 117,396 | 3,743 |
| Wisconsin Energy Corp. | 113,655 | 3,686 |
| NiSource Inc. | 135,917 | 3,002 |
| Northeast Utilities | 85,889 | 2,969 |
| SCANA Corp. | 62,655 | 2,649 |
| American Water | | |
| Works Co. Inc. | 84,781 | 2,588 |
| CMS Energy Corp. | 122,464 | 2,550 |
| OGE Energy Corp. | 47,152 | 2,440 |
| | |
| | | Market |
| | | Value |
| | Shares | ($000) |
| National Fuel Gas Co. | 39,802 | 2,439 |
| Pinnacle West Capital Corp. | 52,590 | 2,397 |
| NSTAR | 50,299 | 2,268 |
| Alliant Energy Corp. | 53,508 | 2,182 |
| Pepco Holdings Inc. | 109,221 | 2,163 |
| Integrys Energy Group Inc. | 37,836 | 2,002 |
| TECO Energy Inc. | 104,306 | 1,937 |
| MDU Resources Group Inc. | 91,140 | 1,878 |
| NV Energy Inc. | 113,564 | 1,822 |
| ITC Holdings Corp. | 24,927 | 1,812 |
| Questar Corp. | 86,114 | 1,659 |
| AGL Resources Inc. | 38,102 | 1,598 |
| UGI Corp. | 53,874 | 1,545 |
| Westar Energy Inc. | 56,252 | 1,533 |
| Atmos Energy Corp. | 43,731 | 1,501 |
| Aqua America Inc. | 67,090 | 1,489 |
| Great Plains Energy Inc. | 65,608 | 1,361 |
| DPL Inc. | 42,644 | 1,294 |
| Nicor Inc. | 21,892 | 1,231 |
| Hawaiian Electric | | |
| Industries Inc. | 46,532 | 1,179 |
| Piedmont Natural | | |
| Gas Co. Inc. | 34,868 | 1,140 |
| Vectren Corp. | 39,337 | 1,116 |
| Cleco Corp. | 29,694 | 1,095 |
| WGL Holdings Inc. | 24,826 | 1,063 |
| IDACORP Inc. | 23,973 | 968 |
| New Jersey Resources Corp. | 20,107 | 945 |
| Portland General Electric Co. | 36,498 | 896 |
| Southwest Gas Corp. | 22,245 | 878 |
| UIL Holdings Corp. | 24,550 | 837 |
| South Jersey Industries Inc. | 14,509 | 817 |
| PNM Resources Inc. | 41,894 | 753 |
| Avista Corp. | 28,143 | 716 |
| Allete Inc. | 17,694 | 699 |
| Unisource Energy Corp. | 17,781 | 663 |
| Black Hills Corp. | 19,171 | 646 |
| NorthWestern Corp. | 17,501 | 603 |
| Northwest Natural Gas Co. | 12,857 | 601 |
| MGE Energy Inc. | 11,140 | 486 |
| Laclede Group Inc. | 10,880 | 436 |
| CH Energy Group Inc. | 7,551 | 417 |
| Empire District Electric Co. | 20,400 | 407 |
| California Water | | |
| Service Group | 20,363 | 378 |
| Otter Tail Corp. | 17,436 | 338 |
| American States Water Co. | 9,125 | 319 |
| Central Vermont | | |
| Public Service Corp. | 6,551 | 232 |
| SJW Corp. | 6,717 | 156 |
| | | 247,427 |
| Total Common Stocks | | |
| (Cost $2,536,103) | | 2,744,902 |
14
| | |
| High Dividend Yield Index Fund | |
| |
| |
| | | Market |
| | | Value |
| | Shares | ($000) |
| Temporary Cash Investment (0.1%) | |
| Money Market Fund (0.1%) | |
| 1,2 Vanguard Market | | |
| Liquidity Fund, | 0.128% | |
| (Cost $3,622) | 3,622,346 | 3,622 |
| Total Investments (100.1%) | |
| (Cost $2,539,725) | | 2,748,524 |
| Other Assets and Liabilities (-0.1%) | |
| Other Assets | | 27,885 |
| Liabilities1 | | (31,319) |
| | | (3,434) |
| Net Assets (100%) | | 2,745,090 |
At October 31, 2011, net assets consisted of:
| |
| | Amount |
| | ($000) |
| Paid-in Capital | 2,566,549 |
| Undistributed Net Investment Income | 5,998 |
| Accumulated Net Realized Losses | (36,256) |
| Unrealized Appreciation (Depreciation) | 208,799 |
| Net Assets | 2,745,090 |
| |
| |
| Investor Shares—Net Assets | |
| Applicable to 43,962,795 outstanding | |
| $.001 par value shares of beneficial | |
| interest (unlimited authorization) | 760,766 |
| Net Asset Value Per Share— | |
| Investor Shares | $17.30 |
| |
| |
| ETF Shares—Net Assets | |
| Applicable to 45,429,335 outstanding | |
| $.001 par value shares of beneficial | |
| interest (unlimited authorization) | 1,984,324 |
| Net Asset Value Per Share— | |
| ETF Shares | $43.68 |
See Note A in Notes to Financial Statements.
^ Part of security position is on loan to broker-dealers. The total value of securities on loan is $2,679,000.
† Non-income producing security—new issue that has not paid a dividend as of October 31, 2011.
1 Includes $2,842,000 of collateral received for securities on loan.
2 Affiliated money market fund available only to Vanguard funds and certain trusts and accounts managed by Vanguard. Rate shown is the 7-day yield.
See accompanying Notes, which are an integral part of the Financial Statements.
15
High Dividend Yield Index Fund
Statement of Operations
| |
| | Year Ended |
| | October 31, 2011 |
| | ($000) |
| Investment Income | |
| Income | |
| Dividends | 60,841 |
| Interest1 | 4 |
| Security Lending | 70 |
| Total Income | 60,915 |
| Expenses | |
| The Vanguard Group—Note B | |
| Investment Advisory Services | 201 |
| Management and Administrative—Investor Shares | 1,043 |
| Management and Administrative—ETF Shares | 992 |
| Marketing and Distribution—Investor Shares | 109 |
| Marketing and Distribution—ETF Shares | 338 |
| Custodian Fees | 250 |
| Auditing Fees | 28 |
| Shareholders’ Reports—Investor Shares | 9 |
| Shareholders’ Reports—ETF Shares | 51 |
| Trustees’ Fees and Expenses | 2 |
| Total Expenses | 3,023 |
| Net Investment Income | 57,892 |
| Realized Net Gain (Loss) on Investment Securities Sold | 38,362 |
| Change in Unrealized Appreciation (Depreciation) of Investment Securities | 99,015 |
| Net Increase (Decrease) in Net Assets Resulting from Operations | 195,269 |
| 1 Interest income from an affiliated company of the fund was $4,000. |
See accompanying Notes, which are an integral part of the Financial Statements.
16
High Dividend Yield Index Fund
Statement of Changes in Net Assets
| | |
| | Year Ended October 31, |
| | 2011 | 2010 |
| | ($000) | ($000) |
| Increase (Decrease) in Net Assets | | |
| Operations | | |
| Net Investment Income | 57,892 | 24,181 |
| Realized Net Gain (Loss) | 38,362 | (40,717) |
| Change in Unrealized Appreciation (Depreciation) | 99,015 | 134,572 |
| Net Increase (Decrease) in Net Assets Resulting from Operations | 195,269 | 118,036 |
| Distributions | | |
| Net Investment Income | | |
| Investor Shares | (14,728) | (5,649) |
| ETF Shares | (39,464) | (17,618) |
| Realized Capital Gain | | |
| Investor Shares | — | — |
| ETF Shares | — | — |
| Total Distributions | (54,192) | (23,267) |
| Capital Share Transactions | | |
| Investor Shares | 427,787 | 117,470 |
| ETF Shares | 995,652 | 383,901 |
| Net Increase (Decrease) from Capital Share Transactions | 1,423,439 | 501,371 |
| Total Increase (Decrease) | 1,564,516 | 596,140 |
| Net Assets | | |
| Beginning of Period | 1,180,574 | 584,434 |
| End of Period1 | 2,745,090 | 1,180,574 |
| 1 Net Assets—End of Period includes undistributed net investment income of $5,998,000 and $2,298,000. |
See accompanying Notes, which are an integral part of the Financial Statements.
17
High Dividend Yield Index Fund
Financial Highlights
| | | | | |
| Investor Shares | | | | | |
| | | | | | Nov. 16, |
| | | | | | 20061, to |
| | | Year Ended October 31, | |
| For a Share Outstanding | | | | | Oct. 31, |
| Throughout Each Period | 2011 | 2010 | 2009 | 2008 | 2007 |
| Net Asset Value, Beginning of Period | $15.94 | $14.15 | $14.20 | $21.61 | $20.00 |
| Investment Operations | | | | | |
| Net Investment Income | .489 | .415 | .4682 | .589 | .5422 |
| Net Realized and Unrealized Gain (Loss) | | | | | |
| on Investments | 1.355 | 1.792 | (.070) | (7.409) | 1.477 |
| Total from Investment Operations | 1.844 | 2.207 | .398 | (6.820) | 2.019 |
| Distributions | | | | | |
| Dividends from Net Investment Income | (.484) | (.417) | (.448) | (.590) | (.409) |
| Distributions from Realized Capital Gains | — | — | — | — | — |
| Total Distributions | (.484) | (.417) | (.448) | (.590) | (.409) |
| Net Asset Value, End of Period | $17.30 | $15.94 | $14.15 | $14.20 | $21.61 |
| |
| Total Return3 | 11.70% | 15.79% | 3.27% | -32.17% | 10.16% |
| |
| Ratios/Supplemental Data | | | | | |
| Net Assets, End of Period (Millions) | $761 | $296 | $155 | $77 | $67 |
| Ratio of Total Expenses to | | | | | |
| Average Net Assets | 0.25% | 0.30% | 0.35% | 0.35% | 0.40%4 |
| Ratio of Net Investment Income to | | | | | |
| Average Net Assets | 3.04% | 2.86% | 3.63% | 3.41% | 2.43%4 |
| Portfolio Turnover Rate5 | 16% | 34% | 20% | 11% | 11% |
1 Inception.
2 Calculated based on average shares outstanding.
3 Total returns do not include account service fees that may have applied in the periods shown. Fund prospectuses provide information about any applicable account service fees.
4 Annualized.
5 Excludes the value of portfolio securities received or delivered as a result of in-kind purchases or redemptions of the fund’s capital shares, including ETF Creation Units.
See accompanying Notes, which are an integral part of the Financial Statements.
18
High Dividend Yield Index Fund
Financial Highlights
| | | | | |
| ETF Shares | | | | | |
| | | | | | |
| | | | | | Nov. 10, |
| | | | 20061, to |
| For a Share Outstanding | | | Year Ended October 31, | Oct. 31, |
| Throughout Each Period | 2011 | 2010 | 2009 | 2008 | 2007 |
| Net Asset Value, Beginning of Period | $40.22 | $35.70 | $35.84 | $54.55 | $50.04 |
| Investment Operations | | | | | |
| Net Investment Income | 1.283 | 1.092 | 1.2352 | 1.553 | 1.4052 |
| Net Realized and Unrealized Gain (Loss) | | | | | |
| on Investments | 3.442 | 4.527 | (.198) | (18.703) | 4.190 |
| Total from Investment Operations | 4.725 | 5.619 | 1.037 | (17.150) | 5.595 |
| Distributions | | | | | |
| Dividends from Net Investment Income | (1.265) | (1.099) | (1.177) | (1.560) | (1.085) |
| Distributions from Realized Capital Gains | — | — | — | — | — |
| Total Distributions | (1.265) | (1.099) | (1.177) | (1.560) | (1.085) |
| Net Asset Value, End of Period | $43.68 | $40.22 | $35.70 | $35.84 | $54.55 |
| |
| Total Return | 11.88% | 15.93% | 3.38% | -32.07% | 11.26% |
| |
| Ratios/Supplemental Data | | | | | |
| Net Assets, End of Period (Millions) | $1,984 | $884 | $430 | $161 | $115 |
| Ratio of Total Expenses to | | | | | |
| Average Net Assets | 0.13% | 0.18% | 0.20% | 0.20% | 0.25%3 |
| Ratio of Net Investment Income to | | | | | |
| Average Net Assets | 3.16% | 2.98% | 3.78% | 3.56% | 2.58%3 |
| Portfolio Turnover Rate4 | 16% | 34% | 20% | 11% | 11% |
1 Inception.
2 Calculated based on average shares outstanding.
3 Annualized.
4 Excludes the value of portfolio securities received or delivered as a result of in-kind purchases or redemptions of the fund’s capital shares, including ETF Creation Units.
See accompanying Notes, which are an integral part of the Financial Statements.
19
High Dividend Yield Index Fund
Notes to Financial Statements
Vanguard High Dividend Yield Index Fund is registered under the Investment Company Act of 1940 as an open-end investment company, or mutual fund. The fund offers two classes of shares: Investor Shares and ETF Shares. Investor Shares are available to any investor who meets the fund’s minimum purchase requirements. ETF Shares are listed for trading on the NYSE Arca, Inc.; they can be purchased and sold through a broker.
A. The following significant accounting policies conform to generally accepted accounting principles for U.S. mutual funds. The fund consistently follows such policies in preparing its financial statements.
1. Security Valuation: Securities are valued as of the close of trading on the New York Stock Exchange (generally 4 p.m., Eastern time) on the valuation date. Equity securities are valued at the latest quoted sales prices or official closing prices taken from the primary market in which each security trades; such securities not traded on the valuation date are valued at the mean of the latest quoted bid and asked prices. Securities for which market quotations are not readily available, or whose values have been materially affected by events occurring before the fund’s pricing time but after the close of the securities’ primary markets, are valued by methods deemed by the board of trustees to represent fair value. Investments in Vanguard Market Liquidity Fund are valued at that fund’s net asset value.
2. Federal Income Taxes: The fund intends to continue to qualify as a regulated investment company and distribute all of its taxable income. Management has analyzed the fund’s tax positions taken for all open federal income tax years (October 31, 2008–2011), and has concluded that no provision for federal income tax is required in the fund’s financial statements.
3. Distributions: Distributions to shareholders are recorded on the ex-dividend date.
4. Security Lending: The fund may lend its securities to qualified institutional borrowers to earn additional income. Security loans are required to be secured at all times by collateral at least equal to the market value of securities loaned. The fund invests cash collateral received in Vanguard Market Liquidity Fund, and records a liability for the return of the collateral, during the period the securities are on loan. Security lending income represents fees charged to borrowers plus income earned on investing cash collateral, less expenses associated with the loan.
5. Other: Dividend income is recorded on the ex-dividend date. Interest income includes income distributions received from Vanguard Market Liquidity Fund and is accrued daily. Security transactions are accounted for on the date securities are bought or sold. Costs used to determine realized gains (losses) on the sale of investment securities are those of the specific securities sold.
Each class of shares has equal rights as to assets and earnings, except that each class separately bears certain class-specific expenses related to maintenance of shareholder accounts (included in Management and Administrative expenses) and shareholder reporting. Marketing and distribution expenses are allocated to each class of shares based on a method approved by the board of trustees. Income, other non-class-specific expenses, and gains and losses on investments are allocated to each class of shares based on its relative net assets.
20
High Dividend Yield Index Fund
B. The Vanguard Group furnishes at cost investment advisory, corporate management, administrative, marketing, and distribution services. The costs of such services are allocated to the fund under methods approved by the board of trustees. The fund has committed to provide up to 0.40% of its net assets in capital contributions to Vanguard. At October 31, 2011, the fund had contributed capital of $404,000 to Vanguard (included in Other Assets), representing 0.01% of the fund’s net assets and 0.16% of Vanguard’s capitalization. The fund’s trustees and officers are also directors and officers of Vanguard.
C. Various inputs may be used to determine the value of the fund’s investments. These inputs are summarized in three broad levels for financial statement purposes. The inputs or methodologies used to value securities are not necessarily an indication of the risk associated with investing in those securities.
Level 1—Quoted prices in active markets for identical securities.
Level 2—Other significant observable inputs (including quoted prices for similar securities, interest rates, prepayment speeds, credit risk, etc.).
Level 3—Significant unobservable inputs (including the fund’s own assumptions used to determine the fair value of investments).
At October 31, 2011, 100% of the market value of the fund’s investments was based on Level 1 inputs.
D. Distributions are determined on a tax basis and may differ from net investment income and realized capital gains for financial reporting purposes. Differences may be permanent or temporary. Permanent differences are reclassified among capital accounts in the financial statements to reflect their tax character. Temporary differences arise when certain items of income, expense, gain, or loss are recognized in different periods for financial statement and tax purposes; these differences will reverse at some time in the future. Differences in classification may also result from the treatment of short-term gains as ordinary income for tax purposes.
During the year ended October 31, 2011, the fund realized $8,117,000 of net capital gains resulting from in-kind redemptions—in which shareholders exchanged fund shares for securities held by the fund rather than for cash. Because such gains are not taxable to the fund, and are not distributed to shareholders, they have been reclassified from accumulated net realized losses to paid-in capital.
For tax purposes, at October 31, 2011, the fund had $7,426,000 of ordinary income available for distribution. The fund had available capital loss carryforwards totaling $24,934,000 to offset future net capital gains through October 31, 2018.
At October 31, 2011, the cost of investment securities for tax purposes was $2,551,046,000.
Net unrealized appreciation of investment securities for tax purposes was $197,478,000, consisting of unrealized gains of $234,931,000 on securities that had risen in value since their purchase and $37,453,000 in unrealized losses on securities that had fallen in value since their purchase.
E. During the year ended October 31, 2011, the fund purchased $1,760,370,000 of investment securities and sold $333,336,000 of investment securities, other than temporary cash investments.
21
High Dividend Yield Index Fund
F. Capital share transactions for each class of shares were:
| | | | |
| | | | Year Ended October 31, |
| | | 2011 | | 2010 |
| | Amount | Shares | Amount | Shares |
| | ($000) | (000) | ($000) | (000) |
| Investor Shares | | | | |
| Issued | 579,720 | 34,357 | 172,365 | 11,302 |
| Issued in Lieu of Cash Distributions | 12,415 | 744 | 4,536 | 300 |
| Redeemed | (164,348) | (9,739) | (59,431) | (3,924) |
| Net Increase (Decrease)—Investor Shares | 427,787 | 25,362 | 117,470 | 7,678 |
| ETF Shares | | | | |
| Issued | 1,021,990 | 24,047 | 387,936 | 10,039 |
| Issued in Lieu of Cash Distributions | — | — | — | — |
| Redeemed | (26,338) | (600) | (4,035) | (100) |
| Net Increase (Decrease)—ETF Shares | 995,652 | 23,447 | 383,901 | 9,939 |
G. In preparing the financial statements as of October 31, 2011, management considered the impact of subsequent events for potential recognition or disclosure in these financial statements.
22
Report of Independent Registered
Public Accounting Firm
To the Trustees of Vanguard Whitehall Funds and the Shareholders of Vanguard High Dividend Yield Index Fund:
In our opinion, the accompanying statement of net assets and the related statements of operations and of changes in net assets and the financial highlights present fairly, in all material respects, the financial position of Vanguard High Dividend Yield Index Fund (constituting a separate portfolio of Vanguard Whitehall Funds, hereafter referred to as the “Fund”) at October 31, 2011, the results of its operations for the year then ended, the changes in its net assets for each of the two years in the period then ended and the financial highlights for each of the periods indicated, in conformity with accounting principles generally accepted in the United States of America. These financial statements and financial highlights (hereafter referred to as “financial statements”) are the responsibility of the Fund’s management; our responsibility is to express an opinion on these financial statements based on our audits.
We conducted our audits of these financial statements in accordance with the standards of the Public Company Accounting Oversight Board (United States). Those standards require that we plan and perform the audit to obtain reasonable assurance about whether the financial statements are free of material misstatement. An audit includes examining, on a test basis, evidence supporting the amounts and disclosures in the financial statements, assessing the accounting principles used and significant estimates made by management, and evaluating the overall financial statement presentation. We believe that our audits, which included confirmation of securities at October 31, 2011 by correspondence with the custodian and by agreement to the underlying ownership records of Vanguard Market Liquidity Fund, provide a reasonable basis for our opinion.
PricewaterhouseCoopers LLP
Philadelphia, Pennsylvania
December 12, 2011
|
| Special 2011 tax information (unaudited) for Vanguard High Dividend Yield Index Fund |
This information for the fiscal year ended October 31, 2011, is included pursuant to provisions of the Internal Revenue Code.
The fund distributed $54,192,000 of qualified dividend income to shareholders during the fiscal year.
For corporate shareholders, 100% of investment income (dividend income plus short-term gains, if any) qualifies for the dividends-received deduction.
23
Your Fund’s After-Tax Returns
This table presents returns for your fund both before and after taxes. The after-tax returns are shown in two ways: (1) assuming that an investor owned the fund during the entire period and paid taxes on the fund’s distributions, and (2) assuming that an investor paid taxes on the fund’s distributions and sold all shares at the end of each period.
Calculations are based on the highest individual federal income tax and capital gains tax rates in effect at the times of the distributions and the hypothetical sales. State and local taxes were not considered. After-tax returns reflect any qualified dividend income, using actual prior-year figures and estimates for 2011. (In the example, returns after the sale of fund shares may be higher than those assuming no sale. This occurs when the sale would have produced a capital loss. The calculation assumes that the investor received a tax deduction for the loss.)
The table shows returns for Investor Shares only; returns for other share classes will differ. Please note that your actual after-tax returns will depend on your tax situation and may differ from those shown. Also note that if you own the fund in a tax-deferred account, such as an individual retirement account or a 401(k) plan, this information does not apply to you. Such accounts are not subject to current taxes.
Finally, keep in mind that a fund’s performance—whether before or after taxes—does not guarantee future results.
Average Annual Total Returns: High Dividend Yield Index Fund Investor Shares
Periods Ended October 31, 2011
| | |
| | | Since |
| | One | Inception |
| | Year | (11/16/2006) |
| Returns Before Taxes | 11.70% | -0.04% |
| Returns After Taxes on Distributions | 11.22 | -0.47 |
| Returns After Taxes on Distributions and Sale of Fund Shares | 8.20 | -0.08 |
24
About Your Fund’s Expenses
As a shareholder of the fund, you incur ongoing costs, which include costs for portfolio management, administrative services, and shareholder reports (like this one), among others. Operating expenses, which are deducted from a fund’s gross income, directly reduce the investment return of the fund.
A fund’s expenses are expressed as a percentage of its average net assets. This figure is known as the expense ratio. The following examples are intended to help you understand the ongoing costs (in dollars) of investing in your fund and to compare these costs with those of other mutual funds. The examples are based on an investment of $1,000 made at the beginning of the period shown and held for the entire period.
The accompanying table illustrates your fund’s costs in two ways:
• Based on actual fund return. This section helps you to estimate the actual expenses that you paid over the period. The ”Ending Account Value“ shown is derived from the fund‘s actual return, and the third column shows the dollar amount that would have been paid by an investor who started with $1,000 in the fund. You may use the information here, together with the amount you invested, to estimate the expenses that you paid over the period.
To do so, simply divide your account value by $1,000 (for example, an $8,600 account value divided by $1,000 = 8.6), then multiply the result by the number given for your fund under the heading ”Expenses Paid During Period.“
• Based on hypothetical 5% yearly return. This section is intended to help you compare your fund‘s costs with those of other mutual funds. It assumes that the fund had a yearly return of 5% before expenses, but that the expense ratio is unchanged. In this case—because the return used is not the fund’s actual return—the results do not apply to your investment. The example is useful in making comparisons because the Securities and Exchange Commission requires all mutual funds to calculate expenses based on a 5% return. You can assess your fund’s costs by comparing this hypothetical example with the hypothetical examples that appear in shareholder reports of other funds.
Note that the expenses shown in the table are meant to highlight and help you compare ongoing costs only and do not reflect transaction costs incurred by the fund for buying and selling securities. Further, the expenses do not include any purchase, redemption, or account service fees described in the fund prospectus. If such fees were applied to your account, your costs would be higher. Your fund does not carry a “sales load.”
The calculations assume no shares were bought or sold during the period. Your actual costs may have been higher or lower, depending on the amount of your investment and the timing of any purchases or redemptions.
You can find more information about the fund’s expenses, including annual expense ratios, in the Financial Statements section of this report. For additional information on operating expenses and other shareholder costs, please refer to your fund’s current prospectus.
25
| | | |
| Six Months Ended October 31, 2011 | | | |
| | Beginning | Ending | Expenses |
| | Account Value | Account Value | Paid During |
| High Dividend Yield Index Fund | 4/30/2011 | 10/31/2011 | Period |
| Based on Actual Fund Return | | | |
| Investor Shares | $1,000.00 | $960.44 | $1.14 |
| ETF Shares | 1,000.00 | 961.53 | 0.54 |
| Based on Hypothetical 5% Yearly Return | | | |
| Investor Shares | $1,000.00 | $1,024.05 | $1.17 |
| ETF Shares | 1,000.00 | 1,024.65 | 0.56 |
The calculations are based on expenses incurred in the most recent six-month period. The fund’s annualized six-month expense ratios for that period are 0.23% for Investor Shares and 0.11% for ETF Shares. The dollar amounts shown as “Expenses Paid” are equal to the annualized expense ratio multiplied by the average account value over the period, multiplied by the number of days in the most recent six-month period, then divided by the number of days in the most recent 12-month period.
26
Glossary
30-Day SEC Yield. A fund’s 30-day SEC yield is derived using a formula specified by the U.S. Securities and Exchange Commission. Under the formula, data related to the fund’s security holdings in the previous 30 days are used to calculate the fund’s hypothetical net income for that period, which is then annualized and divided by the fund’s estimated average net assets over the calculation period. For the purposes of this calculation, a security’s income is based on its current market yield to maturity (for bonds; excluding inflation for inflation-protected securities), its actual income (for asset-backed securities), or its projected dividend yield (for stocks). Because the SEC yield represents hypothetical annualized income, it will differ—at times significantly—from the fund’s actual experience. As a result, the fund’s income distributions may be higher or lower than implied by the SEC yield.
Beta. A measure of the magnitude of a fund’s past share-price fluctuations in relation to the ups and downs of a given market index. The index is assigned a beta of 1.00. Compared with a given index, a fund with a beta of 1.20 typically would have seen its share price rise or fall by 12% when the index rose or fell by 10%. For this report, beta is based on returns over the past 36 months for both the fund and the index. Note that a fund’s beta should be reviewed in conjunction with its R-squared (see definition). The lower the R-squared, the less correlation there is between the fund and the index, and the less reliable beta is as an indicator of volatility.
Dividend Yield. Dividend income earned by stocks, expressed as a percentage of the aggregate market value (or of net asset value, for a fund). The yield is determined by dividing the amount of the annual dividends by the aggregate value (or net asset value) at the end of the period. For a fund, the dividend yield is based solely on stock holdings and does not include any income produced by other investments.
Earnings Growth Rate. The average annual rate of growth in earnings over the past five years for the stocks now in a fund.
Equity Exposure. A measure that reflects a fund’s investments in stocks and stock futures. Any holdings in short-term reserves are excluded.
Expense Ratio. The percentage of a fund’s average net assets used to pay its annual administrative and advisory expenses. These expenses directly reduce returns to investors.
Foreign Holdings. The percentage of a fund represented by securities or depositary receipts of companies based outside the United States.
Inception Date. The date on which the assets of a fund (or one of its share classes) are first invested in accordance with the fund’s investment objective. For funds with a subscription period, the inception date is the day after that period ends. Investment performance is measured from the inception date.
Median Market Cap. An indicator of the size of companies in which a fund invests; the midpoint of market capitalization (market price x shares outstanding) of a fund’s stocks, weighted by the proportion of the fund’s assets invested in each stock. Stocks representing half of the fund’s assets have market capitalizations above the median, and the rest are below it.
Price/Book Ratio. The share price of a stock divided by its net worth, or book value, per share. For a fund, the weighted average price/book ratio of the stocks it holds.
27
Price/Earnings Ratio. The ratio of a stock’s current price to its per-share earnings over the past year. For a fund, the weighted average P/E of the stocks it holds. P/E is an indicator of market expectations about corporate prospects; the higher the P/E, the greater the expectations for a company’s future growth.
R-Squared. A measure of how much of a fund’s past returns can be explained by the returns from the market in general, as measured by a given index. If a fund’s total returns were precisely synchronized with an index’s returns, its R-squared would be 1.00. If the fund’s returns bore no relationship to the index’s returns, its R-squared would be 0. For this report, R-squared is based on returns over the past 36 months for both the fund and the index.
Return on Equity. The annual average rate of return generated by a company during the past five years for each dollar of shareholder’s equity (net income divided by shareholder’s equity). For a fund, the weighted average return on equity for the companies whose stocks it holds.
Short-Term Reserves. The percentage of a fund invested in highly liquid, short-term securities that can be readily converted to cash.
Turnover Rate. An indication of the fund’s trading activity. Funds with high turnover rates incur higher transaction costs and may be more likely to distribute capital gains (which may be taxable to investors). The turnover rate excludes in-kind transactions, which have minimal impact on costs.
28
This page intentionally left blank.
This page intentionally left blank.
This page intentionally left blank.
The People Who Govern Your Fund
The trustees of your mutual fund are there to see that the fund is operated and managed in your best interests since, as a shareholder, you are a part owner of the fund. Your fund’s trustees also serve on the board of directors of The Vanguard Group, Inc., which is owned by the Vanguard funds and provides services to them on an at-cost basis.
A majority of Vanguard’s board members are independent, meaning that they have no affiliation with Vanguard or the funds they oversee, apart from the sizable personal investments they have made as private individuals. The independent board members have distinguished backgrounds in business, academia, and public service. Each of the trustees and executive officers oversees 180 Vanguard funds.
The following table provides information for each trustee and executive officer of the fund. More information about the trustees is in the Statement of Additional Information, which can be obtained, without charge, by contacting Vanguard at 800-662-7447, or online at vanguard.com.
| |
| Interested Trustee1 | and President (2006–2008) of Rohm and Haas Co. |
| | (chemicals); Director of Tyco International, Ltd. |
| F. William McNabb III | (diversified manufacturing and services) and Hewlett- |
| Born 1957. Trustee Since July 2009. Chairman of the | Packard Co. (electronic computer manufacturing); |
| Board. Principal Occupation(s) During the Past Five | Senior Advisor at New Mountain Capital; Trustee |
| Years: Chairman of the Board of The Vanguard Group, | of The Conference Board; Member of the Board of |
| Inc., and of each of the investment companies served | Managers of Delphi Automotive LLP (automotive |
| by The Vanguard Group, since January 2010; Director | components). |
| of The Vanguard Group since 2008; Chief Executive | |
| Officer and President of The Vanguard Group and of | Amy Gutmann |
| each of the investment companies served by The | Born 1949. Trustee Since June 2006. Principal |
| Vanguard Group since 2008; Director of Vanguard | Occupation(s) During the Past Five Years: President |
| Marketing Corporation; Managing Director of The | of the University of Pennsylvania; Christopher H. |
| Vanguard Group (1995–2008). | Browne Distinguished Professor of Political Science |
| | in the School of Arts and Sciences with secondary |
| | appointments at the Annenberg School for Commu- |
| Independent Trustees | nication and the Graduate School of Education |
| | of the University of Pennsylvania; Director of |
| Emerson U. Fullwood | Carnegie Corporation of New York, Schuylkill River |
| Born 1948. Trustee Since January 2008. Principal | Development Corporation, and Greater Philadelphia |
| Occupation(s) During the Past Five Years: Executive | Chamber of Commerce; Trustee of the National |
| Chief Staff and Marketing Officer for North America | Constitution Center; Chair of the Presidential |
| and Corporate Vice President (retired 2008) of Xerox | Commission for the Study of Bioethical Issues. |
| Corporation (document management products and | |
| services); Executive in Residence and 2010 | JoAnn Heffernan Heisen |
| Distinguished Minett Professor at the Rochester | Born 1950. Trustee Since July 1998. Principal |
| Institute of Technology; Director of SPX Corporation | Occupation(s) During the Past Five Years: Corporate |
| (multi-industry manufacturing), the United Way of | Vice President and Chief Global Diversity Officer |
| Rochester, Amerigroup Corporation (managed health | (retired 2008) and Member of the Executive |
| care), the University of Rochester Medical Center, | Committee (1997–2008) of Johnson & Johnson |
| Monroe Community College Foundation, and North | (pharmaceuticals/consumer products); Director of |
| Carolina A&T University. | Skytop Lodge Corporation (hotels), the University |
| | Medical Center at Princeton, the Robert Wood |
| Rajiv L. Gupta | Johnson Foundation, and the Center for Work Life |
| Born 1945. Trustee Since December 2001.2 | Policy; Member of the Advisory Board of the |
| Principal Occupation(s) During the Past Five Years: | Maxwell School of Citizenship and Public Affairs |
| Chairman and Chief Executive Officer (retired 2009) | at Syracuse University. |
| | |
| F. Joseph Loughrey | Thomas J. Higgins | |
| Born 1949. Trustee Since October 2009. Principal | Born 1957. Chief Financial Officer Since September |
| Occupation(s) During the Past Five Years: President | 2008. Principal Occupation(s) During the Past Five |
| and Chief Operating Officer (retired 2009) and Vice | Years: Principal of The Vanguard Group, Inc.; Chief |
| Chairman of the Board (2008–2009) of Cummins Inc. | Financial Officer of each of the investment companies |
| (industrial machinery); Director of SKF AB (industrial | served by The Vanguard Group since 2008; Treasurer |
| machinery), Hillenbrand, Inc. (specialized consumer | of each of the investment companies served by The |
| services), the Lumina Foundation for Education, and | Vanguard Group (1998–2008). |
| Oxfam America; Chairman of the Advisory Council | | |
| for the College of Arts and Letters and Member | Kathryn J. Hyatt | |
| of the Advisory Board to the Kellogg Institute for | Born 1955. Treasurer Since November 2008. Principal |
| International Studies at the University of Notre Dame. | Occupation(s) During the Past Five Years: Principal |
| | of The Vanguard Group, Inc.; Treasurer of each of |
| André F. Perold | the investment companies served by The Vanguard |
| Born 1952. Trustee Since December 2004. Principal | Group since 2008; Assistant Treasurer of each of the |
| Occupation(s) During the Past Five Years: George | investment companies served by The Vanguard Group |
| Gund Professor of Finance and Banking at the Harvard | (1988–2008). | |
| Business School (retired July 2011); Chief Investment | | |
| Officer and co-Managing Partner of HighVista | Heidi Stam | |
| Strategies LLC (private investment firm); Director of | Born 1956. Secretary Since July 2005. Principal |
| Rand Merchant Bank; Overseer of the Museum of | Occupation(s) During the Past Five Years: Managing |
| Fine Arts Boston. | Director of The Vanguard Group, Inc., since 2006; |
| | General Counsel of The Vanguard Group since 2005; |
| Alfred M. Rankin, Jr. | Secretary of The Vanguard Group and of each of the |
| Born 1941. Trustee Since January 1993. Principal | investment companies served by The Vanguard Group |
| Occupation(s) During the Past Five Years: Chairman, | since 2005; Director and Senior Vice President of |
| President, and Chief Executive Officer of NACCO | Vanguard Marketing Corporation since 2005; |
| Industries, Inc. (forklift trucks/housewares/lignite); | Principal of The Vanguard Group (1997–2006). |
| Director of Goodrich Corporation (industrial products/ | | |
| aircraft systems and services) and the National | | |
| Association of Manufacturers; Chairman of the | Vanguard Senior Management Team |
| Federal Reserve Bank of Cleveland; Vice Chairman | | |
| of University Hospitals of Cleveland; President of | R. Gregory Barton | Chris D. McIsaac |
| the Board of The Cleveland Museum of Art. | Mortimer J. Buckley | Michael S. Miller |
| | Kathleen C. Gubanich | James M. Norris |
| Peter F. Volanakis | Paul A. Heller | Glenn W. Reed |
| Born 1955. Trustee Since July 2009. Principal | Martha G. King | George U. Sauter |
| Occupation(s) During the Past Five Years: President | | |
| and Chief Operating Officer (retired 2010) of Corning | | |
| Incorporated (communications equipment); Director of | Chairman Emeritus and Senior Advisor |
| Corning Incorporated (2000–2010) and Dow Corning | | |
| (2001–2010); Overseer of the Amos Tuck School of | John J. Brennan | |
| Business Administration at Dartmouth College. | Chairman, 1996–2009 | |
| | Chief Executive Officer and President, 1996–2008 |
| |
| Executive Officers | | |
| | Founder | |
| Glenn Booraem | | |
| Born 1967. Controller Since July 2010. Principal | John C. Bogle | |
| Occupation(s) During the Past Five Years: Principal | Chairman and Chief Executive Officer, 1974–1996 |
| of The Vanguard Group, Inc.; Controller of each of | | |
| the investment companies served by The Vanguard | | |
| Group since 2010; Assistant Controller of each of | | |
| the investment companies served by The Vanguard | | |
| Group (2001–2010). | | |
1 Mr. McNabb is considered an “interested person,” as defined in the Investment Company Act of 1940, because he is an officer of the Vanguard funds.
2 December 2002 for Vanguard Equity Income Fund, Vanguard Growth Equity Fund, the Vanguard Municipal Bond Funds, and the Vanguard State Tax-Exempt Funds.
|  |
| P.O. Box 2600 |
| Valley Forge, PA 19482-2600 |
Connect with Vanguard® > vanguard.com
| |
| Fund Information > 800-662-7447 | “FTSE®” is a trademark jointly owned by the London |
| Direct Investor Account Services > 800-662-2739 | Stock Exchange plc and The Financial Times Limited |
| | and is used by FTSE International Limited under license. |
| Institutional Investor Services > 800-523-1036 | The FTSE High Dividend Yield Index is calculated by |
| Text Telephone for People | FTSE International Limited. FTSE International Limited |
| With Hearing Impairment > 800-749-7273 | does not sponsor, endorse, or promote the fund; is not |
| | in any way connected to it; and does not accept any |
| This material may be used in conjunction | liability in relation to its issue, operation, and trading. |
| with the offering of shares of any Vanguard | |
| fund only if preceded or accompanied by | |
| the fund’s current prospectus. | |
| |
| All comparative mutual fund data are from Lipper Inc. or | |
| Morningstar, Inc., unless otherwise noted. | |
| |
| You can obtain a free copy of Vanguard’s proxy voting | |
| guidelines by visiting vanguard.com/proxyreporting or by | |
| calling Vanguard at 800-662-2739. The guidelines are | |
| also available from the SEC’s website, sec.gov. In | |
| addition, you may obtain a free report on how your fund | |
| voted the proxies for securities it owned during the 12 | |
| months ended June 30. To get the report, visit either | |
| vanguard.com/proxyreporting or sec.gov. | |
| |
| You can review and copy information about your fund at | |
| the SEC’s Public Reference Room in Washington, D.C. To | |
| find out more about this public service, call the SEC at | |
| 202-551-8090. Information about your fund is also | |
| available on the SEC’s website, and you can receive | |
| copies of this information, for a fee, by sending a | |
| request in either of two ways: via e-mail addressed to | |
| publicinfo@sec.gov or via regular mail addressed to the | |
| Public Reference Section, Securities and Exchange | |
| Commission, Washington, DC 20549-1520. | |
| |
| |
| | © 2011 The Vanguard Group, Inc. |
| | All rights reserved. |
| | Vanguard Marketing Corporation, Distributor. |
| |
| | Q6230 122011 |
Item 2: Code of Ethics. The Registrant has adopted a code of ethics that applies to the Registrant’s principal executive officer, principal financial officer, principal accounting officer or controller or persons performing similar functions. The Code of Ethics was amended during the reporting period covered by this report to make certain technical, non-material changes.
Item 3: Audit Committee Financial Expert. The following members of the Audit Committee have been determined by the Registrant’s Board of Trustees to be Audit Committee Financial Experts serving on its Audit Committee, and to be independent: Charles D. Ellis, Rajiv L. Gupta, JoAnn Heffernan Heisen, André F. Perold, and Alfred M. Rankin, Jr.
Item 4: Principal Accountant Fees and Services.
(a) Audit Fees.
Audit Fees of the Registrant
Fiscal Year Ended October 31, 2011: $120,000
Fiscal Year Ended October 31, 2010: $112,000
Aggregate Audit Fees of Registered Investment Companies in the Vanguard Group.
Fiscal Year Ended October 31, 2011: $3,978,540
Fiscal Year Ended October 31, 2010: $3,607,060
(b) Audit-Related Fees.
Fiscal Year Ended October 31, 2011: $1,341,750
Fiscal Year Ended October 31, 2010: $791,350
Includes fees billed in connection with assurance and related services provided to the Registrant, The Vanguard Group, Inc., Vanguard Marketing Corporation, and other registered investment companies in the Vanguard Group.
(c) Tax Fees.
Fiscal Year Ended October 31, 2011: $373,830
Fiscal Year Ended October 31, 2010: $336,090
Includes fees billed in connection with tax compliance, planning and advice services provided to the Registrant, The Vanguard Group, Inc., Vanguard Marketing Corporation, and other registered investment companies in the Vanguard Group and related to income and excise taxes.
(d) All Other Fees.
Fiscal Year Ended October 31, 2011: $16,000
Fiscal Year Ended October 31, 2010: $16,000
Includes fees billed for services related to risk management and privacy matters. Services were provided to the Registrant, The Vanguard Group, Inc., Vanguard Marketing Corporation, and other registered investment companies in the Vanguard Group.
(e) (1) Pre-Approval Policies. The policy of the Registrant’s Audit Committee is to consider and, if appropriate, approve before the principal accountant is engaged for such services, all specific audit and non-audit services provided to: (1) the Registrant; (2) The Vanguard Group, Inc.; (3) other entities controlled by The Vanguard Group, Inc. that provide ongoing services to the Registrant; and (4) other registered investment
companies in the Vanguard Group. In making a determination, the Audit Committee considers whether the services are consistent with maintaining the principal accountant’s independence.
In the event of a contingency situation in which the principal accountant is needed to provide services in between scheduled Audit Committee meetings, the Chairman of the Audit Committee would be called on to consider and, if appropriate, pre-approve audit or permitted non-audit services in an amount sufficient to complete services through the next Audit Committee meeting, and to determine if such services would be consistent with maintaining the accountant’s independence. At the next scheduled Audit Committee meeting, services and fees would be presented to the Audit Committee for formal consideration, and, if appropriate, approval by the entire Audit Committee. The Audit Committee would again consider whether such services and fees are consistent with maintaining the principal accountant’s independence.
The Registrant’s Audit Committee is informed at least annually of all audit and non-audit services provided by the principal accountant to the Vanguard complex, whether such services are provided to: (1) the Registrant; (2) The Vanguard Group, Inc.; (3) other entities controlled by The Vanguard Group, Inc. that provide ongoing services to the Registrant; or (4) other registered investment companies in the Vanguard Group.
(2) No percentage of the principal accountant’s fees or services were approved pursuant to the waiver provision of paragraph (c)(7)(i)(C) of Rule 2-01 of Regulation S-X.
(f) For the most recent fiscal year, over 50% of the hours worked under the principal accountant’s engagement were not performed by persons other than full-time, permanent employees of the principal accountant.
(g) Aggregate Non-Audit Fees.
Fiscal Year Ended October 31, 2011: $389,830
Fiscal Year Ended October 31, 2010: $352,090
Includes fees billed for non-audit services provided to the Registrant, The Vanguard Group, Inc., Vanguard Marketing Corporation, and other registered investment companies in the Vanguard Group.
(h) For the most recent fiscal year, the Audit Committee has determined that the provision of all non-audit services was consistent with maintaining the principal accountant’s independence.
Item 5: Audit Committee of Listed Registrants.
Not Applicable.
Item 6: Investments.
Not Applicable.
Item 7: Disclosure of Proxy Voting Policies and Procedures for Closed-End Management Investment Companies.
Not Applicable.
Item 8: Portfolio Managers of Closed-End Management Investment Companies.
Not Applicable.
Item 9: Purchase of Equity Securities by Closed-End Management Investment Company and Affiliated Purchasers.
Not Applicable.
Item 10: Submission of Matters to a Vote of Security Holders.
Not Applicable.
Item 11: Controls and Procedures.
(a) Disclosure Controls and Procedures. The Principal Executive and Financial Officers concluded that the Registrant's Disclosure Controls and Procedures are effective based on their evaluation of the Disclosure Controls and Procedures as of a date within 90 days of the filing date of this report.
(b) Internal Control Over Financial Reporting. There were no significant changes in Registrant’s Internal Control Over Financial Reporting or in other factors that could significantly affect this control subsequent to the date of the evaluation, including any corrective actions with regard to significant deficiencies and material weaknesses.
Item 12: Exhibits.
(a) Code of Ethics.
(b) Certifications.
Pursuant to the requirements of the Securities Exchange Act of 1934 and the Investment Company Act of 1940, the registrant has duly caused this report to be signed on its behalf by the undersigned, thereunto duly authorized.
| |
| | VANGUARD WHITEHALL FUNDS |
| |
| By: | /s/ F. WILLIAM MCNABB III* |
| | F. WILLIAM MCNABB III |
| | CHIEF EXECUTIVE OFFICER |
| |
| Date: December 20, 2011 |
Pursuant to the requirements of the Securities Exchange Act of 1934 and the Investment Company Act of 1940, this report has been signed below by the following persons on behalf of the registrant and in the capacities and on the dates indicated.
| |
| | VANGUARD WHITEHALL FUNDS |
| |
| By: | /s/ F. WILLIAM MCNABB III* |
| | F. WILLIAM MCNABB III |
| | CHIEF EXECUTIVE OFFICER |
| |
| Date: December 20, 2011 |
| |
| | VANGUARD WHITEHALL FUNDS |
| |
| By: | /s/ THOMAS J. HIGGINS* |
| | THOMAS J. HIGGINS |
| | CHIEF FINANCIAL OFFICER |
| |
| Date: | December 20, 2011 |
* By: /s/ Heidi Stam
Heidi Stam, pursuant to a Power of Attorney filed on November 28, 2011 see file Number 33-23444, Incorporated by Reference.