UNITED STATES
SECURITIES AND EXCHANGE COMMISSION
Washington, D.C. 20549
FORM N-CSR
CERTIFIED SHAREHOLDER REPORT
OF
REGISTERED MANAGEMENT INVESTMENT COMPANIES
| | |
| Investment Company Act file number: | 811-07443 | |
Name of Registrant: | Vanguard Whitehall Funds |
Address of Registrant: | P.O. Box 2600 |
| | Valley Forge, PA 19482 |
Name and address of agent for service: | Heidi Stam, Esquire |
| | P.O. Box 876 |
| | Valley Forge, PA 19482 |
Registrant’s telephone number, including area code: (610) 669-1000 |
Date of fiscal year end: October 31 | |
Date of reporting period: November 1, 2012 – October 31, 2013 |
Item 1: Reports to Shareholders | |

Annual Report | October 31, 2013
Vanguard Selected Value Fund

Vanguard’s Principles for Investing Success
We want to give you the best chance of investment success. These principles,
grounded in Vanguard’s research and experience, can put you on the right path.
Goals. Create clear, appropriate investment goals.
Balance. Develop a suitable asset allocation using broadly diversified funds.
Cost. Minimize cost.
Discipline. Maintain perspective and long-term discipline.
A single theme unites these principles: Focus on the things you can control.
We believe there is no wiser course for any investor.
| |
| Contents | |
| Your Fund’s Total Returns. | 1 |
| Chairman’s Letter. | 2 |
| Advisors’ Report. | 8 |
| Fund Profile. | 11 |
| Performance Summary. | 12 |
| Financial Statements. | 14 |
| Your Fund’s After-Tax Returns. | 25 |
| About Your Fund’s Expenses. | 26 |
| Glossary. | 28 |
Please note: The opinions expressed in this report are just that—informed opinions. They should not be considered promises or advice.
Also, please keep in mind that the information and opinions cover the period through the date on the front of this report. Of course, the
risks of investing in your fund are spelled out in the prospectus.
See the Glossary for definitions of investment terms used in this report.
About the cover: The ship's wheel represents leadership and guidance, essential qualities in navigating difficult seas.
This one is a replica based on an 18th-century British vessel. The HMS Vanguard, another ship of that era, served as the
flagship for Admiral Horatio Nelson when he defeated a French fleet at the Battle of the Nile.
Your Fund’s Total Returns
| |
| Fiscal Year Ended October 31, 2013 | |
| |
| | Total |
| | Returns |
| Vanguard Selected Value Fund | 36.43% |
| Russell Midcap Value Index | 33.45 |
| Mid-Cap Value Funds Average | 34.41 |
| Mid-Cap Value Funds Average: Derived from data provided by Lipper, a Thomson Reuters Company. |
| | | | |
| Your Fund’s Performance at a Glance | | | | |
| October 31, 2012, Through October 31, 2013 | | | | |
| |
| | | | Distributions Per Share |
| | Starting | Ending | | |
| | Share | Share | Income | Capital |
| | Price | Price | Dividends | Gains |
| Vanguard Selected Value Fund | $21.01 | $28.07 | $0.440 | $0.000 |
1

Chairman’s Letter
Dear Shareholder,
When stock markets are surging, mid-and small-capitalization equities are often at the forefront as confident investors more willingly accept the risk and volatility that typically accompany a commitment to smaller, less-established companies. For the fiscal year ended October 31, 2013, Vanguard Selected Value Fund benefited from just such an investment climate, as well as from superior stock choices and allocation decisions by the fund’s two advisors.
The fund returned more than 36%, about 3 percentage points more than its benchmark, the Russell Midcap Value Index, and 2 percentage points above the average return of its mid-cap value peers. Selected Value’s largest sector weightings––financials, industrials, consumer discretionary, information technology, and health care––were also its most productive. Of the nine sectors in which the fund had meaningful investments, only its second-smallest one, materials, had a negative return.
The fund was also hurt by the advisors’ decision to keep about 10% of its assets in cash, on average, during the period. The 10% cash position is unusual for Vanguard but not for Selected Value; its advisors have the flexibility to hold cash when they cannot find attractive stocks that meet their strict valuation criteria.
2
If you hold shares in a taxable account, you may wish to review the table and discussion on after-tax returns for the fiscal year that appear later in this report.
Amid uncertainty, U.S. stocks found a path to strong returns
U.S. stocks faced several challenges en route to an impressive return of about 29% for the 12 months ended October 31. Investors’ growing appetite for risk drove the rise in stocks, as corporate profit growth, in general, wasn’t particularly tantalizing.
Although the end of the fiscal year was notable for the budget impasse that resulted in October’s 16-day partial federal government shutdown, the period as a
whole was marked by uncertainty about Federal Reserve monetary policy and concern about the economy’s patchy growth. Vanguard’s chief economist, Joe Davis, recently noted that “as was the case at the start of the year, the U.S. economy continues to expand at a modest and uneven pace.”
The disparity between the performance of the U.S. economy and that of U.S. stocks may seem surprising—but Vanguard research has shown a weak relationship over the long term between a nation’s economic growth and its stock returns. (You can read more in The Outlook for Emerging Market Stocks in a Lower-Growth World, available at vanguard.com/research.)
| | | |
| Market Barometer | | | |
| |
| | Average Annual Total Returns |
| | Periods Ended October 31, 2013 |
| | One | Three | Five |
| | Year | Years | Years |
| Stocks | | | |
| Russell 1000 Index (Large-caps) | 28.40% | 16.83% | 15.84% |
| Russell 2000 Index (Small-caps) | 36.28 | 17.69 | 17.04 |
| Russell 3000 Index (Broad U.S. market) | 28.99 | 16.89 | 15.94 |
| MSCI All Country World Index ex USA (International) | 20.29 | 6.04 | 12.48 |
| |
| Bonds | | | |
| Barclays U.S. Aggregate Bond Index (Broad taxable market) | -1.08% | 3.02% | 6.09% |
| Barclays Municipal Bond Index (Broad tax-exempt market) | -1.72 | 3.60 | 6.37 |
| Citigroup Three-Month U.S. Treasury Bill Index | 0.06 | 0.07 | 0.12 |
| |
| CPI | | | |
| Consumer Price Index | 0.96% | 2.21% | 1.52% |
3
Outside the United States, stocks returned about 20%. The developed markets of Europe and the Pacific region delivered robust gains; emerging-market stocks failed to keep pace.
Bond returns sagged as investors kept a close eye on the Fed
With investors fretting over the Fed’s next move in its stimulative bond-buying program, bonds recorded negative results for the 12 months. The broad U.S. taxable bond market returned –1.08%. The yield of the 10-year Treasury note closed at 2.54%, down from 2.63% at September’s close but up from 1.69% at the end of the last fiscal year. (Bond yields and prices move in opposite directions.) Municipal bonds returned –1.72%.
Outside the United States, bond markets (as measured by the Barclays Global Aggregate Index ex USD) returned –1.95%.
The Fed’s target for short-term interest rates remained at 0%–0.25%, severely limiting returns of money market funds and savings accounts.
The advisors’ decisions helped the fund outpace its index
Although small-cap stocks led the market over the 12 months with returns that approached 40%, mid-caps were also lively participants in the rally, trumping their large-cap counterparts. Mid-cap growth stocks outpaced mid-cap value
| | |
| Expense Ratios | | |
| Your Fund Compared With Its Peer Group | | |
| | | Peer Group |
| | Fund | Average |
| Selected Value Fund | 0.38% | 1.31% |
The fund expense ratio shown is from the prospectus dated February 22, 2013, and represents estimated costs for the current fiscal year. For
the fiscal year ended October 31, 2013, the fund’s expense ratio was 0.43%. The peer-group expense ratio is derived from data provided by
Lipper, a Thomson Reuters Company, and captures information through year-end 2012.
Peer group: Mid-Cap Value Funds.
4
stocks by less than 1 percentage point, and double-digit returns were evident across the mid-cap spectrum.
Investing opportunities were abundant among mid-cap companies, and the Selected Value Fund’s two advisors made a number of wise decisions in their efforts to outperform its comparative standards. In some cases, the fund’s holdings bested the benchmark’s; in others, the advisor avoided some subpar holdings that dampened the benchmark’s return.
Financial stocks, the fund’s largest sector, returned about 34% and contributed about one-quarter of the fund’s result. Selected Value’s holdings in insurance companies, consumer finance firms, commercial banks, and asset managers all returned
at least 30%; the sector was boosted by a rosier investment climate, stronger balance sheets, improved lending conditions, and more robust housing and labor markets. The fund’s outperformance, though, was largely because the advisors almost entirely sidestepped real estate investment trusts (REITs), which stalled after a few years of solid growth.
Selected Value’s industrial and consumer discretionary sectors returned about 50% each. This reflected the economy’s slow but steady improvement, and the resulting ability and eagerness of consumers and corporations to spend more freely. Machinery firms, airlines, and electrical equipment companies were among the fund’s standouts in industrials. Clothing company Hanesbrands, which returned
| |
| Total Returns | |
| Ten Years Ended October 31, 2013 | |
| | Average |
| | Annual Return |
| Selected Value Fund | 11.00% |
| Russell Midcap Value Index | 10.62 |
| Mid-Cap Value Funds Average | 9.20 |
| Mid-Cap Value Funds Average: Derived from data provided by Lipper, a Thomson Reuters Company. |
The figures shown represent past performance, which is not a guarantee of future results. (Current performance may be
lower or higher than the performance data cited. For performance data current to the most recent month-end, visit our
website at vanguard.com/performance.) Note, too, that both investment returns and principal value can fluctuate widely, so
an investor’s shares, when sold, could be worth more or less than their original cost.
5
more than 100%, led the fund’s consumer discretionary sector, in which hotels and casinos, auto-parts companies, and housewares firms also performed well.
Perhaps most strikingly, the fund returned more than 80% in technology, compared with 50% for the benchmark. The advisors stayed with Micron Technology through earlier difficulties for the semiconductor equipment firm, and their commitment was rewarded this period with a return of more than 225%. Electronic equipment, software, and IT service companies also drove the fund’s success in the sector.
In health care, the advisors’ concentrated stock choices among providers, managed care firms, and distributors proved fruitful.
Selected Value’s biggest stumbling block was in materials. With gold and silver miners struggling as precious metals prices slid, the fund’s metals and mining holdings returned –50%. That decline outweighed a 48% advance for its specialty chemicals stocks. In energy, the advisors’ holdings underperformed those of the benchmark.
You can find more information on the fund’s positioning and performance during the fiscal year in the Advisors’ Report that follows this letter.
Ten-year results show the fund’s solid advisory arrangement
The Selected Value Fund’s two advisors––Barrow, Hanley, Mewhinney & Strauss, LLC, and Donald Smith & Co., Inc.––both take a value approach to investing, albeit from different perspectives. Barrow, Hanley seeks out-of-favor stocks of solid companies that regularly pay dividends; Donald Smith considers the stocks of troubled companies that may not have much further to fall, but have the potential to stage major rebounds.
Barrow, Hanley has advised the fund since its 1996 inception and Donald Smith since 2005. As measured by the results of the last decade, the arrangement has been a solid one. For the ten years ended October 31, 2013, the Selected Value Fund posted an average annual return of 11.00%. Its benchmark (which bears no expenses) returned 10.62%, and the peer group’s average annual return was 9.20%.
6
Selected Value is served by the advisors’ experience, skill, and knowledge along with low costs, which allow you to keep more of the fund’s return.
Combining diversity of thought with low costs brings benefits
Investors sometimes ask why Vanguard uses a multi-advisor approach for many of its actively managed equity funds. Just as we recommend diversification within and across asset classes for an investor’s overall portfolio, we think significant benefits can accrue from using multiple advisory firms for a single fund: diversity of investment process and style, thought, and holdings.
These elements can lead to less risk and better results. Because not all investment managers invest the same way, their returns relative to the benchmark don’t move in lockstep.
As with many investment topics, however, there are some misconceptions about the benefits of a multi-manager approach. For example, it is often suggested that the
best ideas of the advisors are diluted when combined in one portfolio. Recent Vanguard research has found otherwise.
Conventional wisdom also suggests that multi-manager funds tend to be expensive. At Vanguard, this is not the case: Low costs are a hallmark of all our offerings. And Vanguard research indicates that low costs can contribute greatly to investing success, helping investors keep more of a portfolio’s return. (You can read more in Analyzing Multi-Manager Funds: Does Management Structure Affect Performance?, available at vanguard.com/research.)
As always, thank you for investing with Vanguard.
Sincerely,

F. William McNabb III
Chairman and Chief Executive Officer
November 15, 2013
7
Advisors’ Report
For the fiscal year ended October 31, 2013, Vanguard Selected Value Fund returned 36.43%. Your fund is managed by two independent advisors. This provides exposure to distinct yet complementary investment approaches, enhancing the fund’s diversification. It is not uncommon for different advisors to have different views about individual securities or the broader investment environment.
The advisors, the percentage and amount of fund assets each manages, and a brief description of their investment strategies are presented in the table below. The advisors have also prepared a discussion of the investment environment that existed during the fiscal period and of how portfolio positioning reflects this assessment. These comments were prepared on November 21, 2013.
Barrow, Hanley, Mewhinney &
Strauss, LLC
Portfolio Managers:
James P. Barrow,
Executive Director
Mark Giambrone,
Managing Director
Over the last 12 months, we have seen a substantial rise in the stock market, helped by an improving U.S. housing market, modest U.S. growth, a stabilizing Europe and China, and continued low interest
| | | |
| Vanguard Selected Value Fund Investment Advisors | |
| |
| | Fund Assets Managed | |
| Investment Advisor | % | $ Million | Investment Strategy |
| Barrow, Hanley, Mewhinney & | 71 | 4,988 | Conducts fundamental research on individual stocks |
| Strauss, LLC | | | exhibiting traditional value characteristics: |
| | | | price/earnings and price/book ratios below the market |
| | | | average and dividend yields above the market average. |
| Donald Smith & Co., Inc. | 24 | 1,664 | Conducts fundamental research on the lowest |
| | | | price-to-tangible-book-value companies. Research |
| | | | focuses on underlying quality of book value and assets, |
| | | | and on long-term earnings potential. |
| Cash Investments | 5 | 367 | These short-term reserves are invested by Vanguard in |
| | | | equity index products to simulate investment in stocks. |
| | | | Each advisor may also maintain a modest cash |
| | | | position. |
8
rates. During such a rally, the smallest, most distressed, or least profitable companies tend to lead. Our portfolio typically will lag initially, then catch up as the market once again focuses on solid fundamentals, good valuations, cash flows, and healthy, growing dividend yields.
This scenario played out as the fiscal year progressed, and the portfolio produced strong absolute and relative returns.
We believe it is well-positioned for a modest and consistent improvement in the economy and the eventual rise in interest rates.
Accordingly, we are overweighted in consumer discretionary, health care, and industrial stocks and have the largest allocation to financials. These weightings and our stock selection in these sectors added significantly to our outperformance. We are underweighted in information technology, utilities, and materials. In financials, we are underweighted in real estate investment trusts (REITs). We believe that traditionally high-yielding stocks such as utilities and REITs have had substantial runs because of continued low interest rates and have little room for increased valuation or much additional yield. We see considerable risk to these valuations should rates rise.
We believe our portfolio contains significantly undervalued companies that should perform well over time or be acquired by buyers who recognize their value. In September, Molex, a maker of electronic connectors, was acquired for a substantial premium that added to our performance.
This continues a consistent pattern of mergers and acquisitions in this fund and highlights one of the benefits of investing in mid-capitalization stocks. We expect this type of activity to continue, given that corporate balance sheets are healthy, most companies are generating considerable free cash flow, cash holdings are offering low returns, and mergers and acquisitions can be a controlled way to expand a business and add to the bottom line.
Donald Smith & Co., Inc.
Portfolio Managers:
Donald G. Smith,
Chief Investment Officer
Richard L. Greenberg, CFA,
Senior Vice President
The portfolio at the end of October met our goal by consisting of a concentrated group of stocks with low price-to-tangible book value and attractive long-term earnings potential. The portfolio currently sells at 104% of tangible book value and 9.2 times our estimate of normalized earnings. The Standard & Poor’s 500 Index, by contrast, sells at more than 500% of tangible book value and 18.5 times normalized earnings.
Our largest holding, Micron Technology, rose 226%. Its acquisition of competitor Elpida Memory closed in July. Micron paid a large discount to both book value and replacement cost, and the deal could double its normalized earnings per share. Another large technology holding, Ingram Micro, also did well (+52.4%).
9
Our two domestic airline holdings, Southwest Airlines and JetBlue Airways, appreciated substantially as industry consolidation improved pricing and reduced supply. Our insurance holdings––Unum, Everest Re, American National, CNA Financial, and XL Group––were all selling at discounts to tangible book value when we bought them. Higher insurance rates and stock buybacks at favorable prices have helped lift stock prices closer to book value.
By far the largest detriments to performance were precious metals stocks; their price declines reflected the fall in gold and silver. Our primary precious metals holding, Yamana Gold, dropped about 50%. In utilities, Exelon (–15.9%) sagged amid oversupply and weak pricing for electricity. We sold our holdings in NV Energy, and GenOn Energy was acquired by NRG Energy.
Three companies were added. We invested in AerCap Holdings, an aircraft leasing company, at 83% of tangible book value and seven times earnings. Third-party appraisals of AerCap’s aircraft indicate that its book value is understated by $5 to $10 per share. A shareholder-friendly management has purchased almost one-quarter of outstanding shares over the past two years. The second addition, Coeur d’Alene Mines, is a top miner of silver and gold, with a geographically diverse range of mines in generally mining-friendly countries such as the United States and Mexico. Its strong balance sheet and positive cash
flow, even at today’s lower precious metals prices, will enable Coeur d’Alene to weather the difficult environment and prosper in the next upturn. We bought the stock at about 70% of tangible book value. The third addition, Celestica, is an electronics manufacturing services company. About one-third of its market cap is in cash, which the company has been using to grow its business and buy back stock. We bought Celestica stock at about book value.
Technology (at 17.6%) and insurance (at 17.1%) are our two largest industry weightings. Airlines and aircraft leasing account for 16.0% of the portfolio. We have been adding shares in undervalued companies that depend on two depressed commodities, natural gas (WPX Energy) and gold (Yamana, Coeur d’Alene Mines). Finding attractive companies to buy has been difficult after such a strong stock market run. We are hopeful that a market correction will offer new opportunities.
10
Selected Value Fund
Fund Profile
As of October 31, 2013
| | | |
| Portfolio Characteristics | | |
| | | Russell | DJ U.S. |
| | | Midcap | Total |
| | | Value | Market |
| | Fund | Index | FA Index |
| Number of Stocks | 66 | 526 | 3,612 |
| Median Market Cap | $9.2B | $9.0B | $41.6B |
| Price/Earnings Ratio | 18.7x | 21.3x | 19.8x |
| Price/Book Ratio | 1.7x | 1.7x | 2.5x |
| Return on Equity | 11.1% | 8.8% | 16.5% |
| Earnings Growth Rate | 6.6% | 5.8% | 10.6% |
| Dividend Yield | 2.0% | 2.1% | 1.9% |
| Foreign Holdings | 5.2% | 0.0% | 0.0% |
| Turnover Rate | 27% | — | — |
| Ticker Symbol | VASVX | — | — |
| Expense Ratio1 | 0.38% | — | — |
| 30-Day SEC Yield | 1.44% | — | — |
| Short-Term Reserves | 6.5% | — | — |
| | | |
| Sector Diversification (% of equity exposure) |
| | | | DJ U.S. |
| | | Russell | Total |
| | | Midcap | Market |
| | | Value | FA |
| | Fund | Index | Index |
| Consumer Discretionary | 15.6% | 9.0% | 13.3% |
| Consumer Staples | 3.8 | 2.9 | 8.8 |
| Energy | 8.7 | 7.4 | 9.7 |
| Financials | 26.5 | 32.6 | 17.3 |
| Health Care | 10.3 | 8.3 | 12.5 |
| Industrials | 16.3 | 11.2 | 11.5 |
| Information Technology | 10.2 | 10.3 | 17.7 |
| Materials | 4.2 | 5.3 | 3.8 |
| Telecommunication | | | |
| Services | 0.1 | 0.7 | 2.2 |
| Utilities | 4.3 | 12.3 | 3.2 |
| | |
| Volatility Measures | | |
| | Russell | |
| | Midcap | DJ U.S. |
| | Value | Total Market |
| | Index | FA Index |
| R-Squared | 0.96 | 0.95 |
| Beta | 0.91 | 0.99 |
| These measures show the degree and timing of the fund’s fluctuations compared with the indexes over 36 months. |
| | |
| Ten Largest Holdings (% of total net assets) |
| Royal Caribbean Cruises | Hotels, Resorts & | |
| Ltd. | Cruise Lines | 2.7% |
| Micron Technology Inc. | Semiconductors | 2.5 |
| Omnicare Inc. | Health Care Services | 2.4 |
| Cardinal Health Inc. | Health Care | |
| | Distributors | 2.4 |
| Hanesbrands Inc. | Apparel, Accessories | |
| | & Luxury Goods | 2.2 |
| XL Group plc | Property & Casualty | |
| | Insurance | 2.2 |
| CA Inc. | Systems Software | 2.2 |
| Delphi Automotive plc | Auto Parts & | |
| | Equipment | 2.2 |
| Total System Services | Data Processing & | |
| Inc. | Outsourced Services | 2.1 |
| Eaton Corp. plc | Electrical | |
| | Components & | |
| | Equipment | 2.0 |
| Top Ten | | 22.9% |
| The holdings listed exclude any temporary cash investments and equity index products. |
Investment Focus

1 The expense ratio shown is from the prospectus dated February 22, 2013, and represents estimated costs for the current fiscal year. For the
fiscal year ended October 31, 2013, the expense ratio was 0.43%.
11
Selected Value Fund
Performance Summary
All of the returns in this report represent past performance, which is not a guarantee of future results that may be achieved by the fund. (Current performance may be lower or higher than the performance data cited. For performance data current to the most recent month-end, visit our website at vanguard.com/performance.) Note, too, that both investment returns and principal value can fluctuate widely, so an investor’s shares, when sold, could be worth more or less than their original cost. The returns shown do not reflect taxes that a shareholder would pay on fund distributions or on the sale of fund shares.
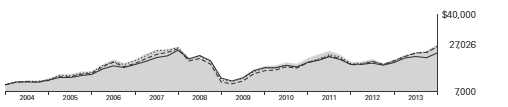
Cumulative Performance: October 31, 2003, Through October 31, 2013
Initial Investment of $10,000
| | | | | |
| | | Average Annual Total Returns | |
| | | Periods Ended October 31, 2013 | |
| | | | | | Final Value |
| | | One | Five | Ten | of a $10,000 |
| | | Year | Years | Years | Investment |
| | Selected Value Fund* | 36.43% | 20.08% | 11.00% | $28,399 |
| •••••••• | Russell Midcap Value Index | 33.45 | 18.85 | 10.62 | 27,445 |
| – – – – | Mid-Cap Value Funds Average | 34.41 | 17.95 | 9.20 | 24,110 |
| | Dow Jones U.S. Total Stock Market | | | | |
| | Float Adjusted Index | 28.86 | 16.01 | 8.13 | 21,850 |
| Mid-Cap Value Funds Average: Derived from data provided by Lipper, a Thomson Reuters Company. |
See Financial Highlights for dividend and capital gains information.
12
Selected Value Fund
Fiscal-Year Total Returns (%): October 31, 2003, Through October 31, 2013

Average Annual Total Returns: Periods Ended September 30, 2013
This table presents returns through the latest calendar quarter—rather than through the end of the fiscal period.
Securities and Exchange Commission rules require that we provide this information.
| | | | |
| | Inception | One | Five | Ten |
| | Date | Year | Years | Years |
| Selected Value Fund | 2/15/1996 | 32.54% | 14.48% | 11.14% |
13
Selected Value Fund
Financial Statements
Statement of Net Assets
As of October 31, 2013
The fund reports a complete list of its holdings in regulatory filings four times in each fiscal year, at the quarter-ends. For the second and fourth fiscal quarters, the lists appear in the fund’s semiannual and annual reports to shareholders. For the first and third fiscal quarters, the fund files the lists with the Securities and Exchange Commission on Form N-Q. Shareholders can look up the fund’s Forms N-Q on the SEC’s website at sec.gov. Forms N-Q may also be reviewed and copied at the SEC’s Public Reference Room (see the back cover of this report for further information).
| | | |
| | | | Market |
| | | | Value |
| | | Shares | ($000) |
| Common Stocks (88.0%)1 | | |
| Consumer Discretionary (13.9%) | |
| | Royal Caribbean | | |
| | Cruises Ltd. | 4,444,825 | 186,861 |
| | Hanesbrands Inc. | 2,301,400 | 156,771 |
| | Delphi Automotive plc | 2,672,900 | 152,890 |
| | L Brands Inc. | 2,086,300 | 130,623 |
| | International Game | | |
| | Technology | 6,789,300 | 127,639 |
| | Newell Rubbermaid Inc. | 2,748,800 | 81,447 |
| * | Murphy USA Inc. | 1,827,325 | 74,153 |
| | Dillard’s Inc. Class A | 384,196 | 31,496 |
| | Rent-A-Center Inc. | 889,470 | 30,456 |
| | CST Brands Inc. | 22,277 | 718 |
| | | | 973,054 |
| Consumer Staples (3.0%) | | |
| | Lorillard Inc. | 2,238,300 | 114,176 |
| | Reynolds American Inc. | 1,940,200 | 99,668 |
| | | | 213,844 |
| Energy (7.5%) | | |
| | Murphy Oil Corp. | 2,166,200 | 130,665 |
| * | WPX Energy Inc. | 5,559,186 | 123,080 |
| | Helmerich & Payne Inc. | 1,262,200 | 97,884 |
| | Seadrill Ltd. | 1,976,800 | 92,158 |
| ^ | Golar LNG Ltd. | 1,557,947 | 57,847 |
| | Nabors Industries Ltd. | 835,000 | 14,596 |
| | Valero Energy Corp. | 237,000 | 9,757 |
| *,^ | Overseas Shipholding | | |
| | Group Inc. | 472,900 | 1,632 |
| | | | 527,619 |
| Financials (23.9%) | | |
| | XL Group plc Class A | 5,110,381 | 156,224 |
| | New York Community | | |
| | Bancorp Inc. | 8,694,600 | 140,939 |
| | Fifth Third Bancorp | 7,347,900 | 139,831 |
| | | |
| | Discover Financial | | |
| | Services | 2,669,400 | 138,489 |
| | Capital One Financial | | |
| | Corp. | 1,835,900 | 126,071 |
| | Willis Group Holdings plc | 2,730,200 | 123,050 |
| | Ameriprise Financial Inc. | 1,209,500 | 121,603 |
| * | CIT Group Inc. | 2,484,600 | 119,658 |
| | SLM Corp. | 4,618,000 | 117,159 |
| | People’s United | | |
| | Financial Inc. | 6,912,100 | 99,742 |
| | CNA Financial Corp. | 2,336,662 | 94,845 |
| | First Niagara Financial | | |
| | Group Inc. | 7,950,900 | 87,698 |
| * | Genworth Financial Inc. | | |
| | Class A | 5,475,817 | 79,564 |
| | Unum Group | 1,990,890 | 63,191 |
| | Everest Re Group Ltd. | 357,437 | 54,952 |
| | American National | | |
| | Insurance Co. | 164,858 | 16,662 |
| | | | 1,679,678 |
| Health Care (8.9%) | | |
| | Omnicare Inc. | 3,096,700 | 170,783 |
| | Cardinal Health Inc. | 2,891,200 | 169,598 |
| | St. Jude Medical Inc. | 2,489,900 | 142,895 |
| | Cigna Corp. | 1,855,100 | 142,806 |
| | | | 626,082 |
| Industrials (14.7%) | | |
| | Eaton Corp. plc | 2,032,500 | 143,413 |
| | Pentair Ltd. | 2,026,300 | 135,944 |
| | SPX Corp. | 1,337,200 | 121,297 |
| | Stanley Black & | | |
| | Decker Inc. | 1,388,500 | 109,816 |
| | KBR Inc. | 2,771,300 | 95,721 |
| | Southwest Airlines Co. | 5,343,930 | 92,023 |
| * | Air France-KLM ADR | 7,473,685 | 78,231 |
| | Joy Global Inc. | 1,357,600 | 77,044 |
| * | JetBlue Airways Corp. | 7,389,729 | 52,393 |
14
Selected Value Fund
| | | | |
| | | | | Market |
| | | | | Value |
| | | | Shares | ($000) |
| | L-3 Communications | | |
| | Holdings Inc. | | 510,400 | 51,270 |
| * | AerCap Holdings NV | 2,322,811 | 47,130 |
| | Xylem Inc. | | 689,400 | 23,784 |
| | | | | 1,028,066 |
| Information Technology (8.6%) | |
| * | Micron Technology Inc. | 10,000,000 | 176,800 |
| | CA Inc. | | 4,878,900 | 154,954 |
| | Total System | | | |
| | Services Inc. | | 5,007,778 | 149,382 |
| * | Ingram Micro Inc. | | 4,191,299 | 97,112 |
| * | Celestica Inc. | | 2,025,000 | 22,194 |
| | | | | 600,442 |
| Materials (3.7%) | | | |
| | Yamana Gold Inc. | | 12,792,246 | 127,027 |
| | Rockwood Holdings Inc. | 1,949,087 | 123,280 |
| * | Coeur Mining Inc. | | 825,000 | 10,073 |
| | | | | 260,380 |
| Utilities (3.8%) | | | |
| | CenterPoint Energy Inc. | 2,573,900 | 63,318 |
| | Xcel Energy Inc. | | 1,929,600 | 55,688 |
| | Pinnacle West | | | |
| | Capital Corp. | | 886,500 | 49,671 |
| | ONEOK Inc. | | 768,900 | 43,443 |
| | Exelon Corp. | | 1,133,003 | 32,336 |
| | NRG Energy Inc. | | 796,234 | 22,716 |
| | | | | 267,172 |
| Total Common Stocks | | | |
| (Cost $4,188,764) | | | 6,176,337 |
| Temporary Cash Investments (12.0%)1 | |
| Money Market Fund (11.8%) | | |
| 2,3 | Vanguard Market | | | |
| | Liquidity | | | |
| | Fund, 0.120% | 825,393,244 | 825,393 |
| |
| | | | Face | |
| | | | Amount | |
| | | | ($000) | |
| U.S. Government and Agency Obligations (0.2%) |
| 4,5 | Federal Home Loan Bank | | |
| | Discount Notes, | | | |
| | 0.050%, 11/22/13 | | 3,000 | 3,000 |
| 4,5 | Federal Home Loan Bank | | |
| | Discount Notes, | | | |
| | 0.050-0.055%, 11/29/13 | 3,300 | 3,300 |
| 4,5 | Federal Home Loan Bank | | |
| | Discount Notes, | | | |
| | 0.190%, 1/15/14 | | 1,100 | 1,100 |
| | | |
| 4,5 | Federal Home Loan Bank | | |
| | Discount Notes, | | |
| | 0.080%, 2/28/14 | 1,000 | 999 |
| 4,6 | Freddie Mac Discount Notes, | | |
| | 0.095-.100%, 1/27/14 | 5,000 | 4,998 |
| 4,6 | Freddie Mac Discount Notes, | | |
| | 0.150%, 2/3/14 | 2,400 | 2,399 |
| 4,6 | Freddie Mac Discount Notes, | | |
| | 0.085%, 3/3/14 | 1,000 | 999 |
| | | | 16,795 |
| Total Temporary Cash Investments | |
| (Cost $842,190) | | 842,188 |
| Total Investments (100.0%) | | |
| (Cost $5,030,954) | | 7,018,525 |
| Other Assets and Liabilities (0.0%) | |
| Other Assets | | 50,878 |
| Liabilities3 | | (50,836) |
| | | | 42 |
| Net Assets (100%) | | |
| Applicable to 249,993,887 outstanding | |
| $.001 par value shares of beneficial | |
| interest (unlimited authorization) | | 7,018,567 |
| Net Asset Value Per Share | | $28.07 |
15
Selected Value Fund
| |
| At October 31, 2013, net assets consisted of: |
| | Amount |
| | ($000) |
| Paid-in Capital | 4,663,145 |
| Undistributed Net Investment Income | 56,037 |
| Accumulated Net Realized Gains | 302,552 |
| Unrealized Appreciation (Depreciation) | |
| Investment Securities | 1,987,571 |
| Futures Contracts | 9,262 |
| Net Assets | 7,018,567 |
See Note A in Notes to Financial Statements.
* Non-income-producing security.
^ Includes partial security positions on loan to broker-dealers. The total value of securities on loan is $18,187,000.
1 The fund invests a portion of its cash reserves in equity markets through the use of index futures contracts. After giving effect to futures
investments, the fund’s effective common stock and temporary cash investment positions represent 93.3% and 6.7%, respectively, of net
assets.
2 Affiliated money market fund available only to Vanguard funds and certain trusts and accounts managed by Vanguard. Rate shown is the
7-day yield.
3 Includes $18,568,000 of collateral received for securities on loan.
4 Securities with a value of $16,795,000 have been segregated as initial margin for open futures contracts.
5 The issuer operates under a congressional charter; its securities are generally neither guaranteed by the U.S. Treasury nor backed by the full
faith and credit of the U.S. government.
6 The issuer was placed under federal conservatorship in September 2008; since that time, its daily operations have been managed by the
Federal Housing Finance Agency and it receives capital from the U.S. Treasury, as needed to maintain a positive net worth, in exchange for
senior preferred stock.
ADR—American Depositary Receipt.
See accompanying Notes, which are an integral part of the Financial Statements.
16
Selected Value Fund
Statement of Operations
| |
| | Year Ended |
| | October 31, 2013 |
| | ($000) |
| Investment Income | |
| Income | |
| Dividends1 | 113,089 |
| Interest2 | 831 |
| Securities Lending | 441 |
| Total Income | 114,361 |
| Expenses | |
| Investment Advisory Fees—Note B | |
| Basic Fee | 11,582 |
| Performance Adjustment | 1,193 |
| The Vanguard Group—Note C | |
| Management and Administrative | 9,157 |
| Marketing and Distribution | 916 |
| Custodian Fees | 52 |
| Auditing Fees | 29 |
| Shareholders’ Reports | 47 |
| Trustees’ Fees and Expenses | 13 |
| Total Expenses | 22,989 |
| Expenses Paid Indirectly | (278) |
| Net Expenses | 22,711 |
| Net Investment Income | 91,650 |
| Realized Net Gain (Loss) | |
| Investment Securities Sold | 340,885 |
| Futures Contracts | 43,592 |
| Realized Net Gain (Loss) | 384,477 |
| Change in Unrealized Appreciation (Depreciation) | |
| Investment Securities | 1,194,522 |
| Futures Contracts | 12,426 |
| Change in Unrealized Appreciation (Depreciation) | 1,206,948 |
| Net Increase (Decrease) in Net Assets Resulting from Operations | 1,683,075 |
| 1 Dividends are net of foreign withholding taxes of $318,000. |
| 2 Interest income from an affiliated company of the fund was $817,000. |
See accompanying Notes, which are an integral part of the Financial Statements.
17
Selected Value Fund
Statement of Changes in Net Assets
| | |
| | Year Ended October 31, |
| | 2013 | 2012 |
| | ($000) | ($000) |
| Increase (Decrease) in Net Assets | | |
| Operations | | |
| Net Investment Income | 91,650 | 82,804 |
| Realized Net Gain (Loss) | 384,477 | 233,261 |
| Change in Unrealized Appreciation (Depreciation) | 1,206,948 | 208,484 |
| Net Increase (Decrease) in Net Assets Resulting from Operations | 1,683,075 | 524,549 |
| Distributions | | |
| Net Investment Income | (90,598) | (67,422) |
| Realized Capital Gain | — | — |
| Total Distributions | (90,598) | (67,422) |
| Capital Share Transactions | | |
| Issued | 1,708,267 | 541,729 |
| Issued in Lieu of Cash Distributions | 81,500 | 60,262 |
| Redeemed1 | (700,802) | (678,320) |
| Net Increase (Decrease) from Capital Share Transactions | 1,088,965 | (76,329) |
| Total Increase (Decrease) | 2,681,442 | 380,798 |
| Net Assets | | |
| Beginning of Period | 4,337,125 | 3,956,327 |
| End of Period2 | 7,018,567 | 4,337,125 |
| 1 Net of redemption fees for fiscal 2012 of $177,000. Effective May 23, 2012, the redemption fee was eliminated. |
| 2 Net Assets—End of Period includes undistributed net investment income of $56,037,000 and $58,409,000. |
See accompanying Notes, which are an integral part of the Financial Statements.
18
Selected Value Fund
Financial Highlights
| | | | | |
| For a Share Outstanding | Year Ended October 31, |
| Throughout Each Period | 2013 | 2012 | 2011 | 2010 | 2009 |
| Net Asset Value, Beginning of Period | $21.01 | $18.81 | $17.73 | $14.78 | $12.48 |
| Investment Operations | | | | | |
| Net Investment Income | .395 | .405 | .334 | .250 | .254 |
| Net Realized and Unrealized Gain (Loss) | | | | | |
| on Investments | 7.105 | 2.122 | 1.037 | 2.941 | 2.463 |
| Total from Investment Operations | 7.500 | 2.527 | 1.371 | 3.191 | 2.717 |
| Distributions | | | | | |
| Dividends from Net Investment Income | (.440) | (.327) | (.291) | (.241) | (.417) |
| Distributions from Realized Capital Gains | — | — | — | — | — |
| Total Distributions | (.440) | (.327) | (.291) | (.241) | (.417) |
| Net Asset Value, End of Period | $28.07 | $21.01 | $18.81 | $17.73 | $14.78 |
| |
| Total Return1 | 36.43% | 13.64% | 7.74% | 21.75% | 22.77% |
| |
| Ratios/Supplemental Data | | | | | |
| Net Assets, End of Period (Millions) | $7,019 | $4,337 | $3,956 | $3,639 | $2,851 |
| Ratio of Total Expenses to | | | | | |
| Average Net Assets2 | 0.43% | 0.38% | 0.45% | 0.47% | 0.52% |
| Ratio of Net Investment Income to | | | | | |
| Average Net Assets | 1.70% | 2.00% | 1.74% | 1.52% | 1.93% |
| Portfolio Turnover Rate | 27% | 18% | 25% | 22% | 30% |
1 Total returns do not include transaction or account service fees that may have applied in the periods shown. Fund prospectuses provide
information about any applicable transaction and account service fees.
2 Includes performance-based investment advisory fee increases (decreases) of 0.02%, (0.03%), 0.04%, 0.05%, and 0.05%.
See accompanying Notes, which are an integral part of the Financial Statements.
19
Selected Value Fund
Notes to Financial Statements
Vanguard Selected Value Fund is registered under the Investment Company Act of 1940 as an open-end investment company, or mutual fund.
A. The following significant accounting policies conform to generally accepted accounting principles for U.S. mutual funds. The fund consistently follows such policies in preparing its financial statements.
1. Security Valuation: Securities are valued as of the close of trading on the New York Stock Exchange (generally 4 p.m., Eastern time) on the valuation date. Equity securities are valued at the latest quoted sales prices or official closing prices taken from the primary market in which each security trades; such securities not traded on the valuation date are valued at the mean of the latest quoted bid and asked prices. Securities for which market quotations are not readily available, or whose values have been affected by events occurring before the fund’s pricing time but after the close of the securities’ primary markets, are valued at their fair values calculated according to procedures adopted by the board of trustees. These procedures include obtaining quotations from an independent pricing service, monitoring news to identify significant market- or security-specific events, and evaluating changes in the values of foreign market proxies (for example, ADRs, futures contracts, or exchange-traded funds), between the time the foreign markets close and the fund’s pricing time. When fair-value pricing is employed, the prices of securities used by a fund to calculate its net asset value may differ from quoted or published prices for the same securities. Investments in Vanguard Market Liquidity Fund are valued at that fund’s net asset value. Temporary cash investments acquired over 60 days to maturity are valued using the latest bid prices or using valuations based on a matrix system (which considers such factors as security prices, yields, maturities, and ratings), both as furnished by independent pricing services. Other temporary cash investments are valued at amortized cost, which approximates market value.
2. Futures Contracts: The fund may use index futures contracts to a limited extent, with the objective of maintaining full exposure to the stock market while maintaining liquidity. The fund may purchase or sell futures contracts to achieve a desired level of investment, whether to accommodate portfolio turnover or cash flows from capital share transactions. The primary risks associated with the use of futures contracts are imperfect correlation between changes in market values of stocks held by the fund and the prices of futures contracts, and the possibility of an illiquid market. Counterparty risk involving futures is mitigated because a regulated clearinghouse is the counterparty instead of the clearing broker. To further mitigate counterparty risk, the fund trades futures contracts on an exchange, monitors the financial strength of its clearing brokers and clearinghouse, and has entered into clearing agreements with its clearing brokers. The clearinghouse imposes initial margin requirements to secure the fund’s performance and requires daily settlement of variation margin representing changes in the market value of each contract.
Futures contracts are valued at their quoted daily settlement prices. The aggregate notional amounts of the contracts are not recorded in the Statement of Net Assets. Fluctuations in the value of the contracts are recorded in the Statement of Net Assets as an asset (liability) and in the Statement of Operations as unrealized appreciation (depreciation) until the contracts are closed, when they are recorded as realized futures gains (losses).
During the year ended October 31, 2013, the fund’s average investments in long and short futures contracts represented 4% and 0% of net assets, respectively, based on quarterly average aggregate settlement values.
20
Selected Value Fund
3. Federal Income Taxes: The fund intends to continue to qualify as a regulated investment company and distribute all of its taxable income. Management has analyzed the fund’s tax positions taken for all open federal income tax years (October 31, 2010–2013), and has concluded that no provision for federal income tax is required in the fund’s financial statements.
4. Distributions: Distributions to shareholders are recorded on the ex-dividend date.
5. Securities Lending: To earn additional income, the fund may lend its securities to qualified institutional borrowers. Security loans are required to be secured at all times by collateral in an amount at least equal to the market value of securities loaned. Daily market fluctuations could cause the value of loaned securities to be more or less than the value of the collateral received. When this occurs, the collateral is adjusted and settled on the next business day. The fund further mitigates its counterparty risk by entering into securities lending transactions only with a diverse group of prequalified counterparties, monitoring their financial strength, and entering into master securities lending agreements with its counterparties. The master securities lending agreements provide that, in the event of a counterparty’s default (including bankruptcy), the fund may terminate any loans with that borrower, determine the net amount owed, and sell or retain the collateral up to the net amount owed to the fund; however, such actions may be subject to legal proceedings. While collateral mitigates counterparty risk, in the absence of a default the fund may experience delays and costs in recovering the securities loaned. The fund invests cash collateral received in Vanguard Market Liquidity Fund, and records a liability for the return of the collateral, during the period the securities are on loan. Securities lending income represents fees charged to borrowers plus income earned on invested cash collateral, less expenses associated with the loan.
6. Other: Dividend income is recorded on the ex-dividend date. Interest income includes income distributions received from Vanguard Market Liquidity Fund and is accrued daily. Premiums and discounts on debt securities purchased are amortized and accreted, respectively, to interest income over the lives of the respective securities. Security transactions are accounted for on the date securities are bought or sold. Costs used to determine realized gains (losses) on the sale of investment securities are those of the specific securities sold.
B. Barrow, Hanley, Mewhinney & Strauss, LLC, and Donald Smith & Co., Inc., each provide investment advisory services to a portion of the fund for a fee calculated at an annual percentage rate of average net assets managed by the advisor. The basic fee of Barrow, Hanley, Mewhinney & Strauss, LLC, is subject to quarterly adjustments based on performance for the preceding three years relative to the Russell Midcap Value Index. The basic fee of Donald Smith & Co., Inc., is subject to quarterly adjustments based on performance for the preceding five years relative to the MSCI Investable Market 2500 Index.
The Vanguard Group manages the cash reserves of the fund on an at-cost basis.
For the year ended October 31, 2013, the aggregate investment advisory fee represented an effective annual basic rate of 0.22% of the fund’s average net assets, before an increase of $1,193,000 (0.02%) based on performance.
C. The Vanguard Group furnishes at cost corporate management, administrative, marketing, and distribution services. The costs of such services are allocated to the fund under methods approved by the board of trustees. The fund has committed to provide up to 0.40% of its net assets in capital
21
Selected Value Fund
contributions to Vanguard. At October 31, 2013, the fund had contributed capital of $776,000 to Vanguard (included in Other Assets), representing 0.01% of the fund’s net assets and 0.31% of Vanguard’s capitalization. The fund’s trustees and officers are also directors and officers of Vanguard.
D. The fund has asked its investment advisors to direct certain security trades, subject to obtaining the best price and execution, to brokers who have agreed to rebate to the fund part of the commissions generated. Such rebates are used solely to reduce the fund’s management and administrative expenses. For the year ended October 31, 2013, these arrangements reduced the fund’s expenses by $278,000 (an annual rate of 0.00% of average net assets).
E. Various inputs may be used to determine the value of the fund’s investments. These inputs are summarized in three broad levels for financial statement purposes. The inputs or methodologies used to value securities are not necessarily an indication of the risk associated with investing in those securities.
Level 1—Quoted prices in active markets for identical securities.
Level 2—Other significant observable inputs (including quoted prices for similar securities, interest rates, prepayment speeds, credit risk, etc.).
Level 3—Significant unobservable inputs (including the fund’s own assumptions used to determine the fair value of investments).
The following table summarizes the market value of the fund’s investments as of October 31, 2013, based on the inputs used to value them:
| | | |
| | Level 1 | Level 2 | Level 3 |
| Investments | ($000) | ($000) | ($000) |
| Common Stocks | 6,176,337 | — | — |
| Temporary Cash Investments | 825,393 | 16,795 | — |
| Futures Contracts—Liabilities1 | (1,967) | — | — |
| Total | 6,999,763 | 16,795 | — |
| 1 Represents variation margin on the last day of the reporting period. |
F. At October 31, 2013, the aggregate settlement value of open futures contracts and the related unrealized appreciation (depreciation) were:
| | | | |
| | | | ($000) |
| | | | Aggregate | |
| | | Number of | Settlement | Unrealized |
| | | Long (Short) | Value | Appreciation |
| Futures Contracts | Expiration | Contracts | Long (Short) | (Depreciation) |
| E-mini S&P 500 Index | December 2013 | 2,210 | 193,486 | 3,055 |
| S&P 500 Index | December 2013 | 400 | 175,100 | 6,207 |
Unrealized appreciation (depreciation) on open futures contracts is required to be treated as realized gain (loss) for tax purposes.
22
Selected Value Fund
G. Distributions are determined on a tax basis and may differ from net investment income and realized capital gains for financial reporting purposes. Differences may be permanent or temporary. Permanent differences are reclassified among capital accounts in the financial statements to reflect their tax character. Temporary differences arise when certain items of income, expense, gain, or loss are recognized in different periods for financial statement and tax purposes; these differences will reverse at some time in the future. Differences in classification may also result from the treatment of short-term gains as ordinary income for tax purposes.
The fund used a tax accounting practice to treat a portion of the price of capital shares redeemed during the year as distributions from net investment income and realized capital gains. Accordingly, the fund has reclassified $3,424,000 from undistributed net investment income, and $12,304,000 from accumulated net realized gains, to paid-in capital.
The fund used capital loss carryforwards of $72,182,000 to offset taxable capital gains realized during the year ended October 31, 2013, reducing the amount of capital gains that would otherwise be available to distribute to shareholders. For tax purposes, at October 31, 2013, the fund had $63,507,000 of ordinary income and $318,326,000 of long-term capital gains available for distribution.
At October 31, 2013, the cost of investment securities for tax purposes was $5,036,862,000. Net unrealized appreciation of investment securities for tax purposes was $1,981,663,000, consisting of unrealized gains of $2,061,255,000 on securities that had risen in value since their purchase and $79,592,000 in unrealized losses on securities that had fallen in value since their purchase.
H. During the year ended October 31, 2013, the fund purchased $2,000,687,000 of investment securities and sold $1,297,874,000 of investment securities, other than temporary cash investments.
I. Capital shares issued and redeemed were:
| | |
| | Year Ended October 31, |
| | 2013 | 2012 |
| | Shares | Shares |
| | (000) | (000) |
| Issued | 68,780 | 27,462 |
| Issued in Lieu of Cash Distributions | 3,922 | 3,211 |
| Redeemed | (29,178) | (34,501) |
| Net Increase (Decrease) in Shares Outstanding | 43,524 | (3,828) |
J. Management has determined that no material events or transactions occurred subsequent to October 31, 2013, that would require recognition or disclosure in these financial statements.
23
Report of Independent Registered
Public Accounting Firm
To the Trustees of Vanguard Whitehall Funds and the Shareholders of Vanguard Selected Value Fund: In our opinion, the accompanying statement of net assets and the related statements of operations and of changes in net assets and the financial highlights present fairly, in all material respects, the financial position of Vanguard Selected Value Fund (constituting a separate portfolio of Vanguard Whitehall Funds, hereafter referred to as the “Fund”) at October 31, 2013, the results of its operations for the year then ended, the changes in its net assets for each of the two years in the period then ended, and the financial highlights for each of the five years in the period then ended, in conformity with accounting principles generally accepted in the United States of America. These financial statements and financial highlights (hereafter referred to as “financial statements”) are the responsibility of the Fund’s management; our responsibility is to express an opinion on these financial statements based on our audits. We conducted our audits of these financial statements in accordance with the standards of the Public Company Accounting Oversight Board (United States). Those standards require that we plan and perform the audit to obtain reasonable assurance about whether the financial statements are free of material misstatement. An audit includes examining, on a test basis, evidence supporting the amounts and disclosures in the financial statements, assessing the accounting principles used and significant estimates made by management, and evaluating the overall financial statement presentation. We believe that our audits, which included confirmation of securities at October 31, 2013 by correspondence with the custodian and broker and by agreement to the underlying ownership records of the transfer agent, provide a reasonable basis for our opinion.
/s/PricewaterhouseCoopers LLP
Philadelphia, Pennsylvania
December 16, 2013
Special 2013 tax information (unaudited) for Vanguard Selected Value Fund
This information for the fiscal year ended October 31, 2013, is included pursuant to provisions of the
Internal Revenue Code.
The fund distributed $12,304,000 as capital gain dividends (from net long-term capital gains) to
shareholders during the fiscal year.
The fund distributed $90,598,000 of qualified dividend income to shareholders during the fiscal year.
For corporate shareholders, 93.3% of investment income (dividend income plus short-term gains,
if any) qualifies for the dividends-received deduction.
24
Your Fund’s After-Tax Returns
This table presents returns for your fund both before and after taxes. The after-tax returns are shown in two ways: (1) assuming that an investor owned the fund during the entire period and paid taxes on the fund’s distributions, and (2) assuming that an investor paid taxes on the fund’s distributions and sold all shares at the end of each period.
Calculations are based on the highest individual federal income tax and capital gains tax rates in effect at the times of the distributions and the hypothetical sales. State and local taxes were not considered. After-tax returns reflect any qualified dividend income, using actual prior-year figures and estimates for 2013. (In the example, returns after the sale of fund shares may be higher than those assuming no sale. This occurs when the sale would have produced a capital loss. The calculation assumes that the investor received a tax deduction for the loss.)
Please note that your actual after-tax returns will depend on your tax situation and may differ from those shown. Also note that if you own the fund in a tax-deferred account, such as an individual retirement account or a 401(k) plan, this information does not apply to you. Such accounts are not subject to current taxes.
Finally, keep in mind that a fund’s performance—whether before or after taxes—does not guarantee future results.
| | | |
| Average Annual Total Returns: Selected Value Fund | | | |
| Periods Ended October 31, 2013 | | | |
| | One | Five | Ten |
| | Year | Years | Years |
| Returns Before Taxes | 36.43% | 20.08% | 11.00% |
| Returns After Taxes on Distributions | 36.01 | 19.68 | 10.35 |
| Returns After Taxes on Distributions and Sale of Fund Shares | 21.15 | 16.39 | 9.06 |
25
About Your Fund’s Expenses
As a shareholder of the fund, you incur ongoing costs, which include costs for portfolio management, administrative services, and shareholder reports (like this one), among others. Operating expenses, which are deducted from a fund’s gross income, directly reduce the investment return of the fund.
A fund’s expenses are expressed as a percentage of its average net assets. This figure is known as the expense ratio. The following examples are intended to help you understand the ongoing costs (in dollars) of investing in your fund and to compare these costs with those of other mutual funds. The examples are based on an investment of $1,000 made at the beginning of the period shown and held for the entire period.
The accompanying table illustrates your fund’s costs in two ways:
• Based on actual fund return. This section helps you to estimate the actual expenses that you paid over the period. The ”Ending Account Value“ shown is derived from the fund‘s actual return, and the third column shows the dollar amount that would have been paid by an investor who started with $1,000 in the fund. You may use the information here, together with the amount you invested, to estimate the expenses that you paid over the period.
To do so, simply divide your account value by $1,000 (for example, an $8,600 account value divided by $1,000 = 8.6), then multiply the result by the number given for your fund under the heading ”Expenses Paid During Period.“
• Based on hypothetical 5% yearly return. This section is intended to help you compare your fund‘s costs with those of other mutual funds. It assumes that the fund had a yearly return of 5% before expenses, but that the expense ratio is unchanged. In this case—because the return used is not the fund’s actual return—the results do not apply to your investment. The example is useful in making comparisons because the Securities and Exchange Commission requires all mutual funds to calculate expenses based on a 5% return. You can assess your fund’s costs by comparing this hypothetical example with the hypothetical examples that appear in shareholder reports of other funds.
Note that the expenses shown in the table are meant to highlight and help you compare ongoing costs only and do not reflect transaction costs incurred by the fund for buying and selling securities. Further, the expenses do not include any purchase, redemption, or account service fees described in the fund prospectus. If such fees were applied to your account, your costs would be higher. Your fund does not carry a “sales load.”
The calculations assume no shares were bought or sold during the period. Your actual costs may have been higher or lower, depending on the amount of your investment and the timing of any purchases or redemptions.
You can find more information about the fund’s expenses, including annual expense ratios, in the Financial Statements section of this report. For additional information on operating expenses and other shareholder costs, please refer to your fund’s current prospectus.
26
| | | |
| Six Months Ended October 31, 2013 | | | |
| | Beginning | Ending | Expenses |
| | Account Value | Account Value | Paid During |
| Selected Value Fund | 4/30/2013 | 10/31/2013 | Period |
| Based on Actual Fund Return | $1,000.00 | $1,171.54 | $2.46 |
| Based on Hypothetical 5% Yearly Return | 1,000.00 | 1,022.94 | 2.29 |
The calculations are based on expenses incurred in the most recent six-month period. The fund’s annualized six-month expense ratio for that
period is 0.45%. The dollar amounts shown as “Expenses Paid” are equal to the annualized expense ratio multiplied by the average account
value over the period, multiplied by the number of days in the most recent six-month period, then divided by the number of days in the most
recent 12-month period.
27
Glossary
30-Day SEC Yield. A fund’s 30-day SEC yield is derived using a formula specified by the U.S. Securities and Exchange Commission. Under the formula, data related to the fund’s security holdings in the previous 30 days are used to calculate the fund’s hypothetical net income for that period, which is then annualized and divided by the fund’s estimated average net assets over the calculation period. For the purposes of this calculation, a security’s income is based on its current market yield to maturity (for bonds), its actual income (for asset-backed securities), or its projected dividend yield (for stocks). Because the SEC yield represents hypothetical annualized income, it will differ—at times significantly—from the fund’s actual experience. As a result, the fund’s income distributions may be higher or lower than implied by the SEC yield.
Beta. A measure of the magnitude of a fund’s past share-price fluctuations in relation to the ups and downs of a given market index. The index is assigned a beta of 1.00. Compared with a given index, a fund with a beta of 1.20 typically would have seen its share price rise or fall by 12% when the index rose or fell by 10%. For this report, beta is based on returns over the past 36 months for both the fund and the index. Note that a fund’s beta should be reviewed in conjunction with its R-squared (see definition). The lower the R-squared, the less correlation there is between the fund and the index, and the less reliable beta is as an indicator of volatility.
Dividend Yield. Dividend income earned by stocks, expressed as a percentage of the aggregate market value (or of net asset value, for a fund). The yield is determined by dividing the amount of the annual dividends by the aggregate value (or net asset value) at the end of the period. For a fund, the dividend yield is based solely on stock holdings and does not include any income produced by other investments.
Earnings Growth Rate. The average annual rate of growth in earnings over the past five years for the stocks now in a fund.
Equity Exposure. A measure that reflects a fund’s investments in stocks and stock futures. Any holdings in short-term reserves are excluded.
Expense Ratio. A fund’s total annual operating expenses expressed as a percentage of the fund’s average net assets. The expense ratio includes management and administrative expenses, but does not include the transaction costs of buying and selling portfolio securities.
Foreign Holdings. The percentage of a fund represented by securities or depositary receipts of companies based outside the United States.
Inception Date. The date on which the assets of a fund (or one of its share classes) are first invested in accordance with the fund’s investment objective. For funds with a subscription period, the inception date is the day after that period ends. Investment performance is measured from the inception date.
Median Market Cap. An indicator of the size of companies in which a fund invests; the midpoint of market capitalization (market price x shares outstanding) of a fund’s stocks, weighted by the proportion of the fund’s assets invested in each stock. Stocks representing half of the fund’s assets have market capitalizations above the median, and the rest are below it.
Price/Book Ratio. The share price of a stock divided by its net worth, or book value, per share. For a fund, the weighted average price/book ratio of the stocks it holds.
28
Price/Earnings Ratio. The ratio of a stock’s current price to its per-share earnings over the past year. For a fund, the weighted average P/E of the stocks it holds. P/E is an indicator of market expectations about corporate prospects; the higher the P/E, the greater the expectations for a company’s future growth.
R-Squared. A measure of how much of a fund’s past returns can be explained by the returns from the market in general, as measured by a given index. If a fund’s total returns were precisely synchronized with an index’s returns, its R-squared would be 1.00. If the fund’s returns bore no relationship to the index’s returns, its R-squared would be 0. For this report, R-squared is based on returns over the past 36 months for both the fund and the index.
Return on Equity. The annual average rate of return generated by a company during the past five years for each dollar of shareholder’s equity (net income divided by shareholder’s equity). For a fund, the weighted average return on equity for the companies whose stocks it holds.
Short-Term Reserves. The percentage of a fund invested in highly liquid, short-term securities that can be readily converted to cash.
Turnover Rate. An indication of the fund’s trading activity. Funds with high turnover rates incur higher transaction costs and may be more likely to distribute capital gains (which may be taxable to investors). The turnover rate excludes in-kind transactions, which have minimal impact on costs.
29
This page intentionally left blank.
This page intentionally left blank.
The People Who Govern Your Fund
The trustees of your mutual fund are there to see that the fund is operated and managed in your best interests since, as a shareholder, you are a part owner of the fund. Your fund’s trustees also serve on the board of directors of The Vanguard Group, Inc., which is owned by the Vanguard funds and provides services to them on an at-cost basis.
A majority of Vanguard’s board members are independent, meaning that they have no affiliation with Vanguard or the funds they oversee, apart from the sizable personal investments they have made as private individuals. The independent board members have distinguished backgrounds in business, academia, and public service. Each of the trustees and executive officers oversees 181 Vanguard funds.
The following table provides information for each trustee and executive officer of the fund. More information about the trustees is in the Statement of Additional Information, which can be obtained, without charge, by contacting Vanguard at 800-662-7447, or online at vanguard.com.
| |
| InterestedTrustee1 | and Delphi Automotive LLP (automotive components); |
| | Senior Advisor at New Mountain Capital; Trustee of |
| F. William McNabb III | The Conference Board. |
| Born 1957. Trustee Since July 2009. Chairman of the | |
| Board. Principal Occupation(s) During the Past Five | Amy Gutmann |
| Years: Chairman of the Board of The Vanguard Group, | Born 1949. Trustee Since June 2006. Principal |
| Inc., and of each of the investment companies served | Occupation(s) During the Past Five Years: President |
| by The Vanguard Group, since January 2010; Director | of the University of Pennsylvania; Christopher H. |
| of The Vanguard Group since 2008; Chief Executive | Browne Distinguished Professor of Political Science |
| Officer and President of The Vanguard Group and of | in the School of Arts and Sciences with secondary |
| each of the investment companies served by The | appointments at the Annenberg School for |
| Vanguard Group since 2008; Director of Vanguard | Communication and the Graduate School of Education |
| Marketing Corporation; Managing Director of The | of the University of Pennsylvania; Member of the |
| Vanguard Group (1995–2008). | National Commission on the Humanities and Social |
| | Sciences; Trustee of Carnegie Corporation of New |
| IndependentTrustees | York and of the National Constitution Center; Chair |
| | of the U.S. Presidential Commission for the Study |
| Emerson U. Fullwood | of Bioethical Issues. |
| Born 1948. Trustee Since January 2008. Principal | |
| Occupation(s) During the Past Five Years: Executive | JoAnn Heffernan Heisen |
| Chief Staff and Marketing Officer for North America | Born 1950. Trustee Since July 1998. Principal |
| and Corporate Vice President (retired 2008) of Xerox | Occupation(s) During the Past Five Years: Corporate |
| Corporation (document management products and | Vice President and Chief Global Diversity Officer |
| services); Executive in Residence and 2010 | (retired 2008) and Member of the Executive |
| Distinguished Minett Professor at the Rochester | Committee (1997–2008) of Johnson & Johnson |
| Institute of Technology; Director of SPX Corporation | (pharmaceuticals/medical devices/consumer |
| (multi-industry manufacturing), the United Way of | products); Director of Skytop Lodge Corporation |
| Rochester, Amerigroup Corporation (managed health | (hotels), the University Medical Center at Princeton, |
| care), the University of Rochester Medical Center, | the Robert Wood Johnson Foundation, and the Center |
| Monroe Community College Foundation, and North | for Talent Innovation; Member of the Advisory Board |
| Carolina A&T University. | of the Maxwell School of Citizenship and Public Affairs |
| | at Syracuse University. |
| Rajiv L. Gupta | |
| Born 1945. Trustee Since December 2001.2 | F. Joseph Loughrey |
| Principal Occupation(s) During the Past Five Years: | Born 1949. Trustee Since October 2009. Principal |
| Chairman and Chief Executive Officer (retired 2009) | Occupation(s) During the Past Five Years: President |
| and President (2006–2008) of Rohm and Haas Co. | and Chief Operating Officer (retired 2009) of Cummins |
| (chemicals); Director of Tyco International, Ltd. | Inc. (industrial machinery); Chairman of the Board of |
| (diversified manufacturing and services), Hewlett- | Hillenbrand, Inc. (specialized consumer services) and |
| Packard Co. (electronic computer manufacturing), | of Oxfam America; Director of SKF AB (industrial |
| | |
| machinery), Hyster-Yale Materials Handling, Inc. | Executive Officers | |
| (forklift trucks), and the Lumina Foundation for | | |
| Education; Member of the Advisory Council for the | Glenn Booraem | |
| College of Arts and Letters and of the Advisory Board | Born 1967. Controller Since July 2010. Principal |
| to the Kellogg Institute for International Studies, both | Occupation(s) During the Past Five Years: Principal |
| at the University of Notre Dame. | of The Vanguard Group, Inc.; Controller of each of |
| | the investment companies served by The Vanguard |
| Mark Loughridge | Group; Assistant Controller of each of the investment |
| Born 1953. Trustee Since March 2012. Principal | companies served by The Vanguard Group (2001–2010). |
| Occupation(s) During the Past Five Years: Senior Vice | | |
| President and Chief Financial Officer at IBM (information | Thomas J. Higgins | |
| technology services); Fiduciary Member of IBM’s | Born 1957. Chief Financial Officer Since September |
| Retirement Plan Committee. | 2008. Principal Occupation(s) During the Past Five |
| | Years: Principal of The Vanguard Group, Inc.; Chief |
| Scott C. Malpass | Financial Officer of each of the investment companies |
| Born 1962. Trustee Since March 2012. Principal | served by The Vanguard Group; Treasurer of each of |
| Occupation(s) During the Past Five Years: Chief | the investment companies served by The Vanguard |
| Investment Officer and Vice President at the University | Group (1998–2008). | |
| of Notre Dame; Assistant Professor of Finance at the | | |
| Mendoza College of Business at Notre Dame; Member | Kathryn J. Hyatt | |
| of the Notre Dame 403(b) Investment Committee; | Born 1955. Treasurer Since November 2008. Principal |
| Director of TIFF Advisory Services, Inc. (investment | Occupation(s) During the Past Five Years: Principal of |
| advisor); Member of the Investment Advisory | The Vanguard Group, Inc.; Treasurer of each of the |
| Committees of the Financial Industry Regulatory | investment companies served by The Vanguard |
| Authority (FINRA) and of Major League Baseball. | Group; Assistant Treasurer of each of the investment |
| | companies served by The Vanguard Group (1988–2008). |
| André F. Perold | | |
| Born 1952. Trustee Since December 2004. Principal | Heidi Stam | |
| Occupation(s) During the Past Five Years: George | Born 1956. Secretary Since July 2005. Principal |
| Gund Professor of Finance and Banking at the Harvard | Occupation(s) During the Past Five Years: Managing |
| Business School (retired 2011); Chief Investment | Director of The Vanguard Group, Inc.; General Counsel |
| Officer and Managing Partner of HighVista Strategies | of The Vanguard Group; Secretary of The Vanguard |
| LLC (private investment firm); Director of Rand | Group and of each of the investment companies |
| Merchant Bank; Overseer of the Museum of Fine | served by The Vanguard Group; Director and Senior |
| Arts Boston. | Vice President of Vanguard Marketing Corporation. |
| |
| Alfred M. Rankin, Jr. | Vanguard Senior ManagementTeam |
| Born 1941. Trustee Since January 1993. Principal | | |
| Occupation(s) During the Past Five Years: Chairman, | Mortimer J. Buckley | Chris D. McIsaac |
| President, and Chief Executive Officer of NACCO | Kathleen C. Gubanich | Michael S. Miller |
| Industries, Inc. (housewares/lignite) and of Hyster-Yale | Paul A. Heller | James M. Norris |
| Materials Handling, Inc. (forklift trucks); Director of | Martha G. King | Glenn W. Reed |
| the National Association of Manufacturers; Chairman | John T. Marcante | |
| of the Board of University Hospitals of Cleveland; | | |
| Advisory Chairman of the Board of The Cleveland | Chairman Emeritus and Senior Advisor |
| Museum of Art. | | |
| | John J. Brennan | |
| Peter F. Volanakis | Chairman, 1996–2009 | |
| Born 1955. Trustee Since July 2009. Principal | Chief Executive Officer and President, 1996–2008 |
| Occupation(s) During the Past Five Years: President | | |
| and Chief Operating Officer (retired 2010) of Corning | | |
| Incorporated (communications equipment); Director | Founder | |
| of SPX Corporation (multi-industry manufacturing); | John C. Bogle | |
| Overseer of the Amos Tuck School of Business | Chairman and Chief Executive Officer, 1974–1996 |
| Administration at Dartmouth College; Advisor to the | | |
| Norris Cotton Cancer Center. | | |
1 Mr. McNabb is considered an “interested person,” as defined in the Investment Company Act of 1940, because he is an officer of the
Vanguard funds.
2 December 2002 for Vanguard Equity Income Fund, Vanguard Growth Equity Fund, the Vanguard Municipal Bond Funds, and the Vanguard
State Tax-Exempt Funds.
|  |
| | P.O. Box 2600 |
| | Valley Forge, PA 19482-2600 |
| |
| |
| |
| Connect with Vanguard® > vanguard.com | |
| |
| |
| |
| Fund Information > 800-662-7447 | CFA® is a trademark owned by CFA Institute. |
| Direct Investor Account Services > 800-662-2739 | |
| Institutional Investor Services > 800-523-1036 | |
| Text Telephone for People | |
| With Hearing Impairment > 800-749-7273 | |
| |
| This material may be used in conjunction | |
| with the offering of shares of any Vanguard | |
| fund only if preceded or accompanied by | |
| the fund’s current prospectus. | |
| |
| All comparative mutual fund data are from Lipper, a | |
| Thomson Reuters Company, or Morningstar, Inc., unless | |
| otherwise noted. | |
| |
| You can obtain a free copy of Vanguard’s proxy voting | |
| guidelines by visiting vanguard.com/proxyreporting or by | |
| calling Vanguard at 800-662-2739. The guidelines are | |
| also available from the SEC’s website, sec.gov. In | |
| addition, you may obtain a free report on how your fund | |
| voted the proxies for securities it owned during the 12 | |
| months ended June 30. To get the report, visit either | |
| vanguard.com/proxyreporting or sec.gov. | |
| |
| You can review and copy information about your fund at | |
| the SEC’s Public Reference Room in Washington, D.C. To | |
| find out more about this public service, call the SEC at | |
| 202-551-8090. Information about your fund is also | |
| available on the SEC’s website, and you can receive | |
| copies of this information, for a fee, by sending a | |
| request in either of two ways: via e-mail addressed to | |
| publicinfo@sec.gov or via regular mail addressed to the | |
| Public Reference Section, Securities and Exchange | |
| Commission, Washington, DC 20549-1520. | |
| |
| | © 2013 The Vanguard Group, Inc. |
| | All rights reserved. |
| | Vanguard Marketing Corporation, Distributor. |
| |
| | Q9340 122013 |

Annual Report | October 31, 2013
Vanguard Mid-Cap Growth Fund

Vanguard’s Principles for Investing Success
We want to give you the best chance of investment success. These principles, grounded in Vanguard’s research and experience, can put you on the right path.
Goals. Create clear, appropriate investment goals.
Balance. Develop a suitable asset allocation using broadly diversified funds. Cost. Minimize cost.
Discipline. Maintain perspective and long-term discipline.
A single theme unites these principles: Focus on the things you can control.
We believe there is no wiser course for any investor.
| |
| Contents | |
| Your Fund’s Total Returns. | 1 |
| Chairman’s Letter. | 2 |
| Advisors’ Report. | 7 |
| Fund Profile. | 11 |
| Performance Summary. | 12 |
| Financial Statements. | 14 |
| Your Fund’s After-Tax Returns. | 25 |
| About Your Fund’s Expenses. | 26 |
| Glossary. | 28 |
Please note: The opinions expressed in this report are just that—informed opinions. They should not be considered promises or advice. Also, please keep in mind that the information and opinions cover the period through the date on the front of this report. Of course, the risks of investing in your fund are spelled out in the prospectus.
See the Glossary for definitions of investment terms used in this report.
About the cover: The ship's wheel represents leadership and guidance, essential qualities in navigating difficult seas. This one is a replica based on an 18th-century British vessel. The HMS Vanguard, another ship of that era, served as the flagship for Admiral Horatio Nelson when he defeated a French fleet at the Battle of the Nile.
Your Fund’s Total Returns
| |
| Fiscal Year Ended October 31, 2013 | |
| |
| | Total |
| | Returns |
| Vanguard Mid-Cap Growth Fund | 30.32% |
| Russell Midcap Growth Index | 33.93 |
| Mid-Cap Growth Funds Average | 32.58 |
| Mid-Cap Growth Funds Average: Derived from data provided by Lipper, a Thomson Reuters Company. |
| | | | |
| Your Fund’s Performance at a Glance | | | | |
| October 31, 2012, Through October 31, 2013 | | | | |
| |
| | | | Distributions Per Share |
| | Starting | Ending | | |
| | Share | Share | Income | Capital |
| | Price | Price | Dividends | Gains |
| Vanguard Mid-Cap Growth Fund | $20.95 | $25.72 | $0.075 | $1.168 |
1

Chairman’s Letter
Dear Shareholder,
The U.S. stock market turned in a strong performance for the 12 months ended October 31, 2013. Mid-capitalization stocks—like those held in Vanguard Mid-Cap Growth Fund—outperformed their larger-cap counterparts as well as the broad market.
In this investment environment, the Mid-Cap Growth Fund returned 30.32%. That robust result notwithstanding, the fund trailed its benchmark, the Russell Midcap Growth Index, by more than 3 percentage points, mainly because of subpar stock selection in a handful of sectors. The fund also lagged the average return of its peers.
If you own shares of the fund in a taxable account, you may wish to review the information about after-tax returns presented later in this report. Please note that as of October 31, 2013, the fund had realized short-term capital gains of $0.78 per share and long-term gains of $1.74, together accounting for 9.8% of fund assets. Gains are distributed in December.
Amid uncertainties, U.S. stocks found a path to strong returns
U.S. stocks faced several challenges en route to an impressive return of about 29% for the 12 months ended October 31, 2013. Investors’ growing appetite for risk drove the rise in stocks, as corporate profit growth, on the whole, wasn’t particularly tantalizing.
2
Although the end of the fiscal year was notable for the budget impasse that resulted in October’s 16-day partial shutdown of the federal government, the period as a whole was marked by uncertainty about Federal Reserve monetary policy and concern about the economy’s patchy growth. Vanguard’s chief economist, Joe Davis, recently noted that “as was the case at the start of the year, the U.S. economy continues to expand at a modest and uneven pace.”
The disparity between the performance of the U.S. economy and that of U.S. stocks may seem surprising—but Vanguard research has shown a weak relationship over the long term between a nation’s economic growth and its stock returns. (You can read more in
The Outlook for Emerging Market Stocks in a Lower-Growth World, available at vanguard.com/research.)
Outside the United States, stocks returned about 20%. The developed markets of Europe and the Pacific region delivered robust gains; emerging-market stocks failed to keep pace.
Bond returns sagged as investors kept a close eye on the Fed
With investors fretting over the Fed’s next move in its stimulative bond-buying program, bonds recorded negative results for the 12 months. The broad U.S. taxable
| | | |
| Market Barometer | | | |
| |
| | Average Annual Total Returns |
| | Periods Ended October 31, 2013 |
| | One | Three | Five |
| | Year | Years | Years |
| Stocks | | | |
| Russell 1000 Index (Large-caps) | 28.40% | 16.83% | 15.84% |
| Russell 2000 Index (Small-caps) | 36.28 | 17.69 | 17.04 |
| Russell 3000 Index (Broad U.S. market) | 28.99 | 16.89 | 15.94 |
| MSCI All Country World Index ex USA (International) | 20.29 | 6.04 | 12.48 |
| |
| Bonds | | | |
| Barclays U.S. Aggregate Bond Index (Broad taxable market) | -1.08% | 3.02% | 6.09% |
| Barclays Municipal Bond Index (Broad tax-exempt market) | -1.72 | 3.60 | 6.37 |
| Citigroup Three-Month U.S. Treasury Bill Index | 0.06 | 0.07 | 0.12 |
| |
| CPI | | | |
| Consumer Price Index | 0.96% | 2.21% | 1.52% |
3
bond market returned –1.08%. The yield of the 10-year Treasury note closed at 2.54%, down from 2.63% at September’s close but up from 1.69% at the end of the previous fiscal year. (Bond yields and prices move in opposite directions.) Municipal bonds returned –1.72%.
Outside the United States, bond markets (as measured by the Barclays Global Aggregate Index ex USD) returned –1.95%.
The Fed’s target for short-term interest rates remained at 0%–0.25%, severely limiting returns of money market funds and savings accounts.
Mid-caps performed robustly, with gains across all sectors
In keeping with its name, Vanguard Mid-Cap Growth Fund invests primarily in stocks of mid-cap U.S. companies that the fund’s advisors believe have a strong potential for growth. Mid-cap stocks, as I mentioned previously, generated impressive results for the fiscal year, outperforming the broad market.
In this environment, the fund posted gains in all nine market sectors in which it was invested (it held no utility stocks). Its shares in the industrial, consumer discretionary, and financial sectors—which together constituted just over half of
| | |
| Expense Ratios | | |
| Your Fund Compared With Its Peer Group | | |
| | | Peer Group |
| | Fund | Average |
| Mid-Cap Growth Fund | 0.54% | 1.35% |
The fund expense ratio shown is from the prospectus dated February 22, 2013, and represents estimated costs for the current fiscal year. For the fiscal year ended October 31, 2013, the fund’s expense ratio was 0.51%. The peer-group expense ratio is derived from data provided by Lipper, a Thomson Reuters Company, and captures information through year-end 2012.
Peer group: Mid-Cap Growth Funds.
4
the fund’s assets, on average, during the period—produced nearly two-thirds of its return.
The industrial sector, often considered a gauge of the health of the economy, contributed most to fund performance. Standouts included trucking companies and aerospace and defense firms.
Consumer discretionary, the fund’s largest sector, was its second-biggest contributor, as signs of economic improvement further bolstered consumer spending. The sector posted strong returns across the board, led by stocks of hotels, apparel companies, and specialty retailers.
Financial stocks were also among the market’s top performers. The industry’s widespread resurgence, which followed several years of dismal results in the wake of the 2008–2009 financial crisis, continued throughout the 12 months, generating solid returns across the sector. Regional banks and asset management firms did particularly well.
The fund’s holdings in information technology and health care also boosted its overall performance.
Your fund’s tempered results compared with its benchmark can be attributed to the advisors’ stock selection in a few sectors. Although the fund’s consumer discretionary holdings added significantly to its
| |
| Total Returns | |
| Ten Years Ended October 31, 2013 | |
| | Average |
| | Annual Return |
| Mid-Cap Growth Fund | 9.23% |
| Russell Midcap Growth Index | 9.60 |
| Mid-Cap Growth Funds Average | 8.10 |
| Mid-Cap Growth Funds Average: Derived from data provided by Lipper, a Thomson Reuters Company. |
The figures shown represent past performance, which is not a guarantee of future results. (Current performance may be lower or higher than the performance data cited. For performance data current to the most recent month-end, visit our website at vanguard.com/performance.) Note, too, that both investment returns and principal value can fluctuate widely, so an investor’s shares, when sold, could be worth more or less than their original cost.
5
overall return, a lack of some high-flying internet stocks hurt its relative results. The advisors’ choices in health care, energy, and information technology also weighed on relative performance.
Despite challenges, the fund yielded competitive ten-year results
For the decade ended October 31, Vanguard Mid-Cap Growth Fund posted an average annual return of 9.23%, trailing its index (+9.60%) but outpacing its peer-group average (+8.10%).
This ten-year period saw periods of extreme volatility, including the trauma of the financial crisis. We thank the current team of advisors—Chartwell Investment Partners and William Blair & Company, which came aboard in 2006, for their stewardship of the fund. We believe that their ongoing efforts, supplemented by the fund’s low costs, will keep it competitive over the long term.
Combining diversity of thought with low costs brings benefits
Investors sometimes ask why Vanguard uses a multi-advisor approach for many of its actively managed equity funds. Just as we recommend diversification within and across asset classes for an investor’s overall portfolio, we think significant benefits can accrue from using multiple advisory firms for a single fund: diversity of investment process and style, thought, and holdings.
All these elements can lead to less risk and better results. Because not all investment managers invest the same way, their returns relative to the benchmark don’t move in lockstep.
As with many investment topics, however, there are some misconceptions about the benefits of a multi-manager approach. For example, it is often suggested that the best ideas of the advisors are diluted when combined in one portfolio. Recent Vanguard research has found otherwise.
Conventional wisdom also suggests that multi-manager funds tend to be expensive. At Vanguard, this is not the case: Low costs are a hallmark of all our offerings. And Vanguard research indicates that low costs can contribute greatly to investing success, helping investors keep more of a portfolio’s return. (You can read more in Analyzing Multi-Manager Funds: Does Management Structure Affect Performance?, available at vanguard.com/research.)
As always, thank you for investing with Vanguard.
Sincerely,

F. William McNabb III
Chairman and Chief Executive Officer
November 14, 2013
6
Advisors’ Report
During the fiscal year ended October 31, 2013, Vanguard Mid-Cap Growth Fund returned 30.32%. Your fund is managed by two independent advisors, a strategy that enhances the fund’s diversification by providing exposure to distinct, yet complementary, investment approaches. It’s not uncommon for different advisors to have different views about individual securities or the broader investment environment.
The advisors, the percentage of fund assets each manages, and brief descriptions of their investment strategies are presented in the table below. The advisors have also prepared a discussion of the investment environment that existed during the fiscal year and of how their portfolio positioning reflects this assessment. These comments were prepared on November 20, 2013.
Chartwell Investment Partners, L.P.
Portfolio Managers:
Edward N. Antoian, CFA, CPA,
Managing Partner
John A. Heffern, Managing Partner and
Senior Portfolio Manager
Financial markets rose impressively over the fiscal year, with some indexes exceeding prerecession levels. This advance was underpinned by signs of economic recovery in employment and housing data, generally positive earnings reports, and continued supportive Federal Reserve actions. Political distractions in
| | | |
| Vanguard Mid-Cap Growth Fund Investment Advisors |
| |
| | Fund Assets Managed | |
| Investment Advisor | % | $ Million | Investment Strategy |
| Chartwell Investment Partners, | 48 | 1,366 | Uses a bottom-up, fundamental, research-driven |
| L.P. | | | stock-selection strategy focusing on companies with |
| | | | sustainable growth, strong management teams, |
| | | | competitive positions, and outstanding product and |
| | | | service offerings. These companies should continually |
| | | | demonstrate growth in earnings per share. |
| William Blair & Company, L.L.C. | 47 | 1,344 | Uses a fundamental investment approach in pursuit of |
| | | | superior long-term investment results from |
| | | | growth-oriented companies with leadership positions |
| | | | and strong market presence. |
| Cash Investments | 5 | 127 | These short-term reserves are invested by Vanguard in |
| | | | equity index products to simulate investment in stocks. |
| | | | Each advisor may also maintain a modest cash |
| | | | position. |
7
Washington caused uncertainty; the recovery’s pace and strength, a pervasive concern for financial markets, remain entangled with political developments around the globe. Accordingly, we are navigating these unsettled times with a portfolio focused on mid-capitalization companies that demonstrate above-average growth potential supported by good products and expanding markets. This approach leads to portfolio decisions that steadfastly reflect our bias toward quality, leadership, defensible profit margins, and a pattern of successfully executing growth-oriented business plans.
Stock selection was successful within our top-performing groups: business services, capital spending, and consumer services. Fuel card provider FleetCor Technologies was able to sell higher levels of service to clients and expand its geographic reach, leading to strong earnings outperformance. Global advertising agency Interpublic Group improved its revenues and profit margins as it recovers market share and leverage costs. Hertz Global Holdings drove stronger earnings growth through solid pricing discipline and expense management, along with expected financial benefits from its acquisition of Dollar Thrifty Automotive Group. Manufacturer B/E Aerospace’s investments in research and development helped the company increase its shares of the wide- and narrow-body aircraft markets. Apparel company Hanesbrands captured market share and improved margins after key innovations increased sales and distribution. Its acquisition of Maidenform Brands is also expected to boost earnings. Rising shares of Domino’s Pizza were supported by sales growth, including solid year-over-year comparisons related to the company’s successful introduction of pan pizza and its continued international expansion.
The portfolio also benefited from our investment in Southeast regional bank Regions Financial. Continued positive credit trends, cost management, and expanded net interest margin aided performance. Strong results for IntercontinentalExchange, a global electronic marketplace operator, were driven by solid fundamentals and recognition that its acquisition of NYSE Euronext could provide additional earnings and other benefits. Lastly, railroad operator Genesee & Wyoming outperformed as a result of increased freight traffic and accelerated benefits from its acquisition of rival RailAmerica.
The technology and consumer discretionary sectors detracted the most. Near-term data for analytic services company Teradata suggested that its returns were hurt by delays in the purchase of large-ticket items and smaller initial deployments of longer return-on-investment solutions. Equinix, a data center provider, encountered revenue pressure and elevated pricing risk. Riverbed Technology, a provider of wide area network (WAN) optimization products, performed poorly amid a slowdown in its saturated core market; also, its acquisition of OPNET Technologies hindered margins and failed to reignite growth. TIBCO Software lost value as it struggled with slow sales in its legacy software business and excessive management turnover.
8
Homebuilder D.R. Horton was hurt by industrywide concerns that rising interest rates and steeply declining mortgage applications might impede the housing recovery.
In the health care sector, managed-care company Humana underestimated costs for new members and underpriced that business, triggering a lower earnings outlook during the time we owned the stock. Its performance has since recovered. Medical technology company Volcano, facing a challenging industry environment in which the number of coronary angioplasties performed in the United States is declining, lowered its revenue guidance.
William Blair & Company, L.L.C.
Portfolio Managers:
Robert C. Lanphier, Partner
David Ricci, CFA, Partner
U.S. mid-cap growth stocks, as measured by the Russell Midcap Growth Index, returned a robust 33.93% for the fiscal year, while Vanguard Mid-Cap Growth Fund underperformed.
Absent a major market correction before year-end, 2013 will be the fourth calendar year out of five in which mid-cap growth stocks had double-digit returns; three of these years (including 2013) saw returns of more than 20%. In general, the primary drivers of the strong equity performance over the last 12 months were improving economic data, especially in housing and employment, and actions by central banks.
Rebounding home prices and homebuilding boosted housing-related employment and overall consumer confidence.
The portfolio underperformed because of investment style challenges and weak stock selection. From a style perspective, our more conservative investment approach (that is, typical lower beta, or less risk) was a negative. Probably more important was our tendency to underweight cheaper stocks (based on near-term consensus fundamentals) because of our biases toward stronger growth and higher quality. The market’s gravitation to cheaper stocks was a clear hindrance.
Stock selection also notably detracted from relative return, especially in the health care and consumer discretionary sectors. In health care, HMS Holdings detracted the most. Uncertainty over renewal of its Medicare audit contract with the federal government and a slowdown in Medicaid enrollments in the improving economy have been largely responsible for slowing growth and souring investor sentiment. Bedding company Select Comfort was the main detractor in consumer discretionary. Its stock underperformed as growth slowed, in part because of a hiccup in its media-buying strategy and greater-than-expected marketing and advertising expenses. IT company SolarWinds was another notable detractor, mainly because of a weak environment for network performance management spending and mismanagement in its sales force.
9
Despite overall underperformance, the portfolio had a few bright spots. Green Mountain Coffee Roasters, in consumer staples, contributed the most. A new CEO with substantial industry expertise laid out an encouraging strategy to increase revenue and improve efficiencies in the wake of the company’s rapid growth. CoStar Group, in IT, was our second-largest relative contributor, thanks to better-than-expected fundamentals. The company improved an already strong cross-sale rate of its commercial real estate data to customers of LoopNet, a rival it acquired in 2012. Pandora Media, also in IT, was the third-largest contributor as internet radio continues to steal market share from traditional radio and advertisers increasingly use Pandora’s more targeted ad platform.
The marketplace will closely watch the Federal Reserve’s potential tapering of quantitative easing for its impact on investor sentiment, the housing recovery, and loan demand. Recent positive data from the United States, Europe, Japan, and China could signal the start of a synchronized global recovery into 2014. Valuations on U.S. stocks, while not discounted, remain reasonable. Mutual fund cash flows have moved away from bond funds and into stock funds, and that could further boost equity returns.
In the end, we consider these macroeconomic variables and factor different economic scenarios into our stock-picking; however, we remain focused on constructing our portfolio from the bottom up.
10
Mid-Cap Growth Fund
Fund Profile
As of October 31, 2013
| | | |
| Portfolio Characteristics | | |
| | | Russell | DJ U.S. |
| | | Midcap | Total |
| | | Growth | Market |
| | Fund | Index | FA Index |
| Number of Stocks | 121 | 493 | 3,612 |
| Median Market Cap | $7.6B | $11.2B | $41.6B |
| Price/Earnings Ratio | 25.9x | 27.0x | 19.8x |
| Price/Book Ratio | 3.9x | 5.0x | 2.5x |
| Return on Equity | 16.2% | 18.1% | 16.5% |
| Earnings Growth Rate | 19.4% | 14.2% | 10.6% |
| Dividend Yield | 0.6% | 1.1% | 1.9% |
| Foreign Holdings | 1.8% | 0.0% | 0.0% |
| Turnover Rate | 83% | — | — |
| Ticker Symbol | VMGRX | — | — |
| Expense Ratio1 | 0.54% | — | — |
| 30-Day SEC Yield | 0.13% | — | — |
| Short-Term Reserves | 2.3% | — | — |
| | | |
| Sector Diversification (% of equity exposure) |
| | | | DJ U.S. |
| | | Russell | Total |
| | | Midcap | Market |
| | | Growth | FA |
| | Fund | Index | Index |
| Consumer Discretionary 21.0% | 25.0% | 13.3% |
| Consumer Staples | 3.4 | 8.3 | 8.8 |
| Energy | 5.5 | 6.3 | 9.7 |
| Financials | 11.7 | 8.3 | 17.3 |
| Health Care | 15.6 | 13.0 | 12.5 |
| Industrials | 19.6 | 14.8 | 11.5 |
| Information Technology | 19.4 | 16.1 | 17.7 |
| Materials | 2.3 | 5.9 | 3.8 |
| Telecommunication | | | |
| Services | 1.3 | 1.5 | 2.2 |
| Utilities | 0.2 | 0.8 | 3.2 |
| | |
| Volatility Measures | | |
| | Russell | |
| | Midcap | DJ U.S. |
| | Growth | Total Market |
| | Index | FA Index |
| R-Squared | 0.96 | 0.89 |
| Beta | 0.92 | 1.03 |
| These measures show the degree and timing of the fund’s fluctuations compared with the indexes over 36 months. |
| | |
| Ten Largest Holdings (% of total net assets) |
| Perrigo Co. | Pharmaceuticals | 2.2% |
| Dick's Sporting Goods | | |
| Inc. | Specialty Stores | 2.0 |
| Affiliated Managers | Asset Management | |
| Group Inc. | & Custody Banks | 1.7 |
| B/E Aerospace Inc. | Aerospace & | |
| | Defense | 1.6 |
| Amphenol Corp. | Electronic | |
| | Components | 1.5 |
| Signature Bank | Regional Banks | 1.4 |
| Mead Johnson Nutrition | Packaged Foods & | |
| Co. | Meats | 1.4 |
| O'Reilly Automotive Inc. | Automotive Retail | 1.4 |
| AMETEK Inc. | Electrical | |
| | Components & | |
| | Equipment | 1.3 |
| Citrix Systems Inc. | Application Software | 1.2 |
| Top Ten | | 15.7% |
| The holdings listed exclude any temporary cash investments and equity index products. |
Investment Focus
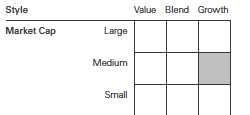
1 The expense ratio shown is from the prospectus dated February 22, 2013, and represents estimated costs for the current fiscal year. For the fiscal year ended October 31, 2013, the expense ratio was 0.51%.
11
Mid-Cap Growth Fund
Performance Summary
All of the returns in this report represent past performance, which is not a guarantee of future results that may be achieved by the fund. (Current performance may be lower or higher than the performance data cited. For performance data current to the most recent month-end, visit our website at vanguard.com/performance.) Note, too, that both investment returns and principal value can fluctuate widely, so an investor’s shares, when sold, could be worth more or less than their original cost. The returns shown do not reflect taxes that a shareholder would pay on fund distributions or on the sale of fund shares.
Cumulative Performance: October 31, 2003, Through October 31, 2013
Initial Investment of $10,000
| | | | | |
| | | Average Annual Total Returns | |
| | | Periods Ended October 31, 2013 | |
| | | | | | Final Value |
| | | One | Five | Ten | of a $10,000 |
| | | Year | Years | Years | Investment |
| | Mid-Cap Growth Fund* | 30.32% | 18.86% | 9.23% | $24,186 |
| •••••••• | Russell Midcap Growth Index | 33.93 | 20.32 | 9.60 | 24,999 |
| – – – – | Mid-Cap Growth Funds Average | 32.58 | 17.81 | 8.10 | 21,796 |
| | Dow Jones U.S. Total Stock Market | | | | |
| | Float Adjusted Index | 28.86 | 16.01 | 8.13 | 21,850 |
| Mid-Cap Growth Funds Average: Derived from data provided by Lipper, a Thomson Reuters Company. |
See Financial Highlights for dividend and capital gains information.
12
Mid-Cap Growth Fund
Fiscal-Year Total Returns (%): October 31, 2003, Through October 31, 2013

Average Annual Total Returns: Periods Ended September 30, 2013
This table presents returns through the latest calendar quarter—rather than through the end of the fiscal period.
Securities and Exchange Commission rules require that we provide this information.
| | | | |
| | Inception | One | Five | Ten |
| | Date | Year | Years | Years |
| Mid-Cap Growth Fund | 12/31/1997 | 24.86% | 13.43% | 10.01% |
13
Mid-Cap Growth Fund
Financial Statements
Statement of Net Assets
As of October 31, 2013
The fund reports a complete list of its holdings in regulatory filings four times in each fiscal year, at the quarter-ends. For the second and fourth fiscal quarters, the lists appear in the fund’s semiannual and annual reports to shareholders. For the first and third fiscal quarters, the fund files the lists with the Securities and Exchange Commission on Form N-Q. Shareholders can look up the fund’s Forms N-Q on the SEC’s website at sec.gov. Forms N-Q may also be reviewed and copied at the SEC’s Public Reference Room (see the back cover of this report for further information).
| | | |
| | | | Market |
| | | | Value |
| | | Shares | ($000) |
| Common Stocks (95.0%)1 | | |
| Consumer Discretionary (20.1%) | |
| | Dick’s Sporting Goods Inc. | 1,084,600 | 57,712 |
| * | O’Reilly Automotive Inc. | 310,300 | 38,418 |
| * | Dollar General Corp. | 574,226 | 33,179 |
| | Six Flags | | |
| | Entertainment Corp. | 874,780 | 32,901 |
| | Harley-Davidson Inc. | 456,300 | 29,221 |
| * | Lululemon Athletica Inc. | 421,200 | 29,084 |
| * | Bed Bath & Beyond Inc. | 369,000 | 28,531 |
| | Lennar Corp. Class A | 791,570 | 28,140 |
| * | MGM Resorts | | |
| | International | 1,270,600 | 24,192 |
| | Carter’s Inc. | 334,425 | 23,126 |
| | GNC Holdings Inc. | | |
| | Class A | 381,425 | 22,435 |
| | Hanesbrands Inc. | 325,095 | 22,145 |
| | Group 1 Automotive Inc. | 343,547 | 21,987 |
| * | Select Comfort Corp. | 1,196,723 | 21,924 |
| * | Fossil Group Inc. | 172,700 | 21,923 |
| | Interpublic Group of | | |
| | Cos. Inc. | 1,183,580 | 19,884 |
| | VF Corp. | 92,170 | 19,817 |
| | Wyndham Worldwide Corp. | 275,325 | 18,282 |
| | Cheesecake Factory Inc. | 383,075 | 18,100 |
| | Guess? Inc. | 501,820 | 15,682 |
| * | Chipotle Mexican Grill Inc. | | |
| | Class A | 28,900 | 15,229 |
| | Ralph Lauren Corp. Class A | 85,555 | 14,171 |
| | H&R Block Inc. | 480,180 | 13,656 |
| | | | 569,739 |
| Consumer Staples (3.1%) | | |
| | Mead Johnson Nutrition Co. | 482,000 | 39,360 |
| * | Green Mountain Coffee | | |
| | Roasters Inc. | 360,945 | 22,671 |
| | Church & Dwight Co. Inc. | 214,648 | 13,984 |
| | McCormick & Co. Inc. | 187,200 | 12,945 |
| | | | 88,960 |
| | | |
| Energy (5.2%) | | |
| * | Denbury Resources Inc. | 1,198,850 | 22,766 |
| * | Concho Resources Inc. | 201,815 | 22,323 |
| | Range Resources Corp. | 241,200 | 18,261 |
| * | FMC Technologies Inc. | 330,800 | 16,722 |
| * | Gulfport Energy Corp. | 259,050 | 15,204 |
| * | Whiting Petroleum Corp. | 226,100 | 15,124 |
| | Cabot Oil & Gas Corp. | 331,330 | 11,703 |
| * | Newfield Exploration Co. | 334,500 | 10,185 |
| | Helmerich & Payne Inc. | 97,633 | 7,571 |
| | Oceaneering | | |
| | International Inc. | 83,600 | 7,180 |
| | | | 147,039 |
| Exchange-Traded Fund (0.3%) | |
| ^,2 | Vanguard Mid-Cap ETF | 82,700 | 8,759 |
| |
| Financials (10.7%) | | |
| * | Affiliated Managers | | |
| | Group Inc. | 244,480 | 48,270 |
| * | Signature Bank | 390,416 | 39,752 |
| * | IntercontinentalExchange | | |
| | Inc. | 156,635 | 30,188 |
| | LPL Financial Holdings Inc. | 668,384 | 27,230 |
| | Discover Financial Services | 407,235 | 21,127 |
| | Zions Bancorporation | 743,384 | 21,090 |
| | First Republic Bank | 357,100 | 18,237 |
| | SEI Investments Co. | 530,150 | 17,596 |
| | Invesco Ltd. | 514,058 | 17,350 |
| | Lazard Ltd. Class A | 436,635 | 16,876 |
| | Assured Guaranty Ltd. | 780,150 | 15,993 |
| | Huntington | | |
| | Bancshares Inc. | 1,671,665 | 14,711 |
| | T. Rowe Price Group Inc. | 184,600 | 14,290 |
| | | | 302,710 |
| Health Care (15.1%) | | |
| | Perrigo Co. | 457,650 | 63,105 |
| * | IDEXX Laboratories Inc. | 319,011 | 34,409 |
| * | BioMarin | | |
| | Pharmaceutical Inc. | 530,070 | 33,299 |
14
Mid-Cap Growth Fund
| | | |
| | | | Market |
| | | | Value |
| | | Shares | ($000) |
| * | Mettler-Toledo | | |
| | International Inc. | 126,370 | 31,272 |
| * | HMS Holdings Corp. | 1,472,836 | 31,121 |
| * | Sirona Dental | | |
| | Systems Inc. | 378,100 | 27,318 |
| * | ICON plc | 555,700 | 22,472 |
| | HealthSouth Corp. | 591,831 | 20,779 |
| | Zoetis Inc. | 646,325 | 20,463 |
| | Agilent | | |
| | Technologies Inc. | 389,595 | 19,776 |
| * | Covance Inc. | 219,900 | 19,628 |
| * | Cerner Corp. | 341,800 | 19,151 |
| | Cooper Cos. Inc. | 131,112 | 16,941 |
| * | MEDNAX Inc. | 152,058 | 16,577 |
| | Thermo Fisher | | |
| | Scientific Inc. | 144,225 | 14,102 |
| * | Waters Corp. | 127,064 | 12,823 |
| * | Catamaran Corp. | 272,400 | 12,792 |
| * | Alexion | | |
| | Pharmaceuticals Inc. | 92,175 | 11,333 |
| | | | 427,361 |
| Industrials (18.8%) | | |
| * | B/E Aerospace Inc. | 570,355 | 46,290 |
| | AMETEK Inc. | 757,755 | 36,243 |
| * | Stericycle Inc. | 283,190 | 32,907 |
| * | Jacobs Engineering | | |
| | Group Inc. | 497,300 | 30,246 |
| * | WESCO International Inc. | 319,529 | 27,307 |
| | Equifax Inc. | 408,100 | 26,392 |
| | JB Hunt Transport | | |
| | Services Inc. | 324,500 | 24,347 |
| * | United Rentals Inc. | 374,720 | 24,203 |
| | TransDigm Group Inc. | 165,100 | 24,007 |
| * | Clean Harbors Inc. | 388,100 | 23,965 |
| | Waste Connections Inc. | 478,940 | 20,470 |
| * | Genesee & Wyoming Inc. | | |
| | Class A | 204,820 | 20,449 |
| * | Old Dominion Freight | | |
| | Line Inc. | 433,740 | 20,342 |
| | Nordson Corp. | 281,300 | 20,279 |
| * | Hertz Global Holdings Inc. | 860,775 | 19,763 |
| * | IHS Inc. Class A | 180,725 | 19,708 |
| | Alaska Air Group Inc. | 259,050 | 18,305 |
| | Actuant Corp. Class A | 454,825 | 17,083 |
| | Flowserve Corp. | 240,975 | 16,741 |
| * | Verisk Analytics Inc. | | |
| | Class A | 237,960 | 16,305 |
| | KAR Auction Services Inc. | 521,100 | 15,487 |
| | Graco Inc. | 165,900 | 12,818 |
| | Hubbell Inc. Class B | 98,200 | 10,560 |
| | Fastenal Co. | 185,135 | 9,220 |
| | | | 533,437 |
| | | | |
| Information Technology (18.5%) | |
| | Amphenol Corp. Class A | 529,085 | 42,480 |
| * | Citrix Systems Inc. | | 618,700 | 35,130 |
| * | Genpact Ltd. | | 1,575,822 | 31,249 |
| * | Trimble Navigation Ltd. | 1,074,947 | 30,711 |
| * | Vantiv Inc. Class A | | 1,092,175 | 30,035 |
| * | NXP Semiconductor NV | 669,850 | 28,214 |
| * | Guidewire Software Inc. | 435,700 | 22,099 |
| * | CoStar Group Inc. | | 124,579 | 22,049 |
| * | VeriSign Inc. | | 392,600 | 21,310 |
| * | Akamai Technologies Inc. | 451,200 | 20,187 |
| * | Cognizant Technology | | |
| | Solutions Corp. Class A | 226,985 | 19,732 |
| * | SolarWinds Inc. | | 539,900 | 19,539 |
| * | Equinix Inc. | | 120,940 | 19,529 |
| | FactSet Research | | | |
| | Systems Inc. | | 164,500 | 17,921 |
| * | PTC Inc. | | 644,605 | 17,868 |
| * | FleetCor Technologies Inc. | 154,348 | 17,804 |
| * | Gartner Inc. | | 282,700 | 16,665 |
| * | NeuStar Inc. Class A | 346,927 | 15,931 |
| * | F5 Networks Inc. | | 190,225 | 15,505 |
| * | Informatica Corp. | | 368,050 | 14,207 |
| * | NCR Corp. | | 375,375 | 13,720 |
| | Avago Technologies Ltd. | | |
| | Class A | | 301,900 | 13,715 |
| * | Finisar Corp. | | 588,125 | 13,533 |
| * | Red Hat Inc. | | 273,900 | 11,852 |
| * | Pandora Media Inc. | | 424,500 | 10,668 |
| | IPG Photonics Corp. | 51,072 | 3,384 |
| | | | | 525,037 |
| Materials (2.0%) | | | |
| | Airgas Inc. | | 293,812 | 32,046 |
| | Cytec Industries Inc. | 300,800 | 24,994 |
| | | | | 57,040 |
| Telecommunication Services (1.2%) | |
| * | SBA Communications | | |
| | Corp. Class A | | 395,450 | 34,590 |
| Total Common Stocks | | | |
| (Cost $2,048,152) | | | 2,694,672 |
| Temporary Cash Investments (6.6%)1 | |
| Money Market Fund (6.4%) | | |
| 3,4 | Vanguard Market | | | |
| | Liquidity Fund, | | | |
| | 0.120% | 182,737,629 | 182,738 |
15
Mid-Cap Growth Fund
| | | |
| | | Face | Market |
| | | Amount | Value |
| | | ($000) | ($000) |
| U.S. Government and Agency Obligations (0.2%) |
| 5,6 | Federal Home Loan Bank | | |
| | Discount Notes, 0.100%, | | |
| | 11/13/13 | 250 | 250 |
| 5,6 | Federal Home Loan Bank | | |
| | Discount Notes, 0.100%, | | |
| | 12/6/13 | 2,800 | 2,799 |
| 6,7 | Freddie Mac Discount | | |
| | Notes, 0.100%, 11/12/13 | 1,000 | 1,000 |
| 6,7 | Freddie Mac Discount | | |
| | Notes, 0.105%, 12/9/13 | 1,000 | 1,000 |
| | | | 5,049 |
| Total Temporary Cash Investments | |
| (Cost $187,786) | | 187,787 |
| Total Investments (101.6%) | | |
| (Cost $2,235,938) | | 2,882,459 |
| Other Assets and Liabilities (-1.6%) | |
| Other Assets | | 17,553 |
| Liabilities4 | | (63,418) |
| | | | (45,865) |
| Net Assets (100%) | | |
| Applicable to 110,306,031 outstanding | |
| $.001 par value shares of beneficial | |
| interest (unlimited authorization) | 2,836,594 |
| Net Asset Value Per Share | | $25.72 |
| |
| At October 31, 2013, net assets consisted of: |
| | Amount |
| | ($000) |
| Paid-in Capital | 1,915,256 |
| Overdistributed Net Investment Income | (3,055) |
| Accumulated Net Realized Gains | 274,117 |
| Unrealized Appreciation (Depreciation) | |
| Investment Securities | 646,521 |
| Futures Contracts | 3,755 |
| Net Assets | 2,836,594 |
See Note A in Notes to Financial Statements.
* Non-income-producing security.
^ Includes partial security positions on loan to broker-dealers. The total value of securities on loan is $4,183,000.
1 The fund invests a portion of its cash reserves in equity markets through the use of index futures contracts. After giving effect to futures
investments, the fund’s effective common stock and temporary cash investment positions represent 99.1% and 2.5%, respectively, of
net assets.
2 Considered an affiliated company of the fund as the issuer is another member of The Vanguard Group.
3 Affiliated money market fund available only to Vanguard funds and certain trusts and accounts managed by Vanguard. Rate shown is the
7-day yield.
4 Includes $4,306,000 of collateral received for securities on loan.
5 The issuer operates under a congressional charter; its securities are generally neither guaranteed by the U.S. Treasury nor backed by the full
faith and credit of the U.S. government.
6 Securities with a value of $5,049,000 have been segregated as initial margin for open futures contracts.
7 The issuer was placed under federal conservatorship in September 2008; since that time, its daily operations have been managed by the
Federal Housing Finance Agency and it receives capital from the U.S. Treasury, as needed to maintain a positive net worth, in exchange for
senior preferred stock.
See accompanying Notes, which are an integral part of the Financial Statements.
16
Mid-Cap Growth Fund
Statement of Operations
| |
| | Year Ended |
| | October 31, 2013 |
| | ($000) |
| Investment Income | |
| Income | |
| Dividends1 | 16,863 |
| Interest1 | 221 |
| Securities Lending | 273 |
| Total Income | 17,357 |
| Expenses | |
| Investment Advisory Fees—Note B | |
| Basic Fee | 5,237 |
| Performance Adjustment | 511 |
| The Vanguard Group—Note C | |
| Management and Administrative | 6,411 |
| Marketing and Distribution | 512 |
| Custodian Fees | 30 |
| Auditing Fees | 32 |
| Shareholders’ Reports | 34 |
| Trustees’ Fees and Expenses | 8 |
| Total Expenses | 12,775 |
| Expenses Paid Indirectly | (132) |
| Net Expenses | 12,643 |
| Net Investment Income | 4,714 |
| Realized Net Gain (Loss) | |
| Investment Securities Sold1 | 279,122 |
| Futures Contracts | 18,602 |
| Realized Net Gain (Loss) | 297,724 |
| Change in Unrealized Appreciation (Depreciation) | |
| Investment Securities | 347,271 |
| Futures Contracts | 6,063 |
| Change in Unrealized Appreciation (Depreciation) | 353,334 |
| Net Increase (Decrease) in Net Assets Resulting from Operations | 655,772 |
| 1 Dividend income, interest income, and realized net gain (loss) from affiliated companies of the fund were $97,000, $215,000, and $0, respectively. |
See accompanying Notes, which are an integral part of the Financial Statements.
17
Mid-Cap Growth Fund
Statement of Changes in Net Assets
| | |
| | Year Ended October 31, |
| | 2013 | 2012 |
| | ($000) | ($000) |
| Increase (Decrease) in Net Assets | | |
| Operations | | |
| Net Investment Income | 4,714 | 3,854 |
| Realized Net Gain (Loss) | 297,724 | 135,148 |
| Change in Unrealized Appreciation (Depreciation) | 353,334 | 47,454 |
| Net Increase (Decrease) in Net Assets Resulting from Operations | 655,772 | 186,456 |
| Distributions | | |
| Net Investment Income | (7,620) | (2,808) |
| Realized Capital Gain1 | (118,662) | (33,038) |
| Total Distributions | (126,282) | (35,846) |
| Capital Share Transactions | | |
| Issued | 533,350 | 517,292 |
| Issued in Lieu of Cash Distributions | 122,777 | 34,905 |
| Redeemed | (478,266) | (377,167) |
| Net Increase (Decrease) from Capital Share Transactions | 177,861 | 175,030 |
| Total Increase (Decrease) | 707,351 | 325,640 |
| Net Assets | | |
| Beginning of Period | 2,129,243 | 1,803,603 |
| End of Period2 | 2,836,594 | 2,129,243 |
| 1 Includes fiscal 2013 and 2012 short-term gain distributions totaling $32,409,000 and $0, respectively. Short-term gain distributions are treated as ordinary income dividends for tax purposes. |
| 2 Net Assets—End of Period includes undistributed (overdistributed) net investment income of ($3,055,000) and $273,000. |
See accompanying Notes, which are an integral part of the Financial Statements.
18
Mid-Cap Growth Fund
Financial Highlights
| | | | | |
| For a Share Outstanding | Year Ended October 31, |
| Throughout Each Period | 2013 | 2012 | 2011 | 2010 | 2009 |
| Net Asset Value, Beginning of Period | $20.95 | $19.40 | $17.54 | $13.86 | $11.82 |
| Investment Operations | | | | | |
| Net Investment Income | . 048 | .041 | .0401 | .001 | .0212 |
| Net Realized and Unrealized Gain (Loss) | | | | | |
| on Investments | 5.965 | 1.892 | 1.840 | 3.697 | 2.059 |
| Total from Investment Operations | 6.013 | 1.933 | 1.880 | 3.698 | 2.080 |
| Distributions | | | | | |
| Dividends from Net Investment Income | (.075) | (. 030) | (. 020) | (. 018) | (.040) |
| Distributions from Realized Capital Gains | (1.168) | (.353) | — | — | — |
| Total Distributions | (1.243) | (. 383) | (. 020) | (. 018) | (.040) |
| Net Asset Value, End of Period | $25.72 | $20.95 | $19.40 | $17.54 | $13.86 |
| |
| Total Return3 | 30.32% | 10.24% | 10.72% | 26.70% | 17.70% |
| |
| Ratios/Supplemental Data | | | | | |
| Net Assets, End of Period (Millions) | $2,837 | $2,129 | $1,804 | $1,562 | $1,229 |
| Ratio of Total Expenses to Average Net Assets4 | 0.51% | 0.54% | 0.53% | 0.51% | 0.60% |
| Ratio of Net Investment Income to | | | | | |
| Average Net Assets | 0.19% | 0.19% | 0.20%1 | 0.00% | 0.16%2 |
| Portfolio Turnover Rate | 83% | 97% | 127% | 88% | 125% |
1 Net investment income per share and the ratio of net investment income to average net assets include $.02 and 0.11%, respectively,
resulting from a special dividend from VeriSign Inc. in December 2010.
2 Net investment income per share and the ratio of net investment income to average net assets include $.02 and 0.19%, respectively,
resulting from a special dividend from TransDigm Group Inc. in October 2009.
3 Total returns do not include account service fees that may have applied in the periods shown. Fund prospectuses provide information about
any applicable account service fees.
4 Includes performance-based investment advisory fee increases (decreases) of 0.02%, 0.04%, 0.01%, (0.01%), and 0.02%.
See accompanying Notes, which are an integral part of the Financial Statements.
19
Mid-Cap Growth Fund
Notes to Financial Statements
Vanguard Mid-Cap Growth Fund is registered under the Investment Company Act of 1940 as an open-end investment company, or mutual fund.
A. The following significant accounting policies conform to generally accepted accounting principles for U.S. mutual funds. The fund consistently follows such policies in preparing its financial statements.
1. Security Valuation: Securities are valued as of the close of trading on the New York Stock Exchange (generally 4 p.m., Eastern time) on the valuation date. Equity securities are valued at the latest quoted sales prices or official closing prices taken from the primary market in which each security trades; such securities not traded on the valuation date are valued at the mean of the latest quoted bid and asked prices. Securities for which market quotations are not readily available, or whose values have been materially affected by events occurring before the fund’s pricing time but after the close of the securities’ primary markets, are valued by methods deemed by the board of trustees to represent fair value. Investments in Vanguard Market Liquidity Fund are valued at that fund’s net asset value. Temporary cash investments acquired over 60 days to maturity are valued using the latest bid prices or using valuations based on a matrix system (which considers such factors as security prices, yields, maturities, and ratings), both as furnished by independent pricing services. Other temporary cash investments are valued at amortized cost, which approximates market value.
2. Futures Contracts: The fund may use index futures contracts to a limited extent, with the objective of maintaining full exposure to the stock market while maintaining liquidity. The fund may purchase or sell futures contracts to achieve a desired level of investment, whether to accommodate portfolio turnover or cash flows from capital share transactions. The primary risks associated with the use of futures contracts are imperfect correlation between changes in market values of stocks held by the fund and the prices of futures contracts, and the possibility of an illiquid market. Counterparty risk involving futures is mitigated because a regulated clearinghouse is the counterparty instead of the clearing broker. To further mitigate counterparty risk, the fund trades futures contracts on an exchange, monitors the financial strength of its clearing brokers and clearinghouse, and has entered into clearing agreements with its clearing brokers. The clearinghouse imposes initial margin requirements to secure the fund’s performance and requires daily settlement of variation margin representing changes in the market value of each contract.
Futures contracts are valued at their quoted daily settlement prices. The aggregate notional amounts of the contracts are not recorded in the Statement of Net Assets. Fluctuations in the value of the contracts are recorded in the Statement of Net Assets as an asset (liability) and in the Statement of Operations as unrealized appreciation (depreciation) until the contracts are closed, when they are recorded as realized futures gains (losses).
During the year ended October 31, 2013, the fund’s average investments in long and short futures contracts represented 4% and 0% of net assets, respectively, based on quarterly average aggregate settlement values.
3. Federal Income Taxes: The fund intends to continue to qualify as a regulated investment company and distribute all of its taxable income. Management has analyzed the fund’s tax positions taken for all open federal income tax years (October 31, 2010–2013), and has concluded that no provision for federal income tax is required in the fund’s financial statements.
4. Distributions: Distributions to shareholders are recorded on the ex-dividend date.
5. Securities Lending: To earn additional income, the fund may lend its securities to qualified institutional borrowers. Security loans are required to be secured at all times by collateral in an amount at least equal to the market value of securities loaned. Daily market fluctuations could cause the value
20
Mid-Cap Growth Fund
of loaned securities to be more or less than the value of the collateral received. When this occurs, the collateral is adjusted and settled on the next business day. The fund further mitigates its counterparty risk by entering into securities lending transactions only with a diverse group of prequalified counterparties, monitoring their financial strength, and entering into master securities lending agreements with its counterparties. The master securities lending agreements provide that, in the event of a counterparty’s default (including bankruptcy), the fund may terminate any loans with that borrower, determine the net amount owed, and sell or retain the collateral up to the net amount owed to the fund; however, such actions may be subject to legal proceedings. While collateral mitigates counterparty risk, in the absence of a default the fund may experience delays and costs in recovering the securities loaned. The fund invests cash collateral received in Vanguard Market Liquidity Fund, and records a liability for the return of the collateral, during the period the securities are on loan. Securities lending income represents fees charged to borrowers plus income earned on invested cash collateral, less expenses associated with the loan.
6. Other: Dividend income is recorded on the ex-dividend date. Interest income includes income distributions received from Vanguard Market Liquidity Fund and is accrued daily. Premiums and discounts on debt securities purchased are amortized and accreted, respectively, to interest income over the lives of the respective securities. Security transactions are accounted for on the date securities are bought or sold. Costs used to determine realized gains (losses) on the sale of investment securities are those of the specific securities sold.
B. Chartwell Investment Partners, L.P., and William Blair & Company, L.L.C., each provide investment advisory services to a portion of the fund for a fee calculated at an annual percentage rate of average net assets managed by the advisor. The basic fee of Chartwell Investment Partners, L.P., is subject to quarterly adjustments based on performance for the preceding three years relative to the Russell Midcap Growth Index. The basic fee of William Blair & Company, L.L.C., is subject to quarterly adjustments based on performance for the preceding five years relative to the Russell MidCap Growth Index.
The Vanguard Group manages the cash reserves of the fund on an at-cost basis.
For the year ended October 31, 2013, the aggregate investment advisory fee represented an effective annual basic rate of 0.21% of the fund’s average net assets, before an increase of $511,000 (0.02%) based on performance.
C. The Vanguard Group furnishes at cost corporate management, administrative, marketing, and distribution services. The costs of such services are allocated to the fund under methods approved by the board of trustees. The fund has committed to provide up to 0.40% of its net assets in capital contributions to Vanguard. At October 31, 2013, the fund had contributed capital of $326,000 to Vanguard (included in Other Assets), representing 0.01% of the fund’s net assets and 0.13% of Vanguard’s capitalization. The fund’s trustees and officers are also directors and officers of Vanguard.
D. The fund has asked its investment advisors to direct certain security trades, subject to obtaining the best price and execution, to brokers who have agreed to rebate to the fund part of the commissions generated. Such rebates are used solely to reduce the fund’s management and administrative expenses. For the year ended October 31, 2013, these arrangements reduced the fund’s expenses by $132,000 (an annual rate of 0.01% of average net assets).
21
Mid-Cap Growth Fund
E. Various inputs may be used to determine the value of the fund’s investments. These inputs are summarized in three broad levels for financial statement purposes. The inputs or methodologies used to value securities are not necessarily an indication of the risk associated with investing in those securities.
Level 1—Quoted prices in active markets for identical securities.
Level 2—Other significant observable inputs (including quoted prices for similar securities, interest rates, prepayment speeds, credit risk, etc.).
Level 3—Significant unobservable inputs (including the fund’s own assumptions used to determine the fair value of investments).
The following table summarizes the market value of the fund’s investments as of October 31, 2013, based on the inputs used to value them:
| | | |
| | Level 1 | Level 2 | Level 3 |
| Investments | ($000) | ($000) | ($000) |
| Common Stocks | 2,694,672 | — | — |
| Temporary Cash Investments | 182,738 | 5,049 | — |
| Futures Contracts—Liabilities1 | (433) | — | — |
| Total | 2,876,977 | 5,049 | — |
| 1 Represents variation margin on the last day of the reporting period. |
F. At October 31, 2013, the aggregate settlement value of open futures contracts and the related unrealized appreciation (depreciation) were:
| | | | |
| | | | ($000) |
| | | | Aggregate | |
| | | Number of | Settlement | Unrealized |
| | | Long (Short) | Value | Appreciation |
| Futures Contracts | Expiration | Contracts | Long (Short) | (Depreciation) |
| E-mini S&P Midcap 400 Index | December 2013 | 751 | 96,609 | 2,984 |
| S&P 500 Index | December 2013 | 39 | 17,072 | 693 |
| E-mini S&P 500 Index | December 2013 | 34 | 2,977 | 78 |
Unrealized appreciation (depreciation) on open futures contracts is required to be treated as realized gain (loss) for tax purposes.
G. Distributions are determined on a tax basis and may differ from net investment income and realized capital gains for financial reporting purposes. Differences may be permanent or temporary. Permanent differences are reclassified among capital accounts in the financial statements to reflect their tax character. Temporary differences arise when certain items of income, expense, gain, or loss are recognized in different periods for financial statement and tax purposes; these differences will reverse at some time in the future. Differences in classification may also result from the treatment of short-term gains as ordinary income for tax purposes.
22
Mid-Cap Growth Fund
The fund used a tax accounting practice to treat a portion of the price of capital shares redeemed during the year as distributions from net investment income and realized capital gains. Accordingly, the fund has reclassified $422,000 from overdistributed net investment income, and $25,260,000 from accumulated net realized gains, to paid-in capital.
For tax purposes, at October 31, 2013, the fund had $87,093,000 of ordinary income and $191,469,000 of long-term capital gains available for distribution.
At October 31, 2013, the cost of investment securities for tax purposes was $2,235,938,000. Net unrealized appreciation of investment securities for tax purposes was $646,521,000, consisting of unrealized gains of $671,167,000 on securities that had risen in value since their purchase and $24,646,000 in unrealized losses on securities that had fallen in value since their purchase.
H. During the year ended October 31, 2013, the fund purchased $2,020,161,000 of investment securities and sold $1,952,966,000 of investment securities, other than temporary cash investments.
I. Capital shares issued and redeemed were:
| | |
| | Year Ended October 31, |
| | 2013 | 2012 |
| | Shares | Shares |
| | (000) | (000) |
| Issued | 23,286 | 25,159 |
| Issued in Lieu of Cash Distributions | 6,078 | 1,898 |
| Redeemed | (20,687) | (18,416) |
| Net Increase (Decrease) in Shares Outstanding | 8,677 | 8,641 |
J. Management has determined that no material events or transactions occurred subsequent to October 31, 2013, that would require recognition or disclosure in these financial statements.
23
Report of Independent Registered
Public Accounting Firm
To the Trustees of Vanguard Whitehall Funds and the Shareholders of Vanguard Mid-Cap Growth Fund:
In our opinion, the accompanying statement of net assets and the related statements of operations and of changes in net assets and the financial highlights present fairly, in all material respects, the financial position of Vanguard Mid-Cap Growth Fund (constituting a separate portfolio of Vanguard Whitehall Funds, hereafter referred to as the “Fund”) at October 31, 2013, the results of its operations for the year then ended, the changes in its net assets for each of the two years in the period then ended, and the financial highlights for each of the five years in the period then ended, in conformity with accounting principles generally accepted in the United States of America. These financial statements and financial highlights (hereafter referred to as “financial statements”) are the responsibility of the Fund’s management; our responsibility is to express an opinion on these financial statements based on our audits. We conducted our audits of these financial statements in accordance with the standards of the Public Company Accounting Oversight Board (United States). Those standards require that we plan and perform the audit to obtain reasonable assurance about whether the financial statements are free of material misstatement. An audit includes examining, on a test basis, evidence supporting the amounts and disclosures in the financial statements, assessing the accounting principles used and significant estimates made by management, and evaluating the overall financial statement presentation. We believe that our audits, which included confirmation of securities at October 31, 2013 by correspondence with the custodian and broker and by agreement to the underlying ownership records of the transfer agent, provide a reasonable basis for our opinion.
/s/PricewaterhouseCoopers LLP
Philadelphia, Pennsylvania
December 12, 2013
Special 2013 tax information (unaudited) for Vanguard Mid-Cap Growth Fund
This information for the fiscal year ended October 31, 2013, is included pursuant to provisions of the
Internal Revenue Code.
The fund distributed $103,658,000 as capital gain dividends (from net long-term capital gains) to
shareholders during the fiscal year .
The fund distributed $16,687,000 of qualified dividend income to shareholders during the fiscal year.
For corporate shareholders, 15.7% of investment income (dividend income plus short-term gains,
if any) qualifies for the dividends-received deduction.
24
Your Fund’s After-Tax Returns
This table presents returns for your fund both before and after taxes. The after-tax returns are shown in two ways: (1) assuming that an investor owned the fund during the entire period and paid taxes on the fund’s distributions, and (2) assuming that an investor paid taxes on the fund’s distributions and sold all shares at the end of each period.
Calculations are based on the highest individual federal income tax and capital gains tax rates in effect at the times of the distributions and the hypothetical sales. State and local taxes were not considered. After-tax returns reflect any qualified dividend income, using actual prior-year figures and estimates for 2013. (In the example, returns after the sale of fund shares may be higher than those assuming no sale. This occurs when the sale would have produced a capital loss. The calculation assumes that the investor received a tax deduction for the loss.)
Please note that your actual after-tax returns will depend on your tax situation and may differ from those shown. Also note that if you own the fund in a tax-deferred account, such as an individual retirement account or a 401(k) plan, this information does not apply to you. Such accounts are not subject to current taxes.
Finally, keep in mind that a fund’s performance—whether before or after taxes—does not guarantee future results.
| | | |
| Average Annual Total Returns: Mid-Cap Growth Fund | | | |
| Periods Ended October 31, 2013 | | | |
| | One | Five | Ten |
| | Year | Years | Years |
| Returns Before Taxes | 30.32% | 18.86% | 9.23% |
| Returns After Taxes on Distributions | 28.91 | 18.51 | 8.67 |
| Returns After Taxes on Distributions and Sale of Fund Shares | 18.46 | 15.36 | 7.52 |
25
About Your Fund’s Expenses
As a shareholder of the fund, you incur ongoing costs, which include costs for portfolio management, administrative services, and shareholder reports (like this one), among others. Operating expenses, which are deducted from a fund’s gross income, directly reduce the investment return of the fund.
A fund’s expenses are expressed as a percentage of its average net assets. This figure is known as the expense ratio. The following examples are intended to help you understand the ongoing costs (in dollars) of investing in your fund and to compare these costs with those of other mutual funds. The examples are based on an investment of $1,000 made at the beginning of the period shown and held for the entire period.
The accompanying table illustrates your fund’s costs in two ways:
• Based on actual fund return. This section helps you to estimate the actual expenses that you paid over the period. The ”Ending Account Value“ shown is derived from the fund‘s actual return, and the third column shows the dollar amount that would have been paid by an investor who started with $1,000 in the fund. You may use the information here, together with the amount you invested, to estimate the expenses that you paid over the period.
To do so, simply divide your account value by $1,000 (for example, an $8,600 account value divided by $1,000 = 8.6), then multiply the result by the number given for your fund under the heading ”Expenses Paid During Period.“
• Based on hypothetical 5% yearly return. This section is intended to help you compare your fund‘s costs with those of other mutual funds. It assumes that the fund had a yearly return of 5% before expenses, but that the expense ratio is unchanged. In this case—because the return used is not the fund’s actual return—the results do not apply to your investment. The example is useful in making comparisons because the Securities and Exchange Commission requires all mutual funds to calculate expenses based on a 5% return. You can assess your fund’s costs by comparing this hypothetical example with the hypothetical examples that appear in shareholder reports of other funds.
Note that the expenses shown in the table are meant to highlight and help you compare ongoing costs only and do not reflect transaction costs incurred by the fund for buying and selling securities. Further, the expenses do not include any purchase, redemption, or account service fees described in the fund prospectus. If such fees were applied to your account, your costs would be higher. Your fund does not carry a “sales load.”
The calculations assume no shares were bought or sold during the period. Your actual costs may have been higher or lower, depending on the amount of your investment and the timing of any purchases or redemptions.
You can find more information about the fund’s expenses, including annual expense ratios, in the Financial Statements section of this report. For additional information on operating expenses and other shareholder costs, please refer to your fund’s current prospectus.
26
| | | |
| Six Months Ended October 31, 2013 | | | |
| | Beginning | Ending | Expenses |
| | Account Value | Account Value | Paid During |
| Mid-Cap Growth Fund | 4/30/2013 | 10/31/2013 | Period |
| Based on Actual Fund Return | $1,000.00 | $1,134.04 | $2.64 |
| Based on Hypothetical 5% Yearly Return | 1,000.00 | 1,022.74 | 2.50 |
The calculations are based on expenses incurred in the most recent six-month period. The fund’s annualized six-month expense ratio for that
period is 0.49%. The dollar amounts shown as “Expenses Paid” are equal to the annualized expense ratio multiplied by the average account
value over the period, multiplied by the number of days in the most recent six-month period, then divided by the number of days in the most
recent 12-month period.
27
Glossary
30-Day SEC Yield. A fund’s 30-day SEC yield is derived using a formula specified by the U.S. Securities and Exchange Commission. Under the formula, data related to the fund’s security holdings in the previous 30 days are used to calculate the fund’s hypothetical net income for that period, which is then annualized and divided by the fund’s estimated average net assets over the calculation period. For the purposes of this calculation, a security’s income is based on its current market yield to maturity (for bonds), its actual income (for asset-backed securities), or its projected dividend yield (for stocks). Because the SEC yield represents hypothetical annualized income, it will differ—at times significantly—from the fund’s actual experience. As a result, the fund’s income distributions may be higher or lower than implied by the SEC yield.
Beta. A measure of the magnitude of a fund’s past share-price fluctuations in relation to the ups and downs of a given market index. The index is assigned a beta of 1.00. Compared with a given index, a fund with a beta of 1.20 typically would have seen its share price rise or fall by 12% when the index rose or fell by 10%. For this report, beta is based on returns over the past 36 months for both the fund and the index. Note that a fund’s beta should be reviewed in conjunction with its R-squared (see definition). The lower the R-squared, the less correlation there is between the fund and the index, and the less reliable beta is as an indicator of volatility.
Dividend Yield. Dividend income earned by stocks, expressed as a percentage of the aggregate market value (or of net asset value, for a fund). The yield is determined by dividing the amount of the annual dividends by the aggregate value (or net asset value) at the end of the period. For a fund, the dividend yield is based solely on stock holdings and does not include any income produced by other investments.
Earnings Growth Rate. The average annual rate of growth in earnings over the past five years for the stocks now in a fund.
Equity Exposure. A measure that reflects a fund’s investments in stocks and stock futures. Any holdings in short-term reserves are excluded.
Expense Ratio. A fund’s total annual operating expenses expressed as a percentage of the fund’s average net assets. The expense ratio includes management and administrative expenses, but does not include the transaction costs of buying and selling portfolio securities.
Foreign Holdings. The percentage of a fund represented by securities or depositary receipts of companies based outside the United States.
Inception Date. The date on which the assets of a fund (or one of its share classes) are first invested in accordance with the fund’s investment objective. For funds with a subscription period, the inception date is the day after that period ends. Investment performance is measured from the inception date.
Median Market Cap. An indicator of the size of companies in which a fund invests; the midpoint of market capitalization (market price x shares outstanding) of a fund’s stocks, weighted by the proportion of the fund’s assets invested in each stock. Stocks representing half of the fund’s assets have market capitalizations above the median, and the rest are below it.
Price/Book Ratio. The share price of a stock divided by its net worth, or book value, per share. For a fund, the weighted average price/book ratio of the stocks it holds.
28
Price/Earnings Ratio. The ratio of a stock’s current price to its per-share earnings over the past year. For a fund, the weighted average P/E of the stocks it holds. P/E is an indicator of market expectations about corporate prospects; the higher the P/E, the greater the expectations for a company’s future growth.
R-Squared. A measure of how much of a fund’s past returns can be explained by the returns from the market in general, as measured by a given index. If a fund’s total returns were precisely synchronized with an index’s returns, its R-squared would be 1.00. If the fund’s returns bore no relationship to the index’s returns, its R-squared would be 0. For this report, R-squared is based on returns over the past 36 months for both the fund and the index.
Return on Equity. The annual average rate of return generated by a company during the past five years for each dollar of shareholder’s equity (net income divided by shareholder’s equity). For a fund, the weighted average return on equity for the companies whose stocks it holds.
Short-Term Reserves. The percentage of a fund invested in highly liquid, short-term securities that can be readily converted to cash.
Turnover Rate. An indication of the fund’s trading activity. Funds with high turnover rates incur higher transaction costs and may be more likely to distribute capital gains (which may be taxable to investors). The turnover rate excludes in-kind transactions, which have minimal impact on costs.
29
This page intentionally left blank.
This page intentionally left blank.
The People Who Govern Your Fund
The trustees of your mutual fund are there to see that the fund is operated and managed in your best interests since, as a shareholder, you are a part owner of the fund. Your fund’s trustees also serve on the board of directors of The Vanguard Group, Inc., which is owned by the Vanguard funds and provides services to them on an at-cost basis.
A majority of Vanguard’s board members are independent, meaning that they have no affiliation with Vanguard or the funds they oversee, apart from the sizable personal investments they have made as private individuals. The independent board members have distinguished backgrounds in business, academia, and public service. Each of the trustees and executive officers oversees 181 Vanguard funds.
The following table provides information for each trustee and executive officer of the fund. More information about the trustees is in the Statement of Additional Information, which can be obtained, without charge, by contacting Vanguard at 800-662-7447, or online at vanguard.com.
| |
| InterestedTrustee1 | and Delphi Automotive LLP (automotive components); |
| | Senior Advisor at New Mountain Capital; Trustee of |
| F. William McNabb III | The Conference Board. |
| Born 1957. Trustee Since July 2009. Chairman of the | |
| Board. Principal Occupation(s) During the Past Five | Amy Gutmann |
| Years: Chairman of the Board of The Vanguard Group, | Born 1949. Trustee Since June 2006. Principal |
| Inc., and of each of the investment companies served | Occupation(s) During the Past Five Years: President |
| by The Vanguard Group, since January 2010; Director | of the University of Pennsylvania; Christopher H. |
| of The Vanguard Group since 2008; Chief Executive | Browne Distinguished Professor of Political Science |
| Officer and President of The Vanguard Group and of | in the School of Arts and Sciences with secondary |
| each of the investment companies served by The | appointments at the Annenberg School for |
| Vanguard Group since 2008; Director of Vanguard | Communication and the Graduate School of Education |
| Marketing Corporation; Managing Director of The | of the University of Pennsylvania; Member of the |
| Vanguard Group (1995–2008). | National Commission on the Humanities and Social |
| | Sciences; Trustee of Carnegie Corporation of New |
| IndependentTrustees | York and of the National Constitution Center; Chair |
| of the U.S. Presidential Commission for the Study |
| Emerson U. Fullwood | of Bioethical Issues. |
| Born 1948. Trustee Since January 2008. Principal | |
| Occupation(s) During the Past Five Years: Executive | JoAnn Heffernan Heisen |
| Chief Staff and Marketing Officer for North America | Born 1950. Trustee Since July 1998. Principal |
| and Corporate Vice President (retired 2008) of Xerox | Occupation(s) During the Past Five Years: Corporate |
| Corporation (document management products and | Vice President and Chief Global Diversity Officer |
| services); Executive in Residence and 2010 | (retired 2008) and Member of the Executive |
| Distinguished Minett Professor at the Rochester | Committee (1997–2008) of Johnson & Johnson |
| Institute of Technology; Director of SPX Corporation | (pharmaceuticals/medical devices/consumer |
| (multi-industry manufacturing), the United Way of | products); Director of Skytop Lodge Corporation |
| Rochester, Amerigroup Corporation (managed health | (hotels), the University Medical Center at Princeton, |
| care), the University of Rochester Medical Center, | the Robert Wood Johnson Foundation, and the Center |
| Monroe Community College Foundation, and North | for Talent Innovation; Member of the Advisory Board |
| Carolina A&T University. | of the Maxwell School of Citizenship and Public Affairs |
| | at Syracuse University. |
| |
| Rajiv L. Gupta | F. Joseph Loughrey |
| Born 1945. Trustee Since December 2001.2 | Born 1949. Trustee Since October 2009. Principal |
| Principal Occupation(s) During the Past Five Years: | Occupation(s) During the Past Five Years: President |
| Chairman and Chief Executive Officer (retired 2009) | and Chief Operating Officer (retired 2009) of Cummins |
| and President (2006–2008) of Rohm and Haas Co. | Inc. (industrial machinery); Chairman of the Board of |
| (chemicals); Director of Tyco International, Ltd. | Hillenbrand, Inc. (specialized consumer services) and |
| (diversified manufacturing and services), Hewlett- | of Oxfam America; Director of SKF AB (industrial |
| Packard Co. (electronic computer manufacturing), | |
| | |
| machinery), Hyster-Yale Materials Handling, Inc. | Executive Officers | |
| (forklift trucks), and the Lumina Foundation for | | |
| Education; Member of the Advisory Council for the | Glenn Booraem | |
| College of Arts and Letters and of the Advisory Board | Born 1967. Controller Since July 2010. Principal |
| to the Kellogg Institute for International Studies, both | Occupation(s) During the Past Five Years: Principal |
| at the University of Notre Dame. | of The Vanguard Group, Inc.; Controller of each of |
| | the investment companies served by The Vanguard |
| Mark Loughridge | Group; Assistant Controller of each of the investment |
| Born 1953. Trustee Since March 2012. Principal | companies served by The Vanguard Group (2001–2010). |
| Occupation(s) During the Past Five Years: Senior Vice | | |
| President and Chief Financial Officer at IBM (information | Thomas J. Higgins | |
| technology services); Fiduciary Member of IBM’s | Born 1957. Chief Financial Officer Since September |
| Retirement Plan Committee. | 2008. Principal Occupation(s) During the Past Five |
| | Years: Principal of The Vanguard Group, Inc.; Chief |
| Scott C. Malpass | Financial Officer of each of the investment companies |
| Born 1962. Trustee Since March 2012. Principal | served by The Vanguard Group; Treasurer of each of |
| Occupation(s) During the Past Five Years: Chief | the investment companies served by The Vanguard |
| Investment Officer and Vice President at the University | Group (1998–2008). | |
| of Notre Dame; Assistant Professor of Finance at the | | |
| Mendoza College of Business at Notre Dame; Member | Kathryn J. Hyatt | |
| of the Notre Dame 403(b) Investment Committee; | Born 1955. Treasurer Since November 2008. Principal |
| Director of TIFF Advisory Services, Inc. (investment | Occupation(s) During the Past Five Years: Principal of |
| advisor); Member of the Investment Advisory | The Vanguard Group, Inc.; Treasurer of each of the |
| Committees of the Financial Industry Regulatory | investment companies served by The Vanguard |
| Authority (FINRA) and of Major League Baseball. | Group; Assistant Treasurer of each of the investment |
| | companies served by The Vanguard Group (1988–2008). |
| André F. Perold | | |
| Born 1952. Trustee Since December 2004. Principal | Heidi Stam | |
| Occupation(s) During the Past Five Years: George | Born 1956. Secretary Since July 2005. Principal |
| Gund Professor of Finance and Banking at the Harvard | Occupation(s) During the Past Five Years: Managing |
| Business School (retired 2011); Chief Investment | Director of The Vanguard Group, Inc.; General Counsel |
| Officer and Managing Partner of HighVista Strategies | of The Vanguard Group; Secretary of The Vanguard |
| LLC (private investment firm); Director of Rand | Group and of each of the investment companies |
| Merchant Bank; Overseer of the Museum of Fine | served by The Vanguard Group; Director and Senior |
| Arts Boston. | Vice President of Vanguard Marketing Corporation. |
| |
| Alfred M. Rankin, Jr. | | |
| | Vanguard Senior ManagementTeam |
| Born 1941. Trustee Since January 1993. Principal | | |
| Occupation(s) During the Past Five Years: Chairman, | Mortimer J. Buckley | Chris D. McIsaac |
| President, and Chief Executive Officer of NACCO | Kathleen C. Gubanich | Michael S. Miller |
| Industries, Inc. (housewares/lignite) and of Hyster-Yale | Paul A. Heller | James M. Norris |
| Materials Handling, Inc. (forklift trucks); Director of | Martha G. King | Glenn W. Reed |
| the National Association of Manufacturers; Chairman | John T. Marcante | |
| of the Board of University Hospitals of Cleveland; | | |
| Advisory Chairman of the Board of The Cleveland | | |
| Museum of Art. | Chairman Emeritus and Senior Advisor |
| | |
| | John J. Brennan | |
| Peter F. Volanakis | Chairman, 1996–2009 | |
| | Chief Executive Officer and President, 1996–2008 |
| Born 1955. Trustee Since July 2009. Principal | | |
| Occupation(s) During the Past Five Years: President | |
| and Chief Operating Officer (retired 2010) of Corning | | |
| Incorporated (communications equipment); Director | Founder | |
| of SPX Corporation (multi-industry manufacturing); | | |
| Overseer of the Amos Tuck School of Business | John C. Bogle | |
| Administration at Dartmouth College; Advisor to the | | |
| Norris Cotton Cancer Center. | Chairman and Chief Executive Officer, 1974–1996 |
1 Mr. McNabb is considered an “interested person,” as defined in the Investment Company Act of 1940, because he is an officer of the
Vanguard funds.
2 December 2002 for Vanguard Equity Income Fund, Vanguard Growth Equity Fund, the Vanguard Municipal Bond Funds, and the Vanguard
State Tax-Exempt Funds.
|  |
| | P.O. Box 2600 |
| | Valley Forge, PA 19482-2600 |
| |
| |
| |
| Connect with Vanguard® > vanguard.com | |
| |
| |
| |
| Fund Information > 800-662-7447 | CFA® is a trademark owned by CFA Institute. |
| Direct Investor Account Services > 800-662-2739 | |
| Institutional Investor Services > 800-523-1036 | |
| Text Telephone for People | |
| With Hearing Impairment > 800-749-7273 | |
| |
| This material may be used in conjunction | |
| with the offering of shares of any Vanguard | |
| fund only if preceded or accompanied by | |
| the fund’s current prospectus. | |
| |
| All comparative mutual fund data are from Lipper, a | |
| Thomson Reuters Company, or Morningstar, Inc., unless | |
| otherwise noted. | |
| |
| You can obtain a free copy of Vanguard’s proxy voting | |
| guidelines by visiting vanguard.com/proxyreporting or by | |
| calling Vanguard at 800-662-2739. The guidelines are | |
| also available from the SEC’s website, sec.gov. In | |
| addition, you may obtain a free report on how your fund | |
| voted the proxies for securities it owned during the 12 | |
| months ended June 30. To get the report, visit either | |
| vanguard.com/proxyreporting or sec.gov. | |
| |
| You can review and copy information about your fund at | |
| the SEC’s Public Reference Room in Washington, D.C. To | |
| find out more about this public service, call the SEC at | |
| 202-551-8090. Information about your fund is also | |
| available on the SEC’s website, and you can receive | |
| copies of this information, for a fee, by sending a | |
| request in either of two ways: via e-mail addressed to | |
| publicinfo@sec.gov or via regular mail addressed to the | |
| Public Reference Section, Securities and Exchange | |
| Commission, Washington, DC 20549-1520. | |
| |
| | © 2013 The Vanguard Group, Inc. |
| | All rights reserved. |
| | Vanguard Marketing Corporation, Distributor. |
| |
| | Q3010 122013 |

Annual Report | October 31, 2013
Vanguard International Explorer™ Fund

Vanguard’s Principles for Investing Success
We want to give you the best chance of investment success. These principles, grounded in Vanguard’s research and experience, can put you on the right path.
Goals. Create clear, appropriate investment goals.
Balance. Develop a suitable asset allocation using broadly diversified funds. Cost. Minimize cost.
Discipline. Maintain perspective and long-term discipline.
A single theme unites these principles: Focus on the things you can control.
We believe there is no wiser course for any investor.
| |
| Contents | |
| Your Fund’s Total Returns. | 1 |
| Chairman’s Letter. | 2 |
| Advisors’ Report. | 8 |
| Fund Profile. | 12 |
| Performance Summary. | 14 |
| Financial Statements. | 16 |
| Your Fund’s After-Tax Returns. | 33 |
| About Your Fund’s Expenses. | 34 |
| Trustees Approve Advisory Arrangements. | 36 |
| Glossary. | 38 |
Please note: The opinions expressed in this report are just that—informed opinions. They should not be considered promises or advice. Also, please keep in mind that the information and opinions cover the period through the date on the front of this report. Of course, the risks of investing in your fund are spelled out in the prospectus.
See the Glossary for definitions of investment terms used in this report.
About the cover: The ship's wheel represents leadership and guidance, essential qualities in navigating difficult seas. This one is a replica based on an 18th-century British vessel. The HMS Vanguard, another ship of that era, served as the flagship for Admiral Horatio Nelson when he defeated a French fleet at the Battle of the Nile.
Your Fund’s Total Returns
| |
| Fiscal Year Ended October 31, 2013 | |
| |
| | Total |
| | Returns |
| Vanguard International Explorer Fund | 31.13% |
| S&P EPAC SmallCap Index | 31.14 |
| International Small-Cap Funds Average | 29.42 |
| International Small-Cap Funds Average: Derived from data provided by Lipper, a Thomson Reuters Company. |
| | | | |
| Your Fund’s Performance at a Glance | | | | |
| October 31, 2012, Through October 31, 2013 | | | | |
| |
| | | | Distributions Per Share |
| | Starting | Ending | | |
| | Share | Share | Income | Capital |
| | Price | Price | Dividends | Gains |
| Vanguard International Explorer Fund | $14.50 | $18.50 | $0.405 | $0.000 |
1

Chairman’s Letter
Dear Shareholder,
International stocks turned in their strongest performance in five years for the fiscal year ended October 31, 2013, as optimism took hold that better days are ahead for the global economy. Many established small-capitalization markets, including those in Germany, France, Switzerland, and the Netherlands, returned more than 35% as investors perceived brighter prospects for small companies.
Vanguard International Explorer Fund posted a return of about 31%, virtually identical to that of its benchmark, the Standard & Poor’s EPAC (Europe Pacific Asia Composite) SmallCap Index, and ahead of the average return of its peers.
The fund’s European holdings performed the best by far. Developed Pacific markets stocks did well, although those in the fund lagged those in the index. The U.S. dollar’s strength against the Japanese yen detracted from results for U.S.-based investors. The fund’s emerging markets small-cap portfolio posted modest gains.
If you own the fund in a taxable account, you may wish to review the information on after-tax returns later in this report.
2
Amid uncertainty, U.S. stocks found a path to strong returns
U.S. stocks faced several challenges en route to an impressive return of about 29% for the 12 months ended October 31. Investors’ growing appetite for risk drove the rise, as corporate profit growth, in general, wasn’t particularly tantalizing.
Although the end of the fiscal year was notable for the budget impasse that resulted in October’s 16-day partial federal government shutdown, the period as a whole was marked by uncertainty about Federal Reserve monetary policy and concern about the economy’s patchy growth. Vanguard’s chief economist, Joe Davis, recently noted that “as was the case at the start of the year, the U.S. economy continues to expand at a modest and uneven pace.”
The disparity between the performance of the U.S. economy and that of U.S. stocks may seem surprising—but Vanguard research has shown a weak relationship over the long term between a nation’s economic growth and its stock returns. (You can read more in The Outlook for Emerging Market Stocks in a Lower-Growth World, available at vanguard.com/research.)
Outside the United States, stocks returned about 20%. As reflected in the results for International Explorer, the developed
| | | |
| Market Barometer | | | |
| |
| | Average Annual Total Returns |
| | Periods Ended October 31, 2013 |
| | One | Three | Five |
| | Year | Years | Years |
| Stocks | | | |
| Russell 1000 Index (Large-caps) | 28.40% | 16.83% | 15.84% |
| Russell 2000 Index (Small-caps) | 36.28 | 17.69 | 17.04 |
| Russell 3000 Index (Broad U.S. market) | 28.99 | 16.89 | 15.94 |
| MSCI All Country World Index ex USA (International) | 20.29 | 6.04 | 12.48 |
| |
| Bonds | | | |
| Barclays U.S. Aggregate Bond Index (Broad taxable market) | -1.08% | 3.02% | 6.09% |
| Barclays Municipal Bond Index (Broad tax-exempt market) | -1.72 | 3.60 | 6.37 |
| Citigroup Three-Month U.S. Treasury Bill Index | 0.06 | 0.07 | 0.12 |
| |
| CPI | | | |
| Consumer Price Index | 0.96% | 2.21% | 1.52% |
3
markets of Europe and the Pacific region delivered robust gains, but emerging-market stocks failed to keep pace.
Bond returns sagged as investors kept a close eye on the Fed
With investors fretting over the Fed’s next move in its stimulative bond-buying program, bonds recorded negative results for the 12 months. The broad U.S. taxable bond market returned –1.08%. The yield of the 10-year Treasury note closed at 2.54%, down from 2.63% at September’s close but up from 1.69% at the end of the previous fiscal year. (Bond yields and prices move in opposite directions.) Municipal bonds returned –1.72%.
Outside the United States, bond markets (as measured by the Barclays Global Aggregate Index ex USD) returned –1.95%.
The Fed’s target for short-term interest rates remained at 0%–0.25%, severely limiting returns of money market funds and savings accounts.
Rebounding European stocks were the largest contributors
Vanguard International Explorer Fund notched gains during the fiscal year in all but a handful of countries. Its European holdings, which made up well over half its assets, were the chief source of its impressive performance. They returned
| | |
| Expense Ratios | | |
| Your Fund Compared With Its Peer Group | | |
| | | Peer Group |
| | Fund | Average |
| International Explorer Fund | 0.43% | 1.55% |
The fund expense ratio shown is from the prospectus dated February 22, 2013, and represents estimated costs for the current fiscal year. For
the fiscal year ended October 31, 2013, the fund’s expense ratio was 0.36%. This decrease from the estimated expense ratio reflects a
performance-based investment advisory fee adjustment. When the performance adjustment is positive, the fund’s expenses increase; when it
is negative, expenses decrease. The peer-group expense ratio is derived from data provided by Lipper, a Thomson Reuters Company, and
captures information through year-end 2012.
Peer group: International Small-Cap Funds.
4
about 45%, versus 39% for the benchmark’s European listings. United Kingdom stocks, composing the largest portion of the fund, contributed most to its bottom line, returning 41% compared with 39% for U.K. stocks in the index.
Other notable performers in the European portfolio included stocks in Germany, the Netherlands, and Scandinavia. Recognizing that stock markets of economies struggling with unprecedented challenges can rebound sharply, the fund’s advisors overweighted Ireland, and their selections reaped a 77% return, easily outpacing the benchmark’s Irish stocks. The fund’s holdings in France, Spain, and Belgium, though, trailed their benchmark counterparts.
The fund’s 20% advance in developed Pacific markets, although generous by historical standards, slightly trailed the index return for those markets. Japanese small-cap stocks, which dominate the region, returned 26% but lagged their index counterparts by 4 percentage points. Returns for U.S.-based investors would have been even higher had the yen’s value not fallen 19% versus the dollar as currency markets reacted to the Bank of Japan’s aggressive intervention in the nation’s fixed income market.
Among the other developed Pacific markets represented in the portfolio, Australia outperformed most, but selections there rose only a somewhat
| |
| Total Returns | |
| Ten Years Ended October 31, 2013 | |
| | Average |
| | Annual Return |
| International Explorer Fund | 10.45% |
| S&P EPAC SmallCap Index | 10.21 |
| International Small-Cap Funds Average | 10.10 |
International Small-Cap Funds Average: Derived from data provided by Lipper, a Thomson Reuters Company.
The figures shown represent past performance, which is not a guarantee of future results. (Current performance may be
lower or higher than the performance data cited. For performance data current to the most recent month-end, visit our
website at vanguard.com/performance.) Note, too, that both investment returns and principal value can fluctuate widely, so
an investor’s shares, when sold, could be worth more or less than their original cost.
5
tame 6%. A 9% decline in the value of the Australian dollar served as a brake for U.S. investors.
International Explorer’s emerging markets portfolio recorded more modest returns than its developed markets stocks but still beat its index counterpart. The advisors’ selections in Brazil and India were the most notable detractors.
For more information on the fund’s investment strategies and positioning, please see the Advisors’ Report that follows this letter.
The fund’s ten-year record spans a bear and two bulls
For the ten years ended October 31, 2013, Vanguard International Explorer Fund returned an average of 10.45% per year, slightly ahead of both its peer group average and benchmark index. This record is notable for a volatile decade that saw markets set record highs, plunge amid the global financial crisis, then recover most or all of their losses.
The fund outpaced the S&P EPAC SmallCap Index even though the index has no investment expenses—not an easy feat for an actively managed fund. The advisors are experienced in identifying promising small-company stocks that are expected to grow faster than the overall market. Also, the fund’s performance isn’t burdened by a high expense ratio that would detract from investors’ returns.
The past decade offered a lesson in perseverance. When stocks worldwide suffered big losses midway through the period, many investors couldn’t resist the temptation to pull out of the market. Those who kept their positions were rewarded. Of course, holding course was easier for those who had balanced their portfolios with tamer investments, including bonds and cash, which provided some cushioning when the stock markets fell. That’s why we like to remind our clients of the perils of overconcentrating in any one market or even one asset class.
Combining diversity of thought with low costs brings benefits
Investors sometimes ask why Vanguard uses a multi-advisor approach for many of its actively managed equity funds. Just as we recommend diversification within and across asset classes for an investor’s overall portfolio, we think significant benefits can accrue from using multiple advisory firms for a single fund: diversity of investment process and style, thought, and holdings.
These elements can lead to less risk and better results. Because not all investment managers invest the same way, their returns relative to the benchmark don’t move in lockstep.
As with many investment topics, however, there are some misconceptions about the benefits of a multi-manager approach. For example, it is often suggested that the
6
best ideas of the advisors are diluted when combined in one portfolio. Recent Vanguard research has found otherwise.
Conventional wisdom also suggests that multi-manager funds tend to be expensive. At Vanguard, this is not the case: Low costs are a hallmark of all our offerings. And Vanguard research indicates that low costs can contribute greatly to investing success, helping investors keep more of a portfolio’s return. (You can read more in Analyzing Multi-Manager Funds: Does Management Structure Affect Performance?, available at vanguard.com/research.)
As always, thank you for investing with Vanguard.
Sincerely,

F. William McNabb III
Chairman and Chief Executive Officer
November 18, 2013
Advisors’ Report
For the fiscal year ended October 31, 2013, Vanguard International Explorer Fund returned 31.13%. Your fund is managed by two independent advisors, a strategy that enhances its diversification by providing exposure to distinct yet complementary investment approaches. It is not uncommon for different advisors to have different views about individual securities or the broader investment environment.
The advisors, the amount and percentage of fund assets each manages, and brief descriptions of their investment strategies are presented in the table below. The advisors have also prepared a discussion of the investment environment that existed during the year and of how
their portfolio positioning reflects this assessment. These comments were prepared on November 20, 2013.
Schroder Investment Management
North America Inc.
Portfolio Manager:
Matthew F. Dobbs
Head of Global Small Companies
In a strong period for small-company returns, the Standard & Poor’s EPAC SmallCap Index rose 31.14%. Large-capitalization equities also posted solid results—26.0% as represented by the S&P EPAC Large/MidCap Index—but trailed their smaller peers by a significant margin.
| | | |
| Vanguard International Explorer Fund Investment Advisors |
| |
| | Fund Assets Managed | |
| Investment Advisor | % | $ Million | Investment Strategy |
| Schroder Investment | 89 | 2,027 | The advisor employs a fundamental investment |
| Management North America Inc. | | | approach that considers macroeconomic factors while |
| | | | focusing primarily on company-specific factors, |
| | | | including a company’s potential for long-term growth, |
| | | | financial condition, quality of management, and |
| | | | sensitivity to cyclical factors. The advisor also |
| | | | considers the relative value of a company’s securities |
| | | | compared with those of other companies and the |
| | | | market as a whole. |
| Wellington Management | 6 | 142 | The advisor employs a traditional, bottom-up approach |
| Company, LLP | | | that is opportunistic in nature, relying on global and |
| | | | regional research resources to identify both |
| | | | growth-oriented and neglected or misunderstood |
| | | | companies. |
| Cash Investments | 5 | 112 | These short-term reserves are invested by Vanguard in |
| | | | equity index products to simulate investment in stocks. |
| | | | Each advisor also may maintain a modest cash |
| | | | position. |
8
Investor sentiment was supported by generally favorable monetary conditions, including accommodative central bank policies in Europe and Japan and broadly strengthening leading indicators. Japanese asset prices responded to initial phases of aggressive easing by Prime Minister Shinzo Abe’s newly elected government, and relative calm in the Eurozone encouraged equity markets. Results were mixed in emerging markets and Asia excluding Japan. Export-sensitive sectors and markets performed respectably, but domestic-sector sentiment was weighed down by factors such as weaker trade terms for commodity-exposed markets, tighter liquidity, and caution among consumers and companies.
Europe contributed most to relative returns. In the United Kingdom, strong results in industrials such as SIG and WS Atkins, along with Photo-Me International in consumer discretionary, were assisted by gains in utilities (Telecom Plus) and information technology (CSR, whose stock rose on the sale of its mobile communications division to Samsung Electronics).
Key contributors from elsewhere in Europe included financials (Denmark’s Sydbank and Jyske Bank and three insurers: Switzerland’s Helvetia, the Netherlands’ Delta Lloyd, and Norway’s Storebrand) and materials (Ireland’s Smurfit Kappa, Switzerland’s Clariant, and Denmark’s Auriga Industries). Xing, a German business-networking platform, was notable in IT. Geographically, holdings in Ireland, Sweden, Norway, and Germany stood out.
Stock selection in Asia was more disappointing. Among Japanese companies, shortfalls in industrials (Glory, Asahi Diamond), IT (Capcom), and materials (Kureha) outweighed a solid contribution from financials (Tokai Tokyo Financial).
Our holdings elsewhere in Asia had a broadly neutral impact. Those in emerging markets such as Indonesia, India, Taiwan, and Thailand advanced in aggregate, but not remotely as much as the overall benchmark (which includes no emerging-market stocks). Relative returns in developed Asian markets were strong. Materials stocks such as New Zealand’s Fletcher Building added value, as did global exporters including South Korea’s Halla Visteon Climate Control (auto parts) and Hankook Tire and China’s Shenzhou International (textiles).
The portfolio remains well-diversified by stock, sector, and geography. We focus on stock-specific fundamentals, with a bias toward companies with superior and sustainable returns, good investment discipline, solid balance sheets, and shareholder-friendly management. During the fiscal year, we added to our U.K. allocation (and closed the period slightly overweighted) but remained underweight in the rest of Europe and in Japan. In Asia, we continue to favor emerging markets. By sector, we are underweight in financials, industrials, IT, consumer staples, and utilities but overweight in consumer cyclicals, materials, and telecommunications.
9
Wellington Management Company, llp
Portfolio Manager: Simon H. Thomas Senior Vice President and Equity Portfolio Manager International equities moved higher as encouraging data in China, a steadily improving U.S. economy, further evidence of recovery in Europe, and solid corporate earnings contributed to a broad-based rally. Accommodative statements from the European Central Bank and the Federal Reserve also increased investors’ appetite for risk. The Fed’s decision to hold off on tapering its bond-buying eased near-term concerns that the rally would be derailed by rapidly rising interest rates. Geopolitical fears about Syria dissipated somewhat in September, but market participants shifted their worries to dysfunction in Congress.
Our portfolio benefited from strong stock selection in financials, materials, and industrials. Sector allocation, largely a result of our bottom-up selection, was negative. Among regions, solid picks in Japan and emerging markets aided relative performance, although an underweight to Europe detracted.
Top relative contributors included Italy’s Safilo Group and Japan’s Kakaku.com and Hino Motors. Shares of Safilo Group, a maker of premium sunglasses, gained as the company reported higher-than-expected quarterly and fiscal year
earnings and paid down debt, indicating a successful turnaround. We sold the stock as it approached our target price. Product and price comparison site Kakaku.com rose on robust growth for Tabelog, its restaurant reservation and review site, which drew more fee-paying restaurants and premium members, partly because of the rise of smartphones. Although we reduced our holdings, we still like the company’s long-term growth prospects. Small-truck manufacturer Hino Motors outperformed as it gained market share and announced a midterm dividend during the first quarter of calendar 2013, and we eliminated our position.
The largest relative detractors included Norway’s Petroleum Geo-Services, Japan’s Benesse Holdings, and U.K.-based De La Rue. Shares of Petroleum Geo-Services fell amid concerns that sales and contract rates would be weak because of lower oil prices and fewer projects, and we trimmed our position. Benesse Holdings dropped as competition substantially cut into enrollment in its high-margin “cram schools.” Concerned that profitability would remain impaired, we sold our shares. De La Rue underperformed and reduced its earnings forecast because of pricing pressure in its printed banknotes business. We still hold the stock because we think the company will benefit from long-term growth in global demand.
10
Among sectors, we ended the period most overweighted in industrials, energy, and health care and most underweighted in IT, financials, utilities, and consumer staples. Among regions, we were most underweighted in Europe and most overweighted in Japan.
We continue to focus our research on individual companies. Our portfolio is a diversified mix of relatively inexpensive holdings with above-average growth, strong market positions, skilled management, and solid balance sheets. We believe they are well-positioned to perform across a range of economic scenarios.
11
International Explorer Fund
Fund Profile
As of October 31, 2013
| | | |
| Portfolio Characteristics | | |
| | | | MSCI |
| | | S&P | AC |
| | | EPAC | World |
| | | SmallCap | Index ex |
| | Fund | Index | USA |
| Number of Stocks | 319 | 3,194 | 1,813 |
| Median Market Cap | $2.0B | $2.0B | $34.5B |
| Price/Earnings Ratio | 21.0x | 23.9x | 17.4x |
| Price/Book Ratio | 1.8x | 1.5x | 1.7x |
| Return on Equity | 10.7% | 9.6% | 14.7% |
| Earnings Growth | | | |
| Rate | 8.6% | 6.3% | 6.8% |
| Dividend Yield | 2.1% | 2.3% | 2.9% |
| Turnover Rate | 36% | — | — |
| Ticker Symbol | VINEX | — | — |
| Expense Ratio1 | 0.43% | — | — |
| Short-Term Reserves | 3.0% | — | — |
| | | |
| Sector Diversification (% of equity exposure) |
| | | | MSCI |
| | | S&P | AC |
| | | EPAC | World |
| | | SmallCap | Index ex |
| | Fund | Index | USA |
| Consumer Discretionary 20.8% | 17.4% | 10.6% |
| Consumer Staples | 5.1 | 6.0 | 10.1 |
| Energy | 3.6 | 2.8 | 9.4 |
| Financials | 17.5 | 21.4 | 27.0 |
| Health Care | 7.3 | 6.3 | 7.7 |
| Industrials | 22.4 | 24.3 | 11.0 |
| Information Technology | 7.1 | 9.1 | 6.3 |
| Materials | 11.9 | 9.4 | 8.7 |
| Telecommunication | | | |
| Services | 3.2 | 1.2 | 5.8 |
| Utilities | 1.1 | 2.1 | 3.4 |
| | |
| Volatility Measures | | |
| | | MSCI |
| | S&P | AC |
| | EPAC | World |
| | SmallCap | Index ex |
| | Index | USA |
| R-Squared | 0.97 | 0.94 |
| Beta | 0.98 | 1.00 |
| These measures show the degree and timing of the fund’s fluctuations compared with the indexes over 36 months. |
| | |
| Ten Largest Holdings (% of total net assets) |
| Delta Lloyd NV | Life & Health | |
| | Insurance | 1.6% |
| Freenet AG | Wireless | |
| | Telecommunication | |
| | Services | 1.4 |
| Storebrand ASA | Life & Health | |
| | Insurance | 1.4 |
| Helvetia Holding AG | Multi-line Insurance | 1.4 |
| Smurfit Kappa Group plc Paper Packaging | 1.3 |
| Kuoni Reisen Holding | Hotels, Resorts & | |
| AG | Cruise Lines | 1.2 |
| Jyske Bank A/S | Diversified Banks | 1.2 |
| Groupe Eurotunnel SA | Highways & | |
| | Railtracks | 1.1 |
| Sydbank A/S | Diversified Banks | 1.1 |
| Hankook Tire Co. Ltd. | Tires & Rubber | 1.1 |
| Top Ten | | 12.8% |
| The holdings listed exclude any temporary cash investments and equity index products. |
Allocation by Region (% of equity exposure)
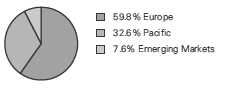
1 The expense ratio shown is from the prospectus dated February 22, 2013, and represents estimated costs for the current fiscal year. For the
fiscal year ended October 31, 2013, the expense ratio was 0.36%.
12
International Explorer Fund
| | | |
| Market Diversification (% of equity exposure) |
| | | S&P | MSCI |
| | | EPAC | AC World |
| | | SmallCap | Index ex |
| | Fund | Index | USA |
| Europe | | | |
| United Kingdom | 20.3% | 20.2% | 15.6% |
| Germany | 8.0 | 8.0 | 6.4 |
| Switzerland | 6.0 | 8.1 | 6.4 |
| France | 4.2 | 8.4 | 7.1 |
| Ireland | 4.1 | 0.2 | 0.3 |
| Italy | 4.0 | 2.4 | 1.7 |
| Denmark | 3.7 | 1.3 | 0.8 |
| Norway | 3.3 | 0.9 | 0.6 |
| Netherlands | 2.5 | 1.9 | 1.9 |
| Sweden | 1.7 | 2.9 | 2.3 |
| Austria | 1.5 | 0.3 | 0.2 |
| Other | 0.5 | 5.2 | 4.0 |
| Subtotal | 59.8% | 59.8% | 47.3% |
| Pacific | | | |
| Japan | 20.4% | 21.5% | 15.0% |
| Australia | 5.5 | 6.5 | 5.8 |
| South Korea | 2.3 | 4.3 | 3.4 |
| Singapore | 2.0 | 1.5 | 1.1 |
| Hong Kong | 1.6 | 2.2 | 2.1 |
| Other | 0.8 | 0.2 | 0.1 |
| Subtotal | 32.6% | 36.2% | 27.5% |
| Emerging Markets | | | |
| India | 2.4% | 0.0% | 1.3% |
| China | 2.1 | 0.5 | 4.0 |
| Taiwan | 1.1 | 0.0 | 2.4 |
| Other | 2.0 | 0.0 | 10.1 |
| Subtotal | 7.6% | 0.5% | 17.8% |
| North America | 0.0% | 0.2% | 7.1% |
| Middle East | 0.0% | 0.6% | 0.3% |
| Other | 0.0% | 2.7% | 0.0% |
13
International Explorer Fund
Performance Summary
All of the returns in this report represent past performance, which is not a guarantee of future results that may be achieved by the fund. (Current performance may be lower or higher than the performance data cited. For performance data current to the most recent month-end, visit our website at vanguard.com/performance.) Note, too, that both investment returns and principal value can fluctuate widely, so an investor’s shares, when sold, could be worth more or less than their original cost. The returns shown do not reflect taxes that a shareholder would pay on fund distributions or on the sale of fund shares.
Cumulative Performance: October 31, 2003, Through October 31, 2013
Initial Investment of $10,000
| | | | | |
| | | Average Annual Total Returns | |
| | | Periods Ended October 31, 2013 | |
| | | | | | Final Value |
| | | One | Five | Ten | of a $10,000 |
| | | Year | Years | Years | Investment |
| | International Explorer Fund* | 31.13% | 17.37% | 10.45% | $27,026 |
| •••••••• | S&P EPAC SmallCap Index | 31.14 | 17.01 | 10.21 | 26,445 |
| – – – – | International Small-Cap Funds | | | | |
| | Average | 29.42 | 18.65 | 10.10 | 26,163 |
| | MSCI All Country World Index ex | | | | |
| | USA | 20.80 | 12.99 | 8.95 | 23,566 |
| International Small-Cap Funds Average: Derived from data provided by Lipper, a Thomson Reuters Company. |
See Financial Highlights for dividend and capital gains information.
14
International Explorer Fund
Fiscal-Year Total Returns (%): October 31, 2003, Through October 31, 2013
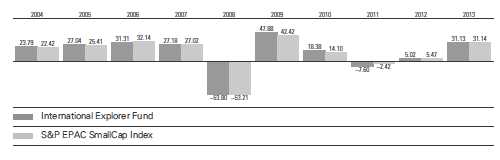
Average Annual Total Returns: Periods Ended September 30, 2013
This table presents returns through the latest calendar quarter—rather than through the end of the fiscal period.
Securities and Exchange Commission rules require that we provide this information.
| | | | |
| | Inception | One | Five | Ten |
| | Date | Year | Years | Years |
| International Explorer Fund | 11/4/1996 | 27.59% | 10.20% | 10.58% |
15
International Explorer Fund
Financial Statements
Statement of Net Assets
As of October 31, 2013
The fund reports a complete list of its holdings in regulatory filings four times in each fiscal year, at the quarter-ends. For the second and fourth fiscal quarters, the lists appear in the fund’s semiannual and annual reports to shareholders. For the first and third fiscal quarters, the fund files the lists with the Securities and Exchange Commission on Form N-Q. Shareholders can look up the fund’s Forms N-Q on the SEC’s website at sec.gov. Forms N-Q may also be reviewed and copied at the SEC’s Public Reference Room (see the back cover of this report for further information).
| | | |
| | | | Market |
| | | | Value |
| | | Shares | ($000) |
| Common Stocks (92.2%)1 | | |
| Australia (4.2%) | | |
| | Amcor Ltd. | 1,617,810 | 16,573 |
| | Computershare Ltd. | 1,596,703 | 16,204 |
| | Mirvac Group | 9,338,318 | 15,352 |
| | Ansell Ltd. | 713,465 | 13,150 |
| | Iluka Resources Ltd. | 1,285,696 | 12,480 |
| | Incitec Pivot Ltd. | 3,205,064 | 8,064 |
| | PanAust Ltd. | 2,114,958 | 4,014 |
| *,^ | Mesoblast Ltd. | 617,926 | 3,849 |
| | Domino’s Pizza | | |
| | Enterprises Ltd. | 95,841 | 1,414 |
| ^ | SAI Global Ltd. | 296,047 | 1,150 |
| * | Karoon Gas Australia Ltd. | 215,540 | 903 |
| | Nufarm Ltd. | 182,896 | 843 |
| | Tox Free Solutions Ltd. | 261,266 | 815 |
| * | Transpacific Industries | | |
| | Group Ltd. | 743,910 | 805 |
| | Seek Ltd. | 40,461 | 497 |
| | | | 96,113 |
| Austria (1.4%) | | |
| ^ | Mayr Melnhof Karton AG | 125,739 | 14,022 |
| | Rosenbauer | | |
| | International AG | 92,000 | 7,435 |
| | Andritz AG | 80,439 | 4,954 |
| | Kapsch TrafficCom AG | 70,000 | 3,778 |
| | Schoeller-Bleckmann | | |
| | Oilfield Equipment AG | 12,024 | 1,387 |
| | Zumtobel AG | 64,781 | 1,156 |
| | | | 32,732 |
| Belgium (0.1%) | | |
| | D’ieteren SA/NV | 29,143 | 1,373 |
| | Cie d’Entreprises CFE | 10,328 | 817 |
| | | | 2,190 |
| Brazil (0.5%) | | |
| | BR Properties SA | 593,450 | 5,021 |
| | Cia Hering | 335,430 | 4,859 |
| * | Magazine Luiza SA | 221,600 | 942 |
| | | | 10,822 |
| | | |
| Canada (0.0%) | | |
| | Pacific Rubiales | | |
| | Energy Corp. | 28,700 | 594 |
| * | Niko Resources Ltd. | 6,173 | 20 |
| | | | 614 |
| China (2.0%) | | |
| ^ | Baoxin Auto Group Ltd. | 9,677,000 | 9,970 |
| | Yuexiu Transport | | |
| | Infrastructure Ltd. | 18,546,000 | 9,757 |
| | Shenzhou International | | |
| | Group Holdings Ltd. | 2,766,000 | 9,537 |
| | Jiangsu Expressway | | |
| | Co. Ltd. | 5,732,000 | 7,221 |
| | Dah Chong Hong | | |
| | Holdings Ltd. | 6,320,000 | 5,365 |
| | Minth Group Ltd. | 1,032,000 | 2,159 |
| * | WuXi PharmaTech | | |
| | Cayman Inc. ADR | 37,600 | 1,100 |
| | Shanghai Fosun | | |
| | Pharmaceutical Group | | |
| | Co. Ltd. | 252,500 | 572 |
| | | | 45,681 |
| Denmark (3.5%) | | |
| * | Jyske Bank A/S | 480,000 | 27,139 |
| * | Sydbank A/S | 850,000 | 25,134 |
| * | Matas A/S | 539,139 | 13,595 |
| * | Auriga Industries Class B | 290,000 | 11,381 |
| | DSV A/S | 60,473 | 1,769 |
| | H Lundbeck A/S | 42,880 | 921 |
| | Rockwool International | | |
| | A/S Class B | 4,740 | 745 |
| | | | 80,684 |
| Finland (0.1%) | | |
| | F-Secure Oyj | 878,186 | 2,270 |
| | Tikkurila Oyj | 35,879 | 930 |
| | | | 3,200 |
| France (3.6%) | | |
| | Groupe Eurotunnel SA | 2,600,000 | 25,170 |
| | Medica SA | 650,000 | 16,703 |
16
International Explorer Fund
| | | |
| | | | Market |
| | | | Value |
| | | Shares | ($000) |
| | Saft Groupe SA | 420,000 | 13,318 |
| | Eurofins Scientific | 28,858 | 7,900 |
| | Lectra | 600,000 | 5,688 |
| | Naturex | 36,250 | 2,862 |
| | Wendel SA | 15,273 | 2,129 |
| * | Inside Secure SA | 669,300 | 2,056 |
| | Imerys SA | 23,633 | 1,896 |
| | Eurazeo SA | 21,979 | 1,660 |
| | AtoS | 17,230 | 1,469 |
| * | Groupe Fnac | 46,554 | 1,301 |
| | | | 82,152 |
| Germany (7.3%) | | |
| | Freenet AG | 1,250,000 | 32,469 |
| * | Tom Tailor Holding AG | 860,000 | 19,601 |
| * | SAF-Holland SA | 1,240,000 | 17,628 |
| | MTU Aero Engines AG | 174,827 | 17,436 |
| | XING AG | 160,000 | 16,135 |
| | Delticom AG | 290,000 | 15,294 |
| * | Tipp24 SE | 190,000 | 12,357 |
| | Sartorius AG Prior Pfd. | 80,000 | 8,432 |
| *,^ | Suss Microtec AG | 611,000 | 6,479 |
| | RIB Software AG | 590,000 | 5,257 |
| | STRATEC Biomedical AG | 92,802 | 3,963 |
| | VTG AG | 180,000 | 3,754 |
| | CANCOM SE | 50,000 | 1,917 |
| | Grenkeleasing AG | 14,425 | 1,427 |
| | DMG MORI SEIKI AG | 36,942 | 1,214 |
| | Rheinmetall AG | 16,543 | 1,023 |
| | ElringKlinger AG | 16,314 | 694 |
| | KUKA AG | 13,088 | 596 |
| ^ | Wacker Chemie AG | 5,707 | 536 |
| | | | 166,212 |
| Hong Kong (1.6%) | | |
| | Techtronic Industries Co. | 8,419,500 | 21,145 |
| | Yue Yuen Industrial | | |
| | Holdings Ltd. | 2,613,500 | 7,176 |
| | Johnson Electric | | |
| | Holdings Ltd. | 9,890,500 | 7,119 |
| | ASM Pacific | | |
| | Technology Ltd. | 64,800 | 625 |
| | | | 36,065 |
| India (2.3%) | | |
| | Idea Cellular Ltd. | 5,325,084 | 14,959 |
| * | Gujarat Pipavav Port Ltd. | 15,036,675 | 12,218 |
| | Shriram Transport | | |
| | Finance Co. Ltd. | 720,522 | 7,162 |
| | Apollo Hospitals | | |
| | Enterprise Ltd. | 470,010 | 6,942 |
| | McLeod Russel India Ltd. | 883,951 | 3,945 |
| | Multi Commodity | | |
| | Exchange of India Ltd. | 509,658 | 3,938 |
| | Ashok Leyland Ltd. | 9,984,208 | 2,791 |
| | | | 51,955 |
| | | |
| Indonesia (0.2%) | | |
| | Ciputra Property Tbk PT 73,359,500 | 5,121 |
| * | Matahari Department | | |
| | Store Tbk PT | 391,000 | 426 |
| | | | 5,547 |
| Ireland (3.9%) | | |
| | Smurfit Kappa Group plc | 1,250,000 | 30,258 |
| | Glanbia plc | 1,600,000 | 22,396 |
| * | Grafton Group plc | 1,600,000 | 15,197 |
| ^ | Irish Continental Group plc | 375,000 | 13,158 |
| | IFG Group plc | 3,312,005 | 6,281 |
| | Paddy Power plc | 30,453 | 2,481 |
| | | | 89,771 |
| Italy (3.8%) | | |
| | Prysmian SPA | 800,000 | 19,542 |
| | Amplifon SPA | 3,200,000 | 17,060 |
| * | Sorin SPA | 5,000,000 | 13,775 |
| ^ | Maire Tecnimont SPA | 4,700,000 | 9,424 |
| | Credito Emiliano SPA | 790,000 | 5,973 |
| | De’Longhi SPA | 373,289 | 5,765 |
| | Danieli & C Officine | | |
| | Meccaniche SPA | 190,000 | 3,924 |
| | MARR SPA | 220,000 | 3,459 |
| | Cairo Communication SPA | 290,000 | 2,030 |
| | Azimut Holding SPA | 60,091 | 1,524 |
| | Pirelli & C. SPA | 87,024 | 1,224 |
| | Beni Stabili SPA | 1,451,309 | 994 |
| | Brunello Cucinelli SPA | 29,109 | 907 |
| | Salvatore Ferragamo SPA | 21,066 | 721 |
| | Immobiliare Grande | | |
| | Distribuzione | 375,394 | 448 |
| | | | 86,770 |
| Japan (18.3%) | | |
| | NEC Networks & System | | |
| | Integration Corp. | 731,000 | 18,406 |
| | Tokai Tokyo Financial | | |
| | Holdings Inc. | 2,151,200 | 18,044 |
| | Nichi-iko Pharmaceutical | | |
| | Co. Ltd. | 607,900 | 15,155 |
| | Aica Kogyo Co. Ltd. | 714,300 | 14,623 |
| | Nippon Soda Co. Ltd. | 2,351,000 | 14,403 |
| | Arcs Co. Ltd. | 731,400 | 13,709 |
| | Nitta Corp. | 639,300 | 13,465 |
| | Nihon Parkerizing Co. Ltd. | 678,000 | 13,245 |
| | Daibiru Corp. | 992,500 | 12,648 |
| ^ | Kuroda Electric Co. Ltd. | 890,900 | 12,480 |
| | Musashi Seimitsu Industry | | |
| | Co. Ltd. | 509,700 | 12,028 |
| | Hitachi High-Technologies | | |
| | Corp. | 517,800 | 11,909 |
| | JSP Corp. | 732,000 | 11,644 |
| | Eagle Industry Co. Ltd. | 678,000 | 10,896 |
| | Kissei Pharmaceutical | | |
| | Co. Ltd. | 466,500 | 10,799 |
17
International Explorer Fund
| | | |
| | | | Market |
| | | | Value |
| | | Shares | ($000) |
| | Koito Manufacturing | | |
| | Co. Ltd. | 585,000 | 10,649 |
| | Trusco Nakayama Corp. | 486,800 | 10,364 |
| | Kureha Corp. | 2,619,000 | 10,100 |
| | Plenus Co. Ltd. | 444,200 | 10,076 |
| | Asahi Diamond Industrial | | |
| | Co. Ltd. | 1,032,000 | 10,018 |
| | Lintec Corp. | 482,300 | 10,003 |
| | Tsuruha Holdings Inc. | 109,200 | 9,914 |
| | Unipres Corp. | 470,600 | 9,496 |
| | Nabtesco Corp. | 362,700 | 8,853 |
| | Mitsui Sugar Co. Ltd. | 2,438,000 | 8,749 |
| | Modec Inc. | 285,000 | 8,641 |
| | Takasago International | | |
| | Corp. | 1,495,000 | 8,312 |
| | Sumitomo Real Estate | | |
| | Sales Co. Ltd. | 243,000 | 7,956 |
| | Hitachi Transport | | |
| | System Ltd. | 484,500 | 7,683 |
| | Glory Ltd. | 261,200 | 6,477 |
| | Tsutsumi Jewelry Co. Ltd. | 265,500 | 6,469 |
| | Yushin Precision | | |
| | Equipment Co. Ltd. | 304,400 | 6,172 |
| ^ | Tsumura & Co. | 116,200 | 3,652 |
| | Icom Inc. | 130,500 | 3,013 |
| | Shinko Plantech Co. Ltd. | 355,400 | 2,869 |
| | Obara Group Inc. | 85,700 | 2,168 |
| | Nippon Thompson Co. Ltd. | 349,000 | 1,900 |
| | Mitsubishi UFJ Lease | | |
| | & Finance Co. Ltd. | 329,600 | 1,864 |
| | Yamato Kogyo Co. Ltd. | 49,500 | 1,835 |
| | SCSK Corp. | 69,900 | 1,772 |
| | Nafco Co. Ltd. | 121,200 | 1,730 |
| | Amada Co. Ltd. | 189,000 | 1,626 |
| | Shinsei Bank Ltd. | 692,000 | 1,620 |
| | Zenkoku Hosho Co. Ltd. | 34,000 | 1,463 |
| | Hoshizaki Electric Co. Ltd. | 37,800 | 1,385 |
| | DMG Mori Seiki Co. Ltd. | 79,400 | 1,288 |
| | Fujikura Kasei Co. Ltd. | 227,000 | 1,238 |
| | Hitachi Metals Ltd. | 89,000 | 1,198 |
| ^ | Zuiko Corp. | 18,300 | 1,197 |
| | Shionogi & Co. Ltd. | 53,000 | 1,173 |
| | Nikkiso Co. Ltd. | 94,000 | 1,163 |
| | IHI Corp. | 273,000 | 1,156 |
| | GLP J-Reit | 1,110 | 1,152 |
| ^ | Message Co. Ltd. | 40,400 | 1,140 |
| | Capcom Co. Ltd. | 60,800 | 1,137 |
| | Nippon Shinyaku Co. Ltd. | 65,000 | 1,120 |
| | Aeon Mall Co. Ltd. | 39,280 | 1,116 |
| | Pigeon Corp. | 21,500 | 1,109 |
| | Asahi Intecc Co. Ltd. | 16,000 | 1,076 |
| | Yokogawa Electric Corp. | 81,800 | 1,069 |
| | | |
| | Internet Initiative | | |
| | Japan Inc. | 37,700 | 1,058 |
| | Japan Petroleum | | |
| | Exploration Co. | 25,100 | 1,022 |
| | THK Co. Ltd. | 45,200 | 987 |
| | Don Quijote Co. Ltd. | 14,700 | 979 |
| ^ | GMO Payment | | |
| | Gateway Inc. | 28,800 | 952 |
| | Sega Sammy Holdings Inc. | 35,900 | 920 |
| | IBJ Leasing Co. Ltd. | 32,300 | 910 |
| | Mitsubishi Gas Chemical | | |
| | Co. Inc. | 110,000 | 899 |
| | Tokyo Tomin Bank Ltd. | 83,700 | 897 |
| | Ichiyoshi Securities | | |
| | Co. Ltd. | 62,700 | 893 |
| ^ | Yumeshin Holdings | | |
| | Co. Ltd. | 118,900 | 869 |
| ^ | Ferrotec Corp. | 167,900 | 826 |
| | Nihon Nohyaku Co. Ltd. | 68,000 | 815 |
| | Tenma Corp. | 62,100 | 804 |
| | Denyo Co. Ltd. | 59,000 | 727 |
| | Makino Milling Machine | | |
| | Co. Ltd. | 111,000 | 727 |
| | Yaskawa Electric Corp. | 56,000 | 725 |
| | Nifco Inc. | 27,200 | 725 |
| ^ | Digital Garage Inc. | 26,200 | 689 |
| | Sanwa Holdings Corp. | 101,000 | 647 |
| | Sanrio Co. Ltd. | 11,500 | 632 |
| | Kakaku.com Inc. | 31,400 | 607 |
| | Nippon Shokubai Co. Ltd. | 46,000 | 564 |
| | Shizuoka Gas Co. Ltd. | 75,400 | 499 |
| | Pocket Card Co. Ltd. | 53,700 | 466 |
| | Tamron Co. Ltd. | 16,400 | 350 |
| * | Jamco Corp. | 17,200 | 244 |
| | | | 418,048 |
| Luxembourg (0.1%) | | |
| * | Reinet Investments SCA | 64,053 | 1,211 |
| 2 | O’Key Group SA GDR | 72,848 | 862 |
| | | | 2,073 |
| Malaysia (0.3%) | | |
| | Bursa Malaysia Bhd. | 2,412,500 | 6,147 |
| |
| Mexico (0.1%) | | |
| | Fibra Uno Administracion | | |
| | SA de CV | 316,700 | 985 |
| | Grupo Sanborns SA de CV | 319,400 | 662 |
| | | | 1,647 |
| Netherlands (2.3%) | | |
| | Delta Lloyd NV | 1,769,753 | 37,522 |
| | Unit4 NV | 225,000 | 10,586 |
| * | PostNL NV | 502,283 | 2,624 |
| | USG People NV | 96,017 | 1,269 |
| | | | 52,001 |
18
International Explorer Fund
| | | |
| | | | Market |
| | | | Value |
| | | Shares | ($000) |
| New Zealand (0.8%) | | |
| | Fletcher Building Ltd. | 1,340,581 | 11,063 |
| | Chorus Ltd. | 3,413,513 | 7,471 |
| | | | 18,534 |
| Norway (3.2%) | | |
| * | Storebrand ASA | 4,950,000 | 32,009 |
| | Borregaard ASA | 4,990,000 | 21,962 |
| | Schibsted ASA | 126,000 | 7,700 |
| | Prosafe SE | 650,000 | 5,571 |
| * | Polarcus Ltd. | 5,500,000 | 3,582 |
| | Kongsberg Gruppen AS | 81,077 | 1,689 |
| | Petroleum Geo-Services | | |
| | ASA | 49,383 | 599 |
| | | | 73,112 |
| Singapore (1.9%) | | |
| | UOL Group Ltd. | 2,322,000 | 12,290 |
| | Mapletree Industrial Trust | 9,634,880 | 10,712 |
| | First Resources Ltd. | 4,598,000 | 7,214 |
| | Sembcorp Industries Ltd. | 1,549,000 | 6,622 |
| * | Vard Holdings Ltd. | 8,494,000 | 6,003 |
| | Noble Group Ltd. | 728,000 | 601 |
| | Indofood Agri | | |
| | Resources Ltd. | 713,000 | 522 |
| | | | 43,964 |
| South Korea (2.2%) | | |
| | Hankook Tire Co. Ltd. | 408,362 | 23,956 |
| | BS Financial Group Inc. | 613,600 | 9,851 |
| | Halla Visteon Climate | | |
| | Control Corp. | 244,310 | 9,136 |
| | Sung Kwang Bend Co. Ltd. | 135,368 | 3,706 |
| | Green Cross Corp. | 7,832 | 967 |
| | Amorepacific Corp. | 1,113 | 913 |
| | CJ O Shopping Co. Ltd. | 2,380 | 794 |
| | Lotte Chemical Corp. | 2,669 | 547 |
| | | | 49,870 |
| Sweden (1.7%) | | |
| | Loomis AB Class B | 800,354 | 19,185 |
| | Byggmax Group AB | 2,100,000 | 15,786 |
| | Opus Group AB | 1,894,804 | 2,427 |
| | Concentric AB | 68,324 | 703 |
| | | | 38,101 |
| Switzerland (5.8%) | | |
| | Helvetia Holding AG | 67,000 | 31,600 |
| | Kuoni Reisen Holding AG | 66,700 | 28,194 |
| | Clariant AG | 1,150,000 | 20,263 |
| | Forbo Holding AG | 23,400 | 18,349 |
| * | Gategroup Holding AG | 471,544 | 12,349 |
| | Orior AG | 200,000 | 11,242 |
| | Schweizerische | | |
| | National-Versicherungs- | | |
| | Gesellschaft AG | 78,000 | 3,855 |
| * | Dufry AG | 11,470 | 1,853 |
| | Partners Group Holding AG | 4,579 | 1,187 |
| | Tecan Group AG | 11,177 | 1,167 |
| | | |
| | Aryzta AG | 13,358 | 996 |
| | Actelion Ltd. | 8,554 | 662 |
| | | | 131,717 |
| Taiwan (1.1%) | | |
| | Giant Manufacturing | | |
| | Co. Ltd. | 1,381,000 | 10,364 |
| | CTCI Corp. | 3,710,000 | 6,488 |
| | Lung Yen Life | | |
| | Service Corp. | 1,867,000 | 5,652 |
| | CHC Healthcare Group | 612,000 | 1,741 |
| | | | 24,245 |
| Thailand (0.4%) | | |
| | Hemaraj Land and | | |
| | Development PCL | 78,955,100 | 8,948 |
| |
| United Arab Emirates (0.4%) | |
| * | Lamprell plc | 3,000,000 | 7,888 |
| |
| United Kingdom (19.1%) | | |
| | Telecom Plus plc | 775,000 | 19,151 |
| | DCC plc | 370,000 | 16,569 |
| | WS Atkins plc | 825,000 | 16,320 |
| | CSR plc | 1,800,000 | 15,855 |
| | Grainger plc | 4,915,405 | 15,350 |
| * | Sports Direct | | |
| | International plc | 1,300,000 | 14,610 |
| | Dechra | | |
| | Pharmaceuticals plc | 1,200,000 | 13,293 |
| | SIG plc | 4,000,000 | 13,199 |
| | Millennium & Copthorne | | |
| | Hotels plc | 1,400,000 | 12,796 |
| | Kier Group plc | 431,870 | 12,505 |
| | Elementis plc | 2,789,089 | 11,578 |
| | IG Group Holdings plc | 1,151,063 | 11,313 |
| | Premier Oil plc | 2,000,000 | 11,129 |
| | Daily Mail & General | | |
| | Trust plc | 825,000 | 10,760 |
| | Inchcape plc | 1,050,000 | 10,720 |
| | Persimmon plc | 500,000 | 10,123 |
| | John Wood Group plc | 772,222 | 10,055 |
| | Ultra Electronics | | |
| | Holdings plc | 322,415 | 9,998 |
| | Ricardo plc | 1,000,000 | 9,776 |
| | Berendsen plc | 600,000 | 9,344 |
| | Berkeley Group | | |
| | Holdings plc | 241,368 | 9,048 |
| | Ashtead Group plc | 850,000 | 8,932 |
| | TalkTalk Telecom | | |
| | Group plc | 2,000,000 | 8,562 |
| | Travis Perkins plc | 275,000 | 8,178 |
| | Senior plc | 1,650,000 | 7,874 |
| | Spirit Pub Co. plc | 6,650,704 | 7,809 |
| | Devro plc | 1,500,000 | 7,620 |
| | N Brown Group plc | 862,917 | 7,252 |
19
International Explorer Fund
| | | | |
| | | | | Market |
| | | | | Value• |
| | | | Shares | ($000) |
| | London Stock Exchange | | |
| | Group plc | | 275,000 | 7,228 |
| | Soco International plc | 1,100,000 | 7,018 |
| | Photo-Me | | | |
| | International plc | | 3,250,000 | 6,930 |
| | Findel plc | | 1,600,365 | 6,531 |
| | QinetiQ Group plc | | 2,000,000 | 6,348 |
| | Synthomer plc | | 1,600,000 | 6,239 |
| | Halma plc | | 675,000 | 5,929 |
| | Eco Animal Health | | | |
| | Group plc | | 1,618,166 | 5,586 |
| | Domino Printing | | | |
| | Sciences plc | | 500,000 | 5,537 |
| | Bodycote plc | | 525,000 | 5,534 |
| * | Micro Focus | | | |
| | International plc | | 415,384 | 5,444 |
| * | EnQuest plc | | 2,500,000 | 5,345 |
| | A.G.BARR plc | | 600,000 | 5,036 |
| * | LMS Capital plc | | 4,144,854 | 4,773 |
| | Victrex plc | | 180,000 | 4,757 |
| * | Gulfsands Petroleum plc | 3,581,812 | 3,446 |
| | Babcock International | | |
| | Group plc | | 128,459 | 2,627 |
| | TT electronics plc | | 750,000 | 2,394 |
| * | Mothercare plc | | 272,596 | 1,671 |
| | Direct Line Insurance | | |
| | Group plc | | 436,748 | 1,577 |
| | Informa plc | | 164,631 | 1,475 |
| | James Fisher & Sons plc | 76,327 | 1,363 |
| | Hansteen Holdings plc | 790,061 | 1,310 |
| | Booker Group plc | | 537,730 | 1,295 |
| | Mears Group plc | | 186,402 | 1,279 |
| | Savills plc | | 118,185 | 1,231 |
| | Tyman plc | | 296,759 | 1,117 |
| | Hays plc | | 549,531 | 1,097 |
| | Domino’s Pizza Group plc | 106,781 | 1,001 |
| | De La Rue plc | | 69,798 | 957 |
| | Hunting plc | | 62,059 | 887 |
| * | Thomas Cook Group plc | 294,583 | 678 |
| * | Crest Nicholson | | | |
| | Holdings plc | | 106,325 | 659 |
| * | Ophir Energy plc | | 121,774 | 648 |
| | Keller Group plc | | 32,341 | 545 |
| | Debenhams plc | | 261,886 | 427 |
| | AZ Electronic Materials SA | 73,884 | 339 |
| | Chemring Group plc | 89,537 | 312 |
| * | Pinnacle Staffing Group plc | 673,983 | — |
| | | | | 436,289 |
| Total Common Stocks | | | |
| (Cost $1,612,317) | | | 2,103,092 |
| Temporary Cash Investments (9.0%)1 | |
| Money Market Fund (8.7%) | | |
| 3,4 | Vanguard Market | | | |
| | Liquidity Fund, | | | |
| | 0.120% | 198,049,908 | 198,050 |
| | | |
| Repurchase Agreement (0.1%) | | |
| | Goldman Sachs & Co. | | |
| | 0.100%, 11/1/13 | | |
| | (Dated 10/31/13, | | |
| | Repurchase Value $2,500,000, | |
| | collateralized by Federal | | |
| | National Mortgage Assn. | | |
| | 3.500%-6.500%, | | |
| | 1/1/26–12/1/38 and | | |
| | Federal Home Loan | | |
| | Mortgage Corp. | | |
| | 2.060%-4.500%, | | |
| | 1/15/22–7/1/41, with a | | |
| | value of $2,583,000) | 2,500 | 2,500 |
| |
| U.S. Government and Agency Obligations (0.2%) |
| 5,6 | Fannie Mae | | |
| | Discount Notes, | | |
| | 0.098%, 11/6/13 | 2,150 | 2,150 |
| 5,6 | Fannie Mae | | |
| | Discount Notes, | | |
| | 0.050%, 1/22/14 | 300 | 300 |
| 5,6 | Fannie Mae | | |
| | Discount Notes, | | |
| | 0.065%, 2/3/14 | 200 | 200 |
| 6,7 | Federal Home Loan | | |
| | Bank Discount Notes, | | |
| | 0.050%, 1/10/14 | 100 | 100 |
| 6,7 | Federal Home Loan | | |
| | Bank Discount Notes, | | |
| | 0.190%, 1/15/14 | 700 | 699 |
| 6,7 | Federal Home Loan | | |
| | Bank Discount Notes, | | |
| | 0.060%, 2/19/14 | 200 | 200 |
| 5,6 | Freddie Mac | | |
| | Discount Notes, | | |
| | 0.095%, 11/18/13 | 1,600 | 1,600 |
| | | | 5,249 |
| Total Temporary Cash Investments | |
| (Cost $205,800) | | 205,799 |
| Total Investments (101.2%) | | |
| (Cost $1,818,117) | | 2,308,891 |
| Other Assets and Liabilities (-1.2%) | |
| Other Assets | | 17,938 |
| Liabilities4 | | (45,459) |
| | | | (27,521) |
| Net Assets (100%) | | |
| Applicable to 123,299,525 outstanding | |
| $.001 par value shares of beneficial | |
| interest (unlimited authorization) | | 2,281,370 |
| Net Asset Value Per Share | | $18.50 |
20
International Explorer Fund
| |
| At October 31, 2013, net assets consisted of: |
| | Amount |
| | ($000) |
| Paid-in Capital | 1,731,168 |
| Undistributed Net Investment Income | 22,380 |
| Accumulated Net Realized Gains | 33,322 |
| Unrealized Appreciation (Depreciation) | |
| Investment Securities | 490,774 |
| Futures Contracts | 2,875 |
| Forward Currency Contracts | 822 |
| Foreign Currencies | 29 |
| Net Assets | 2,281,370 |
See Note A in Notes to Financial Statements.
* Non-income-producing security.
^ Includes partial security positions on loan to broker-dealers. The total value of securities on loan is $29,713,000.
1 The fund invests a portion of its cash reserves in equity markets through the use of index futures contracts. After giving effect to futures
investments, the fund’s effective common stock and temporary cash investment positions represent 96.8% and 4.4%, respectively, of
net assets.
2 Security exempt from registration under Rule 144A of the Securities Act of 1933. Such securities may be sold in transactions exempt from
registration, normally to qualified institutional buyers. At October 31, 2013, the value of this security represented 0.0% of net assets.
3 Affiliated money market fund available only to Vanguard funds and certain trusts and accounts managed by Vanguard. Rate shown is the
7-day yield.
4 Includes $31,643,000 of collateral received for securities on loan.
5 The issuer was placed under federal conservatorship in September 2008; since that time, its daily operations have been managed by the
Federal Housing Finance Agency and it receives capital from the U.S. Treasury, as needed to maintain a positive net worth, in exchange
for senior preferred stock.
6 Securities with a value of $5,249,000 have been segregated as initial margin for open futures contracts.
7 The issuer operates under a congressional charter; its securities are generally neither guaranteed by the U.S. Treasury nor backed by the
full faith and credit of the U.S. government.
ADR—American Depositary Receipt.
GDR—Global Depositary Receipt.
See accompanying Notes, which are an integral part of the Financial Statements.
21
International Explorer Fund
Statement of Operations
| |
| | Year Ended |
| | October 31, 2013 |
| | ($000) |
| Investment Income | |
| Income | |
| Dividends1 | 46,256 |
| Interest2 | 170 |
| Securities Lending | 924 |
| Total Income | 47,350 |
| Expenses | |
| Investment Advisory Fees—Note B | |
| Basic Fee | 4,164 |
| Performance Adjustment | (953) |
| The Vanguard Group—Note C | |
| Management and Administrative | 3,077 |
| Marketing and Distribution | 347 |
| Custodian Fees | 457 |
| Auditing Fees | 34 |
| Shareholders’ Reports | 26 |
| Trustees’ Fees and Expenses | 5 |
| Total Expenses | 7,157 |
| Net Investment Income | 40,193 |
| Realized Net Gain (Loss) | |
| Investment Securities Sold | 48,993 |
| Futures Contracts | 17,897 |
| Foreign Currencies and Forward Currency Contracts | (4,934) |
| Realized Net Gain (Loss) | 61,956 |
| Change in Unrealized Appreciation (Depreciation) | |
| Investment Securities | 437,017 |
| Futures Contracts | 2,258 |
| Foreign Currencies and Forward Currency Contracts | 1,488 |
| Change in Unrealized Appreciation (Depreciation) | 440,763 |
| Net Increase (Decrease) in Net Assets Resulting from Operations | 542,912 |
| 1 Dividends are net of foreign withholding taxes of $2,279,000. |
| 2 Interest income from an affiliated company of the fund was $158,000. |
See accompanying Notes, which are an integral part of the Financial Statements.
22
International Explorer Fund
Statement of Changes in Net Assets
| | |
| | Year Ended October 31, |
| | 2013 | 2012 |
| | ($000) | ($000) |
| Increase (Decrease) in Net Assets | | |
| Operations | | |
| Net Investment Income | 40,193 | 44,166 |
| Realized Net Gain (Loss) | 61,956 | (25,990) |
| Change in Unrealized Appreciation (Depreciation) | 440,763 | 52,467 |
| Net Increase (Decrease) in Net Assets Resulting from Operations | 542,912 | 70,643 |
| Distributions | | |
| Net Investment Income | (50,302) | (48,589) |
| Realized Capital Gain | — | (29,912) |
| Total Distributions | (50,302) | (78,501) |
| Capital Share Transactions | | |
| Issued | 358,438 | 217,594 |
| Issued in Lieu of Cash Distributions | 45,856 | 70,881 |
| Redeemed1 | (434,054) | (649,006) |
| Net Increase (Decrease) from Capital Share Transactions | (29,760) | (360,531) |
| Total Increase (Decrease) | 462,850 | (368,389) |
| Net Assets | | |
| Beginning of Period | 1,818,520 | 2,186,909 |
| End of Period2 | 2,281,370 | 1,818,520 |
| 1 Net of redemption fees for fiscal 2012 of $44,000. Effective May 23, 2012, the redemption fee was eliminated. |
| 2 Net Assets—End of Period includes undistributed net investment income of $22,380,000 and $32,575,000. |
See accompanying Notes, which are an integral part of the Financial Statements.
23
International Explorer Fund
Financial Highlights
| | | | | |
| For a Share Outstanding | Year Ended October 31, |
| Throughout Each Period | 2013 | 2012 | 2011 | 2010 | 2009 |
| Net Asset Value, Beginning of Period | $14.50 | $14.41 | $15.81 | $13.55 | $9.52 |
| Investment Operations | | | | | |
| Net Investment Income | . 327 | .362 | .322 | .237 | .238 |
| Net Realized and Unrealized Gain (Loss) | | | | | |
| on Investments | 4.078 | .287 | (1.498) | 2.225 | 4.148 |
| Total from Investment Operations | 4.405 | .649 | (1.176) | 2.462 | 4.386 |
| Distributions | | | | | |
| Dividends from Net Investment Income | (.405) | (.346) | (. 224) | (. 202) | (. 356) |
| Distributions from Realized Capital Gains | — | (.213) | — | — | — |
| Total Distributions | (.405) | (. 559) | (. 224) | (. 202) | (. 356) |
| Net Asset Value, End of Period | $18.50 | $14.50 | $14.41 | $15.81 | $13.55 |
| |
| Total Return1 | 31.13% | 5.02% | -7.60% | 18.38% | 47.88% |
| |
| Ratios/Supplemental Data | | | | | |
| Net Assets, End of Period (Millions) | $2,281 | $1,819 | $2,187 | $2,436 | $1,911 |
| Ratio of Total Expenses to | | | | | |
| Average Net Assets2 | 0.36% | 0.43% | 0.42% | 0.39% | 0.45% |
| Ratio of Net Investment Income to | | | | | |
| Average Net Assets | 2.03% | 2.35% | 1.93% | 1.67% | 2.10% |
| Portfolio Turnover Rate | 36% | 28% | 43% | 51% | 52% |
| 1 Total returns do not include transaction or account service fees that may have applied in the periods shown. Fund prospectuses provide |
| information about any applicable transaction and account service fees. |
| 2 Includes performance-based investment advisory fee increases (decreases) of (0.05%), 0.02%, 0.03%, 0.00%, and 0.00%. |
See accompanying Notes, which are an integral part of the Financial Statements.
24
International Explorer Fund
Notes to Financial Statements
Vanguard International Explorer Fund is registered under the Investment Company Act of 1940 as an open-end investment company, or mutual fund. The fund invests in securities of foreign issuers, which may subject it to investment risks not normally associated with investing in securities of United States corporations.
A. The following significant accounting policies conform to generally accepted accounting principles for U.S. mutual funds. The fund consistently follows such policies in preparing its financial statements.
1. Security Valuation: Securities are valued as of the close of trading on the New York Stock Exchange (generally 4 p.m., Eastern time) on the valuation date. Equity securities are valued at the latest quoted sales prices or official closing prices taken from the primary market in which each security trades; such securities not traded on the valuation date are valued at the mean of the latest quoted bid and asked prices. Securities for which market quotations are not readily available, or whose values have been affected by events occurring before the fund’s pricing time but after the close of the securities’ primary markets, are valued at their fair values calculated according to procedures adopted by the board of trustees. These procedures include obtaining quotations from an independent pricing service, monitoring news to identify significant market- or security-specific events, and evaluating changes in the values of foreign market proxies (for example, ADRs, futures contracts, or exchange-traded funds), between the time the foreign markets close and the fund’s pricing time. When fair-value pricing is employed, the prices of securities used by a fund to calculate its net asset value may differ from quoted or published prices for the same securities. Investments in Vanguard Market Liquidity Fund are valued at that fund’s net asset value. Temporary cash investments acquired over 60 days to maturity are valued using the latest bid prices or using valuations based on a matrix system (which considers such factors as security prices, yields, maturities, and ratings), both as furnished by independent pricing services. Other temporary cash investments are valued at amortized cost, which approximates market value.
2. Foreign Currency: Securities and other assets and liabilities denominated in foreign currencies are translated into U.S. dollars using exchange rates obtained from an independent third party as of the fund’s pricing time on the valuation date. Realized gains (losses) and unrealized appreciation (depreciation) on investment securities include the effects of changes in exchange rates since the securities were purchased, combined with the effects of changes in security prices. Fluctuations in the value of other assets and liabilities resulting from changes in exchange rates are recorded as unrealized foreign currency gains (losses) until the assets or liabilities are settled in cash, at which time they are recorded as realized foreign currency gains (losses).
3. Futures and Forward Currency Contracts: The fund may use index futures contracts to a limited extent, with the objective of maintaining full exposure to the stock market while maintaining liquidity. The fund may purchase or sell futures contracts to achieve a desired level of investment, whether to accommodate portfolio turnover or cash flows from capital share transactions. The primary risks associated with the use of futures contracts are imperfect correlation between changes in market values of stocks held by the fund and the prices of futures contracts, and the possibility of an illiquid market. Counterparty risk involving futures is mitigated because a regulated clearinghouse is the counterparty instead of the clearing broker. To further mitigate counterparty risk, the fund trades futures contracts on an exchange, monitors the financial strength of its clearing brokers and clearinghouse, and has entered into clearing agreements with its clearing brokers. The clearinghouse imposes initial margin requirements to secure the fund’s performance and requires daily settlement of variation margin representing changes in the market value of each contract.
25
International Explorer Fund
The fund may enter into forward currency contracts to provide the appropriate currency exposure related to any open futures contracts or to protect the value of securities and related receivables and payables against changes in foreign exchange rates. The fund’s risks in using these contracts include movement in the values of the foreign currencies relative to the U.S. dollar and the ability of the counterparties to fulfill their obligations under the contracts. The fund mitigates its counterparty risk by entering into forward currency contracts only with a diverse group of prequalified counterparties, monitoring their financial strength, entering into master netting arrangements with its counterparties, and requiring its counterparties to transfer collateral as security for their performance. The master netting arrangements provide that, in the event of a counterparty’s default (including bankruptcy), the fund may terminate the forward currency contracts, determine the net amount owed by either party in accordance with its master netting arrangements, and sell or retain any collateral held up to the net amount owed to the fund under the master netting arrangements. The forward currency contracts contain provisions whereby a counterparty may terminate open contracts if the fund’s net assets decline below a certain level, triggering a payment by the fund if the fund is in a net liability position at the time of the termination. The payment amount would be reduced by any collateral the fund has pledged. Any assets pledged as collateral for open contracts are noted in the Statement of Net Assets. The value of collateral received or pledged is compared daily to the value of the forward currency contracts exposure with each counterparty, and any difference, if in excess of a specified minimum transfer amount, is adjusted and settled within two business days.
Futures contracts are valued at their quoted daily settlement prices. Forward currency contracts are valued at their quoted daily prices obtained from an independent third party, adjusted for currency risk based on the expiration date of each contract. The aggregate notional amounts of the contracts are not recorded in the Statement of Net Assets. Fluctuations in the value of the contracts are recorded in the Statement of Net Assets as an asset (liability) and in the Statement of Operations as unrealized appreciation (depreciation) until the contracts are closed, when they are recorded as realized gains (losses) on futures or forward currency contracts.
During the year ended October 31, 2013, the fund’s average investments in long and short futures contracts represented 3% and 0% of net assets, respectively, based on quarterly average aggregate settlement values. The fund’s average investment in forward currency contracts represented 3% of net assets, based on quarterly average notional amounts.
4. Repurchase Agreements: The fund may enter into repurchase agreements with institutional counterparties. Securities pledged as collateral to the fund under repurchase agreements are held by a custodian bank until the agreements mature. Each agreement requires that the market value of the collateral be sufficient to cover payments of interest and principal. The fund further mitigates its counterparty risk by entering into repurchase agreements only with a diverse group of prequalified counterparties, monitoring their financial strength, and entering into master repurchase agreements with its counterparties. The master repurchase agreements provide that, in the event of a counterpar-ty’s default (including bankruptcy), the fund may terminate any repurchase agreements with that counterparty, determine the net amount owed, and sell or retain the collateral up to the net amount owed to the fund. Such action may be subject to legal proceedings, which may delay or limit the disposition of collateral.
5. Federal Income Taxes: The fund intends to continue to qualify as a regulated investment company and distribute all of its taxable income. Management has analyzed the fund’s tax positions taken for all open federal income tax years (October 31, 2010–2013), and has concluded that no provision for federal income tax is required in the fund’s financial statements.
26
International Explorer Fund
6. Distributions: Distributions to shareholders are recorded on the ex-dividend date.
7. Securities Lending: To earn additional income, the fund may lend its securities to qualified institutional borrowers. Security loans are required to be secured at all times by collateral in an amount at least equal to the market value of securities loaned. Daily market fluctuations could cause the value of loaned securities to be more or less than the value of the collateral received. When this occurs, the collateral is adjusted and settled on the next business day. The fund further mitigates its counterparty risk by entering into securities lending transactions only with a diverse group of prequalified counterparties, monitoring their financial strength, and entering into master securities lending agreements with its counterparties. The master securities lending agreements provide that, in the event of a counterparty’s default (including bankruptcy), the fund may terminate any loans with that borrower, determine the net amount owed, and sell or retain the collateral up to the net amount owed to the fund; however, such actions may be subject to legal proceedings. While collateral mitigates counterparty risk, in the absence of a default the fund may experience delays and costs in recovering the securities loaned. The fund invests cash collateral received in Vanguard Market Liquidity Fund, and records a liability for the return of the collateral, during the period the securities are on loan. Securities lending income represents fees charged to borrowers plus income earned on invested cash collateral, less expenses associated with the loan.
8. Other: Dividend income is recorded on the ex-dividend date. Interest income includes income distributions received from Vanguard Market Liquidity Fund and is accrued daily. Premiums and discounts on debt securities purchased are amortized and accreted, respectively, to interest income over the lives of the respective securities. Security transactions are accounted for on the date securities are bought or sold. Costs used to determine realized gains (losses) on the sale of investment securities are those of the specific securities sold.
B. Schroder Investment Management North America Inc. and Wellington Management Company, LLP, each provide investment advisory services to a portion of the fund for a fee calculated at an annual percentage rate of average net assets managed by the advisor. The basic fees of Schroder Investment Management North America Inc. and Wellington Management Company, LLP, are subject to quarterly adjustments based on performance for the preceding three years relative to the S&P EPAC SmallCap Index.
The Vanguard Group manages the cash reserves of the fund on an at-cost basis.
For the year ended October 31, 2013, the aggregate investment advisory fee represented an effective annual basic rate of 0.21% of the fund’s average net assets, before a decrease of $953,000 (0.05%) based on performance.
C. The Vanguard Group furnishes at cost corporate management, administrative, marketing, and distribution services. The costs of such services are allocated to the fund under methods approved by the board of trustees. The fund has committed to provide up to 0.40% of its net assets in capital contributions to Vanguard. At October 31, 2013, the fund had contributed capital of $255,000 to Vanguard (included in Other Assets), representing 0.01% of the fund’s net assets and 0.10% of Vanguard’s capitalization. The fund’s trustees and officers are also directors and officers of Vanguard.
27
International Explorer Fund
D. Various inputs may be used to determine the value of the fund’s investments. These inputs are summarized in three broad levels for financial statement purposes. The inputs or methodologies used to value securities are not necessarily an indication of the risk associated with investing in those securities.
Level 1—Quoted prices in active markets for identical securities.
Level 2—Other significant observable inputs (including quoted prices for similar securities, interest rates, prepayment speeds, credit risk, etc.).
Level 3—Significant unobservable inputs (including the fund’s own assumptions used to determine the fair value of investments).
The following table summarizes the market value of the fund’s investments as of October 31, 2013, based on the inputs used to value them:
| | | |
| | Level 1 | Level 2 | Level 3 |
| Investments | ($000) | ($000) | ($000) |
| Common Stocks | 14,183 | 2,088,909 | — |
| Temporary Cash Investments | 198,050 | 7,749 | — |
| Futures Contracts—Liabilities1 | (192) | — | — |
| Forward Currency Contracts—Assets | — | 1,078 | — |
| Forward Currency Contracts—Liabilities | — | (256) | — |
| Total | 212,041 | 2,097,480 | — |
| 1 Represents variation margin on the last day of the reporting period. |
E. At October 31, 2013, the fair values of derivatives were reflected in the Statement of Net Assets as follows:
| | | |
| | | Foreign | |
| | Equity | Exchange | |
| | Contracts | Contracts | Total |
| Statement of Net Assets Caption | ($000) | ($000) | ($000) |
| Other Assets | — | 1,078 | 1,078 |
| Liabilities | (192) | (256) | (448) |
28
International Explorer Fund
Realized net gain (loss) and the change in unrealized appreciation (depreciation) on derivatives for the year ended October 31, 2013, were:
| | | |
| | | Foreign | |
| | Equity | Exchange | |
| | Contracts | Contracts | Total |
| Realized Net Gain (Loss) on Derivatives | ($000) | ($000) | ($000) |
| Futures Contracts | 17,897 | — | 17,897 |
| Forward Currency Contracts | — | (4,665) | (4,665) |
| Realized Net Gain (Loss) on Derivatives | 17,897 | (4,665) | 13,232 |
| |
| Change in Unrealized Appreciation (Depreciation) on Derivatives | | | |
| Futures Contracts | 2,258 | — | 2,258 |
| Forward Currency Contracts | — | 1,372 | 1,372 |
| Change in Unrealized Appreciation (Depreciation) on Derivatives | 2,258 | 1,372 | 3,630 |
At October 31, 2013, the aggregate settlement value of open futures contracts and the related unrealized appreciation (depreciation) were:
| | | | |
| | | | ($000) |
| | | | Aggregate | |
| | | Number of | Settlement | Unrealized |
| | | Long (Short) | Value | Appreciation |
| Futures Contracts | Expiration | Contracts | Long (Short) | (Depreciation) |
| Topix Index | December 2013 | 309 | 37,779 | 343 |
| Dow Jones EURO STOXX 50 Index | December 2013 | 713 | 29,652 | 1,521 |
| S&P ASX 200 Index | December 2013 | 203 | 26,028 | 739 |
| FTSE 100 Index | December 2013 | 116 | 12,502 | 272 |
Unrealized appreciation (depreciation) on open Dow Jones EURO STOXX 50 Index and FTSE 100 Index futures contracts are required to be treated as realized gain (loss) for tax purposes.
29
International Explorer Fund
At October 31, 2013, the fund had open forward currency contracts to receive and deliver currencies as follows. Unrealized appreciation (depreciation) on open forward currency contracts is treated as realized gain (loss) for tax purposes.
| | | | | | |
| | | | | | | Unrealized |
| | Contract | | | | | Appreciation |
| | Settlement | Contract Amount (000) | (Depreciation) |
| Counterparty | Date | Receive | Deliver | ($000) |
| Brown Brothers Harriman & Co. | 12/17/13 | JPY | 2,832,173 | USD | 28,319 | 492 |
| Brown Brothers Harriman & Co. | 12/27/13 | EUR | 15,032 | USD | 20,104 | 308 |
| Brown Brothers Harriman & Co. | 12/24/13 | AUD | 19,270 | USD | 17,931 | 215 |
| Brown Brothers Harriman & Co. | 12/17/13 | JPY | 829,965 | USD | 8,491 | (48) |
| Brown Brothers Harriman & Co. | 12/27/13 | GBP | 5,180 | USD | 8,239 | 63 |
| Brown Brothers Harriman & Co. | 12/27/13 | EUR | 5,712 | USD | 7,824 | (67) |
| Brown Brothers Harriman & Co. | 12/24/13 | AUD | 7,457 | USD | 7,129 | (107) |
| Brown Brothers Harriman & Co. | 12/27/13 | GBP | 2,440 | USD | 3,944 | (34) |
| AUD—Australian dollar. |
| EUR—Euro. |
| GBP—British pound. |
| JPY—Japanese yen. |
| USD—U.S. dollar. |
At October 31, 2013, the counterparty had deposited in segregated accounts cash of $1,380,000 in connection with amounts due to the fund for open forward currency contracts.
F. Distributions are determined on a tax basis and may differ from net investment income and realized capital gains for financial reporting purposes. Differences may be permanent or temporary. Permanent differences are reclassified among capital accounts in the financial statements to reflect their tax character. Temporary differences arise when certain items of income, expense, gain, or loss are recognized in different periods for financial statement and tax purposes; such differences are primarily attributed to the tax treatment of unrealized appreciation on passive foreign investment companies. These differences will reverse at some time in the future. Differences in classification may also result from the treatment of short-term gains as ordinary income for tax purposes.
During the year ended October 31, 2013, the fund realized net foreign currency losses of $270,000, which decreased distributable net income for tax purposes; accordingly, such losses have been reclassified from accumulated net realized gains to undistributed net investment income. Certain of the fund’s investments are in securities considered to be passive foreign investment companies, for which any unrealized appreciation and/or realized gains are required to be included in distributable net income for tax purposes. During the year ended October 31, 2013, the fund realized gains on the sale of passive foreign investment companies of $1,662,000, which have been included in current and prior periods’ taxable income; accordingly, such gains have been reclassified from accumulated net realized gains to undistributed net investment income. Passive foreign investment companies held at October 31, 2013, had unrealized appreciation of $23,530,000, of which $10,217,000 has been distributed and is reflected in the balance of undistributed net investment income.
30
International Explorer Fund
The fund used a tax accounting practice to treat a portion of the price of capital shares redeemed during the year as distributions from net investment income and realized capital gains. Accordingly, the fund has reclassified $1,478,000 from undistributed net investment income, and $928,000 from accumulated net realized gains, to paid-in capital.
The fund used a capital loss carryforward of $27,759,000 to offset taxable capital gains realized during the year ended October 31, 2013, reducing the amount of capital gains that would otherwise be available to distribute to shareholders. For tax purposes, at October 31, 2013, the fund had $67,428,000 of ordinary income and $18,817,000 of long-term capital gains available for distribution.
At October 31, 2013, the cost of investment securities for tax purposes was $1,841,665,000. Net unrealized appreciation of investment securities for tax purposes was $467,226,000, consisting of unrealized gains of $530,113,000 on securities that had risen in value since their purchase and $62,887,000 in unrealized losses on securities that had fallen in value since their purchase.
G. During the year ended October 31, 2013, the fund purchased $664,233,000 of investment securities and sold $771,463,000 of investment securities, other than temporary cash investments.
H. Capital shares issued and redeemed were:
| | |
| | Year Ended October 31, |
| | 2013 | 2012 |
| | Shares | Shares |
| | (000) | (000) |
| Issued | 22,030 | 15,638 |
| Issued in Lieu of Cash Distributions | 3,141 | 5,538 |
| Redeemed | (27,321) | (47,535) |
| Net Increase (Decrease) in Shares Outstanding | (2,150) | (26,359) |
I. Management has determined that no material events or transactions occurred subsequent to October 31, 2013, that would require recognition or disclosure in these financial statements.
31
Report of Independent Registered
Public Accounting Firm
To the Trustees of Vanguard Whitehall Funds and the Shareholders of Vanguard International Explorer Fund: In our opinion, the accompanying statement of net assets and the related statements of operations and of changes in net assets and the financial highlights present fairly, in all material respects, the financial position of Vanguard International Explorer Fund (constituting a separate portfolio of Vanguard Whitehall Funds, hereafter referred to as the “Fund”) at October 31, 2013, the results of its operations for the year then ended, the changes in its net assets for each of the two years in the period then ended, and the financial highlights for each of the five years in the period then ended, in conformity with accounting principles generally accepted in the United States of America. These financial statements and financial highlights (hereafter referred to as “financial statements”) are the responsibility of the Fund’s management; our responsibility is to express an opinion on these financial statements based on our audits. We conducted our audits of these financial statements in accordance with the standards of the Public Company Accounting Oversight Board (United States). Those standards require that we plan and perform the audit to obtain reasonable assurance about whether the financial statements are free of material misstatement. An audit includes examining, on a test basis, evidence supporting the amounts and disclosures in the financial statements, assessing the accounting principles used and significant estimates made by management, and evaluating the overall financial statement presentation. We believe that our audits, which included confirmation of securities at October 31, 2013 by correspondence with the custodian and brokers and by agreement to the underlying ownership records of the transfer agent, provide a reasonable basis for our opinion.
/s/PricewaterhouseCoopers LLP
Philadelphia, Pennsylvania
December 16, 2013

Special 2013 tax information (unaudited) for Vanguard International Explorer Fund
This information for the fiscal year ended October 31, 2013, is included pursuant to provisions of the
Internal Revenue Code.
The fund distributed $499,000 as capital gain dividends (from net long-term capital gains) to
shareholders during the fiscal year.
The fund distributed $38,672,000 of qualified dividend income to shareholders during the fiscal year.
The fund designates to shareholders foreign source income of $46,630,000 and foreign taxes paid
of $2,294,000. Shareholders will receive more detailed information with their Form 1099-DIV in
January 2014 to determine the calendar-year amounts to be included on their 2013 tax returns.
32
Your Fund’s After-Tax Returns
This table presents returns for your fund both before and after taxes. The after-tax returns are shown in two ways: (1) assuming that an investor owned the fund during the entire period and paid taxes on the fund’s distributions, and (2) assuming that an investor paid taxes on the fund’s distributions and sold all shares at the end of each period.
Calculations are based on the highest individual federal income tax and capital gains tax rates in effect at the times of the distributions and the hypothetical sales. State and local taxes were not considered. After-tax returns reflect any qualified dividend income, using actual prior-year figures and estimates for 2013. (In the example, returns after the sale of fund shares may be higher than those assuming no sale. This occurs when the sale would have produced a capital loss. The calculation assumes that the investor received a tax deduction for the loss.)
Please note that your actual after-tax returns will depend on your tax situation and may differ from those shown. Also note that if you own the fund in a tax-deferred account, such as an individual retirement account or a 401(k) plan, this information does not apply to you. Such accounts are not subject to current taxes.
Finally, keep in mind that a fund’s performance—whether before or after taxes—does not guarantee future results.
| | | |
| Average Annual Total Returns: International Explorer Fund | | | |
| Periods Ended October 31, 2013 | | | |
| | One | Five | Ten |
| | Year | Years | Years |
| Returns Before Taxes | 31.13% | 17.37% | 10.45% |
| Returns After Taxes on Distributions | 30.53 | 16.97 | 9.47 |
| Returns After Taxes on Distributions and Sale of Fund Shares | 18.29 | 14.22 | 8.75 |
33
About Your Fund’s Expenses
As a shareholder of the fund, you incur ongoing costs, which include costs for portfolio management, administrative services, and shareholder reports (like this one), among others. Operating expenses, which are deducted from a fund’s gross income, directly reduce the investment return of the fund.
A fund’s expenses are expressed as a percentage of its average net assets. This figure is known as the expense ratio. The following examples are intended to help you understand the ongoing costs (in dollars) of investing in your fund and to compare these costs with those of other mutual funds. The examples are based on an investment of $1,000 made at the beginning of the period shown and held for the entire period.
The accompanying table illustrates your fund’s costs in two ways:
• Based on actual fund return. This section helps you to estimate the actual expenses that you paid over the period. The ”Ending Account Value“ shown is derived from the fund‘s actual return, and the third column shows the dollar amount that would have been paid by an investor who started with $1,000 in the fund. You may use the information here, together with the amount you invested, to estimate the expenses that you paid over the period.
To do so, simply divide your account value by $1,000 (for example, an $8,600 account value divided by $1,000 = 8.6), then multiply the result by the number given for your fund under the heading ”Expenses Paid During Period.“
• Based on hypothetical 5% yearly return. This section is intended to help you compare your fund‘s costs with those of other mutual funds. It assumes that the fund had a yearly return of 5% before expenses, but that the expense ratio is unchanged. In this case—because the return used is not the fund’s actual return—the results do not apply to your investment. The example is useful in making comparisons because the Securities and Exchange Commission requires all mutual funds to calculate expenses based on a 5% return. You can assess your fund’s costs by comparing this hypothetical example with the hypothetical examples that appear in shareholder reports of other funds.
Note that the expenses shown in the table are meant to highlight and help you compare ongoing costs only and do not reflect transaction costs incurred by the fund for buying and selling securities. Further, the expenses do not include any purchase, redemption, or account service fees described in the fund prospectus. If such fees were applied to your account, your costs would be higher. Your fund does not carry a “sales load.”
The calculations assume no shares were bought or sold during the period. Your actual costs may have been higher or lower, depending on the amount of your investment and the timing of any purchases or redemptions.
You can find more information about the fund’s expenses, including annual expense ratios, in the Financial Statements section of this report. For additional information on operating expenses and other shareholder costs, please refer to your fund’s current prospectus.
34
| | | |
| Six Months Ended October 31, 2013 | | | |
| | Beginning | Ending | Expenses |
| | Account Value | Account Value | Paid During |
| International Explorer Fund | 4/30/2013 | 10/31/2013 | Period |
| Based on Actual Fund Return | $1,000.00 | $1,138.46 | $1.94 |
| Based on Hypothetical 5% Yearly Return | 1,000.00 | 1,023.39 | 1.84 |
The calculations are based on expenses incurred in the most recent six-month period. The fund’s annualized six-month expense ratio for that
period is 0.36%. The dollar amounts shown as “Expenses Paid” are equal to the annualized expense ratio multiplied by the average account
value over the period, multiplied by the number of days in the most recent six-month period, then divided by the number of days in the most
recent 12-month period.
35
Trustees Approve Advisory Arrangements
The board of trustees of Vanguard International Explorer Fund has renewed the fund’s investment advisory arrangements with Schroder Investment Management North America Inc. (Schroder Inc.) and Wellington Management Company, LLP (Wellington Management), as well as a sub-advisory arrangement with Schroder Investment Management North America Limited (Schroder Ltd.). The board determined that renewing the fund’s advisory arrangements was in the best interests of the fund and its shareholders.
The board based its decision upon an evaluation of each advisor’s investment staff, portfolio management process, and performance. The trustees considered the factors discussed below, among others. However, no single factor determined whether the board approved the arrangements. Rather, it was the totality of the circumstances that drove the board’s decision.
Nature, extent, and quality of services
The board considered the quality of the fund’s investment management services over both the short and long term, and took into account the organizational depth and stability of each advisor. The board noted the following:
Schroder. Schroders plc, the parent company of Schroder Inc. and Schroder Ltd. (collectively, Schroder), has existed for more than 200 years and has investment management experience dating to 1926. Schroder continues to employ a sound process, selecting attractive small-capitalization growth stocks from developed and emerging markets outside the United States. Schroder’s International Small-Cap Committee is responsible for the management of its portion of the fund. Stocks are selected using a bottom-up approach, supported by Schroder’s worldwide network of analysts, economists, and strategists. The firm has advised a portion of the fund since 1996.
Wellington Management. Wellington Management, founded in 1928, is among the nation’s oldest and most respected institutional investment managers. Wellington Management’s international small-cap team uses a traditional, bottom-up investment process that attempts to discover a company’s intrinsic value. In valuing a company, it believes that the same valuation metric should be applied on an industry-by-industry basis. Although the team’s valuation discipline is essential to the process, its philosophy is not biased toward growth or value as it invests in both extended growth opportunities and neglected or misunderstood companies. The firm has advised a portion of the fund since 2010.
The board concluded that each advisor’s experience, stability, depth, and performance, among other factors, warranted continuation of the advisory arrangements.
Investment performance
The board considered the short- and long-term performance of the fund, including any periods of outperformance or underperformance relative to a benchmark index and peer group. The board concluded that the performance was such that the advisory arrangements should continue. Information about the fund’s most recent performance can be found in the Performance Summary section of this report.
36
Cost
The board concluded that the fund’s expense ratio was well below the average expense ratio charged by funds in its peer group and that the fund’s advisory fee rate was also well below its peer-group average. Information about the fund’s expense ratio appears in the About Your Fund’s Expenses section of this report as well as in the Financial Statements section, which also includes information about the fund’s advisory fee rate.
The board did not consider profitability of Schroder and Wellington Management in determining whether to approve the advisory fees, because the firms are independent of Vanguard, and the advisory fee is the result of arm’s-length negotiations.
The benefit of economies of scale
The board concluded that the fund’s shareholders benefit from economies of scale because of breakpoints in the advisory fee schedule for Schroder and Wellington Management. The breakpoints reduce the effective rate of the fee as the fund’s assets managed by each advisor increase.
The board will consider whether to renew the advisory arrangements again after a one-year period.
37
Glossary
Beta. A measure of the magnitude of a fund’s past share-price fluctuations in relation to the ups and downs of a given market index. The index is assigned a beta of 1.00. Compared with a given index, a fund with a beta of 1.20 typically would have seen its share price rise or fall by 12% when the index rose or fell by 10%. For this report, beta is based on returns over the past 36 months for both the fund and the index. Note that a fund’s beta should be reviewed in conjunction with its R-squared (see definition). The lower the R-squared, the less correlation there is between the fund and the index, and the less reliable beta is as an indicator of volatility.
Dividend Yield. Dividend income earned by stocks, expressed as a percentage of the aggregate market value (or of net asset value, for a fund). The yield is determined by dividing the amount of the annual dividends by the aggregate value (or net asset value) at the end of the period. For a fund, the dividend yield is based solely on stock holdings and does not include any income produced by other investments.
Earnings Growth Rate. The average annual rate of growth in earnings over the past five years for the stocks now in a fund.
Equity Exposure. A measure that reflects a fund’s investments in stocks and stock futures. Any holdings in short-term reserves are excluded.
Expense Ratio. A fund’s total annual operating expenses expressed as a percentage of the fund’s average net assets. The expense ratio includes management and administrative expenses, but does not include the transaction costs of buying and selling portfolio securities.
Inception Date. The date on which the assets of a fund (or one of its share classes) are first invested in accordance with the fund’s investment objective. For funds with a subscription period, the inception date is the day after that period ends. Investment performance is measured from the inception date.
Median Market Cap. An indicator of the size of companies in which a fund invests; the midpoint of market capitalization (market price x shares outstanding) of a fund’s stocks, weighted by the proportion of the fund’s assets invested in each stock. Stocks representing half of the fund’s assets have market capitalizations above the median, and the rest are below it.
Price/Book Ratio. The share price of a stock divided by its net worth, or book value, per share. For a fund, the weighted average price/book ratio of the stocks it holds.
Price/Earnings Ratio. The ratio of a stock’s current price to its per-share earnings over the past year. For a fund, the weighted average P/E of the stocks it holds. P/E is an indicator of market expectations about corporate prospects; the higher the P/E, the greater the expectations for a company’s future growth.
R-Squared. A measure of how much of a fund’s past returns can be explained by the returns from the market in general, as measured by a given index. If a fund’s total returns were precisely synchronized with an index’s returns, its R-squared would be 1.00. If the fund’s returns bore no relationship to the index’s returns, its R-squared would be 0. For this report, R-squared is based on returns over the past 36 months for both the fund and the index.
38
Return on Equity. The annual average rate of return generated by a company during the past five years for each dollar of shareholder’s equity (net income divided by shareholder’s equity). For a fund, the weighted average return on equity for the companies whose stocks it holds.
Short-Term Reserves. The percentage of a fund invested in highly liquid, short-term securities that can be readily converted to cash.
Turnover Rate. An indication of the fund’s trading activity. Funds with high turnover rates incur higher transaction costs and may be more likely to distribute capital gains (which may be taxable to investors). The turnover rate excludes in-kind transactions, which have minimal impact on costs.
39
The People Who Govern Your Fund
The trustees of your mutual fund are there to see that the fund is operated and managed in your best interests since, as a shareholder, you are a part owner of the fund. Your fund’s trustees also serve on the board of directors of The Vanguard Group, Inc., which is owned by the Vanguard funds and provides services to them on an at-cost basis.
A majority of Vanguard’s board members are independent, meaning that they have no affiliation with Vanguard or the funds they oversee, apart from the sizable personal investments they have made as private individuals. The independent board members have distinguished backgrounds in business, academia, and public service. Each of the trustees and executive officers oversees 181 Vanguard funds.
The following table provides information for each trustee and executive officer of the fund. More information about the trustees is in the Statement of Additional Information, which can be obtained, without charge, by contacting Vanguard at 800-662-7447, or online at vanguard.com.
| |
| InterestedTrustee1 | and Delphi Automotive LLP (automotive components); |
| | Senior Advisor at New Mountain Capital; Trustee of |
| F. William McNabb III | The Conference Board. |
| Born 1957. Trustee Since July 2009. Chairman of the | |
| Board. Principal Occupation(s) During the Past Five | Amy Gutmann |
| Years: Chairman of the Board of The Vanguard Group, | Born 1949. Trustee Since June 2006. Principal |
| Inc., and of each of the investment companies served | Occupation(s) During the Past Five Years: President |
| by The Vanguard Group, since January 2010; Director | of the University of Pennsylvania; Christopher H. |
| of The Vanguard Group since 2008; Chief Executive | Browne Distinguished Professor of Political Science |
| Officer and President of The Vanguard Group and of | in the School of Arts and Sciences with secondary |
| each of the investment companies served by The | appointments at the Annenberg School for |
| Vanguard Group since 2008; Director of Vanguard | Communication and the Graduate School of Education |
| Marketing Corporation; Managing Director of The | of the University of Pennsylvania; Member of the |
| Vanguard Group (1995–2008). | National Commission on the Humanities and Social |
| | Sciences; Trustee of Carnegie Corporation of New |
| | York and of the National Constitution Center; Chair |
| IndependentTrustees | of the U.S. Presidential Commission for the Study |
| | of Bioethical Issues. |
| Emerson U. Fullwood | |
| Born 1948. Trustee Since January 2008. Principal | JoAnn Heffernan Heisen |
| Occupation(s) During the Past Five Years: Executive | Born 1950. Trustee Since July 1998. Principal |
| Chief Staff and Marketing Officer for North America | Occupation(s) During the Past Five Years: Corporate |
| and Corporate Vice President (retired 2008) of Xerox | Vice President and Chief Global Diversity Officer |
| Corporation (document management products and | (retired 2008) and Member of the Executive |
| services); Executive in Residence and 2010 | Committee (1997–2008) of Johnson & Johnson |
| Distinguished Minett Professor at the Rochester | (pharmaceuticals/medical devices/consumer |
| Institute of Technology; Director of SPX Corporation | products); Director of Skytop Lodge Corporation |
| (multi-industry manufacturing), the United Way of | (hotels), the University Medical Center at Princeton, |
| Rochester, Amerigroup Corporation (managed health | the Robert Wood Johnson Foundation, and the Center |
| care), the University of Rochester Medical Center, | for Talent Innovation; Member of the Advisory Board |
| Monroe Community College Foundation, and North | of the Maxwell School of Citizenship and Public Affairs |
| Carolina A&T University. | at Syracuse University. |
| |
| Rajiv L. Gupta | F. Joseph Loughrey |
| Born 1945. Trustee Since December 2001.2 | Born 1949. Trustee Since October 2009. Principal |
| Principal Occupation(s) During the Past Five Years: | Occupation(s) During the Past Five Years: President |
| Chairman and Chief Executive Officer (retired 2009) | and Chief Operating Officer (retired 2009) of Cummins |
| and President (2006–2008) of Rohm and Haas Co. | Inc. (industrial machinery); Chairman of the Board of |
| (chemicals); Director of Tyco International, Ltd. | Hillenbrand, Inc. (specialized consumer services) and |
| (diversified manufacturing and services), Hewlett- | of Oxfam America; Director of SKF AB (industrial |
| Packard Co. (electronic computer manufacturing), | |
| | |
| machinery), Hyster-Yale Materials Handling, Inc. | Executive Officers | |
| (forklift trucks), and the Lumina Foundation for | | |
| Education; Member of the Advisory Council for the | Glenn Booraem | |
| College of Arts and Letters and of the Advisory Board | Born 1967. Controller Since July 2010. Principal |
| to the Kellogg Institute for International Studies, both | Occupation(s) During the Past Five Years: Principal |
| at the University of Notre Dame. | of The Vanguard Group, Inc.; Controller of each of |
| | the investment companies served by The Vanguard |
| Mark Loughridge | Group; Assistant Controller of each of the investment |
| Born 1953. Trustee Since March 2012. Principal | companies served by The Vanguard Group (2001–2010). |
| Occupation(s) During the Past Five Years: Senior Vice | | |
| President and Chief Financial Officer at IBM (information | Thomas J. Higgins | |
| technology services); Fiduciary Member of IBM’s | Born 1957. Chief Financial Officer Since September |
| Retirement Plan Committee. | 2008. Principal Occupation(s) During the Past Five |
| | Years: Principal of The Vanguard Group, Inc.; Chief |
| Scott C. Malpass | Financial Officer of each of the investment companies |
| Born 1962. Trustee Since March 2012. Principal | served by The Vanguard Group; Treasurer of each of |
| Occupation(s) During the Past Five Years: Chief | the investment companies served by The Vanguard |
| Investment Officer and Vice President at the University | Group (1998–2008). | |
| of Notre Dame; Assistant Professor of Finance at the | | |
| Mendoza College of Business at Notre Dame; Member | Kathryn J. Hyatt | |
| of the Notre Dame 403(b) Investment Committee; | Born 1955. Treasurer Since November 2008. Principal |
| Director of TIFF Advisory Services, Inc. (investment | Occupation(s) During the Past Five Years: Principal of |
| advisor); Member of the Investment Advisory | The Vanguard Group, Inc.; Treasurer of each of the |
| Committees of the Financial Industry Regulatory | investment companies served by The Vanguard |
| Authority (FINRA) and of Major League Baseball. | Group; Assistant Treasurer of each of the investment |
| | companies served by The Vanguard Group (1988–2008). |
| André F. Perold | | |
| Born 1952. Trustee Since December 2004. Principal | Heidi Stam | |
| Occupation(s) During the Past Five Years: George | Born 1956. Secretary Since July 2005. Principal |
| Gund Professor of Finance and Banking at the Harvard | Occupation(s) During the Past Five Years: Managing |
| Business School (retired 2011); Chief Investment | Director of The Vanguard Group, Inc.; General Counsel |
| Officer and Managing Partner of HighVista Strategies | of The Vanguard Group; Secretary of The Vanguard |
| LLC (private investment firm); Director of Rand | Group and of each of the investment companies |
| Merchant Bank; Overseer of the Museum of Fine | served by The Vanguard Group; Director and Senior |
| Arts Boston. | Vice President of Vanguard Marketing Corporation. |
| |
| Alfred M. Rankin, Jr. | | |
| | Vanguard Senior ManagementTeam |
| Born 1941. Trustee Since January 1993. Principal | | |
| Occupation(s) During the Past Five Years: Chairman, | Mortimer J. Buckley | Chris D. McIsaac |
| President, and Chief Executive Officer of NACCO | Kathleen C. Gubanich | Michael S. Miller |
| Industries, Inc. (housewares/lignite) and of Hyster-Yale | Paul A. Heller | James M. Norris |
| Materials Handling, Inc. (forklift trucks); Director of | Martha G. King | Glenn W. Reed |
| the National Association of Manufacturers; Chairman | John T. Marcante | |
| of the Board of University Hospitals of Cleveland; | | |
| Advisory Chairman of the Board of The Cleveland | | |
| Museum of Art. | Chairman Emeritus and Senior Advisor |
| | |
| | John J. Brennan | |
| Chairman, 1996–2009 | |
| Peter F. Volanakis | Chief Executive Officer and President, 1996–2008 |
| Born 1955. Trustee Since July 2009. Principal | | |
| Occupation(s) During the Past Five Years: President | | |
| and Chief Operating Officer (retired 2010) of Corning | | |
| Incorporated (communications equipment); Director | Founder | |
| of SPX Corporation (multi-industry manufacturing); | John C. Bogle | |
| Overseer of the Amos Tuck School of Business | | |
| Administration at Dartmouth College; Advisor to the | Chairman and Chief Executive Officer, 1974–1996 |
| Norris Cotton Cancer Center. | | |
1 Mr. McNabb is considered an “interested person,” as defined in the Investment Company Act of 1940, because he is an officer of the
Vanguard funds.
2 December 2002 for Vanguard Equity Income Fund, Vanguard Growth Equity Fund, the Vanguard Municipal Bond Funds, and the Vanguard
State Tax-Exempt Funds.
|  |
| | P.O. Box 2600 |
| | Valley Forge, PA 19482-2600 |
| |
| |
| |
| Connect with Vanguard® > vanguard.com | |
| |
| |
| |
| Fund Information > 800-662-7447 | |
| Direct Investor Account Services > 800-662-2739 | |
| Institutional Investor Services > 800-523-1036 | |
| Text Telephone for People | |
| With Hearing Impairment > 800-749-7273 | |
| |
| This material may be used in conjunction | |
| with the offering of shares of any Vanguard | |
| fund only if preceded or accompanied by | |
| the fund’s current prospectus. | |
| |
| All comparative mutual fund data are from Lipper, a | |
| Thomson Reuters Company, or Morningstar, Inc., unless | |
| otherwise noted. | |
| |
| You can obtain a free copy of Vanguard’s proxy voting | |
| guidelines by visiting vanguard.com/proxyreporting or by | |
| calling Vanguard at 800-662-2739. The guidelines are | |
| also available from the SEC’s website, sec.gov. In | |
| addition, you may obtain a free report on how your fund | |
| voted the proxies for securities it owned during the 12 | |
| months ended June 30. To get the report, visit either | |
| vanguard.com/proxyreporting or sec.gov. | |
| |
| You can review and copy information about your fund at | |
| the SEC’s Public Reference Room in Washington, D.C. To | |
| find out more about this public service, call the SEC at | |
| 202-551-8090. Information about your fund is also | |
| available on the SEC’s website, and you can receive | |
| copies of this information, for a fee, by sending a | |
| request in either of two ways: via e-mail addressed to | |
| publicinfo@sec.gov or via regular mail addressed to the | |
| Public Reference Section, Securities and Exchange | |
| Commission, Washington, DC 20549-1520. | |
| |
| | © 2013 The Vanguard Group, Inc. |
| | All rights reserved. |
| | Vanguard Marketing Corporation, Distributor. |
| |
| | Q1260 122013 |

Annual Report | October 31, 2013
Vanguard High Dividend Yield Index Fund

Vanguard’s Principles for Investing Success
We want to give you the best chance of investment success. These principles,
grounded in Vanguard’s research and experience, can put you on the right path.
Goals. Create clear, appropriate investment goals.
Balance. Develop a suitable asset allocation using broadly diversified funds.
Cost. Minimize cost.
Discipline. Maintain perspective and long-term discipline.
A single theme unites these principles: Focus on the things you can control.
We believe there is no wiser course for any investor.
| |
| Contents | |
| Your Fund’s Total Returns. | 1 |
| Chairman’s Letter. | 2 |
| Fund Profile. | 8 |
| Performance Summary. | 9 |
| Financial Statements. | 11 |
| Your Fund’s After-Tax Returns. | 26 |
| About Your Fund’s Expenses. | 27 |
| Glossary. | 29 |
Please note: The opinions expressed in this report are just that—informed opinions. They should not be considered promises or advice.
Also, please keep in mind that the information and opinions cover the period through the date on the front of this report. Of course, the
risks of investing in your fund are spelled out in the prospectus.
See the Glossary for definitions of investment terms used in this report.
About the cover: The ship's wheel represents leadership and guidance, essential qualities in navigating difficult seas.
This one is a replica based on an 18th-century British vessel. The HMS Vanguard, another ship of that era, served as the
flagship for Admiral Horatio Nelson when he defeated a French fleet at the Battle of the Nile.
Your Fund’s Total Returns
| |
| Fiscal Year Ended October 31, 2013 | |
| |
| | Total |
| | Returns |
| Vanguard High Dividend Yield Index Fund | |
| Investor Shares | 24.35% |
| ETF Shares | |
| Market Price | 24.51 |
| Net Asset Value | 24.43 |
| FTSE High Dividend Yield Index | 24.49 |
| Equity Income Funds Average | 23.39 |
| Equity Income Funds Average: Derived from data provided by Lipper, a Thomson Reuters Company. |
The Vanguard ETF® Shares shown are traded on the NYSE Arca exchange and are available only through brokers. The table provides ETF
returns based on both the NYSE Arca market price and the net asset value for a share. U.S. Pat. Nos. 6,879,964; 7,337,138; 7,720,749;
7,925,573; 8,090,646; and 8,417,623.
For the ETF Shares, the market price is determined by the midpoint of the bid-offer spread as of the closing time of the New York Stock
Exchange (generally 4 p.m., Eastern time). The net asset value is also determined as of the NYSE closing time. For more information about
how the ETF Shares' market prices have compared with their net asset value, visit vanguard.com, select your ETF, and then select the Price
and Performance tab. The ETF premium/discount analysis there shows the percentages of days on which the ETF Shares' market price was
above or below the NAV.
Your Fund’s Performance at a Glance
October 31, 2012, Through October 31, 2013
| | | | |
| | | | Distributions Per Share |
| | Starting | Ending | | |
| | Share | Share | Income | Capital |
| | Price | Price | Dividends | Gains |
| Vanguard High Dividend Yield Index Fund | | | | |
| Investor Shares | $19.76 | $23.83 | $0.660 | $0.000 |
| ETF Shares | 49.89 | 60.16 | 1.709 | 0.000 |
1

Chairman’s Letter
Dear Shareholder,
Dividend-paying stocks, which outshone the broad U.S. stock market in the two fiscal years previous to the one just ended, didn’t match the market’s swift pace in the recent period. For the 12 months ended October 31, 2013, Vanguard High Dividend Yield Index Fund returned 24.35% for Investor Shares and 24.43% for ETF Shares based on net asset value.
The fund’s return was in line with that of its benchmark, the FTSE High Dividend Yield Index, and led the average return of equity income peer funds by about 1 percentage point. However, the fund trailed the broad U.S. stock market by almost 5 percentage points.
As of October 31, the 30-day SEC yield of the fund’s Investor Shares was 2.96%, compared with the 1.73% yield of the broad stock market as measured by the Investor Shares of Vanguard Total Stock Market Index Fund. All ten industry sectors registered double-digit gains, with industrials and financials leading the way.
If you own shares of the fund in a taxable account, you may wish to review the fund’s after-tax returns presented later in this report.
2
Stocks found a path to strong returns
U.S. stocks faced several challenges en route to an impressive return of about 29% for the 12 months ended October 31, 2013. Investors’ growing appetite for risk drove the rise in stocks, as corporate profit growth, in general, wasn’t particularly tantalizing.
Although the end of the fiscal year was notable for the budget impasse that resulted in October’s 16-day partial federal government shutdown, the period as a whole was marked by uncertainties about Federal Reserve monetary policy and concern about the economy’s patchy growth. Vanguard’s chief economist, Joe Davis, recently noted that “as was the case at the start of the year, the U.S. economy continues to expand at a modest and uneven pace.”
The disparity between the performance of the U.S. economy and U.S. stocks may seem surprising—but Vanguard research has shown that over the long term, a nation’s economic growth has a weak relationship with its stock returns. (You can read more in The Outlook for Emerging Market Stocks in a Lower-Growth World, available at vanguard.com/research.)
Outside of the United States, stocks returned about 20%. The developed markets of Europe and the Pacific region delivered robust gains; emerging-market stocks failed to keep pace.
| | | |
| Market Barometer | | | |
| |
| | Average Annual Total Returns |
| | | Periods Ended October 31, 2013 |
| | One | Three | Five |
| | Year | Years | Years |
| Stocks | | | |
| Russell 1000 Index (Large-caps) | 28.40% | 16.83% | 15.84% |
| Russell 2000 Index (Small-caps) | 36.28 | 17.69 | 17.04 |
| Russell 3000 Index (Broad U.S. market) | 28.99 | 16.89 | 15.94 |
| MSCI All Country World Index ex USA (International) | 20.29 | 6.04 | 12.48 |
| |
| Bonds | | | |
| Barclays U.S. Aggregate Bond Index (Broad taxable market) | -1.08% | 3.02% | 6.09% |
| Barclays Municipal Bond Index (Broad tax-exempt market) | -1.72 | 3.60 | 6.37 |
| Citigroup Three-Month U.S. Treasury Bill Index | 0.06 | 0.07 | 0.12 |
| |
| CPI | | | |
| Consumer Price Index | 0.96% | 2.21% | 1.52% |
3
Bond returns suffered as investors kept an eye on the Fed
With investors fretting over the Fed’s next move in its stimulative bond-buying program, bonds recorded negative results for the 12 months. The broad U.S. taxable bond market returned –1.08%. The yield of the 10-year Treasury note closed at 2.54%, down from 2.63% at September’s close, but up from 1.69% at the end of the last fiscal year. (Bond yields and prices move in opposite directions.) Municipal bonds returned –1.72%.
Outside of the United States, bond markets (as measured by the Barclays Global Aggregate Index ex USD) returned –1.95%.
The Fed’s target for short-term interest rates remained at 0%–0.25%, severely limiting returns of money market funds and savings accounts.
Dividend payers cooled off as the investing climate changed
In the two fiscal years previous to the one just ended, yield-hungry, risk-averse investors sought dividend-oriented stocks as the stock market was often jittery and the economic recovery uncertain. Dividend-paying funds mostly invest in stocks of large companies, which tend to withstand market volatility better than their smaller, less established counterparts.
| | | |
| Expense Ratios | | | |
| Your Fund Compared With Its Peer Group | | | |
| |
| | Investor | ETF | Peer Group |
| | Shares | Shares | Average |
| High Dividend Yield Index Fund | 0.20% | 0.10% | 1.27% |
The fund expense ratios shown are from the prospectus dated February 22, 2013, and represent estimated costs for the current fiscal year.
For the fiscal year ended October 31, 2013, the fund’s expense ratios were 0.19% for Investor Shares and 0.10% for ETF Shares. The
peer-group expense ratio is derived from data provided by Lipper, a Thomson Reuters Company, and captures information through year-end
2012.
Peer group: Equity Income Funds.
4
However, the investing landscape changed during the recent fiscal year, when the stock market surged far more than it stumbled. Investors grew more comfortable with risk and looked less to dividend payers and more toward growth opportunities.
Vanguard High Dividend Yield Index Fund and the broad U.S. stock market had nearly identical returns for the fiscal year’s first six months. However, the fund trailed the broad market—for the first time since fiscal 2010—by several percentage points in the period’s second half. Of course, this underperformance does nothing to change our view that long-term exposure to high dividend-paying stocks can play a part in the well-diversified portfolio of an investor seeking equity income.
Industrial stocks, a traditional dividend source and the fund’s second-largest sector, advanced more than 40%. Gains occurred across the spectrum as corporate budgets increased, businesses expanded, and manufacturers kept producing. Diversified industrial giants, aerospace and defense corporations, support services firms, and transportation companies were among the sector’s leaders.
The fund’s financial stocks posted a return of about 35%; banks, asset managers, investment services firms, and insurance companies contributed most. The fertile investment climate, solid balance sheets, improved lending conditions, and a muted catastrophe environment boosted results.
| |
| Total Returns | |
| Inception Through October 31, 2013 | |
| | Average |
| | Annual Return |
| High Dividend Yield Index Fund Investor Shares (Returns since inception: 11/16/2006) | 5.60% |
| FTSE High Dividend Yield Index | 5.84 |
| Equity Income Funds Average | 4.91 |
| Equity Income Funds Average: Derived from data provided by Lipper, a Thomson Reuters Company. |
The figures shown represent past performance, which is not a guarantee of future results. (Current performance may be
lower or higher than the performance data cited. For performance data current to the most recent month-end, visit our
website at vanguard.com/performance.) Note, too, that both investment returns and principal value can fluctuate widely, so
an investor’s shares, when sold, could be worth more or less than their original cost.
5
The consumer goods, health care, technology, consumer services, and basic materials sectors all generated returns of 20% or more. A wide variety of industries and businesses took part in the stock market’s climb and benefited from the economy’s recovery. Although they lagged the field, oil and gas, utilities, and telecommunications still recorded double-digit gains.
The fund has made strides with each passing year
Just about every mutual fund’s record improves as we move further away from the 2008–2009 financial crisis. This effect is particularly noticeable in the High Dividend Yield Index Fund, which launched in November 2006 and suffered a –32% decline in fiscal 2008—its second year of existence.
The fund, which has now notched positive results in six of its seven fiscal years and double-digit returns in five, has an average annual return of 5.60% from inception through October 31, 2013. Its benchmark (which bears no expenses) returned 5.84%, and its peer group’s average return was 4.91%.
Credit for the fund’s success in tightly tracking its benchmark goes to its advisor, Vanguard Equity Investment Group, which uses sophisticated portfolio construction and trading techniques to reach its goal. Investors in the fund were also able to keep more of their returns thanks to its low expenses.
Watching costs is especially important for investors seeking income, because expenses are deducted from the income generated by the fund’s holdings. The higher the expenses, the greater the share of income that gets diverted to pay them. Vanguard High Dividend Yield Index Fund had an expense ratio of 0.20% for Investor Shares. The average equity income mutual fund expense ratio was more than six times higher: 1.27%, according to data from Lipper as of December 31, 2012.
In challenging markets, index funds can be a solid portfolio foundation
As you know, index funds seek to capture the return of the market they track, minus only their operating expenses, which—at least at Vanguard—are typically very low. They do so by investing in an entire market or by relying on a sophisticated sampling technique.
In actively managed funds, by contrast, advisors troll the markets and reel in selected stocks or bonds that their analysis suggests will allow them to outperform their benchmarks. As we show in The Case for Index Fund Investing, a paper available at vanguard.com/research, there’s typically a big gap between hope and reality: Consistent outperformance by any one active manager has been rare.
I use the word “typically” because we believe that some actively managed funds, including Vanguard’s, can increase the odds of outperforming their benchmarks
6
over the long term. As demonstrated in a companion paper, The Case for Vanguard Active Management: Solving the Low-Cost/Top-Talent Paradox? (also at vanguard.com/research), the most reliable quantitative indicator of future manager success is low expenses—a Vanguard hallmark. As the paper’s title also implies, finding talented advisors is another key aspect of active investing. We believe we have the process in place to identify the best.
Even so, investors in actively managed funds should expect and be comfortable with the extended periods of underperfor-mance that such funds can undergo. These challenges help further clarify the potential benefits of indexing. Well-run index funds can offer you virtually the market return, year in and year out.
In a portfolio that is diversified within asset classes and balanced among them, low-cost index funds can be the bedrock of a sound investment plan.
As always, thank you for entrusting your assets to Vanguard.
Sincerely,

F. William McNabb III
Chairman and Chief Executive Officer
November 14, 2013
7
High Dividend Yield Index Fund
Fund Profile
As of October 31, 2013
| | |
| Share-Class Characteristics | |
| |
| | Investor | ETF |
| | Shares | Shares |
| Ticker Symbol | VHDYX | VYM |
| Expense Ratio1 | 0.20% | 0.10% |
| 30-Day SEC Yield | 2.96% | 3.05% |
| | | |
| Portfolio Characteristics | | |
| | | | DJ U.S. |
| | | FTSE High | Total |
| | | Dividend | Market |
| | | Yield | FA |
| | Fund | Index | Index |
| Number of Stocks | 384 | 384 | 3,612 |
| Median Market Cap | $99.0B | $99.0B | $41.6B |
| Price/Earnings Ratio | 16.8x | 16.7x | 19.8x |
| Price/Book Ratio | 2.5x | 2.5x | 2.5x |
| Return on Equity | 18.3% | 18.3% | 16.5% |
| Earnings Growth | | | |
| Rate | 5.8% | 5.8% | 10.6% |
| Dividend Yield | 3.1% | 3.1% | 1.9% |
| Foreign Holdings | 0.0% | 0.0% | 0.0% |
| Turnover Rate | 13% | — | — |
| Short-Term Reserves | -0.1% | — | — |
| | | |
| Sector Diversification (% of equity exposure) |
| | | FTSE High | DJ U.S. |
| | | Dividend | Total |
| | | Yield | Market |
| | Fund | Index | FA Index |
| Basic Materials | 3.9% | 3.9% | 3.1% |
| Consumer Goods | 15.4 | 15.4 | 10.4 |
| Consumer Services | 7.1 | 7.1 | 13.7 |
| Financials | 12.5 | 12.4 | 18.3 |
| Health Care | 11.8 | 11.8 | 11.8 |
| Industrials | 14.6 | 14.6 | 13.2 |
| Oil & Gas | 12.1 | 12.1 | 9.5 |
| Technology | 9.3 | 9.4 | 14.6 |
| Telecommunications | 5.1 | 5.1 | 2.2 |
| Utilities | 8.2 | 8.2 | 3.2 |
| | |
| Volatility Measures | | |
| | FTSE High | |
| | Dividend | DJ U.S. |
| | Yield | Total Market |
| | Index | FA Index |
| R-Squared | 1.00 | 0.86 |
| Beta | 1.00 | 0.74 |
| These measures show the degree and timing of the fund’s fluctuations compared with the indexes over 36 months. |
| | |
| Ten Largest Holdings (% of total net assets) |
| Exxon Mobil Corp. | Integrated Oil & Gas | 5.5% |
| General Electric Co. | Diversified Industrials | 3.7 |
| Microsoft Corp. | Software | 3.7 |
| Johnson & Johnson | Pharmaceuticals | 3.5 |
| Chevron Corp. | Integrated Oil & Gas | 3.2 |
| Wells Fargo & Co. | Banks | 3.1 |
| Procter & Gamble Co. | Nondurable | |
| | Household Products | 3.1 |
| Pfizer Inc. | Pharmaceuticals | 2.8 |
| JPMorgan Chase & Co. | Banks | 2.7 |
| AT&T Inc. | Fixed Line | |
| | Telecommunications | 2.7 |
| Top Ten | | 34.0% |
| The holdings listed exclude any temporary cash investments and equity index products. |
Investment Focus

1 The expense ratios shown are from the prospectus dated February 22, 2013, and represent estimated costs for the current fiscal year. For
the fiscal year ended October 31, 2013, the expense ratios were 0.19% for Investor Shares and 0.10% for ETF Shares.
8
High Dividend Yield Index Fund
Performance Summary
All of the returns in this report represent past performance, which is not a guarantee of future results that may be achieved by the fund. (Current performance may be lower or higher than the performance data cited. For performance data current to the most recent month-end, visit our website at vanguard.com/performance.) Note, too, that both investment returns and principal value can fluctuate widely, so an investor’s shares, when sold, could be worth more or less than their original cost. The returns shown do not reflect taxes that a shareholder would pay on fund distributions or on the sale of fund shares.
Cumulative Performance: November 16, 2006, Through October 31, 2013
Initial Investment of $10,000
| | | | | |
| | | Average Annual Total Returns | |
| | | Periods Ended October 31, 2013 | |
| | | | | Since | Final Value |
| | | One | Five | Inception | of a $10,000 |
| | | Year | Years | (11/16/2006) | Investment |
| | High Dividend Yield Index | | | | |
| | Fund*Investor Shares | 24.35% | 14.34% | 5.60% | $14,605 |
| •••••••• | FTSE High Dividend Yield Index | 24.49 | 14.58 | 5.84 | 14,840 |
| – – – – | Equity Income Funds Average | 23.39 | 13.64 | 4.91 | 13,960 |
| | Dow Jones U.S. Total Stock Market | | | | |
| | Float Adjusted Index | 28.86 | 16.01 | 6.11 | 15,104 |
| Equity Income Funds Average: Derived from data provided by Lipper, a Thomson Reuters Company. |
| "Since Inception" performance is calculated from the Investor Shares’ inception date for both the fund and its comparative standards. |
| | | | |
| | | | Since | Final Value |
| | One | Five | Inception | of a $10,000 |
| | Year | Years | (11/10/2006) | Investment |
| High Dividend Yield Index Fund | | | | |
| ETF Shares Net Asset Value | 24.43% | 14.47% | 5.84% | $14,858 |
| FTSE High Dividend Yield Index | 24.49 | 14.58 | 5.95 | 14,964 |
| Dow Jones U.S. Total Stock Market Float | | | | |
| Adjusted Index | 28.86 | 16.01 | 6.33 | 15,339 |
| "Since Inception" performance is calculated from the ETF Shares’ inception date for both the fund and its comparative standards. |
See Financial Highlights for dividend and capital gains information.
9
High Dividend Yield Index Fund
Cumulative Returns of ETF Shares: November 10, 2006, Through October 31, 2013
| | | |
| | | | Since |
| | One | Five | Inception |
| | Year | Years | (11/10/2006) |
| High Dividend Yield Index Fund ETF Shares | | | |
| iMarket Price | 24.51% | 96.20% | 48.69% |
| High Dividend Yield Index Fund ETF Shares Net | | | |
| Asset Value | 24.43 | 96.58 | 48.58 |
| FTSE High Dividend Yield Index | 24.49 | 97.50 | 49.64 |
| "Since Inception" performance is calculated from the ETF Shares’ inception date for both the fund and its comparative standards. |
Fiscal-Year Total Returns (%): November 16, 2006, Through October 31, 2013

Average Annual Total Returns: Periods Ended September 30, 2013
This table presents returns through the latest calendar quarter—rather than through the end of the fiscal period.
Securities and Exchange Commission rules require that we provide this information.
| | | | |
| | Inception | One | Five | Since |
| | Date | Year | Years | Inception |
| Investor Shares | 11/16/2006 | 17.58% | 9.79% | 4.96% |
| ETF Shares | 11/10/2006 | | | |
| Market Price | | 17.70 | 9.85 | 5.21 |
| Net Asset Value | | 17.69 | 9.92 | 5.21 |
10
High Dividend Yield Index Fund
Financial Statements
Statement of Net Assets
As of October 31, 2013
The fund reports a complete list of its holdings in regulatory filings four times in each fiscal year, at the quarter-ends. For the second and fourth fiscal quarters, the lists appear in the fund’s semiannual and annual reports to shareholders. For the first and third fiscal quarters, the fund files the lists with the Securities and Exchange Commission on Form N-Q. Shareholders can look up the fund’s Forms N-Q on the SEC’s website at sec.gov. Forms N-Q may also be reviewed and copied at the SEC’s Public Reference Room (see the back cover of this report for further information).
| | |
| | | Market |
| | | Value |
| | Shares | ($000) |
| Common Stocks (99.8%)1 | | |
| Basic Materials (4.0%) | | |
| EI du Pont de Nemours | | |
| & Co. | 1,268,306 | 77,620 |
| Dow Chemical Co. | 1,670,096 | 65,919 |
| Freeport-McMoRan | | |
| Copper & Gold Inc. | 1,432,300 | 52,651 |
| LyondellBasell Industries | | |
| NV Class A | 613,609 | 45,775 |
| Air Products | | |
| & Chemicals Inc. | 286,547 | 31,237 |
| International Paper Co. | 613,956 | 27,389 |
| Nucor Corp. | 437,116 | 22,630 |
| Newmont Mining Corp. | 676,534 | 18,442 |
| RPM International Inc. | 183,298 | 7,097 |
| Southern Copper Corp. | 234,753 | 6,561 |
| Avery Dennison Corp. | 135,289 | 6,375 |
| Steel Dynamics Inc. | 287,414 | 5,165 |
| Huntsman Corp. | 221,305 | 5,139 |
| Sensient Technologies | | |
| Corp. | 69,112 | 3,603 |
| Compass Minerals | | |
| International Inc. | 45,917 | 3,419 |
| Commercial Metals Co. | 143,190 | 2,629 |
| Olin Corp. | 105,691 | 2,379 |
| Tronox Ltd. Class A | 85,775 | 1,981 |
| Innophos Holdings Inc. | 30,087 | 1,508 |
| A Schulman Inc. | 40,383 | 1,337 |
| Koppers Holdings Inc. | 24,880 | 1,107 |
| AMCOL International Corp. | 33,377 | 1,071 |
| Gold Resource Corp. | 44,496 | 231 |
| | | 391,265 |
| Consumer Goods (15.4%) | | |
| Procter & Gamble Co. | 3,791,694 | 306,179 |
| Coca-Cola Co. | 5,838,557 | 231,032 |
| Philip Morris | | |
| International Inc. | 2,233,483 | 199,048 |
| PepsiCo Inc. | 2,134,555 | 179,495 |
| Altria Group Inc. | 2,773,525 | 103,258 |
| | |
| Ford Motor Co. | 5,314,810 | 90,936 |
| Kimberly-Clark Corp. | 530,892 | 57,336 |
| General Mills Inc. | 893,317 | 45,041 |
| Kraft Foods Group Inc. | 812,438 | 44,180 |
| Lorillard Inc. | 516,060 | 26,324 |
| Reynolds American Inc. | 437,965 | 22,498 |
| Kellogg Co. | 340,166 | 21,515 |
| Mattel Inc. | 473,599 | 21,014 |
| ConAgra Foods Inc. | 582,576 | 18,532 |
| Stanley Black & Decker | | |
| Inc. | 220,798 | 17,463 |
| Genuine Parts Co. | 214,697 | 16,925 |
| Clorox Co. | 179,043 | 16,148 |
| Dr Pepper Snapple | | |
| Group Inc. | 281,097 | 13,310 |
| Autoliv Inc. | 131,397 | 11,724 |
| Campbell Soup Co. | 250,513 | 10,664 |
| Molson Coors Brewing Co. | | |
| Class B | 185,205 | 10,001 |
| Herbalife Ltd. | 142,195 | 9,217 |
| Hasbro Inc. | 160,051 | 8,267 |
| Nu Skin Enterprises Inc. | | |
| Class A | 69,582 | 8,136 |
| Flowers Foods Inc. | 241,126 | 6,110 |
| Leggett & Platt Inc. | 196,999 | 5,859 |
| Gentex Corp. | 198,665 | 5,849 |
| Tupperware Brands Corp. | 63,424 | 5,686 |
| Scotts Miracle-Gro Co. | | |
| Class A | 49,183 | 2,888 |
| Schweitzer-Mauduit | | |
| International Inc. | 40,817 | 2,526 |
| B&G Foods Inc. | 72,340 | 2,449 |
| HNI Corp. | 59,036 | 2,293 |
| Steelcase Inc. Class A | 121,382 | 1,989 |
| Snyders-Lance Inc. | 62,776 | 1,883 |
| Universal Corp. | 31,993 | 1,697 |
| Vector Group Ltd. | 89,713 | 1,451 |
| Knoll Inc. | 58,085 | 954 |
| | | 1,529,877 |
11
High Dividend Yield Index Fund
| | |
| | | Market |
| | | Value |
| | Shares | ($000) |
| Consumer Services (7.1%) | | |
| Wal-Mart Stores Inc. | 2,271,633 | 174,348 |
| McDonald’s Corp. | 1,385,435 | 133,722 |
| Walgreen Co. | 1,208,773 | 71,608 |
| Time Warner Cable Inc. | 394,393 | 47,386 |
| Las Vegas Sands Corp. | 567,718 | 39,865 |
| Sysco Corp. | 819,102 | 26,490 |
| Omnicom Group Inc. | 356,892 | 24,308 |
| Carnival Corp. | 575,272 | 19,933 |
| Wynn Resorts Ltd. | 112,391 | 18,685 |
| Kohl’s Corp. | 284,794 | 16,176 |
| Best Buy Co. Inc. | 375,077 | 16,053 |
| Staples Inc. | 916,450 | 14,773 |
| Safeway Inc. | 331,567 | 11,572 |
| H&R Block Inc. | 373,943 | 10,635 |
| Darden Restaurants Inc. | 178,966 | 9,222 |
| GameStop Corp. Class A | 162,169 | 8,890 |
| Gannett Co. Inc. | 315,561 | 8,732 |
| Six Flags Entertainment | | |
| Corp. | 131,047 | 4,929 |
| Cinemark Holdings Inc. | 144,047 | 4,726 |
| KAR Auction Services Inc. | 152,417 | 4,530 |
| Brinker International Inc. | 91,390 | 4,060 |
| Cablevision Systems Corp. | | |
| Class A | 258,321 | 4,017 |
| Wendy’s Co. | 424,166 | 3,686 |
| Cracker Barrel Old Country | | |
| Store Inc. | 30,545 | 3,356 |
| Guess? Inc. | 88,150 | 2,755 |
| Meredith Corp. | 49,621 | 2,546 |
| Hillenbrand Inc. | 85,878 | 2,423 |
| Bob Evans Farms Inc. | 37,845 | 2,161 |
| Regal Entertainment Group | | |
| Class A | 111,202 | 2,114 |
| DineEquity Inc. | 24,042 | 1,973 |
| Copa Holdings SA Class A | 11,535 | 1,725 |
| Belo Corp. Class A | 107,377 | 1,474 |
| Valassis | | |
| Communications Inc. | 50,041 | 1,369 |
| National CineMedia Inc. | 76,453 | 1,339 |
| CEC Entertainment Inc. | 24,254 | 1,124 |
| CTC Media Inc. | 82,057 | 1,037 |
| Cato Corp. Class A | 32,169 | 964 |
| Weis Markets Inc. | 17,534 | 897 |
| Harte-Hanks Inc. | 55,269 | 441 |
| Speedway Motorsports Inc. | 18,958 | 346 |
| Schawk Inc. Class A | 15,302 | 224 |
| | | 706,614 |
| Financials (12.4%) | | |
| Wells Fargo & Co. | 7,298,519 | 311,574 |
| JPMorgan Chase & Co. | 5,243,374 | 270,243 |
| PNC Financial Services | | |
| Group Inc. | 733,498 | 53,934 |
| BlackRock Inc. | 175,474 | 52,784 |
| Prudential Financial Inc. | 640,332 | 52,117 |
| | | |
| | Aflac Inc. | 623,771 | 40,533 |
| | Marsh & McLennan | | |
| | Cos. Inc. | 760,826 | 34,846 |
| | BB&T Corp. | 971,410 | 32,999 |
| | CME Group Inc. | 435,207 | 32,297 |
| | Fifth Third Bancorp | 1,175,204 | 22,364 |
| | Invesco Ltd. | 612,883 | 20,685 |
| | Principal Financial | | |
| | Group Inc. | 407,339 | 19,332 |
| | M&T Bank Corp. | 157,949 | 17,774 |
| | SLM Corp. | 601,664 | 15,264 |
| ^ | NYSE Euronext | 335,429 | 14,766 |
| | Western Union Co. | 769,051 | 13,089 |
| | Willis Group Holdings plc | 241,756 | 10,896 |
| | Huntington | | |
| | Bancshares Inc. | 1,144,390 | 10,071 |
| | Cincinnati Financial Corp. | 195,803 | 9,790 |
| | New York Community | | |
| | Bancorp Inc. | 582,800 | 9,447 |
| | Fidelity National Financial | | |
| | Inc. Class A | 315,136 | 8,871 |
| | Arthur J Gallagher & Co. | 176,058 | 8,354 |
| | PartnerRe Ltd. | 74,613 | 7,477 |
| | Axis Capital Holdings Ltd. | 148,397 | 7,037 |
| | Waddell & Reed Financial | | |
| | Inc. Class A | 109,236 | 6,745 |
| | People’s United | | |
| | Financial Inc. | 443,441 | 6,399 |
| | Old Republic | | |
| | International Corp. | 331,050 | 5,558 |
| | Hudson City Bancorp Inc. | 603,545 | 5,420 |
| | First Niagara Financial | | |
| | Group Inc. | 466,455 | 5,145 |
| | Cullen/Frost Bankers Inc. | 71,918 | 5,091 |
| | FirstMerit Corp. | 224,781 | 5,049 |
| | Protective Life Corp. | 109,312 | 5,037 |
| | Validus Holdings Ltd. | 112,725 | 4,450 |
| | Hancock Holding Co. | 113,294 | 3,714 |
| | StanCorp Financial | | |
| | Group Inc. | 61,493 | 3,622 |
| | Hanover Insurance | | |
| | Group Inc. | 60,762 | 3,557 |
| | Bank of Hawaii Corp. | 59,563 | 3,453 |
| | Federated Investors Inc. | | |
| | Class B | 124,894 | 3,387 |
| | Fulton Financial Corp. | 269,371 | 3,289 |
| | Endurance Specialty | | |
| | Holdings Ltd. | 56,863 | 3,144 |
| | Symetra Financial Corp. | 162,725 | 3,048 |
| | Glacier Bancorp Inc. | 101,576 | 2,807 |
| | BankUnited Inc. | 87,102 | 2,680 |
| | Capitol Federal | | |
| | Financial Inc. | 205,490 | 2,604 |
| | Janus Capital Group Inc. | 259,504 | 2,561 |
| | Valley National Bancorp | 261,345 | 2,548 |
12
| | |
| High Dividend Yield Index Fund | |
| |
| |
| |
| | | Market |
| | | Value |
| | Shares | ($000) |
| Erie Indemnity Co. Class A | 35,384 | 2,541 |
| FNB Corp. | 189,756 | 2,374 |
| Umpqua Holdings Corp. | 143,626 | 2,351 |
| Trustmark Corp. | 83,962 | 2,280 |
| Home Loan Servicing | | |
| Solutions Ltd. | 94,199 | 2,224 |
| Old National Bancorp | 139,808 | 2,033 |
| Kemper Corp. | 54,129 | 2,004 |
| PacWest Bancorp | 52,247 | 1,988 |
| Iberiabank Corp. | 33,472 | 1,956 |
| Greenhill & Co. Inc. | 35,985 | 1,846 |
| Community Bank | | |
| System Inc. | 50,078 | 1,818 |
| Northwest Bancshares Inc. | 129,390 | 1,810 |
| CVB Financial Corp. | 122,889 | 1,787 |
| Westamerica | | |
| Bancorporation | 34,590 | 1,781 |
| Mercury General Corp. | 37,819 | 1,761 |
| United Bankshares Inc. | 58,653 | 1,735 |
| BOK Financial Corp. | 28,067 | 1,719 |
| National Penn | | |
| Bancshares Inc. | 164,788 | 1,709 |
| Horace Mann | | |
| Educators Corp. | 54,880 | 1,520 |
| Provident Financial | | |
| Services Inc. | 79,400 | 1,488 |
| NBT Bancorp Inc. | 60,159 | 1,466 |
| Interactive Brokers | | |
| Group Inc. | 68,792 | 1,419 |
| Park National Corp. | 16,767 | 1,328 |
| First Financial Bancorp | 78,782 | 1,223 |
| Renasant Corp. | 42,436 | 1,217 |
| American National | | |
| Insurance Co. | 11,777 | 1,190 |
| Safety Insurance Group Inc. | 21,026 | 1,150 |
| WesBanco Inc. | 38,503 | 1,132 |
| Chemical Financial Corp. | 37,622 | 1,102 |
| Provident New York | | |
| Bancorp | 92,048 | 1,079 |
| First Commonwealth | | |
| Financial Corp. | 120,078 | 1,043 |
| Independent Bank Corp. | 28,516 | 1,023 |
| Oritani Financial Corp. | 62,670 | 1,017 |
| BGC Partners Inc. Class A | 181,139 | 964 |
| City Holding Co. | 20,512 | 933 |
| S&T Bancorp Inc. | 37,037 | 908 |
| United Fire Group Inc. | 28,564 | 905 |
| Brookline Bancorp Inc. | 96,296 | 854 |
| TrustCo Bank Corp. NY | 121,863 | 819 |
| Maiden Holdings Ltd. | 73,844 | 809 |
| Sandy Spring Bancorp Inc. | 32,879 | 805 |
| Flushing Financial Corp. | 40,037 | 804 |
| Community Trust | | |
| Bancorp Inc. | 17,261 | 735 |
| Tompkins Financial Corp. | 13,632 | 672 |
| | |
| Dime Community | | |
| Bancshares Inc. | 40,440 | 662 |
| Simmons First National | | |
| Corp. Class A | 19,833 | 649 |
| Washington Trust | | |
| Bancorp Inc. | 19,333 | 636 |
| 1st Source Corp. | 19,763 | 620 |
| Bancfirst Corp. | 10,397 | 578 |
| SY Bancorp Inc. | 16,308 | 489 |
| First Financial Corp. | 13,596 | 470 |
| Arrow Financial Corp. | 13,735 | 355 |
| Republic Bancorp Inc. | | |
| Class A | 13,500 | 311 |
| GFI Group Inc. | 83,059 | 288 |
| Tower Group | | |
| International Ltd. | 73,435 | 267 |
| Baldwin & Lyons Inc. | 9,699 | 265 |
| | | 1,234,764 |
| Health Care (11.7%) | | |
| Johnson & Johnson | 3,789,597 | 350,955 |
| Pfizer Inc. | 9,135,483 | 280,277 |
| Merck & Co. Inc. | 4,038,203 | 182,082 |
| Bristol-Myers Squibb Co. | 2,277,872 | 119,634 |
| AbbVie Inc. | 2,169,790 | 105,126 |
| Eli Lilly & Co. | 1,393,280 | 69,413 |
| Baxter International Inc. | 747,913 | 49,265 |
| Owens & Minor Inc. | 81,931 | 3,066 |
| Healthcare Services | | |
| Group Inc. | 96,358 | 2,639 |
| PDL BioPharma Inc. | 192,588 | 1,558 |
| Meridian Bioscience Inc. | 56,336 | 1,393 |
| National Healthcare Corp. | 12,747 | 617 |
| | | 1,166,025 |
| Industrials (14.6%) | | |
| General Electric Co. | 14,052,742 | 367,339 |
| United Technologies | | |
| Corp. | 1,253,976 | 133,235 |
| Boeing Co. | 952,719 | 124,330 |
| 3M Co. | 943,155 | 118,696 |
| United Parcel Service Inc. | | |
| Class B | 998,580 | 98,100 |
| Emerson Electric Co. | 992,030 | 66,436 |
| Lockheed Martin Corp. | 446,531 | 59,540 |
| Automatic Data | | |
| Processing Inc. | 674,420 | 50,561 |
| Eaton Corp. plc | 652,255 | 46,023 |
| Illinois Tool Works Inc. | 560,705 | 44,178 |
| General Dynamics Corp. | 462,515 | 40,068 |
| Norfolk Southern Corp. | 434,058 | 37,338 |
| Raytheon Co. | 445,065 | 36,660 |
| Northrop Grumman Corp. | 317,651 | 34,151 |
| Waste Management Inc. | 644,564 | 28,064 |
| Paychex Inc. | 451,766 | 19,092 |
| Xerox Corp. | 1,687,997 | 16,779 |
13
| | | |
| High Dividend Yield Index Fund | |
| |
| |
| |
| | | | Market |
| | | | Value |
| | | Shares | ($000) |
| | Republic Services Inc. | | |
| | Class A | 413,465 | 13,839 |
| | L-3 Communications | | |
| | Holdings Inc. | 124,385 | 12,494 |
| | MeadWestvaco Corp. | 243,941 | 8,501 |
| | Packaging Corp. | | |
| | of America | 135,698 | 8,451 |
| | MDU Resources | | |
| | Group Inc. | 258,938 | 7,711 |
| | Iron Mountain Inc. | 231,341 | 6,140 |
| | Broadridge Financial | | |
| | Solutions Inc. | 164,087 | 5,769 |
| | Bemis Co. Inc. | 142,820 | 5,698 |
| | Sonoco Products Co. | 129,404 | 5,259 |
| | RR Donnelley & Sons Co. | 248,537 | 4,615 |
| | Exelis Inc. | 257,215 | 4,241 |
| | Molex Inc. Class A | 104,927 | 4,040 |
| | Molex Inc. | 92,342 | 3,564 |
| | Deluxe Corp. | 69,866 | 3,290 |
| | Harsco Corp. | 110,530 | 3,082 |
| | GATX Corp. | 53,233 | 2,744 |
| | Covanta Holding Corp. | 146,501 | 2,515 |
| | Teekay Corp. | 56,055 | 2,434 |
| | TAL International Group Inc. | 46,558 | 2,249 |
| | Mine Safety Appliances Co. | 42,705 | 2,057 |
| | ABM Industries Inc. | 72,141 | 1,985 |
| | Greif Inc. Class A | 34,732 | 1,858 |
| | Aircastle Ltd. | 92,506 | 1,746 |
| ^ | Seaspan Corp. | 63,085 | 1,409 |
| | Ship Finance | | |
| | International Ltd. | 81,145 | 1,343 |
| | Otter Tail Corp. | 43,568 | 1,300 |
| | Textainer Group | | |
| | Holdings Ltd. | 29,194 | 1,106 |
| | McGrath RentCorp | 28,589 | 1,020 |
| | ManTech International | | |
| | Corp. Class A | 32,953 | 921 |
| | US Ecology Inc. | 23,784 | 846 |
| | China Yuchai | | |
| | International Ltd. | 31,840 | 744 |
| | American Science | | |
| | & Engineering Inc. | 11,112 | 731 |
| | Navios Maritime | | |
| | Holdings Inc. | 99,861 | 707 |
| | Nordic American | | |
| | Tankers Ltd. | 86,500 | 706 |
| | Ennis Inc. | 36,139 | 641 |
| | Landauer Inc. | 12,658 | 613 |
| | Electro Scientific | | |
| | Industries Inc. | 40,662 | 487 |
| | Electro Rent Corp. | 24,643 | 447 |
| | NAM TAI Electronics Inc. | 45,051 | 315 |
| | | | 1,448,208 |
| | |
| Oil & Gas (12.0%) | | |
| Exxon Mobil Corp. | 6,073,848 | 544,338 |
| Chevron Corp. | 2,680,762 | 321,584 |
| ConocoPhillips | 1,676,020 | 122,852 |
| Occidental | | |
| Petroleum Corp. | 1,117,598 | 107,379 |
| Williams Cos. Inc. | 939,900 | 33,564 |
| Kinder Morgan Inc. | 914,775 | 32,301 |
| Ensco plc Class A | 322,334 | 18,583 |
| OGE Energy Corp. | 270,506 | 9,982 |
| Targa Resources Corp. | 38,596 | 2,994 |
| Crosstex Energy Inc. | 48,954 | 1,502 |
| Gulfmark Offshore Inc. | 8,225 | 409 |
| | | 1,195,488 |
| Technology (9.3%) | | |
| Microsoft Corp. | 10,345,162 | 365,701 |
| Intel Corp. | 6,894,161 | 168,424 |
| Cisco Systems Inc. | 7,326,427 | 164,845 |
| Corning Inc. | 2,015,497 | 34,445 |
| Applied Materials Inc. | 1,656,214 | 29,563 |
| Seagate Technology plc | 440,821 | 21,459 |
| Analog Devices Inc. | 422,329 | 20,821 |
| KLA-Tencor Corp. | 228,981 | 15,021 |
| CA Inc. | 469,166 | 14,901 |
| Linear Technology Corp. | 321,990 | 13,247 |
| Microchip Technology Inc. | 271,848 | 11,679 |
| Maxim Integrated | | |
| Products Inc. | 392,832 | 11,667 |
| Harris Corp. | 147,431 | 9,135 |
| Garmin Ltd. | 151,245 | 7,071 |
| Pitney Bowes Inc. | 275,718 | 5,884 |
| Leidos Holdings Inc. | 97,742 | 4,603 |
| j2 Global Inc. | 63,784 | 3,507 |
| Lexmark International Inc. | | |
| Class A | 86,711 | 3,083 |
| Diebold Inc. | 87,608 | 2,625 |
| Science Applications | | |
| International Corp. | 55,801 | 1,967 |
| Cypress Semiconductor | | |
| Corp. | 205,123 | 1,904 |
| Intersil Corp. Class A | 146,098 | 1,630 |
| Quality Systems Inc. | 60,779 | 1,387 |
| United Online Inc. | 127,801 | 1,104 |
| Tellabs Inc. | 444,037 | 1,083 |
| Computer Programs | | |
| & Systems Inc. | 14,420 | 822 |
| Brooks Automation Inc. | 85,222 | 821 |
| Comtech | | |
| Telecommunications Corp. | 22,759 | 683 |
| Epiq Systems Inc. | 41,265 | 617 |
| | | 919,699 |
14
| | |
| High Dividend Yield Index Fund | |
| |
| |
| |
| | | Market |
| | | Value |
| | Shares | ($000) |
| Telecommunications (5.1%) | | |
| AT&T Inc. | 7,328,762 | 265,301 |
| Verizon | | |
| Communications Inc. | 3,933,668 | 198,690 |
| CenturyLink Inc. | 829,019 | 28,071 |
| Windstream Holdings Inc. | 812,461 | 6,946 |
| Frontier Communications | | |
| Corp. | 1,365,652 | 6,022 |
| Consolidated | | |
| Communications | | |
| Holdings Inc. | 55,451 | 1,033 |
| EarthLink Inc. | 114,972 | 582 |
| NTELOS Holdings Corp. | 20,693 | 394 |
| | | 507,039 |
| Utilities (8.2%) | | |
| Duke Energy Corp. | 974,276 | 69,885 |
| Dominion Resources Inc. | 797,211 | 50,822 |
| NextEra Energy Inc. | 580,929 | 49,234 |
| Southern Co. | 1,195,901 | 48,924 |
| Exelon Corp. | 1,182,143 | 33,738 |
| Spectra Energy Corp. | 919,151 | 32,694 |
| American Electric Power | | |
| Co. Inc. | 671,801 | 31,467 |
| Sempra Energy | 335,771 | 30,602 |
| PPL Corp. | 871,843 | 26,705 |
| PG&E Corp. | 614,382 | 25,712 |
| Public Service Enterprise | | |
| Group Inc. | 701,919 | 23,514 |
| Consolidated Edison Inc. | 400,995 | 23,346 |
| Edison International | 449,687 | 22,048 |
| FirstEnergy Corp. | 577,142 | 21,856 |
| Xcel Energy Inc. | 686,311 | 19,807 |
| Northeast Utilities | 431,442 | 18,505 |
| DTE Energy Co. | 239,937 | 16,589 |
| ONEOK Inc. | 282,233 | 15,946 |
| Entergy Corp. | 245,652 | 15,899 |
| CenterPoint Energy Inc. | 589,831 | 14,510 |
| NiSource Inc. | 427,587 | 13,478 |
| Wisconsin Energy Corp. | 314,275 | 13,234 |
| Ameren Corp. | 333,612 | 12,070 |
| American Water Works | | |
| Co. Inc. | 243,355 | 10,433 |
| CMS Energy Corp. | 365,504 | 10,037 |
| Pinnacle West | | |
| Capital Corp. | 151,028 | 8,462 |
| SCANA Corp. | 173,096 | 8,072 |
| Alliant Energy Corp. | 152,094 | 7,942 |
| NV Energy Inc. | 322,331 | 7,652 |
| National Fuel Gas Co. | 103,239 | 7,387 |
| AGL Resources Inc. | 152,535 | 7,300 |
| Pepco Holdings Inc. | 342,189 | 6,597 |
| UGI Corp. | 157,062 | 6,498 |
| | |
| Integrys Energy Group Inc. | 109,273 | 6,412 |
| Questar Corp. | 242,440 | 5,736 |
| Atmos Energy Corp. | 124,516 | 5,512 |
| Westar Energy Inc. | | |
| Class A | 173,694 | 5,491 |
| TECO Energy Inc. | 300,077 | 5,152 |
| Aqua America Inc. | 197,592 | 4,975 |
| Great Plains Energy Inc. | 200,848 | 4,708 |
| Vectren Corp. | 112,928 | 3,943 |
| Cleco Corp. | 83,419 | 3,866 |
| Hawaiian Electric | | |
| Industries Inc. | 135,859 | 3,610 |
| Piedmont Natural | | |
| Gas Co. Inc. | 104,237 | 3,559 |
| IDACORP Inc. | 68,918 | 3,556 |
| Southwest Gas Corp. | 63,902 | 3,467 |
| WGL Holdings Inc. | 71,348 | 3,211 |
| Black Hills Corp. | 61,402 | 3,114 |
| Portland General | | |
| Electric Co. | 106,672 | 3,062 |
| UIL Holdings Corp. | 76,310 | 2,939 |
| UNS Energy Corp. | 56,964 | 2,819 |
| ALLETE Inc. | 55,061 | 2,782 |
| PNM Resources Inc. | 109,641 | 2,623 |
| New Jersey | | |
| Resources Corp. | 56,963 | 2,622 |
| South Jersey Industries Inc. | 43,993 | 2,620 |
| NorthWestern Corp. | 53,095 | 2,434 |
| Avista Corp. | 82,472 | 2,292 |
| Laclede Group Inc. | 42,261 | 1,989 |
| El Paso Electric Co. | 55,396 | 1,948 |
| MGE Energy Inc. | 31,612 | 1,780 |
| Northwest Natural Gas Co. | 37,062 | 1,610 |
| American States Water Co. | 53,159 | 1,514 |
| California Water | | |
| Service Group | 64,856 | 1,414 |
| Empire District Electric Co. | 59,140 | 1,330 |
| SJW Corp. | 21,608 | 610 |
| | | 813,665 |
| Total Common Stocks | | |
| (Cost $8,197,507) | | 9,912,644 |
15
High Dividend Yield Index Fund
| | | |
| | | | Market |
| | | | Value |
| | | Shares | ($000) |
| Temporary Cash Investments (0.2%)1 | |
| Money Market Fund (0.2%) | | |
| 2,3 | Vanguard Market | | |
| | Liquidity Fund, | | |
| | 0.120% | 19,652,351 | 19,652 |
| |
| | | Face | |
| | | Amount | |
| | | ($000) | |
| U.S. Government and Agency Obligations (0.0%) |
| 4,5 | Fannie Mae | | |
| | Discount Notes, | | |
| | 0.145%, 12/26/13 | 1,000 | 1,000 |
| 4,5 | Freddie Mac | | |
| | Discount Notes, | | |
| | 0.070%, 3/31/14 | 1,000 | 999 |
| | | | 1,999 |
| Total Temporary Cash Investments | |
| (Cost $21,652) | | 21,651 |
| Total Investments (100.0%) | | |
| (Cost $8,219,159) | | 9,934,295 |
| Other Assets and Liabilities (0.0%) | |
| Other Assets | | 27,633 |
| Liabilities3 | | (24,904) |
| | | | 2,729 |
| Net Assets (100%) | | 9,937,024 |
| |
| At October 31, 2013, net assets consisted of: |
| | Amount |
| | ($000) |
| Paid-in Capital | 8,215,793 |
| Undistributed Net Investment Income | 24,426 |
| Accumulated Net Realized Losses | (19,057) |
| Unrealized Appreciation (Depreciation) | |
| Investment Securities | 1,715,136 |
| Futures Contracts | 726 |
| Net Assets | 9,937,024 |
| |
| |
| Investor Shares—Net Assets | |
| Applicable to 126,705,730 outstanding | |
| $.001 par value shares of beneficial | |
| interest (unlimited authorization) | 3,019,164 |
| Net Asset Value Per Share— | |
| Investor Shares | $23.83 |
| |
| |
| ETF Shares—Net Assets | |
| Applicable to 114,991,828 outstanding | |
| $.001 par value shares of beneficial | |
| interest (unlimited authorization) | 6,917,860 |
| Net Asset Value Per Share— | |
| ETF Shares | $60.16 |
n See Note A in Notes to Financial Statements.
^ Includes partial security positions on loan to broker-dealers. The total value of securities on loan is $3,719,000.
1 The fund invests a portion of its cash reserves in equity markets through the use of index futures contracts. After giving effect to futures investments, the fund's effective
common stock and temporary cash investment positions represent 100.0% and 0.0%, respectively, of net assets.
2 Affiliated money markets fund available only to Vanguard funds and certain trusts and accounts managed by Vanguard. Rate shown is the 7-day yield.
3 Includes $3,805,000 of collateral received for securities on loan.
4 The issuer was placed under federal consevatorship in September 2008; since that time, its daily operations have managed by the Federal Housing Finance Agency and it receives
capital from the U.S. Treasury, as needed to maintain a positive net worth, in exchange for senior preferred stock.
5 Securities with a value of $1,799,000 have been segregrated as initial margin for open futures contracts.
See accompanying Notes, which are an intergral part of the Financial Statements.
16
High Dividend Yield Index Fund
Statement of Operations
| |
| | Year Ended |
| | October 31, 2013 |
| | ($000) |
| Investment Income | |
| Income | |
| Dividends | 260,393 |
| Interest1 | 36 |
| Securities Lending | 308 |
| Total Income | 260,737 |
| Expenses | |
| The Vanguard Group—Note B | |
| Investment Advisory Services | 467 |
| Management and Administrative—Investor Shares | 3,625 |
| Management and Administrative—ETF Shares | 3,622 |
| Marketing and Distribution—Investor Shares | 486 |
| Marketing and Distribution—ETF Shares | 1,320 |
| Custodian Fees | 354 |
| Auditing Fees | 28 |
| Shareholders’ Reports—Investor Shares | 64 |
| Shareholders’ Reports—ETF Shares | 47 |
| Trustees’ Fees and Expenses | 8 |
| Total Expenses | 10,021 |
| Net Investment Income | 250,716 |
| Realized Net Gain (Loss) | |
| Investment Securities Sold | 384,298 |
| Futures Contracts | 6,053 |
| Realized Net Gain (Loss) | 390,351 |
| Change in Unrealized Appreciation (Depreciation) | |
| Investment Securities | 1,045,145 |
| Futures Contracts | 994 |
| Change in Unrealized Appreciation (Depreciation) | 1,046,139 |
| Net Increase (Decrease) in Net Assets Resulting from Operations | 1,687,206 |
| 1 Interest income from an affiliated company of the fund was $34,000. |
See accompanying Notes, which are an integral part of the Financial Statements.
17
High Dividend Yield Index Fund
Statement of Changes in Net Assets
| | |
| | Year Ended October 31, |
| | 2013 | 2012 |
| | ($000) | ($000) |
| Increase (Decrease) in Net Assets | | |
| Operations | | |
| Net Investment Income | 250,716 | 147,153 |
| Realized Net Gain (Loss) | 390,351 | 70,603 |
| Change in Unrealized Appreciation (Depreciation) | 1,046,139 | 460,924 |
| Net Increase (Decrease) in Net Assets Resulting from Operations | 1,687,206 | 678,680 |
| Distributions | | |
| Net Investment Income | | |
| Investor Shares | (69,438) | (36,928) |
| ETF Shares | (171,585) | (101,515) |
| Realized Capital Gain | | |
| Investor Shares | — | — |
| ETF Shares | — | — |
| Total Distributions | (241,023) | (138,443) |
| Capital Share Transactions | | |
| Investor Shares | 1,003,585 | 684,983 |
| ETF Shares | 1,688,115 | 1,828,831 |
| Net Increase (Decrease) from Capital Share Transactions | 2,691,700 | 2,513,814 |
| Total Increase (Decrease) | 4,137,883 | 3,054,051 |
| Net Assets | | |
| Beginning of Period | 5,799,141 | 2,745,090 |
| End of Period1 | 9,937,024 | 5,799,141 |
| 1 Net Assets—End of Period includes undistributed net investment income of $24,426,000 and $14,708,000. |
See accompanying Notes, which are an integral part of the Financial Statements.
18
High Dividend Yield Index Fund
Financial Highlights
| | | | | |
| Investor Shares | | | | | |
| |
| For a Share Outstanding | Year Ended October 31, |
| Throughout Each Period | 2013 | 2012 | 2011 | 2010 | 2009 |
| Net Asset Value, Beginning of Period | $19.76 | $17.30 | $15.94 | $14.15 | $14.20 |
| Investment Operations | | | | | |
| Net Investment Income | . 667 | .579 | .489 | .415 | .4681 |
| Net Realized and Unrealized Gain (Loss) | | | | | |
| on Investments | 4.063 | 2.446 | 1.355 | 1.792 | (.070) |
| Total from Investment Operations | 4.730 | 3.025 | 1.844 | 2.207 | .398 |
| Distributions | | | | | |
| Dividends from Net Investment Income | (. 660) | (. 565) | (. 484) | (.417) | (.448) |
| Distributions from Realized Capital Gains | — | — | — | — | — |
| Total Distributions | (. 660) | (. 565) | (. 484) | (.417) | (.448) |
| Net Asset Value, End of Period | $23.83 | $19.76 | $17.30 | $15.94 | $14.15 |
| |
| Total Return2 | 24.35% | 17.69% | 11.70% | 15.79% | 3.27% |
| |
| Ratios/Supplemental Data | | | | | |
| Net Assets, End of Period (Millions) | $3,019 | $1,596 | $761 | $296 | $155 |
| Ratio of Total Expenses to Average Net Assets | 0.19% | 0.20% | 0.25% | 0.30% | 0.35% |
| Ratio of Net Investment Income to | | | | | |
| Average Net Assets | 3.10% | 3.22% | 3.04% | 2.86% | 3.63% |
| Portfolio Turnover Rate 3 | 13% | 11% | 16% | 34% | 20% |
1 Calculated based on average shares outstanding.
2 Total returns do not include account service fees that may have applied in the periods shown. Fund prospectuses provide information about
any applicable account service fees.
3 Excludes the value of portfolio securities received or delivered as a result of in-kind purchases or redemptions of the fund’s capital shares,
including ETF Creation Units.
See accompanying Notes, which are an integral part of the Financial Statements.
19
High Dividend Yield Index Fund
Financial Highlights
| | | | | |
| ETF Shares | | | | | |
| |
| For a Share Outstanding | | | Year Ended October 31, |
| Throughout Each Period | 2013 | 2012 | 2011 | 2010 | 2009 |
| Net Asset Value, Beginning of Period | $49.89 | $43.68 | $40.22 | $35.70 | $35.84 |
| Investment Operations | | | | | |
| Net Investment Income | 1.732 | 1.506 | 1.283 | 1.092 | 1.2351 |
| Net Realized and Unrealized Gain (Loss) | | | | | |
| on Investments | 10.247 | 6.180 | 3.442 | 4.527 | (.198) |
| Total from Investment Operations | 11.979 | 7.686 | 4.725 | 5.619 | 1.037 |
| Distributions | | | | | |
| Dividends from Net Investment Income | (1.709) | (1.476) | (1.265) | (1.099) | (1.177) |
| Distributions from Realized Capital Gains | — | — | — | — | — |
| Total Distributions | (1.709) | (1.476) | (1.265) | (1.099) | (1.177) |
| Net Asset Value, End of Period | $60.16 | $49.89 | $43.68 | $40.22 | $35.70 |
| |
| Total Return | 24.43% | 17.80% | 11.88% | 15.93% | 3.38% |
| |
| Ratios/Supplemental Data | | | | | |
| Net Assets, End of Period (Millions) | $6,918 | $4,203 | $1,984 | $884 | $430 |
| Ratio of Total Expenses to Average Net Assets | 0.10% | 0.10% | 0.13% | 0.18% | 0.20% |
| Ratio of Net Investment Income to | | | | | |
| Average Net Assets | 3.19% | 3.32% | 3.16% | 2.98% | 3.78% |
| Portfolio Turnover Rate 2 | 13% | 11% | 16% | 34% | 20% |
1 Calculated based on average shares outstanding.
2 Excludes the value of portfolio securities received or delivered as a result of in-kind purchases or redemptions of the fund’s capital shares,
including ETF Creation Units.
See accompanying Notes, which are an integral part of the Financial Statements.
20
High Dividend Yield Index Fund
Notes to Financial Statements
Vanguard High Dividend Yield Index Fund is registered under the Investment Company Act of 1940 as an open-end investment company, or mutual fund. The fund offers two classes of shares: Investor Shares and ETF Shares. Investor Shares are available to any investor who meets the fund’s minimum purchase requirements. ETF Shares are listed for trading on NYSE Arca; they can be purchased and sold through a broker.
A. The following significant accounting policies conform to generally accepted accounting principles for U.S. mutual funds. The fund consistently follows such policies in preparing its financial statements.
1. Security Valuation: Securities are valued as of the close of trading on the New York Stock Exchange (generally 4 p.m., Eastern time) on the valuation date. Equity securities are valued at the latest quoted sales prices or official closing prices taken from the primary market in which each security trades; such securities not traded on the valuation date are valued at the mean of the latest quoted bid and asked prices. Securities for which market quotations are not readily available, or whose values have been materially affected by events occurring before the fund’s pricing time but after the close of the securities’ primary markets, are valued by methods deemed by the board of trustees to represent fair value. Investments in Vanguard Market Liquidity Fund are valued at that fund’s net asset value. Temporary cash investments acquired over 60 days to maturity are valued using the latest bid prices or using valuations based on a matrix system (which considers such factors as security prices, yields, maturities, and ratings), both as furnished by independent pricing services. Other temporary cash investments are valued at amortized cost, which approximates market value.
2. Futures Contracts: The fund may use index futures contracts to a limited extent, with the objectives of maintaining full exposure to the stock market, enhancing returns, maintaining liquidity, and minimizing transaction costs. The fund may purchase futures contracts to immediately invest incoming cash in the market, or sell futures in response to cash outflows, thereby simulating a fully invested position in the underlying index while maintaining a cash balance for liquidity. The fund may seek to enhance returns by using futures contracts instead of the underlying securities when futures are believed to be priced more attractively than the underlying securities. The primary risks associated with the use of futures contracts are imperfect correlation between changes in market values of stocks held by the fund and the prices of futures contracts, and the possibility of an illiquid market. Counterparty risk involving futures is mitigated because a regulated clearinghouse is the counterparty instead of the clearing broker. To further mitigate counterparty risk, the fund trades futures contracts on an exchange, monitors the financial strength of its clearing brokers and clearinghouse, and has entered into clearing agreements with its clearing brokers. The clearinghouse imposes initial margin requirements to secure the fund’s performance and requires daily settlement of variation margin representing changes in the market value of each contract.
Futures contracts are valued at their quoted daily settlement prices. The aggregate notional amounts of the contracts are not recorded in the Statement of Net Assets. Fluctuations in the value of the contracts are recorded in the Statement of Net Assets as an asset (liability) and in the Statement of Operations as unrealized appreciation (depreciation) until the contracts are closed, when they are recorded as realized futures gains (losses).
During the year ended October 31, 2013, the fund’s average investments in long and short futures contracts represented less than 1% and 0% of net assets, respectively, based on quarterly average aggregate settlement values.
21
High Dividend Yield Index Fund
3. Federal Income Taxes: The fund intends to continue to qualify as a regulated investment company and distribute all of its taxable income. Management has analyzed the fund’s tax positions taken for all open federal income tax years (October 31, 2010–2013), and has concluded that no provision for federal income tax is required in the fund’s financial statements.
4. Distributions: Distributions to shareholders are recorded on the ex-dividend date.
5. Securities Lending: To earn additional income, the fund may lend its securities to qualified institutional borrowers. Security loans are required to be secured at all times by collateral in an amount at least equal to the market value of securities loaned. Daily market fluctuations could cause the value of loaned securities to be more or less than the value of the collateral received. When this occurs, the collateral is adjusted and settled on the next business day. The fund further mitigates its counterparty risk by entering into securities lending transactions only with a diverse group of prequalified counterparties, monitoring their financial strength, and entering into master securities lending agreements with its counterparties. The master securities lending agreements provide that, in the event of a counterparty’s default (including bankruptcy), the fund may terminate any loans with that borrower, determine the net amount owed, and sell or retain the collateral up to the net amount owed to the fund; however, such actions may be subject to legal proceedings. While collateral mitigates counterparty risk, in the absence of a default the fund may experience delays and costs in recovering the securities loaned. The fund invests cash collateral received in Vanguard Market Liquidity Fund, and records a liability for the return of the collateral, during the period the securities are on loan. Securities lending income represents fees charged to borrowers plus income earned on invested cash collateral, less expenses associated with the loan.
6. Other: Dividend income is recorded on the ex-dividend date. Interest income includes income distributions received from Vanguard Market Liquidity Fund and is accrued daily. Premiums and discounts on debt securities purchased are amortized and accreted, respectively, to interest income over the lives of the respective securities. Security transactions are accounted for on the date securities are bought or sold. Costs used to determine realized gains (losses) on the sale of investment securities are those of the specific securities sold.
Each class of shares has equal rights as to assets and earnings, except that each class separately bears certain class-specific expenses related to maintenance of shareholder accounts (included in Management and Administrative expenses) and shareholder reporting. Marketing and distribution expenses are allocated to each class of shares based on a method approved by the board of trustees. Income, other non-class-specific expenses, and gains and losses on investments are allocated to each class of shares based on its relative net assets.
B. The Vanguard Group furnishes at cost investment advisory, corporate management, administrative, marketing, and distribution services. The costs of such services are allocated to the fund under methods approved by the board of trustees. The fund has committed to provide up to 0.40% of its net assets in capital contributions to Vanguard. At October 31, 2013, the fund had contributed capital of $1,108,000 to Vanguard (included in Other Assets), representing 0.01% of the fund’s net assets and 0.44% of Vanguard’s capitalization. The fund’s trustees and officers are also directors and officers of Vanguard.
C. Various inputs may be used to determine the value of the fund’s investments. These inputs are summarized in three broad levels for financial statement purposes. The inputs or methodologies used to value securities are not necessarily an indication of the risk associated with investing in those securities.
22
High Dividend Yield Index Fund
Level 1—Quoted prices in active markets for identical securities.
Level 2—Other significant observable inputs (including quoted prices for similar securities, interest rates, prepayment speeds, credit risk, etc.).
Level 3—Significant unobservable inputs (including the fund’s own assumptions used to determine the fair value of investments).
The following table summarizes the market value of the fund’s investments as of October 31, 2013, based on the inputs used to value them:
| | | |
| | Level 1 | Level 2 | Level 3 |
| Investments | ($000) | ($000) | ($000) |
| Common Stocks | 9,912,644 | — | — |
| Temporary Cash Investments | 19,652 | 1,999 | — |
| Futures Contracts—Liabilities1 | (136) | — | — |
| Total | 9,932,160 | 1,999 | — |
| 1 Represents variation margin on the last day of the reporting period. |
D. At October 31, 2013, the aggregate settlement value of open futures contracts and the related unrealized appreciation (depreciation) were:
| | | | |
| | | | ($000) |
| | | | Aggregate | |
| | | Number of | Settlement | Unrealized |
| | | Long (Short) | Value | Appreciation |
| Futures Contracts | Expiration | Contracts | Long (Short) | (Depreciation) |
| S&P 500 Index | December 2013 | 54 | 23,639 | 711 |
| E-mini S&P 500 Index | December 2013 | 13 | 1,138 | 15 |
Unrealized appreciation (depreciation) on open futures contracts is required to be treated as realized gain (loss) for tax purposes.
E. Distributions are determined on a tax basis and may differ from net investment income and realized capital gains for financial reporting purposes. Differences may be permanent or temporary. Permanent differences are reclassified among capital accounts in the financial statements to reflect their tax character. Temporary differences arise when certain items of income, expense, gain, or loss are recognized in different periods for financial statement and tax purposes. These differences will reverse at some time in the future. Differences in classification may also result from the treatment of short-term gains as ordinary income for tax purposes.
Certain of the fund’s investments are in securities considered to be passive foreign investment companies, for which any unrealized appreciation and/or realized gains are required to be included in distributable net income for tax purposes. During the year ended October 31, 2013, the fund realized gains on the sale of passive foreign investment companies of $25,000, which have been included in current and prior periods’ taxable income; accordingly, such gains have been reclassified from accumulated net realized losses to undistributed net investment income. Passive foreign investment companies held at October 31, 2013, had unrealized appreciation of $763,000, of which $221,000 has been distributed and is reflected in the balance of undistributed net investment income.
23
High Dividend Yield Index Fund
During the year ended October 31, 2013, the fund realized $379,767,000 of net capital gains resulting from in-kind redemptions—in which shareholders exchanged fund shares for securities held by the fund rather than for cash. Because such gains are not taxable to the fund, and are not distributed to shareholders, they have been reclassified from accumulated net realized losses to paid-in capital.
For tax purposes, at October 31, 2013, the fund had $27,687,000 of ordinary income available for distribution. The fund used capital loss carryforwards of $11,554,000 to offset taxable capital gains realized during the year ended October 31, 2013. At October 31, 2013, the fund had available capital losses totaling $18,315,000 to offset future net capital gains through October 31, 2018.
At October 31, 2013, the cost of investment securities for tax purposes was $8,219,937,000. Net unrealized appreciation of investment securities for tax purposes was $1,714,358,000, consisting of unrealized gains of $1,755,713,000 on securities that had risen in value since their purchase and $41,355,000 in unrealized losses on securities that had fallen in value since their purchase.
F. During the year ended October 31, 2013, the fund purchased $5,051,636,000 of investment securities and sold $2,358,785,000 of investment securities, other than temporary cash investments. Purchases and sales include $3,030,110,000 and $1,342,313,000, respectively, in connection with in-kind purchases and redemptions of the fund’s capital shares.
G. Capital share transactions for each class of shares were:
| | | | |
| | Year Ended October 31, |
| | 2013 | 2012 |
| | Amount | Shares | Amount | Shares |
| | ($000) | (000) | ($000) | (000) |
| Investor Shares | | | | |
| Issued | 1,501,318 | 68,725 | 967,267 | 51,782 |
| Issued in Lieu of Cash Distributions | 56,426 | 2,604 | 30,809 | 1,628 |
| Redeemed | (554,159) | (25,363) | (313,093) | (16,633) |
| Net Increase (Decrease)—Investor Shares | 1,003,585 | 45,966 | 684,983 | 36,777 |
| ETF Shares | | | | |
| Issued | 3,045,335 | 55,835 | 2,101,824 | 44,828 |
| Issued in Lieu of Cash Distributions | — | — | — | — |
| Redeemed | (1,357,220) | (25,100) | (272,993) | (6,000) |
| Net Increase (Decrease)—ETF Shares | 1,688,115 | 30,735 | 1,828,831 | 38,828 |
H. Management has determined that no material events or transactions occurred subsequent to October 31, 2013, that would require recognition or disclosure in these financial statements.
24
Report of Independent Registered
Public Accounting Firm
To the Trustees of Vanguard Whitehall Funds and the Shareholders of Vanguard High Dividend Yield Index Fund:
In our opinion, the accompanying statement of net assets and the related statements of operations and of changes in net assets and the financial highlights present fairly, in all material respects, the financial position of Vanguard High Dividend Yield Index Fund (constituting a separate portfolio of Vanguard Whitehall Funds, hereafter referred to as the “Fund”) at October 31, 2013, the results of its operations for the year then ended, the changes in its net assets for each of the two years in the period then ended, and the financial highlights for the five years in the period then ended, in conformity with accounting principles generally accepted in the United States of America. These financial statements and financial highlights (hereafter referred to as “financial statements”) are the responsibility of the Fund’s management; our responsibility is to express an opinion on these financial statements based on our audits. We conducted our audits of these financial statements in accordance with the standards of the Public Company Accounting Oversight Board (United States). Those standards require that we plan and perform the audit to obtain reasonable assurance about whether the financial statements are free of material misstatement. An audit includes examining, on a test basis, evidence supporting the amounts and disclosures in the financial statements, assessing the accounting principles used and significant estimates made by management, and evaluating the overall financial statement presentation. We believe that our audits, which included confirmation of securities at October 31, 2013 by correspondence with the custodian and broker and by agreement to the underlying ownership records of the transfer agent, provide a reasonable basis for our opinion.
/s/PricewaterhouseCoopers LLP
Philadelphia, Pennsylvania
December 12, 2013
Special 2013 tax information (unaudited) for Vanguard High Dividend Yield Index Fund
This information for the fiscal year ended October 31, 2013, is included pursuant to provisions of the
Internal Revenue Code.
The fund distributed $241,023,000 of qualified dividend income to shareholders during the fiscal year.
For corporate shareholders, 100% of investment income (dividend income plus short-term gains,
if any) qualifies for the dividends-received deduction.
25
Your Fund’s After-Tax Returns
This table presents returns for your fund both before and after taxes. The after-tax returns are shown in two ways: (1) assuming that an investor owned the fund during the entire period and paid taxes on the fund’s distributions, and (2) assuming that an investor paid taxes on the fund’s distributions and sold all shares at the end of each period.
Calculations are based on the highest individual federal income tax and capital gains tax rates in effect at the times of the distributions and the hypothetical sales. State and local taxes were not considered. After-tax returns reflect any qualified dividend income, using actual prior-year figures and estimates for 2013. (In the example, returns after the sale of fund shares may be higher than those assuming no sale. This occurs when the sale would have produced a capital loss. The calculation assumes that the investor received a tax deduction for the loss.)
The table shows returns for one share class only; returns for other share classes will differ. Please note that your actual after-tax returns will depend on your tax situation and may differ from those shown. Also note that if you own the fund in a tax-deferred account, such as an individual retirement account or a 401(k) plan, this information does not apply to you. Such accounts are not subject to current taxes.
Finally, keep in mind that a fund’s performance—whether before or after taxes—does not guarantee future results.
Average Annual Total Returns: High Dividend Yield Index Fund Investor Shares
Periods Ended October 31, 2013
| | | |
| | | | Since |
| | One | Five | Inception |
| | Year | Years | (11/16/2006) |
| Returns Before Taxes | 24.35% | 14.34% | 5.60% |
| Returns After Taxes on Distributions | 23.55 | 13.78 | 5.11 |
| Returns After Taxes on Distributions and Sale of Fund Shares | 14.48 | 11.57 | 4.45 |
26
About Your Fund’s Expenses
As a shareholder of the fund, you incur ongoing costs, which include costs for portfolio management, administrative services, and shareholder reports (like this one), among others. Operating expenses, which are deducted from a fund’s gross income, directly reduce the investment return of the fund.
A fund’s expenses are expressed as a percentage of its average net assets. This figure is known as the expense ratio. The following examples are intended to help you understand the ongoing costs (in dollars) of investing in your fund and to compare these costs with those of other mutual funds. The examples are based on an investment of $1,000 made at the beginning of the period shown and held for the entire period.
The accompanying table illustrates your fund’s costs in two ways:
• Based on actual fund return. This section helps you to estimate the actual expenses that you paid over the period. The ”Ending Account Value“ shown is derived from the fund‘s actual return, and the third column shows the dollar amount that would have been paid by an investor who started with $1,000 in the fund. You may use the information here, together with the amount you invested, to estimate the expenses that you paid over the period.
To do so, simply divide your account value by $1,000 (for example, an $8,600 account value divided by $1,000 = 8.6), then multiply the result by the number given for your fund under the heading ”Expenses Paid During Period.“
• Based on hypothetical 5% yearly return. This section is intended to help you compare your fund‘s costs with those of other mutual funds. It assumes that the fund had a yearly return of 5% before expenses, but that the expense ratio is unchanged. In this case—because the return used is not the fund’s actual return—the results do not apply to your investment. The example is useful in making comparisons because the Securities and Exchange Commission requires all mutual funds to calculate expenses based on a 5% return. You can assess your fund’s costs by comparing this hypothetical example with the hypothetical examples that appear in shareholder reports of other funds.
Note that the expenses shown in the table are meant to highlight and help you compare ongoing costs only and do not reflect transaction costs incurred by the fund for buying and selling securities. Further, the expenses do not include any purchase, redemption, or account service fees described in the fund prospectus. If such fees were applied to your account, your costs would be higher. Your fund does not carry a “sales load.”
The calculations assume no shares were bought or sold during the period. Your actual costs may have been higher or lower, depending on the amount of your investment and the timing of any purchases or redemptions.
You can find more information about the fund’s expenses, including annual expense ratios, in the Financial Statements section of this report. For additional information on operating expenses and other shareholder costs, please refer to your fund’s current prospectus.
27
| | | |
| Six Months Ended October 31, 2013 | | | |
| | Beginning | Ending | Expenses |
| | Account Value | Account Value | Paid During |
| High Dividend Yield Index Fund | 4/30/2013 | 10/31/2013 | Period |
| Based on Actual Fund Return | | | |
| Investor Shares | $1,000.00 | $1,081.28 | $1.00 |
| ETF Shares | 1,000.00 | 1,081.65 | 0.52 |
| Based on Hypothetical 5% Yearly Return | | | |
| Investor Shares | $1,000.00 | $1,024.25 | $0.97 |
| ETF Shares | 1,000.00 | 1,024.70 | 0.51 |
The calculations are based on expenses incurred in the most recent six-month period. The fund’s annualized six-month expense ratios for that
period are 0.19% for Investor Shares and 0.10% for ETF Shares. The dollar amounts shown as “Expenses Paid” are equal to the annualized
expense ratio multiplied by the average account value over the period, multiplied by the number of days in the most recent six-month period,
then divided by the number of days in the most recent 12-month period.
28
Glossary
30-Day SEC Yield. A fund’s 30-day SEC yield is derived using a formula specified by the U.S. Securities and Exchange Commission. Under the formula, data related to the fund’s security holdings in the previous 30 days are used to calculate the fund’s hypothetical net income for that period, which is then annualized and divided by the fund’s estimated average net assets over the calculation period. For the purposes of this calculation, a security’s income is based on its current market yield to maturity (for bonds), its actual income (for asset-backed securities), or its projected dividend yield (for stocks). Because the SEC yield represents hypothetical annualized income, it will differ—at times significantly—from the fund’s actual experience. As a result, the fund’s income distributions may be higher or lower than implied by the SEC yield.
Beta. A measure of the magnitude of a fund’s past share-price fluctuations in relation to the ups and downs of a given market index. The index is assigned a beta of 1.00. Compared with a given index, a fund with a beta of 1.20 typically would have seen its share price rise or fall by 12% when the index rose or fell by 10%. For this report, beta is based on returns over the past 36 months for both the fund and the index. Note that a fund’s beta should be reviewed in conjunction with its R-squared (see definition). The lower the R-squared, the less correlation there is between the fund and the index, and the less reliable beta is as an indicator of volatility.
Dividend Yield. Dividend income earned by stocks, expressed as a percentage of the aggregate market value (or of net asset value, for a fund). The yield is determined by dividing the amount of the annual dividends by the aggregate value (or net asset value) at the end of the period. For a fund, the dividend yield is based solely on stock holdings and does not include any income produced by other investments.
Earnings Growth Rate. The average annual rate of growth in earnings over the past five years for the stocks now in a fund.
Equity Exposure. A measure that reflects a fund’s investments in stocks and stock futures. Any holdings in short-term reserves are excluded.
Expense Ratio. A fund’s total annual operating expenses expressed as a percentage of the fund’s average net assets. The expense ratio includes management and administrative expenses, but does not include the transaction costs of buying and selling portfolio securities.
Foreign Holdings. The percentage of a fund represented by securities or depositary receipts of companies based outside the United States.
Inception Date. The date on which the assets of a fund (or one of its share classes) are first invested in accordance with the fund’s investment objective. For funds with a subscription period, the inception date is the day after that period ends. Investment performance is measured from the inception date.
Median Market Cap. An indicator of the size of companies in which a fund invests; the midpoint of market capitalization (market price x shares outstanding) of a fund’s stocks, weighted by the proportion of the fund’s assets invested in each stock. Stocks representing half of the fund’s assets have market capitalizations above the median, and the rest are below it.
Price/Book Ratio. The share price of a stock divided by its net worth, or book value, per share. For a fund, the weighted average price/book ratio of the stocks it holds.
29
Price/Earnings Ratio. The ratio of a stock’s current price to its per-share earnings over the past year. For a fund, the weighted average P/E of the stocks it holds. P/E is an indicator of market expectations about corporate prospects; the higher the P/E, the greater the expectations for a company’s future growth.
R-Squared. A measure of how much of a fund’s past returns can be explained by the returns from the market in general, as measured by a given index. If a fund’s total returns were precisely synchronized with an index’s returns, its R-squared would be 1.00. If the fund’s returns bore no relationship to the index’s returns, its R-squared would be 0. For this report, R-squared is based on returns over the past 36 months for both the fund and the index.
Return on Equity. The annual average rate of return generated by a company during the past five years for each dollar of shareholder’s equity (net income divided by shareholder’s equity). For a fund, the weighted average return on equity for the companies whose stocks it holds.
Short-Term Reserves. The percentage of a fund invested in highly liquid, short-term securities that can be readily converted to cash.
Turnover Rate. An indication of the fund’s trading activity. Funds with high turnover rates incur higher transaction costs and may be more likely to distribute capital gains (which may be taxable to investors). The turnover rate excludes in-kind transactions, which have minimal impact on costs.
30
This page intentionally left blank.
The People Who Govern Your Fund
The trustees of your mutual fund are there to see that the fund is operated and managed in your best interests since, as a shareholder, you are a part owner of the fund. Your fund’s trustees also serve on the board of directors of The Vanguard Group, Inc., which is owned by the Vanguard funds and provides services to them on an at-cost basis.
A majority of Vanguard’s board members are independent, meaning that they have no affiliation with Vanguard or the funds they oversee, apart from the sizable personal investments they have made as private individuals. The independent board members have distinguished backgrounds in business, academia, and public service. Each of the trustees and executive officers oversees 181 Vanguard funds.
The following table provides information for each trustee and executive officer of the fund. More information about the trustees is in the Statement of Additional Information, which can be obtained, without charge, by contacting Vanguard at 800-662-7447, or online at vanguard.com.
| |
| InterestedTrustee1 | and Delphi Automotive LLP (automotive components); |
| | Senior Advisor at New Mountain Capital; Trustee of |
| F. William McNabb III | The Conference Board. |
| Born 1957. Trustee Since July 2009. Chairman of the | |
| Board. Principal Occupation(s) During the Past Five | Amy Gutmann |
| Years: Chairman of the Board of The Vanguard Group, | Born 1949. Trustee Since June 2006. Principal |
| Inc., and of each of the investment companies served | Occupation(s) During the Past Five Years: President |
| by The Vanguard Group, since January 2010; Director | of the University of Pennsylvania; Christopher H. |
| of The Vanguard Group since 2008; Chief Executive | Browne Distinguished Professor of Political Science |
| Officer and President of The Vanguard Group and of | in the School of Arts and Sciences with secondary |
| each of the investment companies served by The | appointments at the Annenberg School for |
| Vanguard Group since 2008; Director of Vanguard | Communication and the Graduate School of Education |
| Marketing Corporation; Managing Director of The | of the University of Pennsylvania; Member of the |
| Vanguard Group (1995–2008). | National Commission on the Humanities and Social |
| | Sciences; Trustee of Carnegie Corporation of New |
| IndependentTrustees | York and of the National Constitution Center; Chair |
| of the U.S. Presidential Commission for the Study |
| Emerson U. Fullwood | of Bioethical Issues. |
| Born 1948. Trustee Since January 2008. Principal | |
| Occupation(s) During the Past Five Years: Executive | JoAnn Heffernan Heisen |
| Chief Staff and Marketing Officer for North America | Born 1950. Trustee Since July 1998. Principal |
| and Corporate Vice President (retired 2008) of Xerox | Occupation(s) During the Past Five Years: Corporate |
| Corporation (document management products and | Vice President and Chief Global Diversity Officer |
| services); Executive in Residence and 2010 | (retired 2008) and Member of the Executive |
| Distinguished Minett Professor at the Rochester | Committee (1997–2008) of Johnson & Johnson |
| Institute of Technology; Director of SPX Corporation | (pharmaceuticals/medical devices/consumer |
| (multi-industry manufacturing), the United Way of | products); Director of Skytop Lodge Corporation |
| Rochester, Amerigroup Corporation (managed health | (hotels), the University Medical Center at Princeton, |
| care), the University of Rochester Medical Center, | the Robert Wood Johnson Foundation, and the Center |
| Monroe Community College Foundation, and North | for Talent Innovation; Member of the Advisory Board |
| Carolina A&T University. | of the Maxwell School of Citizenship and Public Affairs |
| | at Syracuse University. |
| |
| Rajiv L. Gupta | F. Joseph Loughrey |
| Born 1945. Trustee Since December 2001.2 | Born 1949. Trustee Since October 2009. Principal |
| Principal Occupation(s) During the Past Five Years: | Occupation(s) During the Past Five Years: President |
| Chairman and Chief Executive Officer (retired 2009) | and Chief Operating Officer (retired 2009) of Cummins |
| and President (2006–2008) of Rohm and Haas Co. | Inc. (industrial machinery); Chairman of the Board of |
| (chemicals); Director of Tyco International, Ltd. | Hillenbrand, Inc. (specialized consumer services) and |
| (diversified manufacturing and services), Hewlett- | of Oxfam America; Director of SKF AB (industrial |
| Packard Co. (electronic computer manufacturing), | |
| | |
| machinery), Hyster-Yale Materials Handling, Inc. | Executive Officers | |
| (forklift trucks), and the Lumina Foundation for | | |
| Education; Member of the Advisory Council for the | Glenn Booraem | |
| College of Arts and Letters and of the Advisory Board | Born 1967. Controller Since July 2010. Principal |
| to the Kellogg Institute for International Studies, both | Occupation(s) During the Past Five Years: Principal |
| at the University of Notre Dame. | of The Vanguard Group, Inc.; Controller of each of |
| | the investment companies served by The Vanguard |
| Mark Loughridge | Group; Assistant Controller of each of the investment |
| Born 1953. Trustee Since March 2012. Principal | companies served by The Vanguard Group (2001–2010). |
| Occupation(s) During the Past Five Years: Senior Vice | | |
| President and Chief Financial Officer at IBM (information | Thomas J. Higgins | |
| technology services); Fiduciary Member of IBM’s | Born 1957. Chief Financial Officer Since September |
| Retirement Plan Committee. | 2008. Principal Occupation(s) During the Past Five |
| | Years: Principal of The Vanguard Group, Inc.; Chief |
| Scott C. Malpass | Financial Officer of each of the investment companies |
| Born 1962. Trustee Since March 2012. Principal | served by The Vanguard Group; Treasurer of each of |
| Occupation(s) During the Past Five Years: Chief | the investment companies served by The Vanguard |
| Investment Officer and Vice President at the University | Group (1998–2008). | |
| of Notre Dame; Assistant Professor of Finance at the | | |
| Mendoza College of Business at Notre Dame; Member | Kathryn J. Hyatt | |
| of the Notre Dame 403(b) Investment Committee; | Born 1955. Treasurer Since November 2008. Principal |
| Director of TIFF Advisory Services, Inc. (investment | Occupation(s) During the Past Five Years: Principal of |
| advisor); Member of the Investment Advisory | The Vanguard Group, Inc.; Treasurer of each of the |
| Committees of the Financial Industry Regulatory | investment companies served by The Vanguard |
| Authority (FINRA) and of Major League Baseball. | Group; Assistant Treasurer of each of the investment |
| | companies served by The Vanguard Group (1988–2008). |
| André F. Perold | | |
| Born 1952. Trustee Since December 2004. Principal | Heidi Stam | |
| Occupation(s) During the Past Five Years: George | Born 1956. Secretary Since July 2005. Principal |
| Gund Professor of Finance and Banking at the Harvard | Occupation(s) During the Past Five Years: Managing |
| Business School (retired 2011); Chief Investment | Director of The Vanguard Group, Inc.; General Counsel |
| Officer and Managing Partner of HighVista Strategies | of The Vanguard Group; Secretary of The Vanguard |
| LLC (private investment firm); Director of Rand | Group and of each of the investment companies |
| Merchant Bank; Overseer of the Museum of Fine | served by The Vanguard Group; Director and Senior |
| Arts Boston. | Vice President of Vanguard Marketing Corporation. |
| |
| | |
| Alfred M. Rankin, Jr. | Vanguard Senior ManagementTeam |
| Born 1941. Trustee Since January 1993. Principal | | |
| Occupation(s) During the Past Five Years: Chairman, | Mortimer J. Buckley | Chris D. McIsaac |
| President, and Chief Executive Officer of NACCO | Kathleen C. Gubanich | Michael S. Miller |
| Industries, Inc. (housewares/lignite) and of Hyster-Yale | Paul A. Heller | James M. Norris |
| Materials Handling, Inc. (forklift trucks); Director of | Martha G. King | Glenn W. Reed |
| the National Association of Manufacturers; Chairman | John T. Marcante | |
| of the Board of University Hospitals of Cleveland; | | |
| Advisory Chairman of the Board of The Cleveland | | |
| Museum of Art. | Chairman Emeritus and Senior Advisor |
| | | |
| John J. Brennan | |
| Peter F. Volanakis | Chairman, 1996–2009 | |
| Born 1955. Trustee Since July 2009. Principal | Chief Executive Officer and President, 1996–2008 |
| Occupation(s) During the Past Five Years: President | | |
| and Chief Operating Officer (retired 2010) of Corning | | |
| Incorporated (communications equipment); Director | Founder | |
| of SPX Corporation (multi-industry manufacturing); | | |
| Overseer of the Amos Tuck School of Business | John C. Bogle | |
| Administration at Dartmouth College; Advisor to the | Chairman and Chief Executive Officer, 1974–1996 |
| Norris Cotton Cancer Center. | | |
1 Mr. McNabb is considered an “interested person,” as defined in the Investment Company Act of 1940, because he is an officer of the Vanguard funds.
2 December 2002 for Vanguard Equity Income Fund, Vanguard Growth Equity Fund, the Vanguard Municipal Bond Funds, and the Vanguard State Tax-Exempt Funds.
|  |
| | P.O. Box 2600 |
| | Valley Forge, PA 19482-2600 |
| |
| |
| |
| Connect with Vanguard® > vanguard.com | |
| |
| |
| |
| Fund Information > 800-662-7447 | All rights in a FTSE index (the “Index”) vest in FTSE |
| Direct Investor Account Services > 800-662-2739 | International Limited (“FTSE”). “FTSE®” is a trademark |
| | of London Stock Exchange Group companies and is |
| Institutional Investor Services > 800-523-1036 | used by FTSE under licence. The Vanguard Fund(s) (the |
| Text Telephone for People | “Product”) has been developed solely by Vanguard. The |
| With Hearing Impairment > 800-749-7273 | Index is calculated by FTSE or its agent. FTSE and its |
| | licensors are not connected to and do not sponsor, |
| This material may be used in conjunction | advise, recommend, endorse or promote the Product |
| with the offering of shares of any Vanguard | and do not accept any liability whatsoever to any |
| fund only if preceded or accompanied by | person arising out of (a) the use of, reliance on or any |
| | error in the Index or (b) investment in or operation of |
| the fund’s current prospectus. | the Product. FTSE makes no claim, prediction, warranty |
| All comparative mutual fund data are from Lipper, a | or representation either as to the results to be obtained |
| Thomson Reuters Company, or Morningstar, Inc., unless | from the Product or the suitability of the Index for the |
| otherwise noted. | purpose to which it is being put by Vanguard. |
| |
| You can obtain a free copy of Vanguard’s proxy voting | |
| guidelines by visiting vanguard.com/proxyreporting or by | |
| calling Vanguard at 800-662-2739. The guidelines are | |
| also available from the SEC’s website, sec.gov. In | |
| addition, you may obtain a free report on how your fund | |
| voted the proxies for securities it owned during the 12 | |
| months ended June 30. To get the report, visit either | |
| vanguard.com/proxyreporting or sec.gov. | |
| |
| You can review and copy information about your fund at | |
| the SEC’s Public Reference Room in Washington, D.C. To | |
| find out more about this public service, call the SEC at | |
| 202-551-8090. Information about your fund is also | |
| available on the SEC’s website, and you can receive | |
| copies of this information, for a fee, by sending a | |
| request in either of two ways: via e-mail addressed to | |
| publicinfo@sec.gov or via regular mail addressed to the | |
| Public Reference Section, Securities and Exchange | |
| Commission, Washington, DC 20549-1520. | |
| |
| | © 2013 The Vanguard Group, Inc. |
| | All rights reserved. |
| | Vanguard Marketing Corporation, Distributor. |
| |
| | Q6230 122013 |

Annual Report | October 31, 2013
Vanguard Emerging Markets
Government Bond Index Fund

Vanguard’s Principles for Investing Success
We want to give you the best chance of investment success. These principles,
grounded in Vanguard’s research and experience, can put you on the right path.
Goals. Create clear, appropriate investment goals.
Balance. Develop a suitable asset allocation using broadly diversified funds.
Cost. Minimize cost.
Discipline. Maintain perspective and long-term discipline.
A single theme unites these principles: Focus on the things you can control.
We believe there is no wiser course for any investor.
| |
| Contents | |
| Your Fund’s Total Returns. | 1 |
| Chairman’s Letter. | 2 |
| Fund Profile. | 9 |
| Performance Summary. | 11 |
| Financial Statements. | 12 |
| Trustees Approve Advisory Arrangement. | 37 |
| Glossary. | 38 |
Please note: The opinions expressed in this report are just that—informed opinions. They should not be considered promises or advice.
Also, please keep in mind that the information and opinions cover the period through the date on the front of this report. Of course, the
risks of investing in your fund are spelled out in the prospectus.
See the Glossary for definitions of investment terms used in this report.
About the cover: The ship's wheel represents leadership and guidance, essential qualities in navigating difficult seas.
This one is a replica based on an 18th-century British vessel. The HMS Vanguard, another ship of that era, served as the
flagship for Admiral Horatio Nelson when he defeated a French fleet at the Battle of the Nile.
Your Fund’s Total Returns
| | | | |
| Period Ended October 31, 2013 | | | | |
| | | | | Returns |
| | 30-Day SEC | Income | Capital | Since |
| | Yield | Returns | Returns | Inception |
| Vanguard Emerging Markets Government Bond Index Fund | | | |
| Investor Shares (Inception: 5/31/2013) | 4.29% | 1.51% | -2.89% | -1.38% |
| Admiral™ Shares (Inception: 5/31/2013) | 4.44 | 1.57 | -2.94 | -1.37 |
| ETF Shares (Inception: 5/31/2013) | 4.44 | | | |
| Market Price | | | | -0.69 |
| Net Asset Value | | | | -1.39 |
| Barclays USD Emerging Markets Government RIC | | | | |
| Capped Index | | | | -1.30 |
| Emerging Markets Hard Currency Debt Funds | | | | |
| Average | | | | -2.10 |
| Emerging Markets Hard Currency Debt Funds Average: Derived from data provided by Lipper, a Thomson Reuters Company. |
Admiral Shares carry lower expenses and are available to investors who meet certain account-balance requirements. The Vanguard ETF® Shares shown are traded on the Nasdaq exchange and are available only through brokers. The table provides ETF returns based on both the Nasdaq market price and the net asset value for a share. U.S. Pat. Nos. 6,879,964; 7,337,138; 7,720,749; 7,925,573; 8,090,646; and 8,417,623.
For the ETF Shares, the market price is determined by the midpoint of the bid-offer spread as of the closing time of the New York Stock Exchange (generally 4 p.m., Eastern time). The net asset value is also determined as of the NYSE closing time. For more information about how the ETF Shares' market prices have compared with their net asset value, visit vanguard.com, select your ETF, and then select the Price and Performance tab. The ETF premium/discount analysis there shows the percentages of days on which the ETF Shares' market price was above or below the NAV.
| | | | |
| Your Fund’s Performance at a Glance | | | | |
| Inception Through October 31, 2013 | | | | |
| | | | Distributions Per Share |
| | Starting | Ending | | |
| | Share | Share | Income | Capital |
| | Price | Price | Dividends | Gains |
| Vanguard Emerging Markets Government Bond | | | | |
| Index Fund | | | | |
| Investor Shares | $10.00 | $9.74 | $0.148 | $0.000 |
| Admiral Shares | 20.00 | 19.48 | 0.307 | 0.000 |
| ETF Shares | 79.52 | 77.71 | 0.941 | 0.000 |
1

Chairman’s Letter
Dear Shareholder,
I am pleased to present you the first shareholder report for Vanguard Emerging Markets Government Bond Index Fund. We launched this fund to give investors a low-cost opportunity to participate in a key subset of emerging market bonds: U.S. dollar-denominated securities issued by governments in more than 60 countries across Latin America, Europe, Asia, and beyond.
From its inception on May 31, 2013, through October 31, the fund returned –1.38% for Investor Shares and about the same for Admiral and ETF Shares. This result outpaced the average return of the fund’s peer group, emerging markets hard currency debt funds. (A “hard currency” is one that is issued by an economically and politically stable country and is widely used around the world as payment for goods and services.)
Your fund closely tracked the –1.30% return of its benchmark, the Barclays USD Emerging Markets Government RIC Capped Index, which of course incurs no expenses. The fund’s close index tracking in its first few months is a testament to the skill and experience of Vanguard Fixed Income Group, the fund’s advisor.
Barclays constructs and manages your fund’s custom index with caps, or limits, on certain holdings. The intent is to comply with Internal Revenue Service diversification standards for regulated investment companies, or RICs, which
2
include mutual funds. In seeking to track the index, the advisor uses a sampling strategy, holding a range of securities that in total approximate the index’s key risk factors and characteristics, such as average duration and credit quality. Sampling is a common practice for bond index funds because it can be very difficult and potentially costly to own all the bonds in an index.
This report includes a brief look at the financial markets over the full 12 months of the fund’s fiscal year, followed by a review of the fund’s performance since May 31.
Before moving to that discussion, however, I want to mention an important transition at Vanguard. As we announced in early November, Robert F. Auwaerter, principal
and head of Vanguard Fixed Income Group, intends to retire in March 2014. At the conclusion of this letter, I’ll have more to say about the important contributions Bob made to Vanguard in his 32-year career, and I’ll introduce his successor, Gregory Davis.
Bond returns suffered as markets worldwide kept an eye on the Fed
With investors around the world fretting over the U.S. Federal Reserve’s next move in its stimulative bond-buying program, bonds recorded negative results for the 12 months ended October 31, 2013.
Outside the United States, bond markets (as measured by the Barclays Global Aggregate Index ex USD) returned
| | | |
| Market Barometer | | | |
| | Average Annual Total Returns |
| | Periods Ended October 31, 2013 |
| | One | Three | Five |
| | Year | Years | Years |
| Bonds | | | |
| Barclays U.S. Aggregate Bond Index (Broad taxable | | | |
| market) | -1.08% | 3.02% | 6.09% |
| Barclays Municipal Bond Index (Broad tax-exempt market) | -1.72 | 3.60 | 6.37 |
| Citigroup Three-Month U.S. Treasury Bill Index | 0.06 | 0.07 | 0.12 |
| |
| Stocks | | | |
| Russell 1000 Index (Large-caps) | 28.40% | 16.83% | 15.84% |
| Russell 2000 Index (Small-caps) | 36.28 | 17.69 | 17.04 |
| Russell 3000 Index (Broad U.S. market) | 28.99 | 16.89 | 15.94 |
| MSCI All Country World Index ex USA (International) | 20.29 | 6.04 | 12.48 |
| |
| CPI | | | |
| Consumer Price Index | 0.96% | 2.21% | 1.52% |
3
–1.95%, trailing the broad U.S. taxable bond market. International bonds generally traced a bumpy path similar to that of U.S. bonds, in part reflecting the ebb and flow of concerns about when Fed tapering might begin—and its implications for global economic growth.
The broad U.S. taxable bond market returned –1.08%. The yield of the 10-year Treasury note closed at 2.54%, up nearly a full percentage point from 1.69% at the end of October 2012. (Bond yields and prices move in opposite directions.) Municipal bonds returned –1.72%.
The Fed’s target for short-term interest rates remained at 0%–0.25%, severely limiting returns of money market funds and savings accounts.
Stocks in developed markets found a path to strong returns
Stocks outside the United States returned about 20% in aggregate. The developed markets of Europe and the Pacific region delivered robust gains. In Japan, the pro-growth, weaker-yen policies of Prime Minister Shinzo Abe have sparked an economic revival that helped propel the stock market to return almost 65% in yen, and about half that for U.S. dollar-based investors. Emerging-market stocks failed to keep pace with those of developed economies.
U.S. stocks faced several challenges en route to an impressive return of about 29%. Investors’ growing appetite for risk
| | | | |
| Expense Ratios | | | | |
| Your Fund Compared With Its Peer Group | | | | |
| |
| | Investor | Admiral | ETF | Peer Group |
| | Shares | Shares | Shares | Average |
| Emerging Markets Government Bond | | | | |
| Index Fund | 0.50% | 0.35% | 0.35% | 1.22% |
The fund expense ratios shown are from the prospectus dated May 14, 2013, and represent estimated costs for the current fiscal year. For the
period from inception through October 31, 2013, the annualized expense ratios were 0.49% for Investor Shares, 0.34% for Admiral Shares,
and 0.35% for ETF Shares. The peer-group expense ratio is derived from data provided by Lipper, a Thomson Reuters Company, and captures
information through year-end 2012.
Peer group: Emerging Markets Hard Currency Debt Funds.
4
drove the rise in stocks, as corporate profit growth, in general, wasn’t particularly tantalizing.
Although the final month of the fiscal year was notable for the budget impasse that resulted in a partial shutdown of the federal government for 16 days, the period as a whole was marked by uncertainties about the Fed’s monetary policy and concern about the economy’s patchy growth. Nonetheless, as Vanguard’s chief economist, Joe Davis, noted, the U.S. economy continued to expand, albeit at a modest and uneven pace.
The disparity between the performance of the U.S. economy and U.S. stocks may seem surprising, but Vanguard research has shown that over the long term, a nation’s economic growth has a weak relationship with its stock returns. (You can read more in The Outlook for Emerging Market Stocks in a Lower-Growth World, available at vanguard.com/research.)
Markets large and small felt the broad reach of Fed policy
Emerging markets often feature prominently in the headlines, so it can be easy to lose perspective on their relative size in global capital markets. Regarding the overall market value of investable bonds of developing countries, estimates vary for several reasons—including differing definitions of what constitutes an emerging market, the inaccessibility of some bonds because of limits on foreign ownership, and index construction methodologies.
That said, using calculations based on Barclays indexes, Vanguard estimates that emerging market bonds represent only a small slice—about 6%—of the global fixed income market. And bonds issued in local currencies constitute the majority of emerging market debt. Thus, the U.S. dollar-denominated bonds that your fund invests in are a small segment within a small market—but these securities represent some of the most accessible and frequently traded of all emerging market bonds.
Amid an environment of low yields at home and muted expectations from traditional fixed income investments, investors have increasingly turned to the higher yields offered by emerging-market securities. For example, on October 31, the 30-day SEC yield of your fund’s Investor Shares was 4.3%, more than double the yield of Vanguard Total Bond Market Index Fund. Higher yields, of course, typically reflect higher risks.
In May, the first hint that the Fed might begin to scale back its monthly bond purchases sent a chill through developing countries—which have benefited greatly from the Fed’s easy money policies in recent years. Aside from the lure of higher bond yields, many types of investors have
5
been attracted to emerging economies and their stocks for their seemingly attractive growth opportunities. Thus, the prospect of capital beginning to return home to the U.S. was unwelcome news. This made for an inauspicious start for the Emerging Markets Government Bond Index Fund, which—like its index—returned about –5% in June. Positive returns in some subsequent months could not offset the initial decline.
Still, the bonds of several countries notched gains. Argentina—about 1% of assets in the fund and its benchmark—was the standout, with a return of about 22% for its dollar-denominated government bonds. Notwithstanding unresolved court cases related to Argentina’s debt default in 2001, investors were attracted to double-digit yields on the country’s bonds.
At the other end of the spectrum, bonds from Turkey, Ukraine, and Honduras had some of the weakest returns, in the range of about –6% to –13%. And those of Russia and Brazil—two of the largest country holdings—had returns of approximately 0% and –2%, respectively.
Although your fund has only a five-month history, we are pleased by its initial success in closely tracking the return of its benchmark index. As always, however, we encourage you to evaluate results over a long-term horizon.
The role of international bonds in a diversified portfolio
Bonds issued in developed markets outside the United States have long been a meaningful slice of worldwide capital markets, while emerging market bonds have been a much smaller, but fast-growing, slice. Consistent with Vanguard’s principles of balance, diversification, and broad market exposure, it would have been theoretically appropriate to offer an international bond fund before now. However, several practical obstacles to buying non-U.S. bonds—including illiquidity, high trading and currency-hedging costs, and difficulties in navigating foreign credit markets—kept them absent from Vanguard’s fund lineup.
That changed with the recent growth and maturation of bond markets abroad, accompanied by lower currency-hedging costs, further globalization of businesses, greater capital flows, and better information access. Non-U.S. bonds grew from less than 20% of the world’s capital markets—stocks and bonds combined—in 2000 to approximately 33% at year-end 2012, the largest global asset class by a wide margin.
Vanguard research has shown that international bonds have the potential to reduce the volatility of portfolio returns, providing a diversification benefit similar to that expected from international stocks. To help make this important asset class
6
available to investors, in May we launched Vanguard Total International Bond Index Fund, which includes modest exposure to emerging market bonds.
For U.S.-based investors seeking greater exposure, Vanguard Emerging Markets Government Bond Index Fund can play a supporting role in a diversified portfolio. It offers a low-cost opportunity to participate in the potentially higher yields and improving economic fundamentals of developing economies by investing in some of their U.S. dollar-denominated bonds.
A word of caution, however: Emerging market bonds tend to perform more like equities than like traditional fixed income securities. Vanguard research has found that raising a portfolio’s allocation to emerging market bonds historically increased both the potential return and the overall volatility. You can read more about this in Emerging Market Bonds—Beyond the Headlines, at vanguard.com/research.
Bob Auwaerter’s retirement marks the end of a remarkable era
In mid-September 2008, about two weeks after I succeeded Jack Brennan as Vanguard’s chief executive officer, Lehman Brothers went bankrupt, igniting the nation’s worst financial crisis in 70 years. It was, to put it mildly, an extremely challenging time.
Through it all, I was able to depend on Bob Auwaerter’s strong command of the Fixed Income Group, which persevered under these treacherous conditions. Although that was a difficult period for Vanguard and the industry, it was far from the only time I was grateful to have Bob at the helm of our bond group.
Bob, who joined Vanguard in 1981, was an original member of the three-person Fixed Income Group, headed by Ian MacKinnon. Over the years, he held various leadership roles in the department, and he eventually succeeded Ian as its head in 2003. He earned a reputation at Vanguard and within the industry as an extremely dedicated, honest, and insightful decision-maker and leader.
The Fixed Income Group that Bob helped start had total assets of about $1.3 billion in seven funds. He tracked his positions in the two funds he managed on index cards stored in a small metal box. Thirty-two years later, the 120-person group oversees $750 billion, which represents nearly one-third of Vanguard’s assets under management.
On behalf of our clients, I thank Bob for more than three decades of exemplary service and wish him the best in his retirement.
7
We’re fortunate that Greg Davis will become the head of the Fixed Income Group. Greg currently serves as chief investment officer for the Asia-Pacific region and as a director of Vanguard Investments Australia. He joined Vanguard in 1999 and had been head of bond indexing and a senior portfolio manager in the Fixed Income Group. Greg is an eminently qualified successor and has a strong commitment to the Vanguard way of investing. I couldn’t be more confident in his ability to lead the Fixed Income Group and its deep and talented team.
As always, thank you for investing with Vanguard.
Sincerely,

F. William McNabb III
Chairman and Chief Executive Officer
November 19, 2013
8
Emerging Markets Government Bond Index Fund
Fund Profile
As of October 31, 2013
| | | |
| Share-Class Characteristics | | |
| |
| | Investor | Admiral | ETF |
| | Shares | Shares | Shares |
| Ticker Symbol | VGOVX | VGAVX | VWOB |
| Expense Ratio1 | 0.50% | 0.35% | 0.35% |
| 30-Day SEC Yield | 4.29% | 4.44% | 4.44% |
| | |
| Financial Attributes | | |
| | | Barclays USD |
| | | Emerging Mkts |
| | | Government |
| | Fund | RIC Capped Idx |
| Number of Bonds | 460 | 631 |
| Yield to Maturity | | |
| (before expenses) | 4.9% | 5.0% |
| Average Coupon | 5.9% | 6.1% |
| Average Duration | 6.5 years | 6.4 years |
| Average Effective | | |
| Maturity | 10.1 years | 10.4 years |
| Short-Term | | |
| Reserves | 1.5% | — |
| |
| Sector Diversification (% of portfolio) | |
| Foreign | 98. |
| Treasury/Agency | 0.5 |
| Other | 0.9 |
| |
| Distribution by Effective Maturity | |
| (% of portfolio) | |
| Under 1 Year | 0.9% |
| 1 - 3 Years | 11.1 |
| 3 - 5 Years | 17.7 |
| 5 - 10 Years | 45.2 |
| 10 - 20 Years | 9.2 |
| 20 - 30 Years | 14.6 |
| Over 30 Years | 1.3 |
| |
| Distribution by Credit Quality (% of portfolio) |
| U.S. Government | 0.5% |
| Aaa | 0.9 |
| Aa | 7.4 |
| A | 8.9 |
| Baa | 60.8 |
| Less Than Baa | 21.5 |
| For information about these ratings, see the Glossary entry for Credit Quality. |
1 The expense ratios shown are from the prospectus dated May 14, 2013, and represent estimated costs for the current fiscal year. For the
period from inception through October 31, 2013, the annualized expense ratios were 0.49% for Investor Shares, 0.34% for Admiral Shares,
and 0.35% for ETF Shares.
9
Emerging Markets Government Bond Index Fund
| |
| Market Diversification (% of portfolio) | |
| | Fund |
| Emerging Markets | |
| Russia | 13.1% |
| Brazil | 11.1 |
| Mexico | 8.0 |
| Turkey | 5.9 |
| Venezuela | 5.4 |
| Indonesia | 5.2 |
| China | 4.3 |
| United Arab Emirates | 4.1 |
| Philippines | 3.3 |
| Colombia | 2.6 |
| Lebanon | 2.0 |
| South Africa | 1.8 |
| Poland | 1.7 |
| India | 1.6 |
| Malaysia | 1.6 |
| Chile | 1.5 |
| Hungary | 1.5 |
| Peru | 1.4 |
| Argentina | 1.0 |
| Other | 21.3 |
| Subtotal | 98.4% |
| North America | |
| United States | 0.5% |
| Other | |
| Panama | 1.1% |
10
Emerging Markets Government Bond Index Fund
Performance Summary
All of the returns in this report represent past performance, which is not a guarantee of future results that may be achieved by the fund. (Current performance may be lower or higher than the performance data cited. For performance data current to the most recent month-end, visit our website at vanguard.com/performance.) Note, too, that both investment returns and principal value can fluctuate widely, so an investor’s shares, when sold, could be worth more or less than their original cost. The returns shown do not reflect taxes that a shareholder would pay on fund distributions or on the sale of fund shares.
| | | | |
| Fiscal-Year Total Returns (%): May 31, 2013, Through October 31, 2013 | |
| | | | | Barclays USD |
| | | | | Emerging Mkts |
| | | | | Government |
| | | | Investor Shares | RIC Capped Idx |
| Fiscal Year | Income Returns | Capital Returns | Total Returns | Total Returns |
| 2013 | 1.51% | -2.89% | -1.38% | -1.30% |
Total Returns: Periods Ended September 30, 2013
This table presents returns through the latest calendar quarter—rather than through the end of the fiscal period.
Securities and Exchange Commission rules require that we provide this information.
| | | | |
| | | | | Since Inception |
| | Inception Date | Income | Capital | Total |
| Investor Shares | 5/31/2013 | 1.15% | -4.89% | -3.74% |
| Fee-Adjusted Returns | | | | -4.46 |
| Admiral Shares | 5/31/2013 | 1.19 | -4.88 | -3.69 |
| Fee-Adjusted Returns | | | | -4.41 |
| ETF Shares | 5/31/2013 | | | |
| Market Price | | | | -2.40 |
| Net Asset Value | | | | -3.70 |
Vanguard fund returns are adjusted to reflect the 0.75% fee on purchases of fund shares. The fee does not apply to the ETF Shares. The
Fiscal-Year Total Returns table is not adjusted for fees.
See Financial Highlights for dividend and capital gains information.
11
Emerging Markets Government Bond Index Fund
Financial Statements
Statement of Net Assets
As of October 31, 2013
The fund reports a complete list of its holdings in regulatory filings four times in each fiscal year, at the quarter-ends. For the second and fourth fiscal quarters, the lists appear in the fund’s semiannual and annual reports to shareholders. For the first and third fiscal quarters, the fund files the lists with the Securities and Exchange Commission on Form N-Q. Shareholders can look up the fund’s Forms N-Q on the SEC’s website at sec.gov. Forms N-Q may also be reviewed and copied at the SEC’s Public Reference Room (see the back cover of this report for further information).
| | | | |
| | | | Face | Market |
| | | Maturity | Amount | Value |
| | Coupon | Date | ($000) | ($000) |
| Angola (0.2%) | | | | |
| Sovereign Bond (U.S. Dollar-Denominated) (0.2%) | | | | |
| 1 Republic of Angola Via Northern Lights III BV | 7.000% | 8/16/19 | 250 | 272 |
| Total Angola (Cost $269) | | | | 272 |
| Argentina (1.0%) | | | | |
| Sovereign Bonds (U.S. Dollar-Denominated) (1.0%) | | | | |
| 1 Provincia de Buenos Aires | 10.875% | 1/26/21 | 100 | 92 |
| Provincia de Buenos Aires | 11.750% | 10/5/15 | 200 | 197 |
| Provincia de Cordoba | 12.375% | 8/17/17 | 100 | 93 |
| 1 Republic of Argentina | 2.500% | 12/31/38 | 1,097 | 406 |
| Republic of Argentina | 5.770% | 12/31/33 | 554 | 403 |
| Republic of Argentina | 5.770% | 12/31/33 | 163 | 116 |
| Republic of Argentina | 8.750% | 6/2/17 | 100 | 87 |
| Total Argentina (Cost $1,229) | | | | 1,394 |
| Armenia (0.1%) | | | | |
| Sovereign Bond (U.S. Dollar-Denominated) (0.1%) | | | | |
| 2 Republic of Armenia | 6.000% | 9/30/20 | 200 | 197 |
| Total Armenia (Cost $197) | | | | 197 |
| Azerbaijan (0.2%) | | | | |
| Sovereign Bond (U.S. Dollar-Denominated) (0.2%) | | | | |
| State Oil Co. of the Azerbaijan Republic | 5.450% | 2/9/17 | 200 | 213 |
| Total Azerbaijan (Cost $212) | | | | 213 |
| Bahrain (0.8%) | | | | |
| Sovereign Bonds (U.S. Dollar-Denominated) (0.8%) | | | | |
| Bahrain Mumtalakat Holding Co. BSC | 5.000% | 6/30/15 | 150 | 155 |
| Batelco International Finance No. 1 Lts | 4.250% | 5/1/20 | 200 | 184 |
| 2 Kingdom of Bahrain | 5.500% | 3/31/20 | 100 | 103 |
| 2 Kingdom of Bahrain | 6.125% | 7/5/22 | 200 | 210 |
| 2 Kingdom of Bahrain | 6.125% | 8/1/23 | 150 | 156 |
| Kingdom of Bahrain | 6.273% | 11/22/18 | 350 | 395 |
| Total Bahrain (Cost $1,189) | | | | 1,203 |
12
| | | | |
| Emerging Markets Government Bond Index Fund | | | | |
| |
| |
| |
| | | | Face | Market |
| | | Maturity | Amount | Value |
| | Coupon | Date | ($000) | ($000) |
| Belarus (0.2%) | | | | |
| Sovereign Bonds (U.S. Dollar-Denominated) (0.2%) | | | | |
| Republic of Belarus | 8.750% | 8/3/15 | 258 | 257 |
| Republic of Belarus | 8.950% | 1/26/18 | 100 | 100 |
| Total Belarus (Cost $363) | | | | 357 |
| Belize (0.0%) | | | | |
| Sovereign Bond (U.S. Dollar-Denominated) (0.0%) | | | | |
| 1 Belize | 5.000% | 2/20/38 | 100 | 62 |
| Total Belize (Cost $60) | | | | 62 |
| Bermuda (0.1%) | | | | |
| Sovereign Bond (U.S. Dollar-Denominated) (0.1%) | | | | |
| 2 Bermuda | 4.854% | 2/6/24 | 150 | 150 |
| Total Bermuda (Cost $150) | | | | 150 |
| Bolivia (0.1%) | | | | |
| Sovereign Bond (U.S. Dollar-Denominated) (0.1%) | | | | |
| Plurinational State of Bolivia | 4.875% | 10/29/22 | 200 | 198 |
| Total Bolivia (Cost $182) | | | | 198 |
| Brazil (10.9%) | | | | |
| Sovereign Bonds (U.S. Dollar-Denominated) (10.9%) | | | |
| Banco do Brasil SA | 3.875% | 1/23/17 | 244 | 251 |
| Banco do Brasil SA | 3.875% | 10/10/22 | 475 | 430 |
| Banco do Brasil SA | 4.500% | 1/22/15 | 100 | 104 |
| Banco do Brasil SA | 5.375% | 1/15/21 | 100 | 100 |
| Banco do Brasil SA | 5.875% | 1/26/22 | 200 | 201 |
| Banco do Brasil SA | 5.875% | 1/19/23 | 50 | 50 |
| Banco do Brasil SA | 6.000% | 1/22/20 | 100 | 108 |
| 1 Banco do Brasil SA | 8.500% | 10/29/49 | 200 | 226 |
| 2 Banco Nacional de Desenvolvimento Economico | | | | |
| e Social | 3.375% | 9/26/16 | 400 | 405 |
| 2 Banco Nacional de Desenvolvimento Economico | | | | |
| e Social | 5.750% | 9/26/23 | 200 | 209 |
| Banco Nacional de Desenvolvimento Economico | | | | |
| e Social | 6.500% | 6/10/19 | 400 | 442 |
| Caixa Economica Federal | 2.375% | 11/6/17 | 325 | 308 |
| 2 Caixa Economica Federal | 4.500% | 10/3/18 | 200 | 201 |
| Centrais Eletricas Brasileiras SA | 5.750% | 10/27/21 | 200 | 196 |
| Centrais Eletricas Brasileiras SA | 6.875% | 7/30/19 | 200 | 218 |
| Federative Republic of Brazil | 2.625% | 1/5/23 | 600 | 535 |
| Federative Republic of Brazil | 4.250% | 1/7/25 | 300 | 298 |
| Federative Republic of Brazil | 4.875% | 1/22/21 | 531 | 576 |
| Federative Republic of Brazil | 5.625% | 1/7/41 | 450 | 458 |
| Federative Republic of Brazil | 5.875% | 1/15/19 | 430 | 494 |
| Federative Republic of Brazil | 6.000% | 1/17/17 | 650 | 731 |
| Federative Republic of Brazil | 7.125% | 1/20/37 | 990 | 1,190 |
| Federative Republic of Brazil | 7.875% | 3/7/15 | 300 | 326 |
| 1 Federative Republic of Brazil | 8.000% | 1/15/18 | 225 | 252 |
| Federative Republic of Brazil | 8.250% | 1/20/34 | 75 | 100 |
| Federative Republic of Brazil | 8.750% | 2/4/25 | 100 | 140 |
| Federative Republic of Brazil | 8.875% | 10/14/19 | 175 | 232 |
| Federative Republic of Brazil | 8.875% | 4/15/24 | 207 | 289 |
| Federative Republic of Brazil | 10.125% | 5/15/27 | 430 | 671 |
13
| | | | |
| Emerging Markets Government Bond Index Fund | | | | |
| |
| |
| |
| | | | Face | Market |
| | | Maturity | Amount | Value• |
| | Coupon | Date | ($000) | ($000) |
| Federative Republic of Brazil | 12.250% | 3/6/30 | 150 | 262 |
| 3 Petrobras Global Finance BV | 1.884% | 5/20/16 | 100 | 99 |
| Petrobras Global Finance BV | 2.000% | 5/20/16 | 400 | 396 |
| 3 Petrobras Global Finance BV | 2.384% | 1/15/19 | 150 | 146 |
| Petrobras Global Finance BV | 3.000% | 1/15/19 | 726 | 691 |
| Petrobras Global Finance BV | 4.375% | 5/20/23 | 500 | 461 |
| Petrobras Global Finance BV | 5.625% | 5/20/43 | 400 | 341 |
| Petrobras International Finance Co. | 2.875% | 2/6/15 | 325 | 329 |
| Petrobras International Finance Co. | 3.500% | 2/6/17 | 200 | 203 |
| Petrobras International Finance Co. | 3.875% | 1/27/16 | 450 | 464 |
| Petrobras International Finance Co. | 5.375% | 1/27/21 | 960 | 975 |
| Petrobras International Finance Co. | 5.750% | 1/20/20 | 250 | 264 |
| Petrobras International Finance Co. | 5.875% | 3/1/18 | 475 | 513 |
| Petrobras International Finance Co. | 6.750% | 1/27/41 | 397 | 391 |
| Petrobras International Finance Co. | 6.875% | 1/20/40 | 250 | 250 |
| Petrobras International Finance Co. | 7.875% | 3/15/19 | 200 | 232 |
| Petrobras International Finance Co. | 8.375% | 12/10/18 | 50 | 59 |
| Total Brazil (Cost $16,134) | | | | 15,817 |
| Bulgaria (0.1%) | | | | |
| Sovereign Bond (U.S. Dollar-Denominated) (0.1%) | | | | |
| Republic of Bulgaria | 8.250% | 1/15/15 | 150 | 163 |
| Total Bulgaria (Cost $163) | | | | 163 |
| Cayman Islands (1.1%) | | | | |
| Sovereign Bonds (U.S. Dollar-Denominated) (1.1%) | | | | |
| 2 IPIC GMTN Ltd. | 3.125% | 11/15/15 | 100 | 104 |
| 2 IPIC GMTN Ltd. | 3.750% | 3/1/17 | 245 | 260 |
| 2 IPIC GMTN Ltd. | 5.000% | 11/15/20 | 250 | 272 |
| 2 IPIC GMTN Ltd. | 5.500% | 3/1/22 | 310 | 345 |
| Jafz Sukuk Ltd. | 7.000% | 6/19/19 | 200 | 222 |
| 1 Republic of Ivory Coast | 7.100% | 12/31/32 | 376 | 339 |
| Total Cayman Islands (Cost $1,572) | | | | 1,542 |
| Chile (1.5%) | | | | |
| Sovereign Bonds (U.S. Dollar-Denominated) (1.5%) | | | | |
| 2 Banco del Estado de Chile | 3.875% | 2/8/22 | 200 | 196 |
| 2 Corp. Nacional del Cobre de Chile | 5.625% | 10/18/43 | 200 | 202 |
| 2 Corp. Nacional del Cobre de Chile | 3.000% | 7/17/22 | 275 | 253 |
| 2 Corp. Nacional del Cobre de Chile | 3.750% | 11/4/20 | 300 | 301 |
| 2 Corp. Nacional del Cobre De Chile | 3.875% | 11/3/21 | 200 | 199 |
| 2 Corp. Nacional del Cobre de Chile | 4.250% | 7/17/42 | 50 | 42 |
| 2 Corp. Nacional del Cobre de Chile | 4.500% | 8/13/23 | 150 | 153 |
| 2 Corp. Nacional del Cobre de Chile | 5.625% | 9/21/35 | 200 | 205 |
| Republic of Chile | 2.250% | 10/30/22 | 200 | 183 |
| Republic of Chile | 3.625% | 10/30/42 | 150 | 126 |
| Republic of Chile | 3.875% | 8/5/20 | 250 | 266 |
| Total Chile (Cost $2,132) | | | | 2,126 |
| China (4.3%) | | | | |
| Sovereign Bonds (U.S. Dollar-Denominated) (4.3%) | | | | |
| Amber Circle Funding Ltd. | 2.000% | 12/4/17 | 200 | 198 |
| China Development Bank Corp. | 5.000% | 10/15/15 | 200 | 214 |
| 2 China Resources Gas Group Ltd. | 4.500% | 4/5/22 | 200 | 199 |
| 2 China Resources Land Ltd. | 4.625% | 5/19/16 | 200 | 209 |
14
| | | | | |
| Emerging Markets Government Bond Index Fund | | | | |
| |
| |
| |
| | | | | Face | Market |
| | | | Maturity | Amount | Value |
| | | Coupon | Date | ($000) | ($000) |
| 2 | CNOOC Finance 2011 Ltd. | 4.250% | 1/26/21 | 338 | 348 |
| 2 | CNOOC Finance 2012 Ltd. | 3.875% | 5/2/22 | 475 | 469 |
| 2 | CNOOC Finance 2012 Ltd. | 5.000% | 5/2/42 | 200 | 196 |
| | CNOOC Finance 2013 Ltd. | 1.125% | 5/9/16 | 50 | 50 |
| | CNOOC Finance 2013 Ltd. | 1.750% | 5/9/18 | 200 | 196 |
| | CNOOC Finance 2013 Ltd. | 3.000% | 5/9/23 | 300 | 274 |
| | CNOOC Finance 2013 Ltd. | 4.250% | 5/9/43 | 200 | 174 |
| | CNPC General Capital Ltd. | 3.400% | 4/16/23 | 250 | 233 |
| 2 | CNPC HK Overseas Capital Ltd. | 3.125% | 4/28/16 | 400 | 414 |
| 2 | CNPC HK Overseas Capital Ltd. | 5.950% | 4/28/41 | 200 | 221 |
| 2 | COSL Finance BVI Ltd. | 3.250% | 9/6/22 | 100 | 91 |
| 2 | Export-Import Bank of China | 4.875% | 7/21/15 | 200 | 212 |
| | MCC Holding Hong Kong Corp. Ltd. | 4.875% | 7/29/16 | 200 | 201 |
| | Nexen Energy ULC | 5.875% | 3/10/35 | 158 | 171 |
| | Nexen Energy ULC | 6.400% | 5/15/37 | 225 | 259 |
| 1,2 | Sinochem Global Capital Co. Ltd. | 5.000% | 12/29/49 | 200 | 189 |
| 2 | Sinochem Overseas Capital Co. Ltd. | 4.500% | 11/12/20 | 275 | 282 |
| 2 | Sinopec Capital 2013 Ltd. | 3.125% | 4/24/23 | 400 | 366 |
| 2 | Sinopec Group Overseas Development 2012 Ltd. | 3.900% | 5/17/22 | 600 | 592 |
| 2 | Sinopec Group Overseas Development 2012 Ltd. | 4.875% | 5/17/42 | 100 | 97 |
| 2 | Sinopec Group Overseas Development 2013 Ltd. | 4.375% | 10/17/23 | 300 | 301 |
| Total China (Cost $6,243) | | | | 6,156 |
| Colombia (2.6%) | | | | |
| Sovereign Bonds (U.S. Dollar-Denominated) (2.6%) | | | | |
| | Ecopetrol SA | 4.250% | 9/18/18 | 35 | 37 |
| | Ecopetrol SA | 5.875% | 9/18/23 | 65 | 70 |
| | Ecopetrol SA | 7.375% | 9/18/43 | 250 | 286 |
| | Ecopetrol SA | 7.625% | 7/23/19 | 225 | 271 |
| 1 | Republic of Colombia | 2.625% | 3/15/23 | 675 | 608 |
| | Republic of Colombia | 4.375% | 7/12/21 | 200 | 211 |
| | Republic of Colombia | 6.125% | 1/18/41 | 450 | 505 |
| | Republic of Colombia | 7.375% | 1/27/17 | 900 | 1,048 |
| | Republic of Colombia | 7.375% | 3/18/19 | 100 | 122 |
| | Republic of Colombia | 7.375% | 9/18/37 | 200 | 256 |
| | Republic of Colombia | 8.125% | 5/21/24 | 150 | 198 |
| | Republic of Colombia | 8.250% | 12/22/14 | 100 | 108 |
| Total Colombia (Cost $3,740) | | | | 3,720 |
| Costa Rica (0.5%) | | | | |
| Sovereign Bonds (U.S. Dollar-Denominated) (0.5%) | | | | |
| 2 | Banco Nacional de Costa Rica | 4.875% | 11/1/18 | 200 | 200 |
| | Instituto Costarricense de Electricidad | 6.950% | 11/10/21 | 200 | 212 |
| | Republic of Costa Rica | 4.250% | 1/26/23 | 400 | 379 |
| Total Costa Rica (Cost $796) | | | | 791 |
| Croatia (0.9%) | | | | |
| Sovereign Bonds (U.S. Dollar-Denominated) (0.9%) | | | | |
| | Republic of Croatia | 6.250% | 4/27/17 | 200 | 214 |
| | Republic of Croatia | 6.375% | 3/24/21 | 350 | 372 |
| | Republic of Croatia | 6.625% | 7/14/20 | 300 | 324 |
| | Republic of Croatia | 6.750% | 11/5/19 | 400 | 437 |
| Total Croatia (Cost $1,356) | | | | 1,347 |
15
| | | | | |
| Emerging Markets Government Bond Index Fund | | | | |
| |
| |
| | | | | Face | Market |
| | | | Maturity | Amount | Value |
| | | Coupon | Date | ($000) | ($000) |
| Dominican Republic (0.4%) | | | | |
| Sovereign Bonds (U.S. Dollar-Denominated) (0.4%) | | | | |
| 1 | Dominican Republic | 5.875% | 4/18/24 | 200 | 196 |
| 1 | Dominican Republic | 7.500% | 5/6/21 | 350 | 387 |
| Total Dominican Republic (Cost $584) | | | | 583 |
| Ecuador (0.1%) | | | | |
| Sovereign Bond (U.S. Dollar-Denominated) (0.1%) | | | | |
| | Republic of Ecuador | 9.375% | 12/15/15 | 100 | 107 |
| Total Ecuador (Cost $105) | | | | 107 |
| Egypt (0.2%) | | | | |
| Sovereign Bonds (U.S. Dollar-Denominated) (0.2%) | | | | |
| | Arab Republic of Egypt | 5.750% | 4/29/20 | 212 | 196 |
| | Nile Finance Ltd. | 5.250% | 8/5/15 | 100 | 98 |
| Total Egypt (Cost $280) | | | | 294 |
| El Salvador (0.6%) | | | | |
| Sovereign Bonds (U.S. Dollar-Denominated) (0.6%) | | | | |
| | Republic of El Salvador | 5.875% | 1/30/25 | 200 | 199 |
| | Republic of El Salvador | 7.375% | 12/1/19 | 100 | 113 |
| | Republic of El Salvador | 7.650% | 6/15/35 | 260 | 274 |
| | Republic of El Salvador | 7.750% | 1/24/23 | 100 | 113 |
| | Republic of El Salvador | 8.250% | 4/10/32 | 100 | 114 |
| Total El Salvador (Cost $807) | | | | 813 |
| Gabon (0.1%) | | | | |
| Sovereign Bond (U.S. Dollar-Denominated) (0.1%) | | | | |
| | Gabonese Republic | 8.200% | 12/12/17 | 100 | 116 |
| Total Gabon (Cost $116) | | | | 116 |
| Georgia (0.2%) | | | | |
| Sovereign Bond (U.S. Dollar-Denominated) (0.2%) | | | | |
| | Republic of Georgia | 6.875% | 4/12/21 | 200 | 218 |
| Total Georgia (Cost $227) | | | | 218 |
| Ghana (0.2%) | | | | |
| Sovereign Bonds (U.S. Dollar-Denominated) (0.2%) | | | | |
| 2 | Republic of Ghana | 7.875% | 8/7/23 | 200 | 200 |
| | Republic of Ghana | 8.500% | 10/4/17 | 100 | 109 |
| Total Ghana (Cost $309) | | | | 309 |
| Guatemala (0.1%) | | | | |
| Sovereign Bond (U.S. Dollar-Denominated) (0.1%) | | | | |
| | Republic of Guatemala | 4.875% | 2/13/28 | 200 | 188 |
| Total Guatemala (Cost $196) | | | | 188 |
| Honduras (0.1%) | | | | |
| Sovereign Bond (U.S. Dollar-Denominated) (0.1%) | | | | |
| 1 | Republic of Honduras | 7.500% | 3/15/24 | 200 | 177 |
| Total Honduras (Cost $169) | | | | 177 |
16
| | | | | |
| Emerging Markets Government Bond Index Fund | | | | |
| |
| |
| |
| | | | | Face | Market |
| | | | Maturity | Amount | Value |
| | | Coupon | Date | ($000) | ($000) |
| Hungary (1.5%) | | | | |
| Sovereign Bonds (U.S. Dollar-Denominated) (1.5%) | | | | |
| 2,4 | MFB Magyar Fejlesztesi Bank Zrt | 6.250% | 10/21/20 | 200 | 204 |
| | Republic of Hungary | 4.125% | 2/19/18 | 510 | 512 |
| | Republic of Hungary | 4.750% | 2/3/15 | 100 | 103 |
| | Republic of Hungary | 5.375% | 2/21/23 | 250 | 249 |
| | Republic of Hungary | 6.250% | 1/29/20 | 100 | 109 |
| | Republic of Hungary | 6.375% | 3/29/21 | 560 | 607 |
| | Republic of Hungary | 7.625% | 3/29/41 | 300 | 337 |
| Total Hungary (Cost $2,103) | | | | 2,121 |
| India (1.6%) | | | | |
| Sovereign Bonds (U.S. Dollar-Denominated) (1.6%) | | | | |
| | Bank of India | 3.625% | 9/21/18 | 350 | 338 |
| | Export-Import Bank of India | 4.000% | 1/14/23 | 200 | 179 |
| | IDBI Bank Ltd. | 3.750% | 1/25/19 | 200 | 188 |
| | Indian Oil Corp. Ltd. | 4.750% | 1/22/15 | 150 | 154 |
| | Indian Oil Corp. Ltd. | 5.625% | 8/2/21 | 200 | 201 |
| | Indian Overseas Bank | 5.000% | 10/19/16 | 200 | 207 |
| | NTPC Ltd. | 5.625% | 7/14/21 | 200 | 203 |
| | State Bank of India | 4.125% | 8/1/17 | 850 | 863 |
| Total India (Cost $2,381) | | | | 2,333 |
| Indonesia (5.1%) | | | | |
| Sovereign Bonds (U.S. Dollar-Denominated) (5.1%) | | | | |
| | Majapahit Holding BV | 7.750% | 1/20/20 | 675 | 773 |
| | Majapahit Holding BV | 8.000% | 8/7/19 | 100 | 116 |
| 2 | Pertamina Persero PT | 4.300% | 5/20/23 | 655 | 598 |
| | Pertamina Persero PT | 5.250% | 5/23/21 | 200 | 200 |
| 2 | Pertamina Persero PT | 5.625% | 5/20/43 | 200 | 168 |
| 2 | Pertamina Persero PT | 6.000% | 5/3/42 | 200 | 176 |
| | Perusahaan Listrik Negara PT | 5.250% | 10/24/42 | 200 | 162 |
| | Perusahaan Listrik Negara PT | 5.500% | 11/22/21 | 100 | 101 |
| 2 | Perusahaan Penerbit SBSN Indonesia | 6.125% | 3/15/19 | 200 | 216 |
| | Republic of Indonesia | 3.300% | 11/21/22 | 228 | 197 |
| | Republic of Indonesia | 3.375% | 4/15/23 | 200 | 181 |
| | Republic of Indonesia | 3.750% | 4/25/22 | 600 | 568 |
| | Republic of Indonesia | 4.000% | 11/21/18 | 200 | 199 |
| | Republic of Indonesia | 4.625% | 4/15/43 | 375 | 320 |
| | Republic of Indonesia | 4.875% | 5/5/21 | 200 | 208 |
| | Republic of Indonesia | 5.250% | 1/17/42 | 300 | 278 |
| | Republic of Indonesia | 5.375% | 10/17/23 | 200 | 211 |
| | Republic of Indonesia | 6.625% | 2/17/37 | 818 | 894 |
| | Republic of Indonesia | 6.875% | 3/9/17 | 350 | 397 |
| | Republic of Indonesia | 6.875% | 1/17/18 | 466 | 530 |
| | Republic of Indonesia | 7.500% | 1/15/16 | 250 | 279 |
| | Republic of Indonesia | 7.750% | 1/17/38 | 100 | 122 |
| | Republic of Indonesia | 11.625% | 3/4/19 | 400 | 549 |
| Total Indonesia (Cost $7,544) | | | | 7,443 |
| Iraq (0.2%) | | | | |
| Sovereign Bond (U.S. Dollar-Denominated) (0.2%) | | | | |
| | Republic of Iraq | 5.800% | 1/15/28 | 310 | 270 |
| Total Iraq (Cost $273) | | | | 270 |
17
| | | | |
| Emerging Markets Government Bond Index Fund | | | | |
| |
| |
| |
| | | | Face | Market |
| | | Maturity | Amount | Value |
| | Coupon | Date | ($000) | ($000) |
| Ireland (0.1%) | | | | |
| Sovereign Bond (U.S. Dollar-Denominated) (0.1%) | | | | |
| Gazprombank OJSC Via GPB Eurobond Finance plc | 5.625% | 5/17/17 | 200 | 212 |
| Total Ireland (Cost $212) | | | | 212 |
| Jamaica (0.2%) | | | | |
| Sovereign Bond (U.S. Dollar-Denominated) (0.2%) | | | | |
| 1 Jamaica | 8.000% | 6/24/19 | 250 | 244 |
| Total Jamaica (Cost $250) | | | | 244 |
| Kazakhstan (1.8%) | | | | |
| Sovereign Bonds (U.S. Dollar-Denominated) (1.8%) | | | | |
| Development Bank of Kazakhstan JSC | 4.125% | 12/10/22 | 200 | 184 |
| 2 KazAgro National Management Holding JSC | 4.625% | 5/24/23 | 200 | 189 |
| Kazakhstan Temir Zholy Finance BV | 6.950% | 7/10/42 | 200 | 210 |
| Kazatomprom Natsionalnaya Atomnaya | | | | |
| Kompaniya AO | 6.250% | 5/20/15 | 200 | 212 |
| KazMunayGas National Co. JSC | 4.400% | 4/30/23 | 200 | 190 |
| 2 KazMunayGas National Co. JSC | 5.750% | 4/30/43 | 225 | 205 |
| KazMunayGas National Co. JSC | 9.125% | 7/2/18 | 1,125 | 1,378 |
| Total Kazakhstan (Cost $2,577) | | | | 2,568 |
| Latvia (0.4%) | | | | |
| Sovereign Bonds (U.S. Dollar-Denominated) (0.4%) | | | | |
| Republic of Latvia | 2.750% | 1/12/20 | 300 | 286 |
| Republic of Latvia | 5.250% | 2/22/17 | 200 | 218 |
| Total Latvia (Cost $505) | | | | 504 |
| Lebanon (2.0%) | | | | |
| Sovereign Bonds (U.S. Dollar-Denominated) (2.0%) | | | | |
| Republic of Lebanon | 4.750% | 11/2/16 | 100 | 99 |
| Republic of Lebanon | 5.150% | 11/12/18 | 150 | 147 |
| Republic of Lebanon | 5.450% | 11/28/19 | 350 | 339 |
| Republic of Lebanon | 5.500% | 4/23/19 | 50 | 49 |
| Republic of Lebanon | 6.000% | 1/27/23 | 400 | 384 |
| Republic of Lebanon | 6.100% | 10/4/22 | 400 | 389 |
| Republic of Lebanon | 6.375% | 3/9/20 | 580 | 587 |
| Republic of Lebanon | 6.600% | 11/27/26 | 100 | 99 |
| Republic of Lebanon | 8.500% | 8/6/15 | 250 | 266 |
| Republic of Lebanon | 8.500% | 1/19/16 | 300 | 323 |
| Republic of Lebanon | 9.000% | 3/20/17 | 150 | 167 |
| Total Lebanon (Cost $2,861) | | | | 2,849 |
| Lithuania (1.0%) | | | | |
| Sovereign Bonds (U.S. Dollar-Denominated) (1.0%) | | | | |
| Republic of Lithuania | 6.125% | 3/9/21 | 375 | 431 |
| Republic of Lithuania | 6.625% | 2/1/22 | 440 | 522 |
| 2 Republic of Lithuania | 6.750% | 1/15/15 | 450 | 479 |
| Total Lithuania (Cost $1,427) | | | | 1,432 |
| Luxembourg (0.1%) | | | | |
| Sovereign Bond (U.S. Dollar-Denominated) (0.1%) | | | | |
| VTB Bank OJSC Via VTB Capital SA | 6.250% | 6/30/35 | 100 | 106 |
| Total Luxembourg (Cost $106) | | | | 106 |
18
| | | | |
| Emerging Markets Government Bond Index Fund | | | | |
| |
| |
| |
| | | | Face | Market |
| | | Maturity | Amount | Value |
| | Coupon | Date | ($000) | ($000) |
| Malaysia (1.6%) | | | | |
| Sovereign Bonds (U.S. Dollar-Denominated) (1.6%) | | | | |
| 2 Federation of Malaysia | 2.991% | 7/6/16 | 625 | 651 |
| 1 Malayan Banking Bhd. | 3.250% | 9/20/22 | 200 | 198 |
| 2 Petroliam Nasional Bhd. | 7.750% | 8/15/15 | 100 | 111 |
| 2 Petronas Capital Ltd. | 5.250% | 8/12/19 | 748 | 843 |
| Petronas Capital Ltd. | 5.250% | 8/12/19 | 216 | 243 |
| SSG Resources Ltd. | 4.250% | 10/4/22 | 200 | 195 |
| Total Malaysia (Cost $2,242) | | | | 2,241 |
| Mexico (7.9%) | | | | |
| Sovereign Bonds (U.S. Dollar-Denominated) (7.9%) | | | | |
| Comision Federal de Electricidad | 4.875% | 5/26/21 | 250 | 261 |
| 2 Comision Federal de Electricidad | 4.875% | 1/15/24 | 200 | 203 |
| Pemex Project Funding Master Trust | 5.750% | 3/1/18 | 400 | 446 |
| Pemex Project Funding Master Trust | 6.625% | 6/15/35 | 540 | 584 |
| Petroleos Mexicanos | 3.500% | 7/18/18 | 300 | 307 |
| Petroleos Mexicanos | 3.500% | 1/30/23 | 250 | 231 |
| Petroleos Mexicanos | 4.875% | 3/15/15 | 350 | 368 |
| Petroleos Mexicanos | 4.875% | 1/24/22 | 300 | 311 |
| Petroleos Mexicanos | 5.500% | 1/21/21 | 350 | 381 |
| Petroleos Mexicanos | 5.500% | 6/27/44 | 500 | 462 |
| Petroleos Mexicanos | 6.000% | 3/5/20 | 100 | 112 |
| Petroleos Mexicanos | 6.500% | 6/2/41 | 600 | 641 |
| Petroleos Mexicanos | 8.000% | 5/3/19 | 472 | 578 |
| United Mexican States | 3.625% | 3/15/22 | 400 | 404 |
| United Mexican States | 4.000% | 10/2/23 | 1,525 | 1,543 |
| United Mexican States | 4.750% | 3/8/44 | 750 | 698 |
| United Mexican States | 5.625% | 1/15/17 | 640 | 718 |
| United Mexican States | 5.750% | 10/12/10 | 450 | 430 |
| United Mexican States | 5.950% | 3/19/19 | 375 | 436 |
| United Mexican States | 6.050% | 1/11/40 | 420 | 474 |
| United Mexican States | 6.625% | 3/3/15 | 200 | 215 |
| United Mexican States | 6.750% | 9/27/34 | 885 | 1,072 |
| United Mexican States | 7.500% | 4/8/33 | 50 | 65 |
| United Mexican States | 8.000% | 9/24/22 | 150 | 196 |
| United Mexican States | 11.375% | 9/15/16 | 200 | 258 |
| Total Mexico (Cost $11,552) | | | | 11,394 |
| Mongolia (0.2%) | | | | |
| Sovereign Bond (U.S. Dollar-Denominated) (0.2%) | | | | |
| Mongolia | 5.125% | 12/5/22 | 250 | 220 |
| Total Mongolia (Cost $234) | | | | 220 |
| Morocco (0.3%) | | | | |
| Sovereign Bonds (U.S. Dollar-Denominated) (0.3%) | | | | |
| Kingdom of Morocco | 4.250% | 12/11/22 | 250 | 236 |
| Kingdom of Morocco | 5.500% | 12/11/42 | 200 | 175 |
| Total Morocco (Cost $413) | | | | 411 |
19
| | | | |
| Emerging Markets Government Bond Index Fund | | | | |
| |
| |
| |
| | | | Face | Market |
| | | Maturity | Amount | Value |
| | Coupon | Date | ($000) | ($000) |
| Namibia (0.1%) | | | | |
| Sovereign Bond (U.S. Dollar-Denominated) (0.1%) | | | | |
| Republic of Namibia | 5.500% | 11/3/21 | 200 | 210 |
| Total Namibia (Cost $206) | | | | 210 |
| Nigeria (0.1%) | | | | |
| Sovereign Bond (U.S. Dollar-Denominated) (0.1%) | | | | |
| 2 Federal Republic of Nigeria | 5.125% | 7/12/18 | 200 | 207 |
| Total Nigeria (Cost $198) | | | | 207 |
| Pakistan (0.1%) | | | | |
| Sovereign Bond (U.S. Dollar-Denominated) (0.1%) | | | | |
| Islamic Republic of Pakistan | 6.875% | 6/1/17 | 175 | 172 |
| Total Pakistan (Cost $169) | | | | 172 |
| Panama (1.1%) | | | | |
| Sovereign Bonds (U.S. Dollar-Denominated) (1.1%) | | | | |
| Republic of Panama | 5.200% | 1/30/20 | 100 | 110 |
| 1 Republic of Panama | 6.700% | 1/26/36 | 680 | 800 |
| Republic of Panama | 7.250% | 3/15/15 | 400 | 433 |
| Republic of Panama | 8.875% | 9/30/27 | 125 | 174 |
| Republic of Panama | 9.375% | 4/1/29 | 50 | 72 |
| Total Panama (Cost $1,641) | | | | 1,589 |
| Peru (1.4%) | | | | |
| Sovereign Bonds (U.S. Dollar-Denominated) (1.4%) | | | | |
| Fondo MIVIVIENDA SA | 3.500% | 1/31/23 | 100 | 92 |
| Republic of Peru | 5.625% | 11/18/50 | 100 | 105 |
| 1 Republic of Peru | 6.550% | 3/14/37 | 859 | 1,023 |
| Republic of Peru | 7.125% | 3/30/19 | 200 | 243 |
| Republic of Peru | 7.350% | 7/21/25 | 200 | 257 |
| Republic of Peru | 8.375% | 5/3/16 | 150 | 174 |
| Republic of Peru | 8.750% | 11/21/33 | 50 | 72 |
| Total Peru (Cost $2,045) | | | | 1,966 |
| Philippines (3.2%) | | | | |
| Sovereign Bonds (U.S. Dollar-Denominated) (3.2%) | | | | |
| 5 Power Sector Assets & Liabilities | | | | |
| Management Corp. | 6.875% | 11/2/16 | 100 | 113 |
| 5 Power Sector Assets & Liabilities | | | | |
| Management Corp. | 7.250% | 5/27/19 | 214 | 258 |
| 5 Power Sector Assets & Liabilities | | | | |
| Management Corp. | 7.390% | 12/2/24 | 100 | 125 |
| Republic of Philippines | 4.000% | 1/15/21 | 250 | 266 |
| Republic of Philippines | 5.500% | 3/30/26 | 550 | 631 |
| Republic of Philippines | 6.375% | 1/15/32 | 300 | 360 |
| Republic of Philippines | 6.375% | 10/23/34 | 500 | 608 |
| Republic of Philippines | 7.750% | 1/14/31 | 400 | 538 |
| Republic of Philippines | 9.375% | 1/18/17 | 200 | 245 |
| Republic of Philippines | 9.500% | 2/2/30 | 325 | 496 |
| Republic of Philippines | 10.625% | 3/16/25 | 300 | 476 |
| Republic of Philippines | 8.375% | 6/17/19 | 405 | 522 |
| Total Philippines (Cost $4,717) | | | | 4,638 |
20
| | | | | |
| Emerging Markets Government Bond Index Fund | | | | |
| |
| |
| |
| | | | | Face | Market |
| | | | Maturity | Amount | Value |
| | | Coupon | Date | ($000) | ($000) |
| Poland (1.6%) | | | | |
| Sovereign Bonds (U.S. Dollar-Denominated) (1.6%) | | | | |
| | Republic of Poland | 3.000% | 3/17/23 | 500 | 467 |
| | Republic of Poland | 3.875% | 7/16/15 | 300 | 315 |
| | Republic of Poland | 5.000% | 3/23/22 | 200 | 218 |
| | Republic of Poland | 5.125% | 4/21/21 | 675 | 744 |
| | Republic of Poland | 6.375% | 7/15/19 | 525 | 619 |
| Total Poland (Cost $2,384) | | | | 2,363 |
| Qatar (4.4%) | | | | |
| Sovereign Bonds (U.S. Dollar-Denominated) (4.4%) | | | | |
| 1,2 | Nakilat Inc. | 6.067% | 12/31/33 | 100 | 107 |
| 2,6 | Qatari Diar Finance QSC | 3.500% | 7/21/15 | 215 | 223 |
| 2,6 | Qatari Diar Finance QSC | 5.000% | 7/21/20 | 275 | 305 |
| | QNB Finance Ltd. | 2.125% | 2/14/18 | 400 | 392 |
| | QNB Finance Ltd. | 3.375% | 2/22/17 | 400 | 415 |
| 2 | Qtel International Finance Ltd. | 3.250% | 2/21/23 | 150 | 138 |
| 2 | Qtel International Finance Ltd. | 3.375% | 10/14/16 | 305 | 318 |
| 2 | Qtel International Finance Ltd. | 3.875% | 1/31/28 | 200 | 177 |
| 2 | Qtel International Finance Ltd. | 4.750% | 2/16/21 | 300 | 318 |
| 2 | Qtel International Finance Ltd. | 5.000% | 10/19/25 | 200 | 205 |
| 1,2 | Ras Laffan Liquefied Natural Gas Co. Ltd. II | 5.298% | 9/30/20 | 178 | 193 |
| 1,2 | Ras Laffan Liquefied Natural Gas Co. Ltd. III | 5.838% | 9/30/27 | 270 | 290 |
| 6 | State of Qatar | 2.099% | 1/18/18 | 300 | 301 |
| 6 | State of Qatar | 3.241% | 1/18/23 | 425 | 414 |
| 2 | State of Qatar | 4.000% | 1/20/15 | 475 | 493 |
| 2 | State of Qatar | 4.500% | 1/20/22 | 200 | 216 |
| 2 | State of Qatar | 5.250% | 1/20/20 | 757 | 859 |
| 2 | State of Qatar | 5.750% | 1/20/42 | 200 | 218 |
| 2 | State of Qatar | 6.400% | 1/20/40 | 200 | 235 |
| 2 | State of Qatar | 6.550% | 4/9/19 | 250 | 300 |
| 2 | State of Qatar | 9.750% | 6/15/30 | 150 | 233 |
| Total Qatar (Cost $6,428) | | | | 6,350 |
| Romania (0.5%) | | | | |
| Sovereign Bonds (U.S. Dollar-Denominated) (0.5%) | | | | |
| | Republic of Romania | 4.375% | 8/22/23 | 176 | 172 |
| | Republic of Romania | 6.750% | 2/7/22 | 450 | 519 |
| Total Romania (Cost $700) | | | | 691 |
| Russia (12.7%) | | | | |
| Sovereign Bonds (U.S. Dollar-Denominated) (12.7%) | | | | |
| | AK Transneft OJSC Via TransCapitalInvest Ltd. | 8.700% | 8/7/18 | 120 | 147 |
| | Bank of Moscow via BOM Capital PL | 6.699% | 3/11/15 | 175 | 184 |
| | Gazprom Neft OAO Via GPN Capital SA | 4.375% | 9/19/22 | 200 | 189 |
| | Gazprom OAO Via Gaz Capital SA | 3.850% | 2/6/20 | 378 | 370 |
| | Gazprom OAO Via Gaz Capital SA | 4.950% | 5/23/16 | 200 | 212 |
| | Gazprom OAO Via Gaz Capital SA | 4.950% | 7/19/22 | 550 | 547 |
| | Gazprom OAO Via Gaz Capital SA | 4.950% | 2/6/28 | 450 | 408 |
| | Gazprom OAO Via Gaz Capital SA | 5.092% | 11/29/15 | 200 | 212 |
| | Gazprom OAO Via Gaz Capital SA | 6.212% | 11/22/16 | 325 | 358 |
| | Gazprom OAO Via Gaz Capital SA | 7.288% | 8/16/37 | 250 | 278 |
| | Gazprom OAO Via Gaz Capital SA | 9.250% | 4/23/19 | 100 | 125 |
| | Gazprombank OJSC Via GPB Eurobond Finance plc | 6.500% | 9/23/15 | 345 | 369 |
21
| | | | |
| Emerging Markets Government Bond Index Fund | | | | |
| |
| |
| |
| | | | Face | Market |
| | | Maturity | Amount | Value |
| | Coupon | Date | ($000) | ($000) |
| 1 Gazprombank OJSC Via GPB Eurobond Finance | | | | |
| plc | 7.875% | 4/29/49 | 200 | 205 |
| Rosneft Oil Co. via Rosneft International Finance | | | | |
| Ltd. | 4.199% | 3/6/22 | 527 | 494 |
| 2 Russian Agricultural Bank OJSC Via RSHB | | | | |
| Capital SA | 5.100% | 7/25/18 | 100 | 102 |
| Russian Agricultural Bank OJSC Via RSHB | | | | |
| Capital SA | 5.298% | 12/27/17 | 318 | 330 |
| 1 Russian Agricultural Bank OJSC Via RSHB | | | | |
| Capital SA | 6.000% | 6/3/21 | 200 | 204 |
| Russian Agricultural Bank OJSC Via RSHB | | | | |
| Capital SA | 6.299% | 5/15/17 | 200 | 216 |
| Russian Federation | 3.250% | 4/4/17 | 200 | 209 |
| 2 Russian Federation | 3.500% | 1/16/19 | 300 | 308 |
| Russian Federation | 3.625% | 4/29/15 | 700 | 727 |
| Russian Federation | 4.500% | 4/4/22 | 200 | 208 |
| 2 Russian Federation | 4.500% | 4/4/22 | 700 | 728 |
| 2 Russian Federation | 4.875% | 9/16/23 | 200 | 211 |
| Russian Federation | 4.875% | 9/16/23 | 200 | 210 |
| Russian Federation | 5.000% | 4/29/20 | 500 | 545 |
| Russian Federation | 5.625% | 4/4/42 | 800 | 832 |
| 1 Russian Federation | 7.500% | 3/31/30 | 2,324 | 2,766 |
| Russian Federation | 11.000% | 7/24/18 | 500 | 685 |
| Russian Federation | 12.750% | 6/24/28 | 375 | 654 |
| Russian Railways via RZD Capital plc | 5.700% | 4/5/22 | 200 | 210 |
| Russian Railways via RZD Capital plc | 5.739% | 4/3/17 | 250 | 269 |
| Sberbank of Russia Via SB Capital SA | 4.950% | 2/7/17 | 500 | 532 |
| Sberbank of Russia Via SB Capital SA | 5.125% | 10/29/22 | 524 | 505 |
| 2 Sberbank of Russia Via SB Capital SA | 5.250% | 5/23/23 | 150 | 139 |
| Sberbank of Russia Via SB Capital SA | 5.499% | 7/7/15 | 250 | 265 |
| Sberbank of Russia Via SB Capital SA | 5.717% | 6/16/21 | 200 | 214 |
| Sberbank of Russia Via SB Capital SA | 6.125% | 2/7/22 | 200 | 216 |
| Vnesheconombank Via VEB Finance plc | 5.375% | 2/13/17 | 300 | 321 |
| Vnesheconombank Via VEB Finance plc | 6.800% | 11/22/25 | 100 | 109 |
| Vnesheconombank Via VEB Finance plc | 6.902% | 7/9/20 | 550 | 618 |
| VTB Bank OJSC Via VTB Capital SA | 6.000% | 4/12/17 | 525 | 559 |
| VTB Bank OJSC Via VTB Capital SA | 6.465% | 3/4/15 | 300 | 316 |
| VTB Bank OJSC Via VTB Capital SA | 6.551% | 10/13/20 | 350 | 376 |
| VTB Bank OJSC Via VTB Capital SA | 6.950% | 10/17/22 | 375 | 384 |
| 1 VTB Bank OJSC via VTB Eurasia Ltd. | 9.500% | 12/29/49 | 250 | 273 |
| Total Russia (Cost $18,408) | | | | 18,339 |
| Saudi Arabia (0.5%) | | | | |
| Sovereign Bonds (U.S. Dollar-Denominated) (0.5%) | | | | |
| Saudi Electricity Global Sukuk Co. | 4.211% | 4/3/22 | 200 | 203 |
| Saudi Electricity Global Sukuk Co. 2 | 3.473% | 4/8/23 | 550 | 528 |
| Total Saudi Arabia (Cost $752) | | | | 731 |
| Serbia (0.6%) | | | | |
| Sovereign Bonds (U.S. Dollar-Denominated) (0.6%) | | | | |
| Republic of Serbia | 4.875% | 2/25/20 | 500 | 472 |
| Republic of Serbia | 5.250% | 11/21/17 | 400 | 398 |
| Total Serbia (Cost $896) | | | | 870 |
22
| | | | | |
| Emerging Markets Government Bond Index Fund | | | | |
| |
| |
| |
| | | | | Face | Market |
| | | | Maturity | Amount | Value |
| | | Coupon | Date | ($000) | ($000) |
| South Africa (1.7%) | | | | |
| Sovereign Bonds (U.S. Dollar-Denominated) (1.7%) | | | | |
| | Eskom Holdings SOC Ltd. | 5.750% | 1/26/21 | 400 | 403 |
| | Eskom Holdings SOC Ltd. | 6.750% | 8/6/23 | 200 | 207 |
| | Republic of South Africa | 4.665% | 1/17/24 | 300 | 297 |
| | Republic of South Africa | 5.500% | 3/9/20 | 385 | 418 |
| | Republic of South Africa | 5.875% | 5/30/22 | 625 | 686 |
| | Republic of South Africa | 5.875% | 9/16/25 | 200 | 214 |
| | Republic of South Africa | 6.875% | 5/27/19 | 100 | 116 |
| 2 | Transnet SOC Ltd. | 4.000% | 7/26/22 | 200 | 178 |
| Total South Africa (Cost $2,538) | | | | 2,519 |
| Sri Lanka (0.6%) | | | | |
| Sovereign Bonds (U.S. Dollar-Denominated) (0.6%) | | | | |
| | Bank of Ceylon | 5.325% | 4/16/18 | 200 | 193 |
| | Democratic Socialist Republic of Sri Lanka | 5.875% | 7/25/22 | 200 | 195 |
| | Democratic Socialist Republic of Sri Lanka | 6.250% | 10/4/20 | 432 | 437 |
| | Democratic Socialist Republic of Sri Lanka | 7.400% | 1/22/15 | 100 | 104 |
| Total Sri Lanka (Cost $927) | | | | 929 |
| Thailand (0.1%) | | | | |
| Sovereign Bond (U.S. Dollar-Denominated) (0.1%) | | | | |
| | PTT PCL | 4.500% | 10/25/42 | 200 | 166 |
| Total Thailand (Cost $182) | | | | 166 |
| Trinidad and Tobago (0.2%) | | | | |
| Sovereign Bonds (U.S. Dollar-Denominated) (0.2%) | | | | |
| 1 | Petroleum Co. of Trinidad & Tobago Ltd. | 6.000% | 5/8/22 | 75 | 80 |
| 2 | Petroleum Co. of Trinidad & Tobago Ltd. | 9.750% | 8/14/19 | 150 | 191 |
| Total Trinidad and Tobago (Cost $270) | | | | 271 |
| Turkey (5.8%) | | | | |
| Sovereign Bonds (U.S. Dollar-Denominated) (5.8%) | | | | |
| | Export Credit Bank of Turkey | 5.875% | 4/24/19 | 200 | 210 |
| 7 | Republic of Turkey | 2.803% | 3/26/18 | 450 | 431 |
| | Republic of Turkey | 3.250% | 3/23/23 | 451 | 398 |
| 2 | Republic of Turkey | 4.557% | 10/10/18 | 150 | 153 |
| | Republic of Turkey | 4.875% | 4/16/43 | 500 | 433 |
| | Republic of Turkey | 5.625% | 3/30/21 | 701 | 745 |
| | Republic of Turkey | 6.000% | 1/14/41 | 550 | 553 |
| | Republic of Turkey | 6.250% | 9/26/22 | 504 | 554 |
| | Republic of Turkey | 6.750% | 4/3/18 | 987 | 1,105 |
| | Republic of Turkey | 6.750% | 5/30/40 | 100 | 109 |
| | Republic of Turkey | 6.875% | 3/17/36 | 830 | 919 |
| | Republic of Turkey | 7.000% | 9/26/16 | 700 | 780 |
| | Republic of Turkey | 7.000% | 3/11/19 | 100 | 114 |
| | Republic of Turkey | 7.000% | 6/5/20 | 50 | 57 |
| | Republic of Turkey | 7.250% | 3/15/15 | 100 | 107 |
| | Republic of Turkey | 7.375% | 2/5/25 | 400 | 469 |
| | Republic of Turkey | 7.500% | 7/14/17 | 200 | 229 |
| | Republic of Turkey | 8.000% | 2/14/34 | 100 | 124 |
| | Republic of Turkey | 11.875% | 1/15/30 | 100 | 164 |
| | Turkiye Halk Bankasi AS | 3.875% | 2/5/20 | 200 | 183 |
23
| | | | | |
| Emerging Markets Government Bond Index Fund | | | | |
| |
| |
| |
| | | | | Face | Market |
| | | | Maturity | Amount | Value• |
| | | Coupon | Date | ($000) | ($000) |
| | Turkiye Halk Bankasi AS | 4.875% | 7/19/17 | 200 | 203 |
| | Turkiye Vakiflar Bankasi Tao | 3.750% | 4/15/18 | 200 | 191 |
| | Turkiye Vakiflar Bankasi Tao | 6.000% | 11/1/22 | 200 | 187 |
| Total Turkey (Cost $8,848) | | | | 8,418 |
| Ukraine (1.8%) | | | | |
| Sovereign Bonds (U.S. Dollar-Denominated) (1.8%) | | | | |
| | Financing of Infrastructural Projects State | | | | |
| | Enterprise | 7.400% | 4/20/18 | 200 | 170 |
| 8 | Financing of Infrastructural Projects State | | | | |
| | Enterprise | 8.375% | 11/3/17 | 250 | 219 |
| | Oschadbank Via SSB #1 plc | 8.875% | 3/20/18 | 200 | 168 |
| | Ukraine | 6.250% | 6/17/16 | 200 | 180 |
| | Ukraine | 6.580% | 11/21/16 | 615 | 553 |
| | Ukraine | 6.750% | 11/14/17 | 100 | 90 |
| | Ukraine | 7.750% | 9/23/20 | 398 | 360 |
| | Ukraine | 7.950% | 2/23/21 | 450 | 408 |
| | Ukraine | 9.250% | 7/24/17 | 400 | 386 |
| | Ukreximbank Via Biz Finance plc | 8.375% | 4/27/15 | 125 | 117 |
| Total Ukraine (Cost $2,878) | | | | 2,651 |
| United Arab Emirates (4.2%) | | | | |
| Sovereign Bonds (U.S. Dollar-Denominated) (4.2%) | | | | |
| 2 | Abu Dhabi National Energy Co. | 2.500% | 1/12/18 | 200 | 200 |
| 2 | Abu Dhabi National Energy Co. | 3.625% | 1/12/23 | 400 | 376 |
| 2 | Abu Dhabi National Energy Co. | 5.875% | 10/27/16 | 260 | 290 |
| 2 | Abu Dhabi National Energy Co. | 5.875% | 12/13/21 | 200 | 224 |
| 2 | Abu Dhabi National Energy Co. | 6.500% | 10/27/36 | 100 | 118 |
| | ADCB Finance Cayman Ltd. | 2.500% | 3/6/18 | 200 | 197 |
| | ADCB Finance Cayman Ltd. | 4.500% | 3/6/23 | 200 | 196 |
| 2 | Dolphin Energy Ltd. | 5.500% | 12/15/21 | 220 | 243 |
| 1,2 | Dolphin Energy Ltd. | 5.888% | 6/15/19 | 71 | 78 |
| 2 | DP World Ltd. | 6.850% | 7/2/37 | 300 | 315 |
| 2 | DP World Sukuk Ltd. | 6.250% | 7/2/17 | 270 | 297 |
| 2 | Dubai Electricity & Water Authority | 6.375% | 10/21/16 | 100 | 112 |
| 2 | Dubai Electricity & Water Authority | 7.375% | 10/21/20 | 250 | 292 |
| 2 | Dubai Electricity & Water Authority | 8.500% | 4/22/15 | 200 | 219 |
| 2 | Emirate of Abu Dhabi | 6.750% | 4/8/19 | 175 | 215 |
| | Emirate of Dubai United Arab Emirates | 3.875% | 1/30/23 | 200 | 189 |
| | Emirate of Dubai United Arab Emirates | 4.900% | 5/2/17 | 200 | 214 |
| | Emirate of Dubai United Arab Emirates | 5.250% | 1/30/43 | 200 | 172 |
| | Emirate of Dubai United Arab Emirates | 6.396% | 11/3/14 | 150 | 157 |
| | Emirate of Dubai United Arab Emirates | 6.700% | 10/5/15 | 200 | 217 |
| | Emirate of Dubai United Arab Emirates | 7.750% | 10/5/20 | 100 | 119 |
| 1,2 | Emirates Airline | 4.500% | 2/6/25 | 160 | 149 |
| | Emirates NBD PJSC | 4.625% | 3/28/17 | 225 | 235 |
| 2 | IPIC GMTN Ltd. | 6.875% | 11/1/41 | 200 | 251 |
| 2 | MDC-GMTN B.V. | 5.500% | 4/20/21 | 200 | 224 |
| 2 | MDC-GMTN B.V. | 7.625% | 5/6/19 | 200 | 248 |
| | National Bank of Abu Dhabi PJSC | 3.000% | 8/13/19 | 200 | 199 |
| | National Bank of Abu Dhabi PJSC | 4.250% | 3/25/15 | 100 | 104 |
| 1 | Ruwais Power Co. PJSC | 6.000% | 8/31/36 | 200 | 210 |
| 1,2 | Waha Aerospace BV | 3.925% | 7/28/20 | 91 | 96 |
| Total United Arab Emirates (Cost $6,199) | | | | 6,156 |
24
| | | | | |
| Emerging Markets Government Bond Index Fund | | | | |
| |
| |
| |
| | | | | Face | Market |
| | | | Maturity | Amount | Value |
| | | Coupon | Date | ($000) | ($000) |
| United States (0.5%) | | | | |
| U.S. Government and Agency Obligations (0.5%) | | | | |
| | United States Treasury Note/Bond | 0.375% | 8/31/15 | 120 | 120 |
| | United States Treasury Note/Bond | 1.250% | 10/31/18 | 75 | 75 |
| | United States Treasury Note/Bond | 1.375% | 9/30/18 | 475 | 477 |
| | United States Treasury Note/Bond | 4.375% | 2/15/38 | 10 | 11 |
| Total United States (Cost $682) | | | | 683 |
| Uruguay (0.7%) | | | | |
| Sovereign Bonds (U.S. Dollar-Denominated) (0.7%) | | | | |
| 1 | Oriental Republic of Uruguay | 4.125% | 11/20/45 | 225 | 184 |
| 1 | Oriental Republic of Uruguay | 4.500% | 8/14/24 | 496 | 511 |
| 1 | Oriental Republic of Uruguay | 7.625% | 3/21/36 | 300 | 384 |
| Total Uruguay (Cost $1,080) | | | | 1,079 |
| Venezuela (5.3%) | | | | |
| Sovereign Bonds (U.S. Dollar-Denominated) (5.3%) | | | | |
| | Bolivarian Republic of Venezuela | 5.750% | 2/26/16 | 365 | 327 |
| | Bolivarian Republic of Venezuela | 6.000% | 12/9/20 | 100 | 73 |
| | Bolivarian Republic of Venezuela | 7.000% | 12/1/18 | 250 | 206 |
| | Bolivarian Republic of Venezuela | 7.000% | 3/31/38 | 200 | 133 |
| | Bolivarian Republic of Venezuela | 7.650% | 4/21/25 | 150 | 110 |
| | Bolivarian Republic of Venezuela | 7.750% | 10/13/19 | 450 | 367 |
| | Bolivarian Republic of Venezuela | 8.250% | 10/13/24 | 484 | 368 |
| | Bolivarian Republic of Venezuela | 9.000% | 5/7/23 | 650 | 527 |
| | Bolivarian Republic of Venezuela | 9.250% | 9/15/27 | 650 | 537 |
| | Bolivarian Republic of Venezuela | 9.250% | 5/7/28 | 440 | 347 |
| | Bolivarian Republic of Venezuela | 9.375% | 1/13/34 | 200 | 158 |
| | Bolivarian Republic of Venezuela | 11.750% | 10/21/26 | 425 | 392 |
| 1 | Bolivarian Republic of Venezuela | 11.950% | 8/5/31 | 535 | 495 |
| 1 | Bolivarian Republic of Venezuela | 12.750% | 8/23/22 | 325 | 328 |
| | Bolivarian Republic of Venezuela | 13.625% | 8/15/18 | 300 | 319 |
| | Petroleos de Venezuela SA | 5.250% | 4/12/17 | 450 | 361 |
| | Petroleos de Venezuela SA | 5.375% | 4/12/27 | 500 | 306 |
| | Petroleos de Venezuela SA | 5.500% | 4/12/37 | 150 | 88 |
| 1 | Petroleos de Venezuela SA | 8.500% | 11/2/17 | 1,100 | 989 |
| 1 | Petroleos de Venezuela SA | 9.000% | 11/17/21 | 488 | 401 |
| 1 | Petroleos de Venezuela SA | 9.750% | 5/17/35 | 500 | 383 |
| 1 | Petroleos de Venezuela SA | 12.750% | 2/17/22 | 490 | 486 |
| Total Venezuela (Cost $8,240) | | | | 7,701 |
| Vietnam (0.2%) | | | | |
| Sovereign Bonds (U.S. Dollar-Denominated) (0.2%) | | | | |
| | Socialist Republic of Vietnam | 6.750% | 1/29/20 | 173 | 191 |
| | Socialist Republic of Vietnam | 6.875% | 1/15/16 | 100 | 108 |
| Total Vietnam (Cost $294) | | | | 299 |
| Zambia (0.1%) | | | | |
| Sovereign Bond (U.S. Dollar-Denominated) (0.1%) | | | | |
| | Republic of Zambia | 5.375% | 9/20/22 | 200 | 180 |
| Total Zambia (Cost $189) | | | | 180 |
25
| | | |
| Emerging Markets Government Bond Index Fund | | | |
| |
| |
| | | | Market |
| | | | Value• |
| | Coupon | Shares | ($000) |
| Temporary Cash Investments (1.6%) | | | |
| Money Market Fund (1.6%) | | | |
| 9 Vanguard Market Liquidity Fund | 0.120% | 2,222,639 | 2,223 |
| Total Temporary Cash Investments (Cost $2,223) | | | 2,223 |
| Total Investments (99.7%) (Cost $146,554) | | | 144,262 |
| Other Assets and Liabilities (0.3%) | | | |
| Other Assets | | | 5,325 |
| Liabilities | | | (4,834) |
| | | | 491 |
| Net Assets (100%) | | | 144,753 |
| |
| |
| At October 31, 2013, net assets consisted of: | | | |
| | | | Amount |
| | | | ($000) |
| Paid-in Capital | | | 146,925 |
| Undistributed Net Investment Income | | | 309 |
| Accumulated Net Realized Losses | | | (189) |
| Unrealized Appreciation (Depreciation) | | | (2,292) |
| Net Assets | | | 144,753 |
| |
| Investor Shares—Net Assets | | | |
| Applicable to 432,532 outstanding $.001 par value shares of | | | |
| beneficial interest (unlimited authorization) | | | 4,212 |
| Net Asset Value Per Share—Investor Shares | | | $9.74 |
| |
| Admiral Shares—Net Assets | | | |
| Applicable to 2,826,236 outstanding $.001 par value shares of | | | |
| beneficial interest (unlimited authorization) | | | 55,049 |
| Net Asset Value Per Share—Admiral Shares | | | $19.48 |
26
| |
| Emerging Markets Government Bond Index Fund | |
| |
| |
| |
| | Amount |
| | ($000) |
| ETF Shares—Net Assets | |
| Applicable to 1,100,167 outstanding $.001 par value shares of | |
| beneficial interest (unlimited authorization) | 85,492 |
| Net Asset Value Per Share—ETF Shares | $77.71 |
See Note A in Notes to Financial Statements.
1 The average or expected maturity is shorter than the final maturity shown because of the possibility of interim principal payments and
prepayments or the possibility of the issue being called.
2 Security exempt from registration under Rule 144A of the Securities Act of 1933. Such securities may be sold in transactions exempt from
registration, normally to qualified institutional buyers. At October 31, 2013, the aggregate value of these securities was $23,784,000,
representing 16.4% of net assets.
3 Adjustable-rate security.
4 Guaranteed by the Republic of Hungary
5 Guaranteed by the Republic of the Philippines
6 Guaranteed by the State of Qatar.
7 Guaranteed by the Republic of Turkey
8 Guaranteed by the Government of the Ukraine
9 Affiliated money market fund available only to Vanguard funds and certain trusts and accounts managed by Vanguard. Rate shown is the
7-day yield.
See accompanying Notes, which are an integral part of the Financial Statements.
27
Emerging Markets Government Bond Index Fund
Statement of Operations
| |
| | May 14, 20131 to |
| | October 31, 2013 |
| | ($000) |
| Investment Income | |
| Income | |
| Interest2,3 | 2,108 |
| Total Income | 2,108 |
| Expenses | |
| The Vanguard Group—Note B | |
| Investment Advisory Services | 1 |
| Management and Administrative—Investor Shares | 5 |
| Management and Administrative—Admiral Shares | 42 |
| Management and Administrative—ETF Shares | 76 |
| Marketing and Distribution—Investor Shares | — |
| Marketing and Distribution—Admiral Shares | 1 |
| Marketing and Distribution—ETF Shares | 4 |
| Custodian Fees | 15 |
| Auditing Fees | 25 |
| Shareholders’ Reports—Investor Shares | 1 |
| Shareholders’ Reports—Admiral Shares | 1 |
| Shareholders’ Reports— ETF Shares | — |
| Total Expenses | 171 |
| Net Investment Income | 1,937 |
| Realized Net Gain (Loss) on Investment Securities Sold | (189) |
| Change in Unrealized Appreciation (Depreciation) of Investment Securities | (2,292) |
| Net Increase (Decrease) in Net Assets Resulting from Operations | (544) |
| 1 Commencement of subscription period for the fund. |
| 2 Interest income from an affiliated company of the fund was $2,000. |
| 3 Interest income is net of foreign withholding taxes of $50,000. |
See accompanying Notes, which are an integral part of the Financial Statements.
28
Emerging Markets Government Bond Index Fund
Statement of Changes in Net Assets
| |
| | May 14, 20131 to |
| | October 31, 2013 |
| | ($000) |
| Increase (Decrease) in Net Assets | |
| Operations | |
| Net Investment Income | 1,937 |
| Realized Net Gain (Loss) | (189) |
| Change in Unrealized Appreciation (Depreciation) | (2,292) |
| Net Increase (Decrease) in Net Assets Resulting from Operations | (544) |
| Distributions | |
| Net Investment Income | |
| Investor Shares | (50) |
| Admiral Shares | (685) |
| ETF Shares | (893) |
| Realized Capital Gain | |
| Investor Shares | — |
| Admiral Shares | — |
| ETF Shares | — |
| Total Distributions | (1,628) |
| Capital Share Transactions | |
| Investor Shares | 4,229 |
| Admiral Shares | 55,480 |
| ETF Shares | 87,216 |
| Net Increase (Decrease) from Capital Share Transactions | 146,925 |
| Total Increase (Decrease) | 144,753 |
| Net Assets | |
| Beginning of Period | — |
| End of Period2 | 144,753 |
| 1 Commencement of subscription period for the fund. |
| 2 Net Assets—End of Period includes undistributed net investment income of $309,000. |
See accompanying Notes, which are an integral part of the Financial Statements.
29
Emerging Markets Government Bond Index Fund
Financial Highlights
| |
| Investor Shares | |
| | May 14, 20131 to |
| For a Share Outstanding Throughout the Period | October 31, 2013 |
| Net Asset Value, Beginning of Period | $10.00 |
| Investment Operations | |
| Net Investment Income | .149 |
| Net Realized and Unrealized Gain (Loss) on Investments2 | (.261) |
| Total from Investment Operations | (.112) |
| Distributions | |
| Dividends from Net Investment Income | (.148) |
| Distributions from Realized Capital Gains | — |
| Total Distributions | (.148) |
| Net Asset Value, End of Period | $9.74 |
| |
| Total Return 3 | -1.38% |
| |
| Ratios/Supplemental Data | |
| Net Assets, End of Period (Millions) | $4 |
| Ratio of Total Expenses to Average Net Assets | 0.49%4 |
| Ratio of Net Investment Income to Average Net Assets | 3.81%4 |
| Portfolio Turnover Rate5 | 38% |
1 Subscription period for the fund was May 14, 2013, to May 30, 2013, during which time all assets were held in money market instruments.
Performance measurement began May 31, 2013, at a net asset value of $10.03.
2 Includes increases from purchase fees of $.03.
3 Total returns do not include transaction or account service fees that may have applied in the period shown. Fund prospectuses provide
information about any applicable transaction and account service fees.
4 Annualized.
5 Excludes the value of portfolio securities received or delivered as a result of in-kind purchases or redemptions of the fund’s capital shares,
including ETF Creation Units.
See accompanying Notes, which are an integral part of the Financial Statements.
30
Emerging Markets Government Bond Index Fund
Financial Highlights
| |
| Admiral Shares | |
| | May 14, 20131 to |
| For a Share Outstanding Throughout the Period | October 31, 2013 |
| Net Asset Value, Beginning of Period | $20.00 |
| Investment Operations | |
| Net Investment Income | .309 |
| Net Realized and Unrealized Gain (Loss) on Investments2 | (.522) |
| Total from Investment Operations | (.213) |
| Distributions | |
| Dividends from Net Investment Income | (.307) |
| Distributions from Realized Capital Gains | — |
| Total Distributions | (. 307) |
| Net Asset Value, End of Period | $19.48 |
| |
| Total Return 3 | -1.37% |
| |
| Ratios/Supplemental Data | |
| Net Assets, End of Period (Millions) | $55 |
| Ratio of Total Expenses to Average Net Assets | 0.34%4 |
| Ratio of Net Investment Income to Average Net Assets | 3.96%4 |
| Portfolio Turnover Rate5 | 38% |
1 Subscription period for the fund was May 14, 2013, to May 30, 2013, during which time all assets were held in money market instruments.
Performance measurement began May 31, 2013, at a net asset value of $20.07.
2 Includes increases from purchase fees of $.06.
3 Total returns do not include transaction or account service fees that may have applied in the period shown. Fund prospectuses provide
information about any applicable transaction and account service fees.
4 Annualized.
5 Excludes the value of portfolio securities received or delivered as a result of in-kind purchases or redemptions of the fund’s capital shares,
including ETF Creation Units.
See accompanying Notes, which are an integral part of the Financial Statements.
31
Emerging Markets Government Bond Index Fund
Financial Highlights
| |
| ETF Shares | |
| | May 31, 20131 to |
| For a Share Outstanding Throughout the Period | October 31, 2013 |
| Net Asset Value, Beginning of Period | $79.52 |
| Investment Operations | |
| Net Investment Income | 1.217 |
| Net Realized and Unrealized Gain (Loss) on Investments2 | (2.086) |
| Total from Investment Operations | (.869) |
| Distributions | |
| Dividends from Net Investment Income | (.941) |
| Distributions from Realized Capital Gains | — |
| Total Distributions | (. 941) |
| Net Asset Value, End of Period | $77.71 |
| |
| Total Return | -1.39% |
| |
| Ratios/Supplemental Data | |
| Net Assets, End of Period (Millions) | $85 |
| Ratio of Total Expenses to Average Net Assets | 0.35%3 |
| Ratio of Net Investment Income to Average Net Assets | 3.95%3 |
| Portfolio Turnover Rate4 | 38% |
1 Inception.
2 Includes increases from purchase fees of $.30.
3 Annualized.
4 Excludes the value of portfolio securities received or delivered as a result of in-kind purchases or redemptions of the fund’s capital shares,
including ETF Creation Units.
See accompanying Notes, which are an integral part of the Financial Statements.
32
Emerging Markets Government Bond Index Fund
Notes to Financial Statements
Vanguard Emerging Markets Government Bond Index Fund is registered under the Investment Company Act of 1940 as an open-end investment company, or mutual fund. The fund invests in securities of foreign issuers, which may subject it to investment risks not normally associated with investing in securities of U.S. corporations. The fund offers four classes of shares: Investor Shares, Admiral Shares, Institutional Shares, and ETF Shares. Investor Shares are available to any investor who meets the fund’s minimum purchase requirements. Admiral Shares and Institutional Shares are designed for investors who meet certain administrative, service, and account-size criteria. The fund has not issued any Institutional Shares through October 31, 2013. ETF Shares are listed for trading on Nasdaq; they can be purchased and sold through a broker.
A. The following significant accounting policies conform to generally accepted accounting principles for U.S. mutual funds. The fund consistently follows such policies in preparing its financial statements.
1. Security Valuation: Securities are valued as of the close of trading on the New York Stock Exchange (generally 4 p.m., Eastern time) on the valuation date. Bonds, and temporary cash investments acquired over 60 days to maturity, are valued using the latest bid prices or using valuations based on a matrix system (which considers such factors as security prices, yields, maturities, and ratings), both as furnished by independent pricing services. Investments in Vanguard Market Liquidity Fund are valued at that fund’s net asset value. Other temporary cash investments are valued at amortized cost, which approximates market value. Securities for which market quotations are not readily available, or whose values have been affected by events occurring before the fund’s pricing time but after the close of the securities’ primary markets, are valued at their fair values calculated according to procedures adopted by the board of trustees. These procedures include obtaining quotations from an independent pricing service, monitoring news to identify significant market- or security-specific events, and evaluating changes in the values of foreign market proxies (for example, ADRs, futures contracts, or exchange-traded funds), between the time the foreign markets close and the fund’s pricing time. When fair-value pricing is employed, the prices of securities used by a fund to calculate its net asset value may differ from quoted or published prices for the same securities.
2. Federal Income Taxes: The fund intends to qualify as a regulated investment company and distribute all of its taxable income. Management has analyzed the fund’s tax positions taken for its open federal income tax period ended October 31, 2013, and has concluded that no provision for federal income tax is required in the fund’s financial statements.
3. Distributions: Distributions to shareholders are recorded on the ex-dividend date.
4. Other: Interest income includes income distributions received from Vanguard Market Liquidity Fund and is accrued daily. Premiums and discounts on debt securities purchased are amortized and accreted, respectively, to interest income over the lives of the respective securities. Security transactions are accounted for on the date securities are bought or sold. Costs used to determine realized gains (losses) on the sale of investment securities are those of the specific securities sold. Fees assessed on purchases of capital shares are credited to paid-in capital.
Each class of shares has equal rights as to assets and earnings, except that each class separately bears certain class-specific expenses related to maintenance of shareholder accounts (included in Management and Administrative expenses) and shareholder reporting. Marketing and distribution expenses are allocated to each class of shares based on a method approved by the board of trustees. Income, other non-class-specific expenses, and gains and losses on investments are allocated to each class of shares based on its relative net assets.
33
Emerging Markets Government Bond Index Fund
B. The Vanguard Group furnishes at cost investment advisory, corporate management, administrative, marketing, and distribution services. The costs of such services are allocated to the fund under methods approved by the board of trustees. The fund has committed to provide up to 0.40% of its net assets in capital contributions to Vanguard. At October 31, 2013, the fund had contributed capital of $17,000 to Vanguard (included in Other Assets), representing 0.01% of the fund’s net assets and 0.01% of Vanguard’s capitalization. The fund’s trustees and officers are also directors and officers of Vanguard.
C. Various inputs may be used to determine the value of the fund’s investments. These inputs are summarized in three broad levels for financial statement purposes. The inputs or methodologies used to value securities are not necessarily an indication of the risk associated with investing in those securities.
Level 1—Quoted prices in active markets for identical securities.
Level 2—Other significant observable inputs (including quoted prices for similar securities, interest rates, prepayment speeds, credit risk, etc.).
Level 3—Significant unobservable inputs (including the fund’s own assumptions used to determine the fair value of investments).
The following table summarizes the market value of the fund’s investments as of October 31, 2013, based on the inputs used to value them:
| | | |
| | Level 1 | Level 2 | Level 3 |
| Investments | ($000) | ($000) | ($000) |
| U.S. Government and Agency Obligations | — | 683 | — |
| Sovereign Bonds | — | 141,356 | — |
| Temporary Cash Investments | 2,223 | — | — |
| Total | 2,223 | 142,039 | — |
D. Distributions are determined on a tax basis and may differ from net investment income and realized capital gains for financial reporting purposes. Differences may be permanent or temporary. Permanent differences are reclassified among capital accounts in the financial statements to reflect their tax character. Temporary differences arise when certain items of income, expense, gain, or loss are recognized in different periods for financial statement and tax purposes; these differences will reverse at some time in the future. Differences in classification may also result from the treatment of short-term gains as ordinary income for tax purposes.
For tax purposes, at October 31, 2013, the fund had available capital losses totaling $179,000 that may be carried forward indefinitely to offset future net capital gains.
At October 31, 2013, the cost of investment securities for tax purposes was $146,564,000. Net unrealized depreciation of investment securities for tax purposes was $2,302,000, consisting of unrealized gains of $1,067,000 on securities that had risen in value since their purchase and $3,369,000 in unrealized losses on securities that had fallen in value since their purchase.
E. During the period ended October 31, 2013, the fund purchased $152,262,000 of investment securities and sold $9,835,000 of investment securities, other than U.S. government securities and temporary cash investments. Purchases and sales of U.S. government securities were $32,108,000 and $31,533,000, respectively. Total purchases and sales include $63,712,000 and $0, respectively, in connection with in-kind purchases and redemptions of the fund’s capital shares.
Emerging Markets Government Bond Index Fund
F. Capital share transactions for each class of shares were:
| | |
| | October 31, 2013 |
| | Amount | Shares |
| | ($000) | (000) |
| Investor Shares1 | | |
| Issued 2 | 5,058 | 519 |
| Issued in Lieu of Cash Distributions | 47 | 5 |
| Redeemed | (876) | (91) |
| Net Increase (Decrease)—Investor Shares | 4,229 | 433 |
| Admiral Shares1 | | |
| Issued 2 | 59,924 | 3,057 |
| Issued in Lieu of Cash Distributions | 632 | 33 |
| Redeemed | (5,076) | (264) |
| Net Increase (Decrease) —Admiral Shares | 55,480 | 2,826 |
| ETF Shares3 | | |
| Issued 2 | 87,216 | 1,100 |
| Issued in Lieu of Cash Distributions | — | — |
| Redeemed | — | — |
| Net Increase (Decrease)—ETF Shares | 87,216 | 1,100 |
| 1 Commencement of subscription period for the fund was May 14, 2013. |
| 2 Includes purchase fees of $482,000 (fund total). |
| 3 Inception date was May 31, 2013. |
G. Management has determined that no material events or transactions occurred subsequent to October 31, 2013, that would require recognition or disclosure in these financial statements.
35
Report of Independent Registered
Public Accounting Firm
To the Trustees of Vanguard Whitehall Funds and the Shareholders of Vanguard Emerging Markets Government Bond Index Fund: In our opinion, the accompanying statement of net assets and the related statements of operations and of changes in net assets and the financial highlights present fairly, in all material respects, the financial position of Vanguard Emerging Markets Government Bond Index Fund (constituting a separate portfolio of Vanguard Whitehall Funds, hereafter referred to as the “Fund”) at October 31, 2013, and the results of its operations, the changes in its net assets, and the financial highlights for the period May 31, 2013 (commencement of operations) through October 31, 2013, in conformity with accounting principles generally accepted in the United States of America. These financial statements and financial highlights (hereafter referred to as “financial statements”) are the responsibility of the Fund’s management; our responsibility is to express an opinion on these financial statements based on our audit. We conducted our audit of these financial statements in accordance with the standards of the Public Company Accounting Oversight Board (United States). Those standards require that we plan and perform the audit to obtain reasonable assurance about whether the financial statements are free of material misstatement. An audit includes examining, on a test basis, evidence supporting the amounts and disclosures in the financial statements, assessing the accounting principles used and significant estimates made by management, and evaluating the overall financial statement presentation. We believe that our audit, which included confirmation of securities at October 31, 2013 by correspondence with the custodian and by agreement to the underlying ownership records of the transfer agent, provides a reasonable basis for our opinion.
/s/PricewaterhouseCoopers LLP
Philadelphia, Pennsylvania
December 18, 2013
36
Trustees Approve Advisory Arrangement
The board of trustees approved the launch of Vanguard Emerging Markets Government Bond Index Fund with an internalized management structure whereby The Vanguard Group, Inc. (Vanguard)—through its Fixed Income Group—would provide investment advisory services to the fund at cost. The board determined that the investment advisory arrangement with Vanguard was in the best interests of the fund and its prospective shareholders.
The board based its decision upon an evaluation of the advisor’s investment staff, portfolio management process, and performance. The trustees considered the factors discussed below, among others. However, no single factor determined whether the board approved the arrangement. Rather, it was the totality of the circumstances that drove the board’s decision.
Nature, extent, and quality of services
The board considered the quality of the investment management services to be provided to the fund and took into account the organizational depth and stability of the advisor. The board noted that Vanguard has been managing investments for more than three decades. The Fixed Income Group adheres to a sound, disciplined investment management process; the team has considerable experience, stability, and depth.
The board concluded that Vanguard’s experience, stability, depth, and performance, among other factors, warranted approval of the advisory arrangement.
Investment performance
The board could not consider the performance of the fund because it was newly launched. However, the board determined that, in its management of other Vanguard index funds, the Fixed Income Group has a track record of consistent performance and disciplined investment processes. Information about the fund’s performance since inception can be found in the Performance Summary section of this report.
Cost
The board considered the cost of services to be provided and concluded that the fund’s expense ratio would be below the average expense ratio charged by funds in its peer group. Information about the fund’s expense ratio appears in the Financial Statements section.
The board did not conduct a profitability analysis of Vanguard, because of Vanguard’s unique “at-cost” structure. Unlike most other mutual fund management companies, Vanguard is owned by the funds it oversees, and produces “profits” only in the form of reduced expenses for fund shareholders.
The benefit of economies of scale
The board concluded that the fund’s at-cost arrangement with Vanguard ensures that the fund will realize economies of scale as it grows, with the cost to shareholders declining as fund assets increase.
The board will consider whether to renew the advisory arrangement again after a one-year period.
37
Glossary
30-Day SEC Yield. A fund’s 30-day SEC yield is derived using a formula specified by the U.S. Securities and Exchange Commission. Under the formula, data related to the fund’s security holdings in the previous 30 days are used to calculate the fund’s hypothetical net income for that period, which is then annualized and divided by the fund’s estimated average net assets over the calculation period. For the purposes of this calculation, a security’s income is based on its current market yield to maturity (for bonds), its actual income (for asset-backed securities), or its projected dividend yield (for stocks). Because the SEC yield represents hypothetical annualized income, it will differ—at times significantly—from the fund’s actual experience. As a result, the fund’s income distributions may be higher or lower than implied by the SEC yield.
Average Coupon. The average interest rate paid on the fixed income securities held by a fund. It is expressed as a percentage of face value.
Average Duration. An estimate of how much the value of the bonds held by a fund will fluctuate in response to a change in interest rates. To see how the value could change, multiply the average duration by the change in rates. If interest rates rise by 1 percentage point, the value of the bonds in a fund with an average duration of five years would decline by about 5%. If rates decrease by a percentage point, the value would rise by 5%.
Average Effective Maturity. The average length of time until fixed income securities held by a fund reach maturity and are repaid, taking into consideration the possibility that the issuer may call the bond before its maturity date. The figure reflects the proportion of fund assets represented by each security; it also reflects any futures contracts held. In general, the longer the average effective maturity, the more a fund’s share price will fluctuate in response to changes in market interest rates.
Credit Quality. Credit-quality ratings are measured on a scale that generally ranges from AAA (highest) to D (lowest). “Not Rated” is used to classify securities for which a rating is not available. U.S. Treasury, U.S. Agency, and U.S. Agency mortgage-backed securities appear under “U.S. Government.” Credit-quality ratings are obtained from Barclays using ratings generally derived from Moody’s, Fitch, and S&P. When ratings from all three agencies are used, the median rating is shown. When ratings from two of the agencies are used, the lower rating is shown.
Expense Ratio. A fund’s total annual operating expenses expressed as a percentage of the fund’s average net assets. The expense ratio includes management and administrative expenses, but does not include the transaction costs of buying and selling portfolio securities.
Inception Date. The date on which the assets of a fund (or one of its share classes) are first invested in accordance with the fund’s investment objective. For funds with a subscription period, the inception date is the day after that period ends. Investment performance is measured from the inception date.
Short-Term Reserves. The percentage of a fund invested in highly liquid, short-term securities that can be readily converted to cash.
Yield to Maturity. The rate of return an investor would receive if the fixed income securities held by a fund were held to their maturity dates.
38
This page intentionally left blank.
The People Who Govern Your Fund
The trustees of your mutual fund are there to see that the fund is operated and managed in your best interests since, as a shareholder, you are a part owner of the fund. Your fund’s trustees also serve on the board of directors of The Vanguard Group, Inc., which is owned by the Vanguard funds and provides services to them on an at-cost basis.
A majority of Vanguard’s board members are independent, meaning that they have no affiliation with Vanguard or the funds they oversee, apart from the sizable personal investments they have made as private individuals. The independent board members have distinguished backgrounds in business, academia, and public service. Each of the trustees and executive officers oversees 181 Vanguard funds.
The following table provides information for each trustee and executive officer of the fund. More information about the trustees is in the Statement of Additional Information, which can be obtained, without charge, by contacting Vanguard at 800-662-7447, or online at vanguard.com.
| |
| InterestedTrustee1 | and Delphi Automotive LLP (automotive components); |
| | Senior Advisor at New Mountain Capital; Trustee of |
| F. William McNabb III | The Conference Board. |
| Born 1957. Trustee Since July 2009. Chairman of the | |
| Board. Principal Occupation(s) During the Past Five | Amy Gutmann |
| Years: Chairman of the Board of The Vanguard Group, | Born 1949. Trustee Since June 2006. Principal |
| Inc., and of each of the investment companies served | Occupation(s) During the Past Five Years: President |
| by The Vanguard Group, since January 2010; Director | of the University of Pennsylvania; Christopher H. |
| of The Vanguard Group since 2008; Chief Executive | Browne Distinguished Professor of Political Science |
| Officer and President of The Vanguard Group and of | in the School of Arts and Sciences with secondary |
| each of the investment companies served by The | appointments at the Annenberg School for |
| Vanguard Group since 2008; Director of Vanguard | Communication and the Graduate School of Education |
| Marketing Corporation; Managing Director of The | of the University of Pennsylvania; Member of the |
| Vanguard Group (1995–2008). | National Commission on the Humanities and Social |
| | Sciences; Trustee of Carnegie Corporation of New |
| | York and of the National Constitution Center; Chair |
| IndependentTrustees | of the U.S. Presidential Commission for the Study |
| | of Bioethical Issues. |
| Emerson U. Fullwood | |
| Born 1948. Trustee Since January 2008. Principal | JoAnn Heffernan Heisen |
| Occupation(s) During the Past Five Years: Executive | Born 1950. Trustee Since July 1998. Principal |
| Chief Staff and Marketing Officer for North America | Occupation(s) During the Past Five Years: Corporate |
| and Corporate Vice President (retired 2008) of Xerox | Vice President and Chief Global Diversity Officer |
| Corporation (document management products and | (retired 2008) and Member of the Executive |
| services); Executive in Residence and 2010 | Committee (1997–2008) of Johnson & Johnson |
| Distinguished Minett Professor at the Rochester | (pharmaceuticals/medical devices/consumer |
| Institute of Technology; Director of SPX Corporation | products); Director of Skytop Lodge Corporation |
| (multi-industry manufacturing), the United Way of | (hotels), the University Medical Center at Princeton, |
| Rochester, Amerigroup Corporation (managed health | the Robert Wood Johnson Foundation, and the Center |
| care), the University of Rochester Medical Center, | for Talent Innovation; Member of the Advisory Board |
| Monroe Community College Foundation, and North | of the Maxwell School of Citizenship and Public Affairs |
| Carolina A&T University. | at Syracuse University. |
| |
| Rajiv L. Gupta | F. Joseph Loughrey |
| Born 1945. Trustee Since December 2001.2 | Born 1949. Trustee Since October 2009. Principal |
| Principal Occupation(s) During the Past Five Years: | Occupation(s) During the Past Five Years: President |
| Chairman and Chief Executive Officer (retired 2009) | and Chief Operating Officer (retired 2009) of Cummins |
| and President (2006–2008) of Rohm and Haas Co. | Inc. (industrial machinery); Chairman of the Board of |
| (chemicals); Director of Tyco International, Ltd. | Hillenbrand, Inc. (specialized consumer services) and |
| (diversified manufacturing and services), Hewlett- | of Oxfam America; Director of SKF AB (industrial |
| Packard Co. (electronic computer manufacturing), | |
| | |
| machinery), Hyster-Yale Materials Handling, Inc. | Executive Officers | |
| (forklift trucks), and the Lumina Foundation for | | |
| Education; Member of the Advisory Council for the | Glenn Booraem | |
| College of Arts and Letters and of the Advisory Board | Born 1967. Controller Since July 2010. Principal |
| to the Kellogg Institute for International Studies, both | Occupation(s) During the Past Five Years: Principal |
| at the University of Notre Dame. | of The Vanguard Group, Inc.; Controller of each of |
| | the investment companies served by The Vanguard |
| Mark Loughridge | Group; Assistant Controller of each of the investment |
| Born 1953. Trustee Since March 2012. Principal | companies served by The Vanguard Group (2001–2010). |
| Occupation(s) During the Past Five Years: Senior Vice | | |
| President and Chief Financial Officer at IBM (information | Thomas J. Higgins | |
| technology services); Fiduciary Member of IBM’s | Born 1957. Chief Financial Officer Since September |
| Retirement Plan Committee. | 2008. Principal Occupation(s) During the Past Five |
| | Years: Principal of The Vanguard Group, Inc.; Chief |
| Scott C. Malpass | Financial Officer of each of the investment companies |
| Born 1962. Trustee Since March 2012. Principal | served by The Vanguard Group; Treasurer of each of |
| Occupation(s) During the Past Five Years: Chief | the investment companies served by The Vanguard |
| Investment Officer and Vice President at the University | Group (1998–2008). | |
| of Notre Dame; Assistant Professor of Finance at the | | |
| Mendoza College of Business at Notre Dame; Member | Kathryn J. Hyatt | |
| of the Notre Dame 403(b) Investment Committee; | Born 1955. Treasurer Since November 2008. Principal |
| Director of TIFF Advisory Services, Inc. (investment | Occupation(s) During the Past Five Years: Principal of |
| advisor); Member of the Investment Advisory | The Vanguard Group, Inc.; Treasurer of each of the |
| Committees of the Financial Industry Regulatory | investment companies served by The Vanguard |
| Authority (FINRA) and of Major League Baseball. | Group; Assistant Treasurer of each of the investment |
| | companies served by The Vanguard Group (1988–2008). |
| André F. Perold | | |
| Born 1952. Trustee Since December 2004. Principal | Heidi Stam | |
| Occupation(s) During the Past Five Years: George | Born 1956. Secretary Since July 2005. Principal |
| Gund Professor of Finance and Banking at the Harvard | Occupation(s) During the Past Five Years: Managing |
| Business School (retired 2011); Chief Investment | Director of The Vanguard Group, Inc.; General Counsel |
| Officer and Managing Partner of HighVista Strategies | of The Vanguard Group; Secretary of The Vanguard |
| LLC (private investment firm); Director of Rand | Group and of each of the investment companies |
| Merchant Bank; Overseer of the Museum of Fine | served by The Vanguard Group; Director and Senior |
| Arts Boston. | Vice President of Vanguard Marketing Corporation. |
| |
| | |
| Alfred M. Rankin, Jr. | Vanguard Senior ManagementTeam |
| Born 1941. Trustee Since January 1993. Principal | | |
| Occupation(s) During the Past Five Years: Chairman, | Mortimer J. Buckley | Chris D. McIsaac |
| President, and Chief Executive Officer of NACCO | Kathleen C. Gubanich | Michael S. Miller |
| Industries, Inc. (housewares/lignite) and of Hyster-Yale | Paul A. Heller | James M. Norris |
| Materials Handling, Inc. (forklift trucks); Director of | Martha G. King | Glenn W. Reed |
| the National Association of Manufacturers; Chairman | John T. Marcante | |
| of the Board of University Hospitals of Cleveland; | | |
| Advisory Chairman of the Board of The Cleveland | | |
| | Chairman Emeritus and Senior Advisor |
| | |
| | John J. Brennan | |
| Peter F. Volanakis | Chairman, 1996–2009 | |
| Born 1955. Trustee Since July 2009. Principal | Chief Executive Officer and President, 1996–2008 |
| Occupation(s) During the Past Five Years: President | | |
| and Chief Operating Officer (retired 2010) of Corning | | |
| Incorporated (communications equipment); Director | Founder | |
| of SPX Corporation (multi-industry manufacturing); | John C. Bogle | |
| Overseer of the Amos Tuck School of Business | Chairman and Chief Executive Officer, 1974–1996 |
| Administration at Dartmouth College; Advisor to the | | |
| Norris Cotton Cancer Center. | |
1 Mr. McNabb is considered an “interested person,” as defined in the Investment Company Act of 1940, because he is an officer of the
Vanguard funds.
2 December 2002 for Vanguard Equity Income Fund, Vanguard Growth Equity Fund, the Vanguard Municipal Bond Funds, and the Vanguard
State Tax-Exempt Funds.
|  |
| | P.O. Box 2600 |
| | Valley Forge, PA 19482-2600 |
| |
| |
| |
| Connect with Vanguard® > vanguard.com | |
| |
| |
| |
| Fund Information > 800-662-7447 | |
| Direct Investor Account Services > 800-662-2739 | |
| Institutional Investor Services > 800-523-1036 | |
| Text Telephone for People | |
| With Hearing Impairment > 800-749-7273 | |
| |
| This material may be used in conjunction | |
| with the offering of shares of any Vanguard | |
| fund only if preceded or accompanied by | |
| the fund’s current prospectus. | |
| |
| All comparative mutual fund data are from Lipper, a | |
| Thomson Reuters Company, or Morningstar, Inc., unless | |
| otherwise noted. | |
| |
| You can obtain a free copy of Vanguard’s proxy voting | |
| guidelines by visiting vanguard.com/proxyreporting or by | |
| calling Vanguard at 800-662-2739. The guidelines are | |
| also available from the SEC’s website, sec.gov. In | |
| addition, you may obtain a free report on how your fund | |
| voted the proxies for securities it owned during the 12 | |
| months ended June 30. To get the report, visit either | |
| vanguard.com/proxyreporting or sec.gov. | |
| |
| You can review and copy information about your fund at | |
| the SEC’s Public Reference Room in Washington, D.C. To | |
| find out more about this public service, call the SEC at | |
| 202-551-8090. Information about your fund is also | |
| available on the SEC’s website, and you can receive | |
| copies of this information, for a fee, by sending a | |
| request in either of two ways: via e-mail addressed to | |
| publicinfo@sec.gov or via regular mail addressed to the | |
| Public Reference Section, Securities and Exchange | |
| Commission, Washington, DC 20549-1520. | |
| |
| | © 2013 The Vanguard Group, Inc. |
| | All rights reserved. |
| | Vanguard Marketing Corporation, Distributor. |
| |
| | Q11200 122013 |
Item 2: Code of Ethics. The Registrant has adopted a code of ethics that applies to the Registrant’s principal executive officer, principal financial officer, principal accounting officer or controller or persons performing similar functions. The Code of Ethics was amended during the reporting period covered by this report to make certain technical, non-material changes.
Item 3: Audit Committee Financial Expert. The following members of the Audit Committee have been determined by the Registrant’s Board of Trustees to be Audit Committee Financial Experts serving on its Audit Committee, and to be independent: Rajiv L. Gupta, Amy Gutmann, JoAnn Heffernan Heisen, F. Joseph Loughrey, Mark Loughridge, Scott C. Malpass, André F. Perold, and Alfred M. Rankin, Jr.
Item 4: Principal Accountant Fees and Services.
(a) Audit Fees.
Audit Fees of the Registrant
Fiscal Year Ended October 31, 2013: $148,000
Fiscal Year Ended October 31, 2012: $120,000
Aggregate Audit Fees of Registered Investment Companies in the Vanguard Group.
Fiscal Year Ended October 31, 2013: $5,714,113
Fiscal Year Ended October 31, 2012: $4,809,780
Includes fees billed in connection with audits of the Registrant and other registered investment companies in the Vanguard complex. Also includes fees billed in connection with audits of The Vanguard Group, Inc. and Vanguard Marketing Corporation for Fiscal Year Ended October 31, 2013.
(b) Audit-Related Fees.
Fiscal Year Ended October 31, 2013: $1,552,950
Fiscal Year Ended October 31, 2012: $1,812,565
Includes fees billed in connection with assurance and related services provided to the Registrant, other registered investment companies in the Vanguard complex, The Vanguard Group, Inc., and Vanguard Marketing Corporation.
(c) Tax Fees.
Fiscal Year Ended October 31, 2013: $110,000
Fiscal Year Ended October 31, 2012: $490,518
Includes fees billed in connection with tax compliance, planning, and advice services provided to the Registrant, other registered investment companies in the Vanguard complex, The Vanguard Group, Inc., and Vanguard Marketing Corporation. Also includes fees billed in connection with certain tax services related to audits of the Registrant and other registered investment companies in the Vanguard complex for Fiscal Year Ended October 31, 2012.
(d) All Other Fees.
Fiscal Year Ended October 31, 2013: $132,000
Fiscal Year Ended October 31, 2012: $16,000
Includes fees billed in connection with tax compliance, planning, and advice services provided to the Registrant, other registered investment companies in the Vanguard complex, The Vanguard Group, Inc., and Vanguard Marketing Corporation.
(e) (1) Pre-Approval Policies. The policy of the Registrant’s Audit Committee is to consider and, if appropriate, approve before the principal accountant is engaged for such services, all specific audit and non-audit services provided to: the Registrant, other registered investment companies in the Vanguard complex, The Vanguard Group, Inc., and entities controlled by The Vanguard Group, Inc. that provide ongoing services to the Registrant. In making a determination, the Audit Committee considers whether the services are consistent with maintaining the principal accountant’s independence.
In the event of a contingency situation in which the principal accountant is needed to provide services in between scheduled Audit Committee meetings, the Chairman of the Audit Committee would be called on to consider and, if appropriate, pre-approve audit or permitted non-audit services in an amount sufficient to complete services through the next Audit Committee meeting, and to determine if such services would be consistent with maintaining the accountant’s independence. At the next scheduled Audit Committee meeting, services and fees would be presented to the Audit Committee for formal consideration, and, if appropriate, approval by the entire Audit Committee. The Audit Committee would again consider whether such services and fees are consistent with maintaining the principal accountant’s independence.
The Registrant’s Audit Committee is informed at least annually of all audit and non-audit services provided by the principal accountant to the Vanguard complex, whether such services are provided to: the Registrant, other registered investment companies in the Vanguard complex, The Vanguard Group, Inc., or other entities controlled by The Vanguard Group, Inc. that provide ongoing services to the Registrant.
(2) No percentage of the principal accountant’s fees or services were approved pursuant to the waiver provision of paragraph (c)(7)(i)(C) of Rule 2-01 of Regulation S-X.
(f) For the most recent fiscal year, over 50% of the hours worked under the principal accountant’s engagement were not performed by persons other than full-time, permanent employees of the principal accountant.
(g) Aggregate Non-Audit Fees.
Fiscal Year Ended October 31, 2013: $242,000
Fiscal Year Ended October 31, 2012: $506,518
Includes fees billed for non-audit services provided to the Registrant, other registered investment companies in the Vanguard complex, The Vanguard Group, Inc., and Vanguard Marketing Corporation.
(h) For the most recent fiscal year, the Audit Committee has determined that the provision of all non-audit services was consistent with maintaining the principal accountant’s independence.
Item 5: Audit Committee of Listed Registrants.
Not Applicable.
Item 6: Investments.
Not Applicable.
Item 7: Disclosure of Proxy Voting Policies and Procedures for Closed-End Management
Investment Companies.
Not Applicable.
Item 8: Portfolio Managers of Closed-End Management Investment Companies.
Not Applicable.
Item 9: Purchase of Equity Securities by Closed-End Management Investment Company and
Affiliated Purchasers.
Not Applicable.
Item 10: Submission of Matters to a Vote of Security Holders.
Not Applicable.
Item 11: Controls and Procedures.
(a) Disclosure Controls and Procedures. The Principal Executive and Financial Officers concluded that the Registrant’s Disclosure Controls and Procedures are effective based on their evaluation of the Disclosure Controls and Procedures as of a date within 90 days of the filing date of this report.
(b) Internal Control Over Financial Reporting. There were no significant changes in Registrant’s Internal Control Over Financial Reporting or in other factors that could significantly affect this control subsequent to the date of the evaluation, including any corrective actions with regard to significant deficiencies and material weaknesses.
Item 12: Exhibits.
(a) Code of Ethics.
(b) Certifications.
Pursuant to the requirements of the Securities Exchange Act of 1934 and the Investment Company Act of 1940, the registrant has duly caused this report to be signed on its behalf by the undersigned, thereunto duly authorized.
| |
| | VANGUARD WHITEHALL FUNDS |
| |
| |
| BY: | /s/ F. WILLIAM MCNABB III* |
| | F. WILLIAM MCNABB III |
| | CHIEF EXECUTIVE OFFICER |
| |
| Date: December 19, 2013 |
Pursuant to the requirements of the Securities Exchange Act of 1934 and the Investment Company Act of 1940, this report has been signed below by the following persons on behalf of the registrant and in the capacities and on the dates indicated.
| |
| | VANGUARD WHITEHALL FUNDS |
| |
| BY: | /s/ F. WILLIAM MCNABB III* |
| | F. WILLIAM MCNABB III |
| | CHIEF EXECUTIVE OFFICER |
| Date: December 19, 2013 |
| | VANGUARD WHITEHALL FUNDS |
| |
| BY: | /s/ THOMAS J. HIGGINS* |
| THOMAS J. HIGGINS |
| | CHIEF FINANCIAL OFFICER |
| Date: December 19, 2013 |
* By: /s/ Heidi Stam
Heidi Stam, pursuant to a Power of Attorney filed on March 27, 2012 see file Number 2-11444, Incorporated by Reference.