UNITED STATES
SECURITIES AND EXCHANGE COMMISSION
Washington, D.C. 20549
FORM N-CSR
CERTIFIED SHAREHOLDER REPORT
OF
REGISTERED MANAGEMENT INVESTMENT COMPANIES
Investment Company Act file number: 811-07443
Name of Registrant: Vanguard Whitehall Funds
Address of Registrant:
P.O. Box 2600
Valley Forge, PA 19482
Name and address of agent for service:
Heidi Stam, Esquire
P.O. Box 876
Valley Forge, PA 19482
Registrant’s telephone number, including area code: (610) 669-1000
Date of fiscal year end: October 31
Date of reporting period: November 1, 2013 – October 31, 2014
Item 1: Reports to Shareholders
Annual Report | October 31, 2014
Vanguard International Explorer™ Fund
The mission continues
On May 1, 1975, Vanguard began operations, a fledgling company based on the simple but revolutionary idea that a mutual fund company should be managed solely in the interest of its investors.
Four decades later, that revolutionary spirit continues to animate the enterprise. Vanguard remains on a mission to give investors the best chance of investment success.
As we mark our 40th anniversary, we thank you for entrusting your assets to Vanguard and giving us the opportunity to help you reach your financial goals in the decades to come.
| |
| Contents | |
| Your Fund’s Total Returns. | 1 |
| Chairman’s Letter. | 2 |
| Advisors’ Report. | 8 |
| Fund Profile. | 12 |
| Performance Summary. | 14 |
| Financial Statements. | 16 |
| Your Fund’s After-Tax Returns. | 33 |
| About Your Fund’s Expenses. | 34 |
| Trustees Approve Advisory Arrangements. | 36 |
| Glossary. | 38 |
Please note: The opinions expressed in this report are just that—informed opinions. They should not be considered promises or advice.
Also, please keep in mind that the information and opinions cover the period through the date on the front of this report. Of course, the risks of investing in your fund are spelled out in the prospectus.
See the Glossary for definitions of investment terms used in this report.
About the cover: Since our founding, Vanguard has drawn inspiration from the enterprise and valor demonstrated by British naval hero Horatio Nelson and his command at the Battle of the Nile in 1798. The photograph displays a replica of a merchant ship from the same era as Nelson’s flagship, the HMS Vanguard.
Your Fund’s Total Returns
| |
| Fiscal Year Ended October 31, 2014 | |
| |
| | Total |
| | Returns |
| Vanguard International Explorer Fund | 2.66% |
| S&P EPAC SmallCap Index | -0.65 |
| International Small-Cap Funds Average | -0.86 |
| International Small-Cap Funds Average: Derived from data provided by Lipper, a Thomson Reuters Company. |
| | | | |
| Your Fund’s Performance at a Glance | | | | |
| October 31, 2013, Through October 31, 2014 | | | | |
| |
| | | | Distributions Per Share |
| | Starting | Ending | | |
| | Share | Share | Income | Capital |
| | Price | Price | Dividends | Gains |
| Vanguard International Explorer Fund | $18.50 | $18.26 | $0.420 | $0.288 |
1

Chairman’s Letter
Dear Shareholder,
International stock markets significantly trailed the broad U.S. stock market for the fiscal year ended October 31, 2014. Mounting concerns about the global economy, especially the threat of deflation in Europe and a slowdown in China and other emerging markets, contributed to the weakness.
The sluggish global economy took a toll on small-capitalization international stocks, which tend to be more sensitive to economic growth prospects. For the fiscal period, small-capitalization international stocks trailed their larger counterparts.
Vanguard International Explorer Fund, which focuses on promising smaller companies, returned 2.66% for the fiscal year. Although modest, the fund’s result exceeded that of its benchmark, the S&P EPAC SmallCap Index, and the average return of its peers.
The advisors’ holdings in emerging markets and the Pacific region accounted for the fund’s outperformance; the fund’s European stocks merely treaded water.
If you hold this fund in a taxable account, you may wish to review the discussion of after-tax returns later in this report.
Their smooth ride turned jagged, but U.S. stocks ended higher
The global stock market’s occasional zigs and zags over the 12 months included a roller-coaster ride in October that left
international markets several steps behind the broad U.S. market for the fiscal year. Emerging markets advanced modestly, and the developed European and Pacific markets finished in negative territory.
In contrast, the broad U.S. stock market returned about 16%. Impressive corporate earnings and various global stimulus measures generally supported stocks against a bleaker backdrop that included tensions in the Middle East and Ukraine. After falling in the first two weeks of October, then rebounding, several major U.S. indexes finished at record highs. Reflecting confidence in the U.S. economy, the Federal Reserve announced in late October that it was ending its stimulative bond-buying program as anticipated.
Bonds posted mixed results as already low yields declined
International bond markets (as measured by the Barclays Global Aggregate Index ex USD) slid in September and October en route to a –2.53% return for the 12 months, a modestly steeper decline than in the 12 months ended October 2013.
More than reversing its year-ago loss, the broad U.S. taxable bond market returned 4.14%. Bond prices, which backtracked at times over the summer, climbed in October as investors sought sanctuary from stock market volatility.
Overall, bond returns in the United States were strong despite many analysts’ expectations that already low yields
| | | |
| Market Barometer | | | |
| |
| | | Average Annual Total Returns |
| | | Periods Ended October 31, 2014 |
| | One | Three | Five |
| | Year | Years | Years |
| Stocks | | | |
| Russell 1000 Index (Large-caps) | 16.78% | 19.90% | 16.98% |
| Russell 2000 Index (Small-caps) | 8.06 | 18.18 | 17.39 |
| Russell 3000 Index (Broad U.S. market) | 16.07 | 19.77 | 17.01 |
| FTSE All-World ex US Index (International) | 0.45 | 8.07 | 6.38 |
| |
| Bonds | | | |
| Barclays U.S. Aggregate Bond Index (Broad taxable market) | 4.14% | 2.73% | 4.22% |
| Barclays Municipal Bond Index (Broad tax-exempt market) | 7.82 | 4.93 | 5.26 |
| Citigroup Three-Month U.S. Treasury Bill Index | 0.04 | 0.04 | 0.06 |
| |
| CPI | | | |
| Consumer Price Index | 1.66% | 1.60% | 1.89% |
3
wouldn’t decline further. Even as the Fed began steadily reducing its bond purchases in January, prices rose and the yield of the 10-year U.S. Treasury note ended October at 2.31%, down from 2.54% a year earlier. (Bond prices and yields move in opposite directions.)
Municipal bonds returned 7.82%, with tax-exempt issues in high demand even at a time of reduced supply.
The Fed’s target for short-term interest rates remained at 0%–0.25%, restraining returns for money market funds and savings accounts.
Emerging markets gave the fund a distinct boost in the second half
Investors seeking an example of the benefits of global diversification need look no further than the fiscal year that just ended. In the first half, the broad U.S. and developed European stock markets moved higher, while emerging markets and developed Pacific markets retreated. In the second half, the tables turned somewhat: U.S. stocks tacked on more gains but developed Europe reversed course, and emerging markets and developed Pacific markets rebounded.
Amid these developments, the International Explorer Fund’s two advisors held small-cap stocks that outperformed. The fund’s allocation to India, which is not represented in the benchmark, was a
| | |
| Expense Ratios | | |
| Your Fund Compared With Its Peer Group | | |
| | | Peer Group |
| | Fund | Average |
| International Explorer Fund | 0.36% | 1.51% |
| The fund expense ratio shown is from the prospectus dated February 25, 2014, and represents estimated costs for the current fiscal year. For the fiscal year ended October 31, 2014, the fund’s expense ratio was 0.40%. This increase from the estimated expense ratio reflects a performance-based investment advisory fee adjustment. When the performance adjustment is positive, the fund’s expenses increase; when it is negative, expenses decrease. The peer-group expense ratio is derived from data provided by Lipper, a Thomson Reuters Company, and captures information through year-end 2013. |
|
|
|
|
|
| |
| Peer group: International Small-Cap Funds. |
4
major driver of outperformance, as Indian stocks rose sharply after the election of a pro-business prime minister. This performance helped the fund’s emerging-market portfolio outdistance its counterpart in the index by about 9 percentage points.
In developed Pacific markets, the advisors’ selections also outperformed; Japan was the region’s biggest contributor to outperformance.
Europe presented a different picture. As recession and deflation worries reemerged over the continent, small-cap stocks fell back from earlier gains to finish the fiscal year at about where they’d started it. The advisors’ selections outperformed their benchmark counterparts in France and Norway but trailed them in Switzerland and Denmark. One particularly bright spot was French industrials, which rose 33 percentage points more than industrials in the index.
Looking at sector performance across the more than 30 countries in which the fund invests, the industrial sector—one of the largest in both the fund and the benchmark index—was the biggest winner for the fund. The fund’s holdings beat their benchmark counterparts by about 11 percentage points. The second-largest sector, financials, proved to be the leading detractor from relative results. Energy logged the largest loss (–31%) as falling oil prices hurt profits, but the sector’s small size in the fund—about 3% of assets—limited the negative impact.
| |
| Total Returns | |
| Ten Years Ended October 31, 2014 | |
| | Average |
| | Annual Return |
| International Explorer Fund | 8.40% |
| S&P EPAC SmallCap Index | 7.94 |
| International Small-Cap Funds Average | 8.16 |
| International Small-Cap Funds Average: Derived from data provided by Lipper, a Thomson Reuters Company. | |
The figures shown represent past performance, which is not a guarantee of future results. (Current performance may be lower or higher than the performance data cited. For performance data current to the most recent month-end, visit our website at vanguard.com/performance.) Note, too, that both investment returns and principal value can fluctuate widely, so an investor’s shares, when sold, could be worth more or less than their original cost.
5
The U.S. dollar strengthened against most major currencies during the fiscal year, including the euro and the Japanese yen. The stronger dollar reduced returns for U.S.-based investors. (To learn more about currency effects and international diversification, see the box below.)
For more information on the fund’s investment strategies and positioning, please see the Advisors’ Report that follows this letter.
| |
| Currency fluctuation is one reason U.S. and international stocks diverge |
| |
| Diversification is a proven way to reduce volatility and manage risk. That’s why it can make |
| sense for investors to allocate a portion of their stock portfolios to international equities |
| (20% of the equity allocation can be a good starting point). International stocks, which make |
| up about half of the world’s stock market capitalization, perform somewhat differently than |
| stocks in the U.S. market. One of the many reasons for this is currency fluctuation. Currency |
| movements historically have not been correlated to stock price movements, meaning they |
| tend not to move together. |
| |
| International stocks have underperformed U.S. stocks recently for U.S.-based investors, |
| in part because many foreign currencies have weakened against the U.S. dollar. But that |
| divergence actually highlights the diversification benefit of owning both U.S. and international |
| stocks. As you can see from the accompanying chart, at other times, international stocks have |
| outshone their U.S. counterparts. (For more insight, see Global Equities: Balancing Home Bias |
| and Diversification, available at vanguard.com/research.) |
| |
| Trailing 12-month return differential between U.S. and non-U.S. stocks |
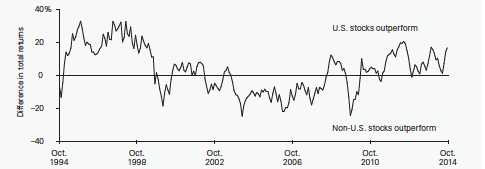
| Notes: U.S. equities are represented by the MSCI USA Index; international equities are represented by the MSCI All Country World Index ex USA. |
| Data are from October 31, 1994, through October 31, 2014. |
| Sources: Vanguard, Thomson Reuters Datastream, and MSCI. |
6
Over the past decade, the fund has exceeded its index, peer funds
For the decade ended October 31, 2014, the International Explorer Fund posted an average annual return of 8.40%, a bit higher than the average return of its benchmark index and peer group.
International Explorer’s long-term success is a tribute to the skill and experience of its advisors. Each brings to the table a slightly different approach, providing a diversification benefit to investors. Of course, the fund’s lower expenses also help.
As we reflect on the past decade, and indeed the fiscal year, it’s good to bear in mind that global stock markets don’t always move in lockstep. A portfolio that includes both U.S. and international stocks and other asset classes can provide some cushion for investors to weather the inevitable variations in global market performance.
When market volatility heats up, the best response is to keep cool
As I noted earlier, after several years of strength, stocks hit a rough patch toward the close of the fiscal year. For the first half of October, global stock markets (as measured by the FTSE Global All Cap Index) returned –5.56%. Even though stocks rebounded in the second half of the month, many investors undoubtedly were left feeling unsettled.
What’s my best advice to anxious shareholders? Remain calm and remember that volatility is a normal part of stock market investing. The value of keeping a cool head is highlighted in a Vanguard research paper that looked at how investors behaved during the financial crisis, when global stocks declined about 58% and U.S. stocks about 55%.
The 2010 paper, Resilience in Volatile Markets: 401(k) Participant Behavior, September 2007–December 2009, examined the behavior of participants in Vanguard-administered retirement plans. During the period studied, about three-quarters of participants made no changes to their accounts, and only 3% gave up on stocks completely.
As stocks recovered, this discipline yielded big benefits. From the end of 2008 to the end of 2013, the average Vanguard 401(k) portfolio nearly doubled in value, largely because of the surge in stock prices.
I’m pleased that, over time, our clients have demonstrated an impressive ability to remain focused on their long-term goals. They stayed the course through the 1987 correction, the dot-com boom of the 1990s, and the more recent financial crisis, and they continue to do so today.
As always, thank you for investing with Vanguard.
Sincerely,

F. William McNabb III
Chairman and Chief Executive Officer
November 18, 2014
7
Advisors’ Report
For the fiscal year ended October 31, 2014, Vanguard International Explorer Fund returned 2.66%. Your fund is managed by two independent advisors, a strategy that enhances its diversification by providing exposure to distinct yet complementary investment approaches. It is not uncommon for different advisors to have different views about individual securities or the broader investment environment.
The advisors, the amount and percentage of fund assets each manages, and brief descriptions of their investment strategies are presented in the table below. The advisors have also prepared a discussion of the investment environment that existed during the year and of how their portfolio positioning reflects this assessment. These comments were prepared on November 20, 2014.
Schroder Investment Management North America Inc.
Portfolio Manager:
Matthew F. Dobbs,
Head of Global Small Companies
International small-company equities ended the period flat, with the S&P EPAC SmallCap Index down 0.65%. This result was about the same as that of the S&P EPAC Large/MidCap Index, which represents larger-capitalization equities.
| | | | |
| Vanguard International Explorer Fund Investment Advisors |
| |
| | Fund Assets Managed | | |
| Investment Advisor | % | $ Million | | Investment Strategy |
| Schroder Investment | 80 | 2,071 | | The advisor employs a fundamental investment |
| Management North America Inc. | | | | approach that considers macroeconomic factors while |
| | | | | focusing primarily on company-specific factors, |
| | | | | including a company’s potential for long-term growth, |
| | | | | financial condition, quality of management, and |
| | | | | sensitivity to cyclical factors. The advisor also |
| | | | | considers the relative value of a company’s securities |
| | | | | compared with those of other companies and the |
| | | | | market as a whole. |
| Wellington Management | 18 | 464 | | The advisor employs a traditional, bottom-up approach |
| Company, LLP | | | | that is opportunistic in nature, relying on global and |
| | | | | regional research resources to identify both |
| | | | | growth-oriented and neglected or misunderstood |
| | | | | companies. |
| Cash Investments | 2 | 63 | | These short-term reserves are invested by Vanguard in |
| | | | | equity index products to simulate investment in stocks. |
| | | | | Each advisor also may maintain a modest cash |
| | | | | position. |
8
The upward progress made by international small-cap equities in the first half was canceled out in the final three months as the U.S. dollar strengthened. This development coincided with underlying weakness in global equities as investors fretted about dwindling growth (particularly in Europe and China), continued “tapering” of bond purchases by the Federal Reserve, the implications of weak commodity prices for vulnerable emerging markets, and broad deflationary concerns.
There was remarkably little variation between regional returns. Among sectors, defensive areas such as utilities, telecommunications, and health care outperformed. Energy was a notable area of weakness, mirroring the downward trend in oil prices.
Emerging-market holdings provided the biggest boost to relative performance. The best returns came from India, including Gujarat Pipavav Port, Cipla (a generic drug developer), Shriram Transport Finance, Multi Commodity Exchange, and Apollo Hospitals Enterprise. However, there were some strong contributors in Southeast Asian markets, including L.P.N. Development Public (a Thai residential developer), Hemaraj Land & Development Public (industrial real estate in Thailand), and PT Matahari Department Store in Indonesia.
Our holdings in Japan also helped, with gains coming from materials (Kureha, Nihon Parkerizing), industrials (Asahi Diamond Industrial, Trusco Nakayama), consumer discretionary (Koito Manufacturing and Eagle Industry, both in auto parts), and consumer staples (Tsuruha Holdings). Our holdings in other developed Asian markets underperformed, with three stocks detracting the most: Australia-listed Iluka Resources (on weak zircon and titanium oxide pricing), Chorus (amid adverse regulatory developments in New Zealand), and South Korea-listed Sung Kwang Bend (on weak volumes and pricing).
Stock selection in the United Kingdom was also a positive contributor. The main successes have been among industrials (DCC, Ashtead Group) and information technology (CSR after a takeover bid), with lesser contributions from consumer discretionary (Sports Direct International, Persimmon, SSP Group) and energy (Lamprell).
We made a number of adjustments to our geographic positioning. We added to continental Europe and to emerging markets, where India remains our biggest single commitment. We funded this shift by selling holdings in the United Kingdom and the Pacific region excluding Japan (primarily in New Zealand and South Korea).
In line with fading investor confidence, small-caps corrected versus their larger peers in the second half of the period, particularly in Europe; because of this correction, valuations now look more attractive. However, we would accept that, having expanded earnings much faster than larger-caps over the last two years, small-caps would be challenged by a more subdued global growth outlook, should it transpire. We take some comfort from the fact that our portfolio, biased toward
9
companies with higher returns, stronger balance sheets, and more visible growth, still exhibits reasonably attractive valuation metrics.
Wellington Management Company, llp
Portfolio Manager:
Simon H. Thomas,
Senior Vice President and
Equity Portfolio Manager
Despite continuing geopolitical tensions in Ukraine and the Middle East, Portuguese banking woes, European economic malaise, and the prospect of an accelerated hike in interest rates by the Federal Reserve, global equities continued their climb, ending the period on a positive note. Investors were reassured as the European Central Bank increased its accommodative monetary policy to spur growth, the People’s Bank of China eased monetary conditions to reduce financial fragilities and lower the risk of a hard landing, and the U.S. corporate earnings season painted a generally encouraging picture. Continued evidence of a Eurozone recovery, solid U.S. corporate earnings, and robust merger and acquisition activity also aided bullish sentiment.
Our top relative contributors included Nippon Shinyaku, Groupe FNAC, and Sumco. Shares of Japan-based Nippon Shinyaku soared as Selexipag, a key drug developed with Switzerland-based pharmaceutical company Actelion, passed its Phase III efficacy test—an important milestone. While we have long believed, based on our work on Actelion in conjunction with our Boston-based health care team, that Selexipag would be a big success, the data released were even stronger than we had expected. Nippon Shinyaku now holds one of the strongest portfolios for treating pulmonary arterial hypertension. Although we trimmed our position to take profits, we continue to hold the stock because we believe that its full value has yet to be realized in the share price.
Groupe FNAC, a leading French retailer of consumer electronics, CDs, DVDs, books, and video games, also contributed to performance as shares rose after strong earnings results for the fourth quarter of 2013. We eliminated the position as it approached our price target.
Japan-based Sumco, which we added to our portfolio during the third quarter of 2014, also outperformed. The company manufactures wafers that are used to make semiconductor chips. Shares of the stock rallied as pricing and sales volumes improved by more than expected. Given the growing demand for products that use semiconductors, particularly in automobiles, we see further upside for the stock and we continue to hold it.
Our underperformers were mainly in the consumer discretionary, financial, and materials sectors. At a regional level, our selections within Japan contributed, but those strong results were offset by the poor performance of our selections within Europe and emerging markets. The largest relative detractors included Mothercare, Vocation, and Iida Group Holdings.
10
Shares of Mothercare, a U.K.-based retailer of baby clothing and educational toys, declined. First-quarter earnings were worse than expected; gross margin pressure in its U.K. business, along with a reduction in traffic caused by unseasonable weather in key markets Russia and the Middle East, pulled down results. We became concerned about management’s communication with shareholders and eliminated our position.
In late October, Vocation, an Australia-based private operator in the vocational training industry, announced that it had lost $20 million in Victorian government funding; shares plunged on the news. We added to our position on this weakness after meeting with company management, which is ensuring that existing contracts are stable. Vocation was also able to sign a new contract with the Victoria Department of Education. We believe that the current price does not reflect the company’s strong fundamentals.
Concerns about slow growth in the Japanese economy have weighed on shares of Iida, a newly merged group of six homebuilders that will become one of Japan’s largest homebuilding companies. We believe substantial synergies lie on both the cost and revenue side as duplicate functions are eliminated, sales forces are integrated, and the extreme competition often seen when bidding for land should ease as key competitors become partners. Because expectations remain depressed and valuations are attractive at current levels, we continue to hold the stock.
We ended the fiscal year most overweighted in industrials, health care, and energy, and most underweighted in consumer discretionary, consumer staples, and utilities. Among regions, we were most overweighted in Japan. We were most underweighted in Europe, though we continue to look for high-quality companies that have been neglected by the market and thus offer attractive investment opportunities.
Overall, we have observed that the market has been rather narrow and that high-quality companies with strong returns on invested capital have underperformed. When markets have gone up for some time, lower-quality companies can gain more attention.
Regardless of the market environment, our investment process continues to prioritize intensive, fundamental bottom-up research to select high-quality stocks with strong balance sheets and good business models that are attractively valued relative to their global industry. Further, we buy companies whose results we think will exceed consensus expectations over the next two to three years. We believe that a disciplined approach to valuation and a quality orientation leads to better downside protection and overall performance over time.
11
International Explorer Fund
Fund Profile
As of October 31, 2014
| | | | |
| Portfolio Characteristics | | |
| | | | MSCI |
| | | S&P | AC |
| | | EPAC | World |
| | | SmallCap | Index ex |
| | Fund | Index | USA |
| Number of Stocks | 325 | 3,647 | 1,819 |
| Median Market Cap | $1.9B | $1.8B | $33.5B |
| Price/Earnings Ratio | 18.4x | 19.8x | 16.9x |
| Price/Book Ratio | 1.8x | 1.5x | 1.7x |
| Return on Equity | 11.2% | 10.3% | 14.9% |
| Earnings Growth | | | |
| Rate | 16.7% | 11.8% | 11.7% |
| Dividend Yield | 2.0% | 2.3% | 2.9% |
| Turnover Rate | 39% | — | — |
| Ticker Symbol | VINEX | — | — |
| Expense Ratio1 | 0.36% | — | — |
| Short-Term Reserves | 2.0% | — | — |
| | | | |
| Sector Diversification (% of equity exposure) |
| | | | MSCI |
| | | S&P | AC |
| | | EPAC | World |
| | | SmallCap | Index |
| | Fund | Index | ex USA |
| Consumer | | | |
| Discretionary | 17.4% | 18.2% | 10.7% |
| Consumer Staples | 5.2 | 6.1 | 9.9 |
| Energy | 3.1 | 2.2 | 8.5 |
| Financials | 19.8 | 22.5 | 27.5 |
| Health Care | 8.7 | 7.5 | 8.6 |
| Industrials | 24.0 | 21.7 | 10.8 |
| Information | | | |
| Technology | 8.5 | 8.8 | 7.0 |
| Materials | 10.0 | 9.1 | 7.8 |
| Telecommunication | | | |
| Services | 1.9 | 1.5 | 5.5 |
| Utilities | 1.4 | 2.4 | 3.7 |
| | | |
| Volatility Measures | | |
| | | MSCI |
| | S&P | AC |
| | EPAC | World |
| | SmallCap | Index ex |
| | Index | USA |
| R-Squared | 0.96 | 0.90 |
| Beta | 0.94 | 0.96 |
| These measures show the degree and timing of the fund’s fluctuations compared with the indexes over 36 months. |
|
| | | |
| Ten Largest Holdings (% of total net assets) |
| Gujarat Pipavav Port Ltd. | Marine Ports & | |
| | Services | 1.5% |
| Helvetia Holding AG | Multi-line Insurance | 1.2 |
| Smurfit Kappa Group plc | Paper Packaging | 1.1 |
| Glanbia plc | Packaged Foods & | |
| | Meats | 1.1 |
| Storebrand ASA | Life & Health | |
| | Insurance | 1.0 |
| Groupe Eurotunnel SA | Highways & | |
| | Railtracks | 1.0 |
| Delta Lloyd NV | Life & Health | |
| | Insurance | 1.0 |
| Techtronic Industries Co. | Household | |
| Ltd. | Appliances | 1.0 |
| Montupet | Auto Parts & | |
| | Equipment | 1.0 |
| MTU Aero Engines AG | Aerospace & | |
| | Defense | 1.0 |
| Top Ten | | 10.9% |
| The holdings listed exclude any temporary cash investments and equity index products. |
|
Allocation by Region (% of equity exposure)

1 The expense ratio shown is from the prospectus dated February 25, 2014, and represents estimated costs for the current fiscal year. For the fiscal year ended October 31, 2014, the expense ratio was 0.40%.
12
International Explorer Fund
| | | |
| Market Diversification (% of equity exposure) |
| | | S&P | MSCI |
| | | EPAC | AC World |
| | | SmallCap | Index ex |
| | Fund | Index | USA |
| Europe | | | |
| United Kingdom | 17.8% | 19.1% | 14.6% |
| Germany | 6.4 | 7.7 | 6.2 |
| France | 5.5 | 7.7 | 6.8 |
| Italy | 4.7 | 2.1 | 1.7 |
| Ireland | 4.7 | 0.2 | 0.2 |
| Switzerland | 4.3 | 8.4 | 6.5 |
| Denmark | 3.8 | 1.2 | 1.1 |
| Sweden | 2.6 | 3.0 | 2.1 |
| Norway | 2.1 | 0.8 | 0.5 |
| Netherlands | 1.5 | 1.9 | 1.9 |
| Austria | 1.1 | 0.2 | 0.1 |
| Other | 2.3 | 5.1 | 4.8 |
| Subtotal | 56.8% | 57.4% | 46.5% |
| Pacific | | | |
| Japan | 22.9% | 21.3% | 14.6% |
| Australia | 5.2 | 6.2 | 5.7 |
| South Korea | 1.8 | 4.3 | 3.2 |
| Hong Kong | 1.7 | 2.5 | 2.2 |
| Singapore | 1.4 | 1.4 | 1.1 |
| Other | 0.4 | 0.2 | 0.1 |
| Subtotal | 33.4% | 35.9% | 26.9% |
| Emerging Markets | | | |
| India | 3.7% | 0.0% | 1.6% |
| China | 1.7 | 0.7 | 4.4 |
| Taiwan | 1.6 | 0.0 | 2.7 |
| Other | 2.7 | 0.7 | 10.0 |
| Subtotal | 9.7% | 1.4% | 18.7% |
| North America | 0.1% | 0.1% | 7.5% |
| Middle East | 0.0% | 0.7% | 0.4% |
| Other | 0.0% | 4.5% | 0.0% |
13
International Explorer Fund
Performance Summary
All of the returns in this report represent past performance, which is not a guarantee of future results that may be achieved by the fund. (Current performance may be lower or higher than the performance data cited. For performance data current to the most recent month-end, visit our website at vanguard.com/performance.) Note, too, that both investment returns and principal value can fluctuate widely, so an investor’s shares, when sold, could be worth more or less than their original cost. The returns shown do not reflect taxes that a shareholder would pay on fund distributions or on the sale of fund shares.
Cumulative Performance: October 31, 2004, Through October 31, 2014
Initial Investment of $10,000

| | | | | |
| | | | Average Annual Total Returns | |
| | | Periods Ended October 31, 2014 | |
| | | | | | Final Value |
| | | One | Five | Ten | of a $10,000 |
| | | Year | Years | Years | Investment |
| International Explorer Fund* | 2.66% | 9.11% | 8.40% | $22,412 |
| ••••••••••• | S&P EPAC SmallCap Index | -0.65 | 8.88 | 7.94 | 21,462 |
| – – – – – | International Small-Cap Funds | | | | |
| | Average | -0.86 | 10.16 | 8.16 | 21,917 |
| | MSCI All Country World Index ex | | | | |
| | USA | 0.49 | 6.55 | 7.06 | 19,789 |
| International Small-Cap Funds Average: Derived from data provided by Lipper, a Thomson Reuters Company. |
See Financial Highlights for dividend and capital gains information.
14
International Explorer Fund
Fiscal-Year Total Returns (%): October 31, 2004, Through October 31, 2014
| | | | | |
| Average Annual Total Returns: Periods Ended September 30, 2014 | | | |
| This table presents returns through the latest calendar quarter—rather than through the end of the fiscal period. |
| Securities and Exchange Commission rules require that we provide this information. | | |
| |
| |
| | Inception | One | Five | Ten |
| | Date | Year | Years | Years |
| International Explorer Fund | 11/4/1996 | 8.39% | 9.07% | 8.89% |
15
International Explorer Fund
Financial Statements
Statement of Net Assets
As of October 31, 2014
The fund reports a complete list of its holdings in regulatory filings four times in each fiscal year, at the quarter-ends. For the second and fourth fiscal quarters, the lists appear in the fund’s semiannual and annual reports to shareholders. For the first and third fiscal quarters, the fund files the lists with the Securities and Exchange Commission on Form N-Q. Shareholders can look up the fund’s Forms N-Q on the SEC’s website at sec.gov. Forms N-Q may also be reviewed and copied at the SEC’s Public Reference Room (see the back cover of this report for further information).
| | | |
| | | | Market |
| | | | Value |
| | | Shares | ($000) |
| Common Stocks (95.5%)1 | | |
| Australia (4.5%) | | |
| | Mirvac Group | 9,368,026 | 14,844 |
| | Amcor Ltd. | 1,428,542 | 14,783 |
| | Computershare Ltd. | 1,339,861 | 14,527 |
| | Iluka Resources Ltd. | 1,921,351 | 12,728 |
| * | Asaleo Care Ltd. | 6,618,650 | 11,854 |
| | Ansell Ltd. | 563,884 | 9,907 |
| | Incitec Pivot Ltd. | 3,205,064 | 8,251 |
| | Recall Holdings Ltd. | 908,126 | 4,652 |
| * | Spotless Group | | |
| | Holdings Ltd. | 2,681,355 | 4,548 |
| | Nufarm Ltd. | 826,442 | 3,623 |
| | Challenger Ltd. | 508,446 | 3,119 |
| | Transpacific Industries | | |
| | Group Ltd. | 3,922,201 | 3,113 |
| | SAI Global Ltd. | 770,871 | 2,761 |
| | Tox Free Solutions Ltd. | 1,175,235 | 2,527 |
| | Super Retail Group Ltd. | 343,718 | 2,224 |
| * | Karoon Gas Australia Ltd. | 722,276 | 1,889 |
| ^ | Vocation Ltd. | 1,196,528 | 956 |
| | | | 116,306 |
| Austria (1.1%) | | |
| | ANDRITZ AG | 482,389 | 23,311 |
| | Schoeller-Bleckmann | | |
| | Oilfield Equipment AG | 30,644 | 2,646 |
| * | Kapsch TrafficCom AG | 85,000 | 1,789 |
| | | | 27,746 |
| Belgium (0.5%) | | |
| | Cie d’Entreprises CFE | 46,638 | 5,046 |
| | Ackermans & | | |
| | van Haaren NV | 31,402 | 3,917 |
| | D’ieteren SA | 104,786 | 3,797 |
| | | | 12,760 |
| Brazil (0.4%) | | |
| | BR Properties SA | 1,412,388 | 7,136 |
| | Magazine Luiza SA | 690,795 | 2,301 |
| | | | 9,437 |
| | | |
| | | | Market |
| | | | Value |
| | | Shares | ($000) |
| Canada (0.1%) | | |
| | Pacific Rubiales | | |
| | Energy Corp. | 150,180 | 2,265 |
| |
| China (1.6%) | | |
| ^ | Baoxin Auto Group Ltd. | 9,677,000 | 7,400 |
| | E-House China | | |
| | Holdings Ltd. ADR | 668,100 | 6,674 |
| | Dah Chong Hong | | |
| | Holdings Ltd. | 10,202,000 | 6,022 |
| *,^,2Tianhe Chemicals | | |
| | Group Ltd. | 31,192,000 | 5,429 |
| * | WuXi PharmaTech | | |
| | Cayman Inc. ADR | 127,245 | 4,797 |
| | Shenzhou International | | |
| | Group Holdings Ltd. | 909,000 | 3,136 |
| | Shanghai Fosun | | |
| | Pharmaceutical | | |
| | Group Co. Ltd. | 747,770 | 2,687 |
| * | Luye Pharma Group Ltd. | 1,711,000 | 2,472 |
| | Haitian International | | |
| | Holdings Ltd. | 1,107,000 | 2,376 |
| * | GCL-Poly Energy | | |
| | Holdings Ltd. | 4,707,000 | 1,589 |
| | | | 42,582 |
| Denmark (3.7%) | | |
| | Matas A/S | 1,034,405 | 22,734 |
| * | Jyske Bank A/S | 330,000 | 17,796 |
| | GN Store Nord A/S | 610,000 | 14,216 |
| * | Auriga Industries A/S | | |
| | Class B | 256,964 | 13,272 |
| * | OW Bunker A/S | 950,000 | 12,492 |
| | SimCorp A/S | 190,000 | 5,736 |
| | H Lundbeck A/S | 247,030 | 5,249 |
| | DSV A/S | 170,712 | 5,108 |
| | | | 96,603 |
16
International Explorer Fund
| | | |
| | | | Market |
| | | | Value |
| | | Shares | ($000) |
| Finland (0.2%) | | |
| | Vaisala Oyj | 125,000 | 3,524 |
| | Tikkurila Oyj | 81,216 | 1,677 |
| | | | 5,201 |
| France (5.1%) | | |
| | Groupe Eurotunnel SA | 2,130,000 | 26,924 |
| | Montupet | 337,000 | 26,278 |
| | Rubis SCA | 325,000 | 19,131 |
| | Eurofins Scientific SE | 62,000 | 15,698 |
| | Korian-Medica | 280,000 | 10,128 |
| | Euler Hermes Group | 80,000 | 7,844 |
| * | Naturex | 100,000 | 6,958 |
| | Lectra | 600,000 | 5,921 |
| | Imerys SA | 62,516 | 4,486 |
| | Eurazeo SA | 44,687 | 2,990 |
| | Wendel SA | 24,733 | 2,729 |
| | Virbac SA | 8,726 | 1,950 |
| *,^ | SOITEC | 593,527 | 1,476 |
| * | Inside Secure SA | 325,419 | 1,258 |
| | | | 133,771 |
| Germany (6.0%) | | |
| | MTU Aero Engines AG | 290,000 | 25,401 |
| | Freenet AG | 850,000 | 22,252 |
| | XING AG | 165,000 | 17,503 |
| | Sartorius AG | | |
| | Preference Shares | 160,000 | 17,460 |
| * | Tom Tailor Holding AG | 890,000 | 12,488 |
| * | BRAAS Monier | | |
| | Building Group SA | 459,881 | 9,242 |
| | Tipp24 SE | 190,000 | 9,141 |
| | RIB Software AG | 605,000 | 8,128 |
| | CTS Eventim AG | | |
| | & Co. KGaA | 300,000 | 7,911 |
| | Grenkeleasing AG | 57,162 | 5,685 |
| | SAF-Holland SA | 329,972 | 4,126 |
| | Rheinmetall AG | 83,403 | 3,585 |
| * | Suss Microtec AG | 583,034 | 3,441 |
| | STRATEC Biomedical AG | 44,974 | 2,385 |
| | DMG MORI SEIKI AG | 79,095 | 2,020 |
| | ElringKlinger AG | 62,910 | 1,922 |
| | SHW AG | 35,000 | 1,593 |
| *,^ | LPKF Laser & | | |
| | Electronics AG | 67,158 | 858 |
| | | | 155,141 |
| Greece (0.1%) | | |
| | Grivalia Properties REIC | 237,094 | 2,570 |
| |
| Hong Kong (1.7%) | | |
| | Techtronic | | |
| | Industries Co. Ltd. | 8,419,500 | 26,339 |
| | Yue Yuen Industrial | | |
| | Holdings Ltd. | 2,613,500 | 8,811 |
| * | Johnson Electric | | |
| | Holdings Ltd. | 2,472,625 | 8,369 |
| | | | 43,519 |
| | | |
| | | | Market |
| | | | Value |
| | | Shares | ($000) |
| India (3.6%) | | |
| * | Gujarat Pipavav | | |
| | Port Ltd. | 14,578,124 | 39,716 |
| | Idea Cellular Ltd. | 8,030,074 | 21,463 |
| | Apollo Hospitals | | |
| | Enterprise Ltd. | 814,438 | 14,817 |
| | Cipla Ltd. | 1,149,739 | 12,569 |
| | Multi Commodity | | |
| | Exchange of India Ltd. | 262,713 | 3,576 |
| | McLeod Russel India Ltd. | 286,458 | 1,213 |
| | | | 93,354 |
| Indonesia (0.6%) | | |
| | Matahari Department | | |
| | Store Tbk PT | 7,666,000 | 9,393 |
| | Ciputra Property Tbk PT | 73,359,500 | 4,600 |
| | Gajah Tunggal Tbk PT | 13,651,990 | 1,627 |
| | | | 15,620 |
| Ireland (4.6%) | | |
| | Smurfit Kappa Group plc | 1,400,000 | 28,921 |
| | Glanbia plc | 2,000,000 | 28,249 |
| | Paddy Power plc | 250,000 | 18,219 |
| | FBD Holdings plc | 725,000 | 12,262 |
| * | Dalata Hotel Group plc | 2,956,507 | 10,742 |
| | IFG Group plc | 3,262,005 | 6,253 |
| | Irish Continental | | |
| | Group plc | 1,600,000 | 5,592 |
| * | Origin Enterprises plc | 480,000 | 4,751 |
| * | Irish Residential | | |
| | Properties REIT plc | 3,302,682 | 4,446 |
| | | | 119,435 |
| Italy (4.5%) | | |
| * | Maire Tecnimont SPA | 7,750,000 | 16,479 |
| * | Banca Popolare | | |
| | dell’Emilia Romagna SC | 2,156,250 | 16,442 |
| * | Sorin SPA | 7,000,000 | 15,658 |
| | Amplifon SPA | 2,550,000 | 14,938 |
| * | Cerved Information | | |
| | Solutions SPA | 2,500,000 | 13,803 |
| * | FinecoBank Banca | | |
| | Fineco SPA | 2,200,000 | 11,449 |
| | Credito Emiliano SPA | 1,104,521 | 8,501 |
| | Prysmian SPA | 200,000 | 3,464 |
| * | Ei Towers SPA | 61,162 | 3,065 |
| | Beni Stabili SpA SIIQ | 4,427,507 | 3,052 |
| | DiaSorin SPA | 67,611 | 2,613 |
| * | Anima Holding SPA | 542,440 | 2,531 |
| | Brunello Cucinelli SPA | 103,654 | 2,098 |
| | Banca Generali SPA | 78,639 | 2,087 |
| | Immobiliare Grande | | |
| | Distribuzione | 1,358,830 | 1,134 |
| | Salvatore | | |
| | Ferragamo SPA | 42,060 | 994 |
| | | | 118,308 |
17
International Explorer Fund
| | | |
| | | | Market |
| | | | Value |
| | | Shares | ($000) |
| Japan (21.7%) | | |
| | Nitta Corp. | 722,900 | 16,728 |
| | NEC Networks & System | | |
| | Integration Corp. | 706,300 | 15,547 |
| | Tsuruha Holdings Inc. | 254,235 | 15,224 |
| | Arcs Co. Ltd. | 657,900 | 14,735 |
| | Eagle Industry Co. Ltd. | 759,200 | 14,682 |
| | Koito Manufacturing | | |
| | Co. Ltd. | 473,200 | 14,643 |
| | Trusco Nakayama Corp. | 517,800 | 14,062 |
| | Tokai Tokyo Financial | | |
| | Holdings Inc. | 1,988,200 | 13,736 |
| | JSP Corp. | 824,900 | 13,350 |
| | Kureha Corp. | 2,646,000 | 13,147 |
| | Kissei Pharmaceutical | | |
| | Co. Ltd. | 486,500 | 12,904 |
| | Nihon Parkerizing | | |
| | Co. Ltd. | 520,100 | 12,646 |
| | Daibiru Corp. | 1,073,100 | 12,137 |
| ^ | Kuroda Electric Co. Ltd. | 836,700 | 12,022 |
| | Aica Kogyo Co. Ltd. | 562,000 | 11,903 |
| | Hitachi High- | | |
| | Technologies Corp. | 372,800 | 11,565 |
| | Nabtesco Corp. | 451,200 | 11,300 |
| | Lintec Corp. | 510,300 | 10,817 |
| ^ | Modec Inc. | 421,900 | 10,304 |
| | Ai Holdings Corp. | 503,700 | 10,240 |
| | Nippon Densetsu | | |
| | Kogyo Co. Ltd. | 631,000 | 9,184 |
| | Nippon Soda Co. Ltd. | 1,581,000 | 9,003 |
| | Mitsui Sugar Co. Ltd. | 2,509,000 | 8,692 |
| | Plenus Co. Ltd. | 471,300 | 8,486 |
| ^ | Digital Garage Inc. | 599,640 | 8,133 |
| | Kakaku.com Inc. | 590,135 | 8,082 |
| | Mitsubishi UFJ Lease | | |
| | & Finance Co. Ltd. | 1,407,995 | 7,498 |
| | Shinsei Bank Ltd. | 3,262,235 | 7,340 |
| | Takasago | | |
| | International Corp. | 1,528,000 | 7,334 |
| | OBIC Business | | |
| | Consultants Ltd. | 233,900 | 7,086 |
| | Unipres Corp. | 352,600 | 7,076 |
| | Glory Ltd. | 258,700 | 6,867 |
| | Hitachi Transport | | |
| | System Ltd. | 502,700 | 6,675 |
| | Zenkoku Hosho Co. Ltd. | 206,355 | 6,629 |
| | TPR Co. Ltd. | 268,600 | 6,570 |
| | Obara Group Inc. | 172,400 | 6,513 |
| | Yamato Kogyo Co. Ltd. | 190,320 | 6,391 |
| | Asahi Intecc Co. Ltd. | 131,635 | 6,204 |
| ^ | Sumco Corp. | 436,900 | 5,994 |
| | Musashi Seimitsu | | |
| | Industry Co. Ltd. | 304,800 | 5,902 |
| | IHI Corp. | 1,180,245 | 5,827 |
| | Tsutsumi Jewelry Co. Ltd. | 233,100 | 5,767 |
| | | |
| | | | Market |
| | | | Value |
| | | Shares | ($000) |
| | TDK Corp. | 99,000 | 5,712 |
| | GLP J-Reit | 4,941 | 5,638 |
| | Kumiai Chemical | | |
| | Industry Co. Ltd. | 863,000 | 5,338 |
| | Nichi-iko Pharmaceutical | | |
| | Co. Ltd. | 312,800 | 5,231 |
| ^ | Zuiko Corp. | 106,960 | 5,129 |
| ^ | Message Co. Ltd. | 160,280 | 5,023 |
| | Hoshizaki Electric Co. Ltd. | 100,055 | 4,973 |
| | Nippon Shinyaku Co. Ltd. | 164,000 | 4,897 |
| | Shionogi & Co. Ltd. | 173,915 | 4,521 |
| | Asahi Diamond | | |
| | Industrial Co. Ltd. | 363,600 | 4,460 |
| | Yaskawa Electric Corp. | 327,175 | 4,285 |
| | CyberAgent Inc. | 107,710 | 4,185 |
| | Sumitomo Real Estate | | |
| | Sales Co. Ltd. | 178,400 | 4,059 |
| | Mitsubishi Gas | | |
| | Chemical Co. Inc. | 667,865 | 4,024 |
| | Nikkiso Co. Ltd. | 370,880 | 3,877 |
| | Yushin Precision | | |
| | Equipment Co. Ltd. | 175,200 | 3,654 |
| *,^ | Tokyo TY Financial | | |
| | Group Inc. | 114,043 | 3,650 |
| | Denyo Co. Ltd. | 277,970 | 3,639 |
| | Sanwa Holdings Corp. | 495,265 | 3,547 |
| | SCSK Corp. | 123,400 | 3,335 |
| | IBJ Leasing Co. Ltd. | 137,965 | 3,320 |
| | Yokogawa Electric Corp. | 226,005 | 3,199 |
| | DMG Mori Seiki Co. Ltd. | 247,615 | 2,988 |
| | Jamco Corp. | 131,700 | 2,986 |
| | Kawasaki Heavy | | |
| | Industries Ltd. | 747,000 | 2,965 |
| | Makino Milling | | |
| | Machine Co. Ltd. | 415,220 | 2,894 |
| | Iida Group Holdings | | |
| | Co. Ltd. | 236,985 | 2,743 |
| | Tenma Corp. | 193,200 | 2,742 |
| | Nippon Shokubai Co. Ltd. | 214,805 | 2,635 |
| ^ | Ferrotec Corp. | 455,800 | 2,545 |
| | THK Co. Ltd. | 98,455 | 2,511 |
| ^ | Tokyo Steel | | |
| | Manufacturing Co. Ltd. | 442,000 | 2,430 |
| | Exedy Corp. | 94,700 | 2,408 |
| | Kobe Steel Ltd. | 1,447,000 | 2,330 |
| | Japan Petroleum | | |
| | Exploration Co. | 69,415 | 2,290 |
| | Jaccs Co. Ltd. | 366,645 | 2,193 |
| ^ | Internet Initiative | | |
| | Japan Inc. | 120,585 | 2,133 |
| | Chiyoda Corp. | 196,000 | 2,037 |
| | Shizuoka Gas Co. Ltd. | 282,050 | 1,875 |
| ^ | Pocket Card Co. Ltd. | 280,270 | 1,687 |
| | Nafco Co. Ltd. | 121,200 | 1,638 |
| | Nippon Thompson Co. Ltd. | 349,000 | 1,443 |
18
International Explorer Fund
| | | |
| | | | Market |
| | | | Value |
| | | Shares | ($000) |
| | Ichiyoshi Securities Co. Ltd. | 110,505 | 1,306 |
| | Hitachi Metals Ltd. | 39,140 | 671 |
| | Sanken Electric Co. Ltd. | 78,000 | 637 |
| | | | 564,728 |
| Luxembourg (0.9%) | | |
| * | Stabilus SA | 307,000 | 8,864 |
| | Samsonite | | |
| | International SA | 1,494,600 | 4,991 |
| * | B&M European | | |
| | Value Retail SA | 961,209 | 3,850 |
| | Reinet Investments SCA | 169,871 | 3,607 |
| 2 | O’Key Group SA GDR | 224,898 | 1,350 |
| | | | 22,662 |
| Malaysia (0.4%) | | |
| | Bursa Malaysia Bhd. | 4,245,200 | 10,447 |
| |
| Mexico (0.0%) | | |
| | Grupo Sanborns | | |
| | SAB de CV | 534,180 | 855 |
| |
| Netherlands (1.4%) | | |
| | Delta Lloyd NV | 1,171,705 | 26,720 |
| | Sligro Food Group NV | 140,000 | 5,167 |
| | USG People NV | 452,845 | 4,546 |
| | | | 36,433 |
| New Zealand (0.4%) | | |
| | Fletcher Building Ltd. | 1,475,159 | 9,920 |
| |
| Norway (2.1%) | | |
| * | Storebrand ASA | 5,300,000 | 27,164 |
| | Borregaard ASA | 2,939,182 | 20,521 |
| | Kongsberg Gruppen AS | 284,342 | 5,754 |
| | | | 53,439 |
| Singapore (1.4%) | | |
| | UOL Group Ltd. | 2,538,000 | 12,768 |
| | Mapletree | | |
| | Industrial Trust | 6,683,880 | 7,694 |
| | First Resources Ltd. | 4,598,000 | 7,448 |
| * | Vard Holdings Ltd. | 11,129,000 | 6,002 |
| | Jardine Cycle | | |
| | & Carriage Ltd. | 87,000 | 2,708 |
| | | | 36,620 |
| South Africa (0.1%) | | |
| | Gold Fields Ltd. | 621,079 | 2,024 |
| |
| South Korea (1.7%) | | |
| ^ | Halla Visteon Climate | | |
| | Control Corp. | 363,090 | 16,235 |
| | Hankook Tire Co. Ltd. | 137,449 | 7,076 |
| | BS Financial Group Inc. | 372,253 | 5,786 |
| ^ | Sung Kwang Bend | | |
| | Co. Ltd. | 386,521 | 5,591 |
| | Green Cross Corp. | 30,196 | 3,872 |
| | CJ O Shopping Co. Ltd. | 11,902 | 2,921 |
| | | |
| | | | Market |
| | | | Value |
| | | Shares | ($000) |
| | Samsung Securities | | |
| | Co. Ltd. | 36,745 | 1,646 |
| | Lotte Chemical Corp. | 10,286 | 1,433 |
| | | | 44,560 |
| Spain (0.5%) | | |
| * | Applus Services SA | 1,100,000 | 13,300 |
| |
| Sweden (2.6%) | | |
| | Intrum Justitia AB | 750,000 | 22,284 |
| | Loomis AB Class B | 700,000 | 19,244 |
| * | Bufab Holding AB | 1,621,559 | 11,733 |
| | Modern Times Group | | |
| | MTG AB Class B | 135,000 | 4,169 |
| | Opus Group AB | 2,577,981 | 3,918 |
| | Concentric AB | 226,879 | 2,786 |
| | Haldex AB | 134,875 | 1,658 |
| * | Seamless | | |
| | Distribution AB | 324,004 | 901 |
| | | | 66,693 |
| Switzerland (4.2%) | | |
| | Helvetia Holding AG | 65,000 | 30,885 |
| | EFG International AG | 1,660,000 | 17,254 |
| | Orior AG | 161,405 | 8,724 |
| | Interroll Holding AG | 14,000 | 7,962 |
| | Clariant AG | 440,000 | 7,676 |
| | Kuoni Reisen | | |
| | Holding AG | 25,267 | 6,886 |
| | Gategroup Holding AG | 254,561 | 5,733 |
| | Partners Group | | |
| | Holding AG | 18,139 | 4,826 |
| * | Dufry AG | 33,050 | 4,758 |
| | Komax Holding AG | 32,000 | 4,715 |
| | Ascom Holding AG | 300,000 | 4,402 |
| | Tecan Group AG | 36,619 | 3,863 |
| | OC Oerlikon Corp. AG | 137,555 | 1,739 |
| | | | 109,423 |
| Taiwan (1.6%) | | |
| | Giant Manufacturing | | |
| | Co. Ltd. | 2,657,000 | 21,527 |
| | Chroma ATE Inc. | 3,416,000 | 8,520 |
| | CTCI Corp. | 3,710,000 | 6,155 |
| | Yungtay Engineering | | |
| | Co. Ltd. | 1,250,000 | 2,778 |
| | Gourmet Master Co. Ltd. | 405,000 | 2,579 |
| | | | 41,559 |
| Thailand (0.8%) | | |
| | Hemaraj Land and | | |
| | Development PCL | 78,955,100 | 11,814 |
| | LPN Development PCL | 12,974,800 | 9,225 |
| | | | 21,039 |
| United Arab Emirates (0.3%) | |
| * | Lamprell plc | 3,937,500 | 9,249 |
19
International Explorer Fund
| | | |
| | | | Market |
| | | | Value |
| | | Shares | ($000) |
| United Kingdom (17.1%) | | |
| | Kennedy Wilson Europe | | |
| | Real Estate plc | 956,452 | 15,915 |
| | DCC plc | 275,000 | 15,396 |
| | Grainger plc | 4,915,405 | 14,890 |
| | Grafton Group plc | 1,450,000 | 14,777 |
| | CSR plc | 1,100,000 | 14,763 |
| | Ashtead Group plc | 825,000 | 13,815 |
| | IG Group Holdings plc | 1,390,645 | 13,378 |
| | Dechra Pharmaceuticals | | |
| | plc | 1,100,000 | 13,354 |
| | Millennium & Copthorne | | |
| | Hotels plc | 1,400,000 | 12,728 |
| | Telecom Plus plc | 560,000 | 12,652 |
| | Persimmon plc | 500,000 | 11,711 |
| | Elementis plc | 2,729,307 | 11,544 |
| | London Stock | | |
| | Exchange Group plc | 350,000 | 11,294 |
| | WS Atkins plc | 445,073 | 9,676 |
| | Investec plc | 1,050,000 | 9,625 |
| | Berendsen plc | 575,000 | 9,303 |
| * | SSP Group plc | 2,226,437 | 8,539 |
| | Ricardo plc | 800,000 | 8,452 |
| | Inchcape plc | 750,000 | 8,354 |
| | Premier Oil plc | 2,000,000 | 8,269 |
| | Micro Focus | | |
| | International plc | 500,000 | 7,933 |
| | Photo-Me | | |
| | International plc | 3,750,000 | 7,922 |
| | John Wood Group plc | 725,000 | 7,698 |
| | Redrow plc | 1,563,146 | 7,236 |
| | Senior plc | 1,650,000 | 7,071 |
| | Domino Printing | | |
| | Sciences plc | 726,000 | 7,011 |
| * | Findel plc | 1,600,365 | 6,764 |
| | Halma plc | 675,000 | 6,739 |
| | Soco International plc | 1,237,140 | 6,512 |
| | QinetiQ Group plc | 2,000,000 | 6,474 |
| | Kier Group plc | 269,686 | 6,435 |
| | A.G.BARR plc | 650,000 | 6,144 |
| | Direct Line Insurance | | |
| | Group plc | 1,375,481 | 6,080 |
| | HomeServe plc | 1,073,881 | 5,929 |
| | Booker Group plc | 2,578,888 | 5,797 |
| *,^ | SuperGroup plc | 425,000 | 5,652 |
| * | Pets at Home Group plc | 1,795,078 | 5,557 |
| | SIG plc | 2,250,000 | 5,276 |
| | Bodycote plc | 525,000 | 5,250 |
| | Mears Group plc | 729,690 | 5,162 |
| | N Brown Group plc | 949,917 | 5,101 |
| | Tyman plc | 1,102,576 | 4,779 |
| | Domino’s Pizza | | |
| | Group plc | 425,479 | 4,328 |
| | | |
| | | | Market |
| | | | Value |
| | | Shares | ($000) |
| | Eco Animal Health | | |
| | Group plc | 1,608,166 | 4,310 |
| | Hays plc | 2,178,064 | 4,307 |
| * | Just Retirement | | |
| | Group plc | 1,900,000 | 4,048 |
| | Savills plc | 390,265 | 4,023 |
| * | LMS Capital plc | 3,097,813 | 4,012 |
| | Crest Nicholson | | |
| | Holdings plc | 699,521 | 3,762 |
| * | EnQuest plc | 3,250,000 | 3,614 |
| | Michael Page | | |
| | International plc | 553,603 | 3,449 |
| | UNITE Group plc | 484,542 | 3,312 |
| | Big Yellow Group plc | 375,671 | 3,286 |
| | James Fisher & Sons plc | 155,244 | 3,246 |
| | Fenner plc | 620,547 | 3,061 |
| | Hansteen Holdings plc | 1,458,284 | 2,474 |
| * | Ophir Energy plc | 828,512 | 2,461 |
| | Keller Group plc | 183,913 | 2,458 |
| | Berkeley Group | | |
| | Holdings plc | 63,121 | 2,306 |
| | De La Rue plc | 275,109 | 2,302 |
| *,2 | TSB Banking Group plc | 498,630 | 2,157 |
| | Hunting plc | 167,817 | 1,977 |
| | Chemring Group plc | 316,217 | 1,235 |
| | | | 443,085 |
| Total Common Stocks | | |
| (Cost $2,152,499) | | 2,480,654 |
| Temporary Cash Investments (6.5%)1 | |
| Money Market Fund (5.8%) | | |
| 3,4 | Vanguard Market | | |
| | Liquidity Fund, | | |
| | 0.114% | 151,071,717 | 151,072 |
| |
| | | Face | |
| | | Amount | |
| | | ($000) | |
| Repurchase Agreement (0.5%) | |
| | Goldman Sachs & Co. | | |
| | 0.090%, 11/3/14 (Dated | |
| | 10/31/14, Repurchase | | |
| | Value $13,600,000, | | |
| | collateralized by Federal | |
| | Home Loan Mortgage | | |
| | Assn. 2.500%–4.000%, | |
| | 11/1/25–10/1/44, and | | |
| | Federal National | | |
| | Mortgage Assn. | | |
| | 2.500%–4.500%, | | |
| | 3/1/27–8/1/44, with a | | |
| | value of $13,872,000) | 13,600 | 13,600 |
20
International Explorer Fund
| | |
| | Face | Market |
| | Amount | Value |
| | ($000) | ($000) |
| U.S. Government and Agency Obligations (0.2%) |
| 5,6 Federal Home Loan | | |
| Bank Discount Notes, | | |
| 0.074%, 12/3/14 | 1,000 | 1,000 |
| 5,6,7 Federal Home Loan | | |
| Bank Discount Notes, | | |
| 0.028%, 12/8/14 | 1,800 | 1,799 |
| 5,6 Federal Home Loan | | |
| Bank Discount Notes, | | |
| 0.050%, 12/10/14 | 1,400 | 1,400 |
| | | 4,199 |
| Total Temporary Cash Investments | |
| (Cost $168,872) | | 168,871 |
| Total Investments (102.0%) | | |
| (Cost $2,321,371) | | 2,649,525 |
| Other Assets and Liabilities (-2.0%) | |
| Other Assets | | 20,593 |
| Liabilities4 | | (72,346) |
| | | (51,753) |
| Net Assets (100%) | | |
| Applicable to 142,288,484 outstanding | |
| $.001 par value shares of beneficial | |
| interest (unlimited authorization) | 2,597,772 |
| Net Asset Value Per Share | | $18.26 |
| | |
| At October 31, 2014, net assets consisted of: |
| | Amount |
| | ($000) |
| Paid-in Capital | 2,102,323 |
| Undistributed Net Investment Income | 13,317 |
| Accumulated Net Realized Gains | 154,404 |
| Unrealized Appreciation (Depreciation) | |
| Investment Securities | 328,154 |
| Futures Contracts | 1,960 |
| Forward Currency Contracts | (2,165) |
| Foreign Currencies | (221) |
| Net Assets | 2,597,772 |
See Note A in Notes to Financial Statements.
* Non-income-producing security.
^ Includes partial security positions on loan to broker-dealers. The total value of securities on loan is $52,519,000.
1 The fund invests a portion of its cash reserves in equity markets through the use of index futures contracts. After giving effect to futures investments, the fund’s effective common stock and temporary cash investment positions represent 97.8% and 4.2%, respectively, of net assets.
2 Security exempt from registration under Rule 144A of the Securities Act of 1933. Such securities may be sold in transactions exempt from registration, normally to qualified institutional buyers. At October 31, 2014, the aggregate value of these securities was $8,936,000, representing 0.3% of net assets.
3 Affiliated money market fund available only to Vanguard funds and certain trusts and accounts managed by Vanguard. Rate shown is the 7-day yield.
4 Includes $56,481,000 of collateral received for securities on loan.
5 The issuer operates under a congressional charter; its securities are generally neither guaranteed by the U.S. Treasury nor backed by the full faith and credit of the U.S. government.
6 Securities with a value of $3,200,000 have been segregated as initial margin for open futures contracts.
7 Securities with a value of $776,000 have been segregated as collateral for open forward currency contracts.
ADR—American Depositary Receipt.
GDR—Global Depositary Receipt.
REIT—Real Estate Investment Trust.
See accompanying Notes, which are an integral part of the Financial Statements.
21
International Explorer Fund
Statement of Operations
| |
| | Year Ended |
| | October 31, 2014 |
| | ($000) |
| Investment Income |
| Income |
| Dividends1 | 52,824 |
| Interest2 | 168 |
| Securities Lending | 1,152 |
| Total Income | 54,144 |
| Expenses |
| Investment Advisory Fees—Note B |
| Basic Fee | 5,396 |
| Performance Adjustment | (113) |
| The Vanguard Group—Note C |
| Management and Administrative | 4,054 |
| Marketing and Distribution | 435 |
| Custodian Fees | 589 |
| Auditing Fees | 38 |
| Shareholders’ Reports | 28 |
| Trustees’ Fees and Expenses | 5 |
| Total Expenses | 10,432 |
| Net Investment Income | 43,712 |
| Realized Net Gain (Loss) |
| Investment Securities Sold | 172,310 |
| Futures Contracts | 4,034 |
| Foreign Currencies and Forward Currency Contracts | (3,378) |
| Realized Net Gain (Loss) | 172,966 |
| Change in Unrealized Appreciation (Depreciation) |
| Investment Securities | (162,620) |
| Futures Contracts | (915) |
| Foreign Currencies and Forward Currency Contracts | (3,237) |
| Change in Unrealized Appreciation (Depreciation) | (166,772) |
| Net Increase (Decrease) in Net Assets Resulting from Operations | 49,906 |
1 Dividends are net of foreign withholding taxes of $3,056,000.
2 Interest income from an affiliated company of the fund was $157,000. |
|
See accompanying Notes, which are an integral part of the Financial Statements.
22
International Explorer Fund
Statement of Changes in Net Assets
| | |
| | Year Ended October 31, |
| | 2014 | 2013 |
| | ($000) | ($000) |
| Increase (Decrease) in Net Assets |
| Operations |
| Net Investment Income | 43,712 | 40,193 |
| Realized Net Gain (Loss) | 172,966 | 61,956 |
| Change in Unrealized Appreciation (Depreciation) | (166,772) | 440,763 |
| Net Increase (Decrease) in Net Assets Resulting from Operations | 49,906 | 542,912 |
| Distributions |
| Net Investment Income | (52,360) | (50,302) |
| Realized Capital Gain1 | (35,904) | — |
| Total Distributions | (88,264) | (50,302) |
| Capital Share Transactions |
| Issued | 653,367 | 358,438 |
| Issued in Lieu of Cash Distributions | 81,125 | 45,856 |
| Redeemed | (379,732) | (434,054) |
| Net Increase (Decrease) from Capital Share Transactions | 354,760 | (29,760) |
| Total Increase (Decrease) | 316,402 | 462,850 |
| Net Assets |
| Beginning of Period | 2,281,370 | 1,818,520 |
| End of Period2 | 2,597,772 | 2,281,370 |
1 Includes fiscal 2014 short-term gain distributions totaling $17,079,000. Short-term gain distributions are treated as ordinary income dividends for tax purposes.
2 Net Assets—End of Period includes undistributed (overdistributed) net investment income of $13,317,000 and $22,380,000. |
|
|
See accompanying Notes, which are an integral part of the Financial Statements.
23
International Explorer Fund
Financial Highlights
| | | | | |
| For a Share Outstanding | | | Year Ended October 31, |
| Throughout Each Period | 2014 | 2013 | 2012 | 2011 | 2010 |
| Net Asset Value, Beginning of Period | $18.50 | $14.50 | $14.41 | $15.81 | $13.55 |
| Investment Operations |
| Net Investment Income | .335 | .327 | .362 | .322 | .237 |
| Net Realized and Unrealized Gain (Loss) | | | | | |
| on Investments | .133 | 4.078 | .287 | (1.498) | 2.225 |
| Total from Investment Operations | .468 | 4.405 | .649 | (1.176) | 2.462 |
| Distributions | | | | | |
| Dividends from Net Investment Income | (.420) | (.405) | (.346) | (.224) | (.202) |
| Distributions from Realized Capital Gains | (.288) | — | (.213) | — | — |
| Total Distributions | (.708) | (.405) | (.559) | (.224) | (.202) |
| Net Asset Value, End of Period | $18.26 | $18.50 | $14.50 | $14.41 | $15.81 |
| |
| Total Return1 | 2.66% | 31.13% | 5.02% | -7.60% | 18.38% |
| |
| Ratios/Supplemental Data | | | | | |
| Net Assets, End of Period (Millions) | $2,598 | $2,281 | $1,819 | $2,187 | $2,436 |
| Ratio of Total Expenses to | | | | | |
| Average Net Assets2 | 0.40% | 0.36% | 0.43% | 0.42% | 0.39% |
| Ratio of Net Investment Income to | | | | | |
| Average Net Assets | 1.69% | 2.03% | 2.35% | 1.93% | 1.67% |
| Portfolio Turnover Rate | 39% | 36% | 28% | 43% | 51% |
1 Total returns do not include transaction or account service fees that may have applied in the periods shown. Fund prospectuses provide information about any applicable transaction and account service fees.
2 Includes performance-based investment advisory fee increases (decreases) of 0.00%, (0.05%), 0.02%, 0.03%, and 0.00%. |
|
|
See accompanying Notes, which are an integral part of the Financial Statements.
24
International Explorer Fund
Notes to Financial Statements
Vanguard International Explorer Fund is registered under the Investment Company Act of 1940 as an open-end investment company, or mutual fund. The fund invests in securities of foreign issuers, which may subject it to investment risks not normally associated with investing in securities of United States corporations.
A. The following significant accounting policies conform to generally accepted accounting principles for U.S. investment companies. The fund consistently follows such policies in preparing its financial statements.
1. Security Valuation: Securities are valued as of the close of trading on the New York Stock Exchange (generally 4 p.m., Eastern time) on the valuation date. Equity securities are valued at the latest quoted sales prices or official closing prices taken from the primary market in which each security trades; such securities not traded on the valuation date are valued at the mean of the latest quoted bid and asked prices. Securities for which market quotations are not readily available, or whose values have been affected by events occurring before the fund’s pricing time but after the close of the securities’ primary markets, are valued at their fair values calculated according to procedures adopted by the board of trustees. These procedures include obtaining quotations from an independent pricing service, monitoring news to identify significant market- or security-specific events, and evaluating changes in the values of foreign market proxies (for example, ADRs, futures contracts, or exchange-traded funds), between the time the foreign markets close and the fund’s pricing time. When fair-value pricing is employed, the prices of securities used by a fund to calculate its net asset value may differ from quoted or published prices for the same securities. Investments in Vanguard Market Liquidity Fund are valued at that fund’s net asset value. Temporary cash investments acquired over 60 days to maturity are valued using the latest bid prices or using valuations based on a matrix system (which considers such factors as security prices, yields, maturities, and ratings), both as furnished by independent pricing services. Other temporary cash investments are valued at amortized cost, which approximates market value.
2. Foreign Currency: Securities and other assets and liabilities denominated in foreign currencies are translated into U.S. dollars using exchange rates obtained from an independent third party as of the fund’s pricing time on the valuation date. Realized gains (losses) and unrealized appreciation (depreciation) on investment securities include the effects of changes in exchange rates since the securities were purchased, combined with the effects of changes in security prices. Fluctuations in the value of other assets and liabilities resulting from changes in exchange rates are recorded as unrealized foreign currency gains (losses) until the assets or liabilities are settled in cash, at which time they are recorded as realized foreign currency gains (losses).
3. Futures and Forward Currency Contracts: The fund uses index futures contracts to a limited extent, with the objective of maintaining full exposure to the stock market while maintaining liquidity. The fund may purchase or sell futures contracts to achieve a desired level of investment, whether to accommodate portfolio turnover or cash flows from capital share transactions. The primary risks associated with the use of futures contracts are imperfect correlation between changes in market values of stocks held by the fund and the prices of futures contracts, and the possibility of an illiquid market. Counterparty risk involving futures is mitigated because a regulated clearinghouse is the counterparty instead of the clearing broker. To further mitigate counterparty risk, the fund trades futures contracts on an exchange, monitors the financial strength of its clearing brokers and clearing-house, and has entered into clearing agreements with its clearing brokers. The clearinghouse imposes initial margin requirements to secure the fund’s performance and requires daily settlement of variation margin representing changes in the market value of each contract.
25
International Explorer Fund
The fund enters into forward currency contracts to provide the appropriate currency exposure related to any open futures contracts or to protect the value of securities and related receivables and payables against changes in foreign exchange rates. The fund’s risks in using these contracts include movement in the values of the foreign currencies relative to the U.S. dollar and the ability of the counterparties to fulfill their obligations under the contracts. The fund mitigates its counterparty risk by entering into forward currency contracts only with a diverse group of prequalified counter-parties, monitoring their financial strength, entering into master netting arrangements with its counterparties, and requiring its counterparties to transfer collateral as security for their performance. The master netting arrangements provide that, in the event of a counterparty’s default (including bankruptcy), the fund may terminate the forward currency contracts, determine the net amount owed by either party in accordance with its master netting arrangements, and sell or retain any collateral held up to the net amount owed to the fund under the master netting arrangements. The forward currency contracts contain provisions whereby a counterparty may terminate open contracts if the fund’s net assets decline below a certain level, triggering a payment by the fund if the fund is in a net liability position at the time of the termination. The payment amount would be reduced by any collateral the fund has pledged. Any assets pledged as collateral for open contracts are noted in the Statement of Net Assets. The value of collateral received or pledged is compared daily to the value of the forward currency contracts exposure with each counterparty, and any difference, if in excess of a specified minimum transfer amount, is adjusted and settled within two business days.
Futures contracts are valued at their quoted daily settlement prices. Forward currency contracts are valued at their quoted daily prices obtained from an independent third party, adjusted for currency risk based on the expiration date of each contract. The aggregate settlement values and notional amounts of the contracts are not recorded in the Statement of Net Assets. Fluctuations in the value of the contracts are recorded in the Statement of Net Assets as an asset (liability) and in the Statement of Operations as unrealized appreciation (depreciation) until the contracts are closed, when they are recorded as realized gains (losses) on futures or forward currency contracts.
During the year ended October 31, 2014, the fund’s average investments in long and short futures contracts represented 3% and 0% of net assets, respectively, based on the average of aggregate settlement values at each quarter-end during the period. The fund’s average investment in forward currency contracts represented 4% of net assets, based on the average of notional amounts at each quarter-end during the period.
4. Repurchase Agreements: The fund enters into repurchase agreements with institutional counter-parties. Securities pledged as collateral to the fund under repurchase agreements are held by a custodian bank until the agreements mature. Each agreement requires that the market value of the collateral be sufficient to cover payments of interest and principal. The fund further mitigates its counterparty risk by entering into repurchase agreements only with a diverse group of prequalified counterparties, monitoring their financial strength, and entering into master repurchase agreements with its counterparties. The master repurchase agreements provide that, in the event of a counter-party’s default (including bankruptcy), the fund may terminate any repurchase agreements with that counterparty, determine the net amount owed, and sell or retain the collateral up to the net amount owed to the fund. Such action may be subject to legal proceedings, which may delay or limit the disposition of collateral.
26
International Explorer Fund
5. Federal Income Taxes: The fund intends to continue to qualify as a regulated investment company and distribute all of its taxable income. Management has analyzed the fund’s tax positions taken for all open federal income tax years (October 31, 2011–2014), and has concluded that no provision for federal income tax is required in the fund’s financial statements.
6. Distributions: Distributions to shareholders are recorded on the ex-dividend date.
7. Securities Lending: To earn additional income, the fund lends its securities to qualified institutional borrowers. Security loans are required to be secured at all times by collateral in an amount at least equal to the market value of securities loaned. Daily market fluctuations could cause the value of loaned securities to be more or less than the value of the collateral received. When this occurs, the collateral is adjusted and settled on the next business day. The fund further mitigates its counterparty risk by entering into securities lending transactions only with a diverse group of prequalified counterparties, monitoring their financial strength, and entering into master securities lending agreements with its counterparties. The master securities lending agreements provide that, in the event of a counterparty’s default (including bankruptcy), the fund may terminate any loans with that borrower, determine the net amount owed, and sell or retain the collateral up to the net amount owed to the fund; however, such actions may be subject to legal proceedings. While collateral mitigates counterparty risk, in the absence of a default the fund may experience delays and costs in recovering the securities loaned. The fund invests cash collateral received in Vanguard Market Liquidity Fund, and records a liability in the Statement of Net Assets for the return of the collateral, during the period the securities are on loan. Securities lending income represents fees charged to borrowers plus income earned on invested cash collateral, less expenses associated with the loan.
8. Credit Facility: The fund and certain other funds managed by The Vanguard Group participate in a $2.89 billion committed credit facility provided by a syndicate of lenders pursuant to a credit agreement that may be renewed annually; each fund is individually liable for its borrowings, if any, under the credit facility. Borrowings may be utilized for temporary and emergency purposes, and are subject to the fund’s regulatory and contractual borrowing restrictions. The participating funds are charged administrative fees and an annual commitment fee of 0.06% of the undrawn amount of the facility; these fees are allocated to the funds based on a method approved by the fund’s board of trustees and included in Management and Administrative expenses on the fund’s Statement of Operations. Any borrowings under this facility bear interest at a rate equal to the higher of the federal funds rate or LIBOR reference rate plus an agreed-upon spread.
The fund had no borrowings outstanding at October 31, 2014, or at any time during the period then ended.
9. Other: Dividend income is recorded on the ex-dividend date. Interest income includes income distributions received from Vanguard Market Liquidity Fund and is accrued daily. Premiums and discounts on debt securities purchased are amortized and accreted, respectively, to interest income over the lives of the respective securities. Security transactions are accounted for on the date securities are bought or sold. Costs used to determine realized gains (losses) on the sale of investment securities are those of the specific securities sold.
27
International Explorer Fund
B. Schroder Investment Management North America Inc. and Wellington Management Company, LLP, each provide investment advisory services to a portion of the fund for a fee calculated at an annual percentage rate of average net assets managed by the advisor. The basic fees of Schroder Investment Management North America Inc. and Wellington Management Company, LLP, are subject to quarterly adjustments based on performance for the preceding three years relative to the S&P EPAC SmallCap Index.
The Vanguard Group manages the cash reserves of the fund on an at-cost basis.
For the year ended October 31, 2014, the aggregate investment advisory fee represented an effective annual basic rate of 0.21% of the fund’s average net assets, before a decrease of $113,000 (0.00%) based on performance.
C. The Vanguard Group furnishes at cost corporate management, administrative, marketing, and distribution services. The costs of such services are allocated to the fund based on methods approved by the board of trustees. The fund has committed to invest up to 0.40% of its net assets in Vanguard. At October 31, 2014, the fund had contributed capital of $265,000 to Vanguard (included in Other Assets), representing 0.01% of the fund’s net assets and 0.11% of Vanguard’s capitalization. The fund’s trustees and officers are also directors and officers of Vanguard.
D. Various inputs may be used to determine the value of the fund’s investments. These inputs are summarized in three broad levels for financial statement purposes. The inputs or methodologies used to value securities are not necessarily an indication of the risk associated with investing in those securities.
Level 1—Quoted prices in active markets for identical securities.
Level 2—Other significant observable inputs (including quoted prices for similar securities, interest rates, prepayment speeds, credit risk, etc.).
Level 3—Significant unobservable inputs (including the fund’s own assumptions used to determine the fair value of investments).
The following table summarizes the market value of the fund’s investments as of October 31, 2014, based on the inputs used to value them:
| | | |
| | Level 1 | Level 2 | Level 3 |
| Investments | ($000) | ($000) | ($000) |
| Common Stocks | 14,591 | 2,466,063 | — |
| Temporary Cash Investments | 151,072 | 17,799 | — |
| Futures Contracts—Assets1 | 1,564 | — | — |
| Forward Currency Contracts—Assets | — | 266 | — |
| Forward Currency Contracts—Liabilities | — | (2,431) | — |
| Total | 167,227 | 2,481,697 | — |
| 1 Represents variation margin on the last day of the reporting period. |
28
International Explorer Fund
E. At October 31, 2014, the fair values of derivatives were reflected in the Statement of Net Assets as follows:
| | | |
| | | Foreign | |
| | Equity | Exchange | |
| | Contracts | Contracts | Total |
| Statement of Net Assets Caption | ($000) | ($000) | ($000) |
| Other Assets | 1,564 | 266 | 1,830 |
| Liabilities | — | (2,431) | (2,431) |
Realized net gain (loss) and the change in unrealized appreciation (depreciation) on derivatives for the year ended October 31, 2014, were:
| | | |
| | | Foreign | |
| | Equity | Exchange | |
| | Contracts | Contracts | Total |
| Realized Net Gain (Loss) on Derivatives | ($000) | ($000) | ($000) |
| Futures Contracts | 4,034 | — | 4,034 |
| Forward Currency Contracts | — | (2,836) | (2,836) |
| Realized Net Gain (Loss) on Derivatives | 4,034 | (2,836) | 1,198 |
| |
| Change in Unrealized Appreciation (Depreciation) on Derivatives | | | |
| Futures Contracts | (915) | — | (915) |
| Forward Currency Contracts | — | (2,987) | (2,987) |
| Change in Unrealized Appreciation (Depreciation) on Derivatives | (915) | (2,987) | (3,902) |
At October 31, 2014, the aggregate settlement value of open futures contracts and the related unrealized appreciation (depreciation) were:
| | | | |
| | | | | ($000) |
| | | | Aggregate | |
| | | Number of | Settlement | Unrealized |
| | | Long (Short) | Value | Appreciation |
| Futures Contracts | Expiration | Contracts | Long (Short) | (Depreciation) |
| Topix Index | December 2014 | 180 | 21,467 | 1,350 |
| Dow Jones EURO STOXX 50 Index | December 2014 | 443 | 17,212 | 214 |
| S&P ASX 200 Index | December 2014 | 126 | 15,279 | 421 |
| FTSE 100 Index | December 2014 | 68 | 7,077 | (25) |
| | | | | 1,960 |
29
International Explorer Fund
Unrealized appreciation (depreciation) on open Dow Jones EURO STOXX 50 Index and FTSE 100 Index futures contracts is required to be treated as realized gain (loss) for tax purposes.
At October 31, 2014, the fund had open forward currency contracts to receive and deliver currencies as follows. Unrealized appreciation (depreciation) on open forward currency contracts is treated as realized gain (loss) for tax purposes.
| | | | | | |
| | | | | | | Unrealized |
| | Contract | | | | | Appreciation |
| | Settlement | | | Contract Amount (000) | (Depreciation) |
| Counterparty | Date | | Receive | | Deliver | ($000) |
| BNP Paribas | 12/16/14 | JPY | 1,726,157 | USD | 16,239 | (863) |
| BNP Paribas | 12/24/14 | EUR | 11,217 | USD | 14,552 | (491) |
| BNP Paribas | 12/23/14 | AUD | 15,510 | USD | 13,910 | (313) |
| Deutsche Bank A.G. | 12/16/14 | JPY | 956,690 | USD | 8,959 | (437) |
| Goldman Sachs International | 12/24/14 | EUR | 5,697 | USD | 7,297 | (155) |
| UBS AG | 12/24/14 | GBP | 4,236 | USD | 6,905 | (131) |
| UBS AG | 12/23/14 | AUD | 7,039 | USD | 6,159 | 11 |
| Deutsche Bank A.G. | 12/24/14 | GBP | 1,883 | USD | 3,042 | (31) |
| Bank of America, N.A. | 12/24/14 | USD | 3,792 | EUR | 2,951 | 92 |
| Bank of America, N.A. | 12/16/14 | USD | 3,627 | JPY | 394,950 | 109 |
| Goldman Sachs International | 12/23/14 | USD | 2,494 | AUD | 2,855 | (8) |
| Bank of America, N.A. | 12/23/14 | USD | 2,172 | AUD | 2,445 | 29 |
| Bank of America, N.A. | 12/24/14 | USD | 1,338 | GBP | 821 | 25 |
| Deutsche Bank A.G. | 12/24/14 | USD | 1,216 | GBP | 762 | (2) |
| | | | | | | (2,165) |
| AUD—Australian dollar. | | | | | | |
| EUR—Euro. | | | | | | |
| GBP—British pound. | | | | | | |
| JPY—Japanese yen. | | | | | | |
| USD—U.S. dollar. | | | | | | |
F. Distributions are determined on a tax basis and may differ from net investment income and realized capital gains for financial reporting purposes. Differences may be permanent or temporary. Permanent differences are reclassified among capital accounts in the financial statements to reflect their tax character. Temporary differences arise when certain items of income, expense, gain, or loss are recognized in different periods for financial statement and tax purposes; such differences are primarily attributed to the tax treatment of unrealized appreciation on passive foreign investment companies. These differences will reverse at some time in the future. Differences in classification may also result from the treatment of short-term gains as ordinary income for tax purposes.
30
International Explorer Fund
During the year ended October 31, 2014, the fund realized net foreign currency losses of $542,000 which decreased distributable net income for tax purposes; accordingly, such losses have been reclassified from accumulated net realized gains to undistributed net investment income. Certain of the fund’s investments are in securities considered to be passive foreign investment companies, for which any unrealized appreciation and/or realized gains are required to be included in distributable net income for tax purposes. During the year ended October 31, 2014, the fund realized gains on the sale of passive foreign investment companies of $3,821,000, which have been included in current and prior periods’ taxable income; accordingly, such gains have been reclassified from accumulated net realized gains to undistributed net investment income. Passive foreign investment companies held at October 31, 2014, had unrealized appreciation of $24,809,000 at October 31, 2014.
The fund used a tax accounting practice to treat a portion of the price of capital shares redeemed during the year as distributions from net investment income and realized capital gains. Accordingly, the fund has reclassified $3,694,000 from undistributed net investment income, and $12,701,000 from accumulated net realized gains, to paid-in capital.
For tax purposes, at October 31, 2014, the fund had $68,681,000 of ordinary income and $126,970,000 of long-term capital gains available for distribution.
At October 31, 2014, the cost of investment securities for tax purposes was $2,346,897,000.
Net unrealized appreciation of investment securities for tax purposes was $302,628,000, consisting of unrealized gains of $472,639,000 on securities that had risen in value since their purchase and $170,011,000 in unrealized losses on securities that had fallen in value since their purchase.
G. During the year ended October 31, 2014, the fund purchased $1,312,431,000 of investment securities and sold $944,558,000 of investment securities, other than temporary cash investments.
H. Capital shares issued and redeemed were:
| | |
| | Year Ended October 31, |
| | 2014 | 2013 |
| | Shares | Shares |
| | (000) | (000) |
| Issued | 34,696 | 22,030 |
| Issued in Lieu of Cash Distributions | 4,589 | 3,141 |
| Redeemed | (20,296) | (27,321) |
| Net Increase (Decrease) in Shares Outstanding | 18,989 | (2,150) |
I. Management has determined that no material events or transactions occurred subsequent to October 31, 2014, that would require recognition or disclosure in these financial statements.
31
Report of Independent Registered
Public Accounting Firm
To the Board of Trustees of Vanguard Whitehall Funds and the Shareholders of Vanguard International Explorer Fund:
In our opinion, the accompanying statement of net assets and the related statements of operations and of changes in net assets and the financial highlights present fairly, in all material respects, the financial position of Vanguard International Explorer Fund (constituting a separate portfolio of Vanguard Whitehall Funds, hereafter referred to as the “Fund”) at October 31, 2014, the results of its operations for the year then ended, the changes in its net assets for each of the two years in the period then ended, and the financial highlights for each of the five years in the period then ended, in conformity with accounting principles generally accepted in the United States of America. These financial statements and financial highlights (hereafter referred to as “financial statements”) are the responsibility of the Fund’s management. Our responsibility is to express an opinion on these financial statements based on our audits. We conducted our audits of these financial statements in accordance with the standards of the Public Company Accounting Oversight Board (United States). Those standards require that we plan and perform the audit to obtain reasonable assurance about whether the financial statements are free of material misstatement. An audit includes examining, on a test basis, evidence supporting the amounts and disclosures in the financial statements, assessing the accounting principles used and significant estimates made by management, and evaluating the overall financial statement presentation. We believe that our audits, which included confirmation of securities at October 31, 2014 by correspondence with the custodians and brokers, by agreement to the underlying ownership records of the transfer agent and the application of alternative auditing procedures where securities purchased had not been received, provide a reasonable basis for our opinion.
/s/PricewaterhouseCoopers LLP
Philadelphia, Pennsylvania
December 16, 2014
| |
| Special 2014 tax information (unaudited) for Vanguard International Explorer Fund |
This information for the fiscal year ended October 31, 2014, is included pursuant to provisions of the Internal Revenue Code.
The fund distributed $29,376,000 as capital gain dividends (from net long-term capital gains) to shareholders during the fiscal year.
For nonresident alien shareholders, 100% of short-term capital gain dividends distributed by the fund are qualified short-term capital gains.
The fund distributed $35,343,000 of qualified dividend income to shareholders during the fiscal year.
The fund designates to shareholders foreign source income of $52,986,000 and foreign taxes paid of $2,904,000. Shareholders will receive more detailed information with their Form 1099-DIV in January 2015 to determine the calendar-year amounts to be included on their 2014 tax returns.
32
Your Fund’s After-Tax Returns
This table presents returns for your fund both before and after taxes. The after-tax returns are shown in two ways: (1) assuming that an investor owned the fund during the entire period and paid taxes on the fund’s distributions, and (2) assuming that an investor paid taxes on the fund’s distributions and sold all shares at the end of each period.
Calculations are based on the highest individual federal income tax and capital gains tax rates in effect at the times of the distributions and the hypothetical sales. State and local taxes were not considered. After-tax returns reflect any qualified dividend income, using actual prior-year figures and estimates for 2014. (In the example, returns after the sale of fund shares may be higher than those assuming no sale. This occurs when the sale would have produced a capital loss. The calculation assumes that the investor received a tax deduction for the loss.)
Please note that your actual after-tax returns will depend on your tax situation and may differ from those shown. Also note that if you own the fund in a tax-deferred account, such as an individual retirement account or a 401(k) plan, this information does not apply to you. Such accounts are not subject to current taxes.
Finally, keep in mind that a fund’s performance—whether before or after taxes—does not guarantee future results.
| | | |
| Average Annual Total Returns: International Explorer Fund | | | |
| Periods Ended October 31, 2014 | | | |
| | One | Five | Ten |
| | Year | Years | Years |
| Returns Before Taxes | 2.66% | 9.11% | 8.40% |
| Returns After Taxes on Distributions | 1.47 | 8.54 | 7.32 |
| Returns After Taxes on Distributions and Sale of Fund Shares | 2.00 | 7.21 | 6.92 |
33
About Your Fund’s Expenses
As a shareholder of the fund, you incur ongoing costs, which include costs for portfolio management, administrative services, and shareholder reports (like this one), among others. Operating expenses, which are deducted from a fund’s gross income, directly reduce the investment return of the fund.
A fund’s expenses are expressed as a percentage of its average net assets. This figure is known as the expense ratio. The following examples are intended to help you understand the ongoing costs (in dollars) of investing in your fund and to compare these costs with those of other mutual funds. The examples are based on an investment of $1,000 made at the beginning of the period shown and held for the entire period.
The accompanying table illustrates your fund’s costs in two ways:
• Based on actual fund return. This section helps you to estimate the actual expenses that you paid over the period. The ”Ending Account Value“ shown is derived from the fund‘s actual return, and the third column shows the dollar amount that would have been paid by an investor who started with $1,000 in the fund. You may use the information here, together with the amount you invested, to estimate the expenses that you paid over the period.
To do so, simply divide your account value by $1,000 (for example, an $8,600 account value divided by $1,000 = 8.6), then multiply the result by the number given for your fund under the heading ”Expenses Paid During Period.“
• Based on hypothetical 5% yearly return. This section is intended to help you compare your fund‘s costs with those of other mutual funds. It assumes that the fund had a yearly return of 5% before expenses, but that the expense ratio is unchanged. In this case—because the return used is not the fund’s actual return—the results do not apply to your investment. The example is useful in making comparisons because the Securities and Exchange Commission requires all mutual funds to calculate expenses based on a 5% return. You can assess your fund’s costs by comparing this hypothetical example with the hypothetical examples that appear in shareholder reports of other funds.
Note that the expenses shown in the table are meant to highlight and help you compare ongoing costs only and do not reflect transaction costs incurred by the fund for buying and selling securities. Further, the expenses do not include any purchase, redemption, or account service fees described in the fund prospectus. If such fees were applied to your account, your costs would be higher. Your fund does not carry a “sales load.”
The calculations assume no shares were bought or sold during the period. Your actual costs may have been higher or lower, depending on the amount of your investment and the timing of any purchases or redemptions.
You can find more information about the fund’s expenses, including annual expense ratios, in the Financial Statements section of this report. For additional information on operating expenses and other shareholder costs, please refer to your fund’s current prospectus.
34
| | | |
| Six Months Ended October 31, 2014 | | | |
| |
| | Beginning | Ending | Expenses |
| | Account Value | Account Value | Paid During |
| International Explorer Fund | 4/30/2014 | 10/31/2014 | Period |
| Based on Actual Fund Return | $1,000.00 | $956.02 | $2.07 |
| Based on Hypothetical 5% Yearly Return | 1,000.00 | 1,023.09 | 2.14 |
| The calculations are based on expenses incurred in the most recent six-month period. The fund’s annualized six-month expense ratio for that period is 0.42%. The dollar amounts shown as “Expenses Paid” are equal to the annualized expense ratio multiplied by the average account value over the period, multiplied by the number of days in the most recent six-month period, then divided by the number of days in the most recent 12-month period. |
|
|
|
35
Trustees Approve Advisory Arrangements
The board of trustees of Vanguard International Explorer Fund has renewed the fund’s investment advisory arrangements with Schroder Investment Management North America Inc. (Schroder Inc.) and Wellington Management Company, LLP (Wellington Management), as well as a sub-advisory arrangement with Schroder Investment Management North America Limited (Schroder Ltd.).
The board determined that renewing the fund’s advisory arrangements was in the best interests of the fund and its shareholders.
The board based its decision upon an evaluation of each advisor’s investment staff, portfolio management process, and performance. The trustees considered the factors discussed below, among others. However, no single factor determined whether the board approved the arrangements. Rather, it was the totality of the circumstances that drove the board’s decision.
Nature, extent, and quality of services
The board considered the quality of the fund’s investment management services over both the short and long term, and took into account the organizational depth and stability of each advisor. The board noted the following:
Schroder. Schroders plc, the parent company of Schroder Inc. and Schroder Ltd. (collectively, Schroder), has existed for more than 200 years and has investment management experience dating to 1926. Schroder continues to employ a sound process, selecting attractive small-capitalization growth stocks from developed and emerging markets outside the United States. Schroder’s International Small-Cap Committee is responsible for the management of its portion of the fund. Stocks are selected using a bottom-up approach, supported by Schroder’s worldwide network of analysts, economists, and strategists. The firm has advised a portion of the fund since 1996.
Wellington Management. Wellington Management, founded in 1928, is among the nation’s oldest and most respected institutional investment managers. Wellington Management’s international small-cap team uses a traditional, bottom-up investment process that attempts to discover a company’s intrinsic value. In valuing a company, it believes that the same valuation metric should be applied on an industry-by-industry basis. Although the team’s valuation discipline is essential to the process, its philosophy is not biased toward growth or value as it invests in both extended growth opportunities and neglected or misunderstood companies. The firm has advised a portion of the fund since 2010.
The board concluded that each advisor’s experience, stability, depth, and performance, among other factors, warranted continuation of the advisory arrangements.
Investment performanceThe board considered the short- and long-term performance of the fund and each advisor, including any periods of outperformance or underperformance relative to a benchmark index and peer group. The board concluded that the performance was such that the advisory arrangements should continue. Information about the fund’s most recent performance can be found in the Performance Summary section of this report.Cost
The board concluded that the fund’s expense ratio was well below the average expense ratio charged by funds in its peer group and that the fund’s advisory fee rate was also well below its peer-group average. Information about the fund’s expense ratio appears in the About Your Fund’s Expenses section of this report as well as in the Financial Statements section, which also includes information about the fund’s advisory fee rate.
36
The board did not consider profitability of Schroder and Wellington Management in determining whether to approve the advisory fees, because the firms are independent of Vanguard, and the advisory fee is the result of arm’s-length negotiations.
The benefit of economies of scale
The board concluded that the fund’s shareholders benefit from economies of scale because of breakpoints in the advisory fee schedule for Schroder and Wellington Management. The breakpoints reduce the effective rate of the fee as the fund’s assets managed by each advisor increase.
The board will consider whether to renew the advisory arrangements again after a one-year period.
37
Glossary
Beta. A measure of the magnitude of a fund’s past share-price fluctuations in relation to the ups and downs of a given market index. The index is assigned a beta of 1.00. Compared with a given index, a fund with a beta of 1.20 typically would have seen its share price rise or fall by 12% when the index rose or fell by 10%. For this report, beta is based on returns over the past 36 months for both the fund and the index. Note that a fund’s beta should be reviewed in conjunction with its R-squared (see definition). The lower the R-squared, the less correlation there is between the fund and the index, and the less reliable beta is as an indicator of volatility.
Dividend Yield. Dividend income earned by stocks, expressed as a percentage of the aggregate market value (or of net asset value, for a fund). The yield is determined by dividing the amount of the annual dividends by the aggregate value (or net asset value) at the end of the period. For a fund, the dividend yield is based solely on stock holdings and does not include any income produced by other investments.
Earnings Growth Rate. The average annual rate of growth in earnings over the past five years for the stocks now in a fund.
Equity Exposure. A measure that reflects a fund’s investments in stocks and stock futures. Any holdings in short-term reserves are excluded.
Expense Ratio. A fund’s total annual operating expenses expressed as a percentage of the fund’s average net assets. The expense ratio includes management and administrative expenses, but does not include the transaction costs of buying and selling portfolio securities.
Inception Date. The date on which the assets of a fund (or one of its share classes) are first invested in accordance with the fund’s investment objective. For funds with a subscription period, the inception date is the day after that period ends. Investment performance is measured from the inception date.
Median Market Cap. An indicator of the size of companies in which a fund invests; the midpoint of market capitalization (market price x shares outstanding) of a fund’s stocks, weighted by the proportion of the fund’s assets invested in each stock. Stocks representing half of the fund’s assets have market capitalizations above the median, and the rest are below it.
Price/Book Ratio. The share price of a stock divided by its net worth, or book value, per share. For a fund, the weighted average price/book ratio of the stocks it holds.
Price/Earnings Ratio. The ratio of a stock’s current price to its per-share earnings over the past year. For a fund, the weighted average P/E of the stocks it holds. P/E is an indicator of market expectations about corporate prospects; the higher the P/E, the greater the expectations for a company’s future growth.
R-Squared. A measure of how much of a fund’s past returns can be explained by the returns from the market in general, as measured by a given index. If a fund’s total returns were precisely synchronized with an index’s returns, its R-squared would be 1.00. If the fund’s returns bore no relationship to the index’s returns, its R-squared would be 0. For this report, R-squared is based on returns over the past 36 months for both the fund and the index.
38
Return on Equity. The annual average rate of return generated by a company during the past five years for each dollar of shareholder’s equity (net income divided by shareholder’s equity). For a fund, the weighted average return on equity for the companies whose stocks it holds.
Short-Term Reserves. The percentage of a fund invested in highly liquid, short-term securities that can be readily converted to cash.
Turnover Rate. An indication of the fund’s trading activity. Funds with high turnover rates incur higher transaction costs and may be more likely to distribute capital gains (which may be taxable to investors). The turnover rate excludes in-kind transactions, which have minimal impact on costs.
39
The People Who Govern Your Fund
The trustees of your mutual fund are there to see that the fund is operated and managed in your best interests since, as a shareholder, you are a part owner of the fund. Your fund’s trustees also serve on the board of directors of The Vanguard Group, Inc., which is owned by the Vanguard funds and provides services to them on an at-cost basis.
A majority of Vanguard’s board members are independent, meaning that they have no affiliation with Vanguard or the funds they oversee, apart from the sizable personal investments they have made as private individuals. The independent board members have distinguished backgrounds in business, academia, and public service. Each of the trustees and executive officers oversees 177 Vanguard funds.
The following table provides information for each trustee and executive officer of the fund. More information about the trustees is in the Statement of Additional Information, which can be obtained, without charge, by contacting Vanguard at 800-662-7447, or online at vanguard.com.
| |
| InterestedTrustee1 | and Delphi Automotive LLP (automotive components); |
| Senior Advisor at New Mountain Capital. |
| F. William McNabb III | |
| Born 1957. Trustee Since July 2009. Chairman of the | Amy Gutmann |
| Board. Principal Occupation(s) During the Past Five | Born 1949. Trustee Since June 2006. Principal |
| Years: Chairman of the Board of The Vanguard Group, | Occupation(s) During the Past Five Years: President of |
| Inc., and of each of the investment companies served | the University of Pennsylvania; Christopher H. Browne |
| by The Vanguard Group, since January 2010; Director | Distinguished Professor of Political Science, School of |
| of The Vanguard Group since 2008; Chief Executive | Arts and Sciences, and Professor of Communication, |
| Officer and President of The Vanguard Group, and of | Annenberg School for Communication, with secondary |
| each of the investment companies served by The | faculty appointments in the Department of Philosophy, |
| Vanguard Group, since 2008; Director of Vanguard | School of Arts and Sciences, and at the Graduate |
| Marketing Corporation; Managing Director of The | School of Education, University of Pennsylvania; |
| Vanguard Group (1995–2008). | Trustee of the National Constitution Center; Chair |
| of the Presidential Commission for the Study of |
| IndependentTrustees | Bioethical Issues. |
| |
| Emerson U. Fullwood | JoAnn Heffernan Heisen |
| Born 1948. Trustee Since January 2008. Principal | Born 1950. Trustee Since July 1998. Principal |
| Occupation(s) During the Past Five Years: Executive | Occupation(s) During the Past Five Years: Corporate |
| Chief Staff and Marketing Officer for North America | Vice President and Chief Global Diversity Officer |
| and Corporate Vice President (retired 2008) of Xerox | (retired 2008) and Member of the Executive |
| Corporation (document management products and | Committee (1997–2008) of Johnson & Johnson |
| services); Executive in Residence and 2009–2010 | (pharmaceuticals/medical devices/consumer |
| Distinguished Minett Professor at the Rochester | products); Director of Skytop Lodge Corporation |
| Institute of Technology; Director of SPX Corporation | (hotels), the University Medical Center at Princeton, |
| (multi-industry manufacturing), the United Way of | the Robert Wood Johnson Foundation, and the Center |
| Rochester, Amerigroup Corporation (managed health | for Talent Innovation; Member of the Advisory Board |
| care), the University of Rochester Medical Center, | of the Maxwell School of Citizenship and Public Affairs |
| Monroe Community College Foundation, and North | at Syracuse University. |
| Carolina A&T University. | |
| F. Joseph Loughrey |
| Rajiv L. Gupta | Born 1949. Trustee Since October 2009. Principal |
| Born 1945. Trustee Since December 2001.2 | Occupation(s) During the Past Five Years: President |
| Principal Occupation(s) During the Past Five Years: | and Chief Operating Officer (retired 2009) of Cummins |
| Chairman and Chief Executive Officer (retired 2009) | Inc. (industrial machinery); Chairman of the Board |
| and President (2006–2008) of Rohm and Haas Co. | of Hillenbrand, Inc. (specialized consumer services), |
| (chemicals); Director of Tyco International, Ltd. | and of Oxfam America; Director of SKF AB (industrial |
| (diversified manufacturing and services), Hewlett- | machinery), Hyster-Yale Materials Handling, Inc. |
| Packard Co. (electronic computer manufacturing), | (forklift trucks), the Lumina Foundation for Education, |
| | |
| | |
| and the V Foundation for Cancer Research; Member | Executive Officers | |
| of the Advisory Council for the College of Arts and |
| Letters and of the Advisory Board to the Kellogg | Glenn Booraem |
| Institute for International Studies, both at the | Born 1967. Controller Since July 2010. Principal |
| University of Notre Dame. | Occupation(s) During the Past Five Years: Principal |
| of The Vanguard Group, Inc.; Controller of each of |
| Mark Loughridge | the investment companies served by The Vanguard |
| Born 1953. Trustee Since March 2012. Principal | Group; Assistant Controller of each of the investment |
| Occupation(s) During the Past Five Years: Senior Vice | companies served by The Vanguard Group (2001–2010). |
| President and Chief Financial Officer (retired 2013) |
| at IBM (information technology services); Fiduciary | Thomas J. Higgins |
| Member of IBM’s Retirement Plan Committee (2004– | Born 1957. Chief Financial Officer Since September |
| 2013); Member of the Council on Chicago Booth. | 2008. Principal Occupation(s) During the Past Five |
| Years: Principal of The Vanguard Group, Inc.; Chief |
| Scott C. Malpass | Financial Officer of each of the investment companies |
| Born 1962. Trustee Since March 2012. Principal | served by The Vanguard Group; Treasurer of each of |
| Occupation(s) During the Past Five Years: Chief | the investment companies served by The Vanguard |
| Investment Officer and Vice President at the University | Group (1998–2008). |
| of Notre Dame; Assistant Professor of Finance at the |
| Mendoza College of Business at Notre Dame; Member | Kathryn J. Hyatt |
| of the Notre Dame 403(b) Investment Committee; | Born 1955. Treasurer Since November 2008. Principal |
| Board Member of TIFF Advisory Services, Inc. | Occupation(s) During the Past Five Years: Principal of |
| (investment advisor); Member of the Investment | The Vanguard Group, Inc.; Treasurer of each of the |
| Advisory Committees of the Financial Industry | investment companies served by The Vanguard |
| Regulatory Authority (FINRA) and of Major League | Group; Assistant Treasurer of each of the investment |
| Baseball. | companies served by The Vanguard Group (1988–2008). |
| |
| André F. Perold | Heidi Stam |
| Born 1952. Trustee Since December 2004. Principal | Born 1956. Secretary Since July 2005. Principal |
| Occupation(s) During the Past Five Years: George | Occupation(s) During the Past Five Years: Managing |
| Gund Professor of Finance and Banking, Emeritus | Director of The Vanguard Group, Inc.; General Counsel |
| at the Harvard Business School (retired 2011); | of The Vanguard Group; Secretary of The Vanguard |
| Chief Investment Officer and Managing Partner of | Group and of each of the investment companies |
| HighVista Strategies LLC (private investment firm); | served by The Vanguard Group; Director and Senior |
| Director of Rand Merchant Bank; Overseer of the | Vice President of Vanguard Marketing Corporation. |
| Museum of Fine Arts Boston. | | |
| | Vanguard Senior ManagementTeam |
| Alfred M. Rankin, Jr. | | |
| Born 1941. Trustee Since January 1993. Principal | Mortimer J. Buckley | Chris D. McIsaac |
| Occupation(s) During the Past Five Years: Chairman, | Kathleen C. Gubanich | Michael S. Miller |
| President, and Chief Executive Officer of NACCO | Paul A. Heller | James M. Norris |
| Industries, Inc. (housewares/lignite), and of Hyster- | Martha G. King | Glenn W. Reed |
| Yale Materials Handling, Inc. (forklift trucks); Chairman | John T. Marcante |
| of the Board of University Hospitals of Cleveland. |
| | Chairman Emeritus and Senior Advisor |
| Peter F. Volanakis | | |
| Born 1955. Trustee Since July 2009. Principal | John J. Brennan |
| Occupation(s) During the Past Five Years: President | Chairman, 1996–2009 |
| and Chief Operating Officer (retired 2010) of Corning | Chief Executive Officer and President, 1996–2008 |
| Incorporated (communications equipment); Trustee of |
| Colby-Sawyer College; Member of the Advisory Board | Founder |
| of the Norris Cotton Cancer Center and of the Advisory |
| Board of the Parthenon Group (strategy consulting). | John C. Bogle |
| Chairman and Chief Executive Officer, 1974–1996 |
| | |
1 Mr. McNabb is considered an “interested person,” as defined in the Investment Company Act of 1940, because he is an officer of the Vanguard funds.
2 December 2002 for Vanguard Equity Income Fund, the Vanguard Municipal Bond Funds, and the Vanguard State Tax-Exempt Funds.
|  |
| | P.O. Box 2600 |
| | Valley Forge, PA 19482-2600 |
| |
| |
| |
| Connect with Vanguard® > vanguard.com | |
| |
| |
| |
| Fund Information > 800-662-7447 | |
| Direct Investor Account Services > 800-662-2739 | |
| Institutional Investor Services > 800-523-1036 | |
| Text Telephone for People | |
| Who Are Deaf or Hard of Hearing> 800-749-7273 | |
| |
| This material may be used in conjunction | |
| with the offering of shares of any Vanguard | |
| fund only if preceded or accompanied by | |
| the fund’s current prospectus. | |
| |
| All comparative mutual fund data are from Lipper, a | |
| Thomson Reuters Company, or Morningstar, Inc., unless | |
| otherwise noted. | |
| |
| You can obtain a free copy of Vanguard’s proxy voting | |
| guidelines by visiting vanguard.com/proxyreporting or by | |
| calling Vanguard at 800-662-2739. The guidelines are | |
| also available from the SEC’s website, sec.gov. In | |
| addition, you may obtain a free report on how your fund | |
| voted the proxies for securities it owned during the 12 | |
| months ended June 30. To get the report, visit either | |
| vanguard.com/proxyreporting or sec.gov. | |
| |
| You can review and copy information about your fund at | |
| the SEC’s Public Reference Room in Washington, D.C. To | |
| find out more about this public service, call the SEC at | |
| 202-551-8090. Information about your fund is also | |
| available on the SEC’s website, and you can receive | |
| copies of this information, for a fee, by sending a | |
| request in either of two ways: via e-mail addressed to | |
| publicinfo@sec.gov or via regular mail addressed to the | |
| Public Reference Section, Securities and Exchange | |
| Commission, Washington, DC 20549-1520. | |
| |
| | © 2014 The Vanguard Group, Inc. |
| | All rights reserved. |
| | Vanguard Marketing Corporation, Distributor. |
| |
| | Q1260 122014 |

Annual Report | October 31, 2014
Vanguard Mid-Cap Growth Fund
The mission continues
On May 1, 1975, Vanguard began operations, a fledgling company based on the simple but revolutionary idea that a mutual fund company should be managed solely in the interest of its investors.
Four decades later, that revolutionary spirit continues to animate the enterprise. Vanguard remains on a mission to give investors the best chance of investment success.
As we mark our 40th anniversary, we thank you for entrusting your assets to Vanguard and giving us the opportunity to help you reach your financial goals in the decades to come.
| |
| Contents | |
| Your Fund’s Total Returns. | 1 |
| Chairman’s Letter. | 2 |
| Advisors’ Report. | 7 |
| Fund Profile. | 11 |
| Performance Summary. | 12 |
| Financial Statements. | 14 |
| Your Fund’s After-Tax Returns. | 25 |
| About Your Fund’s Expenses. | 26 |
| Glossary. | 28 |
Please note: The opinions expressed in this report are just that—informed opinions. They should not be considered promises or advice.Also, please keep in mind that the information and opinions cover the period through the date on the front of this report. Of course, therisks of investing in your fund are spelled out in the prospectus.See the Glossary for definitions of investment terms used in this report.About the cover: Since our founding, Vanguard has drawn inspiration from the enterprise and valor demonstrated by British
naval hero Horatio Nelson and his command at the Battle of the Nile in 1798. The photograph displays a replica of a merchant
ship from the same era as Nelson’s flagship, the HMS Vanguard.
Your Fund’s Total Returns
| |
| Fiscal Year Ended October 31, 2014 | |
| |
| | Total |
| | Returns |
| Vanguard Mid-Cap Growth Fund | 13.42% |
| Russell Midcap Growth Index | 14.59 |
| Mid-Cap Growth Funds Average | 10.18 |
| Mid-Cap Growth Funds Average: Derived from data provided by Lipper, a Thomson Reuters Company. |
Your Fund’s Performance at a Glance
October 31, 2013, Through October 31, 2014
| | | | |
| | | | Distributions Per Share |
| | Starting | Ending | | |
| | Share | Share | Income | Capital |
| | Price | Price | Dividends | Gains |
| Vanguard Mid-Cap Growth Fund | $25.72 | $26.40 | $0.007 | $2.492 |
1

Chairman’s Letter
Dear Shareholder,
The Mid-Cap Growth Fund returned about 13% for the fiscal year, a satisfactory outcome but one that trailed the benchmark Russell Midcap Growth Index by more than 1 percentage point. The fund surpassed the average return of about 10% notched by its mid-capitalization growth peers.
An outstanding performance in the consumer staples sector wasn’t enough to overcome weaker results in health care and consumer discretionary.
If you own shares of the fund in a taxable account, you may wish to review the information about after-tax returns presented later in this report.
Their smooth ride turned jagged, but U.S. stocks ended higher
Punctuated by a roller coaster of an October, the broad U.S. stock market returned about 16% for the 12 months ended October 31.
Impressive corporate earnings and various global stimulus measures generally supported stocks against a bleaker backdrop that included tensions in the Middle East and Ukraine and other international economic concerns. But over the first two weeks of October, stocks declined sharply as investors reacted to weakness in the global economy, especially the slowdown in China and the threat of deflation in Europe. Reflecting confidence in the U.S. economy, however, the Federal
2
Reserve announced October 29 that it was ending its stimulative bond-buying program as anticipated.
U.S. stocks staged an impressive rebound in the period’s final two weeks, and several major indexes finished at record highs. International stocks didn’t fare as well. Emerging markets posted a modest advance for the 12 months, and stocks from the developed markets of Europe and the Pacific region slipped.
Bonds posted positive returns as already low yields declined
The broad U.S. taxable bond market returned 4.14%. Bond prices, which backtracked at times over the summer, climbed in October as investors sought sanctuary from stock market volatility.
Overall, bond returns have been strong despite many analysts’ expectations that already low yields wouldn’t decline further. Prices rose and yields fell even as the Fed began steadily reducing its bond purchases in January. (Bond prices and yields move in opposite directions.) The yield of the 10-year U.S. Treasury note ended October at 2.31%, down from 2.54% a year earlier.
Municipal bonds returned 7.82%, with tax-exempt issues in high demand at a time of reduced supply.
International bond markets (as measured by the Barclays Global Aggregate Index ex USD) slid in September and October en route to a –2.53% return for the 12 months.
| | | |
| Market Barometer | | | |
| |
| | | Average Annual Total Returns |
| | | Periods Ended October 31, 2014 |
| | One | Three | Five |
| | Year | Years | Years |
| Stocks | | | |
| Russell 1000 Index (Large-caps) | 16.78% | 19.90% | 16.98% |
| Russell 2000 Index (Small-caps) | 8.06 | 18.18 | 17.39 |
| Russell 3000 Index (Broad U.S. market) | 16.07 | 19.77 | 17.01 |
| FTSE All-World ex US Index (International) | 0.45 | 8.07 | 6.38 |
| |
| Bonds | | | |
| Barclays U.S. Aggregate Bond Index (Broad taxable market) | 4.14% | 2.73% | 4.22% |
| Barclays Municipal Bond Index (Broad tax-exempt market) | 7.82 | 4.93 | 5.26 |
| Citigroup Three-Month U.S. Treasury Bill Index | 0.04 | 0.04 | 0.06 |
| |
| CPI | | | |
| Consumer Price Index | 1.66% | 1.60% | 1.89% |
3
The Fed’s target for short-term interest rates remained at 0%–0.25%, restraining returns for money market funds and savings accounts.
Mid-cap growth stocks climbed although their ascent slowed
The mid-cap harvest wasn’t quite as bountiful as in the recent past. Although they delivered double-digit returns, mid-caps failed to produce the outsize rewards of just a year ago. However, they also didn’t deteriorate in the same manner as small-caps, which were deemed overvalued by the market.
Vanguard Mid-Cap Growth Fund’s two advisors found outstanding opportunities in certain industry sectors but missed out in others. In some instances, the fund’s investments weren’t aligned with industry developments. At the period’s end, as is sometimes the case, the portfolio’s returns in a handful of sectors bore little resemblance to those of the benchmark.
On the positive side, the lightly held consumer staples sector provided some of the fund’s great successes. New items and expanded prospects in the food products industry drove the sector’s gains of about 57%, and the fund was well-positioned to benefit.
Results were mixed for the health care sector. The fund’s health care stocks increased about 17% and accounted for about 3 percentage points of return. The advisors’ exposure to the sector was adequate, but their stock selection was
| | |
| Expense Ratios | | |
| Your Fund Compared With Its Peer Group | | |
| | | Peer Group |
| | Fund | Average |
| Mid-Cap Growth Fund | 0.51% | 1.30% |
The fund expense ratio shown is from the prospectus dated February 25, 2014, and represents estimated costs for the current fiscal year. Forthe fiscal year ended October 31, 2014, the fund’s expense ratio was 0.46%. The peer-group expense ratio is derived from data provided byLipper, a Thomson Reuters Company, and captures information through year-end 2013.Peer group: Mid-Cap Growth Funds.4
subpar. The Russell Midcap Growth Index’s health care stocks returned about 33%. Amid pockets of strength, the fund had little or no exposure to some of the leading biotechnology, pharmaceutical, and instrument manufacturing companies.
The fund’s top contributor was information technology. Certain semiconductor, communications equipment, and electronic components companies shined and balanced out weaker results among software, hardware, internet, and IT services firms.
Although the fund had little exposure to the struggling energy sector, energy holdings put a dent in results. The fund’s stocks returned about –11%, declining twice as much as those held by the benchmark. The consumer discretionary sector, the fund’s largest, was also more foe than friend; the fund’s stocks in this sector returned about 9%, more than 2 percentage points below their benchmark counterpart.
You can find more information on the fund’s positioning and performance in the Advisors’ Report that follows this letter.
The fund’s long-term record reflects the advisors’ ability
The Mid-Cap Growth Fund’s advisors, Chartwell Investment Partners and William Blair & Company, seek to invest in mid-cap U.S. companies with long-term growth potential. Both advisors focus on companies with strong management teams and competitive advantages in the marketplace.
| |
| Total Returns | |
| Ten Years Ended October 31, 2014 | |
| | Average |
| | Annual Return |
| Mid-Cap Growth Fund | 10.57% |
| Russell Midcap Growth Index | 10.17 |
| Mid-Cap Growth Funds Average | 8.64 |
| Mid-Cap Growth Funds Average: Derived from data provided by Lipper, a Thomson Reuters Company. |
The figures shown represent past performance, which is not a guarantee of future results. (Current performance may be
lower or higher than the performance data cited. For performance data current to the most recent month-end, visit our
website at vanguard.com/performance.) Note, too, that both investment returns and principal value can fluctuate widely, so
an investor’s shares, when sold, could be worth more or less than their original cost.5
The fund’s ten-year record reflects the advisors’ ability and knowledge.
For the decade ended October 31, 2014, the Mid-Cap Growth Fund posted an average annualized return of 10.57%. Its benchmark index (which bears no expenses) returned 10.17%, and its peer group 8.64%.
In addition to the experience and skill of its advisors, the fund is helped by its low costs, which allow you to retain a larger share of its return.
When market volatility heats up, the best response is to stay cool
After several years of strength, stocks hit a rough patch toward the close of the fiscal year, as I noted earlier. For the first half of October, global stock markets (as measured by the FTSE Global All Cap Index) returned –5.56%. Though stocks rebounded in the second half of the month, many investors undoubtedly were left feeling unsettled.
What’s my best advice to anxious shareholders? Remain calm and remember that volatility is a normal part of stock market investing. The value of keeping a cool head is highlighted in a Vanguard research paper that looked at how investors behaved during the financial crisis, when global stocks declined about 58% and U.S. stocks about 55%.
The 2010 paper, Resilience in Volatile Markets: 401(k) Participant Behavior, September 2007–December 2009, examined the behavior of participants in Vanguard-administered retirement plans. During that time, about three-quarters of participants made no changes to their accounts and only 3% gave up on stocks completely.
As stocks recovered, this discipline yielded big benefits. From the end of 2008 to the end of 2013, the average Vanguard 401(k) portfolio nearly doubled in value, largely because of the surge in stock prices.
I’m pleased that, over time, our clients have demonstrated an impressive ability to remain focused on their long-term goals. They stayed the course through the 1987 correction, the dot-com boom of the 1990s, and the more recent financial crisis, and they continue to do so today.
As always, thank you for investing with Vanguard.
Sincerely,

F. William McNabb III
Chairman and Chief Executive Officer
November 13, 2014
6
Advisors’ Report
During the fiscal year ended October 31, 2014, Vanguard Mid-Cap Growth Fund returned 13.42%. Your fund is managed by two independent advisors, a strategy that enhances the fund’s diversification by providing exposure to distinct yet complementary investment approaches. It’s not uncommon for different advisors to have different views about individual securities or the broader investment environment.
The advisors, the percentage of fund assets each manages, and brief descriptions of their investment strategies are presented in the table below. The advisors have also prepared a discussion of the investment environment that existed during the fiscal year and of how their portfolio positioning reflects this assessment. These comments were prepared on November 19, 2014.
Chartwell Investment Partners, Inc.
Portfolio Managers:
Edward N. Antoian, CFA, CPA,
Managing Partner
John A. Heffern, Managing Partner and
Senior Portfolio Manager
The financial markets rallied over the last 12 months, but beneath the surface the economic environment remained uncertain and the markets turbulent. Sluggish global growth and flaring regional geopolitical
Vanguard Mid-Cap Growth Fund Investment Advisors
| | | | |
| | Fund Assets Managed | | |
| Investment Advisor | % | $ Million | | Investment Strategy |
| Chartwell Investment Partners, | 49 | 1,628 | | Uses a bottom-up, fundamental, research-driven |
| Inc. | | | | stock-selection strategy focusing on companies with |
| | | | | sustainable growth, strong management teams, |
| | | | | competitive positions, and outstanding product and |
| | | | | service offerings. These companies should continually |
| | | | | demonstrate growth in earnings per share. |
| William Blair & Company, L.L.C. | 48 | 1,604 | | Uses a fundamental investment approach in pursuit of |
| | | | | superior long-term investment results from |
| | | | | growth-oriented companies with leadership positions |
| | | | | and strong market presence. |
| Cash Investments | 3 | 87 | | These short-term reserves are invested by Vanguard in |
| | | | | equity index products to simulate investment in stocks. |
| | | | | Each advisor may also maintain a modest cash |
| | | | | position. |
7
tensions conspired to erode investor confidence. Domestically, underlying economic data signaled continued healing and, as widely expected, the Federal Reserve announced the end of its asset purchase program.
More than ever, stock selection seems central to investment performance. Accordingly, we are navigating these uncertain times with a portfolio focused on mid-cap companies that demonstrate above-average growth potential supported by good products and expanding markets. This approach leads to decisions that steadfastly reflect our bias toward quality, leadership, defensible margins, and a pattern of successful execution around growth-oriented business models.
Selection was successful in particular among technology, industrial, and consumer stocks. NXP Semiconductors, a broad-based industrial and mixed-signal semiconductor company, benefited from strong quarterly results, growing awareness of payment-card security, and the near-field communication payment capability of the newest iPhone.
Analog semiconductor company Avago Technologies is in the midst of several strong product cycles in the mobile handset, data center, and industrial markets. Increasing radio frequency filter content in premium smartphones, new content on the iPhone, and growing optical demand generated better-than-expected earnings. Recent acquisitions will also be significantly accretive to 2015 and beyond.
Rental and equipment provider United Rentals advanced after reporting solid financial performance driven by volume and pricing gains. Additionally, the company executed its share buyback plan, validating the maturity of its business model. Hertz Global Holdings, a provider of rental cars and equipment, attained strong results through solid pricing discipline, expense management, and synergies from its Dollar Thrifty Automotive Group acquisition.
Basic apparel company Hanesbrands reported solid organic results and progress integrating key acquisitions. We like its pattern of organic share gain, meaningful free cash flow, and accretive capital allocation. MGM Resorts International, which posted strong results, operates casinos and resorts, primarily in the United States and China. The Las Vegas market’s ongoing recovery has offset recent weakness in China.
The portfolio also benefited from our investment in Keurig Green Mountain. The personal beverage system maker’s stock advanced after the announcement of a ten-year Keurig Cold development partnership with Coca-Cola. The company also continues to convert unlicensed K-Cup manufacturers to the Keurig platform.
The health care sector detracted the most. Slower-than-expected earnings growth led to poor performance by Covance, a leading clinical research company. Medical device company Thoratec reported a disappointing second quarter and lowered its full-year
8
growth projection after experiencing slower market growth for a heart pump and loss of market share to a competitor.
Elsewhere, despite solid fundamentals, temporary staffing firm ManpowerGroup weakened as concerns over the health of European, Latin American, and Asian economies increased. Oil price declines pressured the stock of Whiting Petroleum. The company is about to complete its acquisition of Kodiak Oil & Gas, which will enhance the quality of its Bakken shale acreage and accelerate the development of this high-quality asset.
Informatica, a provider of business intelligence and analytics software, also underperformed. Sales force execution issues on large deals left the company unable to reaccelerate revenue to expected levels; its CFO was subsequently replaced.
William Blair & Company, L.L.C.
Portfolio Managers:
Robert C. Lanphier, Partner
David Ricci, CFA, Partner
After a strong finish to 2013, the stock market continued to advance in 2014. Its progress was fueled by positive domestic economic data, strong corporate earnings, continued accommodative policy from global central banks, and increased merger and acquisition activity. However, the positive 12-month return was not without volatility. Late in the first quarter, the Federal Reserve’s comments about the future trajectory of interest rates prompted a strong style rotation. From mid-March to May, the market turned away from higher-growth companies toward cheaper stocks with lower growth prospects.
With the exception of weakness in July resulting from geopolitical tensions, the market improved until late September. A sharp decline through mid-October can be attributed partly to heightened geopolitical risk and uncertainty about softness in European and Chinese economic data. Another factor was further speculation that the Federal Reserve could raise rates earlier than anticipated in 2015. During the second half of October, stocks rallied, reaching year-to-date highs, driven in part by a strong earnings season.
Our challenges during the year were related to stock selection augmented by style factors. Our biases toward higher-quality and higher-growth companies (and therefore higher-valuation stocks) hurt during the March-through-May market rotation away from higher-valuation stocks. In information technology, stock-specific weakness, including positions in Pandora Media and NeuStar, was exacerbated when our typical overweight to services industries and underweight to semiconductors worked against us.
Stock selection in consumer discretionary was also disappointing, and lululemon athletica, Dick’s Sporting Goods, and Fossil Group were among our largest detractors. However, Keurig Green Mountain was a standout in consumer staples. Other top contributors from a variety of sectors were O’Reilly Automotive in consumer
9
discretionary, Old Dominion Freight Line and TransDigm Group in industrials, and Akamai Technologies in information technology.
Looking ahead, risks to the U.S. economy and stock market emanate primarily from abroad. They include the evolving geopolitical landscape, weakness in Europe and China, and the implications of a strengthening U.S. dollar. In the United States, the most notable risk factor is Federal Reserve policy. Although economic data have generally been solid, underutiliza-tion of labor resources combined with low inflation have enabled the Fed to keep interest rate hikes on hold. However, uncertainty with respect to monetary policy timing could contribute to jittery markets.
Buffering these risks are a number of positives: strength in domestic capital expenditures, declining energy prices, an improving job market, and generally accommodative monetary policy outside of the United States.
We believe a continued slow, steady economic expansion and moderate market advance would better suit our style of investing than the unsustainably strong market of the past five years. With limited upside for ongoing multiple expansion, we would expect company-specific revenue growth drivers to be a critical determinant of future stock performance.
As always, we remain focused on identifying high-quality companies whose stocks trade at attractive valuations relative to the expected growth and consistency of the businesses. This discipline has enabled us to add value over the long term.
10
Mid-Cap Growth Fund
Fund Profile
As of October 31, 2014
| | | |
| Portfolio Characteristics | | |
| | | | DJ |
| | | | U.S. |
| | | Russell | Total |
| | | Midcap | Market |
| | | Growth | FA |
| | Fund | Index | Index |
| Number of Stocks | 124 | 552 | 3,756 |
| Median Market Cap | $8.1B | $11.9B | $47.3B |
| Price/Earnings Ratio | 27.0x | 28.1x | 20.4x |
| Price/Book Ratio | 3.9x | 5.1x | 2.7x |
| Return on Equity | 16.0% | 19.3% | 17.8% |
| Earnings Growth | | | |
| Rate | 20.7% | 18.3% | 15.7% |
| Dividend Yield | 0.7% | 1.0% | 1.9% |
| Foreign Holdings | 1.5% | 0.0% | 0.0% |
| Turnover Rate | 82% | — | — |
| Ticker Symbol | VMGRX | — | — |
| Expense Ratio1 | 0.51% | — | — |
| 30-Day SEC Yield | 0.21% | — | — |
| Short-Term Reserves | 3.9% | — | — |
| | | |
| Sector Diversification (% of equity exposure) |
| | | Russell | DJ |
| | | Midcap | U.S. Total |
| | | Growth | Market |
| | Fund | Index | FA Index |
| Consumer | | | |
| Discretionary | 21.5% | 23.3% | 12.5% |
| Consumer Staples | 5.2 | 7.8 | 8.3 |
| Energy | 3.3 | 6.1 | 8.5 |
| Financials | 14.1 | 9.3 | 17.7 |
| Health Care | 16.8 | 13.5 | 13.9 |
| Industrials | 16.6 | 16.2 | 11.3 |
| Information | | | |
| Technology | 18.1 | 17.9 | 18.8 |
| Materials | 2.0 | 4.7 | 3.6 |
| Telecommunication | | | |
| Services | 2.3 | 1.0 | 2.2 |
| Utilities | 0.1 | 0.2 | 3.2 |
| | |
| Volatility Measures | | |
| | Russell | DJ |
| | Midcap | U.S. Total |
| | Growth | Market |
| | Index | FA Index |
| R-Squared | 0.95 | 0.85 |
| Beta | 1.01 | 1.12 |
These measures show the degree and timing of the fund’s
fluctuations compared with the indexes over 36 months.
| | |
| Ten Largest Holdings (% of total net assets) |
| SBA Communications | Wireless | |
| Corp. | Telecommunication | |
| | Services | 2.2% |
| Vantiv Inc. | Data Processing & | |
| | Outsourced Services | 1.7 |
| Manpowergroup Inc. | Human Resource & | |
| | Employment | |
| | Services | 1.6 |
| BioMarin Pharmaceutical | | |
| Inc. | Biotechnology | 1.5 |
| O'Reilly Automotive Inc. | Automotive Retail | 1.5 |
| Stericycle Inc. | Environmental & | |
| | Facilities Services | 1.5 |
| Synovus Financial Corp. | Regional Banks | 1.5 |
| Akamai Technologies | Internet Software & | |
| Inc. | Services | 1.5 |
| Equifax Inc. | Research & | |
| | Consulting Services | 1.3 |
| Gartner Inc. | IT Consulting & | |
| | Other Services | 1.3 |
| Top Ten | | 15.6% |
The holdings listed exclude any temporary cash investments and
equity index products.
Investment Focus
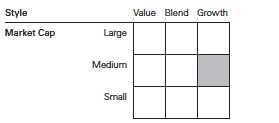
1 The expense ratio shown is from the prospectus dated February 25, 2014, and represents estimated costs for the current fiscal year. For the fiscal
year ended October 31, 2014, the expense ratio was 0.46%.
11
Mid-Cap Growth Fund
Performance Summary
All of the returns in this report represent past performance, which is not a guarantee of future results that may be achieved by the fund. (Current performance may be lower or higher than the performance data cited. For performance data current to the most recent month-end, visit our website at vanguard.com/performance.) Note, too, that both investment returns and principal value can fluctuate widely, so an investor’s shares, when sold, could be worth more or less than their original cost. The returns shown do not reflect taxes that a shareholder would pay on fund distributions or on the sale of fund shares.
Cumulative Performance: October 31, 2004, Through October 31, 2014
Initial Investment of $10,000

| | | | | |
| | | | Average Annual Total Returns | |
| | | Periods Ended October 31, 2014 | |
| | | | | | Final Value |
| | | One | Five | Ten | of a $10,000 |
| | | Year | Years | Years | Investment |
| | Mid-Cap Growth Fund* | 13.42% | 17.98% | 10.57% | $27,317 |
| •••••••• | Russell Midcap Growth Index | 14.59 | 18.73 | 10.17 | 26,338 |
| – – – – | Mid-Cap Growth Funds Average | 10.18 | 16.51 | 8.64 | 22,908 |
| | Dow Jones U.S. Total Stock Market | | | | |
| | Float Adjusted Index | 16.00 | 17.09 | 8.71 | 23,060 |
| Mid-Cap Growth Funds Average: Derived from data provided by Lipper, a Thomson Reuters Company. |
See Financial Highlights for dividend and capital gains information.
12
Mid-Cap Growth Fund
Fiscal-Year Total Returns (%): October 31, 2004, Through October 31, 2014

Average Annual Total Returns: Periods Ended September 30, 2014
This table presents returns through the latest calendar quarter—rather than through the end of the fiscal period.
Securities and Exchange Commission rules require that we provide this information.
| | | | |
| | Inception | One | Five | Ten |
| | Date | Year | Years | Years |
| Mid-Cap Growth Fund | 12/31/1997 | 11.38% | 16.08% | 10.63% |
13
Mid-Cap Growth Fund
Financial Statements
Statement of Net Assets
As of October 31, 2014
The fund reports a complete list of its holdings in regulatory filings four times in each fiscal year, at the quarter-ends. For the second and fourth fiscal quarters, the lists appear in the fund’s semiannual and annual reports to shareholders. For the first and third fiscal quarters, the fund files the lists with the Securities and Exchange Commission on Form N-Q. Shareholders can look up the fund’s Forms N-Q on the SEC’s website at sec.gov. Forms N-Q may also be reviewed and copied at the SEC’s Public Reference Room (see the back cover of this report for further information).
| | | |
| | | | Market |
| | | | Value• |
| | | Shares | ($000) |
| Common Stocks (94.4%)1 | | |
| Consumer Discretionary (20.4%) | |
| * | O’Reilly Automotive Inc. | 287,100 | 50,495 |
| | Williams-Sonoma Inc. | 631,633 | 41,075 |
| | Brunswick Corp. | 874,200 | 40,913 |
| | Six Flags Entertainment | | |
| | Corp. | 935,015 | 37,681 |
| | Ralph Lauren Corp. Class A | 198,365 | 32,698 |
| | Polaris Industries Inc. | 212,100 | 31,997 |
| * | Dollar General Corp. | 505,926 | 31,706 |
| | BorgWarner Inc. | 554,304 | 31,606 |
| | Lennar Corp. Class A | 673,845 | 29,029 |
| | Marriott International Inc. | | |
| | Class A | 374,479 | 28,367 |
| | Carter’s Inc. | 338,725 | 26,465 |
| | VF Corp. | 378,580 | 25,622 |
| * | Norwegian Cruise Line | | |
| | Holdings Ltd. | 634,475 | 24,745 |
| | Hanesbrands Inc. | 218,795 | 23,107 |
| | Tractor Supply Co. | 314,275 | 23,011 |
| | Royal Caribbean | | |
| | Cruises Ltd. | 338,100 | 22,981 |
| | DeVry Education Group Inc. | 438,750 | 21,240 |
| * | MGM Resorts International | 889,675 | 20,685 |
| | Ross Stores Inc. | 242,300 | 19,558 |
| | Interpublic Group of | | |
| | Cos. Inc. | 991,280 | 19,221 |
| | Wyndham Worldwide Corp. | 221,650 | 17,216 |
| | L Brands Inc. | 220,300 | 15,888 |
| | Tiffany & Co. | 160,800 | 15,456 |
| | Advance Auto Parts Inc. | 99,575 | 14,634 |
| | Abercrombie & Fitch Co. | 319,315 | 10,691 |
| | Best Buy Co. Inc. | 311,780 | 10,644 |
| | Cheesecake Factory Inc. | 200,475 | 9,210 |
| | | | 675,941 |
| Consumer Staples (4.9%) | | |
| | Mead Johnson Nutrition Co. | 405,700 | 40,290 |
| | Keurig Green Mountain Inc. | 216,750 | 32,892 |
| | Church & Dwight Co. Inc. | 374,400 | 27,110 |
| | | |
| | | | Market |
| | | | Value• |
| | | Shares | ($000) |
| * | Sprouts Farmers Market Inc. | 792,666 | 23,075 |
| * | Hain Celestial Group Inc. | 210,331 | 22,768 |
| * | Monster Beverage Corp. | 163,400 | 16,484 |
| | | | 162,619 |
| Energy (3.0%) | | |
| * | Whiting Petroleum Corp. | 459,350 | 28,131 |
| * | FMC Technologies Inc. | 284,800 | 15,960 |
| * | Concho Resources Inc. | 138,800 | 15,133 |
| | Range Resources Corp. | 216,600 | 14,816 |
| | Cabot Oil & Gas Corp. | 459,255 | 14,283 |
| | SM Energy Co. | 213,800 | 12,037 |
| | | | 100,360 |
| Financials (13.1%) | | |
| | Synovus Financial Corp. | 1,940,416 | 49,209 |
| | Intercontinental | | |
| | Exchange Inc. | 204,485 | 42,592 |
| | SEI Investments Co. | 1,097,025 | 42,411 |
| | Lazard Ltd. Class A | 826,080 | 40,652 |
| * | Affiliated Managers | | |
| | Group Inc. | 189,190 | 37,798 |
| * | E*TRADE Financial Corp. | 1,196,088 | 26,673 |
| | Jones Lang LaSalle Inc. | 194,825 | 26,342 |
| | PrivateBancorp Inc. | 773,225 | 24,991 |
| * | Portfolio Recovery | | |
| | Associates Inc. | 390,100 | 24,674 |
| | LPL Financial Holdings Inc. | 583,414 | 24,148 |
| | Invesco Ltd. | 522,908 | 21,162 |
| | Assured Guaranty Ltd. | 849,625 | 19,609 |
| * | Signature Bank | 159,384 | 19,306 |
| * | Popular Inc. | 581,155 | 18,527 |
| | First Horizon National | | |
| | Corp. | 1,321,475 | 16,994 |
| | | | 435,088 |
| Health Care (16.0%) | | |
| * | BioMarin | | |
| | Pharmaceutical Inc. | 619,520 | 51,110 |
| * | Medivation Inc. | 306,400 | 32,386 |
| * | Actavis plc | 128,020 | 31,076 |
| * | Mallinckrodt plc | 330,300 | 30,447 |
14
| | | |
| Mid-Cap Growth Fund | | |
| |
| |
| |
| | | | Market |
| | | | Value• |
| | | Shares | ($000) |
| * | IDEXX Laboratories Inc. | 211,394 | 29,948 |
| | Zoetis Inc. | 779,400 | 28,963 |
| * | HMS Holdings Corp. | 1,228,578 | 28,540 |
| * | Catamaran Corp. | 553,975 | 26,408 |
| * | MEDNAX Inc. | 385,800 | 24,086 |
| | Techne Corp. | 261,868 | 23,843 |
| | Thermo Fisher Scientific Inc. | 197,275 | 23,194 |
| * | Sirona Dental Systems Inc. | 280,200 | 22,010 |
| | HealthSouth Corp. | 473,731 | 19,106 |
| * | Bruker Corp. | 921,375 | 19,100 |
| * | HCA Holdings Inc. | 272,050 | 19,057 |
| * | Align Technology Inc. | 351,200 | 18,480 |
| * | Centene Corp. | 191,650 | 17,760 |
| * | Endo International plc | 243,475 | 16,293 |
| | Perrigo Co. plc | 100,625 | 16,246 |
| * | Charles River Laboratories | | |
| | International Inc. | 251,400 | 15,878 |
| * | Mettler-Toledo | | |
| | International Inc. | 59,470 | 15,371 |
| * | Incyte Corp. | 205,075 | 13,752 |
| * | Salix Pharmaceuticals Ltd. | 59,900 | 8,617 |
| | | | 531,671 |
| Industrials (15.6%) | | |
| | Manpowergroup Inc. | 817,925 | 54,596 |
| * | Stericycle Inc. | 399,690 | 50,361 |
| | Equifax Inc. | 588,165 | 44,548 |
| | AMETEK Inc. | 719,520 | 37,523 |
| * | Old Dominion Freight | | |
| | Line Inc. | 449,500 | 32,755 |
| | Towers Watson & Co. | | |
| | Class A | 269,275 | 29,698 |
| | TransDigm Group Inc. | 141,200 | 26,409 |
| | Fastenal Co. | 597,835 | 26,329 |
| * | Verisk Analytics Inc. | | |
| | Class A | 379,400 | 23,656 |
| * | WESCO International Inc. | 286,979 | 23,650 |
| | Fortune Brands Home & | | |
| | Security Inc. | 544,400 | 23,545 |
| | Waste Connections Inc. | 459,315 | 22,920 |
| * | Swift Transportation Co. | 855,030 | 21,119 |
| | Nordson Corp. | 235,650 | 18,039 |
| | Flowserve Corp. | 242,415 | 16,482 |
| * | Middleby Corp. | 177,000 | 15,665 |
| * | United Rentals Inc. | 131,767 | 14,502 |
| * | Genesee & Wyoming Inc. | | |
| | Class A | 135,720 | 13,056 |
| * | IHS Inc. Class A | 92,775 | 12,156 |
| | Alaska Air Group Inc. | 227,475 | 12,108 |
| | | | 519,117 |
| Information Technology (17.1%) | |
| * | Vantiv Inc. Class A | 1,794,187 | 55,476 |
| * | Akamai Technologies Inc. | 808,022 | 48,724 |
| * | Gartner Inc. | 538,085 | 43,429 |
| * | Red Hat Inc. | 601,400 | 35,434 |
| * | IPG Photonics Corp. | 470,600 | 34,547 |
| | | |
| | | | Market |
| | | | Value• |
| | | Shares | ($000) |
| * | Electronics For Imaging Inc. | 710,120 | 32,467 |
| * | Guidewire Software Inc. | 576,700 | 28,800 |
| * | PTC Inc. | 719,580 | 27,452 |
| * | Cognizant Technology | | |
| | Solutions Corp. Class A | 548,795 | 26,809 |
| * | NXP Semiconductor NV | 350,425 | 24,060 |
| | Belden Inc. | 318,200 | 22,653 |
| * | Genpact Ltd. | 1,229,922 | 21,585 |
| | Avago Technologies Ltd. | | |
| | Class A | 222,550 | 19,195 |
| * | Aspen Technology Inc. | 503,050 | 18,578 |
| * | FleetCor Technologies Inc. | 114,023 | 17,167 |
| * | F5 Networks Inc. | 138,125 | 16,986 |
| * | CoStar Group Inc. | 100,179 | 16,138 |
| * | NeuStar Inc. Class A | 591,227 | 15,614 |
| * | Pandora Media Inc. | 783,300 | 15,102 |
| * | Trimble Navigation Ltd. | 528,255 | 14,189 |
| * | VeriFone Systems Inc. | 353,975 | 13,189 |
| * | Informatica Corp. | 245,450 | 8,753 |
| | CDW Corp. | 259,525 | 8,004 |
| | FactSet Research | | |
| | Systems Inc. | 13,788 | 1,812 |
| | | | 566,163 |
| Materials (1.8%) | | |
| | International Flavors & | | |
| | Fragrances Inc. | 302,600 | 30,003 |
| | Airgas Inc. | 258,312 | 28,812 |
| | | | 58,815 |
| Other (0.3%) | | |
| ^,2 | Vanguard Mid-Cap | | |
| | Growth ETF | 100,223 | 9,977 |
| |
| Telecommunication Services (2.2%) | |
| * | SBA Communications | | |
| | Corp. Class A | 650,825 | 73,107 |
| Total Common Stocks | | |
| (Cost $2,545,448) | | 3,132,858 |
| Temporary Cash Investments (6.3%)1 | |
| Money Market Fund (6.1%) | | |
| 3,4 | Vanguard Market Liquidity | | |
| | Fund, 0.114% | 203,738,892 | 203,739 |
15
| | | |
| Mid-Cap Growth Fund | | |
| |
| |
| |
| | | Face | Market |
| | | Amount | Value• |
| | | ($000) | ($000) |
| U.S. Government and Agency Obligations (0.2%) |
| 5,7 | Federal Home Loan Bank | | |
| | Discount Notes, 0.033%, | | |
| | 12/19/14 | 1,900 | 1,900 |
| 6,7 | Freddie Mac Discount Notes, | | |
| | 0.090%, 1/22/15 | 2,700 | 2,699 |
| | | | 4,599 |
| Total Temporary Cash Investments | |
| (Cost $208,338) | | 208,338 |
| Total Investments (100.7%) | | |
| (Cost $2,753,786) | | 3,341,196 |
| Other Assets and Liabilities (-0.7%) | |
| Other Assets | | 55,235 |
| Liabilities4 | | (77,332) |
| | | | (22,097) |
| Net Assets (100%) | | |
| Applicable to 125,723,035 outstanding | |
| $.001 par value shares of beneficial | |
| interest (unlimited authorization) | 3,319,099 |
| Net Asset Value Per Share | | $26.40 |
| |
| At October 31, 2014, net assets consisted of: |
| | Amount |
| | ($000) |
| Paid-in Capital | 2,326,188 |
| Undistributed Net Investment Income | 788 |
| Accumulated Net Realized Gains | 405,028 |
| Unrealized Appreciation (Depreciation) | |
| Investment Securities | 587,410 |
| Futures Contracts | (315) |
| Net Assets | 3,319,099 |
• See Note A in Notes to Financial Statements.* Non-income-producing security.^ Includes partial security positions on loan to broker-dealers. The total value of securities on loan is $2,658,000.1 The fund invests a portion of its cash reserves in equity markets through the use of index futures contracts. After giving effect to futuresinvestments, the fund’s effective common stock and temporary cash investment positions represent 96.6% and 4.1%, respectively, ofnet assets.2 Considered an affiliated company of the fund as the issuer is another member of The Vanguard Group.3 Affiliated money market fund available only to Vanguard funds and certain trusts and accounts managed by Vanguard. Rate shown is the7-day yield.4 Includes $2,697,000 of collateral received for securities on loan.5 The issuer operates under a congressional charter; its securities are generally neither guaranteed by the U.S. Treasury nor backed by thefull faith and credit of the U.S. government.6 The issuer was placed under federal conservatorship in September 2008; since that time, its daily operations have been managed by theFederal Housing Finance Agency and it receives capital from the U.S. Treasury, as needed to maintain a positive net worth, in exchange forsenior preferred stock.7 Securities with a value of $3,699,000 have been segregated as initial margin for open futures contracts.See accompanying Notes, which are an integral part of the Financial Statements.16
Mid-Cap Growth Fund
Statement of Operations
| |
| | Year Ended |
| | October 31, 2014 |
| | ($000) |
| Investment Income | |
| Income | |
| Dividends1 | 18,493 |
| Interest1 | 187 |
| Securities Lending | 447 |
| Total Income | 19,127 |
| Expenses | |
| Investment Advisory Fees—Note B | |
| Basic Fee | 6,332 |
| Performance Adjustment | (483) |
| The Vanguard Group—Note C | |
| Management and Administrative | 7,677 |
| Marketing and Distribution | 638 |
| Custodian Fees | 37 |
| Auditing Fees | 34 |
| Shareholders’ Reports | 29 |
| Trustees’ Fees and Expenses | 6 |
| Total Expenses | 14,270 |
| Expenses Paid Indirectly | (212) |
| Net Expenses | 14,058 |
| Net Investment Income | 5,069 |
| Realized Net Gain (Loss) | |
| Investment Securities Sold1 | 435,694 |
| Futures Contracts | 10,399 |
| Realized Net Gain (Loss) | 446,093 |
| Change in Unrealized Appreciation (Depreciation) | |
| Investment Securities | (59,111) |
| Futures Contracts | (4,070) |
| Change in Unrealized Appreciation (Depreciation) | (63,181) |
| Net Increase (Decrease) in Net Assets Resulting from Operations | 387,981 |
1 Dividend income, interest income, and realized net gain (loss) from affiliated companies of the fund were $106,000, $183,000, and$3,102,000, respectively.See accompanying Notes, which are an integral part of the Financial Statements.
17
Mid-Cap Growth Fund
Statement of Changes in Net Assets
| | |
| | Year Ended October 31, |
| | 2014 | 2013 |
| | ($000) | ($000) |
| Increase (Decrease) in Net Assets | | |
| Operations | | |
| Net Investment Income | 5,069 | 4,714 |
| Realized Net Gain (Loss) | 446,093 | 297,724 |
| Change in Unrealized Appreciation (Depreciation) | (63,181) | 353,334 |
| Net Increase (Decrease) in Net Assets Resulting from Operations | 387,981 | 655,772 |
| Distributions | | |
| Net Investment Income | (782) | (7,620) |
| Realized Capital Gain1 | (278,523) | (118,662) |
| Total Distributions | (279,305) | (126,282) |
| Capital Share Transactions | | |
| Issued | 619,821 | 533,350 |
| Issued in Lieu of Cash Distributions | 271,718 | 122,777 |
| Redeemed | (517,710) | (478,266) |
| Net Increase (Decrease) from Capital Share Transactions | 373,829 | 177,861 |
| Total Increase (Decrease) | 482,505 | 707,351 |
| Net Assets | | |
| Beginning of Period | 2,836,594 | 2,129,243 |
| End of Period2 | 3,319,099 | 2,836,594 |
1 Includes fiscal 2014 and 2013 short-term gain distributions totaling $86,619,000 and $32,409,000, respectively. Short-term gain distributionsare treated as ordinary income dividends for tax purposes.2 Net Assets—End of Period includes undistributed (overdistributed) net investment income of $788,000 and ($3,055,000).See accompanying Notes, which are an integral part of the Financial Statements.
18
Mid-Cap Growth Fund
Financial Highlights
| | | | | |
| For a Share Outstanding | Year Ended October 31, |
| Throughout Each Period | 2014 | 2013 | 2012 | 2011 | 2010 |
| Net Asset Value, Beginning of Period | $25.72 | $20.95 | $19.40 | $17.54 | $13.86 |
| Investment Operations | | | | | |
| Net Investment Income | . 045 | . 048 | .041 | .0401 | .001 |
| Net Realized and Unrealized Gain (Loss) | | | | | |
| on Investments | 3.134 | 5.965 | 1.892 | 1.840 | 3.697 |
| Total from Investment Operations | 3.179 | 6.013 | 1.933 | 1.880 | 3.698 |
| Distributions | | | | | |
| Dividends from Net Investment Income | (.007) | (.075) | (. 030) | (. 020) | (. 018) |
| Distributions from Realized Capital Gains | (2.492) | (1.168) | (.353) | — | — |
| Total Distributions | (2.499) | (1.243) | (.383) | (. 020) | (. 018) |
| Net Asset Value, End of Period | $26.40 | $25.72 | $20.95 | $19.40 | $17.54 |
| |
| Total Return2 | 13.42% | 30.32% | 10.24% | 10.72% | 26.70% |
| |
| Ratios/Supplemental Data | | | | | |
| Net Assets, End of Period (Millions) | $3,319 | $2,837 | $2,129 | $1,804 | $1,562 |
| Ratio of Total Expenses to Average Net Assets3 | 0.46% | 0.51% | 0.54% | 0.53% | 0.51% |
| Ratio of Net Investment Income to | | | | | |
| Average Net Assets | 0.16% | 0.19% | 0.19% | 0.20%1 | 0.00% |
| Portfolio Turnover Rate | 82% | 83% | 97% | 127% | 88% |
1 Net investment income per share and the ratio of net investment income to average net assets include $.02 and 0.11%, respectively,resulting from a special dividend from VeriSign Inc. in December 2010.2 Total returns do not include account service fees that may have applied in the periods shown. Fund prospectuses provide information aboutany applicable account service fees.3 Includes performance-based investment advisory fee increases (decreases) of (0.02%), 0.02%, 0.04%, 0.01%, and (0.01%).See accompanying Notes, which are an integral part of the Financial Statements.
19
Mid-Cap Growth Fund
Notes to Financial Statements
Vanguard Mid-Cap Growth Fund is registered under the Investment Company Act of 1940 as an open-end investment company, or mutual fund.
A. The following significant accounting policies conform to generally accepted accounting principles for U.S. investment companies. The fund consistently follows such policies in preparing its financial statements.
1. Security Valuation: Securities are valued as of the close of trading on the New York Stock Exchange (generally 4 p.m., Eastern time) on the valuation date. Equity securities are valued at the latest quoted sales prices or official closing prices taken from the primary market in which each security trades; such securities not traded on the valuation date are valued at the mean of the latest quoted bid and asked prices. Securities for which market quotations are not readily available, or whose values have been materially affected by events occurring before the fund’s pricing time but after the close of the securities’ primary markets, are valued by methods deemed by the board of trustees to represent fair value. Investments in Vanguard Market Liquidity Fund are valued at that fund’s net asset value. Temporary cash investments acquired over 60 days to maturity are valued using the latest bid prices or using valuations based on a matrix system (which considers such factors as security prices, yields, maturities, and ratings), both as furnished by independent pricing services. Other temporary cash investments are valued at amortized cost, which approximates market value.
2. Futures Contracts: The fund uses index futures contracts to a limited extent, with the objective of maintaining full exposure to the stock market while maintaining liquidity. The fund may purchase or sell futures contracts to achieve a desired level of investment, whether to accommodate portfolio turnover or cash flows from capital share transactions. The primary risks associated with the use of futures contracts are imperfect correlation between changes in market values of stocks held by the fund and the prices of futures contracts, and the possibility of an illiquid market. Counterparty risk involving futures is mitigated because a regulated clearinghouse is the counterparty instead of the clearing broker. To further mitigate counterparty risk, the fund trades futures contracts on an exchange, monitors the financial strength of its clearing brokers and clearinghouse, and has entered into clearing agreements with its clearing brokers. The clearinghouse imposes initial margin requirements to secure the fund’s performance and requires daily settlement of variation margin representing changes in the market value of each contract.
Futures contracts are valued at their quoted daily settlement prices. The aggregate settlement values of the contracts are not recorded in the Statement of Net Assets. Fluctuations in the value of the contracts are recorded in the Statement of Net Assets as an asset (liability) and in the Statement of Operations as unrealized appreciation (depreciation) until the contracts are closed, when they are recorded as realized futures gains (losses).
During the year ended October 31, 2014, the fund’s average investments in long and short futures contracts represented 3% and 0% of net assets, respectively, based on the average of aggregate settlement values at each quarter-end during the period.
3. Federal Income Taxes: The fund intends to continue to qualify as a regulated investment company and distribute all of its taxable income. Management has analyzed the fund’s tax positions taken for all open federal income tax years (October 31, 2011–2014), and has concluded that no provision for federal income tax is required in the fund’s financial statements.
4. Distributions: Distributions to shareholders are recorded on the ex-dividend date.
20
Mid-Cap Growth Fund
5. Securities Lending: To earn additional income, the fund lends its securities to qualified institutional borrowers. Security loans are required to be secured at all times by collateral in an amount at least equal to the market value of securities loaned. Daily market fluctuations could cause the value of loaned securities to be more or less than the value of the collateral received. When this occurs, the collateral is adjusted and settled on the next business day. The fund further mitigates its counterparty risk by entering into securities lending transactions only with a diverse group of prequalified counterparties, monitoring their financial strength, and entering into master securities lending agreements with its counterparties. The master securities lending agreements provide that, in the event of a counterparty’s default (including bankruptcy), the fund may terminate any loans with that borrower, determine the net amount owed, and sell or retain the collateral up to the net amount owed to the fund; however, such actions may be subject to legal proceedings. While collateral mitigates counterparty risk, in the absence of a default the fund may experience delays and costs in recovering the securities loaned. The fund invests cash collateral received in Vanguard Market Liquidity Fund, and records a liability in the Statement of Net Assets for the return of the collateral, during the period the securities are on loan. Securities lending income represents fees charged to borrowers plus income earned on invested cash collateral, less expenses associated with the loan.
6. Credit Facility: The fund and certain other funds managed by The Vanguard Group participate in a $2.89 billion committed credit facility provided by a syndicate of lenders pursuant to a credit agreement that may be renewed annually; each fund is individually liable for its borrowings, if any, under the credit facility. Borrowings may be utilized for temporary and emergency purposes, and are subject to the fund’s regulatory and contractual borrowing restrictions. The participating funds are charged administrative fees and an annual commitment fee of 0.06% of the undrawn amount of the facility; these fees are allocated to the funds based on a method approved by the fund’s board of trustees and included in Management and Administrative expenses on the fund’s Statement of Operations. Any borrowings under this facility bear interest at a rate equal to the higher of the federal funds rate or LIBOR reference rate plus an agreed-upon spread.
The fund had no borrowings outstanding at October 31, 2014, or at any time during the period then ended.
7. Other: Dividend income is recorded on the ex-dividend date. Interest income includes income distributions received from Vanguard Market Liquidity Fund and is accrued daily. Premiums and discounts on debt securities purchased are amortized and accreted, respectively, to interest income over the lives of the respective securities. Security transactions are accounted for on the date securities are bought or sold. Costs used to determine realized gains (losses) on the sale of investment securities are those of the specific securities sold.
B. Chartwell Investment Partners, Inc., and William Blair & Company, L.L.C., each provide investment advisory services to a portion of the fund for a fee calculated at an annual percentage rate of average net assets managed by the advisor. The basic fee of Chartwell Investment Partners, Inc., is subject to quarterly adjustments based on performance for the preceding three years relative to the Russell Midcap Growth Index. The basic fee of William Blair & Company, L.L.C., is subject to quarterly adjustments based on performance for the preceding five years relative to the Russell MidCap Growth Index.
The Vanguard Group manages the cash reserves of the fund on an at-cost basis.
For the year ended October 31, 2014, the aggregate investment advisory fee represented an effective annual basic rate of 0.20% of the fund’s average net assets, before a decrease of $483,000 (0.02%) based on performance.
21
Mid-Cap Growth Fund
C. The Vanguard Group furnishes at cost corporate management, administrative, marketing, and distribution services. The costs of such services are allocated to the fund based on methods approved by the board of trustees. The fund has committed to invest up to 0.40% of its net assets in Vanguard. At October 31, 2014, the fund had contributed capital of $320,000 to Vanguard (included in Other Assets), representing 0.01% of the fund’s net assets and 0.13% of Vanguard’s capitalization. The fund’s trustees and officers are also directors and officers of Vanguard.
D. The fund has asked its investment advisors to direct certain security trades, subject to obtaining the best price and execution, to brokers who have agreed to rebate to the fund part of the commissions generated. Such rebates are used solely to reduce the fund’s management and administrative expenses. For the year ended October 31, 2014, these arrangements reduced the fund’s expenses by $212,000 (an annual rate of 0.01% of average net assets).
E. Various inputs may be used to determine the value of the fund’s investments. These inputs are summarized in three broad levels for financial statement purposes. The inputs or methodologies used to value securities are not necessarily an indication of the risk associated with investing in those securities.
Level 1—Quoted prices in active markets for identical securities.
Level 2—Other significant observable inputs (including quoted prices for similar securities, interest rates, prepayment speeds, credit risk, etc.).
Level 3—Significant unobservable inputs (including the fund’s own assumptions used to determine the fair value of investments).
The following table summarizes the market value of the fund’s investments as of October 31, 2014, based on the inputs used to value them:
| | | |
| | Level 1 | Level 2 | Level 3 |
| Investments | ($000) | ($000) | ($000) |
| Common Stocks | 3,132,858 | — | — |
| Temporary Cash Investments | 203,739 | 4,599 | — |
| Futures Contracts—Assets1 | 853 | — | — |
| Total | 3,337,450 | 4,599 | — |
| 1 Represents variation margin on the last day of the reporting period. |
F. At October 31, 2014, the aggregate settlement value of open futures contracts and the related unrealized appreciation (depreciation) were:
| | | | |
| | | | | ($000) |
| | | | Aggregate | |
| | | Number of | Settlement | Unrealized |
| | | Long (Short) | Value | Appreciation |
| Futures Contracts | Expiration | Contracts | Long (Short) | (Depreciation) |
| E-mini S&P 500 Midcap 400 Index | December 2014 | 530 | 75,016 | (315) |
Unrealized appreciation (depreciation) on open futures contracts is required to be treated as realized gain (loss) for tax purposes.
22
Mid-Cap Growth Fund
G. Distributions are determined on a tax basis and may differ from net investment income and realized capital gains for financial reporting purposes. Differences may be permanent or temporary. Permanent differences are reclassified among capital accounts in the financial statements to reflect their tax character. Temporary differences arise when certain items of income, expense, gain, or loss are recognized in different periods for financial statement and tax purposes. These differences will reverse at some time in the future. Differences in classification may also result from the treatment of short-term gains as ordinary income for tax purposes.
The fund used a tax accounting practice to treat a portion of the price of capital shares redeemed during the year as distributions from net investment income and realized capital gains. Accordingly, the fund has reclassified $444,000 from undistributed net investment income, and $36,659,000 from accumulated net realized gains, to paid-in capital.
For tax purposes, at October 31, 2014, the fund had $85,613,000 of ordinary income and $324,498,000 of long-term capital gains available for distribution.
At October 31, 2014, the cost of investment securities for tax purposes was $2,754,363,000. Net unrealized appreciation of investment securities for tax purposes was $586,833,000, consisting of unrealized gains of $631,378,000 on securities that had risen in value since their purchase and $44,545,000 in unrealized losses on securities that had fallen in value since their purchase.
H. During the year ended October 31, 2014, the fund purchased $2,513,155,000 of investment securities and sold $2,448,027,000 of investment securities, other than temporary cash investments.
I. Capital shares issued and redeemed were:
| | |
| | Year Ended October 31, |
| | 2014 | 2013 |
| | Shares | Shares |
| | (000) | (000) |
| Issued | 24,664 | 23,286 |
| Issued in Lieu of Cash Distributions | 11,417 | 6,078 |
| Redeemed | (20,664) | (20,687) |
| Net Increase (Decrease) in Shares Outstanding | 15,417 | 8,677 |
J. Management has determined that no material events or transactions occurred subsequent to October 31, 2014, that would require recognition or disclosure in these financial statements.
23
Report of Independent Registered Public Accounting Firm
To the Board of Trustees of Vanguard Whitehall Funds and the Shareholders of Vanguard Mid-Cap Growth Fund:
In our opinion, the accompanying statement of net assets and the related statements of operations and of changes in net assets and the financial highlights present fairly, in all material respects, the financial position of Vanguard Mid-Cap Growth Fund (constituting a separate portfolio of Vanguard Whitehall Funds, hereafter referred to as the “Fund”) at October 31, 2014, the results of its operations for the year then ended, the changes in its net assets for each of the two years in the period then ended, and the financial highlights for each of the five years in the period then ended, in conformity with accounting principles generally accepted in the United States of America. These financial statements and financial highlights (hereafter referred to as “financial statements”) are the responsibility of the Fund’s management. Our responsibility is to express an opinion on these financial statements based on our audits. We conducted our audits of these financial statements in accordance with the standards of the Public Company Accounting Oversight Board (United States). Those standards require that we plan and perform the audit to obtain reasonable assurance about whether the financial statements are free of material misstatement. An audit includes examining, on a test basis, evidence supporting the amounts and disclosures in the financial statements, assessing the accounting principles used and significant estimates made by management, and evaluating the overall financial statement presentation. We believe that our audits, which included confirmation of securities at October 31, 2014 by correspondence with the custodian and broker, by agreement to the underlying ownership records of the transfer agent and the application of alternative auditing procedures where securities purchased had not been received, provide a reasonable basis for our opinion.
/s/PricewaterhouseCoopers LLP
Philadelphia, Pennsylvania
December 11, 2014

Special 2014 tax information (unaudited) for Vanguard Mid-Cap Growth Fund
This information for the fiscal year ended October 31, 2014, is included pursuant to provisions of
the Internal Revenue Code.
The fund distributed $221,247,000 as capital gain dividends (from net long-term capital gains) to
shareholders during the fiscal year.
For nonresident alien shareholders, 100% of short-term capital gain dividends distributed by the fund
in fiscal 2013 and 2014 are qualified short-term capital gains.
The fund distributed $11,826,000 of qualified dividend income to shareholders during the fiscal year.
For corporate shareholders, 17.3% of investment income (dividend income plus short-term gains, if
any) qualifies for the dividends-received deduction.
24
Your Fund’s After-Tax Returns
This table presents returns for your fund both before and after taxes. The after-tax returns are shown in two ways: (1) assuming that an investor owned the fund during the entire period and paid taxes on the fund’s distributions, and (2) assuming that an investor paid taxes on the fund’s distributions and sold all shares at the end of each period.
Calculations are based on the highest individual federal income tax and capital gains tax rates in effect at the times of the distributions and the hypothetical sales. State and local taxes were not considered. After-tax returns reflect any qualified dividend income, using actual prior-year figures and estimates for 2014. (In the example, returns after the sale of fund shares may be higher than those assuming no sale. This occurs when the sale would have produced a capital loss. The calculation assumes that the investor received a tax deduction for the loss.)
Please note that your actual after-tax returns will depend on your tax situation and may differ from those shown. Also note that if you own the fund in a tax-deferred account, such as an individual retirement account or a 401(k) plan, this information does not apply to you. Such accounts are not subject to current taxes.
Finally, keep in mind that a fund’s performance—whether before or after taxes—does not guarantee future results.
Average Annual Total Returns: Mid-Cap Growth Fund
Periods Ended October 31, 2014
| | | |
| | One | Five | Ten |
| | Year | Years | Years |
| Returns Before Taxes | 13.42% | 17.98% | 10.57% |
| Returns After Taxes on Distributions | 10.28 | 16.99 | 9.69 |
| Returns After Taxes on Distributions and Sale of Fund Shares | 8.81 | 14.42 | 8.57 |
25
About Your Fund’s Expenses
As a shareholder of the fund, you incur ongoing costs, which include costs for portfolio management, administrative services, and shareholder reports (like this one), among others. Operating expenses, which are deducted from a fund’s gross income, directly reduce the investment return of the fund.
A fund’s expenses are expressed as a percentage of its average net assets. This figure is known as the expense ratio. The following examples are intended to help you understand the ongoing costs (in dollars) of investing in your fund and to compare these costs with those of other mutual funds. The examples are based on an investment of $1,000 made at the beginning of the period shown and held for the entire period.
The accompanying table illustrates your fund’s costs in two ways:
• Based on actual fund return. This section helps you to estimate the actual expenses that you paid over the period. The ”Ending Account Value“ shown is derived from the fund‘s actual return, and the third column shows the dollar amount that would have been paid by an investor who started with $1,000 in the fund. You may use the information here, together with the amount you invested, to estimate the expenses that you paid over the period.
To do so, simply divide your account value by $1,000 (for example, an $8,600 account value divided by $1,000 = 8.6), then multiply the result by the number given for your fund under the heading ”Expenses Paid During Period.“
• Based on hypothetical 5% yearly return. This section is intended to help you compare your fund‘s costs with those of other mutual funds. It assumes that the fund had a yearly return of 5% before expenses, but that the expense ratio is unchanged. In this case—because the return used is not the fund’s actual return—the results do not apply to your investment. The example is useful in making comparisons because the Securities and Exchange Commission requires all mutual funds to calculate expenses based on a 5% return. You can assess your fund’s costs by comparing this hypothetical example with the hypothetical examples that appear in shareholder reports of other funds.
Note that the expenses shown in the table are meant to highlight and help you compare ongoing costs only and do not reflect transaction costs incurred by the fund for buying and selling securities. Further, the expenses do not include any purchase, redemption, or account service fees described in the fund prospectus. If such fees were applied to your account, your costs would be higher. Your fund does not carry a “sales load.”
The calculations assume no shares were bought or sold during the period. Your actual costs may have been higher or lower, depending on the amount of your investment and the timing of any purchases or redemptions.
You can find more information about the fund’s expenses, including annual expense ratios, in the Financial Statements section of this report. For additional information on operating expenses and other shareholder costs, please refer to your fund’s current prospectus.
26
| | | |
| Six Months Ended October 31, 2014 | | | |
| | Beginning | Ending | Expenses |
| | Account Value | Account Value | Paid During |
| Mid-Cap Growth Fund | 4/30/2014 | 10/31/2014 | Period |
| Based on Actual Fund Return | $1,000.00 | $1,081.97 | $2.36 |
| Based on Hypothetical 5% Yearly Return | 1,000.00 | 1,022.94 | 2.29 |
The calculations are based on expenses incurred in the most recent six-month period. The fund’s annualized six-month expense ratio for thatperiod is 0.45%. The dollar amounts shown as “Expenses Paid” are equal to the annualized expense ratio multiplied by the average accountvalue over the period, multiplied by the number of days in the most recent six-month period, then divided by the number of days in the mostrecent 12-month period.27
Glossary
30-Day SEC Yield. A fund’s 30-day SEC yield is derived using a formula specified by the U.S. Securities and Exchange Commission. Under the formula, data related to the fund’s security holdings in the previous 30 days are used to calculate the fund’s hypothetical net income for that period, which is then annualized and divided by the fund’s estimated average net assets over the calculation period. For the purposes of this calculation, a security’s income is based on its current market yield to maturity (for bonds), its actual income (for asset-backed securities), or its projected dividend yield (for stocks). Because the SEC yield represents hypothetical annualized income, it will differ—at times significantly—from the fund’s actual experience. As a result, the fund’s income distributions may be higher or lower than implied by the SEC yield.
Beta. A measure of the magnitude of a fund’s past share-price fluctuations in relation to the ups and downs of a given market index. The index is assigned a beta of 1.00. Compared with a given index, a fund with a beta of 1.20 typically would have seen its share price rise or fall by 12% when the index rose or fell by 10%. For this report, beta is based on returns over the past 36 months for both the fund and the index. Note that a fund’s beta should be reviewed in conjunction with its R-squared (see definition). The lower the R-squared, the less correlation there is between the fund and the index, and the less reliable beta is as an indicator of volatility.
Dividend Yield. Dividend income earned by stocks, expressed as a percentage of the aggregate market value (or of net asset value, for a fund). The yield is determined by dividing the amount of the annual dividends by the aggregate value (or net asset value) at the end of the period. For a fund, the dividend yield is based solely on stock holdings and does not include any income produced by other investments.
Earnings Growth Rate. The average annual rate of growth in earnings over the past five years for the stocks now in a fund.
Equity Exposure. A measure that reflects a fund’s investments in stocks and stock futures. Any holdings in short-term reserves are excluded.
Expense Ratio. A fund’s total annual operating expenses expressed as a percentage of the fund’s average net assets. The expense ratio includes management and administrative expenses, but does not include the transaction costs of buying and selling portfolio securities.
Foreign Holdings. The percentage of a fund represented by securities or depositary receipts of companies based outside the United States.
Inception Date. The date on which the assets of a fund (or one of its share classes) are first invested in accordance with the fund’s investment objective. For funds with a subscription period, the inception date is the day after that period ends. Investment performance is measured from the inception date.
Median Market Cap. An indicator of the size of companies in which a fund invests; the midpoint of market capitalization (market price x shares outstanding) of a fund’s stocks, weighted by the proportion of the fund’s assets invested in each stock. Stocks representing half of the fund’s assets have market capitalizations above the median, and the rest are below it.
Price/Book Ratio. The share price of a stock divided by its net worth, or book value, per share. For a fund, the weighted average price/book ratio of the stocks it holds.
28
Price/Earnings Ratio. The ratio of a stock’s current price to its per-share earnings over the past year. For a fund, the weighted average P/E of the stocks it holds. P/E is an indicator of market expectations about corporate prospects; the higher the P/E, the greater the expectations for a company’s future growth.
R-Squared. A measure of how much of a fund’s past returns can be explained by the returns from the market in general, as measured by a given index. If a fund’s total returns were precisely synchronized with an index’s returns, its R-squared would be 1.00. If the fund’s returns bore no relationship to the index’s returns, its R-squared would be 0. For this report, R-squared is based on returns over the past 36 months for both the fund and the index.
Return on Equity. The annual average rate of return generated by a company during the past five years for each dollar of shareholder’s equity (net income divided by shareholder’s equity). For a fund, the weighted average return on equity for the companies whose stocks it holds.
Short-Term Reserves. The percentage of a fund invested in highly liquid, short-term securities that can be readily converted to cash.
Turnover Rate. An indication of the fund’s trading activity. Funds with high turnover rates incur higher transaction costs and may be more likely to distribute capital gains (which may be taxable to investors). The turnover rate excludes in-kind transactions, which have minimal impact on costs.
29
This page intentionally left blank.
This page intentionally left blank.
The People Who Govern Your Fund
The trustees of your mutual fund are there to see that the fund is operated and managed in your best interests since, as a shareholder, you are a part owner of the fund. Your fund’s trustees also serve on the board of directors of The Vanguard Group, Inc., which is owned by the Vanguard funds and provides services to them on an at-cost basis.
A majority of Vanguard’s board members are independent, meaning that they have no affiliation with Vanguard or the funds they oversee, apart from the sizable personal investments they have made as private individuals. The independent board members have distinguished backgrounds in business, academia, and public service. Each of the trustees and executive officers oversees 177 Vanguard funds.
The following table provides information for each trustee and executive officer of the fund. More information about the trustees is in the Statement of Additional Information, which can be obtained, without charge, by contacting Vanguard at 800-662-7447, or online at vanguard.com.
| |
| InterestedTrustee1 | and Delphi Automotive LLP (automotive components); |
| | Senior Advisor at New Mountain Capital. |
| F. William McNabb III | |
| Born 1957. Trustee Since July 2009. Chairman of the | Amy Gutmann |
| Board. Principal Occupation(s) During the Past Five | Born 1949. Trustee Since June 2006. Principal |
| Years: Chairman of the Board of The Vanguard Group, | Occupation(s) During the Past Five Years: President of |
| Inc., and of each of the investment companies served | the University of Pennsylvania; Christopher H. Browne |
| by The Vanguard Group, since January 2010; Director | Distinguished Professor of Political Science, School of |
| of The Vanguard Group since 2008; Chief Executive | Arts and Sciences, and Professor of Communication, |
| Officer and President of The Vanguard Group, and of | Annenberg School for Communication, with secondary |
| each of the investment companies served by The | faculty appointments in the Department of Philosophy, |
| Vanguard Group, since 2008; Director of Vanguard | School of Arts and Sciences, and at the Graduate |
| Marketing Corporation; Managing Director of The | School of Education, University of Pennsylvania; |
| Vanguard Group (1995–2008). | Trustee of the National Constitution Center; Chair |
| | of the Presidential Commission for the Study of |
| | Bioethical Issues. |
| IndependentTrustees | |
| | JoAnn Heffernan Heisen |
| Emerson U. Fullwood | Born 1950. Trustee Since July 1998. Principal |
| Born 1948. Trustee Since January 2008. Principal | Occupation(s) During the Past Five Years: Corporate |
| Occupation(s) During the Past Five Years: Executive | Vice President and Chief Global Diversity Officer |
| Chief Staff and Marketing Officer for North America | (retired 2008) and Member of the Executive |
| and Corporate Vice President (retired 2008) of Xerox | Committee (1997–2008) of Johnson & Johnson |
| Corporation (document management products and | (pharmaceuticals/medical devices/consumer |
| services); Executive in Residence and 2009–2010 | products); Director of Skytop Lodge Corporation |
| Distinguished Minett Professor at the Rochester | (hotels), the University Medical Center at Princeton, |
| Institute of Technology; Director of SPX Corporation | the Robert Wood Johnson Foundation, and the Center |
| (multi-industry manufacturing), the United Way of | for Talent Innovation; Member of the Advisory Board |
| Rochester, Amerigroup Corporation (managed health | of the Maxwell School of Citizenship and Public Affairs |
| care), the University of Rochester Medical Center, | at Syracuse University. |
| Monroe Community College Foundation, and North | |
| Carolina A&T University. | F. Joseph Loughrey |
| | Born 1949. Trustee Since October 2009. Principal |
| Rajiv L. Gupta | Occupation(s) During the Past Five Years: President |
| Born 1945. Trustee Since December 2001.2 | and Chief Operating Officer (retired 2009) of Cummins |
| Principal Occupation(s) During the Past Five Years: | Inc. (industrial machinery); Chairman of the Board |
| Chairman and Chief Executive Officer (retired 2009) | of Hillenbrand, Inc. (specialized consumer services), |
| and President (2006–2008) of Rohm and Haas Co. | and of Oxfam America; Director of SKF AB (industrial |
| (chemicals); Director of Tyco International, Ltd. | machinery), Hyster-Yale Materials Handling, Inc. |
| (diversified manufacturing and services), Hewlett- | (forklift trucks), the Lumina Foundation for Education, |
| Packard Co. (electronic computer manufacturing), | |
| | |
| and the V Foundation for Cancer Research; Member | Executive Officers | |
| of the Advisory Council for the College of Arts and | | |
| Letters and of the Advisory Board to the Kellogg | Glenn Booraem | |
| Institute for International Studies, both at the | Born 1967. Controller Since July 2010. Principal |
| University of Notre Dame. | Occupation(s) During the Past Five Years: Principal |
| | of The Vanguard Group, Inc.; Controller of each of |
| Mark Loughridge | the investment companies served by The Vanguard |
| Born 1953. Trustee Since March 2012. Principal | Group; Assistant Controller of each of the investment |
| Occupation(s) During the Past Five Years: Senior Vice | companies served by The Vanguard Group (2001–2010). |
| President and Chief Financial Officer (retired 2013) | | |
| at IBM (information technology services); Fiduciary | Thomas J. Higgins | |
| Member of IBM’s Retirement Plan Committee (2004– | Born 1957. Chief Financial Officer Since September |
| 2013); Member of the Council on Chicago Booth. | 2008. Principal Occupation(s) During the Past Five |
| | Years: Principal of The Vanguard Group, Inc.; Chief |
| Scott C. Malpass | Financial Officer of each of the investment companies |
| Born 1962. Trustee Since March 2012. Principal | served by The Vanguard Group; Treasurer of each of |
| Occupation(s) During the Past Five Years: Chief | the investment companies served by The Vanguard |
| Investment Officer and Vice President at the University | Group (1998–2008). | |
| of Notre Dame; Assistant Professor of Finance at the | | |
| Mendoza College of Business at Notre Dame; Member | Kathryn J. Hyatt | |
| of the Notre Dame 403(b) Investment Committee; | Born 1955. Treasurer Since November 2008. Principal |
| Board Member of TIFF Advisory Services, Inc. | Occupation(s) During the Past Five Years: Principal of |
| (investment advisor); Member of the Investment | The Vanguard Group, Inc.; Treasurer of each of the |
| Advisory Committees of the Financial Industry | investment companies served by The Vanguard |
| Regulatory Authority (FINRA) and of Major League | Group; Assistant Treasurer of each of the investment |
| Baseball. | companies served by The Vanguard Group (1988–2008). |
| |
| André F. Perold | Heidi Stam | |
| Born 1952. Trustee Since December 2004. Principal | Born 1956. Secretary Since July 2005. Principal |
| Occupation(s) During the Past Five Years: George | Occupation(s) During the Past Five Years: Managing |
| Gund Professor of Finance and Banking, Emeritus | Director of The Vanguard Group, Inc.; General Counsel |
| at the Harvard Business School (retired 2011); | of The Vanguard Group; Secretary of The Vanguard |
| Chief Investment Officer and Managing Partner of | Group and of each of the investment companies |
| HighVista Strategies LLC (private investment firm); | served by The Vanguard Group; Director and Senior |
| Director of Rand Merchant Bank; Overseer of the | Vice President of Vanguard Marketing Corporation. |
| Museum of Fine Arts Boston. | | |
| | Vanguard Senior ManagementTeam |
| Alfred M. Rankin, Jr. | | |
| Born 1941. Trustee Since January 1993. Principal | Mortimer J. Buckley | Chris D. McIsaac |
| Occupation(s) During the Past Five Years: Chairman, | Kathleen C. Gubanich | Michael S. Miller |
| President, and Chief Executive Officer of NACCO | Paul A. Heller | James M. Norris |
| Industries, Inc. (housewares/lignite), and of Hyster- | Martha G. King | Glenn W. Reed |
| Yale Materials Handling, Inc. (forklift trucks); Chairman | John T. Marcante | |
| of the Board of University Hospitals of Cleveland. | | |
| |
| Peter F. Volanakis | Chairman Emeritus and Senior Advisor |
| Born 1955. Trustee Since July 2009. Principal | | |
| Occupation(s) During the Past Five Years: President | John J. Brennan | |
| and Chief Operating Officer (retired 2010) of Corning | Chairman, 1996–2009 | |
| Incorporated (communications equipment); Trustee of | Chief Executive Officer and President, 1996–2008 |
| Colby-Sawyer College; Member of the Advisory Board | | |
| of the Norris Cotton Cancer Center and of the Advisory | Founder | |
| Board of the Parthenon Group (strategy consulting). | | |
| | John C. Bogle | |
| | Chairman and Chief Executive Officer, 1974–1996 |
1 Mr. McNabb is considered an “interested person,” as defined in the Investment Company Act of 1940, because he is an officer of the
Vanguard funds.
2 December 2002 for Vanguard Equity Income Fund, the Vanguard Municipal Bond Funds, and the Vanguard State Tax-Exempt Funds.
| 
|
| | P.O. Box 2600 |
| | Valley Forge, PA 19482-2600 |
| |
| |
| |
| Connect with Vanguard® > vanguard.com | |
| |
| |
| |
| Fund Information > 800-662-7447 | CFA® is a registered trademark owned by CFA Institute. |
| Direct Investor Account Services > 800-662-2739 | |
| Institutional Investor Services > 800-523-1036 | |
| Text Telephone for People | |
| Who Are Deaf or Hard of Hearing> 800-749-7273 | |
| |
| This material may be used in conjunction | |
| with the offering of shares of any Vanguard | |
| fund only if preceded or accompanied by | |
| the fund’s current prospectus. | |
| |
| All comparative mutual fund data are from Lipper, a | |
| Thomson Reuters Company, or Morningstar, Inc., unless | |
| otherwise noted. | |
| |
| You can obtain a free copy of Vanguard’s proxy voting | |
| guidelines by visiting vanguard.com/proxyreporting or by | |
| calling Vanguard at 800-662-2739. The guidelines are | |
| also available from the SEC’s website, sec.gov. In | |
| addition, you may obtain a free report on how your fund | |
| voted the proxies for securities it owned during the 12 | |
| months ended June 30. To get the report, visit either | |
| vanguard.com/proxyreporting or sec.gov. | |
| |
| You can review and copy information about your fund at | |
| the SEC’s Public Reference Room in Washington, D.C. To | |
| find out more about this public service, call the SEC at | |
| 202-551-8090. Information about your fund is also | |
| available on the SEC’s website, and you can receive | |
| copies of this information, for a fee, by sending a | |
| request in either of two ways: via e-mail addressed to | |
| publicinfo@sec.gov or via regular mail addressed to the | |
| Public Reference Section, Securities and Exchange | |
| Commission, Washington, DC 20549-1520. | |
| |
| | © 2014 The Vanguard Group, Inc. |
| | All rights reserved. |
| | Vanguard Marketing Corporation, Distributor. |
| |
| | Q3010 122014 |

Annual Report | October 31, 2014
Vanguard High Dividend Yield Index Fund
The mission continues
On May 1, 1975, Vanguard began operations, a fledgling company based on the simple but revolutionary idea that a mutual fund company should be managed solely in the interest of its investors.
Four decades later, that revolutionary spirit continues to animate the enterprise. Vanguard remains on a mission to give investors the best chance of investment success.
As we mark our 40th anniversary, we thank you for entrusting your assets to Vanguard and giving us the opportunity to help you reach your financial goals in the decades to come.
| |
| Contents | |
| Your Fund’s Total Returns. | 1 |
| Chairman’s Letter. | 2 |
| Fund Profile. | 7 |
| Performance Summary. | 9 |
| Financial Statements. | 11 |
| Your Fund’s After-Tax Returns. | 27 |
| About Your Fund’s Expenses. | 28 |
| Glossary. | 30 |
Please note: The opinions expressed in this report are just that—informed opinions. They should not be considered promises or advice. Also, please keep in mind that the information and opinions cover the period through the date on the front of this report. Of course, the risks of investing in your fund are spelled out in the prospectus.
See the Glossary for definitions of investment terms used in this report.
About the cover: Since our founding, Vanguard has drawn inspiration from the enterprise and valor demonstrated by British naval hero Horatio Nelson and his command at the Battle of the Nile in 1798. The photograph displays a replica of a merchant ship from the same era as Nelson’s flagship, the HMS Vanguard.
Your Fund’s Total Returns
Fiscal Year Ended October 31, 2014
| | Total |
| | Returns |
| Vanguard High Dividend Yield Index Fund | |
| Investor Shares | 16.48% |
| ETF Shares | |
| Market Price | 16.46 |
| Net Asset Value | 16.56 |
| FTSE High Dividend Yield Index | 16.66 |
| Equity Income Funds Average | 12.64 |
Equity Income Funds Average: Derived from data provided by Lipper, a Thomson Reuters Company.The Vanguard ETF® Shares shown are traded on the NYSE Arca exchange and are available only through brokers. The table provides ETF returns based on both the NYSE Arca market price and the net asset value for a share. U.S. Pat. Nos. 6,879,964; 7,337,138; 7,720,749; 7,925,573; 8,090,646; and 8,417,623.For the ETF Shares, the market price is determined by the midpoint of the bid-offer spread as of the closing time of the New York Stock Exchange (generally 4 p.m., Eastern time). The net asset value is also determined as of the NYSE closing time. For more information about how the ETF Shares' market prices have compared with their net asset value, visit vanguard.com, select your ETF, and then select the Price and Performance tab. The ETF premium/discount analysis there shows the percentages of days on which the ETF Shares' market price was above or below the NAV.Your Fund’s Performance at a Glance
October 31, 2013, Through October 31, 2014
| | | | |
| | | | Distributions Per Share |
| | Starting | Ending | | |
| | Share | Share | Income | Capital |
| | Price | Price | Dividends | Gains |
| Vanguard High Dividend Yield Index Fund | | | | |
| Investor Shares | $23.83 | $26.98 | $0.724 | $0.000 |
| ETF Shares | 60.16 | 68.11 | 1.878 | 0.000 |
1

Chairman’s Letter
Dear Shareholder,
U.S. stocks climbed to record highs during the 12 months ended October 31, 2014 despite some retrenchment at times amid concerns about the pace of economic growth, the prospect of rising interest rates, and bouts of instability abroad. Dividend-paying stocks fared even a little better, with Vanguard High Dividend Yield Index Fund returning 16.48%. (All returns and yields cited in this letter are for Investor Shares.)
That performance was in line with the 16.66% return of the fund’s benchmark, the FTSE High Dividend Yield Index. The fund placed well ahead of the 12.64% average return of its peer group.
At the period’s close, the fund’s 30-day SEC yield was 2.82%, compared with the 1.70% yield of the broad stock market, as measured by Vanguard Total Stock Market Index Fund.
Results for the High Dividend Yield Index Fund were positive across all ten market sectors. Technology stocks stood out the most, followed by utilities, health care, and financials.
Their smooth ride turned jagged, but U.S. stocks ended higher
Punctuated by a roller coaster of an October, the broad U.S. stock market returned about 16% for the 12 months ended October 31.
Impressive corporate earnings and various global stimulus measures generally supported stocks against a bleaker
2
backdrop that included tensions in the Middle East and Ukraine and other international economic concerns. But over the first two weeks of October, stocks declined sharply as investors reacted to weakness in the global economy, especially the slowdown in China and the threat of deflation in Europe. Reflecting confidence in the U.S. economy, however, the Federal Reserve announced on October 29 that it was ending its stimulative bond-buying program as anticipated.
U.S. stocks staged an impressive rebound in the period’s final two weeks, and several major indexes finished at record highs. International stocks didn’t fare as well. Emerging markets posted a modest advance for the 12 months, while stocks from the developed markets of Europe and the Pacific region slipped.
U.S. bonds posted positive results as already low yields declined
The broad U.S. taxable bond market returned 4.14%. Bond prices, which backtracked at times over the summer, climbed in October as investors sought sanctuary from stock market volatility.
Overall, bond returns have been strong despite many analysts’ expectations that already low yields wouldn’t decline further. Prices rose and yields fell even as the Fed began steadily reducing its bond purchases in January. (Bond prices and yields move in
| | | |
| Market Barometer | | | |
| |
| | | Average Annual Total Returns |
| | | Periods Ended October 31, 2014 |
| | One | Three | Five |
| | Year | Years | Years |
| Stocks | | | |
| Russell 1000 Index (Large-caps) | 16.78% | 19.90% | 16.98% |
| Russell 2000 Index (Small-caps) | 8.06 | 18.18 | 17.39 |
| Russell 3000 Index (Broad U.S. market) | 16.07 | 19.77 | 17.01 |
| FTSE All-World ex US Index (International) | 0.45 | 8.07 | 6.38 |
| |
| Bonds | | | |
| Barclays U.S. Aggregate Bond Index (Broad taxable market) | 4.14% | 2.73% | 4.22% |
| Barclays Municipal Bond Index (Broad tax-exempt market) | 7.82 | 4.93 | 5.26 |
| Citigroup Three-Month U.S. Treasury Bill Index | 0.04 | 0.04 | 0.06 |
| |
| CPI | | | |
| Consumer Price Index | 1.66% | 1.60% | 1.89% |
3
opposite directions.) The yield of the 10-year U.S. Treasury note ended October at 2.31%, down from 2.54% a year earlier.
Municipal bonds returned 7.82%, with tax-exempt issues in high demand even at a time of reduced supply.
International bond markets (as measured by the Barclays Global Aggregate Index ex USD) slid in September and October en route to a –2.53% return for the 12 months.
The Fed’s target for short-term interest rates remained at 0%–0.25%, restraining returns for money market funds and savings accounts.
The fund’s larger-cap tilt helped its performance for the period
Vanguard High Dividend Yield Index Fund exposure to stocks of U.S. companies that are expected to pay higher-than-average dividend yields. That focus means the composition of the fund differs significantly from that of the broad U.S. stock market. The fund tends to hold not only more stocks in traditional dividend-paying sectors such as consumer goods and utilities but also more large-capitalization stocks. With small-caps encountering some crosswinds during the period because of concerns about the run-up in their valuations, the fund’s larger-cap bias proved an advantage over the latter part of the fiscal year in particular.
| | | |
| Expense Ratios | | | |
| Your Fund Compared With Its Peer Group | | | |
| |
| | Investor | ETF | Peer Group |
| | Shares | Shares | Average |
| High Dividend Yield Index Fund | 0.19% | 0.10% | 1.22% |
The fund expense ratios shown are from the prospectus dated February 25, 2014, and represent estimated costs for the current fiscal year. For the fiscal year ended October 31, 2014, the fund’s expense ratios were 0.18% for Investor Shares and 0.10% for ETF Shares. The peer-group expense ratio is derived from data provided by Lipper, a Thomson Reuters Company, and captures information through year-end 2013.Peer group: Equity Income Funds.4
By sector, technology stocks produced strong returns over the 12 months. Tech companies have grown and matured over the years and now make up the largest sector in the fund’s index. New consumer-product rollouts and the robust pace at which corporations expanded and upgraded their IT infrastructure helped some of the biggest players boost the sector’s return to about 38%.
The defensive utilities sector returned more than 21%, with broad-based gains among electricity, gas, and water stocks. Health care returned nearly 19%, largely because big pharmaceutical companies did particularly well, thanks to their attractive yields and improving product pipelines.
They also benefited from a sectorwide lift from an anticipated increase in health care spending given the expanded number of insured under the Affordable Care Act.
Financial stocks were also a strong suit for the fund. Although the index doesn’t hold a number of big banks that, in the wake of the financial crisis, are still paying out dividends below their historical norms, some other big banks that are in the index helped the sector return more than 18%.
The oil and gas, consumer services, and telecommunications sectors lagged for the period, though they finished in positive territory.
| |
| Total Returns | |
| Inception Through October 31, 2014 | |
| | Average |
| | Annual Return |
| High Dividend Yield Index Fund Investor Shares (Returns since inception: 11/16/2006) | 6.91% |
| FTSE High Dividend Yield Index | 7.14 |
| Equity Income Funds Average | 5.85 |
| Equity Income Funds Average: Derived from data provided by Lipper, a Thomson Reuters Company. | |
The figures shown represent past performance, which is not a guarantee of future results. (Current performance may be lower or higher than the performance data cited. For performance data current to the most recent month-end, visit our website at vanguard.com/performance.) Note, too, that both investment returns and principal value can fluctuate widely, so an investor’s shares, when sold, could be worth more or less than their original cost.
5
Since its inception, the fund has built a solid track record
Vanguard High Dividend Yield Index Fund, which was launched in November 2006, has fulfilled its primary objective of closely tracking the performance of its target index. The ride over these eight years hasn’t been smooth, with stocks plunging during the financial crisis then rebounding strongly thereafter. Even with those wide swings, the fund managed to produce an annual return of 6.91%, in line with the 7.14% result for its index, which, like all indexes, bears no expenses. The fund also outpaced the 5.85% average return of its peer group.
When market volatility heats up, the best response is to keep cool
After several years of strength, stocks hit a rough patch toward the close of the fiscal year, as I noted earlier. For the first half of October, global stock markets (as measured by the FTSE Global All Cap Index) returned –5.56%. Even though stocks rebounded in the second half of the month, many investors undoubtedly were left feeling unsettled.
What’s my best advice to anxious shareholders? Remain calm and remember that volatility is a normal part of stock market investing. The value of keeping a cool head is highlighted in a Vanguard research paper that looked at how investors behaved during the financial crisis, when global stocks declined about 58% and U.S. stocks about 55%.
The 2010 paper, Resilience in Volatile Markets: 401(k) Participant Behavior, September 2007–December 2009, examined the behavior of participants in Vanguard-administered retirement plans. During that time, about three-quarters of participants made no changes to their accounts, and only 3% gave up on stocks completely.
As stocks recovered, this discipline yielded big benefits. From the end of 2008 to the end of 2013, the average Vanguard 401(k) portfolio nearly doubled in value, largely because of the surge in stock prices.
I’m pleased that, over time, our clients have demonstrated an impressive ability to remain focused on their long-term goals. They stayed the course through the 1987 correction, the dot-com boom of the 1990s, and the more recent financial crisis, and they continue to do so today.
As always, thank you for investing with Vanguard.
Sincerely,

F. William McNabb III
Chairman and Chief Executive Officer
November 12, 2014
6
High Dividend Yield Index Fund
Fund Profile
As of October 31, 2014
| | | |
| Share-Class Characteristics | |
| |
| | Investor | ETF |
| | Shares | Shares |
| Ticker Symbol | VHDYX | VYM |
| Expense Ratio1 | 0.19% | 0.10% |
| 30-Day SEC Yield | 2.82% | 2.90% |
| | | | |
| Portfolio Characteristics | | |
| | | | DJ |
| | | | U.S. |
| | | FTSE High | Total |
| | | Dividend | Market |
| | | Yield | FA |
| | Fund | Index | Index |
| Number of Stocks | 393 | 393 | 3,756 |
| Median Market Cap | $140.0B | $140.0B | $47.3B |
| Price/Earnings Ratio | 16.8x | 16.8x | 20.4x |
| Price/Book Ratio | 2.7x | 2.7x | 2.7x |
| Return on Equity | 21.3% | 21.3% | 17.8% |
| Earnings Growth | | | |
| Rate | 12.7% | 12.7% | 15.7% |
| Dividend Yield | 3.0% | 3.0% | 1.9% |
| Foreign Holdings | 0.0% | 0.0% | 0.0% |
| Turnover Rate | 12% | — | — |
| Short-Term Reserves | -0.1% | — | — |
| | | |
| Volatility Measures | | |
| | FTSE High | DJ |
| | Dividend | U.S. Total |
| | Yield | Market |
| | Index | FA Index |
| R-Squared | 1.00 | 0.79 |
| Beta | 1.00 | 0.80 |
| These measures show the degree and timing of the fund’s |
| fluctuations compared with the indexes over 36 months. |
| | | |
| Ten Largest Holdings (% of total net assets) |
| Apple Inc. | Computer Hardware | 7.5% |
| Exxon Mobil Corp. | Integrated Oil & Gas | 4.8 |
| Microsoft Corp. | Software | 4.0 |
| Johnson & Johnson | Pharmaceuticals | 3.4 |
| Wells Fargo & Co. | Banks | 3.2 |
| General Electric Co. | Diversified Industrials | 3.0 |
| Procter & Gamble Co. | Nondurable | |
| | Household Products | 2.7 |
| Chevron Corp. | Integrated Oil & Gas | 2.6 |
| JPMorgan Chase & Co. | Banks | 2.6 |
| Verizon Communications | Fixed Line | |
| Inc. | Telecommunications | 2.4 |
| Top Ten | | 36.2% |
| The holdings listed exclude any temporary cash investments and equity index products. |
|
Investment Focus

1 The expense ratios shown are from the prospectus dated February 25, 2014, and represent estimated costs for the current fiscal year. For the fiscal year ended October 31, 2014, the expense ratios were 0.18% for Investor Shares and 0.10% for ETF Shares.
7
High Dividend Yield Index Fund
Sector Diversification (% of equity exposure)
| | | FTSE High | DJ |
| | | Dividend | U.S. Total |
| | | Yield | Market |
| | Fund | Index | FA Index |
| Basic Materials | 3.5% | 3.5% | 2.9% |
| Consumer Goods | 13.5 | 13.5 | 9.9 |
| Consumer Services | 5.8 | 5.8 | 13.2 |
| Financials | 12.4 | 12.4 | 18.7 |
| Health Care | 11.3 | 11.2 | 13.1 |
| Industrials | 12.1 | 12.1 | 12.7 |
| Oil & Gas | 10.7 | 10.7 | 8.3 |
| Technology | 17.9 | 17.9 | 15.8 |
| Telecommunications | 4.9 | 5.0 | 2.1 |
| Utilities | 7.9 | 7.9 | 3.3 |
8
High Dividend Yield Index Fund
Performance Summary
All of the returns in this report represent past performance, which is not a guarantee of future results that may be achieved by the fund. (Current performance may be lower or higher than the performance data cited. For performance data current to the most recent month-end, visit our website at vanguard.com/performance.) Note, too, that both investment returns and principal value can fluctuate widely, so an investor’s shares, when sold, could be worth more or less than their original cost. The returns shown do not reflect taxes that a shareholder would pay on fund distributions or on the sale of fund shares.
Cumulative Performance: November 16, 2006, Through October 31, 2014
Initial Investment of $10,000
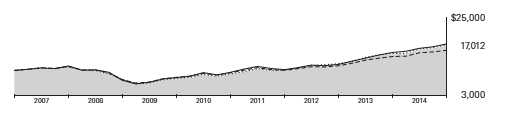
| | | | | |
| | | | Average Annual Total Returns | |
| | | Periods Ended October 31, 2014 | |
| | | | | Since | Final Value |
| | | One | Five | Inception | of a $10,000 |
| | | Year | Years | (11/16/2006) | Investment |
| | High Dividend Yield Index | | | | |
| | Fund*Investor Shares | 16.48% | 17.13% | 6.91% | $17,012 |
| ••••••• | FTSE High Dividend Yield Index | 16.66 | 17.38 | 7.14 | 17,312 |
| – – – – | Equity Income Funds Average | 12.64 | 14.34 | 5.85 | 15,725 |
| | Dow Jones U.S. Total Stock Market | | | | |
| | Float Adjusted Index | 16.00 | 17.09 | 7.30 | 17,521 |
Equity Income Funds Average: Derived from data provided by Lipper, a Thomson Reuters Company.
"Since Inception" performance is calculated from the Investor Shares’ inception date for both the fund and its comparative standards. |
|
| | | | |
| | | | Since | Final Value |
| | One | Five | Inception | of a $10,000 |
| | Year | Years | (11/10/2006) | Investment |
| High Dividend Yield Index Fund | | | | |
| ETF Shares Net Asset Value | 16.56% | 17.25% | 7.13% | $17,319 |
| FTSE High Dividend Yield Index | 16.66 | 17.38 | 7.24 | 17,458 |
| Dow Jones U.S. Total Stock Market Float | | | | |
| Adjusted Index | 16.00 | 17.09 | 7.49 | 17,793 |
| "Since Inception" performance is calculated from the ETF Shares’ inception date for both the fund and its comparative standards. |
See Financial Highlights for dividend and capital gains information.
9
High Dividend Yield Index Fund
| | | |
| Cumulative Returns of ETF Shares: November 10, 2006, Through October 31, 2014 | |
| |
| | | | Since |
| | One | Five | Inception |
| | Year | Years | (11/10/2006) |
| High Dividend Yield Index Fund ETF Shares Market | | | |
| Price | 16.46% | 121.74% | 73.18% |
| High Dividend Yield Index Fund ETF Shares Net | | | |
| Asset Value | 16.56 | 121.64 | 73.19 |
| FTSE High Dividend Yield Index | 16.66 | 122.85 | 74.58 |
"Since Inception" performance is calculated from the ETF Shares’ inception date for both the fund and its comparative standards.
Fiscal-Year Total Returns (%): November 16, 2006, Through October 31, 2014

Average Annual Total Returns: Periods Ended September 30, 2014
This table presents returns through the latest calendar quarter—rather than through the end of the fiscal period.
Securities and Exchange Commission rules require that we provide this information.
| | | | |
| | Inception | One | Five | Since |
| | Date | Year | Years | Inception |
| Investor Shares | 11/16/2006 | 18.83% | 15.84% | 6.63% |
| ETF Shares | 11/10/2006 | | | |
| Market Price | | 18.96 | 16.01 | 6.86 |
| Net Asset Value | | 18.92 | 15.97 | 6.86 |
10
High Dividend Yield Index Fund
Financial Statements
Statement of Net Assets
As of October 31, 2014
The fund reports a complete list of its holdings in regulatory filings four times in each fiscal year, at the quarter-ends. For the second and fourth fiscal quarters, the lists appear in the fund’s semiannual and annual reports to shareholders. For the first and third fiscal quarters, the fund files the lists with the Securities and Exchange Commission on Form N-Q. Shareholders can look up the fund’s Forms N-Q on the SEC’s website at sec.gov. Forms N-Q may also be reviewed and copied at the SEC’s Public Reference Room (see the back cover of this report for further information).
| | | |
| | | | Market |
| | | | Value |
| | | Shares | ($000) |
| Common Stocks (99.7%)1 | | |
| Basic Materials (3.5%) | | |
| | EI du Pont de | | |
| | Nemours & Co. | 1,469,079 | 101,587 |
| | Dow Chemical Co. | 1,908,692 | 94,289 |
| | LyondellBasell Industries | | |
| | NV Class A | 687,746 | 63,018 |
| | Freeport-McMoRan Inc. | 1,658,683 | 47,273 |
| | Air Products & | | |
| | Chemicals Inc. | 338,289 | 45,554 |
| | International Paper Co. | 682,657 | 34,556 |
| | Nucor Corp. | 505,961 | 27,352 |
| | Newmont Mining Corp. | 795,583 | 14,925 |
| | RPM International Inc. | 212,426 | 9,623 |
| | Steel Dynamics Inc. | 364,522 | 8,388 |
| | Avery Dennison Corp. | 150,019 | 7,028 |
| | Huntsman Corp. | 260,167 | 6,348 |
| | Compass Minerals | | |
| | International Inc. | 53,061 | 4,546 |
| | Olin Corp. | 120,741 | 2,927 |
| | Commercial Metals Co. | 166,595 | 2,880 |
| ^ | Cliffs Natural | | |
| | Resources Inc. | 244,326 | 2,744 |
| | Tronox Ltd. Class A | 100,918 | 2,440 |
| | Innophos Holdings Inc. | 34,701 | 1,978 |
| | A Schulman Inc. | 46,741 | 1,655 |
| | Koppers Holdings Inc. | 28,366 | 1,120 |
| * | Veritiv Corp. | 12,765 | 576 |
| | | | 480,807 |
| Consumer Goods (13.5%) | | |
| | Procter & Gamble Co. | 4,344,698 | 379,162 |
| | Coca-Cola Co. | 6,673,855 | 279,501 |
| | PepsiCo Inc. | 2,408,413 | 231,617 |
| | Philip Morris | | |
| | International Inc. | 2,496,872 | 222,247 |
| | Altria Group Inc. | 3,170,343 | 153,254 |
| | Ford Motor Co. | 6,086,286 | 85,756 |
| | Kimberly-Clark Corp. | 602,296 | 68,824 |
| | Kraft Foods Group Inc. | 940,816 | 53,015 |
| | |
| | | Market |
| | | Value |
| | Shares | ($000) |
| General Mills Inc. | 982,043 | 51,027 |
| Lorillard Inc. | 579,034 | 35,611 |
| Reynolds American Inc. | 492,625 | 30,991 |
| Kellogg Co. | 393,740 | 25,184 |
| Genuine Parts Co. | 245,597 | 23,842 |
| Stanley Black & Decker Inc. | 247,978 | 23,221 |
| ConAgra Foods Inc. | 674,324 | 23,163 |
| Dr Pepper Snapple | | |
| Group Inc. | 311,749 | 21,589 |
| Clorox Co. | 207,379 | 20,634 |
| Mattel Inc. | 540,756 | 16,801 |
| Molson Coors | | |
| Brewing Co. Class B | 217,841 | 16,203 |
| Coach Inc. | 438,081 | 15,061 |
| Autoliv Inc. | 149,735 | 13,737 |
| Campbell Soup Co. | 290,234 | 12,820 |
| Hasbro Inc. | 183,426 | 10,552 |
| Leggett & Platt Inc. | 219,630 | 8,649 |
| Ingredion Inc. | 108,390 | 8,373 |
| Flowers Foods Inc. | 279,569 | 5,312 |
| Tupperware Brands Corp. | 71,637 | 4,567 |
| Scotts Miracle-Gro Co. | | |
| Class A | 57,045 | 3,379 |
| HNI Corp. | 68,598 | 3,200 |
| Steelcase Inc. Class A | 145,109 | 2,571 |
| Vector Group Ltd. | 114,863 | 2,566 |
| B&G Foods Inc. | 85,301 | 2,513 |
| Snyder’s-Lance Inc. | 74,112 | 2,208 |
| Cosan Ltd. | 196,948 | 2,086 |
| Schweitzer-Mauduit | | |
| International Inc. | 46,094 | 1,985 |
| Universal Corp. | 36,991 | 1,646 |
| MDC Holdings Inc. | 58,204 | 1,421 |
| Knoll Inc. | 67,954 | 1,352 |
| Superior Industries | | |
| International Inc. | 34,725 | 677 |
| National Presto | | |
| Industries Inc. | 8,120 | 512 |
| | | 1,866,829 |
11
High Dividend Yield Index Fund
| | | |
| | | | Market |
| | | | Value |
| | | Shares | ($000) |
| Consumer Services (5.8%) | | |
| | Wal-Mart Stores Inc. | 2,592,628 | 197,740 |
| | McDonald’s Corp. | 1,582,227 | 148,302 |
| | Time Warner Cable Inc. | 444,223 | 65,394 |
| | Target Corp. | 1,008,599 | 62,352 |
| | Las Vegas Sands Corp. | 649,484 | 40,437 |
| | Sysco Corp. | 929,729 | 35,832 |
| | Omnicom Group Inc. | 401,528 | 28,854 |
| | Carnival Corp. | 665,865 | 26,734 |
| | Wynn Resorts Ltd. | 130,087 | 24,718 |
| | Kohl’s Corp. | 309,899 | 16,803 |
| | Best Buy Co. Inc. | 442,304 | 15,100 |
| | H&R Block Inc. | 439,158 | 14,189 |
| | Staples Inc. | 1,033,296 | 13,102 |
| | Safeway Inc. | 368,029 | 12,829 |
| | Gannett Co. Inc. | 360,610 | 11,359 |
| | Darden Restaurants Inc. | 210,914 | 10,921 |
| | GameStop Corp. Class A | 183,179 | 7,833 |
| | KAR Auction Services Inc. | 221,275 | 6,718 |
| | International Game | | |
| | Technology | 394,439 | 6,465 |
| | Six Flags Entertainment | | |
| | Corp. | 152,054 | 6,128 |
| | Cinemark Holdings Inc. | 167,153 | 5,904 |
| | Cablevision Systems | | |
| | Corp. Class A | 304,461 | 5,669 |
| | Cracker Barrel Old | | |
| | Country Store Inc. | 35,837 | 4,134 |
| | American Eagle | | |
| | Outfitters Inc. | 289,691 | 3,728 |
| | Hillenbrand Inc. | 99,920 | 3,326 |
| | Meredith Corp. | 59,055 | 3,079 |
| | Regal Entertainment | | |
| | Group Class A | 129,056 | 2,859 |
| | Rent-A-Center Inc. | 84,557 | 2,619 |
| | DineEquity Inc. | 28,829 | 2,565 |
| | Guess? Inc. | 102,337 | 2,269 |
| | Buckle Inc. | 38,102 | 1,879 |
| | Bob Evans Farms Inc. | 37,562 | 1,835 |
| | Copa Holdings SA Class A | 13,358 | 1,562 |
| | National CineMedia Inc. | 96,407 | 1,533 |
| | Cato Corp. Class A | 36,767 | 1,311 |
| ^ | Arcos Dorados | | |
| | Holdings Inc. Class A | 208,113 | 1,282 |
| | Weis Markets Inc. | 20,019 | 894 |
| | Stage Stores Inc. | 41,936 | 707 |
| | CTC Media Inc. | 95,946 | 610 |
| | Speedway Motorsports Inc. | 21,350 | 418 |
| | Harte-Hanks Inc. | 62,989 | 410 |
| | | | 800,403 |
| Financials (12.4%) | | |
| | Wells Fargo & Co. | 8,344,044 | 442,985 |
| | JPMorgan Chase & Co. | 6,011,869 | 363,598 |
| | PNC Financial Services | | |
| | Group Inc. | 864,081 | 74,648 |
| | BlackRock Inc. | 199,993 | 68,220 |
| | |
| | | Market |
| | | Value |
| | Shares | ($000) |
| Prudential Financial Inc. | 732,112 | 64,821 |
| ACE Ltd. | 536,483 | 58,638 |
| Travelers Cos. Inc. | 541,830 | 54,616 |
| Marsh & McLennan | | |
| Cos. Inc. | 869,901 | 47,297 |
| BB&T Corp. | 1,148,281 | 43,497 |
| CME Group Inc. | 510,299 | 42,768 |
| Aflac Inc. | 697,754 | 41,677 |
| Invesco Ltd. | 691,996 | 28,005 |
| Fifth Third Bancorp | 1,332,762 | 26,642 |
| Principal Financial | | |
| Group Inc. | 471,491 | 24,692 |
| M&T Bank Corp. | 185,542 | 22,670 |
| Western Union Co. | 846,542 | 14,357 |
| Navient Corp. | 670,271 | 13,258 |
| FNF Group | 438,725 | 13,092 |
| Huntington Bancshares | | |
| Inc. | 1,305,583 | 12,938 |
| Arthur J Gallagher & Co. | 254,079 | 12,120 |
| Willis Group Holdings plc | 284,087 | 11,514 |
| Cincinnati Financial Corp. | 226,858 | 11,450 |
| New York Community | | |
| Bancorp Inc. | 675,611 | 10,776 |
| PartnerRe Ltd. | 79,480 | 9,195 |
| Lazard Ltd. Class A | 165,998 | 8,169 |
| Axis Capital Holdings Ltd. | 158,311 | 7,621 |
| People’s United | | |
| Financial Inc. | 496,151 | 7,254 |
| Cullen/Frost Bankers Inc. | 87,650 | 7,083 |
| PacWest Bancorp | 154,133 | 6,575 |
| SLM Corp. | 674,660 | 6,443 |
| Umpqua Holdings Corp. | 323,132 | 5,687 |
| Old Republic | | |
| International Corp. | 384,371 | 5,677 |
| FirstMerit Corp. | 259,750 | 4,766 |
| Validus Holdings Ltd. | 119,073 | 4,737 |
| Hanover Insurance | | |
| Group Inc. | 70,201 | 4,699 |
| Hancock Holding Co. | 131,350 | 4,622 |
| Federated Investors Inc. | | |
| Class B | 144,847 | 4,529 |
| Janus Capital Group Inc. | 301,747 | 4,523 |
| BankUnited Inc. | 148,449 | 4,439 |
| ProAssurance Corp. | 94,472 | 4,419 |
| First Niagara Financial | | |
| Group Inc. | 544,380 | 4,077 |
| Bank of Hawaii Corp. | 67,831 | 3,972 |
| Endurance Specialty | | |
| Holdings Ltd. | 65,824 | 3,815 |
| Fulton Financial Corp. | 300,817 | 3,574 |
| Glacier Bancorp Inc. | 118,686 | 3,405 |
| United Bankshares Inc. | 93,677 | 3,211 |
| FNB Corp. | 250,859 | 3,208 |
| Valley National Bancorp | 307,385 | 3,068 |
| Iberiabank Corp. | 43,696 | 3,009 |
| Capitol Federal | | |
| Financial Inc. | 229,204 | 2,936 |
12
High Dividend Yield Index Fund
| | | |
| | | | Market |
| | | | Value |
| | | Shares | ($000) |
| | Susquehanna | | |
| | Bancshares Inc. | 287,427 | 2,820 |
| | Old National Bancorp | 168,968 | 2,458 |
| | Trustmark Corp. | 97,707 | 2,377 |
| | Mercury General Corp. | 43,709 | 2,322 |
| | BOK Financial Corp. | 33,137 | 2,272 |
| | CVB Financial Corp. | 143,865 | 2,270 |
| | Community Bank | | |
| | System Inc. | 59,335 | 2,264 |
| | Kemper Corp. | 60,488 | 2,229 |
| * | Blackhawk Network | | |
| | Holdings Inc. Class B | 63,738 | 2,129 |
| | Home Loan Servicing | | |
| | Solutions Ltd. | 108,442 | 2,083 |
| | Horace Mann | | |
| | Educators Corp. | 65,507 | 1,992 |
| * | FNFV Group | 145,736 | 1,959 |
| | Northwest Bancshares Inc. | 152,261 | 1,954 |
| | Westamerica | | |
| | Bancorporation | 38,802 | 1,914 |
| | Greenhill & Co. Inc. | 42,253 | 1,901 |
| | National Penn | | |
| | Bancshares Inc. | 181,255 | 1,865 |
| | Provident Financial | | |
| | Services Inc. | 100,534 | 1,833 |
| | NBT Bancorp Inc. | 69,393 | 1,782 |
| | CNA Financial Corp. | 43,074 | 1,683 |
| | Boston Private Financial | | |
| | Holdings Inc. | 127,046 | 1,671 |
| | Park National Corp. | 19,609 | 1,654 |
| | First Financial Bancorp | 91,672 | 1,608 |
| | American National | | |
| | Insurance Co. | 13,746 | 1,568 |
| | Chemical Financial Corp. | 52,580 | 1,566 |
| | WesBanco Inc. | 44,988 | 1,550 |
| | BGC Partners Inc. Class A | 179,357 | 1,521 |
| | Renasant Corp. | 50,343 | 1,518 |
| | Safety Insurance Group Inc. | 24,240 | 1,512 |
| | Independent Bank Corp. | 34,304 | 1,400 |
| | First Commonwealth | | |
| | Financial Corp. | 136,227 | 1,274 |
| | S&T Bancorp Inc. | 42,850 | 1,182 |
| | Brookline Bancorp Inc. | 112,122 | 1,075 |
| | United Fire Group Inc. | 33,058 | 1,074 |
| | City Holding Co. | 23,836 | 1,072 |
| | Oritani Financial Corp. | 72,093 | 1,065 |
| | TrustCo Bank Corp. NY | 141,803 | 1,035 |
| | Maiden Holdings Ltd. | 86,099 | 1,029 |
| | Simmons First National | | |
| | Corp. Class A | 23,779 | 998 |
| | Sandy Spring Bancorp Inc. | 37,751 | 974 |
| | Flushing Financial Corp. | 46,531 | 937 |
| | Washington Trust | | |
| | Bancorp Inc. | 22,303 | 856 |
| | Tompkins Financial Corp. | 16,323 | 819 |
| | BancFirst Corp. | 12,463 | 810 |
| | |
| | | Market |
| | | Value |
| | Shares | ($000) |
| Community Trust | | |
| Bancorp Inc. | 22,379 | 805 |
| Dime Community | | |
| Bancshares Inc. | 46,371 | 730 |
| 1st Source Corp. | 22,681 | 710 |
| Stock Yards Bancorp Inc. | 19,068 | 635 |
| GFI Group Inc. | 98,327 | 541 |
| First Financial Corp. | 15,526 | 538 |
| Republic Bancorp Inc. | | |
| Class A | 15,278 | 371 |
| Baldwin & Lyons Inc. | 10,826 | 291 |
| | | 1,713,488 |
| Health Care (11.2%) | | |
| Johnson & Johnson | 4,389,473 | 473,097 |
| Pfizer Inc. | 10,202,226 | 305,557 |
| Merck & Co. Inc. | 4,610,703 | 267,144 |
| AbbVie Inc. | 2,551,121 | 161,894 |
| Bristol-Myers Squibb Co. | 2,638,455 | 153,532 |
| Eli Lilly & Co. | 1,589,485 | 105,430 |
| Baxter International Inc. | 866,090 | 60,748 |
| Quest Diagnostics Inc. | 232,382 | 14,747 |
| Healthcare Services | | |
| Group Inc. | 111,405 | 3,318 |
| Owens & Minor Inc. | 95,042 | 3,167 |
| PDL BioPharma Inc. | 255,271 | 2,177 |
| Meridian Bioscience Inc. | 66,335 | 1,230 |
| | | 1,552,041 |
| Industrials (12.1%) | | |
| General Electric Co. | 16,036,481 | 413,902 |
| 3M Co. | 1,035,711 | 159,261 |
| Boeing Co. | 1,048,170 | 130,927 |
| United Parcel Service Inc. | | |
| Class B | 1,129,054 | 118,449 |
| Caterpillar Inc. | 997,798 | 101,187 |
| Lockheed Martin Corp. | 507,308 | 96,678 |
| Emerson Electric Co. | 1,125,273 | 72,085 |
| General Dynamics Corp. | 507,679 | 70,953 |
| Automatic Data | | |
| Processing Inc. | 769,367 | 62,919 |
| Norfolk Southern Corp. | 493,677 | 54,620 |
| Eaton Corp. plc | 755,334 | 51,657 |
| Raytheon Co. | 496,570 | 51,584 |
| PACCAR Inc. | 565,116 | 36,913 |
| Waste Management Inc. | 746,600 | 36,501 |
| Paychex Inc. | 522,906 | 24,545 |
| Xerox Corp. | 1,842,294 | 24,466 |
| Republic Services Inc. | | |
| Class A | 469,826 | 18,041 |
| CH Robinson | | |
| Worldwide Inc. | 237,204 | 16,417 |
| MeadWestvaco Corp. | 267,274 | 11,805 |
| Packaging Corp. | | |
| of America | 157,305 | 11,339 |
| ADT Corp. | 278,490 | 9,981 |
| Iron Mountain Inc. | 271,702 | 9,800 |
13
High Dividend Yield Index Fund
| | | |
| | | | Market |
| | | | Value |
| | | Shares | ($000) |
| | Broadridge Financial | | |
| | Solutions Inc. | 192,977 | 8,477 |
| | Macquarie Infrastructure | | |
| | Co. LLC | 110,827 | 7,940 |
| | Sonoco Products Co. | 151,606 | 6,196 |
| | Bemis Co. Inc. | 160,198 | 6,163 |
| | RR Donnelley & Sons Co. | 319,310 | 5,572 |
| | National Instruments Corp. | 157,359 | 4,985 |
| | Teekay Corp. | 66,199 | 3,870 |
| | GATX Corp. | 59,493 | 3,772 |
| | Covanta Holding Corp. | 169,552 | 3,742 |
| | MSA Safety Inc. | 50,265 | 2,889 |
| | Harsco Corp. | 128,662 | 2,789 |
| | ABM Industries Inc. | 85,563 | 2,365 |
| | TAL International Group Inc. | 54,072 | 2,332 |
| | Aircastle Ltd. | 107,018 | 2,042 |
| | Greif Inc. Class A | 40,981 | 1,806 |
| | Matson Inc. | 63,366 | 1,805 |
| | Brady Corp. Class A | 68,807 | 1,640 |
| | Ship Finance | | |
| | International Ltd. | 93,464 | 1,607 |
| | Otter Tail Corp. | 50,761 | 1,574 |
| | Seaspan Corp. Class A | 76,139 | 1,553 |
| | Acacia Research Corp. | 79,549 | 1,432 |
| ^ | Sturm Ruger & Co. Inc. | 30,900 | 1,288 |
| | McGrath RentCorp | 33,372 | 1,219 |
| | AVX Corp. | 82,661 | 1,194 |
| | Textainer Group | | |
| | Holdings Ltd. | 33,918 | 1,168 |
| | Nordic American | | |
| | Tankers Ltd. | 133,909 | 1,131 |
| | ManTech International | | |
| | Corp. Class A | 38,245 | 1,077 |
| | Schnitzer Steel | | |
| | Industries Inc. | 41,738 | 983 |
| | Daktronics Inc. | 67,987 | 905 |
| | American Science | | |
| | & Engineering Inc. | 12,769 | 706 |
| | Navios Maritime | | |
| | Holdings Inc. | 117,593 | 693 |
| | Ennis Inc. | 41,852 | 621 |
| | Landauer Inc. | 14,545 | 521 |
| | Electro Rent Corp. | 29,360 | 447 |
| | | | 1,670,534 |
| Oil & Gas (10.6%) | | |
| | Exxon Mobil Corp. | 6,816,442 | 659,218 |
| | Chevron Corp. | 3,051,472 | 366,024 |
| | ConocoPhillips | 1,962,369 | 141,585 |
| | Occidental Petroleum | | |
| | Corp. | 1,255,746 | 111,673 |
| | Williams Cos. Inc. | 1,194,573 | 66,311 |
| ^ | Kinder Morgan Inc. | 1,059,595 | 41,006 |
| | Ensco plc Class A | 373,164 | 15,147 |
| | HollyFrontier Corp. | 319,360 | 14,493 |
| | Helmerich & Payne Inc. | 163,251 | 14,173 |
| | OGE Energy Corp. | 318,227 | 11,867 |
| | | |
| | | | Market |
| | | | Value |
| | | Shares | ($000) |
| | Noble Corp. plc | 417,778 | 8,740 |
| | Targa Resources Corp. | 44,695 | 5,749 |
| | Western Refining Inc. | 111,258 | 5,072 |
| ^ | Diamond Offshore | | |
| | Drilling Inc. | 110,696 | 4,174 |
| | PBF Energy Inc. Class A | 139,930 | 3,648 |
| | Delek US Holdings Inc. | 88,659 | 3,005 |
| | CVR Energy Inc. | 27,617 | 1,342 |
| ^ | EXCO Resources Inc. | 323,896 | 988 |
| * | Paragon Offshore plc | 133,474 | 650 |
| | W&T Offshore Inc. | 48,526 | 441 |
| | Gulfmark Offshore Inc. | 9,389 | 283 |
| | | | 1,475,589 |
| Technology (17.8%) | | |
| | Apple Inc. | 9,570,630 | 1,033,628 |
| | Microsoft Corp. | 11,882,699 | 557,893 |
| | Intel Corp. | 7,985,448 | 271,585 |
| | Cisco Systems Inc. | 8,233,712 | 201,479 |
| | Texas Instruments Inc. | 1,706,446 | 84,742 |
| | Applied Materials Inc. | 1,946,124 | 42,990 |
| | Corning Inc. | 2,063,823 | 42,164 |
| | Seagate Technology plc | 500,544 | 31,449 |
| | Symantec Corp. | 1,109,356 | 27,534 |
| | Analog Devices Inc. | 500,731 | 24,846 |
| | KLA-Tencor Corp. | 265,039 | 20,978 |
| | Linear Technology Corp. | 381,105 | 16,327 |
| | CA Inc. | 536,610 | 15,594 |
| | Microchip Technology Inc. | 318,213 | 13,718 |
| | Maxim Integrated | | |
| | Products Inc. | 455,252 | 13,357 |
| | Harris Corp. | 170,888 | 11,894 |
| | Garmin Ltd. | 172,349 | 9,562 |
| * | CDK Global Inc. | 256,536 | 8,620 |
| | Pitney Bowes Inc. | 324,029 | 8,017 |
| | Lexmark International Inc. | | |
| | Class A | 99,184 | 4,281 |
| | j2 Global Inc. | 76,074 | 4,115 |
| | Diebold Inc. | 103,371 | 3,662 |
| | Leidos Holdings Inc. | 99,784 | 3,649 |
| | Compuware Corp. | 317,211 | 3,220 |
| | Cypress Semiconductor | | |
| | Corp. | 252,686 | 2,504 |
| | Intersil Corp. Class A | 170,135 | 2,261 |
| | Brooks Automation Inc. | 99,070 | 1,222 |
| | Quality Systems Inc. | 70,841 | 1,070 |
| | Computer Programs | | |
| | & Systems Inc. | 16,900 | 1,064 |
| | Comtech | | |
| | Telecommunications Corp. | 25,488 | 970 |
| | Epiq Systems Inc. | 46,351 | 743 |
| * | Covisint Corp. | 44,070 | 127 |
| | | | 2,465,265 |
| Telecommunications (4.9%) | | |
| | Verizon | | |
| | Communications Inc. | 6,603,742 | 331,838 |
| | AT&T Inc. | 8,353,051 | 291,020 |
14
High Dividend Yield Index Fund
| | |
| | | Market |
| | | Value |
| | Shares | ($000) |
| CenturyLink Inc. | 911,474 | 37,808 |
| Frontier Communications | | |
| Corp. | 1,601,577 | 10,475 |
| Windstream Holdings Inc. | 963,569 | 10,098 |
| Consolidated | | |
| Communications | | |
| Holdings Inc. | 79,739 | 2,065 |
| EarthLink Holdings Corp. | 129,769 | 465 |
| | | 683,769 |
| Utilities (7.9%) | | |
| Duke Energy Corp. | 1,128,502 | 92,706 |
| NextEra Energy Inc. | 695,631 | 69,716 |
| Southern Co. | 1,425,024 | 66,064 |
| Dominion Resources Inc. | 923,411 | 65,839 |
| Exelon Corp. | 1,368,912 | 50,088 |
| American Electric | | |
| Power Co. Inc. | 777,943 | 45,385 |
| Sempra Energy | 392,982 | 43,228 |
| Spectra Energy Corp. | 1,064,661 | 41,660 |
| PG&E Corp. | 753,607 | 37,922 |
| PPL Corp. | 1,062,094 | 37,163 |
| Public Service Enterprise | | |
| Group Inc. | 813,023 | 33,586 |
| Edison International | 520,862 | 32,596 |
| Consolidated Edison Inc. | 464,479 | 29,429 |
| Xcel Energy Inc. | 807,370 | 27,023 |
| FirstEnergy Corp. | 668,052 | 24,945 |
| Northeast Utilities | 505,466 | 24,945 |
| Entergy Corp. | 284,519 | 23,905 |
| DTE Energy Co. | 282,452 | 23,206 |
| NiSource Inc. | 502,880 | 21,151 |
| ONEOK Inc. | 332,108 | 19,574 |
| Wisconsin Energy Corp. | 363,765 | 18,065 |
| CenterPoint Energy Inc. | 682,746 | 16,761 |
| Ameren Corp. | 386,149 | 16,350 |
| American Water | | |
| Works Co. Inc. | 286,050 | 15,266 |
| CMS Energy Corp. | 441,130 | 14,412 |
| SCANA Corp. | 203,014 | 11,143 |
| Pepco Holdings Inc. | 401,176 | 10,968 |
| Alliant Energy Corp. | 176,303 | 10,915 |
| Pinnacle West Capital Corp. | 175,067 | 10,761 |
| UGI Corp. | 273,005 | 10,290 |
| AGL Resources Inc. | 179,227 | 9,662 |
| Integrys Energy Group Inc. | 127,809 | 9,289 |
| Atmos Energy Corp. | 160,100 | 8,485 |
| Westar Energy Inc. | | |
| Class A | 205,991 | 7,789 |
| TECO Energy Inc. | 373,080 | 7,316 |
| Questar Corp. | 280,342 | 6,759 |
| Great Plains Energy Inc. | 233,135 | 6,278 |
| Aqua America Inc. | 232,391 | 6,089 |
| Vectren Corp. | 130,930 | 5,885 |
| Cleco Corp. | 96,717 | 5,200 |
| IDACORP Inc. | 79,907 | 5,053 |
| | | |
| | | | Market |
| | | | Value |
| | | Shares | ($000) |
| | Piedmont Natural | | |
| | Gas Co. Inc. | 124,455 | 4,731 |
| ^ | Hawaiian Electric | | |
| | Industries Inc. | 163,638 | 4,608 |
| | Portland General | | |
| | Electric Co. | 125,097 | 4,555 |
| | Southwest Gas Corp. | 74,113 | 4,305 |
| | New Jersey | | |
| | Resources Corp. | 67,217 | 3,931 |
| | WGL Holdings Inc. | 82,786 | 3,891 |
| | Black Hills Corp. | 70,877 | 3,879 |
| | PNM Resources Inc. | 127,226 | 3,670 |
| | Avista Corp. | 102,870 | 3,647 |
| | UIL Holdings Corp. | 88,323 | 3,634 |
| | ALLETE Inc. | 67,788 | 3,541 |
| | NorthWestern Corp. | 62,410 | 3,298 |
| | Laclede Group Inc. | 64,915 | 3,296 |
| | South Jersey Industries Inc. | 52,659 | 3,088 |
| | MGE Energy Inc. | 54,730 | 2,434 |
| | El Paso Electric Co. | 64,160 | 2,428 |
| | American States Water Co. | 61,275 | 2,192 |
| | Northwest Natural Gas Co. | 43,473 | 2,040 |
| | Empire District Electric Co. | 69,509 | 1,977 |
| | California Water | | |
| | Service Group | 75,153 | 1,956 |
| | SJW Corp. | 24,594 | 786 |
| | | | 1,090,754 |
| Total Common Stocks | | |
| (Cost $10,991,493) | | 13,799,479 |
| Temporary Cash Investments (0.3%)1 | |
| Money Market Fund (0.3%) | | |
| 2,3 | Vanguard Market | | |
| | Liquidity Fund, | | |
| | 0.114% | 43,401,811 | 43,402 |
| |
| | | Face | |
| | | Amount | |
| | | ($000) | |
| U.S. Government and Agency Obligations (0.0%) |
| 4,5 | Federal Home Loan | | |
| | Bank Discount Notes, | | |
| | 0.074%, 12/3/14 | 2,000 | 2,000 |
| 4,5 | Federal Home Loan | | |
| | Bank Discount Notes, | | |
| | 0.100%, 2/4/15 | 1,000 | 1,000 |
| | | | 3,000 |
| Total Temporary Cash Investments | |
| (Cost $46,402) | | 46,402 |
| Total Investments (100.0%) | | |
| (Cost $11,037,895) | | 13,845,881 |
15
| |
| High Dividend Yield Index Fund | |
| |
| |
| | Market |
| | Value |
| | ($000) |
| Other Assets and Liabilities (0.0%) | |
| Other Assets | 29,639 |
| Liabilities3 | (27,419) |
| | 2,220 |
| Net Assets (100%) | 13,848,101 |
| |
| At October 31, 2014, net assets consisted of: |
| | Amount |
| | ($000) |
| Paid-in Capital | 11,032,856 |
| Undistributed Net Investment Income | 31,793 |
| Accumulated Net Realized Losses | (25,291) |
| Unrealized Appreciation (Depreciation) | |
| Investment Securities | 2,807,986 |
| Futures Contracts | 757 |
| Net Assets | 13,848,101 |
| |
| |
| Investor Shares—Net Assets | |
| Applicable to 150,718,407 outstanding | |
| $.001 par value shares of beneficial | |
| interest (unlimited authorization) | 4,066,077 |
| Net Asset Value Per Share— | |
| Investor Shares | $26.98 |
| |
| |
| ETF Shares—Net Assets | |
| Applicable to 143,612,413 outstanding | |
| $.001 par value shares of beneficial | |
| interest (unlimited authorization) | 9,782,024 |
| Net Asset Value Per Share— | |
| ETF Shares | $68.11 |
See Note A in Notes to Financial Statements.
^ Includes partial security positions on loan to broker-dealers. The total value of securities on loan is $7,600,000.
* Non-income-producing security.
1 The fund invests a portion of its cash reserves in equity markets through the use of index futures contracts. After giving effect to futures investments, the fund’s effective common stock and temporary cash investment positions represent 100.0% and 0.0%, respectively, of net assets.
2 Affiliated money market fund available only to Vanguard funds and certain trusts and accounts managed by Vanguard. Rate shown is the 7-day yield.
3 Includes $7,938,000 of collateral received for securities on loan.
4 The issuer operates under a congressional charter; its securities are generally neither guaranteed by the U.S. Treasury nor backed by the full faith and credit of the U.S. government.
5 Securities with a value of $2,300,000 have been segregated as initial margin for open futures contracts.
See accompanying Notes, which are an integral part of the Financial Statements.
16
High Dividend Yield Index Fund
Statement of Operations
| |
| | Year Ended |
| | October 31, 2014 |
| | ($000) |
| Investment Income | |
| Income | |
| Dividends | 355,307 |
| Interest1 | 40 |
| Securities Lending | 304 |
| Total Income | 355,651 |
| Expenses | |
| The Vanguard Group—Note B | |
| Investment Advisory Services | 1,551 |
| Management and Administrative—Investor Shares | 4,972 |
| Management and Administrative—ETF Shares | 4,720 |
| Marketing and Distribution—Investor Shares | 640 |
| Marketing and Distribution—ETF Shares | 1,693 |
| Custodian Fees | 322 |
| Auditing Fees | 32 |
| Shareholders’ Reports—Investor Shares | 25 |
| Shareholders’ Reports—ETF Shares | 250 |
| Trustees’ Fees and Expenses | 8 |
| Total Expenses | 14,213 |
| Net Investment Income | 341,438 |
| Realized Net Gain (Loss) | |
| Investment Securities Sold | 331,533 |
| Futures Contracts | 6,682 |
| Realized Net Gain (Loss) | 338,215 |
| Change in Unrealized Appreciation (Depreciation) | |
| Investment Securities | 1,092,850 |
| Futures Contracts | 31 |
| Change in Unrealized Appreciation (Depreciation) | 1,092,881 |
| Net Increase (Decrease) in Net Assets Resulting from Operations | 1,772,534 |
| 1 Interest income from an affiliated company of the fund was $38,000. |
See accompanying Notes, which are an integral part of the Financial Statements.
17
High Dividend Yield Index Fund
Statement of Changes in Net Assets
| | |
| | Year Ended October 31, |
| | 2014 | 2013 |
| | ($000) | ($000) |
| Increase (Decrease) in Net Assets | | |
| Operations | | |
| Net Investment Income | 341,438 | 250,716 |
| Realized Net Gain (Loss) | 338,215 | 390,351 |
| Change in Unrealized Appreciation (Depreciation) | 1,092,881 | 1,046,139 |
| Net Increase (Decrease) in Net Assets Resulting from Operations | 1,772,534 | 1,687,206 |
| Distributions | | |
| Net Investment Income | | |
| Investor Shares | (98,372) | (69,438) |
| ETF Shares | (235,932) | (171,585) |
| Realized Capital Gain | | |
| Investor Shares | — | — |
| ETF Shares | — | — |
| Total Distributions | (334,304) | (241,023) |
| Capital Share Transactions | | |
| Investor Shares | 614,733 | 1,003,585 |
| ETF Shares | 1,858,114 | 1,688,115 |
| Net Increase (Decrease) from Capital Share Transactions | 2,472,847 | 2,691,700 |
| Total Increase (Decrease) | 3,911,077 | 4,137,883 |
| Net Assets | | |
| Beginning of Period | 9,937,024 | 5,799,141 |
| End of Period1 | 13,848,101 | 9,937,024 |
1 Net Assets—End of Period includes undistributed (overdistributed) net investment income of $31,793,000 and $24,426,000.See accompanying Notes, which are an integral part of the Financial Statements.
18
High Dividend Yield Index Fund
Financial Highlights
| | | | | |
| Investor Shares | | | | | |
| |
| For a Share Outstanding | Year Ended October 31, |
| Throughout Each Period | 2014 | 2013 | 2012 | 2011 | 2010 |
| Net Asset Value, Beginning of Period | $23.83 | $19.76 | $17.30 | $15.94 | $14.15 |
| Investment Operations | | | | | |
| Net Investment Income | .727 | .667 | .579 | .489 | .415 |
| Net Realized and Unrealized Gain (Loss) | | | | | |
| on Investments | 3.147 | 4.063 | 2.446 | 1.355 | 1.792 |
| Total from Investment Operations | 3.874 | 4.730 | 3.025 | 1.844 | 2.207 |
| Distributions | | | | | |
| Dividends from Net Investment Income | (.724) | (.660) | (.565) | (.484) | (.417) |
| Distributions from Realized Capital Gains | — | — | — | — | — |
| Total Distributions | (.724) | (.660) | (.565) | (.484) | (.417) |
| Net Asset Value, End of Period | $26.98 | $23.83 | $19.76 | $17.30 | $15.94 |
| |
| Total Return1 | 16.48% | 24.35% | 17.69% | 11.70% | 15.79% |
| |
| Ratios/Supplemental Data | | | | | |
| Net Assets, End of Period (Millions) | $4,066 | $3,019 | $1,596 | $761 | $296 |
| Ratio of Total Expenses to | | | | | |
| Average Net Assets | 0.18% | 0.19% | 0.20% | 0.25% | 0.30% |
| Ratio of Net Investment Income to | | | | | |
| Average Net Assets | 2.92% | 3.10% | 3.22% | 3.04% | 2.86% |
| Portfolio Turnover Rate2 | 12% | 13% | 11% | 16% | 34% |
1 Total returns do not include account service fees that may have applied in the periods shown. Fund prospectuses provide information about any applicable account service fees.2 Excludes the value of portfolio securities received or delivered as a result of in-kind purchases or redemptions of the fund’s capital shares, including ETF Creation Units.See accompanying Notes, which are an integral part of the Financial Statements.
19
High Dividend Yield Index Fund
Financial Highlights
| | | | | |
| ETF Shares | | | | | |
| |
| For a Share Outstanding | Year Ended October 31, |
| Throughout Each Period | 2014 | 2013 | 2012 | 2011 | 2010 |
| Net Asset Value, Beginning of Period | $60.16 | $49.89 | $43.68 | $40.22 | $35.70 |
| Investment Operations | | | | | |
| Net Investment Income | 1.885 | 1.732 | 1.506 | 1.283 | 1.092 |
| Net Realized and Unrealized Gain (Loss) | | | | | |
| on Investments | 7.943 | 10.247 | 6.180 | 3.442 | 4.527 |
| Total from Investment Operations | 9.828 | 11.979 | 7.686 | 4.725 | 5.619 |
| Distributions | | | | | |
| Dividends from Net Investment Income | (1.878) | (1.709) | (1.476) | (1.265) | (1.099) |
| Distributions from Realized Capital Gains | — | — | — | — | — |
| Total Distributions | (1.878) | (1.709) | (1.476) | (1.265) | (1.099) |
| Net Asset Value, End of Period | $68.11 | $60.16 | $49.89 | $43.68 | $40.22 |
| |
| Total Return | 16.56% | 24.43% | 17.80% | 11.88% | 15.93% |
| |
| Ratios/Supplemental Data | | | | | |
| Net Assets, End of Period (Millions) | $9,782 | $6,918 | $4,203 | $1,984 | $884 |
| Ratio of Total Expenses to Average Net Assets | 0.10% | 0.10% | 0.10% | 0.13% | 0.18% |
| Ratio of Net Investment Income to | | | | | |
| Average Net Assets | 3.00% | 3.19% | 3.32% | 3.16% | 2.98% |
| Portfolio Turnover Rate1 | 12% | 13% | 11% | 16% | 34% |
1 Excludes the value of portfolio securities received or delivered as a result of in-kind purchases or redemptions of the fund’s capital shares, including ETF Creation Units.See accompanying Notes, which are an integral part of the Financial Statements.
20
High Dividend Yield Index Fund
Notes to Financial Statements
Vanguard High Dividend Yield Index Fund is registered under the Investment Company Act of 1940 as an open-end investment company, or mutual fund. The fund offers two classes of shares: Investor Shares and ETF Shares. Investor Shares are available to any investor who meets the fund’s minimum purchase requirements. ETF Shares are listed for trading on NYSE Arca; they can be purchased and sold through a broker.
A. The following significant accounting policies conform to generally accepted accounting principles for U.S. investment companies. The fund consistently follows such policies in preparing its financial statements.
1. Security Valuation: Securities are valued as of the close of trading on the New York Stock Exchange (generally 4 p.m., Eastern time) on the valuation date. Equity securities are valued at the latest quoted sales prices or official closing prices taken from the primary market in which each security trades; such securities not traded on the valuation date are valued at the mean of the latest quoted bid and asked prices. Securities for which market quotations are not readily available, or whose values have been materially affected by events occurring before the fund’s pricing time but after the close of the securities’ primary markets, are valued by methods deemed by the board of trustees to represent fair value. Investments in Vanguard Market Liquidity Fund are valued at that fund’s net asset value. Temporary cash investments acquired over 60 days to maturity are valued using the latest bid prices or using valuations based on a matrix system (which considers such factors as security prices, yields, maturities, and ratings), both as furnished by independent pricing services. Other temporary cash investments are valued at amortized cost, which approximates market value.
2. Futures Contracts: The fund uses index futures contracts to a limited extent, with the objectives of maintaining full exposure to the stock market, enhancing returns, maintaining liquidity, and minimizing transaction costs. The fund may purchase futures contracts to immediately invest incoming cash in the market, or sell futures in response to cash outflows, thereby simulating a fully invested position in the underlying index while maintaining a cash balance for liquidity. The fund may seek to enhance returns by using futures contracts instead of the underlying securities when futures are believed to be priced more attractively than the underlying securities. The primary risks associated with the use of futures contracts are imperfect correlation between changes in market values of stocks held by the fund and the prices of futures contracts, and the possibility of an illiquid market. Counterparty risk involving futures is mitigated because a regulated clearinghouse is the counterparty instead of the clearing broker. To further mitigate counterparty risk, the fund trades futures contracts on an exchange, monitors the financial strength of its clearing brokers and clearinghouse, and has entered into clearing agreements with its clearing brokers. The clearinghouse imposes initial margin requirements to secure the fund’s performance and requires daily settlement of variation margin representing changes in the market value of each contract.
Futures contracts are valued at their quoted daily settlement prices. The aggregate settlement values of the contracts are not recorded in the Statement of Net Assets. Fluctuations in the value of the contracts are recorded in the Statement of Net Assets as an asset (liability) and in the Statement of Operations as unrealized appreciation (depreciation) until the contracts are closed, when they are recorded as realized futures gains (losses).
21
High Dividend Yield Index Fund
During the year ended October 31, 2014, the fund’s average investments in long and short futures contracts represented less than 1% and 0% of net assets, respectively, based on the average of aggregate settlement values at each quarter-end during the period.
3. Federal Income Taxes: The fund intends to continue to qualify as a regulated investment company and distribute all of its taxable income. Management has analyzed the fund’s tax positions taken for all open federal income tax years (October 31, 2011–2014), and has concluded that no provision for federal income tax is required in the fund’s financial statements.
4. Distributions: Distributions to shareholders are recorded on the ex-dividend date.
5. Securities Lending: To earn additional income, the fund lends its securities to qualified institutional borrowers. Security loans are required to be secured at all times by collateral in an amount at least equal to the market value of securities loaned. Daily market fluctuations could cause the value of loaned securities to be more or less than the value of the collateral received. When this occurs, the collateral is adjusted and settled on the next business day. The fund further mitigates its counterparty risk by entering into securities lending transactions only with a diverse group of prequalified counter-parties, monitoring their financial strength, and entering into master securities lending agreements with its counterparties. The master securities lending agreements provide that, in the event of a counterparty’s default (including bankruptcy), the fund may terminate any loans with that borrower, determine the net amount owed, and sell or retain the collateral up to the net amount owed to the fund; however, such actions may be subject to legal proceedings. While collateral mitigates counter-party risk, in the absence of a default the fund may experience delays and costs in recovering the securities loaned. The fund invests cash collateral received in Vanguard Market Liquidity Fund, and records a liability in the Statement of Net Assets for the return of the collateral, during the period the securities are on loan. Securities lending income represents fees charged to borrowers plus income earned on invested cash collateral, less expenses associated with the loan.
6. Credit Facility: The fund and certain other funds managed by The Vanguard Group participate in a $2.89 billion committed credit facility provided by a syndicate of lenders pursuant to a credit agreement that may be renewed annually; each fund is individually liable for its borrowings, if any, under the credit facility. Borrowings may be utilized for temporary and emergency purposes, and are subject to the fund’s regulatory and contractual borrowing restrictions. The participating funds are charged administrative fees and an annual commitment fee of 0.06% of the undrawn amount of the facility; these fees are allocated to the funds based on a method approved by the fund’s board of trustees and included in Management and Administrative expenses on the fund’s Statement of Operations. Any borrowings under this facility bear interest at a rate equal to the higher of the federal funds rate or LIBOR reference rate plus an agreed-upon spread.
The fund had no borrowings outstanding at October 31, 2014, or at any time during the period then ended.
22
High Dividend Yield Index Fund
7. Other: Dividend income is recorded on the ex-dividend date. Interest income includes income distributions received from Vanguard Market Liquidity Fund and is accrued daily. Premiums and discounts on debt securities purchased are amortized and accreted, respectively, to interest income over the lives of the respective securities. Security transactions are accounted for on the date securities are bought or sold. Costs used to determine realized gains (losses) on the sale of investment securities are those of the specific securities sold.
Each class of shares has equal rights as to assets and earnings, except that each class separately bears certain class-specific expenses related to maintenance of shareholder accounts (included in Management and Administrative expenses) and shareholder reporting. Marketing and distribution expenses are allocated to each class of shares based on a method approved by the board of trustees Income, other non-class-specific expenses, and gains and losses on investments are allocated to each class of shares based on its relative net assets.
B. The Vanguard Group furnishes at cost investment advisory, corporate management, administrative, marketing, and distribution services. The costs of such services are allocated to the fund based on methods approved by the board of trustees. The fund has committed to invest up to 0.40% of its net assets in Vanguard. At October 31, 2014, the fund had contributed capital of $1,300,000 to Vanguard (included in Other Assets), representing 0.01% of the fund’s net assets and 0.52% of Vanguard’s capitalization. The fund’s trustees and officers are also directors and officers of Vanguard.
C. Various inputs may be used to determine the value of the fund’s investments. These inputs are summarized in three broad levels for financial statement purposes. The inputs or methodologies used to value securities are not necessarily an indication of the risk associated with investing in those securities.
Level 1—Quoted prices in active markets for identical securities.
Level 2—Other significant observable inputs (including quoted prices for similar securities, interest rates, prepayment speeds, credit risk, etc.).
Level 3—Significant unobservable inputs (including the fund’s own assumptions used to determine the fair value of investments).
The following table summarizes the market value of the fund’s investments as of October 31, 2014, based on the inputs used to value them:
| | | |
| | Level 1 | Level 2 | Level 3 |
| Investments | ($000) | ($000) | ($000) |
| Common Stocks | 13,799,479 | — | — |
| Temporary Cash Investments | 43,402 | 3,000 | — |
| Futures Contracts—Assets1 | 545 | — | — |
| Total | 13,843,426 | 3,000 | — |
| 1 Represents variation margin on the last day of the reporting period. |
23
High Dividend Yield Index Fund
D. At October 31, 2014, the aggregate settlement value of open futures contracts and the related unrealized appreciation (depreciation) were:
| | | | |
| | | | | ($000) |
| | | | Aggregate | |
| | | Number of | Settlement | Unrealized |
| | | Long (Short) | Value | Appreciation |
| Futures Contracts | Expiration | Contracts | Long (Short) | (Depreciation) |
| S&P 500 Index | December 2014 | 93 | 46,765 | 723 |
| E-mini S&P 500 Index | December 2014 | 13 | 1,307 | 34 |
| | | | | 757 |
Unrealized appreciation (depreciation) on open futures contracts is required to be treated as realized gain (loss) for tax purposes.
E. Distributions are determined on a tax basis and may differ from net investment income and realized capital gains for financial reporting purposes. Differences may be permanent or temporary. Permanent differences are reclassified among capital accounts in the financial statements to reflect their tax character. Temporary differences arise when certain items of income, expense, gain, or loss are recognized in different periods for financial statement and tax purposes. These differences will reverse at some time in the future. Differences in classification may also result from the treatment of short-term gains as ordinary income for tax purposes.
Certain of the fund’s investments are in securities considered to be passive foreign investment companies, for which any unrealized appreciation and/or realized gains are required to be included in distributable net income for tax purposes. During the year ended October 31, 2014, the fund realized gains on the sale of passive foreign investment companies of $233,000, which have been included in current and prior periods’ taxable income; accordingly, such gains have been reclassified from accumulated net realized losses to undistributed net investment income. Passive foreign investment companies held at October 31, 2014, had unrealized appreciation of $577,000, of which all has been distributed and is reflected in the balance of undistributed net investment income.
During the year ended October 31, 2014, the fund realized $344,216,000 of net capital gains resulting from in-kind redemptions—in which shareholders exchanged fund shares for securities held by the fund rather than for cash. Because such gains are not taxable to the fund, and are not distributed to shareholders, they have been reclassified from accumulated net realized losses to paid-in capital.
For tax purposes, at October 31, 2014, the fund had $35,839,000 of ordinary income available for distribution. At October 31, 2014, the fund had available capital losses totaling $24,533,000 to offset future net capital gains. Of this amount, $18,315,000 is subject to expiration on October 31, 2018. Capital losses of $6,218,000 realized beginning in fiscal 2012 may be carried forward indefinitely under the Regulated Investment Company Modernization Act of 2010, but must be used before any expiring loss carryforwards.
24
High Dividend Yield Index Fund
At October 31, 2014, the cost of investment securities for tax purposes was $11,038,473,000.
Net unrealized appreciation of investment securities for tax purposes was $2,807,408,000, consisting of unrealized gains of $2,869,925,000 on securities that had risen in value since their purchase and $62,517,000 in unrealized losses on securities that had fallen in value since their purchase.
F. During the year ended October 31, 2014, the fund purchased $4,809,783,000 of investment securities and sold $2,348,318,000 of investment securities, other than temporary cash investments. Purchases and sales include $2,525,114,000 and $1,003,890,000, respectively, in connection with in-kind purchases and redemptions of the fund’s capital shares.
G. Capital share transactions for each class of shares were:
| | | | |
| | | | Year Ended October 31, |
| | | 2014 | | 2013 |
| | Amount | Shares | Amount | Shares |
| | ($000) | (000) | ($000) | (000) |
| Investor Shares | | | | |
| Issued | 1,212,378 | 47,724 | 1,501,318 | 68,725 |
| Issued in Lieu of Cash Distributions | 79,918 | 3,136 | 56,426 | 2,604 |
| Redeemed | (677,563) | (26,847) | (554,159) | (25,363) |
| Net Increase (Decrease)—Investor Shares | 614,733 | 24,013 | 1,003,585 | 45,966 |
| ETF Shares | | | | |
| Issued | 2,875,637 | 44,821 | 3,045,335 | 55,835 |
| Issued in Lieu of Cash Distributions | — | — | — | — |
| Redeemed | (1,017,523) | (16,200) | (1,357,220) | (25,100) |
| Net Increase (Decrease) —ETF Shares | 1,858,114 | 28,621 | 1,688,115 | 30,735 |
H. Management has determined that no material events or transactions occurred subsequent to October 31, 2014, that would require recognition or disclosure in these financial statements.
25
Report of Independent Registered Public Accounting Firm
To the Board of Trustees of Vanguard Whitehall Funds and the Shareholders of Vanguard High Dividend Yield Index Fund:
In our opinion, the accompanying statement of net assets and the related statements of operations and of changes in net assets and the financial highlights present fairly, in all material respects, the financial position of Vanguard High Dividend Yield Index Fund (constituting a separate portfolio of Vanguard Whitehall Funds, hereafter referred to as the “Fund”) at October 31, 2014, the results of its operations for the year then ended, the changes in its net assets for each of the two years in the period then ended, and the financial highlights for the five years in the period then ended, in conformity with accounting principles generally accepted in the United States of America. These financial statements and financial highlights (hereafter referred to as “financial statements”) are the responsibility of the Fund’s management. Our responsibility is to express an opinion on these financial statements based on our audits. We conducted our audits of these financial statements in accordance with the standards of the Public Company Accounting Oversight Board (United States). Those standards require that we plan and perform the audit to obtain reasonable assurance about whether the financial statements are free of material misstatement. An audit includes examining, on a test basis, evidence supporting the amounts and disclosures in the financial statements, assessing the accounting principles used and significant estimates made by management, and evaluating the overall financial statement presentation. We believe that our audits, which included confirmation of securities at October 31, 2014 by correspondence with the custodian and broker, by agreement to the underlying ownership records of the transfer agent and the application of alternative auditing procedures where securities purchased had not been received, provide a reasonable basis for our opinion.
/s/PricewaterhouseCoopers LLP
Philadelphia, Pennsylvania
December 11, 2014
Special 2014 tax information (unaudited) for Vanguard High Dividend Yield Index Fund
This information for the fiscal year ended October 31, 2014, is included pursuant to provisions of the Internal Revenue Code.
The fund distributed $334,304,000 of qualified dividend income to shareholders during the fiscal year.
For corporate shareholders, 100% of investment income (dividend income plus short-term gains, if any) qualifies for the dividends-received deduction.
26
Your Fund’s After-Tax Returns
This table presents returns for your fund both before and after taxes. The after-tax returns are shown in two ways: (1) assuming that an investor owned the fund during the entire period and paid taxes on the fund’s distributions, and (2) assuming that an investor paid taxes on the fund’s distributions and sold all shares at the end of each period.
Calculations are based on the highest individual federal income tax and capital gains tax rates in effect at the times of the distributions and the hypothetical sales. State and local taxes were not considered. After-tax returns reflect any qualified dividend income, using actual prior-year figures and estimates for 2014. (In the example, returns after the sale of fund shares may be higher than those assuming no sale. This occurs when the sale would have produced a capital loss. The calculation assumes that the investor received a tax deduction for the loss.)
The table shows returns for Investor Shares only; returns for other share classes will differ. Please note that your actual after-tax returns will depend on your tax situation and may differ from those shown. Also note that if you own the fund in a tax-deferred account, such as an individual retirement account or a 401(k) plan, this information does not apply to you. Such accounts are not subject to current taxes.
Finally, keep in mind that a fund’s performance—whether before or after taxes—does not guarantee future results.
Average Annual Total Returns: High Dividend Yield Index Fund Investor Shares
Periods Ended October 31, 2014
| | | |
| | | | Since |
| | One | Five | Inception |
| | Year | Years | (11/16/2006) |
| Returns Before Taxes | 16.48% | 17.13% | 6.91% |
| Returns After Taxes on Distributions | 15.69 | 16.52 | 6.38 |
| Returns After Taxes on Distributions and Sale of Fund Shares | 9.90 | 13.89 | 5.50 |
27
About Your Fund’s Expenses
As a shareholder of the fund, you incur ongoing costs, which include costs for portfolio management, administrative services, and shareholder reports (like this one), among others. Operating expenses, which are deducted from a fund’s gross income, directly reduce the investment return of the fund.
A fund’s expenses are expressed as a percentage of its average net assets. This figure is known as the expense ratio. The following examples are intended to help you understand the ongoing costs (in dollars) of investing in your fund and to compare these costs with those of other mutual funds. The examples are based on an investment of $1,000 made at the beginning of the period shown and held for the entire period.
The accompanying table illustrates your fund’s costs in two ways:
• Based on actual fund return. This section helps you to estimate the actual expenses that you paid over the period. The ”Ending Account Value“ shown is derived from the fund‘s actual return, and the third column shows the dollar amount that would have been paid by an investor who started with $1,000 in the fund. You may use the information here, together with the amount you invested, to estimate the expenses that you paid over the period.
To do so, simply divide your account value by $1,000 (for example, an $8,600 account value divided by $1,000 = 8.6), then multiply the result by the number given for your fund under the heading ”Expenses Paid During Period.“
• Based on hypothetical 5% yearly return. This section is intended to help you compare your fund‘s costs with those of other mutual funds. It assumes that the fund had a yearly return of 5% before expenses, but that the expense ratio is unchanged. In this case—because the return used is not the fund’s actual return—the results do not apply to your investment. The example is useful in making comparisons because the Securities and Exchange Commission requires all mutual funds to calculate expenses based on a 5% return. You can assess your fund’s costs by comparing this hypothetical example with the hypothetical examples that appear in shareholder reports of other funds.
Note that the expenses shown in the table are meant to highlight and help you compare ongoing costs only and do not reflect transaction costs incurred by the fund for buying and selling securities. Further, the expenses do not include any purchase, redemption, or account service fees described in the fund prospectus. If such fees were applied to your account, your costs would be higher. Your fund does not carry a “sales load.”
The calculations assume no shares were bought or sold during the period. Your actual costs may have been higher or lower, depending on the amount of your investment and the timing of any purchases or redemptions.
You can find more information about the fund’s expenses, including annual expense ratios, in the Financial Statements section of this report. For additional information on operating expenses and other shareholder costs, please refer to your fund’s current prospectus.
28
| | | |
| Six Months Ended October 31, 2014 | | | |
| | Beginning | Ending | Expenses |
| | Account Value | Account Value | Paid During |
| High Dividend Yield Index Fund | 4/30/2014 | 10/31/2014 | Period |
| Based on Actual Fund Return | | | |
| Investor Shares | $1,000.00 | $1,071.33 | $0.94 |
| ETF Shares | 1,000.00 | 1,071.78 | 0.52 |
| Based on Hypothetical 5% Yearly Return | | | |
| Investor Shares | $1,000.00 | $1,024.30 | $0.92 |
| ETF Shares | 1,000.00 | 1,024.70 | 0.51 |
The calculations are based on expenses incurred in the most recent six-month period. The fund’s annualized six-month expense ratios for that period are 0.18% for Investor Shares and 0.10% for ETF Shares. The dollar amounts shown as “Expenses Paid” are equal to the annualized expense ratio multiplied by the average account value over the period, multiplied by the number of days in the most recent six-month period, then divided by the number of days in the most recent 12-month period.29
Glossary
30-Day SEC Yield. A fund’s 30-day SEC yield is derived using a formula specified by the U.S. Securities and Exchange Commission. Under the formula, data related to the fund’s security holdings in the previous 30 days are used to calculate the fund’s hypothetical net income for that period, which is then annualized and divided by the fund’s estimated average net assets over the calculation period. For the purposes of this calculation, a security’s income is based on its current market yield to maturity (for bonds), its actual income (for asset-backed securities), or its projected dividend yield (for stocks). Because the SEC yield represents hypothetical annualized income, it will differ—at times significantly—from the fund’s actual experience. As a result, the fund’s income distributions may be higher or lower than implied by the SEC yield.
Beta. A measure of the magnitude of a fund’s past share-price fluctuations in relation to the ups and downs of a given market index. The index is assigned a beta of 1.00. Compared with a given index, a fund with a beta of 1.20 typically would have seen its share price rise or fall by 12% when the index rose or fell by 10%. For this report, beta is based on returns over the past 36 months for both the fund and the index. Note that a fund’s beta should be reviewed in conjunction with its R-squared (see definition). The lower the R-squared, the less correlation there is between the fund and the index, and the less reliable beta is as an indicator of volatility.
Dividend Yield. Dividend income earned by stocks, expressed as a percentage of the aggregate market value (or of net asset value, for a fund). The yield is determined by dividing the amount of the annual dividends by the aggregate value (or net asset value) at the end of the period. For a fund, the dividend yield is based solely on stock holdings and does not include any income produced by other investments.
Earnings Growth Rate. The average annual rate of growth in earnings over the past five years for the stocks now in a fund.
Equity Exposure. A measure that reflects a fund’s investments in stocks and stock futures. Any holdings in short-term reserves are excluded.
Expense Ratio. A fund’s total annual operating expenses expressed as a percentage of the fund’s average net assets. The expense ratio includes management and administrative expenses, but does not include the transaction costs of buying and selling portfolio securities.
Foreign Holdings. The percentage of a fund represented by securities or depositary receipts of companies based outside the United States.
Inception Date. The date on which the assets of a fund (or one of its share classes) are first invested in accordance with the fund’s investment objective. For funds with a subscription period, the inception date is the day after that period ends. Investment performance is measured from the inception date.
Median Market Cap. An indicator of the size of companies in which a fund invests; the midpoint of market capitalization (market price x shares outstanding) of a fund’s stocks, weighted by the proportion of the fund’s assets invested in each stock. Stocks representing half of the fund’s assets have market capitalizations above the median, and the rest are below it.
Price/Book Ratio. The share price of a stock divided by its net worth, or book value, per share. For a fund, the weighted average price/book ratio of the stocks it holds.
30
Price/Earnings Ratio. The ratio of a stock’s current price to its per-share earnings over the past year. For a fund, the weighted average P/E of the stocks it holds. P/E is an indicator of market expectations about corporate prospects; the higher the P/E, the greater the expectations for a company’s future growth.
R-Squared. A measure of how much of a fund’s past returns can be explained by the returns from the market in general, as measured by a given index. If a fund’s total returns were precisely synchronized with an index’s returns, its R-squared would be 1.00. If the fund’s returns bore no relationship to the index’s returns, its R-squared would be 0. For this report, R-squared is based on returns over the past 36 months for both the fund and the index.
Return on Equity. The annual average rate of return generated by a company during the past five years for each dollar of shareholder’s equity (net income divided by shareholder’s equity). For a fund, the weighted average return on equity for the companies whose stocks it holds.
Short-Term Reserves. The percentage of a fund invested in highly liquid, short-term securities that can be readily converted to cash.
Turnover Rate. An indication of the fund’s trading activity. Funds with high turnover rates incur higher transaction costs and may be more likely to distribute capital gains (which may be taxable to investors). The turnover rate excludes in-kind transactions, which have minimal impact on costs.
31
The People Who Govern Your Fund
The trustees of your mutual fund are there to see that the fund is operated and managed in your best interests since, as a shareholder, you are a part owner of the fund. Your fund’s trustees also serve on the board of directors of The Vanguard Group, Inc., which is owned by the Vanguard funds and provides services to them on an at-cost basis.
A majority of Vanguard’s board members are independent, meaning that they have no affiliation with Vanguard or the funds they oversee, apart from the sizable personal investments they have made as private individuals. The independent board members have distinguished backgrounds in business, academia, and public service. Each of the trustees and executive officers oversees 177 Vanguard funds.
The following table provides information for each trustee and executive officer of the fund. More information about the trustees is in the Statement of Additional Information, which can be obtained, without charge, by contacting Vanguard at 800-662-7447, or online at vanguard.com.
| |
| InterestedTrustee1 | and Delphi Automotive LLP (automotive components); |
| | Senior Advisor at New Mountain Capital. |
| F. William McNabb III | |
| Born 1957. Trustee Since July 2009. Chairman of the | Amy Gutmann |
| Board. Principal Occupation(s) During the Past Five | Born 1949. Trustee Since June 2006. Principal |
| Years: Chairman of the Board of The Vanguard Group, | Occupation(s) During the Past Five Years: President of |
| Inc., and of each of the investment companies served | the University of Pennsylvania; Christopher H. Browne |
| by The Vanguard Group, since January 2010; Director | Distinguished Professor of Political Science, School of |
| of The Vanguard Group since 2008; Chief Executive | Arts and Sciences, and Professor of Communication, |
| Officer and President of The Vanguard Group, and of | Annenberg School for Communication, with secondary |
| each of the investment companies served by The | faculty appointments in the Department of Philosophy, |
| Vanguard Group, since 2008; Director of Vanguard | School of Arts and Sciences, and at the Graduate |
| Marketing Corporation; Managing Director of The | School of Education, University of Pennsylvania; |
| Vanguard Group (1995–2008). | Trustee of the National Constitution Center; Chair |
| | of the Presidential Commission for the Study of |
| | Bioethical Issues. |
| IndependentTrustees | |
| | JoAnn Heffernan Heisen |
| Emerson U. Fullwood | Born 1950. Trustee Since July 1998. Principal |
| Born 1948. Trustee Since January 2008. Principal | Occupation(s) During the Past Five Years: Corporate |
| Occupation(s) During the Past Five Years: Executive | Vice President and Chief Global Diversity Officer |
| Chief Staff and Marketing Officer for North America | (retired 2008) and Member of the Executive |
| and Corporate Vice President (retired 2008) of Xerox | Committee (1997–2008) of Johnson & Johnson |
| Corporation (document management products and | (pharmaceuticals/medical devices/consumer |
| services); Executive in Residence and 2009–2010 | products); Director of Skytop Lodge Corporation |
| Distinguished Minett Professor at the Rochester | (hotels), the University Medical Center at Princeton, |
| Institute of Technology; Director of SPX Corporation | the Robert Wood Johnson Foundation, and the Center |
| (multi-industry manufacturing), the United Way of | for Talent Innovation; Member of the Advisory Board |
| Rochester, Amerigroup Corporation (managed health | of the Maxwell School of Citizenship and Public Affairs |
| care), the University of Rochester Medical Center, | at Syracuse University. |
| Monroe Community College Foundation, and North | |
| Carolina A&T University. | F. Joseph Loughrey |
| | Born 1949. Trustee Since October 2009. Principal |
| Rajiv L. Gupta | Occupation(s) During the Past Five Years: President |
| Born 1945. Trustee Since December 2001.2 | and Chief Operating Officer (retired 2009) of Cummins |
| Principal Occupation(s) During the Past Five Years: | Inc. (industrial machinery); Chairman of the Board |
| Chairman and Chief Executive Officer (retired 2009) | of Hillenbrand, Inc. (specialized consumer services), |
| and President (2006–2008) of Rohm and Haas Co. | and of Oxfam America; Director of SKF AB (industrial |
| (chemicals); Director of Tyco International, Ltd. | machinery), Hyster-Yale Materials Handling, Inc. |
| (diversified manufacturing and services), Hewlett- | (forklift trucks), the Lumina Foundation for Education, |
| Packard Co. (electronic computer manufacturing), | |
| | |
| and the V Foundation for Cancer Research; Member | Executive Officers | |
| of the Advisory Council for the College of Arts and | | |
| Letters and of the Advisory Board to the Kellogg | Glenn Booraem | |
| Institute for International Studies, both at the | Born 1967. Controller Since July 2010. Principal |
| University of Notre Dame. | Occupation(s) During the Past Five Years: Principal |
| | of The Vanguard Group, Inc.; Controller of each of |
| Mark Loughridge | the investment companies served by The Vanguard |
| Born 1953. Trustee Since March 2012. Principal | Group; Assistant Controller of each of the investment |
| Occupation(s) During the Past Five Years: Senior Vice | companies served by The Vanguard Group (2001–2010). |
| President and Chief Financial Officer (retired 2013) | | |
| at IBM (information technology services); Fiduciary | Thomas J. Higgins | |
| Member of IBM’s Retirement Plan Committee (2004– | Born 1957. Chief Financial Officer Since September |
| 2013); Member of the Council on Chicago Booth. | 2008. Principal Occupation(s) During the Past Five |
| | Years: Principal of The Vanguard Group, Inc.; Chief |
| Scott C. Malpass | Financial Officer of each of the investment companies |
| Born 1962. Trustee Since March 2012. Principal | served by The Vanguard Group; Treasurer of each of |
| Occupation(s) During the Past Five Years: Chief | the investment companies served by The Vanguard |
| Investment Officer and Vice President at the University | Group (1998–2008). | |
| of Notre Dame; Assistant Professor of Finance at the | | |
| Mendoza College of Business at Notre Dame; Member | Kathryn J. Hyatt | |
| of the Notre Dame 403(b) Investment Committee; | Born 1955. Treasurer Since November 2008. Principal |
| Board Member of TIFF Advisory Services, Inc. | Occupation(s) During the Past Five Years: Principal of |
| (investment advisor); Member of the Investment | The Vanguard Group, Inc.; Treasurer of each of the |
| Advisory Committees of the Financial Industry | investment companies served by The Vanguard |
| Regulatory Authority (FINRA) and of Major League | Group; Assistant Treasurer of each of the investment |
| Baseball. | companies served by The Vanguard Group (1988–2008). |
| |
| André F. Perold | Heidi Stam | |
| Born 1952. Trustee Since December 2004. Principal | Born 1956. Secretary Since July 2005. Principal |
| Occupation(s) During the Past Five Years: George | Occupation(s) During the Past Five Years: Managing |
| Gund Professor of Finance and Banking, Emeritus | Director of The Vanguard Group, Inc.; General Counsel |
| at the Harvard Business School (retired 2011); | of The Vanguard Group; Secretary of The Vanguard |
| Chief Investment Officer and Managing Partner of | Group and of each of the investment companies |
| HighVista Strategies LLC (private investment firm); | served by The Vanguard Group; Director and Senior |
| Director of Rand Merchant Bank; Overseer of the | Vice President of Vanguard Marketing Corporation. |
| Museum of Fine Arts Boston. | | |
| | Vanguard Senior ManagementTeam |
| Alfred M. Rankin, Jr. | | |
| Born 1941. Trustee Since January 1993. Principal | Mortimer J. Buckley | Chris D. McIsaac |
| Occupation(s) During the Past Five Years: Chairman, | Kathleen C. Gubanich | Michael S. Miller |
| President, and Chief Executive Officer of NACCO | Paul A. Heller | James M. Norris |
| Industries, Inc. (housewares/lignite), and of Hyster- | Martha G. King | Glenn W. Reed |
| Yale Materials Handling, Inc. (forklift trucks); Chairman | John T. Marcante | |
| of the Board of University Hospitals of Cleveland. | | |
| |
| Peter F. Volanakis | Chairman Emeritus and Senior Advisor |
| Born 1955. Trustee Since July 2009. Principal | | |
| Occupation(s) During the Past Five Years: President | John J. Brennan | |
| and Chief Operating Officer (retired 2010) of Corning | Chairman, 1996–2009 | |
| Incorporated (communications equipment); Trustee of | Chief Executive Officer and President, 1996–2008 |
| Colby-Sawyer College; Member of the Advisory Board | | |
| of the Norris Cotton Cancer Center and of the Advisory | Founder | |
| Board of the Parthenon Group (strategy consulting). | | |
| | John C. Bogle | |
| | Chairman and Chief Executive Officer, 1974–1996 |
1 Mr. McNabb is considered an “interested person,” as defined in the Investment Company Act of 1940, because he is an officer of the Vanguard funds.
2 December 2002 for Vanguard Equity Income Fund, the Vanguard Municipal Bond Funds, and the Vanguard State Tax-Exempt Funds.
| 
|
| | P.O. Box 2600 |
| | Valley Forge, PA 19482-2600 |
| |
| |
| |
| Connect with Vanguard® > vanguard.com | |
| |
| |
| |
| Fund Information > 800-662-7447 | All rights in a FTSE index (the “Index”) vest in FTSE |
| Direct Investor Account Services > 800-662-2739 | International Limited (“FTSE”). “FTSE®” is a trademark |
| | of London Stock Exchange Group companies and is |
| Institutional Investor Services > 800-523-1036 | used by FTSE under licence. The Vanguard fund (the |
| Text Telephone for People | “Product”) has been developed solely by Vanguard. The |
| Who Are Deaf or Hard of Hearing> 800-749-7273 | Index is calculated by FTSE or its agent. FTSE and its |
| | licensors are not connected to and do not sponsor, |
| This material may be used in conjunction | advise, recommend, endorse, or promote the Product |
| with the offering of shares of any Vanguard | and do not accept any liability whatsoever to any |
| fund only if preceded or accompanied by | person arising out of (a) the use of, reliance on, or any |
| the fund’s current prospectus. | error in the Index or (b) investment in or operation of |
| the Product. FTSE makes no claim, prediction, warranty, |
| All comparative mutual fund data are from Lipper, a | or representation either as to the results to be obtained |
| Thomson Reuters Company, or Morningstar, Inc., unless | from the Product or the suitability of the Index for the |
| otherwise noted. | purpose to which it is being put by Vanguard. |
| |
| You can obtain a free copy of Vanguard’s proxy voting | |
| guidelines by visiting vanguard.com/proxyreporting or by | |
| calling Vanguard at 800-662-2739. The guidelines are | |
| also available from the SEC’s website, sec.gov. In | |
| addition, you may obtain a free report on how your fund | |
| voted the proxies for securities it owned during the 12 | |
| months ended June 30. To get the report, visit either | |
| vanguard.com/proxyreporting or sec.gov. | |
| |
| You can review and copy information about your fund at | |
| the SEC’s Public Reference Room in Washington, D.C. To | |
| find out more about this public service, call the SEC at | |
| 202-551-8090. Information about your fund is also | |
| available on the SEC’s website, and you can receive | |
| copies of this information, for a fee, by sending a | |
| request in either of two ways: via e-mail addressed to | |
| publicinfo@sec.gov or via regular mail addressed to the | |
| Public Reference Section, Securities and Exchange | |
| Commission, Washington, DC 20549-1520. | |
| |
| | © 2014 The Vanguard Group, Inc. |
| | All rights reserved. |
| | Vanguard Marketing Corporation, Distributor. |
| |
| | Q6230 122014 |

Annual Report | October 31, 2014
Vanguard Selected Value Fund
The mission continues
On May 1, 1975, Vanguard began operations, a fledgling company based on the simple but revolutionary idea that a mutual fund company should be managed solely in the interest of its investors.
Four decades later, that revolutionary spirit continues to animate the enterprise. Vanguard remains on a mission to give investors the best chance of investment success.
As we mark our 40th anniversary, we thank you for entrusting your assets to Vanguard and giving us the opportunity to help you reach your financial goals in the decades to come.
| |
| Contents | |
| Your Fund’s Total Returns. | 1 |
| Chairman’s Letter. | 2 |
| Advisors’ Report. | 8 |
| Fund Profile. | 13 |
| Performance Summary. | 14 |
| Financial Statements. | 16 |
| Your Fund’s After-Tax Returns. | 28 |
| About Your Fund’s Expenses. | 29 |
| Glossary. | 31 |
Please note: The opinions expressed in this report are just that—informed opinions. They should not be considered promises or advice.
Also, please keep in mind that the information and opinions cover the period through the date on the front of this report. Of course, the
risks of investing in your fund are spelled out in the prospectus.
See the Glossary for definitions of investment terms used in this report.
About the cover: Since our founding, Vanguard has drawn inspiration from the enterprise and valor demonstrated by British
naval hero Horatio Nelson and his command at the Battle of the Nile in 1798. The photograph displays a replica of a merchant
ship from the same era as Nelson’s flagship, the HMS Vanguard.
Your Fund’s Total Returns
| |
| Fiscal Year Ended October 31, 2014 | |
| |
| | Total |
| | Returns |
| Vanguard Selected Value Fund | 11.02% |
| Russell Midcap Value Index | 16.18 |
| Mid-Cap Value Funds Average | 12.20 |
| Mid-Cap Value Funds Average: Derived from data provided by Lipper, a Thomson Reuters Company. |
| | | | |
| Your Fund’s Performance at a Glance | | | | |
| October 31, 2013, Through October 31, 2014 | | | | |
| |
| | | | Distributions Per Share |
| | Starting | Ending | | |
| | Share | Share | Income | Capital |
| | Price | Price | Dividends | Gains |
| Vanguard Selected Value Fund | $28.07 | $29.49 | $0.330 | $1.220 |
1

Chairman’s Letter
Dear Shareholder,
For the fiscal year ended October 31, 2014, mid-capitalization value stocks posted solid results that were nearly identical to those of the broad U.S. market. However, Vanguard Selected Value Fund didn’t fully participate in those gains. The fund returned about 11% for the 12 months, below the Russell Midcap Value Index’s return of about 16% and the average return of about 12% for mid-cap value fund peers.
The fund had pockets of strength, but the advisors’ stock selection detracted from performance in a variety of industry sectors. Although choices among consumer discretionary stocks boosted results, they weren’t enough to overcome gaps in other areas. The fund’s substantial cash position hindered returns as well.
If you hold shares in a taxable account, you may wish to review the table and discussion on after-tax returns for the fiscal year that appear later in this report.
Their smooth ride turned jagged, but U.S. stocks ended higher
Punctuated by a roller coaster of an October, the broad U.S. stock market returned about 16% for the 12 months ended October 31.
Impressive corporate earnings and various global stimulus measures generally supported stocks against a bleaker backdrop that included tensions in the Middle East and Ukraine and other international economic concerns. But over
2
the first two weeks of October, stocks declined sharply as investors reacted to weakness in the global economy, especially the slowdown in China and the threat of deflation in Europe. Reflecting confidence in the U.S. economy, however, the Federal Reserve announced on October 29 that it was ending its stimulative bond-buying program as anticipated.
U.S. stocks staged an impressive rebound in the period’s final two weeks, and several major indexes finished at record highs. International stocks didn’t fare as well. Emerging markets posted a modest advance, and the developed markets of Europe and the Pacific region slipped.
U.S. bonds posted positive returns as already low yields declined
The broad U.S. taxable bond market returned 4.14%. Bond prices, which backtracked at times over the summer, climbed in October as investors sought sanctuary from stock market volatility.
Overall, bond returns have been strong despite many analysts’ expectations that already low yields wouldn’t decline further. Prices rose and yields fell even as the Fed began steadily reducing its bond purchases in January. (Bond prices and yields move in opposite directions.) The yield of the 10-year U.S. Treasury note ended October at 2.31%, down from 2.54% a year earlier.
| | | |
| Market Barometer | | | |
| |
| | | Average Annual Total Returns |
| | Periods Ended October 31, 2014 |
| | One | Three | Five |
| | Year | Years | Years |
| Stocks | | | |
| Russell 1000 Index (Large-caps) | 16.78% | 19.90% | 16.98% |
| Russell 2000 Index (Small-caps) | 8.06 | 18.18 | 17.39 |
| Russell 3000 Index (Broad U.S. market) | 16.07 | 19.77 | 17.01 |
| FTSE All-World ex US Index (International) | 0.45 | 8.07 | 6.38 |
| |
| Bonds | | | |
| Barclays U.S. Aggregate Bond Index (Broad taxable market) | 4.14% | 2.73% | 4.22% |
| Barclays Municipal Bond Index (Broad tax-exempt market) | 7.82 | 4.93 | 5.26 |
| Citigroup Three-Month U.S. Treasury Bill Index | 0.04 | 0.04 | 0.06 |
| |
| CPI | | | |
| Consumer Price Index | 1.66% | 1.60% | 1.89% |
3
Municipal bonds returned 7.82%, with tax-exempt issues in high demand at a time of reduced supply.
International bond markets (as measured by the Barclays Global Aggregate Index ex USD) slid in September and October en route to a –2.53% return for the 12 months.
The Fed’s target for short-term interest rates remained at 0%–0.25%, restraining returns for money market funds and savings accounts.
Results fell within a wide range as the fund struggled to keep pace
One year isn’t a long period in the life of a mutual fund; the difference between success and failure should be measured in years or even decades rather than months or quarters. Even so, Selected Value’s return over the recent period didn’t stack up favorably against its comparative standards or its own long-term record.
Results for the ten industry sectors spanned the full spectrum. Consumer discretionary stocks were the fund’s clear standouts, gaining about 31% and contributing more than 3 percentage points to returns. The benchmark index’s return for the sector was about 12%. Most of the fund’s bright spots in this sector compared to the benchmark came from apparel manufacturers and specialty retailers, with some assistance from department stores and media companies.
| | |
| Expense Ratios | | |
| Your Fund Compared With Its Peer Group | | |
| | | Peer Group |
| | Fund | Average |
| Selected Value Fund | 0.44% | 1.30% |
The fund expense ratio shown is from the prospectus dated June 9, 2014, and represents estimated costs for the current fiscal year. For the
fiscal year ended October 31, 2014, the fund’s expense ratio was 0.41%. The peer-group expense ratio is derived from data provided by
Lipper, a Thomson Reuters Company, and captures information through year-end 2013.
Peer group: Mid-Cap Value Funds.
4
To a slightly lesser degree, the advisors’ information technology holdings also boosted performance. A superior showing from the semiconductor group offset less impressive results from software, hardware, and internet firms. Consumer staples contributed as well. Although the fund had little exposure to the sector overall, its tobacco stocks excelled.
Accounting for nearly 30% of fund assets on average over the period, financials commanded Selected Value’s largest allocation. This commitment, however, wasn’t productive: The fund’s financial stocks gained about 10%, compared with 15% for those in the benchmark index. The fund’s asset management companies and consumer finance firms did well, but the advisors missed out on some opportunities in insurance and specialized financial services.
Health care results were also mixed. The fund’s stocks advanced more than 26%, an impressive number that still fell shy of the nearly 33% returned by the benchmark index. The fund found success among health care providers and service firms but had zero exposure to the top-performing subsector, pharmaceuticals.
Much of the fund’s weakness came from the energy, industrial, and materials sectors—three areas that tend to be sensitive to the rhythms of the business cycle. Declining oil prices hurt energy stocks, particularly those in the oil and gas industries. Subpar stock selection
| |
| Total Returns | |
| Ten Years Ended October 31, 2014 | |
| | Average |
| | Annual Return |
| Selected Value Fund | 10.06% |
| Russell Midcap Value Index | 10.29 |
| Mid-Cap Value Funds Average | 8.88 |
| Mid-Cap Value Funds Average: Derived from data provided by Lipper, a Thomson Reuters Company. |
The figures shown represent past performance, which is not a guarantee of future results. (Current performance may be
lower or higher than the performance data cited. For performance data current to the most recent month-end, visit our
website at vanguard.com/performance.) Note, too, that both investment returns and principal value can fluctuate widely, so
an investor’s shares, when sold, could be worth more or less than their original cost.
5
was most evident in industrials and materials. The fund’s industrial stocks returned close to 6%, less than half the result of their benchmark counterparts.
The fund’s exposure to materials was small, but its return of about –30% was far off the benchmark index’s result of almost 12%. The fund’s precious metal and mining stocks declined, and it didn’t hold aluminum and steel manufacturers, which performed strongly.
Over longer time periods, the fund has found success
Selected Value’s emphasis on out-of- favor companies can be a prescription for underperformance over shorter periods and a route to outperformance in the long term. The fund’s three advisors search for and invest in mid-capitalization stocks of companies they believe the market has undervalued. Sometimes a company must repair or reinvent itself before its stock rebounds, and this process requires patience and conviction on the part of the advisors.
Although results for the recent period weren’t exceptional, the fund’s record looks better when examined under a ten-year light. For the decade ended October 31, 2014, the fund registered an average annualized return of 10.06%. The benchmark index (which bears no expenses) returned 10.29%, and the average annual return of peers was 8.88%.
The fund benefits from the expertise and knowledge of its advisors, who are helped by the fund’s low costs, which allow you to pocket more of your returns.
When market volatility heats up, the best response is to stay cool
After several years of strength, stocks hit a rough patch toward the close of the fiscal year, as I noted earlier. For the first half of October, global stock markets (as measured by the FTSE Global All Cap Index) returned –5.56%. Even though stocks rebounded in the latter part of October, many investors undoubtedly were left feeling unsettled.
What’s my best advice to anxious shareholders? Remain calm and remember that volatility is a normal part of stock market investing. The value of keeping a cool head is highlighted in a Vanguard research paper on investor behavior during the financial crisis, when global stocks declined about 58% and U.S. stocks about 55%.
The 2010 paper, Resilience in Volatile Markets: 401(k) Participant Behavior, September 2007–December 2009, examined the behavior of participants in Vanguard-administered retirement plans. During that time, about three-quarters of participants made no changes to their accounts and only 3% gave up on stocks completely.
6
As stocks recovered, this discipline yielded big benefits. From the end of 2008 to the end of 2013, the average Vanguard 401(k) portfolio nearly doubled in value, largely because of the surge in stock prices.
I’m pleased that, over time, our clients have demonstrated an impressive ability to remain focused on their long-term goals. They stayed the course through the 1987 correction, the dot-com boom of the 1990s, and the 2008 financial crisis, and they continue to do so today.
As always, thank you for investing with Vanguard.
Sincerely,

F. William McNabb III
Chairman and Chief Executive Officer
November 17, 2014
7
Advisors’ Report
For the fiscal year ended October 31, 2014, Vanguard Selected Value Fund returned 11.02%. Your fund is managed by three independent advisors. This provides exposure to distinct yet complementary investment approaches, enhancing the fund’s diversification. It is not uncommon for different advisors to have different views about individual securities or the broader investment environment.
The advisors, the percentage and amount of fund assets each manages, and a brief description of their investment strategies are presented in the table below. The advisors have also prepared a discussion of the investment environment that existed during the fiscal period and of how portfolio positioning reflects this assessment. These comments were prepared on November 19, 2014.
| | | | |
| Vanguard Selected Value Fund Investment Advisors | | |
| |
| | Fund Assets Managed | | |
| Investment Advisor | % | $ Million | Investment Strategy |
| Barrow, Hanley, Mewhinney & | 63 | 6,430 | | Conducts fundamental research on individual stocks |
| Strauss, LLC | | | | exhibiting traditional value characteristics: |
| | | | | price/earnings and price/book ratios below the market |
| | | | average and dividend yields above the market average. |
| Donald Smith & Co., Inc. | 23 | 2,292 | | Conducts fundamental research on the lowest |
| | | | | price-to-tangible-book-value companies. Research |
| | | | | focuses on underlying quality of book value and assets, |
| | | | and on long-term earnings potential. |
| Pzena Investment Management, | 12 | 1,241 | | Uses a fundamental, bottom-up, deep-value-oriented |
| LLC | | | | investment strategy. Seeks to buy good businesses at |
| | | | | low prices, focusing exclusively on companies that are |
| | | | | underperforming their historically demonstrated |
| | | | earnings power. |
| Cash Investments | 2 | 190 | | These short-term reserves are invested by Vanguard in |
| | | | | equity index products to simulate investment in stocks. |
| | | | | Each advisor may also maintain a modest cash |
| | | | position. |
8
Barrow, Hanley, Mewhinney &
Strauss, LLC
Portfolio Managers:
James P. Barrow, Executive Director
Mark Giambrone, Managing Director
A very strong market supported the fund’s double-digit return for the fiscal year. Among many concerns were fears of an economic slowdown and a moderation in the housing recovery. Several geopolitical events caused a temporary pause in expectations that the U.S. economy is recovering nicely and that interest rates are on a path of consistent increases. Our portfolio is positioned for these eventualities with a large weighting in financials that will benefit from an increase in interest rates. We are also overweight in industrials, where prospects should improve with the economy.
As these expectations remained unfulfilled, our portfolio has underperformed this year. Our positioning and convictions in our individual stock selection and subsequent sector weights have not changed. We anticipate that this will lead to solid performance as time goes on and the economy and interest rates rise.
In addition to being overweight in financials—our largest weighting—and industrials, we are overweight in consumer discretionary and health care. We are underweight in information technology, utilities, materials, and REITs.
We believe traditional yield plays like utilities and REITs had substantial runs while interest rates remained low and have very little room for valuation upside or significant yield. We see considerable risk to these valuation levels should interest rates rise.
Donald Smith & Co., Inc.
Portfolio Managers:
Donald G. Smith, Chief Investment Officer
Richard L. Greenberg, CFA,
Senior Vice President
The portfolio at the end of October 2014 continues to meet our criteria of owning a concentrated selection of low price-to-tangible book value stocks with attractive long-term earnings potential. The portfolio currently sells at 105% of tangible book value and 8.2 times our estimate of normalized earnings. In contrast, the Standard & Poor’s 500 Index sells at over 550% of tangible book value and 18 times normalized earnings.
The portfolio’s return during the past year lagged the major indexes. The decline in commodity prices (such as oil and precious metals) affected oil-related and gold and silver stocks. Yamana Gold’s 59% drop yielded the greatest negative contribution to returns. Other precious metal stocks––Coeur Mining, Kinross Gold, and New Gold––also fell, as did oil-sensitive companies including Noble Corp., Tidewater, Paragon Offshore, and WPX Energy.
9
Among the year’s big winners was Micron Technology, the portfolio’s largest holding, which rose 87%. The top performer was AerCap (+114%). Its purchase of International Lease Finance Corporation (ILFC) from AIG at a substantial discount to book value and asset value is highly accretive and could possibly lead to a doubling of earnings per share (EPS).
Domestic airline stocks JetBlue and Southwest benefited from the oligopolistic pricing structure that arose after the three major airline mergers. The top four competitors now control more than 85% of capacity. Royal Caribbean’s new plan to double EPS over the next three years helped propel that stock’s 65% appreciation.
We eliminated our positions in Dillard’s and Southwest Airlines at substantial gains and in Overseas Shipholding Group at a loss. We reduced our holdings in CNA Financial, Exelon, JetBlue, Micron, Nabors Industries, and Royal Caribbean and increased them in AerCap, Air France, American National Insurance, Yamana Gold, Celestica, Ingram Micro, Unum, WPX Energy, and XL Group.
We added eight new names. Peabody Energy is the world’s largest coal company, with thermal and metallurgical operations in the United States and Australia. If coal prices return to a more normalized level, the company could earn $2 per share. We purchased the stock at eight times our conservative estimate of two-to-four-year earnings and 89% of tangible book value.
We purchased Kinross Gold at 61% of tangible book value. It sells at one-half the market cap/revenues of most of its competition despite comparable average mining costs. We believe that the company has been tainted by an overly aggressive, poorly executed acquisition strategy, which has now been put on hold.
Noble Corporation is an offshore drilling contractor with a fleet of drillships, semisubmersibles, and jack-up rigs. It is completing a multiyear upgrade program in the next 12 months. Cash flow should allow for a sustained higher dividend and stock buyback; a master limited partnership will also likely be formed.
New Gold is a low-cost producer with four operating mines and three growth projects in geographically secure countries (Canada, the United States, Australia, Mexico, and Chile). It has positive earnings and cash flow at currently depressed gold prices. We purchased the stock at seven times potential earnings and a discount to tangible book value.
News Corp., a spinoff from 21st Century Fox, owns a variety of media and information providers including The Wall Street Journal, cable properties in Australia, and the largest real estate listing service in Australia. The breakup value of the assets could approach $25 per share; we purchased the stock at a 30% discount to this value.
10
Paragon Offshore, a recent spinoff from Noble Corporation, is an owner of standard-spec offshore drilling rigs. As of October 31, 2014, it sold at 30% of tangible book value, two times 2014 estimated EPS, and a 10.5% dividend yield. Tidewater provides offshore supply services to drillers. The company’s large capital spending program is abating, and it should be able to start returning excess cash flow to shareholders. We purchased the stock at below an understated book value. We also purchased Validus, a high-return reinsurance company, at 7.5 times normalized earnings.
The portfolio’s two largest industry weightings are insurance and technology. We also have exposures to airlines/aircraft leasing and energy. Because of their declines, commodity-related stocks including coal, oil, and precious metals have garnered much of our attention recently, and we may add to these holdings during the tax-loss selling season.
Pzena Investment Management, LLC
Portfolio Managers:
Richard S. Pzena, Founder,
Chief Executive Officer, and
Co-Chief Investment Officer
Manoj Tandon, Principal,
Co-Director of Research
Eli Rabinowich, Principal
For the period from March 28, 2014 (our portfolio’s inception), through October 31, 2014, results were restrained by broad weakness in our energy holdings and anemic performance from Terex and KBR, two of our producer durables. Energy was the worst sector in the market and the only one to decline. Saudi Arabia chose not to defend $100-per-barrel oil in the face of strong supply and slightly lessening demand from China. The share price drop in our energy holdings accelerated in October as oil prices continued to fall.
Terex, a leading manufacturer of aerial work platforms, cranes, and other material-handling machinery, was the largest detractor in the portfolio as the company reported weak earnings and reduced 2014 guidance. Despite the near-term issues, we find Terex’s challenges to be cyclical in nature and thus temporary.
Shares of construction and engineering firm KBR also slid. The company continued to suffer from several problem contracts and weak order growth, especially in the service segment, which we believe will normalize over time. It has $1 billion of net cash on its balance sheet, which provides significant downside protection. We took the opportunity to add to our energy positions as oil prices fell and added to Terex and KBR on weakness as well.
Electronics manufacturer Flextronics International, the portfolio’s top contributor, moved higher. Management reiterated its strategies to move the company away from high-volume consumer products and toward better opportunities (and profitability) in the form of high-touch contracts with nontraditional customers. It also indicated that it remains committed
11
to restructuring so it can limit structural costs as it closes down factories to achieve margin goals.
Our holdings are concentrated in a number of high-quality but discounted cyclical stocks, with significant exposure to attractively valued financials, consumer discretionary, and technology. Within financials, we have a high degree of exposure to the insurance sector. The profitability of these companies is healthy and in line with history, and they are trading at historically low valuations.
Advertising companies have had to contend with lower demand for their services in a post-financial-crisis period of corporate austerity; this has depressed their valuations, and we have invested in a number of them.
High-dividend-paying companies with less-cyclical earnings profiles, such as utilities, REITs, and pharmaceuticals, trade at premium valuations and thus have little representation in our deep-value portfolio. We expect the portfolio to benefit as this valuation gap normalizes over time.
12
Selected Value Fund
Fund Profile
As of October 31, 2014
| | | |
| Portfolio Characteristics | | |
| | | Russell | DJ |
| | | Midcap | U.S. Total |
| | | Value | Market |
| | Fund | Index | FA Index |
| Number of Stocks | 124 | 571 | 3,756 |
| Median Market Cap | $9.5B | $10.2B | $47.3B |
| Price/Earnings Ratio | 15.6x | 21.6x | 20.4x |
| Price/Book Ratio | 1.7x | 1.8x | 2.7x |
| Return on Equity | 13.0% | 11.0% | 17.8% |
| Earnings Growth Rate | 12.9% | 12.4% | 15.7% |
| Dividend Yield | 2.2% | 2.1% | 1.9% |
| Foreign Holdings | 5.1% | 0.0% | 0.0% |
| Turnover Rate | 18% | — | — |
| Ticker Symbol | VASVX | — | — |
| Expense Ratio1 | 0.44% | — | — |
| 30-Day SEC Yield | 1.65% | — | — |
| Short-Term Reserves | 7.5% | — | — |
| | | |
| Sector Diversification (% of equity exposure) |
| | | | DJ |
| | | | U.S. |
| | | Russell | Total |
| | | Midcap | Market |
| | | Value | FA |
| | Fund | Index | Index |
| Consumer | | | |
| Discretionary | 10.9% | 9.9% | 12.5% |
| Consumer Staples | 3.9 | 3.3 | 8.3 |
| Energy | 9.9 | 4.8 | 8.5 |
| Financials | 29.4 | 32.8 | 17.7 |
| Health Care | 9.3 | 9.6 | 13.9 |
| Industrials | 19.4 | 9.4 | 11.3 |
| Information | | | |
| Technology | 10.2 | 10.6 | 18.8 |
| Materials | 3.6 | 6.9 | 3.6 |
| Telecommunication | | | |
| Services | 0.0 | 0.3 | 2.2 |
| Utilities | 3.4 | 12.4 | 3.2 |
| | |
| Volatility Measures | | |
| | Russell | DJ |
| | Midcap | U.S. Total |
| | Value | Market |
| | Index | FA Index |
| R-Squared | 0.88 | 0.89 |
| Beta | 0.91 | 0.97 |
| These measures show the degree and timing of the fund’s fluctuations compared with the indexes over 36 months. |
|
| | |
| Ten Largest Holdings (% of total net assets) |
| Micron Technology Inc. | Semiconductors | 2.9% |
| Hanesbrands Inc. | Apparel, Accessories | |
| | & Luxury Goods | 2.5 |
| Omnicare Inc. | Health Care Services | 2.3 |
| Royal Caribbean Cruises | Hotels Resorts & | |
| Ltd. | Cruise Lines | 2.2 |
| Host Hotels & Resorts | | |
| Inc. | Specialized REITs | 2.1 |
| Cardinal Health Inc. | Health Care | |
| | Distributors | 2.1 |
| Discover Financial | | |
| Services | Consumer Finance | 2.1 |
| Delphi Automotive plc | Auto Parts & | |
| | Equipment | 2.0 |
| Stanley Black & Decker | | |
| Inc. | Industrial Machinery | 2.0 |
| CIT Group Inc. | Regional Banks | 1.9 |
| Top Ten | | 22.1% |
| The holdings listed exclude any temporary cash investments and equity index products. |
|
Investment Focus
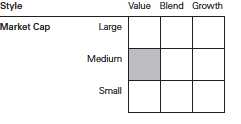
1 The expense ratio shown is from the prospectus dated June 9, 2014, and represents estimated costs for the current fiscal year. For the fiscal year
ended October 31, 2014, the expense ratio was 0.41%.
13
Selected Value Fund
Performance Summary
All of the returns in this report represent past performance, which is not a guarantee of future results that may be achieved by the fund. (Current performance may be lower or higher than the performance data cited. For performance data current to the most recent month-end, visit our website at vanguard.com/performance.) Note, too, that both investment returns and principal value can fluctuate widely, so an investor’s shares, when sold, could be worth more or less than their original cost. The returns shown do not reflect taxes that a shareholder would pay on fund distributions or on the sale of fund shares.
Cumulative Performance: October 31, 2004, Through October 31, 2014
Initial Investment of $10,000
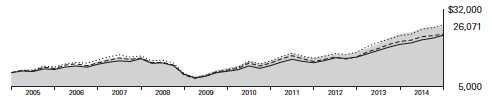
| | | | | |
| | | | Average Annual Total Returns | |
| | | Periods Ended October 31, 2014 | |
| | | | | | Final Value |
| | | One | Five | Ten | of a $10,000 |
| | | Year | Years | Years | Investment |
| | Selected Value Fund* | 11.02% | 17.69% | 10.06% | $26,071 |
| •••••••• | Russell Midcap Value Index | 16.18 | 19.19 | 10.29 | 26,629 |
| – – – – | Mid-Cap Value Funds Average | 12.20 | 16.69 | 8.88 | 23,424 |
| | Dow Jones U.S. Total Stock Market | | | | |
| | Float Adjusted Index | 16.00 | 17.09 | 8.71 | 23,060 |
| Mid-Cap Value Funds Average: Derived from data provided by Lipper, a Thomson Reuters Company. |
See Financial Highlights for dividend and capital gains information.
14
Selected Value Fund
Fiscal-Year Total Returns (%): October 31, 2004, Through October 31, 2014

Average Annual Total Returns: Periods Ended September 30, 2014
This table presents returns through the latest calendar quarter—rather than through the end of the fiscal period.
Securities and Exchange Commission rules require that we provide this information.
| | | | |
| | Inception | One | Five | Ten |
| | Date | Year | Years | Years |
| Selected Value Fund | 2/15/1996 | 13.63% | 16.74% | 10.17% |
15
Selected Value Fund
Financial Statements
Statement of Net Assets
As of October 31, 2014
The fund reports a complete list of its holdings in regulatory filings four times in each fiscal year, at the quarter-ends. For the second and fourth fiscal quarters, the lists appear in the fund’s semiannual and annual reports to shareholders. For the first and third fiscal quarters, the fund files the lists with the Securities and Exchange Commission on Form N-Q. Shareholders can look up the fund’s Forms N-Q on the SEC’s website at sec.gov. Forms N-Q may also be reviewed and copied at the SEC’s Public Reference Room (see the back cover of this report for further information).
| | | |
| | | | Market |
| | | | Value |
| | | Shares | ($000) |
| Common Stocks (90.6%)1 | | |
| Consumer Discretionary (12.6%) | |
| | Hanesbrands Inc. | 2,421,300 | 255,713 |
| | Royal Caribbean | | |
| | Cruises Ltd. | 3,289,325 | 223,575 |
| | Delphi Automotive plc | 2,976,500 | 205,319 |
| | L Brands Inc. | 2,599,200 | 187,454 |
| 2 | SeaWorld | | |
| | Entertainment Inc. | 5,267,100 | 101,339 |
| | Meredith Corp. | 1,340,400 | 69,888 |
| | Lamar Advertising Co. | | |
| | Class A | 752,150 | 38,849 |
| * | News Corp. Class A | 2,298,100 | 35,575 |
| | Interpublic Group of | | |
| | Cos. Inc. | 1,700,450 | 32,972 |
| | Omnicom Group Inc. | 360,700 | 25,920 |
| | Dana Holding Corp. | 1,259,850 | 25,777 |
| | Staples Inc. | 2,031,400 | 25,758 |
| * | TRW Automotive | | |
| | Holdings Corp. | 226,140 | 22,919 |
| | Kohl’s Corp. | 191,125 | 10,363 |
| * | News Corp. Class B | 643,700 | 9,688 |
| | International Game | | |
| | Technology | 506,350 | 8,299 |
| * | Murphy USA Inc. | 60,000 | 3,438 |
| | | | 1,282,846 |
| Consumer Staples (3.3%) | | |
| | Reynolds American Inc. | 2,734,200 | 172,008 |
| | Lorillard Inc. | 2,492,500 | 153,289 |
| | Kellogg Co. | 199,400 | 12,754 |
| | | | 338,051 |
| Energy (7.1%) | | |
| | Murphy Oil Corp. | 2,441,325 | 130,342 |
| * | WPX Energy Inc. | 6,469,194 | 123,691 |
| | Golar LNG Ltd. | 1,739,608 | 97,609 |
| | Helmerich & Payne Inc. | 904,900 | 78,564 |
| ^ | Seadrill Ltd. | 3,382,000 | 77,786 |
| | Noble Corp. plc | 3,160,316 | 66,114 |
| | Superior Energy | | |
| | Services Inc. | 1,346,525 | 33,865 |
| | | |
| | | | Market |
| | | | Value |
| | | Shares | ($000) |
| | Baker Hughes Inc. | 491,750 | 26,043 |
| | Tidewater Inc. | 556,400 | 20,515 |
| | Peabody Energy Corp. | 1,738,700 | 18,135 |
| | Rowan Cos. plc Class A | 730,525 | 17,730 |
| | Nabors Industries Ltd. | 735,000 | 13,120 |
| | Valero Energy Corp. | 237,000 | 11,871 |
| *,^ | Paragon Offshore plc | 870,105 | 4,237 |
| | | | 719,622 |
| Financials (27.6%) | | |
| | Host Hotels & | | |
| | Resorts Inc. | 9,118,800 | 212,559 |
| | Discover Financial | | |
| | Services | 3,296,000 | 210,219 |
| | CIT Group Inc. | 3,880,300 | 189,863 |
| | Capital One | | |
| | Financial Corp. | 2,261,600 | 187,193 |
| | Fifth Third Bancorp | 8,793,975 | 175,791 |
| | Ameriprise Financial Inc. | 1,346,800 | 169,926 |
| | XL Group plc Class A | 4,937,651 | 167,288 |
| | Navient Corp. | 6,686,996 | 132,269 |
| | New York Community | | |
| | Bancorp Inc. | 8,059,600 | 128,551 |
| * | Genworth Financial Inc. | | |
| | Class A | 8,969,692 | 125,486 |
| | Willis Group Holdings plc | 3,029,475 | 122,785 |
| | People’s United | | |
| | Financial Inc. | 7,696,800 | 112,527 |
| | First Niagara | | |
| | Financial Group Inc. | 11,362,000 | 85,101 |
| | CNA Financial Corp. | 2,165,344 | 84,622 |
| | Validus Holdings Ltd. | 2,123,775 | 84,484 |
| | Corporate Office | | |
| | Properties Trust | 2,881,600 | 78,783 |
| | Unum Group | 2,348,890 | 78,594 |
| | Everest Re Group Ltd. | 429,037 | 73,215 |
| | SLM Corp. | 4,618,000 | 44,102 |
| | Progressive Corp. | 1,194,000 | 31,533 |
| | American National | | |
| | Insurance Co. | 254,722 | 29,059 |
| | Axis Capital Holdings Ltd. | 516,625 | 24,870 |
16
Selected Value Fund
| | | |
| | | | Market |
| | | | Value |
| | | Shares | ($000) |
| | Voya Financial Inc. | 627,465 | 24,628 |
| | Invesco Ltd. | 465,650 | 18,845 |
| | Legg Mason Inc. | 348,300 | 18,112 |
| | Hospitality Properties Trust | 583,800 | 17,286 |
| | EPR Properties | 239,975 | 13,463 |
| | Webster Financial Corp. | 416,775 | 13,062 |
| | Primerica Inc. | 255,159 | 13,051 |
| | Assurant Inc. | 190,820 | 13,018 |
| | Synovus Financial Corp. | 509,996 | 12,933 |
| | Endurance Specialty | | |
| | Holdings Ltd. | 219,125 | 12,698 |
| | Hartford Financial | | |
| | Services Group Inc. | 313,800 | 12,420 |
| | Symetra Financial Corp. | 521,850 | 12,368 |
| | Allstate Corp. | 189,275 | 12,274 |
| | Regions Financial Corp. | 1,221,700 | 12,131 |
| | KeyCorp | 916,525 | 12,098 |
| | PartnerRe Ltd. | 103,700 | 11,997 |
| | Comerica Inc. | 245,475 | 11,719 |
| | Citizens Financial | | |
| | Group Inc. | 428,100 | 10,112 |
| | | | 2,801,035 |
| Health Care (8.2%) | | |
| | Omnicare Inc. | 3,448,200 | 229,616 |
| | Cardinal Health Inc. | 2,690,400 | 211,143 |
| | Cigna Corp. | 1,891,707 | 188,357 |
| | St. Jude Medical Inc. | 2,331,700 | 149,625 |
| | Becton Dickinson and Co. | 212,175 | 27,307 |
| * | WellCare Health Plans Inc. | 210,700 | 14,300 |
| | Aetna Inc. | 152,500 | 12,583 |
| | | | 832,931 |
| Industrials (14.8%) | | |
| | Stanley Black & | | |
| | Decker Inc. | 2,177,800 | 203,929 |
| | Joy Global Inc. | 3,192,000 | 167,995 |
| | Eaton Corp. plc | 2,338,800 | 159,950 |
| | SPX Corp. | 1,489,000 | 141,142 |
| * | AerCap Holdings NV | 3,103,782 | 134,518 |
| | Owens Corning | 4,003,052 | 128,338 |
| | KBR Inc. | 6,031,175 | 115,075 |
| * | Spirit AeroSystems | | |
| | Holdings Inc. Class A | 2,480,707 | 97,591 |
| * | JetBlue Airways Corp. | 7,189,729 | 82,969 |
| | Xylem Inc. | 1,942,700 | 70,637 |
| * | Air France-KLM ADR | 7,538,085 | 64,149 |
| | Parker-Hannifin Corp. | 272,375 | 34,600 |
| | Terex Corp. | 1,135,750 | 32,675 |
| * | AECOM Technology Corp. | 583,545 | 18,994 |
| | Masco Corp. | 724,550 | 15,991 |
| | Regal-Beloit Corp. | 185,400 | 13,158 |
| | Actuant Corp. Class A | 394,875 | 12,514 |
| | Con-way Inc. | 256,993 | 11,146 |
| | | | 1,505,371 |
| | | |
| | | | Market |
| | | | Value |
| | | Shares | ($000) |
| Information Technology (10.0%) | |
| * | Micron Technology Inc. | 8,980,588 | 297,168 |
| | Total System | | |
| | Services Inc. | 5,576,278 | 188,422 |
| | CA Inc. | 6,314,900 | 183,511 |
| * | Ingram Micro Inc. | 4,615,009 | 123,867 |
| | Avnet Inc. | 1,043,966 | 45,151 |
| * | Celestica Inc. | 3,156,955 | 34,663 |
| * | ON Semiconductor Corp. | 4,119,120 | 34,147 |
| * | Arrow Electronics Inc. | 503,625 | 28,636 |
| * | Flextronics | | |
| | International Ltd. | 2,423,850 | 25,984 |
| | Corning Inc. | 971,150 | 19,841 |
| | Jabil Circuit Inc. | 914,900 | 19,167 |
| * | Tech Data Corp. | 213,859 | 12,772 |
| | | | 1,013,329 |
| Materials (2.9%) | | |
| ^ | Yamana Gold Inc. | 18,850,141 | 75,024 |
| * | CRH plc ADR | 3,251,000 | 72,855 |
| | Rockwood Holdings Inc. | 942,087 | 72,456 |
| * | Kinross Gold Corp. | 19,633,291 | 42,212 |
| | Ashland Inc. | 119,075 | 12,868 |
| * | New Gold Inc. | 3,474,470 | 12,508 |
| * | Coeur Mining Inc. | 825,000 | 3,052 |
| | | | 290,975 |
| Other (0.3%) | | |
| 3 | Vanguard Mid-Cap | | |
| | Value ETF | 334,800 | 29,436 |
| |
| Utilities (3.8%) | | |
| | Pinnacle West | | |
| | Capital Corp. | 2,356,100 | 144,829 |
| | Xcel Energy Inc. | 3,609,737 | 120,818 |
| | CenterPoint Energy Inc. | 2,595,717 | 63,725 |
| | Exelon Corp. | 702,296 | 25,697 |
| | NRG Energy Inc. | 796,234 | 23,871 |
| | FirstEnergy Corp. | 122,442 | 4,572 |
| | | | 383,512 |
| Total Common Stocks | | |
| (Cost $6,940,837) | | 9,197,108 |
| Temporary Cash Investments (9.4%)1 | |
| Money Market Fund (9.3%) | | |
| 4,5 | Vanguard Market | | |
| | Liquidity Fund, | | |
| | 0.114% | 942,982,019 | 942,982 |
17
Selected Value Fund
| | | |
| | | Face | Market |
| | | Amount | Value |
| | | ($000) | ($000) |
| U.S. Government and Agency Obligations (0.1%) |
| 6 | Fannie Mae Discount | | |
| | Notes, 0.080%, 11/5/14 | 1,000 | 1,000 |
| 7,8 | Federal Home Loan | | |
| | Bank Discount Notes, | | |
| | 0.038%, 11/19/14 | 5,000 | 5,000 |
| 7,8 | Federal Home Loan | | |
| | Bank Discount Notes, | | |
| | 0.045%, 11/21/14 | 300 | 300 |
| 7,8 | Federal Home Loan | | |
| | Bank Discount Notes, | | |
| �� | 0.060%, 12/31/14 | 1,600 | 1,600 |
| 6,8 | Freddie Mac Discount | | |
| | Notes, 0.075%, 2/3/15 | 2,000 | 1,999 |
| | | | 9,899 |
| Total Temporary Cash Investments | |
| (Cost $952,881) | | 952,881 |
| Total Investments (100.0%) | | |
| (Cost $7,893,718) | | 10,149,989 |
| Other Assets and Liabilities (0.0%) | |
| Other Assets | | 107,954 |
| Liabilities5 | | (104,652) |
| | | | 3,302 |
| Net Assets (100%) | | |
| Applicable to 344,249,299 outstanding | |
| $.001 par value shares of beneficial | |
| interest (unlimited authorization) | 10,153,291 |
| Net Asset Value Per Share | | $29.49 |
| |
| At October 31, 2014, net assets consisted of: |
| | Amount |
| | ($000) |
| Paid-in Capital | 7,400,800 |
| Undistributed Net Investment Income | 96,293 |
| Accumulated Net Realized Gains | 399,089 |
| Unrealized Appreciation (Depreciation) | |
| Investment Securities | 2,256,271 |
| Futures Contracts | 838 |
| Net Assets | 10,153,291 |
See Note A in Notes to Financial Statements.
* Non-income-producing security.
^ Includes partial security positions on loan to broker-dealers. The total value of securities on loan is $23,318,000.
1 The fund invests a portion of its cash reserves in equity markets through the use of index futures contracts. After giving effect to futures
investments, the fund’s effective common stock and temporary cash investment positions represent 92.3% and 7.7%, respectively, of
net assets.
2 Considered an affiliated company of the fund as the fund owns more than 5% of the outstanding voting securities of such company.
3 Considered an affiliated company of the fund as the issuer is another member of The Vanguard Group.
4 Affiliated money market fund available only to Vanguard funds and certain trusts and accounts managed by Vanguard. Rate shown is
the 7-day yield.
5 Includes $25,707,000 of collateral received for securities on loan.
6 The issuer was placed under federal conservatorship in September 2008; since that time, its daily operations have been managed by the
Federal Housing Finance Agency and it receives capital from the U.S. Treasury, as needed to maintain a positive net worth, in exchange
for senior preferred stock.
7 The issuer operates under a congressional charter; its securities are generally neither guaranteed by the U.S. Treasury nor backed by the
full faith and credit of the U.S. government.
8 Securities with a value of $7,299,000 have been segregated as initial margin for open futures contracts.
ADR—American Depositary Receipt.
See accompanying Notes, which are an integral part of the Financial Statements.
18
Selected Value Fund
Statement of Operations
| |
| | Year Ended |
| | October 31, 2014 |
| | ($000) |
| Investment Income | |
| Income | |
| Dividends1 | 171,303 |
| Interest | 1,173 |
| Securities Lending | 507 |
| Total Income | 172,983 |
| Expenses | |
| Investment Advisory Fees—Note B | |
| Basic Fee | 18,694 |
| Performance Adjustment | 1,152 |
| The Vanguard Group—Note C | |
| Management and Administrative | 14,877 |
| Marketing and Distribution | 1,765 |
| Custodian Fees | 93 |
| Auditing Fees | 33 |
| Shareholders’ Reports | 146 |
| Trustees’ Fees and Expenses | 14 |
| Total Expenses | 36,774 |
| Expenses Paid Indirectly | (430) |
| Net Expenses | 36,344 |
| Net Investment Income | 136,639 |
| Realized Net Gain (Loss) | |
| Investment Securities Sold | 409,107 |
| Futures Contracts | 38,290 |
| Realized Net Gain (Loss) | 447,397 |
| Change in Unrealized Appreciation (Depreciation) | |
| Investment Securities | 268,700 |
| Futures Contracts | (8,424) |
| Change in Unrealized Appreciation (Depreciation) | 260,276 |
| Net Increase (Decrease) in Net Assets Resulting from Operations | 844,312 |
| 1 Dividends are net of foreign withholding taxes of $473,000. |
See accompanying Notes, which are an integral part of the Financial Statements.
19
Selected Value Fund
Statement of Changes in Net Assets
| | |
| | Year Ended October 31, |
| | 2014 | 2013 |
| | ($000) | ($000) |
| Increase (Decrease) in Net Assets | | |
| Operations | | |
| Net Investment Income | 136,639 | 91,650 |
| Realized Net Gain (Loss) | 447,397 | 384,477 |
| Change in Unrealized Appreciation (Depreciation) | 260,276 | 1,206,948 |
| Net Increase (Decrease) in Net Assets Resulting from Operations | 844,312 | 1,683,075 |
| Distributions | | |
| Net Investment Income | (86,230) | (90,598) |
| Realized Capital Gain | (318,790) | — |
| Total Distributions | (405,020) | (90,598) |
| Capital Share Transactions | | |
| Issued | 3,609,195 | 1,708,267 |
| Issued in Lieu of Cash Distributions | 371,698 | 81,500 |
| Redeemed | (1,285,461) | (700,802) |
| Net Increase (Decrease) from Capital Share Transactions | 2,695,432 | 1,088,965 |
| Total Increase (Decrease) | 3,134,724 | 2,681,442 |
| Net Assets | | |
| Beginning of Period | 7,018,567 | 4,337,125 |
| End of Period1 | 10,153,291 | 7,018,567 |
1 Net Assets—End of Period includes undistributed (overdistributed) net investment income of $96,293,000 and $56,037,000.See accompanying Notes, which are an integral part of the Financial Statements.
20
Selected Value Fund
Financial Highlights
| | | | | |
| For a Share Outstanding | Year Ended October 31, |
| Throughout Each Period | 2014 | 2013 | 2012 | 2011 | 2010 |
| Net Asset Value, Beginning of Period | $28.07 | $21.01 | $18.81 | $17.73 | $14.78 |
| Investment Operations | | | | | |
| Net Investment Income | .415 | .395 | .405 | .334 | .250 |
| Net Realized and Unrealized Gain (Loss) | | | | | |
| on Investments | 2.555 | 7.105 | 2.122 | 1.037 | 2.941 |
| Total from Investment Operations | 2.970 | 7.500 | 2.527 | 1.371 | 3.191 |
| Distributions | | | | | |
| Dividends from Net Investment Income | (. 330) | (. 440) | (. 327) | (. 291) | (. 241) |
| Distributions from Realized Capital Gains | (1.220) | — | — | — | — |
| Total Distributions | (1.550) | (.440) | (.327) | (. 291) | (. 241) |
| Net Asset Value, End of Period | $29.49 | $28.07 | $21.01 | $18.81 | $17.73 |
| |
| Total Return1 | 11.02% | 36.43% | 13.64% | 7.74% | 21.75% |
| |
| Ratios/Supplemental Data | | | | | |
| Net Assets, End of Period (Millions) | $10,153 | $7,019 | $4,337 | $3,956 | $3,639 |
| Ratio of Total Expenses to Average Net Assets2 | 0.41% | 0.43% | 0.38% | 0.45% | 0.47% |
| Ratio of Net Investment Income to | | | | | |
| Average Net Assets | 1.53% | 1.70% | 2.00% | 1.74% | 1.52% |
| Portfolio Turnover Rate | 18% | 27% | 18% | 25% | 22% |
1 Total returns do not include account service fees that may have applied in the periods shown. Fund prospectuses provide information aboutany applicable account service fees.2 Includes performance-based investment advisory fee increases (decreases) of 0.01%, 0.02%, (0.03%), 0.04%, and 0.05%.See accompanying Notes, which are an integral part of the Financial Statements.
21
Selected Value Fund
Notes to Financial Statements
Vanguard Selected Value Fund is registered under the Investment Company Act of 1940 as an open-end investment company, or mutual fund.
A. The following significant accounting policies conform to generally accepted accounting principles for U.S. investment companies. The fund consistently follows such policies in preparing its financial statements.
1. Security Valuation: Securities are valued as of the close of trading on the New York Stock Exchange (generally 4 p.m., Eastern time) on the valuation date. Equity securities are valued at the latest quoted sales prices or official closing prices taken from the primary market in which each security trades; such securities not traded on the valuation date are valued at the mean of the latest quoted bid and asked prices. Securities for which market quotations are not readily available, or whose values have been affected by events occurring before the fund’s pricing time but after the close of the securities’ primary markets, are valued at their fair values calculated according to procedures adopted by the board of trustees. These procedures include obtaining quotations from an independent pricing service, monitoring news to identify significant market- or security-specific events, and evaluating changes in the values of foreign market proxies (for example, ADRs, futures contracts, or exchange-traded funds), between the time the foreign markets close and the fund’s pricing time. When fair-value pricing is employed, the prices of securities used by a fund to calculate its net asset value may differ from quoted or published prices for the same securities. Investments in Vanguard Market Liquidity Fund are valued at that fund’s net asset value. Temporary cash investments acquired over 60 days to maturity are valued using the latest bid prices or using valuations based on a matrix system (which considers such factors as security prices, yields, maturities, and ratings), both as furnished by independent pricing services. Other temporary cash investments are valued at amortized cost, which approximates market value.
2. Futures Contracts: The fund uses index futures contracts to a limited extent, with the objective of maintaining full exposure to the stock market while maintaining liquidity. The fund may purchase or sell futures contracts to achieve a desired level of investment, whether to accommodate portfolio turnover or cash flows from capital share transactions. The primary risks associated with the use of futures contracts are imperfect correlation between changes in market values of stocks held by the fund and the prices of futures contracts, and the possibility of an illiquid market. Counterparty risk involving futures is mitigated because a regulated clearinghouse is the counterparty instead of the clearing broker. To further mitigate counterparty risk, the fund trades futures contracts on an exchange, monitors the financial strength of its clearing brokers and clearinghouse, and has entered into clearing agreements with its clearing brokers. The clearinghouse imposes initial margin requirements to secure the fund’s performance and requires daily settlement of variation margin representing changes in the market value of each contract.
Futures contracts are valued at their quoted daily settlement prices. The aggregate settlement values of the contracts are not recorded in the Statement of Net Assets. Fluctuations in the value of the contracts are recorded in the Statement of Net Assets as an asset (liability) and in the Statement of Operations as unrealized appreciation (depreciation) until the contracts are closed, when they are recorded as realized futures gains (losses).
During the year ended October 31, 2014, the fund’s average investments in long and short futures contracts each represented 3% and 0% of net assets, respectively, based on the average of aggregate settlement values at each quarter-end during the period.
22
Selected Value Fund
3. Federal Income Taxes: The fund intends to continue to qualify as a regulated investment company and distribute all of its taxable income. Management has analyzed the fund’s tax positions taken for all open federal income tax years (October 31, 2011–2014), and has concluded that no provision for federal income tax is required in the fund’s financial statements.
4. Distributions: Distributions to shareholders are recorded on the ex-dividend date.
5. Securities Lending: To earn additional income, the fund lends its securities to qualified institutional borrowers. Security loans are required to be secured at all times by collateral in an amount at least equal to the market value of securities loaned. Daily market fluctuations could cause the value of loaned securities to be more or less than the value of the collateral received. When this occurs, the collateral is adjusted and settled on the next business day. The fund further mitigates its counterparty risk by entering into securities lending transactions only with a diverse group of prequalified counterparties, monitoring their financial strength, and entering into master securities lending agreements with its counterparties. The master securities lending agreements provide that, in the event of a counterparty’s default (including bankruptcy), the fund may terminate any loans with that borrower, determine the net amount owed, and sell or retain the collateral up to the net amount owed to the fund; however, such actions may be subject to legal proceedings. While collateral mitigates counterparty risk, in the absence of a default the fund may experience delays and costs in recovering the securities loaned. The fund invests cash collateral received in Vanguard Market Liquidity Fund, and records a liability in the Statement of Net Assets for the return of the collateral, during the period the securities are on loan. Securities lending income represents fees charged to borrowers plus income earned on invested cash collateral, less expenses associated with the loan.
6. Credit Facility: The fund and certain other funds managed by The Vanguard Group participate in a $2.89 billion committed credit facility provided by a syndicate of lenders pursuant to a credit agreement that may be renewed annually; each fund is individually liable for its borrowings, if any, under the credit facility. Borrowings may be utilized for temporary and emergency purposes, and are subject to the fund’s regulatory and contractual borrowing restrictions. The participating funds are charged administrative fees and an annual commitment fee of 0.06% of the undrawn amount of the facility; these fees are allocated to the funds based on a method approved by the fund’s board of trustees and included in Management and Administrative expenses on the fund’s Statement of Operations. Any borrowings under this facility bear interest at a rate equal to the higher of the federal funds rate or LIBOR reference rate plus an agreed-upon spread.
The fund had no borrowings outstanding at October 31, 2014, or at any time during the period then ended.
7. Other: Dividend income is recorded on the ex-dividend date. Interest income includes income distributions received from Vanguard Market Liquidity Fund and is accrued daily. Premiums and discounts on debt securities purchased are amortized and accreted, respectively, to interest income over the lives of the respective securities. Security transactions are accounted for on the date securities are bought or sold. Costs used to determine realized gains (losses) on the sale of investment securities are those of the specific securities sold.
23
Selected Value Fund
B. Barrow, Hanley, Mewhinney & Strauss, LLC, Donald Smith & Co., Inc., and beginning March 2014, Pzena Investment Management, LLC, each provide investment advisory services to a portion of the fund for a fee calculated at an annual percentage rate of average net assets managed by the advisor. The basic fee of Barrow, Hanley, Mewhinney & Strauss, LLC, is subject to quarterly adjustments based on performance for the preceding three years relative to the Russell Midcap Value Index. The basic fee of Donald Smith & Co., Inc., is subject to quarterly adjustments based on performance for the preceding five years relative to the MSCI Investable Market 2500 Index. In accordance with the advisory contract entered into with Pzena Investment Management, LLC, beginning February 1, 2015, the investment advisory fee will be subject to quarterly adjustments based on performance since April 30, 2014, relative to the Russell Midcap Value Index.
The Vanguard Group manages the cash reserves of the fund on an at-cost basis.
For the year ended October 31, 2014, the aggregate investment advisory fee represented an effective annual basic rate of 0.21% of the fund’s average net assets, before an increase of $1,152,000 (0.01%) based on performance.
C. The Vanguard Group furnishes at cost corporate management, administrative, marketing, and distribution services. The costs of such services are allocated to the fund based on methods approved by the board of trustees. The fund has committed to invest up to 0.40% of its net assets in Vanguard. At October 31, 2014, the fund had contributed capital of $997,000 to Vanguard (included in Other Assets), representing 0.01% of the fund’s net assets and 0.40% of Vanguard’s capitalization. The fund’s trustees and officers are also directors and officers of Vanguard.
D. The fund has asked its investment advisors to direct certain security trades, subject to obtaining the best price and execution, to brokers who have agreed to rebate to the fund part of the commissions generated. Such rebates are used solely to reduce the fund’s management and administrative expenses. For the year ended October 31, 2014, these arrangements reduced the fund’s expenses by $430,000 (an annual rate of 0.00% of average net assets).
E. Various inputs may be used to determine the value of the fund’s investments. These inputs are summarized in three broad levels for financial statement purposes. The inputs or methodologies used to value securities are not necessarily an indication of the risk associated with investing in those securities.
Level 1—Quoted prices in active markets for identical securities.
Level 2—Other significant observable inputs (including quoted prices for similar securities, interest rates, prepayment speeds, credit risk, etc.).
Level 3—Significant unobservable inputs (including the fund’s own assumptions used to determine the fair value of investments).
The following table summarizes the market value of the fund’s investments as of October 31, 2014, based on the inputs used to value them:
| | | |
| | Level 1 | Level 2 | Level 3 |
| Investments | ($000) | ($000) | ($000) |
| Common Stocks | 9,197,108 | — | — |
| Temporary Cash Investments | 942,982 | 9,899 | — |
| Futures Contracts—Assets1 | 1,791 | — | — |
| Total | 10,141,881 | 9,899 | — |
| 1 Represents variation margin on the last day of the reporting period. |
24
Selected Value Fund
F. At October 31, 2014, the aggregate settlement value of open futures contracts and the related unrealized appreciation (depreciation) were:
| | | | |
| | | | ($000) |
| | | | Aggregate | |
| | | Number of | Settlement | Unrealized |
| | | Long (Short) | Value | Appreciation |
| Futures Contracts | Expiration | Contracts | Long (Short) | (Depreciation) |
| E-mini S&P MidCap 400 Index | December 2014 | 692 | 97,946 | (484) |
| E-mini S&P 500 Index | December 2014 | 584 | 58,733 | 1,125 |
| E-mini Russell 2000 Index | December 2014 | 122 | 14,286 | 197 |
| | | | | 838 |
Unrealized appreciation (depreciation) on open futures contracts is required to be treated as realized gain (loss) for tax purposes.
G. Distributions are determined on a tax basis and may differ from net investment income and realized capital gains for financial reporting purposes. Differences may be permanent or temporary. Permanent differences are reclassified among capital accounts in the financial statements to reflect their tax character. Temporary differences arise when certain items of income, expense, gain, or loss are recognized in different periods for financial statement and tax purposes. These differences will reverse at some time in the future. Differences in classification may also result from the treatment of short-term gains as ordinary income for tax purposes.
The fund used a tax accounting practice to treat a portion of the price of capital shares redeemed during the year as distributions from net investment income and realized capital gains. Accordingly, the fund has reclassified $10,153,000 from undistributed net investment income, and $32,070,000 from accumulated net realized gains, to paid-in capital.
For tax purposes, at October 31, 2014, the fund had $138,766,000 of ordinary income and $367,491,000 of long-term capital gains available for distribution.
At October 31, 2014, the cost of investment securities for tax purposes was $7,894,861,000. Net unrealized appreciation of investment securities for tax purposes was $2,255,128,000, consisting of unrealized gains of $2,695,945,000 on securities that had risen in value since their purchase and $440,817,000 in unrealized losses on securities that had fallen in value since their purchase.
H. During the year ended October 31, 2014, the fund purchased $3,808,781,000 of investment securities and sold $1,465,116,000 of investment securities, other than temporary cash investments.
25
Selected Value Fund
I. Capital shares issued and redeemed were:
| | |
| | Year Ended October 31, |
| | 2014 | 2013 |
| | Shares | Shares |
| | (000) | (000) |
| Issued | 125,298 | 68,780 |
| Issued in Lieu of Cash Distributions | 13,610 | 3,922 |
| Redeemed | (44,653) | (29,178) |
| Net Increase (Decrease) in Shares Outstanding | 94,255 | 43,524 |
J. Certain of the fund’s investments are in companies that are considered to be affiliated companies of the fund because the fund owns more than 5% of the outstanding voting securities of the company or the issuer is another member of The Vanguard Group. Transactions during the period in securities of these companies were as follows:
| | | | | | |
| | | Current Period Transactions | |
| | Oct. 31, | | Proceeds | | | Oct. 31, |
| | 2013 | | from | | Capital Gain | 2014 |
| | Market | Purchases | Securities | | Distributions | Market |
| | Value | at Cost | Sold1 | Income | Received | Value |
| | ($000) | ($000) | ($000) | ($000) | ($000) | ($000) |
| SeaWorld Entertainment Inc. | — | 114,674 | — | 1,106 | — | 101,339 |
| Vanguard Mid-Cap Value ETF | — | 54,942 | 30,020 | 477 | — | 29,436 |
| Vanguard Market Liquidity Fund | 825,393 | NA2 | NA 2 | 1,159 | — | 942,982 |
| Total | 825,393 | | | 2,742 | — | 1,073,757 |
| 1 Includes net realized gain (loss) on affiliated investment securities sold of $1,126,000. |
| 2 Not applicable—Purchases and sales are for temporary cash investment purposes. |
K. Management has determined that no material events or transactions occurred subsequent to October 31, 2014, that would require recognition or disclosure in these financial statements.
26
Report of Independent Registered Public Accounting Firm
To the Board of Trustees of Vanguard Whitehall Funds and the Shareholders of Vanguard Selected Value Fund:
In our opinion, the accompanying statement of net assets and the related statements of operations and of changes in net assets and the financial highlights present fairly, in all material respects, the financial position of Vanguard Selected Value Fund (constituting a separate portfolio of Vanguard Whitehall Funds, hereafter referred to as the “Fund”) at October 31, 2014, the results of its operations for the year then ended, the changes in its net assets for each of the two years in the period then ended, and the financial highlights for each of the five years in the period then ended, in conformity with accounting principles generally accepted in the United States of America. These financial statements and financial highlights (hereafter referred to as “financial statements”) are the responsibility of the Fund’s management. Our responsibility is to express an opinion on these financial statements based on our audits. We conducted our audits of these financial statements in accordance with the standards of the Public Company Accounting Oversight Board (United States). Those standards require that we plan and perform the audit to obtain reasonable assurance about whether the financial statements are free of material misstatement. An audit includes examining, on a test basis, evidence supporting the amounts and disclosures in the financial statements, assessing the accounting principles used and significant estimates made by management, and evaluating the overall financial statement presentation. We believe that our audits, which included confirmation of securities at October 31, 2014 by correspondence with the custodian and broker, by agreement to the underlying ownership records of the transfer agent and the application of alternative auditing procedures where securities purchased had not been received, provide a reasonable basis for our opinion.
/s/PricewaterhouseCoopers LLP
Philadelphia, Pennsylvania
December 16, 2014

Special 2014 tax information (unaudited) for Vanguard Selected Value Fund
This information for the fiscal year ended October 31, 2014, is included pursuant to provisions of the
Internal Revenue Code.
The fund distributed $348,134,000 as capital gain dividends (from net long-term capital gains) to
shareholders during the fiscal year.
The fund distributed $86,230,000 of qualified dividend income to shareholders during the fiscal year.
For corporate shareholders, 69.3% of investment income (dividend income plus short-term gains, if
any) qualifies for the dividends-received deduction.
27
Your Fund’s After-Tax Returns
This table presents returns for your fund both before and after taxes. The after-tax returns are shown in two ways: (1) assuming that an investor owned the fund during the entire period and paid taxes on the fund’s distributions, and (2) assuming that an investor paid taxes on the fund’s distributions and sold all shares at the end of each period.
Calculations are based on the highest individual federal income tax and capital gains tax rates in effect at the times of the distributions and the hypothetical sales. State and local taxes were not considered. After-tax returns reflect any qualified dividend income, using actual prior-year figures and estimates for 2014. (In the example, returns after the sale of fund shares may be higher than those assuming no sale. This occurs when the sale would have produced a capital loss. The calculation assumes that the investor received a tax deduction for the loss.)
Please note that your actual after-tax returns will depend on your tax situation and may differ from those shown. Also note that if you own the fund in a tax-deferred account, such as an individual retirement account or a 401(k) plan, this information does not apply to you. Such accounts are not subject to current taxes.
Finally, keep in mind that a fund’s performance—whether before or after taxes—does not guarantee future results.
Average Annual Total Returns: Selected Value Fund
Periods Ended October 31, 2014
| | | |
| | One | Five | Ten |
| | Year | Years | Years |
| Returns Before Taxes | 11.02% | 17.69% | 10.06% |
| Returns After Taxes on Distributions | 9.60 | 17.15 | 9.30 |
| Returns After Taxes on Distributions and Sale of Fund Shares | 7.26 | 14.36 | 8.19 |
28
About Your Fund’s Expenses
As a shareholder of the fund, you incur ongoing costs, which include costs for portfolio management, administrative services, and shareholder reports (like this one), among others. Operating expenses, which are deducted from a fund’s gross income, directly reduce the investment return of the fund.
A fund’s expenses are expressed as a percentage of its average net assets. This figure is known as the expense ratio. The following examples are intended to help you understand the ongoing costs (in dollars) of investing in your fund and to compare these costs with those of other mutual funds. The examples are based on an investment of $1,000 made at the beginning of the period shown and held for the entire period.
The accompanying table illustrates your fund’s costs in two ways:
• Based on actual fund return. This section helps you to estimate the actual expenses that you paid over the period. The ”Ending Account Value“ shown is derived from the fund‘s actual return, and the third column shows the dollar amount that would have been paid by an investor who started with $1,000 in the fund. You may use the information here, together with the amount you invested, to estimate the expenses that you paid over the period.
To do so, simply divide your account value by $1,000 (for example, an $8,600 account value divided by $1,000 = 8.6), then multiply the result by the number given for your fund under the heading ”Expenses Paid During Period.“
• Based on hypothetical 5% yearly return. This section is intended to help you compare your fund‘s costs with those of other mutual funds. It assumes that the fund had a yearly return of 5% before expenses, but that the expense ratio is unchanged. In this case—because the return used is not the fund’s actual return—the results do not apply to your investment. The example is useful in making comparisons because the Securities and Exchange Commission requires all mutual funds to calculate expenses based on a 5% return. You can assess your fund’s costs by comparing this hypothetical example with the hypothetical examples that appear in shareholder reports of other funds.
Note that the expenses shown in the table are meant to highlight and help you compare ongoing costs only and do not reflect transaction costs incurred by the fund for buying and selling securities. Further, the expenses do not include any purchase, redemption, or account service fees described in the fund prospectus. If such fees were applied to your account, your costs would be higher. Your fund does not carry a “sales load.”
The calculations assume no shares were bought or sold during the period. Your actual costs may have been higher or lower, depending on the amount of your investment and the timing of any purchases or redemptions.
You can find more information about the fund’s expenses, including annual expense ratios, in the Financial Statements section of this report. For additional information on operating expenses and other shareholder costs, please refer to your fund’s current prospectus.
29
| | | |
| Six Months Ended October 31, 2014 | | | |
| | Beginning | Ending | Expenses |
| | Account Value | Account Value | Paid During |
| Selected Value Fund | 4/30/2014 | 10/31/2014 | Period |
| Based on Actual Fund Return | $1,000.00 | $1,030.04 | $2.05 |
| Based on Hypothetical 5% Yearly Return | 1,000.00 | 1,023.19 | 2.04 |
The calculations are based on expenses incurred in the most recent six-month period. The fund’s annualized six-month expense ratio for thatperiod is 0.40%. The dollar amounts shown as “Expenses Paid” are equal to the annualized expense ratio multiplied by the average accountvalue over the period, multiplied by the number of days in the most recent six-month period, then divided by the number of days in the mostrecent 12-month period.30
Glossary
30-Day SEC Yield. A fund’s 30-day SEC yield is derived using a formula specified by the U.S. Securities and Exchange Commission. Under the formula, data related to the fund’s security holdings in the previous 30 days are used to calculate the fund’s hypothetical net income for that period, which is then annualized and divided by the fund’s estimated average net assets over the calculation period. For the purposes of this calculation, a security’s income is based on its current market yield to maturity (for bonds), its actual income (for asset-backed securities), or its projected dividend yield (for stocks). Because the SEC yield represents hypothetical annualized income, it will differ—at times significantly—from the fund’s actual experience. As a result, the fund’s income distributions may be higher or lower than implied by the SEC yield.
Beta. A measure of the magnitude of a fund’s past share-price fluctuations in relation to the ups and downs of a given market index. The index is assigned a beta of 1.00. Compared with a given index, a fund with a beta of 1.20 typically would have seen its share price rise or fall by 12% when the index rose or fell by 10%. For this report, beta is based on returns over the past 36 months for both the fund and the index. Note that a fund’s beta should be reviewed in conjunction with its R-squared (see definition). The lower the R-squared, the less correlation there is between the fund and the index, and the less reliable beta is as an indicator of volatility.
Dividend Yield. Dividend income earned by stocks, expressed as a percentage of the aggregate market value (or of net asset value, for a fund). The yield is determined by dividing the amount of the annual dividends by the aggregate value (or net asset value) at the end of the period. For a fund, the dividend yield is based solely on stock holdings and does not include any income produced by other investments.
Earnings Growth Rate. The average annual rate of growth in earnings over the past five years for the stocks now in a fund.
Equity Exposure. A measure that reflects a fund’s investments in stocks and stock futures. Any holdings in short-term reserves are excluded.
Expense Ratio. A fund’s total annual operating expenses expressed as a percentage of the fund’s average net assets. The expense ratio includes management and administrative expenses, but does not include the transaction costs of buying and selling portfolio securities.
Foreign Holdings. The percentage of a fund represented by securities or depositary receipts of companies based outside the United States.
Inception Date. The date on which the assets of a fund (or one of its share classes) are first invested in accordance with the fund’s investment objective. For funds with a subscription period, the inception date is the day after that period ends. Investment performance is measured from the inception date.
Median Market Cap. An indicator of the size of companies in which a fund invests; the midpoint of market capitalization (market price x shares outstanding) of a fund’s stocks, weighted by the proportion of the fund’s assets invested in each stock. Stocks representing half of the fund’s assets have market capitalizations above the median, and the rest are below it.
Price/Book Ratio. The share price of a stock divided by its net worth, or book value, per share. For a fund, the weighted average price/book ratio of the stocks it holds.
31
Price/Earnings Ratio. The ratio of a stock’s current price to its per-share earnings over the past year. For a fund, the weighted average P/E of the stocks it holds. P/E is an indicator of market expectations about corporate prospects; the higher the P/E, the greater the expectations for a company’s future growth.
R-Squared. A measure of how much of a fund’s past returns can be explained by the returns from the market in general, as measured by a given index. If a fund’s total returns were precisely synchronized with an index’s returns, its R-squared would be 1.00. If the fund’s returns bore no relationship to the index’s returns, its R-squared would be 0. For this report, R-squared is based on returns over the past 36 months for both the fund and the index.
Return on Equity. The annual average rate of return generated by a company during the past five years for each dollar of shareholder’s equity (net income divided by shareholder’s equity). For a fund, the weighted average return on equity for the companies whose stocks it holds.
Short-Term Reserves. The percentage of a fund invested in highly liquid, short-term securities that can be readily converted to cash.
Turnover Rate. An indication of the fund’s trading activity. Funds with high turnover rates incur higher transaction costs and may be more likely to distribute capital gains (which may be taxable to investors). The turnover rate excludes in-kind transactions, which have minimal impact on costs.
32
This page intentionally left blank.
This page intentionally left blank.
This page intentionally left blank.
The People Who Govern Your Fund
The trustees of your mutual fund are there to see that the fund is operated and managed in your best interests since, as a shareholder, you are a part owner of the fund. Your fund’s trustees also serve on the board of directors of The Vanguard Group, Inc., which is owned by the Vanguard funds and provides services to them on an at-cost basis.
A majority of Vanguard’s board members are independent, meaning that they have no affiliation with Vanguard or the funds they oversee, apart from the sizable personal investments they have made as private individuals. The independent board members have distinguished backgrounds in business, academia, and public service. Each of the trustees and executive officers oversees 177 Vanguard funds.
The following table provides information for each trustee and executive officer of the fund. More information about the trustees is in the Statement of Additional Information, which can be obtained, without charge, by contacting Vanguard at 800-662-7447, or online at vanguard.com.
| |
| InterestedTrustee1 | and Delphi Automotive LLP (automotive components); |
| | Senior Advisor at New Mountain Capital. |
| F. William McNabb III | |
| Born 1957. Trustee Since July 2009. Chairman of the | Amy Gutmann |
| Board. Principal Occupation(s) During the Past Five | Born 1949. Trustee Since June 2006. Principal |
| Years: Chairman of the Board of The Vanguard Group, | Occupation(s) During the Past Five Years: President of |
| Inc., and of each of the investment companies served | the University of Pennsylvania; Christopher H. Browne |
| by The Vanguard Group, since January 2010; Director | Distinguished Professor of Political Science, School of |
| of The Vanguard Group since 2008; Chief Executive | Arts and Sciences, and Professor of Communication, |
| Officer and President of The Vanguard Group, and of | Annenberg School for Communication, with secondary |
| each of the investment companies served by The | faculty appointments in the Department of Philosophy, |
| Vanguard Group, since 2008; Director of Vanguard | School of Arts and Sciences, and at the Graduate |
| Marketing Corporation; Managing Director of The | School of Education, University of Pennsylvania; |
| Vanguard Group (1995–2008). | Trustee of the National Constitution Center; Chair |
| | of the Presidential Commission for the Study of |
| | Bioethical Issues. |
| IndependentTrustees | |
| | JoAnn Heffernan Heisen |
| Emerson U. Fullwood | Born 1950. Trustee Since July 1998. Principal |
| Born 1948. Trustee Since January 2008. Principal | Occupation(s) During the Past Five Years: Corporate |
| Occupation(s) During the Past Five Years: Executive | Vice President and Chief Global Diversity Officer |
| Chief Staff and Marketing Officer for North America | (retired 2008) and Member of the Executive |
| and Corporate Vice President (retired 2008) of Xerox | Committee (1997–2008) of Johnson & Johnson |
| Corporation (document management products and | (pharmaceuticals/medical devices/consumer |
| services); Executive in Residence and 2009–2010 | products); Director of Skytop Lodge Corporation |
| Distinguished Minett Professor at the Rochester | (hotels), the University Medical Center at Princeton, |
| Institute of Technology; Director of SPX Corporation | the Robert Wood Johnson Foundation, and the Center |
| (multi-industry manufacturing), the United Way of | for Talent Innovation; Member of the Advisory Board |
| Rochester, Amerigroup Corporation (managed health | of the Maxwell School of Citizenship and Public Affairs |
| care), the University of Rochester Medical Center, | at Syracuse University. |
| Monroe Community College Foundation, and North | |
| Carolina A&T University. | F. Joseph Loughrey |
| | Born 1949. Trustee Since October 2009. Principal |
| Rajiv L. Gupta | Occupation(s) During the Past Five Years: President |
| Born 1945. Trustee Since December 2001.2 | and Chief Operating Officer (retired 2009) of Cummins |
| Principal Occupation(s) During the Past Five Years: | Inc. (industrial machinery); Chairman of the Board |
| Chairman and Chief Executive Officer (retired 2009) | of Hillenbrand, Inc. (specialized consumer services), |
| and President (2006–2008) of Rohm and Haas Co. | and of Oxfam America; Director of SKF AB (industrial |
| (chemicals); Director of Tyco International, Ltd. | machinery), Hyster-Yale Materials Handling, Inc. |
| (diversified manufacturing and services), Hewlett- | (forklift trucks), the Lumina Foundation for Education, |
| Packard Co. (electronic computer manufacturing), | |
| | |
| and the V Foundation for Cancer Research; Member | Executive Officers | |
| of the Advisory Council for the College of Arts and | | |
| Letters and of the Advisory Board to the Kellogg | Glenn Booraem | |
| Institute for International Studies, both at the | Born 1967. Controller Since July 2010. Principal |
| University of Notre Dame. | Occupation(s) During the Past Five Years: Principal |
| | of The Vanguard Group, Inc.; Controller of each of |
| Mark Loughridge | the investment companies served by The Vanguard |
| Born 1953. Trustee Since March 2012. Principal | Group; Assistant Controller of each of the investment |
| Occupation(s) During the Past Five Years: Senior Vice | companies served by The Vanguard Group (2001–2010). |
| President and Chief Financial Officer (retired 2013) | | |
| at IBM (information technology services); Fiduciary | Thomas J. Higgins | |
| Member of IBM’s Retirement Plan Committee (2004– | Born 1957. Chief Financial Officer Since September |
| 2013); Member of the Council on Chicago Booth. | 2008. Principal Occupation(s) During the Past Five |
| | Years: Principal of The Vanguard Group, Inc.; Chief |
| Scott C. Malpass | Financial Officer of each of the investment companies |
| Born 1962. Trustee Since March 2012. Principal | served by The Vanguard Group; Treasurer of each of |
| Occupation(s) During the Past Five Years: Chief | the investment companies served by The Vanguard |
| Investment Officer and Vice President at the University | Group (1998–2008). | |
| of Notre Dame; Assistant Professor of Finance at the | | |
| Mendoza College of Business at Notre Dame; Member | Kathryn J. Hyatt | |
| of the Notre Dame 403(b) Investment Committee; | Born 1955. Treasurer Since November 2008. Principal |
| Board Member of TIFF Advisory Services, Inc. | Occupation(s) During the Past Five Years: Principal of |
| (investment advisor); Member of the Investment | The Vanguard Group, Inc.; Treasurer of each of the |
| Advisory Committees of the Financial Industry | investment companies served by The Vanguard |
| Regulatory Authority (FINRA) and of Major League | Group; Assistant Treasurer of each of the investment |
| Baseball. | companies served by The Vanguard Group (1988–2008). |
| |
| André F. Perold | Heidi Stam | |
| Born 1952. Trustee Since December 2004. Principal | Born 1956. Secretary Since July 2005. Principal |
| Occupation(s) During the Past Five Years: George | Occupation(s) During the Past Five Years: Managing |
| Gund Professor of Finance and Banking, Emeritus | Director of The Vanguard Group, Inc.; General Counsel |
| at the Harvard Business School (retired 2011); | of The Vanguard Group; Secretary of The Vanguard |
| Chief Investment Officer and Managing Partner of | Group and of each of the investment companies |
| HighVista Strategies LLC (private investment firm); | served by The Vanguard Group; Director and Senior |
| Director of Rand Merchant Bank; Overseer of the | Vice President of Vanguard Marketing Corporation. |
| Museum of Fine Arts Boston. | | |
| | Vanguard Senior ManagementTeam |
| Alfred M. Rankin, Jr. | | |
| Born 1941. Trustee Since January 1993. Principal | Mortimer J. Buckley | Chris D. McIsaac |
| Occupation(s) During the Past Five Years: Chairman, | Kathleen C. Gubanich | Michael S. Miller |
| President, and Chief Executive Officer of NACCO | Paul A. Heller | James M. Norris |
| Industries, Inc. (housewares/lignite), and of Hyster- | Martha G. King | Glenn W. Reed |
| Yale Materials Handling, Inc. (forklift trucks); Chairman | John T. Marcante | |
| of the Board of University Hospitals of Cleveland. | | |
| |
| Peter F. Volanakis | Chairman Emeritus and Senior Advisor |
| Born 1955. Trustee Since July 2009. Principal | | |
| Occupation(s) During the Past Five Years: President | John J. Brennan | |
| and Chief Operating Officer (retired 2010) of Corning | Chairman, 1996–2009 | |
| Incorporated (communications equipment); Trustee of | Chief Executive Officer and President, 1996–2008 |
| Colby-Sawyer College; Member of the Advisory Board | | |
| of the Norris Cotton Cancer Center and of the Advisory | Founder | |
| Board of the Parthenon Group (strategy consulting). | | |
| | John C. Bogle | |
| | Chairman and Chief Executive Officer, 1974–1996 |
1 Mr. McNabb is considered an “interested person,” as defined in the Investment Company Act of 1940, because he is an officer of the
Vanguard funds.
2 December 2002 for Vanguard Equity Income Fund, the Vanguard Municipal Bond Funds, and the Vanguard State Tax-Exempt Funds.
| 
|
| | P.O. Box 2600 |
| | Valley Forge, PA 19482-2600 |
| |
| |
| |
| Connect with Vanguard® > vanguard.com | |
| |
| |
| |
| Fund Information > 800-662-7447 | CFA® is a registered trademark owned by CFA Institute. |
| Direct Investor Account Services > 800-662-2739 | |
| Institutional Investor Services > 800-523-1036 | |
| Text Telephone for People | |
| Who Are Deaf or Hard of Hearing> 800-749-7273 | |
| |
| This material may be used in conjunction | |
| with the offering of shares of any Vanguard | |
| fund only if preceded or accompanied by | |
| the fund’s current prospectus. | |
| |
| All comparative mutual fund data are from Lipper, a | |
| Thomson Reuters Company, or Morningstar, Inc., unless | |
| otherwise noted. | |
| |
| You can obtain a free copy of Vanguard’s proxy voting | |
| guidelines by visiting vanguard.com/proxyreporting or by | |
| calling Vanguard at 800-662-2739. The guidelines are | |
| also available from the SEC’s website, sec.gov. In | |
| addition, you may obtain a free report on how your fund | |
| voted the proxies for securities it owned during the 12 | |
| months ended June 30. To get the report, visit either | |
| vanguard.com/proxyreporting or sec.gov. | |
| |
| You can review and copy information about your fund at | |
| the SEC’s Public Reference Room in Washington, D.C. To | |
| find out more about this public service, call the SEC at | |
| 202-551-8090. Information about your fund is also | |
| available on the SEC’s website, and you can receive | |
| copies of this information, for a fee, by sending a | |
| request in either of two ways: via e-mail addressed to | |
| publicinfo@sec.gov or via regular mail addressed to the | |
| Public Reference Section, Securities and Exchange | |
| Commission, Washington, DC 20549-1520. | |
| |
| | © 2014 The Vanguard Group, Inc. |
| | All rights reserved. |
| | Vanguard Marketing Corporation, Distributor. |
| |
| | Q9340 122014 |

Annual Report | October 31, 2014
Vanguard Global Minimum Volatility Fund
The mission continues
On May 1, 1975, Vanguard began operations, a fledgling company based on the simple but revolutionary idea that a mutual fund company should be managed solely in the interest of its investors.
Four decades later, that revolutionary spirit continues to animate the enterprise. Vanguard remains on a mission to give investors the best chance of investment success.
As we mark our 40th anniversary, we thank you for entrusting your assets to Vanguard and giving us the opportunity to help you reach your financial goals in the decades to come.
| |
| Contents | |
| Your Fund’s Total Returns. | 1 |
| Chairman’s Letter. | 2 |
| Advisor’s Report. | 8 |
| Fund Profile. | 11 |
| Performance Summary. | 13 |
| Financial Statements. | 15 |
| About Your Fund’s Expenses. | 34 |
| Glossary. | 36 |
Please note: The opinions expressed in this report are just that—informed opinions. They should not be considered promises or advice. Also, please keep in mind that the information and opinions cover the period through the date on the front of this report. Of course, the risks of investing in your fund are spelled out in the prospectus.
See the Glossary for definitions of investment terms used in this report.
About the cover: Since our founding, Vanguard has drawn inspiration from the enterprise and valor demonstrated by British naval hero Horatio Nelson and his command at the Battle of the Nile in 1798. The photograph displays a replica of a merchant ship from the same era as Nelson’s flagship, the HMS Vanguard.
Your Fund’s Total Returns
| | |
| Period Ended October 31, 2014 | |
| | Returns |
| | Since Inception |
| Vanguard Global Minimum Volatility Fund | |
| Investor Shares (Inception: 12/12/2013) | 14.37% |
| Admiral™ Shares (Inception: 12/12/2013) | 14.42 |
| FTSE Global All Cap Index (USD Hedged) | 11.66 |
| Global Funds Average | 5.83 |
| Global Funds Average: Derived from data provided by Lipper, a Thomson Reuters Company. |
| | | | | |
| Your Fund’s Performance at a Glance | | | | |
| Inception Through October 31, 2014 | | | | |
| | | | Distributions Per Share |
| | Starting | Ending | | |
| | Share | Share | Income | Capital |
| | Price | Price | Dividends | Gains |
| Vanguard Global Minimum Volatility Fund | | | | |
| Investor Shares | $10.00 | $11.41 | $0.024 | $0.000 |
| Admiral Shares | 20.00 | 22.83 | 0.048 | 0.000 |
1

Chairman’s Letter
Dear Shareholder,
Vanguard Global Minimum Volatility Fund aims to give investors global equity exposure with a relatively smoother ride than they would experience by investing in the global stock market as a whole. The fund is off to a good start in its first 10½ months.
From its December 12, 2013, inception through October 31, 2014, the fund delivered annualized daily volatility of about 7%, compared with about 9% for its benchmark, the FTSE Global All Cap Index (USD Hedged). We measure volatility using a statistic called standard deviation, which calculates the degree to which the fund’s return in a given period varies from its average return.
For the partial fiscal year, the Global Minimum Volatility Fund’s total return was 14.37% for Investor Shares (14.42% for Admiral Shares), ahead of the 11.66% return of its benchmark and the 5.83% average return of its global fund peers. However, as in comparisons with the benchmark index, your fund’s return relative to the peer-group average tells only part of the story. The vast majority of peer funds don’t follow an investment strategy that is focused on reducing volatility—which includes managing the foreign currency exposure that arises for U.S. investors who own stocks that trade in international markets.
A more appropriate indicator of your fund’s success, given its particular investment objective, is its risk-adjusted return—its
2
return divided by the standard deviation of its returns. Think of it as a measure of return earned per unit of risk taken. As I noted in my April letter, the fund will provide strong value to investors if its risk-adjusted return is above that of the market. For the partial fiscal year, your fund’s risk-adjusted return was 2.1, compared with 1.3 for its benchmark index. Although this is too short a period to draw conclusions, we’re encouraged that the fund’s performance is consistent with our expectations.
Their smooth ride turned jagged, but U.S. stocks ended higher
Punctuated by a roller coaster of an October, the broad U.S. stock market returned about 16% for the 12 months ended October 31.
Impressive corporate earnings and various global stimulus measures generally supported stocks during most of the period against a bleaker backdrop that included tensions in the Middle East and Ukraine. But in the first two weeks of October, stocks declined sharply as investors reacted to more apparent weakness in the global economy, especially the slowdown in China and the increased threat of deflation in Europe. Reflecting confidence in the U.S. economy, however, the Federal Reserve announced in late October that it was ending its stimulative bond-buying program as anticipated.
U.S. stocks staged an impressive rebound in the period’s final two weeks, and several major indexes finished at
| | | | |
| Market Barometer | | | |
| | | Average Annual Total Returns |
| | | Periods Ended October 31, 2014 |
| | One | Three | Five |
| | Year | Years | Years |
| Stocks | | | |
| Russell 1000 Index (Large-caps) | 16.78% | 19.90% | 16.98% |
| Russell 2000 Index (Small-caps) | 8.06 | 18.18 | 17.39 |
| Russell 3000 Index (Broad U.S. market) | 16.07 | 19.77 | 17.01 |
| FTSE All-World ex US Index (International) | 0.45 | 8.07 | 6.38 |
| |
| Bonds | | | |
| Barclays U.S. Aggregate Bond Index (Broad taxable market) | 4.14% | 2.73% | 4.22% |
| Barclays Municipal Bond Index (Broad tax-exempt market) | 7.82 | 4.93 | 5.26 |
| Citigroup Three-Month U.S. Treasury Bill Index | 0.04 | 0.04 | 0.06 |
| |
| CPI | | | |
| Consumer Price Index | 1.66% | 1.60% | 1.89% |
3
record highs. International stocks didn’t fare as well. Emerging markets posted a modest 12-month advance, while the developed markets of Europe and the Pacific region slipped.
Bonds posted mixed results as already low yields declined
The broad U.S. taxable bond market returned 4.14%. Bond prices, which backtracked at times over the summer, climbed in October as investors sought sanctuary from stock market volatility.
Overall, bond returns were strong despite many analysts’ expectations that already low yields wouldn’t decline further. Even as the Fed began steadily reducing its bond purchases in January, prices rose, and the yield of the 10-year U.S. Treasury note ended October at 2.31%, down from 2.54% a year earlier. (Bond prices and yields move in opposite directions.)
Municipal bonds returned 7.82%, with tax-exempt issues in high demand even at a time of reduced supply.
The Fed’s target for short-term interest rates remained at 0%–0.25%, restraining returns for money market funds and savings accounts.
International bond markets (as measured by the Barclays Global Aggregate Index ex USD, hedged) returned more than 6%, outperforming the broad U.S. bond market. The value of some foreign currencies, such
| | | |
| Expense Ratios | | | |
| Your Fund Compared With Its Peer Group | | | |
| | Investor | Admiral | Peer Group |
| | Shares | Shares | Average |
| Global Minimum Volatility Fund | 0.30% | 0.20% | 1.44% |
| The fund expense ratios shown are from the prospectus dated December 12, 2013, and represent estimated costs for the current fiscal period. For the fiscal period from inception through October 31, 2014, the fund’s annualized expense ratios were 0.30% for Investor Shares and 0.20% for Admiral Shares. The peer-group expense ratio is derived from data provided by Lipper, a Thomson Reuters Company, and captures information through year-end 2013. |
|
|
|
|
Peer group: Global Funds.
4
as the Japanese yen, significantly weakened relative to the U.S. dollar during the 12 months. As a result, for dollar-based investors, the return of the unhedged version of the index was negative—highlighting the importance of hedging to minimize the impact of currency fluctuations on returns.
The fund tries to tame the path in pursuit of global stock returns
We offer the Global Minimum Volatility Fund for investors who want a less bumpy ride while still participating in the potential returns of stocks, which have historically outperformed bonds over the long term. By trying to moderate volatility, the fund seeks to temper some of the market turbulence that can prompt investors to abandon stocks during periods of duress.
Our research leads us to expect that, on average, a minimum volatility fund may outperform the overall global market in sharp downturns (while still experiencing losses) and trail it in strong bull markets. Of course, because the fund is expected to have a lower level of risk than the global equity market, you should not expect it to outperform the market over the long run.
Vanguard Equity Investment Group, through its Quantitative Equity Group (QEG), uses quantitative models to evaluate all the stocks in nearly 50 developed and emerging
|
| ‘Low’ or ‘minimum’ volatility: What’s in a name? |
| |
| When it comes to the name of a mutual fund, there can be more—or less—than meets |
| the eye. |
| |
| Consider funds branded as “low” or “minimum” volatility. There’s an important distinction |
| between these investment strategies that isn’t made apparent by labeling alone, as the terms |
| are often used interchangeably in product names and investment literature. |
| |
| Both seek to provide stock returns with a smoother ride than the market they invest in, but |
| they use different tools. “Low” volatility is a simple strategy of rank-ordering a universe of |
| stocks typically based on a single measure of past volatility, then selecting a pre-set percentage |
| of those stocks for a portfolio. This can lead to concentration risk because constraints on |
| industry or sector weights aren’t generally applied. |
| |
| “Minimum” volatility is a more sophisticated strategy that focuses on various factors that |
| drive a portfolio’s volatility, including estimates of correlation (how stocks move in relation to |
| each other). Vanguard’s Quantitative Equity Group uses this approach in managing your fund. |
| The team also applies portfolio constraints to manage unintended exposures such as sector |
| overweights that could have a big impact on performance. |
| |
| As with any investment, Vanguard recommends that you look under the hood to know what |
| you own and why you own it. |
5
countries represented in the benchmark. Your advisor’s selection process includes estimates of expected returns and cross-correlations between securities. (See the box on page 5 for more on this.) Over time, the advisor expects to invest about half the fund’s assets in the stocks of U.S. companies and half in those of foreign companies.
Because this is an actively managed fund, you can expect that country and sector weightings will differ from those of the benchmark index. For example, during the period, the fund’s stakes in each of three sectors—energy, financials, and materials—were about 4 percentage points lighter, on average, than those in the benchmark. QEG imposes a set of constraints to prevent concentrated exposure to any single country or industry; this helps to ensure portfolio diversification and liquidity (the ability to readily trade into and out of holdings).
To minimize volatility for U.S.-based investors, the advisor also uses currency contracts to try to eliminate the impact of changes in exchange rates between foreign currencies and the U.S. dollar. Typically, however, some currency exposure will remain. During the period, hedging of currency exposure helped reduce the “noise” arising from the strengthening of the dollar relative to many major currencies. Of course, although this strategy reduces the absolute volatility of the fund, it should not be expected to materially affect the fund’s performance relative to its benchmark, which is similarly hedged.
For more on QEG’s investment strategy and process, please see the Advisor’s Report that follows this letter.
When market volatility heats up, the best response is to keep cool
After several years of strength, stocks hit an especially rough patch late in the fiscal year, as I noted earlier. Global stock markets stumbled in the first half of October, then rebounded dramatically, undoubtedly leaving many investors feeling unsettled.
What’s my best advice to anxious shareholders? Remain calm and remember that volatility is a normal part of stock market investing. The value of keeping a cool head is highlighted in a Vanguard research paper that looked at how investors behaved during the financial crisis, when global stocks declined about 58% and U.S. stocks about 55%.
The 2010 paper, Resilience in Volatile Markets: 401(k) Participant Behavior, September 2007–December 2009, examined the behavior of participants in Vanguard-administered retirement plans. During that time, about three-quarters of participants made no changes to their accounts, and only 3% gave up on stocks completely.
As stocks recovered, this discipline yielded big benefits. From the end of 2008 to the end of 2013, the average Vanguard 401(k) portfolio nearly doubled in value, largely because of the surge in stock prices.
6
I’m pleased that, over time, our clients have demonstrated an impressive ability to remain focused on their long-term goals. They stayed the course through the 1987 correction, the dot-com boom of the 1990s, and the more recent financial crisis, and they continue to do so today.
And with the addition of the Global Minimum Volatility Fund to Vanguard’s lineup, our investors have another option to help them stay the course and maintain a balanced and diversified portfolio. For long-term investors seeking equity-like returns with more muted ups and downs—and who can accept the risk that this active fund may significantly underperform or outperform the broad market at times—the fund can potentially play a very useful role.
As always, thank you for investing with Vanguard.
Sincerely,

F. William McNabb III
Chairman and Chief Executive Officer
November 19, 2014
7
Advisor’s Report
We are pleased to present the annual Advisor’s Report for Vanguard Global Minimum Volatility Fund, which opened for investment on December 12, 2013. The fund posted strong results for the partial fiscal year ended October 31, 2014, with a total return of 14.37% for Investor Shares and an annualized daily volatility of 6.97%. By comparison, its benchmark, the FTSE Global All Cap Index (USD Hedged), returned 11.66% with an annualized daily volatility of 8.79%. (Just a bit of math: To get the annualized daily volatility, we calculate the standard deviation of daily returns, then multiply it by the square root of 252, generally the number of trading days in a year.)
Investment objective and strategy
Our objective is to create a portfolio that has broad equity exposure with less volatility than the global equity market. We achieved this over the performance period, when the fund’s volatility was about 20% less than that of its benchmark, on average.
It is important to mention that we do not target a specific volatility level. Rather, we seek to provide an equity fund that has lower absolute risk than the broad global market. Thus, when the broad global equity market is experiencing spikes in volatility, you should expect this fund’s volatility to rise as well—just not by the same magnitude. For example, on June 30 (when market volatility as a whole was low), the fund produced a rolling 20-day annualized volatility of 3.7%, compared with the benchmark’s 4.0%. At the end of the fiscal year on October 31 (when volatility as a whole had shifted upward), the fund produced a rolling 20-day annualized volatility of 10.7%, more than 3 percentage points below the benchmark’s 14.2%.
While we recognize that equity-like returns are also an important outcome of an investment in this fund, achieving a total return higher than the benchmark’s is not an explicit objective of our approach. With this in mind, we believe it is reasonable to expect the fund to outperform in many down markets and to underperform in some strong bull markets.
Over the long term, we think an acceptable comparative performance measure is the fund’s risk-adjusted return. This can be calculated by dividing the portfolio’s total return for the period by the annualized standard deviation of daily returns. For the fund’s first 10½ months—admittedly a relatively short time for comparison—the risk-adjusted return was 2.06, compared with 1.33 for the benchmark.
To construct a portfolio to meet our objectives, we incorporate quantitative models that evaluate a variety of equity factors that drive a portfolio’s volatility—such as a company’s market capitalization and its value or growth orientation—in addition to estimates of stocks’ correlation. (Correlation measures how the returns of stocks move in relation to each other.)
When building our portfolio, we apply constraints to reduce stock, sector, and country concentration risk. These constraints, which allow for broader diversification and liquidity, reduce
8
unnecessarily high risk exposures without significantly affecting our ability to reduce overall volatility. Drawing from the universe of about 7,600 stocks in the FTSE index, we construct a portfolio of approximately 350 stocks.
We would also like to draw attention to our treatment of currency exposure in this fund. Owning companies in foreign markets involves the risk of movements in foreign currency exchange rates relative to the U.S. dollar. A portfolio built using an optimization process that focuses on volatilities based on stock returns in an investor’s home currency will tend to overweight exposures to that currency. Instead, we seek to avoid such currency-specific exposures by using an optimization process that focuses on equity volatilities and correlations measured in local currency terms. Then we use foreign currency forward contracts to hedge the resulting currency exposure for U.S. investors. We believe our approach can further reduce the volatility of the portfolio overall in the long run.
The investment environment
Global equities provided solid returns for the period. The North American equity market continued to outpace other developed and emerging markets. Performance within the fund’s benchmark was broad-based as all ten sectors generated positive returns. Results were best in health care, utilities, and information technology.
Part of the ongoing strength in the equity markets can be attributed to the still-accommodative policies of central banks, coupled with lower volatility across financial markets. In the beginning of July, the Chicago Board Options Exchange Volatility Index (VIX) registered 10.3, its lowest level in five years. Volatility began to head back up in August and peaked at 26.5 in mid-October before trending down to levels below its long-term average.
The U.S. labor market further recovered as the unemployment rate fell in October to 5.8%, the lowest since July 2008. Employers added at least 200,000 jobs in each of the nine months through October, the longest such stretch since 1995. In addition, personal income levels have expanded and savings rates have dropped slightly, indicating that consumers may be spending more. GDP growth recovered in the second quarter from a disappointing first quarter, and both manufacturing and nonmanufacturing activity indexes have been moving higher. That said, many factors could still affect the markets in the coming months—including the October end to the Federal Reserve’s bond purchase program, the widening trade deficit, speculation about when interest rates will rise, and geopolitical uncertainties across the globe.
The fund’s successes and shortfalls
The fund met its lower-volatility objective even as market volatility ranged from a five-year low to higher than average. Various exposures and correlation diversification effects helped reduce our overall volatility. Looking at sectors, on average we were overweighted in the less volatile utilities and consumer staples sectors and underweighted in two of the benchmark’s more volatile sectors, information technology and energy. However, our overweight
9
allocation to the more volatile health care sector modestly held back results, as did some of our positions in materials.
Among countries, we were overweighted in some of the benchmark’s less volatile ones, including Singapore, Canada, and Switzerland. Underweight allocations to countries that were more volatile over the period, such as Japan and Spain, also helped.
Our approach to portfolio construction paid off in both volatility reduction and relative performance. Going forward, we remain confident in our ability to produce less volatile returns that are comparable with those of the benchmark on a risk-adjusted basis. But as for total return, we caution that the expectation for higher absolute returns, like those produced by our minimum volatility approach over this period, should be tempered. As we’ve noted, a strategy such as this can reward or fall short of investor expectations over shorter periods. With this in mind, we find that focusing on the portfolio’s long-term risk-adjusted returns relative to the benchmark realigns expectations with the fund’s objective. We thank you for your investment and look forward to the coming fiscal year.
Portfolio Managers:
James D. Troyer, CFA, Principal
James P. Stetler, Principal
Michael R. Roach, CFA
Vanguard Equity Investment Group
November 19, 2014
10
Global Minimum Volatility Fund
Fund Profile
As of October 31, 2014
| | | |
| Share-Class Characteristics | |
| | Investor | Admiral |
| | Shares | Shares |
| Ticker Symbol | VMVFX | VMNVX |
| Expense Ratio1 | 0.30% | 0.20% |
| | | |
| Portfolio Characteristics | | |
| | | FTSE Global |
| | | All Cap Index |
| | Fund | (USD Hedged) |
| Number of Stocks | 368 | 7,538 |
| Median Market Cap | $7.6B | $34.7B |
| Price/Earnings Ratio | 21.4x | 18.6x |
| Price/Book Ratio | 2.3x | 2.1x |
| Return on Equity | 16.5% | 16.2% |
| Earnings Growth | | |
| Rate | 8.7% | 13.7% |
| Dividend Yield | 2.8% | 2.4% |
| Turnover Rate | 49% | — |
| Short-Term Reserves | 0.9% | — |
| | | |
| Sector Diversification (% of equity exposure) |
| | | FTSE Global |
| | | All Cap Index |
| | Fund | (USD Hedged) |
| Consumer Discretionary | 12.5% | 11.9% |
| Consumer Staples | 13.1 | 8.9 |
| Energy | 4.0 | 8.4 |
| Financials | 17.4 | 22.0 |
| Health Care | 14.0 | 11.1 |
| Industrials | 11.9 | 11.6 |
| Information Technology | 9.4 | 13.3 |
| Materials | 2.4 | 5.9 |
| Telecommunication Services | 7.7 | 3.5 |
| Utilities | 7.6 | 3.4 |
| | | |
| Ten Largest Holdings (% of total net assets) |
| CACI International Inc. | IT Consulting & | |
| | Other Services | 1.6% |
| Church & Dwight Co. | | |
| Inc. | Household Products | 1.5 |
| Clorox Co. | Household Products | 1.4 |
| Covanta Holding Corp. | Environmental & | |
| | Facilities Services | 1.4 |
| Henry Schein Inc. | Health Care | |
| | Distributors | 1.4 |
| BCE Inc. | Integrated | |
| | Telecommunication | |
| | Services | 1.4 |
| Capitol Federal Financial | Thrifts & Mortgage | |
| Inc. | Finance | 1.2 |
| Altria Group Inc. | Tobacco | 1.2 |
| CLP Holdings Ltd. | Electric Utilities | 1.2 |
| Hudson Pacific | | |
| Properties Inc. | Office REITs | 1.2 |
| Top Ten | | 13.5% |
Allocation by Region (% of equity exposure)

1 The expense ratios shown are from the prospectus dated December 12, 2013, and represent estimated costs for the current fiscal period. For the period from inception through October 31, 2014, the annualized expense ratios were 0.30% for Investor Shares and 0.20% for Admiral Shares.
11
Global Minimum Volatility Fund
| | |
| Market Diversification (% of equity exposure) |
| | | FTSE |
| | | Global |
| | | All Cap |
| | | Index |
| | | (USD |
| | Fund | Hedged) |
| Europe | | |
| United Kingdom | 6.7% | 7.2% |
| Switzerland | 3.3 | 2.9 |
| Germany | 2.8 | 2.8 |
| Netherlands | 1.4 | 0.9 |
| Denmark | 1.0 | 0.5 |
| Other | 2.5 | 7.4 |
| Subtotal | 17.7% | 21.7% |
| Pacific | | |
| Australia | 5.4% | 2.7% |
| Hong Kong | 5.3 | 1.3 |
| Japan | 4.6 | 7.7 |
| South Korea | 2.9 | 1.5 |
| Singapore | 1.1 | 0.6 |
| Other | 0.0 | 0.1 |
| Subtotal | 19.3% | 13.9% |
| Emerging Markets | | |
| India | 2.1% | 1.0% |
| Brazil | 1.8 | 1.1 |
| Taiwan | 1.7 | 1.5 |
| Mexico | 1.0 | 0.5 |
| Other | 2.0 | 5.2 |
| Subtotal | 8.6% | 9.3% |
| North America | | |
| United States | 47.0% | 51.3% |
| Canada | 7.0 | 3.6 |
| Subtotal | 54.0% | 54.9% |
| Middle East | 0.4% | 0.2% |
12
Global Minimum Volatility Fund
Performance Summary
All of the returns in this report represent past performance, which is not a guarantee of future results that may be achieved by the fund. (Current performance may be lower or higher than the performance data cited. For performance data current to the most recent month-end, visit our website at vanguard.com/performance.) Note, too, that both investment returns and principal value can fluctuate widely, so an investor’s shares, when sold, could be worth more or less than their original cost. The returns shown do not reflect taxes that a shareholder would pay on fund distributions or on the sale of fund shares.
Cumulative Performance: December 12, 2013, Through October 31, 2014
Initial Investment of $10,000

| | | |
| | Total Returns | |
| | Period Ended October 31, 2014 | |
| | Since | Final Value |
| | Inception | of a $10,000 |
| | | (12/12/2013) | Investment |
| | Global Minimum Volatility | | |
| | Fund*Investor Shares | 14.37% | $11,437 |
| | FTSE Global All Cap Index (USD | | |
| | Hedged) | 11.66 | 11,166 |
| – – – – | Global Funds Average | 5.83 | 10,583 |
Global Funds Average: Derived from data provided by Lipper, a Thomson Reuters Company.
"Since Inception" performance is calculated from the Investor Shares’ inception date for both the fund and its comparative standards. |
|
| | |
| | Since | Final Value |
| | Inception | of a $50,000 |
| | (12/12/2013) | Investment |
| Global Minimum Volatility Fund Admiral Shares | 14.42% | $57,209 |
| FTSE Global All Cap Index (USD Hedged) | 11.66 | 55,829 |
| "Since Inception" performance is calculated from the Admiral Shares’ inception date for both the fund and its comparative standards. |
See Financial Highlights for dividend and capital gains information.
13
Global Minimum Volatility Fund
Fiscal-Period Total Returns (%): December 12, 2013, Through October 31, 2014

| | | |
| Total Returns: Periods Ended September 30, 2014 | | |
| This table presents returns through the latest calendar quarter—rather than through the end of the fiscal period. |
| Securities and Exchange Commission rules require that we provide this information. | |
| |
| |
| | Inception | Since |
| | Date | Inception |
| Investor Shares | 12/12/2013 | 10.56% |
| Admiral Shares | 12/12/2013 | 10.71 |
14
Global Minimum Volatility Fund
Financial Statements
Statement of Net Assets
As of October 31, 2014
The fund reports a complete list of its holdings in regulatory filings four times in each fiscal year, at the quarter-ends. For the second and fourth fiscal quarters, the lists appear in the fund’s semiannual and annual reports to shareholders. For the first and third fiscal quarters, the fund files the lists with the Securities and Exchange Commission on Form N-Q. Shareholders can look up the fund’s Forms N-Q on the SEC’s website at sec.gov. Forms N-Q may also be reviewed and copied at the SEC’s Public Reference Room (see the back cover of this report for further information).
| | |
| | | Market |
| | | Value• |
| | Shares | ($000) |
| Common Stocks (96.3%)1 | | |
| Australia (5.1%) | | |
| Telstra Corp. Ltd. | 1,083,888 | 5,383 |
| Transurban Group | 608,582 | 4,374 |
| Wesfarmers Ltd. | 105,181 | 4,101 |
| BWP Trust | 796,405 | 1,771 |
| DUET Group | 720,084 | 1,561 |
| Sonic Healthcare Ltd. | 78,338 | 1,292 |
| ASX Ltd. | 36,272 | 1,152 |
| Woodside Petroleum Ltd. | 32,208 | 1,141 |
| Harvey Norman | | |
| Holdings Ltd. | 288,503 | 967 |
| Abacus Property Group | 307,286 | 732 |
| Charter Hall Retail REIT | 191,055 | 686 |
| AGL Energy Ltd. | 29,549 | 354 |
| JB Hi-Fi Ltd. | 16,273 | 224 |
| Amcom | | |
| Telecommunications Ltd. | 95,223 | 187 |
| Sydney Airport | 43,331 | 169 |
| Origin Energy Ltd. | 10,733 | 135 |
| GPT Group | 20,643 | 75 |
| Invocare Ltd. | 6,500 | 70 |
| Coca-Cola Amatil Ltd. | 5,801 | 47 |
| | | 24,421 |
| Belgium (0.7%) | | |
| Sofina SA | 11,583 | 1,255 |
| Elia System Operator | | |
| SA/NV | 23,212 | 1,152 |
| Cofinimmo SA | 4,692 | 545 |
| UCB SA | 2,802 | 226 |
| Belgacom SA | 1,504 | 57 |
| Colruyt SA | 800 | 36 |
| bpost SA | 789 | 20 |
| | | 3,291 |
| Brazil (1.7%) | | |
| Embraer SA ADR | 70,400 | 2,720 |
| Telefonica Brasil SA ADR | 93,700 | 1,915 |
| | | |
| | | | Market |
| | | | Value• |
| | | Shares | ($000) |
| | Ultrapar Participacoes | | |
| | SA ADR | 75,600 | 1,641 |
| | BRF SA ADR | 48,500 | 1,263 |
| | Cia Brasileira de | | |
| | Distribuicao ADR | 10,700 | 447 |
| | Gerdau SA ADR | 52,500 | 238 |
| | CPFL Energia SA ADR | 1,000 | 15 |
| | | | 8,239 |
| Canada (6.9%) | | |
| | BCE Inc. | 148,500 | 6,594 |
| | Emera Inc. | 123,750 | 4,160 |
| ^ | Fortis Inc. | 116,500 | 3,796 |
| ^ | Canadian Tire Corp. Ltd. | | |
| | Class A | 26,500 | 2,905 |
| | Manitoba Telecom | | |
| | Services Inc. | 90,200 | 2,378 |
| | TELUS Corp. | 50,300 | 1,803 |
| | TransCanada Corp. | 30,600 | 1,508 |
| ^ | Cineplex Inc. | 38,200 | 1,439 |
| | Dollarama Inc. | 12,300 | 1,081 |
| | Thomson Reuters Corp. | 28,700 | 1,068 |
| ^ | Parkland Fuel Corp. | 45,600 | 892 |
| ^ | Shaw Communications Inc. | | |
| | Class B | 32,600 | 837 |
| | Toronto-Dominion Bank | 13,800 | 679 |
| | Gibson Energy Inc. | 17,900 | 521 |
| ^ | Corus Entertainment Inc. | | |
| | Class B | 27,300 | 502 |
| | Intact Financial Corp. | 6,600 | 442 |
| | Loblaw Cos. Ltd. | 7,900 | 412 |
| | National Bank of Canada | 8,400 | 393 |
| | Aimia Inc. | 23,500 | 339 |
| ^ | Extendicare Inc. | 42,000 | 304 |
| | Bonterra Energy Corp. | 5,000 | 225 |
| | George Weston Ltd. | 2,000 | 163 |
| | RONA Inc. | 13,000 | 159 |
| | Calloway REIT | 2,000 | 49 |
| | | | 32,649 |
15
Global Minimum Volatility Fund
| | | |
| | | | Market |
| | | | Value• |
| | | Shares | ($000) |
| Chile (0.3%) | | |
| | Cia Cervecerias Unidas | | |
| | SA ADR | 29,000 | 618 |
| | Enersis SA ADR | 36,100 | 570 |
| | Banco Santander Chile ADR | 2,000 | 42 |
| | | | 1,230 |
| China (0.3%) | | |
| | China Mobile Ltd. ADR | 22,800 | 1,416 |
| |
| Denmark (1.0%) | | |
| | TDC A/S | 234,302 | 1,789 |
| * | Topdanmark A/S | 27,823 | 886 |
| * | William Demant Holding A/S | 11,062 | 839 |
| | Tryg A/S | 4,413 | 477 |
| * | Royal UNIBREW | 1,957 | 320 |
| | ALK-Abello A/S | 2,012 | 226 |
| | Matas A/S | 7,170 | 158 |
| | | | 4,695 |
| France (0.3%) | | |
| | BioMerieux | 7,524 | 794 |
| | Sodexo | 5,000 | 482 |
| | Orpea | 2,015 | 123 |
| | | | 1,399 |
| Germany (2.6%) | | |
| | Rhoen Klinikum AG | 94,714 | 2,821 |
| | Fresenius Medical Care | | |
| | AG & Co. KGaA | 37,230 | 2,731 |
| | Fielmann AG | 39,184 | 2,556 |
| * | Sky Deutschland AG | 289,911 | 2,448 |
| | Fresenius SE & Co. KGaA | 19,817 | 1,020 |
| | MAN SE | 5,556 | 633 |
| | Celesio AG | 7,750 | 255 |
| * | Rhoen-Klinikum AG Tender | | |
| | Rights Expire 11/14/2014 | 94,714 | 80 |
| | | | 12,544 |
| Hong Kong (5.2%) | | |
| | CLP Holdings Ltd. | 670,000 | 5,768 |
| | Yuexiu REIT | 6,296,000 | 3,123 |
| | Tingyi Cayman Islands | | |
| | Holding Corp. | 900,000 | 2,258 |
| | Chow Tai Fook Jewellery | | |
| | Group Ltd. | 1,427,600 | 2,013 |
| | Hang Seng Bank Ltd. | 100,500 | 1,703 |
| | Want Want China | | |
| | Holdings Ltd. | 999,000 | 1,381 |
| | Hopewell Highway | | |
| | Infrastructure Ltd. | 2,375,000 | 1,148 |
| | Uni-President China | | |
| | Holdings Ltd. | 1,199,000 | 1,108 |
| | Television Broadcasts Ltd. | 192,700 | 1,055 |
| *,2 | WH Group Ltd. | 1,512,000 | 989 |
| | Towngas China Co. Ltd. | 691,000 | 725 |
| | VTech Holdings Ltd. | 56,600 | 709 |
| | | |
| | | | Market |
| | | | Value• |
| | | Shares | ($000) |
| | China Mengniu Dairy | | |
| | Co. Ltd. | 160,000 | 706 |
| | Sun Art Retail Group Ltd. | 378,250 | 406 |
| | TCC International | | |
| | Holdings Ltd. | 922,000 | 373 |
| | Li & Fung Ltd. | 216,000 | 265 |
| * | Microport Scientific Corp. | 492,000 | 249 |
| | Prosperity REIT | 547,000 | 183 |
| | Road King Infrastructure Ltd. | 201,000 | 175 |
| | Chow Sang Sang Holdings | | |
| | International Ltd. | 20,000 | 50 |
| | Parkson Retail Group Ltd. | 140,000 | 41 |
| | Hopewell Holdings Ltd. | 10,000 | 35 |
| | APT Satellite Holdings Ltd. | 23,500 | 34 |
| | | | 24,497 |
| India (2.0%) | | |
| | Dr Reddy’s Laboratories | | |
| | Ltd. ADR | 105,200 | 5,501 |
| | Infosys Ltd. ADR | 47,500 | 3,176 |
| | HDFC Bank Ltd. ADR | 7,000 | 367 |
| 2 | Reliance Industries Ltd. GDR | 10,151 | 329 |
| | Wipro Ltd. ADR | 14,100 | 172 |
| | | | 9,545 |
| Indonesia (0.1%) | | |
| | Telekomunikasi Indonesia | | |
| | Persero Tbk PT ADR | 15,400 | 698 |
| |
| Israel (0.4%) | | |
| | Paz Oil Co. Ltd. | 5,690 | 811 |
| | Cellcom Israel Ltd. | | |
| | (Registered) | 28,069 | 285 |
| | Ituran Location and | | |
| | Control Ltd. | 10,962 | 220 |
| | Delek Automotive | | |
| | Systems Ltd. | 19,918 | 202 |
| | Bezeq The Israeli | | |
| | Telecommunication | | |
| | Corp. Ltd. | 92,875 | 158 |
| * | Bank Leumi Le-Israel BM | 38,674 | 138 |
| | Reit 1 Ltd. | 41,599 | 107 |
| | Bank Hapoalim BM | 2,191 | 11 |
| | | | 1,932 |
| Italy (0.4%) | | |
| | Parmalat SPA | 628,084 | 1,888 |
| |
| Japan (4.4%) | | |
| | Kagome Co. Ltd. | 225,700 | 3,672 |
| | Takeda Pharmaceutical | | |
| | Co. Ltd. | 44,700 | 1,950 |
| | Canon Inc. | 59,400 | 1,829 |
| | MOS Food Services Inc. | 56,200 | 1,113 |
| | Kappa Create Holdings | | |
| | Co. Ltd. | 94,500 | 862 |
| | TonenGeneral Sekiyu KK | 94,000 | 829 |
16
Global Minimum Volatility Fund
| | | |
| | | | Market |
| | | | Value• |
| | | Shares | ($000) |
| | Studio Alice Co. Ltd. | 61,900 | 794 |
| | Ringer Hut Co. Ltd. | 44,500 | 691 |
| | Matsuya Foods Co. Ltd. | 31,600 | 618 |
| | Kisoji Co. Ltd. | 32,100 | 557 |
| | Fujiya Co. Ltd. | 309,000 | 548 |
| | Eisai Co. Ltd. | 13,700 | 537 |
| | Sakata Seed Corp. | 33,300 | 491 |
| | Earth Chemical Co. Ltd. | 13,200 | 490 |
| | Sawai Pharmaceutical Co. Ltd. | 7,800 | 467 |
| | Kasumi Co. Ltd. | 42,200 | 405 |
| | Daiichi Sankyo Co. Ltd. | 26,600 | 402 |
| | Key Coffee Inc. | 27,900 | 401 |
| | Keiyo Co. Ltd. | 80,900 | 367 |
| | Nitto Kohki Co. Ltd. | 18,200 | 342 |
| | Mitsubishi Tanabe | | |
| | Pharma Corp. | 21,100 | 325 |
| | Atom Corp. | 58,100 | 316 |
| | Morinaga & Co. Ltd. | 128,000 | 281 |
| | Sagami Chain Co. Ltd. | 29,000 | 277 |
| | Senshukai Co. Ltd. | 34,200 | 275 |
| | Rock Field Co. Ltd. | 13,500 | 229 |
| | Daisyo Corp. | 18,000 | 218 |
| | Kourakuen Corp. | 15,900 | 201 |
| | Saizeriya Co. Ltd. | 13,500 | 198 |
| | Hioki EE Corp. | 11,600 | 179 |
| | ST Corp. | 15,900 | 144 |
| | Taisei Lamick Co. Ltd. | 5,800 | 141 |
| | Itochu-Shokuhin Co. Ltd. | 4,100 | 137 |
| | Kyoto Kimono Yuzen Co. Ltd. | 13,300 | 120 |
| | Zensho Holdings Co. Ltd. | 10,000 | 91 |
| | Unicharm Corp. | 3,300 | 77 |
| | Kohnan Shoji Co. Ltd. | 6,000 | 70 |
| | Meiko Network Japan Co. Ltd. | 3,500 | 39 |
| | Dunlop Sports Co. Ltd. | 2,000 | 24 |
| | | | 20,707 |
| Mexico (1.0%) | | |
| | Grupo Aeroportuario del | | |
| | Pacifico SAB de CV ADR | 55,100 | 3,755 |
| * | Fomento Economico | | |
| | Mexicano SAB de CV ADR | 5,200 | 501 |
| * | Cemex SAB de CV ADR | 24,500 | 301 |
| | Grupo Televisa SAB ADR | 5,200 | 188 |
| | America Movil SAB de | | |
| | CV ADR | 1,000 | 24 |
| | Coca-Cola Femsa SAB de | | |
| | CV ADR | 100 | 11 |
| | | | 4,780 |
| Netherlands (1.4%) | | |
| | Reed Elsevier NV | 142,682 | 3,288 |
| | Wolters Kluwer NV | 105,880 | 2,828 |
| | Wereldhave NV | 1,955 | 160 |
| * | AMG Advanced | | |
| | Metallurgical Group NV | 19,113 | 158 |
| | Koninklijke Vopak NV | 1,333 | 67 |
| | | | 6,501 |
| | |
| | | Market |
| | | Value• |
| | Shares | ($000) |
| Norway (0.6%) | | |
| Statoil ASA | 67,576 | 1,545 |
| Telenor ASA | 19,421 | 437 |
| Norsk Hydro ASA | 76,380 | 427 |
| Orkla ASA | 29,472 | 225 |
| Schibsted ASA | 1,095 | 58 |
| | | 2,692 |
| Russia (0.8%) | | |
| MMC Norilsk Nickel OJSC | | |
| ADR (London Shares) | 112,811 | 2,103 |
| Surgutneftegas OAO ADR | 218,525 | 1,440 |
| NOVATEK OAO GDR | 1,172 | 126 |
| Tatneft OAO ADR | 2,887 | 103 |
| Uralkali OJSC GDR | 5,002 | 89 |
| Severstal OAO GDR | 5,923 | 63 |
| MMC Norilsk Nickel | | |
| OJSC ADR | 3,000 | 56 |
| Lukoil OAO ADR | 416 | 20 |
| Rosneft OAO GDR | 2,430 | 14 |
| | | 4,014 |
| Singapore (1.1%) | | |
| Singapore Airlines Ltd. | 239,000 | 1,843 |
| DBS Group Holdings Ltd. | 116,000 | 1,676 |
| Keppel Corp. Ltd. | 93,000 | 686 |
| StarHub Ltd. | 68,000 | 219 |
| Religare Health Trust | 249,000 | 192 |
| Singapore Press | | |
| Holdings Ltd. | 34,000 | 114 |
| Oversea-Chinese Banking | | |
| Corp. Ltd. | 10,148 | 78 |
| Singapore | | |
| Telecommunications Ltd. | 14,000 | 41 |
| Singapore Post Ltd. | 26,000 | 40 |
| Fortune REIT | 35,000 | 32 |
| Ascendas REIT | 16,000 | 28 |
| OUE Hospitality Trust | 29,000 | 21 |
| Genting Singapore plc | 23,000 | 20 |
| CapitaMall Trust | 11,000 | 17 |
| | | 5,007 |
| South Africa (0.3%) | | |
| * AngloGold Ashanti Ltd. ADR | 150,900 | 1,248 |
| |
| South Korea (2.8%) | | |
| S-Oil Corp. | 57,862 | 2,195 |
| Bukwang Pharmaceutical | | |
| Co. Ltd. | 95,991 | 1,793 |
| Yuhan Corp. | 8,929 | 1,475 |
| Hankook Tire Worldwide | | |
| Co. Ltd. | 50,129 | 1,016 |
| * Asiana Airlines Inc. | 214,920 | 808 |
| Hyundai Marine & Fire | | |
| Insurance Co. Ltd. | 30,245 | 800 |
| Macquarie Korea | | |
| Infrastructure Fund | 106,880 | 713 |
| Hyundai Greenfood Co. Ltd. | 41,202 | 704 |
17
Global Minimum Volatility Fund
| | |
| | | Market |
| | | Value• |
| | Shares | ($000) |
| LG Uplus Corp. | 57,654 | 592 |
| Green Cross Holdings Corp. | 23,940 | 505 |
| Korea Zinc Co. Ltd. | 1,238 | 466 |
| Hite Jinro Co. Ltd. | 13,595 | 337 |
| Ilyang Pharmaceutical | | |
| Co. Ltd. | 12,612 | 319 |
| POSCO Chemtech Co. Ltd. | 2,217 | 309 |
| GS Holdings Corp. | 7,638 | 296 |
| KT Corp. | 7,774 | 239 |
| Hyundai Department Store | | |
| Co. Ltd. | 1,719 | 217 |
| MegaStudy Co. Ltd. | 3,000 | 151 |
| Samsung Techwin Co. Ltd. | 4,700 | 144 |
| Halla Holdings Corp. | 1,761 | 117 |
| Sindoh Co. Ltd. | 1,667 | 110 |
| Shinsegae Co. Ltd. | 540 | 100 |
| * KT Corp. ADR | 700 | 11 |
| | | 13,417 |
| Spain (0.1%) | | |
| Viscofan SA | 8,941 | 526 |
| |
| Sweden (0.3%) | | |
| Swedish Match AB | 26,615 | 865 |
| Axfood AB | 11,163 | 689 |
| | | 1,554 |
| Switzerland (3.3%) | | |
| Swisscom AG | 9,616 | 5,668 |
| Kaba Holding AG Class B | 5,720 | 2,727 |
| Novartis AG | 26,699 | 2,476 |
| Allreal Holding AG | 9,242 | 1,223 |
| Galenica AG | 1,035 | 885 |
| Novartis AG ADR | 9,400 | 871 |
| Siegfried Holding AG | 3,851 | 592 |
| Chocoladefabriken Lindt & | | |
| Sprungli AG | 106 | 532 |
| Alpiq Holding AG | 4,043 | 407 |
| Helvetia Holding AG | 218 | 104 |
| | | 15,485 |
| Taiwan (1.7%) | | |
| Chunghwa Telecom Co. | | |
| Ltd. ADR | 140,700 | 4,269 |
| Taiwan Semiconductor | | |
| Manufacturing Co. | | |
| Ltd. ADR | 93,400 | 2,057 |
| United Microelectronics | | |
| Corp. ADR | 700,200 | 1,533 |
| | | 7,859 |
| United Kingdom (6.3%) | | |
| National Grid plc | 356,213 | 5,281 |
| British American | | |
| Tobacco plc | 86,820 | 4,931 |
| Next plc | 40,667 | 4,198 |
| GlaxoSmithKline plc | 113,376 | 2,570 |
| Centrica plc | 389,626 | 1,888 |
| Reed Elsevier plc | 105,062 | 1,728 |
| | | |
| | | | Market |
| | | | Value• |
| | | Shares | ($000) |
| | Burberry Group plc | 67,886 | 1,665 |
| | UK Commercial Property | | |
| | Trust Ltd. | 946,030 | 1,294 |
| | DCC plc | 20,229 | 1,133 |
| | F&C Commercial Property | | |
| | Trust Ltd. | 537,029 | 1,103 |
| | BAE Systems plc | 133,169 | 979 |
| * | Compass Group plc | 36,815 | 593 |
| | Ultra Electronics | | |
| | Holdings plc | 17,786 | 497 |
| | BP plc | 50,000 | 360 |
| | Inmarsat plc | 30,220 | 332 |
| | Sage Group plc | 44,831 | 271 |
| | Land Securities Group plc | 14,464 | 257 |
| | BT Group plc | 42,856 | 252 |
| | British Sky Broadcasting | | |
| | Group plc | 16,724 | 237 |
| * | BTG plc | 16,716 | 202 |
| | Randgold Resources Ltd. | 1,598 | 93 |
| | Intu Properties plc | 10,240 | 56 |
| | Premier Oil plc | 3,229 | 13 |
| | | | 29,933 |
| United States (45.2%) | | |
| Consumer Discretionary (3.2%) | | |
| | Hasbro Inc. | 64,000 | 3,682 |
| | McDonald’s Corp. | 35,400 | 3,318 |
| | Cracker Barrel Old Country | | |
| | Store Inc. | 26,000 | 2,999 |
| | Churchill Downs Inc. | 17,600 | 1,795 |
| | John Wiley & Sons Inc. | | |
| | Class A | 30,300 | 1,769 |
| | Service Corp. International | 50,400 | 1,102 |
| | HSN Inc. | 7,500 | 496 |
| | Meredith Corp. | 5,700 | 297 |
| | | | 15,458 |
| Consumer Staples (6.1%) | | |
| | Church & Dwight Co. Inc. | 95,500 | 6,915 |
| | Clorox Co. | 69,100 | 6,875 |
| | Altria Group Inc. | 120,500 | 5,825 |
| | Procter & Gamble Co. | 26,750 | 2,334 |
| 3 | Wal-Mart Stores Inc. | 25,350 | 1,933 |
| | Philip Morris International Inc. | 20,500 | 1,825 |
| | Coca-Cola Co. | 34,000 | 1,424 |
| | J&J Snack Foods Corp. | 13,100 | 1,350 |
| | Kimberly-Clark Corp. | 3,200 | 366 |
| | McCormick & Co. Inc. | 1,200 | 85 |
| | | | 28,932 |
| Energy (0.8%) | | |
| | Chevron Corp. | 12,700 | 1,523 |
| | Cosan Ltd. | 138,400 | 1,466 |
| | World Fuel Services Corp. | 21,600 | 891 |
| | | | 3,880 |
| Financials (11.8%) | | |
| | Capitol Federal | | |
| | Financial Inc. | 455,900 | 5,840 |
18
Global Minimum Volatility Fund
| | | |
| | | | Market |
| | | | Value• |
| | | Shares | ($000) |
| 3 | Hudson Pacific | | |
| | Properties Inc. | 210,500 | 5,749 |
| * | Markel Corp. | 8,300 | 5,734 |
| | People’s United | | |
| | Financial Inc. | 343,500 | 5,022 |
| | WP Carey Inc. | 56,900 | 3,853 |
| | Starwood Property | | |
| | Trust Inc. | 136,100 | 3,070 |
| | Oritani Financial Corp. | 199,700 | 2,950 |
| | Home Loan Servicing | | |
| | Solutions Ltd. | 142,600 | 2,739 |
| | TFS Financial Corp. | 175,700 | 2,625 |
| | Marsh & McLennan Cos. Inc. | 38,000 | 2,066 |
| | Colony Financial Inc. | 92,600 | 2,063 |
| | Capstead Mortgage Corp. | 138,700 | 1,763 |
| | Acadia Realty Trust | 48,600 | 1,516 |
| * | Beneficial Mutual | | |
| | Bancorp Inc. | 102,200 | 1,373 |
| | Ramco-Gershenson | | |
| | Properties Trust | 68,000 | 1,189 |
| | Urstadt Biddle Properties | | |
| | Inc. Class A | 47,000 | 1,017 |
| | Post Properties Inc. | 17,300 | 968 |
| | Investors Real Estate Trust | 82,500 | 693 |
| | Crown Castle | | |
| | International Corp. | 8,800 | 688 |
| | Brookline Bancorp Inc. | 68,100 | 653 |
| | Northwest Bancshares Inc. | 41,800 | 536 |
| | Sun Communities Inc. | 8,700 | 504 |
| | Two Harbors | | |
| | Investment Corp. | 49,000 | 496 |
| | Alexandria Real Estate | | |
| | Equities Inc. | 5,900 | 490 |
| | Camden Property Trust | 5,600 | 429 |
| | Universal Health Realty | | |
| | Income Trust | 8,800 | 426 |
| | Safety Insurance Group Inc. | 6,600 | 412 |
| | Dime Community | | |
| | Bancshares Inc. | 25,000 | 394 |
| | Equity LifeStyle | | |
| | Properties Inc. | 6,800 | 334 |
| | Blackstone Mortgage Trust | | |
| | Inc. Class A | 8,000 | 223 |
| | Retail Properties of | | |
| | America Inc. | 8,200 | 129 |
| | HCC Insurance Holdings Inc. | 100 | 5 |
| | | | 55,949 |
| Health Care (6.8%) | | |
| * | Henry Schein Inc. | 55,200 | 6,626 |
| | Zoetis Inc. | 145,900 | 5,422 |
| | Johnson & Johnson | 37,500 | 4,042 |
| | Patterson Cos. Inc. | 88,700 | 3,824 |
| | AmerisourceBergen Corp. | | |
| | Class A | 41,000 | 3,502 |
| | Omnicare Inc. | 37,200 | 2,477 |
| * | MEDNAX Inc. | 34,400 | 2,147 |
| | | |
| | | | Market |
| | | | Value• |
| | | Shares | ($000) |
| * | Magellan Health Inc. | 24,400 | 1,477 |
| | Landauer Inc. | 23,800 | 852 |
| | Owens & Minor Inc. | 16,300 | 543 |
| | Chemed Corp. | 5,200 | 537 |
| * | ICU Medical Inc. | 2,900 | 206 |
| * | Haemonetics Corp. | 4,700 | 177 |
| * | LHC Group Inc. | 7,000 | 170 |
| | Merck & Co. Inc. | 2,500 | 145 |
| * | Premier Inc. Class A | 800 | 27 |
| | | | 32,174 |
| Industrials (6.8%) | | |
| | Covanta Holding Corp. | 309,500 | 6,831 |
| | United Parcel Service Inc. | | |
| | Class B | 50,400 | 5,288 |
| | Rollins Inc. | 153,400 | 4,889 |
| * | Stericycle Inc. | 35,400 | 4,460 |
| | General Dynamics Corp. | 18,700 | 2,614 |
| | 3M Co. | 16,300 | 2,506 |
| | National Presto | | |
| | Industries Inc. | 24,000 | 1,513 |
| | Danaher Corp. | 18,000 | 1,447 |
| | Carlisle Cos. Inc. | 15,700 | 1,395 |
| | Matthews International Corp. | | |
| | Class A | 22,400 | 1,032 |
| | Illinois Tool Works Inc. | 4,300 | 392 |
| | | | 32,367 |
| Information Technology (6.8%) | | |
| * | CACI International Inc. | | |
| | Class A | 91,500 | 7,529 |
| | Amdocs Ltd. | 112,300 | 5,339 |
| | Jack Henry & | | |
| | Associates Inc. | 77,200 | 4,618 |
| | Motorola Solutions Inc. | 68,600 | 4,425 |
| | Paychex Inc. | 57,800 | 2,713 |
| | MAXIMUS Inc. | 34,000 | 1,648 |
| * | VeriSign Inc. | 22,700 | 1,357 |
| | FactSet Research | | |
| | Systems Inc. | 8,900 | 1,170 |
| * | InterXion Holding NV | 38,900 | 1,063 |
| * | Genpact Ltd. | 40,800 | 716 |
| | Automatic Data | | |
| | Processing Inc. | 6,400 | 523 |
| * | Progress Software Corp. | 19,000 | 492 |
| * | Check Point Software | | |
| | Technologies Ltd. | 4,500 | 334 |
| | Intuit Inc. | 3,500 | 308 |
| * | CoreLogic Inc. | 4,900 | 154 |
| | | | 32,389 |
| Materials (0.9%) | | |
| | Compass Minerals | | |
| | International Inc. | 26,900 | 2,305 |
| | Silgan Holdings Inc. | 17,500 | 860 |
| | Kaiser Aluminum Corp. | 9,300 | 647 |
| | AptarGroup Inc. | 4,200 | 261 |
| | | | 4,073 |
19
Global Minimum Volatility Fund
| | |
| | | Market |
| | | Value• |
| | Shares | ($000) |
| Telecommunication Services (0.1%) | |
| Consolidated Communications | | |
| Holdings Inc. | 18,600 | 482 |
| |
| Utilities (1.9%) | | |
| Empire District Electric Co. | 97,500 | 2,773 |
| 3 Southern Co. | 54,500 | 2,527 |
| NorthWestern Corp. | 27,300 | 1,442 |
| Northeast Utilities | 24,000 | 1,184 |
| Duke Energy Corp. | 7,800 | 641 |
| ALLETE Inc. | 8,600 | 449 |
| Vectren Corp. | 1,200 | 54 |
| IDACORP Inc. | 500 | 32 |
| Portland General Electric Co. | 700 | 25 |
| UIL Holdings Corp. | 500 | 21 |
| | | 9,148 |
| | | 214,852 |
| Total Common Stocks | | |
| (Cost $437,016) | | 457,019 |
| Temporary Cash Investment (4.6%)1 | |
| Money Market Fund (4.6%) | | |
| 4,5 Vanguard Market Liquidity | | |
| Fund, 0.114% | | |
| (Cost $21,885) | 21,885,000 | 21,885 |
| Total Investments (100.9%) | | |
| (Cost $458,901) | | 478,904 |
| Other Assets and Liabilities (-0.9%) | |
| Other Assets | | 14,848 |
| Liabilities4 | | (18,940) |
| | | (4,092) |
| Net Assets (100%) | | 474,812 |
| | |
| At October 31, 2014, net assets consisted of: |
| | Amount |
| | ($000) |
| Paid-in Capital | 426,722 |
| Undistributed Net Investment Income | 9,648 |
| Accumulated Net Realized Gains | 9,075 |
| Unrealized Appreciation (Depreciation) | |
| Investment Securities | 20,003 |
| Futures Contracts | 253 |
| Forward Currency Contracts | 9,160 |
| Foreign Currencies | (49) |
| Net Assets | 474,812 |
| |
| Investor Shares—Net Assets | |
| Applicable to 31,540,850 outstanding | |
| $.001 par value shares of beneficial | |
| interest (unlimited authorization) | 359,736 |
| Net Asset Value Per Share— | |
| Investor Shares | $11.41 |
| |
| Admiral Shares—Net Assets | |
| Applicable to 5,040,362 outstanding | |
| $.001 par value shares of beneficial | |
| interest (unlimited authorization) | 115,076 |
| Net Asset Value Per Share— | |
| Admiral Shares | $22.83 |
• See Note A in Notes to Financial Statements.
^ Includes partial security positions on loan to broker-dealers. The total value of securities on loan is $10,457,000.
* Non-income-producing security.
1 The fund invests a portion of its cash reserves in equity markets through the use of index futures contracts. After giving effect to futures investments, the fund’s effective common stock and temporary cash investment positions represent 97.6% and 3.3%, respectively, of net assets.
2 Security exempt from registration under Rule 144A of the Securities Act of 1933. Such securities may be sold in transactions exempt from registration, normally to qualified institutional buyers. At October 31, 2014, the aggregate value of these securities was $1,318,000, representing 0.3% of net assets.
3 Securities with a value of $3,314,000 have been segregated as initial margin for open futures contracts.
4 Includes $11,202,000 of collateral received for securities on loan.
5 Affiliated money market fund available only to Vanguard funds and certain trusts and accounts managed by Vanguard. Rate shown is the 7-day yield.
ADR—American Depositary Receipt.
GDR—Global Depositary Receipt.
REIT—Real Estate Investment Trust.
See accompanying Notes, which are an integral part of the Financial Statements.
20
Global Minimum Volatility Fund
Statement of Operations
| |
| | December 12, 20131 to |
| | October 31, 2014 |
| | ($000) |
| Investment Income | |
| Income | |
| Dividends2 | 11,533 |
| Interest3 | 6 |
| Securities Lending | 160 |
| Total Income | 11,699 |
| Expenses | |
| The Vanguard Group—Note B | |
| Investment Advisory Services | 327 |
| Management and Administrative—Investor Shares | 434 |
| Management and Administrative—Admiral Shares | 32 |
| Marketing and Distribution—Investor Shares | 35 |
| Marketing and Distribution—Admiral Shares | 6 |
| Custodian Fees | 84 |
| Auditing Fees | 34 |
| Shareholders’ Reports—Investor Shares | 4 |
| Shareholders’ Reports—Admiral Shares | 1 |
| Total Expenses | 957 |
| Net Investment Income | 10,742 |
| Realized Net Gain (Loss) | |
| Investment Securities Sold | 10,530 |
| Futures Contracts | 144 |
| Foreign Currencies and Forward Currency Contracts | (1,099) |
| Realized Net Gain (Loss) | 9,575 |
| Change in Unrealized Appreciation (Depreciation) | |
| Investment Securities | 20,003 |
| Futures Contracts | 253 |
| Foreign Currencies and Forward Currency Contracts | 9,111 |
| Change in Unrealized Appreciation (Depreciation) | 29,367 |
| Net Increase (Decrease) in Net Assets Resulting from Operations | 49,684 |
1 Inception.
2 Dividends are net of foreign withholding taxes of $293,000.
3 Interest income from an affiliated company of the fund was $6,000. |
|
|
See accompanying Notes, which are an integral part of the Financial Statements.
21
Global Minimum Volatility Fund
Statement of Changes in Net Assets
| |
| | December 12, 20131 to |
| | October 31, 2014 |
| | ($000) |
| Increase (Decrease) in Net Assets | |
| Operations | |
| Net Investment Income | 10,742 |
| Realized Net Gain (Loss) | 9,575 |
| Change in Unrealized Appreciation (Depreciation) | 29,367 |
| Net Increase (Decrease) in Net Assets Resulting from Operations | 49,684 |
| Distributions | |
| Net Investment Income | |
| Investor Shares | (703) |
| Admiral Shares | (27) |
| Realized Capital Gain | |
| Investor Shares | — |
| Admiral Shares | — |
| Total Distributions | (730) |
| Capital Share Transactions | |
| Investor Shares | 318,348 |
| Admiral Shares | 107,510 |
| Net Increase (Decrease) from Capital Share Transactions | 425,858 |
| Total Increase (Decrease) | 474,812 |
| Net Assets | |
| Beginning of Period | — |
| End of Period2 | 474,812 |
1 Inception.
2 Net Assets—End of Period includes undistributed (overdistributed) net investment income of $9,648,000. |
|
See accompanying Notes, which are an integral part of the Financial Statements.
22
Global Minimum Volatility Fund
Financial Highlights
| |
| Investor Shares | |
| | December 12, 20131 to |
| For a Share Outstanding Throughout the Period | October 31, 2014 |
| Net Asset Value, Beginning of Period | $10.00 |
| Investment Operations | |
| Net Investment Income | . 262 |
| Net Realized and Unrealized Gain (Loss) on Investments | 1.172 |
| Total from Investment Operations | 1.434 |
| Distributions | |
| Dividends from Net Investment Income | (.024) |
| Distributions from Realized Capital Gains | — |
| Total Distributions | (. 024) |
| Net Asset Value, End of Period | $11.41 |
| |
| Total Return2 | 14.37% |
| |
| Ratios/Supplemental Data | |
| Net Assets, End of Period (Millions) | $360 |
| Ratio of Total Expenses to Average Net Assets | 0.30%3 |
| Ratio of Net Investment Income to Average Net Assets | 3.18%3 |
| Portfolio Turnover Rate | 49% |
1 Inception.
2 Total returns do not include account service fees that may have applied in the period shown. Fund prospectuses provide information about any applicable account service fees.
3 Annualized. |
|
|
|
See accompanying Notes, which are an integral part of the Financial Statements.
23
Global Minimum Volatility Fund
Financial Highlights
| |
| Admiral Shares | |
| | December 12, 20131 to |
| For a Share Outstanding Throughout the Period | October 31, 2014 |
| Net Asset Value, Beginning of Period | $20.00 |
| Investment Operations | |
| Net Investment Income | . 546 |
| Net Realized and Unrealized Gain (Loss) on Investments | 2.332 |
| Total from Investment Operations | 2.878 |
| Distributions | |
| Dividends from Net Investment Income | (.048) |
| Distributions from Realized Capital Gains | — |
| Total Distributions | (. 048) |
| Net Asset Value, End of Period | $22.83 |
| |
| Total Return | 14.42% |
| |
| Ratios/Supplemental Data | |
| Net Assets, End of Period (Millions) | $115 |
| Ratio of Total Expenses to Average Net Assets | 0.20%2 |
| Ratio of Net Investment Income to Average Net Assets | 3.28%2 |
| Portfolio Turnover Rate | 49% |
1 Inception.
2 Annualized. |
|
See accompanying Notes, which are an integral part of the Financial Statements.
24
Global Minimum Volatility Fund
Notes to Financial Statements
Vanguard Global Minimum Volatility Fund is registered under the Investment Company Act of 1940 as an open-end investment company, or mutual fund. The fund invests in securities of foreign issuers, which may subject it to investment risks not normally associated with investing in securities of U.S. corporations. To minimize the currency risk and volatility associated with investment in securities denominated in currencies other than the U.S. dollar, the fund attempts to hedge its currency exposure. The fund offers two classes of shares: Investor Shares and Admiral Shares. Investor Shares are available to any investor who meets the fund’s minimum purchase requirements. Admiral Shares are designed for investors who meet certain administrative, service, and account-size criteria.
A. The following significant accounting policies conform to generally accepted accounting principles for U.S. investment companies. The fund consistently follows such policies in preparing its financial statements.
1. Security Valuation: Securities are valued as of the close of trading on the New York Stock Exchange (generally 4 p.m., Eastern time) on the valuation date. Equity securities are valued at the latest quoted sales prices or official closing prices taken from the primary market in which each security trades; such securities not traded on the valuation date are valued at the mean of the latest quoted bid and asked prices. Securities for which market quotations are not readily available, or whose values have been affected by events occurring before the fund’s pricing time but after the close of the securities’ primary markets, are valued at their fair values calculated according to procedures adopted by the board of trustees. These procedures include obtaining quotations from an independent pricing service, monitoring news to identify significant market- or security-specific events, and evaluating changes in the values of foreign market proxies (for example, ADRs, futures contracts, or exchange-traded funds), between the time the foreign markets close and the fund’s pricing time. When fair-value pricing is employed, the prices of securities used by a fund to calculate its net asset value may differ from quoted or published prices for the same securities. Investments in Vanguard Market Liquidity Fund are valued at that fund’s net asset value.
2. Foreign Currency: Securities and other assets and liabilities denominated in foreign currencies are translated into U.S. dollars using exchange rates obtained from an independent third party as of the fund’s pricing time on the valuation date. Realized gains (losses) and unrealized appreciation (depreciation) on investment securities include the effects of changes in exchange rates since the securities were purchased, combined with the effects of changes in security prices. Fluctuations in the value of other assets and liabilities resulting from changes in exchange rates are recorded as unrealized foreign currency gains (losses) until the assets or liabilities are settled in cash, at which time they are recorded as realized foreign currency gains (losses).
3. Futures and Forward Currency Contracts: The fund uses index futures contracts to a limited extent, with the objective of maintaining full exposure to the stock market while maintaining liquidity. The fund may purchase or sell futures contracts to achieve a desired level of investment, whether to accommodate portfolio turnover or cash flows from capital share transactions. The primary risks associated with the use of futures contracts are imperfect correlation between changes in market values of stocks held by the fund and the prices of futures contracts, and the possibility of an illiquid market. Counterparty risk involving futures is mitigated because a regulated clearinghouse is the counterparty instead of the clearing broker. To further mitigate counterparty risk, the fund trades
25
Global Minimum Volatility Fund
futures contracts on an exchange, monitors the financial strength of its clearing brokers and clearing-house, and has entered into clearing agreements with its clearing brokers. The clearinghouse imposes initial margin requirements to secure the fund’s performance and requires daily settlement of variation margin representing changes in the market value of each contract.
The fund enters into forward currency contracts to protect the value of securities and related receivables and payables against changes in future foreign exchange rates. The fund’s risks in using these contracts include movement in the values of the foreign currencies relative to the U.S. dollar and the ability of the counterparties to fulfill their obligations under the contracts. The fund mitigates its counterparty risk by entering into forward currency contracts only with a diverse group of prequalified counterparties, monitoring their financial strength, entering into master netting arrangements with its counterparties, and requiring its counterparties to transfer collateral as security for their performance. The master netting arrangements provide that, in the event of a counterparty’s default (including bankruptcy), the fund may terminate the forward currency contracts, determine the net amount owed by either party in accordance with its master netting arrangements, and sell or retain any collateral held up to the net amount owed to the fund under the master netting arrangements. The forward currency contracts contain provisions whereby a counterparty may terminate open contracts if the fund’s net assets decline below a certain level, triggering a payment by the fund if the fund is in a net liability position at the time of the termination. The payment amount would be reduced by any collateral the fund has pledged. Any assets pledged as collateral for open contracts are noted in the Statement of Net Assets. The value of collateral received or pledged is compared daily to the value of the forward currency contracts exposure with each counterparty, and any difference, if in excess of a specified minimum transfer amount, is adjusted and settled within two business days.
Futures contracts are valued at their quoted daily settlement prices. Forward currency contracts are valued at their quoted daily prices obtained from an independent third party, adjusted for currency risk based on the expiration date of each contract. The aggregate settlement values and notional amounts of the contracts are not recorded in the Statement of Net Assets. Fluctuations in the value of the contracts are recorded in the Statement of Net Assets as an asset (liability) and in the Statement of Operations as unrealized appreciation (depreciation) until the contracts are closed, when they are recorded as realized gains (losses) on futures or forward currency contracts.
During the period ended October 31, 2014, the fund’s average investments in long and short futures contracts represented less than 1% and 0% of net assets, respectively, based on the average of aggregate settlement values at each quarter-end during the period. The fund’s average investment in forward currency contracts represented 47% of net assets, based on the average of notional amounts at each quarter-end during the period.
4. Federal Income Taxes: The fund intends to qualify as a regulated investment company and distribute all of its taxable income. Management has analyzed the fund’s tax positions taken for its open federal income tax period ended October 31, 2014, and has concluded that no provision for federal income tax is required in the fund’s financial statements.
5. Distributions: Distributions to shareholders are recorded on the ex-dividend date.
26
Global Minimum Volatility Fund
6. Securities Lending: To earn additional income, the fund lends its securities to qualified institutional borrowers. Security loans are required to be secured at all times by collateral in an amount at least equal to the market value of securities loaned. Daily market fluctuations could cause the value of loaned securities to be more or less than the value of the collateral received. When this occurs, the collateral is adjusted and settled on the next business day. The fund further mitigates its counterparty risk by entering into securities lending transactions only with a diverse group of prequalified counterparties, monitoring their financial strength, and entering into master securities lending agreements with its counterparties. The master securities lending agreements provide that, in the event of a counterparty’s default (including bankruptcy), the fund may terminate any loans with that borrower, determine the net amount owed, and sell or retain the collateral up to the net amount owed to the fund; however, such actions may be subject to legal proceedings. While collateral mitigates counterparty risk, in the absence of a default the fund may experience delays and costs in recovering the securities loaned. The fund invests cash collateral received in Vanguard Market Liquidity Fund, and records a liability in the Statement of Net Assets for the return of the collateral, during the period the securities are on loan. Securities lending income represents fees charged to borrowers plus income earned on invested cash collateral, less expenses associated with the loan.
7. Credit Facility: The fund and certain other funds managed by The Vanguard Group participate in a $2.89 billion committed credit facility provided by a syndicate of lenders pursuant to a credit agreement that may be renewed annually; each fund is individually liable for its borrowings, if any, under the credit facility. Borrowings may be utilized for temporary and emergency purposes, and are subject to the fund’s regulatory and contractual borrowing restrictions. The participating funds are charged administrative fees and an annual commitment fee of 0.06% of the undrawn amount of the facility; these fees are allocated to the funds based on a method approved by the fund’s board of trustees and included in Management and Administrative expenses on the fund’s Statement of Operations. Any borrowings under this facility bear interest at a rate equal to the higher of the federal funds rate or LIBOR reference rate plus an agreed-upon spread.
The fund had no borrowings outstanding at October 31, 2014, or at any time during the period then ended.
8. Other: Dividend income is recorded on the ex-dividend date. Interest income includes income distributions received from Vanguard Market Liquidity Fund and is accrued daily. Security transactions are accounted for on the date securities are bought or sold. Costs used to determine realized gains (losses) on the sale of investment securities are those of the specific securities sold.
Each class of shares has equal rights as to assets and earnings, except that each class separately bears certain class-specific expenses related to maintenance of shareholder accounts (included in Management and Administrative expenses) and shareholder reporting. Marketing and distribution expenses are allocated to each class of shares based on a method approved by the board of trustees. Income, other non-class-specific expenses, and gains and losses on investments are allocated to each class of shares based on its relative net assets.
27
Global Minimum Volatility Fund
B. The Vanguard Group furnishes at cost investment advisory, corporate management, administrative, marketing, and distribution services. The costs of such services are allocated to the fund based on methods approved by the board of trustees. The fund has committed to invest up to 0.40% of its net assets in Vanguard. At October 31, 2014, the fund had contributed capital of $44,000 to Vanguard (included in Other Assets), representing 0.01% of the fund’s net assets and 0.02% of Vanguard’s capitalization. The fund’s trustees and officers are also directors and officers of Vanguard.
C. Various inputs may be used to determine the value of the fund’s investments. These inputs are summarized in three broad levels for financial statement purposes. The inputs or methodologies used to value securities are not necessarily an indication of the risk associated with investing in those securities.
Level 1—Quoted prices in active markets for identical securities.
Level 2—Other significant observable inputs (including quoted prices for similar securities, interest rates, prepayment speeds, credit risk, etc.).
Level 3—Significant unobservable inputs (including the fund’s own assumptions used to determine the fair value of investments).
The following table summarizes the market value of the fund’s investments as of October 31, 2014, based on the inputs used to value them:
| | | | |
| | Level 1 | Level 2 | Level 3 |
| Investments | ($000) | ($000) | ($000) |
| Common Stocks—International | 68,273 | 173,894 | — |
| Common Stocks—United States | 214,852 | — | — |
| Temporary Cash Investments | 21,885 | — | — |
| Futures Contracts—Assets1 | 132 | — | — |
| Futures Contracts—Liabilities1 | (23) | — | — |
| Forward Currency Contracts—Assets | — | 9,193 | — |
| Forward Currency Contracts—Liabilities | — | (33) | — |
| Total | 305,119 | 183,054 | — |
| 1 Represents variation margin on the last day of the reporting period. |
D. At October 31, 2014, the fair values of derivatives were reflected in the Statement of Net Assets as follows:
| | | |
| | | Foreign | |
| | Equity | Exchange | |
| | Contracts | Contracts | Total |
| Statement of Net Assets Caption | ($000) | ($000) | ($000) |
| Other Assets | 132 | 9,193 | 9,325 |
| Liabilities | (23) | (33) | (56) |
28
Global Minimum Volatility Fund
Realized net gain (loss) and the change in unrealized appreciation (depreciation) on derivatives for the period ended October 31, 2014, were:
| | | | |
| | | Foreign | |
| | Equity | Exchange | |
| | Contracts | Contracts | Total |
| Realized Net Gain (Loss) on Derivatives | ($000) | ($000) | ($000) |
| Futures Contracts | 144 | — | 144 |
| Forward Currency Contracts | — | (791) | (791) |
| Realized Net Gain (Loss) on Derivatives | 144 | (791) | (647) |
| |
| Change in Unrealized Appreciation (Depreciation) on Derivatives | | | |
| Futures Contracts | 253 | — | 253 |
| Forward Currency Contracts | — | 9,160 | 9,160 |
| Change in Unrealized Appreciation (Depreciation) on Derivatives | 253 | 9,160 | 9,413 |
At October 31, 2014, the aggregate settlement value of open futures contracts and the related unrealized appreciation (depreciation) were:
| | | | |
| | | | | ($000) |
| | | | Aggregate | |
| | | Number of | Settlement | Unrealized |
| | | Long (Short) | Value | Appreciation |
| Futures Contracts | Expiration | Contracts | Long (Short) | (Depreciation) |
| E-mini S&P 500 Index | December 2014 | 28 | 2,816 | 119 |
| FTSE 100 Index | December 2014 | 11 | 1,145 | 30 |
| Dow Jones EURO STOXX 50 Index | December 2014 | 29 | 1,127 | 44 |
| Topix Index | December 2014 | 6 | 715 | 36 |
| S&P ASX 200 Index | December 2014 | 5 | 606 | 24 |
| | | | | 253 |
Unrealized appreciation (depreciation) on open E-mini S&P 500 Index, FTSE 100 Index, and Dow Jones EURO STOXX 50 Index futures contracts are required to be treated as realized gain (loss) for tax purposes.
At October 31, 2014, the fund had open forward currency contracts to receive and deliver currencies as follows. Unrealized appreciation (depreciation) on open forward currency contracts, (except for Chilean peso and Taiwanese dollar contracts,) is treated as realized gain (loss) for tax purposes.
29
Global Minimum Volatility Fund
| | | | | | |
| | | | | | | Unrealized |
| | Contract | | | | | Appreciation |
| | Settlement | | | Contract Amount (000) | (Depreciation) |
| Counterparty | Date | | Receive | | Deliver | ($000) |
| Goldman Sachs International | 12/2/14 | CAD | 113 | USD | 100 | — |
| BNP Paribas | 12/2/14 | USD | 33,565 | CAD | 36,894 | 856 |
| BNP Paribas | 12/2/14 | USD | 29,983 | EUR | 22,763 | 1,452 |
| BNP Paribas | 12/2/14 | USD | 28,221 | GBP | 17,062 | 934 |
| BNP Paribas | 12/2/14 | USD | 25,302 | AUD | 27,397 | 1,246 |
| BNP Paribas | 12/2/14 | USD | 21,008 | JPY | 2,194,400 | 1,466 |
| BNP Paribas | 12/2/14 | USD | 14,520 | CHF | 13,284 | 709 |
| BNP Paribas | 12/2/14 | USD | 14,129 | KRW | 14,428,739 | 646 |
| BNP Paribas | 12/2/14 | USD | 8,282 | BRL | 19,336 | 555 |
| BNP Paribas | 12/2/14 | USD | 8,237 | INR | 505,737 | 56 |
| BNP Paribas | 12/2/14 | USD | 7,814 | TWD | 233,596 | 132 |
| BNP Paribas | 12/2/14 | USD | 4,456 | MXN | 58,742 | 102 |
| BNP Paribas | 12/2/14 | USD | 3,898 | RUB | 144,044 | 580 |
| BNP Paribas | 12/2/14 | USD | 2,823 | NOK | 17,490 | 233 |
| Goldman Sachs International | 12/2/14 | USD | 2,065 | GBP | 1,295 | (6) |
| BNP Paribas | 12/2/14 | USD | 1,990 | ILS | 7,087 | 125 |
| Credit Suisse International | 12/2/14 | USD | 1,285 | EUR | 1,013 | 15 |
| BNP Paribas | 12/2/14 | USD | 1,230 | CLP | 725,621 | (27) |
| Credit Suisse International | 12/2/14 | USD | 1,119 | CHF | 1,059 | 18 |
| BNP Paribas | 12/2/14 | USD | 1,075 | ZAR | 11,666 | 23 |
| BNP Paribas | 12/2/14 | USD | 758 | SEK | 5,263 | 45 |
| | | | | | | 9,160 |
AUD—Australian dollar.
BRL—Brazilian real.
CAD—Canadian dollar.
CHF—Swiss franc.
CLP—Chilean peso.
EUR—Euro.
GBP—British pound.
ILS—Israeli shekel.
INR—Indian rupee.
JPY—Japanese yen.
KRW—Korean won.
MXN—Mexican peso.
NOK—Norwegian krone.
RUB—Russian ruble.
SEK—Swedish krona.
TWD—Taiwanese dollar.
USD—U.S. dollar.
ZAR—South African rand.
30
Global Minimum Volatility Fund
The following table summarizes the fund’s derivative assets and liabilities by counterparty for derivatives subject to agreements that provide for offsetting assets and liabilities. Exchange traded derivatives are listed separately.
| | | | | | |
| | Assets | Liabilities | | | | |
| Reflected in | Reflected in | Net Amount | Statement of Net Assets | |
| Statement of | Statement of | Receivable | Collateral | Collateral | Net |
| Net Assets1 | Net Assets1 | (Payable) | Pledged 2 | Received 2 | Exposure 3 |
| | ($000) | ($000) | ($000) | ($000) | ($000) | ($000) |
| Forwards subject to offsetting | | | | | | |
| arrangements, by counterparty | | | | | | |
| BNP Paribas | 9,160 | (27) | 9,133 | — | 6,851 | 2,2824 |
| Credit Suisse International | 33 | — | 33 | — | — | 33 |
| Goldman Sachs International | — | (6) | (6) | — | — | — |
| Exchange Traded Futures Contracts | 132 | (23) | 109 | 3,314 | — | — |
| Total | 9,325 | (56) | 9,269 | 3,314 | 6,851 | 2,315 |
1 Absent an event of default or early termination, derivative assets and liabilities are presented gross and not offset in the Statement of Net Assets.
2 Securities or other assets pledged as collateral are noted in the Statement of Net Assets. Securities received as collateral are held in a segregated account and not included in the fund’s security holdings in the Statement of Net Assets.
3 Net exposure represents the net amount receivable from the counterparty in the event of default. Counterparties may not exchange collateral if amount is below a specified minimum transfer amount.
4 After October 31, 2014, the counterparty posted additional collateral of $2,370,000 in connection with open forward currency contracts as of October 31, 2014. |
|
|
|
|
|
|
|
E. Distributions are determined on a tax basis and may differ from net investment income and realized capital gains for financial reporting purposes. Differences may be permanent or temporary. Permanent differences are reclassified among capital accounts in the financial statements to reflect their tax character. Temporary differences arise when certain items of income, expense, gain, or loss are recognized in different periods for financial statement and tax purposes; such differences are primarily attributed to mark-to-market of open forward currency contracts. These differences will reverse at some time in the future. Differences in classification may also result from the treatment of short-term gains as ordinary income for tax purposes.
During the period ended October 31, 2014, the fund realized net foreign currency losses of $308,000, which decreased distributable net income for tax purposes; accordingly, such losses have been reclassified from accumulated net realized gains to undistributed net investment income. Certain of the fund’s investments are in securities considered to be passive foreign investment companies, for which any unrealized appreciation and/or realized gains are required to be included in distributable net income for tax purposes. During the period ended October 31, 2014, the fund realized gains on the sale of passive foreign investment companies of $268,000, which have been included in current period’s taxable income; accordingly, such gains have been reclassified from accumulated net realized gains to undistributed net investment income. Passive foreign investment companies held at October 31, 2014, had unrealized appreciation of $595,000.
31
Global Minimum Volatility Fund
The fund used a tax accounting practice to treat a portion of the price of capital shares redeemed during the period as distributions from net investment income and realized capital gains. Accordingly, the fund has reclassified $324,000 from undistributed net investment income, and $540,000 from accumulated net realized gains, to paid-in capital.
For tax purposes, at October 31, 2014, the fund had $23,738,000 of ordinary income and $4,875,000 of long-term capital gains available for distribution.
At October 31, 2014, the cost of investment securities for tax purposes was $459,515,000. Net unrealized appreciation of investment securities for tax purposes was $19,389,000, consisting of unrealized gains of $32,014,000 on securities that had risen in value since their purchase and $12,625,000 in unrealized losses on securities that had fallen in value since their purchase.
F. During the period ended October 31, 2014, the fund purchased $614,874,000 of investment securities and sold $189,236,000 of investment securities, other than temporary cash investments.
G. Capital share transactions for each class of shares were:
| | |
| | December 12, 20131 to |
| | October 31, 2014 |
| | Amount | Shares |
| | ($000) | (000) |
| Investor Shares | | |
| Issued | 352,372 | 34,751 |
| Issued in Lieu of Cash Distributions | 702 | 69 |
| Redeemed | (34,726) | (3,279) |
| Net Increase (Decrease)—Investor Shares | 318,348 | 31,541 |
| Admiral Shares | | |
| Issued | 130,196 | 6,096 |
| Issued in Lieu of Cash Distributions | 26 | 1 |
| Redeemed | (22,712) | (1,057) |
| Net Increase (Decrease) —Admiral Shares | 107,510 | 5,040 |
| 1 Inception. |
At October 31, 2014, Vanguard Managed Payout Fund was the record or beneficial owner of 67% of the fund’s net assets. If the shareholder were to redeem its investment in the fund, the redemption might result in an increase in the fund’s expense ratio, cause the fund to incur higher transaction costs, or lead to the realization of taxable capital gains.
H. Management has determined that no material events or transactions occurred subsequent to October 31, 2014, that would require recognition or disclosure in these financial statements.
32
Report of Independent Registered
Public Accounting Firm
To the Board of Trustees of Vanguard Whitehall Funds and the Shareholders of Vanguard Global Minimum Volatility Fund:
In our opinion, the accompanying statement of net assets and the related statements of operations and of changes in net assets and the financial highlights present fairly, in all material respects, the financial position of Vanguard Global Minimum Volatility Fund (constituting a separate portfolio of Vanguard Whitehall Funds, hereafter referred to as the “Fund”) at October 31, 2014, the results of its operations, the changes in its net assets, and the financial highlights for the period December 12, 2013 (commencement of operations) through October 31, 2014, in conformity with accounting principles generally accepted in the United States of America. These financial statements and financial highlights (hereafter referred to as “financial statements”) are the responsibility of the Fund’s management. Our responsibility is to express an opinion on these financial statements based on our audit. We conducted our audit of these financial statements in accordance with the standards of the Public Company Accounting Oversight Board (United States). Those standards require that we plan and perform the audit to obtain reasonable assurance about whether the financial statements are free of material misstatement. An audit includes examining, on a test basis, evidence supporting the amounts and disclosures in the financial statements, assessing the accounting principles used and significant estimates made by management, and evaluating the overall financial statement presentation. We believe that our audit, which included confirmation of securities at October 31, 2014 by correspondence with the custodian and brokers, by agreement to the underlying ownership records of the transfer agent and the application of alternative auditing procedures where securities purchased had not been received, provides a reasonable basis for our opinion.
/s/PricewaterhouseCoopers LLP
Philadelphia, Pennsylvania
December 16, 2014
| |
| Special 2014 tax information (unaudited) for Vanguard Global Minimum Volatility Fund |
This information for the fiscal period ended October 31, 2014, is included pursuant to provisions of the Internal Revenue Code.
The fund distributed $144,000 as capital gain dividends (from net long-term capital gains) to shareholders during the fiscal period.
The fund distributed $510,000 of qualified dividend income to shareholders during the fiscal period.
For corporate shareholders, 11.6% of investment income (dividend income plus short-term gains, if any) qualifies for the dividends-received deduction.
The fund designates to shareholders foreign source income of $5,427,000 and foreign taxes paid of $257,000. Shareholders will receive more detailed information with their Form 1099-DIV in January 2015 to determine the calendar-year amounts to be included on their 2014 tax returns.
33
About Your Fund’s Expenses
As a shareholder of the fund, you incur ongoing costs, which include costs for portfolio management, administrative services, and shareholder reports (like this one), among others. Operating expenses, which are deducted from a fund’s gross income, directly reduce the investment return of the fund.
A fund’s expenses are expressed as a percentage of its average net assets. This figure is known as the expense ratio. The following examples are intended to help you understand the ongoing costs (in dollars) of investing in your fund and to compare these costs with those of other mutual funds. The examples are based on an investment of $1,000 made at the beginning of the period shown and held for the entire period.
The accompanying table illustrates your fund’s costs in two ways:
• Based on actual fund return. This section helps you to estimate the actual expenses that you paid over the period. The ”Ending Account Value“ shown is derived from the fund‘s actual return, and the third column shows the dollar amount that would have been paid by an investor who started with $1,000 in the fund. You may use the information here, together with the amount you invested, to estimate the expenses that you paid over the period.
To do so, simply divide your account value by $1,000 (for example, an $8,600 account value divided by $1,000 = 8.6), then multiply the result by the number given for your fund under the heading ”Expenses Paid During Period.“
• Based on hypothetical 5% yearly return. This section is intended to help you compare your fund‘s costs with those of other mutual funds. It assumes that the fund had a yearly return of 5% before expenses, but that the expense ratio is unchanged. In this case—because the return used is not the fund’s actual return—the results do not apply to your investment. The example is useful in making comparisons because the Securities and Exchange Commission requires all mutual funds to calculate expenses based on a 5% return. You can assess your fund’s costs by comparing this hypothetical example with the hypothetical examples that appear in shareholder reports of other funds.
Note that the expenses shown in the table are meant to highlight and help you compare ongoing costs only and do not reflect transaction costs incurred by the fund for buying and selling securities. Further, the expenses do not include any purchase, redemption, or account service fees described in the fund prospectus. If such fees were applied to your account, your costs would be higher. Your fund does not carry a “sales load.”
The calculations assume no shares were bought or sold during the period. Your actual costs may have been higher or lower, depending on the amount of your investment and the timing of any purchases or redemptions.
You can find more information about the fund’s expenses, including annual expense ratios, in the Financial Statements section of this report. For additional information on operating expenses and other shareholder costs, please refer to your fund’s current prospectus.
34
| | | |
| Six Months Ended October 31, 2014 | | | |
| | Beginning | Ending | Expenses |
| | Account Value | Account Value | Paid During |
| Global Minimum Volatility Fund | 4/30/2014 | 10/31/2014 | Period |
| Based on Actual Fund Return | | | |
| Investor Shares | $1,000.00 | $1,071.36 | $1.41 |
| Admiral Shares | 1,000.00 | 1,071.83 | 0.94 |
| Based on Hypothetical 5% Yearly Return | | | |
| Investor Shares | $1,000.00 | $1,023.84 | $1.38 |
| Admiral Shares | 1,000.00 | 1,024.30 | 0.92 |
| The calculations are based on expenses incurred in the most recent six-month period. The fund’s annualized six-month expense ratios for that period are 0.27% for Investor Shares and 0.18% for Admiral Shares. The dollar amounts shown as “Expenses Paid” are equal to the annualized expense ratio multiplied by the average account value over the period, multiplied by the number of days in the most recent six-month period, then divided by the number of days in the most recent 12-month period. |
|
|
|
35
Glossary
Dividend Yield. Dividend income earned by stocks, expressed as a percentage of the aggregate market value (or of net asset value, for a fund). The yield is determined by dividing the amount of the annual dividends by the aggregate value (or net asset value) at the end of the period. For a fund, the dividend yield is based solely on stock holdings and does not include any income produced by other investments.
Earnings Growth Rate. The average annual rate of growth in earnings over the past five years for the stocks now in a fund.
Equity Exposure. A measure that reflects a fund’s investments in stocks and stock futures. Any holdings in short-term reserves are excluded.
Expense Ratio. A fund’s total annual operating expenses expressed as a percentage of the fund’s average net assets. The expense ratio includes management and administrative expenses, but does not include the transaction costs of buying and selling portfolio securities.
Inception Date. The date on which the assets of a fund (or one of its share classes) are first invested in accordance with the fund’s investment objective. For funds with a subscription period, the inception date is the day after that period ends. Investment performance is measured from the inception date.
Median Market Cap. An indicator of the size of companies in which a fund invests; the midpoint of market capitalization (market price x shares outstanding) of a fund’s stocks, weighted by the proportion of the fund’s assets invested in each stock. Stocks representing half of the fund’s assets have market capitalizations above the median, and the rest are below it.
Price/Book Ratio. The share price of a stock divided by its net worth, or book value, per share. For a fund, the weighted average price/book ratio of the stocks it holds.
Price/Earnings Ratio. The ratio of a stock’s current price to its per-share earnings over the past year. For a fund, the weighted average P/E of the stocks it holds. P/E is an indicator of market expectations about corporate prospects; the higher the P/E, the greater the expectations for a company’s future growth.
Return on Equity. The annual average rate of return generated by a company during the past five years for each dollar of shareholder’s equity (net income divided by shareholder’s equity). For a fund, the weighted average return on equity for the companies whose stocks it holds.
Short-Term Reserves. The percentage of a fund invested in highly liquid, short-term securities that can be readily converted to cash.
Turnover Rate. An indication of the fund’s trading activity. Funds with high turnover rates incur higher transaction costs and may be more likely to distribute capital gains (which may be taxable to investors). The turnover rate excludes in-kind transactions, which have minimal impact on costs.
36
This page intentionally left blank.
This page intentionally left blank.
This page intentionally left blank.
The People Who Govern Your Fund
The trustees of your mutual fund are there to see that the fund is operated and managed in your best interests since, as a shareholder, you are a part owner of the fund. Your fund’s trustees also serve on the board of directors of The Vanguard Group, Inc., which is owned by the Vanguard funds and provides services to them on an at-cost basis.
A majority of Vanguard’s board members are independent, meaning that they have no affiliation with Vanguard or the funds they oversee, apart from the sizable personal investments they have made as private individuals. The independent board members have distinguished backgrounds in business, academia, and public service. Each of the trustees and executive officers oversees 177 Vanguard funds.
The following table provides information for each trustee and executive officer of the fund. More information about the trustees is in the Statement of Additional Information, which can be obtained, without charge, by contacting Vanguard at 800-662-7447, or online at vanguard.com.
| |
| InterestedTrustee1 | and Delphi Automotive LLP (automotive components); |
| | Senior Advisor at New Mountain Capital. |
| F. William McNabb III | |
| Born 1957. Trustee Since July 2009. Chairman of the | Amy Gutmann |
| Board. Principal Occupation(s) During the Past Five | Born 1949. Trustee Since June 2006. Principal |
| Years: Chairman of the Board of The Vanguard Group, | Occupation(s) During the Past Five Years: President of |
| Inc., and of each of the investment companies served | the University of Pennsylvania; Christopher H. Browne |
| by The Vanguard Group, since January 2010; Director | Distinguished Professor of Political Science, School of |
| of The Vanguard Group since 2008; Chief Executive | Arts and Sciences, and Professor of Communication, |
| Officer and President of The Vanguard Group, and of | Annenberg School for Communication, with secondary |
| each of the investment companies served by The | faculty appointments in the Department of Philosophy, |
| Vanguard Group, since 2008; Director of Vanguard | School of Arts and Sciences, and at the Graduate |
| Marketing Corporation; Managing Director of The | School of Education, University of Pennsylvania; |
| Vanguard Group (1995–2008). | Trustee of the National Constitution Center; Chair |
| | of the Presidential Commission for the Study of |
| IndependentTrustees | Bioethical Issues. |
| |
| Emerson U. Fullwood | JoAnn Heffernan Heisen |
| Born 1948. Trustee Since January 2008. Principal | Born 1950. Trustee Since July 1998. Principal |
| Occupation(s) During the Past Five Years: Executive | Occupation(s) During the Past Five Years: Corporate |
| Chief Staff and Marketing Officer for North America | Vice President and Chief Global Diversity Officer |
| and Corporate Vice President (retired 2008) of Xerox | (retired 2008) and Member of the Executive |
| Corporation (document management products and | Committee (1997–2008) of Johnson & Johnson |
| services); Executive in Residence and 2009–2010 | (pharmaceuticals/medical devices/consumer |
| Distinguished Minett Professor at the Rochester | products); Director of Skytop Lodge Corporation |
| Institute of Technology; Director of SPX Corporation | (hotels), the University Medical Center at Princeton, |
| (multi-industry manufacturing), the United Way of | the Robert Wood Johnson Foundation, and the Center |
| Rochester, Amerigroup Corporation (managed health | for Talent Innovation; Member of the Advisory Board |
| care), the University of Rochester Medical Center, | of the Maxwell School of Citizenship and Public Affairs |
| Monroe Community College Foundation, and North | at Syracuse University. |
| Carolina A&T University. | |
| F. Joseph Loughrey |
| Rajiv L. Gupta | Born 1949. Trustee Since October 2009. Principal |
| Born 1945. Trustee Since December 2001.2 | Occupation(s) During the Past Five Years: President |
| Principal Occupation(s) During the Past Five Years: | and Chief Operating Officer (retired 2009) of Cummins |
| Chairman and Chief Executive Officer (retired 2009) | Inc. (industrial machinery); Chairman of the Board |
| and President (2006–2008) of Rohm and Haas Co. | of Hillenbrand, Inc. (specialized consumer services), |
| (chemicals); Director of Tyco International, Ltd. | and of Oxfam America; Director of SKF AB (industrial |
| (diversified manufacturing and services), Hewlett- | machinery), Hyster-Yale Materials Handling, Inc. |
| Packard Co. (electronic computer manufacturing), | (forklift trucks), the Lumina Foundation for Education, |
| |
| | |
| and the V Foundation for Cancer Research; Member | Executive Officers | |
| of the Advisory Council for the College of Arts and | | |
| Letters and of the Advisory Board to the Kellogg | Glenn Booraem | |
| Institute for International Studies, both at the | Born 1967. Controller Since July 2010. Principal |
| University of Notre Dame. | Occupation(s) During the Past Five Years: Principal |
| | of The Vanguard Group, Inc.; Controller of each of |
| Mark Loughridge | the investment companies served by The Vanguard |
| Born 1953. Trustee Since March 2012. Principal | Group; Assistant Controller of each of the investment |
| Occupation(s) During the Past Five Years: Senior Vice | companies served by The Vanguard Group (2001–2010). |
| President and Chief Financial Officer (retired 2013) | | |
| at IBM (information technology services); Fiduciary | Thomas J. Higgins | |
| Member of IBM’s Retirement Plan Committee (2004– | Born 1957. Chief Financial Officer Since September |
| 2013); Member of the Council on Chicago Booth. | 2008. Principal Occupation(s) During the Past Five |
| | Years: Principal of The Vanguard Group, Inc.; Chief |
| Scott C. Malpass | Financial Officer of each of the investment companies |
| Born 1962. Trustee Since March 2012. Principal | served by The Vanguard Group; Treasurer of each of |
| Occupation(s) During the Past Five Years: Chief | the investment companies served by The Vanguard |
| Investment Officer and Vice President at the University | Group (1998–2008). | |
| of Notre Dame; Assistant Professor of Finance at the | | |
| Mendoza College of Business at Notre Dame; Member | Kathryn J. Hyatt | |
| of the Notre Dame 403(b) Investment Committee; | Born 1955. Treasurer Since November 2008. Principal |
| Board Member of TIFF Advisory Services, Inc. | Occupation(s) During the Past Five Years: Principal of |
| (investment advisor); Member of the Investment | The Vanguard Group, Inc.; Treasurer of each of the |
| Advisory Committees of the Financial Industry | investment companies served by The Vanguard |
| Regulatory Authority (FINRA) and of Major League | Group; Assistant Treasurer of each of the investment |
| Baseball. | companies served by The Vanguard Group (1988–2008). |
| |
| André F. Perold | Heidi Stam | |
| Born 1952. Trustee Since December 2004. Principal | Born 1956. Secretary Since July 2005. Principal |
| Occupation(s) During the Past Five Years: George | Occupation(s) During the Past Five Years: Managing |
| Gund Professor of Finance and Banking, Emeritus | Director of The Vanguard Group, Inc.; General Counsel |
| at the Harvard Business School (retired 2011); | of The Vanguard Group; Secretary of The Vanguard |
| Chief Investment Officer and Managing Partner of | Group and of each of the investment companies |
| HighVista Strategies LLC (private investment firm); | served by The Vanguard Group; Director and Senior |
| Director of Rand Merchant Bank; Overseer of the | Vice President of Vanguard Marketing Corporation. |
| Museum of Fine Arts Boston. | | |
| | Vanguard Senior ManagementTeam |
| Alfred M. Rankin, Jr. | | |
| Born 1941. Trustee Since January 1993. Principal | Mortimer J. Buckley | Chris D. McIsaac |
| Occupation(s) During the Past Five Years: Chairman, | Kathleen C. Gubanich | Michael S. Miller |
| President, and Chief Executive Officer of NACCO | Paul A. Heller | James M. Norris |
| Industries, Inc. (housewares/lignite), and of Hyster- | Martha G. King | Glenn W. Reed |
| Yale Materials Handling, Inc. (forklift trucks); Chairman | John T. Marcante | |
| of the Board of University Hospitals of Cleveland. | | |
| Chairman Emeritus and Senior Advisor |
| Peter F. Volanakis | | |
| Born 1955. Trustee Since July 2009. Principal | John J. Brennan | |
| Occupation(s) During the Past Five Years: President | Chairman, 1996–2009 | |
| and Chief Operating Officer (retired 2010) of Corning | Chief Executive Officer and President, 1996–2008 |
| Incorporated (communications equipment); Trustee of | | |
| Colby-Sawyer College; Member of the Advisory Board | Founder | |
| of the Norris Cotton Cancer Center and of the Advisory | | |
| Board of the Parthenon Group (strategy consulting). | John C. Bogle | |
| | Chairman and Chief Executive Officer, 1974–1996 |
| | |
1 Mr. McNabb is considered an “interested person,” as defined in the Investment Company Act of 1940, because he is an officer of the Vanguard funds.
2 December 2002 for Vanguard Equity Income Fund, the Vanguard Municipal Bond Funds, and the Vanguard State Tax-Exempt Funds.
|  |
| | P.O. Box 2600 |
| | Valley Forge, PA 19482-2600 |
| |
| |
| |
| Connect with Vanguard® > vanguard.com | |
| |
| |
| |
| Fund Information > 800-662-7447 | CFA® is a registered trademark owned by CFA Institute. |
| Direct Investor Account Services > 800-662-2739 | |
| Institutional Investor Services > 800-523-1036 | |
| Text Telephone for People | |
| Who Are Deaf or Hard of Hearing> 800-749-7273 | |
| |
| This material may be used in conjunction | |
| with the offering of shares of any Vanguard | |
| fund only if preceded or accompanied by | |
| the fund’s current prospectus. | |
| |
| All comparative mutual fund data are from Lipper, a | |
| Thomson Reuters Company, or Morningstar, Inc., unless | |
| otherwise noted. | |
| |
| You can obtain a free copy of Vanguard’s proxy voting | |
| guidelines by visiting vanguard.com/proxyreporting or by | |
| calling Vanguard at 800-662-2739. The guidelines are | |
| also available from the SEC’s website, sec.gov. In | |
| addition, you may obtain a free report on how your fund | |
| voted the proxies for securities it owned during the 12 | |
| months ended June 30. To get the report, visit either | |
| vanguard.com/proxyreporting or sec.gov. | |
| |
| You can review and copy information about your fund at | |
| the SEC’s Public Reference Room in Washington, D.C. To | |
| find out more about this public service, call the SEC at | |
| 202-551-8090. Information about your fund is also | |
| available on the SEC’s website, and you can receive | |
| copies of this information, for a fee, by sending a | |
| request in either of two ways: via e-mail addressed to | |
| publicinfo@sec.gov or via regular mail addressed to the | |
| Public Reference Section, Securities and Exchange | |
| Commission, Washington, DC 20549-1520. | |
| |
| | © 2014 The Vanguard Group, Inc. |
| | All rights reserved. |
| | Vanguard Marketing Corporation, Distributor. |
| |
| | Q11940 122014 |

Annual Report | October 31, 2014
Vanguard Emerging Markets Government Bond Index Fund
The mission continues
On May 1, 1975, Vanguard began operations, a fledgling company based on the simple but revolutionary idea that a mutual fund company should be managed solely in the interest of its investors.
Four decades later, that revolutionary spirit continues to animate the enterprise. Vanguard remains on a mission to give investors the best chance of investment success.
As we mark our 40th anniversary, we thank you for entrusting your assets to Vanguard and giving us the opportunity to help you reach your financial goals in the decades to come.
| |
| Contents | |
| Your Fund’s Total Returns. | 1 |
| Chairman’s Letter. | 2 |
| Fund Profile. | 7 |
| Performance Summary. | 9 |
| Financial Statements. | 12 |
| About Your Fund’s Expenses. | 43 |
| Glossary. | 45 |
Please note: The opinions expressed in this report are just that—informed opinions. They should not be considered promises or advice. Also, please keep in mind that the information and opinions cover the period through the date on the front of this report. Of course, the risks of investing in your fund are spelled out in the prospectus.
See the Glossary for definitions of investment terms used in this report.
About the cover: Since our founding, Vanguard has drawn inspiration from the enterprise and valor demonstrated by British naval hero Horatio Nelson and his command at the Battle of the Nile in 1798. The photograph displays a replica of a merchant ship from the same era as Nelson’s flagship, the HMS Vanguard.
Your Fund’s Total Returns
| | | | |
| Fiscal Year Ended October 31, 2014 | | | | |
| |
| | 30-Day SEC | Income | Capital | Total |
| | Yield | Returns | Returns | Returns |
| Vanguard Emerging Markets Government Bond Index Fund | | | |
| Investor Shares | 4.48% | 4.46% | 2.16% | 6.62% |
| Admiral™ Shares | 4.63 | 4.62 | 2.16 | 6.78 |
| ETF Shares | 4.63 | | | |
| Market Price | | | | 6.78 |
| Net Asset Value | | | | 6.79 |
| Barclays USD Emerging Markets Government RIC | | | | |
| Capped Index | | | | 7.06 |
| Emerging Markets Hard Currency Debt Funds | | | | |
| Average | | | | 4.41 |
| Emerging Markets Hard Currency Debt Funds Average: Derived from data provided by Lipper, a Thomson Reuters Company. |
Admiral Shares carry lower expenses and are available to investors who meet certain account-balance requirements. The Vanguard ETF® Shares shown are traded on the Nasdaq exchange and are available only through brokers. The table provides ETF returns based on both the Nasdaq market price and the net asset value for a share. U.S. Pat. Nos. 6,879,964; 7,337,138; 7,720,749; 7,925,573; 8,090,646; and 8,417,623.
For the ETF Shares, the market price is determined by the midpoint of the bid-offer spread as of the closing time of the New York Stock Exchange (generally 4 p.m., Eastern time). The net asset value is also determined as of the NYSE closing time. For more information about how the ETF Shares' market prices have compared with their net asset value, visit vanguard.com, select your ETF, and then select the Price and Performance tab. The ETF premium/discount analysis there shows the percentages of days on which the ETF Shares' market price was above or below the NAV.
| | | | | |
| Your Fund’s Performance at a Glance | | | | |
| October 31, 2013, Through October 31, 2014 | | | | |
| | | | Distributions Per Share |
| | Starting | Ending | | |
| | Share | Share | Income | Capital |
| | Price | Price | Dividends | Gains |
| Vanguard Emerging Markets Government Bond | | | | |
| Index Fund | | | | |
| Investor Shares | $9.74 | $9.95 | $0.420 | $0.000 |
| Admiral Shares | 19.48 | 19.90 | 0.870 | 0.000 |
| ETF Shares | 77.71 | 79.40 | 3.439 | 0.000 |
1

Chairman’s Letter
Dear Shareholder,
Vanguard Emerging Markets Government Bond Index Fund successfully captured strong returns from its narrow slice of international bond markets. For the 12 months ended October 31, 2014, it returned 6.62% for Investor Shares (and a bit more for Admiral and ETF Shares). About two-thirds of this return came from interest income, with the balance from increases in bond prices.
The fund closely tracked the 7.06% return of its benchmark, the Barclays USD Emerging Markets Government RIC Capped Index, which of course incurs no expenses. Barclays constructs and manages your fund’s custom index with caps, or limits, on certain holdings. The intent is to comply with Internal Revenue Service diversification standards for regulated investment companies, or RICs, which include mutual funds.
Your fund returned about two percentage points more than the average return of emerging-market hard currency debt funds. (A “hard currency” is one that is issued by an economically and politically stable country and is widely used around the world as payment for goods and services.) Many peer funds don’t hedge exposure to foreign currency, a risk your fund doesn’t face because it invests only in bonds issued in U.S. dollars.
Emerging-market bonds of all types make up only about 7% of the global fixed income market, according to Vanguard estimates. And the U.S. dollar-denominated bonds
2
that your fund invests in represent an even smaller portion, because local-currency bonds constitute the majority of emerging-market debt. Although small, your fund’s universe represents some of the most accessible and frequently traded of all emerging-market bonds—an important consideration, especially when markets are volatile.
As of October 31, the fund’s 30-day SEC yield for Investor Shares was 4.48%, up slightly from 4.29% the previous October. Reflecting the higher risk of emerging-market debt, this year’s yield was more than double that of the broad U.S. bond market (as measured by Vanguard Total Bond Market Index Fund).
Bonds posted mixed returns as already low yields declined
At the start of the new fiscal year, analysts anticipated higher interest rates and falling bond prices. (Bond prices and yields move in opposite directions.) Yields were already low in the United States and abroad, and the Federal Reserve was expected to begin tapering its monthly bond-buying program.
Instead of rising, however, bond yields declined in many markets. “Safe haven” demand for government bonds was strong amid heightened geopolitical risk in the Middle East, Ukraine, and elsewhere. This demand, along with accommodative central bank policy in several markets, helped international bonds—when hedged for currency exposure—outperform the
| | | |
| Market Barometer | | | |
| | | Average Annual Total Returns |
| | | Periods Ended October 31, 2014 |
| | One | Three | Five |
| | Year | Years | Years |
| Bonds | | | |
| Barclays U.S. Aggregate Bond Index (Broad taxable | | | |
| market) | 4.14% | 2.73% | 4.22% |
| Barclays Municipal Bond Index (Broad tax-exempt market) | 7.82 | 4.93 | 5.26 |
| Citigroup Three-Month U.S. Treasury Bill Index | 0.04 | 0.04 | 0.06 |
| |
| Stocks | | | |
| Russell 1000 Index (Large-caps) | 16.78% | 19.90% | 16.98% |
| Russell 2000 Index (Small-caps) | 8.06 | 18.18 | 17.39 |
| Russell 3000 Index (Broad U.S. market) | 16.07 | 19.77 | 17.01 |
| FTSE All-World ex US Index (International) | 0.45 | 8.07 | 6.38 |
| |
| CPI | | | |
| Consumer Price Index | 1.66% | 1.60% | 1.89% |
3
broad U.S. bond market. They returned more than 6%, as measured by Barclays Global Aggregate Index ex USD, hedged. In contrast, the unhedged version of that index declined.
The broad U.S. taxable bond market returned 4.14%. Even as the Fed began steadily reducing its bond purchases in January, bond prices rose. Although they backtracked at times over the summer, prices climbed in October as investors sought sanctuary from stock market volatility. The yield of the 10-year U.S. Treasury note ended October at 2.31%, down from 2.54% a year earlier.
Municipal bonds returned 7.82%, with tax-exempt issues in high demand even at a time of reduced supply. And the Fed’s target for short-term interest rates remained at 0%–0.25%, restraining returns for money market funds and savings accounts.
Their smooth ride turned jagged, but U.S. stocks ended higher
The global stock market’s occasional zigs and zags during the year included a roller-coaster ride in October that left international markets several steps behind the broad U.S. market for the 12 months ended October 31. Emerging markets advanced modestly but the developed European and Pacific markets finished in negative territory.
In contrast, the broad U.S. stock market returned about 16% for the period. Impressive corporate earnings and various global stimulus measures
| | | | | |
| Expense Ratios | | | | |
| Your Fund Compared With Its Peer Group | | | | |
| | Investor | Admiral | ETF | Peer Group |
| | Shares | Shares | Shares | Average |
| Emerging Markets Government Bond | | | | |
| Index Fund | 0.49% | 0.34% | 0.35% | 1.21% |
| The fund expense ratios shown are from the prospectus dated February 25, 2014, and represent estimated costs for the current fiscal year. For the fiscal year ended October 31, 2014, the expense ratios were 0.49% for Investor Shares, 0.34% for Admiral Shares, and 0.34% for ETF Shares. The peer-group expense ratio is derived from data provided by Lipper, a Thomson Reuters Company, and captures information through year-end 2013. |
|
|
|
|
Peer group: Emerging Markets Hard Currency Debt Funds.
4
generally supported stocks against a bleaker backdrop that included tensions in the Middle East and Ukraine. After falling in the first two weeks of October, then rebounding, several major U.S. indexes finished at record highs. Reflecting confidence in the U.S. economy, the Fed announced in late October that it was ending its stimulative bond-buying program as anticipated.
Despite many ups and downs, bonds gained in most countries
Although the broad U.S. and international bond markets had their share of ups and downs during the fiscal year, the swings in emerging-market bonds were at times more pronounced. This is not surprising. Capital markets in many developing countries were bolstered by significant cash inflows resulting from the Fed’s easy-money policies and then shaken by concerns about potential outflows when the stimulus eventually ends. In addition, bond returns in some countries were affected by individual events.
Emerging-market bonds got off to a rough start in November 2013 as investors worried about the beginning of the Fed’s tapering. However, reality proved to be less threatening than expected. As the program wound down, the European Central Bank announced two rounds of stimulus, which gave a boost to emerging markets. Later in the year, however, concerns about economic growth in general as well as geopolitical and country-specific risks weighed on some of the larger emerging markets, notably Russia.
Russian stocks and bonds performed poorly amid strife between Russia and Ukraine, which led to international economic sanctions against Russia and the weakening of the ruble. The U.S. dollar-denominated Russian bonds in the fund’s index—one of its largest country stakes—eked out a return just above breakeven.
In Brazil, another large slice of the fund and its index, all eyes were on the October presidential election. The country’s once-booming economy was reported to have slipped into recession, and its interest rates are among the world’s highest. After the election, the central bank raised the overnight interest rate again (to 11.25%) to try to address inflation. Still, the Brazilian bonds in your fund’s index returned almost 7% for the 12 months.
Bond returns of two other Latin American countries were nearly polar opposites. The Argentine bonds in the index returned almost 24%. Although the country defaulted on its debt for the second time in 13 years, this was viewed as more of a “technical” event than evidence of inability to pay. (This year’s default was triggered by a U.S. court’s ruling against Argentina in favor of certain bondholders who had rejected a debt restructuring offer after the 2001 default.) Some added perspective: Although the negotiations with creditors made news throughout much of the year, Argentine bonds represent only about 1% of the value of the fund’s index.
At the other end of the spectrum, Venezuelan bonds in the index returned about –9%. Falling oil prices have hit this
5
oil exporter hard, and a major credit rating agency further lowered the country’s long-term debt rating. Amid concerns about the government’s ability to service its debt, yields on long-term bonds soared.
In both the fund and its index, longer-term bonds were among the best performers. Bonds maturing in 1 to 3 years returned about 2%; those maturing in 20 or more years generally had double-digit gains. Bonds of the lowest quality (as determined by independent credit rating agencies) generally outperformed those with higher credit ratings.
Although your fund has less than a year and a half of history, we are pleased by its initial success in closely tracking its benchmark index. This is a tribute to the advisor’s skill and sophisticated technology. As always, however, we encourage you to evaluate results over a long-term horizon.
High costs don’t equal strong fund performance
The adage “you get what you pay for” doesn’t apply to mutual funds. In fact, the reverse is true: Research suggests that higher costs are consistent with weaker returns. (See, for example, Shopping for Alpha: You Get What You Don’t Pay For, at vanguard.com/research.)
Shouldn’t paying the highest fees allow you to purchase the services of the greatest talents and therefore get the best returns? As it turns out, the data don’t support that argument. The explanation is simple: Every dollar paid for management fees is a dollar less earning potential return. Keeping expenses down can help narrow the gap between what the markets return and what investors actually earn.
That’s why Vanguard always seeks to minimize costs. Our strategy reflects decades of experience and research, boiled down to one tenet: The less you pay, the more you keep. We negotiate low fees for our actively managed funds, which are run by world-class advisors. And indexing, of course, is the purest form of low-cost investing.
Vanguard Emerging Markets Government Bond Index Fund is a good example of such investing. It can play a solid supporting role in a balanced portfolio. And it offers a diversified, low-cost opportunity to participate in the potentially higher yields and improving fundamentals of more than 60 developing economies—by investing in their U.S. dollar-denominated bonds. A word of caution, however: Emerging-market bonds carry an additional element of risk, as they tend to perform more like equities than like traditional fixed income securities.
As always, thank you for investing with Vanguard.
Sincerely,

F. William McNabb III
Chairman and Chief Executive Officer
November 19, 2014
6
Emerging Markets Government Bond Index Fund
Fund Profile
As of October 31, 2014
| | | |
| Share-Class Characteristics | | |
| |
| | Investor | Admiral | ETF |
| | Shares | Shares | Shares |
| Ticker Symbol | VGOVX | VGAVX | VWOB |
| Expense Ratio1 | 0.49% | 0.34% | 0.35% |
| 30-Day SEC Yield | 4.48% | 4.63% | 4.63% |
| | | |
| Financial Attributes | | |
| |
| | | Barclays USD |
| | | Emerging Mkts |
| | | Government |
| | Fund | RIC Capped Idx |
| Number of Bonds | 716 | 738 |
| Yield to Maturity | | |
| (before expenses) | 4.9% | 4.9% |
| Average Coupon | 5.8% | 5.9% |
| Average Duration | 6.7 years | 6.5 years |
| Average Effective | | |
| Maturity | 10.5 years | 10.6 years |
| Short-Term | | |
| Reserves | 1.1% | — |
| | |
| Distribution by Effective Maturity | |
| (% of portfolio) | |
| Under 1 Year | 0.9% |
| 1 - 3 Years | 12.6 |
| 3 - 5 Years | 17.3 |
| 5 - 10 Years | 41.4 |
| 10 - 20 Years | 10.8 |
| 20 - 30 Years | 14.6 |
| Over 30 Years | 2.4 |
| | |
| Distribution by Credit Quality (% of portfolio) |
| U.S. Government | 0.1% |
| Aaa | 0.6 |
| Aa | 10.0 |
| A | 10.4 |
| Baa | 56.7 |
| Less Than Baa | 22.2 |
| Credit-quality ratings are obtained from Barclays and are generally from Moody’s, Fitch, and S&P. When ratings from all three agencies are used, the median rating is shown. When ratings from two of the agencies are used, the lower rating for each issue is shown. "Not Rated" is used to classify securities for which a rating is not available. For more information about these ratings, see the Glossary entry for Credit Quality. |
|
|
|
|
|
|
| | |
| Sector Diversification (% of portfolio) | |
| Foreign Government | 99.3% |
| Treasury/Agency | 0.1 |
| Other | 0.6 |
| The agency and mortgage-backed securities sectors may include issues from government-sponsored enterprises; such issues are generally not backed by the full faith and credit of the U.S. government. |
|
|
|
1 The expense ratios shown are from the prospectus dated February 25, 2014, and represent estimated costs for the current fiscal year. For the fiscal year ended October 31, 2014, the expense ratios were 0.49% for Investor Shares, 0.34% for Admiral Shares, and 0.34% for ETF Shares.
7
Emerging Markets Government Bond Index Fund
| |
| Market Diversification (% of portfolio ) | |
| | Fund |
| Emerging Markets | |
| Brazil | 10.4% |
| Mexico | 8.6 |
| Russia | 7.9 |
| China | 7.6 |
| Turkey | 6.0 |
| Indonesia | 5.8 |
| United Arab Emirates | 5.1 |
| Venezuela | 4.2 |
| Qatar | 3.9 |
| Philippines | 3.2 |
| Colombia | 3.2 |
| Lebanon | 2.1 |
| India | 2.1 |
| Hungary | 2.0 |
| Chile | 1.9 |
| South Africa | 1.8 |
| Ukraine | 1.5 |
| Kazakhstan | 1.5 |
| Poland | 1.5 |
| Peru | 1.4 |
| Argentina | 1.2 |
| Croatia | 1.2 |
| Malaysia | 1.1 |
| Other | 12.9 |
| Subtotal | 98.1% |
| North America | 0.7% |
| Other | |
| Panama | 1.2% |
8
Emerging Markets Government Bond Index Fund
Performance Summary
All of the returns in this report represent past performance, which is not a guarantee of future results that may be achieved by the fund. (Current performance may be lower or higher than the performance data cited. For performance data current to the most recent month-end, visit our website at vanguard.com/performance.) Note, too, that both investment returns and principal value can fluctuate widely, so an investor’s shares, when sold, could be worth more or less than their original cost. The returns shown do not reflect taxes that a shareholder would pay on fund distributions or on the sale of fund shares.
Cumulative Performance: May 31, 2013, Through October 31, 2014
Initial Investment of $10,000

| | | | | |
| | | Average Annual Total Returns | |
| | | Periods Ended October 31, 2014 | |
| | | | Since | Final Value |
| | | One | Inception | of a $10,000 |
| | | Year | (5/31/2013) | Investment |
| | Emerging Markets Government Bond | | | |
| | Index Fund Investor Shares | 5.82% | 3.05% | $10,436 |
| | Barclays USD Emerging Markets | | | |
| •••••••••••••• | Government RIC Capped Index | 7.06 | 3.96 | 10,566 |
| | Emerging Markets Hard Currency | | | |
| – – – – – –– | Debt Funds Average | 4.41 | 1.56 | 10,222 |
| | Barclays Global Aggregate Index | | | |
| | ex USD | -2.53 | 1.38 | 10,196 |
Emerging Markets Hard Currency Debt Funds Average: Derived from data provided by Lipper, a Thomson Reuters Company.
"Since Inception" performance is calculated from the Investor Shares’ inception date for both the fund and its comparative standards. |
|
Vanguard fund returns are adjusted to reflect the 0.75% fee on purchases of fund shares. The fee does not apply to the ETF Shares. The Fiscal-Year Total Returns table is not adjusted for fees.
See Financial Highlights for dividend and capital gains information.
9
Emerging Markets Government Bond Index Fund
| | | | |
| | Average Annual Total Returns | |
| | Periods Ended October 31, 2014 | |
| | | Since | Final Value |
| | One | Inception | of a $10,000 |
| | Year | (5/31/2013) | Investment |
| Emerging Markets Government Bond Index | | | |
| Fund Admiral Shares | 5.98% | 3.17% | $10,453 |
| Barclays USD Emerging Markets Government | | | |
| RIC Capped Index | 7.06 | 3.96 | 10,566 |
| Barclays Global Aggregate Index ex USD | -2.53 | 1.38 | 10,196 |
| "Since Inception" performance is calculated from the Admiral Shares’ inception date for both the fund and its comparative standard. |
| | | | |
| | | Since | Final Value |
| | One | Inception | of a $10,000 |
| | Year | (5/31/2013) | Investment |
| Emerging Markets Government Bond Index | | | |
| Fund ETF Shares Net Asset Value | 6.79% | 3.71% | $10,531 |
| Emerging Markets Government Bond Index | | | |
| Fund ETF Shares Market Price | 6.78% | 4.22% | 10,604 |
| Barclays USD Emerging Markets Government | | | |
| RIC Capped Index | 7.06 | 3.96 | 10,566 |
| Barclays Global Aggregate Index ex USD | -2.53 | 1.38 | 10,196 |
| "Since Inception" performance is calculated from the ETF Shares’ inception date for both the fund and its comparative standard. |
| | | |
| Cumulative Returns of ETF Shares: May 31, 2013, Through October 31, 2014 | |
| | | Since |
| | One | Inception |
| | Year | (5/31/2013) |
| Emerging Markets Government Bond Index Fund | | |
| ETF Shares Market Price | 6.78% | 6.04% |
| Emerging Markets Government Bond Index Fund | | |
| ETF Shares Net Asset Value | 6.79 | 5.31 |
| Barclays USD Emerging Markets Government RIC | | |
| Capped Index | 7.06 | 5.66 |
| "Since Inception" performance is calculated from the ETF Shares’ inception date for both the fund and its comparative standard. |
Vanguard fund returns are adjusted to reflect the 0.75% fee on purchases of fund shares. The fee does not apply to the ETF Shares. The Fiscal-Year Total Returns table is not adjusted for fees.
10
Emerging Markets Government Bond Index Fund
| | | | |
| Fiscal-Year Total Returns (%): May 31, 2013, Through October 31, 2014 | |
| | | | | Barclays USD |
| | | | | Emerging Mkts |
| | | | | Government |
| | | | Investor Shares | RIC Capped Idx |
| Fiscal Year | Income Returns | Capital Returns | Total Returns | Total Returns |
| 2013 | 1.51% | -2.89% | -1.38% | -1.30% |
| 2014 | 4.46 | 2.16 | 6.62 | 7.06 |
| | | | | |
| Average Annual Total Returns: Periods Ended September 30, 2014 | | |
| This table presents returns through the latest calendar quarter—rather than through the end of the fiscal period. |
| Securities and Exchange Commission rules require that we provide this information. | | |
| | | | | | Since Inception |
| | Inception Date | One Year | Income | Capital | Total |
| Investor Shares | 5/31/2013 | 7.74% | 4.12% | -1.35% | 2.77% |
| Fee-Adjusted Returns | | 6.94 | | | 2.19 |
| Admiral Shares | 5/31/2013 | 7.80 | 4.27 | -1.42 | 2.85 |
| Fee-Adjusted Returns | | 6.99 | | | 2.27 |
| ETF Shares | 5/31/2013 | | | | |
| Market Price | | 7.00 | | | 3.31 |
| Net Asset Value | | 7.79 | | | 2.84 |
Vanguard fund returns are adjusted to reflect the 0.75% fee on purchases of fund shares. The fee does not apply to the ETF Shares. The Fiscal-Year Total Returns table is not adjusted for fees.
11
Emerging Markets Government Bond Index Fund
Financial Statements
Statement of Net Assets
As of October 31, 2014
The fund reports a complete list of its holdings in regulatory filings four times in each fiscal year, at the quarter-ends. For the second and fourth fiscal quarters, the lists appear in the fund’s semiannual and annual reports to shareholders. For the first and third fiscal quarters, the fund files the lists with the Securities and Exchange Commission on Form N-Q. Shareholders can look up the fund’s Forms N-Q on the SEC’s website at sec.gov. Forms N-Q may also be reviewed and copied at the SEC’s Public Reference Room (see the back cover of this report for further information).
| | | | |
| | | | Face | Market |
| | | Maturity | Amount | Value• |
| | Coupon | Date | ($000) | ($000) |
| Angola (0.1%) | | | | |
| Sovereign Bond (U.S. Dollar-Denominated) (0.1%) | | | | |
| 1 Republic of Angola Via Northern Lights III BV | 7.000% | 8/16/19 | 250 | 268 |
| Total Angola (Cost $264) | | | | 268 |
| Argentina (1.2%) | | | | |
| Sovereign Bonds (U.S. Dollar-Denominated) (1.2%) | | | | |
| 1 Provincia de Buenos Aires | 10.875% | 1/26/21 | 350 | 320 |
| Provincia de Cordoba | 12.375% | 8/17/17 | 450 | 414 |
| Republic of Argentina | 8.750% | 6/2/17 | 250 | 217 |
| Republic of Argentina | 8.280% | 12/31/33 | 446 | 376 |
| Republic of Argentina | 8.280% | 12/31/33 | 1,542 | 1,327 |
| 1 Republic of Argentina | 2.500% | 12/31/38 | 1,848 | 1,006 |
| 1 YPF SA | 8.750% | 4/4/24 | 500 | 516 |
| Total Argentina (Cost $3,707) | | | | 4,176 |
| Armenia (0.1%) | | | | |
| Sovereign Bond (U.S. Dollar-Denominated) (0.1%) | | | | |
| 2 Republic of Armenia | 6.000% | 9/30/20 | 200 | 208 |
| Total Armenia (Cost $198) | | | | 208 |
| Azerbaijan (0.4%) | | | | |
| Sovereign Bonds (U.S. Dollar-Denominated) (0.4%) | | | | |
| 2 Republic of Azerbaijan | 4.750% | 3/18/24 | 400 | 416 |
| State Oil Co. of the Azerbaijan Republic | 5.450% | 2/9/17 | 200 | 209 |
| State Oil Co. of the Azerbaijan Republic | 4.750% | 3/13/23 | 800 | 794 |
| Total Azerbaijan (Cost $1,383) | | | | 1,419 |
| Bahrain (0.7%) | | | | |
| Sovereign Bonds (U.S. Dollar-Denominated) (0.7%) | | | | |
| Batelco International Finance No. 1 Ltd. | 4.250% | 5/1/20 | 200 | 200 |
| Kingdom of Bahrain | 6.273% | 11/22/18 | 350 | 405 |
| 2 Kingdom of Bahrain | 5.500% | 3/31/20 | 350 | 381 |
| 2 Kingdom of Bahrain | 6.125% | 7/5/22 | 600 | 677 |
| Kingdom of Bahrain | 6.125% | 8/1/23 | 200 | 225 |
| 2 Kingdom of Bahrain | 6.125% | 8/1/23 | 150 | 169 |
| 2 Kingdom of Bahrain | 6.000% | 9/19/44 | 500 | 516 |
| Total Bahrain (Cost $2,457) | | | | 2,573 |
12
Emerging Markets Government Bond Index Fund
| | | | |
| | | | Face | Market |
| | | Maturity | Amount | Value |
| | Coupon | Date | ($000) | ($000) |
| Belarus (0.1%) | | | | |
| Sovereign Bond (U.S. Dollar-Denominated) (0.1%) | | | | |
| Republic of Belarus | 8.950% | 1/26/18 | 200 | 216 |
| Total Belarus (Cost $201) | | | | 216 |
| Belize (0.0%) | | | | |
| Sovereign Bond (U.S. Dollar-Denominated) (0.0%) | | | | |
| 1 Belize | 5.000% | 2/20/38 | 200 | 152 |
| Total Belize (Cost $137) | | | | 152 |
| Bermuda (0.1%) | | | | |
| Sovereign Bonds (U.S. Dollar-Denominated) (0.1%) | | | | |
| 2 Bermuda | 5.603% | 7/20/20 | 100 | 109 |
| Bermuda | 4.854% | 2/6/24 | 200 | 212 |
| 2 Bermuda | 4.854% | 2/6/24 | 150 | 156 |
| Total Bermuda (Cost $465) | | | | 477 |
| Bolivia (0.1%) | | | | |
| Sovereign Bonds (U.S. Dollar-Denominated) (0.1%) | | | | |
| Plurinational State of Bolivia | 4.875% | 10/29/22 | 200 | 206 |
| Plurinational State of Bolivia | 5.950% | 8/22/23 | 200 | 215 |
| Total Bolivia (Cost $394) | | | | 421 |
| Brazil (10.0%) | | | | |
| Sovereign Bonds (U.S. Dollar-Denominated) (10.0%) | | | | |
| Banco do Brasil SA | 3.875% | 1/23/17 | 94 | 97 |
| Banco do Brasil SA | 6.000% | 1/22/20 | 100 | 110 |
| Banco do Brasil SA | 5.375% | 1/15/21 | 275 | 282 |
| Banco do Brasil SA | 5.875% | 1/26/22 | 600 | 617 |
| Banco do Brasil SA | 3.875% | 10/10/22 | 650 | 613 |
| Banco do Brasil SA | 5.875% | 1/19/23 | 250 | 259 |
| 1 Banco do Brasil SA | 8.500% | 10/29/49 | 450 | 516 |
| Banco Nacional de Desenvolvimento | | | | |
| Economico e Social | 6.369% | 6/16/18 | 825 | 904 |
| 2 Banco Nacional de Desenvolvimento | | | | |
| Economico e Social | 4.000% | 4/14/19 | 450 | 455 |
| Banco Nacional de Desenvolvimento | | | | |
| Economico e Social | 6.500% | 6/10/19 | 700 | 780 |
| 2 Banco Nacional de Desenvolvimento | | | | |
| Economico e Social | 5.500% | 7/12/20 | 100 | 108 |
| Banco Nacional de Desenvolvimento | | | | |
| Economico e Social | 5.500% | 7/12/20 | 100 | 108 |
| 2 Banco Nacional de Desenvolvimento | | | | |
| Economico e Social | 5.750% | 9/26/23 | 300 | 324 |
| Banco Nacional de Desenvolvimento | | | | |
| Economico e Social | 5.750% | 9/26/23 | 200 | 215 |
| Caixa Economica Federal | 2.375% | 11/6/17 | 725 | 712 |
| 2 Caixa Economica Federal | 4.500% | 10/3/18 | 200 | 205 |
| Caixa Economica Federal | 4.500% | 10/3/18 | 600 | 615 |
| Caixa Economica Federal | 3.500% | 11/7/22 | 150 | 137 |
| Centrais Eletricas Brasileiras SA | 6.875% | 7/30/19 | 350 | 382 |
| Centrais Eletricas Brasileiras SA | 5.750% | 10/27/21 | 600 | 610 |
| Federative Republic of Brazil | 6.000% | 1/17/17 | 600 | 656 |
| 1 Federative Republic of Brazil | 8.000% | 1/15/18 | 272 | 300 |
| Federative Republic of Brazil | 5.875% | 1/15/19 | 920 | 1,037 |
13
Emerging Markets Government Bond Index Fund
| | | | |
| | | | Face | Market |
| | | Maturity | Amount | Value |
| | Coupon | Date | ($000) | ($000) |
| Federative Republic of Brazil | 8.875% | 10/14/19 | 175 | 223 |
| Federative Republic of Brazil | 4.875% | 1/22/21 | 956 | 1,031 |
| Federative Republic of Brazil | 2.625% | 1/5/23 | 450 | 412 |
| Federative Republic of Brazil | 8.875% | 4/15/24 | 307 | 421 |
| Federative Republic of Brazil | 4.250% | 1/7/25 | 1,697 | 1,717 |
| Federative Republic of Brazil | 8.750% | 2/4/25 | 350 | 481 |
| Federative Republic of Brazil | 10.125% | 5/15/27 | 230 | 359 |
| Federative Republic of Brazil | 8.250% | 1/20/34 | 525 | 727 |
| Federative Republic of Brazil | 7.125% | 1/20/37 | 890 | 1,124 |
| 1 Federative Republic of Brazil | 11.000% | 8/17/40 | 688 | 740 |
| Federative Republic of Brazil | 5.625% | 1/7/41 | 951 | 1,025 |
| Federative Republic of Brazil | 5.000% | 1/27/45 | 1,536 | 1,501 |
| 3 Petrobras Global Finance BV | 1.852% | 5/20/16 | 350 | 349 |
| Petrobras Global Finance BV | 2.000% | 5/20/16 | 400 | 399 |
| 3 Petrobras Global Finance BV | 2.595% | 3/17/17 | 200 | 201 |
| Petrobras Global Finance BV | 3.250% | 3/17/17 | 300 | 303 |
| 3 Petrobras Global Finance BV | 2.371% | 1/15/19 | 350 | 352 |
| Petrobras Global Finance BV | 4.875% | 3/17/20 | 1,100 | 1,117 |
| Petrobras Global Finance BV | 4.375% | 5/20/23 | 1,250 | 1,192 |
| Petrobras Global Finance BV | 6.250% | 3/17/24 | 1,100 | 1,165 |
| Petrobras Global Finance BV | 5.625% | 5/20/43 | 550 | 499 |
| Petrobras Global Finance BV | 7.250% | 3/17/44 | 200 | 219 |
| Petrobras International Finance Co. SA | 3.875% | 1/27/16 | 1,300 | 1,326 |
| Petrobras International Finance Co. SA | 6.125% | 10/6/16 | 400 | 429 |
| Petrobras International Finance Co. SA | 3.500% | 2/6/17 | 700 | 710 |
| Petrobras International Finance Co. SA | 5.875% | 3/1/18 | 1,200 | 1,289 |
| Petrobras International Finance Co. SA | 8.375% | 12/10/18 | 350 | 412 |
| Petrobras International Finance Co. SA | 7.875% | 3/15/19 | 600 | 687 |
| Petrobras International Finance Co. SA | 5.750% | 1/20/20 | 1,300 | 1,370 |
| Petrobras International Finance Co. SA | 5.375% | 1/27/21 | 1,460 | 1,493 |
| Petrobras International Finance Co. SA | 6.875% | 1/20/40 | 865 | 906 |
| Petrobras International Finance Co. SA | 6.750% | 1/27/41 | 627 | 650 |
| Total Brazil (Cost $34,462) | | | | 34,871 |
| Chile (1.7%) | | | | |
| Sovereign Bonds (U.S. Dollar-Denominated) (1.7%) | | | | |
| 2 Banco del Estado de Chile | 2.000% | 11/9/17 | 200 | 201 |
| 2 Banco del Estado de Chile | 4.125% | 10/7/20 | 200 | 211 |
| 2 Banco del Estado de Chile | 3.875% | 2/8/22 | 200 | 203 |
| Corp Nacional del Cobre de Chile | 3.750% | 11/4/20 | 300 | 309 |
| 2 Corp Nacional del Cobre de Chile | 4.875% | 11/4/44 | 400 | 394 |
| 2 Corp. Nacional del Cobre de Chile | 7.500% | 1/15/19 | 100 | 120 |
| 2 Corp. Nacional del Cobre de Chile | 3.875% | 11/3/21 | 600 | 620 |
| 2 Corp. Nacional del Cobre de Chile | 3.000% | 7/17/22 | 475 | 460 |
| Corp. Nacional del Cobre de Chile | 3.000% | 7/17/22 | 200 | 193 |
| 2 Corp. Nacional del Cobre de Chile | 4.500% | 8/13/23 | 150 | 159 |
| Corp. Nacional del Cobre de Chile | 4.500% | 8/13/23 | 200 | 213 |
| 2 Corp. Nacional del Cobre de Chile | 5.625% | 9/21/35 | 300 | 330 |
| 2 Corp. Nacional del Cobre de Chile | 6.150% | 10/24/36 | 200 | 235 |
| 2 Corp. Nacional del Cobre de Chile | 4.250% | 7/17/42 | 50 | 45 |
| 2 Corp. Nacional del Cobre de Chile | 5.625% | 10/18/43 | 200 | 221 |
| 2 Empresa de Transporte de Pasajeros Metro SA | 4.750% | 2/4/24 | 200 | 211 |
| 2 Empresa Nacional del Petroleo | 5.250% | 8/10/20 | 200 | 216 |
| 2 Empresa Nacional del Petroleo | 4.750% | 12/6/21 | 200 | 209 |
| Republic of Chile | 3.875% | 8/5/20 | 441 | 472 |
14
Emerging Markets Government Bond Index Fund
| | | | | |
| | | | | Face | Market |
| | | | Maturity | Amount | Value |
| | | Coupon | Date | ($000) | ($000) |
| | Republic of Chile | 3.250% | 9/14/21 | 375 | 387 |
| | Republic of Chile | 2.250% | 10/30/22 | 200 | 189 |
| | Republic of Chile | 3.625% | 10/30/42 | 300 | 268 |
| Total Chile (Cost $5,671) | | | | 5,866 |
| China (7.4%) | | | | |
| Sovereign Bonds (U.S. Dollar-Denominated) (6.6%) | | | | |
| | Amber Circle Funding Ltd. | 2.000% | 12/4/17 | 200 | 199 |
| | Amber Circle Funding Ltd. | 3.250% | 12/4/22 | 600 | 581 |
| | Bank of China Ltd. | 2.125% | 1/23/17 | 300 | 301 |
| | Bank of China Ltd. | 3.125% | 1/23/19 | 200 | 202 |
| | BOC Aviation Pte Ltd. | 2.875% | 10/10/17 | 300 | 301 |
| | Century Master Investment Co. Ltd. | 4.750% | 9/19/18 | 200 | 208 |
| | China Cinda Finance 2014 Ltd. | 4.000% | 5/14/19 | 300 | 302 |
| | China Cinda Finance 2014 Ltd. | 5.625% | 5/14/24 | 200 | 210 |
| 2 | China Resources Gas Group Ltd. | 4.500% | 4/5/22 | 200 | 207 |
| 2 | China Resources Land Ltd. | 4.625% | 5/19/16 | 400 | 415 |
| | China Resources Land Ltd. | 4.375% | 2/27/19 | 250 | 257 |
| | China Resources Land Ltd. | 6.000% | 2/27/24 | 200 | 217 |
| 2 | CNOOC Curtis Funding No 1 Pty Ltd. | 4.500% | 10/3/23 | 300 | 317 |
| | CNOOC Curtis Funding No 1 Pty Ltd. | 4.500% | 10/3/23 | 1,070 | 1,133 |
| 2 | CNOOC Finance 2011 Ltd. | 4.250% | 1/26/21 | 338 | 361 |
| 2 | CNOOC Finance 2011 Ltd. | 5.750% | 1/26/41 | 200 | 237 |
| 2 | CNOOC Finance 2012 Ltd. | 3.875% | 5/2/22 | 575 | 588 |
| 2 | CNOOC Finance 2012 Ltd. | 5.000% | 5/2/42 | 200 | 215 |
| | CNOOC Finance 2013 Ltd. | 1.125% | 5/9/16 | 50 | 50 |
| | CNOOC Finance 2013 Ltd. | 1.750% | 5/9/18 | 200 | 198 |
| | CNOOC Finance 2013 Ltd. | 3.000% | 5/9/23 | 850 | 804 |
| | CNOOC Finance 2013 Ltd. | 4.250% | 5/9/43 | 200 | 191 |
| | CNOOC Nexen Finance 2014 ULC | 1.625% | 4/30/17 | 300 | 300 |
| | CNOOC Nexen Finance 2014 ULC | 4.250% | 4/30/24 | 650 | 671 |
| | CNOOC Nexen Finance 2014 ULC | 4.875% | 4/30/44 | 200 | 212 |
| | CNPC General Capital Ltd. | 1.450% | 4/16/16 | 250 | 250 |
| 2 | CNPC General Capital Ltd. | 2.750% | 4/19/17 | 200 | 204 |
| 2,3 | CNPC General Capital Ltd. | 1.133% | 5/14/17 | 200 | 200 |
| | CNPC General Capital Ltd. | 1.950% | 4/16/18 | 350 | 345 |
| 2 | CNPC General Capital Ltd. | 2.750% | 5/14/19 | 200 | 201 |
| | CNPC General Capital Ltd. | 2.750% | 5/14/19 | 250 | 250 |
| 2 | CNPC General Capital Ltd. | 3.950% | 4/19/22 | 200 | 204 |
| | CNPC General Capital Ltd. | 3.400% | 4/16/23 | 250 | 243 |
| 2 | CNPC HK Overseas Capital Ltd. | 3.125% | 4/28/16 | 200 | 205 |
| 2 | CNPC HK Overseas Capital Ltd. | 5.950% | 4/28/41 | 200 | 245 |
| | COSCO Finance 2011 Ltd. | 4.000% | 12/3/22 | 400 | 389 |
| 2 | COSL Finance BVI Ltd. | 3.250% | 9/6/22 | 550 | 524 |
| 1 | CRCC Yupeng Ltd. | 3.950% | 2/28/49 | 300 | 300 |
| | CRCC Yuxiang Ltd. | 3.500% | 5/16/23 | 250 | 243 |
| 2 | Export-Import Bank of China | 2.500% | 7/31/19 | 700 | 696 |
| | Export-Import Bank of China | 3.625% | 7/31/24 | 550 | 553 |
| 2 | Franshion Development Ltd. | 6.750% | 4/15/21 | 200 | 211 |
| | Franshion Investment Ltd. | 4.700% | 10/26/17 | 200 | 204 |
| | Huarong Finance Co. Ltd. | 4.000% | 7/17/19 | 300 | 302 |
| | MCC Holding Hong Kong Corp. Ltd. | 4.875% | 7/29/16 | 200 | 203 |
| | Nexen Energy ULC | 7.875% | 3/15/32 | 100 | 139 |
| | Nexen Energy ULC | 5.875% | 3/10/35 | 308 | 359 |
| | Nexen Energy ULC | 6.400% | 5/15/37 | 425 | 529 |
| | Prosperous Ray Ltd. | 3.000% | 11/12/18 | 400 | 406 |
15
Emerging Markets Government Bond Index Fund
| | | | | |
| | | | | Face | Market |
| | | | Maturity | Amount | Value• |
| | | Coupon | Date | ($000) | ($000) |
| 1,2 | Sinochem Global Capital Co. Ltd. | 5.000% | 12/29/49 | 200 | 204 |
| 2 | Sinochem Offshore Capital Co. Ltd. | 3.250% | 4/29/19 | 200 | 202 |
| | Sinochem Overseas Capital Co. Ltd. | 4.500% | 11/12/20 | 100 | 106 |
| 2 | Sinochem Overseas Capital Co. Ltd. | 4.500% | 11/12/20 | 175 | 187 |
| 2 | Sinochem Overseas Capital Co. Ltd. | 6.300% | 11/12/40 | 250 | 308 |
| | Sino-Ocean Land Treasure Finance I Ltd. | 6.000% | 7/30/24 | 350 | 353 |
| | Sinopec Capital 2013 Ltd. | 1.250% | 4/24/16 | 200 | 200 |
| | Sinopec Capital 2013 Ltd. | 1.875% | 4/24/18 | 200 | 197 |
| | Sinopec Capital 2013 Ltd. | 3.125% | 4/24/23 | 400 | 381 |
| 2 | Sinopec Capital 2013 Ltd. | 3.125% | 4/24/23 | 400 | 381 |
| 2 | Sinopec Group Overseas Development 2012 Ltd. | 2.750% | 5/17/17 | 800 | 818 |
| 2 | Sinopec Group Overseas Development 2012 Ltd. | 3.900% | 5/17/22 | 600 | 613 |
| 2 | Sinopec Group Overseas Development 2012 Ltd. | 4.875% | 5/17/42 | 400 | 428 |
| | Sinopec Group Overseas Development 2013 Ltd. | 4.375% | 10/17/23 | 925 | 966 |
| | Sinopec Group Overseas Development 2013 Ltd. | 5.375% | 10/17/43 | 200 | 228 |
| 3 | Sinopec Group Overseas Development 2014 Ltd. | 1.009% | 4/10/17 | 300 | 300 |
| 2 | Sinopec Group Overseas Development 2014 Ltd. | 1.750% | 4/10/17 | 1,000 | 1,000 |
| 2 | Sinopec Group Overseas Development 2014 Ltd. | 2.750% | 4/10/19 | 400 | 401 |
| 2 | State Grid Overseas Investment 2013 Ltd. | 1.750% | 5/22/18 | 200 | 197 |
| | State Grid Overseas Investment 2013 Ltd. | 3.125% | 5/22/23 | 630 | 610 |
| 2 | State Grid Overseas Investment 2013 Ltd. | 4.375% | 5/22/43 | 200 | 203 |
| 2 | State Grid Overseas Investment 2014 Ltd. | 2.750% | 5/7/19 | 700 | 704 |
| | State Grid Overseas Investment 2014 Ltd. | 4.125% | 5/7/24 | 200 | 208 |
| 2 | State Grid Overseas Investment 2014 Ltd. | 4.850% | 5/7/44 | 350 | 376 |
| Total China (Cost $25,112) | | | | 25,653 |
| Colombia (2.9%) | | | | |
| Sovereign Bonds (U.S. Dollar-Denominated) (2.9%) | | | | |
| | Ecopetrol SA | 4.250% | 9/18/18 | 35 | 37 |
| | Ecopetrol SA | 7.625% | 7/23/19 | 425 | 511 |
| | Ecopetrol SA | 5.875% | 9/18/23 | 565 | 626 |
| | Ecopetrol SA | 4.125% | 1/16/25 | 475 | 461 |
| | Ecopetrol SA | 7.375% | 9/18/43 | 300 | 365 |
| | Ecopetrol SA | 5.875% | 5/28/45 | 750 | 769 |
| | Oleoducto Central SA | 4.000% | 5/7/21 | 200 | 202 |
| | Republic of Colombia | 7.375% | 1/27/17 | 800 | 904 |
| | Republic of Colombia | 7.375% | 3/18/19 | 675 | 808 |
| | Republic of Colombia | 4.375% | 7/12/21 | 942 | 1,003 |
| 1 | Republic of Colombia | 2.625% | 3/15/23 | 275 | 258 |
| | Republic of Colombia | 4.000% | 2/26/24 | 600 | 615 |
| | Republic of Colombia | 8.125% | 5/21/24 | 540 | 720 |
| | Republic of Colombia | 7.375% | 9/18/37 | 550 | 745 |
| | Republic of Colombia | 6.125% | 1/18/41 | 1,053 | 1,259 |
| 1 | Republic of Colombia | 5.625% | 2/26/44 | 812 | 908 |
| Total Colombia (Cost $9,907) | | | | 10,191 |
| Costa Rica (0.6%) | | | | |
| Sovereign Bonds (U.S. Dollar-Denominated) (0.6%) | | | | |
| 2 | Banco Nacional de Costa Rica | 4.875% | 11/1/18 | 200 | 204 |
| | Banco Nacional de Costa Rica | 4.875% | 11/1/18 | 200 | 204 |
| | Instituto Costarricense de Electricidad | 6.950% | 11/10/21 | 200 | 211 |
| | Instituto Costarricense de Electricidad | 6.375% | 5/15/43 | 200 | 174 |
| | Republic of Costa Rica | 4.250% | 1/26/23 | 600 | 568 |
| | Republic of Costa Rica | 5.625% | 4/30/43 | 200 | 176 |
| | Republic of Costa Rica | 7.000% | 4/4/44 | 400 | 413 |
| Total Costa Rica (Cost $1,934) | | | | 1,950 |
16
Emerging Markets Government Bond Index Fund
| | | | | |
| | | | | Face | Market |
| | | | Maturity | Amount | Value |
| | | Coupon | Date | ($000) | ($000) |
| Cote D’Ivoire (0.3%) | | | | |
| Sovereign Bonds (U.S. Dollar-Denominated) (0.3%) | | | | |
| | Cote D’Ivoire | 5.375% | 7/23/24 | 250 | 240 |
| 1 | Cote D’Ivoire | 7.774% | 12/31/32 | 895 | 861 |
| Total Cote D’Ivoire (Cost $1,083) | | | | 1,101 |
| Croatia (1.1%) | | | | |
| Sovereign Bonds (U.S. Dollar-Denominated) (1.1%) | | | | |
| | Hrvatska Elektroprivreda | 6.000% | 11/9/17 | 200 | 209 |
| | Republic of Croatia | 6.250% | 4/27/17 | 512 | 547 |
| | Republic of Croatia | 6.750% | 11/5/19 | 600 | 665 |
| | Republic of Croatia | 6.625% | 7/14/20 | 540 | 598 |
| | Republic of Croatia | 6.375% | 3/24/21 | 550 | 603 |
| | Republic of Croatia | 5.500% | 4/4/23 | 500 | 521 |
| | Republic of Croatia | 6.000% | 1/26/24 | 635 | 683 |
| Total Croatia (Cost $3,733) | | | | 3,826 |
| Dominican Republic (0.5%) | | | | |
| Sovereign Bonds (U.S. Dollar-Denominated) (0.5%) | | | | |
| 1 | Dominican Republic | 9.040% | 1/23/18 | 77 | 83 |
| 1 | Dominican Republic | 7.500% | 5/6/21 | 550 | 628 |
| | Dominican Republic | 6.600% | 1/28/24 | 250 | 277 |
| 1 | Dominican Republic | 5.875% | 4/18/24 | 250 | 263 |
| | Dominican Republic | 7.450% | 4/30/44 | 200 | 225 |
| 2 | Dominican Republic | 7.450% | 4/30/44 | 300 | 335 |
| Total Dominican Republic (Cost $1,705) | | | | 1,811 |
| Ecuador (0.3%) | | | | |
| Sovereign Bonds (U.S. Dollar-Denominated) (0.3%) | | | | |
| | Republic of Ecuador | 9.375% | 12/15/15 | 250 | 261 |
| | Republic of Ecuador | 7.950% | 6/20/24 | 650 | 680 |
| Total Ecuador (Cost $928) | | | | 941 |
| Egypt (0.3%) | | | | |
| Sovereign Bonds (U.S. Dollar-Denominated) (0.3%) | | | | |
| | African Export-Import Bank | 3.875% | 6/4/18 | 250 | 247 |
| | Arab Republic of Egypt | 5.750% | 4/29/20 | 412 | 435 |
| | Arab Republic of Egypt | 6.875% | 4/30/40 | 200 | 204 |
| Total Egypt (Cost $865) | | | | 886 |
| El Salvador (0.6%) | | | | |
| Sovereign Bonds (U.S. Dollar-Denominated) (0.6%) | | | | |
| | Republic of El Salvador | 7.375% | 12/1/19 | 300 | 334 |
| | Republic of El Salvador | 7.750% | 1/24/23 | 300 | 340 |
| | Republic of El Salvador | 5.875% | 1/30/25 | 300 | 299 |
| 2 | Republic of El Salvador | 6.375% | 1/18/27 | 300 | 308 |
| | Republic of El Salvador | 8.250% | 4/10/32 | 200 | 233 |
| | Republic of El Salvador | 7.650% | 6/15/35 | 380 | 414 |
| | Republic of El Salvador | 7.625% | 2/1/41 | 150 | 162 |
| Total El Salvador (Cost $2,027) | | | | 2,090 |
17
Emerging Markets Government Bond Index Fund
| | | | | |
| | | | | Face | Market |
| | | | Maturity | Amount | Value |
| | | Coupon | Date | ($000) | ($000) |
| Gabon (0.2%) | | | | |
| Sovereign Bonds (U.S. Dollar-Denominated) (0.2%) | | | | |
| | Gabonese Republic | 8.200% | 12/12/17 | 100 | 112 |
| 1,2 | Gabonese Republic | 6.375% | 12/12/24 | 400 | 426 |
| Total Gabon (Cost $521) | | | | 538 |
| Georgia (0.1%) | | | | |
| Sovereign Bonds (U.S. Dollar-Denominated) (0.1%) | | | | |
| | Georgian Railway JSC | 7.750% | 7/11/22 | 200 | 224 |
| | Republic of Georgia | 6.875% | 4/12/21 | 200 | 225 |
| Total Georgia (Cost $451) | | | | 449 |
| Ghana (0.3%) | | | | |
| Sovereign Bonds (U.S. Dollar-Denominated) (0.3%) | | | | |
| | Republic of Ghana | 8.500% | 10/4/17 | 200 | 211 |
| 2 | Republic of Ghana | 7.875% | 8/7/23 | 400 | 402 |
| 1,2 | Republic of Ghana | 8.125% | 1/18/26 | 300 | 302 |
| Total Ghana (Cost $912) | | | | 915 |
| Guatemala (0.1%) | | | | |
| Sovereign Bonds (U.S. Dollar-Denominated) (0.1%) | | | | |
| | Republic of Guatemala | 5.750% | 6/6/22 | 200 | 220 |
| | Republic of Guatemala | 4.875% | 2/13/28 | 200 | 203 |
| Total Guatemala (Cost $400) | | | | 423 |
| Honduras (0.1%) | | | | |
| Sovereign Bond (U.S. Dollar-Denominated) (0.1%) | | | | |
| 1 | Republic of Honduras | 7.500% | 3/15/24 | 200 | 215 |
| Total Honduras (Cost $171) | | | | 215 |
| Hungary (2.0%) | | | | |
| Sovereign Bonds (U.S. Dollar-Denominated) (2.0%) | | | | |
| 4 | Magyar Export-Import Bank Zrt | 5.500% | 2/12/18 | 200 | 212 |
| 2,4 | MFB Magyar Fejlesztesi Bank Zrt | 6.250% | 10/21/20 | 200 | 222 |
| | Republic of Hungary | 4.125% | 2/19/18 | 770 | 797 |
| | Republic of Hungary | 4.000% | 3/25/19 | 800 | 820 |
| | Republic of Hungary | 6.250% | 1/29/20 | 1,131 | 1,272 |
| | Republic of Hungary | 6.375% | 3/29/21 | 1,028 | 1,168 |
| | Republic of Hungary | 5.375% | 2/21/23 | 562 | 605 |
| | Republic of Hungary | 5.750% | 11/22/23 | 718 | 790 |
| | Republic of Hungary | 5.375% | 3/25/24 | 550 | 586 |
| | Republic of Hungary | 7.625% | 3/29/41 | 350 | 454 |
| Total Hungary (Cost $6,618) | | | | 6,926 |
| India (1.9%) | | | | |
| Sovereign Bonds (U.S. Dollar-Denominated) (1.9%) | | | | |
| | Bank of Baroda | 4.875% | 7/23/19 | 350 | 370 |
| | Bank of India | 3.625% | 9/21/18 | 350 | 356 |
| | Bharat Petroleum Corp. Ltd. | 4.625% | 10/25/22 | 200 | 205 |
| | Canara Bank | 5.250% | 10/18/18 | 200 | 214 |
| | Export-Import Bank of India | 4.000% | 8/7/17 | 200 | 208 |
| | Export-Import Bank of India | 4.000% | 1/14/23 | 400 | 398 |
| | IDBI Bank Ltd. | 4.375% | 3/26/18 | 200 | 204 |
| | IDBI Bank Ltd. | 3.750% | 1/25/19 | 200 | 199 |
| | Indian Oil Corp. Ltd. | 5.625% | 8/2/21 | 200 | 217 |
18
Emerging Markets Government Bond Index Fund
| | | | |
| | | | Face | Market |
| | | Maturity | Amount | Value |
| | Coupon | Date | ($000) | ($000) |
| Indian Oil Corp. Ltd. | 5.750% | 8/1/23 | 200 | 218 |
| Indian Overseas Bank | 5.000% | 10/19/16 | 400 | 420 |
| Indian Railway Finance Corp. Ltd. | 3.917% | 2/26/19 | 200 | 207 |
| NTPC Ltd. | 5.625% | 7/14/21 | 200 | 217 |
| NTPC Ltd. | 4.750% | 10/3/22 | 200 | 206 |
| Oil India Ltd. | 5.375% | 4/17/24 | 250 | 267 |
| ONGC Videsh Ltd. | 3.750% | 5/7/23 | 400 | 387 |
| ONGC Videsh Ltd. | 4.625% | 7/15/24 | 250 | 254 |
| Power Grid Corp. of India Ltd. | 3.875% | 1/17/23 | 200 | 194 |
| Rural Electrification Corp. Ltd. | 4.250% | 1/25/16 | 300 | 308 |
| State Bank of India | 4.125% | 8/1/17 | 650 | 677 |
| State Bank of India | 3.250% | 4/18/18 | 400 | 405 |
| 2 State Bank of India | 4.875% | 4/17/24 | 200 | 208 |
| Syndicate Bank | 4.750% | 11/6/16 | 250 | 261 |
| Total India (Cost $6,468) | | | | 6,600 |
| Indonesia (5.6%) | | | | |
| Sovereign Bonds (U.S. Dollar-Denominated) (5.6%) | | | | |
| Lembaga Pembiayaan Ekspor Indonesia | 3.750% | 4/26/17 | 300 | 307 |
| Majapahit Holding BV | 8.000% | 8/7/19 | 250 | 294 |
| Majapahit Holding BV | 7.750% | 1/20/20 | 525 | 612 |
| Majapahit Holding BV | 7.875% | 6/29/37 | 100 | 120 |
| 2 Pelabuhan Indonesia III PT | 4.875% | 10/1/24 | 200 | 203 |
| Pertamina Persero PT | 5.250% | 5/23/21 | 200 | 210 |
| Pertamina Persero PT | 4.875% | 5/3/22 | 350 | 357 |
| 2 Pertamina Persero PT | 4.300% | 5/20/23 | 430 | 418 |
| Pertamina Persero PT | 4.300% | 5/20/23 | 200 | 195 |
| Pertamina Persero PT | 6.500% | 5/27/41 | 400 | 424 |
| 2 Pertamina Persero PT | 6.000% | 5/3/42 | 750 | 749 |
| 2 Pertamina Persero PT | 5.625% | 5/20/43 | 200 | 191 |
| Pertamina Persero PT | 5.625% | 5/20/43 | 200 | 192 |
| Pertamina Persero PT | 6.450% | 5/30/44 | 200 | 213 |
| 2 Perusahaan Gas Negara Persero Tbk PT | 5.125% | 5/16/24 | 400 | 411 |
| Perusahaan Listrik Negara PT | 5.500% | 11/22/21 | 300 | 319 |
| Perusahaan Listrik Negara PT | 5.250% | 10/24/42 | 400 | 362 |
| Republic of Indonesia | 6.875% | 3/9/17 | 300 | 332 |
| Republic of Indonesia | 6.875% | 1/17/18 | 1,718 | 1,937 |
| Republic of Indonesia | 4.000% | 11/21/18 | 200 | 207 |
| Republic of Indonesia | 11.625% | 3/4/19 | 400 | 536 |
| 2 Republic of Indonesia | 6.125% | 3/15/19 | 200 | 223 |
| Republic of Indonesia | 6.125% | 3/15/19 | 400 | 445 |
| 2 Republic of Indonesia | 5.875% | 3/13/20 | 350 | 391 |
| Republic of Indonesia | 5.875% | 3/13/20 | 950 | 1,063 |
| Republic of Indonesia | 4.875% | 5/5/21 | 500 | 534 |
| Republic of Indonesia | 3.750% | 4/25/22 | 850 | 845 |
| Republic of Indonesia | 3.300% | 11/21/22 | 228 | 217 |
| Republic of Indonesia | 3.375% | 4/15/23 | 600 | 574 |
| Republic of Indonesia | 5.375% | 10/17/23 | 209 | 229 |
| 2 Republic of Indonesia | 5.875% | 1/15/24 | 200 | 228 |
| Republic of Indonesia | 5.875% | 1/15/24 | 850 | 966 |
| 2 Republic of Indonesia | 4.350% | 9/10/24 | 600 | 603 |
| Republic of Indonesia | 8.500% | 10/12/35 | 400 | 562 |
| Republic of Indonesia | 6.625% | 2/17/37 | 818 | 956 |
| Republic of Indonesia | 7.750% | 1/17/38 | 275 | 361 |
| Republic of Indonesia | 5.250% | 1/17/42 | 900 | 906 |
19
Emerging Markets Government Bond Index Fund
| | | | |
| | | | Face | Market |
| | | Maturity | Amount | Value |
| | Coupon | Date | ($000) | ($000) |
| Republic of Indonesia | 4.625% | 4/15/43 | 375 | 347 |
| 2 Republic of Indonesia | 6.750% | 1/15/44 | 450 | 551 |
| Republic of Indonesia | 6.750% | 1/15/44 | 750 | 917 |
| Total Indonesia (Cost $18,533) | | | | 19,507 |
| Iraq (0.2%) | | | | |
| Sovereign Bond (U.S. Dollar-Denominated) (0.2%) | | | | |
| Republic of Iraq | 5.800% | 1/15/28 | 810 | 719 |
| Total Iraq (Cost $715) | | | | 719 |
| Ireland (0.1%) | | | | |
| Sovereign Bonds (U.S. Dollar-Denominated) (0.1%) | | | | |
| Vnesheconombank Via VEB Finance plc | 4.224% | 11/21/18 | 200 | 188 |
| Total Ireland (Cost $186) | | | | 188 |
| Jamaica (0.3%) | | | | |
| Sovereign Bonds (U.S. Dollar-Denominated) (0.3%) | | | | |
| 1 Jamaica | 8.000% | 6/24/19 | 450 | 486 |
| 1 Jamaica | 7.625% | 7/9/25 | 250 | 269 |
| 1 Jamaica | 8.000% | 3/15/39 | 125 | 126 |
| Total Jamaica (Cost $834) | | | | 881 |
| Jordan (0.1%) | | | | |
| Sovereign Bond (U.S. Dollar-Denominated) (0.1%) | | | | |
| Hashemite Kingdom of Jordan | 3.875% | 11/12/15 | 200 | 202 |
| Total Jordan (Cost $200) | | | | 202 |
| Kazakhstan (1.5%) | | | | |
| Sovereign Bonds (U.S. Dollar-Denominated) (1.5%) | | | | |
| Development Bank of Kazakhstan JSC | 4.125% | 12/10/22 | 500 | 472 |
| Intergas Finance BV | 6.375% | 5/14/17 | 150 | 160 |
| KazAgro National Management Holding JSC | 4.625% | 5/24/23 | 600 | 578 |
| 2 KazAgro National Management Holding JSC | 4.625% | 5/24/23 | 200 | 191 |
| Kazakhstan Temir Zholy Finance BV | 6.950% | 7/10/42 | 600 | 669 |
| KazMunayGas National Co. JSC | 9.125% | 7/2/18 | 425 | 502 |
| KazMunayGas National Co. JSC | 7.000% | 5/5/20 | 200 | 225 |
| KazMunayGas National Co. JSC | 6.375% | 4/9/21 | 630 | 695 |
| KazMunayGas National Co. JSC | 4.400% | 4/30/23 | 425 | 418 |
| KazMunayGas National Co. JSC | 5.750% | 4/30/43 | 200 | 195 |
| 2 KazMunayGas National Co. JSC | 5.750% | 4/30/43 | 225 | 216 |
| 2 KazMunayGas National Co. JSC | 6.000% | 11/7/44 | 200 | 197 |
| Republic of Kazakhstan | 3.875% | 10/14/24 | 200 | 196 |
| 2 Republic of Kazakhstan | 4.875% | 10/14/44 | 400 | 386 |
| Total Kazakhstan (Cost $5,007) | | | | 5,100 |
| Kenya (0.2%) | | | | |
| Sovereign Bonds (U.S. Dollar-Denominated) (0.2%) | | | | |
| Republic of Kenya | 5.875% | 6/24/19 | 200 | 207 |
| 2 Republic of Kenya | 6.875% | 6/24/24 | 200 | 213 |
| Republic of Kenya | 6.875% | 6/24/24 | 400 | 426 |
| Total Kenya (Cost $831) | | | | 846 |
20
Emerging Markets Government Bond Index Fund
| | | | | |
| | | | | Face | Market |
| | | | Maturity | Amount | Value |
| | | Coupon | Date | ($000) | ($000) |
| Latvia (0.3%) | | | | |
| Sovereign Bonds (U.S. Dollar-Denominated) (0.3%) | | | | |
| | Republic of Latvia | 5.250% | 2/22/17 | 180 | 195 |
| | Republic of Latvia | 2.750% | 1/12/20 | 700 | 693 |
| | Republic of Latvia | 5.250% | 6/16/21 | 200 | 225 |
| Total Latvia (Cost $1,091) | | | | 1,113 |
| Lebanon (2.0%) | | | | |
| Sovereign Bonds (U.S. Dollar-Denominated) (2.0%) | | | | |
| | Republic of Lebanon | 8.500% | 1/19/16 | 600 | 634 |
| | Republic of Lebanon | 4.750% | 11/2/16 | 100 | 101 |
| | Republic of Lebanon | 9.000% | 3/20/17 | 400 | 444 |
| | Republic of Lebanon | 5.000% | 10/12/17 | 400 | 405 |
| | Republic of Lebanon | 5.150% | 6/12/18 | 50 | 51 |
| | Republic of Lebanon | 5.150% | 11/12/18 | 300 | 302 |
| | Republic of Lebanon | 5.500% | 4/23/19 | 50 | 51 |
| | Republic of Lebanon | 6.000% | 5/20/19 | 150 | 155 |
| | Republic of Lebanon | 5.450% | 11/28/19 | 350 | 353 |
| | Republic of Lebanon | 6.375% | 3/9/20 | 1,516 | 1,585 |
| | Republic of Lebanon | 8.250% | 4/12/21 | 700 | 802 |
| | Republic of Lebanon | 6.100% | 10/4/22 | 708 | 721 |
| | Republic of Lebanon | 6.000% | 1/27/23 | 300 | 302 |
| | Republic of Lebanon | 6.250% | 6/12/25 | 100 | 100 |
| | Republic of Lebanon | 6.600% | 11/27/26 | 600 | 613 |
| | Republic of Lebanon | 6.750% | 11/29/27 | 495 | 510 |
| Total Lebanon (Cost $6,990) | | | | 7,129 |
| Lithuania (0.7%) | | | | |
| Sovereign Bonds (U.S. Dollar-Denominated) (0.7%) | | | | |
| | Republic of Lithuania | 5.125% | 9/14/17 | 200 | 219 |
| | Republic of Lithuania | 7.375% | 2/11/20 | 941 | 1,139 |
| | Republic of Lithuania | 6.125% | 3/9/21 | 519 | 605 |
| | Republic of Lithuania | 6.625% | 2/1/22 | 440 | 533 |
| Total Lithuania (Cost $2,459) | | | | 2,496 |
| Malaysia (1.1%) | | | | |
| Sovereign Bonds (U.S. Dollar-Denominated) (1.1%) | | | | |
| | Export-Import Bank of Malaysia Bhd. | 2.875% | 12/14/17 | 200 | 207 |
| 2 | Federation of Malaysia | 2.991% | 7/6/16 | 625 | 645 |
| 2 | Federation of Malaysia | 4.646% | 7/6/21 | 250 | 276 |
| 1 | Malayan Banking Berhad | 3.250% | 9/20/22 | 400 | 404 |
| 2,5 | Penerbangan Malaysia Bhd. | 5.625% | 3/15/16 | 300 | 318 |
| | Petroliam Nasional Bhd. | 7.625% | 10/15/26 | 100 | 137 |
| 2 | Petronas Capital Ltd. | 5.250% | 8/12/19 | 623 | 702 |
| | Petronas Capital Ltd. | 5.250% | 8/12/19 | 416 | 468 |
| | Petronas Capital Ltd. | 7.875% | 5/22/22 | 200 | 261 |
| | SSG Resources Ltd. | 4.250% | 10/4/22 | 400 | 409 |
| Total Malaysia (Cost $3,750) | | | | 3,827 |
| Mexico (8.2%) | | | | |
| Sovereign Bonds (U.S. Dollar-Denominated) (8.2%) | | | | |
| | Comision Federal de Electricidad | 4.875% | 5/26/21 | 250 | 268 |
| 2 | Comision Federal de Electricidad | 4.875% | 1/15/24 | 200 | 211 |
| | Comision Federal de Electricidad | 4.875% | 1/15/24 | 400 | 422 |
| | Comision Federal de Electricidad | 5.750% | 2/14/42 | 200 | 212 |
21
Emerging Markets Government Bond Index Fund
| | | | | |
| | | | | Face | Market |
| | | | Maturity | Amount | Value• |
| | | Coupon | Date | ($000) | ($000) |
| | Pemex Project Funding Master Trust | 5.750% | 3/1/18 | 775 | 854 |
| | Pemex Project Funding Master Trust | 6.625% | 6/15/35 | 1,233 | 1,452 |
| | Petroleos Mexicanos | 3.500% | 7/18/18 | 500 | 518 |
| | Petroleos Mexicanos | 8.000% | 5/3/19 | 644 | 783 |
| | Petroleos Mexicanos | 6.000% | 3/5/20 | 200 | 226 |
| | Petroleos Mexicanos | 5.500% | 1/21/21 | 1,623 | 1,797 |
| | Petroleos Mexicanos | 4.875% | 1/24/22 | 950 | 1,015 |
| | Petroleos Mexicanos | 3.500% | 1/30/23 | 650 | 630 |
| | Petroleos Mexicanos | 4.875% | 1/18/24 | 950 | 1,008 |
| 2 | Petroleos Mexicanos | 4.250% | 1/15/25 | 200 | 202 |
| | Petroleos Mexicanos | 6.500% | 6/2/41 | 820 | 955 |
| | Petroleos Mexicanos | 5.500% | 6/27/44 | 1,186 | 1,227 |
| 2 | Petroleos Mexicanos | 5.500% | 6/27/44 | 500 | 517 |
| | Petroleos Mexicanos | 6.375% | 1/23/45 | 1,000 | 1,147 |
| | United Mexican States | 11.375% | 9/15/16 | 325 | 389 |
| | United Mexican States | 5.625% | 1/15/17 | 1,290 | 1,408 |
| | United Mexican States | 5.950% | 3/19/19 | 1,345 | 1,546 |
| | United Mexican States | 8.125% | 12/30/19 | 225 | 293 |
| | United Mexican States | 5.125% | 1/15/20 | 780 | 873 |
| | United Mexican States | 3.500% | 1/21/21 | 300 | 309 |
| | United Mexican States | 3.625% | 3/15/22 | 1,046 | 1,075 |
| | United Mexican States | 8.000% | 9/24/22 | 150 | 199 |
| | United Mexican States | 4.000% | 10/2/23 | 1,301 | 1,355 |
| | United Mexican States | 8.300% | 8/15/31 | 200 | 299 |
| | United Mexican States | 7.500% | 4/8/33 | 200 | 275 |
| | United Mexican States | 6.750% | 9/27/34 | 1,035 | 1,343 |
| | United Mexican States | 6.050% | 1/11/40 | 1,606 | 1,936 |
| | United Mexican States | 4.750% | 3/8/44 | 1,520 | 1,550 |
| | United Mexican States | 5.550% | 1/21/45 | 950 | 1,079 |
| | United Mexican States | 5.750% | 10/12/10 | 1,100 | 1,165 |
| Total Mexico (Cost $27,586) | | | | 28,538 |
| Mongolia (0.2%) | | | | |
| Sovereign Bonds (U.S. Dollar-Denominated) (0.2%) | | | | |
| 6 | Development Bank of Mongolia LLC | 5.750% | 3/21/17 | 200 | 194 |
| | Mongolia | 4.125% | 1/5/18 | 200 | 190 |
| | Mongolia | 5.125% | 12/5/22 | 450 | 401 |
| Total Mongolia (Cost $786) | | | | 785 |
| Morocco (0.5%) | | | | |
| Sovereign Bonds (U.S. Dollar-Denominated) (0.5%) | | | | |
| | Kingdom of Morocco | 4.250% | 12/11/22 | 700 | 708 |
| | Kingdom of Morocco | 5.500% | 12/11/42 | 225 | 229 |
| 2 | OCP SA | 5.625% | 4/25/24 | 500 | 524 |
| 2 | OCP SA | 6.875% | 4/25/44 | 200 | 218 |
| Total Morocco (Cost $1,594) | | | | 1,679 |
| Mozambique (0.1%) | | | | |
| Sovereign Bond (U.S. Dollar-Denominated) (0.1%) | | | | |
| 1,7 | Mozambique EMATUM Finance 2020 BV | 6.305% | 9/11/20 | 400 | 399 |
| Total Mozambique (Cost $383) | | | | 399 |
22
Emerging Markets Government Bond Index Fund
| | | | |
| | | | Face | Market |
| | | Maturity | Amount | Value |
| | Coupon | Date | ($000) | ($000) |
| Namibia (0.1%) | | | | |
| Sovereign Bond (U.S. Dollar-Denominated) (0.1%) | | | | |
| Republic of Namibia | 5.500% | 11/3/21 | 200 | 215 |
| Total Namibia (Cost $206) | | | | 215 |
| Nigeria (0.1%) | | | | |
| Sovereign Bonds (U.S. Dollar-Denominated) (0.1%) | | | | |
| 2 Federal Republic of Nigeria | 5.125% | 7/12/18 | 200 | 206 |
| Federal Republic of Nigeria | 6.750% | 1/28/21 | 250 | 271 |
| Total Nigeria (Cost $463) | | | | 477 |
| Pakistan (0.3%) | | | | |
| Sovereign Bonds (U.S. Dollar-Denominated) (0.3%) | | | | |
| Islamic Republic of Pakistan | 6.875% | 6/1/17 | 275 | 281 |
| 2 Islamic Republic of Pakistan | 7.250% | 4/15/19 | 400 | 417 |
| 2 Islamic Republic of Pakistan | 8.250% | 4/15/24 | 250 | 262 |
| Islamic Republic of Pakistan | 8.250% | 4/15/24 | 200 | 209 |
| Total Pakistan (Cost $1,131) | | | | 1,169 |
| Panama (1.1%) | | | | |
| Sovereign Bonds (U.S. Dollar-Denominated) (1.1%) | | | | |
| Republic of Panama | 5.200% | 1/30/20 | 758 | 839 |
| 1 Republic of Panama | 4.000% | 9/22/24 | 200 | 203 |
| Republic of Panama | 7.125% | 1/29/26 | 100 | 126 |
| Republic of Panama | 8.875% | 9/30/27 | 425 | 610 |
| Republic of Panama | 9.375% | 4/1/29 | 225 | 335 |
| 1 Republic of Panama | 6.700% | 1/26/36 | 1,130 | 1,415 |
| 1 Republic of Panama | 4.300% | 4/29/53 | 200 | 179 |
| Total Panama (Cost $3,598) | | | | 3,707 |
| Paraguay (0.1%) | | | | |
| Republic of Paraguay | 4.625% | 1/25/23 | 200 | 205 |
| Republic of Paraguay | 6.100% | 8/11/44 | 300 | 322 |
| Total Paraguay (Cost $523) | | | | 527 |
| Peru (1.3%) | | | | |
| Sovereign Bonds (U.S. Dollar-Denominated) (1.3%) | | | | |
| Corp Financiera de Desarrollo SA | 4.750% | 2/8/22 | 200 | 209 |
| Fondo MIVIVIENDA SA | 3.500% | 1/31/23 | 100 | 95 |
| Republic of Peru | 7.125% | 3/30/19 | 471 | 564 |
| Republic of Peru | 7.350% | 7/21/25 | 742 | 981 |
| Republic of Peru | 8.750% | 11/21/33 | 760 | 1,160 |
| 1 Republic of Peru | 6.550% | 3/14/37 | 1,033 | 1,312 |
| Republic of Peru | 5.625% | 11/18/50 | 200 | 226 |
| Total Peru (Cost $4,432) | | | | 4,547 |
| Philippines (3.0%) | | | | |
| Sovereign Bonds (U.S. Dollar-Denominated) (3.0%) | | | | |
| 8 Power Sector Assets & Liabilities | | | | |
| Management Corp. | 6.875% | 11/2/16 | 100 | 110 |
| 8 Power Sector Assets & Liabilities | | | | |
| Management Corp. | 7.250% | 5/27/19 | 464 | 551 |
| 8 Power Sector Assets & Liabilities | | | | |
| Management Corp. | 7.390% | 12/2/24 | 500 | 647 |
| Republic of Philippines | 9.375% | 1/18/17 | 200 | 235 |
| Republic of Philippines | 9.875% | 1/15/19 | 250 | 325 |
23
Emerging Markets Government Bond Index Fund
| | | | | |
| | | | | Face | Market |
| | | | Maturity | Amount | Value |
| | | Coupon | Date | ($000) | ($000) |
| | Republic of Philippines | 8.375% | 6/17/19 | 405 | 510 |
| | Republic of Philippines | 6.500% | 1/20/20 | 450 | 535 |
| | Republic of Philippines | 4.000% | 1/15/21 | 570 | 611 |
| | Republic of Philippines | 4.200% | 1/21/24 | 400 | 430 |
| | Republic of Philippines | 10.625% | 3/16/25 | 584 | 927 |
| | Republic of Philippines | 5.500% | 3/30/26 | 850 | 994 |
| | Republic of Philippines | 9.500% | 2/2/30 | 625 | 998 |
| | Republic of Philippines | 7.750% | 1/14/31 | 1,118 | 1,587 |
| | Republic of Philippines | 6.375% | 1/15/32 | 500 | 640 |
| | Republic of Philippines | 6.375% | 10/23/34 | 600 | 788 |
| | Republic of Philippines | 5.000% | 1/13/37 | 600 | 689 |
| Total Philippines (Cost $10,245) | | | | 10,577 |
| Poland (1.5%) | | | | |
| Sovereign Bonds (U.S. Dollar-Denominated) (1.5%) | | | | |
| | Republic of Poland | 6.375% | 7/15/19 | 1,431 | 1,699 |
| | Republic of Poland | 5.125% | 4/21/21 | 461 | 521 |
| | Republic of Poland | 5.000% | 3/23/22 | 1,268 | 1,423 |
| | Republic of Poland | 3.000% | 3/17/23 | 700 | 694 |
| | Republic of Poland | 4.000% | 1/22/24 | 830 | 874 |
| Total Poland (Cost $5,062) | | | | 5,211 |
| Qatar (3.8%) | | | | |
| Sovereign Bonds (U.S. Dollar-Denominated) (3.8%) | | | | |
| 1,2 | Nakilat Inc. | 6.067% | 12/31/33 | 400 | 455 |
| 2 | Ooredoo International Finance Ltd. | 3.375% | 10/14/16 | 505 | 523 |
| 2 | Ooredoo International Finance Ltd. | 7.875% | 6/10/19 | 400 | 493 |
| 2 | Ooredoo International Finance Ltd. | 4.750% | 2/16/21 | 500 | 543 |
| 2 | Ooredoo International Finance Ltd. | 3.250% | 2/21/23 | 150 | 146 |
| 2 | Ooredoo International Finance Ltd. | 5.000% | 10/19/25 | 200 | 217 |
| 2 | Ooredoo International Finance Ltd. | 3.875% | 1/31/28 | 650 | 627 |
| | Ooredoo Tamweel Ltd. | 3.039% | 12/3/18 | 225 | 231 |
| 2,9 | Qatari Diar Finance QSC | 5.000% | 7/21/20 | 825 | 925 |
| | QNB Finance Ltd. | 3.125% | 11/16/15 | 400 | 408 |
| | QNB Finance Ltd. | 3.375% | 2/22/17 | 500 | 521 |
| | QNB Finance Ltd. | 2.125% | 2/14/18 | 200 | 200 |
| | QNB Finance Ltd. | 2.750% | 10/31/18 | 400 | 405 |
| | QNB Finance Ltd. | 2.875% | 4/29/20 | 400 | 400 |
| 1,2 | Ras Laffan Liquefied Natural Gas Co. Ltd. II | 5.298% | 9/30/20 | 310 | 336 |
| 2 | Ras Laffan Liquefied Natural Gas Co. Ltd. III | 6.750% | 9/30/19 | 250 | 297 |
| 1,2 | Ras Laffan Liquefied Natural Gas Co. Ltd. III | 5.838% | 9/30/27 | 270 | 306 |
| 1,2 | Ras Laffan Liquefied Natural Gas Co. Ltd. III | 6.332% | 9/30/27 | 250 | 293 |
| 2 | State of Qatar | 3.125% | 1/20/17 | 775 | 810 |
| 9 | State of Qatar | 2.099% | 1/18/18 | 700 | 710 |
| 2 | State of Qatar | 6.550% | 4/9/19 | 250 | 297 |
| 2 | State of Qatar | 5.250% | 1/20/20 | 757 | 861 |
| | State of Qatar | 5.250% | 1/20/20 | 100 | 114 |
| 2 | State of Qatar | 4.500% | 1/20/22 | 850 | 941 |
| 9 | State of Qatar | 3.241% | 1/18/23 | 375 | 383 |
| 2 | State of Qatar | 9.750% | 6/15/30 | 500 | 810 |
| 2 | State of Qatar | 6.400% | 1/20/40 | 400 | 513 |
| 2 | State of Qatar | 5.750% | 1/20/42 | 400 | 477 |
| Total Qatar (Cost $12,942) | | | | 13,242 |
24
Emerging Markets Government Bond Index Fund
| | | | |
| | | | Face | Market |
| | | Maturity | Amount | Value |
| | Coupon | Date | ($000) | ($000) |
| Romania (0.7%) | | | | |
| Sovereign Bonds (U.S. Dollar-Denominated) (0.7%) | | | | |
| Republic of Romania | 6.750% | 2/7/22 | 1,026 | 1,229 |
| Republic of Romania | 4.375% | 8/22/23 | 830 | 864 |
| 2 Republic of Romania | 4.875% | 1/22/24 | 100 | 107 |
| 2 Republic of Romania | 6.125% | 1/22/44 | 300 | 352 |
| Total Romania (Cost $2,409) | | | | 2,552 |
| Russia (10.0%) | | | | |
| Sovereign Bonds (U.S. Dollar-Denominated) (10.0%) | | | |
| AK Transneft OJSC Via TransCapitalInvest Ltd. | 8.700% | 8/7/18 | 320 | 358 |
| Gazprom Neft OAO Via GPN Capital SA | 4.376% | 9/19/22 | 600 | 531 |
| 2 Gazprom Neft OAO Via GPN Capital SA | 6.000% | 11/27/23 | 200 | 194 |
| Gazprom Neft OAO Via GPN Capital SA | 6.000% | 11/27/23 | 450 | 434 |
| Gazprom OAO Via Gaz Capital SA | 5.092% | 11/29/15 | 200 | 203 |
| Gazprom OAO Via Gaz Capital SA | 4.950% | 5/23/16 | 500 | 507 |
| Gazprom OAO Via Gaz Capital SA | 6.212% | 11/22/16 | 325 | 337 |
| Gazprom OAO Via Gaz Capital SA | 8.146% | 4/11/18 | 500 | 549 |
| Gazprom OAO Via Gaz Capital SA | 9.250% | 4/23/19 | 1,050 | 1,213 |
| Gazprom OAO Via Gaz Capital SA | 3.850% | 2/6/20 | 378 | 352 |
| Gazprom OAO Via Gaz Capital SA | 5.999% | 1/23/21 | 200 | 202 |
| Gazprom OAO Via Gaz Capital SA | 6.510% | 3/7/22 | 325 | 337 |
| Gazprom OAO Via Gaz Capital SA | 4.950% | 7/19/22 | 350 | 334 |
| Gazprom OAO Via Gaz Capital SA | 4.950% | 2/6/28 | 450 | 400 |
| Gazprom OAO Via Gaz Capital SA | 8.625% | 4/28/34 | 275 | 323 |
| Gazprom OAO Via Gaz Capital SA | 7.288% | 8/16/37 | 450 | 481 |
| Gazprombank OJSC Via GPB Eurobond | | | | |
| Finance plc | 5.625% | 5/17/17 | 400 | 398 |
| Gazprombank OJSC Via GPB Eurobond | | | | |
| Finance plc | 7.250% | 5/3/19 | 200 | 201 |
| Gazprombank OJSC Via GPB | | | | |
| Eurobond Finance plc | 4.960% | 9/5/19 | 200 | 188 |
| Rosneft Finance SA | 7.500% | 7/18/16 | 250 | 260 |
| Rosneft Finance SA | 6.625% | 3/20/17 | 100 | 103 |
| 2 Rosneft Finance SA | 7.875% | 3/13/18 | 100 | 107 |
| Rosneft Finance SA | 7.875% | 3/13/18 | 400 | 426 |
| Rosneft Finance SA | 7.250% | 2/2/20 | 200 | 210 |
| Rosneft Oil Co. via Rosneft International | | | | |
| Finance Ltd. | 3.149% | 3/6/17 | 400 | 382 |
| Rosneft Oil Co. via Rosneft International | | | | |
| Finance Ltd. | 4.199% | 3/6/22 | 777 | 674 |
| Russian Agricultural Bank OJSC Via RSHB | | | | |
| Capital SA | 6.299% | 5/15/17 | 200 | 201 |
| Russian Agricultural Bank OJSC Via RSHB | | | | |
| Capital SA | 5.298% | 12/27/17 | 318 | 309 |
| Russian Agricultural Bank OJSC Via RSHB | | | | |
| Capital SA | 7.750% | 5/29/18 | 400 | 416 |
| 2 Russian Agricultural Bank OJSC Via RSHB | | | | |
| Capital SA | 5.100% | 7/25/18 | 100 | 96 |
| Russian Agricultural Bank OJSC Via RSHB | | | | |
| Capital SA | 5.100% | 7/25/18 | 400 | 383 |
| 1 Russian Agricultural Bank OJSC Via RSHB | | | | |
| Capital SA | 6.000% | 6/3/21 | 200 | 185 |
| Russian Federation | 3.250% | 4/4/17 | 200 | 200 |
| Russian Federation | 11.000% | 7/24/18 | 825 | 1,025 |
25
Emerging Markets Government Bond Index Fund
| | | | |
| | | | Face | Market |
| | | Maturity | Amount | Value |
| | Coupon | Date | ($000) | ($000) |
| 2 Russian Federation | 3.500% | 1/16/19 | 300 | 294 |
| Russian Federation | 3.500% | 1/16/19 | 400 | 393 |
| Russian Federation | 5.000% | 4/29/20 | 1,300 | 1,342 |
| 2 Russian Federation | 4.500% | 4/4/22 | 500 | 497 |
| Russian Federation | 4.500% | 4/4/22 | 800 | 791 |
| 2 Russian Federation | 4.875% | 9/16/23 | 200 | 200 |
| Russian Federation | 4.875% | 9/16/23 | 600 | 600 |
| Russian Federation | 12.750% | 6/24/28 | 775 | 1,275 |
| 1 Russian Federation | 7.500% | 3/31/30 | 5,637 | 6,404 |
| Russian Federation | 5.625% | 4/4/42 | 800 | 806 |
| Russian Federation | 5.875% | 9/16/43 | 600 | 622 |
| Russian Railways via RZD Capital plc | 5.739% | 4/3/17 | 1,036 | 1,062 |
| Russian Railways via RZD Capital plc | 5.700% | 4/5/22 | 600 | 595 |
| Sberbank of Russia Via SB Capital SA | 4.950% | 2/7/17 | 500 | 501 |
| Sberbank of Russia Via SB Capital SA | 5.400% | 3/24/17 | 550 | 557 |
| Sberbank of Russia Via SB Capital SA | 5.180% | 6/28/19 | 750 | 735 |
| Sberbank of Russia Via SB Capital SA | 5.717% | 6/16/21 | 200 | 195 |
| Sberbank of Russia Via SB Capital SA | 6.125% | 2/7/22 | 200 | 199 |
| Sberbank of Russia Via SB Capital SA | 5.125% | 10/29/22 | 524 | 468 |
| 2 Sberbank of Russia Via SB Capital SA | 5.250% | 5/23/23 | 350 | 309 |
| SCF Capital Ltd. | 5.375% | 10/27/17 | 200 | 190 |
| Vnesheconombank Via VEB Finance plc | 5.375% | 2/13/17 | 300 | 301 |
| Vnesheconombank Via VEB Finance plc | 6.902% | 7/9/20 | 650 | 661 |
| Vnesheconombank Via VEB Finance plc | 6.025% | 7/5/22 | 425 | 411 |
| 2 Vnesheconombank Via VEB Finance plc | 5.942% | 11/21/23 | 200 | 188 |
| Vnesheconombank Via VEB Finance plc | 6.800% | 11/22/25 | 650 | 641 |
| VTB Bank OJSC Via VTB Capital SA | 6.000% | 4/12/17 | 525 | 526 |
| VTB Bank OJSC Via VTB Capital SA | 6.315% | 2/22/18 | 200 | 202 |
| VTB Bank OJSC Via VTB Capital SA | 6.875% | 5/29/18 | 575 | 587 |
| VTB Bank OJSC Via VTB Capital SA | 6.551% | 10/13/20 | 450 | 452 |
| VTB Bank OJSC Via VTB Capital SA | 6.950% | 10/17/22 | 575 | 546 |
| VTB Bank OJSC Via VTB Capital SA | 6.250% | 6/30/35 | 100 | 101 |
| Total Russia (Cost $36,226) | | | | 35,170 |
| Saudi Arabia (0.9%) | | | | |
| Sovereign Bonds (U.S. Dollar-Denominated) (0.9%) | | | | |
| SABIC Capital I BV | 3.000% | 11/2/15 | 200 | 204 |
| SABIC Capital II BV | 2.625% | 10/3/18 | 400 | 404 |
| Saudi Electricity Global Sukuk Co. | 4.211% | 4/3/22 | 400 | 425 |
| Saudi Electricity Global Sukuk Co. 2 | 3.473% | 4/8/23 | 550 | 555 |
| Saudi Electricity Global Sukuk Co. 2 | 5.060% | 4/8/43 | 400 | 406 |
| 2 Saudi Electricity Global Sukuk Co. 3 | 4.000% | 4/8/24 | 650 | 681 |
| 2 Saudi Electricity Global Sukuk Co. 3 | 5.500% | 4/8/44 | 300 | 326 |
| Total Saudi Arabia (Cost $2,912) | | | | 3,001 |
| Senegal (0.1%) | | | | |
| Sovereign Bonds (U.S. Dollar-Denominated) (0.1%) | | | | |
| Republic of Senegal | 8.750% | 5/13/21 | 200 | 229 |
| Republic of Senegal | 6.250% | 7/30/24 | 200 | 198 |
| Total Senegal (Cost $420) | | | | 427 |
26
Emerging Markets Government Bond Index Fund
| | | | | |
| | | | | Face | Market |
| | | | Maturity | Amount | Value• |
| | | Coupon | Date | ($000) | ($000) |
| Serbia, Republic Of (0.7%) | | | | |
| Sovereign Bonds (U.S. Dollar-Denominated) (0.7%) | | | | |
| | Republic of Serbia | 5.250% | 11/21/17 | 400 | 415 |
| | Republic of Serbia | 5.875% | 12/3/18 | 400 | 425 |
| 2 | Republic of Serbia | 5.875% | 12/3/18 | 200 | 212 |
| | Republic of Serbia | 4.875% | 2/25/20 | 800 | 815 |
| | Republic of Serbia | 7.250% | 9/28/21 | 400 | 458 |
| Total Serbia, Republic Of (Cost $2,259) | | | | 2,325 |
| South Africa (1.6%) | | | | |
| Sovereign Bonds (U.S. Dollar-Denominated) (1.6%) | | | | |
| | Eskom Holdings SOC Ltd. | 5.750% | 1/26/21 | 600 | 618 |
| | Eskom Holdings SOC Ltd. | 6.750% | 8/6/23 | 200 | 215 |
| | Republic of South Africa | 6.875% | 5/27/19 | 575 | 661 |
| | Republic of South Africa | 5.500% | 3/9/20 | 945 | 1,036 |
| | Republic of South Africa | 5.875% | 5/30/22 | 223 | 252 |
| | Republic of South Africa | 4.665% | 1/17/24 | 950 | 988 |
| | Republic of South Africa | 5.875% | 9/16/25 | 650 | 734 |
| | Republic of South Africa | 6.250% | 3/8/41 | 125 | 147 |
| | Republic of South Africa | 5.375% | 7/24/44 | 300 | 311 |
| | Transnet SOC Ltd. | 4.500% | 2/10/16 | 200 | 207 |
| 2 | Transnet SOC Ltd. | 4.000% | 7/26/22 | 600 | 574 |
| Total South Africa (Cost $5,567) | | | | 5,743 |
| Sri Lanka (0.8%) | | | | |
| Sovereign Bonds (U.S. Dollar-Denominated) (0.8%) | | | | |
| | Bank of Ceylon | 6.875% | 5/3/17 | 250 | 265 |
| | Bank of Ceylon | 5.325% | 4/16/18 | 200 | 203 |
| 2 | Democratic Socialist Republic of Sri Lanka | 6.000% | 1/14/19 | 200 | 212 |
| 2 | Democratic Socialist Republic of Sri Lanka | 5.125% | 4/11/19 | 250 | 257 |
| | Democratic Socialist Republic of Sri Lanka | 6.250% | 10/4/20 | 232 | 247 |
| | Democratic Socialist Republic of Sri Lanka | 6.250% | 7/27/21 | 800 | 853 |
| | Democratic Socialist Republic of Sri Lanka | 5.875% | 7/25/22 | 400 | 416 |
| | National Savings Bank | 8.875% | 9/18/18 | 200 | 227 |
| Total Sri Lanka (Cost $2,573) | | | | 2,680 |
| Thailand (0.2%) | | | | |
| Sovereign Bonds (U.S. Dollar-Denominated) (0.2%) | | | | |
| 1 | Krung Thai Bank PCL | 5.200% | 12/26/24 | 250 | 259 |
| | PTT PCL | 4.500% | 10/25/42 | 200 | 179 |
| | PTT Public Co. Ltd. | 3.375% | 10/25/22 | 225 | 219 |
| Total Thailand (Cost $648) | | | | 657 |
| Trinidad And Tobago (0.2%) | | | | |
| Sovereign Bonds (U.S. Dollar-Denominated) (0.2%) | | | | |
| 2 | Petroleum Co. of Trinidad & Tobago Ltd. | 9.750% | 8/14/19 | 300 | 378 |
| 1 | Petroleum Co. of Trinidad & Tobago Ltd. | 6.000% | 5/8/22 | 67 | 71 |
| 2 | Republic of Trinidad & Tobago | 4.375% | 1/16/24 | 200 | 216 |
| Total Trinidad And Tobago (Cost $643) | | | | 665 |
27
Emerging Markets Government Bond Index Fund
| | | | | |
| | | | | Face | Market |
| | | | Maturity | Amount | Value |
| | | Coupon | Date | ($000) | ($000) |
| Turkey (5.7%) | | | | |
| Sovereign Bonds (U.S. Dollar-Denominated) (5.7%) | | | | |
| | Export Credit Bank of Turkey | 5.875% | 4/24/19 | 200 | 212 |
| 2 | Export Credit Bank of Turkey | 5.000% | 9/23/21 | 400 | 403 |
| | Hazine Mustesarligi Varlik Kiralama AS | 4.557% | 10/10/18 | 250 | 263 |
| | Republic of Turkey | 7.000% | 9/26/16 | 500 | 547 |
| | Republic of Turkey | 7.500% | 7/14/17 | 1,241 | 1,397 |
| 10 | Republic of Turkey | 2.803% | 3/26/18 | 250 | 249 |
| | Republic of Turkey | 6.750% | 4/3/18 | 787 | 883 |
| 2 | Republic of Turkey | 4.557% | 10/10/18 | 150 | 157 |
| | Republic of Turkey | 7.000% | 3/11/19 | 616 | 706 |
| | Republic of Turkey | 7.500% | 11/7/19 | 550 | 649 |
| | Republic of Turkey | 7.000% | 6/5/20 | 630 | 734 |
| | Republic of Turkey | 5.625% | 3/30/21 | 901 | 988 |
| | Republic of Turkey | 5.125% | 3/25/22 | 825 | 880 |
| | Republic of Turkey | 6.250% | 9/26/22 | 504 | 574 |
| | Republic of Turkey | 3.250% | 3/23/23 | 451 | 421 |
| | Republic of Turkey | 5.750% | 3/22/24 | 1,350 | 1,492 |
| | Republic of Turkey | 7.375% | 2/5/25 | 1,150 | 1,424 |
| | Republic of Turkey | 11.875% | 1/15/30 | 275 | 481 |
| | Republic of Turkey | 8.000% | 2/14/34 | 400 | 541 |
| | Republic of Turkey | 6.875% | 3/17/36 | 1,093 | 1,330 |
| | Republic of Turkey | 7.250% | 3/5/38 | 150 | 191 |
| | Republic of Turkey | 6.750% | 5/30/40 | 790 | 956 |
| | Republic of Turkey | 6.000% | 1/14/41 | 1,200 | 1,338 |
| | Republic of Turkey | 4.875% | 4/16/43 | 666 | 648 |
| | Republic of Turkey | 6.625% | 2/17/45 | 550 | 664 |
| 2 | TC Ziraat Bankasi AS | 4.250% | 7/3/19 | 200 | 197 |
| 2 | Turkiye Halk Bankasi AS | 4.750% | 6/4/19 | 250 | 249 |
| | Turkiye Halk Bankasi AS | 3.875% | 2/5/20 | 400 | 382 |
| | Turkiye Vakiflar Bankasi Tao | 5.750% | 4/24/17 | 200 | 210 |
| | Turkiye Vakiflar Bankasi Tao | 3.750% | 4/15/18 | 200 | 196 |
| | Turkiye Vakiflar Bankasi Tao | 6.000% | 11/1/22 | 400 | 390 |
| Total Turkey (Cost $18,975) | | | | 19,752 |
| Ukraine (1.4%) | | | | |
| Sovereign Bonds (U.S. Dollar-Denominated) (1.4%) | | | | |
| 11 | Financing of Infrastructural Projects | | | | |
| | State Enterprise | 8.375% | 11/3/17 | 100 | 83 |
| 11 | Financing of Infrastructural Projects | | | | |
| | State Enterprise | 9.000% | 12/7/17 | 200 | 168 |
| 11 | Financing of Infrastructural Projects | | | | |
| | State Enterprise | 7.400% | 4/20/18 | 200 | 165 |
| | Oschadbank Via SSB #1 plc | 8.250% | 3/10/16 | 200 | 162 |
| | Oschadbank Via SSB #1 plc | 8.875% | 3/20/18 | 200 | 158 |
| | Ukraine | 6.250% | 6/17/16 | 400 | 356 |
| | Ukraine | 6.580% | 11/21/16 | 923 | 812 |
| | Ukraine | 9.250% | 7/24/17 | 1,050 | 954 |
| | Ukraine | 6.750% | 11/14/17 | 325 | 284 |
| | Ukraine | 7.750% | 9/23/20 | 498 | 437 |
| | Ukraine | 7.950% | 2/23/21 | 250 | 220 |
| | Ukraine | 7.800% | 11/28/22 | 800 | 692 |
28
Emerging Markets Government Bond Index Fund
| | | | | |
| | | | | Face | Market |
| | | | Maturity | Amount | Value |
| | | Coupon | Date | ($000) | ($000) |
| | Ukraine | 7.500% | 4/17/23 | 200 | 170 |
| 2 | Ukraine Railways via Shortline plc | 9.500% | 5/21/18 | 200 | 144 |
| | Ukreximbank Via Biz Finance plc | 8.750% | 1/22/18 | 200 | 158 |
| Total Ukraine (Cost $5,407) | | | | 4,963 |
| United Arab Emirates (5.1%) | | | | |
| Sovereign Bonds (U.S. Dollar-Denominated) (5.0%) | | | | |
| 2 | Abu Dhabi National Energy Co. | 5.875% | 10/27/16 | 585 | 638 |
| 2 | Abu Dhabi National Energy Co. | 4.125% | 3/13/17 | 400 | 424 |
| 2 | Abu Dhabi National Energy Co. | 2.500% | 1/12/18 | 400 | 405 |
| 2 | Abu Dhabi National Energy Co. | 6.250% | 9/16/19 | 275 | 323 |
| 2 | Abu Dhabi National Energy Co. | 5.875% | 12/13/21 | 200 | 234 |
| 2 | Abu Dhabi National Energy Co. | 3.625% | 1/12/23 | 600 | 603 |
| | Abu Dhabi National Energy Co. | 3.875% | 5/6/24 | 200 | 204 |
| 2 | Abu Dhabi National Energy Co. | 6.500% | 10/27/36 | 425 | 535 |
| 3 | ADCB Finance Cayman Ltd. | 1.531% | 1/9/17 | 200 | 202 |
| | ADCB Finance Cayman Ltd. | 2.500% | 3/6/18 | 200 | 202 |
| | ADCB Finance Cayman Ltd. | 3.000% | 3/4/19 | 400 | 408 |
| | ADCB Finance Cayman Ltd. | 4.500% | 3/6/23 | 425 | 432 |
| | ADCB Islamic Finance Cayman Ltd. | 4.071% | 11/22/16 | 200 | 210 |
| | AHB Sukuk Co. | 3.267% | 10/8/18 | 200 | 207 |
| | DEWA Sukuk 2013 Ltd. | 3.000% | 3/5/18 | 650 | 670 |
| 1,2 | Dolphin Energy Ltd. | 5.888% | 6/15/19 | 62 | 68 |
| 2 | Dolphin Energy Ltd. | 5.500% | 12/15/21 | 420 | 479 |
| 2 | DP World Ltd. | 6.850% | 7/2/37 | 650 | 748 |
| 2 | DP World Sukuk Ltd. | 6.250% | 7/2/17 | 670 | 734 |
| | Dubai DOF Sukuk Ltd. | 6.450% | 5/2/22 | 200 | 238 |
| 2 | Dubai Electricity & Water Authority | 6.375% | 10/21/16 | 100 | 110 |
| 2 | Dubai Electricity & Water Authority | 7.375% | 10/21/20 | 450 | 552 |
| 2 | Emirate of Abu Dhabi | 6.750% | 4/8/19 | 525 | 630 |
| | Emirate of Dubai | 4.900% | 5/2/17 | 200 | 218 |
| | Emirate of Dubai | 7.750% | 10/5/20 | 400 | 500 |
| | Emirate of Dubai | 3.875% | 1/30/23 | 200 | 200 |
| | Emirate of Dubai | 5.250% | 1/30/43 | 200 | 192 |
| | Emirates Airline | 5.125% | 6/8/16 | 300 | 316 |
| 1,2 | Emirates Airline | 4.500% | 2/6/25 | 360 | 359 |
| | Emirates NBD PJSC | 4.625% | 3/28/17 | 425 | 448 |
| 1 | Emirates NBD PJSC | 4.875% | 3/28/23 | 250 | 258 |
| | Emirates Telecommunications Corp. | 3.500% | 6/18/24 | 200 | 204 |
| 2 | IPIC GMTN Ltd. | 3.125% | 11/15/15 | 100 | 102 |
| | IPIC GMTN Ltd. | 1.750% | 11/30/15 | 450 | 454 |
| 2 | IPIC GMTN Ltd. | 3.750% | 3/1/17 | 945 | 996 |
| 2 | IPIC GMTN Ltd. | 5.000% | 11/15/20 | 500 | 562 |
| 2 | IPIC GMTN Ltd. | 5.500% | 3/1/22 | 510 | 594 |
| 2 | IPIC GMTN Ltd. | 6.875% | 11/1/41 | 200 | 269 |
| | Jafz Sukuk Ltd. | 7.000% | 6/19/19 | 200 | 230 |
| 2 | MDC-GMTN B.V. | 3.750% | 4/20/16 | 200 | 208 |
| 2 | MDC-GMTN B.V. | 7.625% | 5/6/19 | 200 | 248 |
| 2 | MDC-GMTN B.V. | 5.500% | 4/20/21 | 200 | 232 |
| 2 | MDC-GMTN B.V. | 3.250% | 4/28/22 | 200 | 204 |
| | National Bank of Abu Dhabi PJSC | 3.250% | 3/27/17 | 200 | 208 |
| | National Bank of Abu Dhabi PJSC | 3.000% | 8/13/19 | 200 | 205 |
| | RAK Capital | 3.297% | 10/21/18 | 200 | 208 |
29
Emerging Markets Government Bond Index Fund
| | | | | |
| | | | | Face | Market |
| | | | Maturity | Amount | Value |
| | | Coupon | Date | ($000) | ($000) |
| 1 | Ruwais Power Co. PJSC | 6.000% | 8/31/36 | 400 | 459 |
| | Union National Bank PJSC | 3.875% | 11/10/16 | 200 | 210 |
| 1,2 | Waha Aerospace BV | 3.925% | 7/28/20 | 288 | 304 |
| Total United Arab Emirates (Cost $17,231) | | | | 17,644 |
| United States (0.0%) | | | | |
| U.S. Government and Agency Obligations (0.0%) | | | | |
| | United States Treasury Note/Bond | 0.250% | 9/15/15 | 20 | 20 |
| | United States Treasury Note/Bond | 5.500% | 8/15/28 | 30 | 40 |
| | United States Treasury Note/Bond | 3.750% | 8/15/41 | 5 | 6 |
| Total United States (Cost $64) | | | | 66 |
| Uruguay (0.8%) | | | | |
| Sovereign Bonds (U.S. Dollar-Denominated) (0.8%) | | | | |
| 1 | Oriental Republic of Uruguay | 8.000% | 11/18/22 | 125 | 163 |
| 1 | Oriental Republic of Uruguay | 4.500% | 8/14/24 | 421 | 440 |
| | Oriental Republic of Uruguay | 7.875% | 1/15/33 | 250 | 342 |
| 1 | Oriental Republic of Uruguay | 7.625% | 3/21/36 | 502 | 677 |
| 1 | Oriental Republic of Uruguay | 4.125% | 11/20/45 | 350 | 305 |
| 1 | Oriental Republic of Uruguay | 5.100% | 6/18/50 | 800 | 790 |
| Total Uruguay (Cost $2,633) | | | | 2,717 |
| Venezuela (4.1%) | | | | |
| Sovereign Bonds (U.S. Dollar-Denominated) (4.1%) | | | | |
| | Bolivarian Republic of Venezuela | 5.750% | 2/26/16 | 490 | 416 |
| | Bolivarian Republic of Venezuela | 13.625% | 8/15/18 | 300 | 257 |
| | Bolivarian Republic of Venezuela | 7.000% | 12/1/18 | 520 | 343 |
| | Bolivarian Republic of Venezuela | 7.750% | 10/13/19 | 1,000 | 647 |
| | Bolivarian Republic of Venezuela | 6.000% | 12/9/20 | 400 | 232 |
| 1 | Bolivarian Republic of Venezuela | 12.750% | 8/23/22 | 1,145 | 901 |
| | Bolivarian Republic of Venezuela | 9.000% | 5/7/23 | 701 | 447 |
| | Bolivarian Republic of Venezuela | 8.250% | 10/13/24 | 434 | 265 |
| | Bolivarian Republic of Venezuela | 7.650% | 4/21/25 | 450 | 267 |
| | Bolivarian Republic of Venezuela | 11.750% | 10/21/26 | 1,175 | 858 |
| | Bolivarian Republic of Venezuela | 9.250% | 9/15/27 | 1,497 | 985 |
| | Bolivarian Republic of Venezuela | 9.250% | 5/7/28 | 540 | 338 |
| 1 | Bolivarian Republic of Venezuela | 11.950% | 8/5/31 | 1,916 | 1,388 |
| | Bolivarian Republic of Venezuela | 9.375% | 1/13/34 | 450 | 287 |
| | Bolivarian Republic of Venezuela | 7.000% | 3/31/38 | 550 | 314 |
| | CA La Electricidad de Caracas | 8.500% | 4/10/18 | 200 | 123 |
| 2 | CITGO Petroleum Corp. | 6.250% | 8/15/22 | 200 | 203 |
| | Petroleos de Venezuela SA | 5.250% | 4/12/17 | 950 | 627 |
| 1 | Petroleos de Venezuela SA | 8.500% | 11/2/17 | 2,028 | 1,543 |
| 1 | Petroleos de Venezuela SA | 9.000% | 11/17/21 | 938 | 595 |
| 1 | Petroleos de Venezuela SA | 12.750% | 2/17/22 | 905 | 718 |
| 1 | Petroleos de Venezuela SA | 6.000% | 11/15/26 | 2,326 | 1,137 |
| | Petroleos de Venezuela SA | 5.375% | 4/12/27 | 1,081 | 513 |
| 1 | Petroleos de Venezuela SA | 9.750% | 5/17/35 | 1,165 | 711 |
| | Petroleos de Venezuela SA | 5.500% | 4/12/37 | 200 | 94 |
| Total Venezuela (Cost $17,475) | | | | 14,209 |
30
Emerging Markets Government Bond Index Fund
| | | | |
| | | | Face | Market |
| | | Maturity | Amount | Value |
| | Coupon | Date | ($000) | ($000) |
| Vietnam (0.2%) | | | | |
| Sovereign Bonds (U.S. Dollar-Denominated) (0.2%) | | | | |
| Socialist Republic of Vietnam | 6.875% | 1/15/16 | 100 | 105 |
| Socialist Republic of Vietnam | 6.750% | 1/29/20 | 519 | 584 |
| Total Vietnam (Cost $673) | | | | 689 |
| Zambia (0.2%) | | | | |
| Sovereign Bonds (U.S. Dollar-Denominated) (0.2%) | | | | |
| Republic of Zambia | 5.375% | 9/20/22 | 200 | 191 |
| 2 Republic of Zambia | 8.500% | 4/14/24 | 450 | 514 |
| Total Zambia (Cost $662) | | | | 705 |
| |
| | | | Shares | |
| Temporary Cash Investments (1.1%) | | | | |
| Money Market Fund (1.1%) | | | | |
| 12 Vanguard Market Liquidity Fund (Cost $3,738) | 0.114% | | 3,738,000 | 3,738 |
| Total Investments (99.4%) (Cost $342,236) | | | | 345,946 |
| Other Assets and Liabilities (0.6%) | | | | |
| Other Assets | | | | 6,917 |
| Liabilities | | | | (4,769) |
| | | | | 2,148 |
| Net Assets (100%) | | | | 348,094 |
31
Emerging Markets Government Bond Index Fund
| |
| At October 31, 2014, net assets consisted of: | |
| | Amount |
| | ($000) |
| Paid-in Capital | 344,052 |
| Undistributed Net Investment Income | 716 |
| Accumulated Net Realized Losses | (384) |
| Unrealized Appreciation (Depreciation) | 3,710 |
| Net Assets | 348,094 |
| |
| Investor Shares—Net Assets | |
| Applicable to 730,308 outstanding $.001 par value shares of | |
| beneficial interest (unlimited authorization) | 7,268 |
| Net Asset Value Per Share—Investor Shares | $9.95 |
| |
| Admiral Shares—Net Assets | |
| Applicable to 5,946,187 outstanding $.001 par value shares of | |
| beneficial interest (unlimited authorization) | 118,349 |
| Net Asset Value Per Share—Admiral Shares | $19.90 |
| |
| ETF Shares—Net Assets | |
| Applicable to 2,801,857 outstanding $.001 par value shares of | |
| beneficial interest (unlimited authorization) | 222,477 |
| Net Asset Value Per Share—ETF Shares | $79.40 |
See Note A in Notes to Financial Statements.
1 The average or expected maturity is shorter than the final maturity shown because of the possibility of interim principal payments and prepayments or the possibility of the issue being called.
2 Security exempt from registration under Rule 144A of the Securities Act of 1933. Such securities may be sold in transactions exempt from registration, normally to qualified institutional buyers. At October 31, 2014, the aggregate value of these securities was $58,185,000, representing 16.7% of net assets.
3 Adjustable-rate security.
4 Guaranteed by the Republic of Hungary.
5 Guaranteed by the Federation of Malaysia.
6 Guaranteed by the Government of Mongolia.
7 Guaranteed by the Republic of Mozambique.
8 Guaranteed by the Republic of the Philippines.
9 Guaranteed by the State of Qatar.
10 Guaranteed by the Republic of Turkey.
11 Guaranteed by the Government of the Ukraine.
12 Affiliated money market fund available only to Vanguard funds and certain trusts and accounts managed by Vanguard. Rate shown is the 7-day yield.
See accompanying Notes, which are an integral part of the Financial Statements.
32
Emerging Markets Government Bond Index Fund
Statement of Operations
| |
| | Year Ended |
| | October 31, 2014 |
| | ($000) |
| Investment Income | |
| Income | |
| Interest1 | 12,318 |
| Total Income | 12,318 |
| Expenses | |
| The Vanguard Group—Note B | |
| Investment Advisory Services | 6 |
| Management and Administrative—Investor Shares | 18 |
| Management and Administrative—Admiral Shares | 274 |
| Management and Administrative—ETF Shares | 453 |
| Marketing and Distribution—Investor Shares | — |
| Marketing and Distribution—Admiral Shares | 13 |
| Marketing and Distribution—ETF Shares | 31 |
| Custodian Fees | 23 |
| Auditing Fees | 41 |
| Shareholders’ Reports—Investor Shares | 7 |
| Shareholders’ Reports—Admiral Shares | — |
| Shareholders’ Reports—ETF Shares | 7 |
| Total Expenses | 873 |
| Net Investment Income | 11,445 |
| Realized Net Gain (Loss) | |
| Investment Securities Sold | 314 |
| Futures Contracts | (32) |
| Realized Net Gain (Loss) | 282 |
| Change in Unrealized Appreciation (Depreciation) of Investment Securities | 6,002 |
| Net Increase (Decrease) in Net Assets Resulting from Operations | 17,729 |
| 1 Interest income from an affiliated company of the fund was $3,000. |
See accompanying Notes, which are an integral part of the Financial Statements.
33
Emerging Markets Government Bond Index Fund
Statement of Changes in Net Assets
| | |
| | Year Ended | May 14, 20131 |
| | October 31, | to October 31, |
| | 2014 | 2013 |
| | ($000) | ($000) |
| Increase (Decrease) in Net Assets | | |
| Operations | | |
| Net Investment Income | 11,445 | 1,937 |
| Realized Net Gain (Loss) | 282 | (189) |
| Change in Unrealized Appreciation (Depreciation) | 6,002 | (2,292) |
| Net Increase (Decrease) in Net Assets Resulting from Operations | 17,729 | (544) |
| Distributions | | |
| Net Investment Income | | |
| Investor Shares | (251) | (50) |
| Admiral Shares | (4,147) | (685) |
| ETF Shares | (6,640) | (893) |
| Realized Capital Gain | | |
| Investor Shares | — | — |
| Admiral Shares | — | — |
| ETF Shares | — | — |
| Total Distributions | (11,038) | (1,628) |
| Capital Share Transactions | | |
| Investor Shares | 2,919 | 4,229 |
| Admiral Shares | 61,205 | 55,480 |
| ETF Shares | 132,526 | 87,216 |
| Net Increase (Decrease) from Capital Share Transactions | 196,650 | 146,925 |
| Total Increase (Decrease) | 203,341 | 144,753 |
| Net Assets | | |
| Beginning of Period | 144,753 | — |
| End of Period2 | 348,094 | 144,753 |
1 Commencement of subscription period for the fund.
2 Net Assets—End of Period includes undistributed (overdistributed) net investment income of $716,000 and $309,000. |
|
See accompanying Notes, which are an integral part of the Financial Statements.
34
Emerging Markets Government Bond Index Fund
Financial Highlights
| | |
| Investor Shares | | |
| | Year | May 14, |
| | Ended | 20131 to |
| | Oct. 31, | Oct. 31, |
| For a Share Outstanding Throughout Each Period | 2014 | 2013 |
| Net Asset Value, Beginning of Period | $9.74 | $10.00 |
| Investment Operations | | |
| Net Investment Income | . 417 | .149 |
| Net Realized and Unrealized Gain (Loss) on Investments2 | .213 | (.261) |
| Total from Investment Operations | .630 | (.112) |
| Distributions | | |
| Dividends from Net Investment Income | (.420) | (.148) |
| Distributions from Realized Capital Gains | — | — |
| Total Distributions | (. 420) | (.148) |
| Net Asset Value, End of Period | $9.95 | $9.74 |
| |
| Total Return3 | 6.62% | -1.38% |
| |
| Ratios/Supplemental Data | | |
| Net Assets, End of Period (Millions) | $7 | $4 |
| Ratio of Total Expenses to Average Net Assets | 0.49% | 0.49%4 |
| Ratio of Net Investment Income to Average Net Assets | 4.35% | 3.81%4 |
| Portfolio Turnover Rate 5 | 27% | 38% |
1 Subscription period for the fund was May 14, 2013, to May 30, 2013, during which time all assets were held in money market instruments. Performance measurement began May 31, 2013, at a net asset value of $10.03.
2 Includes increases from purchase fees of $.00 and $.03.
3 Total returns do not include transaction or account service fees that may have applied in the periods shown. Fund prospectuses provide information about any applicable transaction and account service fees.
4 Annualized.
5 Excludes the value of portfolio securities received or delivered as a result of in-kind purchases or redemptions of the fund’s capital shares, including ETF Creation Units. |
|
|
|
|
|
|
|
See accompanying Notes, which are an integral part of the Financial Statements.
35
Emerging Markets Government Bond Index Fund
Financial Highlights
| | |
| Admiral Shares | | |
| | Year | May 14, |
| | Ended | 20131 to |
| | Oct. 31, | Oct. 31, |
| For a Share Outstanding Throughout Each Period | 2014 | 2013 |
| Net Asset Value, Beginning of Period | $19.48 | $20.00 |
| Investment Operations | | |
| Net Investment Income | . 863 | . 309 |
| Net Realized and Unrealized Gain (Loss) on Investments2 | .427 | (.522) |
| Total from Investment Operations | 1.290 | (.213) |
| Distributions | | |
| Dividends from Net Investment Income | (.870) | (.307) |
| Distributions from Realized Capital Gains | — | — |
| Total Distributions | (. 870) | (. 307) |
| Net Asset Value, End of Period | $19.90 | $19.48 |
| |
| Total Return3 | 6.78% | -1.37% |
| |
| Ratios/Supplemental Data | | |
| Net Assets, End of Period (Millions) | $118 | $55 |
| Ratio of Total Expenses to Average Net Assets | 0.34% | 0.34%4 |
| Ratio of Net Investment Income to Average Net Assets | 4.50% | 3.96%4 |
| Portfolio Turnover Rate 5 | 27% | 38% |
1 Subscription period for the fund was May 14, 2013, to May 30, 2013, during which time all assets were held in money market instruments. Performance measurement began May 31, 2013, at a net asset value of $20.07.
2 Includes increases from purchase fees of $.00 and $.06.
3 Total returns do not include transaction or account service fees that may have applied in the periods shown. Fund prospectuses provide information about any applicable transaction and account service fees.
4 Annualized.
5 Excludes the value of portfolio securities received or delivered as a result of in-kind purchases or redemptions of the fund’s capital shares, including ETF Creation Units. |
|
|
|
|
|
|
|
See accompanying Notes, which are an integral part of the Financial Statements.
36
Emerging Markets Government Bond Index Fund
Financial Highlights
| | |
| ETF Shares | | |
| | Year | May 31, |
| | Ended | 20131 to |
| | Oct. 31, | Oct. 31, |
| For a Share Outstanding Throughout Each Period | 2014 | 2013 |
| Net Asset Value, Beginning of Period | $77.71 | $79.52 |
| Investment Operations | | |
| Net Investment Income | 3.429 | 1.217 |
| Net Realized and Unrealized Gain (Loss) on Investments2 | 1.700 | (2.086) |
| Total from Investment Operations | 5.129 | (.869) |
| Distributions | | |
| Dividends from Net Investment Income | (3.439) | (.941) |
| Distributions from Realized Capital Gains | — | — |
| Total Distributions | (3.439) | (.941) |
| Net Asset Value, End of Period | $79.40 | $77.71 |
| |
| Total Return | 6.79% | -1.39% |
| |
| Ratios/Supplemental Data | | |
| Net Assets, End of Period (Millions) | $222 | $85 |
| Ratio of Total Expenses to Average Net Assets | 0.34% | 0.35%3 |
| Ratio of Net Investment Income to Average Net Assets | 4.50% | 3.95%3 |
| Portfolio Turnover Rate 4 | 27% | 38% |
1 Inception.
2 Includes increases from purchase fees of $.01 and $.30.
3 Annualized.
4 Excludes the value of portfolio securities received or delivered as a result of in-kind purchases or redemptions of the fund’s capital shares, including ETF Creation Units. |
|
|
|
|
See accompanying Notes, which are an integral part of the Financial Statements.
37
Emerging Markets Government Bond Index Fund
Notes to Financial Statements
Vanguard Emerging Markets Government Bond Index Fund is registered under the Investment Company Act of 1940 as an open-end investment company, or mutual fund. The fund invests in securities of foreign issuers, which may subject it to investment risks not normally associated with investing in securities of U.S. corporations. The fund offers four classes of shares: Investor Shares, Admiral Shares, Institutional Shares, and ETF Shares. Investor Shares are available to any investor who meets the fund’s minimum purchase requirements. Admiral Shares and Institutional Shares are designed for investors who meet certain administrative, service, and account-size criteria. The fund has not issued any Institutional Shares through October 31, 2014; subsequently, Institutional Shares were issued on November 25, 2014. ETF Shares are listed for trading on Nasdaq; they can be purchased and sold through a broker.
A. The following significant accounting policies conform to generally accepted accounting principles for U.S. investment companies. The fund consistently follows such policies in preparing its financial statements.
1. Security Valuation: Securities are valued as of the close of trading on the New York Stock Exchange (generally 4 p.m., Eastern time) on the valuation date. Bonds, and temporary cash investments acquired over 60 days to maturity, are valued using the latest bid prices or using valuations based on a matrix system (which considers such factors as security prices, yields, maturities, and ratings), both as furnished by independent pricing services. Investments in Vanguard Market Liquidity Fund are valued at that fund’s net asset value. Other temporary cash investments are valued at amortized cost, which approximates market value. Securities for which market quotations are not readily available, or whose values have been affected by events occurring before the fund’s pricing time but after the close of the securities’ primary markets, are valued at their fair values calculated according to procedures adopted by the board of trustees. These procedures include obtaining quotations from an independent pricing service, monitoring news to identify significant market-or security-specific events, and evaluating changes in the values of foreign market proxies (for example, ADRs, futures contracts, or exchange-traded funds), between the time the foreign markets close and the fund’s pricing time. When fair-value pricing is employed, the prices of securities used by a fund to calculate its net asset value may differ from quoted or published prices for the same securities.
2. Futures Contracts: The fund uses futures contracts to invest in fixed income asset classes with greater efficiency and lower cost than is possible through direct investment, to add value when these instruments are attractively priced, or to adjust sensitivity to changes in interest rates. The primary risks associated with the use of futures contracts are imperfect correlation between changes in market values of bonds held by the fund and the prices of futures contracts, and the possibility of an illiquid market. Counterparty risk involving futures is mitigated because a regulated clearinghouse is the counterparty instead of the clearing broker. To further mitigate counterparty risk, the fund trades futures contracts on an exchange, monitors the financial strength of its clearing brokers and clearinghouse, and has entered into clearing agreements with its clearing brokers. The clearinghouse imposes initial margin requirements to secure the fund’s performance and requires daily settlement of variation margin representing changes in the market value of each contract.
Futures contracts are valued at their quoted daily settlement prices. The aggregate settlement values of the contracts are not recorded in the Statement of Net Assets. Fluctuations in the value of the contracts are recorded in the Statement of Net Assets as an asset (liability) and in the Statement of Operations as unrealized appreciation (depreciation) until the contracts are closed, when they are recorded as realized futures gains (losses).
38
Emerging Markets Government Bond Index Fund
During the year ended October 31, 2014, the fund’s average investments in long and short futures contracts each represented 0% of net assets, based on the average of aggregate settlement values at each quarter-end during the period. The fund had no open future contracts at October 31, 2014.
3. Federal Income Taxes: The fund intends to continue to qualify as a regulated investment company and distribute all of its taxable income. Management has analyzed the fund’s tax positions taken for all open federal income tax years (October 31, 2013–2014), and has concluded that no provision for federal income tax is required in the fund’s financial statements.
4. Distributions: Distributions to shareholders are recorded on the ex-dividend date.
5. Credit Facility: The fund and certain other funds managed by The Vanguard Group participate in a $2.89 billion committed credit facility provided by a syndicate of lenders pursuant to a credit agreement that may be renewed annually; each fund is individually liable for its borrowings, if any, under the credit facility. Borrowings may be utilized for temporary and emergency purposes, and are subject to the fund’s regulatory and contractual borrowing restrictions. The participating funds are charged administrative fees and an annual commitment fee of 0.06% of the undrawn amount of the facility; these fees are allocated to the funds based on a method approved by the fund’s board of trustees and included in Management and Administrative expenses on the fund’s Statement of Operations. Any borrowings under this facility bear interest at a rate equal to the higher of the federal funds rate or LIBOR reference rate plus an agreed-upon spread.
The fund had no borrowings outstanding at October 31, 2014, or at any time during the period then ended.
6. Other: Interest income includes income distributions received from Vanguard Market Liquidity Fund and is accrued daily. Premiums and discounts on debt securities purchased are amortized and accreted, respectively, to interest income over the lives of the respective securities. Security transactions are accounted for on the date securities are bought or sold. Costs used to determine realized gains (losses) on the sale of investment securities are those of the specific securities sold. Fees assessed on capital share transactions are credited to paid-in capital.
Each class of shares has equal rights as to assets and earnings, except that each class separately bears certain class-specific expenses related to maintenance of shareholder accounts (included in Management and Administrative expenses) and shareholder reporting. Marketing and distribution expenses are allocated to each class of shares based on a method approved by the board of trustees. Income, other non-class-specific expenses, and gains and losses on investments are allocated to each class of shares based on its relative net assets.
B. The Vanguard Group furnishes at cost investment advisory, corporate management, administrative, marketing, and distribution services. The costs of such services are allocated to the fund based on methods approved by the board of trustees. The fund has committed to invest up to 0.40% of its net assets in Vanguard. At October 31, 2014, the fund had contributed capital of $36,000 to Vanguard (included in Other Assets), representing 0.01% of the fund’s net assets and 0.01% of Vanguard’s capitalization. The fund’s trustees and officers are also directors and officers of Vanguard.
39
Emerging Markets Government Bond Index Fund
C. Various inputs may be used to determine the value of the fund’s investments. These inputs are summarized in three broad levels for financial statement purposes. The inputs or methodologies used to value securities are not necessarily an indication of the risk associated with investing in those securities.
Level 1—Quoted prices in active markets for identical securities.
Level 2—Other significant observable inputs (including quoted prices for similar securities, interest rates, prepayment speeds, credit risk, etc.).
Level 3—Significant unobservable inputs (including the fund’s own assumptions used to determine the fair value of investments).
The following table summarizes the market value of the fund’s investments as of October 31, 2014, based on the inputs used to value them:
| | | |
| | Level 1 | Level 2 | Level 3 |
| Investments | ($000) | ($000) | ($000) |
| U.S. Government and Agency Obligations | — | 66 | — |
| Sovereign Bonds | — | 341,945 | 197 |
| Temporary Cash Investments | 3,738 | — | — |
| Total | 3,738 | 342,011 | 197 |
D. Distributions are determined on a tax basis and may differ from net investment income and realized capital gains for financial reporting purposes. Differences may be permanent or temporary. Permanent differences are reclassified among capital accounts in the financial statements to reflect their tax character. Temporary differences arise when certain items of income, expense, gain, or loss are recognized in different periods for financial statement and tax purposes. These differences will reverse at some time in the future. Differences in classification may also result from the treatment of short-term gains as ordinary income for tax purposes.
During the year ended October 31, 2014, the fund realized $477,000 of net capital gains resulting from in-kind redemptions—in which shareholders exchanged fund shares for securities held by the fund rather than for cash. Because such gains are not taxable to the fund, and are not distributed to shareholders, they have been reclassified from accumulated net realized losses to paid-in capital.
For tax purposes, at October 31, 2014, the fund had available capital losses totaling $378,000 that may be carried forward indefinitely to offset future net capital gains.
At October 31, 2014, the cost of investment securities for tax purposes was $342,243,000. Net unrealized appreciation of investment securities for tax purposes was $3,703,000, consisting of unrealized gains of $8,860,000 on securities that had risen in value since their purchase and $5,157,000 in unrealized losses on securities that had fallen in value since their purchase.
E. During the year ended October 31, 2014, the fund purchased $129,592,000 of investment securities and sold $52,568,000 of investment securities, other than U.S. government securities and temporary cash investments. Purchases and sales of U.S. government securities were $12,906,000 and $13,497,000, respectively. Total purchases and sales include $132,287,000 and $15,473,000, respectively, in connection with in-kind purchases and redemptions of the fund’s capital shares.
40
Emerging Markets Government Bond Index Fund
F. Capital share transactions for each class of shares were:
| | | | |
| | | | Year Ended October 31, |
| | | 2014 | | 2013 |
| | Amount | Shares | Amount | Shares |
| | ($000) | (000) | ($000) | (000) |
| Investor Shares1 | | | | |
| Issued 2 | 7,000 | 712 | 5,058 | 519 |
| Issued in Lieu of Cash Distributions | 234 | 24 | 47 | 5 |
| Redeemed | (4,315) | (438) | (876) | (91) |
| Net Increase (Decrease)—Investor Shares | 2,919 | 298 | 4,229 | 433 |
| Admiral Shares1 | | | | |
| Issued 2 | 78,630 | 4,007 | 59,924 | 3,057 |
| Issued in Lieu of Cash Distributions | 3,473 | 176 | 632 | 33 |
| Redeemed | (20,898) | (1,063) | (5,076) | (264) |
| Net Increase (Decrease)—Admiral Shares | 61,205 | 3,120 | 55,480 | 2,826 |
| ETF Shares3 | | | | |
| Issued 2 | 148,304 | 1,902 | 87,216 | 1,100 |
| Issued in Lieu of Cash Distributions | — | — | — | — |
| Redeemed | (15,778) | (200) | — | — |
| Net Increase (Decrease)—ETF Shares | 132,526 | 1,702 | 87,216 | 1,100 |
1 Commencement of subscription period for the fund was May 14, 2013.
2 Includes purchase fees for fiscal 2014 and 2013 of $62,000 and $482,000, respectively (fund totals).
3 Inception date was May 31, 2013. |
|
|
G. Management has determined that, other than the aforementioned issuance of Institutional Shares, no material events or transactions occurred subsequent to October 31, 2014, that would require recognition or disclosure in these financial statements.
41
Report of Independent Registered
Public Accounting Firm
To the Board of Trustees of Vanguard Whitehall Funds and the Shareholders of Vanguard Emerging Markets Government Bond Index Fund:
In our opinion, the accompanying statement of net assets and the related statements of operations and of changes in net assets and the financial highlights present fairly, in all material respects, the financial position of Vanguard Emerging Markets Government Bond Index Fund (constituting a separate portfolio of Vanguard Whitehall Funds, hereafter referred to as the “Fund”) at October 31, 2014, and the results of its operations for the year then ended and the changes in its net assets and the financial highlights for each of the periods indicated, in conformity with accounting principles generally accepted in the United States of America. These financial statements and financial highlights (hereafter referred to as “financial statements”) are the responsibility of the Fund’s management. Our responsibility is to express an opinion on these financial statements based on our audits. We conducted our audits of these financial statements in accordance with the standards of the Public Company Accounting Oversight Board (United States). Those standards require that we plan and perform the audit to obtain reasonable assurance about whether the financial statements are free of material misstatement. An audit includes examining, on a test basis, evidence supporting the amounts and disclosures in the financial statements, assessing the accounting principles used and significant estimates made by management, and evaluating the overall financial statement presentation. We believe that our audits, which included confirmation of securities at October 31, 2014 by correspondence with the custodian, by agreement to the underlying ownership records of the transfer agent and the application of alternative auditing procedures where securities purchased had not been received, provide a reasonable basis for our opinion.
/s/PricewaterhouseCoopers LLP
Philadelphia, Pennsylvania
December 16, 2014
42
About Your Fund’s Expenses
As a shareholder of the fund, you incur ongoing costs, which include costs for portfolio management, administrative services, and shareholder reports (like this one), among others. Operating expenses, which are deducted from a fund’s gross income, directly reduce the investment return of the fund.
A fund’s expenses are expressed as a percentage of its average net assets. This figure is known as the expense ratio. The following examples are intended to help you understand the ongoing costs (in dollars) of investing in your fund and to compare these costs with those of other mutual funds. The examples are based on an investment of $1,000 made at the beginning of the period shown and held for the entire period.
The accompanying table illustrates your fund’s costs in two ways:
• Based on actual fund return. This section helps you to estimate the actual expenses that you paid over the period. The ”Ending Account Value“ shown is derived from the fund‘s actual return, and the third column shows the dollar amount that would have been paid by an investor who started with $1,000 in the fund. You may use the information here, together with the amount you invested, to estimate the expenses that you paid over the period.
To do so, simply divide your account value by $1,000 (for example, an $8,600 account value divided by $1,000 = 8.6), then multiply the result by the number given for your fund under the heading ”Expenses Paid During Period.“
• Based on hypothetical 5% yearly return. This section is intended to help you compare your fund‘s costs with those of other mutual funds. It assumes that the fund had a yearly return of 5% before expenses, but that the expense ratio is unchanged. In this case—because the return used is not the fund’s actual return—the results do not apply to your investment. The example is useful in making comparisons because the Securities and Exchange Commission requires all mutual funds to calculate expenses based on a 5% return. You can assess your fund’s costs by comparing this hypothetical example with the hypothetical examples that appear in shareholder reports of other funds.
Note that the expenses shown in the table are meant to highlight and help you compare ongoing costs only and do not reflect transaction costs incurred by the fund for buying and selling securities. Further, the expenses do not include any purchase, redemption, or account service fees described in the fund prospectus. If such fees were applied to your account, your costs would be higher. Your fund does not carry a “sales load.”
The calculations assume no shares were bought or sold during the period. Your actual costs may have been higher or lower, depending on the amount of your investment and the timing of any purchases or redemptions.
You can find more information about the fund’s expenses, including annual expense ratios, in the Financial Statements section of this report. For additional information on operating expenses and other shareholder costs, please refer to your fund’s current prospectus.
43
| | | |
| Six Months Ended October 31, 2014 | | | |
| | Beginning | Ending | Expenses |
| | Account Value | Account Value | Paid During |
| Emerging Markets Government Bond Index Fund | 4/30/2014 | 10/31/2014 | Period |
| Based on Actual Fund Return | | | |
| Investor Shares | $1,000.00 | $1,037.11 | $2.52 |
| Admiral Shares | 1,000.00 | 1,038.37 | 1.75 |
| ETF Shares | 1,000.00 | 1,038.43 | 1.75 |
| Based on Hypothetical 5% Yearly Return | | | |
| Investor Shares | $1,000.00 | $1,022.74 | $2.50 |
| Admiral Shares | 1,000.00 | 1,023.49 | 1.73 |
| ETF Shares | 1,000.00 | 1,023.49 | 1.73 |
| The calculations are based on expenses incurred in the most recent six-month period. The fund’s annualized six-month expense ratios for that period are 0.49% for Investor Shares, 0.34% for Admiral Shares, and 0.34% for ETF Shares. The dollar amounts shown as “Expenses Paid” are equal to the annualized expense ratio multiplied by the average account value over the period, multiplied by the number of days in the most recent six-month period, then divided by the number of days in the most recent 12-month period. |
|
|
|
44
Glossary
30-Day SEC Yield. A fund’s 30-day SEC yield is derived using a formula specified by the U.S. Securities and Exchange Commission. Under the formula, data related to the fund’s security holdings in the previous 30 days are used to calculate the fund’s hypothetical net income for that period, which is then annualized and divided by the fund’s estimated average net assets over the calculation period. For the purposes of this calculation, a security’s income is based on its current market yield to maturity (for bonds), its actual income (for asset-backed securities), or its projected dividend yield (for stocks). Because the SEC yield represents hypothetical annualized income, it will differ—at times significantly—from the fund’s actual experience. As a result, the fund’s income distributions may be higher or lower than implied by the SEC yield.
Average Coupon. The average interest rate paid on the fixed income securities held by a fund. It is expressed as a percentage of face value.
Average Duration. An estimate of how much the value of the bonds held by a fund will fluctuate in response to a change in interest rates. To see how the value could change, multiply the average duration by the change in rates. If interest rates rise by 1 percentage point, the value of the bonds in a fund with an average duration of five years would decline by about 5%. If rates decrease by a percentage point, the value would rise by 5%.
Average Effective Maturity. The average length of time until fixed income securities held by a fund reach maturity and are repaid, taking into consideration the possibility that the issuer may call the bond before its maturity date. The figure reflects the proportion of fund assets represented by each security; it also reflects any futures contracts held. In general, the longer the average effective maturity, the more a fund’s share price will fluctuate in response to changes in market interest rates.
Credit Quality. Credit-quality ratings are measured on a scale that generally ranges from AAA (highest) to D (lowest). “Not Rated” is used to classify securities for which a rating is not available. U.S. Treasury, U.S. Agency, and U.S. Agency mortgage-backed securities appear under “U.S. Government.” Credit-quality ratings are obtained from Barclays using ratings generally derived from Moody’s, Fitch, and S&P. When ratings from all three agencies are used, the median rating is shown. When ratings from two of the agencies are used, the lower rating is shown.
Expense Ratio. A fund’s total annual operating expenses expressed as a percentage of the fund’s average net assets. The expense ratio includes management and administrative expenses, but does not include the transaction costs of buying and selling portfolio securities.
Inception Date. The date on which the assets of a fund (or one of its share classes) are first invested in accordance with the fund’s investment objective. For funds with a subscription period, the inception date is the day after that period ends. Investment performance is measured from the inception date.
Short-Term Reserves. The percentage of a fund invested in highly liquid, short-term securities that can be readily converted to cash.
Yield to Maturity. The rate of return an investor would receive if the fixed income securities held by a fund were held to their maturity dates.
45
This page intentionally left blank.
This page intentionally left blank.
The People Who Govern Your Fund
The trustees of your mutual fund are there to see that the fund is operated and managed in your best interests since, as a shareholder, you are a part owner of the fund. Your fund’s trustees also serve on the board of directors of The Vanguard Group, Inc., which is owned by the Vanguard funds and provides services to them on an at-cost basis.
A majority of Vanguard’s board members are independent, meaning that they have no affiliation with Vanguard or the funds they oversee, apart from the sizable personal investments they have made as private individuals. The independent board members have distinguished backgrounds in business, academia, and public service. Each of the trustees and executive officers oversees 177 Vanguard funds.
The following table provides information for each trustee and executive officer of the fund. More information about the trustees is in the Statement of Additional Information, which can be obtained, without charge, by contacting Vanguard at 800-662-7447, or online at vanguard.com.
| |
| InterestedTrustee1 | and Delphi Automotive LLP (automotive components); |
| | Senior Advisor at New Mountain Capital. |
| F. William McNabb III | |
| Born 1957. Trustee Since July 2009. Chairman of the | Amy Gutmann |
| Board. Principal Occupation(s) During the Past Five | Born 1949. Trustee Since June 2006. Principal |
| Years: Chairman of the Board of The Vanguard Group, | Occupation(s) During the Past Five Years: President of |
| Inc., and of each of the investment companies served | the University of Pennsylvania; Christopher H. Browne |
| by The Vanguard Group, since January 2010; Director | Distinguished Professor of Political Science, School of |
| of The Vanguard Group since 2008; Chief Executive | Arts and Sciences, and Professor of Communication, |
| Officer and President of The Vanguard Group, and of | Annenberg School for Communication, with secondary |
| each of the investment companies served by The | faculty appointments in the Department of Philosophy, |
| Vanguard Group, since 2008; Director of Vanguard | School of Arts and Sciences, and at the Graduate |
| Marketing Corporation; Managing Director of The | School of Education, University of Pennsylvania; |
| Vanguard Group (1995–2008). | Trustee of the National Constitution Center; Chair |
| | of the Presidential Commission for the Study of |
| IndependentTrustees | Bioethical Issues. |
| |
| Emerson U. Fullwood | JoAnn Heffernan Heisen |
| Born 1948. Trustee Since January 2008. Principal | Born 1950. Trustee Since July 1998. Principal |
| Occupation(s) During the Past Five Years: Executive | Occupation(s) During the Past Five Years: Corporate |
| Chief Staff and Marketing Officer for North America | Vice President and Chief Global Diversity Officer |
| and Corporate Vice President (retired 2008) of Xerox | (retired 2008) and Member of the Executive |
| Corporation (document management products and | Committee (1997–2008) of Johnson & Johnson |
| services); Executive in Residence and 2009–2010 | (pharmaceuticals/medical devices/consumer |
| Distinguished Minett Professor at the Rochester | products); Director of Skytop Lodge Corporation |
| Institute of Technology; Director of SPX Corporation | (hotels), the University Medical Center at Princeton, |
| (multi-industry manufacturing), the United Way of | the Robert Wood Johnson Foundation, and the Center |
| Rochester, Amerigroup Corporation (managed health | for Talent Innovation; Member of the Advisory Board |
| care), the University of Rochester Medical Center, | of the Maxwell School of Citizenship and Public Affairs |
| Monroe Community College Foundation, and North | at Syracuse University. |
| Carolina A&T University. | |
| F. Joseph Loughrey |
| Rajiv L. Gupta | Born 1949. Trustee Since October 2009. Principal |
| Born 1945. Trustee Since December 2001.2 | Occupation(s) During the Past Five Years: President |
| Principal Occupation(s) During the Past Five Years: | and Chief Operating Officer (retired 2009) of Cummins |
| Chairman and Chief Executive Officer (retired 2009) | Inc. (industrial machinery); Chairman of the Board |
| and President (2006–2008) of Rohm and Haas Co. | of Hillenbrand, Inc. (specialized consumer services), |
| (chemicals); Director of Tyco International, Ltd. | and of Oxfam America; Director of SKF AB (industrial |
| (diversified manufacturing and services), Hewlett- | machinery), Hyster-Yale Materials Handling, Inc. |
| Packard Co. (electronic computer manufacturing), | (forklift trucks), the Lumina Foundation for Education, |
| | |
| | |
| and the V Foundation for Cancer Research; Member | Executive Officers | |
| of the Advisory Council for the College of Arts and | | |
| Letters and of the Advisory Board to the Kellogg | Glenn Booraem | |
| Institute for International Studies, both at the | Born 1967. Controller Since July 2010. Principal |
| University of Notre Dame. | Occupation(s) During the Past Five Years: Principal |
| | of The Vanguard Group, Inc.; Controller of each of |
| Mark Loughridge | the investment companies served by The Vanguard |
| Born 1953. Trustee Since March 2012. Principal | Group; Assistant Controller of each of the investment |
| Occupation(s) During the Past Five Years: Senior Vice | companies served by The Vanguard Group (2001–2010). |
| President and Chief Financial Officer (retired 2013) | | |
| at IBM (information technology services); Fiduciary | Thomas J. Higgins | |
| Member of IBM’s Retirement Plan Committee (2004– | Born 1957. Chief Financial Officer Since September |
| 2013); Member of the Council on Chicago Booth. | 2008. Principal Occupation(s) During the Past Five |
| | Years: Principal of The Vanguard Group, Inc.; Chief |
| Scott C. Malpass | Financial Officer of each of the investment companies |
| Born 1962. Trustee Since March 2012. Principal | served by The Vanguard Group; Treasurer of each of |
| Occupation(s) During the Past Five Years: Chief | the investment companies served by The Vanguard |
| Investment Officer and Vice President at the University | Group (1998–2008). | |
| of Notre Dame; Assistant Professor of Finance at the | | |
| Mendoza College of Business at Notre Dame; Member | Kathryn J. Hyatt | |
| of the Notre Dame 403(b) Investment Committee; | Born 1955. Treasurer Since November 2008. Principal |
| Board Member of TIFF Advisory Services, Inc. | Occupation(s) During the Past Five Years: Principal of |
| (investment advisor); Member of the Investment | The Vanguard Group, Inc.; Treasurer of each of the |
| Advisory Committees of the Financial Industry | investment companies served by The Vanguard |
| Regulatory Authority (FINRA) and of Major League | Group; Assistant Treasurer of each of the investment |
| Baseball. | companies served by The Vanguard Group (1988–2008). |
| |
| André F. Perold | Heidi Stam | |
| Born 1952. Trustee Since December 2004. Principal | Born 1956. Secretary Since July 2005. Principal |
| Occupation(s) During the Past Five Years: George | Occupation(s) During the Past Five Years: Managing |
| Gund Professor of Finance and Banking, Emeritus | Director of The Vanguard Group, Inc.; General Counsel |
| at the Harvard Business School (retired 2011); | of The Vanguard Group; Secretary of The Vanguard |
| Chief Investment Officer and Managing Partner of | Group and of each of the investment companies |
| HighVista Strategies LLC (private investment firm); | served by The Vanguard Group; Director and Senior |
| Director of Rand Merchant Bank; Overseer of the | Vice President of Vanguard Marketing Corporation. |
| Museum of Fine Arts Boston. | | |
| | Vanguard Senior ManagementTeam |
| Alfred M. Rankin, Jr. | | |
| Born 1941. Trustee Since January 1993. Principal | Mortimer J. Buckley | Chris D. McIsaac |
| Occupation(s) During the Past Five Years: Chairman, | Kathleen C. Gubanich | Michael S. Miller |
| President, and Chief Executive Officer of NACCO | Paul A. Heller | James M. Norris |
| Industries, Inc. (housewares/lignite), and of Hyster- | Martha G. King | Glenn W. Reed |
| Yale Materials Handling, Inc. (forklift trucks); Chairman | John T. Marcante | |
| of the Board of University Hospitals of Cleveland. | | |
| Chairman Emeritus and Senior Advisor |
| Peter F. Volanakis | | |
| Born 1955. Trustee Since July 2009. Principal | John J. Brennan | |
| Occupation(s) During the Past Five Years: President | Chairman, 1996–2009 | |
| and Chief Operating Officer (retired 2010) of Corning | Chief Executive Officer and President, 1996–2008 |
| Incorporated (communications equipment); Trustee of | | |
| Colby-Sawyer College; Member of the Advisory Board | Founder | |
| of the Norris Cotton Cancer Center and of the Advisory | | |
| Board of the Parthenon Group (strategy consulting). | John C. Bogle | |
| | Chairman and Chief Executive Officer, 1974–1996 |
| | |
1 Mr. McNabb is considered an “interested person,” as defined in the Investment Company Act of 1940, because he is an officer of the Vanguard funds.
2 December 2002 for Vanguard Equity Income Fund, the Vanguard Municipal Bond Funds, and the Vanguard State Tax-Exempt Funds.
|  |
| | P.O. Box 2600 |
| | Valley Forge, PA 19482-2600 |
| |
| |
| |
| Connect with Vanguard® > vanguard.com | |
| |
| |
| |
| Fund Information > 800-662-7447 | |
| Direct Investor Account Services > 800-662-2739 | |
| Institutional Investor Services > 800-523-1036 | |
| Text Telephone for People | |
| Who Are Deaf or Hard of Hearing> 800-749-7273 | |
| |
| This material may be used in conjunction | |
| with the offering of shares of any Vanguard | |
| fund only if preceded or accompanied by | |
| the fund’s current prospectus. | |
| |
| All comparative mutual fund data are from Lipper, a | |
| Thomson Reuters Company, or Morningstar, Inc., unless | |
| otherwise noted. | |
| |
| You can obtain a free copy of Vanguard’s proxy voting | |
| guidelines by visiting vanguard.com/proxyreporting or by | |
| calling Vanguard at 800-662-2739. The guidelines are | |
| also available from the SEC’s website, sec.gov. In | |
| addition, you may obtain a free report on how your fund | |
| voted the proxies for securities it owned during the 12 | |
| months ended June 30. To get the report, visit either | |
| vanguard.com/proxyreporting or sec.gov. | |
| |
| You can review and copy information about your fund at | |
| the SEC’s Public Reference Room in Washington, D.C. To | |
| find out more about this public service, call the SEC at | |
| 202-551-8090. Information about your fund is also | |
| available on the SEC’s website, and you can receive | |
| copies of this information, for a fee, by sending a | |
| request in either of two ways: via e-mail addressed to | |
| publicinfo@sec.gov or via regular mail addressed to the | |
| Public Reference Section, Securities and Exchange | |
| Commission, Washington, DC 20549-1520. | |
| |
| | © 2014 The Vanguard Group, Inc. |
| | All rights reserved. |
| | Vanguard Marketing Corporation, Distributor. |
| |
| | Q11200 122014 |
Item 2: Code of Ethics. The Registrant has adopted a code of ethics that applies to the Registrant’s principal executive officer, principal financial officer, principal accounting officer or controller or persons performing similar functions. The Code of Ethics was amended during the reporting period covered by this report to make certain technical, non-material changes.
Item 3: Audit Committee Financial Expert. The following members of the Audit Committee have been determined by the Registrant’s Board of Trustees to be Audit Committee Financial Experts serving on its Audit Committee, and to be independent: Rajiv L. Gupta, Amy Gutmann, JoAnn Heffernan Heisen, F. Joseph Loughrey, Mark Loughridge, Scott C. Malpass, André F. Perold, and Alfred M. Rankin, Jr.
Item 4: Principal Accountant Fees and Services.
(a) Audit Fees.
Audit Fees of the Registrant
Fiscal Year Ended October 31, 2014: $212,000
Fiscal Year Ended October 31, 2013: $148,000
Aggregate Audit Fees of Registered Investment Companies in the Vanguard Group.
Fiscal Year Ended October 31, 2014: $6,605,127
Fiscal Year Ended October 31, 2013: $5,714,113
Includes fees billed in connection with audits of the Registrant, other registered investment companies in the Vanguard complex, The Vanguard Group, Inc. and Vanguard Marketing Corporation.
(b) Audit-Related Fees.
Fiscal Year Ended October 31, 2014: $2,176,479
Fiscal Year Ended October 31, 2013: $1,552,950
Includes fees billed in connection with assurance and related services provided to the Registrant, other registered investment companies in the Vanguard complex, The Vanguard Group, Inc., and Vanguard Marketing Corporation.
(c) Tax Fees.
Fiscal Year Ended October 31, 2014: $316,869
Fiscal Year Ended October 31, 2013: $110,000
Includes fees billed in connection with tax compliance, planning, and advice services provided to the Registrant, other registered investment companies in the Vanguard complex, The Vanguard Group, Inc., and Vanguard Marketing Corporation.
(d) All Other Fees.
Fiscal Year Ended October 31, 2014: $198,163
Fiscal Year Ended October 31, 2013: $132,000
Includes fees billed for services related to tax reported information provided to the Registrant, other registered investment companies in the Vanguard complex, The Vanguard Group, Inc., and Vanguard Marketing Corporation.
(e) (1) Pre-Approval Policies. The policy of the Registrant’s Audit Committee is to consider and, if appropriate, approve before the principal accountant is engaged for such services, all specific audit and non-audit services provided to: the Registrant, other registered investment companies in the Vanguard complex, The Vanguard Group, Inc., and entities controlled by The Vanguard Group, Inc. that provide ongoing services to the Registrant. In making a determination, the Audit Committee considers whether the services are consistent with maintaining the principal accountant’s independence.
In the event of a contingency situation in which the principal accountant is needed to provide services in between scheduled Audit Committee meetings, the Chairman of the Audit Committee would be called on to consider and, if appropriate, pre-approve audit or permitted non-audit services in an amount sufficient to complete services through the next Audit Committee meeting, and to determine if such services would be consistent with maintaining the accountant’s independence. At the next scheduled Audit Committee meeting, services and fees would be presented to the Audit Committee for formal consideration, and, if appropriate, approval by the entire Audit Committee. The Audit Committee would again consider whether such services and fees are consistent with maintaining the principal accountant’s independence.
The Registrant’s Audit Committee is informed at least annually of all audit and non-audit services provided by the principal accountant to the Vanguard complex, whether such services are provided to: the Registrant, other registered investment companies in the Vanguard complex, The Vanguard Group, Inc., or other entities controlled by The Vanguard Group, Inc. that provide ongoing services to the Registrant.
(2) No percentage of the principal accountant’s fees or services were approved pursuant to the waiver provision of paragraph (c)(7)(i)(C) of Rule 2-01 of Regulation S-X.
(f) For the most recent fiscal year, over 50% of the hours worked under the principal accountant’s engagement were not performed by persons other than full-time, permanent employees of the principal accountant.
(g) Aggregate Non-Audit Fees.
Fiscal Year Ended October 31, 2014: $515,032
Fiscal Year Ended October 31, 2013: $242,000
Includes fees billed for non-audit services provided to the Registrant, other registered investment companies in the Vanguard complex, The Vanguard Group, Inc., and Vanguard Marketing Corporation.
(h) For the most recent fiscal year, the Audit Committee has determined that the provision of all non-audit services was consistent with maintaining the principal accountant’s independence.
Item 5: Audit Committee of Listed Registrants.
Not Applicable.
Item 6: Investments.
Not Applicable.
Item 7: Disclosure of Proxy Voting Policies and Procedures for Closed-End Management Investment Companies.
Not Applicable.
Item 8: Portfolio Managers of Closed-End Management Investment Companies.
Not Applicable.
Item 9: Purchase of Equity Securities by Closed-End Management Investment Company and Affiliated Purchasers.
Not Applicable.
Item 10: Submission of Matters to a Vote of Security Holders.
Not Applicable.
Item 11: Controls and Procedures.
(a) Disclosure Controls and Procedures. The Principal Executive and Financial Officers concluded that the Registrant’s Disclosure Controls and Procedures are effective based on their evaluation of the Disclosure Controls and Procedures as of a date within 90 days of the filing date of this report.
(b) Internal Control Over Financial Reporting. There were no significant changes in Registrant’s Internal Control Over Financial Reporting or in other factors that could significantly affect this control subsequent to the date of the evaluation, including any corrective actions with regard to significant deficiencies and material weaknesses.
Item 12: Exhibits.
(a) Code of Ethics.
(b) Certifications.
Pursuant to the requirements of the Securities Exchange Act of 1934 and the Investment
Company Act of 1940, the registrant has duly caused this report to be signed on its behalf by
the undersigned, thereunto duly authorized.
| |
| | VANGUARD WHITEHALL FUNDS |
| |
| |
| BY: | /s/ F. WILLIAM MCNABB III* |
| | F. WILLIAM MCNABB III |
| | CHIEF EXECUTIVE OFFICER |
| |
| Date: December 18, 2014 |
Pursuant to the requirements of the Securities Exchange Act of 1934 and the Investment Company Act of 1940, this report has been signed below by the following persons on behalf of the registrant and in the capacities and on the dates indicated.
| |
| | VANGUARD WHITEHALL FUNDS |
| |
| |
| BY: | /s/ F. WILLIAM MCNABB III* |
| | F. WILLIAM MCNABB III |
| | CHIEF EXECUTIVE OFFICER |
| |
| Date: December 18, 2014 |
| |
| | VANGUARD WHITEHALL FUNDS |
| |
| |
| BY: | /s/ THOMAS J. HIGGINS* |
| THOMAS J. HIGGINS |
| | CHIEF FINANCIAL OFFICER |
| |
| Date: December 18, 2014 |
* By: /s/ Heidi Stam
Heidi Stam, pursuant to a Power of Attorney filed on April 22, 2014 see file Number2-17620, Incorporated by Reference.