UNITED STATES
SECURITIES AND EXCHANGE COMMISSION
Washington, D.C. 20549
FORM N-CSR
CERTIFIED SHAREHOLDER REPORT
OF
REGISTERED MANAGEMENT INVESTMENT COMPANIES
| | |
| Investment Company Act file number: | 811-07443 |
Name of Registrant: | Vanguard Whitehall Funds |
Address of Registrant: | P.O. Box 2600 |
| | Valley Forge, PA 19482 |
Name and address of agent for service: | Anne E. Robinson, Esquire |
| | P.O. Box 876 |
| | Valley Forge, PA 19482 |
Registrant’s telephone number, including area code: (610) 669-1000 |
Date of fiscal year end: October 31 |
Date of reporting period: November 1, 2015 – October 31, 2016 |
Item 1: Reports to Shareholders |
 |
| Annual Report | October 31, 2016 |
| Vanguard Selected Value Fund |
A new format, unwavering commitment
As you begin reading this report, you’ll notice that we’ve made some improvements to the opening sections—based on feedback from you, our clients.
Page 1 starts with a new ”Your Fund’s Performance at a Glance,” a concise, handy summary of how your fund performed during the period.
In the renamed ”Chairman’s Perspective,” Bill McNabb will focus on enduring principles and investment insights.
We’ve modified some tables, and eliminated some redundancy, but we haven’t removed any information.
At Vanguard, we’re always looking for better ways to communicate and to help you make sound investment decisions. Thank you for entrusting your assets to us.
| |
| Contents | |
| Your Fund’s Performance at a Glance. | 1 |
| Chairman’s Perspective. | 3 |
| Advisors’ Report. | 7 |
| Fund Profile. | 12 |
| Performance Summary. | 13 |
| Financial Statements. | 15 |
| Your Fund’s After-Tax Returns. | 28 |
| About Your Fund’s Expenses. | 29 |
| Glossary. | 31 |
Please note: The opinions expressed in this report are just that—informed opinions. They should not be considered promises or advice. Also, please keep in mind that the information and opinions cover the period through the date on the front of this report. Of course, the risks of investing in your fund are spelled out in the prospectus.
See the Glossary for definitions of investment terms used in this report.
About the cover: No matter what language you speak, Vanguard has one consistent message and set of principles. Our primary focus is on you, our clients. We conduct our business with integrity as a faithful steward of your assets. This message is shown translated into seven languages, reflecting our expanding global presence.
Your Fund’s Performance at a Glance
• Vanguard Selected Value Fund returned 2.20% for the 12 months ended October 31, 2016, trailing the 7.84% return of its benchmark, the Russell Midcap Value Index, and the 4.65% average return of its mid-capitalization value fund peers.
• Value stocks performed better than their growth counterparts, while large- and small-cap stocks exceeded mid-caps.
• As always, Selected Value’s three advisors depended on extensive research as they hunted for undervalued mid-cap companies.
• The fund’s consumer discretionary, industrial, and energy holdings all lagged their benchmark counterparts. Consumer discretionary lagged the most, finishing well behind the benchmark. Within that sector, cruise lines were the main culprit. Shortfalls in industrials and energy also hurt returns.
• For the ten years ended October 31, 2016, the fund’s average annual return of 6.95% slightly trailed that of its benchmark, which bears no expenses, and surpassed that of its peers.
| |
| Total Returns: Fiscal Year Ended October 31, 2016 | |
| | Total |
| | Returns |
| Vanguard Selected Value Fund | 2.20% |
| Russell Midcap Value Index | 7.84 |
| Mid-Cap Value Funds Average | 4.65 |
| Mid-Cap Value Funds Average: Derived from data provided by Lipper, a Thomson Reuters Company. | |
| |
| |
| Total Returns: Ten Years Ended October 31, 2016 | |
| | Average |
| | Annual Return |
| Selected Value Fund | 6.95% |
| Russell Midcap Value Index | 7.19 |
| Mid-Cap Value Funds Average | 6.34 |
| Mid-Cap Value Funds Average: Derived from data provided by Lipper, a Thomson Reuters Company. | |
The figures shown represent past performance, which is not a guarantee of future results. (Current performance may be lower or higher than the performance data cited. For performance data current to the most recent month-end, visit our website at vanguard.com/performance.) Note, too, that both investment returns and principal value can fluctuate widely, so an investor’s shares, when sold, could be worth more or less than their original cost.
1
| | |
| Expense Ratios | | |
| Your Fund Compared With Its Peer Group | | |
| | | Peer Group |
| | Fund | Average |
| Selected Value Fund | 0.39% | 1.25% |
The fund expense ratio shown is from the prospectus dated February 25, 2016, and represents estimated costs for the current fiscal year. For the fiscal year ended October 31, 2016, the fund’s expense ratio was 0.35%. The peer-group expense ratio is derived from data provided by Lipper, a Thomson Reuters Company, and captures information through year-end 2015.
Peer group: Mid-Cap Value Funds.
2
Chairman’s Perspective

Bill McNabb
Chairman and Chief Executive Officer
Dear Shareholder,
Over the three years ended August 31, 2016, investors poured more than $1 trillion into index funds. Indexing now accounts for nearly a third of all mutual fund assets—more than double what it did a decade ago and eight times its share two decades ago.1
By contrast, active management’s commercial struggles have reflected its disappointing investment performance. Over the decade ended December 31, 2015, 82% of actively managed stock funds and 81% of active bond funds have either underperformed their benchmarks or shut down.
This subpar performance has fueled the explosion of asset growth in indexing among individual, retirement, and nonprofit investors. So what might the trend mean for the future of actively managed funds?
Our research and experience indicate that active management can survive—and even succeed—but only if it’s offered at much lower expense.
High costs, which limit a manager’s ability to deliver benchmark-beating returns to clients, are the biggest reason why active has lagged. Industrywide as of December 31, 2015, the average expense ratio for all active stock funds is 1.14%, compared with 0.76% for stock index
1 Sources: Wall Street Journal; Morningstar, Inc.; and Investment Company Institute, 2016.
3
funds. And the expense advantage is even wider for bonds; the average expense ratio for an active bond fund is 0.93%, compared with 0.43% for bond index funds.
But even these big differences understate the real gap. These days, it’s not hard to find an index fund that charges maybe 0.05% or 0.10%. So even if you have identified active managers who are skilled at selecting stocks and bonds, to match the return of a comparable (much cheaper) index fund would require significant outperformance. Think about it. Any fund that charges 1.00% in expenses—not even the high end of the range—will find it extraordinarily difficult to overcome the index fund’s head start.
Active management also has taken a hit from a regulatory environment that has been favorable to low-cost strategies. The U.S. Department of Labor several years ago mandated greater disclosure of retirement plan fees. And its new fiduciary rule, which is set to take effect in April, requires financial advisors to demonstrate that their recommendations are aligned with their clients’ best interest. Both changes encourage the use of lower-cost investments, including index funds.
The future of active management
In light of all this, people have been asking me whether active management is “dead.” My response is both yes and no. High-cost active management is dead, and rightly so. It has never been a winning proposition
| | | |
| Market Barometer | | | |
| | | Average Annual Total Returns |
| | | Periods Ended October 31, 2016 |
| | One | Three | Five |
| | Year | Years | Years |
| Stocks | | | |
| Russell 1000 Index (Large-caps) | 4.26% | 8.48% | 13.51% |
| Russell 2000 Index (Small-caps) | 4.11 | 4.12 | 11.51 |
| Russell 3000 Index (Broad U.S. market) | 4.24 | 8.13 | 13.35 |
| FTSE All-World ex US Index (International) | 0.64 | -0.94 | 4.09 |
| |
| Bonds | | | |
| Bloomberg Barclays U.S. Aggregate Bond Index | | | |
| (Broad taxable market) | 4.37% | 3.48% | 2.90% |
| Bloomberg Barclays Municipal Bond Index | | | |
| (Broad tax-exempt market) | 4.06 | 4.89 | 4.34 |
| Citigroup Three-Month U.S. Treasury Bill Index | 0.22 | 0.07 | 0.07 |
| |
| CPI | | | |
| Consumer Price Index | 1.64% | 1.15% | 1.32% |
4
for investors. Low-cost active funds, though, can potentially play an important role for investors who seek to outperform the market.
Paying less for your funds is the only sure-fire way to improve your odds of achieving success in active management. But even if you have found an active manager with low costs, the odds of outperforming the market are still long. You have to be able to identify talented stock and bond portfolio managers with long time horizons and clear investment strategies. Look for managers with consistent track records and the discipline to stick closely to their investment strategy.
Know what you own and why
Despite the well-deserved reputation of indexing and the challenges for active managers, there’s still a place for traditional active strategies that are low-cost, diversified, and highly disciplined, and are run by talented managers who focus on the long term.
Vanguard has always applied these principles to our active strategies, and investors have benefited as a majority of our active funds outperformed their benchmarks and bested their peers’ average annual return over the ten years ended September 30, 2016.
Worried about the election’s impact on your portfolio?
The 2016 presidential election season was one of the most intense and unpredictable in U.S. history. In its aftermath, investors may be left with lingering questions about what the outcome will mean for their portfolios. The answer, based on Vanguard research into decades of historical data, is that presidential elections typically have no long-term effect on market performance.
These findings hold true regardless of the market’s initial reaction. Whether there’s a swoon or bounce immediately after an election, investors shouldn’t extrapolate that performance to the long term.
As you can see in the accompanying chart, data going back to 1853 show that stock market returns are virtually identical no matter which party controls the White House. Although headlines out of Washington at any given time may still cause concern, investors
shouldn’t overreact to short-term events. Instead, it’s best to maintain a balanced and diversified portfolio and stay focused on your long-term goals.
Average annual stock market returns based on party control of the White House (1853–2015)

Sources: Global Financial Data, 1853–1926; Morningstar, Inc., and Ibbotson Associates thereafter through 2015.
5
But it’s crucial for investors to be patient. Even active managers with the best track records frequently underperform their benchmarks when their investment styles are out of favor. Such periods, though temporary, can persist. So it’s important when entrusting your assets to an active strategy to be in it for the long haul.
Make sure you know what you’re buying and what the risks are. Active strategies are becoming more complex, so it’s important to clearly understand what the investments in your portfolio are designed to accomplish and why you want to hold them. Otherwise, you run the risk of selecting strategies that don’t fit your needs or objectives.
Keeping these considerations in mind can potentially boost your chances of success in identifying active strategies that may be able to help you reach your goals.
As always, thank you for investing with Vanguard.
Sincerely,

F. William McNabb III
Chairman and Chief Executive Officer
November 9, 2016
6
Advisors’ Report
For the fiscal year ended October 31, 2016, Vanguard Selected Value Fund returned 2.20%. Your fund is managed by three independent advisors. This provides exposure to distinct yet complementary investment approaches, enhancing the fund’s diversification. It is not uncommon for different advisors to have different views about individual securities or the broader investment environment.
The advisors, the percentage and amount of fund assets each manages, and a brief description of their investment strategies are presented in the table below. The advisors have also prepared a discussion of the investment environment that existed during the fiscal period and of how portfolio positioning reflects this assessment. (Please note that the Pzena Investment
Management discussion refers to industry sectors as defined by Russell classifications rather than the Global Industry Classification Standard used elsewhere in this report.) These comments were prepared on November 17, 2016.
Barrow, Hanley, Mewhinney &
Strauss, LLC
Portfolio Managers:
James P. Barrow,
Executive Director
Mark Giambrone,
Managing Director
The uncertainty and volatility of the last 12 months have created significant headwinds for our strategy. We began
| | | |
| Vanguard Selected Value Fund Investment Advisors | |
| |
| | Fund Assets Managed | |
| Investment Advisor | % | $ Million | Investment Strategy |
| Barrow, Hanley, Mewhinney & | 59 | 5,217 | Conducts fundamental research on individual stocks |
| Strauss, LLC | | | exhibiting traditional value characteristics: |
| | | | price/earnings and price/book ratios below the market |
| | | | average and dividend yields above the market average. |
| Pzena Investment Management, | 21 | 1,849 | Uses a fundamental, bottom-up, deep-value-oriented |
| LLC | | | investment strategy. Seeks to buy good businesses at |
| | | | low prices, focusing exclusively on companies that are |
| | | | underperforming their historically demonstrated |
| | | | earnings power. |
| Donald Smith & Co., Inc. | 18 | 1,567 | Conducts fundamental research on the lowest |
| | | | price-to-tangible book value companies. Research |
| | | | focuses on underlying quality of book value and assets, |
| | | | and on long-term earnings potential. |
| Cash Investments | 2 | 169 | These short-term reserves are invested by Vanguard in |
| | | | equity index products to simulate investment in stocks. |
| | | | Each advisor may also maintain a cash position. |
7
2016 anticipating several Federal Reserve rate increases, but global concerns sent the market plummeting early on, and investors began considering the possibility of negative interest rates in the United States. This first-quarter unease was followed by the unexpected Brexit vote toward the end of the second quarter—and all these events occurred during our own election cycle.
This scenario could not have been worse for our expectations and positioning, as we believe rates will rise slowly, economic growth will continue, and there will be some global stability. The already expensive areas of the market that benefit both from their defensive characteristics and lower-rate environments––including utilities and REITs, where we are underweight––did well over the period. Conversely, groups that need interest rates and the economy to improve steadily––including consumer discretionary, consumer finance, and industrials, where we are overweight––did poorly.
We believe we are positioned to take advantage of value in the market and that we are past the point of maximum uncertainty; we expect our performance to slowly recover throughout the year. An election year creates its own uncertainty and usually exerts some pressure on health care names (in which we are overweight); the largest overhang may not disappear until after the election. At that point, however, we expect valuations and cash flows to matter most. The portfolio is well situated to benefit from such an environment.
We continue to benefit from a pickup in merger and acquisition activity, as both St. Jude Medical and Tyco International were taken out during the period. If we are finding good companies with attractive valuations and cash flow, and the market doesn’t recognize this, a financial or strategic buyer certainly validates our process.
We are underweight utilities, technology, energy, and REITs. We believe traditional yield plays like utilities and REITs have had substantial runs thanks to a continued low interest rate environment and have very little room for valuation upside or meaningful yield relative to their own histories. We also see considerable risk to these valuation levels when interest rates rise.
Pzena Investment Management, LLC
Portfolio Managers:
Richard Pzena, Founder,
Chief Executive Officer, and
Co-Chief Investment Officer
John Flynn, Principal
Eli Rabinowich, Principal
Equity market returns were volatile over the 12 months, marked by plummeting energy prices in early 2016 and a surprise Brexit vote in June. Despite these head-winds, markets were solidly positive for the year. Our portfolio performed in line with the Russell Midcap Value Index, the fund’s benchmark, benefiting from positioning in technology and stock selection within energy and hindered
8
by the underperformance of some consumer discretionary and producer durables holdings.
Hard drive manufacturer Seagate Technology was the portfolio’s top individual contributor. We added to our position in the second quarter of 2016 as the stock declined on personal computer unit weakness that led to a severe decline in gross margins. The stock rebounded sharply during the most recent quarter as the company increased guidance on its cost-cutting efforts and end-market recovery. Also performing well in technology was Hewlett Packard Enterprise (enterprise information technology) as management continues to disassemble the business in order to unlock value. Within producer durables, Terex Corporation (machinery manufacturing) was a top contributor, helped by its continued initiatives to simplify the business and improve returns.
Staples (office supplies) and News Corp. (media and information services) were the leading detractors in the portfolio. Staples struggled as it announced that it would shut its stores in the United Kingdom, and may do the same in Continental Europe, because of declining sales. The company was hurt most from failing to get regulatory approval for its merger deal with Office Depot. We had long believed such an outcome to be possible and had limited our position size accordingly, and we believe the stock remains attractive. News Corp. shares were weak as the company showed continued deterioration in its newspapers business. The stock remains attractive based on its low valuation of 0.6 times book value and more than $3 per share in cash.
The exploitable pockets of cheapness continue to be in financial services, information technology (“old tech” companies that are more exposed to enterprise spending), and, to a growing extent, industrial cyclicals—areas where we have our largest exposures. We have significantly less exposure to sectors deemed “safe” by investors, such as health care, consumer staples, and utilities, where we believe valuations are at unattractive levels.
Donald Smith & Co., Inc.
Portfolio Managers:
Donald G. Smith, President
and Chief Investment Officer
Richard L. Greenberg, CFA,
Senior Vice President
The portfolio continues to meet our criteria of owning a concentrated selection of low price-to-tangible book value stocks with attractive long-term earnings potential. It currently sells at 106% of tangible book value and 8.2 times our estimate of “normalized earnings.” In contrast, the Standard & Poor’s 500 Index sells at over 7 times tangible book value and 17 times normalized earnings.
The rebound in precious metals and energy mirrored the rise in the underlying commodities and contributed most to returns. Top contributors included Yamana Gold (+62.6%) and Kinross Gold Corporation (+92.0%). WPX Energy (+58.3%) and Nabors (+18.5%) also contributed.
9
Continued surplus capacity and declining day rates meant that offshore drillers, such as Noble Corp. (–63.3%), did not do well.
While rebounding oil prices helped the energy sector, they also hindered the performance of previously strong airline/ aircraft leasing stocks, including JetBlue (–29.6%), Air France (–16.8%), and AerCap (–0.94%). Lower interest rates tend to push down financial stocks. Our financial exposure is primarily limited to insurance stocks, which on average lagged the market with single-digit returns. Everest Re was an exception, rising 14.4%. In technology, Ingram Micro (+24.9%) received a takeover offer from a Chinese conglomerate.
We eliminated our positions in a number of holdings, most of which had done well and met our targets. These included American National Insurance Company, Coeur Mining, New Gold, Royal Caribbean Cruises, Valero Energy Corporation, and Validus Holdings. We also trimmed positions in Aspen Insurance, Everest RE, Ingram Micro, JetBlue, Kinross Gold, WPX Energy, and XL Group, and added to our positions in AerCap, Air France-KLM, Celestica, MFA Financial, and Micron. We reduced our holdings in Yamana earlier in the period, and then bought some back later at a lower price. Three new names were added to the portfolio: Axis Capital, IAMGOLD Corporation, and Toll Brothers. Axis Capital is a Bermuda-based insurer/ reinsurer; IAMGOLD is an 800,000-ounce gold producer with mines in Africa and Canada; and Toll Brothers is a national builder of luxury homes.
Our largest position is in AerCap. The stock sells at 89% book value, below fair market value, and about 6 times our 2- to 4-year earnings estimate. AerCap has been aggressively selling planes at premiums to book value and redeploying proceeds to a stock buyback program. Our largest industry weightings are to insurance, technology, airlines/aircraft leasing, and metals.
The portfolio’s six insurance companies sell at an average of 95% of tangible book value. Hurt by low interest rates and the attendant low returns on investment portfolios, returns on equity have generally been in the high single digits. Higher interest rates, coupled with stock buyback programs at all six companies and the potential for takeover, should buoy the stocks. In technology, it appears that a better supply/demand situation has developed in memory, providing underlying support to Micron.
Finally, the precious metals stocks have been an obvious beneficiary of the recent rebound in gold and silver prices. While it may be difficult to predict the future direction of precious metal prices, several factors give us comfort in our position.
On a macro level, these factors include worldwide loose monetary policy, which has led to negative real (and in many cases nominal) interest rates in much of the developed world; strong and persistent central bank purchases of gold; rising wealth in countries with a historical affinity for gold (China and India); and a benign
10
outlook for gold supply, with few sizable projects on the horizon to replace depletion from older mines.
Our investment in the miners themselves is not necessarily predicated on rising gold prices. Each of them has company-specific projects or catalysts that have the potential to lead to sharply higher earnings, even assuming flat gold prices. The stocks are cheap on both historical price/book
value and price/revenues metrics, while cost-cutting efforts over the past few years should allow the companies to be at least cash flow breakeven, even if gold prices turn lower. Our preference has been to purchase companies that have the most sales and reserves relative to enterprise value; they also must have the balance-sheet strength to survive an extended period of lower prices.
11
Selected Value Fund
Fund Profile
As of October 31, 2016
| | | |
| Portfolio Characteristics | | |
| | | | DJ |
| | | | U.S. |
| | | Russell | Total |
| | | Midcap | Market |
| | | Value | FA |
| | Fund | Index | Index |
| Number of Stocks | 123 | 565 | 3,833 |
| Median Market Cap | $9.2B | $11.2B | $53.5B |
| Price/Earnings Ratio | 20.3x | 23.7x | 23.1x |
| Price/Book Ratio | 1.7x | 1.8x | 2.7x |
| Return on Equity | 11.7% | 10.0% | 16.6% |
| Earnings Growth | | | |
| Rate | 10.9% | 7.9% | 8.4% |
| Dividend Yield | 2.1% | 2.3% | 2.1% |
| Foreign Holdings | 10.9% | 0.0% | 0.0% |
| Turnover Rate | 27% | — | — |
| Ticker Symbol | VASVX | — | — |
| Expense Ratio1 | 0.39% | — | — |
| 30-Day SEC Yield | 1.78% | — | — |
| Short-Term | | | |
| Reserves | 1.7% | — | — |
| | | |
| Sector Diversification (% of equity exposure) |
| | | Russell | DJ |
| | | Midcap | U.S. Total |
| | | Value | Market |
| | Fund | Index | FA Index |
| Consumer | | | |
| Discretionary | 15.5% | 8.7% | 12.6% |
| Consumer Staples | 3.4 | 3.6 | 8.9 |
| Energy | 7.5 | 9.9 | 6.6 |
| Financials | 26.4 | 18.3 | 13.9 |
| Health Care | 4.0 | 4.5 | 13.4 |
| Industrials | 16.3 | 12.4 | 10.5 |
| Information | | | |
| Technology | 11.2 | 9.0 | 21.0 |
| Materials | 7.9 | 5.7 | 3.2 |
| Real Estate | 3.4 | 14.7 | 4.2 |
| Telecommunication | | | |
| Services | 0.1 | 1.5 | 2.3 |
| Utilities | 4.3 | 11.7 | 3.4 |
| | |
| Volatility Measures | | |
| | Russell | DJ |
| | Midcap | U.S. Total |
| | Value | Market |
| | Index | FA Index |
| R-Squared | 0.86 | 0.86 |
| Beta | 1.02 | 1.03 |
These measures show the degree and timing of the fund’s
fluctuations compared with the indexes over 36 months.
| | |
| Ten Largest Holdings (% of total net assets) |
| AerCap Holdings NV | Trading Companies & | |
| | Distributors | 2.1% |
| Royal Caribbean Cruises | Hotels, Resorts & | |
| Ltd. | Cruise Lines | 2.0 |
| Willis Towers Watson | | |
| plc | Insurance Brokers | 2.0 |
| Ingram Micro Inc. | Technology | |
| | Distributors | 1.9 |
| Micron Technology Inc. | Semiconductors | 1.9 |
| Capital One Financial | | |
| Corp. | Consumer Finance | 1.9 |
| Hanesbrands Inc. | Apparel, Accessories | |
| | & Luxury Goods | 1.9 |
| Reynolds American Inc. | Tobacco | 1.9 |
| Norwegian Cruise Line | Hotels, Resorts & | |
| Holdings Ltd. | Cruise Lines | 1.9 |
| Stanley Black & Decker | | |
| Inc. | Industrial Machinery | 1.9 |
| Top Ten | | 19.4% |
The holdings listed exclude any temporary cash investments and equity index products.
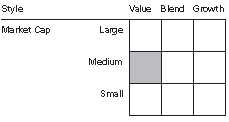
Investment Focus
1 The expense ratio shown is from the prospectus dated February 25, 2016, and represents estimated costs for the current fiscal year. For the fiscal year ended October 31, 2016, the expense ratio was 0.35%.
12
Selected Value Fund
Performance Summary
All of the returns in this report represent past performance, which is not a guarantee of future results that may be achieved by the fund. (Current performance may be lower or higher than the performance data cited. For performance data current to the most recent month-end, visit our website at vanguard.com/performance.) Note, too, that both investment returns and principal value can fluctuate widely, so an investor’s shares, when sold, could be worth more or less than their original cost. The returns shown do not reflect taxes that a shareholder would pay on fund distributions or on the sale of fund shares.
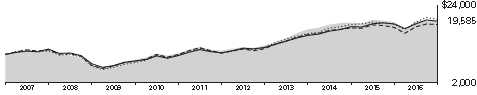
Cumulative Performance: October 31, 2006, Through October 31, 2016
Initial Investment of $10,000
| | | | |
| | Average Annual Total Returns | |
| | Periods Ended October 31, 2016 | |
| | | | | Final Value |
| | One | Five | Ten | of a $10,000 |
| | Year | Years | Years | Investment |
| Selected Value Fund | 2.20% | 12.16% | 6.95% | $19,585 |
| Russell Midcap Value Index | 7.84 | 14.07 | 7.19 | 20,033 |
| Mid-Cap Value Funds Average | 4.65 | 12.27 | 6.34 | 18,486 |
| Dow Jones U.S. Total Stock Market | | | | |
| Float Adjusted Index | 4.21 | 13.29 | 6.87 | 19,436 |
See Financial Highlights for dividend and capital gains information.
13
Selected Value Fund
Fiscal-Year Total Returns (%): October 31, 2006, Through October 31, 2016

Average Annual Total Returns: Periods Ended September 30, 2016
This table presents returns through the latest calendar quarter—rather than through the end of the fiscal period.
Securities and Exchange Commission rules require that we provide this information.
| | | | |
| | Inception | One | Five | Ten |
| | Date | Year | Years | Years |
| Selected Value Fund | 2/15/1996 | 10.53% | 15.23% | 7.39% |
14
Selected Value Fund
Financial Statements
Statement of Net Assets
As of October 31, 2016
The fund reports a complete list of its holdings in regulatory filings four times in each fiscal year, at the quarter-ends. For the second and fourth fiscal quarters, the lists appear in the fund’s semiannual and annual reports to shareholders. For the first and third fiscal quarters, the fund files the lists with the Securities and Exchange Commission on Form N-Q. Shareholders can look up the fund’s Forms N-Q on the SEC’s website at sec.gov. Forms N-Q may also be reviewed and copied at the SEC’s Public Reference Room (see the back cover of this report for further information).
| | | |
| | | | Market |
| | | | Value• |
| | | Shares | ($000) |
| Common Stocks (96.4%)1 | | |
| Consumer Discretionary (13.5%) | |
| | Royal Caribbean Cruises | | |
| | Ltd. | 2,344,500 | 180,222 |
| | Hanesbrands Inc. | 6,499,800 | 167,045 |
| * | Norwegian Cruise Line | | |
| | Holdings Ltd. | 4,283,100 | 166,484 |
| | Whirlpool Corp. | 989,800 | 148,292 |
| | L Brands Inc. | 1,671,200 | 120,644 |
| | Meredith Corp. | 1,495,544 | 67,823 |
| ^,2 | SeaWorld Entertainment | | |
| | Inc. | 4,546,700 | 63,699 |
| | Interpublic Group of Cos. | | |
| | Inc. | 2,152,894 | 48,203 |
| | News Corp. Class A | 3,579,375 | 43,382 |
| | Omnicom Group Inc. | 531,150 | 42,396 |
| | Dana Inc. | 2,360,300 | 36,538 |
| | Hilton Worldwide | | |
| | Holdings Inc. | 1,586,544 | 35,856 |
| * | Toll Brothers Inc. | 1,022,000 | 28,044 |
| | Staples Inc. | 3,090,600 | 22,870 |
| * | Adient plc | 343,886 | 15,650 |
| | | | 1,187,148 |
| Consumer Staples (3.0%) | | |
| | Reynolds American Inc. | 3,028,476 | 166,808 |
| | Coca-Cola European | | |
| | Partners plc | 1,820,000 | 69,961 |
| | Kellogg Co. | 337,425 | 25,351 |
| | | | 262,120 |
| Energy (7.3%) | | |
| | Devon Energy Corp. | 3,382,600 | 128,167 |
| ^ | Vermilion Energy Inc. | 2,812,100 | 110,459 |
| | PBF Energy Inc. Class A | 4,662,257 | 101,637 |
| ^ | Golar LNG Ltd. | 4,424,608 | 96,855 |
| | Murphy Oil Corp. | 1,521,653 | 39,365 |
| * | WPX Energy Inc. | 3,037,079 | 32,983 |
| | Cenovus Energy Inc. | 2,004,475 | 28,945 |
| | | |
| | | | Market |
| | | | Value• |
| | | Shares | ($000) |
| | Baker Hughes Inc. | 437,251 | 24,224 |
| | FMC Technologies Inc. | 637,475 | 20,571 |
| | Superior Energy Services | | |
| | Inc. | 1,120,132 | 15,861 |
| | Noble Corp. plc | 3,160,316 | 15,612 |
| | Rowan Cos. plc Class A | 996,725 | 13,226 |
| | Nabors Industries Ltd. | 885,000 | 10,531 |
| ^ | Tidewater Inc. | 556,400 | 963 |
| *,^ | Paragon Offshore plc | 870,105 | 243 |
| | | | 639,642 |
| Financials (25.9%) | | |
| | Willis Towers Watson plc | 1,392,045 | 175,258 |
| | Capital One Financial | | |
| | Corp. | 2,265,500 | 167,738 |
| | Discover Financial | | |
| | Services | 2,845,200 | 160,270 |
| | New York Community | | |
| | Bancorp Inc. | 10,701,500 | 153,673 |
| | Unum Group | 4,292,805 | 151,965 |
| | FNF Group | 3,258,500 | 117,013 |
| | KeyCorp | 7,651,825 | 108,044 |
| | Fifth Third Bancorp | 4,809,000 | 104,644 |
| | Navient Corp. | 7,757,647 | 99,143 |
| | Ameriprise Financial Inc. | 1,018,600 | 90,034 |
| | Voya Financial Inc. | 2,829,840 | 86,452 |
| | Axis Capital Holdings Ltd. | 1,509,138 | 85,976 |
| | CNA Financial Corp. | 2,259,996 | 82,648 |
| | Everest Re Group Ltd. | 401,462 | 81,705 |
| | XL Group Ltd. | 1,631,430 | 56,611 |
| | Comerica Inc. | 1,040,025 | 54,175 |
| ^ | Element Fleet | | |
| | Management Corp. | 5,546,200 | 54,044 |
| | Valley National Bancorp | 5,402,200 | 53,266 |
| | Regions Financial Corp. | 4,105,725 | 43,972 |
| | Invesco Ltd. | 1,501,950 | 42,190 |
| | Franklin Resources Inc. | 1,059,950 | 35,678 |
| | Webster Financial Corp. | 765,100 | 30,910 |
| * | SLM Corp. | 4,030,500 | 28,415 |
15
| | | |
| Selected Value Fund | | |
| |
| |
| |
| | | | Market |
| | | | Value• |
| | | Shares | ($000) |
| | Validus Holdings Ltd. | 541,925 | 27,692 |
| | Torchmark Corp. | 426,183 | 27,024 |
| | Endurance Specialty | | |
| | Holdings Ltd. | 260,000 | 23,907 |
| | MFA Financial Inc. | 3,014,000 | 22,032 |
| | Legg Mason Inc. | 639,775 | 18,374 |
| | Allstate Corp. | 269,225 | 18,280 |
| | Progressive Corp. | 495,225 | 15,604 |
| | Synovus Financial Corp. | 420,221 | 13,897 |
| | Hartford Financial Services | | |
| | Group Inc. | 313,800 | 13,842 |
| *,^ | ECN Capital Corp. | 5,545,900 | 12,115 |
| | Aspen Insurance Holdings | | |
| | Ltd. | 200,475 | 9,673 |
| | Genworth Financial Inc. | | |
| | Class A | 2,224,850 | 9,211 |
| | Assurant Inc. | 80,045 | 6,445 |
| | | | 2,281,920 |
| Health Care (3.5%) | | |
| | Cigna Corp. | 1,327,025 | 157,690 |
| | Cardinal Health Inc. | 1,903,900 | 130,779 |
| | Aetna Inc. | 154,800 | 16,618 |
| | | | 305,087 |
| Industrials (17.5%) | | |
| * | AerCap Holdings NV | 4,443,188 | 182,659 |
| | Stanley Black & Decker | | |
| | Inc. | 1,440,975 | 164,041 |
| | Owens Corning | 3,081,732 | 150,327 |
| * | Johnson Controls | | |
| | International plc | 3,438,864 | 138,655 |
| * | Spirit AeroSystems | | |
| | Holdings Inc. Class A | 2,715,407 | 136,748 |
| | Eaton Corp. plc | 2,018,900 | 128,745 |
| | KBR Inc. | 6,222,500 | 92,155 |
| * | JetBlue Airways Corp. | 5,138,340 | 89,818 |
| | Orbital ATK Inc. | 1,048,400 | 77,959 |
| | Ryder System Inc. | 1,008,600 | 69,987 |
| | CNH Industrial NV | 7,519,700 | 58,503 |
| *,^ | Air France-KLM ADR | 8,488,085 | 51,608 |
| | Terex Corp. | 2,115,440 | 50,517 |
| | Parker-Hannifin Corp. | 375,225 | 46,059 |
| | Dover Corp. | 664,325 | 44,437 |
| | AECOM | 1,380,510 | 38,447 |
| | Actuant Corp. Class A | 1,038,025 | 23,148 |
| | | | 1,543,813 |
| Information Technology (10.4%) | |
| | Ingram Micro Inc. | 4,595,009 | 170,934 |
| * | Micron Technology Inc. | 9,780,588 | 167,835 |
| | Microchip Technology Inc. | 2,250,200 | 136,250 |
| | Total System Services | | |
| | Inc. | 1,686,036 | 84,099 |
| | Hewlett Packard | | |
| | Enterprise Co. | 2,214,625 | 49,763 |
| | | |
| | | | Market |
| | | | Value• |
| | | Shares | ($000) |
| | ON Semiconductor Corp. | 4,216,096 | 49,202 |
| | Avnet Inc. | 1,102,016 | 46,230 |
| | Seagate Technology plc | 1,257,575 | 43,147 |
| | Flex Ltd. | 2,982,200 | 42,317 |
| * | Celestica Inc. | 2,887,239 | 34,214 |
| | HP Inc. | 2,175,125 | 31,517 |
| | Genpact Ltd. | 1,016,327 | 23,365 |
| | Arrow Electronics Inc. | 304,204 | 18,593 |
| | Jabil Circuit Inc. | 711,890 | 15,192 |
| | CDW Corp. | 145,485 | 6,534 |
| | | | 919,192 |
| Materials (7.8%) | | |
| * | Kinross Gold Corp. | 42,300,000 | 163,278 |
| ^ | CRH plc ADR | 4,798,799 | 155,001 |
| | FMC Corp. | 2,840,000 | 133,168 |
| | Yamana Gold Inc. | | |
| | (New York Shares) | 20,405,340 | 72,643 |
| * | Axalta Coating Systems | | |
| | Ltd. | 2,846,500 | 71,504 |
| | Celanese Corp. Class A | 811,000 | 59,138 |
| * | IAMGOLD Corp. | 9,238,132 | 37,045 |
| | | | 691,777 |
| Real Estate (3.3%) | | |
| 2 | GEO Group Inc. | 3,840,700 | 92,023 |
| | Host Hotels & Resorts | | |
| | Inc. | 5,038,900 | 78,002 |
| | Lamar Advertising Co. | | |
| | Class A | 840,850 | 53,352 |
| | Corporate Office | | |
| | Properties Trust | 1,861,110 | 49,673 |
| | Hospitality Properties | | |
| | Trust | 583,800 | 15,973 |
| | | | 289,023 |
| Utilities (4.2%) | | |
| | Xcel Energy Inc. | 2,961,137 | 123,035 |
| | Pinnacle West Capital | | |
| | Corp. | 1,443,700 | 109,909 |
| | CenterPoint Energy Inc. | 2,167,817 | 49,426 |
| | Edison International | 558,150 | 41,013 |
| | PG&E Corp. | 312,425 | 19,408 |
| | Exelon Corp. | 483,693 | 16,480 |
| | NRG Energy Inc. | 796,234 | 8,464 |
| | | | 367,735 |
| Total Common Stocks | | |
| (Cost $6,952,508) | | 8,487,457 |
16
| | | | |
| Selected Value Fund | | | |
| |
| |
| |
| | | | | Market |
| | | | | Value• |
| | | | Shares | ($000) |
| Temporary Cash Investments (4.8%)1 | |
| Money Market Fund (4.7%) | | |
| 3,4 | Vanguard Market Liquidity | | |
| | Fund, 0.718% | 4,108,011 | 410,842 |
| |
| | | | Face | |
| | | | Amount | |
| | | | ($000) | |
| U.S. Government and Agency Obligations (0.1%) |
| 5,6 | Freddie Mac Discount Notes, | | |
| | 0.300%, 11/8/16 | | 600 | 600 |
| 6 | United States Treasury Bill, | | |
| | 0.296%–0.320%, 11/25/16 | 5,700 | 5,699 |
| 6 | United States Treasury Bill, | | |
| | 0.257–0.292%, 12/29/16 | 1,800 | 1,799 |
| 6 | United States Treasury Bill, | | |
| | 0.454%, 4/20/17 | | 200 | 200 |
| | | | | 8,298 |
| Total Temporary Cash Investments | |
| (Cost $419,115) | | | 419,140 |
| Total Investments (101.2%) | | |
| (Cost $7,371,623) | | | 8,906,597 |
| Other Assets and Liabilities (-1.2%) | |
| Other Assets | | | 20,626 |
| Liabilities 4 | | | (125,557) |
| | | | | (104,931) |
| Net Assets (100%) | | | |
| Applicable to 323,065,536 outstanding | |
| $.001 par value shares of beneficial | |
| interest (unlimited authorization) | 8,801,666 |
| Net Asset Value Per Share | | $27.24 |
| |
| | Amount |
| | ($000) |
| Statement of Assets and Liabilities | |
| Assets | |
| Investments in Securities, at Value | |
| Unaffiliated Issuers | 8,340,033 |
| Affiliated Vanguard Funds | 410,842 |
| Other Affiliated Issuers | 155,722 |
| Total Investments in Securities | 8,906,597 |
| Investment in Vanguard | 687 |
| Receivables for Investment Securities | |
| Sold | 9,597 |
| Receivables for Accrued Income | 7,197 |
| Receivables for Capital Shares Issued | 2,730 |
| Other Assets | 415 |
| Total Assets | 8,927,223 |
| Liabilities | |
| Payables for Investment Securities | |
| Purchased | (6,614) |
| Collateral for Securities on Loan | (93,713) |
| Payables to Investment Advisor | (3,716) |
| Payables for Capital Shares Redeemed | (10,483) |
| Payables to Vanguard | (10,716) |
| Other Liabilities | (315) |
| Total Liabilities | (125,557) |
| Net Assets | 8,801,666 |
17
Selected Value Fund
| |
| At October 31, 2016, net assets consisted of: |
| | Amount |
| | ($000) |
| Paid-in Capital | 6,888,746 |
| Undistributed Net Investment Income | 118,432 |
| Accumulated Net Realized Gains | 261,298 |
| Unrealized Appreciation (Depreciation) | |
| Investment Securities | 1,534,974 |
| Futures Contracts | (1,784) |
| Net Assets | 8,801,666 |
• See Note A in Notes to Financial Statements.
* Non-income-producing security.
^ Includes partial security positions on loan to broker-dealers. The total value of securities on loan is $87,621,000.
1 The fund invests a portion of its cash reserves in equity markets through the use of index futures contracts. After giving effect to futures
investments, the fund’s effective common stock and temporary cash investment positions represent 98.4% and 2.8%, respectively, of
net assets.
2 Considered an affiliated company of the fund as the fund owns more than 5% of the outstanding voting securities of such company.
3 Affiliated money market fund available only to Vanguard funds and certain trusts and accounts managed by Vanguard. Rate shown is the
7-day yield.
4 Includes $93,713,000 of collateral received for securities on loan.
5 The issuer was placed under federal conservatorship in September 2008; since that time, its daily operations have been managed by the
Federal Housing Finance Agency and it receives capital from the U.S. Treasury, as needed to maintain a positive net worth, in exchange
for senior preferred stock.
6 Securities with a value of $7,798,000 have been segregated as initial margin for open futures contracts.
ADR—American Depositary Receipt.
See accompanying Notes, which are an integral part of the Financial Statements.
18
| |
| Selected Value Fund | |
| |
| |
| Statement of Operations | |
| |
| | Year Ended |
| | October 31, 2016 |
| | ($000) |
| Investment Income | |
| Income | |
| Dividends1 | 208,155 |
| Interest | 2,122 |
| Securities Lending—Net | 902 |
| Total Income | 211,179 |
| Expenses | |
| Investment Advisory Fees—Note B | |
| Basic Fee | 19,809 |
| Performance Adjustment | (3,390) |
| The Vanguard Group—Note C | |
| Management and Administrative | 13,235 |
| Marketing and Distribution | 1,820 |
| Custodian Fees | 97 |
| Auditing Fees | 36 |
| Shareholders’ Reports | 163 |
| Trustees’ Fees and Expenses | 11 |
| Total Expenses | 31,781 |
| Expenses Paid Indirectly | (439) |
| Net Expenses | 31,342 |
| Net Investment Income | 179,837 |
| Realized Net Gain (Loss) | |
| Investment Securities Sold | 279,830 |
| Futures Contracts | 14,324 |
| Foreign Currencies | (32) |
| Realized Net Gain (Loss) | 294,122 |
| Change in Unrealized Appreciation (Depreciation) | |
| Investment Securities | (271,390) |
| Futures Contracts | (7,939) |
| Change in Unrealized Appreciation (Depreciation) | (279,329) |
| Net Increase (Decrease) in Net Assets Resulting from Operations | 194,630 |
| 1 Dividends are net of foreign withholding taxes of $526,000. | |
See accompanying Notes, which are an integral part of the Financial Statements.
19
| | |
| Selected Value Fund | | |
| |
| |
| Statement of Changes in Net Assets | | |
| |
| | Year Ended October 31, |
| | 2016 | 2015 |
| | ($000) | ($000) |
| Increase (Decrease) in Net Assets | | |
| Operations | | |
| Net Investment Income | 179,837 | 163,790 |
| Realized Net Gain (Loss) | 294,122 | 379,722 |
| Change in Unrealized Appreciation (Depreciation) | (279,329) | (444,590) |
| Net Increase (Decrease) in Net Assets Resulting from Operations | 194,630 | 98,922 |
| Distributions | | |
| Net Investment Income | (150,373) | (138,609) |
| Realized Capital Gain1 | (347,588) | (401,073) |
| Total Distributions | (497,961) | (539,682) |
| Capital Share Transactions | | |
| Issued | 1,575,113 | 1,787,330 |
| Issued in Lieu of Cash Distributions | 457,613 | 496,488 |
| Redeemed | (2,591,075) | (2,333,003) |
| Net Increase (Decrease) from Capital Share Transactions | (558,349) | (49,185) |
| Total Increase (Decrease) | (861,680) | (489,945) |
| Net Assets | | |
| Beginning of Period | 9,663,346 | 10,153,291 |
| End of Period2 | 8,801,666 | 9,663,346 |
1 Includes fiscal 2016 and 2015 short-term gain distributions totaling $29,192,000 and $33,623,000, respectively. Short-term gain distributions
are treated as ordinary income dividends for tax purposes.
2 Net Assets—End of Period includes undistributed (overdistributed) net investment income of $118,432,000 and $106,036,000.
See accompanying Notes, which are an integral part of the Financial Statements.
20
| | | | | |
| Selected Value Fund | | | | | |
| |
| |
| Financial Highlights | | | | | |
| |
| |
| For a Share Outstanding | | | Year Ended October 31, |
| Throughout Each Period | 2016 | 2015 | 2014 | 2013 | 2012 |
| Net Asset Value, Beginning of Period | $28.15 | $29.49 | $28.07 | $21.01 | $18.81 |
| Investment Operations | | | | | |
| Net Investment Income | . 5271 | .478 | .415 | . 395 | .405 |
| Net Realized and Unrealized Gain (Loss) | | | | | |
| on Investments | .030 | (.245) | 2.555 | 7.105 | 2.122 |
| Total from Investment Operations | .557 | .233 | 2.970 | 7.500 | 2.527 |
| Distributions | | | | | |
| Dividends from Net Investment Income | (. 443) | (. 404) | (. 330) | (. 440) | (. 327) |
| Distributions from Realized Capital Gains | (1.024) | (1.169) | (1.220) | — | — |
| Total Distributions | (1.467) | (1.573) | (1.550) | (.440) | (.327) |
| Net Asset Value, End of Period | $27.24 | $28.15 | $29.49 | $28.07 | $21.01 |
| |
| Total Return2 | 2.20% | 0.88% | 11.02% | 36.43% | 13.64% |
| |
| Ratios/Supplemental Data | | | | | |
| Net Assets, End of Period (Millions) | $8,802 | $9,663 | $10,153 | $7,019 | $4,337 |
| Ratio of Total Expenses to Average Net Assets3 | 0.35% | 0.39% | 0.41% | 0.43% | 0.38% |
| Ratio of Net Investment Income to | | | | | |
| Average Net Assets | 2.00% | 1.62% | 1.53% | 1.70% | 2.00% |
| Portfolio Turnover Rate | 27% | 24% | 18% | 27% | 18% |
1 Calculated based on average shares outstanding.
2 Total returns do not include account service fees that may have applied in the periods shown. Fund prospectuses provide information about
any applicable account service fees.
3 Includes performance-based investment advisory fee increases (decreases) of (0.04%), (0.02%), 0.01%, 0.02%, and (0.03%).
See accompanying Notes, which are an integral part of the Financial Statements.
21
Selected Value Fund
Notes to Financial Statements
Vanguard Selected Value Fund is registered under the Investment Company Act of 1940 as an open-end investment company, or mutual fund.
A. The following significant accounting policies conform to generally accepted accounting principles for U.S. investment companies. The fund consistently follows such policies in preparing its financial statements.
1. Security Valuation: Securities are valued as of the close of trading on the New York Stock Exchange (generally 4 p.m., Eastern time) on the valuation date. Equity securities are valued at the latest quoted sales prices or official closing prices taken from the primary market in which each security trades; such securities not traded on the valuation date are valued at the mean of the latest quoted bid and asked prices. Securities for which market quotations are not readily available, or whose values have been materially affected by events occurring before the fund’s pricing time but after the close of the securities’ primary markets, are valued by methods deemed by the board of trustees to represent fair value. Investments in Vanguard Market Liquidity Fund are valued at that fund’s net asset value. Temporary cash investments acquired over 60 days to maturity are valued using the latest bid prices or using valuations based on a matrix system (which considers such factors as security prices, yields, maturities, and ratings), both as furnished by independent pricing services. Other temporary cash investments are valued at amortized cost, which approximates market value.
2. Futures Contracts: The fund uses index futures contracts to a limited extent, with the objective of maintaining full exposure to the stock market while maintaining liquidity. The fund may purchase or sell futures contracts to achieve a desired level of investment, whether to accommodate portfolio turnover or cash flows from capital share transactions. The primary risks associated with the use of futures contracts are imperfect correlation between changes in market values of stocks held by the fund and the prices of futures contracts, and the possibility of an illiquid market. Counterparty risk involving futures is mitigated because a regulated clearinghouse is the counterparty instead of the clearing broker. To further mitigate counterparty risk, the fund trades futures contracts on an exchange, monitors the financial strength of its clearing brokers and clearinghouse, and has entered into clearing agreements with its clearing brokers. The clearinghouse imposes initial margin requirements to secure the fund’s performance and requires daily settlement of variation margin representing changes in the market value of each contract.
Futures contracts are valued at their quoted daily settlement prices. The aggregate settlement values of the contracts are not recorded in the Statement of Assets and Liabilities. Fluctuations in the value of the contracts are recorded in the Statement of Assets and Liabilities as an asset (liability) and in the Statement of Operations as unrealized appreciation (depreciation) until the contracts are closed, when they are recorded as realized futures gains (losses).
During the year ended October 31, 2016, the fund’s average investments in long and short futures contracts represented 2% and 0% of net assets, respectively, based on the average of aggregate settlement values at each quarter-end during the period.
3. Federal Income Taxes: The fund intends to continue to qualify as a regulated investment company and distribute all of its taxable income. Management has analyzed the fund’s tax positions taken for all open federal income tax years (October 31, 2013–2016), and has concluded that no provision for federal income tax is required in the fund’s financial statements.
4. Distributions: Distributions to shareholders are recorded on the ex-dividend date.
22
Selected Value Fund
5. Securities Lending: To earn additional income, the fund lends its securities to qualified institutional borrowers. Security loans are subject to termination by the fund at any time, and are required to be secured at all times by collateral in an amount at least equal to the market value of securities loaned. Daily market fluctuations could cause the value of loaned securities to be more or less than the value of the collateral received. When this occurs, the collateral is adjusted and settled on the next business day. The fund further mitigates its counterparty risk by entering into securities lending transactions only with a diverse group of prequalified counterparties, monitoring their financial strength, and entering into master securities lending agreements with its counterparties. The master securities lending agreements provide that, in the event of a counterparty’s default (including bankruptcy), the fund may terminate any loans with that borrower, determine the net amount owed, and sell or retain the collateral up to the net amount owed to the fund; however, such actions may be subject to legal proceedings. While collateral mitigates counterparty risk, in the absence of a default the fund may experience delays and costs in recovering the securities loaned. The fund invests cash collateral received in Vanguard Market Liquidity Fund, and records a liability in the Statement of Assets and Liabilities for the return of the collateral, during the period the securities are on loan. Securities lending income represents fees charged to borrowers plus income earned on invested cash collateral, less expenses associated with the loan. During the term of the loan, the fund is entitled to all distributions made on or in respect of the loaned securities.
6. Credit Facility: The fund and certain other funds managed by The Vanguard Group (“Vanguard”) participate in a $3.1 billion committed credit facility provided by a syndicate of lenders pursuant to a credit agreement that may be renewed annually; each fund is individually liable for its borrowings, if any, under the credit facility. Borrowings may be utilized for temporary and emergency purposes, and are subject to the fund’s regulatory and contractual borrowing restrictions. The participating funds are charged administrative fees and an annual commitment fee of 0.10% of the undrawn amount of the facility; these fees are allocated to the funds based on a method approved by the fund’s board of trustees and included in Management and Administrative expenses on the fund’s Statement of Operations. Any borrowings under this facility bear interest at a rate based upon the higher of the one-month London Interbank Offered Rate, federal funds effective rate, or overnight bank funding rate plus an agreed-upon spread.
The fund had no borrowings outstanding at October 31, 2016, or at any time during the period then ended.
7. Other: Dividend income is recorded on the ex-dividend date. Interest income includes income distributions received from Vanguard Market Liquidity Fund and is accrued daily. Premiums and discounts on debt securities purchased are amortized and accreted, respectively, to interest income over the lives of the respective securities. Security transactions are accounted for on the date securities are bought or sold. Costs used to determine realized gains (losses) on the sale of investment securities are those of the specific securities sold.
B. The investment advisory firms Barrow, Hanley, Mewhinney & Strauss, LLC, Donald Smith & Co., Inc., and Pzena Investment Management, LLC, each provide investment advisory services to a portion of the fund for a fee calculated at an annual percentage rate of average net assets managed by the advisor. The basic fee of Barrow, Hanley, Mewhinney & Strauss, LLC, is subject to quarterly adjustments based on performance relative to the Russell Midcap Value Index for the preceding three years. The basic fee of Donald Smith & Co., Inc., is subject to quarterly adjustments based on performance relative to the MSCI Investable Market 2500 Index for the preceding five years. The basic fee of Pzena Investment Management, LLC, is subject to quarterly adjustments based on performance relative to the Russell Midcap Value Index since April 30, 2014.
23
Selected Value Fund
Vanguard manages the cash reserves of the fund as described below.
For the year ended October 31, 2016, the aggregate investment advisory fee represented an effective annual basic rate of 0.22% of the fund’s average net assets, before a decrease of $3,390,000 (0.04%) based on performance.
C. In accordance with the terms of a Funds’ Service Agreement (the “FSA”) between Vanguard and the fund, Vanguard furnishes to the fund corporate management, administrative, marketing, distribution, and cash management services at Vanguard’s cost of operations (as defined by the FSA). These costs of operations are allocated to the fund based on methods and guidelines approved by the board of trustees. Vanguard does not require reimbursement in the current period for certain costs of operations (such as deferred compensation/benefits and risk/insurance costs); the fund’s liability for these costs of operations is included in Payables to Vanguard on the Statement of Assets and Liabilities.
Upon the request of Vanguard, the fund may invest up to 0.40% of its net assets as capital in Vanguard. At October 31, 2016, the fund had contributed to Vanguard capital in the amount of $687,000, representing 0.01% of the fund’s net assets and 0.27% of Vanguard’s capitalization. The fund’s trustees and officers are also directors and employees, respectively, of Vanguard.
D. The fund has asked its investment advisors to direct certain security trades, subject to obtaining the best price and execution, to brokers who have agreed to rebate to the fund part of the commissions generated. Such rebates are used solely to reduce the fund’s management and administrative expenses. For the year ended October 31, 2016, these arrangements reduced the fund’s expenses by $439,000 (an annual rate of 0.00% of average net assets).
E. Various inputs may be used to determine the value of the fund’s investments. These inputs are summarized in three broad levels for financial statement purposes. The inputs or methodologies used to value securities are not necessarily an indication of the risk associated with investing in those securities.
Level 1—Quoted prices in active markets for identical securities.
Level 2—Other significant observable inputs (including quoted prices for similar securities, interest rates, prepayment speeds, credit risk, etc.).
Level 3—Significant unobservable inputs (including the fund’s own assumptions used to determine the fair value of investments).
The following table summarizes the market value of the fund’s investments as of October 31, 2016, based on the inputs used to value them:
| | | |
| | Level 1 | Level 2 | Level 3 |
| Investments | ($000) | ($000) | ($000) |
| Common Stocks | 8,487,457 | — | — |
| Temporary Cash Investments | 410,842 | 8,298 | — |
| Futures Contracts—Assets1 | 6 | — | — |
| Futures Contracts—Liabilities1 | (314) | — | — |
| Total | 8,897,991 | 8,298 | — |
| 1 Represents variation margin on the last day of the reporting period. | | | |
24
Selected Value Fund
F. At October 31, 2016, the aggregate settlement value of open futures contracts and the related unrealized appreciation (depreciation) were:
| | | | |
| | | | | ($000) |
| | | | Aggregate | |
| | | Number of | Settlement | Unrealized |
| | | Long (Short) | Value | Appreciation |
| Futures Contracts | Expiration | Contracts | Long (Short) | (Depreciation) |
| E-mini S&P 500 Index | December 2016 | 1,642 | 174,060 | (1,784) |
Unrealized appreciation (depreciation) on open futures contracts is required to be treated as realized gain (loss) for tax purposes.
G. Distributions are determined on a tax basis and may differ from net investment income and realized capital gains for financial reporting purposes. Differences may be permanent or temporary. Permanent differences are reclassified among capital accounts in the financial statements to reflect their tax character. Temporary differences arise when certain items of income, expense, gain, or loss are recognized in different periods for financial statement and tax purposes. These differences will reverse at some time in the future. Differences in classification may also result from the treatment of short-term gains as ordinary income for tax purposes.
During the year ended October 31, 2016, the fund realized net foreign currency losses of $32,000, which decreased distributable net income for tax purposes; accordingly, such losses have been reclassified from accumulated net realized gains to undistributed net investment income.
The fund used a tax accounting practice to treat a portion of the price of capital shares redeemed during the year as distributions from net investment income and realized capital gains. Accordingly, the fund has reclassified $17,036,000 from undistributed net investment income, and $27,138,000 from accumulated net realized gains, to paid-in capital.
For tax purposes, at October 31, 2016, the fund had $129,021,000 of ordinary income and $259,750,000 of long-term capital gains available for distribution.
At October 31, 2016, the cost of investment securities for tax purposes was $7,372,296,000. Net unrealized appreciation of investment securities for tax purposes was $1,534,301,000, consisting of unrealized gains of $2,243,602,000 on securities that had risen in value since their purchase and $709,301,000 in unrealized losses on securities that had fallen in value since their purchase.
H. During the year ended October 31, 2016, the fund purchased $2,352,037,000 of investment securities and sold $2,886,715,000 of investment securities, other than temporary cash investments.
25
| | |
| Selected Value Fund | | |
| |
| |
| |
| |
| I. Capital shares issued and redeemed were: | | |
| | Year Ended October 31, |
| | 2016 | 2015 |
| | Shares | Shares |
| | (000) | (000) |
| Issued | 63,300 | 62,441 |
| Issued in Lieu of Cash Distributions | 17,506 | 17,943 |
| Redeemed | (100,972) | (81,402) |
| Net Increase (Decrease) in Shares Outstanding | (20,166) | (1,018) |
J. Certain of the fund’s investments are in companies that are considered to be affiliated companies of the fund because the fund owns more than 5% of the outstanding voting securities of the company or the issuer is another member of The Vanguard Group. Transactions during the period in securities of these companies were as follows:
| | | | | | |
| | | | Current Period Transactions | |
| | Oct. 31, | | Proceeds | | | Oct. 31, |
| | 2015 | | from | | Capital Gain | 2016 |
| | Market | Purchases | Securities | | Distributions | Market |
| | Value | at Cost | Sold1 | Income | Received | Value |
| | ($000) | ($000) | ($000) | ($000) | ($000) | ($000) |
| GEO Group Inc. | — | 88,638 | — | 2,497 | — | 92,023 |
| SeaWorld Entertainment Inc. | 102,468 | — | 10,832 | 3,612 | — | 63,699 |
| SPX FLOW Inc. | 84,631 | — | 52,087 | — | — | — |
| Vanguard Market Liquidity Fund | 708,715 | NA2 | NA 2 | 2,076 | — | 410,842 |
| Vanguard Mid-Cap Value ETF | 29,626 | — | 29,453 | 283 | — | — |
| Total | 925,440 | | | 8,468 | — | 566,564 |
| 1 Includes net realized gain (loss) on affiliated investment securities sold of ($58,795,000). |
| 2 Not applicable—purchases and sales are for temporary cash investment purposes. |
K. Management has determined that no material events or transactions occurred subsequent to October 31, 2016, that would require recognition or disclosure in these financial statements.
26
Report of Independent Registered Public Accounting Firm
To the Board of Trustees of Vanguard Whitehall Funds and the Shareholders of Vanguard Selected Value Fund:
In our opinion, the accompanying statement of net assets, statement of assets and liabilities and the related statements of operations and of changes in net assets and the financial highlights present fairly, in all material respects, the financial position of Vanguard Selected Value Fund (constituting a separate portfolio of Vanguard Whitehall Funds, hereafter referred to as the “Fund”) at October 31, 2016, the results of its operations for the year then ended, the changes in its net assets for each of the two years in the period then ended, and the financial highlights for each of the five years in the period then ended, in conformity with accounting principles generally accepted in the United States of America. These financial statements and financial highlights (hereafter referred to as “financial statements”) are the responsibility of the Fund’s management. Our responsibility is to express an opinion on these financial statements based on our audits. We conducted our audits of these financial statements in accordance with the standards of the Public Company Accounting Oversight Board (United States). Those standards require that we plan and perform the audit to obtain reasonable assurance about whether the financial statements are free of material misstatement. An audit includes examining, on a test basis, evidence supporting the amounts and disclosures in the financial statements, assessing the accounting principles used and significant estimates made by management, and evaluating the overall financial statement presentation. We believe that our audits, which included confirmation of securities at October 31, 2016 by correspondence with the custodian and brokers and by agreement to the underlying ownership records of the transfer agent, provide a reasonable basis for our opinion.
/s/PricewaterhouseCoopers LLP
Philadelphia, Pennsylvania
December 15, 2016
Special 2016 tax information (unaudited) for Vanguard Selected Value Fund
This information for the fiscal year ended October 31, 2016, is included pursuant to provisions of the Internal Revenue Code.
The fund distributed $345,803,000 as capital gain dividends (20% rate gain distributions) to shareholders during the fiscal year.
For nonresident alien shareholders, 100% of short-term capital gain dividends distributed by the fund are qualified short-term capital gains.
The fund distributed $167,214,000 of qualified dividend income to shareholders during the fiscal year.
For corporate shareholders, 77.1% of investment income (dividend income plus short-term gains, if any) qualifies for the dividends-received deduction.
27
Your Fund’s After-Tax Returns
This table presents returns for your fund both before and after taxes. The after-tax returns are shown in two ways: (1) assuming that an investor owned the fund during the entire period and paid taxes on the fund’s distributions, and (2) assuming that an investor paid taxes on the fund’s distributions and sold all shares at the end of each period.
Calculations are based on the highest individual federal income tax and capital gains tax rates in effect at the times of the distributions and the hypothetical sales. State and local taxes were not considered. After-tax returns reflect any qualified dividend income, using actual prior-year figures and estimates for 2016. (In the example, returns after the sale of fund shares may be higher than those assuming no sale. This occurs when the sale would have produced a capital loss. The calculation assumes that the investor received a tax deduction for the loss.)
Please note that your actual after-tax returns will depend on your tax situation and may differ from those shown. Also note that if you own the fund in a tax-deferred account, such as an individual retirement account or a 401(k) plan, this information does not apply to you. Such accounts are not subject to current taxes.
Finally, keep in mind that a fund’s performance—whether before or after taxes—does not guarantee future results.
| | | |
| Average Annual Total Returns: Selected Value Fund | | | |
| Periods Ended October 31, 2016 | | | |
| | One | Five | Ten |
| | Year | Years | Years |
| Returns Before Taxes | 2.20% | 12.16% | 6.95% |
| Returns After Taxes on Distributions | 0.88 | 11.16 | 6.08 |
| Returns After Taxes on Distributions and Sale of Fund Shares | 2.21 | 9.67 | 5.53 |
28
About Your Fund’s Expenses
As a shareholder of the fund, you incur ongoing costs, which include costs for portfolio management, administrative services, and shareholder reports (like this one), among others. Operating expenses, which are deducted from a fund’s gross income, directly reduce the investment return of the fund.
A fund’s expenses are expressed as a percentage of its average net assets. This figure is known as the expense ratio. The following examples are intended to help you understand the ongoing costs (in dollars) of investing in your fund and to compare these costs with those of other mutual funds. The examples are based on an investment of $1,000 made at the beginning of the period shown and held for the entire period.
The accompanying table illustrates your fund’s costs in two ways:
• Based on actual fund return. This section helps you to estimate the actual expenses that you paid over the period. The ”Ending Account Value“ shown is derived from the fund‘s actual return, and the third column shows the dollar amount that would have been paid by an investor who started with $1,000 in the fund. You may use the information here, together with the amount you invested, to estimate the expenses that you paid over the period.
To do so, simply divide your account value by $1,000 (for example, an $8,600 account value divided by $1,000 = 8.6), then multiply the result by the number given for your fund under the heading ”Expenses Paid During Period.“
• Based on hypothetical 5% yearly return. This section is intended to help you compare your fund‘s costs with those of other mutual funds. It assumes that the fund had a yearly return of 5% before expenses, but that the expense ratio is unchanged. In this case—because the return used is not the fund’s actual return—the results do not apply to your investment. The example is useful in making comparisons because the Securities and Exchange Commission requires all mutual funds to calculate expenses based on a 5% return. You can assess your fund’s costs by comparing this hypothetical example with the hypothetical examples that appear in shareholder reports of other funds.
Note that the expenses shown in the table are meant to highlight and help you compare ongoing costs only and do not reflect transaction costs incurred by the fund for buying and selling securities. Further, the expenses do not include any purchase, redemption, or account service fees described in the fund prospectus. If such fees were applied to your account, your costs would be higher. Your fund does not carry a “sales load.”
The calculations assume no shares were bought or sold during the period. Your actual costs may have been higher or lower, depending on the amount of your investment and the timing of any purchases or redemptions.
You can find more information about the fund’s expenses, including annual expense ratios, in the Financial Statements section of this report. For additional information on operating expenses and other shareholder costs, please refer to your fund’s current prospectus.
29
| | | |
| Six Months Ended October 31, 2016 | | | |
| | Beginning | Ending | Expenses |
| | Account Value | Account Value | Paid During |
| Selected Value Fund | 4/30/2016 | 10/31/2016 | Period |
| Based on Actual Fund Return | $1,000.00 | $1,010.01 | $1.57 |
| Based on Hypothetical 5% Yearly Return | 1,000.00 | 1,023.58 | 1.58 |
The calculations are based on expenses incurred in the most recent six-month period. The fund’s annualized six-month expense ratio for that period is 0.31%. The dollar amounts shown as “Expenses Paid” are equal to the annualized expense ratio multiplied by the average account value over the period, multiplied by the number of days in the most recent six-month period, then divided by the number of days in the most recent 12-month period (184/366).
30
Glossary
30-Day SEC Yield. A fund’s 30-day SEC yield is derived using a formula specified by the U.S. Securities and Exchange Commission. Under the formula, data related to the fund’s security holdings in the previous 30 days are used to calculate the fund’s hypothetical net income for that period, which is then annualized and divided by the fund’s estimated average net assets over the calculation period. For the purposes of this calculation, a security’s income is based on its current market yield to maturity (for bonds), its actual income (for asset-backed securities), or its projected dividend yield (for stocks). Because the SEC yield represents hypothetical annualized income, it will differ—at times significantly—from the fund’s actual experience. As a result, the fund’s income distributions may be higher or lower than implied by the SEC yield.
Beta. A measure of the magnitude of a fund’s past share-price fluctuations in relation to the ups and downs of a given market index. The index is assigned a beta of 1.00. Compared with a given index, a fund with a beta of 1.20 typically would have seen its share price rise or fall by 12% when the index rose or fell by 10%. For this report, beta is based on returns over the past 36 months for both the fund and the index. Note that a fund’s beta should be reviewed in conjunction with its R-squared (see definition). The lower the R-squared, the less correlation there is between the fund and the index, and the less reliable beta is as an indicator of volatility.
Dividend Yield. Dividend income earned by stocks, expressed as a percentage of the aggregate market value (or of net asset value, for a fund). The yield is determined by dividing the amount of the annual dividends by the aggregate value (or net asset value) at the end of the period. For a fund, the dividend yield is based solely on stock holdings and does not include any income produced by other investments.
Earnings Growth Rate. The average annual rate of growth in earnings over the past five years for the stocks now in a fund.
Equity Exposure. A measure that reflects a fund’s investments in stocks and stock futures. Any holdings in short-term reserves are excluded.
Expense Ratio. A fund’s total annual operating expenses expressed as a percentage of the fund’s average net assets. The expense ratio includes management and administrative expenses, but does not include the transaction costs of buying and selling portfolio securities.
Foreign Holdings. The percentage of a fund represented by securities or depositary receipts of companies based outside the United States.
Inception Date. The date on which the assets of a fund (or one of its share classes) are first invested in accordance with the fund’s investment objective. For funds with a subscription period, the inception date is the day after that period ends. Investment performance is measured from the inception date.
Median Market Cap. An indicator of the size of companies in which a fund invests; the midpoint of market capitalization (market price x shares outstanding) of a fund’s stocks, weighted by the proportion of the fund’s assets invested in each stock. Stocks representing half of the fund’s assets have market capitalizations above the median, and the rest are below it.
Price/Book Ratio. The share price of a stock divided by its net worth, or book value, per share. For a fund, the weighted average price/book ratio of the stocks it holds.
31
Price/Earnings Ratio. The ratio of a stock’s current price to its per-share earnings over the past year. For a fund, the weighted average P/E of the stocks it holds. P/E is an indicator of market expectations about corporate prospects; the higher the P/E, the greater the expectations for a company’s future growth.
R-Squared. A measure of how much of a fund’s past returns can be explained by the returns from the market in general, as measured by a given index. If a fund’s total returns were precisely synchronized with an index’s returns, its R-squared would be 1.00. If the fund’s returns bore no relationship to the index’s returns, its R-squared would be 0. For this report, R-squared is based on returns over the past 36 months for both the fund and the index.
Return on Equity. The annual average rate of return generated by a company during the past five years for each dollar of shareholder’s equity (net income divided by shareholder’s equity). For a fund, the weighted average return on equity for the companies whose stocks it holds.
Short-Term Reserves. The percentage of a fund invested in highly liquid, short-term securities that can be readily converted to cash.
Turnover Rate. An indication of the fund’s trading activity. Funds with high turnover rates incur higher transaction costs and may be more likely to distribute capital gains (which may be taxable to investors). The turnover rate excludes in-kind transactions, which have minimal impact on costs.
32
This page intentionally left blank.
This page intentionally left blank.
This page intentionally left blank.
The People Who Govern Your Fund
The trustees of your mutual fund are there to see that the fund is operated and managed in your best interests since, as a shareholder, you are a part owner of the fund. Your fund’s trustees also serve on the board of directors of The Vanguard Group, Inc., which is owned by the Vanguard funds and provides services to them on an at-cost basis.
A majority of Vanguard’s board members are independent, meaning that they have no affiliation with Vanguard or the funds they oversee, apart from the sizable personal investments they have made as private individuals. The independent board members have distinguished backgrounds in business, academia, and public service. Each of the trustees and executive officers oversees 198 Vanguard funds.
The following table provides information for each trustee and executive officer of the fund. The mailing address of the trustees and officers is P.O. Box 876, Valley Forge, PA 19482. More information about the trustees is in the Statement of Additional Information, which can be obtained, without charge, by contacting Vanguard at 800-662-7447, or online at vanguard.com.
Interested Trustee1
F. William McNabb III
Born 1957. Trustee Since July 2009. Chairman of the Board. Principal Occupation(s) During the Past Five Years and Other Experience: Chairman of the Board of The Vanguard Group, Inc., and of each of the investment companies served by The Vanguard Group, since January 2010; Director of The Vanguard Group since 2008; Chief Executive Officer and President of The Vanguard Group, and of each of the investment companies served by The Vanguard Group, since 2008; Director of Vanguard Marketing Corporation; Managing Director of The Vanguard Group (1995–2008).
Independent Trustees
Emerson U. Fullwood
Born 1948. Trustee Since January 2008. Principal Occupation(s) During the Past Five Years and Other Experience: Executive Chief Staff and Marketing Officer for North America and Corporate Vice President (retired 2008) of Xerox Corporation (document management products and services); Executive in Residence and 2009–2010 Distinguished Minett Professor at the Rochester Institute of Technology; Lead Director of SPX FLOW, Inc. (multi-industry manufacturing); Director of the United Way of Rochester, the University of Rochester Medical Center, Monroe Community College Foundation, North Carolina A&T University, and Roberts Wesleyan College.
Rajiv L. Gupta
Born 1945. Trustee Since December 2001.2 Principal Occupation(s) During the Past Five Years and Other Experience: Chairman and Chief Executive Officer (retired 2009) and President (2006–2008) of Rohm and Haas Co. (chemicals); Director of Tyco International plc (diversified manufacturing and services), HP Inc. (printer and personal computer manufacturing), and Delphi Automotive plc (automotive components); Senior Advisor at New Mountain Capital.
Amy Gutmann
Born 1949. Trustee Since June 2006. Principal Occupation(s) During the Past Five Years and Other Experience: President of the University of Pennsylvania; Christopher H. Browne Distinguished Professor of Political Science, School of Arts and Sciences, and Professor of Communication, Annenberg School for Communication, with secondary faculty appointments in the Department of Philosophy, School of Arts and Sciences, and at the Graduate School of Education, University of Pennsylvania; Trustee of the National Constitution Center; Chair of the Presidential Commission for the Study of Bioethical Issues.
JoAnn Heffernan Heisen
Born 1950. Trustee Since July 1998. Principal Occupation(s) During the Past Five Years and Other Experience: Corporate Vice President and Chief Global Diversity Officer (retired 2008) and Member of the Executive Committee (1997–2008) of Johnson & Johnson (pharmaceuticals/medical devices/consumer products); Director of Skytop Lodge Corporation (hotels) and the Robert Wood Johnson Foundation; Member of the Advisory Board of the Institute for Women’s Leadership at Rutgers University.
F. Joseph Loughrey
Born 1949. Trustee Since October 2009. Principal Occupation(s) During the Past Five Years and Other Experience: President and Chief Operating Officer (retired 2009) of Cummins Inc. (industrial machinery); Chairman of the Board of Hillenbrand, Inc. (specialized consumer services), and of Oxfam America; Director of SKF AB (industrial machinery), Hyster-Yale Materials Handling, Inc. (forklift trucks), the Lumina Foundation for Education, and the V Foundation for Cancer Research; Member of the Advisory Council for the College of Arts and Letters and of the Advisory Board to the Kellogg Institute for International Studies, both at the University of Notre Dame.
Mark Loughridge
Born 1953. Trustee Since March 2012. Principal Occupation(s) During the Past Five Years and Other Experience: Senior Vice President and Chief Financial Officer (retired 2013) at IBM (information technology services); Fiduciary Member of IBM’s Retirement Plan Committee (2004–2013); Director of the Dow Chemical Company; Member of the Council on Chicago Booth.
Scott C. Malpass
Born 1962. Trustee Since March 2012. Principal Occupation(s) During the Past Five Years and Other Experience: Chief Investment Officer and Vice President at the University of Notre Dame; Assistant Professor of Finance at the Mendoza College of Business at Notre Dame; Member of the Notre Dame 403(b) Investment Committee, the Board of Advisors for Spruceview Capital Partners, and the Investment Advisory Committee of Major League Baseball; Board Member of TIFF Advisory Services, Inc., and Catholic Investment Services, Inc. (investment advisors).
André F. Perold
Born 1952. Trustee Since December 2004. Principal Occupation(s) During the Past Five Years and Other Experience: George Gund Professor of Finance and Banking, Emeritus at the Harvard Business School (retired 2011); Chief Investment Officer and Managing Partner of HighVista Strategies LLC (private investment firm); Director of Rand Merchant Bank; Overseer of the Museum of Fine Arts Boston.
Peter F. Volanakis
Born 1955. Trustee Since July 2009. Principal Occupation(s) During the Past Five Years and Other Experience: President and Chief Operating Officer (retired 2010) of Corning Incorporated (communications equipment); Chairman of the Board of Trustees of Colby-Sawyer College; Member of the Advisory Board of the Norris Cotton Cancer Center.
Executive Officers
Glenn Booraem
Born 1967. Treasurer Since May 2015. Principal Occupation(s) During the Past Five Years and Other Experience: Principal of The Vanguard Group, Inc.; Treasurer of each of the investment companies served by The Vanguard Group; Controller of each of the investment companies served by The Vanguard Group (2010–2015); Assistant Controller of each of the investment companies served by The Vanguard Group (2001–2010).
Thomas J. Higgins
Born 1957. Chief Financial Officer Since September 2008. Principal Occupation(s) During the Past Five Years and Other Experience: Principal of The Vanguard Group, Inc.; Chief Financial Officer of each of the investment companies served by The Vanguard Group; Treasurer of each of the investment companies served by The Vanguard Group (1998–2008).
Peter Mahoney
Born 1974. Controller Since May 2015. Principal Occupation(s) During the Past Five Years and Other Experience: Head of Global Fund Accounting at The Vanguard Group, Inc.; Controller of each of the investment companies served by The Vanguard Group; Head of International Fund Services at The Vanguard Group (2008–2014).
Anne E. Robinson
Born 1970. Secretary Since September 2016. Principal Occupation(s) During the Past Five Years and Other Experience: Managing Director of The Vanguard Group, Inc.; General Counsel of The Vanguard Group; Secretary of The Vanguard Group and of each of the investment companies served by The Vanguard Group; Director and Senior Vice President of Vanguard Marketing Corporation; Managing Director and General Counsel of Global Cards and Consumer Services at Citigroup (2014–2016); Counsel at American Express (2003–2014).
| |
| Vanguard Senior ManagementTeam |
| Mortimer J. Buckley | James M. Norris |
| Kathleen C. Gubanich | Thomas M. Rampulla |
| Martha G. King | Glenn W. Reed |
| John T. Marcante | Karin A. Risi |
| Chris D. McIsaac | Michael Rollings |
Chairman Emeritus and Senior Advisor
John J. Brennan
Chairman, 1996–2009
Chief Executive Officer and President, 1996–2008
Founder
John C. Bogle
Chairman and Chief Executive Officer, 1974–1996
1 Mr. McNabb is considered an “interested person,” as defined in the Investment Company Act of 1940, because he is an officer of the Vanguard funds.
2 December 2002 for Vanguard Equity Income Fund, the Vanguard Municipal Bond Funds, and the Vanguard State Tax-Exempt Funds.
| |
| |
| |
|  |
| P.O. Box 2600
Valley Forge, PA 19482-2600 |
Connect with Vanguard® > vanguard.com | |
| |
| Fund Information > 800-662-7447 | CFA® is a registered trademark owned by CFA Institute. |
| Direct Investor Account Services > 800-662-2739 | |
| Institutional Investor Services > 800-523-1036 | |
| Text Telephone for People | |
| Who Are Deaf or Hard of Hearing> 800-749-7273 | |
| |
| This material may be used in conjunction | |
| with the offering of shares of any Vanguard | |
| fund only if preceded or accompanied by | |
| the fund’s current prospectus. | |
| |
| All comparative mutual fund data are from Lipper, a | |
| Thomson Reuters Company, or Morningstar, Inc., unless | |
| otherwise noted. | |
| |
| You can obtain a free copy of Vanguard’s proxy voting | |
| guidelines by visiting vanguard.com/proxyreporting or by | |
| calling Vanguard at 800-662-2739. The guidelines are | |
| also available from the SEC’s website, sec.gov. In | |
| addition, you may obtain a free report on how your fund | |
| voted the proxies for securities it owned during the 12 | |
| months ended June 30. To get the report, visit either | |
| vanguard.com/proxyreporting or sec.gov. | |
| |
| You can review and copy information about your fund at | |
| the SEC’s Public Reference Room in Washington, D.C. To | |
| find out more about this public service, call the SEC at | |
| 202-551-8090. Information about your fund is also | |
| available on the SEC’s website, and you can receive | |
| copies of this information, for a fee, by sending a | |
| request in either of two ways: via email addressed to | |
| publicinfo@sec.gov or via regular mail addressed to the | |
| Public Reference Section, Securities and Exchange | |
| Commission, Washington, DC 20549-1520. | |
| |
| | © 2016 The Vanguard Group, Inc. |
| | All rights reserved. |
| | Vanguard Marketing Corporation, Distributor. |
| |
| | Q9340 122016 |
 |
| Annual Report | October 31, 2016 |
| Vanguard Mid-Cap Growth Fund |
A new format, unwavering commitment
As you begin reading this report, you’ll notice that we’ve made some improvements to the opening sections—based on feedback from you, our clients.
Page 1 starts with a new ”Your Fund’s Performance at a Glance,” a concise, handy summary of how your fund performed during the period.
In the renamed ”Chairman’s Perspective,” Bill McNabb will focus on enduring principles and investment insights.
We’ve modified some tables, and eliminated some redundancy, but we haven’t removed any information.
At Vanguard, we’re always looking for better ways to communicate and to help you make sound investment decisions. Thank you for entrusting your assets to us.
| |
| Contents | |
| Your Fund’s Performance at a Glance. | 1 |
| Chairman’s Perspective. | 3 |
| Advisors’ Report. | 7 |
| Fund Profile. | 11 |
| Performance Summary. | 12 |
| Financial Statements. | 14 |
| Your Fund’s After-Tax Returns. | 25 |
| About Your Fund’s Expenses. | 26 |
| Glossary. | 28 |
Please note: The opinions expressed in this report are just that—informed opinions. They should not be considered promises or advice. Also, please keep in mind that the information and opinions cover the period through the date on the front of this report. Of course, the risks of investing in your fund are spelled out in the prospectus.
See the Glossary for definitions of investment terms used in this report.
About the cover: No matter what language you speak, Vanguard has one consistent message and set of principles. Our primary focus is on you, our clients. We conduct our business with integrity as a faithful steward of your assets. This message is shown translated into seven languages, reflecting our expanding global presence.
Your Fund’s Performance at a Glance
• Vanguard Mid-Cap Growth Fund returned –5.49% for the 12 months ended October 31, 2016. The fund trailed the 0.40% return of its benchmark, the Russell Midcap Growth Index, and the –1.06% average return of its mid-cap growth fund peers.
• Value stocks outperformed their growth counterparts in the U.S. stock market, while large- and small-capitalization stocks exceeded mid-caps.
• Two advisors separately manage fund assets. Their selections among financials—notably real estate investment trusts and related firms—performed especially poorly and finished well behind their benchmark counterparts. (Effective September 1, real estate was designated as its own new sector, the 11th in the benchmark.)
• Strong holdings in the materials sector couldn’t offset additional shortfalls in consumer discretionary, health care, and consumer staples.
• Over the past ten years, the fund’s average annual return of 7.48% slightly trailed that of its benchmark index, which bears no expenses, and surpassed that of its peers.
| |
| Total Returns: Fiscal Year Ended October 31, 2016 | |
| | Total |
| | Returns |
| Vanguard Mid-Cap Growth Fund | -5.49% |
| Russell Midcap Growth Index | 0.40 |
| Mid-Cap Growth Funds Average | -1.06 |
| Mid-Cap Growth Funds Average: Derived from data provided by Lipper, a Thomson Reuters Company. | |
| |
| |
| Total Returns: Ten Years Ended October 31, 2016 | |
| | Average |
| | Annual Return |
| Mid-Cap Growth Fund | 7.48% |
| Russell Midcap Growth Index | 7.65 |
| Mid-Cap Growth Funds Average | 6.26 |
| Mid-Cap Growth Funds Average: Derived from data provided by Lipper, a Thomson Reuters Company. | |
The figures shown represent past performance, which is not a guarantee of future results. (Current performance may be lower or higher than the performance data cited. For performance data current to the most recent month-end, visit our website at vanguard.com/performance.) Note, too, that both investment returns and principal value can fluctuate widely, so an investor’s shares, when sold, could be worth more or less than their original cost.
1
| | |
| Expense Ratios | | |
| Your Fund Compared With Its Peer Group | | |
| | | Peer Group |
| | Fund | Average |
| Mid-Cap Growth Fund | 0.43% | 1.31% |
The fund expense ratio shown is from the prospectus dated February 25, 2016, and represents estimated costs for the current fiscal year. For the fiscal year ended October 31, 2016, the fund’s expense ratio was 0.36%. The peer-group expense ratio is derived from data provided by Lipper, a Thomson Reuters Company, and captures information through year-end 2015.
Peer group: Mid-Cap Growth Funds.
2
Chairman’s Perspective

Bill McNabb
Chairman and Chief Executive Officer
Dear Shareholder,
Over the three years ended August 31, 2016, investors poured more than $1 trillion into index funds. Indexing now accounts for nearly a third of all mutual fund assets—more than double what it did a decade ago and eight times its share two decades ago.1
By contrast, active management’s commercial struggles have reflected its disappointing investment performance. Over the decade ended December 31, 2015, 82% of actively managed stock funds and 81% of active bond funds have either underperformed their benchmarks or shut down.
This subpar performance has fueled the explosion of asset growth in indexing among individual, retirement, and nonprofit investors. So what might the trend mean for the future of actively managed funds?
Our research and experience indicate that active management can survive—and even succeed—but only if it’s offered at much lower expense.
High costs, which limit a manager’s ability to deliver benchmark-beating returns to clients, are the biggest reason why active has lagged. Industrywide as of December 31, 2015, the average expense ratio for all active stock funds is 1.14%, compared with 0.76% for stock index
1 Sources: Wall Street Journal; Morningstar, Inc.; and Investment Company Institute,
3
funds. And the expense advantage is even wider for bonds; the average expense ratio for an active bond fund is 0.93%, compared with 0.43% for bond index funds.
But even these big differences understate the real gap. These days, it’s not hard to find an index fund that charges maybe 0.05% or 0.10%. So even if you have identified active managers who are skilled at selecting stocks and bonds, to match the return of a comparable (much cheaper) index fund would require significant outperformance. Think about it. Any fund that charges 1.00% in expenses—not even the high end of the range—will find it extraordinarily difficult to overcome the index fund’s head start.
Active management also has taken a hit from a regulatory environment that has been favorable to low-cost strategies. The U.S. Department of Labor several years ago mandated greater disclosure of retirement plan fees. And its new fiduciary rule, which is set to take effect in April, requires financial advisors to demonstrate that their recommendations are aligned with their clients’ best interest. Both changes encourage the use of lower-cost investments, including index funds.
The future of active management
In light of all this, people have been asking me whether active management is “dead.” My response is both yes and no. High-cost active management is dead, and rightly so. It has never been a winning proposition
| | | |
| Market Barometer | | | |
| | | Average Annual Total Returns |
| | | Periods Ended October 31, 2016 |
| | One | Three | Five |
| | Year | Years | Years |
| Stocks | | | |
| Russell 1000 Index (Large-caps) | 4.26% | 8.48% | 13.51% |
| Russell 2000 Index (Small-caps) | 4.11 | 4.12 | 11.51 |
| Russell 3000 Index (Broad U.S. market) | 4.24 | 8.13 | 13.35 |
| FTSE All-World ex US Index (International) | 0.64 | -0.94 | 4.09 |
| |
| Bonds | | | |
| Bloomberg Barclays U.S. Aggregate Bond Index | | | |
| (Broad taxable market) | 4.37% | 3.48% | 2.90% |
| Bloomberg Barclays Municipal Bond Index | | | |
| (Broad tax-exempt market) | 4.06 | 4.89 | 4.34 |
| Citigroup Three-Month U.S. Treasury Bill Index | 0.22 | 0.07 | 0.07 |
| |
| CPI | | | |
| Consumer Price Index | 1.64% | 1.15% | 1.32% |
4
for investors. Low-cost active funds, though, can potentially play an important role for investors who seek to outperform the market.
Paying less for your funds is the only sure-fire way to improve your odds of achieving success in active management. But even if you have found an active manager with low costs, the odds of outperforming the market are still long. You have to be able to identify talented stock and bond portfolio managers with long time horizons and clear investment strategies. Look for managers with consistent track records and the discipline to stick closely to their investment strategy.
Know what you own and why
Despite the well-deserved reputation of indexing and the challenges for active managers, there’s still a place for traditional active strategies that are low-cost, diversified, and highly disciplined, and are run by talented managers who focus on the long term.
Vanguard has always applied these principles to our active strategies, and investors have benefited as a majority of our active funds outperformed their benchmarks and bested their peers’ average annual return over the ten years ended September 30, 2016.
Worried about the election’s impact on your portfolio?
The 2016 presidential election season was one of the most intense and unpredictable in U.S. history. In its aftermath, investors may be left with lingering questions about what the outcome will mean for their portfolios. The answer, based on Vanguard research into decades of historical data, is that presidential elections typically have no long-term effect on market performance.
These findings hold true regardless of the market’s initial reaction. Whether there’s a swoon or bounce immediately after an election, investors shouldn’t extrapolate that performance to the long term.
As you can see in the accompanying chart, data going back to 1853 show that stock market returns are virtually identical no matter which party controls the White House. Although headlines out of Washington at any given time may still cause concern, investors shouldn’t overreact to short-term events. Instead, it’s best to maintain a balanced and diversified portfolio and stay focused on your long-term goals.
Average annual stock market returns based on party control of the White House (1853–2015)
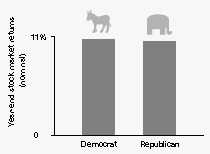
Sources: Global Financial Data, 1853–1926; Morningstar, Inc., and Ibbotson Associates thereafter through 2015.
5
But it’s crucial for investors to be patient. Even active managers with the best track records frequently underperform their benchmarks when their investment styles are out of favor. Such periods, though temporary, can persist. So it’s important when entrusting your assets to an active strategy to be in it for the long haul.
Make sure you know what you’re buying and what the risks are. Active strategies are becoming more complex, so it’s important to clearly understand what the investments in your portfolio are designed to accomplish and why you want to hold them. Otherwise, you run the risk of selecting strategies that don’t fit your needs or objectives.
Keeping these considerations in mind can potentially boost your chances of success in identifying active strategies that may be able to help you reach your goals.
As always, thank you for investing with Vanguard.
Sincerely,

F. William McNabb III
Chairman and Chief Executive Officer
November 9, 2016
6
Advisors’ Report
During the 12 months ended October 31, 2016, Vanguard Mid-Cap Growth Fund returned –5.49%. Your fund is managed by two independent advisors, a strategy that enhances the fund’s diversification by providing exposure to distinct yet complementary investment approaches.
Please note that William Blair Investment Management, LLC, marked its tenth anniversary of managing a portion of the fund’s assets in June. Also, after the end of the period, on December 5, Vanguard announced that Chartwell Investment Partners, LLC, would no longer serve as an advisor to the fund. Assets managed by Chartwell have been allocated to RS Investments, a Victory Capital Management investment franchise.
The fund’s advisors during the fiscal year, the percentage of fund assets each managed, and brief descriptions of their investment strategies are presented in the table below. The advisors have also prepared a discussion of the investment environment that existed during the fiscal year and of how their portfolio positioning reflects this assessment. It’s not uncommon for different advisors to have different views about individual securities or the broader investment environment. These comments were prepared on November 15, 2016.
| | | |
| Vanguard Mid-Cap Growth Fund Investment Advisors |
| |
| | Fund Assets Managed | |
| Investment Advisor | % | $ Million | Investment Strategy |
| Chartwell Investment Partners, | 49 | 1,940 | Uses a bottom-up, fundamental, research-driven |
| LLC | | | stock-selection strategy focusing on companies with |
| | | | sustainable growth, strong management teams, |
| | | | competitive positions, and outstanding product and |
| | | | service offerings. These companies should continually |
| | | | demonstrate growth in earnings per share. |
| William Blair Investment | 49 | 1,938 | Uses a fundamental investment approach in pursuit of |
| Management, LLC | | | superior long-term investment results from |
| | | | growth-oriented companies with leadership positions |
| | | | and strong market presence. |
| Cash Investments | 2 | 102 | These short-term reserves are invested by Vanguard in |
| | | | equity index products to simulate investment in stocks. |
| | | | Each advisor may also maintain a modest cash |
| | | | position. |
7
Chartwell Investment Partners, LLC
Portfolio Manager:
John A. Heffern, Managing Partner and Senior Portfolio Manager
Equity markets delivered modestly positive performance for the past 12 months. Concerns during the period included the state of the global economy, heightened terrorist activity, geopolitical events, the U.K. Brexit referendum, Federal Reserve rate decisions, and the presidential election campaign. However, gradual easing of some of these issues, accommodative monetary policy, and a rebound in oil prices improved market sentiment in the last six months and drove returns into positive territory.
Against this backdrop, our portfolio decisions steadfastly reflected our bias toward quality, leadership, defensible margins, and a pattern of successful execution around growth-oriented business models.
In consumer services, MGM Resorts International and Burlington Stores boosted the portfolio’s overall performance. MGM, a casino operator with properties in the United States and Asia, benefited from share gains in both its business and leisure segments along with a strong development pipeline. Burlington Stores, an off-price retailer, increased its revenues and profit margin as it executed its business model.
Financial services stocks also did well. Popular, a bank holding company with operations in Puerto Rico and the United States, held steady and maintained ample capital while weathering Puerto Rico’s debt crisis. Market share gains, consolidation opportunities, excess capital, and undemanding valuation drove solid stock performance for Assured Guaranty, the largest and highest-rated U.S. financial guarantor.
In technology, our holdings in Cavium made a solid contribution. The semiconductor provider experienced an uptick in demand for several of its product classes as well as synergies from a recent acquisition. Another success was ServiceNow, a cloud software company with a focus on service management. It appears on track to become a multi-product company with expertise in information technology, service, and human resource management.
Selection among cyclical consumer stocks detracted the most from our performance. Several terrorist attacks, zika virus worries, macroeconomic issues in China, and higher fuel prices weighed on earnings and sentiment for both Norwegian Cruise Line and Royal Caribbean Cruises. Brunswick Corporation, a manufacturer of marine and fitness recreational products, was affected by international market and general macroeconomic concerns.
In business services, our positions in ManpowerGroup and SEI Investments dampened results. Slightly weaker
8
operating trends in some markets hurt ManpowerGroup, a provider of blue-collar temporary staffing services. Expenses related to a new processing platform pressured SEI Investments, which develops processing and investment programs for the asset management industry.
The health care sector also underperformed, particularly in the pharmaceuticals industry as competition increased for the generic drug businesses of Endo International and Perrigo.
William Blair Investment Management, LLC
Portfolio Managers: Robert C. Lanphier, Partner David Ricci, CFA, Partner
The relatively flat return of the U.S. equity market over the 12-month period masked some significant moves. The market declined precipitously in the first six weeks of 2016 amid concerns that weakness in manufacturing, falling oil prices, and persistent challenges to global growth could trigger a U.S. recession.
A mid-February reversal was spurred by further easing from foreign central banks and improving global data. From there, positive U.S. economic indicators carried the market higher until June, when the results of the Brexit vote increased investor uncertainty. After a brief pause, the market advanced again, driven by strength among more cyclical segments of the economy, before softening somewhat in October.
Our portfolio’s underperformance was primarily the result of investors’ style preferences. These were most pronounced early in 2016 when the perceived safety of high-dividend-yielding stocks dominated the market.
Our portfolio tends to be significantly underweighted in high-dividend yielders, as we prefer growth companies with substantial reinvestment opportunities that enable superior, durable long-term growth. Although the dividend-yield trade did slow in the months that followed, it remained an obstacle to relative performance.
More recently, investors favored more cyclically oriented areas of the market. Some of our typical industry biases, which in aggregate lead to a portfolio with less cyclicality than the benchmark index, dampened relative returns. For example, in information technology we tend to be underweighted in semiconductors because their commodity-like nature limits their pricing power and cyclicality. Conversely, we generally are overweighted in software and IT services, which tend to have more differentiated products and services, higher value propositions, and more durable growth. This typical positioning worked against us during the period as semiconductors significantly outperformed.
On a stock-specific basis, selection within financials detracted from returns, in part because of our positions in Affiliated Managers Group and Signature Bank. Other laggards included health care companies Perrigo and MEDNAX and consumer discretionary firm Polaris Industries.
9
Our holdings in industrials, including a position in Old Dominion Freight Line, performed well. Other top contributors included Airgas (materials), Akamai Technologies (information technology), Dollar General (consumer discretionary), and IDEXX Laboratories (health care).
Looking forward, U.S. investors’ minds are focused on the trajectory of interest rates and the aftermath of the U.S. presidential election. While we evaluate the investment risks and implications of such events, we do not position the portfolio based on possible outcomes. We believe that we can add the most value by investing in quality companies that can grow their earnings faster than the market over the long term.
We are now probably past the midpoint in the recovery from the global financial crisis. Therefore, we believe the risks of an economic slowdown are higher than they have been in the recent past. Slow U.S. and global growth, potential adverse effects from Brexit, rising wages, and unfavorable currency rates are all likely to challenge corporate profit growth.
In this environment, it is our view that earnings growth, rather than valuation expansion, is likely to drive stock performance. We believe our time is best spent focusing on companies with durable, consistent business models that are less dependent on the macroeconomic or political environment to grow earnings over time.
10
Mid-Cap Growth Fund
Fund Profile
As of October 31, 2016
| | | |
| Portfolio Characteristics | | |
| | | | DJ |
| | | | U.S. |
| | | Russell | Total |
| | | Midcap | Market |
| | | Growth | FA |
| | Fund | Index | Index |
| Number of Stocks | 123 | 467 | 3,833 |
| Median Market Cap | $9.7B | $11.1B | $53.5B |
| Price/Earnings Ratio | 26.1x | 27.0x | 23.1x |
| Price/Book Ratio | 3.0x | 5.1x | 2.7x |
| Return on Equity | 15.1% | 19.7% | 16.6% |
| Earnings Growth | | | |
| Rate | 17.0% | 11.8% | 8.4% |
| Dividend Yield | 0.8% | 1.2% | 2.1% |
| Foreign Holdings | 1.1% | 0.0% | 0.0% |
| Turnover Rate | 91% | — | — |
| Ticker Symbol | VMGRX | — | — |
| Expense Ratio1 | 0.43% | — | — |
| 30-Day SEC Yield | 0.44% | — | — |
| Short-Term | | | |
| Reserves | 2.6% | — | — |
| | | |
| Sector Diversification (% of equity exposure) |
| | | Russell | DJ |
| | | Midcap | U.S. Total |
| | | Growth | Market |
| | Fund | Index | FA Index |
| Consumer | | | |
| Discretionary | 20.2% | 23.5% | 12.6% |
| Consumer Staples | 3.1 | 7.6 | 8.9 |
| Energy | 2.2 | 1.3 | 6.6 |
| Financials | 14.5 | 5.0 | 13.9 |
| Health Care | 16.4 | 15.1 | 13.4 |
| Industrials | 10.1 | 14.3 | 10.5 |
| Information | | | |
| Technology | 27.3 | 22.8 | 21.0 |
| Materials | 3.1 | 5.1 | 3.2 |
| Real Estate | 1.5 | 4.8 | 4.2 |
| Telecommunication | | | |
| Services | 1.5 | 0.5 | 2.3 |
| Utilities | 0.1 | 0.0 | 3.4 |
| | |
| Volatility Measures | | |
| | Russell | DJ |
| | Midcap | U.S. Total |
| | Growth | Market |
| | Index | FA Index |
| R-Squared | 0.94 | 0.87 |
| Beta | 1.01 | 1.09 |
These measures show the degree and timing of the fund’s fluctuations compared with the indexes over 36 months.
| | |
| Ten Largest Holdings (% of total net assets) |
| MGM Resorts | | |
| International | Casinos & Gaming | 2.6% |
| Vantiv Inc. | Data Processing & | |
| | Outsourced Services | 2.2 |
| Popular Inc. | Regional Banks | 2.2 |
| SEI Investments Co. | Asset Management | |
| | & Custody Banks | 2.0 |
| BioMarin Pharmaceutical | | |
| Inc. | Biotechnology | 1.9 |
| Brunswick Corp. | Leisure Products | 1.8 |
| Assured Guaranty Ltd. | Property & Casualty | |
| | Insurance | 1.7 |
| Agilent Technologies Inc. Life Sciences Tools & | |
| | Services | 1.7 |
| Centene Corp. | Managed Health | |
| | Care | 1.6 |
| Delta Air Lines Inc. | Airlines | 1.6 |
| Top Ten | | 19.3% |
The holdings listed exclude any temporary cash investments and equity index products.
Investment Focus
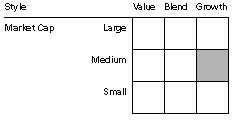
1 The expense ratio shown is from the prospectus dated February 25, 2016, and represents estimated costs for the current fiscal year. For the fiscal year ended October 31, 2016, the expense ratio was 0.36%.
11
Mid-Cap Growth Fund
Performance Summary
All of the returns in this report represent past performance, which is not a guarantee of future results that may be achieved by the fund. (Current performance may be lower or higher than the performance data cited. For performance data current to the most recent month-end, visit our website at vanguard.com/performance.) Note, too, that both investment returns and principal value can fluctuate widely, so an investor’s shares, when sold, could be worth more or less than their original cost. The returns shown do not reflect taxes that a shareholder would pay on fund distributions or on the sale of fund shares.
Cumulative Performance: October 31, 2006, Through October 31, 2016
Initial Investment of $10,000
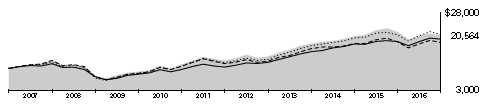
| | | | |
| | Average Annual Total Returns | |
| | Periods Ended October 31, 2016 | |
| | | | | Final Value |
| | One | Five | Ten | of a $10,000 |
| | Year | Years | Years | Investment |
| Mid-Cap Growth Fund | -5.49% | 10.44% | 7.48% | $20,564 |
| Russell Midcap Growth Index | 0.40 | 12.02 | 7.65 | 20,907 |
| Mid-Cap Growth Funds Average | -1.06 | 9.73 | 6.26 | 18,347 |
| Dow Jones U.S. Total Stock Market | | | | |
| Float Adjusted Index | 4.21 | 13.29 | 6.87 | 19,436 |
Mid-Cap Growth Funds Average: Derived from data provided by Lipper, a Thomson Reuters Company.
See Financial Highlights for dividend and capital gains information.
12
Mid-Cap Growth Fund
Fiscal-Year Total Returns (%): October 31, 2006, Through October 31, 2016
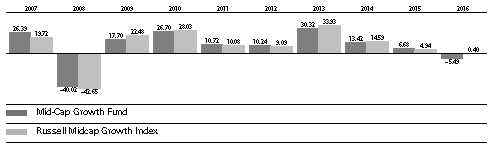
Average Annual Total Returns: Periods Ended September 30, 2016
This table presents returns through the latest calendar quarter—rather than through the end of the fiscal period.
Securities and Exchange Commission rules require that we provide this information.
| | | | |
| | Inception | One | Five | Ten |
| | Date | Year | Years | Years |
| Mid-Cap Growth Fund | 12/31/1997 | 2.22% | 13.60% | 8.11% |
13
Mid-Cap Growth Fund
Financial Statements
Statement of Net Assets
As of October 31, 2016
The fund reports a complete list of its holdings in regulatory filings four times in each fiscal year, at the quarter-ends. For the second and fourth fiscal quarters, the lists appear in the fund’s semiannual and annual reports to shareholders. For the first and third fiscal quarters, the fund files the lists with the Securities and Exchange Commission on Form N-Q. Shareholders can look up the fund’s Forms N-Q on the SEC’s website at sec.gov. Forms N-Q may also be reviewed and copied at the SEC’s Public Reference Room (see the back cover of this report for further information).
| | | |
| | | | Market |
| | | | Value• |
| | | Shares | ($000) |
| Common Stocks (93.8%)1 | | |
| Consumer Discretionary (19.1%) | |
| * | MGM Resorts | | |
| | International | 3,880,345 | 101,549 |
| | Brunswick Corp. | 1,621,011 | 70,514 |
| | Newell Brands Inc. | 1,206,100 | 57,917 |
| | Ross Stores Inc. | 862,800 | 53,960 |
| | Hanesbrands Inc. | 1,994,100 | 51,248 |
| | Six Flags Entertainment | | |
| | Corp. | 885,797 | 49,295 |
| | Royal Caribbean Cruises | | |
| | Ltd. | 567,670 | 43,637 |
| | Tractor Supply Co. | 655,040 | 41,025 |
| * | Toll Brothers Inc. | 1,389,075 | 38,116 |
| * | Norwegian Cruise Line | | |
| | Holdings Ltd. | 969,667 | 37,691 |
| | PulteGroup Inc. | 1,813,510 | 33,731 |
| | BorgWarner Inc. | 863,904 | 30,962 |
| | Dollar General Corp. | 432,626 | 29,890 |
| * | O’Reilly Automotive Inc. | 110,821 | 29,305 |
| * | Sally Beauty Holdings Inc. | 750,548 | 19,469 |
| * | Ulta Salon Cosmetics & | | |
| | Fragrance Inc. | 62,072 | 15,105 |
| | Dick’s Sporting Goods Inc. | 261,710 | 14,564 |
| | PVH Corp. | 127,500 | 13,640 |
| * | Panera Bread Co. Class A | 57,040 | 10,881 |
| * | Burlington Stores Inc. | 144,274 | 10,812 |
| * | JC Penney Co. Inc. | 837,135 | 7,191 |
| | | | 760,502 |
| Consumer Staples (2.7%) | | |
| | Tyson Foods Inc. Class A | 722,900 | 51,217 |
| | Mead Johnson Nutrition Co. | 554,100 | 41,430 |
| * | Herbalife Ltd. | 256,900 | 15,589 |
| | | | 108,236 |
| Energy (2.0%) | | |
| | Superior Energy Services | | |
| | Inc. | 2,419,135 | 34,255 |
| * | Concho Resources Inc. | 227,015 | 28,817 |
| * | Diamondback Energy Inc. | 177,826 | 16,234 |
| | | | 79,306 |
| | | |
| Financials (13.6%) | | |
| | Popular Inc. | 2,373,861 | 86,171 |
| | SEI Investments Co. | 1,840,355 | 81,583 |
| | Assured Guaranty Ltd. | 2,276,535 | 68,046 |
| | Intercontinental | | |
| | Exchange Inc. | 189,995 | 51,373 |
| | Willis Towers Watson plc | 389,200 | 49,000 |
| * | Signature Bank | 384,184 | 46,317 |
| | Lazard Ltd. Class A | 1,103,878 | 40,247 |
| | Radian Group Inc. | 2,221,173 | 30,186 |
| | Nasdaq Inc. | 370,100 | 23,675 |
| * | Affiliated Managers | | |
| | Group Inc. | 129,590 | 17,192 |
| | Evercore Partners Inc. | | |
| | Class A | 313,716 | 16,862 |
| | CME Group Inc. | 93,945 | 9,404 |
| | MarketAxess Holdings Inc. | 58,715 | 8,852 |
| | XL Group Ltd. | 229,835 | 7,975 |
| * | Western Alliance Bancorp | 110,783 | 4,139 |
| | | | 541,022 |
| Health Care (15.4%) | | |
| * | BioMarin Pharmaceutical | | |
| | Inc. | 939,277 | 75,631 |
| | Agilent Technologies Inc. | 1,541,735 | 67,173 |
| * | Centene Corp. | 1,032,013 | 64,480 |
| * | MEDNAX Inc. | 966,400 | 59,192 |
| * | Cerner Corp. | 889,700 | 52,119 |
| | Zoetis Inc. | 845,600 | 40,420 |
| * | Mettler-Toledo | | |
| | International Inc. | 85,100 | 34,387 |
| * | Mallinckrodt plc | 407,665 | 24,158 |
| | Cigna Corp. | 187,895 | 22,327 |
| | Dentsply Sirona Inc. | 370,507 | 21,330 |
| | HealthSouth Corp. | 492,800 | 19,786 |
| * | IDEXX Laboratories Inc. | 177,858 | 19,056 |
| * | Align Technology Inc. | 212,800 | 18,284 |
| | Perrigo Co. plc | 210,900 | 17,545 |
| * | Alexion Pharmaceuticals | | |
| | Inc. | 92,270 | 12,041 |
| * | Veeva Systems Inc. | | |
| | Class A | 255,000 | 9,907 |
14
Mid-Cap Growth Fund
| | | |
| | | | Market |
| | | | Value• |
| | | Shares | ($000) |
| * | VCA Inc. | 126,245 | 7,759 |
| * | ABIOMED Inc. | 69,492 | 7,296 |
| * | Incyte Corp. | 77,170 | 6,711 |
| *,^ | Intercept Pharmaceuticals | | |
| | Inc. | 53,685 | 6,643 |
| | Danaher Corp. | 77,170 | 6,062 |
| * | Edwards Lifesciences Corp. | 58,715 | 5,591 |
| * | Charles River Laboratories | | |
| | International Inc. | 70,460 | 5,346 |
| * | Neurocrine Biosciences Inc. | 107,370 | 4,700 |
| * | Vertex Pharmaceuticals Inc. | 61,375 | 4,656 |
| | | | 612,600 |
| Industrials (9.4%) | | |
| | Delta Air Lines Inc. | 1,538,380 | 64,258 |
| * | Old Dominion Freight | | |
| | Line Inc. | 807,110 | 60,275 |
| * | Verisk Analytics Inc. | | |
| | Class A | 671,100 | 54,728 |
| * | Copart Inc. | 728,600 | 38,230 |
| | TransDigm Group Inc. | 133,600 | 36,401 |
| | KAR Auction Services Inc. | 734,800 | 31,288 |
| * | Middleby Corp. | 253,100 | 28,375 |
| | Wabtec Corp. | 304,900 | 23,572 |
| | Dun & Bradstreet Corp. | 157,200 | 19,626 |
| | Equifax Inc. | 150,465 | 18,653 |
| | | | 375,406 |
| Information Technology (25.7%) | |
| * | Vantiv Inc. Class A | 1,490,164 | 86,966 |
| * | Akamai Technologies Inc. | 923,272 | 64,140 |
| * | Red Hat Inc. | 738,200 | 57,174 |
| * | CoStar Group Inc. | 253,479 | 47,431 |
| | SS&C Technologies | | |
| | Holdings Inc. | 1,236,407 | 39,478 |
| * | Check Point Software | | |
| | Technologies Ltd. | 433,300 | 36,640 |
| * | Euronet Worldwide Inc. | 452,960 | 36,033 |
| * | Guidewire Software Inc. | 623,200 | 35,803 |
| * | ServiceNow Inc. | 399,273 | 35,100 |
| | Booz Allen Hamilton | | |
| | Holding Corp. Class A | 1,115,900 | 34,001 |
| * | PTC Inc. | 716,345 | 33,983 |
| | Global Payments Inc. | 464,700 | 33,700 |
| * | Genpact Ltd. | 1,448,922 | 33,311 |
| * | Adobe Systems Inc. | 303,650 | 32,645 |
| | CSRA Inc. | 1,277,000 | 32,040 |
| | MAXIMUS Inc. | 612,605 | 31,892 |
| * | Cavium Inc. | 548,585 | 30,968 |
| * | Tyler Technologies Inc. | 182,860 | 29,331 |
| * | Ultimate Software | | |
| | Group Inc. | 125,824 | 26,548 |
| | Fidelity National | | |
| | Information Services Inc. | 323,780 | 23,934 |
| | Monolithic Power Systems | | |
| | Inc. | 301,970 | 23,798 |
| | | |
| * | Manhattan Associates Inc. | 444,570 | 22,513 |
| * | Electronics For Imaging | | |
| | Inc. | 496,577 | 21,119 |
| * | Palo Alto Networks Inc. | 135,890 | 20,904 |
| * | First Data Corp. Class A | 1,256,540 | 17,579 |
| * | IPG Photonics Corp. | 176,400 | 17,113 |
| * | Trimble Inc. | 530,130 | 14,653 |
| | Belden Inc. | 221,445 | 14,352 |
| * | salesforce.com Inc. | 156,020 | 11,726 |
| | LogMeIn Inc. | 122,467 | 11,634 |
| | Applied Materials Inc. | 374,110 | 10,879 |
| | Broadcom Ltd. | 58,745 | 10,003 |
| | Avnet Inc. | 196,280 | 8,234 |
| * | Nice Ltd. ADR | 122,468 | 8,140 |
| | Lam Research Corp. | 77,173 | 7,475 |
| * | Qorvo Inc. | 107,370 | 5,975 |
| * | Fortinet Inc. | 172,795 | 5,540 |
| * | Tableau Software Inc. | | |
| | Class A | 100,659 | 4,837 |
| * | Mobileye NV | 122,465 | 4,553 |
| | | | 1,022,145 |
| Materials (2.9%) | | |
| | Ball Corp. | 684,500 | 52,754 |
| | Vulcan Materials Co. | 364,300 | 41,239 |
| * | Axalta Coating Systems | | |
| | Ltd. | 862,800 | 21,674 |
| | | | 115,667 |
| Other (0.2%) | | |
| 2 | Vanguard Mid-Cap Growth | | |
| | ETF | 100,223 | 10,269 |
| |
| Real Estate (1.4%) | | |
| ^ | MGM Growth Properties | | |
| | LLC Class A | 1,155,885 | 30,423 |
| | Equinix Inc. | 41,939 | 14,984 |
| * | CBRE Group Inc. Class A | 360,691 | 9,291 |
| | | | 54,698 |
| Telecommunication Services (1.4%) | |
| * | SBA Communications Corp. | |
| | Class A | 492,800 | 55,824 |
| Total Common Stocks | | |
| (Cost $3,360,038) | | 3,735,675 |
| Temporary Cash Investments (5.0%)1 | |
| Money Market Fund (4.8%) | | |
| 3,4 | Vanguard Market | | |
| | Liquidity Fund, 0.718% | 1,921,722 | 192,192 |
15
Mid-Cap Growth Fund
| | | |
| | | Face | Market |
| | | Amount | Value• |
| | | ($000) | ($000) |
| U.S. Government and Agency Obligations (0.2%) |
| 5 | United States Treasury Bill, | | |
| | 0.321%, 12/1/16 | 3,900 | 3,899 |
| 5 | United States Treasury Bill, | | |
| | 0.270%, 12/29/16 | 200 | 200 |
| 5 | United States Treasury Bill, | | |
| | 0.287%, 1/5/17 | 2,000 | 1,999 |
| | | | 6,098 |
| Total Temporary Cash Investments | |
| (Cost $198,277) | | 198,290 |
| Total Investments (98.8%) | | |
| (Cost $3,558,315) | | 3,933,965 |
| Other Assets and Liabilities (1.2%) | |
| Other Assets | | 100,043 |
| Liabilities 4 | | (53,957) |
| | | | 46,086 |
| Net Assets (100%) | | |
| Applicable to 182,978,885 outstanding | |
| $.001 par value shares of beneficial | |
| interest (unlimited authorization) | 3,980,051 |
| Net Asset Value Per Share | | $21.75 |
| |
| | Amount |
| | ($000) |
| Statement of Assets and Liabilities | |
| Assets | |
| Investments in Securities, at Value | |
| Unaffiliated Issuers | 3,731,504 |
| Affiliated Vanguard Funds | 202,461 |
| Total Investments in Securities | 3,933,965 |
| Investment in Vanguard | 317 |
| Receivables for Investment Securities Sold | 94,517 |
| Receivables for Accrued Income | 3,412 |
| Receivables for Capital Shares Issued | 1,439 |
| Other Assets | 358 |
| Total Assets | 4,034,008 |
| Liabilities | |
| Payables for Investment Securities | |
| Purchased | (27,083) |
| Collateral for Securities on Loan | (4,929) |
| Payables for Capital Shares Redeemed | (15,371) |
| Payables to Vanguard | (6,448) |
| Other Liabilities | (126) |
| Total Liabilities | (53,957) |
| Net Assets | 3,980,051 |
| |
| |
| At October 31, 2016, net assets consisted of: |
| | Amount |
| | ($000) |
| Paid-in Capital | 3,783,083 |
| Undistributed Net Investment Income | 18,779 |
| Accumulated Net Realized Losses | (196,515) |
| Unrealized Appreciation (Depreciation) | |
| Investment Securities | 375,650 |
| Futures Contracts | (946) |
| Net Assets | 3,980,051 |
• See Note A in Notes to Financial Statements.
* Non-income-producing security.
^ Includes partial security positions on loan to broker-dealers. The total value of securities on loan is $4,804,000.
1 The fund invests a portion of its cash reserves in equity markets through the use of index futures contracts. After giving effect to futures
investments, the fund’s effective common stock and temporary cash investment positions represent 96.1% and 2.7%, respectively, of
net assets.
2 Considered an affiliated company of the fund as the issuer is another member of The Vanguard Group.
3 Affiliated money market fund available only to Vanguard funds and certain trusts and accounts managed by Vanguard. Rate shown is the
7-day yield.
4 Includes $4,929,000 of collateral received for securities on loan.
5 Securities with a value of $4,599,000 have been segregated as initial margin for open futures contracts.
ADR—American Depositary Receipt.
See accompanying Notes, which are an integral part of the Financial Statements.
16
| |
| Mid-Cap Growth Fund | |
| |
| |
| Statement of Operations | |
| |
| | Year Ended |
| | October 31, 2016 |
| | ($000) |
| Investment Income | |
| Income | |
| Dividends1 | 40,354 |
| Interest1 | 978 |
| Securities Lending—Net | 92 |
| Total Income | 41,424 |
| Expenses | |
| Investment Advisory Fees—Note B | |
| Basic Fee | 8,125 |
| Performance Adjustment | (1,863) |
| The Vanguard Group—Note C | |
| Management and Administrative | 7,756 |
| Marketing and Distribution | 901 |
| Custodian Fees | 42 |
| Auditing Fees | 37 |
| Shareholders’ Reports | 73 |
| Trustees’ Fees and Expenses | 6 |
| Total Expenses | 15,077 |
| Expenses Paid Indirectly | (224) |
| Net Expenses | 14,853 |
| Net Investment Income | 26,571 |
| Realized Net Gain (Loss) | |
| Investment Securities Sold1 | (194,336) |
| Futures Contracts | 10,960 |
| Realized Net Gain (Loss) | (183,376) |
| Change in Unrealized Appreciation (Depreciation) | |
| Investment Securities | (70,032) |
| Futures Contracts | (5,006) |
| Change in Unrealized Appreciation (Depreciation) | (75,038) |
| Net Increase (Decrease) in Net Assets Resulting from Operations | (231,843) |
1 Dividend income, interest income, and realized net gain (loss) from affiliated companies of the fund were $89,000, $947,000, and $10,000, respectively.
See accompanying Notes, which are an integral part of the Financial Statements.
17
| | |
| Mid-Cap Growth Fund | | |
| |
| |
| Statement of Changes in Net Assets | | |
| |
| | Year Ended October 31, |
| | 2016 | 2015 |
| | ($000) | ($000) |
| Increase (Decrease) in Net Assets | | |
| Operations | | |
| Net Investment Income | 26,571 | 9,595 |
| Realized Net Gain (Loss) | (183,376) | 343,380 |
| Change in Unrealized Appreciation (Depreciation) | (75,038) | (137,353) |
| Net Increase (Decrease) in Net Assets Resulting from Operations | (231,843) | 215,622 |
| Distributions | | |
| Net Investment Income | (12,324) | (4,856) |
| Realized Capital Gain1 | (311,613) | (405,208) |
| Total Distributions | (323,937) | (410,064) |
| Capital Share Transactions | | |
| Issued | 943,333 | 1,505,655 |
| Issued in Lieu of Cash Distributions | 314,619 | 398,819 |
| Redeemed | (1,039,524) | (711,728) |
| Net Increase (Decrease) from Capital Share Transactions | 218,428 | 1,192,746 |
| Total Increase (Decrease) | (337,352) | 998,304 |
| Net Assets | | |
| Beginning of Period | 4,317,403 | 3,319,099 |
| End of Period2 | 3,980,051 | 4,317,403 |
1 Includes fiscal 2016 and 2015 short-term gain distributions totaling $15,141,000 and $80,760,000, respectively. Short-term gain distributions
are treated as ordinary income dividends for tax purposes.
2 Net Assets—End of Period includes undistributed (overdistributed) net investment income of $18,779,000 and $4,532,000.
See accompanying Notes, which are an integral part of the Financial Statements.
18
| | | | | |
| Mid-Cap Growth Fund | | | | | |
| |
| |
| Financial Highlights | | | | | |
| |
| |
| For a Share Outstanding | | | Year Ended October 31, |
| Throughout Each Period | 2016 | 2015 | 2014 | 2013 | 2012 |
| Net Asset Value, Beginning of Period | $24.88 | $26.40 | $25.72 | $20.95 | $19.40 |
| Investment Operations | | | | | |
| Net Investment Income | .147 2 | .0641 | .045 | .048 | .041 |
| Net Realized and Unrealized Gain (Loss) | | | | | |
| on Investments | (1.437) | 1.625 | 3.134 | 5.965 | 1.892 |
| Total from Investment Operations | (1.290) | 1.689 | 3.179 | 6.013 | 1.933 |
| Distributions | | | | | |
| Dividends from Net Investment Income | (.070) | (.038) | (.007) | (.075) | (.030) |
| Distributions from Realized Capital Gains | (1.770) | (3.171) | (2.492) | (1.168) | (.353) |
| Total Distributions | (1.840) | (3.209) | (2.499) | (1.243) | (.383) |
| Net Asset Value, End of Period | $21.75 | $24.88 | $26.40 | $25.72 | $20.95 |
| |
| Total Return 3 | -5.49% | 6.68% | 13.42% | 30.32% | 10.24% |
| |
| Ratios/Supplemental Data | | | | | |
| Net Assets, End of Period (Millions) | $3,980 | $4,317 | $3,319 | $2,837 | $2,129 |
| Ratio of Total Expenses to Average Net Assets4 | 0.36% | 0.43% | 0.46% | 0.51% | 0.54% |
| Ratio of Net Investment Income to | | | | | |
| Average Net Assets | 0.64%2 | 0.25%1 | 0.16% | 0.19% | 0.19% |
| Portfolio Turnover Rate | 91% | 93% | 82% | 83% | 97% |
1 Net investment income per share and the ratio of net investment income to average net assets include $.006 and 0.03%, respectively,
resulting from a special dividend from Lazard Ltd. in February 2015.
2 Net investment income per share and the ratio of net investment income to average net assets include $.018 and 0.08%, respectively,
resulting from a special dividend from TransDigm Group in October 2016.
3 Total returns do not include account service fees that may have applied in the periods shown. Fund prospectuses provide information about
any applicable account service fees.
4 Includes performance-based investment advisory fee increases (decreases) of (0.04%), (0.01%), (0.02%), 0.02%, and 0.04%.
See accompanying Notes, which are an integral part of the Financial Statements.
19
Mid-Cap Growth Fund
Notes to Financial Statements
Vanguard Mid-Cap Growth Fund is registered under the Investment Company Act of 1940 as an open-end investment company, or mutual fund.
A. The following significant accounting policies conform to generally accepted accounting principles for U.S. investment companies. The fund consistently follows such policies in preparing its financial statements.
1. Security Valuation: Securities are valued as of the close of trading on the New York Stock Exchange (generally 4 p.m., Eastern time) on the valuation date. Equity securities are valued at the latest quoted sales prices or official closing prices taken from the primary market in which each security trades; such securities not traded on the valuation date are valued at the mean of the latest quoted bid and asked prices. Securities for which market quotations are not readily available, or whose values have been materially affected by events occurring before the fund’s pricing time but after the close of the securities’ primary markets, are valued by methods deemed by the board of trustees to represent fair value. Investments in Vanguard Market Liquidity Fund are valued at that fund’s net asset value. Temporary cash investments acquired over 60 days to maturity are valued using the latest bid prices or using valuations based on a matrix system (which considers such factors as security prices, yields, maturities, and ratings), both as furnished by independent pricing services. Other temporary cash investments are valued at amortized cost, which approximates market value.
2. Futures Contracts: The fund uses index futures contracts to a limited extent, with the objective of maintaining full exposure to the stock market while maintaining liquidity. The fund may purchase or sell futures contracts to achieve a desired level of investment, whether to accommodate portfolio turnover or cash flows from capital share transactions. The primary risks associated with the use of futures contracts are imperfect correlation between changes in market values of stocks held by the fund and the prices of futures contracts, and the possibility of an illiquid market. Counterparty risk involving futures is mitigated because a regulated clearinghouse is the counterparty instead of the clearing broker. To further mitigate counterparty risk, the fund trades futures contracts on an exchange, monitors the financial strength of its clearing brokers and clearinghouse, and has entered into clearing agreements with its clearing brokers. The clearinghouse imposes initial margin requirements to secure the fund’s performance and requires daily settlement of variation margin representing changes in the market value of each contract.
Futures contracts are valued at their quoted daily settlement prices. The aggregate settlement values of the contracts are not recorded in the Statement of Net Assets. Fluctuations in the value of the contracts are recorded in the Statement of Assets and Liabilities as an asset (liability) and in the Statement of Operations as unrealized appreciation (depreciation) until the contracts are closed, when they are recorded as realized futures gains (losses).
During the year ended October 31, 2016, the fund’s average investments in long and short futures contracts represented less than 3% and 0% of net assets, respectively, based on the average of aggregate settlement values at each quarter-end during the period.
3. Federal Income Taxes: The fund intends to continue to qualify as a regulated investment company and distribute all of its taxable income. Management has analyzed the fund’s tax positions taken for all open federal income tax years (October 31, 2013–2016), and has concluded that no provision for federal income tax is required in the fund’s financial statements.
20
Mid-Cap Growth Fund
4. Distributions: Distributions to shareholders are recorded on the ex-dividend date.
5. Securities Lending: To earn additional income, the fund lends its securities to qualified institutional borrowers. Security loans are subject to termination by the fund at any time, and are required to be secured at all times by collateral in an amount at least equal to the market value of securities loaned. Daily market fluctuations could cause the value of loaned securities to be more or less than the value of the collateral received. When this occurs, the collateral is adjusted and settled on the next business day. The fund further mitigates its counterparty risk by entering into securities lending transactions only with a diverse group of prequalified counterparties, monitoring their financial strength, and entering into master securities lending agreements with its counterparties. The master securities lending agreements provide that, in the event of a counterparty’s default (including bankruptcy), the fund may terminate any loans with that borrower, determine the net amount owed, and sell or retain the collateral up to the net amount owed to the fund; however, such actions may be subject to legal proceedings. While collateral mitigates counterparty risk, in the absence of a default the fund may experience delays and costs in recovering the securities loaned. The fund invests cash collateral received in Vanguard Market Liquidity Fund, and records a liability in the Statement of Assets and Liabilities for the return of the collateral, during the period the securities are on loan. Securities lending income represents fees charged to borrowers plus income earned on invested cash collateral, less expenses associated with the loan. During the term of the loan, the fund is entitled to all distributions made on or in respect of the loaned securities.
6. Credit Facility: The fund and certain other funds managed by The Vanguard Group (“Vanguard”) participate in a $3.1 billion committed credit facility provided by a syndicate of lenders pursuant to a credit agreement that may be renewed annually; each fund is individually liable for its borrowings, if any, under the credit facility. Borrowings may be utilized for temporary and emergency purposes, and are subject to the fund’s regulatory and contractual borrowing restrictions. The participating funds are charged administrative fees and an annual commitment fee of 0.10% of the undrawn amount of the facility; these fees are allocated to the funds based on a method approved by the fund’s board of trustees and included in Management and Administrative expenses on the fund’s Statement of Operations. Any borrowings under this facility bear interest at a rate based upon the higher of the one-month London Interbank Offered Rate, federal funds effective rate, or overnight bank funding rate plus an agreed-upon spread.
The fund had no borrowings outstanding at October 31, 2016, or at any time during the period then ended.
7. Other: Dividend income is recorded on the ex-dividend date. Interest income includes income distributions received from Vanguard Market Liquidity Fund and is accrued daily. Premiums and discounts on debt securities purchased are amortized and accreted, respectively, to interest income over the lives of the respective securities. Security transactions are accounted for on the date securities are bought or sold. Costs used to determine realized gains (losses) on the sale of investment securities are those of the specific securities sold.
B. The investment advisory firms Chartwell Investment Partners, LLC, and William Blair Investment Management, LLC, each provide investment advisory services to a portion of the fund for a fee calculated at an annual percentage rate of average net assets managed by the advisor. The basic fee of Chartwell Investment Partners, LLC, is subject to quarterly adjustments based on performance
21
Mid-Cap Growth Fund
relative to the Russell Midcap Growth Index for the preceding three years. The basic fee of William Blair Investment Management, LLC, is subject to quarterly adjustments based on performance relative to the Russell Midcap Growth Index for the preceding five years .
Vanguard manages the cash reserves of the fund as described below.
For the year ended October 31, 2016, the aggregate investment advisory fee represented an effective annual basic rate of 0.20% of the fund’s average net assets, before a decrease of $1,863,000 (0.04%) based on performance.
C. In accordance with the terms of a Funds’ Service Agreement (the “FSA”) between Vanguard and the fund, Vanguard furnishes to the fund corporate management, administrative, marketing, distribution, and cash management services at Vanguard’s cost of operations (as defined by the FSA). These costs of operations are allocated to the fund based on methods and guidelines approved by the board of trustees. Vanguard does not require reimbursement in the current period for certain costs of operations (such as deferred compensation/benefits and risk/insurance costs); the fund’s liability for these costs of operations is included in Payables to Vanguard on the Statement of Assets and Liabilities.
Upon the request of Vanguard, the fund may invest up to 0.40% of its net assets as capital in Vanguard. At October 31, 2016, the fund had contributed to Vanguard capital in the amount of $317,000 representing 0.01% of the fund’s net assets and 0.13% of Vanguard’s capitalization. The fund’s trustees and officers are also directors and employees, respectively, of Vanguard.
D. The fund has asked its investment advisors to direct certain security trades, subject to obtaining the best price and execution, to brokers who have agreed to rebate to the fund part of the commissions generated. Such rebates are used solely to reduce the fund’s management and administrative expenses. For the year ended October 31, 2016, these arrangements reduced the fund’s expenses by $224,000 (an annual rate of 0.01% of average net assets).
E. Various inputs may be used to determine the value of the fund’s investments. These inputs are summarized in three broad levels for financial statement purposes. The inputs or methodologies used to value securities are not necessarily an indication of the risk associated with investing in those securities.
Level 1—Quoted prices in active markets for identical securities.
Level 2—Other significant observable inputs (including quoted prices for similar securities, interest rates, prepayment speeds, credit risk, etc.).
Level 3—Significant unobservable inputs (including the fund’s own assumptions used to determine the fair value of investments).
The following table summarizes the market value of the fund’s investments as of October 31, 2016, based on the inputs used to value them:
| | | |
| | Level 1 | Level 2 | Level 3 |
| Investments | ($000) | ($000) | ($000) |
| Common Stocks | 3,735,675 | — | — |
| Temporary Cash Investments | 192,192 | 6,098 | — |
| Futures Contracts—Assets1 | 358 | | |
| Futures Contracts—Liabilities1 | (126) | — | — |
| Total | 3,928,099 | 6,098 | — |
| 1 Represents variation margin on the last day of the reporting period. | | | |
22
Mid-Cap Growth Fund
F. At October 31, 2016, the aggregate settlement value of open futures contracts and the related unrealized appreciation (depreciation) were:
| | | | |
| | | | | ($000) |
| | | | Aggregate | |
| | | Number of | Settlement | Unrealized |
| | | Long (Short) | Value | Appreciation |
| Futures Contracts | Expiration | Contracts | Long (Short) | (Depreciation) |
| E-mini S&P Mid-Cap 400 Index | December 2016 | 307 | 46,259 | (783) |
| E-mini S&P 500 Index | December 2016 | 426 | 45,158 | (163) |
| | | | | (946) |
Unrealized appreciation (depreciation) on open futures contracts is required to be treated as realized gain (loss) for tax purposes.
G. Distributions are determined on a tax basis and may differ from net investment income and realized capital gains for financial reporting purposes. Differences may be permanent or temporary. Permanent differences are reclassified among capital accounts in the financial statements to reflect their tax character. Temporary differences arise when certain items of income, expense, gain, or loss are recognized in different periods for financial statement and tax purposes. These differences will reverse at some time in the future. Differences in classification may also result from the treatment of short-term gains as ordinary income for tax purposes.
For tax purposes, at October 31, 2016, the fund had $23,293,000 of ordinary income available for distribution. The fund had capital losses totaling $187,803,000 that may be carried forward indefinitely to offset future net capital gains.
At October 31, 2016, the cost of investment securities for tax purposes was $3,567,851,000. Net unrealized appreciation of investment securities for tax purposes was $366,114,000, consisting of unrealized gains of $498,385,000 on securities that had risen in value since their purchase and $132,271,000 in unrealized losses on securities that had fallen in value since their purchase.
H. During the year ended October 31, 2016, the fund purchased $3,620,514,000 of investment securities and sold $3,718,001,000 of investment securities, other than temporary cash investments.
| | |
| I. Capital shares issued and redeemed were: | | |
| | Year Ended October 31, |
| | 2016 | 2015 |
| | Shares | Shares |
| | (000) | (000) |
| Issued | 43,119 | 59,434 |
| Issued in Lieu of Cash Distributions | 13,866 | 16,399 |
| Redeemed | (47,557) | (28,005) |
| Net Increase (Decrease) in Shares Outstanding | 9,428 | 47,828 |
J. Management has determined that no material events or transactions occurred subsequent to October 31, 2016, that would require recognition or disclosure in these financial statements.
23
Report of Independent Registered Public Accounting Firm
To the Board of Trustees of Vanguard Whitehall Funds and the Shareholders of Vanguard Mid-Cap Growth Fund:
In our opinion, the accompanying statement of net assets, statement of assets and liabilities and the related statements of operations and of changes in net assets and the financial highlights present fairly, in all material respects, the financial position of Vanguard Mid-Cap Growth Fund (constituting a separate portfolio of Vanguard Whitehall Funds, hereafter referred to as the “Fund”) at October 31, 2016, the results of its operations for the year then ended, the changes in its net assets for each of the two years in the period then ended, and the financial highlights for each of the five years in the period then ended, in conformity with accounting principles generally accepted in the United States of America. These financial statements and financial highlights (hereafter referred to as “financial statements”) are the responsibility of the Fund’s management. Our responsibility is to express an opinion on these financial statements based on our audits. We conducted our audits of these financial statements in accordance with the standards of the Public Company Accounting Oversight Board (United States). Those standards require that we plan and perform the audit to obtain reasonable assurance about whether the financial statements are free of material misstatement. An audit includes examining, on a test basis, evidence supporting the amounts and disclosures in the financial statements, assessing the accounting principles used and significant estimates made by management, and evaluating the overall financial statement presentation. We believe that our audits, which included confirmation of securities at October 31, 2016 by correspondence with the custodian and brokers and by agreement to the underlying ownership records of the transfer agent, provide a reasonable basis for our opinion.
/s/PricewaterhouseCoopers LLP
Philadelphia, Pennsylvania
December 15, 2016
Special 2016 tax information (unaudited) for Vanguard Mid-Cap Growth Fund
This information for the fiscal year ended October 31, 2016, is included pursuant to provisions of the Internal Revenue Code.
The fund distributed $296,472,000 as capital gain dividends (20% rate gain distributions) to shareholders during the fiscal year.
For nonresident alien shareholders, 100% of short-term capital gain dividends distributed by the fund are qualified short-term capital gains.
The fund distributed $25,643,000 of qualified dividend income to shareholders during the fiscal year.
For corporate shareholders, 100% of investment income (dividend income plus short-term gains, if any) qualifies for the dividends-received deduction.
24
Your Fund’s After-Tax Returns
This table presents returns for your fund both before and after taxes. The after-tax returns are shown in two ways: (1) assuming that an investor owned the fund during the entire period and paid taxes on the fund’s distributions, and (2) assuming that an investor paid taxes on the fund’s distributions and sold all shares at the end of each period.
Calculations are based on the highest individual federal income tax and capital gains tax rates in effect at the times of the distributions and the hypothetical sales. State and local taxes were not considered. After-tax returns reflect any qualified dividend income, using actual prior-year figures and estimates for 2016. (In the example, returns after the sale of fund shares may be higher than those assuming no sale. This occurs when the sale would have produced a capital loss. The calculation assumes that the investor received a tax deduction for the loss.)
Please note that your actual after-tax returns will depend on your tax situation and may differ from those shown. Also note that if you own the fund in a tax-deferred account, such as an individual retirement account or a 401(k) plan, this information does not apply to you. Such accounts are not subject to current taxes.
Finally, keep in mind that a fund’s performance—whether before or after taxes—does not guarantee future results.
| | | |
| Average Annual Total Returns: Mid-Cap Growth Fund | | | |
| Periods Ended October 31, 2016 | | | |
| | One | Five | Ten |
| | Year | Years | Years |
| Returns Before Taxes | -5.49% | 10.44% | 7.48% |
| Returns After Taxes on Distributions | -7.19 | 8.42 | 6.09 |
| Returns After Taxes on Distributions and Sale of Fund Shares | -1.63 | 8.07 | 5.87 |
25
About Your Fund’s Expenses
As a shareholder of the fund, you incur ongoing costs, which include costs for portfolio management, administrative services, and shareholder reports (like this one), among others. Operating expenses, which are deducted from a fund’s gross income, directly reduce the investment return of the fund.
A fund’s expenses are expressed as a percentage of its average net assets. This figure is known as the expense ratio. The following examples are intended to help you understand the ongoing costs (in dollars) of investing in your fund and to compare these costs with those of other mutual funds. The examples are based on an investment of $1,000 made at the beginning of the period shown and held for the entire period.
The accompanying table illustrates your fund’s costs in two ways:
• Based on actual fund return. This section helps you to estimate the actual expenses that you paid over the period. The ”Ending Account Value“ shown is derived from the fund‘s actual return, and the third column shows the dollar amount that would have been paid by an investor who started with $1,000 in the fund. You may use the information here, together with the amount you invested, to estimate the expenses that you paid over the period.
To do so, simply divide your account value by $1,000 (for example, an $8,600 account value divided by $1,000 = 8.6), then multiply the result by the number given for your fund under the heading ”Expenses Paid During Period.“
• Based on hypothetical 5% yearly return. This section is intended to help you compare your fund‘s costs with those of other mutual funds. It assumes that the fund had a yearly return of 5% before expenses, but that the expense ratio is unchanged. In this case—because the return used is not the fund’s actual return—the results do not apply to your investment. The example is useful in making comparisons because the Securities and Exchange Commission requires all mutual funds to calculate expenses based on a 5% return. You can assess your fund’s costs by comparing this hypothetical example with the hypothetical examples that appear in shareholder reports of other funds.
Note that the expenses shown in the table are meant to highlight and help you compare ongoing costs only and do not reflect transaction costs incurred by the fund for buying and selling securities. Further, the expenses do not include any purchase, redemption, or account service fees described in the fund prospectus. If such fees were applied to your account, your costs would be higher. Your fund does not carry a “sales load.”
The calculations assume no shares were bought or sold during the period. Your actual costs may have been higher or lower, depending on the amount of your investment and the timing of any purchases or redemptions.
You can find more information about the fund’s expenses, including annual expense ratios, in the Financial Statements section of this report. For additional information on operating expenses and other shareholder costs, please refer to your fund’s current prospectus.
26
| | | |
| Six Months Ended October 31, 2016 | | | |
| | Beginning | Ending | Expenses |
| | Account Value | Account Value | Paid During |
| Mid-Cap Growth Fund | 4/30/2016 | 10/31/2016 | Period |
| Based on Actual Fund Return | $1,000.00 | $999.54 | $1.71 |
| Based on Hypothetical 5% Yearly Return | 1,000.00 | 1,023.43 | 1.73 |
The calculations are based on expenses incurred in the most recent six-month period. The fund’s annualized six-month expense ratio for that period is 0.34%. The dollar amounts shown as “Expenses Paid” are equal to the annualized expense ratio multiplied by the average account value over the period, multiplied by the number of days in the most recent six-month period, then divided by the number of days in the most recent 12-month period (184/366).
27
Glossary
30-Day SEC Yield. A fund’s 30-day SEC yield is derived using a formula specified by the U.S. Securities and Exchange Commission. Under the formula, data related to the fund’s security holdings in the previous 30 days are used to calculate the fund’s hypothetical net income for that period, which is then annualized and divided by the fund’s estimated average net assets over the calculation period. For the purposes of this calculation, a security’s income is based on its current market yield to maturity (for bonds), its actual income (for asset-backed securities), or its projected dividend yield (for stocks). Because the SEC yield represents hypothetical annualized income, it will differ—at times significantly—from the fund’s actual experience. As a result, the fund’s income distributions may be higher or lower than implied by the SEC yield.
Beta. A measure of the magnitude of a fund’s past share-price fluctuations in relation to the ups and downs of a given market index. The index is assigned a beta of 1.00. Compared with a given index, a fund with a beta of 1.20 typically would have seen its share price rise or fall by 12% when the index rose or fell by 10%. For this report, beta is based on returns over the past 36 months for both the fund and the index. Note that a fund’s beta should be reviewed in conjunction with its R-squared (see definition). The lower the R-squared, the less correlation there is between the fund and the index, and the less reliable beta is as an indicator of volatility.
Dividend Yield. Dividend income earned by stocks, expressed as a percentage of the aggregate market value (or of net asset value, for a fund). The yield is determined by dividing the amount of the annual dividends by the aggregate value (or net asset value) at the end of the period. For a fund, the dividend yield is based solely on stock holdings and does not include any income produced by other investments.
Earnings Growth Rate. The average annual rate of growth in earnings over the past five years for the stocks now in a fund.
Equity Exposure. A measure that reflects a fund’s investments in stocks and stock futures. Any holdings in short-term reserves are excluded.
Expense Ratio. A fund’s total annual operating expenses expressed as a percentage of the fund’s average net assets. The expense ratio includes management and administrative expenses, but does not include the transaction costs of buying and selling portfolio securities.
Foreign Holdings. The percentage of a fund represented by securities or depositary receipts of companies based outside the United States.
Inception Date. The date on which the assets of a fund (or one of its share classes) are first invested in accordance with the fund’s investment objective. For funds with a subscription period, the inception date is the day after that period ends. Investment performance is measured from the inception date.
Median Market Cap. An indicator of the size of companies in which a fund invests; the midpoint of market capitalization (market price x shares outstanding) of a fund’s stocks, weighted by the proportion of the fund’s assets invested in each stock. Stocks representing half of the fund’s assets have market capitalizations above the median, and the rest are below it.
Price/Book Ratio. The share price of a stock divided by its net worth, or book value, per share. For a fund, the weighted average price/book ratio of the stocks it holds.
28
Price/Earnings Ratio. The ratio of a stock’s current price to its per-share earnings over the past year. For a fund, the weighted average P/E of the stocks it holds. P/E is an indicator of market expectations about corporate prospects; the higher the P/E, the greater the expectations for a company’s future growth.
R-Squared. A measure of how much of a fund’s past returns can be explained by the returns from the market in general, as measured by a given index. If a fund’s total returns were precisely synchronized with an index’s returns, its R-squared would be 1.00. If the fund’s returns bore no relationship to the index’s returns, its R-squared would be 0. For this report, R-squared is based on returns over the past 36 months for both the fund and the index.
Return on Equity. The annual average rate of return generated by a company during the past five years for each dollar of shareholder’s equity (net income divided by shareholder’s equity). For a fund, the weighted average return on equity for the companies whose stocks it holds.
Short-Term Reserves. The percentage of a fund invested in highly liquid, short-term securities that can be readily converted to cash.
Turnover Rate. An indication of the fund’s trading activity. Funds with high turnover rates incur higher transaction costs and may be more likely to distribute capital gains (which may be taxable to investors). The turnover rate excludes in-kind transactions, which have minimal impact on costs.
29
This page intentionally left blank.
This page intentionally left blank.
The People Who Govern Your Fund
The trustees of your mutual fund are there to see that the fund is operated and managed in your best interests since, as a shareholder, you are a part owner of the fund. Your fund’s trustees also serve on the board of directors of The Vanguard Group, Inc., which is owned by the Vanguard funds and provides services to them on an at-cost basis.
A majority of Vanguard’s board members are independent, meaning that they have no affiliation with Vanguard or the funds they oversee, apart from the sizable personal investments they have made as private individuals. The independent board members have distinguished backgrounds in business, academia, and public service. Each of the trustees and executive officers oversees 198 Vanguard funds.
The following table provides information for each trustee and executive officer of the fund. The mailing address of the trustees and officers is P.O. Box 876, Valley Forge, PA 19482. More information about the trustees is in the Statement of Additional Information, which can be obtained, without charge, by contacting Vanguard at 800-662-7447, or online at vanguard.com.
Interested Trustee1
F. William McNabb III
Born 1957. Trustee Since July 2009. Chairman of the Board. Principal Occupation(s) During the Past Five Years and Other Experience: Chairman of the Board of The Vanguard Group, Inc., and of each of the investment companies served by The Vanguard Group, since January 2010; Director of The Vanguard Group since 2008; Chief Executive Officer and President of The Vanguard Group, and of each of the investment companies served by The Vanguard Group, since 2008; Director of Vanguard Marketing Corporation; Managing Director of The Vanguard Group (1995–2008).
Independent Trustees
Emerson U. Fullwood
Born 1948. Trustee Since January 2008. Principal Occupation(s) During the Past Five Years and Other Experience: Executive Chief Staff and Marketing Officer for North America and Corporate Vice President (retired 2008) of Xerox Corporation (document management products and services); Executive in Residence and 2009–2010 Distinguished Minett Professor at the Rochester Institute of Technology; Lead Director of SPX FLOW, Inc. (multi-industry manufacturing); Director of the United Way of Rochester, the University of Rochester Medical Center, Monroe Community College Foundation, North Carolina A&T University, and Roberts Wesleyan College.
Rajiv L. Gupta
Born 1945. Trustee Since December 2001.2 Principal Occupation(s) During the Past Five Years and Other Experience: Chairman and Chief Executive Officer (retired 2009) and President (2006–2008) of Rohm and Haas Co. (chemicals); Director of Tyco International plc (diversified manufacturing and services), HP Inc. (printer and personal computer manufacturing), and Delphi Automotive plc (automotive components); Senior Advisor at New Mountain Capital.
Amy Gutmann
Born 1949. Trustee Since June 2006. Principal Occupation(s) During the Past Five Years and Other Experience: President of the University of Pennsylvania; Christopher H. Browne Distinguished Professor of Political Science, School of Arts and Sciences, and Professor of Communication, Annenberg School for Communication, with secondary faculty appointments in the Department of Philosophy, School of Arts and Sciences, and at the Graduate School of Education, University of Pennsylvania; Trustee of the National Constitution Center; Chair of the Presidential Commission for the Study of Bioethical Issues.
JoAnn Heffernan Heisen
Born 1950. Trustee Since July 1998. Principal Occupation(s) During the Past Five Years and Other Experience: Corporate Vice President and Chief Global Diversity Officer (retired 2008) and Member of the Executive Committee (1997–2008) of Johnson & Johnson (pharmaceuticals/medical devices/consumer products); Director of Skytop Lodge Corporation (hotels) and the Robert Wood Johnson Foundation; Member of the Advisory Board of the Institute for Women’s Leadership at Rutgers University.
F. Joseph Loughrey
Born 1949. Trustee Since October 2009. Principal Occupation(s) During the Past Five Years and Other Experience: President and Chief Operating Officer (retired 2009) of Cummins Inc. (industrial machinery); Chairman of the Board of Hillenbrand, Inc. (specialized consumer services), and of Oxfam America; Director of SKF AB (industrial machinery), Hyster-Yale Materials Handling, Inc. (forklift trucks), the Lumina Foundation for Education, and the V Foundation for Cancer Research; Member of the Advisory Council for the College of Arts and Letters and of the Advisory Board to the Kellogg Institute for International Studies, both at the University of Notre Dame.
Mark Loughridge
Born 1953. Trustee Since March 2012. Principal Occupation(s) During the Past Five Years and Other Experience: Senior Vice President and Chief Financial Officer (retired 2013) at IBM (information technology services); Fiduciary Member of IBM’s Retirement Plan Committee (2004–2013); Director of the Dow Chemical Company; Member of the Council on Chicago Booth.
Scott C. Malpass
Born 1962. Trustee Since March 2012. Principal Occupation(s) During the Past Five Years and Other Experience: Chief Investment Officer and Vice President at the University of Notre Dame; Assistant Professor of Finance at the Mendoza College of Business at Notre Dame; Member of the Notre Dame 403(b) Investment Committee, the Board of Advisors for Spruceview Capital Partners, and the Investment Advisory Committee of Major League Baseball; Board Member of TIFF Advisory Services, Inc., and Catholic Investment Services, Inc. (investment advisors).
André F. Perold
Born 1952. Trustee Since December 2004. Principal Occupation(s) During the Past Five Years and Other Experience: George Gund Professor of Finance and Banking, Emeritus at the Harvard Business School (retired 2011); Chief Investment Officer and Managing Partner of HighVista Strategies LLC (private investment firm); Director of Rand Merchant Bank; Overseer of the Museum of Fine Arts Boston.
Peter F. Volanakis
Born 1955. Trustee Since July 2009. Principal Occupation(s) During the Past Five Years and Other Experience: President and Chief Operating Officer (retired 2010) of Corning Incorporated (communications equipment); Chairman of the Board of Trustees of Colby-Sawyer College; Member of the Advisory Board of the Norris Cotton Cancer Center.
Executive Officers
Glenn Booraem
Born 1967. Treasurer Since May 2015. Principal Occupation(s) During the Past Five Years and Other Experience: Principal of The Vanguard Group, Inc.; Treasurer of each of the investment companies served by The Vanguard Group; Controller of each of the investment companies served by The Vanguard Group (2010–2015); Assistant Controller of each of the investment companies served by The Vanguard Group (2001–2010).
Thomas J. Higgins
Born 1957. Chief Financial Officer Since September 2008. Principal Occupation(s) During the Past Five Years and Other Experience: Principal of The Vanguard Group, Inc.; Chief Financial Officer of each of the investment companies served by The Vanguard Group; Treasurer of each of the investment companies served by The Vanguard Group (1998–2008).
Peter Mahoney
Born 1974. Controller Since May 2015. Principal Occupation(s) During the Past Five Years and Other Experience: Head of Global Fund Accounting at The Vanguard Group, Inc.; Controller of each of the investment companies served by The Vanguard Group; Head of International Fund Services at The Vanguard Group (2008–2014).
Anne E. Robinson
Born 1970. Secretary Since September 2016. Principal Occupation(s) During the Past Five Years and Other Experience: Managing Director of The Vanguard Group, Inc.; General Counsel of The Vanguard Group; Secretary of The Vanguard Group and of each of the investment companies served by The Vanguard Group; Director and Senior Vice President of Vanguard Marketing Corporation; Managing Director and General Counsel of Global Cards and Consumer Services at Citigroup (2014–2016); Counsel at American Express (2003–2014).
Vanguard Senior Management Team
| |
| Mortimer J. Buckley | James M. Norris |
| Kathleen C. Gubanich | Thomas M. Rampulla |
| Martha G. King | Glenn W. Reed |
| John T. Marcante | Karin A. Risi |
| Chris D. McIsaac | Michael Rollings |
Chairman Emeritus and Senior Advisor
John J. Brennan
Chairman, 1996–2009
Chief Executive Officer and President, 1996–2008
Founder
John C. Bogle
Chairman and Chief Executive Officer, 1974–1996
1 Mr. McNabb is considered an “interested person,” as defined in the Investment Company Act of 1940, because he is an officer of the Vanguard funds.
2 December 2002 for Vanguard Equity Income Fund, the Vanguard Municipal Bond Funds, and the Vanguard State Tax-Exempt Funds.
| |
| |
|  |
| P.O. Box 2600
Valley Forge, PA 19482-2600 |
Connect with Vanguard® > vanguard.com | |
| |
| |
| Fund Information > 800-662-7447 | CFA® is a registered trademark owned by CFA Institute. |
| Direct Investor Account Services > 800-662-2739 | |
| Institutional Investor Services > 800-523-1036 | |
| Text Telephone for People | |
| Who Are Deaf or Hard of Hearing> 800-749-7273 | |
| |
| This material may be used in conjunction | |
| with the offering of shares of any Vanguard | |
| fund only if preceded or accompanied by | |
| the fund’s current prospectus. | |
| |
| All comparative mutual fund data are from Lipper, a | |
| Thomson Reuters Company, or Morningstar, Inc., unless | |
| otherwise noted. | |
| |
| You can obtain a free copy of Vanguard’s proxy voting | |
| guidelines by visiting vanguard.com/proxyreporting or by | |
| calling Vanguard at 800-662-2739. The guidelines are | |
| also available from the SEC’s website, sec.gov. In | |
| addition, you may obtain a free report on how your fund | |
| voted the proxies for securities it owned during the 12 | |
| months ended June 30. To get the report, visit either | |
| vanguard.com/proxyreporting or sec.gov. | |
| |
| You can review and copy information about your fund at | |
| the SEC’s Public Reference Room in Washington, D.C. To | |
| find out more about this public service, call the SEC at | |
| 202-551-8090. Information about your fund is also | |
| available on the SEC’s website, and you can receive | |
| copies of this information, for a fee, by sending a | |
| request in either of two ways: via email addressed to | |
| publicinfo@sec.gov or via regular mail addressed to the | |
| Public Reference Section, Securities and Exchange | |
| Commission, Washington, DC 20549-1520. | |
| |
| | © 2016 The Vanguard Group, Inc. |
| | All rights reserved. |
| | Vanguard Marketing Corporation, Distributor. |
| |
| | Q3010 122016 |
 |
|
| Annual Report | October 31, 2016 |
| Vanguard International Explorer™ Fund |
A new format, unwavering commitment
As you begin reading this report, you’ll notice that we’ve made some improvements to the opening sections—based on feedback from you, our clients.
Page 1 starts with a new ”Your Fund’s Performance at a Glance,” a concise, handy summary of how your fund performed during the period.
In the renamed ”Chairman’s Perspective,” Bill McNabb will focus on enduring principles and investment insights.
We’ve modified some tables, and eliminated some redundancy, but we haven’t removed any information.
At Vanguard, we’re always looking for better ways to communicate and to help you make sound investment decisions. Thank you for entrusting your assets to us.
| |
| Contents | |
| Your Fund’s Performance at a Glance. | 1 |
| Chairman’s Perspective. | 3 |
| Advisors’ Report. | 7 |
| Fund Profile. | 11 |
| Performance Summary. | 13 |
| Financial Statements. | 15 |
| Your Fund’s After-Tax Returns. | 33 |
| About Your Fund’s Expenses. | 34 |
| Trustees Approve Advisory Arrangements. | 36 |
| Glossary. | 38 |
Please note: The opinions expressed in this report are just that—informed opinions. They should not be considered promises or advice.
Also, please keep in mind that the information and opinions cover the period through the date on the front of this report. Of course, the
risks of investing in your fund are spelled out in the prospectus.
See the Glossary for definitions of investment terms used in this report.
About the cover: No matter what language you speak, Vanguard has one consistent message and set of principles. Our primary
focus is on you, our clients. We conduct our business with integrity as a faithful steward of your assets. This message is shown
translated into seven languages, reflecting our expanding global presence.
Your Fund’s Performance at a Glance
• For the 12 months ended October 31, 2016, Vanguard International Explorer Fund returned –0.06%. Its benchmark returned 1.88%; the average return of its peers was 1.39%.
• The fund’s two advisors analyze small-capitalization companies to identify those they believe will grow faster than the overall market.
• Their bottom-up approach produced above-benchmark returns in some markets, including China, South Korea, France, and Sweden, but lagged overall in the Pacific and Europe. In particular, stock selection in Japan, Australia, Italy, and the United Kingdom dampened relative performance.
• By sector, the fund outperformed in information technology, consumer discretionary, and utilities, but underperformed in others, notably financials and materials.
• For the ten years ended October 31, 2016, the fund produced an average annual return of 3.56%. Its composite index returned 3.61% and the average return of its peers was 3.68%.
| |
| Total Returns: Fiscal Year Ended October 31, 2016 | |
| | Total |
| | Returns |
| Vanguard International Explorer Fund | -0.06% |
| S&P EPAC SmallCap Index | 1.88 |
| International Small-Cap Funds Average | 1.39 |
| International Small-Cap Funds Average: Derived from data provided by Lipper, a Thomson Reuters Company. | |
| |
| Total Returns: Ten Years Ended October 31, 2016 | |
| | Average |
| | Annual Return |
| International Explorer Fund | 3.56% |
| S&P EPAC SmallCap Index | 3.61 |
| International Small-Cap Funds Average | 3.68 |
| International Small-Cap Funds Average: Derived from data provided by Lipper, a Thomson Reuters Company. | |
The figures shown represent past performance, which is not a guarantee of future results. (Current performance may be lower or higher than the performance data cited. For performance data current to the most recent month-end, visit our website at vanguard.com/performance.) Note, too, that both investment returns and principal value can fluctuate widely, so an investor’s shares, when sold, could be worth more or less than their original cost.
1
| | |
| Expense Ratios | | |
| Your Fund Compared With Its Peer Group | | |
| | | Peer Group |
| | Fund | Average |
| International Explorer Fund | 0.42% | 1.59% |
The fund expense ratio shown is from the prospectus dated February 25, 2016, and represents estimated costs for the current fiscal year. For the fiscal year ended October 31, 2016, the fund’s expense ratio was 0.41%. The peer-group expense ratio is derived from data provided by Lipper, a Thomson Reuters Company, and captures information through year-end 2015.
Peer group: International Small-Cap Funds.
2
Chairman’s Perspective

Bill McNabb
Chairman and Chief Executive Officer
Dear Shareholder,
Over the three years ended August 31, 2016, investors poured more than $1 trillion into index funds. Indexing now accounts for nearly a third of all mutual fund assets—more than double what it did a decade ago and eight times its share two decades ago.1
By contrast, active management’s commercial struggles have reflected its disappointing investment performance. Over the decade ended December 31, 2015, 82% of actively managed stock funds and 81% of active bond funds have either underperformed their benchmarks or shut down.
This subpar performance has fueled the explosion of asset growth in indexing among individual, retirement, and nonprofit investors. So what might the trend mean for the future of actively managed funds?
Our research and experience indicate that active management can survive—and even succeed—but only if it’s offered at much lower expense.
High costs, which limit a manager’s ability to deliver benchmark-beating returns to clients, are the biggest reason why active has lagged. Industrywide as of December 31, 2015, the average expense ratio for all active stock funds is 1.14%, compared with 0.76% for stock index
1 Sources: Wall Street Journal; Morningstar, Inc.; and Investment Company Institute, 2016.
3
funds. And the expense advantage is even wider for bonds; the average expense ratio for an active bond fund is 0.93%, compared with 0.43% for bond index funds.
But even these big differences understate the real gap. These days, it’s not hard to find an index fund that charges maybe 0.05% or 0.10%. So even if you have identified active managers who are skilled at selecting stocks and bonds, to match the return of a comparable (much cheaper) index fund would require significant outperformance. Think about it. Any fund that charges 1.00% in expenses—not even the high end of the range—will find it extraordinarily difficult to overcome the index fund’s head start.
Active management also has taken a hit from a regulatory environment that has been favorable to low-cost strategies. The U.S. Department of Labor several years ago mandated greater disclosure of retirement plan fees. And its new fiduciary rule, which is set to take effect in April, requires financial advisors to demonstrate that their recommendations are aligned with their clients’ best interest. Both changes encourage the use of lower-cost investments, including index funds.
The future of active management
In light of all this, people have been asking me whether active management is “dead.” My response is both yes and no. High-cost active management is dead, and rightly so. It has never been a winning proposition
| | | |
| Market Barometer | | | |
| | | Average Annual Total Returns |
| | | Periods Ended October 31, 2016 |
| | One | Three | Five |
| | Year | Years | Years |
| Stocks | | | |
| Russell 1000 Index (Large-caps) | 4.26% | 8.48% | 13.51% |
| Russell 2000 Index (Small-caps) | 4.11 | 4.12 | 11.51 |
| Russell 3000 Index (Broad U.S. market) | 4.24 | 8.13 | 13.35 |
| FTSE All-World ex US Index (International) | 0.64 | -0.94 | 4.09 |
| |
| Bonds | | | |
| Bloomberg Barclays U.S. Aggregate Bond Index | | | |
| (Broad taxable market) | 4.37% | 3.48% | 2.90% |
| Bloomberg Barclays Municipal Bond Index | | | |
| (Broad tax-exempt market) | 4.06 | 4.89 | 4.34 |
| Citigroup Three-Month U.S. Treasury Bill Index | 0.22 | 0.07 | 0.07 |
| |
| CPI | | | |
| Consumer Price Index | 1.64% | 1.15% | 1.32% |
4
for investors. Low-cost active funds, though, can potentially play an important role for investors who seek to outperform the market.
Paying less for your funds is the only sure-fire way to improve your odds of achieving success in active management. But even if you have found an active manager with low costs, the odds of outperforming the market are still long. You have to be able to identify talented stock and bond portfolio managers with long time horizons and clear investment strategies. Look for managers with consistent track records and the discipline to stick closely to their investment strategy.
Know what you own and why
Despite the well-deserved reputation of indexing and the challenges for active managers, there’s still a place for traditional active strategies that are low-cost, diversified, and highly disciplined, and are run by talented managers who focus on the long term.
Vanguard has always applied these principles to our active strategies, and investors have benefited as a majority of our active funds outperformed their benchmarks and bested their peers’ average annual return over the ten years ended September 30, 2016.
Worried about the election’s impact on your portfolio?
The 2016 presidential election season was one of the most intense and unpredictable in U.S. history. In its aftermath, investors may be left with lingering questions about what the outcome will mean for their portfolios. The answer, based on Vanguard research into decades of historical data, is that presidential elections typically have no long-term effect on market performance.
These findings hold true regardless of the market’s initial reaction. Whether there’s a swoon or bounce immediately after an election, investors shouldn’t extrapolate that performance to the long term.
As you can see in the accompanying chart, data going back to 1853 show that stock market returns are virtually identical no matter which party controls the White House. Although headlines out of Washington at any given time may still cause concern, investors
shouldn’t overreact to short-term events. Instead, it’s best to maintain a balanced and diversified portfolio and stay focused on your long-term goals.
Average annual stock market returns based on party control of the White House (1853–2015)
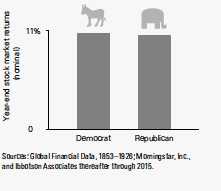
5
But it’s crucial for investors to be patient. Even active managers with the best track records frequently underperform their benchmarks when their investment styles are out of favor. Such periods, though temporary, can persist. So it’s important when entrusting your assets to an active strategy to be in it for the long haul.
Make sure you know what you’re buying and what the risks are. Active strategies are becoming more complex, so it’s important to clearly understand what the investments in your portfolio are designed to accomplish and why you want to hold them. Otherwise, you run the risk of selecting strategies that don’t fit your needs or objectives.
Keeping these considerations in mind can potentially boost your chances of success in identifying active strategies that may be able to help you reach your goals.
As always, thank you for investing with Vanguard.
Sincerely,

F. William McNabb III
Chairman and Chief Executive Officer
November 9, 2016
6
Advisors’ Report
For the fiscal year ended October 31, 2016, Vanguard International Explorer Fund returned –0.06%. Your fund is managed by two independent advisors, a strategy that enhances its diversification by providing exposure to distinct yet complementary investment approaches. It is not uncommon for different advisors to have different views about individual securities or the broader investment environment.
The advisors, the amount and percentage of fund assets each manages, and brief descriptions of their investment strategies are presented in the table below. The advisors have also prepared a discussion of the investment environment that existed during the year and of how their portfolio positioning reflected that assessment. These comments were prepared on November 10, 2016.
November 4, 2016, marked the fund’s 20th anniversary. We would like to thank Schroder Investment Management for being an advisor to the fund since its launch.
Schroder Investment Management
North America Inc.
Portfolio Manager:
Matthew F. Dobbs,
Head of Global Small Companies
International small-capitalization equities made limited progress over the year, with the S&P EPAC SmallCap Index returning 1.9% in U.S. dollars. Overall returns may have been modest for the year, but international small caps have again
| | | |
| Vanguard International Explorer Fund Investment Advisors |
| |
| | Fund Assets Managed | |
| Investment Advisor | % | $ Million | Investment Strategy |
| Schroder Investment | 69 | 1,961 | The advisor employs a fundamental investment |
| Management North America Inc. | | | approach that considers macroeconomic factors while |
| | | | focusing primarily on company-specific factors, |
| | | | including a company’s potential for long-term growth, |
| | | | financial condition, quality of management, and |
| | | | sensitivity to cyclical factors. The advisor also |
| | | | considers the relative value of a company’s securities |
| | | | compared with those of other companies and the |
| | | | market as a whole. |
| Wellington Management | 28 | 801 | The advisor employs a traditional, bottom-up approach |
| Company LLP | | | that is opportunistic in nature, relying on global and |
| | | | regional research resources to identify both |
| | | | growth-oriented and neglected or misunderstood |
| | | | companies. |
| Cash Investments | 3 | 67 | These short-term reserves are invested by Vanguard in |
| | | | equity index products to simulate investment in stocks. |
| | | | Each advisor also may maintain a modest cash |
| | | | position. |
7
outperformed their larger peers, which returned –2.7% as measured by the S&P EPAC Large/Midcap Index.
The small-cap “effect” has been most prominent in continental Europe, where smaller-company outperformance in the financial and health care sectors has been particularly influential; and in Japan, where the more domestic focus of smaller companies has benefited them relative to large caps during a period of strength in the Japanese yen.
Among the worst returns were in the United Kingdom, where the vote to leave the European Union on June 23 hit more domestically focused smaller companies particularly hard. The rout was led by key small-cap sectors such as house builders, real estate, retail, and consumer services. This reflected acute investor concerns over the outlook for revenues, the impact on input costs (costs for items used to produce goods and services) from a dramatically weaker pound sterling, and the potential for restrictive immigration policies.
It has been a mixed period regarding relative performance. Stock selection in Japan has been the main challenge. It was not helped by our underweighting of the market, which has been the strongest major-market performer over the year. We have struggled to find attractive value among domestic defensives and the high-yielding real estate investment trust sector, but given a strong currency and a hunt for yield amid the negative interest rate policy pursued by the Bank of Japan,
these areas have outperformed strongly. Meanwhile, stock selection in consumer discretionary (auto parts companies such as Unipres and Eagle Industries), information technology (OBIC, Kakaku. com), and materials (Kumiai Chemical) lagged. The impact was only partly offset by strong showings among some of our domestically oriented industrial holdings such as Aica Kogyo, Trusco Nakayama, and Fukushima Industries.
Our continental European holdings also disappointed, almost entirely because of our financials in Italy, most notably Anima Holding, BPER, and Banca Sistema. This more than counteracted good selection among information technology stocks, most notably Logitech, Ubisoft, and Lectra.
Selection in Asian markets outside Japan (in both developed and emerging markets) has generally been strong. A number of consumer names in Hong Kong and China have been notably strong, including New Oriental Education and Shenzhou International, along with South Korean auto parts stocks Mando and Hanon Systems. Selection in information technology also added value because of strong returns from SINA.com, the Chinese internet stock, and Chroma ATE in Taiwan.
The year has closed with perhaps more than the usual litany of uncertainties, including political developments in Europe, continued fragility in a number of emerging markets, and signs that the efficacy of monetary policy tools is fading. The constraints of high debt levels and poor demographics (and not just in developed
8
economies) suggest that overall global growth will continue to be as muted as it has been over the last seven years. Long-term investors will have to work harder to identify areas of superior growth, and in that context we remain confident that selective exposure to smaller companies is strategically important. We will continue to work hard to identify companies offering sustainable growth and superior returns.
Wellington Management Company LLP
Portfolio Manager:
Simon H. Thomas,
Senior Managing Director and Equity Portfolio Manager
Global equities rose over the 12-month period. The year had a volatile start as Chinese stocks plunged in early January, sparking a global risk-off trade that caused central banks to increase monetary easing efforts around the world. Toward the end of the second quarter, after a lengthy and, at times, acrimonious campaign, the British electorate voted to leave the European Union. Risk appetite has fluctuated considerably over the period as governments have had to grapple with a slow-growth, low-inflation environment. The U.S. Federal Reserve’s signaling of a second rate hike at its December meeting, coupled with a “hard” Brexit scenario, U.S. election uncertainty, and potential monetary shifts by the European Central Bank, caused global equities to pull back toward the end of the period.
Stock selection within the financial, materials, and industrial sectors weighed on the performance of our portfolio. (Effective September 1, a real estate sector was added, composed of holdings that previously were classified as financials. The index returns and attribution analysis of the real estate sector are for the period starting September 1 and ending October 31.) This weight on performance was partially offset by strong stock selection within consumer staples, energy, and information technology. Allocation among sectors, which is largely a result of our bottom-up stock selection process, weighed on performance as well, largely driven by our overweight allocation to the consumer discretionary sector. At the regional level, selection within Europe, specifically the United Kingdom, and Japan detracted most from relative results. From an allocation perspective, our overweight to Japan aided relative performance.
The largest detractors from relative performance during the period included Anima, B&M European Value Retail, and N Brown Group. Anima, an Italian asset manager, performed poorly as the environment for financials in Italy became more challenging because of low interest rates and the overall health of the Italian banking sector. Despite this short-term volatility, we have maintained our position in the company as we believe it will be a long-term beneficiary of the increasing Italian savings rate, and the continued shift of retirement assets to asset managers.
9
B&M European Value Retail, one of the leading value retailers of general merchandise in the United Kingdom, traded down after the Brexit vote in June. This is a company that we are really excited about and believe was oversold post-Brexit, given the company’s underlying fundamentals. It has a first-class management team that will likely benefit from a slower U.K. economy, as consumers have tightened their belts. We still held the stock as of the end of the period. N Brown Group, a U.K.-based internet and catalogue home shopping company offering clothes and accessories, faced a much more challenging business environment after the Brexit vote. Many of its input goods are U.S.-dollar-based, which became a challenge given the depreciating pound sterling. We exited our position following the Brexit vote.
Top contributors to relative performance included Kyudenko, Nippon Shinyaku, and Gategroup. Kyudenko is a Japanese electrical engineering company that owns a sizable solar asset portfolio. The company continues to benefit from a healthy construction cycle in Japan, as well as the appreciation of value in its solar assets. Shares remain inexpensive, and the company has a net cash position on its balance sheet. We continue to hold the position based
on our positive outlook for the company. Nippon Shinyaku is a Japan-based pharmaceutical company. We continue to be optimistic about the company’s new pulmonary hypertension drug, Selexipag, which has been approved in the United States, and is expected to be approved in Europe in the near future. We maintained our position as the company continues to execute and maintains a strong drug pipeline. Switzerland-based Gategroup is a leading provider of catering, hospitality, and logistics services to the travel industry. In July, the company was acquired by HNA Group, a Chinese travel and logistics conglomerate. We supported the acquisition given that shares were at an all-time high and sold our position into strength.
Relative to the benchmark, at the end of the period we were most overweight the consumer discretionary and health care sectors. We were most underweight the new real estate sector and information technology. On a regional basis, Japan was our greatest overweight position relative to the benchmark. We were most underweight Asia excluding Japan, though we continue to look for high-quality companies that have been neglected by the market and thus offer attractive investment opportunities.
10
International Explorer Fund
Fund Profile
As of October 31, 2016
| | | |
| Portfolio Characteristics | | |
| | | | MSCI |
| | | S&P | AC |
| | | EPAC | World |
| | | SmallCap | Index ex |
| | Fund | Index | USA |
| Number of Stocks | 298 | 3,907 | 1,844 |
| Median Market Cap | $1.7B | $1.6B | $29.6B |
| Price/Earnings Ratio | 20.9x | 19.9x | 20.9x |
| Price/Book Ratio | 1.9x | 1.5x | 1.6x |
| Return on Equity | 12.0% | 10.5% | 14.9% |
| Earnings Growth | | | |
| Rate | 15.0% | 10.1% | 6.9% |
| Dividend Yield | 2.2% | 2.3% | 3.0% |
| Turnover Rate | 37% | — | — |
| Ticker Symbol | VINEX | — | — |
| Expense Ratio1 | 0.42% | — | — |
| Short-Term Reserves | 2.3% | — | — |
| | | |
| Sector Diversification (% of equity exposure) |
| | | | MSCI |
| | | S&P | AC |
| | | EPAC | World |
| | | SmallCap | Index |
| | Fund | Index | ex USA |
| Consumer | | | |
| Discretionary | 20.2% | 16.0% | 11.5% |
| Consumer Staples | 5.0 | 6.2 | 10.4 |
| Energy | 1.1 | 2.2 | 6.8 |
| Financials | 11.0 | 12.4 | 22.5 |
| Health Care | 8.1 | 8.5 | 8.2 |
| Industrials | 26.2 | 22.2 | 11.7 |
| Information | | | |
| Technology | 11.7 | 11.0 | 9.5 |
| Materials | 9.6 | 9.5 | 7.7 |
| Real Estate | 4.6 | 9.4 | 3.4 |
| Telecommunication | | | |
| Services | 0.7 | 0.9 | 4.9 |
| Utilities | 1.8 | 1.7 | 3.4 |
| | |
| Volatility Measures | | |
| | | MSCI |
| | S&P | AC |
| | EPAC | World |
| | SmallCap | Index ex |
| | Index | USA |
| R-Squared | 0.94 | 0.76 |
| Beta | 0.94 | 0.80 |
These measures show the degree and timing of the fund’s fluctuations compared with the indexes over 36 months.
| | |
| Ten Largest Holdings (% of total net assets) |
| Anima Holding SPA | Asset Management | |
| | & Custody Banks | 1.3% |
| Rubis SCA | Gas Utilities | 1.2 |
| BRAAS Monier Building | Construction | |
| Group SA | Materials | 1.2 |
| Nippon Shinyaku Co. | | |
| Ltd. | Pharmaceuticals | 1.1 |
| Cerved Information | | |
| Solutions SPA | Specialized Finance | 1.1 |
| Logitech International SA Technology | |
| | Hardware, Storage & | |
| | Peripherals | 1.1 |
| Smurfit Kappa Group plc Paper Packaging | 1.0 |
| SPIE SA | Construction & | |
| | Engineering | 1.0 |
| Ubisoft Entertainment | Home Entertainment | |
| SA | Software | 1.0 |
| OC Oerlikon Corp. AG | Industrial Machinery | 1.0 |
| Top Ten | | 11.0% |
The holdings listed exclude any temporary cash investments and equity index products.
Allocation by Region (% of equity exposure)
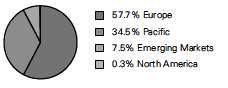
1 The expense ratio shown is from the prospectus dated February 25, 2016, and represents estimated costs for the current fiscal year. For the fiscal year ended October 31, 2016, the expense ratio was 0.41%.
11
International Explorer Fund
| | | |
| Market Diversification (% of equity exposure) |
| | | S&P | MSCI |
| | | EPAC | AC World |
| | | SmallCap | Index ex |
| | Fund | Index | USA |
| Europe | | | |
| United Kingdom | 14.8% | 14.6% | 12.4% |
| Italy | 8.0 | 2.0 | 1.4 |
| France | 7.9 | 8.6 | 6.9 |
| Germany | 5.5 | 7.8 | 6.3 |
| Switzerland | 4.8 | 7.9 | 6.0 |
| Sweden | 3.8 | 3.1 | 1.9 |
| Ireland | 4.6 | 0.3 | 0.3 |
| Netherlands | 3.0 | 1.8 | 2.3 |
| Denmark | 1.4 | 1.4 | 1.2 |
| Austria | 1.2 | 0.2 | 0.1 |
| Other | 2.7 | 5.9 | 4.5 |
| Subtotal | 57.7% | 53.6% | 43.3% |
| Pacific | | | |
| Japan | 26.7% | 25.7% | 17.2% |
| Australia | 4.4 | 6.6 | 5.1 |
| South Korea | 1.8 | 3.8 | 3.4 |
| Hong Kong | 1.1 | 2.5 | 2.5 |
| Other | 0.5 | 1.4 | 1.0 |
| Subtotal | 34.5% | 40.0% | 29.2% |
| Emerging Markets | | | |
| India | 2.5% | 0.0% | 2.0% |
| China | 2.5 | 0.8 | 6.2 |
| Taiwan | 1.7 | 0.0 | 2.9 |
| Other | 0.8 | 0.0 | 8.9 |
| Subtotal | 7.5% | 0.8% | 20.0% |
| North America | | | |
| Other | 0.3% | 0.3% | 6.8% |
| Middle East | 0.0% | 0.8% | 0.5% |
| Other | 0.0% | 4.5% | 0.2% |
"Other" represents securities that are not classified by the fund's benchmark index.
12
International Explorer Fund
Performance Summary
All of the returns in this report represent past performance, which is not a guarantee of future results that may be achieved by the fund. (Current performance may be lower or higher than the performance data cited. For performance data current to the most recent month-end, visit our website at vanguard.com/performance.) Note, too, that both investment returns and principal value can fluctuate widely, so an investor’s shares, when sold, could be worth more or less than their original cost. The returns shown do not reflect taxes that a shareholder would pay on fund distributions or on the sale of fund shares.
Cumulative Performance: October 31, 2006, Through October 31, 2016
Initial Investment of $10,000
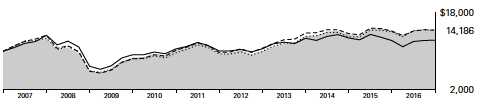
| | | | |
| | Average Annual Total Returns | |
| | Periods Ended October 31, 2016 | |
| | | | | Final Value |
| | One | Five | Ten | of a $10,000 |
| | Year | Years | Years | Investment |
| International Explorer Fund | -0.06% | 8.34% | 3.56% | $14,186 |
| S&P EPAC SmallCap Index | 1.88 | 8.64 | 3.61 | 14,262 |
| International Small-Cap Funds Average | 1.39 | 8.07 | 3.68 | 14,348 |
| MSCI All Country World Index ex USA | 0.72 | 4.11 | 2.07 | 12,277 |
International Small-Cap Funds Average: Derived from data provided by Lipper, a Thomson Reuters Company.
See Financial Highlights for dividend and capital gains information.
13
International Explorer Fund
Fiscal-Year Total Returns (%): October 31, 2006, Through October 31, 2016
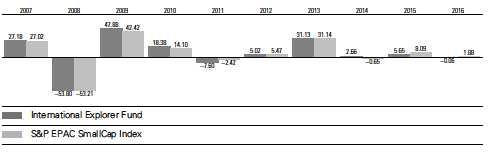
Average Annual Total Returns: Periods Ended September 30, 2016
This table presents returns through the latest calendar quarter—rather than through the end of the fiscal period.
Securities and Exchange Commission rules require that we provide this information.
| | | | |
| | Inception | One | Five | Ten |
| | Date | Year | Years | Years |
| International Explorer Fund | 11/4/1996 | 7.95% | 10.77% | 4.27% |
14
International Explorer Fund
Financial Statements
Statement of Net Assets
As of October 31, 2016
The fund reports a complete list of its holdings in regulatory filings four times in each fiscal year, at the quarter-ends. For the second and fourth fiscal quarters, the lists appear in the fund’s semiannual and annual reports to shareholders. For the first and third fiscal quarters, the fund files the lists with the Securities and Exchange Commission on Form N-Q. Shareholders can look up the fund’s Forms N-Q on the SEC’s website at sec.gov. Forms N-Q may also be reviewed and copied at the SEC’s Public Reference Room (see the back cover of this report for further information).
| | | |
| | | | Market |
| | | | Value• |
| | | Shares | ($000) |
| Common Stocks (96.0%)1 | | |
| Australia (4.0%) | | |
| | Computershare Ltd. | 1,553,679 | 12,446 |
| | Mirvac Group | 6,146,824 | 9,751 |
| | oOh!media Ltd. | 2,861,954 | 9,295 |
| | Iluka Resources Ltd. | 2,094,685 | 9,183 |
| | Ansell Ltd. | 547,555 | 9,021 |
| | Tox Free Solutions Ltd. | 4,248,114 | 7,588 |
| | Domino’s Pizza | | |
| | Enterprises Ltd. | 151,696 | 7,390 |
| | Fairfax Media Ltd. | 11,707,454 | 7,333 |
| | Spotless Group Holdings | | |
| | Ltd. | 8,552,373 | 6,488 |
| | Incitec Pivot Ltd. | 2,439,068 | 5,455 |
| ^ | Japara Healthcare Ltd. | 3,284,183 | 4,689 |
| | Mantra Group Ltd. | 1,784,551 | 4,456 |
| | SEEK Ltd. | 386,119 | 4,288 |
| | Asaleo Care Ltd. | 3,589,221 | 3,977 |
| | Amcor Ltd. | 303,234 | 3,385 |
| ^ | Regis Healthcare Ltd. | 1,099,902 | 3,289 |
| ^,* | Karoon Gas Australia Ltd. | 1,374,635 | 2,388 |
| ^ | Estia Health Ltd. | 1,003,698 | 2,045 |
| | Link Administration | | |
| | Holdings Ltd. | 262,865 | 1,438 |
| | | | 113,905 |
| Austria (1.2%) | | |
| | Lenzing AG | 98,802 | 12,877 |
| | ANDRITZ AG | 144,985 | 7,581 |
| | BUWOG AG | 185,240 | 4,477 |
| | Wienerberger AG | 264,678 | 4,230 |
| | Schoeller-Bleckmann | | |
| | Oilfield Equipment AG | 59,483 | 4,214 |
| | | | 33,379 |
| Belgium (0.7%) | | |
| | Cie d’Entreprises CFE | 52,608 | 5,799 |
| | D’ieteren SA | 117,856 | 5,195 |
| | Ontex Group NV | 150,617 | 4,556 |
| * | Galapagos NV | 49,600 | 3,018 |
| | | | 18,568 |
| | | |
| China (2.4%) | | |
| | Shenzhou International | | |
| | Group Holdings Ltd. | 2,482,000 | 16,440 |
| * | SINA Corp. | 208,099 | 15,012 |
| * | New Oriental Education | | |
| | & Technology Group Inc. | | |
| | ADR | 285,056 | 14,290 |
| | ANTA Sports Products | | |
| | Ltd. | 2,437,000 | 7,028 |
| | Belle International | | |
| | Holdings Ltd. | 8,858,000 | 5,349 |
| | CSPC Pharmaceutical | | |
| | Group Ltd. | 4,756,000 | 4,924 |
| | Haitian International | | |
| | Holdings Ltd. | 1,807,000 | 3,725 |
| | | | 66,768 |
| Denmark (1.3%) | | |
| | Matas A/S | 1,375,000 | 26,685 |
| * | H Lundbeck A/S | 301,184 | 9,707 |
| | Ambu A/S Class B | 28,887 | 1,497 |
| * | OW Bunker A/S | 1,000,000 | — |
| | | | 37,889 |
| Finland (0.2%) | | |
| | Tikkurila Oyj | 250,000 | 4,813 |
| |
| France (7.4%) | | |
| | Rubis SCA | 375,361 | 34,230 |
| | SPIE SA | 1,500,000 | 28,347 |
| * | Ubisoft Entertainment SA | 825,000 | 28,071 |
| | Elis SA | 1,561,961 | 25,950 |
| * | Marie Brizard Wine & | | |
| | Spirits SA | 1,000,000 | 16,989 |
| | Imerys SA | 167,514 | 11,663 |
| *,2 | Maisons du Monde SA | 390,663 | 10,997 |
| | Lectra | 580,000 | 10,484 |
| * | ID Logistics Group | 69,999 | 9,874 |
| | Eurazeo SA | 108,699 | 6,259 |
| | Orpea | 61,653 | 5,131 |
| * | Virbac SA | 31,697 | 5,044 |
| | BioMerieux | 32,381 | 4,718 |
15
International Explorer Fund
| | | |
| | | | Market |
| | | | Value• |
| | | Shares | ($000) |
| | Albioma SA | 250,000 | 4,130 |
| | Wendel SA | 33,264 | 3,827 |
| | Coface SA | 512,886 | 3,321 |
| | | | 209,035 |
| Germany (5.1%) | | |
| | BRAAS Monier Building | | |
| | Group SA | 1,133,916 | 32,679 |
| | Duerr AG | 300,000 | 22,371 |
| | XING AG | 87,891 | 17,926 |
| | RIB Software AG | 900,000 | 12,209 |
| | Zeal Network SE | 318,921 | 10,839 |
| ^ | Wacker Chemie AG | 100,000 | 8,921 |
| | Grand City Properties SA | 425,000 | 7,476 |
| | STRATEC Biomedical AG | 123,627 | 7,068 |
| * | Senvion SA | 290,000 | 5,101 |
| | Sartorius AG Preference | | |
| | Shares | 58,461 | 4,602 |
| | SAF-Holland SA | 339,483 | 4,559 |
| *,2 | windeln.de SE | 850,000 | 3,824 |
| | Deutsche Beteiligungs AG | 110,136 | 3,723 |
| ^ | ElringKlinger AG | 173,940 | 2,694 |
| | | | 143,992 |
| Hong Kong (1.1%) | | |
| | Techtronic Industries Co. | | |
| | Ltd. | 3,898,500 | 14,647 |
| | Hysan Development Co. | | |
| | Ltd. | 1,373,000 | 6,337 |
| | Johnson Electric Holdings | | |
| | Ltd. | 2,052,125 | 4,960 |
| | Value Partners Group Ltd. | 4,491,000 | 4,284 |
| | | | 30,228 |
| India (2.4%) | | |
| | Gujarat Pipavav Port Ltd. | 7,640,999 | 18,628 |
| | Apollo Hospitals | | |
| | Enterprise Ltd. | 909,567 | 18,261 |
| | Container Corp. Of India | | |
| | Ltd. | 616,702 | 12,712 |
| | Phoenix Mills Ltd. | 1,438,800 | 8,131 |
| | Idea Cellular Ltd. | 5,969,556 | 6,819 |
| | Multi Commodity | | |
| | Exchange of India Ltd. | 205,558 | 3,966 |
| | | | 68,517 |
| Indonesia (0.2%) | | |
| | Matahari Department | | |
| | Store Tbk PT | 3,465,800 | 4,780 |
| | Ciputra Property Tbk PT | 34,752,201 | 2,026 |
| | | | 6,806 |
| Ireland (4.5%) | | |
| | Smurfit Kappa Group plc | | |
| | (London Shares) | 1,150,000 | 25,249 |
| * | Dalata Hotel Group plc | 5,000,000 | 22,374 |
| | Glanbia plc | 900,000 | 14,661 |
| | Origin Enterprises plc | 2,000,000 | 12,401 |
| | | |
| | Irish Continental Group | | |
| | plc | 2,500,000 | 11,659 |
| | Irish Residential | | |
| | Properties REIT plc | 8,400,000 | 10,832 |
| | Kingspan Group plc | 425,000 | 10,407 |
| * | Cairn Homes plc | 5,854,846 | 7,575 |
| * | FBD Holdings plc | 650,000 | 4,351 |
| | Smurfit Kappa Group plc | 175,000 | 3,840 |
| | IFG Group plc | 1,675,000 | 3,315 |
| | | | 126,664 |
| Italy (7.7%) | | |
| 2 | Anima Holding SPA | 7,437,016 | 36,232 |
| | Cerved Information | | |
| | Solutions SPA | 3,947,405 | 31,773 |
| * | Yoox Net-A-Porter | | |
| | Group SPA | 850,000 | 24,451 |
| | Maire Tecnimont SPA | 6,500,000 | 15,672 |
| ^ | Salvatore Ferragamo SPA | 606,146 | 14,817 |
| | Moncler SPA | 761,170 | 12,672 |
| | Credito Emiliano SPA | 2,125,000 | 11,979 |
| | Cairo Communication | | |
| | SPA | 2,372,242 | 10,177 |
| | DiaSorin SPA | 160,424 | 9,859 |
| | FinecoBank Banca Fineco | | |
| | SPA | 1,500,000 | 8,766 |
| | Brunello Cucinelli SPA | 431,223 | 8,542 |
| 2 | Infrastrutture Wireless | | |
| | Italiane SPA | 1,802,466 | 8,521 |
| 2 | OVS SPA | 1,419,252 | 7,775 |
| | Autogrill SPA | 913,656 | 7,615 |
| 2 | Banca Sistema SPA | 2,371,523 | 6,225 |
| *,2 | Technogym SPA | 750,000 | 3,386 |
| | | | 218,462 |
| Japan (25.5%) | | |
| | Nippon Shinyaku Co. Ltd. | 637,800 | 32,376 |
| | Aica Kogyo Co. Ltd. | 742,700 | 21,194 |
| | Hitachi Transport System | | |
| | Ltd. | 978,800 | 20,177 |
| | Digital Garage Inc. | 1,067,300 | 20,167 |
| | Tsuruha Holdings Inc. | 167,000 | 19,269 |
| | Tokai Tokyo Financial | | |
| | Holdings Inc. | 3,670,500 | 18,622 |
| | Arcs Co. Ltd. | 709,300 | 17,798 |
| | Zenkoku Hosho Co. Ltd. | 388,555 | 16,706 |
| | Ai Holdings Corp. | 668,400 | 16,424 |
| | Trusco Nakayama Corp. | 315,700 | 16,322 |
| | Kuroda Electric Co. Ltd. | 811,400 | 15,787 |
| | Nihon Parkerizing Co. Ltd. | 1,140,000 | 15,708 |
| | Glory Ltd. | 465,700 | 15,395 |
| | Nippon Densetsu Kogyo | | |
| | Co. Ltd. | 807,600 | 14,714 |
| | Koito Manufacturing Co. | | |
| | Ltd. | 276,100 | 14,496 |
16
International Explorer Fund
| | | |
| | | | Market |
| | | | Value• |
| | | Shares | ($000) |
| | TPR Co. Ltd. | 493,100 | 14,259 |
| | Nitta Corp. | 548,700 | 14,201 |
| | Kureha Corp. | 369,400 | 14,127 |
| | Kakaku.com Inc. | 769,500 | 12,928 |
| | JSP Corp. | 512,500 | 12,245 |
| | Obara Group Inc. | 279,700 | 12,054 |
| | Kissei Pharmaceutical | | |
| | Co. Ltd. | 445,800 | 11,651 |
| | Daikyonishikawa Corp. | 890,400 | 11,529 |
| | SCSK Corp. | 307,400 | 11,467 |
| | OBIC Business | | |
| | Consultants Co. Ltd. | 243,800 | 11,416 |
| | Kyudenko Corp. | 346,400 | 11,160 |
| | Temp Holdings Co. Ltd. | 626,500 | 10,625 |
| | Alps Electric Co. Ltd. | 440,090 | 10,557 |
| | Sumitomo Real Estate | | |
| | Sales Co. Ltd. | 465,300 | 10,517 |
| | Daibiru Corp. | 1,195,400 | 10,384 |
| | Shinmaywa Industries Ltd. | 1,321,000 | 10,225 |
| | Nippon Shokubai Co. Ltd. | 144,361 | 9,962 |
| | Fukushima Industries | | |
| | Corp. | 285,500 | 9,747 |
| * | IHI Corp. | 3,703,245 | 9,742 |
| | Musashi Seimitsu | | |
| | Industry Co. Ltd. | 384,900 | 9,427 |
| | Unipres Corp. | 469,200 | 9,055 |
| | NEC Networks & System | | |
| | Integration Corp. | 488,600 | 8,683 |
| | Sanwa Holdings Corp. | 867,665 | 8,641 |
| | Asahi Intecc Co. Ltd. | 182,870 | 7,920 |
| | Taiheiyo Cement Corp. | 2,736,000 | 7,836 |
| | Kenedix Inc. | 1,823,900 | 7,669 |
| | Takara Leben Co. Ltd. | 1,088,600 | 7,384 |
| | Lintec Corp. | 329,700 | 7,181 |
| | Iida Group Holdings Co. | | |
| | Ltd. | 369,785 | 7,148 |
| | Tokyo TY Financial Group | | |
| | Inc. | 219,643 | 7,028 |
| | Nabtesco Corp. | 225,300 | 6,729 |
| | Teijin Ltd. | 341,800 | 6,604 |
| | Ferrotec Corp. | 530,400 | 6,451 |
| | Disco Corp. | 51,900 | 6,273 |
| * | Itoham Yonekyu Holdings | | |
| | Inc. | 651,000 | 6,208 |
| | Miura Co. Ltd. | 352,400 | 6,081 |
| | Ezaki Glico Co. Ltd. | 105,300 | 5,986 |
| | Toyo Tire & Rubber Co. | | |
| | Ltd. | 375,200 | 5,819 |
| | Tokyo Ohka Kogyo Co. | | |
| | Ltd. | 155,480 | 5,521 |
| | Ain Holdings Inc. | 81,600 | 5,508 |
| | Shinsei Bank Ltd. | 3,390,235 | 5,481 |
| | EPS Holdings Inc. | 396,100 | 5,198 |
| | Eagle Industry Co. Ltd. | 349,600 | 4,988 |
| | | |
| | Tokyo Steel | | |
| | Manufacturing Co. Ltd. | 718,100 | 4,981 |
| ^ | Kumiai Chemical Industry | | |
| | Co. Ltd. | 876,100 | 4,960 |
| | Tenma Corp. | 265,300 | 4,595 |
| | Leopalace21 Corp. | 650,000 | 4,226 |
| ^ | Yushin Precision | | |
| | Equipment Co. Ltd. | 175,200 | 4,081 |
| ^ | Jamco Corp. | 197,300 | 4,068 |
| * | Kobe Steel Ltd. | 488,500 | 4,031 |
| | Hitachi Metals Ltd. | 321,700 | 4,021 |
| | Ichigo Inc. | 909,600 | 3,944 |
| | Takasago International | | |
| | Corp. | 144,600 | 3,876 |
| | DMG Mori Co. Ltd. | 348,400 | 3,695 |
| | H2O Retailing Corp. | 246,900 | 3,667 |
| ^,* | W-Scope Corp. | 184,800 | 3,306 |
| | Mitsui Sugar Co. Ltd. | 146,500 | 3,301 |
| | Casio Computer Co. Ltd. | 228,100 | 3,177 |
| | Tsutsumi Jewelry Co. Ltd. | 187,900 | 2,973 |
| | | | 721,672 |
| Luxembourg (0.7%) | | |
| | L’Occitane International | | |
| | SA | 6,365,500 | 13,141 |
| | Reinet Investments SCA | 339,753 | 6,694 |
| | | | 19,835 |
| Malaysia (0.1%) | | |
| | Bursa Malaysia Bhd. | 1,977,900 | 4,077 |
| |
| Netherlands (2.9%) | | |
| * | Van Lanschot NV Class A | 950,000 | 19,477 |
| | Kendrion NV | 350,000 | 10,094 |
| * | SIF Holding NV | | |
| | (Berlin Shares) | 581,260 | 10,084 |
| | IMCD Group NV | 230,511 | 9,969 |
| 2 | Refresco Group NV | 658,323 | 9,617 |
| *,2 | Intertrust NV | 399,996 | 8,432 |
| | Beter Bed Holding NV | 400,000 | 7,243 |
| * | SIF Holding NV | 343,740 | 5,961 |
| | Delta Lloyd NV | 4 | — |
| | | | 80,877 |
| New Zealand (0.3%) | | |
| | Fletcher Building Ltd. | 1,197,176 | 8,869 |
| |
| Norway (0.3%) | | |
| | Kongsberg Gruppen ASA | 518,433 | 7,401 |
| |
| Other (0.8%) | | |
| ^,3 | Vanguard FTSE All World | | |
| | ex-US Small-Cap ETF | 249,010 | 24,052 |
| |
| Singapore (0.2%) | | |
| | First Resources Ltd. | 4,816,500 | 6,301 |
17
International Explorer Fund
| | | |
| | | | Market |
| | | | Value• |
| | | Shares | ($000) |
| South Korea (1.8%) | | |
| | Medy-Tox Inc. | 32,771 | 11,627 |
| | NCSoft Corp. | 36,154 | 8,352 |
| | Mando Corp. | 32,377 | 7,570 |
| ^ | Nexen Tire Corp. | 645,802 | 7,408 |
| | S-1 Corp. | 83,659 | 6,755 |
| ^ | Hotel Shilla Co. Ltd. | 99,951 | 5,000 |
| | Hanon Systems | 302,600 | 2,829 |
| | | | 49,541 |
| Spain (0.7%) | | |
| | Applus Services SA | 900,000 | 8,636 |
| | Melia Hotels International | | |
| | SA | 626,180 | 7,731 |
| | Naturhouse Health SAU | 600,000 | 3,194 |
| | | | 19,561 |
| Sweden (3.7%) | | |
| 2 | Bravida Holding AB | 3,250,000 | 19,974 |
| 2 | Nordax Group AB | 3,125,000 | 19,615 |
| | Modern Times Group | | |
| | MTG AB Class B | 600,000 | 16,148 |
| 2 | Coor Service | | |
| | Management Holding | | |
| | AB | 2,750,000 | 15,984 |
| | Bufab AB | 1,724,046 | 14,343 |
| | Loomis AB Class B | 450,000 | 12,791 |
| | Concentric AB | 469,805 | 5,587 |
| | | | 104,442 |
| Switzerland (4.6%) | | |
| | Logitech International SA | 1,250,000 | 30,233 |
| | OC Oerlikon Corp. AG | 2,859,137 | 26,879 |
| | Helvetia Holding AG | 37,500 | 19,510 |
| | Ascom Holding AG | 900,000 | 15,411 |
| | Interroll Holding AG | 14,000 | 15,281 |
| | u-blox Holding AG | 51,532 | 9,741 |
| | Comet Holding AG | 6,000 | 5,202 |
| | ams AG | 183,362 | 5,134 |
| | Tecan Group AG | 21,312 | 3,512 |
| | | | 130,903 |
| Taiwan (1.6%) | | |
| | Giant Manufacturing Co. | | |
| | Ltd. | 1,767,000 | 12,498 |
| | Chroma ATE Inc. | 3,824,000 | 9,693 |
| | CTCI Corp. | 4,336,000 | 6,363 |
| | Gourmet Master Co. Ltd. | 657,300 | 5,899 |
| | Catcher Technology Co. | | |
| | Ltd. | 492,000 | 3,851 |
| | Eclat Textile Co. Ltd. | 326,000 | 3,694 |
| | Globalwafers Co. Ltd. | 1,283,000 | 3,162 |
| | | | 45,160 |
| Thailand (0.2%) | | |
| | LPN Development PCL | 14,565,300 | 4,747 |
| |
| United Arab Emirates (0.1%) | |
| * | Lamprell plc | 3,650,000 | 3,280 |
| | | |
| United Kingdom (14.1%) | | |
| | Dechra Pharmaceuticals | | |
| | plc | 850,000 | 13,988 |
| | Grainger plc | 4,660,000 | 12,615 |
| | Restaurant Group plc | 2,501,386 | 11,475 |
| | DCC plc | 140,000 | 11,390 |
| | Kennedy Wilson Europe | | |
| | Real Estate plc | 879,949 | 10,923 |
| | HomeServe plc | 1,420,000 | 10,602 |
| | Micro Focus International | | |
| | plc | 392,057 | 10,266 |
| | Elementis plc | 3,500,640 | 10,210 |
| | Abcam plc | 936,899 | 9,977 |
| | IG Group Holdings plc | 975,000 | 9,846 |
| | SuperGroup plc | 574,000 | 9,446 |
| | SSP Group plc | 2,209,000 | 9,180 |
| | Ricardo plc | 800,000 | 9,074 |
| | Dunelm Group plc | 972,500 | 9,007 |
| | AA plc | 2,845,363 | 8,899 |
| | Northgate plc | 1,700,208 | 8,731 |
| ^ | Telecom Plus plc | 600,000 | 8,688 |
| | Eco Animal Health Group | | |
| | plc | 1,448,166 | 8,676 |
| | Tyman plc | 2,910,245 | 8,663 |
| | Grafton Group plc | 1,425,000 | 8,655 |
| | B&M European Value | | |
| | Retail SA | 2,873,534 | 8,250 |
| | Hikma Pharmaceuticals | | |
| | plc | 380,581 | 8,163 |
| | Halma plc | 630,000 | 8,065 |
| | Keller Group plc | 877,904 | 7,308 |
| | Redrow plc | 1,563,146 | 7,261 |
| ^ | Kier Group plc | 420,311 | 6,990 |
| | Photo-Me International | | |
| | plc | 3,600,000 | 6,671 |
| | Bodycote plc | 913,000 | 6,617 |
| | Hunting plc | 1,023,975 | 6,293 |
| | Pets at Home Group plc | 2,356,073 | 6,157 |
| | Mears Group plc | 1,096,560 | 6,050 |
| | Investec plc | 931,000 | 5,778 |
| ^ | Victrex plc | 268,040 | 5,740 |
| | WS Atkins plc | 310,000 | 5,729 |
| | Saga plc | 2,289,340 | 5,553 |
| 2 | Auto Trader Group plc | 1,203,759 | 5,515 |
| | Polypipe Group plc | 1,744,012 | 5,377 |
| | Consort Medical plc | 382,925 | 5,354 |
| | Hays plc | 3,072,148 | 5,131 |
| | Inchcape plc | 600,000 | 4,770 |
| | Volution Group plc | 2,317,253 | 4,739 |
| | Genus plc | 205,292 | 4,715 |
| | Berendsen plc | 365,000 | 4,307 |
| | JRP Group plc | 2,909,347 | 4,303 |
| | James Fisher & Sons plc | 202,693 | 4,011 |
| | Soco International plc | 2,311,526 | 3,901 |
18
International Explorer Fund
| | | |
| | | | Market |
| | | | Value• |
| | | Shares | ($000) |
| | Ultra Electronics Holdings | | |
| | plc | 168,554 | 3,830 |
| | LondonMetric Property | | |
| | plc | 2,000,000 | 3,649 |
| | Electra Private Equity plc | 67,300 | 3,545 |
| | Cranswick plc | 134,329 | 3,482 |
| | UNITE Group plc | 513,676 | 3,480 |
| | Cineworld Group plc | 524,152 | 3,461 |
| | Brewin Dolphin Holdings | | |
| | plc | 984,495 | 3,132 |
| * | Findel plc | 1,104,252 | 2,863 |
| | A.G. Barr plc | 496,000 | 2,859 |
| | QinetiQ Group plc | 1,000,000 | 2,816 |
| | Senior plc | 1,263,500 | 2,693 |
| | SIG plc | 1,975,000 | 2,672 |
| | Hill & Smith Holdings plc | 215,326 | 2,649 |
| *,2 | ConvaTec Group plc | 824,284 | 2,522 |
| ^,* | LMS Capital plc | 1,906,855 | 1,314 |
| * | Ophir Energy plc | 1,408,565 | 1,189 |
| | Laird plc | 588,080 | 1,042 |
| | | | 400,257 |
| United States (0.2%) | | |
| | Samsonite International | | |
| | SA | 1,969,500 | 6,192 |
| Total Common Stocks | | |
| (Cost $2,451,654) | | 2,716,193 |
| Temporary Cash Investments (5.7%)1 | |
| Money Market Fund (5.1%) | | |
| 4,5 | Vanguard Market | | |
| | Liquidity Fund, | | |
| | 0.718% | 1,447,562 | 144,771 |
| |
| | | Face | |
| | | Amount | |
| | | ($000) | |
| Repurchase Agreement (0.3%) | |
| | Goldman Sachs & Co. | | |
| | 0.320%, 11/1/16 | | |
| | (Dated 10/31/16, | | |
| | Repurchase Value | | |
| | $8,900,000 collateralized | | |
| | by Federal National | | |
| | Mortgage Assn. | | |
| | 3.500%, 8/1/46, with | | |
| | a value of $9,078,000) | 8,900 | 8,900 |
| | | |
| U.S. Government and Agency Obligations (0.3%) |
| 6 | United States Treasury | | |
| | Bill, 0.327%, 1/19/17 | 3,000 | 2,998 |
| 7 | United States Treasury | | |
| | Bill, 0.320%, 1/26/17 | 3,000 | 2,998 |
| 7 | United States Treasury | | |
| | Bill, 0.381%, 3/9/17 | 1,000 | 998 |
| | | | 6,994 |
| Total Temporary Cash Investments | |
| (Cost $160,658) | | 160,665 |
| Total Investments (101.7%) | | |
| (Cost $2,612,312) | | 2,876,858 |
| Other Assets and Liabilities (-1.7%) | |
| Other Assets 6 | | 16,560 |
| Liabilities 4 | | (64,715) |
| | | | (48,155) |
| Net Assets (100%) | | |
| Applicable to 168,160,576 outstanding | |
| $.001 par value shares of beneficial | |
| interest (unlimited authorization) | | 2,828,703 |
| Net Asset Value Per Share | | $16.82 |
| |
| |
| Statement of Assets and Liabilities | |
| Assets | | |
| Investments in Securities, at Value | | |
| | Unaffiliated Issuers | | 2,708,035 |
| | Affiliated Vanguard Funds | | 168,823 |
| Total Investments in Securities | | 2,876,858 |
| Investment in Vanguard | | 224 |
| Receivables for Investment Securities | |
| | Sold | | 4,551 |
| Receivables for Accrued Income | | 7,916 |
| Receivables for Capital Shares Issued | 703 |
| Other Assets 6 | | 3,166 |
| Total Assets | | 2,893,418 |
| Liabilities | | |
| Payables for Investment Securities | | |
| | Purchased | | 2,498 |
| Collateral for Securities on Loan | | 49,669 |
| Payables to Investment Advisor | | 1,462 |
| Payables for Capital Shares Redeemed | 2,638 |
| Payables to Vanguard | | 4,482 |
| Other Liabilities | | 3,966 |
| Total Liabilities | | 64,715 |
| Net Assets | | 2,828,703 |
19
International Explorer Fund
| |
| At October 31, 2016, net assets consisted of: |
| | Amount |
| | ($000) |
| Paid-in Capital | 2,570,759 |
| Undistributed Net Investment Income | 16,139 |
| Accumulated Net Realized Losses | (22,767) |
| Unrealized Appreciation (Depreciation) | |
| Investment Securities | 264,546 |
| Futures Contracts | 1,174 |
| Forward Currency Contracts | (716) |
| Foreign Currencies | (432) |
| Net Assets | 2,828,703 |
• See Note A in Notes to Financial Statements.
^ Includes partial security positions on loan to broker-dealers. The total value of securities on loan is $47,125,000.
* Non-income-producing security.
1 The fund invests a portion of its cash reserves in equity markets through the use of index futures contracts. After giving effect to futures
investments, the fund’s effective common stock and temporary cash investment positions represent 97.6% and 4.1%, respectively,
of net assets.
2 Security exempt from registration under Rule 144A of the Securities Act of 1933. Such securities may be sold in transactions exempt from
registration, normally to qualified institutional buyers. At October 31, 2016, the aggregate value of these securities was $158,619,000,
representing 5.6% of net assets.
3 Considered an affiliated company of the fund as the issuer is another member of The Vanguard Group.
4 Includes $49,669,000 of collateral received for securities on loan.
5 Affiliated money market fund available only to Vanguard funds and certain trusts and accounts managed by Vanguard. Rate shown is
the 7-day yield.
6 Securities with a value of $1,098,000 and cash of $525,000 have been segregated as collateral for open forward currency contracts.
7 Securities with a value of $3,097,000 have been segregated as initial margin for open futures contracts.
ADR—American Depositary Receipt.
REIT—Real Estate Investment Trust.
See accompanying Notes, which are an integral part of the Financial Statements.
20
International Explorer Fund
| |
| Statement of Operations | |
| |
| | Year Ended |
| | October 31, 2016 |
| | ($000) |
| Investment Income | |
| Income | |
| Dividends1 | 62,096 |
| Interest | 571 |
| Securities Lending—Net | 2,123 |
| Total Income | 64,790 |
| Expenses | |
| Investment Advisory Fees—Note B | |
| Basic Fee | 6,288 |
| Performance Adjustment | (23) |
| The Vanguard Group—Note C | |
| Management and Administrative | 4,387 |
| Marketing and Distribution | 529 |
| Custodian Fees | 481 |
| Auditing Fees | 40 |
| Shareholders’ Reports | 45 |
| Trustees’ Fees and Expenses | 4 |
| Total Expenses | 11,751 |
| Net Investment Income | 53,039 |
| Realized Net Gain (Loss) | |
| Investment Securities Sold | (17,731) |
| Futures Contracts | (2,056) |
| Foreign Currencies and Forward Currency Contracts | 1,507 |
| Realized Net Gain (Loss) | (18,280) |
| Change in Unrealized Appreciation (Depreciation) | |
| Investment Securities | (31,650) |
| Futures Contracts | (1,998) |
| Foreign Currencies and Forward Currency Contracts | (433) |
| Change in Unrealized Appreciation (Depreciation) | (34,081) |
| Net Increase (Decrease) in Net Assets Resulting from Operations | 678 |
| 1 Dividends are net of foreign withholding taxes of $4,692,000. | |
See accompanying Notes, which are an integral part of the Financial Statements.
21
International Explorer Fund
| | |
| Statement of Changes in Net Assets | | |
| |
| | Year Ended October 31, |
| | 2016 | 2015 |
| | ($000) | ($000) |
| Increase (Decrease) in Net Assets | | |
| Operations | | |
| Net Investment Income | 53,039 | 41,153 |
| Realized Net Gain (Loss) | (18,280) | 121,585 |
| Change in Unrealized Appreciation (Depreciation) | (34,081) | (29,075) |
| Net Increase (Decrease) in Net Assets Resulting from Operations | 678 | 133,663 |
| Distributions | | |
| Net Investment Income | (43,678) | (45,599) |
| Realized Capital Gain1 | (109,775) | (153,304) |
| Total Distributions | (153,453) | (198,903) |
| Capital Share Transactions | | |
| Issued | 533,743 | 712,308 |
| Issued in Lieu of Cash Distributions | 139,822 | 183,328 |
| Redeemed | (578,815) | (541,440) |
| Net Increase (Decrease) from Capital Share Transactions | 94,750 | 354,196 |
| Total Increase (Decrease) | (58,025) | 288,956 |
| Net Assets | | |
| Beginning of Period | 2,886,728 | 2,597,772 |
| End of Period2 | 2,828,703 | 2,886,728 |
1 Includes fiscal 2016 and 2015 short-term gain distributions totaling $0 and $26,297,000 respectively. Short-term gain distributions are
treated as ordinary income dividends for tax purposes.
2 Net Assets—End of Period includes undistributed (overdistributed) net investment income of $16,139,000 and $4,878,000.
See accompanying Notes, which are an integral part of the Financial Statements.
22
International Explorer Fund
| | | | | |
| Financial Highlights | | | | | |
| |
| |
| For a Share Outstanding | | | Year Ended October 31, |
| Throughout Each Period | 2016 | 2015 | 2014 | 2013 | 2012 |
| Net Asset Value, Beginning of Period | $17.76 | $18.26 | $18.50 | $14.50 | $14.41 |
| Investment Operations | | | | | |
| Net Investment Income | .318 | .287 | .335 | .327 | .362 |
| Net Realized and Unrealized Gain (Loss) | | | | | |
| on Investments | (.334) | .635 | .133 | 4.078 | .287 |
| Total from Investment Operations | (.016) | .922 | .468 | 4.405 | .649 |
| Distributions | | | | | |
| Dividends from Net Investment Income | (. 263) | (. 326) | (. 420) | (. 405) | (. 346) |
| Distributions from Realized Capital Gains | (.661) | (1.096) | (.288) | — | (.213) |
| Total Distributions | (. 924) | (1.422) | (.708) | (. 405) | (. 559) |
| Net Asset Value, End of Period | $16.82 | $17.76 | $18.26 | $18.50 | $14.50 |
| |
| Total Return1 | -0.06% | 5.65% | 2.66% | 31.13% | 5.02% |
| |
| Ratios/Supplemental Data | | | | | |
| Net Assets, End of Period (Millions) | $2,829 | $2,887 | $2,598 | $2,281 | $1,819 |
| Ratio of Total Expenses to Average Net Assets2 | 0.41% | 0.42% | 0.40% | 0.36% | 0.43% |
| Ratio of Net Investment Income to | | | | | |
| Average Net Assets | 1.83% | 1.53% | 1.69% | 2.03% | 2.35% |
| Portfolio Turnover Rate | 37% | 42% | 39% | 36% | 28% |
1 Total returns do not include transaction or account service fees that may have applied in the periods shown. Fund prospectuses provide
information about any applicable transaction and account service fees.
2 Includes performance-based investment advisory fee increases (decreases) of 0.00%, 0.00%, 0.00%, (0.05%), and 0.02%.
See accompanying Notes, which are an integral part of the Financial Statements.
23
International Explorer Fund
Notes to Financial Statements
Vanguard International Explorer Fund is registered under the Investment Company Act of 1940 as an open-end investment company, or mutual fund. The fund invests in securities of foreign issuers, which may subject it to investment risks not normally associated with investing in securities of U.S. corporations.
A. The following significant accounting policies conform to generally accepted accounting principles for U.S. investment companies. The fund consistently follows such policies in preparing its financial statements.
1. Security Valuation: Securities are valued as of the close of trading on the New York Stock Exchange (generally 4 p.m., Eastern time) on the valuation date. Equity securities are valued at the latest quoted sales prices or official closing prices taken from the primary market in which each security trades; such securities not traded on the valuation date are valued at the mean of the latest quoted bid and asked prices. Securities for which market quotations are not readily available, or whose values have been affected by events occurring before the fund’s pricing time but after the close of the securities’ primary markets, are valued at their fair values calculated according to procedures adopted by the board of trustees. These procedures include obtaining quotations from an independent pricing service, monitoring news to identify significant market- or security-specific events, and evaluating changes in the values of foreign market proxies (for example, ADRs, futures contracts, or exchange-traded funds), between the time the foreign markets close and the fund’s pricing time. When fair-value pricing is employed, the prices of securities used by a fund to calculate its net asset value may differ from quoted or published prices for the same securities. Investments in Vanguard Market Liquidity Fund are valued at that fund’s net asset value. Temporary cash investments acquired over 60 days to maturity are valued using the latest bid prices or using valuations based on a matrix system (which considers such factors as security prices, yields, maturities, and ratings), both as furnished by independent pricing services. Other temporary cash investments are valued at amortized cost, which approximates market value.
2. Foreign Currency: Securities and other assets and liabilities denominated in foreign currencies are translated into U.S. dollars using exchange rates obtained from an independent third party as of the fund’s pricing time on the valuation date. Realized gains (losses) and unrealized appreciation (depreciation) on investment securities include the effects of changes in exchange rates since the securities were purchased, combined with the effects of changes in security prices. Fluctuations in the value of other assets and liabilities resulting from changes in exchange rates are recorded as unrealized foreign currency gains (losses) until the assets or liabilities are settled in cash, at which time they are recorded as realized foreign currency gains (losses).
3. Futures and Forward Currency Contracts: The fund uses index futures contracts to a limited extent, with the objective of maintaining full exposure to the stock market while maintaining liquidity. The fund may purchase or sell futures contracts to achieve a desired level of investment, whether to accommodate portfolio turnover or cash flows from capital share transactions. The primary risks associated with the use of futures contracts are imperfect correlation between changes in market values of stocks held by the fund and the prices of futures contracts, and the possibility of an illiquid market. Counterparty risk involving futures is mitigated because a regulated clearinghouse is the counterparty instead of the clearing broker. To further mitigate counterparty risk, the fund trades futures contracts on an exchange, monitors the financial strength of its clearing brokers and clearing-house, and has entered into clearing agreements with its clearing brokers. The clearinghouse imposes initial margin requirements to secure the fund’s performance and requires daily settlement of variation margin representing changes in the market value of each contract.
24
International Explorer Fund
The fund enters into forward currency contracts to provide the appropriate currency exposure related to any open futures contracts or to protect the value of securities and related receivables and payables against changes in foreign exchange rates. The fund’s risks in using these contracts include movement in the values of the foreign currencies relative to the U.S. dollar and the ability of the counterparties to fulfill their obligations under the contracts. The fund mitigates its counter-party risk by entering into forward currency contracts only with a diverse group of prequalified counterparties, monitoring their financial strength, entering into master netting arrangements with its counterparties, and requiring its counterparties to transfer collateral as security for their performance. In the absence of a default, the collateral pledged or received by the fund cannot be repledged, resold or rehypothecated. The master netting arrangements provide that, in the event of a counterparty’s default (including bankruptcy), the fund may terminate the forward currency contracts, determine the net amount owed by either party in accordance with its master netting arrangements, and sell or retain any collateral held up to the net amount owed to the fund under the master netting arrangements. The forward currency contracts contain provisions whereby a counterparty may terminate open contracts if the fund’s net assets decline below a certain level, triggering a payment by the fund if the fund is in a net liability position at the time of the termination. The payment amount would be reduced by any collateral the fund has pledged. Any assets pledged as collateral for open contracts are noted in the Statement of Net Assets. The value of collateral received or pledged is compared daily to the value of the forward currency contracts exposure with each counterparty, and any difference, if in excess of a specified minimum transfer amount, is adjusted and settled within two business days.
Futures contracts are valued at their quoted daily settlement prices. Forward currency contracts are valued at their quoted daily prices obtained from an independent third party, adjusted for currency risk based on the expiration date of each contract. The aggregate settlement values and notional amounts of the contracts are not recorded in the Statement of Assets and Liabilities. Fluctuations in the value of the contracts are recorded in the Statement of Assets and Liabilities as an asset (liability) and in the Statement of Operations as unrealized appreciation (depreciation) until the contracts are closed, when they are recorded as realized gains (losses) on futures or forward currency contracts.
During the year ended October 31, 2016, the fund’s average investments in long and short futures contracts represented 2% and 0% of net assets, respectively, based on the average of aggregate settlement values at each quarter-end during the period. The fund’s average investment in forward currency contracts represented 5% of net assets, based on the average of notional amounts at each quarter-end during the period.
4. Repurchase Agreements: The fund enters into repurchase agreements with institutional counterparties. Securities pledged as collateral to the fund under repurchase agreements are held by a custodian bank until the agreements mature, and in the absence of a default, such collateral cannot be repledged, resold or rehypothecated. Each agreement requires that the market value of the collateral be sufficient to cover payments of interest and principal. The fund further mitigates its counterparty risk by entering into repurchase agreements only with a diverse group of prequalified counterparties, monitoring their financial strength, and entering into master repurchase agreements with its counterparties. The master repurchase agreements provide that, in the event of a counterparty’s default (including bankruptcy), the fund may terminate any repurchase agreements with that counterparty, determine the net amount owed, and sell or retain the collateral up to the net amount owed to the fund. Such action may be subject to legal proceedings, which may delay or limit the disposition of collateral.
25
International Explorer Fund
5. Federal Income Taxes: The fund intends to continue to qualify as a regulated investment company and distribute all of its taxable income. Management has analyzed the fund’s tax positions taken for all open federal income tax years (October 31, 2013–2016), and has concluded that no provision for federal income tax is required in the fund’s financial statements.
6. Distributions: Distributions to shareholders are recorded on the ex-dividend date.
7. Securities Lending: To earn additional income, the fund lends its securities to qualified institutional borrowers. Security loans are subject to termination by the fund at any time, and are required to be secured at all times by collateral in an amount at least equal to the market value of securities loaned. Daily market fluctuations could cause the value of loaned securities to be more or less than the value of the collateral received. When this occurs, the collateral is adjusted and settled on the next business day. The fund further mitigates its counterparty risk by entering into securities lending transactions only with a diverse group of prequalified counterparties, monitoring their financial strength, and entering into master securities lending agreements with its counterparties. The master securities lending agreements provide that, in the event of a counterparty’s default (including bankruptcy), the fund may terminate any loans with that borrower, determine the net amount owed, and sell or retain the collateral up to the net amount owed to the fund; however, such actions may be subject to legal proceedings. While collateral mitigates counterparty risk, in the absence of a default the fund may experience delays and costs in recovering the securities loaned. The fund invests cash collateral received in Vanguard Market Liquidity Fund, and records a liability in the Statement of Assets and Liabilities for the return of the collateral, during the period the securities are on loan. Securities lending income represents fees charged to borrowers plus income earned on invested cash collateral, less expenses associated with the loan. During the term of the loan, the fund is entitled to all distributions made on or in respect of the loaned securities.
8. Credit Facility: The fund and certain other funds managed by The Vanguard Group (“Vanguard”) participate in a $3.1 billion committed credit facility provided by a syndicate of lenders pursuant to a credit agreement that may be renewed annually; each fund is individually liable for its borrowings, if any, under the credit facility. Borrowings may be utilized for temporary and emergency purposes, and are subject to the fund’s regulatory and contractual borrowing restrictions. The participating funds are charged administrative fees and an annual commitment fee of 0.10% of the undrawn amount of the facility; these fees are allocated to the funds based on a method approved by the fund’s board of trustees and included in Management and Administrative expenses on the fund’s Statement of Operations. Any borrowings under this facility bear interest at a rate based upon the higher of the one-month London Interbank Offered Rate, federal funds effective rate, or overnight bank funding rate plus an agreed-upon spread.
The fund had no borrowings outstanding at October 31, 2016, or at any time during the period then ended.
9. Other: Dividend income is recorded on the ex-dividend date. Interest income includes income distributions received from Vanguard Market Liquidity Fund and is accrued daily. Premiums and discounts on debt securities purchased are amortized and accreted, respectively, to interest income over the lives of the respective securities. Security transactions are accounted for on the date securities are bought or sold. Costs used to determine realized gains (losses) on the sale of investment securities are those of the specific securities sold.
26
International Explorer Fund
Withholding taxes on foreign dividends and capital gains have been provided for in accordance with the fund’s understanding of the applicable countries’ tax rules and rates. The fund has filed tax reclaims for previously withheld taxes on dividends earned in certain European Union countries. These filings are subject to various administrative and judicial proceedings within these countries. Such tax reclaims received during the year, if any, are included in dividend income. No other amounts for additional tax reclaims are reflected in the financial statements due to the uncertainty as to the ultimate resolution of proceedings, the likelihood of receipt of these reclaims, and the potential timing of payment.
B. The investment advisory firms Schroder Investment Management North America Inc. and Wellington Management Company LLP each provide investment advisory services to a portion of the fund for a fee calculated at an annual percentage rate of average net assets managed by the advisor. The basic fee of Schroder Investment Management North America Inc. and Wellington Management Company LLP is subject to quarterly adjustments based on performance relative to the S&P EPAC SmallCap Index for the preceding three years.
Vanguard manages the cash reserves of the fund as described below.
For the year ended October 31, 2016, the aggregate investment advisory fee represented an effective annual basic rate of 0.22% of the fund’s average net assets, before a decrease of $23,000 (0.00%) based on performance.
C. In accordance with the terms of a Funds’ Service Agreement (the “FSA”) between Vanguard and the fund, Vanguard furnishes to the fund corporate management, administrative, marketing, distribution, and cash management services at Vanguard’s cost of operations (as defined by the FSA). These costs of operations are allocated to the fund based on methods and guidelines approved by the board of trustees. Vanguard does not require reimbursement in the current period for certain costs of operations (such as deferred compensation/benefits and risk/insurance costs); the fund’s liability for these costs of operations is included in Payables to Vanguard on the Statement of Assets and Liabilities.
Upon the request of Vanguard, the fund may invest up to 0.40% of its net assets as capital in Vanguard. At October 31, 2016, the fund had contributed to Vanguard capital in the amount of $224,000, representing 0.01% of the fund’s net assets and 0.09% of Vanguard’s capitalization. The fund’s trustees and officers are also directors and employees, respectively, of Vanguard.
D. Various inputs may be used to determine the value of the fund’s investments. These inputs are summarized in three broad levels for financial statement purposes. The inputs or methodologies used to value securities are not necessarily an indication of the risk associated with investing in those securities.
Level 1—Quoted prices in active markets for identical securities.
Level 2—Other significant observable inputs (including quoted prices for similar securities, interest rates, prepayment speeds, credit risk, etc.).
Level 3—Significant unobservable inputs (including the fund’s own assumptions used to determine the fair value of investments).
27
International Explorer Fund
The following table summarizes the market value of the fund’s investments as of October 31, 2016, based on the inputs used to value them:
| | | |
| | Level 1 | Level 2 | Level 3 |
| Investments | ($000) | ($000) | ($000) |
| Common Stocks | 53,354 | 2,662,839 | — |
| Temporary Cash Investments | 144,771 | 15,894 | — |
| Futures Contracts—Assets1 | 58 | — | — |
| Futures Contracts—Liabilities1 | (154) | — | — |
| Forward Currency Contracts—Assets | — | 923 | — |
| Forward Currency Contracts—Liabilities | — | (1,639) | — |
| Total | 198,029 | 2,678,017 | — |
| 1 Represents variation margin on the last day of the reporting period. | | | |
E. At October 31, 2016, the fair values of derivatives were reflected in the Statement of Assets and Liabilities as follows:
| | | |
| | | Foreign | |
| | Equity | Exchange | |
| | Contracts | Contracts | Total |
| Statement of Assets and Liabilities Caption | ($000) | ($000) | ($000) |
| Other Assets | 58 | 923 | 981 |
| Other Liabilities | (154) | (1,639) | (1,793) |
Realized net gain (loss) and the change in unrealized appreciation (depreciation) on derivatives for the year ended October 31, 2016, were:
| | | |
| | | Foreign | |
| | Equity | Exchange | |
| | Contracts | Contracts | Total |
| Realized Net Gain (Loss) on Derivatives | ($000) | ($000) | ($000) |
| Futures Contracts | (2,056) | — | (2,056) |
| Forward Currency Contracts | — | 861 | 861 |
| Realized Net Gain (Loss) on Derivatives | (2,056) | 861 | (1,195) |
| |
| Change in Unrealized Appreciation (Depreciation) on Derivatives | | | |
| Futures Contracts | (1,998) | — | (1,998) |
| Forward Currency Contracts | — | (288) | (288) |
| Change in Unrealized Appreciation (Depreciation) on Derivatives | (1,998) | (288) | (2,286) |
28
International Explorer Fund
At October 31, 2016, the aggregate settlement value of open futures contracts and the related unrealized appreciation (depreciation) were:
| | | | |
| | | | | ($000) |
| | | | Aggregate | |
| | | Number of | Settlement | Unrealized |
| | | Long (Short) | Value | Appreciation |
| Futures Contracts | Expiration | Contracts | Long (Short) | (Depreciation) |
| Dow Jones EURO STOXX 50 Index | December 2016 | 628 | 21,017 | 306 |
| Topix Index | December 2016 | 100 | 13,275 | 775 |
| S&P ASX 200 Index | December 2016 | 56 | 5,635 | (50) |
| FTSE 100 Index | December 2016 | 63 | 5,330 | 143 |
| | | | | 1,174 |
Unrealized appreciation (depreciation) on open Dow Jones EURO STOXX 50 and FTSE 100 Index futures contracts is required to be treated as realized gain (loss) for tax purposes.
At October 31, 2016, the fund had open forward currency contracts to receive and deliver currencies as follows. Unrealized appreciation (depreciation) on open forward currency contracts is treated as realized gain (loss) for tax purposes.
| | | | | | |
| | | | | | | Unrealized |
| | Contract | | | | | Appreciation |
| | Settlement | | | Contract Amount (000) | (Depreciation) |
| Counterparty | Date | | Receive | | Deliver | ($000) |
| Toronto-Dominion Securities | 12/21/16 | EUR | 19,023 | USD | 21,470 | (537) |
| BNP Paribas | 12/13/16 | JPY | 1,551,213 | USD | 15,214 | (396) |
| Citibank, N.A. | 12/21/16 | EUR | 13,628 | USD | 14,996 | — |
| Citibank, N.A. | 12/13/16 | JPY | 1,001,960 | USD | 9,668 | (97) |
| Bank of America N.A. | 12/21/16 | GBP | 4,149 | USD | 5,552 | (468) |
| Goldman Sachs International | 12/20/16 | AUD | 6,481 | USD | 4,819 | 105 |
| JPMorgan Chase Bank N.A. | 12/20/16 | AUD | 5,121 | USD | 3,923 | (32) |
| Citibank, N.A. | 12/21/16 | GBP | 3,139 | USD | 3,865 | (18) |
| BNP Paribas | 12/21/16 | EUR | 616 | USD | 695 | (17) |
| JPMorgan Chase Bank N.A | 12/21/16 | GBP | 366 | USD | 489 | (40) |
| Barclays Bank plc | 12/21/16 | USD | 6,905 | EUR | 6,153 | 136 |
| Citibank, N.A. | 12/13/16 | USD | 5,781 | JPY | 587,565 | 169 |
| JPMorgan Chase Bank N.A | 12/21/16 | USD | 5,337 | EUR | 4,758 | 102 |
| Goldman Sachs International | 12/21/16 | USD | 2,189 | GBP | 1,680 | 131 |
| BNP Paribas | 12/13/16 | USD | 1,865 | JPY | 186,830 | 80 |
| BNP Paribas | 12/21/16 | USD | 1,483 | EUR | 1,352 | (5) |
| JPMorgan Chase Bank N.A | 12/21/16 | USD | 1,416 | GBP | 1,084 | 88 |
| BNP Paribas | 12/21/16 | USD | 1,279 | EUR | 1,138 | 27 |
| Bank of America N.A. | 12/13/16 | USD | 1,194 | JPY | 125,325 | (3) |
| Barclays Bank plc | 12/13/16 | USD | 1,192 | JPY | 119,205 | 53 |
29
International Explorer Fund
| | | | | | |
| | | | | | | Unrealized |
| | Contract | | | | | Appreciation |
| | Settlement | | | Contract Amount (000) | (Depreciation) |
| Counterparty | Date | | Receive | | Deliver | ($000) |
| Barclays Bank plc | 12/20/16 | USD | 1,089 | AUD | 1,449 | (12) |
| Citibank, N.A. | 12/21/16 | USD | 1,033 | EUR | 932 | 7 |
| JPMorgan Chase Bank N.A | 12/13/16 | USD | 909 | JPY | 93,930 | 12 |
| JPMorgan Chase Bank N.A | 12/20/16 | USD | 793 | AUD | 1,058 | (11) |
| Bank of America N.A. | 12/13/16 | USD | 786 | JPY | 81,210 | 10 |
| JPMorgan Chase Bank N.A. | 12/20/16 | USD | 623 | AUD | 819 | — |
| Citibank, N.A. | 12/20/16 | USD | 414 | AUD | 541 | 3 |
| JPMorgan Chase Bank N.A. | 12/21/16 | USD | 344 | GBP | 281 | — |
| Bank of America N.A. | 12/20/16 | USD | 253 | GBP | 208 | (2) |
| UBS AG | 12/21/16 | USD | 206 | AUD | 273 | (1) |
| Barclays Bank plc | 12/21/16 | USD | 172 | GBP | 140 | — |
| Bank of America N.A | 12/20/16 | USD | 100 | AUD | 131 | — |
| | | | | | | (716) |
| AUD—Australian dollar. | | | | | | |
| EUR—Euro. | | | | | | |
| GBP—British pound. | | | | | | |
| JPY—Japanese yen. | | | | | | |
| USD—U.S. dollar. | | | | | | |
F. Distributions are determined on a tax basis and may differ from net investment income and realized capital gains for financial reporting purposes. Differences may be permanent or temporary. Permanent differences are reclassified among capital accounts in the financial statements to reflect their tax character. Temporary differences arise when certain items of income, expense, gain, or loss are recognized in different periods for financial statement and tax purposes. These differences will reverse at some time in the future. Differences in classification may also result from the treatment of short-term gains as ordinary income for tax purposes.
During the year ended October 31, 2016, the fund realized net foreign currency gains of $647,000, which increased distributable net income for tax purposes; accordingly, such gains have been reclassified from accumulated net realized losses to undistributed net investment income. Certain of the fund’s investments are in securities considered to be passive foreign investment companies, for which any unrealized appreciation and/or realized gains are required to be included in distributable net income for tax purposes. During the year ended October 31, 2016, the fund realized gains on the sale of passive foreign investment companies of $1,287,000, which have been included in current and prior periods’ taxable income; accordingly, such gains have been reclassified from accumulated net realized losses to undistributed net investment income. Passive foreign investment companies held at October 31, 2016, had unrealized appreciation of $28,891,000, all of which has been distributed and is reflected in the balance of undistributed net investment income.
The fund realized gains on the sale of securities that were subject to capital gains tax in certain foreign countries. Capital gains taxes reduce realized gains for financial statement purposes but are treated as an expense for tax purposes. Accordingly, $34,000 of capital gains tax has been reclassified from accumulated net realized losses to undistributed net investment income.
30
International Explorer Fund
For tax purposes, at October 31, 2016, the fund had $49,262,000 of ordinary income available for distribution. The fund had available capital losses totaling $21,093,000 that may be carried forward indefinitely to offset future net capital gains.
At October 31, 2016, the cost of investment securities for tax purposes was $2,643,118,000. Net unrealized appreciation of investment securities for tax purposes was $233,740,000, consisting of unrealized gains of $479,023,000 on securities that had risen in value since their purchase and $245,283,000 in unrealized losses on securities that had fallen in value since their purchase.
G. During the year ended October 31, 2016, the fund purchased $1,056,398,000 of investment securities and sold $1,040,777,000 of investment securities, other than temporary cash investments.
H. Capital shares issued and redeemed were:
| | |
| | Year Ended October 31, |
| | 2016 | 2015 |
| | Shares | Shares |
| | (000) | (000) |
| Issued | 32,185 | 39,930 |
| Issued in Lieu of Cash Distributions | 8,363 | 11,118 |
| Redeemed | (34,938) | (30,786) |
| Net Increase (Decrease) in Shares Outstanding | 5,610 | 20,262 |
I. Certain of the fund’s investments are in companies that are considered to be affiliated companies of the fund because the fund owns more than 5% of the outstanding voting securities of the company or the issuer is another member of The Vanguard Group. Transactions during the period in securities of these companies were as follows:
| | | | | | |
| | | | Current Period Transactions | |
| | Oct. 31, | | Proceeds | | | Oct. 31, |
| | 2015 | | from | | Capital Gain | 2016 |
| | Market | Purchases | Securities | | Distributions | Market |
| | Value | at Cost | Sold | Income | Received | Value |
| | ($000) | ($000) | ($000)1 | ($000) | ($000) | ($000) |
| Bufab AB | 12,344 | 469 | 5,448 | 412 | — | NA2 |
| Vanguard FTSE All World ex-US | | | | | | |
| Small-Cap ETF | 23,646 | — | — | 632 | — | 24,052 |
| Vanguard Market Liquidity Fund | 208,878 | NA3 | NA 3 | 477 | — | 144,771 |
| Total | 244,868 | | | 1,521 | — | 168,823 |
| 1 Includes net realized gain (loss) on affiliated investment securities sold of $298,000. |
| 2 Not applicable—at October 31, 2016, the security was still held, but the issuer was no longer an affiliated company of the fund. |
| 3 Not applicable—purchases and sales are for temporary cash investment purposes. |
J. Management has determined that no material events or transactions occurred subsequent to October 31, 2016, that would require recognition or disclosure in these financial statements.
31
Report of Independent Registered Public Accounting Firm
To the Board of Trustees of Vanguard Whitehall Funds and the Shareholders of Vanguard International Explorer Fund:
In our opinion, the accompanying statement of net assets, statement of assets and liabilities and the related statements of operations and of changes in net assets and the financial highlights present fairly, in all material respects, the financial position of Vanguard International Explorer Fund (constituting a separate portfolio of Vanguard Whitehall Funds, hereafter referred to as the “Fund”) at October 31, 2016, the results of its operations for the year then ended, the changes in its net assets for each of the two years in the period then ended, and the financial highlights for each of the five years in the period then ended, in conformity with accounting principles generally accepted in the United States of America. These financial statements and financial highlights (hereafter referred to as “financial statements”) are the responsibility of the Fund’s management. Our responsibility is to express an opinion on these financial statements based on our audits. We conducted our audits of these financial statements in accordance with the standards of the Public Company Accounting Oversight Board (United States). Those standards require that we plan and perform the audit to obtain reasonable assurance about whether the financial statements are free of material misstatement. An audit includes examining, on a test basis, evidence supporting the amounts and disclosures in the financial statements, assessing the accounting principles used and significant estimates made by management, and evaluating the overall financial statement presentation. We believe that our audits, which included confirmation of securities at October 31, 2016 by correspondence with the custodian and brokers and by agreement to the underlying ownership records of the transfer agent, provide a reasonable basis for our opinion.
/s/PricewaterhouseCoopers LLP
Philadelphia, Pennsylvania
December 15, 2016
Special 2016 tax information (unaudited) for Vanguard International Explorer Fund
This information for the fiscal year ended October 31, 2016, is included pursuant to provisions of the Internal Revenue Code.
The fund distributed $109,775,000 as capital gain dividends (20% rate gain distributions) to shareholders during the fiscal year.
The fund distributed $37,392,000 of qualified dividend income to shareholders during the fiscal year.
The fund designates to shareholders foreign source income of $62,810,000 and foreign taxes paid of $4,609,000. Shareholders will receive more detailed information with their Form 1099-DIV in January 2017 to determine the calendar-year amounts to be included on their 2016 tax returns.
32
Your Fund’s After-Tax Returns
This table presents returns for your fund both before and after taxes. The after-tax returns are shown in two ways: (1) assuming that an investor owned the fund during the entire period and paid taxes on the fund’s distributions, and (2) assuming that an investor paid taxes on the fund’s distributions and sold all shares at the end of each period.
Calculations are based on the highest individual federal income tax and capital gains tax rates in effect at the times of the distributions and the hypothetical sales. State and local taxes were not considered. After-tax returns reflect any qualified dividend income, using actual prior-year figures and estimates for 2016. (In the example, returns after the sale of fund shares may be higher than those assuming no sale. This occurs when the sale would have produced a capital loss. The calculation assumes that the investor received a tax deduction for the loss.)
Please note that your actual after-tax returns will depend on your tax situation and may differ from those shown. Also note that if you own the fund in a tax-deferred account, such as an individual retirement account or a 401(k) plan, this information does not apply to you. Such accounts are not subject to current taxes.
Finally, keep in mind that a fund’s performance—whether before or after taxes—does not guarantee future results.
| | | |
| Average Annual Total Returns: International Explorer Fund | | | |
| Periods Ended October 31, 2016 | | | |
| | One | Five | Ten |
| | Year | Years | Years |
| Returns Before Taxes | -0.06% | 8.34% | 3.56% |
| Returns After Taxes on Distributions | -1.28 | 7.14 | 2.45 |
| Returns After Taxes on Distributions and Sale of Fund Shares | 1.01 | 6.47 | 2.85 |
33
About Your Fund’s Expenses
As a shareholder of the fund, you incur ongoing costs, which include costs for portfolio management, administrative services, and shareholder reports (like this one), among others. Operating expenses, which are deducted from a fund’s gross income, directly reduce the investment return of the fund.
A fund’s expenses are expressed as a percentage of its average net assets. This figure is known as the expense ratio. The following examples are intended to help you understand the ongoing costs (in dollars) of investing in your fund and to compare these costs with those of other mutual funds. The examples are based on an investment of $1,000 made at the beginning of the period shown and held for the entire period.
The accompanying table illustrates your fund’s costs in two ways:
• Based on actual fund return. This section helps you to estimate the actual expenses that you paid over the period. The ”Ending Account Value“ shown is derived from the fund‘s actual return, and the third column shows the dollar amount that would have been paid by an investor who started with $1,000 in the fund. You may use the information here, together with the amount you invested, to estimate the expenses that you paid over the period.
To do so, simply divide your account value by $1,000 (for example, an $8,600 account value divided by $1,000 = 8.6), then multiply the result by the number given for your fund under the heading ”Expenses Paid During Period.“
• Based on hypothetical 5% yearly return. This section is intended to help you compare your fund‘s costs with those of other mutual funds. It assumes that the fund had a yearly return of 5% before expenses, but that the expense ratio is unchanged. In this case—because the return used is not the fund’s actual return—the results do not apply to your investment. The example is useful in making comparisons because the Securities and Exchange Commission requires all mutual funds to calculate expenses based on a 5% return. You can assess your fund’s costs by comparing this hypothetical example with the hypothetical examples that appear in shareholder reports of other funds.
Note that the expenses shown in the table are meant to highlight and help you compare ongoing costs only and do not reflect transaction costs incurred by the fund for buying and selling securities. Further, the expenses do not include any purchase, redemption, or account service fees described in the fund prospectus. If such fees were applied to your account, your costs would be higher. Your fund does not carry a “sales load.”
The calculations assume no shares were bought or sold during the period. Your actual costs may have been higher or lower, depending on the amount of your investment and the timing of any purchases or redemptions.
You can find more information about the fund’s expenses, including annual expense ratios, in the Financial Statements section of this report. For additional information on operating expenses and other shareholder costs, please refer to your fund’s current prospectus.
34
| | | |
| Six Months Ended October 31, 2016 | | | |
| | Beginning | Ending | Expenses |
| | Account Value | Account Value | Paid During |
| International Explorer Fund | 4/30/2016 | 10/31/2016 | Period |
| Based on Actual Fund Return | $1,000.00 | $1,005.98 | $1.97 |
| Based on Hypothetical 5% Yearly Return | 1,000.00 | 1,023.18 | 1.98 |
The calculations are based on expenses incurred in the most recent six-month period. The fund’s annualized six-month expense ratio for that period is 0.39%. The dollar amounts shown as “Expenses Paid” are equal to the annualized expense ratio multiplied by the average account value over the period, multiplied by the number of days in the most recent six-month period, then divided by the number of days in the most recent 12-month period (184/366).
35
Trustees Approve Advisory Arrangements
The board of trustees of Vanguard International Explorer Fund has renewed the fund’s investment advisory arrangements with Schroder Investment Management North America Inc. (Schroder Inc.) and Wellington Management Company LLP (Wellington Management), as well as a sub-advisory arrangement with Schroder Investment Management North America Limited (Schroder Ltd.). The board determined that renewing the fund’s advisory arrangements was in the best interests of the fund and its shareholders.
The board based its decision upon an evaluation of each advisor’s investment staff, portfolio management process, and performance. This evaluation included information provided to the board by Vanguard’s Portfolio Review Department, which is responsible for fund and advisor oversight and product management. The Portfolio Review Department met regularly with the advisors and made monthly presentations to the board during the fiscal year directing the board’s focus to relevant information and topics.
The board, or an investment committee made up of board members, also received information through the year during advisor presentations. For each advisor presentation, the board was provided with letters and reports that included information about, among other things, the advisory firm and the advisor’s assessment of the investment environment, portfolio performance, and portfolio characteristics.
In addition, the board received monthly reports, which included a Market and Economic Report, a Fund Dashboard Monthly Summary, and a Fund Performance Report.
Prior to their meeting, the trustees were provided with a memo and materials that summarized the information they received over the course of the year. They also considered the factors discussed below, among others. However, no single factor determined whether the board approved the arrangements. Rather, it was the totality of the circumstances that drove the board’s decision.
Nature, extent, and quality of services
The board reviewed the quality of the fund’s investment management services over both the short and long term, and took into account the organizational depth and stability of each advisor. The board considered the following:
Schroder. Schroders plc, the parent company of Schroder Inc. and Schroder Ltd. (collectively, Schroder), founded in 1804, specializes in global equity and fixed income management. Schroder employs a bottom-up, fundamental research-driven process to select stocks. Schroder’s International Small-Cap Committee is responsible for the management of its portion of the fund, and leverages Schroder’s extensive network of local analysts across the globe, as it believes that country factors are more important for smaller companies relative to larger companies. Schroder focuses on identifying companies with sustainable competitive advantages, attractive earnings growth, and compelling valuations. Schroder Inc. has advised the fund since its inception in 1996, and its affiliate Schroder Ltd. has advised a portion of the fund since 2003.
Wellington Management. Wellington Management, founded in 1928, is among the nation’s oldest and most respected institutional investment managers. Wellington Management’s international small-cap team uses a traditional, bottom-up investment process that attempts to discover a company’s intrinsic value. In valuing a company, it believes that the same valuation metric should be applied on an industry-by-industry basis. Although the team’s valuation discipline is essential to the process, its philosophy is not biased toward growth or value as it invests in both extended growth opportunities and neglected or misunderstood companies. The firm has advised a portion of the fund since 2010.
36
The board concluded that each advisor’s experience, stability, depth, and performance, among other factors, warranted continuation of the advisory arrangements.
Investment performance
The board considered the short- and long-term performance of the fund, including any periods of outperformance or underperformance compared with a relevant benchmark index and peer group. The board concluded that the performance was such that the advisory arrangements should continue. Information about the fund’s most recent performance can be found in the Performance Summary section of this report.
Cost
The board concluded that the fund’s expense ratio was well below the average expense ratio charged by funds in its peer group and that the fund’s advisory fee rate was also well below its peer-group average. Information about the fund’s expense ratio appears in the About Your Fund’s Expenses section of this report as well as in the Financial Statements section, which also includes information about the fund’s advisory fee rate.
The board did not consider profitability of the fund’s advisors in determining whether to approve the advisory fees, because the firms are independent of Vanguard, and the advisory fees are the result of arm’s-length negotiations.
The benefit of economies of scale
The board concluded that the fund’s shareholders benefit from economies of scale because of breakpoints in the advisory fee schedules. The breakpoints reduce the effective rate of the fees as the fund’s assets managed by each firm increase.
The board will consider whether to renew the advisory arrangements again after a one-year period.
37
Glossary
Beta. A measure of the magnitude of a fund’s past share-price fluctuations in relation to the ups and downs of a given market index. The index is assigned a beta of 1.00. Compared with a given index, a fund with a beta of 1.20 typically would have seen its share price rise or fall by 12% when the index rose or fell by 10%. For this report, beta is based on returns over the past 36 months for both the fund and the index. Note that a fund’s beta should be reviewed in conjunction with its R-squared (see definition). The lower the R-squared, the less correlation there is between the fund and the index, and the less reliable beta is as an indicator of volatility.
Dividend Yield. Dividend income earned by stocks, expressed as a percentage of the aggregate market value (or of net asset value, for a fund). The yield is determined by dividing the amount of the annual dividends by the aggregate value (or net asset value) at the end of the period. For a fund, the dividend yield is based solely on stock holdings and does not include any income produced by other investments.
Earnings Growth Rate. The average annual rate of growth in earnings over the past five years for the stocks now in a fund.
Equity Exposure. A measure that reflects a fund’s investments in stocks and stock futures. Any holdings in short-term reserves are excluded.
Expense Ratio. A fund’s total annual operating expenses expressed as a percentage of the fund’s average net assets. The expense ratio includes management and administrative expenses, but does not include the transaction costs of buying and selling portfolio securities.
Inception Date. The date on which the assets of a fund (or one of its share classes) are first invested in accordance with the fund’s investment objective. For funds with a subscription period, the inception date is the day after that period ends. Investment performance is measured from the inception date.
Median Market Cap. An indicator of the size of companies in which a fund invests; the midpoint of market capitalization (market price x shares outstanding) of a fund’s stocks, weighted by the proportion of the fund’s assets invested in each stock. Stocks representing half of the fund’s assets have market capitalizations above the median, and the rest are below it.
Price/Book Ratio. The share price of a stock divided by its net worth, or book value, per share. For a fund, the weighted average price/book ratio of the stocks it holds.
Price/Earnings Ratio. The ratio of a stock’s current price to its per-share earnings over the past year. For a fund, the weighted average P/E of the stocks it holds. P/E is an indicator of market expectations about corporate prospects; the higher the P/E, the greater the expectations for a company’s future growth.
R-Squared. A measure of how much of a fund’s past returns can be explained by the returns from the market in general, as measured by a given index. If a fund’s total returns were precisely synchronized with an index’s returns, its R-squared would be 1.00. If the fund’s returns bore no relationship to the index’s returns, its R-squared would be 0. For this report, R-squared is based on returns over the past 36 months for both the fund and the index.
38
Return on Equity. The annual average rate of return generated by a company during the past five years for each dollar of shareholder’s equity (net income divided by shareholder’s equity). For a fund, the weighted average return on equity for the companies whose stocks it holds.
Short-Term Reserves. The percentage of a fund invested in highly liquid, short-term securities that can be readily converted to cash.
Turnover Rate. An indication of the fund’s trading activity. Funds with high turnover rates incur higher transaction costs and may be more likely to distribute capital gains (which may be taxable to investors). The turnover rate excludes in-kind transactions, which have minimal impact on costs.
39
The People Who Govern Your Fund
The trustees of your mutual fund are there to see that the fund is operated and managed in your best interests since, as a shareholder, you are a part owner of the fund. Your fund’s trustees also serve on the board of directors of The Vanguard Group, Inc., which is owned by the Vanguard funds and provides services to them on an at-cost basis.
A majority of Vanguard’s board members are independent, meaning that they have no affiliation with Vanguard or the funds they oversee, apart from the sizable personal investments they have made as private individuals. The independent board members have distinguished backgrounds in business, academia, and public service. Each of the trustees and executive officers oversees 198 Vanguard funds.
The following table provides information for each trustee and executive officer of the fund. The mailing address of the trustees and officers is P.O. Box 876, Valley Forge, PA 19482. More information about the trustees is in the Statement of Additional Information, which can be obtained, without charge, by contacting Vanguard at 800-662-7447, or online at vanguard.com.
InterestedTrustee1
F. William McNabb III
Born 1957. Trustee Since July 2009. Chairman of the Board. Principal Occupation(s) During the Past Five Years and Other Experience: Chairman of the Board of The Vanguard Group, Inc., and of each of the investment companies served by The Vanguard Group, since January 2010; Director of The Vanguard Group since 2008; Chief Executive Officer and President of The Vanguard Group, and of each of the investment companies served by The Vanguard Group, since 2008; Director of Vanguard Marketing Corporation; Managing Director of The Vanguard Group (1995–2008).
IndependentTrustees
Emerson U. Fullwood
Born 1948. Trustee Since January 2008. Principal Occupation(s) During the Past Five Years and Other Experience: Executive Chief Staff and Marketing Officer for North America and Corporate Vice President (retired 2008) of Xerox Corporation (document management products and services); Executive in Residence and 2009–2010 Distinguished Minett Professor at the Rochester Institute of Technology; Lead Director of SPX FLOW, Inc. (multi-industry manufacturing); Director of the United Way of Rochester, the University of Rochester Medical Center, Monroe Community College Foundation, North Carolina A&T University, and Roberts Wesleyan College.
Rajiv L. Gupta
Born 1945. Trustee Since December 2001.2 Principal Occupation(s) During the Past Five Years and Other Experience: Chairman and Chief Executive Officer (retired 2009) and President (2006–2008) of Rohm and Haas Co. (chemicals); Director of Tyco International plc (diversified manufacturing and services), HP Inc. (printer and personal computer manufacturing), and Delphi Automotive plc (automotive components); Senior Advisor at New Mountain Capital.
Amy Gutmann
Born 1949. Trustee Since June 2006. Principal Occupation(s) During the Past Five Years and Other Experience: President of the University of Pennsylvania; Christopher H. Browne Distinguished Professor of Political Science, School of Arts and Sciences, and Professor of Communication, Annenberg School for Communication, with secondary faculty appointments in the Department of Philosophy, School of Arts and Sciences, and at the Graduate School of Education, University of Pennsylvania; Trustee of the National Constitution Center; Chair of the Presidential Commission for the Study of Bioethical Issues.
JoAnn Heffernan Heisen
Born 1950. Trustee Since July 1998. Principal Occupation(s) During the Past Five Years and Other Experience: Corporate Vice President and Chief Global Diversity Officer (retired 2008) and Member of the Executive Committee (1997–2008) of Johnson & Johnson (pharmaceuticals/medical devices/consumer products); Director of Skytop Lodge Corporation (hotels) and the Robert Wood Johnson Foundation; Member of the Advisory Board of the Institute for Women’s Leadership at Rutgers University.
F. Joseph Loughrey
Born 1949. Trustee Since October 2009. Principal Occupation(s) During the Past Five Years and Other Experience: President and Chief Operating Officer (retired 2009) of Cummins Inc. (industrial machinery); Chairman of the Board of Hillenbrand, Inc. (specialized consumer services), and of Oxfam America; Director of SKF AB (industrial machinery), Hyster-Yale Materials Handling, Inc. (forklift trucks), the Lumina Foundation for Education, and the V Foundation for Cancer Research; Member of the Advisory Council for the College of Arts and Letters and of the Advisory Board to the Kellogg Institute for International Studies, both at the University of Notre Dame.
Mark Loughridge
Born 1953. Trustee Since March 2012. Principal Occupation(s) During the Past Five Years and Other Experience: Senior Vice President and Chief Financial Officer (retired 2013) at IBM (information technology services); Fiduciary Member of IBM’s Retirement Plan Committee (2004–2013); Director of the Dow Chemical Company; Member of the Council on Chicago Booth.
Scott C. Malpass
Born 1962. Trustee Since March 2012. Principal Occupation(s) During the Past Five Years and Other Experience: Chief Investment Officer and Vice President at the University of Notre Dame; Assistant Professor of Finance at the Mendoza College of Business at Notre Dame; Member of the Notre Dame 403(b) Investment Committee, the Board of Advisors for Spruceview Capital Partners, and the Investment Advisory Committee of Major League Baseball; Board Member of TIFF Advisory Services, Inc., and Catholic Investment Services, Inc. (investment advisors).
André F. Perold
Born 1952. Trustee Since December 2004. Principal Occupation(s) During the Past Five Years and Other Experience: George Gund Professor of Finance and Banking, Emeritus at the Harvard Business School (retired 2011); Chief Investment Officer and Managing Partner of HighVista Strategies LLC (private investment firm); Director of Rand Merchant Bank; Overseer of the Museum of Fine Arts Boston.
Peter F. Volanakis
Born 1955. Trustee Since July 2009. Principal Occupation(s) During the Past Five Years and Other Experience: President and Chief Operating Officer (retired 2010) of Corning Incorporated (communications equipment); Chairman of the Board of Trustees of Colby-Sawyer College; Member of the Advisory Board of the Norris Cotton Cancer Center.
Executive Officers
Glenn Booraem
Born 1967. Treasurer Since May 2015. Principal Occupation(s) During the Past Five Years and Other Experience: Principal of The Vanguard Group, Inc.; Treasurer of each of the investment companies served by The Vanguard Group; Controller of each of the investment companies served by The Vanguard Group (2010–2015); Assistant Controller of each of the investment companies served by The Vanguard Group (2001–2010).
Thomas J. Higgins
Born 1957. Chief Financial Officer Since September 2008. Principal Occupation(s) During the Past Five Years and Other Experience: Principal of The Vanguard Group, Inc.; Chief Financial Officer of each of the investment companies served by The Vanguard Group; Treasurer of each of the investment companies served by The Vanguard Group (1998–2008).
Peter Mahoney
Born 1974. Controller Since May 2015. Principal Occupation(s) During the Past Five Years and Other Experience: Head of Global Fund Accounting at The Vanguard Group, Inc.; Controller of each of the investment companies served by The Vanguard Group; Head of International Fund Services at The Vanguard Group (2008–2014).
Anne E. Robinson
Born 1970. Secretary Since September 2016. Principal Occupation(s) During the Past Five Years and Other Experience: Managing Director of The Vanguard Group, Inc.; General Counsel of The Vanguard Group; Secretary of The Vanguard Group and of each of the investment companies served by The Vanguard Group; Director and Senior Vice President of Vanguard Marketing Corporation; Managing Director and General Counsel of Global Cards and Consumer Services at Citigroup (2014–2016); Counsel at American Express (2003–2014).
| |
| Vanguard Senior ManagementTeam |
| Mortimer J. Buckley | James M. Norris |
| Kathleen C. Gubanich | Thomas M. Rampulla |
| Martha G. King | Glenn W. Reed |
| John T. Marcante | Karin A. Risi |
| Chris D. McIsaac | Michael Rollings |
Chairman Emeritus and Senior Advisor
John J. Brennan
Chairman, 1996–2009
Chief Executive Officer and President, 1996–2008
Founder
John C. Bogle
Chairman and Chief Executive Officer, 1974–1996
1 Mr. McNabb is considered an “interested person,” as defined in the Investment Company Act of 1940, because he is an officer of the
Vanguard funds.
2 December 2002 for Vanguard Equity Income Fund, the Vanguard Municipal Bond Funds, and the Vanguard State Tax-Exempt Funds.
|
|
|  |
| P.O. Box 2600 |
| Valley Forge, PA 19482-2600 |
Connect with Vanguard® > vanguard.com
| |
| Fund Information > 800-662-7447 | |
| Direct Investor Account Services > 800-662-2739 | |
| Institutional Investor Services > 800-523-1036 | |
| Text Telephone for People | |
| Who Are Deaf or Hard of Hearing > 800-749-7273 | |
| |
| This material may be used in conjunction | |
| with the offering of shares of any Vanguard | |
| fund only if preceded or accompanied by | |
| the fund’s current prospectus. | |
| |
| All comparative mutual fund data are from Lipper, a | |
| Thomson Reuters Company, or Morningstar, Inc., unless | |
| otherwise noted. | |
| |
| You can obtain a free copy of Vanguard’s proxy voting | |
| guidelines by visiting vanguard.com/proxyreporting or by | |
| calling Vanguard at 800-662-2739. The guidelines are | |
| also available from the SEC’s website, sec.gov. In | |
| addition, you may obtain a free report on how your fund | |
| voted the proxies for securities it owned during the 12 | |
| months ended June 30. To get the report, visit either | |
| vanguard.com/proxyreporting or sec.gov. | |
| |
| You can review and copy information about your fund at | |
| the SEC’s Public Reference Room in Washington, D.C. To | |
| find out more about this public service, call the SEC at | |
| 202-551-8090. Information about your fund is also | |
| available on the SEC’s website, and you can receive | |
| copies of this information, for a fee, by sending a | |
| request in either of two ways: via email addressed to | |
| publicinfo@sec.gov or via regular mail addressed to the | |
| Public Reference Section, Securities and Exchange | |
| Commission, Washington, DC 20549-1520. | |
| |
| | © 2016 The Vanguard Group, Inc. |
| | All rights reserved. |
| | Vanguard Marketing Corporation, Distributor. |
| |
| | Q1260 122016 |
Annual Report | October 31, 2016
Vanguard High Dividend Yield Index Fund
A new format, unwavering commitment
As you begin reading this report, you’ll notice that we’ve made some improvements to the opening sections—based on feedback from you, our clients.
Page 1 starts with a new ”Your Fund’s Performance at a Glance,” a concise, handy summary of how your fund performed during the period.
In the renamed ”Chairman’s Perspective,” Bill McNabb will focus on enduring principles and investment insights.
We’ve modified some tables, and eliminated some redundancy, but we haven’t removed any information.
At Vanguard, we’re always looking for better ways to communicate and to help you make sound investment decisions. Thank you for entrusting your assets to us.
| |
| Contents | |
| Your Fund’s Performance at a Glance. | 1 |
| Chairman’s Perspective. | 3 |
| Fund Profile. | 7 |
| Performance Summary. | 9 |
| Financial Statements. | 11 |
| Your Fund’s After-Tax Returns. | 28 |
| About Your Fund’s Expenses. | 29 |
| Glossary. | 31 |
Please note: The opinions expressed in this report are just that—informed opinions. They should not be considered promises or advice. Also, please keep in mind that the information and opinions cover the period through the date on the front of this report. Of course, the risks of investing in your fund are spelled out in the prospectus.
See the Glossary for definitions of investment terms used in this report.
About the cover: No matter what language you speak, Vanguard has one consistent message and set of principles. Our primary focus is on you, our clients. We conduct our business with integrity as a faithful steward of your assets. This message is shown translated into seven languages, reflecting our expanding global presence.
Your Fund’s Performance at a Glance
• Vanguard High Dividend Yield Index Fund returned a bit more than 8% for the 12 months ended October 31, 2016, closely tracking its target, the FTSE High Dividend Yield Index. It outdistanced both the broad market and the average return of its peers.
• The fund’s focus on U.S. companies that are committed to paying larger-than-average dividends helped boost its results for the fiscal year.
• The fund posted gains in each of its ten market sectors. Technology (+15%) was the top contributor, followed by consumer goods (+10%), utilities (+18%), and industrials (+10%).
• Since its inception in November of 2006, the fund has produced an average annual return of almost 7%.
| |
| Total Returns: Fiscal Year Ended October 31, 2016 | |
| | Total |
| | Returns |
| Vanguard High Dividend Yield Index Fund | |
| Investor Shares | 8.11% |
| ETF Shares | |
| Market Price | 8.13 |
| Net Asset Value | 8.18 |
| FTSE High Dividend Yield Index | 8.25 |
| Equity Income Funds Average | 4.59 |
Equity Income Funds Average: Derived from data provided by Lipper, a Thomson Reuters Company.
The Vanguard ETF® Shares shown are traded on the NYSE Arca exchange and are available only through brokers. The table provides ETF returns based on both the NYSE Arca market price and the net asset value for a share. U.S. Pat. Nos. 6,879,964; 7,337,138; 7,720,749; 7,925,573; 8,090,646; and 8,417,623.
For the ETF Shares, the market price is determined by the midpoint of the bid-offer spread as of the closing time of the New York Stock Exchange (generally 4 p.m., Eastern time). The net asset value is also determined as of the NYSE closing time. For more information about how the ETF Shares' market prices have compared with their net asset value, visit vanguard.com, select your ETF, and then select the Price and Performance tab. The ETF premium/discount analysis there shows the percentages of days on which the ETF Shares' market price was above or below the NAV.
1
| |
| Total Returns: Inception Through October 31, 2016 | |
| | Average |
| | Annual Return |
| High Dividend Yield Index Fund Investor Shares (Returns since inception: 11/16/2006) | 6.60% |
| FTSE High Dividend Yield Index | 6.82 |
| Equity Income Funds Average | 5.11 |
| Equity Income Funds Average: Derived from data provided by Lipper, a Thomson Reuters Company. | |
The figures shown represent past performance, which is not a guarantee of future results. (Current performance may be lower or higher than the performance data cited. For performance data current to the most recent month-end, visit our website at vanguard.com/performance.) Note, too, that both investment returns and principal value can fluctuate widely, so an investor’s shares, when sold, could be worth more or less than their original cost.
| | | |
| Expense Ratios | | | |
| Your Fund Compared With Its Peer Group | | | |
| | Investor | ETF | Peer Group |
| | Shares | Shares | Average |
| High Dividend Yield Index Fund | 0.16% | 0.09% | 1.20% |
The fund expense ratios shown are from the prospectus dated February 25, 2016, and represent estimated costs for the current fiscal year. For the fiscal year ended October 31, 2016, the fund’s expense ratios were 0.15% for Investor Shares and 0.08% for ETF Shares. The peer-group expense ratio is derived from data provided by Lipper, a Thomson Reuters Company, and captures information through year-end 2015.
Peer group: Equity Income Funds.
2
Chairman’s Perspective

|
| Bill McNabb |
| Chairman and Chief Executive Officer |
Dear Shareholder,
Over the three years ended August 31, 2016, investors poured more than $1 trillion into index funds. Indexing now accounts for nearly a third of all mutual fund assets—more than double what it did a decade ago and eight times its share two decades ago.1
By contrast, active management’s commercial struggles have reflected its disappointing investment performance. Over the decade ended December 31, 2015, 82% of actively managed stock funds and 81% of active bond funds have either underperformed their benchmarks or shut down.
This subpar performance has fueled the explosion of asset growth in indexing among individual, retirement, and nonprofit investors. So what might the trend mean for the future of actively managed funds?
Our research and experience indicate that active management can survive—and even succeed—but only if it’s offered at much lower expense.
High costs, which limit a manager’s ability to deliver benchmark-beating returns to clients, are the biggest reason why active has lagged. Industrywide as of December 31, 2015, the average expense ratio for all active stock funds is 1.14%, compared with 0.76% for stock index
1 Sources: Wall Street Journal; Morningstar, Inc.; and Investment Company Institute, 2016.
3
funds. And the expense advantage is even wider for bonds; the average expense ratio for an active bond fund is 0.93%, compared with 0.43% for bond index funds.
But even these big differences understate the real gap. These days, it’s not hard to find an index fund that charges maybe 0.05% or 0.10%. So even if you have identified active managers who are skilled at selecting stocks and bonds, to match the return of a comparable (much cheaper) index fund would require significant outperformance. Think about it. Any fund that charges 1.00% in expenses—not even the high end of the range—will find it extraordinarily difficult to overcome the index fund’s head start.
Active management also has taken a hit from a regulatory environment that has been favorable to low-cost strategies. The U.S. Department of Labor several years ago mandated greater disclosure of retirement plan fees. And its new fiduciary rule, which is set to take effect in April, requires financial advisors to demonstrate that their recommendations are aligned with their clients’ best interest. Both changes encourage the use of lower-cost investments, including index funds.
The future of active management
In light of all this, people have been asking me whether active management is “dead.” My response is both yes and no. High-cost active management is dead, and rightly so. It has never been a winning proposition
| | | |
| Market Barometer | | | |
| | | Average Annual Total Returns |
| | | Periods Ended October 31, 2016 |
| | One | Three | Five |
| | Year | Years | Years |
| Stocks | | | |
| Russell 1000 Index (Large-caps) | 4.26% | 8.48% | 13.51% |
| Russell 2000 Index (Small-caps) | 4.11 | 4.12 | 11.51 |
| Russell 3000 Index (Broad U.S. market) | 4.24 | 8.13 | 13.35 |
| FTSE All-World ex US Index (International) | 0.64 | -0.94 | 4.09 |
| |
| Bonds | | | |
| Bloomberg Barclays U.S. Aggregate Bond Index | | | |
| (Broad taxable market) | 4.37% | 3.48% | 2.90% |
| Bloomberg Barclays Municipal Bond Index | | | |
| (Broad tax-exempt market) | 4.06 | 4.89 | 4.34 |
| Citigroup Three-Month U.S. Treasury Bill Index | 0.22 | 0.07 | 0.07 |
| |
| CPI | | | |
| Consumer Price Index | 1.64% | 1.15% | 1.32% |
4
for investors. Low-cost active funds, though, can potentially play an important role for investors who seek to outperform the market.
Paying less for your funds is the only sure-fire way to improve your odds of achieving success in active management. But even if you have found an active manager with low costs, the odds of outperforming the market are still long. You have to be able to identify talented stock and bond portfolio managers with long time horizons and clear investment strategies. Look for managers with consistent track records and the discipline to stick closely to their investment strategy.
Know what you own and why
Despite the well-deserved reputation of indexing and the challenges for active managers, there’s still a place for traditional active strategies that are low-cost, diversified, and highly disciplined, and are run by talented managers who focus on the long term.
Vanguard has always applied these principles to our active strategies, and investors have benefited as a majority of our active funds outperformed their benchmarks and bested their peers’ average annual return over the ten years ended September 30, 2016.
Worried about the election’s impact on your portfolio?
The 2016 presidential election season was one of the most intense and unpredictable in U.S. history. In its aftermath, investors may be left with lingering questions about what the outcome will mean for their portfolios. The answer, based on Vanguard research into decades of historical data, is that presidential elections typically have no long-term effect on market performance.
These findings hold true regardless of the market’s initial reaction. Whether there’s a swoon or bounce immediately after an election, investors shouldn’t extrapolate that performance to the long term.
As you can see in the accompanying chart, data going back to 1853 show that stock market returns are virtually identical no matter which party controls the White House. Although headlines out of Washington at any given time may still cause concern, investors
shouldn’t overreact to short-term events. Instead, it’s best to maintain a balanced and diversified portfolio and stay focused on your long-term goals.
Average annual stock market returns based on party control of the White House (1853–2015)
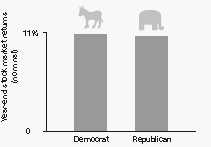
Sources: Global Financial Data, 1853–1926; Morningstar, Inc., and Ibbotson Associates thereafter through 2015.
5
But it’s crucial for investors to be patient. Even active managers with the best track records frequently underperform their benchmarks when their investment styles are out of favor. Such periods, though temporary, can persist. So it’s important when entrusting your assets to an active strategy to be in it for the long haul.
Make sure you know what you’re buying and what the risks are. Active strategies are becoming more complex, so it’s important to clearly understand what the investments in your portfolio are designed to accomplish and why you want to hold them. Otherwise, you run the risk of selecting strategies that don’t fit your needs or objectives.
Keeping these considerations in mind can potentially boost your chances of success in identifying active strategies that may be able to help you reach your goals.
As always, thank you for investing with Vanguard.
Sincerely,

F. William McNabb III
Chairman and Chief Executive Officer
November 9, 2016
6
High Dividend Yield Index Fund
Fund Profile
As of October 31, 2016
| | |
| Share-Class Characteristics | |
| |
| |
| | Investor | ETF |
| | Shares | Shares |
| Ticker Symbol | VHDYX | VYM |
| Expense Ratio1 | 0.16% | 0.09% |
| 30-Day SEC | | |
| Yield | 3.17% | 3.24% |
| | | |
| Portfolio Characteristics | | |
| | | | DJ |
| | | | U.S. |
| | | FTSE High | Total |
| | | Dividend | Market |
| | | Yield | FA |
| | Fund | Index | Index |
| Number of Stocks | 419 | 415 | 3,833 |
| Median Market Cap | $108.2B | $108.2B | $53.5B |
| Price/Earnings Ratio | 20.2x | 20.2x | 23.1x |
| Price/Book Ratio | 2.6x | 2.6x | 2.7x |
| Return on Equity | 17.4% | 17.4% | 16.6% |
| Earnings Growth | | | |
| Rate | 1.1% | 1.1% | 8.4% |
| Dividend Yield | 3.3% | 3.3% | 2.1% |
| Foreign Holdings | 0.0% | 0.0% | 0.0% |
| Turnover Rate | 7% | — | — |
| Short-Term | | | |
| Reserves | -0.1% | — | — |
| | |
| Volatility Measures | | |
| | FTSE High | DJ |
| | Dividend | U.S. Total |
| | Yield | Market |
| | Index | FA Index |
| R-Squared | 1.00 | 0.89 |
| Beta | 1.00 | 0.86 |
These measures show the degree and timing of the fund’s fluctuations compared with the indexes over 36 months.
| | |
| Ten Largest Holdings (% of total net assets) |
| Microsoft Corp. | Software | 5.3% |
| Exxon Mobil Corp. | Integrated Oil & Gas | 4.0 |
| Johnson & Johnson | Pharmaceuticals | 3.7 |
| General Electric Co. | Diversified Industrials | 3.0 |
| JPMorgan Chase & Co. | Banks | 2.9 |
| Wells Fargo & Co. | Banks | 2.7 |
| AT&T Inc. | Fixed Line | |
| | Telecommunications | 2.6 |
| Procter & Gamble Co. | Nondurable | |
| | Household Products | 2.6 |
| Chevron Corp. | Integrated Oil & Gas | 2.3 |
| Verizon Communications Fixed Line | |
| Inc. | Telecommunications | 2.3 |
| Top Ten | | 31.4% |
The holdings listed exclude any temporary cash investments and equity index products.
Investment Focus
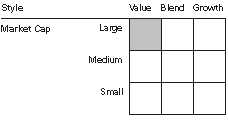
1 The expense ratios shown are from the prospectus dated February 25, 2016, and represent estimated costs for the current fiscal year. For the fiscal year ended October 31, 2016, the expense ratios were 0.15% for Investor Shares and 0.08% for ETF Shares.
7
High Dividend Yield Index Fund
| | | |
| Sector Diversification (% of equity exposure) |
| | | FTSE High | DJ |
| | | Dividend | U.S. Total |
| | | Yield | Market |
| | Fund | Index | FA Index |
| Basic Materials | 3.2% | 3.2% | 2.5% |
| Consumer Goods | 15.2 | 15.2 | 10.2 |
| Consumer Services | 5.7 | 5.6 | 13.2 |
| Financials | 13.8 | 13.8 | 19.4 |
| Health Care | 11.0 | 11.0 | 12.6 |
| Industrials | 12.4 | 12.4 | 12.7 |
| Oil & Gas | 10.4 | 10.5 | 6.6 |
| Technology | 14.8 | 14.8 | 17.2 |
| Telecommunications | 5.2 | 5.2 | 2.3 |
| Utilities | 8.3 | 8.3 | 3.3 |
8
High Dividend Yield Index Fund
Performance Summary
All of the returns in this report represent past performance, which is not a guarantee of future results that may be achieved by the fund. (Current performance may be lower or higher than the performance data cited. For performance data current to the most recent month-end, visit our website at vanguard.com/performance.) Note, too, that both investment returns and principal value can fluctuate widely, so an investor’s shares, when sold, could be worth more or less than their original cost. The returns shown do not reflect taxes that a shareholder would pay on fund distributions or on the sale of fund shares.
Cumulative Performance: November 16, 2006, Through October 31, 2016
Initial Investment of $10,000
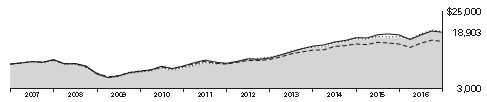
| | | | |
| | Average Annual Total Returns | |
| | Periods Ended October 31, 2016 | |
| | | | Since | Final Value |
| | One | Five | Inception | of a $10,000 |
| | Year | Years | (11/16/2006) | Investment |
| High Dividend Yield Index Fund | | | | |
| Investor Shares | 8.11% | 13.63% | 6.60% | $18,903 |
| FTSE High Dividend Yield Index | 8.25 | 13.79 | 6.82 | 19,287 |
| Equity Income Funds Average | 4.59 | 10.40 | 5.11 | 16,432 |
| Dow Jones U.S. Total Stock Market | | | | |
| Float Adjusted Index | 4.21 | 13.29 | 6.69 | 19,062 |
Equity Income Funds Average: Derived from data provided by Lipper, a Thomson Reuters Company.
"Since Inception" performance is calculated from the Investor Shares’ inception date for both the fund and its comparative standards.
| | | | |
| | | | Since | Final Value |
| | One | Five | Inception | of a $10,000 |
| | Year | Years | (11/10/2006) | Investment |
| High Dividend Yield Index Fund | | | | |
| ETF Shares Net Asset Value | 8.18% | 13.71% | 6.80% | $19,267 |
| FTSE High Dividend Yield Index | 8.25 | 13.79 | 6.90 | 19,449 |
| Dow Jones U.S. Total Stock Market Float | | | | |
| Adjusted Index | 4.21 | 13.29 | 6.85 | 19,358 |
| "Since Inception" performance is calculated from the ETF Shares’ inception date for both the fund and its comparative standards. |
See Financial Highlights for dividend and capital gains information.
9
High Dividend Yield Index Fund
Cumulative Returns of ETF Shares: November 10, 2006, Through October 31, 2016
| | | |
| | | | Since |
| | One | Five | Inception |
| | Year | Years | (11/10/2006) |
| High Dividend Yield Index Fund ETF Shares Market | | | |
| Price | 8.13% | 90.01% | 92.68% |
| High Dividend Yield Index Fund ETF Shares Net | | | |
| Asset Value | 8.18 | 90.09 | 92.67 |
| FTSE High Dividend Yield Index | 8.25 | 90.79 | 94.49 |
| "Since Inception" performance is calculated from the ETF Shares’ inception date for both the fund and its comparative standards. |
Fiscal-Year Total Returns (%): November 16, 2006, Through October 31, 2016
Average Annual Total Returns: Periods Ended September 30, 2016
This table presents returns through the latest calendar quarter—rather than through the end of the fiscal period.
Securities and Exchange Commission rules require that we provide this information.
| | | | |
| | Inception | One | Five | Since |
| | Date | Year | Years | Inception |
| Investor Shares | 11/16/2006 | 18.75% | 15.74% | 6.81% |
| ETF Shares | 11/10/2006 | | | |
| Market Price | | 18.79 | 15.82 | 7.00 |
| Net Asset Value | | 18.79 | 15.84 | 7.00 |
10
High Dividend Yield Index Fund
Financial Statements
Statement of Net Assets
As of October 31, 2016
The fund reports a complete list of its holdings in regulatory filings four times in each fiscal year, at the quarter-ends. For the second and fourth fiscal quarters, the lists appear in the fund’s semiannual and annual reports to shareholders. For the first and third fiscal quarters, the fund files the lists with the Securities and Exchange Commission on Form N-Q. Shareholders can look up the fund’s Forms N-Q on the SEC’s website at sec.gov. Forms N-Q may also be reviewed and copied at the SEC’s Public Reference Room (see the back cover of this report for further information).
| | | |
| | | | Market |
| | | | Value• |
| | | Shares | ($000) |
| Common Stocks (99.6%)1 | | |
| Basic Materials (3.2%) | | |
| | EI du Pont de Nemours | | |
| | & Co. | 2,173,172 | 149,492 |
| | Dow Chemical Co. | 2,765,415 | 148,807 |
| | Air Products & | | |
| | Chemicals Inc. | 538,044 | 71,786 |
| | LyondellBasell Industries | | |
| | NV Class A | 869,176 | 69,143 |
| | International Paper Co. | 1,023,383 | 46,083 |
| | Nucor Corp. | 782,274 | 38,214 |
| | Mosaic Co. | 873,979 | 20,565 |
| | RPM International Inc. | 333,927 | 15,875 |
| | Steel Dynamics Inc. | 565,803 | 15,537 |
| | Avery Dennison Corp. | 222,243 | 15,510 |
| | CF Industries Holdings Inc. | 562,040 | 13,495 |
| | Reliance Steel & | | |
| | Aluminum Co. | 165,192 | 11,362 |
| | Olin Corp. | 393,994 | 8,640 |
| | Scotts Miracle-Gro Co. | | |
| | Class A | 89,723 | 7,904 |
| | Huntsman Corp. | 406,196 | 6,885 |
| | Compass Minerals | | |
| | International Inc. | 86,367 | 6,205 |
| * | Versum Materials Inc. | 268,981 | 6,106 |
| | Domtar Corp. | 146,301 | 5,260 |
| * | Ingevity Corp. | 106,012 | 4,389 |
| | Commercial Metals Co. | 276,105 | 4,338 |
| | KapStone Paper and | | |
| | Packaging Corp. | 206,500 | 3,746 |
| | Innophos Holdings Inc. | 54,893 | 2,516 |
| | A Schulman Inc. | 86,695 | 2,492 |
| | Ferroglobe plc | 165,318 | 1,529 |
| | Rayonier Advanced | | |
| | Materials Inc. | 114,338 | 1,478 |
| | | | 677,357 |
| Consumer Goods (15.1%) | | |
| | Procter & Gamble Co. | 6,361,328 | 552,163 |
| | Coca-Cola Co. | 10,251,522 | 434,664 |
| | PepsiCo Inc. | 3,574,839 | 383,223 |
| | | |
| | Philip Morris | | |
| | International Inc. | 3,878,328 | 374,026 |
| | Altria Group Inc. | 4,926,173 | 325,719 |
| | Kraft Heinz Co. | 1,477,234 | 131,400 |
| | Reynolds American Inc. | 2,066,337 | 113,814 |
| | Ford Motor Co. | 9,589,553 | 112,581 |
| | General Motors Co. | 3,561,716 | 112,550 |
| | Kimberly-Clark Corp. | 897,496 | 102,682 |
| | General Mills Inc. | 1,473,082 | 91,302 |
| | Archer-Daniels-Midland | | |
| | Co. | 1,452,931 | 63,304 |
| | ConAgra Foods Inc. | 1,078,201 | 51,948 |
| | Kellogg Co. | 584,623 | 43,923 |
| | Stanley Black & Decker | | |
| | Inc. | 368,453 | 41,945 |
| | Clorox Co. | 320,992 | 38,525 |
| | Genuine Parts Co. | 374,466 | 33,923 |
| | Mattel Inc. | 832,346 | 26,244 |
| | Harley-Davidson Inc. | 445,398 | 25,397 |
| | Coach Inc. | 679,581 | 24,390 |
| | Hasbro Inc. | 279,084 | 23,278 |
| | Coca-Cola European | | |
| | Partners plc | 564,965 | 21,717 |
| | Bunge Ltd. | 342,890 | 21,263 |
| | Leggett & Platt Inc. | 325,466 | 14,932 |
| | Pinnacle Foods Inc. | 282,196 | 14,510 |
| | Nu Skin Enterprises Inc. | | |
| | Class A | 118,358 | 7,297 |
| | B&G Foods Inc. | 165,519 | 7,018 |
| ^ | Flowers Foods Inc. | 435,293 | 6,756 |
| | Tupperware Brands Corp. | 110,270 | 6,563 |
| | Vector Group Ltd. | 232,939 | 4,878 |
| | HNI Corp. | 102,315 | 4,160 |
| | Steelcase Inc. Class A | 236,376 | 3,156 |
| | Universal Corp. | 55,795 | 3,024 |
| | Schweitzer-Mauduit | | |
| | International Inc. | 71,956 | 2,656 |
| | MDC Holdings Inc. | 108,807 | 2,580 |
| ^ | Cal-Maine Foods Inc. | 65,606 | 2,536 |
| | Knoll Inc. | 105,141 | 2,275 |
11
High Dividend Yield Index Fund
| | | |
| | | | Market |
| | | | Value• |
| | | Shares | ($000) |
| | Cosan Ltd. | 251,354 | 2,237 |
| | Briggs & Stratton Corp. | 95,647 | 1,781 |
| | National Presto Industries | | |
| | Inc. | 15,145 | 1,321 |
| | Superior Industries | | |
| | International Inc. | 53,376 | 1,308 |
| | | | 3,238,969 |
| Consumer Services (5.6%) | | |
| | Wal-Mart Stores Inc. | 3,878,435 | 271,568 |
| | McDonald’s Corp. | 2,123,966 | 239,095 |
| | Target Corp. | 1,423,591 | 97,843 |
| | Sysco Corp. | 1,284,200 | 61,796 |
| | Las Vegas Sands Corp. | 994,162 | 57,542 |
| | Carnival Corp. | 953,661 | 46,825 |
| | Omnicom Group Inc. | 585,581 | 46,741 |
| | L Brands Inc. | 533,089 | 38,484 |
| | Viacom Inc. Class B | 855,499 | 32,133 |
| | Macy’s Inc. | 764,430 | 27,894 |
| | Best Buy Co. Inc. | 642,342 | 24,993 |
| | Darden Restaurants Inc. | 313,880 | 20,336 |
| | Wynn Resorts Ltd. | 202,982 | 19,192 |
| | Kohl’s Corp. | 426,575 | 18,663 |
| ^ | Nordstrom Inc. | 348,560 | 18,125 |
| | Gap Inc. | 561,160 | 15,482 |
| | KAR Auction Services Inc. | 333,257 | 14,190 |
| | Six Flags Entertainment | | |
| | Corp. | 230,192 | 12,810 |
| | H&R Block Inc. | 556,706 | 12,788 |
| | Staples Inc. | 1,610,841 | 11,920 |
| | TEGNA Inc. | 544,727 | 10,688 |
| | Cinemark Holdings Inc. | 262,289 | 10,439 |
| ^ | Cracker Barrel Old | | |
| | Country Store Inc. | 53,772 | 7,420 |
| | American Eagle Outfitters | | |
| | Inc. | 425,696 | 7,254 |
| | International Game | | |
| | Technology plc | 249,884 | 7,177 |
| | GameStop Corp. Class A | 260,745 | 6,271 |
| | John Wiley & Sons Inc. | | |
| | Class A | 103,387 | 5,335 |
| | Hillenbrand Inc. | 150,118 | 4,556 |
| ^ | Regal Entertainment | | |
| | Group Class A | 203,319 | 4,373 |
| | ILG Inc. | 258,177 | 4,229 |
| | Meredith Corp. | 92,988 | 4,217 |
| | DineEquity Inc. | 44,398 | 3,512 |
| | Time Inc. | 255,897 | 3,327 |
| | Extended Stay America Inc. | 215,764 | 3,085 |
| | Abercrombie & Fitch Co. | 174,422 | 2,548 |
| | SeaWorld Entertainment | | |
| | Inc. | 175,035 | 2,452 |
| | Bob Evans Farms Inc. | 56,260 | 2,319 |
| | Guess? Inc. | 170,709 | 2,305 |
| | Gannett Co. Inc. | 287,381 | 2,233 |
| | National CineMedia Inc. | 148,555 | 2,060 |
| | | | |
| | ClubCorp Holdings Inc. | 170,361 | 1,968 |
| | Tailored Brands Inc. | | 119,497 | 1,888 |
| ^ | Copa Holdings SA Class A | 19,407 | 1,790 |
| | Weis Markets Inc. | | 31,174 | 1,734 |
| | New Media Investment | | |
| | Group Inc. | | 109,542 | 1,577 |
| | Cato Corp. Class A | | 48,589 | 1,442 |
| ^ | Buckle Inc. | | 65,168 | 1,359 |
| | Rent-A-Center Inc. | | 130,755 | 1,319 |
| | Pier 1 Imports Inc. | | 220,797 | 952 |
| | Speedway Motorsports Inc. | 37,581 | 707 |
| | | | | 1,198,956 |
| Financials (13.7%) | | | |
| | JPMorgan Chase & Co. | 8,991,456 | 622,748 |
| | Wells Fargo & Co. | 12,570,101 | 578,350 |
| | Chubb Ltd. | | 1,155,177 | 146,707 |
| | PNC Financial Services | | |
| | Group Inc. | | 1,222,092 | 116,832 |
| | BlackRock Inc. | | 306,297 | 104,521 |
| | MetLife Inc. | | 2,198,138 | 103,225 |
| | Prudential Financial Inc. | 1,087,833 | 92,237 |
| | CME Group Inc. | | 796,849 | 79,765 |
| | BB&T Corp. | | 2,009,255 | 78,763 |
| | Travelers Cos. Inc. | | 716,280 | 77,487 |
| | Aflac Inc. | | 985,821 | 67,893 |
| | SunTrust Banks Inc. | | 1,227,242 | 55,508 |
| | M&T Bank Corp. | | 367,411 | 45,092 |
| | Fifth Third Bancorp | | 1,908,891 | 41,537 |
| | Principal Financial Group | | |
| | Inc. | | 713,128 | 38,937 |
| | KeyCorp | | 2,701,876 | 38,150 |
| | T. Rowe Price Group Inc. | 586,766 | 37,559 |
| | Ameriprise Financial Inc. | 403,956 | 35,706 |
| | Regions Financial Corp. | 3,147,877 | 33,714 |
| | Huntington Bancshares | | |
| | Inc. | | 2,713,418 | 28,762 |
| | Invesco Ltd. | | 1,022,187 | 28,713 |
| | Cincinnati Financial Corp. | 364,763 | 25,818 |
| | FNF Group | | 676,620 | 24,297 |
| | Western Union Co. | | 1,200,867 | 24,101 |
| | Arthur J Gallagher & Co. | 430,902 | 20,782 |
| | New York Community | | |
| | Bancorp Inc. | | 1,168,558 | 16,780 |
| | People’s United Financial | | |
| | Inc. | | 792,489 | 12,870 |
| | PacWest Bancorp | | 287,475 | 12,474 |
| | Axis Capital Holdings Ltd. | 208,657 | 11,887 |
| | First American Financial | | |
| | Corp. | | 268,635 | 10,493 |
| | Navient Corp. | | 802,237 | 10,253 |
| | Cullen/Frost Bankers Inc. | 132,035 | 10,033 |
| | Eaton Vance Corp. | | 276,947 | 9,710 |
| | Lazard Ltd. Class A | | 265,963 | 9,697 |
| | Old Republic International | | |
| | Corp. | | 573,323 | 9,666 |
12
High Dividend Yield Index Fund
| | | |
| | | | Market |
| | | | Value• |
| | | Shares | ($000) |
| | Allied World Assurance Co. | | |
| | Holdings AG | 222,510 | 9,563 |
| | Umpqua Holdings Corp. | 544,485 | 8,320 |
| | Validus Holdings Ltd. | 160,212 | 8,187 |
| | Bank of Hawaii Corp. | 98,753 | 7,421 |
| | Chemical Financial Corp. | 169,871 | 7,296 |
| | BankUnited Inc. | 242,102 | 7,055 |
| | ProAssurance Corp. | 129,752 | 6,916 |
| | United Bankshares Inc. | 181,104 | 6,828 |
| | Hancock Holding Co. | 199,473 | 6,692 |
| | FNB Corp. | 511,679 | 6,688 |
| | IBERIABANK Corp. | 101,202 | 6,644 |
| | Fulton Financial Corp. | 444,809 | 6,628 |
| | NorthStar Asset | | |
| | Management Group Inc. | 482,226 | 6,607 |
| | Valley National Bancorp | 663,719 | 6,544 |
| | Janus Capital Group Inc. | 471,963 | 6,051 |
| | Federated Investors Inc. | | |
| | Class B | 219,367 | 5,923 |
| ^ | LPL Financial Holdings Inc. | 190,884 | 5,910 |
| | Washington Federal Inc. | 216,635 | 5,903 |
| | RLI Corp. | 90,828 | 5,063 |
| | Old National Bancorp | 342,443 | 5,034 |
| | Glacier Bancorp Inc. | 177,526 | 5,017 |
| | Capitol Federal Financial | | |
| | Inc. | 340,220 | 4,991 |
| | Hope Bancorp Inc. | 307,206 | 4,958 |
| | Columbia Banking System | | |
| | Inc. | 140,581 | 4,642 |
| | Community Bank System | | |
| | Inc. | 96,063 | 4,526 |
| | BGC Partners Inc. Class A | 487,412 | 4,187 |
| | Trustmark Corp. | 144,817 | 4,009 |
| | TFS Financial Corp. | 222,764 | 3,970 |
| | LegacyTexas Financial | | |
| | Group Inc. | 114,689 | 3,924 |
| | Northwest Bancshares Inc. | 246,102 | 3,874 |
| | Mercury General Corp. | 70,750 | 3,854 |
| | CVB Financial Corp. | 221,691 | 3,720 |
| | Horace Mann Educators | | |
| | Corp. | 99,140 | 3,564 |
| | Provident Financial | | |
| | Services Inc. | 155,528 | 3,529 |
| ^ | BOK Financial Corp. | 49,330 | 3,503 |
| | NBT Bancorp Inc. | 101,735 | 3,429 |
| | Waddell & Reed Financial | | |
| | Inc. Class A | 211,265 | 3,321 |
| | Kemper Corp. | 86,212 | 3,237 |
| | WesBanco Inc. | 97,839 | 3,220 |
| | Independent Bank Corp. | 55,880 | 3,082 |
| | First Financial Bancorp | 141,879 | 3,050 |
| | Artisan Partners Asset | | |
| | Management Inc. Class A | 111,401 | 2,896 |
| | Simmons First National | | |
| | Corp. Class A | 57,901 | 2,857 |
| | NRG Yield Inc. Class A | 193,468 | 2,850 |
| | | |
| Park National Corp. | | 29,100 | 2,821 |
| Westamerica | | | |
| Bancorporation | | 55,960 | 2,773 |
| CNA Financial Corp. | | 72,248 | 2,642 |
| Boston Private Financial | | |
| Holdings Inc. | | 199,406 | 2,622 |
| HFF Inc. Class A | | 98,058 | 2,611 |
| Tompkins Financial Corp. | 31,963 | 2,534 |
| Safety Insurance Group Inc. 37,099 | 2,512 |
| American National | | | |
| Insurance Co. | | 20,356 | 2,385 |
| S&T Bancorp Inc. | | 75,879 | 2,382 |
| Brookline Bancorp Inc. | 163,424 | 2,092 |
| First Commonwealth | | |
| Financial Corp. | | 185,243 | 1,882 |
| City Holding Co. | | 35,821 | 1,872 |
| Oritani Financial Corp. | 117,384 | 1,837 |
| Maiden Holdings Ltd. | 133,081 | 1,817 |
| Cohen & Steers Inc. | | 47,293 | 1,758 |
| FBL Financial Group Inc. | | |
| Class A | | 27,315 | 1,729 |
| Washington Trust Bancorp | | |
| Inc. | | 36,048 | 1,655 |
| Stock Yards Bancorp Inc. | 46,333 | 1,580 |
| TrustCo Bank Corp. NY | 207,081 | 1,450 |
| Flushing Financial Corp. | 67,578 | 1,448 |
| BancFirst Corp. | | 19,900 | 1,427 |
| Sandy Spring Bancorp Inc. | 43,261 | 1,371 |
| Community Trust Bancorp | | |
| Inc. | | 37,223 | 1,361 |
| 1st Source Corp. | | 35,861 | 1,239 |
| Greenhill & Co. Inc. | | 50,681 | 1,188 |
| Dime Community | | | |
| Bancshares Inc. | | 71,018 | 1,150 |
| NRG Yield Inc. | | 68,351 | 1,053 |
| First Financial Corp. | | 24,254 | 973 |
| Republic Bancorp Inc. | | |
| Class A | | 18,762 | 594 |
| Willis Towers Watson plc | 8 | 1 |
| | | | 2,939,309 |
| Health Care (10.9%) | | | |
| Johnson & Johnson | | 6,831,686 | 792,407 |
| Pfizer Inc. | 15,076,778 | 478,085 |
| Merck & Co. Inc. | | 6,898,512 | 405,081 |
| AbbVie Inc. | | 4,022,673 | 224,385 |
| Bristol-Myers Squibb Co. | 4,136,700 | 210,599 |
| Eli Lilly & Co. | | 2,445,586 | 180,582 |
| Quest Diagnostics Inc. | 343,916 | 28,009 |
| Owens & Minor Inc. | | 149,356 | 4,847 |
| Abaxis Inc. | | 58,721 | 2,803 |
| * Innoviva Inc. | | 233,860 | 2,409 |
| Kindred Healthcare Inc. | 218,212 | 2,149 |
| Meridian Bioscience Inc. | 109,059 | 1,794 |
| PDL BioPharma Inc. | | 397,897 | 1,281 |
| | | | 2,334,431 |
13
High Dividend Yield Index Fund
| | |
| | | Market |
| | | Value• |
| | Shares | ($000) |
| Industrials (12.4%) | | |
| General Electric Co. | 22,252,630 | 647,551 |
| 3M Co. | 1,503,713 | 248,564 |
| Boeing Co. | 1,407,385 | 200,454 |
| United Parcel Service Inc. | | |
| Class B | 1,725,859 | 185,979 |
| Lockheed Martin Corp. | 742,718 | 182,991 |
| Caterpillar Inc. | 1,436,924 | 119,926 |
| Raytheon Co. | 735,605 | 100,491 |
| Automatic Data | | |
| Processing Inc. | 1,135,339 | 98,843 |
| Emerson Electric Co. | 1,585,268 | 80,341 |
| Waste Management Inc. | 1,112,462 | 73,044 |
| Eaton Corp. plc | 1,126,774 | 71,854 |
| CSX Corp. | 2,339,449 | 71,377 |
| Norfolk Southern Corp. | 727,436 | 67,651 |
| Deere & Co. | 735,799 | 64,971 |
| Cummins Inc. | 415,911 | 53,162 |
| PACCAR Inc. | 875,605 | 48,088 |
| Paychex Inc. | 817,704 | 45,137 |
| Republic Services Inc. | | |
| Class A | 695,882 | 36,624 |
| WestRock Co. | 627,392 | 28,979 |
| Fastenal Co. | 654,487 | 25,512 |
| Xerox Corp. | 2,505,845 | 24,482 |
| CH Robinson Worldwide | | |
| Inc. | 354,994 | 24,182 |
| Packaging Corp. of | | |
| America | 233,690 | 19,279 |
| MDU Resources Group | | |
| Inc. | 469,588 | 12,308 |
| Sonoco Products Co. | 234,636 | 11,800 |
| Ryder System Inc. | 135,494 | 9,402 |
| MSC Industrial Direct Co. | | |
| Inc. Class A | 118,404 | 8,620 |
| National Instruments Corp. | 248,624 | 6,984 |
| Kennametal Inc. | 199,752 | 5,655 |
| Timken Co. | 166,396 | 5,499 |
| MSA Safety Inc. | 81,118 | 4,729 |
| Covanta Holding Corp. | 276,852 | 4,153 |
| CEB Inc. | 79,709 | 3,878 |
| Applied Industrial | | |
| Technologies Inc. | 75,114 | 3,816 |
| GATX Corp. | 86,723 | 3,796 |
| Aircastle Ltd. | 169,245 | 3,478 |
| Brady Corp. Class A | 100,885 | 3,339 |
| RR Donnelley & Sons Co. | 170,746 | 3,031 |
| Otter Tail Corp. | 83,171 | 2,990 |
| Greif Inc. Class A | 63,223 | 2,963 |
| ^ Ship Finance International | | |
| Ltd. | 192,688 | 2,437 |
| ManTech International | | |
| Corp. Class A | 59,834 | 2,323 |
| Greenbrier Cos. Inc. | 70,298 | 2,214 |
| | | |
| ^ | Nordic American Tankers | | |
| | Ltd. | 268,921 | 2,197 |
| ^ | GasLog Ltd. | 133,590 | 2,051 |
| | Raven Industries Inc. | 94,239 | 2,021 |
| | General Cable Corp. | 139,299 | 1,950 |
| ^ | Seaspan Corp. Class A | 157,065 | 1,943 |
| | AVX Corp. | 121,511 | 1,704 |
| * | LSC Communications Inc. | 63,830 | 1,547 |
| | McGrath RentCorp | 49,971 | 1,504 |
| | Schnitzer Steel Industries | | |
| | Inc. | 58,208 | 1,406 |
| * | Donnelley Financial | | |
| | Solutions Inc. | 63,830 | 1,369 |
| | Triton International | | |
| | Ltd./Bermuda | 112,833 | 1,362 |
| | Scorpio Tankers Inc. | 295,523 | 1,132 |
| | H&E Equipment Services | | |
| | Inc. | 79,262 | 1,106 |
| | American Railcar Industries | |
| | Inc. | 27,295 | 1,004 |
| ^ | Teekay Corp. | 145,350 | 949 |
| | Myers Industries Inc. | 54,838 | 661 |
| | Textainer Group Holdings | | |
| | Ltd. | 50,219 | 382 |
| | Daktronics Inc. | 1,161 | 10 |
| | | | 2,647,195 |
| Oil & Gas (10.4%) | | |
| | Exxon Mobil Corp. | 10,360,211 | 863,213 |
| | Chevron Corp. | 4,678,093 | 490,030 |
| | Occidental Petroleum | | |
| | Corp. | 1,919,538 | 139,954 |
| | ConocoPhillips | 3,066,582 | 133,243 |
| | Phillips 66 | 1,317,627 | 106,925 |
| | Kinder Morgan Inc. | 4,663,030 | 95,266 |
| | Spectra Energy Corp. | 1,732,123 | 72,420 |
| | Valero Energy Corp. | 1,154,729 | 68,406 |
| | Marathon Petroleum | | |
| | Corp. | 1,316,985 | 57,407 |
| | Williams Cos. Inc. | 1,845,440 | 53,887 |
| | National Oilwell Varco Inc. | 942,682 | 30,260 |
| ^ | Helmerich & Payne Inc. | 261,870 | 16,527 |
| | Targa Resources Corp. | 370,652 | 16,272 |
| | OGE Energy Corp. | 492,324 | 15,282 |
| | Murphy Oil Corp. | 424,138 | 10,972 |
| | HollyFrontier Corp. | 403,775 | 10,074 |
| | Patterson-UTI Energy Inc. | 369,037 | 8,296 |
| | Western Refining Inc. | 219,245 | 6,325 |
| | Oceaneering International | | |
| | Inc. | 249,835 | 5,946 |
| | PBF Energy Inc. Class A | 265,515 | 5,788 |
| | SemGroup Corp. Class A | 164,006 | 5,289 |
| | Pattern Energy Group Inc. | | |
| | Class A | 183,751 | 4,107 |
| | Noble Corp. plc | 624,509 | 3,085 |
| | Delek US Holdings Inc. | 167,362 | 2,828 |
14
High Dividend Yield Index Fund
| | | |
| | Archrock Inc. | 161,631 | 1,875 |
| ^ | Frank’s International NV | 117,847 | 1,326 |
| | CVR Energy Inc. | 84,952 | 1,127 |
| | | | 2,226,130 |
| Other (0.0%)2 | | |
| * | Safeway Inc CVR | | |
| | (Casa Ley) | | |
| | Expire 1/30/2018 | 364 | — |
| * | Safeway Inc CVR (PDC) | | |
| | Expire 1/30/2017 | 364 | — |
| |
| Technology (14.8%) | | |
| | Microsoft Corp. | 18,793,880 | 1,126,129 |
| | Intel Corp. | 11,776,788 | 410,657 |
| | Cisco Systems Inc. | 12,522,705 | 384,197 |
| | International Business | | |
| | Machines Corp. | 2,387,024 | 366,862 |
| | QUALCOMM Inc. | 3,650,583 | 250,868 |
| | Texas Instruments Inc. | 2,504,350 | 177,433 |
| | HP Inc. | 4,265,355 | 61,805 |
| | Analog Devices Inc. | 763,566 | 48,944 |
| | Western Digital Corp. | 656,806 | 38,384 |
| | Linear Technology Corp. | 598,383 | 35,939 |
| | Microchip Technology Inc. 534,217 | 32,347 |
| | Xilinx Inc. | 632,227 | 32,161 |
| | KLA-Tencor Corp. | 386,823 | 29,054 |
| | Maxim Integrated | | |
| | Products Inc. | 709,640 | 28,123 |
| | Harris Corp. | 308,233 | 27,497 |
| | Seagate Technology plc | 701,010 | 24,052 |
| | CA Inc. | 774,634 | 23,812 |
| | Garmin Ltd. | 263,236 | 12,730 |
| | Pitney Bowes Inc. | 465,983 | 8,313 |
| | Cypress Semiconductor | | |
| | Corp. | 798,914 | 7,965 |
| | Science Applications | | |
| | International Corp. | 91,494 | 6,305 |
| | Lexmark International Inc. | | |
| | Class A | 156,890 | 6,227 |
| | Intersil Corp. Class A | 277,999 | 6,138 |
| | Diebold Inc. | 187,608 | 4,090 |
| | Cogent Communications | | |
| | Holdings Inc. | 103,875 | 3,833 |
| | West Corp. | 161,906 | 3,193 |
| | Brooks Automation Inc. | 167,756 | 2,186 |
| | Computer Programs & | | |
| | Systems Inc. | 12,023 | 314 |
| | | | 3,159,558 |
| Telecommunications (5.2%) | | |
| | AT&T Inc. | 15,355,165 | 564,916 |
| | Verizon Communications | | |
| | Inc. | 10,138,588 | 487,666 |
| | CenturyLink Inc. | 1,368,364 | 36,371 |
| | Frontier Communications | | |
| | Corp. | 2,968,957 | 11,935 |
| | |
| Consolidated | | |
| Communications | | |
| Holdings Inc. | 124,516 | 2,980 |
| ^ Windstream Holdings Inc. | 244,196 | 1,917 |
| EarthLink Holdings Corp. | 243,821 | 1,395 |
| | | 1,107,180 |
| Utilities (8.3%) | | |
| NextEra Energy Inc. | 1,153,179 | 147,607 |
| Duke Energy Corp. | 1,722,568 | 137,840 |
| Southern Co. | 2,436,925 | 125,672 |
| Dominion Resources Inc. | 1,563,311 | 117,561 |
| American Electric Power | | |
| Co. Inc. | 1,223,158 | 79,310 |
| PG&E Corp. | 1,253,886 | 77,891 |
| Exelon Corp. | 2,197,210 | 74,859 |
| Sempra Energy | 616,040 | 65,978 |
| Edison International | 812,893 | 59,731 |
| Consolidated Edison Inc. | 762,539 | 57,610 |
| PPL Corp. | 1,668,563 | 57,298 |
| Public Service Enterprise | | |
| Group Inc. | 1,264,433 | 53,207 |
| Xcel Energy Inc. | 1,236,086 | 51,359 |
| WEC Energy Group Inc. | 788,760 | 47,105 |
| Eversource Energy | 776,646 | 42,762 |
| DTE Energy Co. | 444,228 | 42,650 |
| FirstEnergy Corp. | 1,047,162 | 35,907 |
| Entergy Corp. | 438,706 | 32,324 |
| Ameren Corp. | 595,738 | 29,757 |
| CMS Energy Corp. | 691,079 | 29,129 |
| ONEOK Inc. | 527,086 | 25,527 |
| CenterPoint Energy Inc. | 1,058,219 | 24,127 |
| SCANA Corp. | 318,855 | 23,391 |
| Alliant Energy Corp. | 555,098 | 21,121 |
| Westar Energy Inc. | | |
| Class A | 362,437 | 20,775 |
| Pinnacle West Capital | | |
| Corp. | 270,732 | 20,611 |
| UGI Corp. | 429,689 | 19,890 |
| AES Corp. | 1,687,705 | 19,864 |
| Atmos Energy Corp. | 257,516 | 19,157 |
| NiSource Inc. | 791,877 | 18,419 |
| Great Plains Energy Inc. | 488,134 | 13,883 |
| Aqua America Inc. | 374,046 | 11,483 |
| National Fuel Gas Co. | 194,231 | 10,174 |
| Vectren Corp. | 199,051 | 10,014 |
| Portland General Electric | | |
| Co. | 215,488 | 9,404 |
| IDACORP Inc. | 118,539 | 9,292 |
| Southwest Gas Corp. | 120,962 | 8,765 |
| NRG Energy Inc. | 791,987 | 8,419 |
| WGL Holdings Inc. | 130,752 | 8,247 |
| Black Hills Corp. | 129,515 | 8,010 |
| Hawaiian Electric | | |
| Industries Inc. | 264,426 | 7,801 |
| ONE Gas Inc. | 125,628 | 7,698 |
15
High Dividend Yield Index Fund
| | | |
| | New Jersey Resources | | |
| | Corp. | 220,205 | 7,476 |
| | ALLETE Inc. | 115,574 | 7,084 |
| | Spire Inc. | 110,424 | 6,935 |
| | NorthWestern Corp. | 117,496 | 6,762 |
| | PNM Resources Inc. | 203,431 | 6,683 |
| | Avista Corp. | 148,325 | 6,141 |
| | Avangrid Inc. | 155,618 | 6,133 |
| | South Jersey Industries Inc. | 193,803 | 5,746 |
| | MGE Energy Inc. | 86,277 | 5,043 |
| | Empire District Electric Co. | 140,303 | 4,803 |
| | El Paso Electric Co. | 94,819 | 4,381 |
| | Northwest Natural Gas Co. | 66,232 | 3,894 |
| | California Water Service | | |
| | Group | 119,053 | 3,691 |
| | Atlantica Yield plc | 89,574 | 1,611 |
| | | | 1,768,012 |
| Total Common Stocks | | |
| (Cost $18,713,225) | | 21,297,097 |
| Temporary Cash Investments (0.4%)1 | |
| Money Market Fund (0.4%) | | |
| 3,4 | Vanguard Market | | |
| | Liquidity Fund, 0.718% | 704,088 | 70,416 |
| |
| | | Face | |
| | | Amount | |
| | | ($000) | |
| U.S. Government and Agency Obligations (0.0%) |
| 5 | United States Treasury Bill, | | |
| | 0.275–0.312%, 12/8/16 | 2,500 | 2,499 |
| 5 | United States Treasury Bill, | | |
| | 0.281%, 12/15/16 | 300 | 300 |
| 5 | United States Treasury Bill, | | |
| | 0.300%, 12/22/16 | 200 | 200 |
| 5 | United States Treasury Bill, | | |
| | 0.360%, 1/12/17 | 500 | 500 |
| | | | 3,499 |
| Total Temporary Cash Investments | |
| (Cost $73,912) | | 73,915 |
| Total Investments (100.0%) | | |
| (Cost $18,787,137) | | 21,371,012 |
| |
| Other Assets and Liabilities (0.0%) | |
| Other Assets | |
| Investment in Vanguard | 1,630 |
| Receivables for Accrued Income | 31,814 |
| Receivables for Capital Shares Issued | 9,960 |
| Other Assets | 16 |
| Total Other Assets | 43,420 |
| Liabilities | |
| Payables for Investment Securities | |
| Purchased | (268) |
| Collateral for Securities on Loan | (23,840) |
| Payables for Capital Shares Redeemed | (7,637) |
| Payables to Vanguard | (6,431) |
| Other Liabilities | (136) |
| Total Liabilities | (38,312) |
| Net Assets (100%) | 21,376,120 |
| |
| |
| At October 31, 2016, net assets consisted of: |
| | Amount |
| | ($000) |
| Paid-in Capital | 18,939,601 |
| Undistributed Net Investment Income | 63,970 |
| Accumulated Net Realized Losses | (210,773) |
| Unrealized Appreciation (Depreciation) | |
| Investment Securities | 2,583,875 |
| Futures Contracts | (553) |
| Net Assets | 21,376,120 |
16
High Dividend Yield Index Fund
| |
| | Amount |
| | ($000) |
| Investor Shares—Net Assets | |
| Applicable to 208,506,549 outstanding | |
| $.001 par value shares of beneficial | |
| interest (unlimited authorization) | 5,878,923 |
| Net Asset Value Per Share— | |
| Investor Shares | $28.20 |
| |
| |
| ETF Shares—Net Assets | |
| Applicable to 217,684,796 outstanding | |
| $.001 par value shares of beneficial | |
| interest (unlimited authorization) | 15,497,197 |
| Net Asset Value Per Share— | |
| ETF Shares | $71.19 |
• See Note A in Notes to Financial Statements.
^ Includes partial security positions on loan to broker-dealers. The total value of securities on loan is $22,757,000.
* Non-income-producing security.
1 The fund invests a portion of its cash reserves in equity markets through the use of index futures contracts. After giving effect to futures
investments, the fund’s effective common stock and temporary cash investment positions represent 100.0% and 0.0%, respectively,
of net assets.
2 “Other” represents securities that are not classified by the fund’s benchmark index.
3 Affiliated money market fund available only to Vanguard funds and certain trusts and accounts managed by Vanguard. Rate shown is the
7-day yield.
4 Includes $23,840,000 of collateral received for securities on loan.
5 Securities with a value of $3,349,000 have been segregated as initial margin for open futures contracts.
CVR—Contingent Value Rights.
See accompanying Notes, which are an integral part of the Financial Statements.
17
High Dividend Yield Index Fund
| |
| Statement of Operations | |
| |
| | Year Ended |
| | October 31, 2016 |
| | ($000) |
| Investment Income | |
| Income | |
| Dividends | 611,556 |
| Interest1 | 185 |
| Securities Lending—Net | 2,059 |
| Total Income | 613,800 |
| Expenses | |
| The Vanguard Group—Note B | |
| Investment Advisory Services | 2,202 |
| Management and Administrative—Investor Shares | 5,586 |
| Management and Administrative—ETF Shares | 7,368 |
| Marketing and Distribution—Investor Shares | 1,068 |
| Marketing and Distribution—ETF Shares | 868 |
| Custodian Fees | 603 |
| Auditing Fees | 35 |
| Shareholders’ Reports—Investor Shares | 49 |
| Shareholders’ Reports—ETF Shares | 349 |
| Trustees’ Fees and Expenses | 10 |
| Total Expenses | 18,138 |
| Net Investment Income | 595,662 |
| Realized Net Gain (Loss) | |
| Investment Securities Sold1 | 345,824 |
| Futures Contracts | 4,312 |
| Realized Net Gain (Loss) | 350,136 |
| Change in Unrealized Appreciation (Depreciation) | |
| Investment Securities | 538,186 |
| Futures Contracts | (5,027) |
| Change in Unrealized Appreciation (Depreciation) | 533,159 |
| Net Increase (Decrease) in Net Assets Resulting from Operations | 1,478,957 |
| 1 Interest income and realized net gain (loss) from an affiliated company of the fund were $166,000 and $7,000, respectively. |
See accompanying Notes, which are an integral part of the Financial Statements.
18
High Dividend Yield Index Fund
| | |
| Statement of Changes in Net Assets | | |
| |
| | Year Ended October 31, |
| | 2016 | 2015 |
| | ($000) | ($000) |
| Increase (Decrease) in Net Assets | | |
| Operations | | |
| Net Investment Income | 595,662 | 471,533 |
| Realized Net Gain (Loss) | 350,136 | 709,023 |
| Change in Unrealized Appreciation (Depreciation) | 533,159 | (758,580) |
| Net Increase (Decrease) in Net Assets Resulting from Operations | 1,478,957 | 421,976 |
| Distributions | | |
| Net Investment Income | | |
| Investor Shares | (149,810) | (131,007) |
| ETF Shares | (416,117) | (338,220) |
| Realized Capital Gain | | |
| Investor Shares | — | — |
| ETF Shares | — | — |
| Total Distributions | (565,927) | (469,227) |
| Capital Share Transactions | | |
| Investor Shares | 1,276,227 | 316,638 |
| ETF Shares | 3,605,173 | 1,464,202 |
| Net Increase (Decrease) from Capital Share Transactions | 4,881,400 | 1,780,840 |
| Total Increase (Decrease) | 5,794,430 | 1,733,589 |
| Net Assets | | |
| Beginning of Period | 15,581,690 | 13,848,101 |
| End of Period1 | 21,376,120 | 15,581,690 |
| 1 Net Assets—End of Period includes undistributed (overdistributed) net investment income of $63,970,000 and $34,148,000. |
See accompanying Notes, which are an integral part of the Financial Statements.
19
High Dividend Yield Index Fund
Financial Highlights
| | | | | |
| Investor Shares | | | | | |
| |
| For a Share Outstanding | | | Year Ended October 31, |
| Throughout Each Period | 2016 | 2015 | 2014 | 2013 | 2012 |
| Net Asset Value, Beginning of Period | $26.89 | $26.98 | $23.83 | $19.76 | $17.30 |
| Investment Operations | | | | | |
| Net Investment Income | . 854 | . 815 | .727 | . 667 | . 579 |
| Net Realized and Unrealized Gain (Loss) | | | | | |
| on Investments | 1.286 | (.088) | 3.147 | 4.063 | 2.446 |
| Total from Investment Operations | 2.140 | .727 | 3.874 | 4.730 | 3.025 |
| Distributions | | | | | |
| Dividends from Net Investment Income | (. 830) | (. 817) | (.724) | (. 660) | (. 565) |
| Distributions from Realized Capital Gains | — | — | — | — | — |
| Total Distributions | (. 830) | (. 817) | (.724) | (. 660) | (. 565) |
| Net Asset Value, End of Period | $28.20 | $26.89 | $26.98 | $23.83 | $19.76 |
| |
| Total Return1 | 8.11% | 2.78% | 16.48% | 24.35% | 17.69% |
| |
| Ratios/Supplemental Data | | | | | |
| Net Assets, End of Period (Millions) | $5,879 | $4,368 | $4,066 | $3,019 | $1,596 |
| Ratio of Total Expenses to Average Net Assets | 0.15% | 0.16% | 0.18% | 0.19% | 0.20% |
| Ratio of Net Investment Income to | | | | | |
| Average Net Assets | 3.19% | 3.06% | 2.92% | 3.10% | 3.22% |
| Portfolio Turnover Rate2 | 7% | 11% | 12% | 13% | 11% |
1 Total returns do not include account service fees that may have applied in the periods shown. Fund prospectuses provide information about
any applicable account service fees.
2 Excludes the value of portfolio securities received or delivered as a result of in-kind purchases or redemptions of the fund’s capital shares,
including ETF Creation Units.
See accompanying Notes, which are an integral part of the Financial Statements.
20
High Dividend Yield Index Fund
Financial Highlights
| | | | | |
| ETF Shares | | | | | |
| |
| For a Share Outstanding | | | Year Ended October 31, |
| Throughout Each Period | 2016 | 2015 | 2014 | 2013 | 2012 |
| Net Asset Value, Beginning of Period | $67.88 | $68.11 | $60.16 | $49.89 | $43.68 |
| Investment Operations | | | | | |
| Net Investment Income | 2.203 | 2.104 | 1.885 | 1.732 | 1.506 |
| Net Realized and Unrealized Gain (Loss) | | | | | |
| on Investments | 3.245 | (.222) | 7.943 | 10.247 | 6.180 |
| Total from Investment Operations | 5.448 | 1.882 | 9.828 | 11.979 | 7.686 |
| Distributions | | | | | |
| Dividends from Net Investment Income | (2.138) | (2.112) | (1.878) | (1.709) | (1.476) |
| Distributions from Realized Capital Gains | — | — | — | — | — |
| Total Distributions | (2.138) | (2.112) | (1.878) | (1.709) | (1.476) |
| Net Asset Value, End of Period | $71.19 | $67.88 | $68.11 | $60.16 | $49.89 |
| |
| Total Return | 8.18% | 2.84% | 16.56% | 24.43% | 17.80% |
| |
| Ratios/Supplemental Data | | | | | |
| Net Assets, End of Period (Millions) | $15,497 | $11,214 | $9,782 | $6,918 | $4,203 |
| Ratio of Total Expenses to Average Net Assets | 0.08% | 0.09% | 0.10% | 0.10% | 0.10% |
| Ratio of Net Investment Income to | | | | | |
| Average Net Assets | 3.26% | 3.13% | 3.00% | 3.19% | 3.32% |
| Portfolio Turnover Rate1 | 7% | 11% | 12% | 13% | 11% |
1 Excludes the value of portfolio securities received or delivered as a result of in-kind purchases or redemptions of the fund’s capital shares,
including ETF Creation Units.
See accompanying Notes, which are an integral part of the Financial Statements.
21
High Dividend Yield Index Fund
Notes to Financial Statements
Vanguard High Dividend Yield Index Fund is registered under the Investment Company Act of 1940 as an open-end investment company, or mutual fund. The fund offers two classes of shares: Investor Shares and ETF Shares. Investor Shares are available to any investor who meets the fund’s minimum purchase requirements. ETF Shares are listed for trading on NYSE Arca; they can be purchased and sold through a broker.
A. The following significant accounting policies conform to generally accepted accounting principles for U.S. investment companies. The fund consistently follows such policies in preparing its financial statements.
1. Security Valuation: Securities are valued as of the close of trading on the New York Stock Exchange (generally 4 p.m., Eastern time) on the valuation date. Equity securities are valued at the latest quoted sales prices or official closing prices taken from the primary market in which each security trades; such securities not traded on the valuation date are valued at the mean of the latest quoted bid and asked prices. Securities for which market quotations are not readily available, or whose values have been materially affected by events occurring before the fund’s pricing time but after the close of the securities’ primary markets, are valued by methods deemed by the board of trustees to represent fair value. Investments in Vanguard Market Liquidity Fund are valued at that fund’s net asset value. Temporary cash investments acquired over 60 days to maturity are valued using the latest bid prices or using valuations based on a matrix system (which considers such factors as security prices, yields, maturities, and ratings), both as furnished by independent pricing services. Other temporary cash investments are valued at amortized cost, which approximates market value.
2. Futures Contracts: The fund uses index futures contracts to a limited extent, with the objectives of maintaining full exposure to the stock market, enhancing returns, maintaining liquidity, and minimizing transaction costs. The fund may purchase futures contracts to immediately invest incoming cash in the market, or sell futures in response to cash outflows, thereby simulating a fully invested position in the underlying index while maintaining a cash balance for liquidity. The fund may seek to enhance returns by using futures contracts instead of the underlying securities when futures are believed to be priced more attractively than the underlying securities. The primary risks associated with the use of futures contracts are imperfect correlation between changes in market values of stocks held by the fund and the prices of futures contracts, and the possibility of an illiquid market. Counterparty risk involving futures is mitigated because a regulated clearinghouse is the counterparty instead of the clearing broker. To further mitigate counterparty risk, the fund trades futures contracts on an exchange, monitors the financial strength of its clearing brokers and clearinghouse, and has entered into clearing agreements with its clearing brokers. The clearinghouse imposes initial margin requirements to secure the fund’s performance and requires daily settlement of variation margin representing changes in the market value of each contract.
Futures contracts are valued at their quoted daily settlement prices. The aggregate settlement values of the contracts are not recorded in the Statement of Net Assets. Fluctuations in the value of the contracts are recorded in the Statement of Net Assets as an asset (liability) and in the Statement of Operations as unrealized appreciation (depreciation) until the contracts are closed, when they are recorded as realized futures gains (losses).
During the year ended October 31, 2016, the fund’s average investments in long and short futures contracts represented less than 1% and 0% of net assets, respectively, based on the average of aggregate settlement values at each quarter-end during the period.
22
High Dividend Yield Index Fund
3. Federal Income Taxes: The fund intends to continue to qualify as a regulated investment company and distribute all of its taxable income. Management has analyzed the fund’s tax positions taken for all open federal income tax years (October 31, 2013–2016), and has concluded that no provision for federal income tax is required in the fund’s financial statements.
4. Distributions: Distributions to shareholders are recorded on the ex-dividend date.
5. Securities Lending: To earn additional income, the fund lends its securities to qualified institutional borrowers. Security loans are subject to termination by the fund at any time, and are required to be secured at all times by collateral in an amount at least equal to the market value of securities loaned. Daily market fluctuations could cause the value of loaned securities to be more or less than the value of the collateral received. When this occurs, the collateral is adjusted and settled on the next business day. The fund further mitigates its counterparty risk by entering into securities lending transactions only with a diverse group of prequalified counterparties, monitoring their financial strength, and entering into master securities lending agreements with its counterparties. The master securities lending agreements provide that, in the event of a counterparty’s default (including bankruptcy), the fund may terminate any loans with that borrower, determine the net amount owed, and sell or retain the collateral up to the net amount owed to the fund; however, such actions may be subject to legal proceedings. While collateral mitigates counterparty risk, in the absence of a default the fund may experience delays and costs in recovering the securities loaned. The fund invests cash collateral received in Vanguard Market Liquidity Fund, and records a liability in the Statement of Net Assets for the return of the collateral, during the period the securities are on loan. Securities lending income represents fees charged to borrowers plus income earned on invested cash collateral, less expenses associated with the loan. During the term of the loan, the fund is entitled to all distributions made on or in respect of the loaned securities.
6. Credit Facility: The fund and certain other funds managed by The Vanguard Group (“Vanguard”) participate in a $3.1 billion committed credit facility provided by a syndicate of lenders pursuant to a credit agreement that may be renewed annually; each fund is individually liable for its borrowings, if any, under the credit facility. Borrowings may be utilized for temporary and emergency purposes, and are subject to the fund’s regulatory and contractual borrowing restrictions. The participating funds are charged administrative fees and an annual commitment fee of 0.10% of the undrawn amount of the facility; these fees are allocated to the funds based on a method approved by the fund’s board of trustees and included in Management and Administrative expenses on the fund’s Statement of Operations. Any borrowings under this facility bear interest at a rate based upon the higher of the one-month London Interbank Offered Rate, federal funds effective rate, or overnight bank funding rate plus an agreed-upon spread.
The fund had no borrowings outstanding at October 31, 2016, or at any time during the period then ended.
7. Other: Dividend income is recorded on the ex-dividend date. Interest income includes income distributions received from Vanguard Market Liquidity Fund and is accrued daily. Premiums and discounts on debt securities purchased are amortized and accreted, respectively, to interest income over the lives of the respective securities. Security transactions are accounted for on the date securities are bought or sold. Costs used to determine realized gains (losses) on the sale of investment securities are those of the specific securities sold.
Each class of shares has equal rights as to assets and earnings, except that each class separately bears certain class-specific expenses related to maintenance of shareholder accounts (included in Management and Administrative expenses) and shareholder reporting. Marketing and distribution
23
High Dividend Yield Index Fund
expenses are allocated to each class of shares based on a method approved by the board of trustees. Income, other non-class-specific expenses, and gains and losses on investments are allocated to each class of shares based on its relative net assets.
B. In accordance with the terms of a Funds’ Service Agreement (the “FSA”) between Vanguard and the fund, Vanguard furnishes to the fund investment advisory, corporate management, administrative, marketing, and distribution services at Vanguard’s cost of operations (as defined by the FSA). These costs of operations are allocated to the fund based on methods and guidelines approved by the board of trustees. Vanguard does not require reimbursement in the current period for certain costs of operations (such as deferred compensation/benefits and risk/insurance costs); the fund’s liability for these costs of operations is included in Payables to Vanguard on the Statement of Net Assets.
Upon the request of Vanguard, the fund may invest up to 0.40% of its net assets as capital in Vanguard. At October 31, 2016, the fund had contributed to Vanguard capital in the amount of $1,630,000, representing 0.01% of the fund’s net assets and 0.65% of Vanguard’s capitalization. The fund’s trustees and officers are also directors and employees, respectively, of Vanguard.
C. Various inputs may be used to determine the value of the fund’s investments. These inputs are summarized in three broad levels for financial statement purposes. The inputs or methodologies used to value securities are not necessarily an indication of the risk associated with investing in those securities.
Level 1—Quoted prices in active markets for identical securities.
Level 2—Other significant observable inputs (including quoted prices for similar securities, interest
rates, prepayment speeds, credit risk, etc.).
Level 3—Significant unobservable inputs (including the fund’s own assumptions used to determine
the fair value of investments).
The following table summarizes the market value of the fund’s investments as of October 31, 2016,
based on the inputs used to value them:
| | | |
| | Level 1 | Level 2 | Level 3 |
| Investments | ($000) | ($000) | ($000) |
| Common Stocks | 21,297,097 | — | — |
| Temporary Cash Investments | 70,416 | 3,499 | — |
| Futures Contracts—Liabilities1 | (132) | — | — |
| Total | 21,367,381 | 3,499 | — |
| 1 Represents variation margin on the last day of the reporting period. | | | |
D. At October 31, 2016, the aggregate settlement value of open futures contracts and the related unrealized appreciation (depreciation) were:
| | | | |
| | | | | ($000) |
| | | | Aggregate | |
| | | Number of | Settlement | Unrealized |
| | | Long (Short) | Value | Appreciation |
| Futures Contracts | Expiration | Contracts | Long (Short) | (Depreciation) |
| E-mini S&P 500 Index | December 2016 | 713 | 75,582 | (553) |
Unrealized appreciation (depreciation) on open futures contracts is required to be treated as realized gain (loss) for tax purposes.
24
High Dividend Yield Index Fund
E. Distributions are determined on a tax basis and may differ from net investment income and realized capital gains for financial reporting purposes. Differences may be permanent or temporary. Permanent differences are reclassified among capital accounts in the financial statements to reflect their tax character. Temporary differences arise when certain items of income, expense, gain, or loss are recognized in different periods for financial statement and tax purposes. These differences will reverse at some time in the future. Differences in classification may also result from the treatment of short-term gains as ordinary income for tax purposes.
Certain of the fund’s investments are in securities considered to be passive foreign investment companies, for which any unrealized appreciation and/or realized gains are required to be included in distributable net income for tax purposes. During the year ended October 31, 2016, the fund realized gains on the sale of passive foreign investment companies of $87,000, which have been included in current and prior periods’ taxable income; accordingly, such gains have been reclassified from accumulated net realized losses to undistributed net investment income. Passive foreign investment companies held at October 31, 2016, had unrealized appreciation of $652,000.
During the year ended October 31, 2016, the fund realized $472,041,000 of net capital gains resulting from in-kind redemptions—in which shareholders exchanged fund shares for securities held by the fund rather than for cash. Because such gains are not taxable to the fund, and are not distributed to shareholders, they have been reclassified from accumulated net realized losses to paid-in capital.
For tax purposes, at October 31, 2016, the fund had $70,013,000 of ordinary income available for distribution. At October 31, 2016, the fund had available capital losses totaling $211,326,000 to offset future net capital gains. Of this amount, $18,315,000 is subject to expiration on October 31, 2018. Capital losses of $193,011,000 realized beginning in fiscal 2012 may be carried forward indefinitely under the Regulated Investment Company Modernization Act of 2010, but must be used before any expiring loss carryforwards.
At October 31, 2016, the cost of investment securities for tax purposes was $18,787,789,000. Net unrealized appreciation of investment securities for tax purposes was $2,583,223,000, consisting of unrealized gains of $2,980,769,000 on securities that had risen in value since their purchase and $397,546,000 in unrealized losses on securities that had fallen in value since their purchase.
F. During the year ended October 31, 2016, the fund purchased $7,672,681,000 of investment securities and sold $2,765,795,000 of investment securities, other than temporary cash investments. Purchases and sales include $4,544,933,000 and $1,418,566,000, respectively, in connection with in-kind purchases and redemptions of the fund’s capital shares.
The fund purchased securities from and sold securities to other Vanguard funds or accounts managed by Vanguard or its affiliates, in accordance with procedures adopted by the board of trustees in compliance with Rule 17a-7 of the Investment Company Act of 1940. For the year ended October 31, 2016, such purchases and sales were $285,964,000 and $395,673,000, respectively; these amounts are included in the purchases and sales of investment securities noted above.
25
High Dividend Yield Index Fund
G. Capital share transactions for each class of shares were:
| | | | |
| | | | Year Ended October 31, |
| | | 2016 | | 2015 |
| | Amount | Shares | Amount | Shares |
| | ($000) | (000) | ($000) | (000) |
| Investor Shares | | | | |
| Issued | 2,061,346 | 74,813 | 1,160,012 | 43,020 |
| Issued in Lieu of Cash Distributions | 124,953 | 4,577 | 106,677 | 4,039 |
| Redeemed | (910,072) | (33,330) | (950,051) | (35,330) |
| Net Increase (Decrease)—Investor Shares | 1,276,227 | 46,060 | 316,638 | 11,729 |
| ETF Shares | | | | |
| Issued | 5,032,957 | 73,213 | 3,664,582 | 53,660 |
| Issued in Lieu of Cash Distributions | — | — | — | — |
| Redeemed | (1,427,784) | (20,725) | (2,200,380) | (32,075) |
| Net Increase (Decrease)—ETF Shares | 3,605,173 | 52,488 | 1,464,202 | 21,585 |
H. Management has determined that no material events or transactions occurred subsequent to October 31, 2016, that would require recognition or disclosure in these financial statements.
26
Report of Independent Registered Public Accounting Firm
To the Board of Trustees of Vanguard Whitehall Funds and the Shareholders of Vanguard High Dividend Yield Index Fund:
In our opinion, the accompanying statement of net assets and the related statements of operations and of changes in net assets and the financial highlights present fairly, in all material respects, the financial position of Vanguard High Dividend Yield Index Fund (constituting a separate portfolio of Vanguard Whitehall Funds, hereafter referred to as the “Fund”) at October 31, 2016, the results of its operations for the year then ended, the changes in its net assets for each of the two years in the period then ended, and the financial highlights for each of the five years in the period then ended, in conformity with accounting principles generally accepted in the United States of America. These financial statements and financial highlights (hereafter referred to as “financial statements”) are the responsibility of the Fund’s management. Our responsibility is to express an opinion on these financial statements based on our audits. We conducted our audits of these financial statements in accordance with the standards of the Public Company Accounting Oversight Board (United States). Those standards require that we plan and perform the audit to obtain reasonable assurance about whether the financial statements are free of material misstatement. An audit includes examining, on a test basis, evidence supporting the amounts and disclosures in the financial statements, assessing the accounting principles used and significant estimates made by management, and evaluating the overall financial statement presentation. We believe that our audits, which included confirmation of securities at October 31, 2016 by correspondence with the custodian and brokers and by agreement to the underlying ownership records of the transfer agent, provide a reasonable basis for our opinion.
/s/PricewaterhouseCoopers LLP
Philadelphia, Pennsylvania
December 15, 2016
Special 2016 tax information (unaudited) for Vanguard High Dividend Yield Index Fund
This information for the fiscal year ended October 31, 2016, is included pursuant to provisions of the Internal Revenue Code.
The fund distributed $565,927,000 of qualified dividend income to shareholders during the fiscal year.
For corporate shareholders, 99.7% of investment income (dividend income plus short-term gains, if any) qualifies for the dividends-received deduction.
27
Your Fund’s After-Tax Returns
This table presents returns for your fund both before and after taxes. The after-tax returns are shown in two ways: (1) assuming that an investor owned the fund during the entire period and paid taxes on the fund’s distributions, and (2) assuming that an investor paid taxes on the fund’s distributions and sold all shares at the end of each period.
Calculations are based on the highest individual federal income tax and capital gains tax rates in effect at the times of the distributions and the hypothetical sales. State and local taxes were not considered. After-tax returns reflect any qualified dividend income, using actual prior-year figures and estimates for 2016. (In the example, returns after the sale of fund shares may be higher than those assuming no sale. This occurs when the sale would have produced a capital loss. The calculation assumes that the investor received a tax deduction for the loss.)
The table shows returns for Investor Shares only; returns for other share classes will differ. Please note that your actual after-tax returns will depend on your tax situation and may differ from those shown. Also note that if you own the fund in a tax-deferred account, such as an individual retirement account or a 401(k) plan, this information does not apply to you. Such accounts are not subject to current taxes.
Finally, keep in mind that a fund’s performance—whether before or after taxes—does not guarantee future results.
| | | |
| Average Annual Total Returns: High Dividend Yield Index Fund Investor Shares | |
| Periods Ended October 31, 2016 | | | |
| |
| | | | Since |
| | One | Five | Inception |
| | Year | Years | (11/16/2006) |
| Returns Before Taxes | 8.11% | 13.63% | 6.60% |
| Returns After Taxes on Distributions | 7.33 | 12.90 | 6.03 |
| Returns After Taxes on Distributions and Sale of Fund Shares | 5.18 | 10.89 | 5.27 |
28
About Your Fund’s Expenses
As a shareholder of the fund, you incur ongoing costs, which include costs for portfolio management, administrative services, and shareholder reports (like this one), among others. Operating expenses, which are deducted from a fund’s gross income, directly reduce the investment return of the fund.
A fund’s expenses are expressed as a percentage of its average net assets. This figure is known as the expense ratio. The following examples are intended to help you understand the ongoing costs (in dollars) of investing in your fund and to compare these costs with those of other mutual funds. The examples are based on an investment of $1,000 made at the beginning of the period shown and held for the entire period.
The accompanying table illustrates your fund’s costs in two ways:
• Based on actual fund return. This section helps you to estimate the actual expenses that you paid over the period. The ”Ending Account Value“ shown is derived from the fund‘s actual return, and the third column shows the dollar amount that would have been paid by an investor who started with $1,000 in the fund. You may use the information here, together with the amount you invested, to estimate the expenses that you paid over the period.
To do so, simply divide your account value by $1,000 (for example, an $8,600 account value divided by $1,000 = 8.6), then multiply the result by the number given for your fund under the heading ”Expenses Paid During Period.“
• Based on hypothetical 5% yearly return. This section is intended to help you compare your fund‘s costs with those of other mutual funds. It assumes that the fund had a yearly return of 5% before expenses, but that the expense ratio is unchanged. In this case—because the return used is not the fund’s actual return—the results do not apply to your investment. The example is useful in making comparisons because the Securities and Exchange Commission requires all mutual funds to calculate expenses based on a 5% return. You can assess your fund’s costs by comparing this hypothetical example with the hypothetical examples that appear in shareholder reports of other funds.
Note that the expenses shown in the table are meant to highlight and help you compare ongoing costs only and do not reflect transaction costs incurred by the fund for buying and selling securities. Further, the expenses do not include any purchase, redemption, or account service fees described in the fund prospectus. If such fees were applied to your account, your costs would be higher. Your fund does not carry a “sales load.”
The calculations assume no shares were bought or sold during the period. Your actual costs may have been higher or lower, depending on the amount of your investment and the timing of any purchases or redemptions.
You can find more information about the fund’s expenses, including annual expense ratios, in the Financial Statements section of this report. For additional information on operating expenses and other shareholder costs, please refer to your fund’s current prospectus.
29
| | | |
| Six Months Ended October 31, 2016 | | | |
| | Beginning | Ending | Expenses |
| | Account Value | Account Value | Paid During |
| High Dividend Yield Index Fund | 4/30/2016 | 10/31/2016 | Period |
| Based on Actual Fund Return | | | |
| Investor Shares | $1,000.00 | $1,039.29 | $0.77 |
| ETF Shares | 1,000.00 | 1,039.72 | 0.41 |
| Based on Hypothetical 5% Yearly Return | | | |
| Investor Shares | $1,000.00 | $1,024.38 | $0.76 |
| ETF Shares | 1,000.00 | 1,024.73 | 0.41 |
The calculations are based on expenses incurred in the most recent six-month period. The fund’s annualized six-month expense ratios for that period are 0.15% for Investor Shares and 0.08% for ETF Shares. The dollar amounts shown as “Expenses Paid” are equal to the annualized expense ratio multiplied by the average account value over the period, multiplied by the number of days in the most recent six-month period, then divided by the number of days in the most recent 12-month period (184/366).
30
Glossary
30-Day SEC Yield. A fund’s 30-day SEC yield is derived using a formula specified by the U.S. Securities and Exchange Commission. Under the formula, data related to the fund’s security holdings in the previous 30 days are used to calculate the fund’s hypothetical net income for that period, which is then annualized and divided by the fund’s estimated average net assets over the calculation period. For the purposes of this calculation, a security’s income is based on its current market yield to maturity (for bonds), its actual income (for asset-backed securities), or its projected dividend yield (for stocks). Because the SEC yield represents hypothetical annualized income, it will differ—at times significantly—from the fund’s actual experience. As a result, the fund’s income distributions may be higher or lower than implied by the SEC yield.
Beta. A measure of the magnitude of a fund’s past share-price fluctuations in relation to the ups and downs of a given market index. The index is assigned a beta of 1.00. Compared with a given index, a fund with a beta of 1.20 typically would have seen its share price rise or fall by 12% when the index rose or fell by 10%. For this report, beta is based on returns over the past 36 months for both the fund and the index. Note that a fund’s beta should be reviewed in conjunction with its R-squared (see definition). The lower the R-squared, the less correlation there is between the fund and the index, and the less reliable beta is as an indicator of volatility.
Dividend Yield. Dividend income earned by stocks, expressed as a percentage of the aggregate market value (or of net asset value, for a fund). The yield is determined by dividing the amount of the annual dividends by the aggregate value (or net asset value) at the end of the period. For a fund, the dividend yield is based solely on stock holdings and does not include any income produced by other investments.
Earnings Growth Rate. The average annual rate of growth in earnings over the past five years for the stocks now in a fund.
Equity Exposure. A measure that reflects a fund’s investments in stocks and stock futures. Any holdings in short-term reserves are excluded.
Expense Ratio. A fund’s total annual operating expenses expressed as a percentage of the fund’s average net assets. The expense ratio includes management and administrative expenses, but does not include the transaction costs of buying and selling portfolio securities.
Foreign Holdings. The percentage of a fund represented by securities or depositary receipts of companies based outside the United States.
Inception Date. The date on which the assets of a fund (or one of its share classes) are first invested in accordance with the fund’s investment objective. For funds with a subscription period, the inception date is the day after that period ends. Investment performance is measured from the inception date.
Median Market Cap. An indicator of the size of companies in which a fund invests; the midpoint of market capitalization (market price x shares outstanding) of a fund’s stocks, weighted by the proportion of the fund’s assets invested in each stock. Stocks representing half of the fund’s assets have market capitalizations above the median, and the rest are below it.
Price/Book Ratio. The share price of a stock divided by its net worth, or book value, per share. For a fund, the weighted average price/book ratio of the stocks it holds.
31
Price/Earnings Ratio. The ratio of a stock’s current price to its per-share earnings over the past year. For a fund, the weighted average P/E of the stocks it holds. P/E is an indicator of market expectations about corporate prospects; the higher the P/E, the greater the expectations for a company’s future growth.
R-Squared. A measure of how much of a fund’s past returns can be explained by the returns from the market in general, as measured by a given index. If a fund’s total returns were precisely synchronized with an index’s returns, its R-squared would be 1.00. If the fund’s returns bore no relationship to the index’s returns, its R-squared would be 0. For this report, R-squared is based on returns over the past 36 months for both the fund and the index.
Return on Equity. The annual average rate of return generated by a company during the past five years for each dollar of shareholder’s equity (net income divided by shareholder’s equity). For a fund, the weighted average return on equity for the companies whose stocks it holds.
Short-Term Reserves. The percentage of a fund invested in highly liquid, short-term securities that can be readily converted to cash.
Turnover Rate. An indication of the fund’s trading activity. Funds with high turnover rates incur higher transaction costs and may be more likely to distribute capital gains (which may be taxable to investors). The turnover rate excludes in-kind transactions, which have minimal impact on costs.
32
This page intentionally left blank.
This page intentionally left blank.
This page intentionally left blank.
The People Who Govern Your Fund
The trustees of your mutual fund are there to see that the fund is operated and managed in your best interests since, as a shareholder, you are a part owner of the fund. Your fund’s trustees also serve on the board of directors of The Vanguard Group, Inc., which is owned by the Vanguard funds and provides services to them on an at-cost basis.
A majority of Vanguard’s board members are independent, meaning that they have no affiliation with Vanguard or the funds they oversee, apart from the sizable personal investments they have made as private individuals. The independent board members have distinguished backgrounds in business, academia, and public service. Each of the trustees and executive officers oversees 198 Vanguard funds.
The following table provides information for each trustee and executive officer of the fund. The mailing address of the trustees and officers is P.O. Box 876, Valley Forge, PA 19482. More information about the trustees is in the Statement of Additional Information, which can be obtained, without charge, by contacting Vanguard at 800-662-7447, or online at vanguard.com.
Interested Trustee1
F. William McNabb III
Born 1957. Trustee Since July 2009. Chairman of the Board. Principal Occupation(s) During the Past Five Years and Other Experience: Chairman of the Board of The Vanguard Group, Inc., and of each of the investment companies served by The Vanguard Group, since January 2010; Director of The Vanguard Group since 2008; Chief Executive Officer and President of The Vanguard Group, and of each of the investment companies served by The Vanguard Group, since 2008; Director of Vanguard Marketing Corporation; Managing Director of The Vanguard Group (1995–2008).
Independent Trustees
Emerson U. Fullwood
Born 1948. Trustee Since January 2008. Principal Occupation(s) During the Past Five Years and Other Experience: Executive Chief Staff and Marketing Officer for North America and Corporate Vice President (retired 2008) of Xerox Corporation (document management products and services); Executive in Residence and 2009–2010 Distinguished Minett Professor at the Rochester Institute of Technology; Lead Director of SPX FLOW, Inc. (multi-industry manufacturing); Director of the United Way of Rochester, the University of Rochester Medical Center, Monroe Community College Foundation, North Carolina A&T University, and Roberts Wesleyan College.
Rajiv L. Gupta
Born 1945. Trustee Since December 2001.2 Principal Occupation(s) During the Past Five Years and Other Experience: Chairman and Chief Executive Officer (retired 2009) and President (2006–2008) of Rohm and Haas Co. (chemicals); Director of Tyco International plc (diversified manufacturing and services), HP Inc. (printer and personal computer manufacturing), and Delphi Automotive plc (automotive components); Senior Advisor at New Mountain Capital.
Amy Gutmann
Born 1949. Trustee Since June 2006. Principal Occupation(s) During the Past Five Years and Other Experience: President of the University of Pennsylvania; Christopher H. Browne Distinguished Professor of Political Science, School of Arts and Sciences, and Professor of Communication, Annenberg School for Communication, with secondary faculty appointments in the Department of Philosophy, School of Arts and Sciences, and at the Graduate School of Education, University of Pennsylvania; Trustee of the National Constitution Center; Chair of the Presidential Commission for the Study of Bioethical Issues.
JoAnn Heffernan Heisen
Born 1950. Trustee Since July 1998. Principal Occupation(s) During the Past Five Years and Other Experience: Corporate Vice President and Chief Global Diversity Officer (retired 2008) and Member of the Executive Committee (1997–2008) of Johnson & Johnson (pharmaceuticals/medical devices/consumer products); Director of Skytop Lodge Corporation (hotels) and the Robert Wood Johnson Foundation; Member of the Advisory Board of the Institute for Women’s Leadership at Rutgers University.
F. Joseph Loughrey
Born 1949. Trustee Since October 2009. Principal Occupation(s) During the Past Five Years and Other Experience: President and Chief Operating Officer (retired 2009) of Cummins Inc. (industrial machinery); Chairman of the Board of Hillenbrand, Inc. (specialized consumer services), and of Oxfam America; Director of SKF AB (industrial machinery), Hyster-Yale Materials Handling, Inc. (forklift trucks), the Lumina Foundation for Education, and the V Foundation for Cancer Research; Member of the Advisory Council for the College of Arts and Letters and of the Advisory Board to the Kellogg Institute for International Studies, both at the University of Notre Dame.
Mark Loughridge
Born 1953. Trustee Since March 2012. Principal Occupation(s) During the Past Five Years and Other Experience: Senior Vice President and Chief Financial Officer (retired 2013) at IBM (information technology services); Fiduciary Member of IBM’s Retirement Plan Committee (2004–2013); Director of the Dow Chemical Company; Member of the Council on Chicago Booth.
Scott C. Malpass
Born 1962. Trustee Since March 2012. Principal Occupation(s) During the Past Five Years and Other Experience: Chief Investment Officer and Vice President at the University of Notre Dame; Assistant Professor of Finance at the Mendoza College of Business at Notre Dame; Member of the Notre Dame 403(b) Investment Committee, the Board of Advisors for Spruceview Capital Partners, and the Investment Advisory Committee of Major League Baseball; Board Member of TIFF Advisory Services, Inc., and Catholic Investment Services, Inc. (investment advisors).
André F. Perold
Born 1952. Trustee Since December 2004. Principal Occupation(s) During the Past Five Years and Other Experience: George Gund Professor of Finance and Banking, Emeritus at the Harvard Business School (retired 2011); Chief Investment Officer and Managing Partner of HighVista Strategies LLC (private investment firm); Director of Rand Merchant Bank; Overseer of the Museum of Fine Arts Boston.
Peter F. Volanakis
Born 1955. Trustee Since July 2009. Principal Occupation(s) During the Past Five Years and Other Experience: President and Chief Operating Officer (retired 2010) of Corning Incorporated (communications equipment); Chairman of the Board of Trustees of Colby-Sawyer College; Member of the Advisory Board of the Norris Cotton Cancer Center.
Executive Officers
Glenn Booraem
Born 1967. Treasurer Since May 2015. Principal Occupation(s) During the Past Five Years and Other Experience: Principal of The Vanguard Group, Inc.; Treasurer of each of the investment companies served by The Vanguard Group; Controller of each of the investment companies served by The Vanguard Group (2010–2015); Assistant Controller of each of the investment companies served by The Vanguard Group (2001–2010).
Thomas J. Higgins
Born 1957. Chief Financial Officer Since September 2008. Principal Occupation(s) During the Past Five Years and Other Experience: Principal of The Vanguard Group, Inc.; Chief Financial Officer of each of the investment companies served by The Vanguard Group; Treasurer of each of the investment companies served by The Vanguard Group (1998–2008).
Peter Mahoney
Born 1974. Controller Since May 2015. Principal Occupation(s) During the Past Five Years and Other Experience: Head of Global Fund Accounting at The Vanguard Group, Inc.; Controller of each of the investment companies served by The Vanguard Group; Head of International Fund Services at The Vanguard Group (2008–2014).
Anne E. Robinson
Born 1970. Secretary Since September 2016. Principal Occupation(s) During the Past Five Years and Other Experience: Managing Director of The Vanguard Group, Inc.; General Counsel of The Vanguard Group; Secretary of The Vanguard Group and of each of the investment companies served by The Vanguard Group; Director and Senior Vice President of Vanguard Marketing Corporation; Managing Director and General Counsel of Global Cards and Consumer Services at Citigroup (2014–2016); Counsel at American Express (2003–2014).
| |
| Vanguard Senior ManagementTeam |
| Mortimer J. Buckley | James M. Norris |
| Kathleen C. Gubanich | Thomas M. Rampulla |
| Martha G. King | Glenn W. Reed |
| John T. Marcante | Karin A. Risi |
| Chris D. McIsaac | Michael Rollings |
Chairman Emeritus and Senior Advisor
John J. Brennan
Chairman, 1996–2009
Chief Executive Officer and President, 1996–2008
Founder
John C. Bogle
Chairman and Chief Executive Officer, 1974–1996
1 Mr. McNabb is considered an “interested person,” as defined in the Investment Company Act of 1940, because he is an officer of the Vanguard funds.
2 December 2002 for Vanguard Equity Income Fund, the Vanguard Municipal Bond Funds, and the Vanguard State Tax-Exempt Funds.
| |
| |
|  |
| P.O. Box 2600 |
Connect with Vanguard® > vanguard.com | Valley Forge, PA 19482-2600 |
| |
| Fund Information > 800-662-7447 | |
| |
| Direct Investor Account Services > 800-662-2739 | London Stock Exchange Group companies include FTSE |
| International Limited (”FTSE”), Frank Russell Company |
| Institutional Investor Services > 800-523-1036 | (”Russell”), MTS Next Limited (”MTS”), and FTSE TMX |
| Global Debt Capital Markets Inc. (”FTSE TMX”). All |
| Text Telephone for People | rights reserved. ”FTSE®”, ”Russell®”, ”MTS®”, ”FTSE |
| Who Are Deaf or Hard of Hearing> 800-749-7273 | TMX®” and ”FTSE Russell” and other service marks |
| | and trademarks related to the FTSE or Russell indexes |
| This material may be used in conjunction | are trademarks of the London Stock Exchange Group |
| with the offering of shares of any Vanguard | companies and are used by FTSE, MTS, FTSE TMX and |
| fund only if preceded or accompanied by | Russell under licence. All information is provided for |
| | information purposes only. No responsibility or liability |
| the fund’s current prospectus. | can be accepted by the London Stock Exchange Group |
| All comparative mutual fund data are from Lipper, a | companies nor its licensors for any errors or for any |
| Thomson Reuters Company, or Morningstar, Inc., unless | loss from use of this publication. Neither the London |
| otherwise noted. | Stock Exchange Group companies nor any of its |
| | licensors make any claim, prediction, warranty or |
| You can obtain a free copy of Vanguard’s proxy voting | representation whatsoever, expressly or impliedly, |
| guidelines by visiting vanguard.com/proxyreporting or by | either as to the results to be obtained from the use of |
| calling Vanguard at 800-662-2739. The guidelines are | the FTSE Indexes or the fitness or suitability of the |
| also available from the SEC’s website, sec.gov. In | Indexes for any particular purpose to which they might |
| addition, you may obtain a free report on how your fund | be put. |
| voted the proxies for securities it owned during the 12 | |
| months ended June 30. To get the report, visit either | |
| vanguard.com/proxyreporting or sec.gov. | |
| |
| You can review and copy information about your fund at | |
| the SEC’s Public Reference Room in Washington, D.C. To | |
| find out more about this public service, call the SEC at | |
| 202-551-8090. Information about your fund is also | |
| available on the SEC’s website, and you can receive | |
| copies of this information, for a fee, by sending a | |
| request in either of two ways: via email addressed to | |
| publicinfo@sec.gov or via regular mail addressed to the | |
| Public Reference Section, Securities and Exchange | |
| Commission, Washington, DC 20549-1520. | |
| |
| | © 2016 The Vanguard Group, Inc. |
| | All rights reserved. |
| | Vanguard Marketing Corporation, Distributor. |
| |
| | Q6230 122016 |
 |
| Annual Report | October 31, 2016 |
| |
| Vanguard Emerging Markets |
| Government Bond Index Fund |
A new format, unwavering commitment
As you begin reading this report, you’ll notice that we’ve made some improvements to the opening sections—based on feedback from you, our clients.
Page 1 starts with a new ”Your Fund’s Performance at a Glance,” a concise, handy summary of how your fund performed during the period.
In the renamed ”Chairman’s Perspective,” Bill McNabb will focus on enduring principles and investment insights.
We’ve modified some tables, and eliminated some redundancy, but we haven’t removed any information.
At Vanguard, we’re always looking for better ways to communicate and to help you make sound investment decisions. Thank you for entrusting your assets to us.
| |
| Contents | |
| Your Fund’s Performance at a Glance. | 1 |
| Chairman’s Perspective. | 3 |
| Fund Profile. | 7 |
| Performance Summary. | 9 |
| Financial Statements. | 12 |
| About Your Fund’s Expenses. | 48 |
| Glossary. | 50 |
Please note: The opinions expressed in this report are just that—informed opinions. They should not be considered promises or advice. Also, please keep in mind that the information and opinions cover the period through the date on the front of this report. Of course, the risks of investing in your fund are spelled out in the prospectus.
See the Glossary for definitions of investment terms used in this report.
About the cover: No matter what language you speak, Vanguard has one consistent message and set of principles. Our primary focus is on you, our clients. We conduct our business with integrity as a faithful steward of your assets. This message is shown translated into seven languages, reflecting our expanding global presence.
Your Fund’s Performance at a Glance
• Vanguard Emerging Markets Government Bond Index Fund returned 10.65% for Investor Shares for the 12 months ended October 31, 2016, tracking the performance of its benchmark and slightly outperforming the average return of its peers.
• Monetary policy among the world’s largest central banks remained supportive of global bonds. The Federal Reserve raised interest rates just once, in December. Central banks in the United Kingdom, Europe, and Japan maintained highly accommodative policies.
• Historically low yields—some even below 0%—among government bonds in developed nations spurred demand for emerging-market bonds with higher yields. As emerging-market bonds gained in price, their yields fell. The fund’s SEC yield for Investor Shares declined from 4.75% to 4.09% during the period.
• Performance was nearly uniformly positive across all nations. Of the top ten countries represented in the fund by assets, the sovereign bonds of Brazil (+23.3%), Argentina (+20.3%), and Indonesia (+14.0%) produced the fund’s strongest returns.
| | | | |
| Total Returns: Fiscal Year Ended October 31, 2016 | | | | |
| | 30-Day SEC | Income | Capital | Total |
| | Yield | Returns | Returns | Returns |
| Vanguard Emerging Markets Government Bond Index Fund | | | | |
| Investor Shares | 4.09% | 4.97% | 5.68% | 10.65% |
| ETF Shares | 4.26 | | | |
| Market Price | | | | 10.87 |
| Net Asset Value | | | | 10.84 |
| Admiral™ Shares | 4.26 | 5.15 | 5.74 | 10.89 |
| Institutional Shares | 4.29 | 5.19 | 5.70 | 10.89 |
| Bloomberg Barclays USD Emerging Markets Government | | | | |
| RIC Capped Index | | | | 11.05 |
| Emerging Markets Hard Currency Debt Funds Average | | | | 10.56 |
Emerging Markets Hard Currency Debt Funds Average: Derived from data provided by Lipper, a Thomson Reuters Company.
Admiral Shares carry lower expenses and are available to investors who meet certain account-balance requirements. The Vanguard ETF® Shares shown are traded on the Nasdaq exchange and are available only through brokers. The table provides ETF returns based on both the Nasdaq market price and the net asset value for a share. U.S. Pat. Nos. 6,879,964; 7,337,138; 7,720,749; 7,925,573; 8,090,646; and 8,417,623.
For the ETF Shares, the market price is determined by the midpoint of the bid-offer spread as of the closing time of the New York Stock Exchange (generally 4 p.m., Eastern time). The net asset value is also determined as of the NYSE closing time. For more information about how the ETF Shares' market prices have compared with their net asset value, visit vanguard.com, select your ETF, and then select the Price and Performance tab. The ETF premium/discount analysis there shows the percentages of days on which the ETF Shares' market price was above or below the NAV.
1
| |
| Total Returns: Inception Through October 31, 2016 | |
| | Average |
| Annual Return |
| Emerging Markets Government Bond Index Fund Investor Shares (Returns since inception: 5/31/2013) | 4.48% |
| Bloomberg Barclays USD Emerging Markets Government RIC Capped Index | 4.72 |
| Emerging Markets Hard Currency Debt Funds Average | 2.07 |
| Emerging Markets Hard Currency Debt Funds Average: Derived from data provided by Lipper, a Thomson Reuters Company. | |
The figures shown represent past performance, which is not a guarantee of future results. (Current performance may be lower or higher than the performance data cited. For performance data current to the most recent month-end, visit our website at vanguard.com/performance.) Note, too, that both investment returns and principal value can fluctuate widely, so an investor’s shares, when sold, could be worth more or less than their original cost.
| | | | | |
| Expense Ratios | | | | | |
| Your Fund Compared With Its Peer Group | | | | | |
| | Investor | ETF | Admiral | Institutional | Peer Group |
| | Shares | Shares | Shares | Shares | Average |
| Emerging Markets Government Bond | | | | | |
| Index Fund | 0.49% | 0.34% | 0.33% | 0.29% | 1.24% |
The fund expense ratios shown are from the prospectus dated February 25, 2016, and represent estimated costs for the current fiscal year. For the fiscal year ended October 31, 2016, the expense ratios were 0.49% for Investor Shares, 0.32% for ETF Shares, 0.32% for Admiral Shares, and 0.29% for Institutional Shares. The peer-group expense ratio is derived from data provided by Lipper, a Thomson Reuters Company, and captures information through year-end 2015.
Peer group: Emerging Markets Hard Currency Debt Funds.
2
Chairman’s Perspective

Bill McNabb
Chairman and Chief Executive Officer
Dear Shareholder,
Over the three years ended August 31, 2016, investors poured more than $1 trillion into index funds. Indexing now accounts for nearly a third of all mutual fund assets—more than double what it did a decade ago and eight times its share two decades ago.1
By contrast, active management’s commercial struggles have reflected its disappointing investment performance. Over the decade ended December 31, 2015, 82% of actively managed stock funds and 81% of active bond funds have either underperformed their benchmarks or shut down.
This subpar performance has fueled the explosion of asset growth in indexing among individual, retirement, and nonprofit investors. So what might the trend mean for the future of actively managed funds?
Our research and experience indicate that active management can survive—and even succeed—but only if it’s offered at much lower expense.
High costs, which limit a manager’s ability to deliver benchmark-beating returns to clients, are the biggest reason why active has lagged. Industrywide as of December 31, 2015, the average expense ratio for all active stock funds is 1.14%, compared with 0.76% for stock index
1 Sources: Wall Street Journal; Morningstar, Inc.; and Investment Company Institute, 2016.
3
funds. And the expense advantage is even wider for bonds; the average expense ratio for an active bond fund is 0.93%, compared with 0.43% for bond index funds.
But even these big differences understate the real gap. These days, it’s not hard to find an index fund that charges maybe 0.05% or 0.10%. So even if you have identified active managers who are skilled at selecting stocks and bonds, to match the return of a comparable (much cheaper) index fund would require significant outperformance. Think about it. Any fund that charges 1.00% in expenses—not even the high end of the range—will find it extraordinarily difficult to overcome the index fund’s head start.
Active management also has taken a hit from a regulatory environment that has been favorable to low-cost strategies. The U.S. Department of Labor several years ago mandated greater disclosure of retirement plan fees. And its new fiduciary rule, which is set to take effect in April, requires financial advisors to demonstrate that their recommendations are aligned with their clients’ best interest. Both changes encourage the use of lower-cost investments, including index funds.
The future of active management
In light of all this, people have been asking me whether active management is “dead.” My response is both yes and no. High-cost active management is dead, and rightly so. It has never been a winning proposition
| | | |
| Market Barometer | | | |
| | | Average Annual Total Returns |
| | | Periods Ended October 31, 2016 |
| | One | Three | Five |
| | Year | Years | Years |
| Stocks | | | |
| Russell 1000 Index (Large-caps) | 4.26% | 8.48% | 13.51% |
| Russell 2000 Index (Small-caps) | 4.11 | 4.12 | 11.51 |
| Russell 3000 Index (Broad U.S. market) | 4.24 | 8.13 | 13.35 |
| FTSE All-World ex US Index (International) | 0.64 | -0.94 | 4.09 |
| |
| Bonds | | | |
| Bloomberg Barclays U.S. Aggregate Bond Index | | | |
| (Broad taxable market) | 4.37% | 3.48% | 2.90% |
| Bloomberg Barclays Municipal Bond Index | | | |
| (Broad tax-exempt market) | 4.06 | 4.89 | 4.34 |
| Citigroup Three-Month U.S. Treasury Bill Index | 0.22 | 0.07 | 0.07 |
| |
| CPI | | | |
| Consumer Price Index | 1.64% | 1.15% | 1.32% |
4
for investors. Low-cost active funds, though, can potentially play an important role for investors who seek to outperform the market.
Paying less for your funds is the only sure-fire way to improve your odds of achieving success in active management. But even if you have found an active manager with low costs, the odds of outperforming the market are still long. You have to be able to identify talented stock and bond portfolio managers with long time horizons and clear investment strategies. Look for managers with consistent track records and the discipline to stick closely to their investment strategy.
Know what you own and why
Despite the well-deserved reputation of indexing and the challenges for active managers, there’s still a place for traditional active strategies that are low-cost, diversified, and highly disciplined, and are run by talented managers who focus on the long term.
Vanguard has always applied these principles to our active strategies, and investors have benefited as a majority of our active funds outperformed their benchmarks and bested their peers’ average annual return over the ten years ended September 30, 2016.
Worried about the election’s impact on your portfolio?
The 2016 presidential election season was one of the most intense and unpredictable in U.S. history. In its aftermath, investors may be left with lingering questions about what the outcome will mean for their portfolios. The answer, based on Vanguard research into decades of historical data, is that presidential elections typically have no long-term effect on market performance.
These findings hold true regardless of the market’s initial reaction. Whether there’s a swoon or bounce immediately after an election, investors shouldn’t extrapolate that performance to the long term.
As you can see in the accompanying chart, data going back to 1853 show that stock market returns are virtually identical no matter which party controls the White House. Although headlines out of Washington at any given time may still cause concern, investors
shouldn’t overreact to short-term events. Instead, it’s best to maintain a balanced and diversified portfolio and stay focused on your long-term goals.
Average annual stock market returns based on party control of the White House (1853–2015)
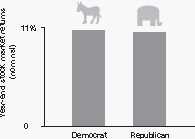
Sources: Global Financial Data, 1853–1926; Morningstar, Inc., and Ibbotson Associates thereafter through 2015.
5
But it’s crucial for investors to be patient. Even active managers with the best track records frequently underperform their benchmarks when their investment styles are out of favor. Such periods, though temporary, can persist. So it’s important when entrusting your assets to an active strategy to be in it for the long haul.
Make sure you know what you’re buying and what the risks are. Active strategies are becoming more complex, so it’s important to clearly understand what the investments in your portfolio are designed to accomplish and why you want to hold them. Otherwise, you run the risk of selecting strategies that don’t fit your needs or objectives.
Keeping these considerations in mind can potentially boost your chances of success in identifying active strategies that may be able to help you reach your goals.
As always, thank you for investing with Vanguard.
Sincerely,

F. William McNabb III
Chairman and Chief Executive Officer
November 9, 2016
6
Emerging Markets Government Bond Index Fund
Fund Profile
As of October 31, 2016
| | | | |
| Share-Class Characteristics | | | | |
| |
| | Investor | | Admiral | Institutional |
| | Shares | ETF Shares | Shares | Shares |
| Ticker Symbol | VGOVX | VWOB | VGAVX | VGIVX |
| Expense Ratio1 | 0.49% | 0.34% | 0.33% | 0.29% |
| 30-Day SEC Yield | 4.09% | 4.26% | 4.26% | 4.29% |
| | |
| Financial Attributes | | |
| |
| | | Bloomberg |
| | | Barclays USD |
| | | Emerging Mkts |
| | | Government |
| | Fund | RIC Capped Idx |
| Number of Bonds | 937 | 950 |
| Yield to Maturity | | |
| (before expenses) | 4.6% | 4.6% |
| Average Coupon | 5.5% | 5.6% |
| Average Duration | 6.5 years | 6.3 years |
| Average Effective | | |
| Maturity | 10.0 years | 10.0 years |
| Short-Term Reserves | 0.9% | — |
| |
| Sector Diversification (% of portfolio) | |
| Foreign Government | 100.0% |
The agency and mortgage-backed securities sectors may include issues from government-sponsored enterprises; such issues are generally not backed by the full faith and credit of the U.S. government.
| |
| Volatility Measures | |
| | Bloomberg |
| | Barclays USD |
| | Emerging Mkts |
| | Government |
| | RIC Capped Idx |
| R-Squared | 1.00 |
| Beta | 1.03 |
These measures show the degree and timing of the fund’s fluctuations compared with the index over 36 months.
| |
| Distribution by Effective Maturity | |
| (% of portfolio) | |
| Under 1 Year | 0.7% |
| 1 - 3 Years | 15.4 |
| 3 - 5 Years | 22.0 |
| 5 - 10 Years | 36.9 |
| 10 - 20 Years | 8.8 |
| 20 - 30 Years | 14.7 |
| Over 30 Years | 1.5 |
| |
| Distribution by Credit Quality (% of portfolio) |
| Aa | 6.8 |
| A | 17.3 |
| Baa | 36.2 |
| Less Than Baa | 39.7 |
Credit-quality ratings are obtained from Barclays and are from Moody's, Fitch, and S&P. When ratings from all three agencies are used, the median rating is shown. When ratings from two of the agencies are used, the lower rating for each issue is shown. "Not Rated" is used to classify securities for which a rating is not available. For more information about these ratings, see the Glossary entry for Credit Quality.
1 The expense ratios shown are from the prospectus dated February 25, 2016, and represent estimated costs for the current fiscal year. For the fiscal year ended October 31, 2016, the expense ratios were 0.49% for Investor Shares, 0.32% for ETF Shares, 0.32% for Admiral Shares, and 0.29% for Institutional Shares.
7
Emerging Markets Government Bond Index Fund
| |
| Market Diversification (% of portfolio ) | |
| | Fund |
| Emerging Markets | |
| China | 14.4% |
| Mexico | 8.3 |
| Brazil | 7.6 |
| Indonesia | 5.8 |
| Russia | 5.8 |
| Turkey | 5.0 |
| United Arab Emirates | 4.6 |
| Argentina | 3.8 |
| Qatar | 3.5 |
| Colombia | 2.9 |
| Philippines | 2.7 |
| Venezuela | 2.4 |
| Saudi Arabia | 2.1 |
| India | 1.9 |
| Lebanon | 1.8 |
| Malaysia | 1.8 |
| South Africa | 1.7 |
| Chile | 1.7 |
| Hungary | 1.5 |
| Kazakhstan | 1.5 |
| Poland | 1.4 |
| Ukraine | 1.4 |
| Peru | 1.2 |
| Uruguay | 1.0 |
| Other | 13.0 |
| Subtotal | 98.8% |
| Other | |
| Panama | 1.2% |
8
Emerging Markets Government Bond Index Fund
Performance Summary
All of the returns in this report represent past performance, which is not a guarantee of future results that may be achieved by the fund. (Current performance may be lower or higher than the performance data cited. For performance data current to the most recent month-end, visit our website at vanguard.com/performance.) Note, too, that both investment returns and principal value can fluctuate widely, so an investor’s shares, when sold, could be worth more or less than their original cost. The returns shown do not reflect taxes that a shareholder would pay on fund distributions or on the sale of fund shares.
Cumulative Performance: May 31, 2013, Through October 31, 2016
Initial Investment of $10,000
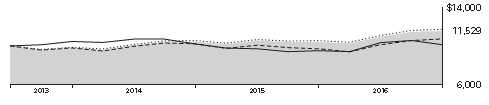
| | | |
| | Average Annual Total Returns | |
| | Periods Ended October 31, 2016 | |
| | | Since | Final Value |
| | One | Inception | of a $10,000 |
| | Year | (5/31/2013) | Investment |
| Emerging Markets Government Bond | | | |
| Index Fund Investor Shares | 9.82% | 4.25% | $11,529 |
| Bloomberg Barclays USD Emerging | | | |
| Markets Government RIC Capped | | | |
| Index | 11.05 | 4.72 | 11,709 |
| Emerging Markets Hard Currency | | | |
| Debt Funds Average | 10.56 | 2.07 | 10,727 |
| Bloomberg Barclays Global | | | |
| Aggregate Index ex USD | 6.47 | 0.36 | 10,124 |
Emerging Markets Hard Currency Debt Funds Average: Derived from data provided by Lipper, a Thomson Reuters Company.
"Since Inception" performance is calculated from the Investor Shares’ inception date for both the fund and its comparative standards.
| | | |
| | | Since | Final Value |
| | One | Inception | of a $10,000 |
| | Year | (5/31/2013) | Investment |
| Emerging Markets Government Bond Index Fund | | | |
| ETF Shares Net Asset Value | 10.84% | 4.62% | $11,672 |
| Emerging Markets Government Bond Index Fund | | | |
| ETF Shares Market Price | 10.87 | 4.74 | 11,714 |
| Bloomberg Barclays USD Emerging Markets | | | |
| Government RIC Capped Index | 11.05 | 4.72 | 11,709 |
| Bloomberg Barclays Global Aggregate Index ex USD | 6.47 | 0.36 | 10,124 |
| "Since Inception" performance is calculated from the ETF Shares’ inception date for both the fund and its comparative standards. |
Vanguard fund returns are adjusted to reflect the 0.75% fee on purchases of fund shares. The fee does not apply to the ETF Shares. The Fiscal-Year Total Returns table is not adjusted for fees.
See Financial Highlights for dividend and capital gains information.
9
| | | |
| Emerging Markets Government Bond Index Fund | | | |
| |
| |
| |
| |
| | Average Annual Total Returns | |
| | Periods Ended October 31, 2016 | |
| | | Since | Final Value |
| | One | Inception | of a $10,000 |
| | Year | (5/31/2013) | Investment |
| Emerging Markets Government Bond Index | | | |
| Fund Admiral Shares | 10.06% | 4.41% | $11,591 |
| Bloomberg Barclays USD Emerging Markets | | | |
| Government RIC Capped Index | 11.05 | 4.72 | 11,709 |
| Bloomberg Barclays Global Aggregate Index | | | |
| ex USD | 6.47 | 0.36 | 10,124 |
"Since Inception" performance is calculated from the Admiral Shares’ inception date for both the fund and its comparative standards.
| | | |
| | | Since | Final Value |
| | One | Inception | of a $5,000,000 |
| | Year | (2/11/2015)1 | Investment |
| Emerging Markets Government Bond Index | | | |
| Fund Institutional Shares | 10.06% | 7.46% | $5,658,329 |
| Bloomberg Barclays USD Emerging Markets | | | |
| Government RIC Capped Index | 11.05 | 8.01 | 5,708,092 |
| Bloomberg Barclays Global Aggregate Index | | | |
| ex USD | 6.47 | 3.37 | 5,293,296 |
"Since Inception" performance is calculated from the Institutional Shares’ inception date for both the fund and its comparative standards.
1 Institutional Shares were first issued on November 25, 2014, and were redeemed shortly thereafter. Institutional Shares were next issued on February 11, 2015. The total return shown is based on the period beginning February 11, 2015.
| | |
| Cumulative Returns of ETF Shares: May 31, 2013, Through October 31, 2016 | |
| | | Since |
| | One | Inception |
| | Year | (5/31/2013) |
| Emerging Markets Government Bond Index Fund | | |
| ETF Shares Market Price | 10.87% | 17.14% |
| Emerging Markets Government Bond Index Fund | | |
| ETF Shares Net Asset Value | 10.84 | 16.72 |
| Bloomberg Barclays USD Emerging Markets | | |
| Government RIC Capped Index | 11.05 | 17.09 |
"Since Inception" performance is calculated from the ETF Shares’ inception date for both the fund and its comparative standard.
Vanguard fund returns are adjusted to reflect the 0.75% fee on purchases of fund shares. The fee does not apply to the ETF Shares. The Fiscal-Year Total Returns table is not adjusted for fees.
10
Emerging Markets Government Bond Index Fund
| | | | |
| Fiscal-Year Total Returns (%): May 31, 2013, Through October 31, 2016 | |
| | | | | Bloomberg |
| | | | | Barclays USD |
| | | | | Emerging Mkts |
| | | | | Government |
| | | | Investor Shares | RIC Capped Idx |
| Fiscal Year | Income Returns | Capital Returns | Total Returns | Total Returns |
| 2013 | 1.51% | -2.89% | -1.38% | -1.39% |
| 2014 | 4.46 | 2.16 | 6.62 | 7.00 |
| 2015 | 4.36 | -4.52 | -0.16 | -0.08 |
| 2016 | 4.97 | 5.68 | 10.65 | 11.05 |
Average Annual Total Returns: Periods Ended September 30, 2016
This table presents returns through the latest calendar quarter—rather than through the end of the fiscal period.
Securities and Exchange Commission rules require that we provide this information.
| | | | | |
| | | | | | Since Inception |
| | Inception Date | One Year | Income | Capital | Total |
| Investor Shares | 5/31/2013 | 15.25% | 4.47% | 0.45% | 4.92% |
| Fee-Adjusted Returns | | 14.39 | | | 4.68 |
| ETF Shares | 5/31/2013 | | | | |
| Market Price | | 15.21 | | | 5.27 |
| Net Asset Value | | 15.38 | | | 5.05 |
| Admiral Shares | 5/31/2013 | 15.37 | 4.64 | 0.43 | 5.07 |
| Fee-Adjusted Returns | | 14.50 | | | 4.83 |
| Institutional Shares | 2/11/20151 | 15.41 | 5.16 | 3.84 | 9.00 |
| Fee-Adjusted Returns | | 14.54 | | | 8.50 |
1 Institutional Shares were first issued on November 25, 2014, and were redeemed shortly thereafter. Institutional Shares were next issued on February 11, 2015. The total return shown is based on the period beginning February 11, 2015.
Vanguard fund returns are adjusted to reflect the 0.75% fee on purchases of fund shares. The fee does not apply to the ETF Shares. The Fiscal-Year Total Returns table is not adjusted for fees.
11
Emerging Markets Government Bond Index Fund
Financial Statements
Statement of Net Assets
As of October 31, 2016
The fund reports a complete list of its holdings in regulatory filings four times in each fiscal year, at the quarter-ends. For the second and fourth fiscal quarters, the lists appear in the fund’s semiannual and annual reports to shareholders. For the first and third fiscal quarters, the fund files the lists with the Securities and Exchange Commission on Form N-Q. Shareholders can look up the fund’s Forms N-Q on the SEC’s website at sec.gov. Forms N-Q may also be reviewed and copied at the SEC’s Public Reference Room (see the back cover of this report for further information).
| | | | | |
| | | | | Face | Market |
| | | | Maturity | Amount | Value• |
| | | Coupon | Date | ($000) | ($000) |
| Angola (0.2%) | | | | |
| Sovereign Bonds (U.S. Dollar-Denominated) (0.2%) | | | | |
| | Republic of Angola | 9.500% | 11/12/25 | 1,400 | 1,374 |
| 1 | Republic of Angola Via Northern Lights III BV | 7.000% | 8/16/19 | 750 | 750 |
| Total Angola (Cost $2,140) | | | | 2,124 |
| Argentina (3.7%) | | | | |
| Sovereign Bonds (U.S. Dollar-Denominated) (3.7%) | | | | |
| | Argentine Republic | 8.750% | 6/2/17 | 1,050 | 1,087 |
| | Argentine Republic | 6.250% | 4/22/19 | 3,000 | 3,174 |
| | Argentine Republic | 6.875% | 4/22/21 | 3,700 | 3,994 |
| 2 | Argentine Republic | 6.875% | 4/22/21 | 150 | 162 |
| | Argentine Republic | 7.500% | 4/22/26 | 5,600 | 6,112 |
| | Argentine Republic | 8.280% | 12/31/33 | 1,012 | 1,092 |
| | Argentine Republic | 8.280% | 12/31/33 | 2,452 | 2,750 |
| | Argentine Republic | 7.125% | 7/6/36 | 3,480 | 3,578 |
| 1 | Argentine Republic | 2.500% | 12/31/38 | 5,994 | 4,088 |
| | Argentine Republic | 7.625% | 4/22/46 | 2,350 | 2,560 |
| 1 | City of Buenos Aires Argentina | 8.950% | 2/19/21 | 200 | 225 |
| 1 | City of Buenos Aires Argentina | 7.500% | 6/1/27 | 250 | 268 |
| 1,2 | City of Buenos Aires Argentina | 7.500% | 6/1/27 | 1,000 | 1,067 |
| | Petrobras Argentina SA | 7.375% | 7/21/23 | 500 | 514 |
| 1 | Provincia de Buenos Aires | 10.875% | 1/26/21 | 1,000 | 1,145 |
| 1 | Provincia de Buenos Aires | 9.950% | 6/9/21 | 600 | 682 |
| 1,2 | Provincia de Buenos Aires | 9.950% | 6/9/21 | 400 | 455 |
| 1 | Provincia de Buenos Aires | 9.125% | 3/16/24 | 1,000 | 1,104 |
| 1 | Provincia de Buenos Aires | 7.875% | 6/15/27 | 1,000 | 1,023 |
| | Provincia de Cordoba | 12.375% | 8/17/17 | 149 | 159 |
| 1 | Provincia de Mendoza Argentina | 8.375% | 5/19/24 | 400 | 415 |
| 1 | Provincia del Chubut Argentina | 7.750% | 7/26/26 | 500 | 509 |
| | YPF SA | 8.875% | 12/19/18 | 800 | 873 |
| 2 | YPF SA | 8.875% | 12/19/18 | 50 | 55 |
| | YPF SA | 8.500% | 3/23/21 | 1,000 | 1,097 |
| 1 | YPF SA | 8.750% | 4/4/24 | 1,145 | 1,257 |
| | YPF SA | 8.500% | 7/28/25 | 775 | 845 |
| Total Argentina (Cost $37,485) | | | | 40,290 |
12
| | | | |
| Emerging Markets Government Bond Index Fund | | | | |
| |
| |
| |
| | | | Face | Market |
| | | Maturity | Amount | Value• |
| | Coupon | Date | ($000) | ($000) |
| Armenia (0.1%) | | | | |
| Sovereign Bonds (U.S. Dollar-Denominated) (0.1%) | | | | |
| 2 Republic of Armenia | 6.000% | 9/30/20 | 200 | 207 |
| Republic of Armenia | 6.000% | 9/30/20 | 200 | 207 |
| Republic of Armenia | 7.150% | 3/26/25 | 500 | 528 |
| Total Armenia (Cost $897) | | | | 942 |
| Azerbaijan (0.5%) | | | | |
| Sovereign Bonds (U.S. Dollar-Denominated) (0.5%) | | | | |
| International Bank of Azerbaijan OJSC | 5.625% | 6/11/19 | 800 | 793 |
| 2 Republic of Azerbaijan | 4.750% | 3/18/24 | 400 | 413 |
| Republic of Azerbaijan | 4.750% | 3/18/24 | 800 | 826 |
| 3 Southern Gas Corridor CJSC | 6.875% | 3/24/26 | 1,150 | 1,295 |
| State Oil Co. of the Azerbaijan Republic | 4.750% | 3/13/23 | 1,700 | 1,693 |
| State Oil Co. of the Azerbaijan Republic | 6.950% | 3/18/30 | 200 | 217 |
| Total Azerbaijan (Cost $5,009) | | | | 5,237 |
| Bahrain (0.8%) | | | | |
| Sovereign Bonds (U.S. Dollar-Denominated) (0.8%) | | | | |
| Bahrain Mumtalakat Holding Co. BSC | 4.000% | 11/25/21 | 250 | 243 |
| Batelco International Finance No. 1 Ltd. | 4.250% | 5/1/20 | 400 | 400 |
| Kingdom of Bahrain | 6.273% | 11/22/18 | 550 | 583 |
| 2 Kingdom of Bahrain | 5.500% | 3/31/20 | 1,650 | 1,730 |
| Kingdom of Bahrain | 5.875% | 1/26/21 | 200 | 210 |
| 2 Kingdom of Bahrain | 6.125% | 7/5/22 | 1,400 | 1,481 |
| Kingdom of Bahrain | 6.125% | 8/1/23 | 425 | 448 |
| 2 Kingdom of Bahrain | 6.125% | 8/1/23 | 150 | 158 |
| 2 Kingdom of Bahrain | 7.000% | 1/26/26 | 1,000 | 1,064 |
| Kingdom of Bahrain | 7.000% | 1/26/26 | 1,050 | 1,116 |
| Kingdom of Bahrain | 7.000% | 10/12/28 | 1,000 | 1,030 |
| 2 Kingdom of Bahrain | 6.000% | 9/19/44 | 500 | 423 |
| Kingdom of Bahrain | 6.000% | 9/19/44 | 400 | 338 |
| Total Bahrain (Cost $9,145) | | | | 9,224 |
| Belarus (0.1%) | | | | |
| Sovereign Bond (U.S. Dollar-Denominated) (0.1%) | | | | |
| Republic of Belarus | 8.950% | 1/26/18 | 450 | 473 |
| Total Belarus (Cost $439) | | | | 473 |
| Belize (0.0%) | | | | |
| Sovereign Bond (U.S. Dollar-Denominated) (0.0%) | | | | |
| 1 Belize | 5.000% | 2/20/38 | 450 | 236 |
| Total Belize (Cost $289) | | | | 236 |
| Bermuda (0.1%) | | | | |
| Sovereign Bonds (U.S. Dollar-Denominated) (0.1%) | | | | |
| Bermuda | 4.854% | 2/6/24 | 400 | 437 |
| 2 Bermuda | 4.854% | 2/6/24 | 150 | 165 |
| 1 Bermuda | 3.717% | 1/25/27 | 850 | 851 |
| Total Bermuda (Cost $1,414) | | | | 1,453 |
13
| | | | |
| Emerging Markets Government Bond Index Fund | | | | |
| |
| |
| |
| | | | Face | Market |
| | | Maturity | Amount | Value• |
| | Coupon | Date | ($000) | ($000) |
| Bolivia (0.0%) | | | | |
| Sovereign Bonds (U.S. Dollar-Denominated) (0.0%) | | | | |
| Plurinational State of Bolivia | 4.875% | 10/29/22 | 200 | 222 |
| Plurinational State of Bolivia | 5.950% | 8/22/23 | 200 | 236 |
| Total Bolivia (Cost $396) | | | | 458 |
| Brazil (7.3%) | | | | |
| Sovereign Bonds (U.S. Dollar-Denominated) (7.3%) | | | | |
| Banco do Brasil SA | 6.000% | 1/22/20 | 500 | 537 |
| Banco do Brasil SA | 5.375% | 1/15/21 | 475 | 480 |
| Banco do Brasil SA | 5.875% | 1/26/22 | 1,675 | 1,675 |
| Banco do Brasil SA | 3.875% | 10/10/22 | 1,626 | 1,549 |
| Banco do Brasil SA | 5.875% | 1/19/23 | 450 | 442 |
| 1 Banco do Brasil SA | 8.500% | 10/29/49 | 1,350 | 1,385 |
| Banco Nacional de Desenvolvimento | | | | |
| Economico e Social | 6.369% | 6/16/18 | 925 | 976 |
| Banco Nacional de Desenvolvimento | | | | |
| Economico e Social | 6.500% | 6/10/19 | 750 | 810 |
| Banco Nacional de Desenvolvimento | | | | |
| Economico e Social | 5.500% | 7/12/20 | 400 | 419 |
| Banco Nacional de Desenvolvimento | | | | |
| Economico e Social | 5.750% | 9/26/23 | 1,300 | 1,357 |
| Caixa Economica Federal | 2.375% | 11/6/17 | 1,275 | 1,265 |
| Caixa Economica Federal | 4.500% | 10/3/18 | 860 | 872 |
| 2 Caixa Economica Federal | 4.500% | 10/3/18 | 200 | 203 |
| Caixa Economica Federal | 4.250% | 5/13/19 | 1,600 | 1,606 |
| Caixa Economica Federal | 3.500% | 11/7/22 | 150 | 138 |
| Centrais Eletricas Brasileiras SA | 6.875% | 7/30/19 | 800 | 840 |
| Centrais Eletricas Brasileiras SA | 5.750% | 10/27/21 | 1,700 | 1,697 |
| Federative Republic of Brazil | 5.875% | 1/15/19 | 2,220 | 2,403 |
| Federative Republic of Brazil | 8.875% | 10/14/19 | 175 | 207 |
| Federative Republic of Brazil | 4.875% | 1/22/21 | 3,406 | 3,602 |
| Federative Republic of Brazil | 2.625% | 1/5/23 | 3,136 | 2,901 |
| Federative Republic of Brazil | 8.875% | 4/15/24 | 707 | 904 |
| Federative Republic of Brazil | 4.250% | 1/7/25 | 3,872 | 3,828 |
| Federative Republic of Brazil | 8.750% | 2/4/25 | 350 | 449 |
| Federative Republic of Brazil | 6.000% | 4/7/26 | 900 | 992 |
| Federative Republic of Brazil | 10.125% | 5/15/27 | 916 | 1,337 |
| Federative Republic of Brazil | 8.250% | 1/20/34 | 1,725 | 2,176 |
| Federative Republic of Brazil | 7.125% | 1/20/37 | 2,240 | 2,559 |
| Federative Republic of Brazil | 5.625% | 1/7/41 | 2,626 | 2,534 |
| Federative Republic of Brazil | 5.000% | 1/27/45 | 4,161 | 3,682 |
| Federative Republic of Brazil | 5.625% | 2/21/47 | 200 | 192 |
| Petrobras Global Finance BV | 3.000% | 1/15/19 | 1,000 | 980 |
| Petrobras Global Finance BV | 4.875% | 3/17/20 | 1,925 | 1,942 |
| Petrobras Global Finance BV | 8.375% | 5/23/21 | 6,000 | 6,637 |
| Petrobras Global Finance BV | 4.375% | 5/20/23 | 4,000 | 3,620 |
| Petrobras Global Finance BV | 6.250% | 3/17/24 | 1,125 | 1,110 |
| Petrobras Global Finance BV | 8.750% | 5/23/26 | 3,400 | 3,829 |
| Petrobras Global Finance BV | 5.625% | 5/20/43 | 300 | 234 |
| Petrobras Global Finance BV | 7.250% | 3/17/44 | 110 | 101 |
| Petrobras Global Finance BV | 6.850% | 6/5/15 | 2,475 | 2,110 |
| Petrobras International Finance Co. SA | 7.875% | 3/15/19 | 2,900 | 3,118 |
14
| | | | |
| Emerging Markets Government Bond Index Fund | | | | |
| |
| |
| |
| | | | Face | Market |
| | | Maturity | Amount | Value• |
| | Coupon | Date | ($000) | ($000) |
| Petrobras International Finance Co. SA | 5.750% | 1/20/20 | 4,000 | 4,130 |
| Petrobras International Finance Co. SA | 5.375% | 1/27/21 | 3,755 | 3,703 |
| Petrobras International Finance Co. SA | 6.875% | 1/20/40 | 2,415 | 2,158 |
| Petrobras International Finance Co. SA | 6.750% | 1/27/41 | 3,127 | 2,763 |
| Total Brazil (Cost $76,212) | | | | 80,452 |
| Cameroon (0.1%) | | | | |
| Sovereign Bond (U.S. Dollar-Denominated) (0.1%) | | | | |
| 1 Republic of Cameroon | 9.500% | 11/19/25 | 500 | 556 |
| Total Cameroon (Cost $492) | | | | 556 |
| Chile (1.7%) | | | | |
| Sovereign Bonds (U.S. Dollar-Denominated) (1.7%) | | | | |
| 2 Banco del Estado de Chile | 2.000% | 11/9/17 | 385 | 386 |
| 2 Banco del Estado de Chile | 4.125% | 10/7/20 | 400 | 424 |
| 2 Banco del Estado de Chile | 3.875% | 2/8/22 | 625 | 666 |
| Corp Nacional del Cobre de Chile | 3.000% | 7/17/22 | 1,150 | 1,135 |
| 2 Corp. Nacional del Cobre de Chile | 7.500% | 1/15/19 | 800 | 895 |
| Corp. Nacional del Cobre de Chile | 3.750% | 11/4/20 | 1,359 | 1,430 |
| 2 Corp. Nacional del Cobre de Chile | 3.750% | 11/4/20 | 300 | 316 |
| 2 Corp. Nacional del Cobre de Chile | 3.875% | 11/3/21 | 800 | 831 |
| Corp. Nacional del Cobre de Chile | 3.875% | 11/3/21 | 854 | 886 |
| 2 Corp. Nacional del Cobre de Chile | 3.000% | 7/17/22 | 150 | 148 |
| 2 Corp. Nacional del Cobre de Chile | 4.500% | 8/13/23 | 150 | 159 |
| Corp. Nacional del Cobre de Chile | 4.500% | 8/13/23 | 675 | 715 |
| Corp. Nacional del Cobre de Chile | 4.500% | 9/16/25 | 900 | 935 |
| 2 Corp. Nacional del Cobre de Chile | 5.625% | 9/21/35 | 300 | 328 |
| 2 Corp. Nacional del Cobre de Chile | 6.150% | 10/24/36 | 100 | 115 |
| 2 Corp. Nacional del Cobre de Chile | 4.250% | 7/17/42 | 400 | 371 |
| 2 Corp. Nacional del Cobre de Chile | 5.625% | 10/18/43 | 200 | 220 |
| Corp. Nacional del Cobre de Chile | 5.625% | 10/18/43 | 900 | 987 |
| 2 Corp. Nacional del Cobre de Chile | 4.875% | 11/4/44 | 400 | 399 |
| Corp. Nacional del Cobre de Chile | 4.875% | 11/4/44 | 900 | 900 |
| 2 Empresa de Transporte de Pasajeros Metro SA | 4.750% | 2/4/24 | 200 | 219 |
| 2 Empresa Nacional del Petroleo | 4.750% | 12/6/21 | 536 | 573 |
| Empresa Nacional del Petroleo | 4.375% | 10/30/24 | 500 | 530 |
| Republic of Chile | 3.875% | 8/5/20 | 1,300 | 1,394 |
| Republic of Chile | 3.125% | 3/27/25 | 450 | 471 |
| Republic of Chile | 3.125% | 1/21/26 | 2,240 | 2,324 |
| Republic of Chile | 3.625% | 10/30/42 | 300 | 307 |
| Total Chile (Cost $17,382) | | | | 18,064 |
| China (14.0%) | | | | |
| Sovereign Bonds (U.S. Dollar-Denominated) (14.0%) | | | | |
| Agricultural Bank Of China | 2.000% | 5/21/18 | 1,550 | 1,553 |
| Agricultural Bank Of China | 2.750% | 5/21/20 | 250 | 255 |
| Agricultural Bank of China Ltd. | 2.250% | 12/9/17 | 500 | 502 |
| Agricultural Bank of China Ltd. | 2.875% | 12/10/18 | 500 | 510 |
| Agricultural Bank of China Ltd. | 2.750% | 10/20/20 | 200 | 204 |
| Amber Circle Funding Ltd. | 2.000% | 12/4/17 | 400 | 402 |
| Amber Circle Funding Ltd. | 3.250% | 12/4/22 | 1,200 | 1,249 |
| Amipeace Ltd. | 2.000% | 12/6/16 | 250 | 250 |
| Avi Funding Co Ltd. | 3.800% | 9/16/25 | 1,600 | 1,695 |
| Avi Funding Co. Ltd. | 2.850% | 9/16/20 | 300 | 306 |
| 2 Avi Funding Co. Ltd. | 2.850% | 9/16/20 | 400 | 408 |
15
| | | | |
| Emerging Markets Government Bond Index Fund | | | | |
| |
| |
| |
| | | | Face | Market |
| | | Maturity | Amount | Value• |
| | Coupon | Date | ($000) | ($000) |
| Bank of China Ltd. | 2.125% | 6/30/18 | 1,300 | 1,306 |
| Bank of China Ltd. | 3.125% | 1/23/19 | 200 | 205 |
| Bank of China Ltd. | 2.875% | 6/30/20 | 2,400 | 2,453 |
| Bank of China Ltd. | 2.375% | 3/1/21 | 750 | 751 |
| 2 Bank of China Ltd. | 5.000% | 11/13/24 | 1,000 | 1,075 |
| Bank of China Ltd. | 5.000% | 11/13/24 | 1,100 | 1,182 |
| Bank of China Ltd. | 3.875% | 6/30/25 | 1,000 | 1,057 |
| Bao-trans Enterprises Ltd. | 3.750% | 12/12/18 | 725 | 743 |
| Beijing State-Owned Assets Management | | | | |
| Hong Kong Co. Ltd. | 4.125% | 5/26/25 | 800 | 831 |
| Bluestar Finance Holdings Ltd. | 3.500% | 6/11/18 | 1,000 | 1,015 |
| Bluestar Finance Holdings Ltd. | 4.375% | 12/29/49 | 700 | 717 |
| BOC Aviation Ltd. | 2.875% | 10/10/17 | 500 | 505 |
| BOC Aviation Ltd. | 3.000% | 3/30/20 | 1,000 | 1,015 |
| 2 BOC Aviation Ltd. | 2.375% | 9/15/21 | 900 | 885 |
| BOC Aviation Ltd. | 4.375% | 5/2/23 | 200 | 215 |
| BOC Aviation Ltd. | 3.875% | 4/27/26 | 600 | 617 |
| CCBL Cayman 1 Corp. Ltd. | 2.750% | 5/31/21 | 250 | 252 |
| CCBL Cayman Corp. Ltd. | 3.250% | 7/28/20 | 300 | 308 |
| 1 CCCI Treasure Ltd. | 3.500% | 12/29/49 | 550 | 561 |
| Century Master Investment Co. Ltd. | 4.750% | 9/19/18 | 450 | 470 |
| CGNPC International Ltd. | 4.000% | 5/19/25 | 500 | 526 |
| Charming Light Investments Ltd. | 3.750% | 9/3/19 | 1,350 | 1,401 |
| China Cinda Finance 2014 Ltd. | 4.000% | 5/14/19 | 500 | 520 |
| China Cinda Finance 2014 Ltd. | 5.625% | 5/14/24 | 600 | 673 |
| China Cinda Finance 2015 I Ltd. | 3.125% | 4/23/20 | 2,000 | 2,035 |
| China Cinda Finance 2015 I Ltd. | 4.250% | 4/23/25 | 1,500 | 1,533 |
| China Clean Energy Development Ltd. | 4.000% | 11/5/25 | 1,000 | 1,048 |
| China Construction Bank Asia Corp. Ltd. | 3.250% | 7/2/19 | 700 | 724 |
| 1 China Construction Bank Asia Corp. Ltd. | 4.250% | 8/20/24 | 400 | 415 |
| 1 China Construction Bank Corp. | 3.875% | 5/13/25 | 1,900 | 1,945 |
| China Development Bank Corp. | 2.500% | 10/9/20 | 1,800 | 1,833 |
| China Development Bank Corp. | 2.125% | 6/1/21 | 2,850 | 2,864 |
| China Great Wall International Holdings II Ltd. | 2.500% | 6/18/18 | 1,200 | 1,207 |
| China Great Wall International Holdings Ltd. | 2.500% | 9/17/17 | 200 | 201 |
| 1 China Life Insurance Co. Ltd. | 4.000% | 7/3/75 | 1,000 | 1,006 |
| China Overseas Finance Cayman II Ltd. | 5.500% | 11/10/20 | 1,500 | 1,662 |
| China Overseas Finance Cayman III Ltd. | 5.375% | 10/29/23 | 1,500 | 1,695 |
| 2 China Resources Gas Group Ltd. | 4.500% | 4/5/22 | 400 | 434 |
| China Resources Land Ltd. | 4.375% | 2/27/19 | 950 | 998 |
| China Resources Land Ltd. | 6.000% | 2/27/24 | 400 | 467 |
| China Shenhua Overseas Capital Co. Ltd. | 2.500% | 1/20/18 | 600 | 603 |
| China Shenhua Overseas Capital Co. Ltd. | 3.125% | 1/20/20 | 650 | 666 |
| China Shenhua Overseas Capital Co. Ltd. | 3.875% | 1/20/25 | 400 | 421 |
| China Shipping Overseas Finance 2013 Ltd. | 4.250% | 1/28/19 | 500 | 520 |
| CITIC Ltd. | 6.875% | 1/21/18 | 200 | 212 |
| CITIC Ltd. | 6.375% | 4/10/20 | 2,200 | 2,485 |
| CITIC Ltd. | 6.625% | 4/15/21 | 200 | 234 |
| CITIC Ltd. | 2.800% | 12/14/21 | 300 | 303 |
| CITIC Ltd. | 6.800% | 1/17/23 | 1,700 | 2,055 |
| CITIC Ltd. | 3.700% | 6/14/26 | 500 | 513 |
| 1 CITIC Ltd. | 8.625% | 5/29/49 | 900 | 1,002 |
| CITIC Securities Finance 2013 Co. Ltd. | 2.500% | 5/3/18 | 400 | 402 |
| CITIC Securities Finance MTN Co. Ltd. | 3.500% | 10/30/19 | 1,200 | 1,239 |
| 2 CNOOC Curtis Funding No 1 Pty Ltd. | 4.500% | 10/3/23 | 300 | 328 |
| CNOOC Curtis Funding No 1 pty Ltd. | 4.500% | 10/3/23 | 1,920 | 2,089 |
16
| | | | | |
| Emerging Markets Government Bond Index Fund | | | | |
| |
| |
| |
| | | | | Face | Market |
| | | | Maturity | Amount | Value• |
| | | Coupon | Date | ($000) | ($000) |
| 2 | CNOOC Finance 2011 Ltd. | 4.250% | 1/26/21 | 1,888 | 2,023 |
| 2 | CNOOC Finance 2011 Ltd. | 5.750% | 1/26/41 | 200 | 246 |
| 2 | CNOOC Finance 2012 Ltd. | 3.875% | 5/2/22 | 1,200 | 1,275 |
| 2 | CNOOC Finance 2012 Ltd. | 5.000% | 5/2/42 | 200 | 223 |
| | CNOOC Finance 2013 Ltd. | 1.750% | 5/9/18 | 900 | 899 |
| | CNOOC Finance 2013 Ltd. | 3.000% | 5/9/23 | 850 | 849 |
| | CNOOC Finance 2013 Ltd. | 4.250% | 5/9/43 | 1,200 | 1,203 |
| | CNOOC Finance 2015 Australia Pty Ltd. | 2.625% | 5/5/20 | 1,650 | 1,675 |
| | CNOOC Finance 2015 USA LLC | 3.500% | 5/5/25 | 1,300 | 1,321 |
| | CNOOC Nexen Finance 2014 ULC | 4.250% | 4/30/24 | 2,310 | 2,474 |
| | CNOOC Nexen Finance 2014 ULC | 4.875% | 4/30/44 | 1,100 | 1,216 |
| 2 | CNPC General Capital Ltd. | 2.750% | 4/19/17 | 50 | 50 |
| 2,4 | CNPC General Capital Ltd. | 1.717% | 5/14/17 | 200 | 200 |
| | CNPC General Capital Ltd. | 1.950% | 4/16/18 | 850 | 851 |
| 2 | CNPC General Capital Ltd. | 2.750% | 5/14/19 | 200 | 203 |
| | CNPC General Capital Ltd. | 2.750% | 5/14/19 | 450 | 459 |
| | CNPC General Capital Ltd. | 2.700% | 11/25/19 | 1,400 | 1,431 |
| 2 | CNPC General Capital Ltd. | 3.950% | 4/19/22 | 700 | 748 |
| | CNPC General Capital Ltd. | 3.400% | 4/16/23 | 250 | 258 |
| 2 | CNPC HK Overseas Capital Ltd. | 4.500% | 4/28/21 | 725 | 790 |
| 2 | CNPC HK Overseas Capital Ltd. | 5.950% | 4/28/41 | 400 | 509 |
| | COSCO Finance 2011 Ltd. | 4.000% | 12/3/22 | 1,050 | 1,114 |
| 2 | COSL Finance BVI Ltd. | 3.250% | 9/6/22 | 550 | 554 |
| | COSL Singapore Capital Ltd. | 3.500% | 7/30/20 | 1,200 | 1,235 |
| 1 | CRCC Yupeng Ltd. | 3.950% | 2/28/49 | 300 | 309 |
| | CRCC Yuxiang Ltd. | 3.500% | 5/16/23 | 950 | 972 |
| 1 | Dianjian Haixing Ltd. | 4.050% | 10/29/49 | 200 | 206 |
| | Eastern Creation II Investment Holdings Ltd. | 2.625% | 11/20/17 | 400 | 403 |
| 2 | Export-Import Bank of China | 2.500% | 7/31/19 | 200 | 204 |
| | Export-Import Bank of China | 2.500% | 7/31/19 | 1,960 | 2,000 |
| | Export-Import Bank of China | 3.625% | 7/31/24 | 200 | 211 |
| | Export-Import Bank of China | 2.875% | 4/26/26 | 1,400 | 1,391 |
| | Franshion Brilliant Ltd. | 5.750% | 3/19/19 | 600 | 638 |
| 2 | Franshion Development Ltd. | 6.750% | 4/15/21 | 500 | 574 |
| | Franshion Investment Ltd. | 4.700% | 10/26/17 | 200 | 204 |
| | Huarong Finance Co. Ltd. | 4.000% | 7/17/19 | 700 | 728 |
| | Huarong Finance II Co. Ltd. | 3.500% | 1/16/18 | 550 | 558 |
| | Huarong Finance II Co. Ltd. | 2.875% | 11/19/18 | 1,800 | 1,820 |
| | Huarong Finance II Co. Ltd. | 4.500% | 1/16/20 | 1,650 | 1,737 |
| | Huarong Finance II Co. Ltd. | 3.750% | 11/19/20 | 550 | 570 |
| | Huarong Finance II Co. Ltd. | 5.500% | 1/16/25 | 1,300 | 1,436 |
| | Huarong Finance II Co. Ltd. | 5.000% | 11/19/25 | 600 | 646 |
| | Huarong Finance II Co. Ltd. | 4.625% | 6/3/26 | 1,250 | 1,317 |
| 2 | ICBCIL Finance Co. Ltd. | 2.375% | 5/19/19 | 700 | 701 |
| | ICBCIL Finance Co. Ltd. | 3.250% | 3/17/20 | 800 | 817 |
| | ICBCIL Finance Co. Ltd. | 3.200% | 11/10/20 | 700 | 716 |
| 2 | ICBCIL Finance Co. Ltd. | 2.750% | 5/19/21 | 600 | 603 |
| | Industrial & Commercial Bank of China Asia Ltd. | 5.125% | 11/30/20 | 750 | 819 |
| | Industrial & Commercial Bank of China Ltd. | 2.500% | 11/21/17 | 600 | 604 |
| | Industrial & Commercial Bank of China Ltd. | 4.875% | 9/21/25 | 1,750 | 1,876 |
| | Industrial & Commercial Bank of China Ltd. | 2.351% | 11/13/17 | 1,250 | 1,256 |
| | Industrial & Commercial Bank of China Ltd. | 2.000% | 5/10/19 | 1,300 | 1,300 |
| | Industrial & Commercial Bank of China Ltd. | 3.231% | 11/13/19 | 1,300 | 1,346 |
| | Industrial & Commercial Bank of China Ltd. | 2.905% | 11/13/20 | 550 | 561 |
| | Industrial & Commercial Bank of China Ltd. | 2.635% | 5/26/21 | 1,450 | 1,464 |
| | King Power Capital Ltd. | 5.625% | 11/3/24 | 500 | 563 |
17
| | | | | |
| Emerging Markets Government Bond Index Fund | | | | |
| |
| |
| |
| | | | | Face | Market |
| | | | Maturity | Amount | Value• |
| | | Coupon | Date | ($000) | ($000) |
| | Kunlun Energy Co. Ltd. | 2.875% | 5/13/20 | 600 | 610 |
| | Kunlun Energy Co. Ltd. | 3.750% | 5/13/25 | 350 | 362 |
| | MCC Holding Hong Kong Corp. Ltd. | 2.500% | 8/28/17 | 400 | 401 |
| | Minmetals Bounteous Finance BVI Ltd. | 3.500% | 7/30/20 | 300 | 307 |
| | Minmetals Bounteous Finance BVI Ltd. | 4.750% | 7/30/25 | 600 | 637 |
| | Nexen Energy ULC | 7.875% | 3/15/32 | 200 | 280 |
| | Nexen Energy ULC | 5.875% | 3/10/35 | 808 | 960 |
| | Nexen Energy ULC | 6.400% | 5/15/37 | 820 | 1,042 |
| | Nexen Energy ULC | 7.500% | 7/30/39 | 300 | 428 |
| | Prosperous Ray Ltd. | 3.000% | 11/12/18 | 400 | 408 |
| | Prosperous Ray Ltd. | 4.625% | 11/12/23 | 550 | 604 |
| | Shanghai Electric Group Global Investment Ltd. | 3.000% | 8/14/19 | 500 | 511 |
| | Shanghai Electric Power Finance Ltd. | 3.625% | 8/11/20 | 1,100 | 1,142 |
| | Sino-Ocean Land Treasure Finance I Ltd. | 4.625% | 7/30/19 | 1,100 | 1,145 |
| | Sino-Ocean Land Treasure Finance I Ltd. | 6.000% | 7/30/24 | 350 | 379 |
| | Sino-Ocean Land Treasure Finance II Ltd. | 4.450% | 2/4/20 | 400 | 414 |
| | Sino-Ocean Land Treasure Finance II Ltd. | 5.950% | 2/4/27 | 250 | 270 |
| 1,2 | Sinochem Global Capital Co. Ltd. | 5.000% | 12/29/49 | 200 | 207 |
| 2 | Sinochem Offshore Capital Co. Ltd. | 3.250% | 4/29/19 | 200 | 205 |
| | Sinochem Offshore Capital Co. Ltd. | 3.250% | 4/29/19 | 700 | 718 |
| 2 | Sinochem Overseas Capital Co. Ltd. | 4.500% | 11/12/20 | 1,375 | 1,475 |
| 2 | Sinochem Overseas Capital Co. Ltd. | 6.300% | 11/12/40 | 450 | 581 |
| | Sinopec Capital 2013 Ltd. | 1.875% | 4/24/18 | 800 | 801 |
| | Sinopec Capital 2013 Ltd. | 3.125% | 4/24/23 | 1,200 | 1,210 |
| 2 | Sinopec Capital 2013 Ltd. | 3.125% | 4/24/23 | 400 | 406 |
| | Sinopec Capital 2013 Ltd. | 4.250% | 4/24/43 | 200 | 204 |
| | Sinopec Group Overseas Development 2012 Ltd. | 3.900% | 5/17/22 | 707 | 754 |
| 2 | Sinopec Group Overseas Development 2012 Ltd. | 3.900% | 5/17/22 | 1,619 | 1,727 |
| 2 | Sinopec Group Overseas Development 2012 Ltd. | 4.875% | 5/17/42 | 775 | 864 |
| | Sinopec Group Overseas Development 2013 Ltd. | 2.500% | 10/17/18 | 300 | 304 |
| | Sinopec Group Overseas Development 2013 Ltd. | 4.375% | 10/17/23 | 1,625 | 1,775 |
| | Sinopec Group Overseas Development 2013 Ltd. | 5.375% | 10/17/43 | 200 | 240 |
| 2 | Sinopec Group Overseas Development 2014 Ltd. | 2.750% | 4/10/19 | 400 | 408 |
| | Sinopec Group Overseas Development 2014 Ltd. | 2.750% | 4/10/19 | 700 | 713 |
| | Sinopec Group Overseas Development 2014 Ltd. | 4.375% | 4/10/24 | 2,000 | 2,181 |
| | Sinopec Group Overseas Development 2015 Ltd. | 2.500% | 4/28/20 | 4,300 | 4,366 |
| | Sinopec Group Overseas Development 2015 Ltd. | 3.250% | 4/28/25 | 1,700 | 1,710 |
| | Sinopec Group Overseas Development 2015 Ltd. | 4.100% | 4/28/45 | 800 | 804 |
| | Sinopec Group Overseas Development 2016 Ltd. | 3.500% | 5/3/26 | 1,000 | 1,024 |
| | Skysea International Capital Management | 4.875% | 12/7/21 | 400 | 445 |
| | State Elite Global Ltd. | 3.125% | 1/20/20 | 1,000 | 1,024 |
| 2 | State Grid Overseas Investment 2013 Ltd. | 1.750% | 5/22/18 | 200 | 199 |
| | State Grid Overseas Investment 2013 Ltd. | 3.125% | 5/22/23 | 1,410 | 1,457 |
| 2 | State Grid Overseas Investment 2013 Ltd. | 4.375% | 5/22/43 | 200 | 222 |
| 2 | State Grid Overseas Investment 2014 Ltd. | 2.750% | 5/7/19 | 700 | 716 |
| | State Grid Overseas Investment 2014 Ltd. | 2.750% | 5/7/19 | 1,370 | 1,403 |
| | State Grid Overseas Investment 2014 Ltd. | 4.125% | 5/7/24 | 1,470 | 1,597 |
| 2 | State Grid Overseas Investment 2014 Ltd. | 4.850% | 5/7/44 | 350 | 417 |
| | State Grid Overseas Investment 2014 Ltd. | 4.850% | 5/7/44 | 200 | 238 |
| | State Grid Overseas Investment 2016 Ltd. | 2.875% | 5/18/26 | 700 | 697 |
| | Three Gorges Finance I Cayman Islands Ltd. | 2.300% | 6/2/21 | 400 | 401 |
| | Three Gorges Finance I Cayman Islands Ltd. | 3.700% | 6/10/25 | 700 | 737 |
| | Three Gorges Finance I Cayman Islands Ltd. | 3.150% | 6/2/26 | 1,200 | 1,209 |
| Total China (Cost $149,991) | | | | 153,451 |
18
| | | | |
| Emerging Markets Government Bond Index Fund | | | | |
| |
| |
| |
| | | | Face | Market |
| | | Maturity | Amount | Value• |
| | Coupon | Date | ($000) | ($000) |
| Colombia (2.8%) | | | | |
| Sovereign Bonds (U.S. Dollar-Denominated) (2.8%) | | | | |
| Ecopetrol SA | 7.625% | 7/23/19 | 725 | 825 |
| Ecopetrol SA | 5.875% | 9/18/23 | 1,490 | 1,598 |
| Ecopetrol SA | 4.125% | 1/16/25 | 1,275 | 1,216 |
| Ecopetrol SA | 5.375% | 6/26/26 | 2,000 | 2,025 |
| Ecopetrol SA | 7.375% | 9/18/43 | 1,200 | 1,230 |
| Ecopetrol SA | 5.875% | 5/28/45 | 1,500 | 1,327 |
| Empresa de Energia de Bogota SA ESP | 6.125% | 11/10/21 | 1,100 | 1,131 |
| Empresas Publicas de Medellin ESP | 7.625% | 7/29/19 | 300 | 340 |
| Oleoducto Central SA | 4.000% | 5/7/21 | 400 | 408 |
| Republic of Colombia | 7.375% | 3/18/19 | 1,485 | 1,674 |
| Republic of Colombia | 11.750% | 2/25/20 | 550 | 717 |
| Republic of Colombia | 4.375% | 7/12/21 | 2,134 | 2,273 |
| 1 Republic of Colombia | 2.625% | 3/15/23 | 960 | 929 |
| Republic of Colombia | 4.000% | 2/26/24 | 2,195 | 2,283 |
| Republic of Colombia | 8.125% | 5/21/24 | 540 | 699 |
| 1 Republic of Colombia | 4.500% | 1/28/26 | 1,400 | 1,500 |
| Republic of Colombia | 7.375% | 9/18/37 | 1,550 | 1,999 |
| Republic of Colombia | 6.125% | 1/18/41 | 2,207 | 2,549 |
| 1 Republic of Colombia | 5.625% | 2/26/44 | 2,134 | 2,348 |
| 1 Republic of Colombia | 5.000% | 6/15/45 | 2,700 | 2,761 |
| Transportadora de Gas Internacional SA ESP | 5.700% | 3/20/22 | 600 | 619 |
| Total Colombia (Cost $29,521) | | | | 30,451 |
| Costa Rica (0.6%) | | | | |
| Sovereign Bonds (U.S. Dollar-Denominated) (0.6%) | | | | |
| Banco de Costa Rica | 5.250% | 8/12/18 | 250 | 255 |
| Banco Nacional de Costa Rica | 4.875% | 11/1/18 | 400 | 407 |
| 2 Banco Nacional de Costa Rica | 4.875% | 11/1/18 | 200 | 204 |
| 2 Banco Nacional de Costa Rica | 5.875% | 4/25/21 | 1,000 | 1,039 |
| Banco Nacional de Costa Rica | 6.250% | 11/1/23 | 200 | 208 |
| Instituto Costarricense de Electricidad | 6.950% | 11/10/21 | 475 | 507 |
| Instituto Costarricense de Electricidad | 6.375% | 5/15/43 | 200 | 173 |
| Republic of Costa Rica | 4.250% | 1/26/23 | 1,132 | 1,091 |
| Republic of Costa Rica | 5.625% | 4/30/43 | 1,200 | 1,068 |
| Republic of Costa Rica | 7.000% | 4/4/44 | 800 | 830 |
| Republic of Costa Rica | 7.158% | 3/12/45 | 800 | 838 |
| Total Costa Rica (Cost $6,316) | | | | 6,620 |
| Cote d’Ivoire (0.4%) | | | | |
| Sovereign Bonds (U.S. Dollar-Denominated) (0.4%) | | | | |
| Republic of Cote d’Ivoire | 5.375% | 7/23/24 | 950 | 958 |
| 1 Republic of Cote d’Ivoire | 6.375% | 3/3/28 | 900 | 938 |
| 1 Republic of Cote d’Ivoire | 5.750% | 12/31/32 | 2,272 | 2,228 |
| Total Cote d’Ivoire (Cost $3,910) | | | | 4,124 |
| Croatia (0.8%) | | | | |
| Sovereign Bonds (U.S. Dollar-Denominated) (0.8%) | | | | |
| Hrvatska Elektroprivreda | 5.875% | 10/23/22 | 500 | 544 |
| Republic of Croatia | 6.750% | 11/5/19 | 1,922 | 2,107 |
| Republic of Croatia | 6.625% | 7/14/20 | 1,294 | 1,433 |
19
| | | | | |
| Emerging Markets Government Bond Index Fund | | | | |
| |
| |
| |
| | | | | Face | Market |
| | | | Maturity | Amount | Value• |
| | | Coupon | Date | ($000) | ($000) |
| | Republic of Croatia | 6.375% | 3/24/21 | 1,600 | 1,777 |
| | Republic of Croatia | 5.500% | 4/4/23 | 700 | 764 |
| | Republic of Croatia | 6.000% | 1/26/24 | 1,935 | 2,182 |
| Total Croatia (Cost $8,416) | | | | 8,807 |
| Dominican Republic (0.9%) | | | | |
| Sovereign Bonds (U.S. Dollar-Denominated) (0.9%) | | | | |
| 1 | Dominican Republic | 7.500% | 5/6/21 | 1,352 | 1,489 |
| | Dominican Republic | 6.600% | 1/28/24 | 450 | 490 |
| 1 | Dominican Republic | 5.875% | 4/18/24 | 350 | 363 |
| | Dominican Republic | 5.500% | 1/27/25 | 1,760 | 1,788 |
| | Dominican Republic | 6.875% | 1/29/26 | 2,100 | 2,314 |
| | Dominican Republic | 7.450% | 4/30/44 | 450 | 500 |
| 2 | Dominican Republic | 6.850% | 1/27/45 | 1,000 | 1,050 |
| 1 | Dominican Republic | 6.850% | 1/27/45 | 1,444 | 1,506 |
| Total Dominican Republic (Cost $9,277) | | | | 9,500 |
| Ecuador (0.5%) | | | | |
| Sovereign Bonds (U.S. Dollar-Denominated) (0.5%) | | | | |
| | Republic of Ecuador | 10.500% | 3/24/20 | 1,300 | 1,373 |
| | Republic of Ecuador | 10.750% | 3/28/22 | 1,900 | 2,012 |
| | Republic of Ecuador | 7.950% | 6/20/24 | 1,950 | 1,845 |
| Total Ecuador (Cost $4,971) | | | | 5,230 |
| Egypt (0.3%) | | | | |
| Sovereign Bonds (U.S. Dollar-Denominated) (0.3%) | | | | |
| | African Export-Import Bank | 3.875% | 6/4/18 | 450 | 456 |
| | African Export-Import Bank | 4.750% | 7/29/19 | 400 | 417 |
| | Arab Republic of Egypt | 5.750% | 4/29/20 | 812 | 828 |
| | Arab Republic of Egypt | 5.875% | 6/11/25 | 1,650 | 1,524 |
| | Arab Republic of Egypt | 6.875% | 4/30/40 | 300 | 273 |
| Total Egypt (Cost $3,590) | | | | 3,498 |
| El Salvador (0.5%) | | | | |
| Sovereign Bonds (U.S. Dollar-Denominated) (0.5%) | | | | |
| | Republic of El Salvador | 7.375% | 12/1/19 | 345 | 364 |
| | Republic of El Salvador | 7.750% | 1/24/23 | 1,035 | 1,131 |
| | Republic of El Salvador | 5.875% | 1/30/25 | 300 | 298 |
| 2 | Republic of El Salvador | 6.375% | 1/18/27 | 300 | 300 |
| | Republic of El Salvador | 6.375% | 1/18/27 | 400 | 399 |
| | Republic of El Salvador | 8.250% | 4/10/32 | 604 | 659 |
| | Republic of El Salvador | 7.650% | 6/15/35 | 1,390 | 1,444 |
| | Republic of El Salvador | 7.625% | 2/1/41 | 608 | 624 |
| Total El Salvador (Cost $4,975) | | | | 5,219 |
| Ethiopia (0.1%) | | | | |
| Sovereign Bond (U.S. Dollar-Denominated) (0.1%) | | �� | | |
| | Republic of Ethiopia | 6.625% | 12/11/24 | 1,150 | 1,089 |
| Total Ethiopia (Cost $1,113) | | | | 1,089 |
| Gabon (0.2%) | | | | |
| Sovereign Bonds (U.S. Dollar-Denominated) (0.2%) | | | | |
| 1 | Gabonese Republic | 6.375% | 12/12/24 | 1,261 | 1,156 |
| 1,2 | Gabonese Republic | 6.375% | 12/12/24 | 400 | 366 |
| | Gabonese Republic | 6.950% | 6/16/25 | 200 | 184 |
| Total Gabon (Cost $1,788) | | | | 1,706 |
20
| | | | | |
| Emerging Markets Government Bond Index Fund | | | | |
| |
| |
| |
| | | | | Face | Market |
| | | | Maturity | Amount | Value• |
| | | Coupon | Date | ($000) | ($000) |
| Georgia (0.1%) | | | | |
| Sovereign Bonds (U.S. Dollar-Denominated) (0.1%) | | | | |
| | Georgian Railway JSC | 7.750% | 7/11/22 | 700 | 782 |
| | Republic of Georgia | 6.875% | 4/12/21 | 700 | 780 |
| Total Georgia (Cost $1,537) | | | | 1,562 |
| Ghana (0.3%) | | | | |
| Sovereign Bonds (U.S. Dollar-Denominated) (0.3%) | | | | |
| | Republic of Ghana | 8.500% | 10/4/17 | 300 | 311 |
| 1 | Republic of Ghana | 9.250% | 9/15/22 | 300 | 311 |
| | Republic of Ghana | 7.875% | 8/7/23 | 200 | 191 |
| 2 | Republic of Ghana | 7.875% | 8/7/23 | 600 | 574 |
| 1,2 | Republic of Ghana | 8.125% | 1/18/26 | 300 | 288 |
| 1 | Republic of Ghana | 8.125% | 1/18/26 | 750 | 718 |
| 1 | Republic of Ghana | 10.750% | 10/14/30 | 1,000 | 1,177 |
| Total Ghana (Cost $3,355) | | | | 3,570 |
| Guatemala (0.2%) | | | | |
| Sovereign Bonds (U.S. Dollar-Denominated) (0.2%) | | | | |
| | Republic of Guatemala | 5.750% | 6/6/22 | 700 | 774 |
| | Republic of Guatemala | 4.500% | 5/3/26 | 1,000 | 1,020 |
| | Republic of Guatemala | 4.875% | 2/13/28 | 600 | 631 |
| Total Guatemala (Cost $2,334) | | | | 2,425 |
| Honduras (0.1%) | | | | |
| Sovereign Bonds (U.S. Dollar-Denominated) (0.1%) | | | | |
| | Republic of Honduras | 8.750% | 12/16/20 | 700 | 793 |
| 1 | Republic of Honduras | 7.500% | 3/15/24 | 200 | 222 |
| Total Honduras (Cost $950) | | | | 1,015 |
| Hungary (1.5%) | | | | |
| Sovereign Bonds (U.S. Dollar-Denominated) (1.5%) | | | | |
| 5 | Magyar Export-Import Bank Zrt | 5.500% | 2/12/18 | 750 | 784 |
| 2,5 | MFB Magyar Fejlesztesi Bank Zrt | 6.250% | 10/21/20 | 900 | 1,014 |
| | MFB Magyar Fejlesztesi Bank Zrt | 6.250% | 10/21/20 | 200 | 225 |
| | Republic of Hungary | 4.125% | 2/19/18 | 1,150 | 1,184 |
| | Republic of Hungary | 4.000% | 3/25/19 | 500 | 523 |
| | Republic of Hungary | 6.250% | 1/29/20 | 1,315 | 1,471 |
| | Republic of Hungary | 6.375% | 3/29/21 | 3,672 | 4,237 |
| | Republic of Hungary | 5.375% | 2/21/23 | 2,162 | 2,448 |
| | Republic of Hungary | 5.750% | 11/22/23 | 1,570 | 1,829 |
| | Republic of Hungary | 5.375% | 3/25/24 | 1,025 | 1,179 |
| | Republic of Hungary | 7.625% | 3/29/41 | 1,050 | 1,592 |
| Total Hungary (Cost $15,601) | | | | 16,486 |
| India (1.8%) | | | | |
| Sovereign Bonds (U.S. Dollar-Denominated) (1.8%) | | | | |
| | Bank of Baroda | 4.875% | 7/23/19 | 975 | 1,033 |
| | Bank of India | 3.625% | 9/21/18 | 350 | 356 |
| | Bank of India | 3.125% | 5/6/20 | 400 | 400 |
| | Bank of India | 6.250% | 2/16/21 | 900 | 1,006 |
| | Bharat Petroleum Corp. Ltd. | 4.625% | 10/25/22 | 400 | 433 |
| | Bharat Petroleum Corp. Ltd. | 4.000% | 5/8/25 | 400 | 410 |
| | Canara Bank | 5.250% | 10/18/18 | 600 | 632 |
| | Export-Import Bank of India | 3.875% | 10/2/19 | 1,500 | 1,567 |
21
| | | | |
| Emerging Markets Government Bond Index Fund | | | | |
| |
| |
| |
| | | | Face | Market |
| | | Maturity | Amount | Value• |
| | Coupon | Date | ($000) | ($000) |
| Export-Import Bank of India | 2.750% | 4/1/20 | 1,000 | 1,011 |
| Export-Import Bank of India | 4.000% | 1/14/23 | 400 | 420 |
| Export-Import Bank of India | 3.375% | 8/5/26 | 850 | 845 |
| IDBI Bank Ltd. | 4.375% | 3/26/18 | 400 | 408 |
| IDBI Bank Ltd. | 3.750% | 1/25/19 | 600 | 610 |
| Indian Oil Corp. Ltd. | 5.625% | 8/2/21 | 500 | 559 |
| Indian Oil Corp. Ltd. | 5.750% | 8/1/23 | 400 | 456 |
| Indian Overseas Bank | 4.625% | 2/21/18 | 400 | 408 |
| Indian Railway Finance Corp. Ltd. | 3.917% | 2/26/19 | 600 | 625 |
| NTPC Ltd. | 5.625% | 7/14/21 | 400 | 450 |
| NTPC Ltd. | 4.750% | 10/3/22 | 450 | 493 |
| NTPC Ltd. | 4.375% | 11/26/24 | 400 | 426 |
| Oil India Ltd. | 3.875% | 4/17/19 | 600 | 621 |
| Oil India Ltd. | 5.375% | 4/17/24 | 250 | 275 |
| ONGC Videsh Ltd. | 3.250% | 7/15/19 | 900 | 922 |
| ONGC Videsh Ltd. | 3.750% | 5/7/23 | 700 | 717 |
| ONGC Videsh Ltd. | 4.625% | 7/15/24 | 700 | 749 |
| Power Grid Corp. of India Ltd. | 3.875% | 1/17/23 | 600 | 622 |
| State Bank of India | 3.250% | 4/18/18 | 1,300 | 1,321 |
| State Bank of India | 3.622% | 4/17/19 | 1,300 | 1,341 |
| 2 State Bank of India | 4.875% | 4/17/24 | 400 | 442 |
| Syndicate Bank | 4.125% | 4/12/18 | 400 | 407 |
| Total India (Cost $19,530) | | | | 19,965 |
| Indonesia (5.6%) | | | | |
| Sovereign Bonds (U.S. Dollar-Denominated) (5.6%) | | | | |
| Majapahit Holding BV | 8.000% | 8/7/19 | 350 | 400 |
| Majapahit Holding BV | 7.750% | 1/20/20 | 1,925 | 2,204 |
| Majapahit Holding BV | 7.875% | 6/29/37 | 400 | 516 |
| 2 Pelabuhan Indonesia II PT | 4.250% | 5/5/25 | 600 | 602 |
| Pelabuhan Indonesia II PT | 4.250% | 5/5/25 | 950 | 952 |
| Pelabuhan Indonesia II PT | 5.375% | 5/5/45 | 500 | 496 |
| 2 Pelabuhan Indonesia III PT | 4.875% | 10/1/24 | 200 | 209 |
| Pertamina Persero PT | 5.250% | 5/23/21 | 450 | 486 |
| Pertamina Persero PT | 4.875% | 5/3/22 | 2,750 | 2,924 |
| Pertamina Persero PT | 4.300% | 5/20/23 | 900 | 933 |
| 2 Pertamina Persero PT | 4.300% | 5/20/23 | 430 | 446 |
| Pertamina Persero PT | 6.500% | 5/27/41 | 200 | 224 |
| Pertamina Persero PT | 6.000% | 5/3/42 | 1,450 | 1,521 |
| 2 Pertamina Persero PT | 6.000% | 5/3/42 | 750 | 788 |
| Pertamina Persero PT | 5.625% | 5/20/43 | 625 | 625 |
| 2 Pertamina Persero PT | 5.625% | 5/20/43 | 200 | 200 |
| Pertamina Persero PT | 6.450% | 5/30/44 | 1,100 | 1,237 |
| Perusahaan Gas Negara Persero Tbk | 5.125% | 5/16/24 | 800 | 854 |
| 2 Perusahaan Gas Negara Persero Tbk PT | 5.125% | 5/16/24 | 400 | 424 |
| Perusahaan Listrik Negara PT | 5.500% | 11/22/21 | 950 | 1,053 |
| Perusahaan Listrik Negara PT | 5.250% | 10/24/42 | 500 | 497 |
| 2 Perusahaan Listrik Negara PT | 5.250% | 10/24/42 | 300 | 298 |
| Perusahaan Penerbit SBSN Indonesia II | 4.000% | 11/21/18 | 600 | 625 |
| 2 Perusahaan Penerbit SBSN Indonesia III | 6.125% | 3/15/19 | 200 | 219 |
| Perusahaan Penerbit SBSN Indonesia III | 6.125% | 3/15/19 | 600 | 656 |
| Perusahaan Penerbit SBSN Indonesia III | 3.300% | 11/21/22 | 1,178 | 1,199 |
| 2 Perusahaan Penerbit SBSN Indonesia III | 4.350% | 9/10/24 | 600 | 632 |
| Perusahaan Penerbit SBSN Indonesia III | 4.350% | 9/10/24 | 2,250 | 2,371 |
| 6 Perusahaan Penerbit SBSN Indonesia III | 4.325% | 5/28/25 | 1,200 | 1,255 |
22
| | | | |
| Emerging Markets Government Bond Index Fund | | | | |
| |
| |
| |
| | | | Face | Market |
| | | Maturity | Amount | Value• |
| | Coupon | Date | ($000) | ($000) |
| Perusahaan Penerbit SBSN Indonesia III | 4.550% | 3/29/26 | 1,050 | 1,106 |
| Republic of Indonesia | 6.875% | 1/17/18 | 1,957 | 2,073 |
| Republic of Indonesia | 11.625% | 3/4/19 | 2,386 | 2,898 |
| Republic of Indonesia | 5.875% | 3/13/20 | 810 | 901 |
| 2 Republic of Indonesia | 5.875% | 3/13/20 | 350 | 389 |
| Republic of Indonesia | 4.875% | 5/5/21 | 2,300 | 2,500 |
| Republic of Indonesia | 3.750% | 4/25/22 | 950 | 984 |
| Republic of Indonesia | 3.375% | 4/15/23 | 1,100 | 1,111 |
| Republic of Indonesia | 5.375% | 10/17/23 | 1,109 | 1,252 |
| Republic of Indonesia | 5.875% | 1/15/24 | 1,400 | 1,625 |
| 2 Republic of Indonesia | 4.125% | 1/15/25 | 200 | 210 |
| Republic of Indonesia | 4.125% | 1/15/25 | 1,300 | 1,363 |
| Republic of Indonesia | 4.750% | 1/8/26 | 3,800 | 4,141 |
| Republic of Indonesia | 8.500% | 10/12/35 | 1,685 | 2,491 |
| Republic of Indonesia | 6.625% | 2/17/37 | 1,267 | 1,594 |
| Republic of Indonesia | 7.750% | 1/17/38 | 1,863 | 2,612 |
| Republic of Indonesia | 5.250% | 1/17/42 | 1,500 | 1,646 |
| Republic of Indonesia | 4.625% | 4/15/43 | 2,175 | 2,240 |
| Republic of Indonesia | 6.750% | 1/15/44 | 1,850 | 2,439 |
| 2 Republic of Indonesia | 6.750% | 1/15/44 | 100 | 132 |
| Republic of Indonesia | 5.125% | 1/15/45 | 3,069 | 3,342 |
| Total Indonesia (Cost $58,231) | | | | 61,895 |
| Iraq (0.2%) | | | | |
| Sovereign Bond (U.S. Dollar-Denominated) (0.2%) | | | | |
| 1 Republic of Iraq | 5.800% | 1/15/28 | 2,460 | 1,979 |
| Total Iraq (Cost $1,981) | | | | 1,979 |
| Jamaica (0.4%) | | | | |
| Sovereign Bonds (U.S. Dollar-Denominated) (0.4%) | | | | |
| 1 Jamaica | 7.625% | 7/9/25 | 450 | 527 |
| Jamaica | 6.750% | 4/28/28 | 1,800 | 2,034 |
| 1 Jamaica | 8.000% | 3/15/39 | 848 | 996 |
| Jamaica | 7.875% | 7/28/45 | 600 | 691 |
| Total Jamaica (Cost $3,861) | | | | 4,248 |
| Jordan (0.1%) | | | | |
| Sovereign Bonds (U.S. Dollar-Denominated) (0.1%) | | | | |
| The Hashemite Kingdom of Jordan | 6.125% | 1/29/26 | 350 | 367 |
| The Hashemite Kingdom of Jordan | 5.750% | 1/31/27 | 1,000 | 993 |
| Total Jordan (Cost $1,353) | | | | 1,360 |
| Kazakhstan (1.5%) | | | | |
| Sovereign Bonds (U.S. Dollar-Denominated) (1.5%) | | | | |
| Development Bank of Kazakhstan JSC | 4.125% | 12/10/22 | 2,050 | 2,000 |
| KazAgro National Management Holding JSC | 4.625% | 5/24/23 | 850 | 795 |
| 2 Kazakhstan Temir Zholy Finance BV | 6.375% | 10/6/20 | 600 | 643 |
| Kazakhstan Temir Zholy Finance BV | 6.950% | 7/10/42 | 1,100 | 1,133 |
| KazMunayGas National Co. JSC | 9.125% | 7/2/18 | 1,425 | 1,561 |
| KazMunayGas National Co. JSC | 7.000% | 5/5/20 | 1,570 | 1,742 |
| KazMunayGas National Co. JSC | 6.375% | 4/9/21 | 1,029 | 1,127 |
| KazMunayGas National Co. JSC | 5.750% | 4/30/43 | 350 | 352 |
| Republic of Kazakhstan | 3.875% | 10/14/24 | 2,900 | 2,998 |
| Republic of Kazakhstan | 5.125% | 7/21/25 | 1,900 | 2,107 |
23
| | | | |
| Emerging Markets Government Bond Index Fund | | | | |
| |
| |
| |
| | | | Face | Market |
| | | Maturity | Amount | Value• |
| | Coupon | Date | ($000) | ($000) |
| 2 Republic of Kazakhstan | 4.875% | 10/14/44 | 400 | 404 |
| Republic of Kazakhstan | 4.875% | 10/14/44 | 300 | 303 |
| Republic of Kazakhstan | 6.500% | 7/21/45 | 800 | 957 |
| Total Kazakhstan (Cost $15,141) | | | | 16,122 |
| Kenya (0.2%) | | | | |
| Sovereign Bonds (U.S. Dollar-Denominated) (0.2%) | | | | |
| Republic of Kenya | 5.875% | 6/24/19 | 300 | 310 |
| 2 Republic of Kenya | 5.875% | 6/24/19 | 200 | 207 |
| Republic of Kenya | 6.875% | 6/24/24 | 1,925 | 1,921 |
| 2 Republic of Kenya | 6.875% | 6/24/24 | 200 | 199 |
| Total Kenya (Cost $2,595) | | | | 2,637 |
| Lebanon (1.7%) | | | | |
| Sovereign Bonds (U.S. Dollar-Denominated) (1.7%) | | | | |
| Republic of Lebanon | 5.150% | 6/12/18 | 150 | 148 |
| Republic of Lebanon | 5.150% | 11/12/18 | 1,275 | 1,256 |
| Republic of Lebanon | 5.500% | 4/23/19 | 50 | 49 |
| Republic of Lebanon | 6.000% | 5/20/19 | 450 | 448 |
| Republic of Lebanon | 5.450% | 11/28/19 | 925 | 910 |
| Republic of Lebanon | 6.375% | 3/9/20 | 2,541 | 2,553 |
| Republic of Lebanon | 5.800% | 4/14/20 | 100 | 99 |
| Republic of Lebanon | 8.250% | 4/12/21 | 2,378 | 2,547 |
| Republic of Lebanon | 6.100% | 10/4/22 | 1,914 | 1,871 |
| Republic of Lebanon | 6.000% | 1/27/23 | 1,335 | 1,292 |
| Republic of Lebanon | 6.650% | 4/22/24 | 1,391 | 1,374 |
| Republic of Lebanon | 6.200% | 2/26/25 | 100 | 96 |
| Republic of Lebanon | 6.250% | 6/12/25 | 400 | 383 |
| Republic of Lebanon | 6.600% | 11/27/26 | 1,700 | 1,653 |
| Republic of Lebanon | 6.750% | 11/29/27 | 961 | 946 |
| Republic of Lebanon | 6.650% | 11/3/28 | 750 | 729 |
| Republic of Lebanon | 6.850% | 5/25/29 | 800 | 786 |
| Republic of Lebanon | 6.650% | 2/26/30 | 1,100 | 1,061 |
| Republic of Lebanon | 7.050% | 11/2/35 | 500 | 496 |
| Total Lebanon (Cost $19,071) | | | | 18,697 |
| Malaysia (1.8%) | | | | |
| Sovereign Bonds (U.S. Dollar-Denominated) (1.8%) | | | | |
| 1MDB Global Investments Ltd. | 4.400% | 3/9/23 | 1,000 | 880 |
| Axiata SPV2 Bhd. | 3.466% | 11/19/20 | 350 | 364 |
| Axiata SPV2 Bhd. | 4.357% | 3/24/26 | 700 | 750 |
| Cagamas Global plc | 2.745% | 12/10/19 | 500 | 507 |
| Danga Capital Bhd. | 3.035% | 3/1/21 | 400 | 408 |
| Export-Import Bank of Malaysia Bhd. | 2.875% | 12/14/17 | 650 | 659 |
| 2 Federation of Malaysia | 4.646% | 7/6/21 | 750 | 832 |
| 7 Federation of Malaysia | 3.179% | 4/27/26 | 1,550 | 1,592 |
| 1 Malayan Banking Bhd. | 3.905% | 10/29/26 | 700 | 723 |
| Malaysia Sovereign Sukuk Bhd. | 3.043% | 4/22/25 | 900 | 914 |
| 7 Malaysia Sovereign Sukuk Bhd. | 4.236% | 4/22/45 | 550 | 594 |
| Petroliam Nasional Bhd. | 7.625% | 10/15/26 | 430 | 606 |
| 2 Petronas Capital Ltd. | 5.250% | 8/12/19 | 1,423 | 1,555 |
| Petronas Capital Ltd. | 5.250% | 8/12/19 | 1,963 | 2,146 |
| Petronas Capital Ltd. | 3.125% | 3/18/22 | 400 | 415 |
| 2 Petronas Capital Ltd. | 7.875% | 5/22/22 | 750 | 962 |
| Petronas Capital Ltd. | 3.500% | 3/18/25 | 2,450 | 2,594 |
24
| | | | |
| Emerging Markets Government Bond Index Fund | | | | |
| |
| |
| |
| | | | Face | Market |
| | | Maturity | Amount | Value• |
| | Coupon | Date | ($000) | ($000) |
| Petronas Capital Ltd. | 4.500% | 3/18/45 | 1,250 | 1,361 |
| Petronas Global Sukuk Ltd. | 2.707% | 3/18/20 | 850 | 862 |
| SSG Resources Ltd. | 4.250% | 10/4/22 | 700 | 743 |
| Total Malaysia (Cost $18,902) | | | | 19,467 |
| Mexico (8.0%) | | | | |
| Sovereign Bonds (U.S. Dollar-Denominated) (8.0%) | | | | |
| Banco Nacional de Comercio Exterior SNC | 4.375% | 10/14/25 | 700 | 723 |
| Comision Federal de Electricidad | 4.875% | 5/26/21 | 1,450 | 1,537 |
| 2 Comision Federal de Electricidad | 4.875% | 1/15/24 | 900 | 943 |
| Comision Federal de Electricidad | 4.875% | 1/15/24 | 600 | 628 |
| 2 Comision Federal de Electricidad | 4.750% | 2/23/27 | 1,000 | 1,018 |
| Comision Federal de Electricidad | 5.750% | 2/14/42 | 700 | 715 |
| 2 Comision Federal de Electricidad | 6.125% | 6/16/45 | 200 | 212 |
| 2 Mexico City Airport Trust | 4.250% | 10/31/26 | 1,000 | 1,019 |
| Petroleos Mexicanos | 3.500% | 7/18/18 | 800 | 817 |
| 2 Petroleos Mexicanos | 5.500% | 2/4/19 | 500 | 528 |
| Petroleos Mexicanos | 8.000% | 5/3/19 | 500 | 563 |
| Petroleos Mexicanos | 6.000% | 3/5/20 | 1,600 | 1,733 |
| Petroleos Mexicanos | 3.500% | 7/23/20 | 1,300 | 1,306 |
| Petroleos Mexicanos | 5.500% | 1/21/21 | 1,789 | 1,904 |
| 2 Petroleos Mexicanos | 6.375% | 2/4/21 | 1,800 | 1,961 |
| Petroleos Mexicanos | 6.375% | 2/4/21 | 1,300 | 1,416 |
| Petroleos Mexicanos | 4.875% | 1/24/22 | 1,280 | 1,310 |
| Petroleos Mexicanos | 3.500% | 1/30/23 | 1,550 | 1,462 |
| 2 Petroleos Mexicanos | 4.625% | 9/21/23 | 2,343 | 2,349 |
| Petroleos Mexicanos | 4.875% | 1/18/24 | 1,569 | 1,577 |
| Petroleos Mexicanos | 4.250% | 1/15/25 | 1,460 | 1,396 |
| Petroleos Mexicanos | 4.500% | 1/23/26 | 1,250 | 1,211 |
| 2 Petroleos Mexicanos | 6.875% | 8/4/26 | 3,950 | 4,419 |
| Petroleos Mexicanos | 6.625% | 6/15/35 | 2,305 | 2,332 |
| Petroleos Mexicanos | 6.500% | 6/2/41 | 3,220 | 3,180 |
| Petroleos Mexicanos | 5.500% | 6/27/44 | 2,936 | 2,527 |
| Petroleos Mexicanos | 6.375% | 1/23/45 | 1,460 | 1,391 |
| Petroleos Mexicanos | 5.625% | 1/23/46 | 3,422 | 2,951 |
| 2 Petroleos Mexicanos | 6.750% | 9/21/47 | 3,117 | 3,084 |
| United Mexican States | 5.950% | 3/19/19 | 1,100 | 1,220 |
| United Mexican States | 8.125% | 12/30/19 | 850 | 1,024 |
| United Mexican States | 5.125% | 1/15/20 | 1,580 | 1,749 |
| United Mexican States | 3.500% | 1/21/21 | 200 | 211 |
| United Mexican States | 3.625% | 3/15/22 | 4,117 | 4,304 |
| United Mexican States | 4.000% | 10/2/23 | 3,641 | 3,832 |
| United Mexican States | 3.600% | 1/30/25 | 3,349 | 3,421 |
| United Mexican States | 4.125% | 1/21/26 | 2,350 | 2,486 |
| United Mexican States | 8.300% | 8/15/31 | 520 | 824 |
| United Mexican States | 7.500% | 4/8/33 | 1,190 | 1,651 |
| United Mexican States | 6.750% | 9/27/34 | 2,174 | 2,811 |
| United Mexican States | 6.050% | 1/11/40 | 3,104 | 3,694 |
| United Mexican States | 4.750% | 3/8/44 | 3,550 | 3,554 |
| United Mexican States | 5.550% | 1/21/45 | 3,175 | 3,560 |
| United Mexican States | 4.600% | 1/23/46 | 3,155 | 3,104 |
| United Mexican States | 4.350% | 1/15/47 | 1,800 | 1,712 |
| United Mexican States | 5.750% | 10/12/10 | 2,400 | 2,458 |
| Total Mexico (Cost $87,477) | | | | 87,827 |
25
| | | | | |
| Emerging Markets Government Bond Index Fund | | | | |
| |
| |
| |
| | | | | Face | Market |
| | | | Maturity | Amount | Value• |
| | | Coupon | Date | ($000) | ($000) |
| Mongolia (0.2%) | | | | |
| Sovereign Bonds (U.S. Dollar-Denominated) (0.2%) | | | | |
| | Mongolia | 4.125% | 1/5/18 | 800 | 769 |
| | Mongolia | 5.125% | 12/5/22 | 1,050 | 927 |
| 8 | Trade & Development Bank of Mongolia LLC | 9.375% | 5/19/20 | 400 | 399 |
| 2,8 | Trade & Development Bank of Mongolia LLC | 9.375% | 5/19/20 | 200 | 198 |
| Total Mongolia (Cost $2,275) | | | | 2,293 |
| Morocco (0.5%) | | | | |
| Sovereign Bonds (U.S. Dollar-Denominated) (0.5%) | | | | |
| | Kingdom of Morocco | 4.250% | 12/11/22 | 1,950 | 2,075 |
| | Kingdom of Morocco | 5.500% | 12/11/42 | 425 | 478 |
| | OCP SA | 5.625% | 4/25/24 | 1,100 | 1,183 |
| 2 | OCP SA | 5.625% | 4/25/24 | 350 | 376 |
| 2 | OCP SA | 4.500% | 10/22/25 | 450 | 453 |
| | OCP SA | 4.500% | 10/22/25 | 750 | 754 |
| 2 | OCP SA | 6.875% | 4/25/44 | 200 | 220 |
| | OCP SA | 6.875% | 4/25/44 | 300 | 330 |
| Total Morocco (Cost $5,592) | | | | 5,869 |
| Mozambique (0.0%) | | | | |
| Sovereign Bond (U.S. Dollar-Denominated) (0.0%) | | | | |
| | Republic of Mozambique | 10.500% | 1/18/23 | 644 | 365 |
| Total Mozambique (Cost $540) | | | | 365 |
| Namibia (0.1%) | | | | |
| Sovereign Bonds (U.S. Dollar-Denominated) (0.1%) | | | | |
| | Republic of Namibia | 5.500% | 11/3/21 | 500 | 536 |
| | Republic of Namibia | 5.250% | 10/29/25 | 700 | 727 |
| Total Namibia (Cost $1,233) | | | | 1,263 |
| Nigeria (0.1%) | | | | |
| Sovereign Bonds (U.S. Dollar-Denominated) (0.1%) | | | | |
| 2 | Africa Finance Corp. | 4.375% | 4/29/20 | 350 | 365 |
| 2 | Federal Republic of Nigeria | 5.125% | 7/12/18 | 200 | 201 |
| | Federal Republic of Nigeria | 6.750% | 1/28/21 | 250 | 248 |
| | Federal Republic of Nigeria | 6.375% | 7/12/23 | 600 | 580 |
| Total Nigeria (Cost $1,359) | | | | 1,394 |
| Oman (0.4%) | | | | |
| Sovereign Bonds (U.S. Dollar-Denominated) (0.4%) | | | | |
| | Lamar Funding Ltd. | 3.958% | 5/7/25 | 1,300 | 1,243 |
| | Sultanate of Oman | 4.750% | 6/15/26 | 500 | 503 |
| 2 | Sultanate of Oman | 4.750% | 6/15/26 | 2,900 | 2,915 |
| Total Oman (Cost $4,675) | | | | 4,661 |
| Pakistan (0.4%) | | | | |
| Sovereign Bonds (U.S. Dollar-Denominated) (0.4%) | | | | |
| 2 | Islamic Republic of Pakistan | 7.250% | 4/15/19 | 400 | 424 |
| | Islamic Republic of Pakistan | 7.250% | 4/15/19 | 1,100 | 1,166 |
| | Islamic Republic of Pakistan | 6.750% | 12/3/19 | 800 | 847 |
| | Islamic Republic of Pakistan | 8.250% | 4/15/24 | 750 | 844 |
26
| | | | | |
| Emerging Markets Government Bond Index Fund | | | | |
| |
| |
| |
| | | | | Face | Market |
| | | | Maturity | Amount | Value• |
| | | Coupon | Date | ($000) | ($000) |
| 2 | Islamic Republic of Pakistan | 8.250% | 4/15/24 | 250 | 281 |
| | Islamic Republic of Pakistan | 8.250% | 9/30/25 | 200 | 227 |
| | Third Pakistan International Sukuk Co. Ltd. | 5.500% | 10/13/21 | 500 | 508 |
| Total Pakistan (Cost $4,062) | | | | 4,297 |
| Panama (1.3%) | | | | |
| Sovereign Bonds (U.S. Dollar-Denominated) (1.3%) | | | | |
| 1,2 | Aeropuerto Internacional de Tocumen SA | 5.625% | 5/18/36 | 1,000 | 1,069 |
| | Republic of Panama | 5.200% | 1/30/20 | 1,973 | 2,180 |
| 1 | Republic of Panama | 4.000% | 9/22/24 | 550 | 592 |
| 1 | Republic of Panama | 3.750% | 3/16/25 | 1,800 | 1,913 |
| | Republic of Panama | 7.125% | 1/29/26 | 760 | 1,005 |
| | Republic of Panama | 8.875% | 9/30/27 | 1,445 | 2,131 |
| 1 | Republic of Panama | 3.875% | 3/17/28 | 900 | 955 |
| | Republic of Panama | 9.375% | 4/1/29 | 800 | 1,217 |
| 1 | Republic of Panama | 6.700% | 1/26/36 | 1,737 | 2,312 |
| 1 | Republic of Panama | 4.300% | 4/29/53 | 600 | 614 |
| Total Panama (Cost $13,349) | | | | 13,988 |
| Paraguay (0.2%) | | | | |
| Sovereign Bonds (U.S. Dollar-Denominated) (0.2%) | | | | |
| | Republic of Paraguay | 4.625% | 1/25/23 | 800 | 834 |
| | Republic of Paraguay | 6.100% | 8/11/44 | 1,250 | 1,384 |
| Total Paraguay (Cost $2,115) | | | | 2,218 |
| Peru (1.2%) | | | | |
| Sovereign Bonds (U.S. Dollar-Denominated) (1.2%) | | | | |
| | Corp. Financiera de Desarrollo SA | 3.250% | 7/15/19 | 1,200 | 1,243 |
| 2 | Corp. Financiera de Desarrollo SA | 3.250% | 7/15/19 | 250 | 259 |
| | Corp. Financiera de Desarrollo SA | 4.750% | 2/8/22 | 200 | 219 |
| | Fondo MIVIVIENDA SA | 3.500% | 1/31/23 | 750 | 773 |
| | Republic of Peru | 4.125% | 8/25/27 | 1,400 | 1,566 |
| | Republic of Peru | 8.750% | 11/21/33 | 2,982 | 4,729 |
| 1 | Republic of Peru | 6.550% | 3/14/37 | 1,361 | 1,877 |
| | Republic of Peru | 5.625% | 11/18/50 | 2,023 | 2,589 |
| Total Peru (Cost $12,340) | | | | 13,255 |
| Philippines (2.6%) | | | | |
| Sovereign Bonds (U.S. Dollar-Denominated) (2.6%) | | | | |
| 9 | Power Sector Assets & Liabilities Management | | | | |
| | Corp. | 7.250% | 5/27/19 | 1,064 | 1,193 |
| 9 | Power Sector Assets & Liabilities Management | | | | |
| | Corp. | 7.390% | 12/2/24 | 1,050 | 1,401 |
| | Republic of the Philippines | 9.875% | 1/15/19 | 650 | 769 |
| | Republic of the Philippines | 8.375% | 6/17/19 | 1,066 | 1,251 |
| | Republic of the Philippines | 6.500% | 1/20/20 | 150 | 172 |
| | Republic of the Philippines | 4.000% | 1/15/21 | 1,310 | 1,415 |
| | Republic of the Philippines | 4.200% | 1/21/24 | 1,964 | 2,200 |
| | Republic of the Philippines | 10.625% | 3/16/25 | 834 | 1,331 |
| | Republic of the Philippines | 5.500% | 3/30/26 | 1,850 | 2,271 |
| | Republic of the Philippines | 9.500% | 2/2/30 | 1,453 | 2,425 |
| | Republic of the Philippines | 7.750% | 1/14/31 | 2,154 | 3,250 |
| | Republic of the Philippines | 6.375% | 1/15/32 | 1,200 | 1,634 |
27
| | | | | |
| Emerging Markets Government Bond Index Fund | | | | |
| |
| |
| |
| | | | | Face | Market |
| | | | Maturity | Amount | Value• |
| | | Coupon | Date | ($000) | ($000) |
| | Republic of the Philippines | 6.375% | 10/23/34 | 1,800 | 2,504 |
| | Republic of the Philippines | 5.000% | 1/13/37 | 1,880 | 2,298 |
| | Republic of the Philippines | 3.950% | 1/20/40 | 2,000 | 2,152 |
| | Republic of the Philippines | 3.700% | 3/1/41 | 2,000 | 2,093 |
| Total Philippines (Cost $27,266) | | | | 28,359 |
| Poland (1.4%) | | | | |
| Sovereign Bonds (U.S. Dollar-Denominated) (1.4%) | | | | |
| | Republic of Poland | 6.375% | 7/15/19 | 4,081 | 4,601 |
| | Republic of Poland | 5.125% | 4/21/21 | 1,710 | 1,930 |
| | Republic of Poland | 5.000% | 3/23/22 | 2,484 | 2,813 |
| | Republic of Poland | 3.000% | 3/17/23 | 1,175 | 1,209 |
| | Republic of Poland | 4.000% | 1/22/24 | 2,428 | 2,650 |
| | Republic of Poland | 3.250% | 4/6/26 | 1,700 | 1,764 |
| Total Poland (Cost $14,496) | | | | 14,967 |
| Qatar (3.4%) | | | | |
| Sovereign Bonds (U.S. Dollar-Denominated) (3.4%) | | | | |
| 1,2 | Nakilat Inc. | 6.067% | 12/31/33 | 700 | 843 |
| 2 | Ooredoo International Finance Ltd. | 7.875% | 6/10/19 | 300 | 345 |
| 2 | Ooredoo International Finance Ltd. | 4.750% | 2/16/21 | 500 | 548 |
| 2 | Ooredoo International Finance Ltd. | 3.250% | 2/21/23 | 1,050 | 1,069 |
| 2 | Ooredoo International Finance Ltd. | 5.000% | 10/19/25 | 900 | 1,013 |
| 2 | Ooredoo International Finance Ltd. | 3.750% | 6/22/26 | 250 | 256 |
| 2 | Ooredoo International Finance Ltd. | 3.875% | 1/31/28 | 1,750 | 1,794 |
| | Ooredoo Tamweel Ltd. | 3.039% | 12/3/18 | 425 | 433 |
| 2,10 Qatari Diar Finance QSC | 5.000% | 7/21/20 | 2,230 | 2,456 |
| | QNB Finance Ltd. | 2.125% | 2/14/18 | 500 | 500 |
| | QNB Finance Ltd. | 2.750% | 10/31/18 | 400 | 405 |
| | QNB Finance Ltd. | 2.875% | 4/29/20 | 2,650 | 2,700 |
| 1,2 | Ras Laffan Liquefied Natural Gas Co. Ltd. II | 5.298% | 9/30/20 | 320 | 343 |
| 2 | Ras Laffan Liquefied Natural Gas Co. Ltd. III | 6.750% | 9/30/19 | 950 | 1,077 |
| 1,2 | Ras Laffan Liquefied Natural Gas Co. Ltd. III | 5.838% | 9/30/27 | 770 | 888 |
| 1,2 | Ras Laffan Liquefied Natural Gas Co. Ltd. III | 6.332% | 9/30/27 | 250 | 299 |
| 10 | State of Qatar | 2.099% | 1/18/18 | 1,700 | 1,706 |
| 2 | State of Qatar | 6.550% | 4/9/19 | 950 | 1,058 |
| 2 | State of Qatar | 5.250% | 1/20/20 | 2,007 | 2,203 |
| | State of Qatar | 5.250% | 1/20/20 | 1,600 | 1,755 |
| | State of Qatar | 2.375% | 6/2/21 | 3,800 | 3,814 |
| 2 | State of Qatar | 4.500% | 1/20/22 | 1,050 | 1,155 |
| 10 | State of Qatar | 3.241% | 1/18/23 | 475 | 499 |
| | State of Qatar | 3.250% | 6/2/26 | 3,300 | 3,343 |
| | State of Qatar | 9.750% | 6/15/30 | 325 | 531 |
| 2 | State of Qatar | 9.750% | 6/15/30 | 600 | 983 |
| 2 | State of Qatar | 6.400% | 1/20/40 | 500 | 673 |
| | State of Qatar | 6.400% | 1/20/40 | 1,262 | 1,698 |
| 2 | State of Qatar | 5.750% | 1/20/42 | 616 | 778 |
| | State of Qatar | 5.750% | 1/20/42 | 600 | 756 |
| | State of Qatar | 4.625% | 6/2/46 | 1,400 | 1,474 |
| Total Qatar (Cost $36,412) | | | | 37,395 |
| Romania (0.6%) | | | | |
| Sovereign Bonds (U.S. Dollar-Denominated) (0.6%) | | | | |
| | Republic of Romania | 6.750% | 2/7/22 | 2,642 | 3,135 |
| | Republic of Romania | 4.375% | 8/22/23 | 1,754 | 1,904 |
| | Republic of Romania | 4.875% | 1/22/24 | 300 | 336 |
28
| | | | |
| Emerging Markets Government Bond Index Fund | | | | |
| |
| |
| |
| | | | Face | Market |
| | | Maturity | Amount | Value• |
| | Coupon | Date | ($000) | ($000) |
| 2 Republic of Romania | 4.875% | 1/22/24 | 100 | 112 |
| 2 Republic of Romania | 6.125% | 1/22/44 | 200 | 260 |
| Republic of Romania | 6.125% | 1/22/44 | 520 | 675 |
| Total Romania (Cost $6,106) | | | | 6,422 |
| Russia (6.8%) | | | | |
| Sovereign Bonds (U.S. Dollar-Denominated) (6.8%) | | | | |
| AK Transneft OJSC Via TransCapitalInvest Ltd. | 8.700% | 8/7/18 | 770 | 847 |
| Gazprom Neft OAO Via GPN Capital SA | 4.375% | 9/19/22 | 1,200 | 1,184 |
| 2 Gazprom Neft OAO Via GPN Capital SA | 6.000% | 11/27/23 | 200 | 211 |
| Gazprom Neft OAO Via GPN Capital SA | 6.000% | 11/27/23 | 1,350 | 1,427 |
| Gazprom OAO Via Gaz Capital SA | 8.146% | 4/11/18 | 1,600 | 1,720 |
| Gazprom OAO Via Gaz Capital SA | 9.250% | 4/23/19 | 2,800 | 3,195 |
| Gazprom OAO Via Gaz Capital SA | 3.850% | 2/6/20 | 478 | 479 |
| Gazprom OAO Via Gaz Capital SA | 5.999% | 1/23/21 | 1,100 | 1,179 |
| Gazprom OAO Via Gaz Capital SA | 6.510% | 3/7/22 | 1,225 | 1,343 |
| Gazprom OAO Via Gaz Capital SA | 4.950% | 7/19/22 | 350 | 360 |
| Gazprom OAO Via Gaz Capital SA | 4.950% | 2/6/28 | 650 | 638 |
| Gazprom OAO Via Gaz Capital SA | 8.625% | 4/28/34 | 725 | 929 |
| Gazprom OAO Via Gaz Capital SA | 7.288% | 8/16/37 | 1,375 | 1,563 |
| Gazprombank OJSC Via GPB Eurobond | | | | |
| Finance plc | 7.250% | 5/3/19 | 200 | 213 |
| Gazprombank OJSC Via GPB Eurobond | | | | |
| Finance plc | 4.960% | 9/5/19 | 1,100 | 1,125 |
| 2 Rosneft Finance SA | 7.875% | 3/13/18 | 100 | 107 |
| Rosneft Finance SA | 7.875% | 3/13/18 | 1,350 | 1,435 |
| Rosneft Finance SA | 7.250% | 2/2/20 | 200 | 220 |
| Rosneft Oil Co. via Rosneft International | | | | |
| Finance Ltd. | 4.199% | 3/6/22 | 1,727 | 1,697 |
| Russian Agricultural Bank OJSC Via RSHB | | | | |
| Capital SA | 5.298% | 12/27/17 | 818 | 837 |
| Russian Agricultural Bank OJSC Via RSHB | | | | |
| Capital SA | 7.750% | 5/29/18 | 1,000 | 1,066 |
| Russian Agricultural Bank OJSC Via RSHB | | | | |
| Capital SA | 5.100% | 7/25/18 | 1,700 | 1,745 |
| 2 Russian Agricultural Bank OJSC Via RSHB | | | | |
| Capital SA | 5.100% | 7/25/18 | 100 | 103 |
| Russian Federation | 11.000% | 7/24/18 | 2,053 | 2,357 |
| 2 Russian Federation | 3.500% | 1/16/19 | 300 | 306 |
| Russian Federation | 3.500% | 1/16/19 | 1,400 | 1,427 |
| Russian Federation | 5.000% | 4/29/20 | 4,700 | 5,015 |
| Russian Federation | 4.500% | 4/4/22 | 2,600 | 2,741 |
| 2 Russian Federation | 4.875% | 9/16/23 | 450 | 484 |
| Russian Federation | 4.875% | 9/16/23 | 4,800 | 5,158 |
| Russian Federation | 12.750% | 6/24/28 | 1,585 | 2,770 |
| 1 Russian Federation | 7.500% | 3/31/30 | 7,337 | 8,879 |
| Russian Federation | 5.625% | 4/4/42 | 2,800 | 3,084 |
| Russian Federation | 5.875% | 9/16/43 | 1,600 | 1,826 |
| Russian Railways via RZD Capital plc | 5.700% | 4/5/22 | 1,550 | 1,652 |
| Sberbank of Russia Via SB Capital SA | 5.180% | 6/28/19 | 750 | 787 |
| Sberbank of Russia Via SB Capital SA | 5.717% | 6/16/21 | 1,700 | 1,811 |
| Sberbank of Russia Via SB Capital SA | 6.125% | 2/7/22 | 2,300 | 2,498 |
| Sberbank of Russia Via SB Capital SA | 5.125% | 10/29/22 | 224 | 225 |
| SCF Capital Ltd. | 5.375% | 6/16/23 | 400 | 414 |
| Vnesheconombank Via VEB Finance plc | 4.224% | 11/21/18 | 1,000 | 1,012 |
29
| | | | |
| Emerging Markets Government Bond Index Fund | | | | |
| |
| |
| |
| | | | Face | Market |
| | | Maturity | Amount | Value• |
| | Coupon | Date | ($000) | ($000) |
| Vnesheconombank Via VEB Finance plc | 6.902% | 7/9/20 | 1,350 | 1,454 |
| Vnesheconombank Via VEB Finance plc | 6.025% | 7/5/22 | 1,025 | 1,072 |
| 2 Vnesheconombank Via VEB Finance plc | 5.942% | 11/21/23 | 200 | 205 |
| Vnesheconombank Via VEB Finance plc | 5.942% | 11/21/23 | 1,125 | 1,162 |
| Vnesheconombank Via VEB Finance plc | 6.800% | 11/22/25 | 1,150 | 1,231 |
| VTB Bank OJSC Via VTB Capital SA | 6.000% | 4/12/17 | 275 | 279 |
| VTB Bank OJSC Via VTB Capital SA | 6.315% | 2/22/18 | 400 | 416 |
| VTB Bank OJSC Via VTB Capital SA | 6.875% | 5/29/18 | 875 | 923 |
| VTB Bank OJSC Via VTB Capital SA | 6.551% | 10/13/20 | 550 | 596 |
| VTB Bank OJSC Via VTB Capital SA | 6.950% | 10/17/22 | 1,725 | 1,801 |
| Total Russia (Cost $70,844) | | | | 75,208 |
| Saudi Arabia (2.0%) | | | | |
| Sovereign Bonds (U.S. Dollar-Denominated) (2.0%) | | | | |
| 2 Kingdom of Saudi Arabia | 2.375% | 10/26/21 | 5,000 | 4,991 |
| Kingdom of Saudi Arabia | 3.250% | 10/26/26 | 5,050 | 4,978 |
| Kingdom of Saudi Arabia | 4.500% | 10/26/46 | 5,950 | 5,860 |
| SABIC Capital II BV | 2.625% | 10/3/18 | 1,000 | 1,010 |
| Saudi Electricity Global Sukuk Co. | 4.211% | 4/3/22 | 625 | 665 |
| Saudi Electricity Global Sukuk Co. 2 | 3.473% | 4/8/23 | 1,050 | 1,069 |
| Saudi Electricity Global Sukuk Co. 2 | 5.060% | 4/8/43 | 700 | 691 |
| Saudi Electricity Global Sukuk Co. 3 | 4.000% | 4/8/24 | 1,550 | 1,603 |
| 2 Saudi Electricity Global Sukuk Co. 3 | 4.000% | 4/8/24 | 650 | 672 |
| 2 Saudi Electricity Global Sukuk Co. 3 | 5.500% | 4/8/44 | 300 | 313 |
| Saudi Electricity Global Sukuk Co. 3 | 5.500% | 4/8/44 | 500 | 519 |
| Total Saudi Arabia (Cost $22,265) | | | | 22,371 |
| Senegal (0.1%) | | | | |
| Sovereign Bonds (U.S. Dollar-Denominated) (0.1%) | | | | |
| Republic of Senegal | 8.750% | 5/13/21 | 500 | 565 |
| Republic of Senegal | 6.250% | 7/30/24 | 200 | 206 |
| Total Senegal (Cost $736) | | | | 771 |
| Serbia, Republic Of (0.5%) | | | | |
| Sovereign Bonds (U.S. Dollar-Denominated) (0.5%) | | | | |
| Republic of Serbia | 5.250% | 11/21/17 | 720 | 740 |
| 2 Republic of Serbia | 5.875% | 12/3/18 | 200 | 212 |
| Republic of Serbia | 5.875% | 12/3/18 | 1,300 | 1,374 |
| Republic of Serbia | 4.875% | 2/25/20 | 700 | 724 |
| Republic of Serbia | 7.250% | 9/28/21 | 2,300 | 2,636 |
| Total Serbia, Republic Of (Cost $5,526) | | | | 5,686 |
| South Africa (1.7%) | | | | |
| Sovereign Bonds (U.S. Dollar-Denominated) (1.7%) | | | | |
| Eskom Holdings SOC Ltd. | 5.750% | 1/26/21 | 2,400 | 2,412 |
| Eskom Holdings SOC Ltd. | 6.750% | 8/6/23 | 1,130 | 1,165 |
| 2 Eskom Holdings SOC Ltd. | 7.125% | 2/11/25 | 200 | 206 |
| Eskom Holdings SOC Ltd. | 7.125% | 2/11/25 | 100 | 103 |
| Republic of South Africa | 6.875% | 5/27/19 | 300 | 331 |
| Republic of South Africa | 5.500% | 3/9/20 | 1,995 | 2,165 |
| Republic of South Africa | 5.875% | 5/30/22 | 971 | 1,095 |
| Republic of South Africa | 4.665% | 1/17/24 | 1,900 | 1,988 |
| Republic of South Africa | 5.875% | 9/16/25 | 1,800 | 2,016 |
| Republic of South Africa | 4.300% | 10/12/28 | 3,250 | 3,149 |
| Republic of South Africa | 6.250% | 3/8/41 | 993 | 1,157 |
30
| | | | | |
| Emerging Markets Government Bond Index Fund | | | | |
| |
| |
| |
| | | | | Face | Market |
| | | | Maturity | Amount | Value• |
| | | Coupon | Date | ($000) | ($000) |
| | Republic of South Africa | 5.375% | 7/24/44 | 700 | 728 |
| | Republic of South Africa | 5.000% | 10/12/46 | 950 | 920 |
| 2 | Transnet SOC Ltd. | 4.000% | 7/26/22 | 800 | 782 |
| | ZAR Sovereign Capital Fund Propriety Ltd. | 3.903% | 6/24/20 | 200 | 206 |
| Total South Africa (Cost $18,062) | | | | 18,423 |
| Sri Lanka (0.8%) | | | | |
| Sovereign Bonds (U.S. Dollar-Denominated) (0.8%) | | | | |
| | Bank of Ceylon | 6.875% | 5/3/17 | 250 | 253 |
| | Bank of Ceylon | 5.325% | 4/16/18 | 500 | 506 |
| 2 | Democratic Socialist Republic of Sri Lanka | 6.000% | 1/14/19 | 200 | 206 |
| | Democratic Socialist Republic of Sri Lanka | 6.000% | 1/14/19 | 800 | 826 |
| 2 | Democratic Socialist Republic of Sri Lanka | 5.125% | 4/11/19 | 250 | 253 |
| | Democratic Socialist Republic of Sri Lanka | 6.250% | 10/4/20 | 1,232 | 1,288 |
| | Democratic Socialist Republic of Sri Lanka | 6.250% | 7/27/21 | 1,550 | 1,619 |
| | Democratic Socialist Republic of Sri Lanka | 5.875% | 7/25/22 | 1,000 | 1,020 |
| | Democratic Socialist Republic of Sri Lanka | 6.125% | 6/3/25 | 500 | 502 |
| | Democratic Socialist Republic of Sri Lanka | 6.850% | 11/3/25 | 1,200 | 1,264 |
| | Democratic Socialist Republic of Sri Lanka | 6.825% | 7/18/26 | 1,000 | 1,055 |
| | National Savings Bank | 8.875% | 9/18/18 | 400 | 430 |
| Total Sri Lanka (Cost $8,943) | | | | 9,222 |
| Thailand (0.2%) | | | | |
| Sovereign Bonds (U.S. Dollar-Denominated) (0.2%) | | | | |
| | Krung Thai Bank PCL | 2.250% | 9/11/18 | 400 | 403 |
| 1 | Krung Thai Bank PCL | 5.200% | 12/26/24 | 750 | 786 |
| | PTT Public Co. Ltd. | 3.375% | 10/25/22 | 525 | 546 |
| | PTT Public Co. Ltd. | 4.500% | 10/25/42 | 400 | 399 |
| Total Thailand (Cost $2,044) | | | | 2,134 |
| Trinidad And Tobago (0.2%) | | | | |
| Sovereign Bonds (U.S. Dollar-Denominated) (0.2%) | | | | |
| 2 | Petroleum Co. of Trinidad & Tobago Ltd. | 9.750% | 8/14/19 | 700 | 772 |
| 2 | Republic of Trinidad & Tobago | 4.375% | 1/16/24 | 200 | 208 |
| | Republic of Trinidad & Tobago | 4.500% | 8/4/26 | 1,250 | 1,269 |
| Total Trinidad And Tobago (Cost $2,218) | | | | 2,249 |
| Tunisia (0.1%) | | | | |
| Sovereign Bond (U.S. Dollar-Denominated) (0.1%) | | | | |
| | Banque Centrale de Tunisie SA | 5.750% | 1/30/25 | 1,300 | 1,253 |
| Total Tunisia (Cost $1,246) | | | | 1,253 |
| Turkey (4.8%) | | | | |
| Sovereign Bonds (U.S. Dollar-Denominated) (4.8%) | | | | |
| | Export Credit Bank of Turkey | 5.875% | 4/24/19 | 600 | 623 |
| 2 | Export Credit Bank of Turkey | 5.375% | 2/8/21 | 500 | 508 |
| 2 | Export Credit Bank of Turkey | 5.000% | 9/23/21 | 400 | 401 |
| | Hazine Mustesarligi Varlik Kiralama AS | 4.251% | 6/8/21 | 1,250 | 1,246 |
| 2 | Hazine Mustesarligi Varlik Kiralama AS | 4.489% | 11/25/24 | 800 | 788 |
| | Republic of Turkey | 7.500% | 7/14/17 | 991 | 1,027 |
| 11 | Republic of Turkey | 2.803% | 3/26/18 | 700 | 695 |
| | Republic of Turkey | 6.750% | 4/3/18 | 2,187 | 2,305 |
| 2 | Republic of Turkey | 4.557% | 10/10/18 | 500 | 513 |
| | Republic of Turkey | 7.000% | 3/11/19 | 2,680 | 2,901 |
| | Republic of Turkey | 7.500% | 11/7/19 | 966 | 1,073 |
31
| | | | | |
| Emerging Markets Government Bond Index Fund | | | | |
| |
| |
| |
| | | | | Face | Market |
| | | | Maturity | Amount | Value• |
| | | Coupon | Date | ($000) | ($000) |
| | Republic of Turkey | 7.000% | 6/5/20 | 2,630 | 2,890 |
| | Republic of Turkey | 5.625% | 3/30/21 | 2,301 | 2,430 |
| | Republic of Turkey | 5.125% | 3/25/22 | 825 | 853 |
| | Republic of Turkey | 6.250% | 9/26/22 | 2,004 | 2,182 |
| | Republic of Turkey | 3.250% | 3/23/23 | 1,601 | 1,489 |
| | Republic of Turkey | 5.750% | 3/22/24 | 2,550 | 2,709 |
| | Republic of Turkey | 7.375% | 2/5/25 | 2,850 | 3,338 |
| | Republic of Turkey | 4.250% | 4/14/26 | 1,950 | 1,867 |
| | Republic of Turkey | 4.875% | 10/9/26 | 1,900 | 1,895 |
| | Republic of Turkey | 6.875% | 3/17/36 | 2,698 | 3,066 |
| | Republic of Turkey | 6.750% | 5/30/40 | 1,210 | 1,366 |
| | Republic of Turkey | 6.000% | 1/14/41 | 2,400 | 2,475 |
| | Republic of Turkey | 4.875% | 4/16/43 | 5,419 | 4,809 |
| | Republic of Turkey | 6.625% | 2/17/45 | 3,565 | 3,997 |
| 2 | TC Ziraat Bankasi AS | 4.250% | 7/3/19 | 200 | 199 |
| 2 | TC Ziraat Bankasi AS | 4.750% | 4/29/21 | 800 | 793 |
| 2 | Turkiye Halk Bankasi AS | 4.750% | 6/4/19 | 250 | 249 |
| | Turkiye Halk Bankasi AS | 4.750% | 6/4/19 | 400 | 398 |
| | Turkiye Halk Bankasi AS | 3.875% | 2/5/20 | 400 | 383 |
| | Turkiye Halk Bankasi AS | 4.750% | 2/11/21 | 700 | 675 |
| 2 | Turkiye Halk Bankasi AS | 5.000% | 7/13/21 | 500 | 482 |
| | Turkiye Vakiflar Bankasi Tao | 5.750% | 4/24/17 | 200 | 202 |
| | Turkiye Vakiflar Bankasi Tao | 3.750% | 4/15/18 | 700 | 692 |
| | Turkiye Vakiflar Bankasi TAO | 5.000% | 10/31/18 | 500 | 505 |
| | Turkiye Vakiflar Bankasi Tao | 6.000% | 11/1/22 | 800 | 788 |
| 1 | Turkiye Vakiflar Bankasi Tao | 6.875% | 2/3/25 | 200 | 198 |
| Total Turkey (Cost $53,585) | | | | 53,010 |
| Ukraine (1.3%) | | | | |
| Sovereign Bonds (U.S. Dollar-Denominated) (1.3%) | | | | |
| 2 | Oschadbank Via SSB #1 plc | 9.625% | 3/20/25 | 200 | 192 |
| 1 | Oschadbank Via SSB #1 plc | 9.625% | 3/20/25 | 1,400 | 1,347 |
| | Ukraine | 7.750% | 9/1/19 | 1,500 | 1,497 |
| 2 | Ukraine | 7.750% | 9/1/20 | 1,728 | 1,713 |
| | Ukraine | 7.750% | 9/1/20 | 600 | 593 |
| 2 | Ukraine | 7.750% | 9/1/21 | 907 | 892 |
| | Ukraine | 7.750% | 9/1/22 | 800 | 781 |
| | Ukraine | 7.750% | 9/1/23 | 1,700 | 1,651 |
| | Ukraine | 7.750% | 9/1/24 | 1,750 | 1,686 |
| | Ukraine | 7.750% | 9/1/25 | 250 | 240 |
| | Ukraine | 7.750% | 9/1/26 | 1,600 | 1,527 |
| | Ukraine | 7.750% | 9/1/27 | 800 | 760 |
| 2 | Ukraine Railways via Shortline plc | 9.875% | 9/15/21 | 200 | 192 |
| 1 | Ukreximbank Via Biz Finance plc | 9.625% | 4/27/22 | 600 | 591 |
| 1,2 | Ukreximbank Via Biz Finance plc | 9.750% | 1/22/25 | 200 | 192 |
| 1 | Ukreximbank Via Biz Finance plc | 9.750% | 1/22/25 | 500 | 481 |
| Total Ukraine (Cost $13,856) | | | | 14,335 |
| United Arab Emirates (4.4%) | | | | |
| Sovereign Bonds (U.S. Dollar-Denominated) (4.4%) | | | | |
| 2 | Abu Dhabi National Energy Co. PJSC | 6.165% | 10/25/17 | 1,150 | 1,199 |
| 2 | Abu Dhabi National Energy Co. PJSC | 2.500% | 1/12/18 | 400 | 401 |
| 2 | Abu Dhabi National Energy Co. PJSC | 6.250% | 9/16/19 | 275 | 306 |
| 2 | Abu Dhabi National Energy Co. PJSC | 5.875% | 12/13/21 | 200 | 227 |
| 2 | Abu Dhabi National Energy Co. PJSC | 3.625% | 1/12/23 | 2,100 | 2,137 |
32
| | | | | |
| Emerging Markets Government Bond Index Fund | | | | |
| |
| |
| |
| | | | | Face | Market |
| | | | Maturity | Amount | Value• |
| | | Coupon | Date | ($000) | ($000) |
| | Abu Dhabi National Energy Co. PJSC | 3.875% | 5/6/24 | 650 | 669 |
| 2 | Abu Dhabi National Energy Co. PJSC | 4.375% | 6/22/26 | 1,000 | 1,048 |
| 2 | Abu Dhabi National Energy Co. PJSC | 6.500% | 10/27/36 | 1,075 | 1,422 |
| 4 | ADCB Finance Cayman Ltd. | 2.176% | 1/9/17 | 200 | 200 |
| | ADCB Finance Cayman Ltd. | 2.500% | 3/6/18 | 1,200 | 1,207 |
| | ADCB Finance Cayman Ltd. | 3.000% | 3/4/19 | 800 | 811 |
| | ADCB Finance Cayman Ltd. | 2.625% | 3/10/20 | 1,300 | 1,308 |
| | ADCB Finance Cayman Ltd. | 4.500% | 3/6/23 | 425 | 443 |
| | AHB Sukuk Co. Ltd. | 3.267% | 10/8/18 | 200 | 204 |
| | DEWA Sukuk 2013 Ltd. | 3.000% | 3/5/18 | 650 | 658 |
| 1,2 | Dolphin Energy Ltd. | 5.888% | 6/15/19 | 636 | 673 |
| 2 | Dolphin Energy Ltd. | 5.500% | 12/15/21 | 820 | 938 |
| | DP World Crescent Ltd. | 3.908% | 5/31/23 | 1,000 | 1,026 |
| | DP World Ltd. | 3.250% | 5/18/20 | 1,250 | 1,285 |
| 2 | DP World Ltd. | 6.850% | 7/2/37 | 1,500 | 1,713 |
| 2 | DP World Sukuk Ltd. | 6.250% | 7/2/17 | 670 | 689 |
| | Dubai DOF Sukuk Ltd. | 6.450% | 5/2/22 | 200 | 233 |
| 2 | Dubai Electricity & Water Authority | 7.375% | 10/21/20 | 1,975 | 2,326 |
| 2 | Emirate of Abu Dhabi | 6.750% | 4/8/19 | 1,583 | 1,781 |
| | Emirate of Abu Dhabi | 2.125% | 5/3/21 | 1,765 | 1,769 |
| 2 | Emirate of Abu Dhabi | 3.125% | 5/3/26 | 1,800 | 1,870 |
| | Emirate of Abu Dhabi | 3.125% | 5/3/26 | 1,057 | 1,098 |
| | Emirate of Dubai | 7.750% | 10/5/20 | 1,000 | 1,185 |
| | Emirate of Dubai | 3.875% | 1/30/23 | 1,100 | 1,136 |
| | Emirate of Dubai | 5.250% | 1/30/43 | 200 | 192 |
| 1,2 | Emirates Airline | 4.500% | 2/6/25 | 777 | 802 |
| | Emirates NBD PJSC | 3.250% | 11/19/19 | 735 | 753 |
| 1 | Emirates NBD PJSC | 4.875% | 3/28/23 | 950 | 976 |
| | Emirates Telecommunications Group Co. PJSC | 2.375% | 6/18/19 | 800 | 807 |
| | Emirates Telecommunications Group Co. PJSC | 3.500% | 6/18/24 | 500 | 526 |
| | ICD Sukuk Co. Ltd. | 3.508% | 5/21/20 | 250 | 251 |
| | IPIC GMTN Ltd. | 5.000% | 11/15/20 | 250 | 276 |
| 2 | IPIC GMTN Ltd. | 5.000% | 11/15/20 | 1,400 | 1,545 |
| 2 | IPIC GMTN Ltd. | 5.500% | 3/1/22 | 710 | 818 |
| 2 | IPIC GMTN Ltd. | 6.875% | 11/1/41 | 800 | 1,146 |
| | Jafz Sukuk Ltd. | 7.000% | 6/19/19 | 400 | 444 |
| 2 | MDC-GMTN B.V. | 7.625% | 5/6/19 | 500 | 572 |
| 2 | MDC-GMTN B.V. | 5.500% | 4/20/21 | 450 | 514 |
| 2 | MDC-GMTN B.V. | 3.250% | 4/28/22 | 200 | 208 |
| | MDC-GMTN B.V. | 3.250% | 4/28/22 | 500 | 518 |
| | MDC-GMTN B.V. | 2.750% | 5/11/23 | 250 | 250 |
| 1 | Medjool Ltd. | 3.875% | 3/19/23 | 246 | 251 |
| | National Bank of Abu Dhabi PJSC | 3.000% | 8/13/19 | 1,300 | 1,327 |
| | National Bank of Abu Dhabi PJSC | 2.250% | 2/11/20 | 775 | 776 |
| | Noor Sukuk Co. Ltd. | 2.788% | 4/28/20 | 350 | 347 |
| 2 | NOVA Chemicals Corp. | 5.250% | 8/1/23 | 900 | 925 |
| | RAK Capital | 3.297% | 10/21/18 | 600 | 612 |
| | RAK Capital | 3.094% | 3/31/25 | 700 | 689 |
| | RAKFunding Cayman Ltd. | 3.250% | 6/24/19 | 950 | 954 |
| 1 | Ruwais Power Co. PJSC | 6.000% | 8/31/36 | 800 | 965 |
| | Sharjah Sukuk Ltd. | 3.764% | 9/17/24 | 400 | 414 |
| 1,2 | Waha Aerospace BV | 3.925% | 7/28/20 | 592 | 612 |
| Total United Arab Emirates (Cost $47,379) | | | | 48,432 |
33
| | | | |
| Emerging Markets Government Bond Index Fund | | | | |
| |
| |
| |
| | | | Face | Market |
| | | Maturity | Amount | Value• |
| | Coupon | Date | ($000) | ($000) |
| Uruguay (1.0%) | | | | |
| Sovereign Bonds (U.S. Dollar-Denominated) (1.0%) | | | | |
| 1 Oriental Republic of Uruguay | 8.000% | 11/18/22 | 298 | 383 |
| 1 Oriental Republic of Uruguay | 4.500% | 8/14/24 | 1,589 | 1,730 |
| 1 Oriental Republic of Uruguay | 4.375% | 10/27/27 | 2,230 | 2,364 |
| Oriental Republic of Uruguay | 7.875% | 1/15/33 | 346 | 479 |
| 1 Oriental Republic of Uruguay | 7.625% | 3/21/36 | 1,516 | 2,084 |
| 1 Oriental Republic of Uruguay | 4.125% | 11/20/45 | 850 | 778 |
| 1 Oriental Republic of Uruguay | 5.100% | 6/18/50 | 3,320 | 3,312 |
| Total Uruguay (Cost $10,686) | | | | 11,130 |
| Venezuela (2.4%) | | | | |
| Sovereign Bonds (U.S. Dollar-Denominated) (2.4%) | | | | |
| Bolivarian Republic of Venezuela | 13.625% | 8/15/18 | 566 | 411 |
| Bolivarian Republic of Venezuela | 7.000% | 12/1/18 | 1,760 | 1,034 |
| Bolivarian Republic of Venezuela | 7.750% | 10/13/19 | 1,606 | 820 |
| Bolivarian Republic of Venezuela | 6.000% | 12/9/20 | 956 | 428 |
| 1 Bolivarian Republic of Venezuela | 12.750% | 8/23/22 | 3,565 | 2,067 |
| Bolivarian Republic of Venezuela | 9.000% | 5/7/23 | 2,151 | 989 |
| Bolivarian Republic of Venezuela | 8.250% | 10/13/24 | 2,679 | 1,186 |
| Bolivarian Republic of Venezuela | 7.650% | 4/21/25 | 1,700 | 734 |
| Bolivarian Republic of Venezuela | 11.750% | 10/21/26 | 1,927 | 1,064 |
| Bolivarian Republic of Venezuela | 9.250% | 9/15/27 | 3,122 | 1,565 |
| Bolivarian Republic of Venezuela | 9.250% | 5/7/28 | 640 | 297 |
| 1 Bolivarian Republic of Venezuela | 11.950% | 8/5/31 | 4,229 | 2,332 |
| Bolivarian Republic of Venezuela | 9.375% | 1/13/34 | 1,900 | 881 |
| Bolivarian Republic of Venezuela | 7.000% | 3/31/38 | 1,375 | 578 |
| CA La Electricidad de Caracas | 8.500% | 4/10/18 | 320 | 182 |
| 2 CITGO Holding Inc. | 10.750% | 2/15/20 | 1,150 | 1,175 |
| CITGO Holding Inc. | 10.750% | 2/15/20 | 100 | 102 |
| 2 CITGO Petroleum Corp. | 6.250% | 8/15/22 | 535 | 540 |
| CITGO Petroleum Corp. | 6.250% | 8/15/22 | 100 | 101 |
| 1 Petroleos de Venezuela SA | 8.500% | 11/2/17 | 1,819 | 1,314 |
| 1 Petroleos de Venezuela SA | 9.000% | 11/17/21 | 1,858 | 914 |
| 1 Petroleos de Venezuela SA | 12.750% | 2/17/22 | 555 | 325 |
| 1 Petroleos de Venezuela SA | 6.000% | 5/16/24 | 6,250 | 2,338 |
| 1 Petroleos de Venezuela SA | 6.000% | 11/15/26 | 4,991 | 1,838 |
| Petroleos de Venezuela SA | 5.375% | 4/12/27 | 4,145 | 1,501 |
| 1 Petroleos de Venezuela SA | 9.750% | 5/17/35 | 2,963 | 1,300 |
| Petroleos de Venezuela SA | 5.500% | 4/12/37 | 1,810 | 651 |
| Total Venezuela (Cost $26,544) | | | | 26,667 |
| Vietnam (0.2%) | | | | |
| Sovereign Bonds (U.S. Dollar-Denominated) (0.2%) | | | | |
| Socialist Republic of Vietnam | 6.750% | 1/29/20 | 659 | 733 |
| 2 Socialist Republic of Vietnam | 4.800% | 11/19/24 | 200 | 211 |
| Socialist Republic of Vietnam | 4.800% | 11/19/24 | 775 | 820 |
| Total Vietnam (Cost $1,695) | | | | 1,764 |
34
| | | | | |
| Emerging Markets Government Bond Index Fund | | | | |
| |
| |
| |
| | | | | Face | Market |
| | | | Maturity | Amount | Value• |
| | | Coupon | Date | ($000) | ($000) |
| Zambia (0.3%) | | | | |
| Sovereign Bonds (U.S. Dollar-Denominated) (0.3%) | | | | |
| | Republic of Zambia | 5.375% | 9/20/22 | 725 | 630 |
| 2 | Republic of Zambia | 8.500% | 4/14/24 | 450 | 438 |
| | Republic of Zambia | 8.500% | 4/14/24 | 800 | 781 |
| 1 | Zambia Government International Bond | 8.970% | 7/30/27 | 900 | 885 |
| Total Zambia (Cost $2,694) | | | | 2,734 |
| Temporary Cash Investments (0.9%) | | | | |
| 12 | Vanguard Market Liquidity Fund | 0.718% | | 94,583 | 9,459 |
| Total Temporary Cash Investments (Cost $9,459) | | | | 9,459 |
| Total Investments (99.3%) (Cost $1,056,689) | | | | 1,090,053 |
| |
| | | | | | Amount |
| | | | | | ($000) |
| Other Assets and Liabilities (0.7%) | | | | |
| Other Assets | | | | |
| Investment in Vanguard | | | | 83 |
| Receivables for Investment Securities Sold | | | | 10,133 |
| Receivables for Accrued Income | | | | 14,206 |
| Receivables for Capital Shares Issued | | | | 519 |
| Other Assets | | | | 62 |
| Total Other Assets | | | | 25,003 |
| Liabilities | | | | |
| Payables for Investment Securities Purchased | | | | (16,717) |
| Payables for Capital Shares Redeemed | | | | (80) |
| Payables for Distributions | | | | (128) |
| Payables to Vanguard | | | | (315) |
| Other Liabilities | | | | (276) |
| Total Liabilities | | | | (17,516) |
| Net Assets (100%) | | | | 1,097,540 |
| |
| |
| At October 31, 2016, net assets consisted of: | | | | |
| | | | | | Amount |
| | | | | | ($000) |
| Paid-in Capital | | | | 1,065,691 |
| Undistributed Net Investment Income | | | | 3,353 |
| Accumulated Net Realized Losses | | | | (4,868) |
| Unrealized Appreciation (Depreciation) | | | | 33,364 |
| Net Assets | | | | 1,097,540 |
35
| |
| Emerging Markets Government Bond Index Fund | |
| |
| |
| |
| | Amount |
| | ($000) |
| Investor Shares—Net Assets | |
| Applicable to 1,175,964 outstanding $.001 par value shares of | |
| beneficial interest (unlimited authorization) | 11,811 |
| Net Asset Value Per Share—Investor Shares | $10.04 |
| |
| ETF Shares—Net Assets | |
| Applicable to 10,905,979 outstanding $.001 par value shares of | |
| beneficial interest (unlimited authorization) | 873,634 |
| Net Asset Value Per Share—ETF Shares | $80.11 |
| |
| Admiral Shares—Net Assets | |
| Applicable to 9,507,413 outstanding $.001 par value shares of | |
| beneficial interest (unlimited authorization) | 190,976 |
| Net Asset Value Per Share—Admiral Shares | $20.09 |
| |
| Institutional Shares—Net Assets | |
| Applicable to 655,117 outstanding $.001 par value shares of | |
| beneficial interest (unlimited authorization) | 21,119 |
| Net Asset Value Per Share—Institutional Shares | $32.24 |
• See Note A in Notes to Financial Statements.
1 The average or expected maturity is shorter than the final maturity shown because of the possibility of interim principal payments
and prepayments or the possibility of the issue being called.
2 Security exempt from registration under Rule 144A of the Securities Act of 1933. Such securities may be sold in transactions exempt
from registration, normally to qualified institutional buyers. At October 31, 2016, the aggregate value of these securities was
$131,549,000, representing 12.0% of net assets.
3 Guaranteed by the Republic of Azerbaijan.
4 Adjustable-rate security.
5 Guaranteed by the Republic of Hungary.
6 Guaranteed by the Republic of Indonesia.
7 Guaranteed by the Federation of Malaysia.
8 Guaranteed by the Government of Mongolia.
9 Guaranteed by the Republic of the Philippines.
10 Guaranteed by the State of Qatar.
11 Guaranteed by the Republic of Turkey.
12 Affiliated money market fund available only to Vanguard funds and certain trusts and accounts managed by Vanguard. Rate shown is
the 7-day yield.
See accompanying Notes, which are an integral part of the Financial Statements.
36
| |
| Emerging Markets Government Bond Index Fund | |
| |
| |
| Statement of Operations | |
| |
| | Year Ended |
| | October 31, 2016 |
| | ($000) |
| Investment Income | |
| Income | |
| Interest1 | 44,495 |
| Total Income | 44,495 |
| Expenses | |
| The Vanguard Group—Note B | |
| Investment Advisory Services | 23 |
| Management and Administrative—Investor Shares | 37 |
| Management and Administrative—ETF Shares | 1,978 |
| Management and Administrative—Admiral Shares | 461 |
| Management and Administrative—Institutional Shares | 47 |
| Marketing and Distribution—Investor Shares | 2 |
| Marketing and Distribution—ETF Shares | 54 |
| Marketing and Distribution—Admiral Shares | 15 |
| Marketing and Distribution—Institutional Shares | 1 |
| Custodian Fees | 46 |
| Auditing Fees | 48 |
| Shareholders’ Reports—Investor Shares | 9 |
| Shareholders’ Reports—ETF Shares | 19 |
| Shareholders’ Reports—Admiral Shares | 1 |
| Shareholders’ Reports—Institutional Shares | — |
| Total Expenses | 2,741 |
| Net Investment Income | 41,754 |
| Realized Net Gain (Loss) on Investment Securities Sold1 | (1,858) |
| Change in Unrealized Appreciation (Depreciation) of Investment Securities | 47,756 |
| Net Increase (Decrease) in Net Assets Resulting from Operations | 87,652 |
1 Interest income and realized net gain (loss) from an affiliated company of the fund was $37,000 and $0, respectively.
See accompanying Notes, which are an integral part of the Financial Statements.
37
| | |
| Emerging Markets Government Bond Index Fund | | |
| |
| |
| Statement of Changes in Net Assets | | |
| |
| | Year Ended October 31, |
| | 2016 | 2015 |
| | ($000) | ($000) |
| Increase (Decrease) in Net Assets | | |
| Operations | | |
| Net Investment Income | 41,754 | 22,613 |
| Realized Net Gain (Loss) | (1,858) | (3,826) |
| Change in Unrealized Appreciation (Depreciation) | 47,756 | (18,102) |
| Net Increase (Decrease) in Net Assets Resulting from Operations | 87,652 | 685 |
| Distributions | | |
| Net Investment Income | | |
| Investor Shares | (465) | (399) |
| ETF Shares | (31,046) | (15,477) |
| Admiral Shares | (7,488) | (5,622) |
| Institutional Shares | (845) | (388) |
| Realized Capital Gain | | |
| Investor Shares | — | — |
| ETF Shares | — | — |
| Admiral Shares | — | — |
| Institutional Shares | — | — |
| Total Distributions | (39,844) | (21,886) |
| Capital Share Transactions | | |
| Investor Shares | 2,244 | 2,155 |
| ETF Shares | 335,485 | 292,555 |
| Admiral Shares | 51,874 | 18,272 |
| Institutional Shares | 9,579 | 10,675 |
| Net Increase (Decrease) from Capital Share Transactions | 399,182 | 323,657 |
| Total Increase (Decrease) | 446,990 | 302,456 |
| Net Assets | | |
| Beginning of Period | 650,550 | 348,094 |
| End of Period1 | 1,097,540 | 650,550 |
| 1 Net Assets—End of Period includes undistributed net investment income of $3,353,000 and $1,443,000. | |
See accompanying Notes, which are an integral part of the Financial Statements.
38
| | | | |
| Emerging Markets Government Bond Index Fund | | | | |
| |
| |
| Financial Highlights | | | | |
| |
| |
| Investor Shares | | | | |
| | | | | May 14, |
| | | | | 20131 to |
| | Year Ended October 31, | Oct. 31, |
| For a Share Outstanding Throughout Each Period | 2016 | 2015 | 2014 | 2013 |
| Net Asset Value, Beginning of Period | $9.50 | $9.95 | $9.74 | $10.00 |
| Investment Operations | | | | |
| Net Investment Income | .454 | .427 | .417 | .149 |
| Net Realized and Unrealized Gain (Loss) on Investments2 | . 533 | (. 447) | . 213 | (. 261) |
| Total from Investment Operations | . 987 | (. 020) | . 630 | (.112) |
| Distributions | | | | |
| Dividends from Net Investment Income | (. 447) | (. 430) | (. 420) | (.148) |
| Distributions from Realized Capital Gains | — | — | — | — |
| Total Distributions | (. 447) | (. 430) | (. 420) | (.148) |
| Net Asset Value, End of Period | $10.04 | $9.50 | $9.95 | $9.74 |
| |
| Total Return3 | 10.65% | -0.16% | 6.62% | -1.38% |
| |
| Ratios/Supplemental Data | | | | |
| Net Assets, End of Period (Millions) | $12 | $9 | $7 | $4 |
| Ratio of Total Expenses to Average Net Assets | 0.49% | 0.49% | 0.49% | 0.49%4 |
| Ratio of Net Investment Income to Average Net Assets | 4.72% | 4.52% | 4.35% | 3.81%4 |
| Portfolio Turnover Rate 5 | 24% | 20% | 27% | 38% |
1 Subscription period for the fund was May 14, 2013, to May 30, 2013, during which time all assets were held in money market instruments.
Performance measurement began May 31, 2013, at a net asset value of $10.03.
2 Includes increases from purchase fees of $.01, $.01, $.00, and $.03
3 Total returns do not include transaction or account service fees that may have applied in the periods shown. Fund prospectuses provide
information about any applicable transaction and account service fees.
4 Annualized.
5 Excludes the value of portfolio securities received or delivered as a result of in-kind purchases or redemptions of the fund’s capital shares,
including ETF Creation Units.
See accompanying Notes, which are an integral part of the Financial Statements.
39
| | | | |
| Emerging Markets Government Bond Index Fund | | | | |
| |
| |
| Financial Highlights | | | | |
| |
| |
| ETF Shares | | | | |
| | | | | May 31, |
| | | | | 20131 to |
| | Year Ended October 31, | Oct. 31, |
| For a Share Outstanding Throughout Each Period | 2016 | 2015 | 2014 | 2013 |
| Net Asset Value, Beginning of Period | $75.81 | $79.40 | $77.71 | $79.52 |
| Investment Operations | | | | |
| Net Investment Income | 3.753 | 3.516 | 3.429 | 1.217 |
| Net Realized and Unrealized Gain (Loss) on Investments2 | 4.228 | (3.556) | 1.700 | (2.086) |
| Total from Investment Operations | 7.981 | (.040) | 5.129 | (.869) |
| Distributions | | | | |
| Dividends from Net Investment Income | (3.681) | (3.550) | (3.439) | (.941) |
| Distributions from Realized Capital Gains | — | — | — | — |
| Total Distributions | (3.681) | (3.550) | (3.439) | (.941) |
| Net Asset Value, End of Period | $80.11 | $75.81 | $79.40 | $77.71 |
| |
| Total Return | 10.84% | -0.01% | 6.79% | -1.39% |
| |
| Ratios/Supplemental Data | | | | |
| Net Assets, End of Period (Millions) | $874 | $501 | $222 | $85 |
| Ratio of Total Expenses to Average Net Assets | 0.32% | 0.34% | 0.34% | 0.35%3 |
| Ratio of Net Investment Income to Average Net Assets | 4.89% | 4.67% | 4.50% | 3.95%3 |
| Portfolio Turnover Rate4 | 24% | 20% | 27% | 38% |
1 Inception.
2 Includes increases from purchase fees of $.04, $.06, $.01, and $.30.
3 Annualized.
4 Excludes the value of portfolio securities received or delivered as a result of in-kind purchases or redemptions of the fund’s capital shares,
including ETF Creation Units.
See accompanying Notes, which are an integral part of the Financial Statements.
40
| | | | |
| Emerging Markets Government Bond Index Fund | | | | |
| |
| |
| Financial Highlights | | | | |
| |
| |
| Admiral Shares | | | | |
| | | | | May 14, |
| | | | | 20131 to |
| | Year Ended October 31, | Oct. 31, |
| For a Share Outstanding Throughout Each Period | 2016 | 2015 | 2014 | 2013 |
| Net Asset Value, Beginning of Period | $19.00 | $19.90 | $19.48 | $20.00 |
| Investment Operations | | | | |
| Net Investment Income | . 941 | . 885 | . 863 | . 309 |
| Net Realized and Unrealized Gain (Loss) on Investments2 | 1.076 | (. 894) | . 427 | (. 522) |
| Total from Investment Operations | 2.017 | (.009) | 1.290 | (.213) |
| Distributions | | | | |
| Dividends from Net Investment Income | (. 927) | (. 891) | (. 870) | (. 307) |
| Distributions from Realized Capital Gains | — | — | — | — |
| Total Distributions | (. 927) | (. 891) | (. 870) | (. 307) |
| Net Asset Value, End of Period | $20.09 | $19.00 | $19.90 | $19.48 |
| |
| Total Return3 | 10.89% | 0% | 6.78% | -1.37% |
| |
| Ratios/Supplemental Data | | | | |
| Net Assets, End of Period (Millions) | $191 | $131 | $118 | $55 |
| Ratio of Total Expenses to Average Net Assets | 0.32% | 0.33% | 0.34% | 0.34%4 |
| Ratio of Net Investment Income to Average Net Assets | 4.89% | 4.68% | 4.50% | 3.96%4 |
| Portfolio Turnover Rate 5 | 24% | 20% | 27% | 38% |
1 Subscription period for the fund was May 14, 2013, to May 30, 2013, during which time all assets were held in money market instruments.
Performance measurement began May 31, 2013, at a net asset value of $20.07.
2 Includes increases from purchase fees of $.01, $.02, $.00, and $.06.
3 Total returns do not include transaction or account service fees that may have applied in the periods shown. Fund prospectuses provide
information about any applicable transaction and account service fees.
4 Annualized.
5 Excludes the value of portfolio securities received or delivered as a result of in-kind purchases or redemptions of the fund’s capital shares,
including ETF Creation Units.
See accompanying Notes, which are an integral part of the Financial Statements.
41
| | | |
| Emerging Markets Government Bond Index Fund | | | |
| |
| |
| Financial Highlights | | | |
| |
| |
| Institutional Shares | | | |
| | Year | Feb 11, | Nov. 25, |
| | Ended | 20151 to | 20141 to |
| | October 31, | Oct. 31, | Dec. 18, |
| For a Share Outstanding Throughout Each Period | 2016 | 2015 | 2014 |
| Net Asset Value, Beginning of Period | $30.50 | $30.72 | $31.53 |
| Investment Operations | | | |
| Net Investment Income | 1.521 | 1.019 | .108 |
| Net Realized and Unrealized Gain (Loss) on Investments2 | 1.715 | (.159) | (1.240) |
| Total from Investment Operations | 3.236 | .860 | (1.132) |
| Distributions | | | |
| Dividends from Net Investment Income | (1.496) | (1.080) | (.108) |
| Distributions from Realized Capital Gains | — | — | — |
| Total Distributions | (1.496) | (1.080) | (.108) |
| Net Asset Value, End of Period | $32.24 | $30.50 | $30.29 |
| |
| Total Return3 | 10.89% | 2.82% | -3.60% |
| |
| Ratios/Supplemental Data | | | |
| Net Assets, End of Period (Millions) | $21 | $10 | $0 |
| Ratio of Total Expenses to Average Net Assets | 0.29% | 0.29% | 0.30% |
| Ratio of Net Investment Income to Average Net Assets | 4.92% | 4.75% | 4.72% |
| Portfolio Turnover Rate 4 | 24% | 20%5 | 20%5 |
1 The class commenced operations on November 25, 2014. On December 18, 2014, all outstanding shares were redeemed and the Net Asset
Value represents the per share amount at which such shares were redeemed. On February 11, 2015, the class recommenced operations.
2 Includes increases from purchase fees of $.02 for the current period and $.04 in aggregate for periods prior to November 1, 2015.
3 Total returns do not include transaction or account service fees that may have applied in the period shown. Fund prospectuses provide
information about any applicable transaction and account service fees.
4 Excludes the value of portfolio securities received or delivered as a result of in-kind purchases or redemptions of the fund’s capital shares,
including ETF Creation Units.
5 Reflects the fund’s portfolio turnover for the fiscal year ended October 31, 2015.
See accompanying Notes, which are an integral part of the Financial Statements.
42
Emerging Markets Government Bond Index Fund
Notes to Financial Statements
Vanguard Emerging Markets Government Bond Index Fund is registered under the Investment Company Act of 1940 as an open-end investment company, or mutual fund. The fund invests in securities of foreign issuers, which may subject it to investment risks not normally associated with investing in securities of U.S. corporations. The fund offers four classes of shares: Investor Shares, ETF Shares, Admiral Shares, and Institutional Shares. Investor Shares are available to any investor who meets the fund’s minimum purchase requirements. ETF Shares are listed for trading on Nasdaq; they can be purchased and sold through a broker. Admiral Shares and Institutional Shares are designed for investors who meet certain administrative, service, and account-size criteria.
A. The following significant accounting policies conform to generally accepted accounting principles for U.S. investment companies. The fund consistently follows such policies in preparing its financial statements.
1. Security Valuation: Securities are valued as of the close of trading on the New York Stock Exchange (generally 4 p.m., Eastern time) on the valuation date. Bonds and temporary cash investments acquired over 60 days to maturity are valued using the latest bid prices or using valuations based on a matrix system (which considers such factors as security prices, yields, maturities, and ratings), both as furnished by independent pricing services. Investments in Vanguard Market Liquidity Fund are valued at that fund’s net asset value. Other temporary cash investments are valued at amortized cost, which approximates market value. Securities for which market quotations are not readily available, or whose values have been affected by events occurring before the fund’s pricing time but after the close of the securities’ primary markets, are valued at their fair values calculated according to procedures adopted by the board of trustees. These procedures include obtaining quotations from an independent pricing service, monitoring news to identify significant market- or security-specific events, and evaluating changes in the values of foreign market proxies (for example, ADRs, futures contracts, or exchange-traded funds), between the time the foreign markets close and the fund’s pricing time. When fair-value pricing is employed, the prices of securities used by a fund to calculate its net asset value may differ from quoted or published prices for the same securities.
2. Federal Income Taxes: The fund intends to continue to qualify as a regulated investment company and distribute all of its taxable income. Management has analyzed the fund’s tax positions taken for all open federal income tax years (October 31, 2013–2016), and has concluded that no provision for federal income tax is required in the fund’s financial statements.
3. Distributions: Distributions to shareholders are recorded on the ex-dividend date.
4. Credit Facility: The fund and certain other funds managed by The Vanguard Group (“Vanguard”) participate in a $3.1 billion committed credit facility provided by a syndicate of lenders pursuant to a credit agreement that may be renewed annually; each fund is individually liable for its borrowings, if any, under the credit facility. Borrowings may be utilized for temporary and emergency purposes, and are subject to the fund’s regulatory and contractual borrowing restrictions. The participating funds are charged administrative fees and an annual commitment fee of 0.10% of the undrawn amount of the facility; these fees are allocated to the funds based on a method approved by the fund’s board of trustees and included in Management and Administrative expenses on the fund’s Statement of
43
Emerging Markets Government Bond Index Fund
Operations. Any borrowings under this facility bear interest at a rate based upon the higher of the one-month London Interbank Offered Rate, federal funds effective rate, or overnight bank funding rate plus an agreed-upon spread.
The fund had no borrowings outstanding at October 31, 2016, or at any time during the period then ended.
5. Other: Interest income includes income distributions received from Vanguard Market Liquidity Fund and is accrued daily. Premiums and discounts on debt securities purchased are amortized and accreted, respectively, to interest income over the lives of the respective securities. Security transactions are accounted for on the date securities are bought or sold. Costs used to determine realized gains (losses) on the sale of investment securities are those of the specific securities sold. Fees assessed on capital share transactions are credited to paid-in capital.
Each class of shares has equal rights as to assets and earnings, except that each class separately bears certain class-specific expenses related to maintenance of shareholder accounts (included in Management and Administrative expenses) and shareholder reporting. Marketing and distribution expenses are allocated to each class of shares based on a method approved by the board of trustees. Income, other non-class-specific expenses, and gains and losses on investments are allocated to each class of shares based on its relative net assets.
B. In accordance with the terms of a Funds’ Service Agreement (the “FSA”) between Vanguard and the fund, Vanguard furnishes to the fund investment advisory, corporate management, administrative, marketing, and distribution services at Vanguard’s cost of operations (as defined by the FSA). These costs of operations are allocated to the fund based on methods and guidelines approved by the board of trustees. Vanguard does not require reimbursement in the current period for certain costs of operations (such as deferred compensation/benefits and risk/insurance costs); the fund’s liability for these costs of operations is included in Payables to Vanguard on the Statement of Net Assets.
Upon the request of Vanguard, the fund may invest up to 0.40% of its net assets as capital in Vanguard. At October 31, 2016, the fund had contributed to Vanguard capital in the amount of $83,000, representing 0.01% of the fund’s net assets and 0.03% of Vanguard’s capitalization. The fund’s trustees and officers are also directors and employees, respectively, of Vanguard.
C. Various inputs may be used to determine the value of the fund’s investments. These inputs are summarized in three broad levels for financial statement purposes. The inputs or methodologies used to value securities are not necessarily an indication of the risk associated with investing in those securities.
Level 1—Quoted prices in active markets for identical securities.
Level 2—Other significant observable inputs (including quoted prices for similar securities, interest rates, prepayment speeds, credit risk, etc.).
Level 3—Significant unobservable inputs (including the fund’s own assumptions used to determine the fair value of investments).
44
Emerging Markets Government Bond Index Fund
The following table summarizes the market value of the fund’s investments as of October 31, 2016, based on the inputs used to value them:
| | | |
| | Level 1 | Level 2 | Level 3 |
| Investments | ($000) | ($000) | ($000) |
| Sovereign Bonds | — | 1,080,594 | — |
| Temporary Cash Investments | 9,459 | — | — |
| Total | 9,459 | 1,080,594 | — |
D. Distributions are determined on a tax basis and may differ from net investment income and realized capital gains for financial reporting purposes. Differences may be permanent or temporary. Permanent differences are reclassified among capital accounts in the financial statements to reflect their tax character. Temporary differences arise when certain items of income, expense, gain, or loss are recognized in different periods for financial statement and tax purposes. These differences will reverse at some time in the future. Differences in classification may also result from the treatment of short-term gains as ordinary income for tax purposes.
During the year ended October 31, 2016, the fund realized $669,000 of net capital losses resulting from in-kind redemptions—in which shareholders exchanged fund shares for securities held by the fund rather than for cash. Because such losses are not taxable to the fund, and are not distributed to shareholders, they have been reclassified from accumulated net realized losses to paid-in capital.
For tax purposes, at October 31, 2016, the fund had $3,634,000 of ordinary income available for distribution. The fund had available capital losses totaling $4,868,000 that may be carried forward indefinitely to offset future net capital gains.
At October 31, 2016, the cost of investment securities for tax purposes was $1,056,689,000. Net unrealized appreciation of investment securities for tax purposes was $33,364,000, consisting of unrealized gains of $39,277,000 on securities that had risen in value since their purchase and $5,913,000 in unrealized losses on securities that had fallen in value since their purchase.
E. During the year ended October 31, 2016, the fund purchased $615,548,000 of investment securities and sold $219,189,000 of investment securities, other than U.S. government securities and temporary cash investments. Purchases and sales of U.S. government securities were $0 and $99,000, respectively. Total purchases and sales include $332,352,000 and $21,492,000, respectively, in connection with in-kind purchases and redemptions of the fund’s capital shares.
45
Emerging Markets Government Bond Index Fund
| | | | |
| F. Capital share transactions for each class of shares were: | | | |
| | | | Year Ended October 31, |
| | | 2016 | | 2015 |
| | Amount | Shares | Amount | Shares |
| | ($000) | (000) | ($000) | (000) |
| Investor Shares | | | | |
| Issued1 | 5,566 | 565 | 6,261 | 646 |
| Issued in Lieu of Cash Distributions | 392 | 40 | 339 | 35 |
| Redeemed | (3,714) | (379) | (4,445) | (461) |
| Net Increase (Decrease)—Investor Shares | 2,244 | 226 | 2,155 | 220 |
| ETF Shares | | | | |
| Issued1 | 357,502 | 4,601 | 338,399 | 4,403 |
| Issued in Lieu of Cash Distributions | — | — | — | — |
| Redeemed | (22,017) | (300) | (45,844) | (600) |
| Net Increase (Decrease)—ETF Shares | 335,485 | 4,301 | 292,555 | 3,803 |
| Admiral Shares | | | | |
| Issued1 | 77,994 | 3,984 | 53,419 | 2,758 |
| Issued in Lieu of Cash Distributions | 6,294 | 323 | 4,782 | 249 |
| Redeemed | (32,414) | (1,673) | (39,929) | (2,079) |
| Net Increase (Decrease)—Admiral Shares | 51,874 | 2,634 | 18,272 | 928 |
| Institutional Shares2 | | | | |
| Issued1 | 8,772 | 295 | 19,856 | 637 |
| Issued in Lieu of Cash Distributions | 845 | 27 | 354 | 12 |
| Redeemed | (38) | (1) | (9,535) | (315) |
| Net Increase (Decrease)—Institutional Shares | 9,579 | 321 | 10,675 | 334 |
1 Includes purchase fees for fiscal 2016 and 2015 of $620,000 and $592,000, respectively (fund totals).
2 Institutional shares were first issued on November 25, 2014, and were redeemed shortly thereafter. Institutional shares were next issued on February 11, 2015. The table reflects all Institutional transactions beginning November 25, 2014.
G. Management has determined that no material events or transactions occurred subsequent to October 31, 2016, that would require recognition or disclosure in these financial statements.
46
Report of Independent Registered Public Accounting Firm
To the Board of Trustees of Vanguard Whitehall Funds and the Shareholders of Vanguard Emerging Markets Government Bond Index Fund:
In our opinion, the accompanying statement of net assets and the related statements of operations and of changes in net assets and the financial highlights present fairly, in all material respects, the financial position of Vanguard Emerging Markets Government Bond Index Fund (constituting a separate portfolio of Vanguard Whitehall Funds, hereafter referred to as the “Fund”) at October 31, 2016, the results of its operations for the year then ended, the changes in its net assets for each of the two years in the period then ended, and the financial highlights for each of the periods indicated, in conformity with accounting principles generally accepted in the United States of America. These financial statements and financial highlights (hereafter referred to as “financial statements”) are the responsibility of the Fund’s management. Our responsibility is to express an opinion on these financial statements based on our audits. We conducted our audits of these financial statements in accordance with the standards of the Public Company Accounting Oversight Board (United States). Those standards require that we plan and perform the audit to obtain reasonable assurance about whether the financial statements are free of material misstatement. An audit includes examining, on a test basis, evidence supporting the amounts and disclosures in the financial statements, assessing the accounting principles used and significant estimates made by management, and evaluating the overall financial statement presentation. We believe that our audits, which included confirmation of securities at October 31, 2016 by correspondence with the custodian and brokers and by agreement to the underlying ownership records of the transfer agent, provide a reasonable basis for our opinion.
/s/PricewaterhouseCoopers LLP
Philadelphia, Pennsylvania
December 15, 2016
47
About Your Fund’s Expenses
As a shareholder of the fund, you incur ongoing costs, which include costs for portfolio management, administrative services, and shareholder reports (like this one), among others. Operating expenses, which are deducted from a fund’s gross income, directly reduce the investment return of the fund.
A fund’s expenses are expressed as a percentage of its average net assets. This figure is known as the expense ratio. The following examples are intended to help you understand the ongoing costs (in dollars) of investing in your fund and to compare these costs with those of other mutual funds. The examples are based on an investment of $1,000 made at the beginning of the period shown and held for the entire period.
The accompanying table illustrates your fund’s costs in two ways:
• Based on actual fund return. This section helps you to estimate the actual expenses that you paid over the period. The ”Ending Account Value“ shown is derived from the fund‘s actual return, and the third column shows the dollar amount that would have been paid by an investor who started with $1,000 in the fund. You may use the information here, together with the amount you invested, to estimate the expenses that you paid over the period.
To do so, simply divide your account value by $1,000 (for example, an $8,600 account value divided by $1,000 = 8.6), then multiply the result by the number given for your fund under the heading ”Expenses Paid During Period.“
• Based on hypothetical 5% yearly return. This section is intended to help you compare your fund‘s costs with those of other mutual funds. It assumes that the fund had a yearly return of 5% before expenses, but that the expense ratio is unchanged. In this case—because the return used is not the fund’s actual return—the results do not apply to your investment. The example is useful in making comparisons because the Securities and Exchange Commission requires all mutual funds to calculate expenses based on a 5% return. You can assess your fund’s costs by comparing this hypothetical example with the hypothetical examples that appear in shareholder reports of other funds.
Note that the expenses shown in the table are meant to highlight and help you compare ongoing costs only and do not reflect transaction costs incurred by the fund for buying and selling securities. Further, the expenses do not include any purchase, redemption, or account service fees described in the fund prospectus. If such fees were applied to your account, your costs would be higher. Your fund does not carry a “sales load.”
The calculations assume no shares were bought or sold during the period. Your actual costs may have been higher or lower, depending on the amount of your investment and the timing of any purchases or redemptions.
You can find more information about the fund’s expenses, including annual expense ratios, in the Financial Statements section of this report. For additional information on operating expenses and other shareholder costs, please refer to your fund’s current prospectus.
48
| | | |
| Six Months Ended October 31, 2016 | | | |
| | Beginning | Ending | Expenses |
| | Account Value | Account Value | Paid During |
| Emerging Markets Government Bond Index Fund | 4/30/2016 | 10/31/2016 | Period |
| Based on Actual Fund Return | | | |
| Investor Shares | $1,000.00 | $1,053.98 | $2.48 |
| ETF Shares | 1,000.00 | 1,055.68 | 1.60 |
| Admiral Shares | 1,000.00 | 1,055.94 | 1.60 |
| Institutional Shares | 1,000.00 | 1,055.87 | 1.45 |
| Based on Hypothetical 5% Yearly Return | | | |
| Investor Shares | $1,000.00 | $1,022.72 | $2.44 |
| ETF Shares | 1,000.00 | 1,023.58 | 1.58 |
| Admiral Shares | 1,000.00 | 1,023.58 | 1.58 |
| Institutional Shares | 1,000.00 | 1,023.73 | 1.42 |
The calculations are based on expenses incurred in the most recent six-month period. The fund’s annualized six-month expense ratios for that period are 0.48% for Investor Shares, 0.31% for ETF Shares, 0.31% for Admiral Shares, and 0.28% for Institutional Shares. The dollar amounts shown as “Expenses Paid” are equal to the annualized expense ratio multiplied by the average account value over the period, multiplied by the number of days in the most recent six-month period, then divided by the number of days in the most recent 12-month period (184/366).
49
Glossary
30-Day SEC Yield. A fund’s 30-day SEC yield is derived using a formula specified by the U.S. Securities and Exchange Commission. Under the formula, data related to the fund’s security holdings in the previous 30 days are used to calculate the fund’s hypothetical net income for that period, which is then annualized and divided by the fund’s estimated average net assets over the calculation period. For the purposes of this calculation, a security’s income is based on its current market yield to maturity (for bonds), its actual income (for asset-backed securities), or its projected dividend yield (for stocks). Because the SEC yield represents hypothetical annualized income, it will differ—at times significantly—from the fund’s actual experience. As a result, the fund’s income distributions may be higher or lower than implied by the SEC yield.
Average Coupon. The average interest rate paid on the fixed income securities held by a fund. It is expressed as a percentage of face value.
Average Duration. An estimate of how much the value of the bonds held by a fund will fluctuate in response to a change in interest rates. To see how the value could change, multiply the average duration by the change in rates. If interest rates rise by 1 percentage point, the value of the bonds in a fund with an average duration of five years would decline by about 5%. If rates decrease by a percentage point, the value would rise by 5%.
Average Effective Maturity. The average length of time until fixed income securities held by a fund reach maturity and are repaid, taking into consideration the possibility that the issuer may call the bond before its maturity date. The figure reflects the proportion of fund assets represented by each security; it also reflects any futures contracts held. In general, the longer the average effective maturity, the more a fund’s share price will fluctuate in response to changes in market interest rates.
Beta. A measure of the magnitude of a fund’s past share-price fluctuations in relation to the ups and downs of a given market index. The index is assigned a beta of 1.00. Compared with a given index, a fund with a beta of 1.20 typically would have seen its share price rise or fall by 12% when the index rose or fell by 10%. For this report, beta is based on returns over the past 36 months for both the fund and the index. Note that a fund’s beta should be reviewed in conjunction with its R-squared (see definition). The lower the R-squared, the less correlation there is between the fund and the index, and the less reliable beta is as an indicator of volatility.
Credit Quality. Credit-quality ratings are measured on a scale that generally ranges from AAA (highest) to D (lowest). U.S. Treasury, U.S. Agency, and U.S. Agency mortgage-backed securities appear under “U.S. Government.” Credit-quality ratings are obtained from Barclays and are from Moody’s, Fitch, and S&P. When ratings from all three agencies are used, the median rating is shown. When ratings from two of the agencies are used, the lower rating for each issue is shown. “Not Rated” is used to classify securities for which a rating is not available.
Expense Ratio. A fund’s total annual operating expenses expressed as a percentage of the fund’s average net assets. The expense ratio includes management and administrative expenses, but does not include the transaction costs of buying and selling portfolio securities.
Inception Date. The date on which the assets of a fund (or one of its share classes) are first invested in accordance with the fund’s investment objective. For funds with a subscription period, the inception date is the day after that period ends. Investment performance is measured from the inception date.
50
R-Squared. A measure of how much of a fund’s past returns can be explained by the returns from the market in general, as measured by a given index. If a fund’s total returns were precisely synchronized with an index’s returns, its R-squared would be 1.00. If the fund’s returns bore no relationship to the index’s returns, its R-squared would be 0. For this report, R-squared is based on returns over the past 36 months for both the fund and the index.
Short-Term Reserves. The percentage of a fund invested in highly liquid, short-term securities that can be readily converted to cash.
Yield to Maturity. The rate of return an investor would receive if the fixed income securities held by a fund were held to their maturity dates.
51
Vanguard Emerging Markets Government Bond Index Fund is not sponsored, endorsed, issued, sold, or promoted by Barclays Risk Analytics and Index Solutions Limited or any of its affiliates (“Barclays”). Barclays makes no representation or warranty, express or implied, to the owners or purchasers of Vanguard Emerging Markets Government Bond Index Fund or any member of the public regarding the advisability of investing in securities generally or in Vanguard Emerging Markets Government Bond Index Fund particularly or the ability of the Barclays Index to track general bond market performance. Barclays has not passed on the legality or suitability of Vanguard Emerging Markets Government Bond Index Fund with respect to any person or entity. Barclays’ only relationship to Vanguard and Vanguard Emerging Markets Government Bond Index Fund is the licensing of the Barclays index, which is determined, composed, and calculated by Barclays without regard to Vanguard or Vanguard Emerging Markets Government Bond Index Fund or any owners or purchasers of Vanguard Emerging Markets Government Bond Index Fund. Barclays has no obligation to take the needs of Vanguard, Vanguard Emerging Markets Government Bond Index Fund, or the owners of Vanguard Emerging Markets Government Bond Index Fund into consideration in determining, composing, or calculating the Barclays Index. Barclays is not responsible for and has not participated in the determination of the timing of, prices at, or quantities of Vanguard Emerging Markets Government Bond Index Fund to be issued. Barclays has no obligation or liability in connection with the administration, marketing, or trading of Vanguard Emerging Markets Government Bond Index Fund.
BARCLAYS SHALL HAVE NO LIABILITY TO THIRD PARTIES FOR THE QUALITY, ACCURACY, AND/OR COMPLETENESS OF THE INDEX OR ANY DATA INCLUDED THEREIN OR FOR INTERRUPTIONS IN THE DELIVERY OF THE INDEX. BARCLAYS MAKES NO WARRANTY, EXPRESS OR IMPLIED, AS TO RESULTS TO BE OBTAINED BY OWNERS OF VANGUARD EMERGING MARKETS GOVERNMENT BOND INDEX FUND OR ANY OTHER PERSON OR ENTITY FROM THE USE OF THE INDEX OR ANY DATA INCLUDED THEREIN IN CONNECTION WITH THE RIGHTS LICENSED HEREUNDER OR FOR ANY OTHER USE. BARCLAYS RESERVES THE RIGHT TO CHANGE THE METHODS OF CALCULATION OR PUBLICATION, OR TO CEASE THE CALCULATION OR PUBLICATION OF THE BLOOMBERG BARCLAYS USD EMERGING MARKETS GOVERNMENT RIC CAPPED INDEX, AND BARCLAYS SHALL NOT BE LIABLE FOR ANY MISCALCULATION OF OR ANY INCORRECT, DELAYED, OR INTERRUPTED PUBLICATION WITH RESPECT TO THE BLOOMBERG BARCLAYS USD EMERGING MARKETS GOVERNMENT RIC CAPPED INDEX. BARCLAYS MAKES NO EXPRESS OR IMPLIED WARRANTIES, AND HEREBY EXPRESSLY DISCLAIMS ALL WARRANTIES OF MERCHANTABILITY OR FITNESS FOR A PARTICULAR PURPOSE OR USE WITH RESPECT TO THE
INDEX OR ANY DATA INCLUDED THEREIN. BARCLAYS SHALL NOT BE LIABLE FOR ANY DAMAGES, INCLUDING, WITHOUT LIMITATION, ANY INDIRECT OR CONSEQUENTIAL DAMAGES RESULTING FROM THE USE OF THE INDEX OR ANY DATA INCLUDED THEREIN.
© 2016 Barclays. Used with Permission.
Source: Barclays Global Family of Indices. Copyright 2016, Barclays. All rights reserved.
52
This page intentionally left blank.
This page intentionally left blank.
This page intentionally left blank.
The People Who Govern Your Fund
The trustees of your mutual fund are there to see that the fund is operated and managed in your best interests since, as a shareholder, you are a part owner of the fund. Your fund’s trustees also serve on the board of directors of The Vanguard Group, Inc., which is owned by the Vanguard funds and provides services to them on an at-cost basis.
A majority of Vanguard’s board members are independent, meaning that they have no affiliation with Vanguard or the funds they oversee, apart from the sizable personal investments they have made as private individuals. The independent board members have distinguished backgrounds in business, academia, and public service. Each of the trustees and executive officers oversees 198 Vanguard funds.
The following table provides information for each trustee and executive officer of the fund. The mailing address of the trustees and officers is P.O. Box 876, Valley Forge, PA 19482. More information about the trustees is in the Statement of Additional Information, which can be obtained, without charge, by contacting Vanguard at 800-662-7447, or online at vanguard.com.
Interested Trustee1
F. William McNabb III
Born 1957. Trustee Since July 2009. Chairman of the Board. Principal Occupation(s) During the Past Five Years and Other Experience: Chairman of the Board of The Vanguard Group, Inc., and of each of the investment companies served by The Vanguard Group, since January 2010; Director of The Vanguard Group since 2008; Chief Executive Officer and President of The Vanguard Group, and of each of the investment companies served by The Vanguard Group, since 2008; Director of Vanguard Marketing Corporation; Managing Director of The Vanguard Group (1995–2008).
Independent Trustees
Emerson U. Fullwood
Born 1948. Trustee Since January 2008. Principal Occupation(s) During the Past Five Years and Other Experience: Executive Chief Staff and Marketing Officer for North America and Corporate Vice President (retired 2008) of Xerox Corporation (document management products and services); Executive in Residence and 2009–2010 Distinguished Minett Professor at the Rochester Institute of Technology; Lead Director of SPX FLOW, Inc. (multi-industry manufacturing); Director of the United Way of Rochester, the University of Rochester Medical Center, Monroe Community College Foundation, North Carolina A&T University, and Roberts Wesleyan College.
Rajiv L. Gupta
Born 1945. Trustee Since December 2001.2 Principal Occupation(s) During the Past Five Years and Other Experience: Chairman and Chief Executive Officer (retired 2009) and President (2006–2008) of Rohm and Haas Co. (chemicals); Director of Tyco International plc (diversified manufacturing and services), HP Inc. (printer and personal computer manufacturing), and Delphi Automotive plc (automotive components); Senior Advisor at New Mountain Capital.
Amy Gutmann
Born 1949. Trustee Since June 2006. Principal Occupation(s) During the Past Five Years and Other Experience: President of the University of Pennsylvania; Christopher H. Browne Distinguished Professor of Political Science, School of Arts and Sciences, and Professor of Communication, Annenberg School for Communication, with secondary faculty appointments in the Department of Philosophy, School of Arts and Sciences, and at the Graduate School of Education, University of Pennsylvania; Trustee of the National Constitution Center; Chair of the Presidential Commission for the Study of Bioethical Issues.
JoAnn Heffernan Heisen
Born 1950. Trustee Since July 1998. Principal Occupation(s) During the Past Five Years and Other Experience: Corporate Vice President and Chief Global Diversity Officer (retired 2008) and Member of the Executive Committee (1997–2008) of Johnson & Johnson (pharmaceuticals/medical devices/consumer products); Director of Skytop Lodge Corporation (hotels) and the Robert Wood Johnson Foundation; Member of the Advisory Board of the Institute for Women’s Leadership at Rutgers University.
F. Joseph Loughrey
Born 1949. Trustee Since October 2009. Principal Occupation(s) During the Past Five Years and Other Experience: President and Chief Operating Officer (retired 2009) of Cummins Inc. (industrial machinery); Chairman of the Board of Hillenbrand, Inc. (specialized consumer services), and of Oxfam America; Director of SKF AB (industrial machinery), Hyster-Yale Materials Handling, Inc. (forklift trucks), the Lumina Foundation for Education, and the V Foundation for Cancer Research; Member of the Advisory Council for the College of Arts and Letters and of the Advisory Board to the Kellogg Institute for International Studies, both at the University of Notre Dame.
Mark Loughridge
Born 1953. Trustee Since March 2012. Principal Occupation(s) During the Past Five Years and Other Experience: Senior Vice President and Chief Financial Officer (retired 2013) at IBM (information technology services); Fiduciary Member of IBM’s Retirement Plan Committee (2004–2013); Director of the Dow Chemical Company; Member of the Council on Chicago Booth.
Scott C. Malpass
Born 1962. Trustee Since March 2012. Principal Occupation(s) During the Past Five Years and Other Experience: Chief Investment Officer and Vice President at the University of Notre Dame; Assistant Professor of Finance at the Mendoza College of Business at Notre Dame; Member of the Notre Dame 403(b) Investment Committee, the Board of Advisors for Spruceview Capital Partners, and the Investment Advisory Committee of Major League Baseball; Board Member of TIFF Advisory Services, Inc., and Catholic Investment Services, Inc. (investment advisors).
André F. Perold
Born 1952. Trustee Since December 2004. Principal Occupation(s) During the Past Five Years and Other Experience: George Gund Professor of Finance and Banking, Emeritus at the Harvard Business School (retired 2011); Chief Investment Officer and Managing Partner of HighVista Strategies LLC (private investment firm); Director of Rand Merchant Bank; Overseer of the Museum of Fine Arts Boston.
Peter F. Volanakis
Born 1955. Trustee Since July 2009. Principal Occupation(s) During the Past Five Years and Other Experience: President and Chief Operating Officer (retired 2010) of Corning Incorporated (communications equipment); Chairman of the Board of Trustees of Colby-Sawyer College; Member of the Advisory Board of the Norris Cotton Cancer Center.
Executive Officers
Glenn Booraem
Born 1967. Treasurer Since May 2015. Principal Occupation(s) During the Past Five Years and Other Experience: Principal of The Vanguard Group, Inc.; Treasurer of each of the investment companies served by The Vanguard Group; Controller of each of the investment companies served by The Vanguard Group (2010–2015); Assistant Controller of each of the investment companies served by The Vanguard Group (2001–2010).
Thomas J. Higgins
Born 1957. Chief Financial Officer Since September 2008. Principal Occupation(s) During the Past Five Years and Other Experience: Principal of The Vanguard Group, Inc.; Chief Financial Officer of each of the investment companies served by The Vanguard Group; Treasurer of each of the investment companies served by The Vanguard Group (1998–2008).
Peter Mahoney
Born 1974. Controller Since May 2015. Principal Occupation(s) During the Past Five Years and Other Experience: Head of Global Fund Accounting at The Vanguard Group, Inc.; Controller of each of the investment companies served by The Vanguard Group; Head of International Fund Services at The Vanguard Group (2008–2014).
Anne E. Robinson
Born 1970. Secretary Since September 2016. Principal Occupation(s) During the Past Five Years and Other Experience: Managing Director of The Vanguard Group, Inc.; General Counsel of The Vanguard Group; Secretary of The Vanguard Group and of each of the investment companies served by The Vanguard Group; Director and Senior Vice President of Vanguard Marketing Corporation; Managing Director and General Counsel of Global Cards and Consumer Services at Citigroup (2014–2016); Counsel at American Express (2003–2014).
Vanguard Senior Management Team
| |
| Mortimer J. Buckley | James M. Norris |
| Kathleen C. Gubanich | Thomas M. Rampulla |
| Martha G. King | Glenn W. Reed |
| John T. Marcante | Karin A. Risi |
| Chris D. McIsaac | Michael Rollings |
Chairman Emeritus and Senior Advisor
John J. Brennan
Chairman, 1996–2009
Chief Executive Officer and President, 1996–2008
Founder
John C. Bogle
Chairman and Chief Executive Officer, 1974–1996
1 Mr. McNabb is considered an “interested person,” as defined in the Investment Company Act of 1940, because he is an officer of the Vanguard funds.
2 December 2002 for Vanguard Equity Income Fund, the Vanguard Municipal Bond Funds, and the Vanguard State Tax-Exempt Funds.
| |
|  |
| P.O. Box 2600 |
| Valley Forge, PA 19482-2600 |
| |
Connect with Vanguard® > vanguard.com | |
| |
| Fund Information > 800-662-7447 | |
| Direct Investor Account Services > 800-662-2739 | |
| Institutional Investor Services > 800-523-1036 | |
| Text Telephone for People | |
| Who Are Deaf or Hard of Hearing> 800-749-7273 | |
| |
| This material may be used in conjunction | |
| with the offering of shares of any Vanguard | |
| fund only if preceded or accompanied by | |
| the fund’s current prospectus. | |
| |
| All comparative mutual fund data are from Lipper, a | |
| Thomson Reuters Company, or Morningstar, Inc., unless | |
| otherwise noted. | |
| |
| You can obtain a free copy of Vanguard’s proxy voting | |
| guidelines by visiting vanguard.com/proxyreporting or by | |
| calling Vanguard at 800-662-2739. The guidelines are | |
| also available from the SEC’s website, sec.gov. In | |
| addition, you may obtain a free report on how your fund | |
| voted the proxies for securities it owned during the 12 | |
| months ended June 30. To get the report, visit either | |
| vanguard.com/proxyreporting or sec.gov. | |
| |
| You can review and copy information about your fund at | |
| the SEC’s Public Reference Room in Washington, D.C. To | |
| find out more about this public service, call the SEC at | |
| 202-551-8090. Information about your fund is also | |
| available on the SEC’s website, and you can receive | |
| copies of this information, for a fee, by sending a | |
| request in either of two ways: via email addressed to | |
| publicinfo@sec.gov or via regular mail addressed to the | |
| Public Reference Section, Securities and Exchange | |
| Commission, Washington, DC 20549-1520. | |
| |
| | © 2016 The Vanguard Group, Inc. |
| | All rights reserved. |
| | Vanguard Marketing Corporation, Distributor. |
| |
| | Q11200 122016 |
| |
 |
| Annual Report | October 31, 2016 |
| Vanguard Global Minimum Volatility Fund |
A new format, unwavering commitment
As you begin reading this report, you’ll notice that we’ve made some improvements to the opening sections—based on feedback from you, our clients.
Page 1 starts with a new ”Your Fund’s Performance at a Glance,” a concise, handy summary of how your fund performed during the period.
In the renamed ”Chairman’s Perspective,” Bill McNabb will focus on enduring principles and investment insights.
We’ve modified some tables, and eliminated some redundancy, but we haven’t removed any information.
At Vanguard, we’re always looking for better ways to communicate and to help you make sound investment decisions. Thank you for entrusting your assets to us.
| |
| Contents | |
| Your Fund’s Performance at a Glance. | 1 |
| Chairman’s Perspective. | 2 |
| Advisor’s Report. | 6 |
| Fund Profile. | 9 |
| Performance Summary. | 11 |
| Financial Statements. | 13 |
| Your Fund’s After-Tax Returns. | 33 |
| About Your Fund’s Expenses. | 34 |
| Glossary. | 36 |
Please note: The opinions expressed in this report are just that—informed opinions. They should not be considered promises or advice. Also, please keep in mind that the information and opinions cover the period through the date on the front of this report. Of course, the risks of investing in your fund are spelled out in the prospectus.
See the Glossary for definitions of investment terms used in this report.
About the cover: No matter what language you speak, Vanguard has one consistent message and set of principles. Our primary focus is on you, our clients. We conduct our business with integrity as a faithful steward of your assets. This message is shown translated into seven languages, reflecting our expanding global presence.
Your Fund’s Performance at a Glance
• Vanguard Global Minimum Volatility Fund returned more than 4% for the 12 months ended October 31, 2016, ahead of its benchmark and the average performance of its peers.
• The fund’s objective is to create a portfolio that has broad equity exposure with less volatility than the global equity market. During the fiscal year, the fund produced lower daily volatility and a higher risk-adjusted return than its benchmark, the FTSE Global All Cap Index (USD Hedged). (We calculate daily volatility and risk-adjusted return using standard deviation, as we discuss in the Advisor’s Report.)
• Overweight allocations to some benchmark sectors with less volatile returns, such as consumer staples, telecommunication services, and utilities, helped performance. An underweight allocation to energy limited exposure to one of the benchmark’s most volatile sectors.
• The fund benefited from having less exposure to South Africa than the benchmark but was hampered by small overweight positions in Brazil and Russia.
| |
| Total Returns: Fiscal Year Ended October 31, 2016 | |
| | Total |
| | Returns |
| Vanguard Global Minimum Volatility Fund | |
| Investor Shares | 4.23% |
| Admiral™ Shares | 4.39 |
| FTSE Global All Cap Index (USD Hedged) | 3.09 |
| Global Funds Average | 0.98 |
| Global Funds Average: Derived from data provided by Lipper, a Thomson Reuters Company. | |
| Admiral Shares carry lower expenses and are available to investors who meet certain account-balance requirements. | |
| | | |
| Expense Ratios | | | |
| Your Fund Compared With Its Peer Group | | | |
| | Investor | Admiral | Peer Group |
| | Shares | Shares | Average |
| Global Minimum Volatility Fund | 0.27% | 0.21% | 1.27% |
The fund expense ratios shown are from the prospectus dated February 25, 2016, and represent estimated costs for the current fiscal year. For the fiscal year ended October 31, 2016, the fund’s expense ratios were 0.25% for Investor Shares and 0.17% for Admiral Shares. The peer-group expense ratio is derived from data provided by Lipper, a Thomson Reuters Company, and captures information through year-end 2015.
Peer group: Global Funds.
1
Chairman’s Perspective

Bill McNabb
Chairman and Chief Executive Officer
Dear Shareholder,
Over the three years ended August 31, 2016, investors poured more than $1 trillion into index funds. Indexing now accounts for nearly a third of all mutual fund assets—more than double what it did a decade ago and eight times its share two decades ago.1
By contrast, active management’s commercial struggles have reflected its disappointing investment performance. Over the decade ended December 31, 2015, 82% of actively managed stock funds and 81% of active bond funds have either underperformed their benchmarks or shut down.
This subpar performance has fueled the explosion of asset growth in indexing among individual, retirement, and nonprofit investors. So what might the trend mean for the future of actively managed funds?
Our research and experience indicate that active management can survive—and even succeed—but only if it’s offered at much lower expense.
High costs, which limit a manager’s ability to deliver benchmark-beating returns to clients, are the biggest reason why active has lagged. Industrywide as of December 31, 2015, the average expense ratio for all active stock funds is 1.14%, compared with 0.76% for stock index
1 Sources: Wall Street Journal; Morningstar, Inc.; and Investment Company Institute,
2
funds. And the expense advantage is even wider for bonds; the average expense ratio for an active bond fund is 0.93%, compared with 0.43% for bond index funds.
But even these big differences understate the real gap. These days, it’s not hard to find an index fund that charges maybe 0.05% or 0.10%. So even if you have identified active managers who are skilled at selecting stocks and bonds, to match the return of a comparable (much cheaper) index fund would require significant outperformance. Think about it. Any fund that charges 1.00% in expenses—not even the high end of the range—will find it extraordinarily difficult to overcome the index fund’s head start.
Active management also has taken a hit from a regulatory environment that has been favorable to low-cost strategies. The U.S. Department of Labor several years ago mandated greater disclosure of retirement plan fees. And its new fiduciary rule, which is set to take effect in April, requires financial advisors to demonstrate that their recommendations are aligned with their clients’ best interest. Both changes encourage the use of lower-cost investments, including index funds.
The future of active management
In light of all this, people have been asking me whether active management is “dead.” My response is both yes and no. High-cost active management is dead, and rightly so. It has never been a winning proposition
| | | |
| Market Barometer | | | |
| | | Average Annual Total Returns |
| | | Periods Ended October 31, 2016 |
| | One | Three | Five |
| | Year | Years | Years |
| Stocks | | | |
| Russell 1000 Index (Large-caps) | 4.26% | 8.48% | 13.51% |
| Russell 2000 Index (Small-caps) | 4.11 | 4.12 | 11.51 |
| Russell 3000 Index (Broad U.S. market) | 4.24 | 8.13 | 13.35 |
| FTSE All-World ex US Index (International) | 0.64 | -0.94 | 4.09 |
| |
| Bonds | | | |
| Bloomberg Barclays U.S. Aggregate Bond Index | | | |
| (Broad taxable market) | 4.37% | 3.48% | 2.90% |
| Bloomberg Barclays Municipal Bond Index | | | |
| (Broad tax-exempt market) | 4.06 | 4.89 | 4.34 |
| Citigroup Three-Month U.S. Treasury Bill Index | 0.22 | 0.07 | 0.07 |
| |
| CPI | | | |
| Consumer Price Index | 1.64% | 1.15% | 1.32% |
3
for investors. Low-cost active funds, though, can potentially play an important role for investors who seek to outperform the market.
Paying less for your funds is the only sure-fire way to improve your odds of achieving success in active management. But even if you have found an active manager with low costs, the odds of outperforming the market are still long. You have to be able to identify talented stock and bond portfolio managers with long time horizons and clear investment strategies. Look for managers with consistent track records and the discipline to stick closely to their investment strategy.
Know what you own and why
Despite the well-deserved reputation of indexing and the challenges for active managers, there’s still a place for traditional active strategies that are low-cost, diversified, and highly disciplined, and are run by talented managers who focus on the long term.
Vanguard has always applied these principles to our active strategies, and investors have benefited as a majority of our active funds outperformed their benchmarks and bested their peers’ average annual return over the ten years ended September 30, 2016.
Worried about the election’s impact on your portfolio?
The 2016 presidential election season was one of the most intense and unpredictable in U.S. history. In its aftermath, investors may be left with lingering questions about what the outcome will mean for their portfolios. The answer, based on Vanguard research into decades of historical data, is that presidential elections typically have no long-term effect on market performance.
These findings hold true regardless of the market’s initial reaction. Whether there’s a swoon or bounce immediately after an election, investors shouldn’t extrapolate that performance to the long term.
As you can see in the accompanying chart, data going back to 1853 show that stock market returns are virtually identical no matter which party controls the White House. Although headlines out of Washington at any given time may still cause concern, investors
shouldn’t overreact to short-term events. Instead, it’s best to maintain a balanced and diversified portfolio and stay focused on your long-term goals.
Average annual stock market returns based on party control of the White House (1853–2015)
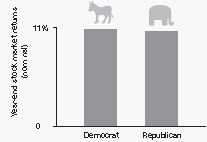
Sources: Global Financial Data, 1853–1926; Morningstar, Inc., and Ibbotson Associates thereafter through 2015.
4
But it’s crucial for investors to be patient. Even active managers with the best track records frequently underperform their benchmarks when their investment styles are out of favor. Such periods, though temporary, can persist. So it’s important when entrusting your assets to an active strategy to be in it for the long haul.
Make sure you know what you’re buying and what the risks are. Active strategies are becoming more complex, so it’s important to clearly understand what the investments in your portfolio are designed to accomplish and why you want to hold them. Otherwise, you run the risk of selecting strategies that don’t fit your needs or objectives.
Keeping these considerations in mind can potentially boost your chances of success in identifying active strategies that may be able to help you reach your goals.
As always, thank you for investing with Vanguard.
Sincerely,

F. William McNabb III
Chairman and Chief Executive Officer
November 9, 2016
5
Advisor’s Report
For the 12 months ended October 31, 2016, Vanguard Global Minimum Volatility Fund returned 4.23% for Investor Shares and 4.39% for Admiral Shares, with an annualized daily volatility of 10.7%. By comparison, its benchmark, the FTSE Global All Cap Index (USD Hedged), returned 3.09%, with an annualized daily volatility of 12.7%. (To get the annualized daily volatility, we calculate the standard deviation of daily returns and multiply it by the square root of 252, generally the number of trading days in a year.)
Investment objective
Our objective is to create a portfolio that has broad equity exposure with less volatility than the global equity market. We achieved this over the performance period, as the fund’s daily volatility averaged about 15.8% less than that of its benchmark.
It is important to mention, as we have in the past, that we do not target a specific volatility level. Rather, we seek to provide an equity fund that has lower absolute risk than the broad global market. Thus, when the broad global equity market is experiencing periods with spikes in volatility, you should expect this fund’s volatility to rise as well—just not by the same magnitude.
We recognize that equity-like returns are also an important outcome of an investment in this fund, but achieving a total return higher than the benchmark’s is not our objective. Although our research leads us to expect that, on average, a minimum volatility fund may outperform the overall global market in sharp
downturns (while still experiencing losses), the fund should be expected to trail in strong bull markets. With that in mind, because the fund is expected to have a lower level of risk than the global equity market, you should not expect it to outperform the market over the long run.
Over the long term, we think an acceptable comparative performance measure for the fund is its risk-adjusted return. This can be calculated by dividing the portfolio’s total return for the period by the annualized standard deviation of daily returns. We view 12 months to be a relatively short time, but for the most recent fiscal year, the risk-adjusted return was 0.40, compared with 0.24 for the benchmark. Over a slightly longer period—since the fund’s inception on December 12, 2013—its risk-adjusted return was 1.02, compared with 0.58 for the benchmark.
Investment strategy
In building our portfolio, we use quantitative models that evaluate a variety of factors that drive a stock’s volatility. These fundamental drivers include risk factors such as growth, value, dividend yields, size, volatility, and liquidity. In addition, our portfolio construction process includes estimates of each stock’s correlation—or how its factors move in relation to one another. This approach allows us to make appropriate risk/diversification trade-offs, while not relying solely on volatility estimates.
Our process also approaches currency exposure and its impact on a portfolio in a specific manner. We recognize that owning companies in foreign markets involves the
6
risk of movements in foreign currency exchange rates relative to the U.S. dollar. Because of this, an optimization process that focuses solely on volatilities tied to an investor’s home currency will tend to overweight exposures to that currency. We aim to avoid such currency-specific exposures by focusing on equity volatilities and correlations measured in local currency terms. Then we use currency forward contracts to hedge the resulting exposure for U.S. investors. We believe this process can further reduce the volatility of the portfolio overall in the long run.
Finally, when constructing the portfolio, we apply constraints to reduce stock, sector, and country concentration risk. We find that these constraints, which allow for broader diversification and liquidity, reduce unnecessarily high risk exposures without significantly affecting our ability to reduce overall volatility. Drawing from the universe of about 7,700 stocks in the FTSE index, we construct a portfolio of about 400–450 stocks.
The investment environment
The unhedged FTSE Global All Cap Index returned 2.74% for the fiscal year. This performance highlights the lower return environment for global equities, which struggled in late 2015 and early 2016 but recovered in the second and third quarters. Although only three of the 11 sectors in the benchmark had negative returns, larger sectors such as health care and financials drove down its overall return.
The fund’s hedged benchmark outperformed its unhedged counterpart by about a third of a percentage point.
In the second half of the fiscal year, we saw foreign currencies weaken relative to the U.S. dollar, helping absolute returns. However, those currencies strengthened in the first half of the year and therefore detracted from performance. As we have mentioned, Vanguard doesn’t forecast exchange rates or use currency hedging to enhance returns. Rather, hedging currency exposure is an important element of our volatility-reduction strategy.
Although the market did experience spikes in volatility over the period, average levels were still below longer-term expectations. For example, the Chicago Board Options Exchange Volatility Index (VIX), a measure of implied volatility of Standard & Poor’s 500 Index options, had a ten-year average level of 20.7, compared with 16.38 for the fiscal year.
The fund’s successes and shortfalls
We have cautioned that during periods of low volatility, expectations for the size of the portfolio’s volatility discount relative to the market should be tempered. Toward the end of the fiscal year, we saw the benchmark’s volatility levels drop significantly. At times, that volatility over these short measurement periods was lower than what the fund realized. For example, the 60-day annualized volatility of daily returns as of October 7 was 7.25% for the benchmark, compared with 8.33% for the fund.
It is important to recognize that there will be periods such as this, particularly when the market is experiencing historically low levels of volatility; however, we still maintain confidence in our process to
7
deliver lower volatility over the long term. In this regard, the fund met its objective of lower volatility than the broader equity market measured by daily volatility for the annual period. Additionally, the benefits of our strategy become even clearer when you seek to remove some of the noise caused by short-term reversals in daily returns, which can increase volatility levels, and focus on a longer return horizon such as monthly returns. For example, since inception, the fund has delivered a 31.3% reduction in the annualized volatility of monthly returns relative to its benchmark.
A combination of factors helped reduce the fund’s volatility during the fiscal year. Our strategy of holding stocks that have lower correlations with one another provided diversification benefits. On average, we were overweighted in less volatile sectors, such as consumer staples, telecommunication services, and utilities, and underweighted in two of the benchmark’s more volatile industry groups, energy and financials. As for country allocations, the fund benefited from having less exposure to South Africa than the benchmark but was hampered by small overweight positions in Brazil and Russia.
We continue to see our approach to portfolio construction pay off in reduced volatility. The portfolio also outperformed the benchmark in terms of relative return, but as we’ve noted, a strategy such as ours can reward or fall short of investor expectations over shorter periods. With this in mind, we find that focusing on the long-term risk-adjusted returns of the portfolio relative to the benchmark realigns expectations with the fund’s objective. We thank you for your investment and look forward to the new fiscal year.
Portfolio Managers:
Michael R. Roach, CFA
Anatoly Shtekhman, CFA
Binbin Guo, Principal, Head of Equity
Research and Portfolio Strategies
Vanguard Quantitative Equity Group
November 10, 2016
8
Global Minimum Volatility Fund
Fund Profile
As of October 31, 2016
| | |
| Share-Class Characteristics | |
| | Investor | Admiral |
| | Shares | Shares |
| Ticker Symbol | VMVFX | VMNVX |
| Expense Ratio1 | 0.27% | 0.21% |
| | |
| Portfolio Characteristics | | |
| | | FTSE Global |
| | | All Cap Index |
| | Fund | (USD Hedged) |
| Number of Stocks | 370 | 7,707 |
| Median Market Cap | $8.6B | $33.4B |
| Price/Earnings Ratio | 22.4x | 21.9x |
| Price/Book Ratio | 2.5x | 2.0x |
| Return on Equity | 15.4% | 15.5% |
| Earnings Growth | | |
| Rate | 5.7% | 7.8% |
| Dividend Yield | 2.6% | 2.5% |
| Turnover Rate | 58% | — |
| Short-Term Reserves | -0.4% | — |
| | |
| Sector Diversification (% of equity exposure) |
| | | FTSE Global |
| | | All Cap Index |
| | Fund | (USD Hedged) |
| Consumer Discretionary | 7.9% | 12.3% |
| Consumer Staples | 13.9 | 9.5 |
| Energy | 2.2 | 6.7 |
| Financials | 12.5 | 17.3 |
| Health Care | 13.9 | 10.9 |
| Industrials | 13.1 | 11.6 |
| Information Technology | 10.8 | 15.3 |
| Materials | 5.1 | 5.7 |
| Real Estate | 5.3 | 4.1 |
| Telecommunication Services | 7.1 | 3.2 |
| Utilities | 8.2 | 3.4 |
| | |
| Ten Largest Holdings (% of total net assets) |
| Taiwan Semiconductor | | |
| Manufacturing Co. Ltd. | Semiconductors | 1.5% |
| RenaissanceRe Holdings | | |
| Ltd. | Reinsurance | 1.5 |
| Waste Management Inc. Environmental & | |
| | Facilities Services | 1.5 |
| Expeditors International | Air Freight & | |
| of Washington Inc. | Logistics | 1.5 |
| United Parcel Service | Air Freight & | |
| Inc. | Logistics | 1.5 |
| HDFC Bank Ltd. | Diversified Banks | 1.5 |
| CLP Holdings Ltd. | Electric Utilities | 1.5 |
| Johnson & Johnson | Pharmaceuticals | 1.5 |
| BCE Inc. | Integrated | |
| | Telecommunication | |
| | Services | 1.4 |
| Church & Dwight Co. | | |
| Inc. | Household Products | 1.4 |
| Top Ten | | 14.8% |
The holdings listed exclude any temporary cash investments and equity index products.
Allocation by Region (% of equity exposure)
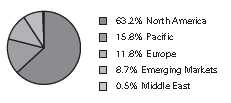
1 The expense ratios shown are from the prospectus dated February 25, 2016, and represent estimated costs for the current fiscal year. For the fiscal year ended October 31, 2016, the expense ratios were 0.25% for Investor Shares and 0.17% for Admiral Shares.
9
Global Minimum Volatility Fund
| | |
| Market Diversification (% of equity exposure) |
| | | FTSE |
| | | Global |
| | | All Cap |
| | | Index |
| | | (USD |
| | Fund | Hedged) |
| Europe | | |
| Switzerland | 5.3% | 2.7% |
| United Kingdom | 2.3 | 6.0 |
| Germany | 1.5 | 2.9 |
| Other | 2.7 | 8.5 |
| Subtotal | 11.8% | 20.1% |
| Pacific | | |
| Australia | 4.8% | 2.4% |
| Japan | 3.9 | 8.6 |
| South Korea | 3.2 | 1.6 |
| Hong Kong | 3.0 | 1.3 |
| Other | 0.9 | 0.5 |
| Subtotal | 15.8% | 14.4% |
| Emerging Markets | | |
| India | 2.3% | 1.2% |
| Taiwan | 2.2 | 1.5 |
| Brazil | 1.6 | 0.9 |
| Other | 2.6 | 5.7 |
| Subtotal | 8.7% | 9.3% |
| North America | | |
| United States | 56.8% | 52.7% |
| Canada | 6.4 | 3.3 |
| Subtotal | 63.2% | 56.0% |
| Middle East | 0.5% | 0.2% |
10
Global Minimum Volatility Fund
Performance Summary
All of the returns in this report represent past performance, which is not a guarantee of future results that may be achieved by the fund. (Current performance may be lower or higher than the performance data cited. For performance data current to the most recent month-end, visit our website at vanguard.com/performance.) Note, too, that both investment returns and principal value can fluctuate widely, so an investor’s shares, when sold, could be worth more or less than their original cost. The returns shown do not reflect taxes that a shareholder would pay on fund distributions or on the sale of fund shares.
Cumulative Performance: December 12, 2013, Through October 31, 2016
Initial Investment of $10,000
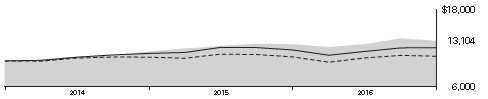
| | | |
| | Average Annual Total Returns | |
| | Periods Ended October 31, 2016 | |
| | | Since | Final Value |
| | One | Inception | of a $10,000 |
| | Year | (12/12/2013) | Investment |
| Global Minimum Volatility | | | |
| Fund*Investor Shares | 4.23% | 9.82% | $13,104 |
| FTSE Global All Cap Index (USD | | | |
| Hedged) | 3.09 | 6.72 | 12,063 |
| Global Funds Average | 0.98 | 2.46 | 10,725 |
Global Funds Average: Derived from data provided by Lipper, a Thomson Reuters Company.
"Since Inception" performance is calculated from the Investor Shares’ inception date for both the fund and its comparative standards.
| | | |
| | | Since | Final Value |
| | One | Inception | of a $50,000 |
| | Year | (12/12/2013) | Investment |
| Global Minimum Volatility Fund Admiral Shares | 4.39% | 9.92% | $65,697 |
| FTSE Global All Cap Index (USD Hedged) | 3.09 | 6.72 | 60,314 |
| "Since Inception" performance is calculated from the Admiral Shares’ inception date for both the fund and its comparative standards. |
See Financial Highlights for dividend and capital gains information.
11
Global Minimum Volatility Fund
Fiscal-Year Total Returns (%): December 12, 2013, Through October 31, 2016
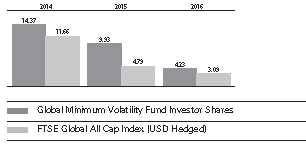
Average Annual Total Returns: Periods Ended September 30, 2016
This table presents returns through the latest calendar quarter—rather than through the end of the fiscal period.
Securities and Exchange Commission rules require that we provide this information.
| | | |
| | Inception | One | Since |
| | Date | Year | Inception |
| Investor Shares | 12/12/2013 | 10.99% | 11.08% |
| Admiral Shares | 12/12/2013 | 11.12 | 11.19 |
12
Global Minimum Volatility Fund
Financial Statements
Statement of Net Assets
As of October 31, 2016
The fund reports a complete list of its holdings in regulatory filings four times in each fiscal year, at the quarter-ends. For the second and fourth fiscal quarters, the lists appear in the fund’s semiannual and annual reports to shareholders. For the first and third fiscal quarters, the fund files the lists with the Securities and Exchange Commission on Form N-Q. Shareholders can look up the fund’s Forms N-Q on the SEC’s website at sec.gov. Forms N-Q may also be reviewed and copied at the SEC’s Public Reference Room (see the back cover of this report for further information).
| | |
| | | Market |
| | | Value• |
| | Shares | ($000) |
| Common Stocks (99.1%)1 | | |
| Australia (4.7%) | | |
| AGL Energy Ltd. | 827,252 | 12,051 |
| Wesfarmers Ltd. | 367,202 | 11,434 |
| Transurban Group | 1,226,320 | 9,676 |
| Stockland | 2,204,185 | 7,403 |
| Ramsay Health Care Ltd. | 98,463 | 5,483 |
| Cochlear Ltd. | 44,476 | 4,321 |
| JB Hi-Fi Ltd. | 193,336 | 4,168 |
| DUET Group | 2,084,006 | 3,773 |
| Caltex Australia Ltd. | 151,102 | 3,517 |
| Coca-Cola Amatil Ltd. | 358,529 | 2,597 |
| ASX Ltd. | 72,176 | 2,582 |
| GPT Group | 514,397 | 1,819 |
| Sonic Healthcare Ltd. | 107,293 | 1,669 |
| Aurizon Holdings Ltd. | 407,600 | 1,510 |
| BWP Trust | 383,701 | 865 |
| Goodman Group | 119,454 | 616 |
| Charter Hall Retail REIT | 191,055 | 602 |
| | | 74,086 |
| Belgium (0.6%) | | |
| Colruyt SA | 113,482 | 6,099 |
| Elia System Operator SA/NV | 23,212 | 1,201 |
| Sofina SA | 6,290 | 879 |
| Cofinimmo SA | 5,474 | 641 |
| | | 8,820 |
| Brazil (1.6%) | | |
| Telefonica Brasil SA ADR | 726,126 | 10,456 |
| BRF SA ADR | 474,056 | 7,926 |
| Ambev SA ADR | 889,910 | 5,251 |
| TIM Participacoes SA ADR | 61,005 | 845 |
| Cia de Saneamento Basico | | |
| do Estado de Sao Paulo | | |
| ADR | 66,423 | 699 |
| | | 25,177 |
| Canada (6.4%) | | |
| BCE Inc. | 499,910 | 22,713 |
| TELUS Corp. | 447,081 | 14,476 |
| ^ Dollarama Inc. | 184,597 | 13,794 |
| | | |
| | Emera Inc. | 316,311 | 11,032 |
| | Shaw Communications Inc. | | |
| | Class B | 403,497 | 7,996 |
| ^ | Canadian Tire Corp. Ltd. | | |
| | Class A | 63,338 | 6,157 |
| | TransCanada Corp. | 87,611 | 3,966 |
| ^ | Bank of Montreal | 60,681 | 3,862 |
| | Pembina Pipeline Corp. | 108,535 | 3,335 |
| | Intact Financial Corp. | 35,402 | 2,406 |
| ^ | Metro Inc. | 72,882 | 2,253 |
| | Fortis Inc. | 62,428 | 2,055 |
| ^ | Cineplex Inc. | 49,300 | 1,874 |
| | Parkland Fuel Corp. | 66,839 | 1,561 |
| 2 | Hydro One Ltd. | 59,688 | 1,089 |
| | Open Text Corp. | 17,262 | 1,072 |
| | H&R REIT | 37,097 | 631 |
| ^ | RioCan REIT | 30,410 | 591 |
| | | | 100,863 |
| Chile (0.2%) | | |
| | Enersis Americas SA ADR | 150,624 | 1,306 |
| | Sociedad Quimica y Minera | | |
| | de Chile SA ADR | 41,614 | 1,217 |
| | Cia Cervecerias Unidas SA | | |
| | ADR | 30,786 | 662 |
| | | | 3,185 |
| China (0.3%) | | |
| | China Mobile Ltd. ADR | 76,191 | 4,376 |
| |
| Denmark (0.2%) | | |
| | ISS A/S | 44,768 | 1,757 |
| | William Demant Holding A/S | 30,782 | 573 |
| | Royal Unibrew A/S | 9,785 | 458 |
| | | | 2,788 |
| France (0.0%) | | |
| | BioMerieux | 4,866 | 709 |
| |
| Germany (1.4%) | | |
| | Merck KGaA | 56,421 | 5,807 |
| | adidas AG | 23,444 | 3,852 |
| | STADA Arzneimittel AG | 71,425 | 3,582 |
13
Global Minimum Volatility Fund
| | |
| | | Market |
| | | Value• |
| | Shares | ($000) |
| Fielmann AG | 39,184 | 2,720 |
| Celesio AG | 61,654 | 1,730 |
| MTU Aero Engines AG | 15,632 | 1,632 |
| LANXESS AG | 21,418 | 1,373 |
| RHOEN-KLINIKUM AG | 44,813 | 1,247 |
| Henkel AG & Co. KGaA | | |
| Preference Shares | 4,820 | 620 |
| | | 22,563 |
| Hong Kong (3.0%) | | |
| CLP Holdings Ltd. | 2,289,850 | 23,276 |
| Hang Seng Bank Ltd. | 298,000 | 5,374 |
| Power Assets Holdings | | |
| Ltd. | 531,500 | 4,988 |
| AAC Technologies | | |
| Holdings Inc. | 414,000 | 3,944 |
| Yuexiu REIT | 5,326,000 | 3,055 |
| Cheung Kong | | |
| Infrastructure Holdings | | |
| Ltd. | 297,000 | 2,431 |
| Want Want China | | |
| Holdings Ltd. | 3,487,000 | 2,123 |
| Chow Tai Fook Jewellery | | |
| Group Ltd. | 1,969,600 | 1,397 |
| | | 46,588 |
| India (2.3%) | | |
| HDFC Bank Ltd. ADR | 330,170 | 23,369 |
| Dr Reddy’s Laboratories | | |
| Ltd. ADR | 177,457 | 8,747 |
| Infosys Ltd. ADR | 255,677 | 3,902 |
| | | 36,018 |
| Indonesia (0.5%) | | |
| Telekomunikasi Indonesia | | |
| Persero Tbk PT ADR | 246,300 | 8,002 |
| |
| Ireland (0.1%) | | |
| Kerry Group plc Class A | 11,196 | 813 |
| |
| Israel (0.5%) | | |
| Bank Hapoalim BM | 400,095 | 2,308 |
| Bezeq The Israeli | | |
| Telecommunication Corp. | | |
| Ltd. | 893,813 | 1,623 |
| Teva Pharmaceutical | | |
| Industries Ltd. | 37,909 | 1,583 |
| Teva Pharmaceutical | | |
| Industries Ltd. ADR | 26,908 | 1,150 |
| Paz Oil Co. Ltd. | 5,690 | 889 |
| | | 7,553 |
| Italy (0.1%) | | |
| Terna Rete Elettrica | | |
| Nazionale SPA | 305,099 | 1,493 |
| | |
| Japan (3.8%) | | |
| Sawai Pharmaceutical Co. | | |
| Ltd. | 136,000 | 8,789 |
| Mitsubishi Tanabe | | |
| Pharma Corp. | 386,900 | 7,531 |
| Daiichi Sankyo Co. Ltd. | 283,100 | 6,803 |
| Takeda Pharmaceutical | | |
| Co. Ltd. | 151,100 | 6,758 |
| Kagome Co. Ltd. | 221,800 | 5,816 |
| Sumitomo Dainippon | | |
| Pharma Co. Ltd. | 290,100 | 5,024 |
| Taisho Pharmaceutical | | |
| Holdings Co. Ltd. | 37,700 | 3,678 |
| TonenGeneral Sekiyu KK | 355,000 | 3,495 |
| MOS Food Services Inc. | 60,500 | 2,032 |
| Canon Inc. | 69,800 | 2,005 |
| Toho Co. Ltd. | 49,100 | 1,473 |
| Sankyo Co. Ltd. | 40,300 | 1,420 |
| Takashimaya Co. Ltd. | 119,000 | 970 |
| Rohto Pharmaceutical Co. | | |
| Ltd. | 51,000 | 895 |
| Ringer Hut Co. Ltd. | 28,800 | 733 |
| ABC-Mart Inc. | 10,200 | 621 |
| Earth Chemical Co. Ltd. | 13,200 | 613 |
| Toyo Suisan Kaisha Ltd. | 15,000 | 608 |
| Studio Alice Co. Ltd. | 28,500 | 575 |
| | | 59,839 |
| Mexico (0.8%) | | |
| Fomento Economico | | |
| Mexicano SAB de CV ADR | 91,132 | 8,719 |
| Grupo Aeroportuario del | | |
| Pacifico SAB de CV ADR | 34,717 | 3,355 |
| Grupo Televisa SAB ADR | 34,665 | 850 |
| | | 12,924 |
| Norway (0.5%) | | |
| Orkla ASA | 673,403 | 6,358 |
| Norsk Hydro ASA | 269,503 | 1,205 |
| | | 7,563 |
| Russia (0.8%) | | |
| Novatek OJSC GDR | 50,176 | 5,350 |
| MMC Norilsk Nickel PJSC | | |
| ADR | 301,262 | 4,544 |
| Gazprom PJSC ADR | 546,875 | 2,358 |
| | | 12,252 |
| Singapore (0.9%) | | |
| Oversea-Chinese Banking | | |
| Corp. Ltd. | 1,025,748 | 6,249 |
| United Overseas Bank Ltd. | 249,700 | 3,369 |
| Singapore Airlines Ltd. | 409,400 | 2,979 |
| Wilmar International Ltd. | 481,400 | 1,143 |
| CapitaLand Mall Trust | 270,700 | 403 |
| | | 14,143 |
14
Global Minimum Volatility Fund
| | | |
| | | | Market |
| | | | Value• |
| | | Shares | ($000) |
| South Korea (3.2%) | | |
| | KT Corp. | 510,114 | 14,390 |
| | Korea Zinc Co. Ltd. | 26,278 | 10,434 |
| | SK Telecom Co. Ltd. | 49,961 | 9,794 |
| | Woori Bank | 260,724 | 2,841 |
| | NAVER Corp. | 3,041 | 2,275 |
| | GS Holdings Corp. | 45,783 | 2,037 |
| | Hotel Shilla Co. Ltd. | 24,691 | 1,235 |
| | Kakao Corp. | 16,227 | 1,082 |
| | E-MART Inc. | 7,382 | 1,047 |
| | Kangwon Land Inc. | 30,739 | 1,019 |
| | S-Oil Corp. | 13,445 | 919 |
| | Macquarie Korea | | |
| | Infrastructure Fund | 106,880 | 823 |
| | CJ CheilJedang Corp. | 2,635 | 804 |
| | Samsung Card Co. Ltd. | 19,017 | 801 |
| | LG Corp. | 13,123 | 702 |
| | Daewoong Pharmaceutical | | |
| | Co. Ltd. | 8,065 | 480 |
| | | | 50,683 |
| Spain (0.2%) | | |
| | Endesa SA | 74,331 | 1,578 |
| * | Red Electrica Corp. SA | 62,340 | 1,299 |
| | Viscofan SA | 9,941 | 468 |
| | Ebro Foods SA | 17,809 | 384 |
| | | | 3,729 |
| Sweden (0.9%) | | |
| | Swedish Match AB | 351,800 | 12,243 |
| ^ | Tele2 AB | 133,241 | 1,100 |
| * | Tele2 AB Rights Exp. | | |
| | 11/16/2016 | 133,241 | 40 |
| | | | 13,383 |
| Switzerland (5.3%) | | |
| | Kuehne & Nagel | | |
| | International AG | 108,640 | 14,725 |
| | Swisscom AG | 32,097 | 14,672 |
| | Sonova Holding AG | 103,137 | 13,832 |
| | Logitech International SA | 567,125 | 13,717 |
| | Baloise Holding AG | 54,703 | 6,730 |
| | Sika AG | 742 | 3,566 |
| | dorma&kaba Holding AG | 4,796 | 3,333 |
| | Swiss Prime Site AG | 38,590 | 3,201 |
| | Chocoladefabriken Lindt & | | |
| | Spruengli AG Participation | | |
| | Certificates | 493 | 2,560 |
| * | Flughafen Zuerich AG | 9,890 | 1,818 |
| | Partners Group Holding AG | 3,186 | 1,613 |
| | Allreal Holding AG | 9,242 | 1,360 |
| | Siegfried Holding AG | 3,851 | 792 |
| | EMS-Chemie Holding AG | 1,292 | 649 |
| | Straumann Holding AG | 1,611 | 604 |
| | Chocoladefabriken Lindt & | | |
| | Spruengli AG Registered | | |
| | Shares | 5 | 310 |
| | | | 83,482 |
| | | |
| Taiwan (2.2%) | | |
| | Taiwan Semiconductor | | |
| | Manufacturing Co. Ltd. | | |
| | ADR | 781,827 | 24,315 |
| | Chunghwa Telecom Co. | | |
| | Ltd. ADR | 161,501 | 5,515 |
| | Siliconware Precision | | |
| | Industries Co. Ltd. ADR | 486,505 | 3,644 |
| | United Microelectronics | | |
| | Corp. ADR | 649,400 | 1,234 |
| | | | 34,708 |
| United Kingdom (2.2%) | | |
| | Royal Mail plc | 926,507 | 5,559 |
| | DCC plc | 56,090 | 4,563 |
| | GlaxoSmithKline plc | 179,759 | 3,551 |
| | UBM plc | 329,554 | 2,893 |
| 2 | Merlin Entertainments plc | 454,738 | 2,563 |
| | Tate & Lyle plc | 237,881 | 2,269 |
| | Direct Line Insurance | | |
| | Group plc | 488,288 | 2,066 |
| | Reckitt Benckiser Group plc | 19,275 | 1,724 |
| | SSE plc | 79,867 | 1,553 |
| | RELX NV | 62,909 | 1,123 |
| | Croda International plc | 25,289 | 1,081 |
| | UK Commercial Property | | |
| | Trust Ltd. | 899,207 | 859 |
| | Playtech plc | 73,865 | 838 |
| | Meggitt plc | 126,346 | 672 |
| | F&C Commercial Property | | |
| | Trust Ltd. | 434,498 | 667 |
| | Greene King plc | 71,219 | 637 |
| | Indivior plc | 156,397 | 601 |
| | RPC Group plc | 51,115 | 593 |
| | Inchcape plc | 73,936 | 588 |
| | Regus plc | 175,484 | 534 |
| | Ultra Electronics Holdings | | |
| | plc | 17,786 | 404 |
| | | | 35,338 |
| United States (56.4%) | | |
| Consumer Discretionary (4.0%) | | |
| | Aramark | 349,903 | 13,027 |
| | Pool Corp. | 84,362 | 7,810 |
| | Genuine Parts Co. | 71,939 | 6,517 |
| | Service Corp. International | 164,437 | 4,210 |
| * | Madison Square Garden Co. | | |
| | Class A | 23,169 | 3,834 |
| | Ross Stores Inc. | 53,680 | 3,357 |
| | Children’s Place Inc. | 42,525 | 3,230 |
| * | AutoZone Inc. | 4,052 | 3,007 |
| * | Murphy USA Inc. | 31,141 | 2,142 |
| * | O’Reilly Automotive Inc. | 7,200 | 1,904 |
| | Monro Muffler Brake Inc. | 29,134 | 1,602 |
| | Cable One Inc. | 2,569 | 1,482 |
| | Churchill Downs Inc. | 10,875 | 1,479 |
15
| | | |
| Global Minimum Volatility Fund | |
| |
| |
| |
| | | | Market |
| | | | Value• |
| | | Shares | ($000) |
| * | Liberty Media Corp-Liberty | | |
| | Media Class A | 47,245 | 1,315 |
| | Vail Resorts Inc. | 8,163 | 1,302 |
| * | Liberty Broadband Corp. | 18,359 | 1,224 |
| ^ | Regal Entertainment Group | | |
| | Class A | 52,989 | 1,140 |
| * | LifeLock Inc. | 52,557 | 846 |
| | John Wiley & Sons Inc. | | |
| | Class A | 14,755 | 761 |
| | DineEquity Inc. | 9,310 | 736 |
| | Choice Hotels International | | |
| | Inc. | 13,846 | 671 |
| * | Liberty Media Corp-Liberty | | |
| | Media | 22,710 | 622 |
| | New York Times Co. Class A | 45,523 | 496 |
| | | | 62,714 |
| Consumer Staples (8.5%) | | |
| | Church & Dwight Co. Inc. | 463,846 | 22,385 |
| | Spectrum Brands Holdings | | |
| | Inc. | 162,208 | 21,937 |
| | Clorox Co. | 165,989 | 19,922 |
| | Kimberly-Clark Corp. | 131,329 | 15,025 |
| | Vector Group Ltd. | 668,791 | 14,005 |
| | Sysco Corp. | 225,737 | 10,862 |
| | Colgate-Palmolive Co. | 146,189 | 10,432 |
| | Altria Group Inc. | 103,245 | 6,827 |
| | Lancaster Colony Corp. | 33,726 | 4,406 |
| | Philip Morris International | | |
| | Inc. | 31,600 | 3,048 |
| | Ingredion Inc. | 9,889 | 1,297 |
| | WD-40 Co. | 7,491 | 799 |
| | Fresh Del Monte Produce | | |
| | Inc. | 12,537 | 757 |
| | J&J Snack Foods Corp. | 4,400 | 537 |
| | McCormick & Co. Inc. | 5,400 | 518 |
| | | | 132,757 |
| Energy (0.4%) | | |
| | Cosan Ltd. | 289,575 | 2,577 |
| | World Fuel Services Corp. | 61,476 | 2,474 |
| | Exxon Mobil Corp. | 23,497 | 1,958 |
| | | | 7,009 |
| Financials (8.2%) | | |
| | RenaissanceRe Holdings | | |
| | Ltd. | 194,300 | 24,150 |
| | Washington Federal Inc. | 397,132 | 10,822 |
| | Brown & Brown Inc. | 226,200 | 8,338 |
| | Chimera Investment Corp. | 453,330 | 7,104 |
| | ProAssurance Corp. | 132,894 | 7,083 |
| | Two Harbors Investment | | |
| | Corp. | 818,470 | 6,818 |
| | Capitol Federal Financial | | |
| | Inc. | 455,900 | 6,688 |
| | Beneficial Bancorp Inc. | 433,982 | 6,293 |
| | Arthur J Gallagher & Co. | 107,283 | 5,174 |
| | | |
| | Blackstone Mortgage Trust | | |
| | Inc. Class A | 151,797 | 4,584 |
| * | Essent Group Ltd. | 150,286 | 3,974 |
| | TFS Financial Corp. | 219,700 | 3,915 |
| | Starwood Property Trust | | |
| | Inc. | 159,460 | 3,546 |
| | Oritani Financial Corp. | 206,400 | 3,230 |
| | MFA Financial Inc. | 418,444 | 3,059 |
| | Marsh & McLennan Cos. | | |
| | Inc. | 46,600 | 2,954 |
| * | Arch Capital Group Ltd. | 36,803 | 2,870 |
| | AGNC Investment Corp. | 133,795 | 2,684 |
| | Capstead Mortgage Corp. | 241,849 | 2,300 |
| | American Financial Group | | |
| | Inc. | 23,331 | 1,738 |
| | People’s United Financial | | |
| | Inc. | 103,849 | 1,686 |
| | Northwest Bancshares Inc. | 97,172 | 1,529 |
| | Axis Capital Holdings Ltd. | 25,360 | 1,445 |
| | Allied World Assurance Co. | | |
| | Holdings AG | 28,896 | 1,242 |
| | Annaly Capital Management | | |
| | Inc. | 108,600 | 1,125 |
| | Torchmark Corp. | 15,808 | 1,002 |
| | White Mountains Insurance | | |
| | Group Ltd. | 1,126 | 934 |
| | CYS Investments Inc. | 102,919 | 887 |
| | Brookline Bancorp Inc. | 68,100 | 872 |
| | Investors Bancorp Inc. | 54,095 | 663 |
| | Safety Insurance Group Inc. | 6,600 | 447 |
| | Dime Community | | |
| | Bancshares Inc. | 25,000 | 405 |
| | | | 129,561 |
| Health Care (7.7%) | | |
| | Johnson & Johnson | 198,616 | 23,037 |
| | Owens & Minor Inc. | 481,544 | 15,626 |
| * | Intuitive Surgical Inc. | 20,646 | 13,876 |
| | CR Bard Inc. | 38,267 | 8,292 |
| | Patterson Cos. Inc. | 171,936 | 7,343 |
| * | Laboratory Corp. of | | |
| | America Holdings | 53,901 | 6,756 |
| | Teleflex Inc. | 43,021 | 6,158 |
| | Chemed Corp. | 42,398 | 5,996 |
| * | Henry Schein Inc. | 32,476 | 4,845 |
| | Pfizer Inc. | 135,771 | 4,305 |
| | Hill-Rom Holdings Inc. | 62,433 | 3,459 |
| | Quest Diagnostics Inc. | 41,446 | 3,375 |
| | Danaher Corp. | 36,900 | 2,899 |
| * | Integra LifeSciences | | |
| | Holdings Corp. | 33,397 | 2,655 |
| | Eli Lilly & Co. | 34,411 | 2,541 |
| * | Varian Medical Systems Inc. | 20,456 | 1,856 |
| * | ICU Medical Inc. | 11,241 | 1,566 |
| | Cantel Medical Corp. | 21,506 | 1,532 |
| * | HealthEquity Inc. | 34,293 | 1,140 |
16
Global Minimum Volatility Fund
| | | |
| | | | Market |
| | | | Value• |
| | | Shares | ($000) |
| | Dentsply Sirona Inc. | 19,519 | 1,124 |
| * | Bio-Rad Laboratories Inc. | | |
| | Class A | 5,785 | 915 |
| * | Premier Inc. Class A | 26,952 | 858 |
| * | WellCare Health Plans Inc. | 5,571 | 632 |
| * | Masimo Corp. | 19 | 1 |
| | | | 120,787 |
| Industrials (9.5%) | | |
| | Waste Management Inc. | 366,593 | 24,071 |
| | Expeditors International of | | |
| | Washington Inc. | 457,904 | 23,568 |
| | United Parcel Service Inc. | | |
| | Class B | 217,051 | 23,389 |
| | Northrop Grumman Corp. | 56,788 | 13,004 |
| | L-3 Communications | | |
| | Holdings Inc. | 90,664 | 12,416 |
| | Carlisle Cos. Inc. | 78,206 | 8,200 |
| | Rollins Inc. | 194,918 | 6,007 |
| | BWX Technologies Inc. | 137,363 | 5,387 |
| | Republic Services Inc. | | |
| | Class A | 97,995 | 5,158 |
| * | Copart Inc. | 82,419 | 4,325 |
| | General Dynamics Corp. | 20,100 | 3,030 |
| | Lockheed Martin Corp. | 11,992 | 2,955 |
| | Cintas Corp. | 22,330 | 2,382 |
| | 3M Co. | 14,100 | 2,331 |
| | Healthcare Services | | |
| | Group Inc. | 62,724 | 2,319 |
| | Huntington Ingalls | | |
| | Industries Inc. | 12,812 | 2,067 |
| * | Teledyne Technologies Inc. | 17,400 | 1,874 |
| | National Presto Industries | | |
| | Inc. | 20,674 | 1,804 |
| | KAR Auction Services Inc. | 42,236 | 1,798 |
| | Matthews International Corp. | | |
| | Class A | 16,715 | 1,001 |
| | UniFirst Corp. | 7,195 | 881 |
| | Rockwell Collins Inc. | 8,803 | 742 |
| | Raytheon Co. | 4,852 | 663 |
| | | | 149,372 |
| Information Technology (7.0%) | | |
| | Jack Henry & Associates | | |
| | Inc. | 273,567 | 22,164 |
| | Paychex Inc. | 288,625 | 15,932 |
| | Amdocs Ltd. | 253,968 | 14,845 |
| | Broadridge Financial | | |
| | Solutions Inc. | 148,843 | 9,624 |
| | Automatic Data Processing | | |
| | Inc. | 58,893 | 5,127 |
| | Motorola Solutions Inc. | 68,600 | 4,979 |
| * | Synopsys Inc. | 72,182 | 4,281 |
| | Harris Corp. | 47,898 | 4,273 |
| | InterDigital Inc. | 43,826 | 3,096 |
| | Amphenol Corp. Class A | 44,813 | 2,955 |
| | | |
| * | CACI International Inc. | | |
| | Class A | 28,540 | 2,793 |
| * | Euronet Worldwide Inc. | 20,797 | 1,654 |
| | Mentor Graphics Corp. | 52,586 | 1,520 |
| | Science Applications | | |
| | International Corp. | 20,701 | 1,427 |
| * | Cardtronics plc Class A | 27,712 | 1,386 |
| * | Genpact Ltd. | 60,068 | 1,381 |
| | Dolby Laboratories Inc. | | |
| | Class A | 28,616 | 1,362 |
| | CDW Corp. | 29,393 | 1,320 |
| * | Viavi Solutions Inc. | 184,091 | 1,311 |
| * | Gartner Inc. | 14,108 | 1,214 |
| | Cognex Corp. | 22,595 | 1,166 |
| | DST Systems Inc. | 11,785 | 1,133 |
| * | NETGEAR Inc. | 19,490 | 984 |
| | Littelfuse Inc. | 5,994 | 836 |
| * | Itron Inc. | 13,161 | 709 |
| | CSG Systems | | |
| | International Inc. | 18,286 | 695 |
| * | Sohu.com Inc. | 15,378 | 576 |
| | National Instruments Corp. | 19,000 | 534 |
| * | Progress Software Corp. | 19,000 | 511 |
| | | | 109,788 |
| Materials (3.4%) | | |
| | Kaiser Aluminum Corp. | 205,576 | 14,902 |
| | Compass Minerals | | |
| | International Inc. | 203,358 | 14,611 |
| | AptarGroup Inc. | 185,036 | 13,219 |
| | Sonoco Products Co. | 186,390 | 9,374 |
| | Worthington Industries Inc. | 25,051 | 1,177 |
| | Silgan Holdings Inc. | 16,625 | 847 |
| | | | 54,130 |
| Real Estate (3.8%) | | |
| | Lamar Advertising Co. | | |
| | Class A | 158,167 | 10,036 |
| * | Equity Commonwealth | 311,369 | 9,406 |
| | Rayonier Inc. | 272,400 | 7,306 |
| | Healthcare Trust of | | |
| | America Inc. Class A | 186,634 | 5,711 |
| | PS Business Parks Inc. | 34,375 | 3,774 |
| | New York REIT Inc. | 356,734 | 3,360 |
| | Piedmont Office Realty | | |
| | Trust Inc. Class A | 120,630 | 2,471 |
| | WP Carey Inc. | 34,915 | 2,121 |
| | Acadia Realty Trust | 56,000 | 1,887 |
| | Equity One Inc. | 50,389 | 1,436 |
| 3 | Hudson Pacific Properties | | |
| | Inc. | 42,608 | 1,432 |
| | Healthcare Realty Trust Inc. | 43,610 | 1,391 |
| | Empire State Realty Trust | | |
| | Inc. | 68,170 | 1,334 |
| | DCT Industrial Trust Inc. | 27,929 | 1,306 |
| | EastGroup Properties Inc. | 18,339 | 1,245 |
17
Global Minimum Volatility Fund
| | |
| | | Market |
| | | Value• |
| | Shares | ($000) |
| Ramco-Gershenson | | |
| Properties Trust | 60,746 | 1,053 |
| Urstadt Biddle Properties Inc. | |
| Class A | 40,998 | 881 |
| Franklin Street Properties | | |
| Corp. | 72,029 | 833 |
| Education Realty Trust Inc. | 19,133 | 815 |
| STAG Industrial Inc. | 25,426 | 587 |
| Universal Health Realty | | |
| Income Trust | 8,800 | 517 |
| Investors Real Estate Trust | 82,500 | 501 |
| | | 59,403 |
| Telecommunication Services (0.2%) | |
| Cogent Communications | | |
| Holdings Inc. | 42,888 | 1,583 |
| Windstream Holdings Inc. | 106,003 | 832 |
| | | 2,415 |
| Utilities (3.7%) | | |
| IDACORP Inc. | 147,196 | 11,539 |
| Vectren Corp. | 190,567 | 9,588 |
| Portland General Electric | | |
| Co. | 163,848 | 7,150 |
| Southern Co. | 133,667 | 6,893 |
| ALLETE Inc. | 80,705 | 4,946 |
| MDU Resources Group Inc. | 146,470 | 3,839 |
| Avista Corp. | 77,012 | 3,188 |
| NorthWestern Corp. | 54,051 | 3,111 |
| Ameren Corp. | 36,454 | 1,821 |
| Duke Energy Corp. | 18,700 | 1,496 |
| Spire Inc. | 20,533 | 1,290 |
| Avangrid Inc. | 23,699 | 934 |
| OGE Energy Corp. | 28,179 | 875 |
| Enersis Chile SA ADR | 152,793 | 759 |
| Dominion Resources Inc. | 6,600 | 496 |
| | | 57,925 |
| | | 885,861 |
| Total Common Stocks | | |
| (Cost $1,474,071) | | 1,556,939 |
| Temporary Cash Investments (2.0%)1 | |
| Money Market Fund (1.9%) | | |
| 4,5 Vanguard Market Liquidity | | |
| Fund, 0.718% | 301,817 | 30,184 |
| | |
| U.S. Government and Agency Obligations (0.1%) |
| United States Treasury Bill, | | |
| 0.291%, 12/22/16 | 100 | 100 |
| United States Treasury Bill, | | |
| 0.292%–0.325%, 12/29/16 | 200 | 200 |
| United States Treasury Bill, | | |
| 0.287%, 1/5/17 | 100 | 100 |
| | | 400 |
| Total Temporary Cash Investments | | |
| (Cost $30,584) | | 30,584 |
| Total Investments (101.1%) | | |
| (Cost $1,504,655) | | 1,587,523 |
| |
| | | Amount |
| | | ($000) |
| Other Assets and Liabilities (-1.1%) | | |
| Other Assets | | |
| Investment in Vanguard | | 122 |
| Receivables for Accrued Income | | 2,354 |
| Receivables for Capital Shares Issued | 3,123 |
| Other Assets | | 9,479 |
| Total Other Assets | | 15,078 |
| Liabilities | | |
| Payables for Investment Securities | | |
| Purchased | | (6) |
| Collateral for Securities on Loan | | (28,229) |
| Payables for Capital Shares Redeemed | (1,330) |
| Payables to Vanguard | | (390) |
| Other Liabilities | | (1,668) |
| Total Liabilities | | (31,623) |
| Net Assets (100%) | | 1,570,978 |
18
Global Minimum Volatility Fund
| |
| At October 31, 2016, net assets consisted of: |
| | Amount |
| | ($000) |
| Paid-in Capital | 1,470,274 |
| Undistributed Net Investment Income | 32,307 |
| Accumulated Net Realized Losses | (20,982) |
| Unrealized Appreciation (Depreciation) | |
| Investment Securities | 82,868 |
| Futures Contracts | 59 |
| Forward Currency Contracts | 6,487 |
| Foreign Currencies | (35) |
| Net Assets | 1,570,978 |
| |
| |
| Investor Shares—Net Assets | |
| Applicable to 35,173,048 outstanding | |
| $.001 par value shares of beneficial | |
| interest (unlimited authorization) | 419,412 |
| Net Asset Value Per Share— | |
| Investor Shares | $11.92 |
| |
| |
| Admiral Shares—Net Assets | |
| Applicable to 48,259,232 outstanding | |
| $.001 par value shares of beneficial | |
| interest (unlimited authorization) | 1,151,566 |
| Net Asset Value Per Share— | |
| Admiral Shares | $23.86 |
• See Note A in Notes to Financial Statements.
^ Includes partial security positions on loan to broker-dealers. The total value of securities on loan is $26,616,000.
* Non-income-producing security.
1 The fund invests a portion of its cash reserves in equity markets through the use of index futures contracts. After giving effect to futures
investments, the fund’s effective common stock and temporary cash investment positions represent 99.7% and 1.4%, respectively, of net
assets.
2 Security exempt from registration under Rule 144A of the Securities Act of 1933. Such securities may be sold in transactions exempt from
registration, normally to qualified institutional buyers. At October 31, 2016, the aggregate value of these securities was $3,652,000,
representing 0.2% of net assets.
3 Securities with a value of $958,000 have been segregated as initial margin for open futures contracts.
4 Affiliated money market fund available only to Vanguard funds and certain trusts and accounts managed by Vanguard. Rate shown is the
7-day yield.
5 Includes $28,229,000 of collateral received for securities on loan.
ADR—American Depositary Receipt.
GDR—Global Depositary Receipt.
REIT—Real Estate Investment Trust.
See accompanying Notes, which are an integral part of the Financial Statements.
19
| |
| Global Minimum Volatility Fund | |
| |
| |
| Statement of Operations | |
| |
| | Year Ended |
| | October 31, 2016 |
| | ($000) |
| Investment Income | |
| Income | |
| Dividends1 | 42,483 |
| Interest2 | 72 |
| Securities Lending—Net | 453 |
| Total Income | 43,008 |
| Expenses | |
| The Vanguard Group—Note B | |
| Investment Advisory Services | 1,217 |
| Management and Administrative—Investor Shares | 638 |
| Management and Administrative—Admiral Shares | 572 |
| Marketing and Distribution—Investor Shares | 121 |
| Marketing and Distribution—Admiral Shares | 106 |
| Custodian Fees | 227 |
| Auditing Fees | 47 |
| Shareholders’ Reports—Investor Shares | 12 |
| Shareholders’ Reports—Admiral Shares | 12 |
| Trustees’ Fees and Expenses | 1 |
| Total Expenses | 2,953 |
| Net Investment Income | 40,055 |
| Realized Net Gain (Loss) | |
| Investment Securities Sold2 | (22,242) |
| Futures Contracts | 1,256 |
| Foreign Currencies and Forward Currency Contracts | 2,558 |
| Realized Net Gain (Loss) | (18,428) |
| Change in Unrealized Appreciation (Depreciation) | |
| Investment Securities | 43,813 |
| Futures Contracts | (172) |
| Foreign Currencies and Forward Currency Contracts | 4,607 |
| Change in Unrealized Appreciation (Depreciation) | 48,248 |
| Net Increase (Decrease) in Net Assets Resulting from Operations | 69,875 |
1 Dividends are net of foreign withholding taxes of $2,158,000.
2 Interest income and realized net gain (loss) from an affiliated company of the fund were $72,000 and $2,000, respectively.
See accompanying Notes, which are an integral part of the Financial Statements.
20
| | |
| Global Minimum Volatility Fund | | |
| |
| |
| Statement of Changes in Net Assets | | |
| |
| | Year Ended October 31, |
| | 2016 | 2015 |
| | ($000) | ($000) |
| Increase (Decrease) in Net Assets | | |
| Operations | | |
| Net Investment Income | 40,055 | 21,205 |
| Realized Net Gain (Loss) | (18,428) | 31,565 |
| Change in Unrealized Appreciation (Depreciation) | 48,248 | 11,764 |
| Net Increase (Decrease) in Net Assets Resulting from Operations | 69,875 | 64,534 |
| Distributions | | |
| Net Investment Income | | |
| Investor Shares | (8,415) | (9,075) |
| Admiral Shares | (15,208) | (3,883) |
| Realized Capital Gain1 | | |
| Investor Shares | (6,527) | (13,061) |
| Admiral Shares | (11,326) | (5,350) |
| Total Distributions | (41,476) | (31,369) |
| Capital Share Transactions | | |
| Investor Shares | (41,867) | 73,567 |
| Admiral Shares | 376,134 | 626,768 |
| Net Increase (Decrease) from Capital Share Transactions | 334,267 | 700,335 |
| Total Increase (Decrease) | 362,666 | 733,500 |
| Net Assets | | |
| Beginning of Period | 1,208,312 | 474,812 |
| End of Period2 | 1,570,978 | 1,208,312 |
1 Includes fiscal 2016 and 2015 short-term gain distributions totaling $2,919,000 and $13,523,000, respectively. Short-term gain distributions
are treated as ordinary income dividends for tax purposes.
2 Net Assets—End of Period includes undistributed (overdistributed) net investment income of $32,307,000 and $15,621,000.
See accompanying Notes, which are an integral part of the Financial Statements.
21
| | | |
| Global Minimum Volatility Fund | | | |
| |
| |
| Financial Highlights | | | |
| |
| |
| Investor Shares | | | |
| | | | Dec. 12, |
| | Year Ended | 20131 to |
| | October 31, | Oct. 31, |
| For a Share Outstanding Throughout Each Period | 2016 | 2015 | 2014 |
| Net Asset Value, Beginning of Period | $11.81 | $11.41 | $10.00 |
| Investment Operations | | | |
| Net Investment Income | . 293 | . 288 2 | .262 |
| Net Realized and Unrealized Gain (Loss) on Investments | .181 | .795 | 1.172 |
| Total from Investment Operations | .474 | 1.083 | 1.434 |
| Distributions | | | |
| Dividends from Net Investment Income | (. 205) | (. 280) | (. 024) |
| Distributions from Realized Capital Gains | (.159) | (.403) | — |
| Total Distributions | (. 364) | (. 683) | (. 024) |
| Net Asset Value, End of Period | $11.92 | $11.81 | $11.41 |
| |
| Total Return3 | 4.23% | 9.93% | 14.37% |
| |
| Ratios/Supplemental Data | | | |
| Net Assets, End of Period (Millions) | $419 | $451 | $360 |
| Ratio of Total Expenses to Average Net Assets | 0.25% | 0.27% | 0.30%4 |
| Ratio of Net Investment Income to Average Net Assets | 2.63% | 2.52% | 3.18%4 |
| Portfolio Turnover Rate | 58% | 57% | 49% |
1 Inception.
2 Calculated based on average shares outstanding.
3 Total returns do not include account service fees that may have applied in the periods shown. Fund prospectuses provide information about
any applicable account service fees.
4 Annualized.
See accompanying Notes, which are an integral part of the Financial Statements.
22
| | | |
| Global Minimum Volatility Fund | | | |
| |
| |
| Financial Highlights | | | |
| |
| |
| Admiral Shares | | | |
| | | | Dec. 12, |
| | Year Ended | 20131 to |
| | October 31, | Oct. 31, |
| For a Share Outstanding Throughout Each Period | 2016 | 2015 | 2014 |
| Net Asset Value, Beginning of Period | $23.62 | $22.83 | $20.00 |
| Investment Operations | | | |
| Net Investment Income | . 608 | . 605 2 | .546 |
| Net Realized and Unrealized Gain (Loss) on Investments | .377 | 1.576 | 2.332 |
| Total from Investment Operations | .985 | 2.181 | 2.878 |
| Distributions | | | |
| Dividends from Net Investment Income | (. 427) | (. 585) | (. 048) |
| Distributions from Realized Capital Gains | (.318) | (.806) | — |
| Total Distributions | (.745) | (1.391) | (.048) |
| Net Asset Value, End of Period | $23.86 | $23.62 | $22.83 |
| |
| Total Return3 | 4.39% | 10.00% | 14.42% |
| |
| Ratios/Supplemental Data | | | |
| Net Assets, End of Period (Millions) | $1,152 | $757 | $115 |
| Ratio of Total Expenses to Average Net Assets | 0.17% | 0.21% | 0.20%4 |
| Ratio of Net Investment Income to Average Net Assets | 2.71% | 2.58% | 3.28%4 |
| Portfolio Turnover Rate | 58% | 57% | 49% |
1 Inception.
2 Calculated based on average shares outstanding.
3 Total returns do not include account service fees that may have applied in the periods shown. Fund prospectuses provide information about
any applicable account service fees.
4 Annualized.
See accompanying Notes, which are an integral part of the Financial Statements.
23
Global Minimum Volatility Fund
Notes to Financial Statements
Vanguard Global Minimum Volatility Fund is registered under the Investment Company Act of 1940 as an open-end investment company, or mutual fund. The fund invests in securities of foreign issuers, which may subject it to investment risks not normally associated with investing in securities of U.S. corporations. To minimize the currency risk and volatility associated with investment in securities denominated in currencies other than the U.S. dollar, the fund attempts to hedge its currency exposure. The fund offers two classes of shares: Investor Shares and Admiral Shares. Investor Shares are available to any investor who meets the fund’s minimum purchase requirements. Admiral Shares are designed for investors who meet certain administrative, service, and account-size criteria.
A. The following significant accounting policies conform to generally accepted accounting principles for U.S. investment companies. The fund consistently follows such policies in preparing its financial statements.
1. Security Valuation: Securities are valued as of the close of trading on the New York Stock Exchange (generally 4 p.m., Eastern time) on the valuation date. Equity securities are valued at the latest quoted sales prices or official closing prices taken from the primary market in which each security trades; such securities not traded on the valuation date are valued at the mean of the latest quoted bid and asked prices. Securities for which market quotations are not readily available, or whose values have been affected by events occurring before the fund’s pricing time but after the close of the securities’ primary markets, are valued at their fair values calculated according to procedures adopted by the board of trustees. These procedures include obtaining quotations from an independent pricing service, monitoring news to identify significant market- or security-specific events, and evaluating changes in the values of foreign market proxies (for example, ADRs, futures contracts, or exchange-traded funds), between the time the foreign markets close and the fund’s pricing time. When fair-value pricing is employed, the prices of securities used by a fund to calculate its net asset value may differ from quoted or published prices for the same securities. Investments in Vanguard Market Liquidity Fund are valued at that fund’s net asset value. Temporary cash investments acquired over 60 days to maturity are valued using the latest bid prices or using valuations based on a matrix system (which considers such factors as security prices, yields, maturities, and ratings), both as furnished by independent pricing services. Other temporary cash investments are valued at amortized cost, which approximates market value.
2. Foreign Currency: Securities and other assets and liabilities denominated in foreign currencies are translated into U.S. dollars using exchange rates obtained from an independent third party as of the fund’s pricing time on the valuation date. Realized gains (losses) and unrealized appreciation (depreciation) on investment securities include the effects of changes in exchange rates since the securities were purchased, combined with the effects of changes in security prices. Fluctuations in the value of other assets and liabilities resulting from changes in exchange rates are recorded as unrealized foreign currency gains (losses) until the assets or liabilities are settled in cash, at which time they are recorded as realized foreign currency gains (losses).
3. Futures and Forward Currency Contracts: The fund uses index futures contracts to a limited extent, with the objective of maintaining full exposure to the stock market while maintaining liquidity. The fund may purchase or sell futures contracts to achieve a desired level of investment, whether to accommodate portfolio turnover or cash flows from capital share transactions. The primary risks associated with the use of futures contracts are imperfect correlation between changes in market values of stocks held by the fund and the prices of futures contracts, and the possibility of an illiquid market. Counterparty risk involving futures is mitigated because a regulated clearinghouse is the counterparty instead of the clearing broker. To further mitigate counterparty risk, the fund trades futures contracts on an exchange, monitors the financial strength of its clearing brokers and
24
Global Minimum Volatility Fund
clearinghouse, and has entered into clearing agreements with its clearing brokers. The clearinghouse imposes initial margin requirements to secure the fund’s performance and requires daily settlement of variation margin representing changes in the market value of each contract.
The fund enters into forward currency contracts to protect the value of securities and related receivables and payables against changes in future foreign exchange rates. The fund’s risks in using these contracts include movement in the values of the foreign currencies relative to the U.S. dollar and the ability of the counterparties to fulfill their obligations under the contracts. The fund mitigates its counterparty risk by entering into forward currency contracts only with a diverse group of prequalified counterparties, monitoring their financial strength, entering into master netting arrangements with its counterparties, and requiring its counterparties to transfer collateral as security for their performance. In the absence of a default, the collateral pledged or received by the fund cannot be repledged, resold or rehypothecated. The master netting arrangements provide that, in the event of a counterparty’s default (including bankruptcy), the fund may terminate the forward currency contracts, determine the net amount owed by either party in accordance with its master netting arrangements, and sell or retain any collateral held up to the net amount owed to the fund under the master netting arrangements. The forward currency contracts contain provisions whereby a counterparty may terminate open contracts if the fund’s net assets decline below a certain level, triggering a payment by the fund if the fund is in a net liability position at the time of the termination. The payment amount would be reduced by any collateral the fund has pledged. Any assets pledged as collateral for open contracts are noted in the Statement of Net Assets. The value of collateral received or pledged is compared daily to the value of the forward currency contracts exposure with each counterparty, and any difference, if in excess of a specified minimum transfer amount, is adjusted and settled within two business days.
Futures contracts are valued at their quoted daily settlement prices. Forward currency contracts are valued at their quoted daily prices obtained from an independent third party, adjusted for currency risk based on the expiration date of each contract. The aggregate settlement values and notional amounts of the contracts are not recorded in the Statement of Net Assets. Fluctuations in the value of the contracts are recorded in the Statement of Net Assets as an asset (liability) and in the Statement of Operations as unrealized appreciation (depreciation) until the contracts are closed, when they are recorded as realized gains (losses) on futures or forward currency contracts.
During the year ended October 31, 2016, the fund’s average investments in long and short futures contracts represented less than 1% and 0% of net assets, respectively, based on the average of aggregate settlement values at each quarter-end during the period. The fund’s average investment in forward currency contracts represented 47% of net assets, based on the average of notional amounts at each quarter-end during the period.
4. Federal Income Taxes: The fund intends to continue to qualify as a regulated investment company and distribute all of its taxable income. Management has analyzed the fund’s tax positions taken for all open federal income tax years (October 31, 2014–2016), and has concluded that no provision for federal income tax is required in the fund’s financial statements.
5. Distributions: Distributions to shareholders are recorded on the ex-dividend date.
6. Securities Lending: To earn additional income, the fund lends its securities to qualified institutional borrowers. Security loans are subject to termination by the fund at any time, and are required to be secured at all times by collateral in an amount at least equal to the market value of securities loaned. Daily market fluctuations could cause the value of loaned securities to be more or less than the value of the collateral received. When this occurs, the collateral is adjusted and settled on the next business
25
Global Minimum Volatility Fund
day. The fund further mitigates its counterparty risk by entering into securities lending transactions only with a diverse group of prequalified counterparties, monitoring their financial strength, and entering into master securities lending agreements with its counterparties. The master securities lending agreements provide that, in the event of a counterparty’s default (including bankruptcy), the fund may terminate any loans with that borrower, determine the net amount owed, and sell or retain the collateral up to the net amount owed to the fund; however, such actions may be subject to legal proceedings. While collateral mitigates counterparty risk, in the absence of a default the fund may experience delays and costs in recovering the securities loaned. The fund invests cash collateral received in Vanguard Market Liquidity Fund, and records a liability in the Statement of Net Assets for the return of the collateral, during the period the securities are on loan. Securities lending income represents fees charged to borrowers plus income earned on invested cash collateral, less expenses associated with the loan. During the term of the loan, the fund is entitled to all distributions made on or in respect of the loaned securities.
7. Credit Facility: The fund and certain other funds managed by The Vanguard Group (“Vanguard”) participate in a $3.1 billion committed credit facility provided by a syndicate of lenders pursuant to a credit agreement that may be renewed annually; each fund is individually liable for its borrowings, if any, under the credit facility. Borrowings may be utilized for temporary and emergency purposes, and are subject to the fund’s regulatory and contractual borrowing restrictions. The participating funds are charged administrative fees and an annual commitment fee of 0.10% of the undrawn amount of the facility; these fees are allocated to the funds based on a method approved by the fund’s board of trustees and included in Management and Administrative expenses on the fund’s Statement of Operations. Any borrowings under this facility bear interest at a rate based upon the higher of the one-month London Interbank Offered Rate, federal funds effective rate, or overnight bank funding rate plus an agreed-upon spread.
The fund had no borrowings outstanding at October 31, 2016, or at any time during the period then ended.
8. Other: Dividend income is recorded on the ex-dividend date. Interest income includes income distributions received from Vanguard Market Liquidity Fund and is accrued daily. Premiums and discounts on debt securities purchased are amortized and accreted, respectively, to interest income over the lives of the respective securities. Security transactions are accounted for on the date securities are bought or sold. Costs used to determine realized gains (losses) on the sale of investment securities are those of the specific securities sold.
Each class of shares has equal rights as to assets and earnings, except that each class separately bears certain class-specific expenses related to maintenance of shareholder accounts (included in Management and Administrative expenses) and shareholder reporting. Marketing and distribution expenses are allocated to each class of shares based on a method approved by the board of trustees. Income, other non-class-specific expenses, and gains and losses on investments are allocated to each class of shares based on its relative net assets.
B. In accordance with the terms of a Funds’ Service Agreement (the “FSA”) between Vanguard and the fund, Vanguard furnishes to the fund investment advisory, corporate management, administrative, marketing, and distribution services at Vanguard’s cost of operations (as defined by the FSA). These costs of operations are allocated to the fund based on methods and guidelines approved by the board of trustees. Vanguard does not require reimbursement in the current period for certain costs of operations (such as deferred compensation/benefits and risk/insurance costs); the fund’s liability for these costs of operations is included in Payables to Vanguard on the Statement of Net Assets.
26
Global Minimum Volatility Fund
Upon the request of Vanguard, the fund may invest up to 0.40% of its net assets as capital in Vanguard. At October 31, 2016, the fund had contributed to Vanguard capital in the amount of $122,000, representing 0.01% of the fund’s net assets and 0.05% of Vanguard’s capitalization. The fund’s trustees and officers are also directors and employees, respectively, of Vanguard.
C. Various inputs may be used to determine the value of the fund’s investments. These inputs are summarized in three broad levels for financial statement purposes. The inputs or methodologies used to value securities are not necessarily an indication of the risk associated with investing in those securities.
Level 1—Quoted prices in active markets for identical securities.
Level 2—Other significant observable inputs (including quoted prices for similar securities, interest rates, prepayment speeds, credit risk, etc.).
Level 3—Significant unobservable inputs (including the fund’s own assumptions used to determine the fair value of investments).
The following table summarizes the market value of the fund’s investments as of October 31, 2016, based on the inputs used to value them:
| | | |
| | Level 1 | Level 2 | Level 3 |
| Investments | ($000) | ($000) | ($000) |
| Common Stocks—International | 226,403 | 444,675 | — |
| Common Stocks—United States | 885,861 | — | — |
| Temporary Cash Investments | 30,184 | 400 | — |
| Futures Contracts—Assets1 | 7 | — | — |
| Futures Contracts—Liabilities1 | (18) | — | — |
| Forward Currency Contracts—Assets | — | 7,855 | — |
| Forward Currency Contracts—Liabilities | — | (1,368) | — |
| Total | 1,142,437 | 451,562 | — |
| 1 Represents variation margin on the last day of the reporting period. | | | |
D. At October 31, 2016, the fair values of derivatives were reflected in the Statement of Net Assets as follows:
| | | |
| | | Foreign | |
| | Equity | Exchange | |
| | Contracts | Contracts | Total |
| Statement of Net Assets Caption | ($000) | ($000) | ($000) |
| Other Assets | 7 | 7,855 | 7,862 |
| Other Liabilities | (18) | (1,368) | (1,386) |
27
Global Minimum Volatility Fund
Realized net gain (loss) and the change in unrealized appreciation (depreciation) on derivatives for the year ended October 31, 2016, were:
| | | |
| | | Foreign | |
| | Equity | Exchange | |
| | Contracts | Contracts | Total |
| Realized Net Gain (Loss) on Derivatives | ($000) | ($000) | ($000) |
| Futures Contracts | 1,256 | — | 1,256 |
| Forward Currency Contracts | — | 2,659 | 2,659 |
| Realized Net Gain (Loss) on Derivatives | 1,256 | 2,659 | 3,915 |
| |
| Change in Unrealized Appreciation (Depreciation) on Derivatives | | | |
| Futures Contracts | (172) | — | (172) |
| Forward Currency Contracts | — | 4,628 | 4,628 |
| Change in Unrealized Appreciation (Depreciation) on Derivatives | (172) | 4,628 | 4,456 |
At October 31, 2016, the aggregate settlement value of open futures contracts and the related unrealized appreciation (depreciation) were:
| | | | |
| | | | | ($000) |
| | | | Aggregate | |
| | | Number of | Settlement | Unrealized |
| | | Long (Short) | Value | Appreciation |
| Futures Contracts | Expiration | Contracts | Long (Short) | (Depreciation) |
| E-mini S&P 500 Index | December 2016 | 56 | 5,936 | (61) |
| S&P ASX 200 Index | December 2016 | 8 | 805 | 33 |
| Dow Jones EURO STOXX 50 Index | December 2016 | 22 | 736 | 23 |
| Topix Index | December 2016 | 5 | 664 | 29 |
| FTSE 100 Index | December 2016 | 7 | 592 | 35 |
| | | | | 59 |
Unrealized appreciation (depreciation) on open E-mini S&P 500 Index, Dow Jones EURO STOXX 50 Index, and FTSE 100 Index futures contracts is required to be treated as realized gain (loss) for tax purposes.
28
Global Minimum Volatility Fund
At October 31, 2016, the fund had open forward currency contracts to receive and deliver currencies as follows. Unrealized appreciation (depreciation) on open forward currency contracts, except for Danish krone, Hong Kong dollar, Indonesian rupiah, Singapore dollar, and Taiwanese dollar contracts, is treated as realized gain (loss) for tax purposes.
| | | | | | |
| | | | | | | Unrealized |
| | Contract | | | | | Appreciation |
| | Settlement | Contract Amount (000) | (Depreciation) |
| Counterparty | Date | | Receive | | Deliver | ($000) |
| Goldman Sachs International | 11/18/16 | GBP | 10,053 | USD | 12,375 | (66) |
| Credit Suisse International | 11/18/16 | HKD | 45,291 | USD | 5,840 | — |
| Goldman Sachs International | 11/18/16 | USD | 99,644 | CAD | 131,702 | 1,444 |
| BNP Paribas | 11/18/16 | USD | 82,579 | CHF | 80,694 | 958 |
| Goldman Sachs International | 11/18/16 | USD | 76,228 | AUD | 100,747 | (375) |
| Credit Suisse International | 11/18/16 | USD | 60,012 | JPY | 6,227,076 | 599 |
| Goldman Sachs International | 11/18/16 | USD | 55,000 | HKD | 426,523 | (1) |
| BNP Paribas | 11/18/16 | USD | 50,949 | KRW | 56,988,799 | 1,148 |
| Goldman Sachs International | 11/18/16 | USD | 48,942 | GBP | 38,707 | 1,548 |
| Goldman Sachs International | 11/18/16 | USD | 38,544 | EUR | 34,421 | 731 |
| BNP Paribas | 11/18/16 | USD | 35,713 | INR | 2,399,315 | (115) |
| BNP Paribas | 11/18/16 | USD | 34,376 | TWD | 1,084,734 | (10) |
| BNP Paribas | 11/18/16 | USD | 24,755 | BRL | 80,859 | (436) |
| Goldman Sachs International | 11/18/16 | USD | 14,288 | SGD | 19,609 | 191 |
| Goldman Sachs International | 11/18/16 | USD | 12,854 | MXN | 248,491 | (264) |
| BNP Paribas | 11/18/16 | USD | 12,295 | RUB | 771,953 | 173 |
| Goldman Sachs International | 11/18/16 | USD | 11,660 | SEK | 100,349 | 540 |
| BNP Paribas | 11/18/16 | USD | 8,324 | IDR | 109,051,794 | (15) |
| Goldman Sachs International | 11/17/16 | USD | 7,740 | ILS | 29,301 | 100 |
| Goldman Sachs International | 11/18/16 | USD | 7,194 | NOK | 57,923 | 184 |
| BNP Paribas | 11/18/16 | USD | 3,760 | CLP | 2,515,904 | (86) |
| Goldman Sachs International | 11/18/16 | USD | 2,947 | DKK | 19,589 | 53 |
| BNP Paribas | 11/18/16 | USD | 2,844 | CAD | 3,720 | 70 |
29
| | | | | | |
| Global Minimum Volatility Fund | | | | | | |
| |
| |
| |
| |
| | | | | | | Unrealized |
| | Contract | | | | | Appreciation |
| | Settlement | Contract Amount (000) | (Depreciation) |
| Counterparty | Date | | Receive | | Deliver | ($000) |
| Goldman Sachs International | 11/18/16 | USD | 2,633 | CHF | 2,573 | 31 |
| Goldman Sachs International | 11/18/16 | USD | 1,961 | HKD | 15,210 | — |
| Goldman Sachs International | 11/18/16 | USD | 1,331 | JPY | 138,156 | 13 |
| BNP Paribas | 11/18/16 | USD | 1,064 | SEK | 9,155 | 49 |
| BNP Paribas | 11/18/16 | USD | 713 | GBP | 564 | 23 |
| | | | | | | 6,487 |
AUD—Australian dollar.
BRL—Brazilian real.
CAD—Canadian dollar.
CHF—Swiss franc.
CLP—Chilean peso.
DKK—Danish krone.
EUR—Euro.
GBP—British pound.
HKD—Hong Kong dollar.
IDR—Indonesian rupiah.
ILS—Israeli shekel.
INR—Indian rupee.
JPY—Japanese yen.
KRW—Korean won.
MXN—Mexican peso.
NOK—Norwegian krone.
RUB—Russian ruble.
SEK—Swedish krona.
SGD—Singapore dollar.
TWD—Taiwanese dollar.
USD—U.S. dollar.
At October 31, 2016, the counterparties had deposited in segregated accounts securities and cash with a value of $7,142,000 in connection with open forward currency contracts.
E. Distributions are determined on a tax basis and may differ from net investment income and realized capital gains for financial reporting purposes. Differences may be permanent or temporary. Permanent differences are reclassified among capital accounts in the financial statements to reflect their tax character. Temporary differences arise when certain items of income, expense, gain, or loss are recognized in different periods for financial statement and tax purposes. These differences will reverse at some time in the future. Differences in classification may also result from the treatment of short-term gains as ordinary income for tax purposes.
30
Global Minimum Volatility Fund
During the year ended October 31, 2016, the fund realized net foreign currency losses of $101,000, which decreased distributable net income for tax purposes; accordingly, such losses have been reclassified from accumulated net realized losses to undistributed net investment income.
For tax purposes, at October 31, 2016, the fund had $34,470,000 of ordinary income available for distribution. The fund had available capital losses totaling $14,548,000 that may be carried forward indefinitely to offset future net capital gains.
At October 31, 2016, the cost of investment securities for tax purposes was $1,506,723,000. Net unrealized appreciation of investment securities for tax purposes was $80,800,000, consisting of unrealized gains of $121,564,000 on securities that had risen in value since their purchase and $40,764,000 in unrealized losses on securities that had fallen in value since their purchase.
F. During the year ended October 31, 2016, the fund purchased $1,200,737,000 of investment securities and sold $859,684,000 of investment securities, other than temporary cash investments.
G. Capital share transactions for each class of shares were:
| | | | |
| | | | Year Ended October 31, |
| | | 2016 | | 2015 |
| | Amount | Shares | Amount | Shares |
| | ($000) | (000) | ($000) | (000) |
| Investor Shares | | | | |
| Issued | 214,536 | 18,493 | 259,472 | 22,420 |
| Issued in Lieu of Cash Distributions | 14,502 | 1,302 | 21,996 | 2,000 |
| Redeemed | (270,905) | (22,823) | (207,901) | (17,760) |
| Net Increase (Decrease)—Investor Shares | (41,867) | (3,028) | 73,567 | 6,660 |
| Admiral Shares | | | | |
| Issued | 705,818 | 30,468 | 772,864 | 33,351 |
| Issued in Lieu of Cash Distributions | 23,214 | 1,042 | 8,043 | 366 |
| Redeemed | (352,898) | (15,309) | (154,139) | (6,699) |
| Net Increase (Decrease)—Admiral Shares | 376,134 | 16,201 | 626,768 | 27,018 |
H. Management has determined that no material events or transactions occurred subsequent to October 31, 2016, that would require recognition or disclosure in these financial statements.
31
Report of Independent Registered Public Accounting Firm
To the Board of Trustees of Vanguard Whitehall Funds and the Shareholders of Vanguard Global Minimum Volatility Fund:
In our opinion, the accompanying statement of net assets and the related statements of operations and of changes in net assets and the financial highlights present fairly, in all material respects, the financial position of Vanguard Global Minimum Volatility Fund (constituting a separate portfolio of Vanguard Whitehall Funds, hereafter referred to as the “Fund”) at October 31, 2016, the results of its operations for the year then ended, the changes in its net assets for each of the two years in the period then ended, and the financial highlights for each of the periods indicated, in conformity with accounting principles generally accepted in the United States of America. These financial statements and financial highlights (hereafter referred to as “financial statements”) are the responsibility of the Fund’s management. Our responsibility is to express an opinion on these financial statements based on our audits. We conducted our audits of these financial statements in accordance with the standards of the Public Company Accounting Oversight Board (United States). Those standards require that we plan and perform the audit to obtain reasonable assurance about whether the financial statements are free of material misstatement. An audit includes examining, on a test basis, evidence supporting the amounts and disclosures in the financial statements, assessing the accounting principles used and significant estimates made by management, and evaluating the overall financial statement presentation. We believe that our audits, which included confirmation of securities at October 31, 2016 by correspondence with the custodian and brokers and by agreement to the underlying ownership records of the transfer agent, provide a reasonable basis for our opinion.
/s/PricewaterhouseCoopers LLP
Philadelphia, Pennsylvania
December 15, 2016
Special 2016 tax information (unaudited) for Vanguard Global Minimum Volatility Fund
This information for the fiscal year ended October 31, 2016, is included pursuant to provisions of the Internal Revenue Code.
The fund distributed $14,934,000 as capital gain dividends (20% rate gain distributions) to shareholders during the fiscal year.
For nonresident alien shareholders, 100% of short-term capital gain dividends distributed by the fund are qualified short-term capital gains.
The fund distributed $17,278,000 of qualified dividend income to shareholders during the fiscal year.
For corporate shareholders, 32.9% of investment income (dividend income plus short-term gains, if any) qualifies for the dividends-received deduction.
32
Your Fund’s After-Tax Returns
This table presents returns for your fund both before and after taxes. The after-tax returns are shown in two ways: (1) assuming that an investor owned the fund during the entire period and paid taxes on the fund’s distributions, and (2) assuming that an investor paid taxes on the fund’s distributions and sold all shares at the end of each period.
Calculations are based on the highest individual federal income tax and capital gains tax rates in effect at the times of the distributions and the hypothetical sales. State and local taxes were not considered. After-tax returns reflect any qualified dividend income, using actual prior-year figures and estimates for 2016. (In the example, returns after the sale of fund shares may be higher than those assuming no sale. This occurs when the sale would have produced a capital loss. The calculation assumes that the investor received a tax deduction for the loss.)
The table shows returns for Investor Shares only; returns for other share classes will differ. Please note that your actual after-tax returns will depend on your tax situation and may differ from those shown. Also note that if you own the fund in a tax-deferred account, such as an individual retirement account or a 401(k) plan, this information does not apply to you. Such accounts are not subject to current taxes.
Finally, keep in mind that a fund’s performance—whether before or after taxes—does not guarantee future results.
Average Annual Total Returns: Global Minimum Volatility Fund Investor Shares
Periods Ended October 31, 2016
| | |
| | | Since |
| | One | Inception |
| | Year | (12/12/2013) |
| Returns Before Taxes | 4.23% | 9.82% |
| Returns After Taxes on Distributions | 3.33 | 8.69 |
| Returns After Taxes on Distributions and Sale of Fund Shares | 2.86 | 7.27 |
33
About Your Fund’s Expenses
As a shareholder of the fund, you incur ongoing costs, which include costs for portfolio management, administrative services, and shareholder reports (like this one), among others. Operating expenses, which are deducted from a fund’s gross income, directly reduce the investment return of the fund.
A fund’s expenses are expressed as a percentage of its average net assets. This figure is known as the expense ratio. The following examples are intended to help you understand the ongoing costs (in dollars) of investing in your fund and to compare these costs with those of other mutual funds. The examples are based on an investment of $1,000 made at the beginning of the period shown and held for the entire period.
The accompanying table illustrates your fund’s costs in two ways:
• Based on actual fund return. This section helps you to estimate the actual expenses that you paid over the period. The ”Ending Account Value“ shown is derived from the fund‘s actual return, and the third column shows the dollar amount that would have been paid by an investor who started with $1,000 in the fund. You may use the information here, together with the amount you invested, to estimate the expenses that you paid over the period.
To do so, simply divide your account value by $1,000 (for example, an $8,600 account value divided by $1,000 = 8.6), then multiply the result by the number given for your fund under the heading ”Expenses Paid During Period.“
• Based on hypothetical 5% yearly return. This section is intended to help you compare your fund‘s costs with those of other mutual funds. It assumes that the fund had a yearly return of 5% before expenses, but that the expense ratio is unchanged. In this case—because the return used is not the fund’s actual return—the results do not apply to your investment. The example is useful in making comparisons because the Securities and Exchange Commission requires all mutual funds to calculate expenses based on a 5% return. You can assess your fund’s costs by comparing this hypothetical example with the hypothetical examples that appear in shareholder reports of other funds.
Note that the expenses shown in the table are meant to highlight and help you compare ongoing costs only and do not reflect transaction costs incurred by the fund for buying and selling securities. Further, the expenses do not include any purchase, redemption, or account service fees described in the fund prospectus. If such fees were applied to your account, your costs would be higher. Your fund does not carry a “sales load.”
The calculations assume no shares were bought or sold during the period. Your actual costs may have been higher or lower, depending on the amount of your investment and the timing of any purchases or redemptions.
You can find more information about the fund’s expenses, including annual expense ratios, in the Financial Statements section of this report. For additional information on operating expenses and other shareholder costs, please refer to your fund’s current prospectus.
34
| | | |
| Six Months Ended October 31, 2016 | | | |
| | Beginning | Ending | Expenses |
| | Account Value | Account Value | Paid During |
| Global Minimum Volatility Fund | 4/30/2016 | 10/31/2016 | Period |
| Based on Actual Fund Return | | | |
| Investor Shares | $1,000.00 | $1,041.05 | $1.18 |
| Admiral Shares | 1,000.00 | 1,041.47 | 0.87 |
| Based on Hypothetical 5% Yearly Return | | | |
| Investor Shares | $1,000.00 | $1,023.98 | $1.17 |
| Admiral Shares | 1,000.00 | 1,024.28 | 0.87 |
The calculations are based on expenses incurred in the most recent six-month period. The fund’s annualized six-month expense ratios for that period are 0.23% for Investor Shares and 0.17% for Admiral Shares. The dollar amounts shown as “Expenses Paid” are equal to the annualized expense ratio multiplied by the average account value over the period, multiplied by the number of days in the most recent six-month period, then divided by the number of days in the most recent 12-month period (184/366).
35
Glossary
Dividend Yield. Dividend income earned by stocks, expressed as a percentage of the aggregate market value (or of net asset value, for a fund). The yield is determined by dividing the amount of the annual dividends by the aggregate value (or net asset value) at the end of the period. For a fund, the dividend yield is based solely on stock holdings and does not include any income produced by other investments.
Earnings Growth Rate. The average annual rate of growth in earnings over the past five years for the stocks now in a fund.
Equity Exposure. A measure that reflects a fund’s investments in stocks and stock futures. Any holdings in short-term reserves are excluded.
Expense Ratio. A fund’s total annual operating expenses expressed as a percentage of the fund’s average net assets. The expense ratio includes management and administrative expenses, but does not include the transaction costs of buying and selling portfolio securities.
Inception Date. The date on which the assets of a fund (or one of its share classes) are first invested in accordance with the fund’s investment objective. For funds with a subscription period, the inception date is the day after that period ends. Investment performance is measured from the inception date.
Median Market Cap. An indicator of the size of companies in which a fund invests; the midpoint of market capitalization (market price x shares outstanding) of a fund’s stocks, weighted by the proportion of the fund’s assets invested in each stock. Stocks representing half of the fund’s assets have market capitalizations above the median, and the rest are below it.
Price/Book Ratio. The share price of a stock divided by its net worth, or book value, per share. For a fund, the weighted average price/book ratio of the stocks it holds.
Price/Earnings Ratio. The ratio of a stock’s current price to its per-share earnings over the past year. For a fund, the weighted average P/E of the stocks it holds. P/E is an indicator of market expectations about corporate prospects; the higher the P/E, the greater the expectations for a company’s future growth.
Return on Equity. The annual average rate of return generated by a company during the past five years for each dollar of shareholder’s equity (net income divided by shareholder’s equity). For a fund, the weighted average return on equity for the companies whose stocks it holds.
Short-Term Reserves. The percentage of a fund invested in highly liquid, short-term securities that can be readily converted to cash.
Turnover Rate. An indication of the fund’s trading activity. Funds with high turnover rates incur higher transaction costs and may be more likely to distribute capital gains (which may be taxable to investors). The turnover rate excludes in-kind transactions, which have minimal impact on costs.
36
This page intentionally left blank.
This page intentionally left blank.
This page intentionally left blank.
The People Who Govern Your Fund
The trustees of your mutual fund are there to see that the fund is operated and managed in your best interests since, as a shareholder, you are a part owner of the fund. Your fund’s trustees also serve on the board of directors of The Vanguard Group, Inc., which is owned by the Vanguard funds and provides services to them on an at-cost basis.
A majority of Vanguard’s board members are independent, meaning that they have no affiliation with Vanguard or the funds they oversee, apart from the sizable personal investments they have made as private individuals. The independent board members have distinguished backgrounds in business, academia, and public service. Each of the trustees and executive officers oversees 198 Vanguard funds.
The following table provides information for each trustee and executive officer of the fund. The mailing address of the trustees and officers is P.O. Box 876, Valley Forge, PA 19482. More information about the trustees is in the Statement of Additional Information, which can be obtained, without charge, by contacting Vanguard at 800-662-7447, or online at vanguard.com.
Interested Trustee1
F. William McNabb III
Born 1957. Trustee Since July 2009. Chairman of the Board. Principal Occupation(s) During the Past Five Years and Other Experience: Chairman of the Board of The Vanguard Group, Inc., and of each of the investment companies served by The Vanguard Group, since January 2010; Director of The Vanguard Group since 2008; Chief Executive Officer and President of The Vanguard Group, and of each of the investment companies served by The Vanguard Group, since 2008; Director of Vanguard Marketing Corporation; Managing Director of The Vanguard Group (1995–2008).
Independent Trustees
Emerson U. Fullwood
Born 1948. Trustee Since January 2008. Principal Occupation(s) During the Past Five Years and Other Experience: Executive Chief Staff and Marketing Officer for North America and Corporate Vice President (retired 2008) of Xerox Corporation (document management products and services); Executive in Residence and 2009–2010 Distinguished Minett Professor at the Rochester Institute of Technology; Lead Director of SPX FLOW, Inc. (multi-industry manufacturing); Director of the United Way of Rochester, the University of Rochester Medical Center, Monroe Community College Foundation, North Carolina A&T University, and Roberts Wesleyan College.
Rajiv L. Gupta
Born 1945. Trustee Since December 2001.2 Principal Occupation(s) During the Past Five Years and Other Experience: Chairman and Chief Executive Officer (retired 2009) and President (2006–2008) of Rohm and Haas Co. (chemicals); Director of Tyco International plc (diversified manufacturing and services), HP Inc. (printer and personal computer manufacturing), and Delphi Automotive plc (automotive components); Senior Advisor at New Mountain Capital.
Amy Gutmann
Born 1949. Trustee Since June 2006. Principal Occupation(s) During the Past Five Years and Other Experience: President of the University of Pennsylvania; Christopher H. Browne Distinguished Professor of Political Science, School of Arts and Sciences, and Professor of Communication, Annenberg School for Communication, with secondary faculty appointments in the Department of Philosophy, School of Arts and Sciences, and at the Graduate School of Education, University of Pennsylvania; Trustee of the National Constitution Center; Chair of the Presidential Commission for the Study of Bioethical Issues.
JoAnn Heffernan Heisen
Born 1950. Trustee Since July 1998. Principal Occupation(s) During the Past Five Years and Other Experience: Corporate Vice President and Chief Global Diversity Officer (retired 2008) and Member of the Executive Committee (1997–2008) of Johnson & Johnson (pharmaceuticals/medical devices/consumer products); Director of Skytop Lodge Corporation (hotels) and the Robert Wood Johnson Foundation; Member of the Advisory Board of the Institute for Women’s Leadership at Rutgers University.
F. Joseph Loughrey
Born 1949. Trustee Since October 2009. Principal Occupation(s) During the Past Five Years and Other Experience: President and Chief Operating Officer (retired 2009) of Cummins Inc. (industrial machinery); Chairman of the Board of Hillenbrand, Inc. (specialized consumer services), and of Oxfam America; Director of SKF AB (industrial machinery), Hyster-Yale Materials Handling, Inc. (forklift trucks), the Lumina Foundation for Education, and the V Foundation for Cancer Research; Member of the Advisory Council for the College of Arts and Letters and of the Advisory Board to the Kellogg Institute for International Studies, both at the University of Notre Dame.
Mark Loughridge
Born 1953. Trustee Since March 2012. Principal Occupation(s) During the Past Five Years and Other Experience: Senior Vice President and Chief Financial Officer (retired 2013) at IBM (information technology services); Fiduciary Member of IBM’s Retirement Plan Committee (2004–2013); Director of the Dow Chemical Company; Member of the Council on Chicago Booth.
Scott C. Malpass
Born 1962. Trustee Since March 2012. Principal Occupation(s) During the Past Five Years and Other Experience: Chief Investment Officer and Vice President at the University of Notre Dame; Assistant Professor of Finance at the Mendoza College of Business at Notre Dame; Member of the Notre Dame 403(b) Investment Committee, the Board of Advisors for Spruceview Capital Partners, and the Investment Advisory Committee of Major League Baseball; Board Member of TIFF Advisory Services, Inc., and Catholic Investment Services, Inc. (investment advisors).
André F. Perold
Born 1952. Trustee Since December 2004. Principal Occupation(s) During the Past Five Years and Other Experience: George Gund Professor of Finance and Banking, Emeritus at the Harvard Business School (retired 2011); Chief Investment Officer and Managing Partner of HighVista Strategies LLC (private investment firm); Director of Rand Merchant Bank; Overseer of the Museum of Fine Arts Boston.
Peter F. Volanakis
Born 1955. Trustee Since July 2009. Principal Occupation(s) During the Past Five Years and Other Experience: President and Chief Operating Officer (retired 2010) of Corning Incorporated (communications equipment); Chairman of the Board of Trustees of Colby-Sawyer College; Member of the Advisory Board of the Norris Cotton Cancer Center.
Executive Officers
Glenn Booraem
Born 1967. Treasurer Since May 2015. Principal Occupation(s) During the Past Five Years and Other Experience: Principal of The Vanguard Group, Inc.; Treasurer of each of the investment companies served by The Vanguard Group; Controller of each of the investment companies served by The Vanguard Group (2010–2015); Assistant Controller of each of the investment companies served by The Vanguard Group (2001–2010).
Thomas J. Higgins
Born 1957. Chief Financial Officer Since September 2008. Principal Occupation(s) During the Past Five Years and Other Experience: Principal of The Vanguard Group, Inc.; Chief Financial Officer of each of the investment companies served by The Vanguard Group; Treasurer of each of the investment companies served by The Vanguard Group (1998–2008).
Peter Mahoney
Born 1974. Controller Since May 2015. Principal Occupation(s) During the Past Five Years and Other Experience: Head of Global Fund Accounting at The Vanguard Group, Inc.; Controller of each of the investment companies served by The Vanguard Group; Head of International Fund Services at The Vanguard Group (2008–2014).
Anne E. Robinson
Born 1970. Secretary Since September 2016. Principal Occupation(s) During the Past Five Years and Other Experience: Managing Director of The Vanguard Group, Inc.; General Counsel of The Vanguard Group; Secretary of The Vanguard Group and of each of the investment companies served by The Vanguard Group; Director and Senior Vice President of Vanguard Marketing Corporation; Managing Director and General Counsel of Global Cards and Consumer Services at Citigroup (2014–2016); Counsel at American Express (2003–2014).
Vanguard Senior Management Team
| |
| Mortimer J. Buckley | James M. Norris |
| Kathleen C. Gubanich | Thomas M. Rampulla |
| Martha G. King | Glenn W. Reed |
| John T. Marcante | Karin A. Risi |
| Chris D. McIsaac | Michael Rollings |
Chairman Emeritus and Senior Advisor
John J. Brennan
Chairman, 1996–2009
Chief Executive Officer and President, 1996–2008
Founder
John C. Bogle
Chairman and Chief Executive Officer, 1974–1996
1 Mr. McNabb is considered an “interested person,” as defined in the Investment Company Act of 1940, because he is an officer of the Vanguard funds.
2 December 2002 for Vanguard Equity Income Fund, the Vanguard Municipal Bond Funds, and the Vanguard State Tax-Exempt Funds.
| |
|  |
| P.O. Box 2600
Valley Forge, PA 19482-2600 |
| |
Connect with Vanguard® > vanguard.com | |
| |
| Fund Information > 800-662-7447 | CFA® is a registered trademark owned by CFA Institute. |
| Direct Investor Account Services > 800-662-2739 | |
| Institutional Investor Services > 800-523-1036 | |
| Text Telephone for People | |
| Who Are Deaf or Hard of Hearing> 800-749-7273 | |
| |
| This material may be used in conjunction | |
| with the offering of shares of any Vanguard | |
| fund only if preceded or accompanied by | |
| the fund’s current prospectus. | |
| |
| All comparative mutual fund data are from Lipper, a | |
| Thomson Reuters Company, or Morningstar, Inc., unless | |
| otherwise noted. | |
| |
| You can obtain a free copy of Vanguard’s proxy voting | |
| guidelines by visiting vanguard.com/proxyreporting or by | |
| calling Vanguard at 800-662-2739. The guidelines are | |
| also available from the SEC’s website, sec.gov. In | |
| addition, you may obtain a free report on how your fund | |
| voted the proxies for securities it owned during the 12 | |
| months ended June 30. To get the report, visit either | |
| vanguard.com/proxyreporting or sec.gov. | |
| |
| You can review and copy information about your fund at | |
| the SEC’s Public Reference Room in Washington, D.C. To | |
| find out more about this public service, call the SEC at | |
| 202-551-8090. Information about your fund is also | |
| available on the SEC’s website, and you can receive | |
| copies of this information, for a fee, by sending a | |
| request in either of two ways: via email addressed to | |
| publicinfo@sec.gov or via regular mail addressed to the | |
| Public Reference Section, Securities and Exchange | |
| Commission, Washington, DC 20549-1520. | |
| |
| | © 2016 The Vanguard Group, Inc. |
| | All rights reserved. |
| | Vanguard Marketing Corporation, Distributor. |
| |
| | Q11940 122016 |
 |
| Annual Report | October 31, 2016 |
| Vanguard International Dividend Index Funds |
| Vanguard International Dividend Appreciation Index Fund |
| Vanguard International High Dividend Yield Index Fund |
A new format, unwavering commitment
As you begin reading this report, you’ll notice that we’ve made some improvements to the opening sections—based on feedback from you, our clients.
Page 1 starts with a new ”Your Fund’s Performance at a Glance,” a concise, handy summary of how your fund performed during the period.
In the renamed ”Chairman’s Perspective,” Bill McNabb will focus on enduring principles and investment insights.
We’ve modified some tables, and eliminated some redundancy, but we haven’t removed any information.
At Vanguard, we’re always looking for better ways to communicate and to help you make sound investment decisions. Thank you for entrusting your assets to us.
| |
| Contents | |
| Your Fund’s Performance at a Glance. | 1 |
| Chairman’s Perspective. | 3 |
| International Dividend Appreciation Index Fund. | 7 |
| International High Dividend Yield Index Fund. | 27 |
| About Your Fund’s Expenses. | 59 |
| Glossary. | 61 |
Please note: The opinions expressed in this report are just that—informed opinions. They should not be considered promises or advice. Also, please keep in mind that the information and opinions cover the period through the date on the front of this report. Of course, the risks of investing in your fund are spelled out in the prospectus.
See the Glossary for definitions of investment terms used in this report.
About the cover: No matter what language you speak, Vanguard has one consistent message and set of principles. Our primary focus is on you, our clients. We conduct our business with integrity as a faithful steward of your assets. This message is shown translated into seven languages, reflecting our expanding global presence.
Your Fund’s Performance at a Glance
• Vanguard International Dividend Appreciation Index Fund returned 9.57% for Investor Shares and 9.64% for ETF Shares (based on net asset value) from their February 25, 2016, inception through October 31, 2016. The fund’s Admiral Shares, from their March 2, 2016, inception, returned 6.54%.
• Vanguard International High Dividend Yield Index Fund returned 13.26% for Investor Shares and 13.37% for ETF Shares from their February 25 inception through October 31. The fund’s Admiral Shares, from their March 2 inception, returned 9.73%.
• The funds trailed their benchmark indexes as the process of launching the funds served as an initial drag on performance.
• Emerging markets posted the highest returns. Pacific region results were also strong, boosted in part by the rising Japanese yen and Australian dollar.
• Please note that on November 30, we announced that purchase and redemption fees of 0.25% would be added for Investor and Admiral Shares, effective February 7, 2017.
| |
| Total Returns: Period Ended October 31, 2016 | |
| |
| | Returns Since |
| | Inception |
| Vanguard International Dividend Appreciation Index Fund | |
| Investor Shares (Inception: 2/25/2016) | 9.57% |
| ETF Shares (Inception: 2/25/2016) | |
| Market Price | 10.03 |
| Net Asset Value | 9.64 |
| Admiral™ Shares (Inception: 3/2/2016) | 6.54 |
| NASDAQ International Dividend Achievers Select Index | 10.47 |
| International Large-Cap Core Funds Average | 10.00 |
| International Large-Cap Core Funds Average: Derived from data provided by Lipper, a Thomson Reuters Company. |
1
| |
| | Returns Since |
| | Inception |
| Vanguard International High Dividend Yield Index Fund | |
| Investor Shares (Inception: 2/25/2016) | 13.26% |
| ETF Shares (Inception: 2/25/2016) | |
| Market Price | 13.79 |
| Net Asset Value | 13.37 |
| Admiral Shares (Inception: 3/2/2016) | 9.73 |
| FTSE All-World ex US High Dividend Yield Index | 14.71 |
| International Income Funds Average | 5.05 |
| International Income Funds Average: Derived from data provided by Lipper, a Thomson Reuters Company. | |
Admiral Shares carry lower expenses and are available to investors who meet certain account-balance requirements. The Vanguard ETF® Shares shown are traded on the Nasdaq exchange and are available only through brokers. The table provides ETF returns based on both the Nasdaq market price and the net asset value for a share. U.S. Pat. Nos. 6,879,964; 7,337,138; 7,720,749; 7,925,573; 8,090,646; and 8,417,623.
For the ETF Shares, the market price is determined by the midpoint of the bid-offer spread as of the closing time of the New York Stock Exchange (generally 4 p.m., Eastern time). The net asset value is also determined as of the NYSE closing time. For more information about how the ETF Shares' market prices have compared with their net asset value, visit vanguard.com, select your ETF, and then select the Price and Performance tab. The ETF premium/discount analysis there shows the percentages of days on which the ETF Shares' market price was above or below the NAV.
Benchmark returns are calculated from the start of the reporting period or from the earliest share-class inception date.
| | | | |
| Expense Ratios | | | | |
| Your Fund Compared With Its Peer Group | | | | |
| | Investor | ETF | Admiral | Peer Group |
| | Shares | Shares | Shares | Average |
| International Dividend Appreciation | | | | |
| Index Fund | 0.35% | 0.25% | 0.25% | 1.23% |
| International High Dividend Yield Index | | | | |
| Fund | 0.40 | 0.30 | 0.30 | 1.05 |
The fund expense ratios shown are from the prospectus dated February 25, 2016, and represent estimated costs for the current fiscal year. For the period from inception through October 31, 2016, the funds’ annualized expense ratios were: for the International Dividend Appreciation Index Fund, 0.35% for Investor Shares, 0.25% for ETF Shares, and 0.25% for Admiral Shares; and for the International High Dividend Yield Index Fund, 0.42% for Investor Shares, 0.32% for ETF Shares, and 0.32% for Admiral Shares. The peer-group expense ratio is derived from data provided by Lipper, a Thomson Reuters Company, and captures information through year-end 2015.
Peer groups: For the International Dividend Appreciation Index Fund, International Large-Cap Core Funds; for the International High Dividend Yield Index Fund, International Income Funds.
2
Chairman’s Perspective

Bill McNabb
Chairman and Chief Executive Officer
Dear Shareholder,
Over the three years ended August 31, 2016, investors poured more than $1 trillion into index funds. Indexing now accounts for nearly a third of all mutual fund assets—more than double what it did a decade ago and eight times its share two decades ago.1
By contrast, active management’s commercial struggles have reflected its disappointing investment performance. Over the decade ended December 31, 2015, 82% of actively managed stock funds and 81% of active bond funds have either underperformed their benchmarks or shut down.
This subpar performance has fueled the explosion of asset growth in indexing among individual, retirement, and nonprofit investors. So what might the trend mean for the future of actively managed funds?
Our research and experience indicate that active management can survive—and even succeed—but only if it’s offered at much lower expense.
High costs, which limit a manager’s ability to deliver benchmark-beating returns to clients, are the biggest reason why active has lagged. Industrywide as of December 31, 2015, the average expense ratio for all active stock funds is 1.14%, compared with 0.76% for stock index
1 Sources: Wall Street Journal; Morningstar, Inc.; and Investment Company Institute, 2016.
3
funds. And the expense advantage is even wider for bonds; the average expense ratio for an active bond fund is 0.93%, compared with 0.43% for bond index funds.
But even these big differences understate the real gap. These days, it’s not hard to find an index fund that charges maybe 0.05% or 0.10%. So even if you have identified active managers who are skilled at selecting stocks and bonds, to match the return of a comparable (much cheaper) index fund would require significant outperformance. Think about it. Any fund that charges 1.00% in expenses—not even the high end of the range—will find it extraordinarily difficult to overcome the index fund’s head start.
Active management also has taken a hit from a regulatory environment that has been favorable to low-cost strategies. The U.S. Department of Labor several years ago mandated greater disclosure of retirement plan fees. And its new fiduciary rule, which is set to take effect in April, requires financial advisors to demonstrate that their recommendations are aligned with their clients’ best interest. Both changes encourage the use of lower-cost investments, including index funds.
The future of active management
In light of all this, people have been asking me whether active management is “dead.” My response is both yes and no. High-cost active management is dead, and rightly so. It has never been a winning proposition
| | | |
| Market Barometer | | | |
| | | Average Annual Total Returns |
| | | Periods Ended October 31, 2016 |
| | One | Three | Five |
| | Year | Years | Years |
| Stocks | | | |
| Russell 1000 Index (Large-caps) | 4.26% | 8.48% | 13.51% |
| Russell 2000 Index (Small-caps) | 4.11 | 4.12 | 11.51 |
| Russell 3000 Index (Broad U.S. market) | 4.24 | 8.13 | 13.35 |
| FTSE All-World ex US Index (International) | 0.64 | -0.94 | 4.09 |
| |
| Bonds | | | |
| Bloomberg Barclays U.S. Aggregate Bond Index | | | |
| (Broad taxable market) | 4.37% | 3.48% | 2.90% |
| Bloomberg Barclays Municipal Bond Index | | | |
| (Broad tax-exempt market) | 4.06 | 4.89 | 4.34 |
| Citigroup Three-Month U.S. Treasury Bill Index | 0.22 | 0.07 | 0.07 |
| |
| CPI | | | |
| Consumer Price Index | 1.64% | 1.15% | 1.32% |
4
for investors. Low-cost active funds, though, can potentially play an important role for investors who seek to outperform the market.
Paying less for your funds is the only sure-fire way to improve your odds of achieving success in active management. But even if you have found an active manager with low costs, the odds of outperforming the market are still long. You have to be able to identify talented stock and bond portfolio managers with long time horizons and clear investment strategies. Look for managers with consistent track records and the discipline to stick closely to their investment strategy.
Know what you own and why
Despite the well-deserved reputation of indexing and the challenges for active managers, there’s still a place for traditional active strategies that are low-cost, diversified, and highly disciplined, and are run by talented managers who focus on the long term.
Vanguard has always applied these principles to our active strategies, and investors have benefited as a majority of our active funds outperformed their benchmarks and bested their peers’ average annual return over the ten years ended September 30, 2016.
Worried about the election’s impact on your portfolio?
The 2016 presidential election season was one of the most intense and unpredictable in U.S. history. In its aftermath, investors may be left with lingering questions about what the outcome will mean for their portfolios. The answer, based on Vanguard research into decades of historical data, is that presidential elections typically have no long-term effect on market performance.
These findings hold true regardless of the market’s initial reaction. Whether there’s a swoon or bounce immediately after an election, investors shouldn’t extrapolate that performance to the long term.
As you can see in the accompanying chart, data going back to 1853 show that stock market returns are virtually identical no matter which party controls the White House. Although headlines out of Washington at any given time may still cause concern, investors shouldn’t overreact to short-term events. Instead, it’s best to maintain a balanced and diversified portfolio and stay focused on your long-term goals.
Average annual stock market returns based on party control of the White House (1853–2015)
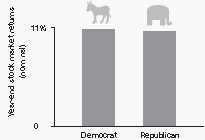
Sources: Global Financial Data, 1853–1926; Morningstar, Inc., and Ibbotson Associates thereafter through 2015.
5
But it’s crucial for investors to be patient. Even active managers with the best track records frequently underperform their benchmarks when their investment styles are out of favor. Such periods, though temporary, can persist. So it’s important when entrusting your assets to an active strategy to be in it for the long haul.
Make sure you know what you’re buying and what the risks are. Active strategies are becoming more complex, so it’s important to clearly understand what the investments in your portfolio are designed to accomplish and why you want to hold them. Otherwise, you run the risk of selecting strategies that don’t fit your needs or objectives.
Keeping these considerations in mind can potentially boost your chances of success in identifying active strategies that may be able to help you reach your goals.
As always, thank you for investing with Vanguard.
Sincerely,

F. William McNabb III
Chairman and Chief Executive Officer
November 9, 2016
6
International Dividend Appreciation Index Fund
Fund Profile
As of October 31, 2016
| | | |
| Share-Class Characteristics | | |
| |
| | Investor | ETF | Admiral |
| | Shares | Shares | Shares |
| Ticker Symbol | VIAIX | VIGI | VIAAX |
| Expense Ratio1 | 0.35% | 0.25% | 0.25% |
| | |
| Portfolio Characteristics | | |
| | | NASDAQ |
| | | International |
| | | Dividend |
| | | Achievers |
| | Fund | Select Index |
| Number of Stocks | 198 | 198 |
| Median Market Cap | $42.3B | $42.3B |
| Price/Earnings Ratio | 25.2x | 26.1x |
| Price/Book Ratio | 2.6x | 2.6x |
| Return on Equity | 19.7% | 19.6% |
| Earnings Growth | | |
| Rate | 8.1% | 8.4% |
| Dividend Yield | 2.2% | 2.2% |
| Turnover Rate | 8% | — |
| Short-Term Reserves | 8.2% | — |
| | |
| Sector Diversification (% of equity exposure) |
| | | NASDAQ |
| | | International |
| | | Dividend |
| | | Achievers |
| | Fund | Select Index |
| Basic Materials | 3.5% | 3.5% |
| Consumer Goods | 18.2 | 18.7 |
| Consumer Services | 10.3 | 10.5 |
| Financials | 8.9 | 8.2 |
| Health Care | 23.3 | 23.3 |
| Industrials | 8.8 | 8.5 |
| Oil & Gas | 6.9 | 7.0 |
| Technology | 10.1 | 10.0 |
| Telecommunications | 6.4 | 6.6 |
| Utilities | 3.6 | 3.7 |
| | |
| Ten Largest Holdings (% of total net assets) |
| Tencent Holdings Ltd. | Internet | 5.3% |
| Nestle SA | Food Products | 3.8 |
| Novartis AG | Pharmaceuticals | 3.6 |
| Sanofi | Pharmaceuticals | 3.4 |
| L'Oreal SA | Personal Products | 3.3 |
| Roche Holding AG | Pharmaceuticals | 3.3 |
| Nippon Telegraph & | Fixed Line | |
| Telephone Corp. | Telecommunications | 3.0 |
| BHP Billiton | General Mining | 2.9 |
| Novo Nordisk A/S | Pharmaceuticals | 2.4 |
| Naspers Ltd. | Broadcasting & | |
| | Entertainment | 2.4 |
| Top Ten | | 33.4% |
The holdings listed exclude any temporary cash investments and equity index products.
Allocation by Region (% of equity exposure)

Investment Focus
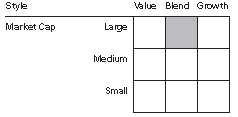
1 The expense ratios shown are from the prospectus dated February 25, 2016, and represent estimated costs for the current fiscal year. For the period from inception through October 31, 2016, the annualized expense ratios were 0.35% for Investor Shares, 0.25% for ETF Shares, and 0.25% for Admiral Shares.
7
International Dividend Appreciation Index Fund
| | |
| Market Diversification (% of equity exposure) |
| | | NASDAQ |
| | | International |
| | | Dividend |
| | | Achievers |
| | Fund Select Index |
| Europe | | |
| Switzerland | 11.1% | 11.1% |
| France | 9.5 | 9.4 |
| United Kingdom | 5.4 | 5.6 |
| Denmark | 3.3 | 3.2 |
| Netherlands | 2.9 | 2.8 |
| Germany | 2.8 | 2.7 |
| Spain | 1.4 | 1.2 |
| Other | 1.6 | 1.7 |
| Subtotal | 38.0% | 37.7% |
| Pacific | | |
| Japan | 9.2% | 9.3% |
| Hong Kong | 5.6 | 5.7 |
| Australia | 4.5 | 4.5 |
| South Korea | 1.7 | 1.7 |
| Other | 0.1 | 0.1 |
| Subtotal | 21.1% | 21.3% |
| Emerging Markets | | |
| India | 10.7% | 10.4% |
| China | 7.4 | 7.6 |
| South Africa | 2.7 | 2.7 |
| Mexico | 1.4 | 1.4 |
| Other | 1.5 | 1.8 |
| Subtotal | 23.7% | 23.9% |
| North America | | |
| Canada | 15.8% | 15.7% |
| Middle East | | |
| Israel | 1.4% | 1.4% |
8
International Dividend Appreciation Index Fund
Performance Summary
All of the returns in this report represent past performance, which is not a guarantee of future results that may be achieved by the fund. (Current performance may be lower or higher than the performance data cited. For performance data current to the most recent month-end, visit our website at vanguard.com/performance.) Note, too, that both investment returns and principal value can fluctuate widely, so an investor’s shares, when sold, could be worth more or less than their original cost. The returns shown do not reflect taxes that a shareholder would pay on fund distributions or on the sale of fund shares.
Cumulative Performance: February 25, 2016, Through October 31, 2016
Initial Investment of $10,000
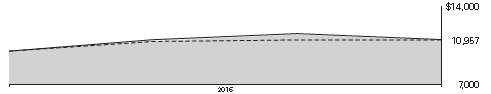
| | |
| | Total Returns | |
| | Period Ended October 31, 2016 | |
| | Since | Final Value |
| | Inception | of a $10,000 |
| | (2/25/2016) | Investment |
| International Dividend Appreciation | | |
| Index Fund Investor Shares | 9.57% | $10,957 |
| NASDAQ International Dividend | | |
| Achievers Select Index | 10.47 | 11,047 |
| International Large-Cap Core Funds | | |
| Average | 10.00 | 11,000 |
International Large-Cap Core Funds Average: Derived from data provided by Lipper, a Thomson Reuters Company.
"Since Inception" performance is calculated from the Investor Shares’ inception date for both the fund and its comparative standards.
| | |
| | Since | Final Value |
| | Inception | of a $10,000 |
| | (2/25/2016) | Investment |
| International Dividend Appreciation Index Fund | | |
| ETF Shares Net Asset Value | 9.64% | $10,964 |
| International Dividend Appreciation Index Fund | | |
| ETF Shares Market Price | 10.03 | 11,003 |
| NASDAQ International Dividend Achievers Select Index | 10.47 | 11,047 |
| "Since Inception" performance is calculated from the ETF Shares’ inception date for both the fund and its comparative standards. |
See Financial Highlights for dividend and capital gains information.
9
| | |
| International Dividend Appreciation Index Fund | | |
| |
| |
| |
| |
| | Total Returns | |
| | Period Ended October 31, 2016 | |
| | Since | Final Value |
| | Inception | of a $10,000 |
| | (3/2/2016) | Investment |
| International Dividend Appreciation Index | | |
| Fund Admiral Shares | 6.54% | $10,654 |
| NASDAQ International Dividend Achievers | | |
| Select Index | 7.23 | 10,723 |
"Since Inception" performance is calculated from the Admiral Shares’ inception date for both the fund and its comparative standards.
| |
| Cumulative Returns of ETF Shares: February 25, 2016, Through October 31, 2016 | |
| | Since |
| | Inception |
| | (2/25/2016) |
| International Dividend Appreciation Index Fund ETF | |
| Shares Market Price | 10.03% |
| International Dividend Appreciation Index Fund ETF | |
| Shares Net Asset Value | 9.64 |
| NASDAQ International Dividend Achievers Select | |
| Index | 10.47 |
"Since Inception" performance is calculated from the ETF Shares’ inception date for both the fund and its comparative standards.
10
International Dividend Appreciation Index Fund
Fiscal-Period Total Returns (%): February 25, 2016, Through October 31, 2016
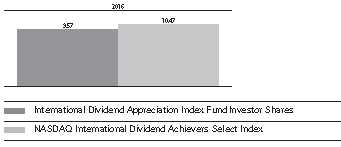
Average Annual Total Returns: Periods Ended September 30, 2016
This table presents returns through the latest calendar quarter—rather than through the end of the fiscal period.
Securities and Exchange Commission rules require that we provide this information.
| | |
| | | Since Inception |
| | Inception Date | Total |
| Investor Shares | 2/25/2016 | 14.20% |
| ETF Shares | 2/25/2016 | |
| Market Price | | 14.90 |
| Net Asset Value | | 14.29 |
| Admiral Shares | 3/2/2016 | 11.05 |
11
International Dividend Appreciation Index Fund
Financial Statements
Statement of Net Assets
As of October 31, 2016
The fund reports a complete list of its holdings in regulatory filings four times in each fiscal year, at the quarter-ends. For the second and fourth fiscal quarters, the lists appear in the fund’s semiannual and annual reports to shareholders. For the first and third fiscal quarters, the fund files the lists with the Securities and Exchange Commission on Form N-Q. Shareholders can look up the fund’s Forms N-Q on the SEC’s website at sec.gov. Forms N-Q may also be reviewed and copied at the SEC’s Public Reference Room (see the back cover of this report for further information).
| | |
| | | Market |
| | | Value• |
| | Shares | ($000) |
| Common Stocks (99.1%)1 | | |
| Australia (4.4%) | | |
| BHP Billiton Ltd. | 238,155 | 4,161 |
| CSL Ltd. | 34,281 | 2,616 |
| Woolworths Ltd. | 95,294 | 1,710 |
| Ramsay Health Care Ltd. | 15,428 | 859 |
| Domino’s Pizza Enterprises | | |
| Ltd. | 7,133 | 348 |
| Washington H Soul | | |
| Pattinson & Co. Ltd. | 15,847 | 191 |
| InvoCare Ltd. | 10,897 | 108 |
| Retail Food Group Ltd. | 13,999 | 72 |
| FlexiGroup Ltd. | 41,082 | 70 |
| Collection House Ltd. | 19,469 | 20 |
| | | 10,155 |
| Belgium (0.6%) | | |
| Groupe Bruxelles Lambert | | |
| SA | 12,022 | 1,033 |
| Sofina SA | 2,059 | 288 |
| * Fagron | 6,297 | 62 |
| | | 1,383 |
| Brazil (0.0%) | | |
| Ez Tec Empreendimentos | | |
| e Participacoes SA | 15,488 | 80 |
| |
| Canada (15.7%) | | |
| Canadian National Railway | | |
| Co. | 59,378 | 3,733 |
| Suncor Energy Inc. | 114,473 | 3,435 |
| BCE Inc. | 64,714 | 2,940 |
| Enbridge Inc. | 65,128 | 2,812 |
| TransCanada Corp. | 58,536 | 2,650 |
| Canadian Natural | | |
| Resources Ltd. | 80,086 | 2,542 |
| Thomson Reuters Corp. | 59,128 | 2,330 |
| Imperial Oil Ltd. | 62,802 | 2,037 |
| TELUS Corp. | 44,550 | 1,443 |
| Rogers Communications | | |
| Inc. Class B | 31,244 | 1,257 |
| | | |
| | Saputo Inc. | 28,785 | 1,034 |
| | Fortis Inc. | 30,049 | 989 |
| | Franco-Nevada Corp. | 12,960 | 848 |
| | Shaw Communications Inc. | | |
| | Class B | 35,943 | 712 |
| | Intact Financial Corp. | 10,232 | 696 |
| | Metro Inc. | 19,356 | 598 |
| | Emera Inc. | 14,794 | 516 |
| | Inter Pipeline Ltd. | 24,378 | 505 |
| | CCL Industries Inc. Class B | 2,584 | 460 |
| | SNC-Lavalin Group Inc. | 11,108 | 451 |
| | Canadian Utilities Ltd. | | |
| | Class A | 14,489 | 414 |
| | Keyera Corp. | 13,602 | 408 |
| | Ritchie Bros Auctioneers Inc. | 8,229 | 285 |
| | CAE Inc. | 18,818 | 264 |
| | Finning International Inc. | 13,550 | 252 |
| | Atco Ltd. | 6,670 | 234 |
| | Empire Co. Ltd. | 15,043 | 217 |
| | Stella-Jones Inc. | 5,795 | 206 |
| | Toromont Industries Ltd. | 5,882 | 173 |
| ^ | Canadian Western Bank | 8,000 | 152 |
| | Cogeco Communications | | |
| | Inc. | 3,249 | 152 |
| | ShawCor Ltd. | 5,680 | 142 |
| | Molson Coors Canada Inc. | | |
| | Class B | 1,183 | 123 |
| | Enghouse Systems Ltd. | 3,231 | 121 |
| | Jean Coutu Group PJC Inc. | | |
| | Class A | 7,716 | 116 |
| | Laurentian Bank of Canada | 3,086 | 114 |
| | Pason Systems Inc. | 7,836 | 89 |
| | Transcontinental Inc. | | |
| | Class A | 6,112 | 82 |
| | Gluskin Sheff & Associates | | |
| | Inc. | 6,506 | 78 |
| | Boyd Group Income Fund | 1,212 | 75 |
| | Computer Modelling Group | | |
| | Ltd. | 7,988 | 59 |
| | High Liner Foods Inc. | 3,100 | 57 |
12
International Dividend Appreciation Index Fund
| | |
| | | Market |
| | | Value• |
| | Shares | ($000) |
| Ensign Energy Services Inc. | 5,693 | 34 |
| ^ Home Capital Group Inc. | | |
| Class B | 600 | 12 |
| | | 35,847 |
| China (7.4%) | | |
| Tencent Holdings Ltd. | 455,900 | 12,082 |
| China Overseas Land & | | |
| Investment Ltd. | 826,000 | 2,536 |
| Hengan International Group | | |
| Co. Ltd. | 88,000 | 699 |
| China Gas Holdings Ltd. | 363,000 | 553 |
| China Everbright | | |
| International Ltd. | 349,000 | 417 |
| ENN Energy Holdings Ltd. | 84,000 | 395 |
| Shanghai Lujiazui Finance & | | |
| Trade Zone Development | | |
| Co. Ltd. Class B | 49,940 | 78 |
| Huaxin Cement Co. Ltd. | | |
| Class B | 70,500 | 50 |
| * Qinqin Foodstuffs Group | | |
| Cayman Co. Ltd. | 8,100 | 3 |
| | | 16,813 |
| Colombia (0.3%) | | |
| Grupo de Inversiones | | |
| Suramericana SA | 34,741 | 448 |
| Bancolombia SA ADR | 7,225 | 276 |
| Bancolombia SA Preference | | |
| Shares | 4,617 | 44 |
| | | 768 |
| Denmark (3.2%) | | |
| Novo Nordisk A/S Class B | 155,827 | 5,551 |
| Coloplast A/S Class B | 15,534 | 1,082 |
| Novozymes A/S | 20,475 | 760 |
| | | 7,393 |
| Finland (0.0%) | | |
| Raisio Oyj | 14,266 | 60 |
| |
| France (9.4%) | | |
| Sanofi | 98,833 | 7,691 |
| L’Oreal SA | 42,706 | 7,651 |
| Hermes International | 8,045 | 3,259 |
| Essilor International SA | 16,770 | 1,885 |
| SEB SA | 3,810 | 561 |
| Rubis SCA | 3,328 | 303 |
| IPSOS | 3,920 | 128 |
| | | 21,478 |
| Germany (2.7%) | | |
| Fresenius SE & Co. KGaA | 41,534 | 3,069 |
| Fresenius Medical Care | | |
| AG & Co. KGaA | 23,937 | 1,950 |
| Fielmann AG | 6,559 | 455 |
| CTS Eventim AG & Co. | | |
| KGaA | 8,321 | 299 |
| | |
| Fuchs Petrolub SE | | |
| Preference Shares | 5,373 | 240 |
| AURELIUS Equity | | |
| Opportunities SE & Co. | | |
| KGaA | 2,541 | 152 |
| BayWa AG | 2,913 | 98 |
| | | 6,263 |
| Hong Kong (5.6%) | | |
| Jardine Matheson Holdings | | |
| Ltd. | 52,383 | 3,191 |
| Jardine Strategic Holdings | | |
| Ltd. | 82,400 | 2,891 |
| MTR Corp. Ltd. | 425,500 | 2,355 |
| Hong Kong & China Gas | | |
| Co. Ltd. | 904,600 | 1,767 |
| Cheung Kong Infrastructure | | |
| Holdings Ltd. | 189,000 | 1,546 |
| Techtronic Industries Co. | | |
| Ltd. | 145,000 | 545 |
| Minth Group Ltd. | 139,000 | 492 |
| | | 12,787 |
| India (10.6%) | | |
| Tata Consultancy Services | | |
| Ltd. | 148,672 | 5,341 |
| HDFC Bank Ltd. ADR | 55,558 | 3,932 |
| ITC Ltd. | 903,985 | 3,293 |
| Housing Development | | |
| Finance Corp. Ltd. | 120,990 | 2,525 |
| Infosys Ltd. ADR | 136,156 | 2,078 |
| Larsen & Toubro Ltd. | 68,392 | 1,518 |
| Axis Bank Ltd. | 182,684 | 1,334 |
| Asian Paints Ltd. | 71,117 | 1,139 |
| IndusInd Bank Ltd. | 44,469 | 800 |
| Lupin Ltd. | 34,724 | 774 |
| HDFC Bank Ltd. | 22,105 | 417 |
| Power Finance Corp. Ltd. | 199,519 | 371 |
| LIC Housing Finance Ltd. | 41,600 | 363 |
| Infosys Ltd. | 16,805 | 251 |
| Reliance Infrastructure Ltd. | 20,163 | 164 |
| Larsen & Toubro Ltd. GDR | 1,491 | 33 |
| | | 24,333 |
| Indonesia (0.2%) | | |
| Indocement Tunggal | | |
| Prakarsa Tbk PT | 290,300 | 365 |
| |
| Ireland (0.3%) | | |
| Kerry Group plc Class A | 7,783 | 565 |
| Glanbia plc | 1,319 | 21 |
| | | 586 |
| Israel (1.4%) | | |
| Teva Pharmaceutical | | |
| Industries Ltd. | 77,426 | 3,234 |
13
International Dividend Appreciation Index Fund
| | |
| | | Market |
| | | Value• |
| | Shares | ($000) |
| Italy (0.1%) | | |
| DiaSorin SPA | 4,364 | 268 |
| |
| Japan (9.2%) | | |
| Nippon Telegraph & | | |
| Telephone Corp. | 155,788 | 6,907 |
| Yahoo Japan Corp. | 411,400 | 1,578 |
| Asahi Group Holdings Ltd. | 34,600 | 1,234 |
| Unicharm Corp. | 44,800 | 1,065 |
| Sysmex Corp. | 14,900 | 1,033 |
| Nitori Holdings Co. Ltd. | 8,300 | 992 |
| Daito Trust Construction | | |
| Co. Ltd. | 5,500 | 922 |
| West Japan Railway Co. | 13,600 | 837 |
| M3 Inc. | 23,800 | 724 |
| Lawson Inc. | 7,200 | 547 |
| Don Quijote Holdings Co. | | |
| Ltd. | 11,100 | 422 |
| Sundrug Co. Ltd. | 4,800 | 378 |
| Shimamura Co. Ltd. | 2,500 | 320 |
| Rinnai Corp. | 3,200 | 307 |
| Mitsubishi UFJ Lease & | | |
| Finance Co. Ltd. | 62,400 | 302 |
| Kakaku.com Inc. | 15,600 | 262 |
| Kobayashi Pharmaceutical | | |
| Co. Ltd. | 5,000 | 261 |
| San-A Co. Ltd. | 4,600 | 250 |
| Miraca Holdings Inc. | 4,900 | 237 |
| Fuyo General Lease Co. Ltd. | 4,600 | 233 |
| Kaken Pharmaceutical Co. | | |
| Ltd. | 3,200 | 202 |
| Yaoko Co. Ltd. | 4,600 | 193 |
| Siix Corp. | 4,300 | 172 |
| Relo Group Inc. | 1,000 | 166 |
| Glory Ltd. | 5,000 | 165 |
| Hamakyorex Co. Ltd. | 8,500 | 158 |
| NEC Networks & System | | |
| Integration Corp. | 8,600 | 153 |
| Modec Inc. | 8,700 | 147 |
| Ci:z Holdings Co. Ltd. | 4,900 | 141 |
| Aeon Delight Co. Ltd. | 4,700 | 139 |
| SHO-BOND Holdings Co. | | |
| Ltd. | 2,652 | 128 |
| Kissei Pharmaceutical Co. | | |
| Ltd. | 4,700 | 123 |
| Hiday Hidaka Corp. | 4,500 | 112 |
| F@N Communications Inc. | 13,400 | 100 |
| GMO Payment Gateway Inc. | 400 | 18 |
| Meiko Network Japan Co. | | |
| Ltd. | 400 | 4 |
| JP-Holdings Inc. | 400 | 1 |
| | | 20,933 |
| | |
| Mexico (1.4%) | | |
| America Movil SAB | | |
| de CV | 3,209,032 | 2,126 |
| Grupo Financiero Inbursa | | |
| SAB de CV | 522,340 | 847 |
| Kimberly-Clark de Mexico | | |
| SAB de CV Class A | 130,600 | 282 |
| | | 3,255 |
| Netherlands (2.8%) | | |
| Unilever NV | 131,760 | 5,511 |
| Wolters Kluwer NV | 24,481 | 947 |
| | | 6,458 |
| New Zealand (0.1%) | | |
| Ryman Healthcare Ltd. | 42,998 | 273 |
| |
| Norway (0.1%) | | |
| Tomra Systems ASA | 13,917 | 151 |
| |
| Philippines (0.8%) | | |
| SM Investments Corp. | 90,705 | 1,257 |
| Jollibee Foods Corp. | 84,136 | 413 |
| Manila Water Co. Inc. | 162,500 | 102 |
| | | 1,772 |
| Poland (0.1%) | | |
| Asseco Poland SA | 9,078 | 121 |
| |
| South Africa (2.7%) | | |
| Naspers Ltd. | 32,945 | 5,518 |
| Discovery Ltd. | 53,879 | 460 |
| * EOH Holdings Ltd. | 14,225 | 169 |
| | | 6,147 |
| South Korea (1.7%) | | |
| Hyundai Motor Co. | 16,863 | 2,059 |
| Hyundai Mobis Co. Ltd. | 7,480 | 1,784 |
| Dongsuh Cos. Inc. | 171 | 4 |
| | | 3,847 |
| Spain (1.4%) | | |
| Abertis Infraestructuras SA | 78,482 | 1,163 |
| * Red Electrica Corp. SA | 45,448 | 947 |
| Enagas SA | 20,646 | 592 |
| Viscofan SA | 4,490 | 212 |
| Vidrala SA | 2,220 | 127 |
| Miquel y Costas & Miquel SA | 916 | 39 |
| | | 3,080 |
| Sweden (0.5%) | | |
| Castellum AB | 23,956 | 325 |
| Hufvudstaden AB Class A | 19,422 | 301 |
| Intrum Justitia AB | 6,765 | 208 |
| Wihlborgs Fastigheter AB | 9,702 | 188 |
| | | 1,022 |
| Switzerland (11.0%) | | |
| Nestle SA | 119,707 | 8,681 |
| Novartis AG | 117,003 | 8,303 |
14
International Dividend Appreciation Index Fund
| | |
| | | Market |
| | | Value• |
| | Shares | ($000) |
| Roche Holding AG | 32,707 | 7,512 |
| Chocoladefabriken Lindt & | | |
| Spruengli AG | 96 | 499 |
| Galenica AG | 128 | 128 |
| | | 25,123 |
| Thailand (0.1%) | | |
| * Glow Energy PCL | 113,700 | 250 |
| |
| Turkey (0.0%) | | |
| BIM Birlesik Magazalar AS | 2,056 | 33 |
| |
| United Kingdom (5.3%) | | |
| Shire plc | 69,287 | 3,912 |
| BHP Billiton plc | 163,518 | 2,459 |
| Experian plc | 88,006 | 1,692 |
| Associated British Foods plc | 43,377 | 1,305 |
| Smith & Nephew plc | 84,306 | 1,219 |
| Micro Focus International plc | 19,914 | 521 |
| John Wood Group plc | 44,979 | 423 |
| JD Sports Fashion plc | 19,114 | 355 |
| Abcam plc | 22,206 | 237 |
| Hikma Pharmaceuticals plc | 2,252 | 48 |
| Rightmove plc | 549 | 25 |
| | | 12,196 |
| Total Common Stocks (Cost $229,039) | 226,474 |
| Temporary Cash Investments (9.9%)1 | |
| Money Market Fund (9.9%) | | |
| 2,3 Vanguard Market Liquidity | | |
| Fund, 0.718% | 226,443 | 22,647 |
| |
| | Face | |
| | Amount | |
| | ($000) | |
| U.S. Government and Agency Obligations (0.0%) |
| 4 United States Treasury | | |
| Bill, 0.330%, 12/29/16 | 100 | 100 |
| Total Temporary Cash Investments | |
| (Cost $22,746) | | 22,747 |
| Total Investments (109.0%) | | |
| (Cost $251,785) | | 249,221 |
| Other Assets and Liabilities (-9.0%) | |
| Other Assets 5 | | 4,851 |
| Liabilities 3 | | (25,510) |
| | | (20,659) |
| Net Assets (100%) | | 228,562 |
| |
| | Amount |
| | ($000) |
| Statement of Assets and Liabilities | |
| Assets | |
| Investments in Securities, at Value | |
| Unaffiliated Issuers | 226,574 |
| Affiliated Vanguard Funds | 22,647 |
| Total Investments in Securities | 249,221 |
| Investment in Vanguard | 16 |
| Receivables for Investment Securities Sold | 3,163 |
| Receivables for Accrued Income | 240 |
| Receivables for Capital Shares Issued | 210 |
| Other Assets | 1,222 |
| Total Assets | 254,072 |
| Liabilities | |
| Payables for Investment Securities | |
| Purchased | (25,082) |
| Collateral for Securities on Loan | (183) |
| Payables for Capital Shares Redeemed | (208) |
| Payables to Vanguard | (34) |
| Other Liabilities | (3) |
| Total Liabilities | (25,510) |
| Net Assets | 228,562 |
| |
| At October 31, 2016, net assets consisted of: |
| | Amount |
| | ($000) |
| Paid-in Capital | 231,226 |
| Undistributed Net Investment Income | 227 |
| Accumulated Net Realized Losses | (387) |
| Unrealized Appreciation (Depreciation) | |
| Investment Securities | (2,564) |
| Futures Contracts | (6) |
| Foreign Currencies | 66 |
| Net Assets | 228,562 |
| |
| |
| Investor Shares—Net Assets | |
| Applicable to 205,153 outstanding | |
| $.001 par value shares of beneficial | |
| interest (unlimited authorization) | 4,466 |
| Net Asset Value Per Share— | |
| Investor Shares | $21.77 |
| |
| |
| ETF Shares—Net Assets | |
| Applicable to 2,700,212 outstanding | |
| $.001 par value shares of beneficial | |
| interest (unlimited authorization) | 146,981 |
| Net Asset Value Per Share— | |
| ETF Shares | $54.43 |
15
International Dividend Appreciation Index Fund
| |
| | Amount |
| | ($000) |
| Admiral Shares—Net Assets | |
| Applicable to 2,915,505 outstanding | |
| $.001 par value shares of beneficial | |
| interest (unlimited authorization) | 77,115 |
| Net Asset Value Per Share— | |
| Admiral Shares | $26.45 |
• See Note A in Notes to Financial Statements.
* Non-income-producing security.
^ Includes partial security positions on loan to broker-dealers. The total value of securities on loan is $173,000.
1 The fund invests a portion of its cash reserves in equity markets through the use of index futures contracts. After giving effect to futures
investments, the fund’s effective common stock and temporary cash investment positions represent 100.0% and 9.0%, respectively, of net
assets.
2 Affiliated money market fund available only to Vanguard funds and certain trusts and accounts managed by Vanguard. Rate shown is the
7-day yield.
3 Includes $183,000 of collateral received for securities on loan.
4 Securities with a value of $100,000 have been segregated as initial margin for open futures contracts.
5 Cash of $105,000 has been segregated as initial margin for open futures contracts.
ADR—American Depositary Receipt.
GDR—Global Depositary Receipt.
See accompanying Notes, which are an integral part of the Financial Statements.
16
| |
| International Dividend Appreciation Index Fund | |
| |
| |
| Statement of Operations | |
| |
| | February 25, 20161 to |
| | October 31, 2016 |
| | ($000) |
| Investment Income | |
| Income | |
| Dividends2 | 1,390 |
| Interest3 | 7 |
| Securities Lending—Net | 5 |
| Total Income | 1,402 |
| Expenses | |
| The Vanguard Group—Note B | |
| Investment Advisory Services | 8 |
| Management and Administrative—Investor Shares | 3 |
| Management and Administrative—ETF Shares | 2 |
| Management and Administrative—Admiral Shares | 3 |
| Marketing and Distribution—Investor Shares | — |
| Marketing and Distribution—ETF Shares | 3 |
| Marketing and Distribution—Admiral Shares | 1 |
| Custodian Fees | 150 |
| Auditing Fees | 17 |
| Shareholders’ Reports—Investor Shares | 1 |
| Shareholders’ Reports—ETF Shares | 2 |
| Shareholders’ Reports—Admiral Shares | 1 |
| Total Expenses | 191 |
| Net Investment Income | 1,211 |
| Realized Net Gain (Loss) | |
| Investment Securities Sold3 | (340) |
| Futures Contracts | (47) |
| Foreign Currencies | (146) |
| Realized Net Gain (Loss) | (533) |
| Change in Unrealized Appreciation (Depreciation) | |
| Investment Securities | (2,564) |
| Futures Contracts | (6) |
| Foreign Currencies | 66 |
| Change in Unrealized Appreciation (Depreciation) | (2,504) |
| Net Increase (Decrease) in Net Assets Resulting from Operations | (1,826) |
1 Inception.
2 Dividends are net of foreign withholding taxes of $141,000.
3 Interest income and realized net gain (loss) from an affiliated company of the fund were $7,000 and $0, respectively.
See accompanying Notes, which are an integral part of the Financial Statements.
17
| |
| International Dividend Appreciation Index Fund | |
| |
| |
| Statement of Changes in Net Assets | |
| |
| | February 25, 20161 to |
| | October 31, 2016 |
| | ($000) |
| Increase (Decrease) in Net Assets | |
| Operations | |
| Net Investment Income | 1,211 |
| Realized Net Gain (Loss) | (533) |
| Change in Unrealized Appreciation (Depreciation) | (2,504) |
| Net Increase (Decrease) in Net Assets Resulting from Operations | (1,826) |
| Distributions | |
| Net Investment Income | |
| Investor Shares | (15) |
| ETF Shares | (610) |
| Admiral Shares | (213) |
| Realized Capital Gain | |
| Investor Shares | — |
| ETF Shares | — |
| Admiral Shares | — |
| Total Distributions | (838) |
| Capital Share Transactions | |
| Investor Shares | 4,517 |
| ETF Shares | 148,546 |
| Admiral Shares | 78,163 |
| Net Increase (Decrease) from Capital Share Transactions | 231,226 |
| Total Increase (Decrease) | 228,562 |
| Net Assets | |
| Beginning of Period | — |
| End of Period2 | 228,562 |
1 Inception.
2 Net Assets—End of Period includes undistributed (overdistributed) net investment income of $227,000.
See accompanying Notes, which are an integral part of the Financial Statements.
18
| |
| International Dividend Appreciation Index Fund | |
| |
| |
| Financial Highlights | |
| |
| |
| Investor Shares | |
| | February 25, 20161 to |
| For a Share Outstanding Throughout the Period | October 31, 2016 |
| Net Asset Value, Beginning of Period | $20.00 |
| Investment Operations | |
| Net Investment Income | . 244 2 |
| Net Realized and Unrealized Gain (Loss) on Investments | 1.671 |
| Total from Investment Operations | 1.915 |
| Distributions | |
| Dividends from Net Investment Income | (.145) |
| Distributions from Realized Capital Gains | — |
| Total Distributions | (.145) |
| Net Asset Value, End of Period | $21.77 |
| |
| Total Return3 | 9.57% |
| |
| Ratios/Supplemental Data | |
| Net Assets, End of Period (Millions) | $4 |
| Ratio of Total Expenses to Average Net Assets | 0.35%4 |
| Ratio of Net Investment Income to Average Net Assets | 1.50%4 |
| Portfolio Turnover Rate 5 | 8% |
1 Inception.
2 Calculated based on average shares outstanding.
3 Total returns do not include account service fees that may have applied in the periods shown. Fund prospectuses provide information about
any applicable account service fees.
4 Annualized.
5 Excludes the value of portfolio securities received or delivered as a result of in-kind purchases or redemptions of the fund’s capital shares,
including ETF Creation Units.
See accompanying Notes, which are an integral part of the Financial Statements.
19
| |
| International Dividend Appreciation Index Fund | |
| |
| |
| Financial Highlights | |
| |
| |
| ETF Shares | |
| | February 25, 20161 to |
| For a Share Outstanding Throughout the Period | October 31, 2016 |
| Net Asset Value, Beginning of Period | $50.00 |
| Investment Operations | |
| Net Investment Income | . 662 2 |
| Net Realized and Unrealized Gain (Loss) on Investments | 4.154 |
| Total from Investment Operations | 4.816 |
| Distributions | |
| Dividends from Net Investment Income | (.386) |
| Distributions from Realized Capital Gains | — |
| Total Distributions | (. 386) |
| Net Asset Value, End of Period | $54.43 |
| |
| Total Return | 9.64% |
| |
| Ratios/Supplemental Data | |
| Net Assets, End of Period (Millions) | $147 |
| Ratio of Total Expenses to Average Net Assets | 0.25%3 |
| Ratio of Net Investment Income to Average Net Assets | 1.60%3 |
| Portfolio Turnover Rate 4 | 8% |
1 Inception.
2 Calculated based on average shares outstanding.
3 Annualized.
4 Excludes the value of portfolio securities received or delivered as a result of in-kind purchases or redemptions of the fund’s capital shares,
including ETF Creation Units.
See accompanying Notes, which are an integral part of the Financial Statements.
20
| |
| International Dividend Appreciation Index Fund | |
| |
| |
| Financial Highlights | |
| |
| |
| Admiral Shares | |
| | March 2, 20161 to |
| For a Share Outstanding Throughout the Period | October 31, 2016 |
| Net Asset Value, Beginning of Period | $25.00 |
| Investment Operations | |
| Net Investment Income | . 285 2 |
| Net Realized and Unrealized Gain (Loss) on Investments | 1.352 |
| Total from Investment Operations | 1.637 |
| Distributions | |
| Dividends from Net Investment Income | (.187) |
| Distributions from Realized Capital Gains | — |
| Total Distributions | (.187) |
| Net Asset Value, End of Period | $26.45 |
| |
| Total Return3 | 6.54% |
| |
| Ratios/Supplemental Data | |
| Net Assets, End of Period (Millions) | $77 |
| Ratio of Total Expenses to Average Net Assets | 0.25%4 |
| Ratio of Net Investment Income to Average Net Assets | 1.60%4 |
| Portfolio Turnover Rate 5 | 8% |
1 Inception.
2 Calculated based on average shares outstanding.
3 Total returns do not include account service fees that may have applied in the periods shown. Fund prospectuses provide information about
any applicable account service fees.
4 Annualized.
5 Excludes the value of portfolio securities received or delivered as a result of in-kind purchases or redemptions of the fund’s capital shares,
including ETF Creation Units.
See accompanying Notes, which are an integral part of the Financial Statements.
21
International Dividend Appreciation Index Fund
Notes to Financial Statements
Vanguard International Dividend Appreciation Index Fund is registered under the Investment Company Act of 1940 as an open-end investment company, or mutual fund. The fund invests in securities of foreign issuers, which may subject it to investment risks not normally associated with investing in securities of U.S. corporations. The fund offers three classes of shares: Investor Shares, ETF Shares, and Admiral Shares. Investor Shares are available to any investor who meets the fund’s minimum purchase requirements. ETF Shares are listed for trading on NYSE Arca; they can be purchased and sold through a broker. Admiral Shares are designed for investors who meet certain administrative, service, and account-size criteria.
A. The following significant accounting policies conform to generally accepted accounting principles for U.S. investment companies. The fund consistently follows such policies in preparing its financial statements.
1. Security Valuation: Securities are valued as of the close of trading on the New York Stock Exchange (generally 4 p.m., Eastern time) on the valuation date. Equity securities are valued at the latest quoted sales prices or official closing prices taken from the primary market in which each security trades; such securities not traded on the valuation date are valued at the mean of the latest quoted bid and asked prices. Securities for which market quotations are not readily available, or whose values have been affected by events occurring before the fund’s pricing time but after the close of the securities’ primary markets, are valued at their fair values calculated according to procedures adopted by the board of trustees. These procedures include obtaining quotations from an independent pricing service, monitoring news to identify significant market- or security-specific events, and evaluating changes in the values of foreign market proxies (for example, ADRs, futures contracts, or exchange-traded funds), between the time the foreign markets close and the fund’s pricing time. When fair-value pricing is employed, the prices of securities used by a fund to calculate its net asset value may differ from quoted or published prices for the same securities. Investments in Vanguard Market Liquidity Fund are valued at that fund’s net asset value. Temporary cash investments acquired over 60 days to maturity are valued using the latest bid prices or using valuations based on a matrix system (which considers such factors as security prices, yields, maturities, and ratings), both as furnished by independent pricing services. Other temporary cash investments are valued at amortized cost, which approximates market value.
2. Foreign Currency: Securities and other assets and liabilities denominated in foreign currencies are translated into U.S. dollars using exchange rates obtained from an independent third party as of the fund’s pricing time on the valuation date. Realized gains (losses) and unrealized appreciation (depreciation) on investment securities include the effects of changes in exchange rates since the securities were purchased, combined with the effects of changes in security prices. Fluctuations in the value of other assets and liabilities resulting from changes in exchange rates are recorded as unrealized foreign currency gains (losses) until the assets or liabilities are settled in cash, at which time they are recorded as realized foreign currency gains (losses).
3. Futures Contracts: The fund uses index futures contracts to a limited extent, with the objectives of maintaining full exposure to the stock market, enhancing returns, maintaining liquidity, and minimizing transaction costs. The fund may purchase futures contracts to immediately invest incoming cash in the market, or sell futures in response to cash outflows, thereby simulating a fully invested position in the underlying index while maintaining a cash balance for liquidity. The fund may seek to enhance returns by using futures contracts instead of the underlying securities when futures are believed to be priced more attractively than the underlying securities. The primary risks associated with the use of futures contracts are imperfect correlation between changes in market values of stocks held by the fund and the prices of futures contracts, and the possibility of an illiquid market. Counterparty risk
22
International Dividend Appreciation Index Fund
involving futures is mitigated because a regulated clearinghouse is the counterparty instead of the clearing broker. To further mitigate counterparty risk, the fund trades futures contracts on an exchange, monitors the financial strength of its clearing brokers and clearinghouse, and has entered into clearing agreements with its clearing brokers. The clearinghouse imposes initial margin requirements to secure the fund’s performance and requires daily settlement of variation margin representing changes in the market value of each contract.
Futures contracts are valued at their quoted daily settlement prices. The aggregate settlement values of the contracts are not recorded in the Statement of Assets and Liabilities. Fluctuations in the value of the contracts are recorded in the Statement of Assets and Liabilities as an asset (liability) and in the Statement of Operations as unrealized appreciation (depreciation) until the contracts are closed, when they are recorded as realized futures gains (losses).
During the year ended October 31, 2016, the fund’s average investments in long and short futures contracts represented less than 1% and 0% of net assets, respectively, based on the average of aggregate settlement values at each quarter-end during the period.
4. Federal Income Taxes: The fund intends to qualify as a regulated investment company and distribute all of its taxable income. Management has analyzed the fund’s tax positions taken for its open federal income tax year ended October 31, 2016, and has concluded that no provision for federal income tax is required in the fund’s financial statements.
5. Distributions: Distributions to shareholders are recorded on the ex-dividend date.
6. Securities Lending: To earn additional income, the fund lends its securities to qualified institutional borrowers. Security loans are subject to termination by the fund at any time, and are required to be secured at all times by collateral in an amount at least equal to the market value of securities loaned. Daily market fluctuations could cause the value of loaned securities to be more or less than the value of the collateral received. When this occurs, the collateral is adjusted and settled on the next business day. The fund further mitigates its counterparty risk by entering into securities lending transactions only with a diverse group of prequalified counterparties, monitoring their financial strength, and entering into master securities lending agreements with its counterparties. The master securities lending agreements provide that, in the event of a counterparty’s default (including bankruptcy), the fund may terminate any loans with that borrower, determine the net amount owed, and sell or retain the collateral up to the net amount owed to the fund; however, such actions may be subject to legal proceedings. While collateral mitigates counterparty risk, in the absence of a default the fund may experience delays and costs in recovering the securities loaned. The fund invests cash collateral received in Vanguard Market Liquidity Fund, and records a liability in the Statement of Assets and Liabilities for the return of the collateral, during the period the securities are on loan. Securities lending income represents fees charged to borrowers plus income earned on invested cash collateral, less expenses associated with the loan. During the term of the loan, the fund is entitled to all distributions made on or in respect of the loaned securities.
7. Credit Facility: The fund and certain other funds managed by The Vanguard Group (“Vanguard”) participate in a $3.1 billion committed credit facility provided by a syndicate of lenders pursuant to a credit agreement that may be renewed annually; each fund is individually liable for its borrowings, if any, under the credit facility. Borrowings may be utilized for temporary and emergency purposes, and are subject to the fund’s regulatory and contractual borrowing restrictions. The participating funds are charged administrative fees and an annual commitment fee of 0.10% of the undrawn amount of the facility; these fees are allocated to the funds based on a method approved by the fund’s board of trustees and included in Management and Administrative expenses on the fund’s Statement of
23
International Dividend Appreciation Index Fund
Operations. Any borrowings under this facility bear interest at a rate based upon the higher of the one-month London Interbank Offered Rate, federal funds effective rate, or overnight bank funding rate plus an agreed-upon spread.
The fund had no borrowings outstanding at October 31, 2016, or at any time during the period then ended.
8. Other: Dividend income is recorded on the ex-dividend date. Interest income includes income distributions received from Vanguard Market Liquidity Fund and is accrued daily. Premiums and discounts on debt securities purchased are amortized and accreted, respectively, to interest income over the lives of the respective securities. Security transactions are accounted for on the date securities are bought or sold. Costs used to determine realized gains (losses) on the sale of investment securities are those of the specific securities sold.
Each class of shares has equal rights as to assets and earnings, except that each class separately bears certain class-specific expenses related to maintenance of shareholder accounts (included in Management and Administrative expenses) and shareholder reporting. Marketing and distribution expenses are allocated to each class of shares based on a method approved by the board of trustees. Income, other non-class-specific expenses, and gains and losses on investments are allocated to each class of shares based on its relative net assets.
B. In accordance with the terms of a Funds’ Service Agreement (the “FSA”) between Vanguard and the fund, Vanguard furnishes to the fund investment advisory, corporate management, administrative, marketing, and distribution services at Vanguard’s cost of operations (as defined by the FSA). These costs of operations are allocated to the fund based on methods and guidelines approved by the board of trustees. Vanguard does not require reimbursement in the current period for certain costs of operations (such as deferred compensation/benefits and risk/insurance costs); the fund’s liability for these costs of operations is included in Payables to Vanguard on the Statement of Assets and Liabilities.
Upon the request of Vanguard, the fund may invest up to 0.40% of its net assets as capital in Vanguard. At October 31, 2016, the fund had contributed to Vanguard capital in the amount of $16,000, representing 0.01% of the fund’s net assets and 0.01% of Vanguard’s capitalization. The fund’s trustees and officers are also directors and employees, respectively, of Vanguard.
C. Various inputs may be used to determine the value of the fund’s investments. These inputs are summarized in three broad levels for financial statement purposes. The inputs or methodologies used to value securities are not necessarily an indication of the risk associated with investing in those securities.
Level 1—Quoted prices in active markets for identical securities.
Level 2—Other significant observable inputs (including quoted prices for similar securities, interest rates, prepayment speeds, credit risk, etc.).
Level 3—Significant unobservable inputs (including the fund’s own assumptions used to determine the fair value of investments).
24
International Dividend Appreciation Index Fund
The following table summarizes the market value of the fund’s investments as of October 31, 2016, based on the inputs used to value them:
| | | |
| | Level 1 | Level 2 | Level 3 |
| Investments | ($000) | ($000) | ($000) |
| Common Stocks—North and South America | 39,950 | — | — |
| Common Stocks—Other | 6,010 | 180,436 | 78 |
| Temporary Cash Investments | 22,647 | 100 | — |
| Futures Contracts—Liabilities1 | (4) | — | — |
| Total | 68,603 | 180,536 | 78 |
| 1 Represents variation margin on the last day of the reporting period. | | | |
D. At October 31, 2016, the aggregate settlement value of open futures contracts and the related unrealized appreciation (depreciation) were:
| | | | |
| | | | | ($000) |
| | | | Aggregate | |
| | | Number of | Settlement | Unrealized |
| | | Long (Short) | Value | Appreciation |
| Futures Contracts | Expiration | Contracts | Long (Short) | (Depreciation) |
| E-mini S&P 500 Index | December 2016 | 21 | 2,226 | (6) |
Unrealized appreciation (depreciation) on open futures contracts is required to be treated as realized gain (loss) for tax purposes.
E. Distributions are determined on a tax basis and may differ from net investment income and realized capital gains for financial reporting purposes. Differences may be permanent or temporary. Permanent differences are reclassified among capital accounts in the financial statements to reflect their tax character. Temporary differences arise when certain items of income, expense, gain, or loss are recognized in different periods for financial statement and tax purposes. These differences will reverse at some time in the future. Differences in classification may also result from the treatment of short-term gains as ordinary income for tax purposes.
During the year ended October 31, 2016, the fund realized net foreign currency losses of $146,000, which decreased distributable net income for tax purposes; accordingly, such losses have been reclassified from accumulated net realized losses to undistributed net investment income.
For tax purposes, at October 31, 2016, the fund had $417,000 of ordinary income available for distribution. The fund had available capital losses totaling $393,000 that may be carried forward indefinitely to offset future net capital gains.
At October 31, 2016, the cost of investment securities for tax purposes was $251,968,000. Net unrealized depreciation of investment securities for tax purposes was $2,747,000, consisting of unrealized gains of $7,196,000 on securities that had risen in value since their purchase and $9,943,000 in unrealized losses on securities that had fallen in value since their purchase.
F. During the year ended October 31, 2016, the fund purchased $238,511,000 of investment securities and sold $9,133,000 of investment securities, other than temporary cash investments. Purchases and sales include $119,557,000 and $0, respectively, in connection with in-kind purchases and redemptions of the fund’s capital shares.
25
| | |
| International Dividend Appreciation Index Fund | | |
| |
| |
| |
| |
| G. Capital share transactions for each class of shares were: | | |
| | | Year Ended |
| | October 31, 2016 |
| | Amount | Shares |
| | ($000) | (000) |
| Investor Shares1 | | |
| Issued | 6,530 | 295 |
| Issued in Lieu of Cash Distributions | 14 | 1 |
| Redeemed | (2,027) | (91) |
| Net Increase (Decrease)—Investor Shares | 4,517 | 205 |
| ETF Shares1 | | |
| Issued | 148,546 | 2,700 |
| Issued in Lieu of Cash Distributions | — | — |
| Redeemed | — | — |
| Net Increase (Decrease)—ETF Shares | 148,546 | 2,700 |
| Admiral Shares2 | | |
| Issued | 84,631 | 3,156 |
| Issued in Lieu of Cash Distributions | 163 | 6 |
| Redeemed | (6,631) | (246) |
| Net Increase (Decrease) —Admiral Shares | 78,163 | 2,916 |
| 1 Inception was February 25, 2016, for Investor Shares and ETF Shares. |
| 2 Inception was March 2, 2016, for Admiral Shares. |
H. Management has determined that no material events or transactions occurred subsequent to October 31, 2016, that would require recognition or disclosure in these financial statements.
26
International High Dividend Yield Index Fund
Fund Profile
As of October 31, 2016
| | | |
| Share-Class Characteristics | | |
| | Investor | ETF | Admiral |
| | Shares | Shares | Shares |
| Ticker Symbol | VIHIX | VYMI | VIHAX |
| Expense Ratio1 | 0.40% | 0.30% | 0.30% |
| | |
| Portfolio Characteristics | | |
| | | FTSE |
| | | All-World |
| | | ex US High |
| | | Dividend Yield |
| | Fund | Index |
| Number of Stocks | 912 | 876 |
| Median Market Cap | $43.9B | $43.9B |
| Price/Earnings Ratio | 19.1x | 19.8x |
| Price/Book Ratio | 1.4x | 1.4x |
| Return on Equity | 15.0% | 15.0% |
| Earnings Growth | | |
| Rate | 3.0% | 3.0% |
| Dividend Yield | 4.3% | 4.4% |
| Turnover Rate | 6% | — |
| Short-Term Reserves | 8.7% | — |
| | |
| Sector Diversification (% of equity exposure) |
| | | FTSE |
| | | All-World |
| | | ex US High |
| | | Dividend Yield |
| | Fund | Index |
| Basic Materials | 5.8% | 5.9% |
| Consumer Goods | 11.9 | 11.9 |
| Consumer Services | 4.1 | 3.9 |
| Financials | 36.4 | 36.7 |
| Health Care | 7.4 | 7.3 |
| Industrials | 9.4 | 9.4 |
| Oil & Gas | 9.9 | 9.9 |
| Technology | 3.4 | 3.1 |
| Telecommunications | 6.4 | 6.6 |
| Utilities | 5.3 | 5.3 |
| | |
| Ten Largest Holdings (% of total net assets) |
| Nestle SA | Food Products | 2.6% |
| Royal Dutch Shell plc | Integrated Oil & Gas | 2.3 |
| Novartis AG | Pharmaceuticals | 1.9 |
| Roche Holding AG | Pharmaceuticals | 1.8 |
| Toyota Motor Corp. | Automobiles | 1.8 |
| HSBC Holdings plc | Banks | 1.7 |
| Taiwan Semiconductor | | |
| Manufacturing Co. Ltd. | Semiconductors | 1.6 |
| BP plc | Integrated Oil & Gas | 1.3 |
| British American | | |
| Tobacco plc | Tobacco | 1.2 |
| TOTAL SA | Integrated Oil & Gas | 1.2 |
| Top Ten | | 17.4% |
The holdings listed exclude any temporary cash investments and equity index products.
Allocation by Region (% of equity exposure)
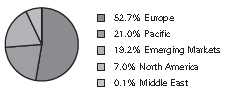
Investment Focus
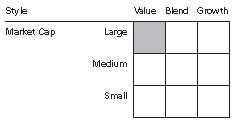
1 The expense ratios shown are from the prospectus dated February 25, 2016, and represent estimated costs for the current fiscal year. For the period from inception through October 31, 2016, the annualized expense ratios were 0.42% for Investor Shares, 0.32% for ETF Shares, and 0.32% for Admiral Shares.
27
International High Dividend Yield Index Fund
| | |
| Market Diversification (% of equity exposure) |
| | | FTSE |
| | | All-World |
| | | ex US High |
| | | Dividend |
| | | Yield |
| | Fund | Index |
| Europe | | |
| United Kingdom | 16.5% | 16.5% |
| Switzerland | 9.6 | 9.6 |
| France | 6.5 | 6.5 |
| Germany | 6.4 | 6.4 |
| Spain | 3.5 | 3.5 |
| Sweden | 2.6 | 2.7 |
| Netherlands | 2.4 | 2.4 |
| Italy | 2.1 | 2.1 |
| Finland | 1.1 | 1.1 |
| Other | 2.0 | 2.0 |
| Subtotal | 52.7% | 52.8% |
| Pacific | | |
| Australia | 8.0% | 8.0% |
| Japan | 7.8 | 7.8 |
| Hong Kong | 2.7 | 2.7 |
| Singapore | 1.4 | 1.4 |
| Other | 1.1 | 1.0 |
| Subtotal | 21.0% | 20.9% |
| Emerging Markets | | |
| Taiwan | 4.9% | 4.9% |
| China | 4.8 | 4.8 |
| Brazil | 3.0 | 3.0 |
| South Africa | 1.4 | 1.4 |
| Russia | 1.1 | 1.1 |
| Other | 4.0 | 4.0 |
| Subtotal | 19.2% | 19.2% |
| North America | | |
| Canada | 7.0% | 7.0% |
| Middle East | 0.1% | 0.1% |
28
International High Dividend Yield Index Fund
Performance Summary
All of the returns in this report represent past performance, which is not a guarantee of future results that may be achieved by the fund. (Current performance may be lower or higher than the performance data cited. For performance data current to the most recent month-end, visit our website at vanguard.com/performance.) Note, too, that both investment returns and principal value can fluctuate widely, so an investor’s shares, when sold, could be worth more or less than their original cost. The returns shown do not reflect taxes that a shareholder would pay on fund distributions or on the sale of fund shares.
Cumulative Performance: February 25, 2016, Through October 31, 2016
Initial Investment of $10,000
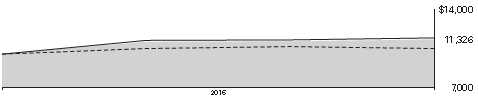
| | |
| | Total Returns | |
| | Period Ended October 31, 2016 | |
| | Since | Final Value |
| | Inception | of a $10,000 |
| | (2/25/2016) | Investment |
| International High Dividend Yield Index | | |
| Fund Investor Shares | 13.26% | $11,326 |
| FTSE All-World ex US High Dividend | | |
| Yield Index | 14.71 | 11,471 |
| International Income Funds Average | 5.05 | 10,505 |
International Income Funds Average: Derived from data provided by Lipper, a Thomson Reuters Company.
"Since Inception" performance is calculated from the Investor Shares’ inception date for both the fund and its comparative standards.
| | |
| | Since | Final Value |
| | Inception | of a $10,000 |
| | (2/25/2016) | Investment |
| International High Dividend Yield Index Fund | | |
| ETF Shares Net Asset Value | 13.37% | $11,337 |
| International High Dividend Yield Index Fund | | |
| ETF Shares Market Price | 13.79 | 11,379 |
| FTSE All-World ex US High Dividend Yield Index | 14.71 | 11,471 |
| "Since Inception" performance is calculated from the ETF Shares’ inception date for both the fund and its comparative standards. |
See Financial Highlights for dividend and capital gains information.
29
| | |
| International High Dividend Yield Index Fund | | |
| |
| |
| |
| |
| | Total Returns | |
| | Period Ended October 31, 2016 | |
| | Since | Final Value |
| | Inception | of a $10,000 |
| | (3/2/2016) | Investment |
| International High Dividend Yield Index Fund | | |
| Admiral Shares | 9.73% | $10,973 |
| FTSE All-World ex US High Dividend Yield | | |
| Index | 10.87 | 11,087 |
"Since Inception" performance is calculated from the Admiral Shares’ inception date for both the fund and its comparative standards.
| |
| Cumulative Returns of ETF Shares: February 25, 2016, Through October 31, 2016 | |
| | Since |
| | Inception |
| | (2/25/2016) |
| International High Dividend Yield Index Fund ETF | |
| Shares Market Price | 13.79% |
| International High Dividend Yield Index Fund ETF | |
| Shares Net Asset Value | 13.37 |
| FTSE All-World ex US High Dividend Yield Index | 14.71 |
"Since Inception" performance is calculated from the ETF Shares’ inception date for both the fund and its comparative standards.
30
International High Dividend Yield Index Fund
Fiscal-Period Total Returns (%): February 25, 2016, Through October 31, 2016
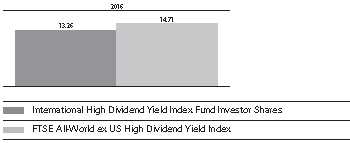
Average Annual Total Returns: Periods Ended September 30, 2016
This table presents returns through the latest calendar quarter—rather than through the end of the fiscal period.
Securities and Exchange Commission rules require that we provide this information.
| | |
| | | Since Inception |
| | Inception Date | Total |
| Investor Shares | 2/25/2016 | 14.12% |
| ETF Shares | 2/25/2016 | |
| Market Price | | 14.89 |
| Net Asset Value | | 14.22 |
| Admiral Shares | 3/2/2016 | 10.54 |
31
International High Dividend Yield Index Fund
Financial Statements
Statement of Net Assets
As of October 31, 2016
The fund reports a complete list of its holdings in regulatory filings four times in each fiscal year, at the quarter-ends. For the second and fourth fiscal quarters, the lists appear in the fund’s semiannual and annual reports to shareholders. For the first and third fiscal quarters, the fund files the lists with the Securities and Exchange Commission on Form N-Q. Shareholders can look up the fund’s Forms N-Q on the SEC’s website at sec.gov. Forms N-Q may also be reviewed and copied at the SEC’s Public Reference Room (see the back cover of this report for further information).
| | |
| | | Market |
| | | Value• |
| | Shares | ($000) |
| Common Stocks (99.0%)1 | | |
| Australia (7.9%) | | |
| Commonwealth Bank of | | |
| Australia | 39,534 | 2,201 |
| Westpac Banking Corp. | 77,358 | 1,789 |
| Australia & New Zealand | | |
| Banking Group Ltd. | 67,582 | 1,427 |
| National Australia Bank Ltd. | 61,551 | 1,307 |
| BHP Billiton Ltd. | 74,752 | 1,306 |
| Wesfarmers Ltd. | 25,984 | 809 |
| Woolworths Ltd. | 29,417 | 528 |
| Macquarie Group Ltd. | 7,185 | 434 |
| Rio Tinto Ltd. | 9,889 | 409 |
| Telstra Corp. Ltd. | 100,350 | 379 |
| Transurban Group | 47,654 | 376 |
| Woodside Petroleum Ltd. | 17,130 | 367 |
| Amcor Ltd. | 26,923 | 300 |
| Suncorp Group Ltd. | 29,543 | 268 |
| QBE Insurance Group Ltd. | 31,990 | 242 |
| AMP Ltd. | 67,928 | 236 |
| Insurance Australia Group | | |
| Ltd. | 55,534 | 232 |
| AGL Energy Ltd. | 15,674 | 228 |
| Aurizon Holdings Ltd. | 46,082 | 171 |
| ASX Ltd. | 4,684 | 168 |
| Origin Energy Ltd. | 40,915 | 165 |
| APA Group | 26,161 | 158 |
| James Hardie Industries plc | 10,349 | 154 |
| Sonic Healthcare Ltd. | 9,571 | 149 |
| Caltex Australia Ltd. | 6,127 | 143 |
| LendLease Group | 12,946 | 133 |
| Medibank Pvt Ltd. | 64,234 | 126 |
| Sydney Airport | 25,905 | 123 |
| Challenger Ltd. | 13,218 | 108 |
| Orica Ltd. | 8,716 | 108 |
| Tatts Group Ltd. | 34,168 | 105 |
| DUET Group | 57,349 | 104 |
| | | |
| | Bendigo & Adelaide Bank | | |
| | Ltd. | 11,003 | 93 |
| | Computershare Ltd. | 11,506 | 92 |
| | Coca-Cola Amatil Ltd. | 12,285 | 89 |
| | Incitec Pivot Ltd. | 39,761 | 89 |
| | Boral Ltd. | 17,312 | 83 |
| | Tabcorp Holdings Ltd. | 20,490 | 75 |
| | Bank of Queensland Ltd. | 9,290 | 74 |
| | Alumina Ltd. | 60,350 | 73 |
| | ALS Ltd. | 12,084 | 57 |
| | Orora Ltd. | 25,780 | 57 |
| | CIMIC Group Ltd. | 2,218 | 50 |
| | AusNet Services | 42,992 | 49 |
| | Harvey Norman Holdings | | |
| | Ltd. | 12,272 | 47 |
| | Adelaide Brighton Ltd. | 11,469 | 47 |
| | IOOF Holdings Ltd. | 7,150 | 44 |
| | Magellan Financial Group Ltd. | 2,625 | 42 |
| | Downer EDI Ltd. | 9,350 | 41 |
| | Macquarie Atlas Roads | | |
| | Group | 11,467 | 41 |
| | DuluxGroup Ltd. | 8,131 | 40 |
| | Perpetual Ltd. | 1,105 | 38 |
| | CSR Ltd. | 12,442 | 35 |
| * | WorleyParsons Ltd. | 4,920 | 31 |
| | Fairfax Media Ltd. | 50,161 | 31 |
| | Flight Centre Travel Group | | |
| | Ltd. | 1,187 | 30 |
| | Sims Metal Management | | |
| | Ltd. | 3,421 | 26 |
| | Platinum Asset Management | | |
| | Ltd. | 5,616 | 21 |
| | | | 16,148 |
| Austria (0.1%) | | |
| | OMV AG | 3,380 | 106 |
| | voestalpine AG | 2,609 | 92 |
| | Vienna Insurance Group AG | | |
| | Wiener Versicherung Gruppe | 744 | 15 |
| | | | 213 |
32
International High Dividend Yield Index Fund
| | | |
| | | | Market |
| | | | Value• |
| | | Shares | ($000) |
| Belgium (0.6%) | | |
| * | KBC Group NV | 6,453 | 393 |
| | Solvay SA Class A | 1,652 | 190 |
| | Ageas | 4,689 | 171 |
| | Groupe Bruxelles Lambert SA | 1,913 | 165 |
| | Proximus SADP | 3,325 | 95 |
| * | Telenet Group Holding NV | 1,031 | 55 |
| | bpost SA | 1,895 | 50 |
| | | | 1,119 |
| Brazil (3.0%) | | |
| * | Petroleo Brasileiro SA ADR | | |
| | Type A | 56,116 | 621 |
| | Itau Unibanco Holding SA | | |
| | ADR | 45,217 | 539 |
| | Ambev SA ADR | 70,332 | 415 |
| | Itau Unibanco Holding SA | | |
| | Preference Shares | 30,320 | 365 |
| | Banco Bradesco SA | | |
| | Preference Shares | 34,220 | 359 |
| | Banco Bradesco SA ADR | 28,141 | 293 |
| | Itausa - Investimentos Itau | | |
| | SA Preference Shares | 90,360 | 267 |
| * | Vale SA Class B Pref. ADR | 38,038 | 245 |
| | BM&FBovespa SA - | | |
| | Bolsa de Valores | | |
| | Mercadorias e Futuros | 40,400 | 238 |
| | Ambev SA | 39,700 | 234 |
| * | Petroleo Brasileiro SA | 37,700 | 220 |
| | Banco Bradesco SA | 18,866 | 188 |
| | Banco do Brasil SA | 20,100 | 184 |
| | Kroton Educacional SA | 35,600 | 177 |
| * | Petroleo Brasileiro SA ADR | 13,930 | 163 |
| | BB Seguridade Participacoes | | |
| | SA | 14,100 | 142 |
| | CCR SA | 20,500 | 111 |
| * | Vale SA Preference Shares | 16,900 | 109 |
| * | Vale SA Class B ADR | 15,188 | 105 |
| | Banco Santander Brasil SA | 9,900 | 82 |
| | Telefonica Brasil SA ADR | 5,137 | 74 |
| * | Centrais Eletricas Brasileiras | | |
| | SA ADR | 8,061 | 70 |
| | CETIP SA - Mercados | | |
| | Organizados | 4,952 | 70 |
| | Telefonica Brasil SA | | |
| | Preference Shares | 4,300 | 62 |
| | Engie Brasil Energia SA | 4,600 | 58 |
| | JBS SA | 14,797 | 45 |
| | CPFL Energia SA ADR | 2,875 | 44 |
| | Natura Cosmeticos SA | 4,200 | 40 |
| | BTG Pactual Group | 7,828 | 40 |
| | Cia Energetica de Minas | | |
| | Gerais ADR | 12,204 | 37 |
| | EDP - Energias do Brasil SA | 7,650 | 37 |
| * | Vale SA | 5,100 | 35 |
| | Estacio Participacoes SA | 6,000 | 35 |
| | | |
| | Sul America SA | 5,400 | 33 |
| * | Petroleo Brasileiro SA | | |
| | Preference Shares | 5,600 | 31 |
| | TOTVS SA | 3,200 | 29 |
| | Braskem SA ADR | 1,590 | 28 |
| | Smiles SA | 1,400 | 26 |
| * | Centrais Eletricas Brasileiras | | |
| | SA Preference Shares | 2,600 | 22 |
| | AES Tiete Energia SA | 3,921 | 20 |
| | Cia de Transmissao de | | |
| | Energia Eletrica Paulista | | |
| | Preference Shares | 902 | 20 |
| | Cia Paranaense de Energia | 2,400 | 18 |
| | Multiplus SA | 1,300 | 18 |
| | Porto Seguro SA | 1,800 | 17 |
| | Transmissora Alianca de | | |
| | Energia Eletrica SA | 2,300 | 15 |
| | Cia Energetica de Minas | | |
| | Gerais | 4,400 | 13 |
| | Cia de Gas de Sao Paulo | | |
| | COMGAS Preference | | |
| | Shares Class A | 702 | 11 |
| | Cia Paranaense de Energia | | |
| | ADR | 996 | 11 |
| * | Centrais Eletricas Brasileiras | | |
| | SA | 1,400 | 10 |
| | Cia Energetica de Minas | | |
| | Gerais Preference Shares | 3,100 | 9 |
| | CPFL Energia SA | 1,127 | 9 |
| | | | 6,044 |
| Canada (7.0%) | | |
| | Royal Bank of Canada | 34,377 | 2,148 |
| | Toronto-Dominion Bank | 42,863 | 1,945 |
| | Bank of Nova Scotia | 28,147 | 1,513 |
| ^ | Bank of Montreal | 14,933 | 950 |
| | Enbridge Inc. | 21,557 | 931 |
| | TransCanada Corp. | 18,570 | 841 |
| | Canadian Imperial Bank of | | |
| | Commerce | 9,154 | 686 |
| | Manulife Financial Corp. | 45,986 | 666 |
| | Sun Life Financial Inc. | 14,196 | 475 |
| | Rogers Communications | | |
| | Inc. Class B | 8,542 | 344 |
| | Potash Corp. of | | |
| | Saskatchewan Inc. | 19,585 | 318 |
| | Thomson Reuters Corp. | 7,900 | 311 |
| | BCE Inc. | 6,659 | 303 |
| | Fortis Inc. | 9,093 | 299 |
| | Agrium Inc. | 3,225 | 296 |
| | National Bank of Canada | 7,848 | 280 |
| | Pembina Pipeline Corp. | 9,061 | 278 |
| | Shaw Communications Inc. | | |
| | Class B | 9,740 | 193 |
| | Great-West Lifeco Inc. | 6,937 | 174 |
| | Power Corp. of Canada | 8,104 | 174 |
33
International High Dividend Yield Index Fund
| | | |
| | | | Market |
| | | | Value• |
| | | Shares | ($000) |
| | Inter Pipeline Ltd. | 7,927 | 164 |
| | TELUS Corp. | 4,545 | 147 |
| ^ | Crescent Point Energy Corp. | 12,021 | 143 |
| ^ | ARC Resources Ltd. | 8,292 | 141 |
| | Canadian Utilities Ltd. | | |
| | Class A | 4,553 | 130 |
| | Power Financial Corp. | 5,397 | 128 |
| | CI Financial Corp. | 5,597 | 103 |
| | IGM Financial Inc. | 2,329 | 63 |
| | | | 14,144 |
| Chile (0.3%) | | |
| | Banco Santander Chile | | |
| | ADR | 3,787 | 86 |
| | Enersis Americas SA | | |
| | ADR | 9,197 | 80 |
| | Banco de Chile | 623,881 | 74 |
| | Sociedad Quimica y | | |
| | Minera de Chile SA | | |
| | Preference Shares | | |
| | Class B | 2,092 | 62 |
| | Banco de Credito e | | |
| | Inversiones | 1,139 | 59 |
| * | Itau CorpBanca | 4,613,882 | 42 |
| | Aguas Andinas SA | | |
| | Class A | 62,107 | 41 |
| | Colbun SA | 175,754 | 38 |
| | Enersis Chile SA | 198,250 | 20 |
| | | | 502 |
| China (4.7%) | | |
| | China Construction Bank | | |
| | Corp. | 2,128,000 | 1,554 |
| | China Mobile Ltd. | 124,000 | 1,421 |
| | Industrial & Commercial | | |
| | Bank of China Ltd. | 1,675,000 | 1,005 |
| | Bank of China Ltd. | 1,747,000 | 783 |
| | China Petroleum & | | |
| | Chemical Corp. | 585,000 | 423 |
| | Agricultural Bank of China | | |
| | Ltd. | 587,000 | 247 |
| | China Merchants Bank | | |
| | Co. Ltd. | 88,000 | 214 |
| | PICC Property & Casualty | | |
| | Co. Ltd. | 108,000 | 174 |
| | China Minsheng Banking | | |
| | Corp. Ltd. | 148,000 | 168 |
| | China Shenhua Energy | | |
| | Co. Ltd. | 78,500 | 163 |
| | Bank of Communications | | |
| | Co. Ltd. | 182,000 | 138 |
| | Haitong Securities Co. Ltd. | 77,200 | 137 |
| | Hengan International Group | | |
| | Co. Ltd. | 16,997 | 135 |
| | CITIC Securities Co. Ltd. | 53,500 | 118 |
| | | |
| | China Communications | | |
| | Construction Co. Ltd. | 106,000 | 116 |
| | China CITIC Bank Corp. Ltd. | 175,000 | 113 |
| | Guangdong Investment Ltd. | 64,000 | 96 |
| | Belle International Holdings | | |
| | Ltd. | 150,000 | 91 |
| | Country Garden Holdings | | |
| | Co. Ltd. | 173,000 | 90 |
| 2 | China Galaxy Securities | | |
| | Co. Ltd. | 91,000 | 86 |
| | China Vanke Co. Ltd. | 31,600 | 82 |
| | China Cinda Asset | | |
| | Management Co. Ltd. | 227,000 | 82 |
| | GF Securities Co. Ltd. | 36,400 | 81 |
| | China Resources Power | | |
| | Holdings Co. Ltd. | 46,000 | 78 |
| | Anhui Conch Cement Co. | | |
| | Ltd. | 28,000 | 77 |
| | China Merchants Port | | |
| | Holdings Co. Ltd. | 28,000 | 72 |
| | Great Wall Motor Co. Ltd. | 71,500 | 70 |
| | Huaneng Power | | |
| | International Inc. | 104,000 | 64 |
| | ANTA Sports Products Ltd. | 22,000 | 63 |
| | Guangzhou Automobile | | |
| | Group Co. Ltd. | 52,000 | 63 |
| | Beijing Enterprises Holdings | | |
| | Ltd. | 12,000 | 60 |
| | China Evergrande Group | 90,000 | 59 |
| *,2 | China Huarong Asset | | |
| | Management Co. Ltd. | 154,000 | 59 |
| | Longfor Properties Co. Ltd. | 37,500 | 50 |
| | Shimao Property Holdings | | |
| | Ltd. | 32,500 | 43 |
| | China Everbright Ltd. | 22,000 | 43 |
| | Kingboard Chemical | | |
| | Holdings Ltd. | 14,500 | 43 |
| | Chongqing Rural | | |
| | Commercial Bank Co. Ltd. | 69,000 | 41 |
| | Far East Horizon Ltd. | 45,000 | 41 |
| | Sinopec Shanghai | | |
| | Petrochemical Co. Ltd. | 80,000 | 41 |
| 2 | BAIC Motor Corp. Ltd. | 37,000 | 39 |
| | Zijin Mining Group Co. Ltd. | 122,000 | 39 |
| | Shanghai Industrial Holdings | | |
| | Ltd. | 12,000 | 37 |
| | Shenzhen International | | |
| | Holdings Ltd. | 23,500 | 36 |
| | COSCO SHIPPING Ports | | |
| | Ltd. | 36,000 | 36 |
| | Zhejiang Expressway Co. | | |
| | Ltd. | 34,000 | 36 |
| | China Communications | | |
| | Services Corp. Ltd. | 56,000 | 33 |
| | Jiangsu Expressway Co. Ltd. | 24,000 | 33 |
34
International High Dividend Yield Index Fund
| | | |
| | | | Market |
| | | | Value• |
| | | Shares | ($000) |
| | China Power International | | |
| | Development Ltd. | 87,000 | 32 |
| | China Jinmao Holdings | | |
| | Group Ltd. | 114,000 | 31 |
| 2 | Fuyao Glass Industry | | |
| | Group Co. Ltd. | 10,800 | 31 |
| | GOME Electrical Appliances | | |
| | Holding Ltd. | 243,000 | 31 |
| | China Everbright Bank Co. | | |
| | Ltd. | 66,000 | 30 |
| | Lee & Man Paper | | |
| | Manufacturing Ltd. | 39,000 | 29 |
| | Guangzhou R&F Properties | | |
| | Co. Ltd. | 20,400 | 29 |
| | Sunac China Holdings Ltd. | 41,000 | 28 |
| | Shenzhen Investment Ltd. | 62,000 | 27 |
| | Yuexiu Property Co. Ltd. | 182,000 | 27 |
| | Sino-Ocean Group Holding | | |
| | Ltd. | 62,500 | 26 |
| 2 | Sinopec Engineering Group | | |
| | Co. Ltd. | 29,000 | 26 |
| | Kingboard Laminates | | |
| | Holdings Ltd. | 27,500 | 25 |
| | Sinotrans Ltd. | 52,000 | 24 |
| | Chongqing Changan | | |
| | Automobile Co. Ltd. | | |
| | Class B | 16,000 | 24 |
| | Huadian Power International | | |
| | Corp. Ltd. | 52,000 | 22 |
| | KWG Property Holding Ltd. | 37,000 | 21 |
| | China Resources Cement | | |
| | Holdings Ltd. | 52,000 | 21 |
| | Agile Group Holdings Ltd. | 36,000 | 20 |
| | Datang International Power | | |
| | Generation Co. Ltd. | 74,000 | 20 |
| | China Machinery | | |
| | Engineering Corp. | 33,000 | 20 |
| | SOHO China Ltd. | 38,000 | 20 |
| | China Hongqiao Group Ltd. | 21,000 | 19 |
| | Huishang Bank Corp. Ltd. | 39,000 | 19 |
| 2 | Red Star Macalline Group | | |
| | Corp. Ltd. | 17,400 | 19 |
| | Beijing Jingneng Clean | | |
| | Energy Co. Ltd. | 60,000 | 18 |
| * | Greentown China Holdings | | |
| | Ltd. | 19,000 | 15 |
| | Huadian Fuxin Energy Corp. | | |
| | Ltd. | 64,000 | 15 |
| | Shenzhen Expressway Co. | | |
| | Ltd. | 14,000 | 14 |
| | Guangdong Electric Power | | |
| | Development Co. Ltd. | | |
| | Class B | 31,400 | 14 |
| | Lao Feng Xiang Co. Ltd. | | |
| | Class B | 4,100 | 14 |
| | | |
| | China Dongxiang Group Co. | | |
| | Ltd. | 67,000 | 13 |
| | Weifu High-Technology | | |
| | Group Co. Ltd. Class B | 5,500 | 13 |
| | China South City Holdings | | |
| | Ltd. | 58,000 | 13 |
| | CSG Holding Co. Ltd. | | |
| | Class B | 13,300 | 11 |
| | China BlueChemical Ltd. | 50,000 | 10 |
| | Xinjiang Goldwind Science | | |
| | & Technology Co. Ltd. | 7,000 | 10 |
| | China International Marine | | |
| | Containers Group Co. Ltd. | 7,500 | 9 |
| | China Zhongwang Holdings | | |
| | Ltd. | 18,000 | 8 |
| | Sichuan Expressway Co. Ltd. | 16,000 | 6 |
| | Anhui Expressway Co. Ltd. | 6,000 | 5 |
| * | Qinqin Foodstuffs Group | | |
| | Cayman Co. Ltd. | 300 | — |
| | Inner Mongolia Yitai Coal Co. | | |
| | Ltd. Class B | 100 | — |
| | | | 9,582 |
| Colombia (0.1%) | | |
| | Bancolombia SA ADR | 2,537 | 97 |
| * | Ecopetrol SA ADR | 4,434 | 39 |
| | Grupo Aval Acciones y | | |
| | Valores SA ADR | 3,552 | 29 |
| | Interconexion Electrica SA | | |
| | ESP | 7,974 | 27 |
| | Almacenes Exito SA | 3,859 | 19 |
| | Grupo Aval Acciones y | | |
| | Valores Preference Shares | 24,557 | 10 |
| | Corp Financiera Colombiana | | |
| | SA | 794 | 10 |
| * | Ecopetrol SA | 19,170 | 8 |
| | Bancolombia SA Preference | | |
| | Shares | 306 | 3 |
| | | | 242 |
| Czech Republic (0.1%) | | |
| | CEZ AS | 3,722 | 70 |
| | Komercni banka as | 1,659 | 61 |
| | | | 131 |
| Denmark (0.3%) | | |
| | Danske Bank A/S | 17,468 | 539 |
| * | TDC A/S | 19,087 | 105 |
| | Tryg A/S | 2,782 | 54 |
| | | | 698 |
| Egypt (0.1%) | | |
| | Commercial International | | |
| | Bank Egypt SAE | 24,667 | 143 |
| | Talaat Moustafa Group | 24,117 | 15 |
| * | Orascom Construction Ltd. | 1,679 | 9 |
| | Telecom Egypt Co. | 7,807 | 8 |
35
International High Dividend Yield Index Fund
| | |
| | | Market |
| | | Value• |
| | Shares | ($000) |
| ElSewedy Electric Co. | 1,042 | 7 |
| Sidi Kerir Petrochemicals Co. | 1,624 | 3 |
| | | 185 |
| Finland (1.1%) | | |
| Sampo Oyj Class A | 10,897 | 499 |
| Kone Oyj Class B | 8,838 | 407 |
| UPM-Kymmene Oyj | 12,349 | 287 |
| Fortum Oyj | 10,102 | 168 |
| Wartsila OYJ Abp | 3,690 | 160 |
| Neste Oyj | 2,968 | 128 |
| Stora Enso Oyj | 13,528 | 128 |
| Elisa Oyj | 3,771 | 127 |
| Nokian Renkaat Oyj | 3,229 | 108 |
| Orion Oyj Class B | 2,382 | 101 |
| Metso Oyj | 3,235 | 85 |
| Kesko Oyj Class B | 1,642 | 82 |
| | | 2,280 |
| France (6.4%) | | |
| TOTAL SA | 50,157 | 2,403 |
| Sanofi | 25,985 | 2,022 |
| BNP Paribas SA | 22,777 | 1,321 |
| AXA SA | 44,905 | 1,013 |
| Schneider Electric SE | 12,663 | 852 |
| Orange SA | 44,381 | 698 |
| Societe Generale SA | 17,115 | 668 |
| Vivendi SA | 25,597 | 518 |
| Cie de Saint-Gobain | 11,135 | 494 |
| Engie SA | 33,461 | 483 |
| Cie Generale des | | |
| Etablissements Michelin | 4,136 | 448 |
| Credit Agricole SA | 26,322 | 284 |
| Veolia Environnement SA | 11,355 | 248 |
| SES SA Class A | 7,902 | 182 |
| Technip SA | 2,734 | 181 |
| Bouygues SA | 4,461 | 145 |
| STMicroelectronics NV | 14,609 | 139 |
| Suez | 7,733 | 122 |
| SCOR SE | 3,686 | 119 |
| Edenred | 4,909 | 114 |
| Natixis SA | 22,038 | 111 |
| Rexel SA | 7,521 | 104 |
| Eutelsat Communications SA | 4,359 | 91 |
| Electricite de France SA | 7,003 | 79 |
| Lagardere SCA | 2,813 | 72 |
| Casino Guichard Perrachon | | |
| SA | 1,405 | 70 |
| CNP Assurances | 3,786 | 66 |
| Euler Hermes Group | 339 | 29 |
| | | 13,076 |
| Germany (6.3%) | | |
| Siemens AG | 17,706 | 2,012 |
| BASF SE | 21,507 | 1,899 |
| Allianz SE | 10,613 | 1,657 |
| Daimler AG | 22,328 | 1,593 |
| | | |
| | Deutsche Telekom AG | 74,998 | 1,224 |
| | Deutsche Post AG | 22,024 | 683 |
| | Bayerische Motoren Werke | | |
| | AG | 7,712 | 673 |
| | Muenchener | | |
| | Rueckversicherungs- | | |
| | Gesellschaft AG in | | |
| | Muenchen | 3,322 | 645 |
| | Vonovia SE | 10,893 | 384 |
| | E.ON SE | 34,633 | 254 |
| | ProSiebenSat.1 Media SE | 5,023 | 217 |
| | Porsche Automobil Holding | | |
| | SE Preference Shares | 3,675 | 199 |
| | Commerzbank AG | 24,780 | 169 |
| | Hannover Rueck SE | 1,401 | 156 |
| | Evonik Industries AG | 3,705 | 116 |
| | METRO AG | 3,847 | 115 |
| | RWE AG Preference Shares | 8,501 | 98 |
| | HUGO BOSS AG | 1,531 | 96 |
| * | RWE AG | 5,856 | 93 |
| | K&S AG | 4,549 | 92 |
| | Bayerische Motoren Werke | | |
| | AG Preference Shares | 1,161 | 88 |
| | Deutsche Lufthansa AG | 5,948 | 76 |
| | MAN SE | 731 | 75 |
| | RTL Group SA | 922 | 72 |
| * | Uniper SE | 4,735 | 63 |
| | Telefonica Deutschland | | |
| | Holding AG | 15,255 | 59 |
| | Axel Springer SE | 1,101 | 55 |
| | Talanx AG | 1,138 | 35 |
| | | | 12,898 |
| Greece (0.0%) | | |
| | OPAP SA | 4,326 | 37 |
| * | Hellenic Petroleum SA | 805 | 4 |
| | | | 41 |
| Hong Kong (2.7%) | | |
| | Hong Kong Exchanges & | | |
| | Clearing Ltd. | 28,400 | 751 |
| | Sun Hung Kai Properties Ltd. | 33,000 | 491 |
| | Cheung Kong Property | | |
| | Holdings Ltd. | 65,500 | 484 |
| | CLP Holdings Ltd. | 35,500 | 361 |
| | Hang Seng Bank Ltd. | 17,500 | 316 |
| | BOC Hong Kong Holdings | | |
| | Ltd. | 84,000 | 299 |
| | Power Assets Holdings Ltd. | 30,497 | 286 |
| | Sands China Ltd. | 56,400 | 245 |
| | Wharf Holdings Ltd. | 28,000 | 210 |
| | MTR Corp. Ltd. | 32,000 | 177 |
| | New World Development | | |
| | Co. Ltd. | 122,000 | 152 |
| | Swire Pacific Ltd. Class A | 12,000 | 125 |
| | Wheelock & Co. Ltd. | 20,000 | 123 |
36
International High Dividend Yield Index Fund
| | | |
| | | | Market |
| | | | Value• |
| | | Shares | ($000) |
| | Sino Land Co. Ltd. | 72,000 | 122 |
| | Bank of East Asia Ltd. | 28,000 | 113 |
| | Hang Lung Properties Ltd. | 46,000 | 101 |
| | Want Want China Holdings | | |
| | Ltd. | 141,997 | 86 |
| | Hang Lung Group Ltd. | 19,000 | 73 |
| | Li & Fung Ltd. | 144,000 | 71 |
| | Yue Yuen Industrial | | |
| | Holdings Ltd. | 17,500 | 67 |
| | Hysan Development Co. Ltd. | 14,000 | 65 |
| | PCCW Ltd. | 103,000 | 61 |
| | ASM Pacific Technology Ltd. | 5,800 | 56 |
| | NWS Holdings Ltd. | 31,000 | 55 |
| | Hopewell Holdings Ltd. | 15,500 | 54 |
| | Tingyi Cayman Islands | | |
| | Holding Corp. | 46,000 | 50 |
| | Kerry Properties Ltd. | 14,500 | 46 |
| | VTech Holdings Ltd. | 3,700 | 45 |
| | First Pacific Co. Ltd. | 54,000 | 41 |
| | Haitong International | | |
| | Securities Group Ltd. | 58,000 | 37 |
| | Xinyi Glass Holdings Ltd. | 40,000 | 34 |
| | SJM Holdings Ltd. | 39,000 | 27 |
| | Cathay Pacific Airways Ltd. | 20,000 | 26 |
| | Xinyi Solar Holdings Ltd. | 66,000 | 24 |
| | Dah Sing Financial Holdings | | |
| | Ltd. | 3,600 | 24 |
| | Chow Tai Fook Jewellery | | |
| | Group Ltd. | 33,600 | 24 |
| | Guotai Junan International | | |
| | Holdings Ltd. | 59,000 | 22 |
| | Cafe de Coral Holdings Ltd. | 6,000 | 21 |
| | Television Broadcasts Ltd. | 5,600 | 20 |
| | Shun Tak Holdings Ltd. | 56,000 | 19 |
| | Orient Overseas | | |
| | International Ltd. | 5,000 | 19 |
| * | Huabao International | | |
| | Holdings Ltd. | 40,000 | 15 |
| | Lifestyle International | | |
| | Holdings Ltd. | 11,000 | 15 |
| | SA Sa International Holdings | | |
| | Ltd. | 30,000 | 14 |
| | Hutchison | | |
| | Telecommunications Hong | | |
| | Kong Holdings Ltd. | 32,000 | 10 |
| | Texwinca Holdings Ltd. | 14,000 | 10 |
| | Hopewell Highway | | |
| | Infrastructure Ltd. | 10,500 | 6 |
| | Kowloon Development Co. | | |
| | Ltd. | 5,000 | 5 |
| * | Lifestyle China Group Ltd. | 4,500 | 1 |
| | | | 5,499 |
| | | |
| Hungary (0.1%) | | |
| | OTP Bank plc | 4,461 | 125 |
| | MOL Hungarian Oil & Gas plc 1,152 | 74 |
| | Magyar Telekom | | |
| | Telecommunications plc | 6,658 | 11 |
| | | | 210 |
| India (0.6%) | | |
| | Oil & Natural Gas Corp. Ltd. | 47,620 | 204 |
| | Coal India Ltd. | 30,474 | 148 |
| | Indian Oil Corp. Ltd. | 25,862 | 125 |
| | Hero MotoCorp Ltd. | 2,278 | 114 |
| | NTPC Ltd. | 44,897 | 102 |
| | Indiabulls Housing Finance | | |
| | Ltd. | 7,742 | 99 |
| * | Vedanta Ltd. | 26,712 | 81 |
| | Hindustan Petroleum Corp. | | |
| | Ltd. | 9,991 | 70 |
| | NMDC Ltd. | 16,357 | 32 |
| | Cairn India Ltd. | 8,992 | 30 |
| | Rural Electrification Corp. | | |
| | Ltd. | 13,423 | 27 |
| | Power Finance Corp. Ltd. | 13,494 | 25 |
| * | Bank of Baroda | 9,631 | 23 |
| | Sun TV Network Ltd. | 2,559 | 21 |
| * | Steel Authority of India Ltd. | 26,383 | 21 |
| | Mphasis Ltd. | 2,442 | 19 |
| * | Punjab National Bank | 8,475 | 18 |
| | NHPC Ltd. | 44,288 | 18 |
| | Oil India Ltd. | 2,806 | 18 |
| | Oriental Bank of Commerce | 5,154 | 10 |
| | Union Bank of India | 4,110 | 9 |
| * | Bank of India | 5,292 | 9 |
| | Great Eastern Shipping Co. | | |
| | Ltd. | 1,629 | 9 |
| * | Canara Bank | 1,825 | 9 |
| * | IDFC Ltd. | 8,139 | 9 |
| 2 | InterGlobe Aviation Ltd. | 590 | 8 |
| | | | 1,258 |
| Indonesia (0.3%) | | |
| | Telekomunikasi Indonesia | | |
| | Persero Tbk PT | 1,174,400 | 379 |
| | United Tractors Tbk PT | 33,000 | 55 |
| | Perusahaan Gas Negara | | |
| | Persero Tbk | 262,600 | 51 |
| | Indocement Tunggal | | |
| | Prakarsa Tbk PT | 30,399 | 38 |
| | Tambang Batubara Bukit | | |
| | Asam Persero Tbk PT | 16,000 | 15 |
| * | Vale Indonesia Tbk PT | 52,300 | 11 |
| * | Bank CIMB Niaga Tbk PT | 14,376 | 1 |
| | | | 550 |
37
International High Dividend Yield Index Fund
| | | |
| | | | Market |
| | | | Value• |
| | | Shares | ($000) |
| Ireland (0.1%) | | |
| * | Bank of Ireland | 418,123 | 90 |
| |
| Israel (0.1%) | | |
| | Bezeq The Israeli | | |
| | Telecommunication Corp. | | |
| | Ltd. | 47,178 | 86 |
| | Israel Chemicals Ltd. | 10,567 | 38 |
| | Gazit-Globe Ltd. | 1,894 | 17 |
| | Harel Insurance | | |
| | Investments & Financial | | |
| | Services Ltd. | 3,682 | 14 |
| | Paz Oil Co. Ltd. | 87 | 14 |
| | Shikun & Binui Ltd. | 7,642 | 13 |
| * | Israel Corp. Ltd. | 85 | 13 |
| | Amot Investments Ltd. | 2,945 | 12 |
| * | Migdal Insurance & | | |
| | Financial Holding Ltd. | 2,097 | 1 |
| | | | 208 |
| Italy (2.1%) | | |
| | Eni SPA | 57,659 | 837 |
| | Enel SPA | 177,111 | 762 |
| | Intesa Sanpaolo SPA | | |
| | (Registered) | 267,997 | 621 |
| | Assicurazioni Generali SPA | 29,516 | 381 |
| | UniCredit SPA | 124,543 | 309 |
| | Snam SPA | 57,003 | 300 |
| | Atlantia SPA | 11,128 | 273 |
| | Terna Rete Elettrica | | |
| | Nazionale SPA | 33,118 | 162 |
| | Tenaris SA | 11,045 | 156 |
| | Telecom Italia SPA (Bearer) | 143,800 | 102 |
| | Mediobanca SPA | 13,254 | 97 |
| | Intesa Sanpaolo SPA | 36,547 | 79 |
| | FinecoBank Banca Fineco | | |
| | SPA | 9,559 | 56 |
| | Unione di Banche Italiane | | |
| | SPA | 19,293 | 53 |
| | Banca Mediolanum SPA | 6,470 | 45 |
| | UnipolSai SPA | 23,358 | 45 |
| | | | 4,278 |
| Japan (7.7%) | | |
| | Toyota Motor Corp. | 63,600 | 3,689 |
| | Mitsubishi UFJ Financial | | |
| | Group Inc. | 317,000 | 1,636 |
| | Honda Motor Co. Ltd. | 41,700 | 1,248 |
| | Sumitomo Mitsui Financial | | |
| | Group Inc. | 30,300 | 1,051 |
| | Mizuho Financial Group Inc. | 583,100 | 982 |
| | Takeda Pharmaceutical Co. | | |
| | Ltd. | 18,000 | 805 |
| | Canon Inc. | 24,100 | 692 |
| | Fuji Heavy Industries Ltd. | 14,300 | 559 |
| | Mitsui & Co. Ltd. | 39,500 | 547 |
| | | |
| | Nissan Motor Co. Ltd. | 46,600 | 474 |
| | ITOCHU Corp. | 33,400 | 422 |
| | Nomura Holdings Inc. | 79,800 | 400 |
| | Sumitomo Mitsui Trust | | |
| | Holdings Inc. | 8,900 | 300 |
| | Sumitomo Corp. | 26,100 | 300 |
| | Daiwa Securities Group Inc. | 39,000 | 233 |
| | Sekisui House Ltd. | 13,797 | 228 |
| | Resona Holdings Inc. | 51,100 | 227 |
| | JX Holdings Inc. | 56,000 | 221 |
| | Marubeni Corp. | 36,400 | 191 |
| | Yamaha Motor Co. Ltd. | 6,500 | 144 |
| | Dai Nippon Printing Co. Ltd. | 14,000 | 140 |
| | Japan Post Bank Co. Ltd. | 9,800 | 116 |
| | Kawasaki Heavy Industries | | |
| | Ltd. | 34,000 | 99 |
| | Aozora Bank Ltd. | 27,000 | 89 |
| | Chugoku Electric Power | | |
| | Co. Inc. | 7,297 | 85 |
| | Sojitz Corp. | 29,200 | 77 |
| | Hino Motors Ltd. | 6,600 | 72 |
| | TonenGeneral Sekiyu KK | 7,000 | 69 |
| * | Kobe Steel Ltd. | 7,200 | 59 |
| | DIC Corp. | 1,800 | 55 |
| | Sony Financial Holdings Inc. | 3,800 | 53 |
| | Hitachi Construction | | |
| | Machinery Co. Ltd. | 2,300 | 48 |
| | Aoyama Trading Co. Ltd. | 1,200 | 42 |
| | Sankyo Co. Ltd. | 1,100 | 39 |
| | Showa Shell Sekiyu KK | 4,000 | 37 |
| | Japan Airlines Co. Ltd. | 1,200 | 35 |
| | NTN Corp. | 9,000 | 34 |
| | Tokai Tokyo Financial | | |
| | Holdings Inc. | 5,700 | 29 |
| | Sanrio Co. Ltd. | 1,500 | 28 |
| | Senshu Ikeda Holdings Inc. | 5,400 | 25 |
| | North Pacific Bank Ltd. | 6,100 | 23 |
| | Hitachi Capital Corp. | 1,000 | 22 |
| | Matsui Securities Co. Ltd. | 1,900 | 15 |
| | Okasan Securities Group Inc. | 2,000 | 11 |
| | Mitsui Mining & Smelting | | |
| | Co. Ltd. | 3,000 | 7 |
| | | | 15,658 |
| Malaysia (0.6%) | | |
| | Malayan Banking Bhd. | 126,600 | 238 |
| | CIMB Group Holdings Bhd. | 128,700 | 154 |
| | Sime Darby Bhd. | 75,700 | 148 |
| | Axiata Group Bhd. | 108,800 | 127 |
| | DiGi.Com Bhd. | 85,600 | 103 |
| | Maxis Bhd. | 61,700 | 88 |
| | AMMB Holdings Bhd. | 46,700 | 47 |
| | YTL Corp. Bhd. | 112,500 | 43 |
| | British American Tobacco | | |
| | Malaysia Bhd. | 3,000 | 35 |
38
International High Dividend Yield Index Fund
| | | |
| | | | Market |
| | | | Value• |
| | | Shares | ($000) |
| 2 | Astro Malaysia Holdings | | |
| | Bhd. | 50,800 | 34 |
| | Telekom Malaysia Bhd. | 21,700 | 34 |
| | UMW Holdings Bhd. | 19,500 | 27 |
| | KLCCP Stapled Group | 14,000 | 27 |
| | Alliance Financial Group Bhd. | 26,600 | 25 |
| | YTL Power International Bhd. | 65,500 | 24 |
| | Lafarge Malaysia Bhd. | 11,400 | 22 |
| | Westports Holdings Bhd. | 17,000 | 18 |
| | Berjaya Sports Toto Bhd. | 17,000 | 13 |
| | SP Setia Bhd Group | 9,200 | 8 |
| | | | 1,215 |
| Mexico (0.1%) | | |
| | Grupo Aeroportuario del | | |
| | Pacifico SAB de CV Class B | 7,800 | 75 |
| | Grupo Financiero Santander | | |
| | Mexico SAB de CV Class B | 35,500 | 64 |
| | Kimberly-Clark de Mexico | | |
| | SAB de CV Class A | 22,400 | 48 |
| | Infraestructura Energetica | | |
| | Nova SAB de CV | 7,400 | 33 |
| | Grupo Sanborns SAB de CV | 1,200 | 2 |
| | | | 222 |
| Netherlands (2.4%) | | |
| | Unilever NV | 36,271 | 1,517 |
| | ING Groep NV | 90,072 | 1,182 |
| | Koninklijke Philips NV | 21,265 | 641 |
| * | ArcelorMittal | 42,914 | 290 |
| | Koninklijke DSM NV | 4,084 | 263 |
| | Koninklijke KPN NV | 72,859 | 238 |
| | NN Group NV | 7,575 | 228 |
| | Aegon NV | 45,140 | 195 |
| | Randstad Holding NV | 2,580 | 133 |
| 2 | ABN AMRO Group NV | 5,126 | 118 |
| | Boskalis Westminster | 2,085 | 67 |
| * | OCI NV | 2,412 | 33 |
| | | | 4,905 |
| New Zealand (0.2%) | | |
| | Fletcher Building Ltd. | 16,002 | 119 |
| | Spark New Zealand Ltd. | 42,580 | 111 |
| | Contact Energy Ltd. | 17,869 | 61 |
| | Meridian Energy Ltd. | 28,237 | 52 |
| | SKYCITY Entertainment | | |
| | Group Ltd. | 15,170 | 42 |
| | Mercury NZ Ltd. | 18,840 | 41 |
| | SKY Network Television Ltd. | 8,810 | 29 |
| | Air New Zealand Ltd. | 15,450 | 21 |
| | Vector Ltd. | 6,960 | 16 |
| | Warehouse Group Ltd. | 713 | 2 |
| | | | 494 |
| Norway (0.7%) | | |
| �� | Statoil ASA | 22,376 | 365 |
| | DNB ASA | 22,506 | 325 |
| | Telenor ASA | 16,216 | 258 |
| | | |
| | Orkla ASA | 17,995 | 170 |
| | Marine Harvest ASA | 8,694 | 158 |
| | Yara International ASA | 4,161 | 147 |
| | Gjensidige Forsikring ASA | 3,625 | 65 |
| | | | 1,488 |
| Pakistan (0.0%) | | |
| | Oil & Gas Development | | |
| | Co. Ltd. | 16,700 | 22 |
| | Pakistan Petroleum Ltd. | 9,900 | 14 |
| | Fauji Fertilizer Co. Ltd. | 13,000 | 13 |
| | National Bank of Pakistan | 10,500 | 7 |
| | | | 56 |
| Philippines (0.1%) | | |
| | Manila Electric Co. | 9,010 | 52 |
| | Aboitiz Power Corp. | 53,100 | 50 |
| | Globe Telecom Inc. | 80 | 3 |
| | | | 105 |
| Poland (0.4%) | | |
| | Polski Koncern Naftowy | | |
| | ORLEN SA | 7,449 | 147 |
| | Powszechna Kasa | | |
| | Oszczednosci Bank Polski | | |
| | SA | 20,144 | 141 |
| | Bank Pekao SA | 3,664 | 113 |
| | Powszechny Zaklad | | |
| | Ubezpieczen SA | 13,199 | 92 |
| | KGHM Polska Miedz SA | 3,465 | 63 |
| | Polskie Gornictwo Naftowe i | | |
| | Gazownictwo SA | 44,412 | 57 |
| | Bank Zachodni WBK SA | 612 | 49 |
| | PGE Polska Grupa | | |
| | Energetyczna SA | 16,132 | 42 |
| * | mBank SA | 304 | 27 |
| | Orange Polska SA | 18,821 | 27 |
| | Bank Handlowy w | | |
| | Warszawie SA | 1,111 | 22 |
| * | Tauron Polska Energia SA | 32,472 | 22 |
| | Asseco Poland SA | 1,615 | 22 |
| * | Enea SA | 5,514 | 14 |
| * | Synthos SA | 9,040 | 11 |
| | Budimex SA | 185 | 10 |
| | | | 859 |
| Portugal (0.2%) | | |
| | Galp Energia SGPS SA | 12,124 | 165 |
| | EDP - Energias de Portugal | | |
| | SA | 44,832 | 148 |
| | | | 313 |
| Russia (1.1%) | | |
| | Gazprom PJSC ADR | 78,306 | 338 |
| | Lukoil PJSC ADR | 6,326 | 308 |
| | Gazprom PJSC | 98,520 | 216 |
| | Lukoil PJSC | 4,234 | 207 |
| | Tatneft PJSC ADR | 5,444 | 182 |
39
International High Dividend Yield Index Fund
| | |
| | | Market |
| | | Value• |
| | Shares | ($000) |
| MMC Norilsk Nickel PJSC | | |
| ADR | 10,891 | 164 |
| Rosneft PJSC GDR | 26,837 | 146 |
| Mobile TeleSystems PJSC | | |
| ADR | 11,903 | 92 |
| Alrosa PJSC | 59,600 | 83 |
| Surgutneftegas OAO | | |
| Preference Shares | 178,841 | 81 |
| Moscow Exchange | | |
| MICEX-RTS PJSC | 29,389 | 54 |
| Severstal PJSC GDR | 3,831 | 54 |
| Novolipetsk Steel PJSC | 21,830 | 35 |
| Sistema PJSC FC GDR | 3,801 | 28 |
| Bashneft PJSC | 509 | 27 |
| Rostelecom PJSC ADR | 3,569 | 26 |
| Inter RAO UES PJSC | 414,000 | 22 |
| Magnitogorsk Iron & Steel | | |
| OJSC | 42,500 | 21 |
| * Aeroflot PJSC | 10,400 | 21 |
| PhosAgro PJSC GDR | 1,693 | 21 |
| MegaFon PJSC GDR | 2,160 | 21 |
| LSR Group PJSC GDR | 6,084 | 17 |
| E.ON Russia JSC | 321,000 | 15 |
| Tatneft PAO Preference | | |
| Shares | 4,340 | 14 |
| Bashneft PAO Preference | | |
| Shares | 430 | 10 |
| Rostelecom PJSC | 2,810 | 4 |
| | | 2,207 |
| Singapore (1.3%) | | |
| Singapore | | |
| Telecommunications Ltd. | 170,900 | 476 |
| Oversea-Chinese Banking | | |
| Corp. Ltd. | 76,700 | 467 |
| DBS Group Holdings Ltd. | 41,400 | 446 |
| United Overseas Bank Ltd. | 27,800 | 375 |
| Keppel Corp. Ltd. | 33,900 | 128 |
| Singapore Press Holdings | | |
| Ltd. | 36,600 | 98 |
| Singapore Exchange Ltd. | 18,497 | 94 |
| ComfortDelGro Corp. Ltd. | 49,500 | 90 |
| Singapore Airlines Ltd. | 11,900 | 87 |
| Singapore Technologies | | |
| Engineering Ltd. | 38,100 | 86 |
| Hutchison Port Holdings | | |
| Trust | 123,300 | 55 |
| SATS Ltd. | 14,200 | 49 |
| Singapore Post Ltd. | 36,000 | 41 |
| Golden Agri-Resources Ltd. | 141,400 | 39 |
| StarHub Ltd. | 15,300 | 37 |
| Venture Corp. Ltd. | 5,100 | 35 |
| Sembcorp Industries Ltd. | 19,100 | 35 |
| Yangzijiang Shipbuilding | | |
| Holdings Ltd. | 56,100 | 30 |
| | |
| Sembcorp Marine Ltd. | 21,700 | 20 |
| SIA Engineering Co. Ltd. | 7,500 | 20 |
| * Noble Group Ltd. | 122,600 | 15 |
| Frasers Centrepoint Ltd. | 1,700 | 2 |
| | | 2,725 |
| South Africa (1.4%) | | |
| Sasol Ltd. | 12,893 | 356 |
| MTN Group Ltd. | 41,069 | 355 |
| Standard Bank Group Ltd. | 28,277 | 300 |
| FirstRand Ltd. | 70,619 | 253 |
| Sanlam Ltd. | 40,433 | 196 |
| Woolworths Holdings Ltd. | 22,236 | 129 |
| Vodacom Group Ltd. | 11,744 | 127 |
| Barclays Africa Group Ltd. | 10,043 | 117 |
| Tiger Brands Ltd. | 3,741 | 106 |
| Nedbank Group Ltd. | 5,230 | 86 |
| Life Healthcare Group | | |
| Holdings Ltd. | 25,153 | 67 |
| Mr Price Group Ltd. | 5,375 | 61 |
| SPAR Group Ltd. | 4,304 | 61 |
| RMB Holdings Ltd. | 13,828 | 61 |
| Imperial Holdings Ltd. | 4,487 | 57 |
| Truworths International Ltd. | 10,579 | 56 |
| AVI Ltd. | 6,774 | 48 |
| Investec Ltd. | 7,159 | 44 |
| MMI Holdings Ltd. | 22,445 | 38 |
| Telkom SA SOC Ltd. | 7,380 | 34 |
| Coronation Fund Managers | | |
| Ltd. | 5,337 | 29 |
| Barloworld Ltd. | 4,408 | 28 |
| JSE Ltd. | 2,374 | 28 |
| Liberty Holdings Ltd. | 2,949 | 25 |
| Nampak Ltd. | 17,413 | 24 |
| Tsogo Sun Holdings Ltd. | 9,353 | 21 |
| Tongaat Hulett Ltd. | 2,237 | 20 |
| Massmart Holdings Ltd. | 2,113 | 18 |
| Santam Ltd. | 943 | 17 |
| AECI Ltd. | 2,149 | 16 |
| Sun International Ltd. | 2,486 | 15 |
| Omnia Holdings Ltd. | 1,221 | 15 |
| Oceana Group Ltd. | 956 | 8 |
| DataTec Ltd. | 472 | 2 |
| Alexander Forbes Group | | |
| Holdings Ltd. | 2,484 | 1 |
| | | 2,819 |
| South Korea (0.8%) | | |
| KB Financial Group Inc. | 9,676 | 358 |
| POSCO | 1,583 | 329 |
| KT&G Corp. | 2,591 | 256 |
| SK Telecom Co. Ltd. ADR | 4,885 | 107 |
| Hyundai Motor Co. 2nd | | |
| Preference Shares | 1,061 | 93 |
| Industrial Bank of Korea | 6,489 | 75 |
| Woori Bank | 6,514 | 71 |
40
International High Dividend Yield Index Fund
| | | |
| | | | Market |
| | | | Value• |
| | | Shares | ($000) |
| | Hyundai Marine & Fire | | |
| | Insurance Co. Ltd. | 1,328 | 41 |
| | Doosan Heavy Industries & | | |
| | Construction Co. Ltd. | 1,577 | 36 |
| | Mirae Asset Daewoo Co. Ltd. | 4,803 | 32 |
| | DGB Financial Group Inc. | 3,611 | 30 |
| | NH Investment & Securities | | |
| | Co. Ltd. | 3,227 | 28 |
| | Samsung Card Co. Ltd. | 665 | 28 |
| | Hyundai Motor Co. | | |
| | Preference Shares | 328 | 27 |
| | Hanwha Life Insurance Co. | | |
| | Ltd. | 4,523 | 25 |
| | Doosan Corp. | 243 | 22 |
| | Hite Jinro Co. Ltd. | 602 | 12 |
| | | | 1,570 |
| Spain (3.5%) | | |
| | Banco Santander SA | 336,773 | 1,650 |
| | Banco Bilbao Vizcaya | | |
| | Argentaria SA | 150,807 | 1,086 |
| | Telefonica SA | 100,384 | 1,020 |
| | Iberdrola SA | 131,380 | 894 |
| * | Repsol SA | 25,939 | 362 |
| | Abertis Infraestructuras SA | 15,028 | 223 |
| * | Ferrovial SA | 11,368 | 221 |
| | Red Electrica Corp. SA | 10,163 | 212 |
| | CaixaBank SA | 61,778 | 186 |
| | Enagas SA | 5,445 | 156 |
| | Endesa SA | 7,248 | 154 |
| | Gas Natural SDG SA | 7,422 | 146 |
| | Bankinter SA | 16,981 | 130 |
| * | ACS Actividades de | | |
| | Construccion y Servicios | | |
| | SA | 4,201 | 129 |
| * | Banco de Sabadell SA | 76,368 | 102 |
| | Bankia SA | 110,572 | 97 |
| | Distribuidora Internacional | | |
| | de Alimentacion SA | 14,813 | 79 |
| | Mapfre SA | 24,404 | 72 |
| | Mediaset Espana | | |
| | Comunicacion SA | 4,521 | 51 |
| * | Acerinox SA | 3,720 | 46 |
| | Zardoya Otis SA | 5,391 | 45 |
| * | Banco Popular Espanol SA | 37,825 | 41 |
| * | Ferrovial SA Rights Expire | | |
| | 11/14/2016 | 11,368 | 5 |
| | | | 7,107 |
| Sweden (2.6%) | | |
| | Nordea Bank AB | 73,998 | 778 |
| | Hennes & Mauritz AB | | |
| | Class B | 22,176 | 624 |
| | Swedbank AB Class A | 24,540 | 574 |
| | Svenska Handelsbanken AB | | |
| | Class A | 32,914 | 449 |
| | | |
| | Volvo AB Class B | 36,181 | 388 |
| | Investor AB Class B | 10,358 | 368 |
| | Telefonaktiebolaget LM | | |
| | Ericsson Class B | 69,842 | 339 |
| | Skandinaviska Enskilda | | |
| | Banken AB Class A | 33,565 | 339 |
| | Sandvik AB | 25,221 | 286 |
| ^ | Telia Co. AB | 60,338 | 241 |
| | Skanska AB Class B | 8,270 | 180 |
| | Swedish Match AB | 4,182 | 145 |
| | Industrivarden AB Class A | 6,787 | 129 |
| | SKF AB | 7,545 | 128 |
| * | Kinnevik AB | 4,675 | 118 |
| | Husqvarna AB | 9,578 | 72 |
| ^ | Tele2 AB | 7,816 | 64 |
| | SKF AB Class A | 2,018 | 34 |
| | Svenska Handelsbanken AB | | |
| | Class B | 2,289 | 31 |
| | Industrivarden AB | 1,361 | 24 |
| * | Tele2 AB Rights | 6,659 | 2 |
| | | | 5,313 |
| Switzerland (9.5%) | | |
| | Nestle SA | 71,780 | 5,205 |
| | Novartis AG | 55,046 | 3,906 |
| | Roche Holding AG | 16,360 | 3,758 |
| | UBS Group AG | 81,283 | 1,149 |
| | ABB Ltd. | 44,323 | 914 |
| | Zurich Insurance Group AG | 3,467 | 908 |
| | Swiss Re AG | 7,606 | 706 |
| | Credit Suisse Group AG | 48,651 | 679 |
| | LafargeHolcim Ltd. | 11,331 | 604 |
| | Swisscom AG | 525 | 240 |
| | SGS SA | 117 | 237 |
| | Adecco Group AG | 3,711 | 220 |
| | Swiss Life Holding AG | 739 | 196 |
| | Kuehne & Nagel | | |
| | International AG | 1,094 | 148 |
| | Baloise Holding AG | 1,053 | 130 |
| | Swiss Prime Site AG | 1,466 | 122 |
| | PSP Swiss Property AG | 901 | 81 |
| | Helvetia Holding AG | 136 | 71 |
| | Pargesa Holding SA | 899 | 60 |
| | Banque Cantonale Vaudoise | 66 | 41 |
| | | | 19,375 |
| Taiwan (4.9%) | | |
| | Taiwan Semiconductor | | |
| | Manufacturing Co. Ltd. | 557,400 | 3,345 |
| | Hon Hai Precision Industry | | |
| | Co. Ltd. | 348,000 | 940 |
| | Formosa Plastics Corp. | 113,000 | 305 |
| | Formosa Chemicals & | | |
| | Fibre Corp. | 102,000 | 303 |
| | Nan Ya Plastics Corp. | 132,000 | 274 |
| | Delta Electronics Inc. | 51,200 | 270 |
41
International High Dividend Yield Index Fund
| | |
| | | Market |
| | | Value• |
| | Shares | ($000) |
| MediaTek Inc. | 34,000 | 258 |
| Fubon Financial Holding Co. | | |
| Ltd. | 170,000 | 241 |
| Cathay Financial Holding Co. | | |
| Ltd. | 185,000 | 239 |
| CTBC Financial Holding Co. | | |
| Ltd. | 425,120 | 229 |
| Chunghwa Telecom Co. | | |
| Ltd. ADR | 6,049 | 207 |
| Mega Financial Holding Co. | | |
| Ltd. | 254,000 | 174 |
| Catcher Technology Co. Ltd. | 18,000 | 141 |
| Asustek Computer Inc. | 15,999 | 140 |
| Taiwan Mobile Co. Ltd. | 39,000 | 136 |
| Quanta Computer Inc. | 62,000 | 125 |
| Pegatron Corp. | 45,000 | 121 |
| Hotai Motor Co. Ltd. | 10,000 | 116 |
| First Financial Holding Co. | | |
| Ltd. | 213,424 | 112 |
| Formosa Petrochemical | | |
| Corp. | 33,000 | 110 |
| Advanced Semiconductor | | |
| Engineering Inc. ADR | 17,501 | 102 |
| Yuanta Financial Holding | | |
| Co. Ltd. | 272,000 | 102 |
| Taiwan Cement Corp. | 75,000 | 90 |
| Cheng Shin Rubber Industry | | |
| Co. Ltd. | 43,999 | 90 |
| Chunghwa Telecom Co. Ltd. | 26,000 | 89 |
| Hua Nan Financial Holdings | | |
| Co. Ltd. | 170,928 | 87 |
| Pou Chen Corp. | 63,000 | 85 |
| China Development | | |
| Financial Holding Corp. | 338,000 | 85 |
| Far EasTone | | |
| Telecommunications Co. | | |
| Ltd. | 35,000 | 83 |
| Taishin Financial Holding | | |
| Co. Ltd. | 210,275 | 77 |
| Foxconn Technology Co. | | |
| Ltd. | 26,190 | 76 |
| Lite-On Technology Corp. | 52,194 | 75 |
| Advanced Semiconductor | | |
| Engineering Inc. | 62,000 | 73 |
| Far Eastern New Century | | |
| Corp. | 92,000 | 71 |
| Innolux Corp. | 211,000 | 71 |
| SinoPac Financial Holdings | | |
| Co. Ltd. | 238,400 | 69 |
| United Microelectronics | | |
| Corp. ADR | 34,557 | 66 |
| Compal Electronics Inc. | 106,000 | 63 |
| Siliconware Precision | | |
| Industries Co. Ltd. ADR | 8,044 | 60 |
| | | |
| | Novatek Microelectronics | | |
| | Corp. | 14,000 | 52 |
| | Inventec Corp. | 66,999 | 52 |
| | Wistron Corp. | 69,256 | 52 |
| | Vanguard International | | |
| | Semiconductor Corp. | 23,000 | 47 |
| | Asia Cement Corp. | 50,000 | 44 |
| | Realtek Semiconductor Corp. | 11,000 | 37 |
| | United Microelectronics | | |
| | Corp. | 91,000 | 34 |
| | Chicony Electronics Co. Ltd. | 13,019 | 33 |
| | Synnex Technology | | |
| | International Corp. | 30,000 | 32 |
| | Teco Electric and Machinery | | |
| | Co. Ltd. | 36,000 | 32 |
| | Nanya Technology Corp. | 18,000 | 23 |
| | Eternal Materials Co. Ltd. | 19,320 | 20 |
| | Far Eastern International | | |
| | Bank | 64,260 | 18 |
| | Wan Hai Lines Ltd. | 36,000 | 18 |
| | Formosa Taffeta Co. Ltd. | 19,000 | 17 |
| | U-Ming Marine Transport | | |
| | Corp. | 22,000 | 15 |
| | Transcend Information Inc. | 5,000 | 14 |
| | Cheng Uei Precision | | |
| | Industry Co. Ltd. | 11,000 | 14 |
| | Cathay Real Estate | | |
| | Development Co. Ltd. | 25,900 | 13 |
| | Siliconware Precision | | |
| | Industries Co. Ltd. | 8,000 | 12 |
| | Taiwan Secom Co. Ltd. | 4,000 | 12 |
| | China Motor Corp. | 14,000 | 11 |
| | Ton Yi Industrial Corp. | 22,000 | 9 |
| | Capital Securities Corp. | 33,000 | 8 |
| | Feng Hsin Steel Co. Ltd. | 6,000 | 8 |
| | Oriental Union Chemical | | |
| | Corp. | 11,000 | 7 |
| | YFY Inc. | 15,000 | 4 |
| | President Securities Corp. | 9,280 | 3 |
| | | | 9,941 |
| Thailand (0.8%) | | |
| * | PTT PCL | 32,800 | 323 |
| | Siam Cement PCL NVDR | 11,800 | 168 |
| * | Siam Commercial Bank PCL | | |
| | (Local) | 31,900 | 131 |
| * | Advanced Info Service PCL | | |
| | (Local) | 28,036 | 123 |
| | Siam Cement PCL (Foreign) | 7,550 | 109 |
| | Siam Commercial Bank PCL | 24,200 | 99 |
| * | Charoen Pokphand Foods | | |
| | PCL | 99,800 | 90 |
| * | PTT Global Chemical PCL | 46,799 | 80 |
| * | Krung Thai Bank PCL | 148,100 | 73 |
| | Bangkok Bank PCL (Foreign) | 12,200 | 56 |
| * | Thai Oil PCL | 24,500 | 49 |
42
International High Dividend Yield Index Fund
| | | |
| | | | Market |
| | | | Value• |
| | | Shares | ($000) |
| * | Banpu PCL (Local) | 90,200 | 47 |
| * | Land & Houses PCL | 157,000 | 41 |
| * | Intouch Holdings PCL | 27,000 | 41 |
| * | Thai Union Group PCL | 58,100 | 36 |
| * | IRPC PCL | 254,200 | 35 |
| * | Electricity Generating PCL | 6,197 | 34 |
| | Intouch Holdings NVDR | 18,400 | 28 |
| * | Ratchaburi Electricity | | |
| | Generating Holding PCL | | |
| | (Local) | 19,200 | 27 |
| * | Glow Energy PCL | 11,600 | 25 |
| * | Delta Electronics Thailand | | |
| | PCL | 9,800 | 22 |
| * | Siam City Cement PCL | | |
| | (Local) | 1,800 | 15 |
| * | Total Access Communication | | |
| | PCL (Local) | 14,100 | 13 |
| * | BEC World PCL | 19,200 | 11 |
| | Banpu PCL | 8,550 | 4 |
| | | | 1,680 |
| Turkey (0.1%) | | |
| | Tupras Turkiye Petrol | | |
| | Rafinerileri AS | 2,742 | 56 |
| * | Turkcell Iletisim Hizmetleri | | |
| | AS | 16,477 | 53 |
| | Eregli Demir ve Celik | | |
| | Fabrikalari TAS | 34,155 | 46 |
| | Arcelik AS | 3,827 | 25 |
| | Turk Telekomunikasyon AS | 11,692 | 22 |
| | Ford Otomotiv Sanayi AS | 2,035 | 21 |
| | TAV Havalimanlari Holding | | |
| | AS | 4,675 | 19 |
| | Tofas Turk Otomobil | | |
| | Fabrikasi AS | 2,363 | 18 |
| | Turk Traktor ve Ziraat | | |
| | Makineleri AS | 511 | 13 |
| * | Koza Altin Isletmeleri AS | 1,578 | 9 |
| | Aygaz AS | 2,512 | 9 |
| | | | 291 |
| United Arab Emirates (0.3%) | | |
| | Emirates | | |
| | Telecommunications | | |
| | Group Co. PJSC | 39,120 | 201 |
| | First Gulf Bank PJSC | 27,597 | 86 |
| | Abu Dhabi Commercial | | |
| | Bank PJSC | 42,950 | 72 |
| | Dubai Islamic Bank PJSC | 28,885 | 41 |
| | Emaar Malls PJSC | 50,875 | 35 |
| | Union National Bank PJSC | 31,483 | 34 |
| | DAMAC Properties Dubai | | |
| | Co. PJSC | 46,902 | 28 |
| | Air Arabia PJSC | 47,462 | 17 |
| | Dubai Investments PJSC | 22,690 | 12 |
| | | |
| | Al Waha Capital PJSC | 10,656 | 5 |
| * | Union Properties PJSC | 24,088 | 5 |
| | | | 536 |
| United Kingdom (16.3%) | | |
| | HSBC Holdings plc | 462,002 | 3,479 |
| | BP plc | 437,771 | 2,588 |
| | Royal Dutch Shell plc | | |
| | Class A | 103,420 | 2,576 |
| | British American Tobacco | | |
| | plc | 43,465 | 2,491 |
| | GlaxoSmithKline plc | 113,412 | 2,240 |
| | Royal Dutch Shell plc | | |
| | Class B | 84,971 | 2,192 |
| | Vodafone Group plc | 622,086 | 1,708 |
| | AstraZeneca plc | 29,426 | 1,648 |
| | National Grid plc | 88,344 | 1,149 |
| | Imperial Brands plc | 22,553 | 1,091 |
| | Lloyds Banking Group plc 1,497,105 | 1,045 |
| | Rio Tinto plc | 28,266 | 983 |
| | Barclays plc | 395,862 | 917 |
| | BT Group plc | 196,772 | 903 |
| | BHP Billiton plc | 49,407 | 743 |
| * | Standard Chartered plc | 63,079 | 549 |
| | Aviva plc | 95,314 | 516 |
| | BAE Systems plc | 75,071 | 497 |
| | SSE plc | 23,730 | 461 |
| | Legal & General Group plc | 140,121 | 358 |
| | Centrica plc | 128,921 | 338 |
| | Old Mutual plc | 115,548 | 284 |
| | Sky plc | 25,231 | 252 |
| | Next plc | 3,371 | 198 |
| | Standard Life plc | 47,355 | 195 |
| | United Utilities Group plc | 16,086 | 185 |
| | Pearson plc | 19,418 | 180 |
| | RSA Insurance Group plc | 24,370 | 165 |
| | Smiths Group plc | 9,482 | 164 |
| | Marks & Spencer Group plc | 38,547 | 160 |
| | Severn Trent plc | 5,543 | 158 |
| | St. James’s Place plc | 12,521 | 145 |
| | TUI AG | 11,367 | 144 |
| | Direct Line Insurance | | |
| | Group plc | 32,927 | 139 |
| | Royal Mail plc | 22,278 | 134 |
| | Provident Financial plc | 3,592 | 130 |
| | J Sainsbury plc | 41,823 | 128 |
| | Admiral Group plc | 4,872 | 114 |
| | DS Smith plc | 23,301 | 114 |
| | Weir Group plc | 5,184 | 108 |
| | Tate & Lyle plc | 11,219 | 107 |
| | Meggitt plc | 19,079 | 102 |
| | Pennon Group plc | 9,824 | 100 |
| | G4S plc | 37,161 | 100 |
| | Persimmon plc | 4,770 | 99 |
| | Investec plc | 15,899 | 99 |
43
International High Dividend Yield Index Fund
| | |
| | | Market |
| | | Value• |
| | Shares | ($000) |
| Aberdeen Asset | | |
| Management plc | 24,399 | 95 |
| IMI plc | 7,395 | 90 |
| Bellway plc | 2,998 | 87 |
| John Wood Group plc | 9,015 | 85 |
| Taylor Wimpey plc | 48,893 | 85 |
| Barratt Developments plc | 14,941 | 83 |
| ICAP plc | 13,167 | 78 |
| Henderson Group plc | 26,517 | 75 |
| New Europe Property | | |
| Investments plc | 5,526 | 68 |
| Petrofac Ltd. | 6,562 | 65 |
| easyJet plc | 5,326 | 61 |
| Inmarsat plc | 5,571 | 48 |
| Ashmore Group plc | 10,915 | 47 |
| Berkeley Group Holdings plc | 1,568 | 45 |
| TalkTalk Telecom Group plc | 14,290 | 36 |
| Cobham plc | 15,180 | 26 |
| | | 33,250 |
| United States (0.0%) | | |
| Enersis Chile SA ADR | 5,728 | 29 |
| Total Common Stocks | | |
| (Cost $196,817) | | 201,554 |
| Temporary Cash Investment (11.2%)1 | |
| Money Market Fund (11.2%) | | |
| 3,4 Vanguard Market | | |
| Liquidity Fund, | | |
| 0.718% (Cost $22,774) | 227,720 | 22,774 |
| Total Investments (110.2%) | | |
| (Cost $219,591) | | 224,328 |
| |
| | | Amount |
| | | ($000) |
| Other Assets and Liabilities (-10.2%) | |
| Other Assets 5 | | 2,273 |
| Liabilities 4 | | (23,008) |
| | | (20,735) |
| Net Assets (100%) | | 203,593 |
| |
| Statement of Assets and Liabilities | |
| Assets | |
| Investments in Securities, at Value | |
| Unaffiliated Issuers | 201,554 |
| Affiliated Vanguard Funds | 22,774 |
| Total Investments in Securities | 224,328 |
| Investment in Vanguard | 13 |
| Receivables for Investment Securities Sold | 89 |
| Receivables for Accrued Income | 348 |
| Receivables for Capital Shares Issued | 496 |
| Other Assets | 1,327 |
| Total Assets | 226,601 |
| Liabilities | |
| Payables for Investment Securities | |
| Purchased | (21,052) |
| Collateral for Securities on Loan | (1,261) |
| Payables for Capital Shares Redeemed | (28) |
| Payables to Vanguard | (317) |
| Other Liabilities | (350) |
| Total Liabilities | (23,008) |
| Net Assets | 203,593 |
| |
| At October 31, 2016, net assets consisted of: |
| | Amount |
| | ($000) |
| Paid-in Capital | 198,462 |
| Undistributed Net Investment Income | 555 |
| Accumulated Net Realized Losses | (223) |
| Unrealized Appreciation (Depreciation) | |
| Investment Securities | 4,737 |
| Futures Contracts | (4) |
| Foreign Currencies | 66 |
| Net Assets | 203,593 |
| |
| |
| Investor Shares—Net Assets | |
| Applicable to 133,111 outstanding | |
| $.001 par value shares of beneficial | |
| interest (unlimited authorization) | 2,960 |
| Net Asset Value Per Share— | |
| Investor Shares | $22.24 |
44
International High Dividend Yield Index Fund
| |
| | Amount |
| | ($000) |
| ETF Shares—Net Assets | |
| Applicable to 2,100,062 outstanding | |
| $.001 par value shares of beneficial | |
| interest (unlimited authorization) | 116,778 |
| Net Asset Value Per Share— | |
| ETF Shares | $55.61 |
| |
| |
| Admiral Shares—Net Assets | |
| Applicable to 3,115,165 outstanding | |
| $.001 par value shares of beneficial | |
| interest (unlimited authorization) | 83,855 |
| Net Asset Value Per Share— | |
| Admiral Shares | $26.92 |
• See Note A in Notes to Financial Statements.
* Non-income-producing security.
^ Includes partial security positions on loan to broker-dealers. The total value of securities on loan is $1,152,000.
1 The fund invests a portion of its cash reserves in equity markets through the use of index futures contracts. After giving effect to futures
investments, the fund’s effective common stock and temporary cash investment positions represent 100.0% and 10.2%, respectively, of net
assets.
2 Security exempt from registration under Rule 144A of the Securities Act of 1933. Such securities may be sold in transactions exempt from
registration, normally to qualified institutional buyers. At October 31, 2016, the aggregate value of these securities was $420,000,
representing 0.2% of net assets.
3 Affiliated money market fund available only to Vanguard funds and certain trusts and accounts managed by Vanguard. Rate shown is the
7-day yield.
4 Includes $1,261,000 of collateral received for securities on loan.
5 Cash of $155,000 has been segregated as initial margin for open futures contracts.
ADR—American Depositary Receipt.
GDR—Global Depositary Receipt.
NVDR—Non-Voting Depository Receipt.
See accompanying Notes, which are an integral part of the Financial Statements.
45
| |
| International High Dividend Yield Index Fund | |
| |
| |
| Statement of Operations | |
| |
| | February 25, 20161 to |
| | October 31, 2016 |
| | ($000) |
| Investment Income | |
| Income | |
| Dividends2 | 2,537 |
| Interest3 | 8 |
| Securities Lending—Net | 5 |
| Total Income | 2,550 |
| Expenses | |
| The Vanguard Group—Note B | |
| Investment Advisory Services | 5 |
| Management and Administrative—Investor Shares | 2 |
| Management and Administrative—ETF Shares | 24 |
| Management and Administrative—Admiral Shares | 69 |
| Marketing and Distribution—Investor Shares | — |
| Marketing and Distribution—ETF Shares | 2 |
| Marketing and Distribution—Admiral Shares | 1 |
| Custodian Fees | 376 |
| Auditing Fees | 17 |
| Shareholders’ Reports—Investor Shares | — |
| Shareholders’ Reports—ETF Shares | 1 |
| Shareholders’ Reports—Admiral Shares | 1 |
| Total Expenses | 498 |
| Expense Reimbursement—Note B | (294) |
| Net Expenses | 204 |
| Net Investment Income | 2,346 |
| Realized Net Gain (Loss) | |
| Investment Securities Sold3 | (132) |
| Futures Contracts | (91) |
| Foreign Currencies and Forward Currency Contracts | (4) |
| Realized Net Gain (Loss) | (227) |
| Change in Unrealized Appreciation (Depreciation) | |
| Investment Securities | 4,737 |
| Futures Contracts | (4) |
| Foreign Currencies and Forward Currency Contracts | 66 |
| Change in Unrealized Appreciation (Depreciation) | 4,799 |
| Net Increase (Decrease) in Net Assets Resulting from Operations | 6,918 |
1 Inception.
2 Dividends are net of foreign withholding taxes of $256,000.
3 Interest income and realized net gain (loss) from an affiliated company of the fund were $8,000 and $0, respectively.
See accompanying Notes, which are an integral part of the Financial Statements.
46
| |
| International High Dividend Yield Index Fund | |
| |
| |
| Statement of Changes in Net Assets | |
| |
| | February 25, 20161 to |
| | October 31, 2016 |
| | ($000) |
| Increase (Decrease) in Net Assets | |
| Operations | |
| Net Investment Income | 2,346 |
| Realized Net Gain (Loss) | (227) |
| Change in Unrealized Appreciation (Depreciation) | 4,799 |
| Net Increase (Decrease) in Net Assets Resulting from Operations | 6,918 |
| Distributions | |
| Net Investment Income | |
| Investor Shares | (32) |
| ETF Shares | (1,192) |
| Admiral Shares | (563) |
| Realized Capital Gain | |
| Investor Shares | — |
| ETF Shares | — |
| Admiral Shares | — |
| Total Distributions | (1,787) |
| Capital Share Transactions | |
| Investor Shares | 2,884 |
| ETF Shares | 112,659 |
| Admiral Shares | 82,919 |
| Net Increase (Decrease) from Capital Share Transactions | 198,462 |
| Total Increase (Decrease) | 203,593 |
| Net Assets | |
| Beginning of Period | — |
| End of Period2 | 203,593 |
1 Inception.
2 Net Assets—End of Period includes undistributed (overdistributed) net investment income of $555,000.
See accompanying Notes, which are an integral part of the Financial Statements.
47
| |
| International High Dividend Yield Index Fund | |
| |
| |
| Financial Highlights | |
| |
| |
| Investor Shares | |
| | February 25, 20161 to |
| For a Share Outstanding Throughout the Period | October 31, 2016 |
| Net Asset Value, Beginning of Period | $20.00 |
| Investment Operations | |
| Net Investment Income | . 578 2 |
| Net Realized and Unrealized Gain (Loss) on Investments | 2.059 |
| Total from Investment Operations | 2.637 |
| Distributions | |
| Dividends from Net Investment Income | (.397) |
| Distributions from Realized Capital Gains | — |
| Total Distributions | (. 397) |
| Net Asset Value, End of Period | $22.24 |
| |
| Total Return 3 | 13.26% |
| |
| Ratios/Supplemental Data | |
| Net Assets, End of Period (Millions) | $3 |
| Ratio of Expenses to Average Net Assets | 0.42%4,5 |
| Ratio of Net Investment Income to Average Net Assets | 3.55%4 |
| Portfolio Turnover Rate6 | 6% |
1 Inception.
2 Calculated based on average shares outstanding.
3 Total returns do not include account service fees that may have applied in the periods shown. Fund prospectuses provide information about
any applicable account service fees.
4 Annualized.
5 The ratio of total expenses to average net assets before an expense reimbursement of 0.31% was 0.73%. See note B in the Notes to
Financial Statements.
6 Excludes the value of portfolio securities received or delivered as a result of in-kind purchases or redemptions of the fund’s capital shares,
including ETF Creation Units.
See accompanying Notes, which are an integral part of the Financial Statements.
48
| |
| International High Dividend Yield Index Fund | |
| |
| |
| Financial Highlights | |
| |
| |
| ETF Shares | |
| | February 25, 20161 to |
| For a Share Outstanding Throughout the Period | October 31, 2016 |
| Net Asset Value, Beginning of Period | $50.00 |
| Investment Operations | |
| Net Investment Income | 1.323 2 |
| Net Realized and Unrealized Gain (Loss) on Investments | 5.305 |
| Total from Investment Operations | 6.628 |
| Distributions | |
| Dividends from Net Investment Income | (1.018) |
| Distributions from Realized Capital Gains | — |
| Total Distributions | (1.018) |
| Net Asset Value, End of Period | $55.61 |
| |
| Total Return | 13.37% |
| |
| Ratios/Supplemental Data | |
| Net Assets, End of Period (Millions) | $117 |
| Ratio of Expenses to Average Net Assets | 0.32%3,4 |
| Ratio of Net Investment Income to Average Net Assets | 3.65%3 |
| Portfolio Turnover Rate5 | 6% |
1 Inception.
2 Calculated based on average shares outstanding.
3 Annualized.
4 The ratio of total expenses to average net assets before an expense reimbursement of 0.31% was 0.63%. See note B in the Notes to
Financial Statements.
5 Excludes the value of portfolio securities received or delivered as a result of in-kind purchases or redemptions of the fund’s capital shares,
including ETF Creation Units.
See accompanying Notes, which are an integral part of the Financial Statements.
49
| |
| International High Dividend Yield Index Fund | |
| |
| |
| Financial Highlights | |
| |
| |
| Admiral Shares | |
| | March 2, 20161 to |
| For a Share Outstanding Throughout the Period | October 31, 2016 |
| Net Asset Value, Beginning of Period | $25.00 |
| Investment Operations | |
| Net Investment Income | . 597 2 |
| Net Realized and Unrealized Gain (Loss) on Investments | 1.817 |
| Total from Investment Operations | 2.414 |
| Distributions | |
| Dividends from Net Investment Income | (.494) |
| Distributions from Realized Capital Gains | — |
| Total Distributions | (. 494) |
| Net Asset Value, End of Period | $26.92 |
| |
| Total Return 3 | 9.73% |
| |
| Ratios/Supplemental Data | |
| Net Assets, End of Period (Millions) | $84 |
| Ratio of Expenses to Average Net Assets | 0.32%4,5 |
| Ratio of Net Investment Income to Average Net Assets | 3.65%4 |
| Portfolio Turnover Rate6 | 6% |
1 Inception.
2 Calculated based on average shares outstanding.
3 Total returns do not include transaction or account service fees that may have applied in the periods shown. Fund prospectuses provide
information about any applicable transaction and account service fees.
4 Annualized.
5 The ratio of total expenses to average net assets before an expense reimbursement of 0.31% was 0.63%. See note B in the Notes to
Financial Statements.
6 Excludes the value of portfolio securities received or delivered as a result of in-kind purchases or redemptions of the fund’s capital shares,
including ETF Creation Units.
See accompanying Notes, which are an integral part of the Financial Statements.
50
International High Dividend Yield Index Fund
Notes to Financial Statements
Vanguard International High Dividend Yield Index Fund is registered under the Investment Company Act of 1940 as an open-end investment company, or mutual fund. The fund invests in securities of foreign issuers, which may subject it to investment risks not normally associated with investing in securities of U.S. corporations. The fund offers three classes of shares: Investor Shares, ETF Shares, and Admiral Shares. Investor Shares are available to any investor who meets the fund’s minimum purchase requirements. ETF Shares are listed for trading on NYSE Arca; they can be purchased and sold through a broker. Admiral Shares are designed for investors who meet certain administrative, service, and account-size criteria.
A. The following significant accounting policies conform to generally accepted accounting principles for U.S. investment companies. The fund consistently follows such policies in preparing its financial statements.
1. Security Valuation: Securities are valued as of the close of trading on the New York Stock Exchange (generally 4 p.m., Eastern time) on the valuation date. Equity securities are valued at the latest quoted sales prices or official closing prices taken from the primary market in which each security trades; such securities not traded on the valuation date are valued at the mean of the latest quoted bid and asked prices. Securities for which market quotations are not readily available, or whose values have been affected by events occurring before the fund’s pricing time but after the close of the securities’ primary markets, are valued at their fair values calculated according to procedures adopted by the board of trustees. These procedures include obtaining quotations from an independent pricing service, monitoring news to identify significant market- or security-specific events, and evaluating changes in the values of foreign market proxies (for example, ADRs, futures contracts, or exchange-traded funds), between the time the foreign markets close and the fund’s pricing time. When fair-value pricing is employed, the prices of securities used by a fund to calculate its net asset value may differ from quoted or published prices for the same securities. Investments in Vanguard Market Liquidity Fund are valued at that fund’s net asset value.
2. Foreign Currency: Securities and other assets and liabilities denominated in foreign currencies are translated into U.S. dollars using exchange rates obtained from an independent third party as of the fund’s pricing time on the valuation date. Realized gains (losses) and unrealized appreciation (depreciation) on investment securities include the effects of changes in exchange rates since the securities were purchased, combined with the effects of changes in security prices. Fluctuations in the value of other assets and liabilities resulting from changes in exchange rates are recorded as unrealized foreign currency gains (losses) until the assets or liabilities are settled in cash, at which time they are recorded as realized foreign currency gains (losses).
3. Futures and Forward Currency Contracts: The fund uses index futures contracts to a limited extent, with the objectives of maintaining full exposure to the stock market, enhancing returns, maintaining liquidity, and minimizing transaction costs. The fund may purchase futures contracts to immediately invest incoming cash in the market, or sell futures in response to cash outflows, thereby simulating a fully invested position in the underlying index while maintaining a cash balance for liquidity. The fund may seek to enhance returns by using futures contracts instead of the underlying securities when futures are believed to be priced more attractively than the underlying securities. The primary risks associated with the use of futures contracts are imperfect correlation between changes in market values of stocks held by the fund and the prices of futures contracts, and the possibility of an illiquid market. Counterparty risk involving futures is mitigated because a regulated clearinghouse is the
51
International High Dividend Yield Index Fund
counterparty instead of the clearing broker. To further mitigate counterparty risk, the fund trades futures contracts on an exchange, monitors the financial strength of its clearing brokers and clearinghouse, and has entered into clearing agreements with its clearing brokers. The clearinghouse imposes initial margin requirements to secure the fund’s performance and requires daily settlement of variation margin representing changes in the market value of each contract.
The fund also enters into forward currency contracts to provide the appropriate currency exposure related to any open futures contracts. The fund’s risks in using these contracts include movement in the values of the foreign currencies relative to the U.S. dollar and the ability of the counterparties to fulfill their obligations under the contracts. The fund mitigates its counterparty risk by entering into forward currency contracts only with a diverse group of prequalified counterparties, monitoring their financial strength, entering into master netting arrangements with its counterparties, and requiring its counterparties to transfer collateral as security for their performance. In the absence of a default, the collateral pledged or received by the fund cannot be repledged, resold or rehypothecated. The master netting arrangements provide that, in the event of a counterparty’s default (including bankruptcy), the fund may terminate the forward currency contracts, determine the net amount owed by either party in accordance with its master netting arrangements, and sell or retain any collateral held up to the net amount owed to the fund under the master netting arrangements. The forward currency contracts contain provisions whereby a counterparty may terminate open contracts if the fund’s net assets decline below a certain level, triggering a payment by the fund if the fund is in a net liability position at the time of the termination. The payment amount would be reduced by any collateral the fund has pledged. Any assets pledged as collateral for open contracts are noted in the Statement of Net Assets. The value of collateral received or pledged is compared daily to the value of the forward currency contracts exposure with each counterparty, and any difference, if in excess of a specified minimum transfer amount, is adjusted and settled within two business days. The fund had no open forward currency contracts at October 31, 2016.
Futures contracts are valued at their quoted daily settlement prices. Forward currency contracts are valued at their quoted daily prices obtained from an independent third party, adjusted for currency risk based on the expiration date of each contract. The aggregate settlement values and notional amounts of the contracts are not recorded in the Statement of Assets and Liabilities. Fluctuations in the value of the contracts are recorded in the Statement of Assets and Liabilities as an asset (liability) and in the Statement of Operations as unrealized appreciation (depreciation) until the contracts are closed, when they are recorded as realized gains (losses) on futures or forward currency contracts.
During the year ended October 31, 2016, the fund’s average investments in long and short futures contracts represented less than 1% and 0% of net assets, respectively, based on the average of aggregate settlement values at each quarter-end during the period. The fund’s average investment in forward currency contracts represented less than 1% of net assets, based on the average of notional amounts at each quarter-end during the period.
4. Federal Income Taxes: The fund intends to qualify as a regulated investment company and distribute all of its taxable income. Management has analyzed the fund’s tax positions taken for its open federal income tax year ended October 31, 2016, and has concluded that no provision for federal income tax is required in the fund’s financial statements.
5. Distributions: Distributions to shareholders are recorded on the ex-dividend date.
52
International High Dividend Yield Index Fund
6. Securities Lending: To earn additional income, the fund lends its securities to qualified institutional borrowers. Security loans are subject to termination by the fund at any time, and are required to be secured at all times by collateral in an amount at least equal to the market value of securities loaned. Daily market fluctuations could cause the value of loaned securities to be more or less than the value of the collateral received. When this occurs, the collateral is adjusted and settled on the next business day. The fund further mitigates its counterparty risk by entering into securities lending transactions only with a diverse group of prequalified counterparties, monitoring their financial strength, and entering into master securities lending agreements with its counterparties. The master securities lending agreements provide that, in the event of a counterparty’s default (including bankruptcy), the fund may terminate any loans with that borrower, determine the net amount owed, and sell or retain the collateral up to the net amount owed to the fund; however, such actions may be subject to legal proceedings. While collateral mitigates counterparty risk, in the absence of a default the fund may experience delays and costs in recovering the securities loaned. The fund invests cash collateral received in Vanguard Market Liquidity Fund, and records a liability in the Statement of Assets and Liabilities for the return of the collateral, during the period the securities are on loan. Securities lending income represents fees charged to borrowers plus income earned on invested cash collateral, less expenses associated with the loan. During the term of the loan, the fund is entitled to all distributions made on or in respect of the loaned securities.
7. Credit Facility: The fund and certain other funds managed by The Vanguard Group (“Vanguard”) participate in a $3.1 billion committed credit facility provided by a syndicate of lenders pursuant to a credit agreement that may be renewed annually; each fund is individually liable for its borrowings, if any, under the credit facility. Borrowings may be utilized for temporary and emergency purposes, and are subject to the fund’s regulatory and contractual borrowing restrictions. The participating funds are charged administrative fees and an annual commitment fee of 0.10% of the undrawn amount of the facility; these fees are allocated to the funds based on a method approved by the fund’s board of trustees and included in Management and Administrative expenses on the fund’s Statement of Operations. Any borrowings under this facility bear interest at a rate based upon the higher of the one-month London Interbank Offered Rate, federal funds effective rate, or overnight bank funding rate plus an agreed-upon spread.
The fund had no borrowings outstanding at October 31, 2016, or at any time during the period then ended.
8. Other: Dividend income is recorded on the ex-dividend date. Interest income includes income distributions received from Vanguard Market Liquidity Fund and is accrued daily. Security transactions are accounted for on the date securities are bought or sold. Costs used to determine realized gains (losses) on the sale of investment securities are those of the specific securities sold.
Each class of shares has equal rights as to assets and earnings, except that each class separately bears certain class-specific expenses related to maintenance of shareholder accounts (included in Management and Administrative expenses) and shareholder reporting. Marketing and distribution expenses are allocated to each class of shares based on a method approved by the board of trustees. Income, other non-class-specific expenses, and gains and losses on investments are allocated to each class of shares based on its relative net assets.
53
International High Dividend Yield Index Fund
B. In accordance with the terms of a Funds’ Service Agreement (the “FSA”) between Vanguard and the fund, Vanguard furnishes to the fund investment advisory, corporate management, administrative, marketing, and distribution services at Vanguard’s cost of operations (as defined by the FSA). These costs of operations are allocated to the fund based on methods and guidelines approved by the board of trustees. Vanguard does not require reimbursement in the current period for certain costs of operations (such as deferred compensation/benefits and risk/insurance costs); the fund’s liability for these costs of operations is included in Payables to Vanguard on the Statement of Assets and Liabilities.
Upon the request of Vanguard, the fund may invest up to 0.40% of its net assets as capital in Vanguard. At October 31, 2016, the fund had contributed to Vanguard capital in the amount of $13,000, representing 0.01% of the fund’s net assets and 0.01% of Vanguard’s capitalization. The fund’s trustees and officers are also directors and employees, respectively, of Vanguard.
The fund incurred higher than anticipated custody costs because of a higher volume of securities transactions, which included transactions from a rebalance of the benchmark index shortly after the fund’s inception. Because of these factors, Vanguard has agreed to reimburse the fund for the unanticipated custody costs, in the amount of $294,000 (an effective annual rate of 0.31% of the fund’s average net assets); the fund is not obligated to repay this amount to Vanguard.
C. Various inputs may be used to determine the value of the fund’s investments. These inputs are summarized in three broad levels for financial statement purposes. The inputs or methodologies used to value securities are not necessarily an indication of the risk associated with investing in those securities.
Level 1—Quoted prices in active markets for identical securities.
Level 2—Other significant observable inputs (including quoted prices for similar securities, interest rates, prepayment speeds, credit risk, etc.).
Level 3—Significant unobservable inputs (including the fund’s own assumptions used to determine the fair value of investments).
The following table summarizes the market value of the fund’s investments as of October 31, 2016, based on the inputs used to value them:
| | | |
| | Level 1 | Level 2 | Level 3 |
| Investments | ($000) | ($000) | ($000) |
| Common Stocks—North and South America | 20,847 | 336 | — |
| Common Stocks—Other | 634 | 179,737 | — |
| Temporary Cash Investments | 22,774 | — | — |
| Futures Contracts— Liabilities1 | (3) | — | — |
| Total | 44,252 | 180,073 | — |
| 1 Represents variation margin on the last day of the reporting period for recently closed futures contracts. |
D. At October 31, 2016, the fair values of derivatives were reflected in the Statement of Assets and Liabilities as follows:
| | | |
| | | Foreign | |
| | Equity | Exchange | |
| | Contracts | Contracts | Total |
| Statement of Assets and Liabilities Caption | ($000) | ($000) | ($000) |
| Other Liabilities | (3) | — | (3) |
54
International High Dividend Yield Index Fund
Realized net gain (loss) and the change in unrealized appreciation (depreciation) on derivatives for the year ended October 31, 2016, were:
| | | |
| | | Foreign | |
| | Equity | Exchange | |
| | Contracts | Contracts | Total |
| Realized Net Gain (Loss) on Derivatives | ($000) | ($000) | ($000) |
| Futures Contracts | (91) | — | (91) |
| Forward Currency Contracts | — | (1) | (1) |
| Realized Net Gain (Loss) on Derivatives | (91) | (1) | (92) |
| |
| Change in Unrealized Appreciation (Depreciation) on Derivatives | | | |
| Futures Contracts | (4) | — | (4) |
| Forward Currency Contracts | — | — | — |
| Change in Unrealized Appreciation (Depreciation) on Derivatives | (4) | — | (4) |
E. At October 31, 2016, the aggregate settlement value of open futures contracts and the related unrealized appreciation (depreciation) were:
| | | | |
| | | | | ($000) |
| | | | Aggregate | |
| | | Number of | Settlement | Unrealized |
| | | Long (Short) | Value | Appreciation |
| Futures Contracts | Expiration | Contracts | Long (Short) | (Depreciation) |
| E-mini S&P 500 Index | December 2016 | 20 | 2,120 | (4) |
Unrealized appreciation (depreciation) on open futures contracts is required to be treated as realized gain (loss) for tax purposes.
F. Distributions are determined on a tax basis and may differ from net investment income and realized capital gains for financial reporting purposes. Differences may be permanent or temporary. Permanent differences are reclassified among capital accounts in the financial statements to reflect their tax character. Temporary differences arise when certain items of income, expense, gain, or loss are recognized in different periods for financial statement and tax purposes. These differences will reverse at some time in the future. Differences in classification may also result from the treatment of short-term gains as ordinary income for tax purposes.
During the period ended October 31, 2016, the fund realized net foreign currency losses of $3,000, which decreased distributable net income for tax purposes; accordingly, such losses have been reclassified from accumulated net realized losses to undistributed net investment income.
For tax purposes, at October 31, 2016, the fund had $587,000 of ordinary income available for distribution. The fund had available capital losses totaling $227,000 that may be carried forward indefinitely to offset future net capital gains.
55
International High Dividend Yield Index Fund
At October 31, 2016, the cost of investment securities for tax purposes was $219,618,000. Net unrealized appreciation of investment securities for tax purposes was $4,710,000, consisting of unrealized gains of $9,571,000 on securities that had risen in value since their purchase and $4,861,000 in unrealized losses on securities that had fallen in value since their purchase.
G. During the year ended October 31, 2016, the fund purchased $202,802,000 of investment securities and sold $5,855,000 of investment securities, other than temporary cash investments. Purchases and sales include $104,903,000 and $0, respectively, in connection with in-kind purchases and redemptions of the fund’s capital shares.
| | |
| H. Capital share transactions for each class of shares were: | | |
| | | Year Ended |
| | October 31, 2016 |
| | Amount | Shares |
| | ($000) | (000) |
| Investor Shares1 | | |
| Issued | 4,632 | 214 |
| Issued in Lieu of Cash Distributions | 29 | 1 |
| Redeemed | (1,777) | (82) |
| Net Increase (Decrease)—Investor Shares | 2,884 | 133 |
| ETF Shares1 | | |
| Issued | 112,659 | 2,100 |
| Issued in Lieu of Cash Distributions | — | — |
| Redeemed | — | — |
| Net Increase (Decrease)—ETF Shares | 112,659 | 2,100 |
| Admiral Shares2 | | |
| Issued | 90,853 | 3,415 |
| Issued in Lieu of Cash Distributions | 352 | 13 |
| Redeemed | (8,286) | (313) |
| Net Increase (Decrease) —Admiral Shares | 82,919 | 3,115 |
| 1 Inception was February 25, 2016, for Investor Shares and ETF Shares. |
| 2 Inception was March 2, 2016, for Admiral Shares. |
I. Management has determined that no material events or transactions occurred subsequent to October 31, 2016, that would require recognition or disclosure in these financial statements.
56
Report of Independent Registered Public Accounting Firm
To the Board of Trustees of Vanguard Whitehall Funds and the Shareholders of Vanguard International Dividend Appreciation Index Fund and Vanguard International High Dividend Yield Index Fund: In our opinion, the accompanying statements of net assets, statements of assets and liabilities and the related statements of operations and of changes in net assets and the financial highlights present fairly, in all material respects, the financial position of Vanguard International Dividend Appreciation Index Fund and Vanguard International High Dividend Yield Index Fund (constituting separate portfolios of Vanguard Whitehall Funds, hereafter referred to as the “Funds”) at October 31, 2016, and the results of each of their operations and the changes in each of their net assets for the period from February 25, 2016 (commencement of operations) through October 31, 2016, and the financial highlights for each of the periods indicated, in conformity with accounting principles generally accepted in the United States of America. These financial statements and financial highlights (hereafter referred to as “financial statements”) are the responsibility of the Funds’ management. Our responsibility is to express an opinion on these financial statements based on our audits. We conducted our audits of these financial statements in accordance with the standards of the Public Company Accounting Oversight Board (United States). Those standards require that we plan and perform the audit to obtain reasonable assurance about whether the financial statements are free of material misstatement. An audit includes examining, on a test basis, evidence supporting the amounts and disclosures in the financial statements, assessing the accounting principles used and significant estimates made by management, and evaluating the overall financial statement presentation. We believe that our audits, which included confirmation of securities at October 31, 2016 by correspondence with the custodian and brokers and by agreement to the underlying ownership records of the transfer agent, provide a reasonable basis for our opinion.
/s/PricewaterhouseCoopers LLP
Philadelphia, Pennsylvania
December 15, 2016
57
Special 2016 tax information (unaudited) for Vanguard International Dividend Appreciation Fund
This information for the fiscal year ended October 31, 2016, is included pursuant to provisions of the Internal Revenue Code.
The fund distributed $838,000 of qualified dividend income to shareholders during the fiscal year.
The fund designates to shareholders foreign source income of $1,522,000 and foreign taxes paid of $115,000. Shareholders will receive more detailed information with their Form 1099-DIV in January 2017 to determine the calendar-year amounts to be included on their 2016 tax returns.
Special 2016 tax information (unaudited) for Vanguard International High Dividend Yield Index Fund
This information for the fiscal year ended October 31, 2016, is included pursuant to provisions of the Internal Revenue Code.
The fund distributed $1,493,000 of qualified dividend income to shareholders during the fiscal year.
The fund designates to shareholders foreign source income of $2,658,000 and foreign taxes paid of $208,000. Shareholders will receive more detailed information with their Form 1099-DIV in January 2017 to determine the calendar-year amounts to be included on their 2016 tax returns.
58
About Your Fund’s Expenses
As a shareholder of the fund, you incur ongoing costs, which include costs for portfolio management, administrative services, and shareholder reports (like this one), among others. Operating expenses, which are deducted from a fund’s gross income, directly reduce the investment return of the fund.
A fund’s expenses are expressed as a percentage of its average net assets. This figure is known as the expense ratio. The following examples are intended to help you understand the ongoing costs (in dollars) of investing in your fund and to compare these costs with those of other mutual funds. The examples are based on an investment of $1,000 made at the beginning of the period shown and held for the entire period.
The accompanying table illustrates your fund’s costs in two ways:
• Based on actual fund return. This section helps you to estimate the actual expenses that you paid over the period. The ”Ending Account Value“ shown is derived from the fund‘s actual return, and the third column shows the dollar amount that would have been paid by an investor who started with $1,000 in the fund. You may use the information here, together with the amount you invested, to estimate the expenses that you paid over the period.
To do so, simply divide your account value by $1,000 (for example, an $8,600 account value divided by $1,000 = 8.6), then multiply the result by the number given for your fund under the heading ”Expenses Paid During Period.“
• Based on hypothetical 5% yearly return. This section is intended to help you compare your fund‘s costs with those of other mutual funds. It assumes that the fund had a yearly return of 5% before expenses, but that the expense ratio is unchanged. In this case—because the return used is not the fund’s actual return—the results do not apply to your investment. The example is useful in making comparisons because the Securities and Exchange Commission requires all mutual funds to calculate expenses based on a 5% return. You can assess your fund’s costs by comparing this hypothetical example with the hypothetical examples that appear in shareholder reports of other funds.
Note that the expenses shown in the table are meant to highlight and help you compare ongoing costs only and do not reflect transaction costs incurred by the fund for buying and selling securities. Further, the expenses do not include any purchase, redemption, or account service fees described in the fund prospectus. If such fees were applied to your account, your costs would be higher. Your fund does not carry a “sales load.”
The calculations assume no shares were bought or sold during the period. Your actual costs may have been higher or lower, depending on the amount of your investment and the timing of any purchases or redemptions.
You can find more information about the fund’s expenses, including annual expense ratios, in the Financial Statements section of this report. For additional information on operating expenses and other shareholder costs, please refer to your fund’s current prospectus.
59
| | | |
| Six Months Ended October 31, 2016 | | | |
| | Beginning | Ending | Expenses |
| | Account Value | Account Value | Paid During |
| | 4/30/2016 | 10/31/2016 | Period |
| Based on Actual Fund Return | | | |
| International Dividend Appreciation Index Fund | | | |
| Investor Shares | $1,000.00 | $1,003.93 | $1.21 |
| ETF Shares | 1,000.00 | 1,004.26 | 0.86 |
| Admiral Shares | 1,000.00 | 1,004.27 | 0.86 |
| International High Dividend Yield Index Fund | | | |
| Investor Shares | $1,000.00 | $1,018.75 | $1.47 |
| ETF Shares | 1,000.00 | 1,019.73 | 1.12 |
| Admiral Shares | 1,000.00 | 1,019.33 | 1.12 |
| Based on Hypothetical 5% Yearly Return | | | |
| International Dividend Appreciation Index Fund | | | |
| Investor Shares | $1,000.00 | $1,023.93 | $1.22 |
| ETF Shares | 1,000.00 | 1,024.28 | 0.87 |
| Admiral Shares | 1,000.00 | 1,024.28 | 0.87 |
| International High Dividend Yield Index Fund | | | |
| Investor Shares | $1,000.00 | $1,023.68 | $1.48 |
| ETF Shares | 1,000.00 | 1,024.03 | 1.12 |
| Admiral Shares | 1,000.00 | 1,024.03 | 1.12 |
The calculations are based on expenses incurred in the most recent six-month period. The funds’ annualized six-month expense ratios for that period are: for the International Dividend Appreciation Index Fund, 0.24% for Investor Shares, 0.17% for ETF Shares, and 0.17% for Admiral Shares; and for the International High Dividend Yield Index Fund, 0.29% for Investor Shares, 0.22% for ETF Shares, and 0.22% for Admiral Shares. The dollar amounts shown as “Expenses Paid” are equal to the annualized expense ratio multiplied by the average account value over the period, multiplied by the number of days in the six-month period, then divided by the number of days in the most recent 12-month period (184/366).
60
Glossary
Dividend Yield. Dividend income earned by stocks, expressed as a percentage of the aggregate market value (or of net asset value, for a fund). The yield is determined by dividing the amount of the annual dividends by the aggregate value (or net asset value) at the end of the period. For a fund, the dividend yield is based solely on stock holdings and does not include any income produced by other investments.
Earnings Growth Rate. The average annual rate of growth in earnings over the past five years for the stocks now in a fund.
Equity Exposure. A measure that reflects a fund’s investments in stocks and stock futures. Any holdings in short-term reserves are excluded.
Expense Ratio. A fund’s total annual operating expenses expressed as a percentage of the fund’s average net assets. The expense ratio includes management and administrative expenses, but does not include the transaction costs of buying and selling portfolio securities.
Fair-Value Pricing. Fair-value adjustments, which are required by the Securities and Exchange Commission, address pricing discrepancies that may arise because of time-zone differences among global stock markets. Foreign stocks may trade on exchanges that close many hours before a fund’s closing share price is calculated in the United States, generally at 4 p.m., Eastern time. In the hours between the foreign close and the U.S. close, the value of these foreign securities may change—because of company-specific announcements or market-wide developments, for example. Such price changes are not immediately reflected in international index values. Fair-value pricing takes such changes into account in calculating the fund’s daily net asset value, thus ensuring that the NAV doesn’t include “stale” prices. The result can be a temporary divergence between the return of the fund and that of its benchmark index—a difference that usually corrects itself when the foreign markets reopen.
Inception Date. The date on which the assets of a fund (or one of its share classes) are first invested in accordance with the fund’s investment objective. For funds with a subscription period, the inception date is the day after that period ends. Investment performance is measured from the inception date.
Median Market Cap. An indicator of the size of companies in which a fund invests; the midpoint of market capitalization (market price x shares outstanding) of a fund’s stocks, weighted by the proportion of the fund’s assets invested in each stock. Stocks representing half of the fund’s assets have market capitalizations above the median, and the rest are below it.
Price/Book Ratio. The share price of a stock divided by its net worth, or book value, per share. For a fund, the weighted average price/book ratio of the stocks it holds.
Price/Earnings Ratio. The ratio of a stock’s current price to its per-share earnings over the past year. For a fund, the weighted average P/E of the stocks it holds. P/E is an indicator of market expectations about corporate prospects; the higher the P/E, the greater the expectations for a company’s future growth.
Return on Equity. The annual average rate of return generated by a company during the past five years for each dollar of shareholder’s equity (net income divided by shareholder’s equity). For a fund, the weighted average return on equity for the companies whose stocks it holds.
61
Short-Term Reserves. The percentage of a fund invested in highly liquid, short-term securities that can be readily converted to cash.
Turnover Rate. An indication of the fund’s trading activity. Funds with high turnover rates incur higher transaction costs and may be more likely to distribute capital gains (which may be taxable to investors). The turnover rate excludes in-kind transactions, which have minimal impact on costs.
62
This page intentionally left blank.
The People Who Govern Your Fund
The trustees of your mutual fund are there to see that the fund is operated and managed in your best interests since, as a shareholder, you are a part owner of the fund. Your fund’s trustees also serve on the board of directors of The Vanguard Group, Inc., which is owned by the Vanguard funds and provides services to them on an at-cost basis.
A majority of Vanguard’s board members are independent, meaning that they have no affiliation with Vanguard or the funds they oversee, apart from the sizable personal investments they have made as private individuals. The independent board members have distinguished backgrounds in business, academia, and public service. Each of the trustees and executive officers oversees 198 Vanguard funds.
The following table provides information for each trustee and executive officer of the fund. The mailing address of the trustees and officers is P.O. Box 876, Valley Forge, PA 19482. More information about the trustees is in the Statement of Additional Information, which can be obtained, without charge, by contacting Vanguard at 800-662-7447, or online at vanguard.com.
Interested Trustee1
F. William McNabb III
Born 1957. Trustee Since July 2009. Chairman of the Board. Principal Occupation(s) During the Past Five Years and Other Experience: Chairman of the Board of The Vanguard Group, Inc., and of each of the investment companies served by The Vanguard Group, since January 2010; Director of The Vanguard Group since 2008; Chief Executive Officer and President of The Vanguard Group, and of each of the investment companies served by The Vanguard Group, since 2008; Director of Vanguard Marketing Corporation; Managing Director of The Vanguard Group (1995–2008).
Independent Trustees
Emerson U. Fullwood
Born 1948. Trustee Since January 2008. Principal Occupation(s) During the Past Five Years and Other Experience: Executive Chief Staff and Marketing Officer for North America and Corporate Vice President (retired 2008) of Xerox Corporation (document management products and services); Executive in Residence and 2009–2010 Distinguished Minett Professor at the Rochester Institute of Technology; Lead Director of SPX FLOW, Inc. (multi-industry manufacturing); Director of the United Way of Rochester, the University of Rochester Medical Center, Monroe Community College Foundation, North Carolina A&T University, and Roberts Wesleyan College.
Rajiv L. Gupta
Born 1945. Trustee Since December 2001.2 Principal Occupation(s) During the Past Five Years and Other Experience: Chairman and Chief Executive Officer (retired 2009) and President (2006–2008) of Rohm and Haas Co. (chemicals); Director of Tyco International plc (diversified manufacturing and services), HP Inc. (printer and personal computer manufacturing), and Delphi Automotive plc (automotive components); Senior Advisor at New Mountain Capital.
Amy Gutmann
Born 1949. Trustee Since June 2006. Principal Occupation(s) During the Past Five Years and Other Experience: President of the University of Pennsylvania; Christopher H. Browne Distinguished Professor of Political Science, School of Arts and Sciences, and Professor of Communication, Annenberg School for Communication, with secondary faculty appointments in the Department of Philosophy, School of Arts and Sciences, and at the Graduate School of Education, University of Pennsylvania; Trustee of the National Constitution Center; Chair of the Presidential Commission for the Study of Bioethical Issues.
JoAnn Heffernan Heisen
Born 1950. Trustee Since July 1998. Principal Occupation(s) During the Past Five Years and Other Experience: Corporate Vice President and Chief Global Diversity Officer (retired 2008) and Member of the Executive Committee (1997–2008) of Johnson & Johnson (pharmaceuticals/medical devices/consumer products); Director of Skytop Lodge Corporation (hotels) and the Robert Wood Johnson Foundation; Member of the Advisory Board of the Institute for Women’s Leadership at Rutgers University.
F. Joseph Loughrey
Born 1949. Trustee Since October 2009. Principal Occupation(s) During the Past Five Years and Other Experience: President and Chief Operating Officer (retired 2009) of Cummins Inc. (industrial machinery); Chairman of the Board of Hillenbrand, Inc. (specialized consumer services), and of Oxfam America; Director of SKF AB (industrial machinery), Hyster-Yale Materials Handling, Inc. (forklift trucks), the Lumina Foundation for Education, and the V Foundation for Cancer Research; Member of the Advisory Council for the College of Arts and Letters and of the Advisory Board to the Kellogg Institute for International Studies, both at the University of Notre Dame.
Mark Loughridge
Born 1953. Trustee Since March 2012. Principal Occupation(s) During the Past Five Years and Other Experience: Senior Vice President and Chief Financial Officer (retired 2013) at IBM (information technology services); Fiduciary Member of IBM’s Retirement Plan Committee (2004–2013); Director of the Dow Chemical Company; Member of the Council on Chicago Booth.
Scott C. Malpass
Born 1962. Trustee Since March 2012. Principal Occupation(s) During the Past Five Years and Other Experience: Chief Investment Officer and Vice President at the University of Notre Dame; Assistant Professor of Finance at the Mendoza College of Business at Notre Dame; Member of the Notre Dame 403(b) Investment Committee, the Board of Advisors for Spruceview Capital Partners, and the Investment Advisory Committee of Major League Baseball; Board Member of TIFF Advisory Services, Inc., and Catholic Investment Services, Inc. (investment advisors).
André F. Perold
Born 1952. Trustee Since December 2004. Principal Occupation(s) During the Past Five Years and Other Experience: George Gund Professor of Finance and Banking, Emeritus at the Harvard Business School (retired 2011); Chief Investment Officer and Managing Partner of HighVista Strategies LLC (private investment firm); Director of Rand Merchant Bank; Overseer of the Museum of Fine Arts Boston.
Peter F. Volanakis
Born 1955. Trustee Since July 2009. Principal Occupation(s) During the Past Five Years and Other Experience: President and Chief Operating Officer (retired 2010) of Corning Incorporated (communications equipment); Chairman of the Board of Trustees of Colby-Sawyer College; Member of the Advisory Board of the Norris Cotton Cancer Center.
Executive Officers
Glenn Booraem
Born 1967. Treasurer Since May 2015. Principal Occupation(s) During the Past Five Years and Other Experience: Principal of The Vanguard Group, Inc.; Treasurer of each of the investment companies served by The Vanguard Group; Controller of each of the investment companies served by The Vanguard Group (2010–2015); Assistant Controller of each of the investment companies served by The Vanguard Group (2001–2010).
Thomas J. Higgins
Born 1957. Chief Financial Officer Since September 2008. Principal Occupation(s) During the Past Five Years and Other Experience: Principal of The Vanguard Group, Inc.; Chief Financial Officer of each of the investment companies served by The Vanguard Group; Treasurer of each of the investment companies served by The Vanguard Group (1998–2008).
Peter Mahoney
Born 1974. Controller Since May 2015. Principal Occupation(s) During the Past Five Years and Other Experience: Head of Global Fund Accounting at The Vanguard Group, Inc.; Controller of each of the investment companies served by The Vanguard Group; Head of International Fund Services at The Vanguard Group (2008–2014).
Anne E. Robinson
Born 1970. Secretary Since September 2016. Principal Occupation(s) During the Past Five Years and Other Experience: Managing Director of The Vanguard Group, Inc.; General Counsel of The Vanguard Group; Secretary of The Vanguard Group and of each of the investment companies served by The Vanguard Group; Director and Senior Vice President of Vanguard Marketing Corporation; Managing Director and General Counsel of Global Cards and Consumer Services at Citigroup (2014–2016); Counsel at American Express (2003–2014).
Vanguard Senior Management Team
| |
| Mortimer J. Buckley | James M. Norris |
| Kathleen C. Gubanich | Thomas M. Rampulla |
| Martha G. King | Glenn W. Reed |
| John T. Marcante | Karin A. Risi |
| Chris D. McIsaac | Michael Rollings |
Chairman Emeritus and Senior Advisor
John J. Brennan
Chairman, 1996–2009
Chief Executive Officer and President, 1996–2008
Founder
John C. Bogle
Chairman and Chief Executive Officer, 1974–1996
1 Mr. McNabb is considered an “interested person,” as defined in the Investment Company Act of 1940, because he is an officer of the Vanguard funds.
2 December 2002 for Vanguard Equity Income Fund, the Vanguard Municipal Bond Funds, and the Vanguard State Tax-Exempt Funds.
| |
| |
|  |
Connect with Vanguard® > vanguard.com | P.O. Box 2600
Valley Forge, PA 19482-2600 |
| |
| Fund Information > 800-662-7447 | |
| |
| Direct Investor Account Services > 800-662-2739 | “Dividend Achievers” is a trademark of The NASDAQ |
| OMX Group, Inc. (collectively, with its affiliates |
| Institutional Investor Services > 800-523-1036 | “NASDAQ OMX”), and has been licensed for use by The |
| Vanguard Group, Inc. Vanguard mutual funds are not |
| Text Telephone for People | sponsored, endorsed, sold, or promoted by NASDAQ |
| Who Are Deaf or Hard of Hearing> 800-749-7273 | OMX and NASDAQ OMX makes no representation |
| | regarding the advisability of investing in the funds. |
| This material may be used in conjunction | NASDAQ OMX makes no warranties and bears no |
| with the offering of shares of any Vanguard | liability with respect to the Vanguard mutual funds. |
| fund only if preceded or accompanied by | London Stock Exchange Group companies include FTSE |
| the fund’s current prospectus. | International Limited (”FTSE”), Frank Russell Company |
| | (”Russell”), MTS Next Limited (”MTS”), and FTSE TMX |
| All comparative mutual fund data are from Lipper, a | Global Debt Capital Markets Inc. (”FTSE TMX”). All |
| Thomson Reuters Company, or Morningstar, Inc., unless | rights reserved. ”FTSE®”, ”Russell®”, ”MTS®”, ”FTSE |
| otherwise noted. | TMX®” and ”FTSE Russell” and other service marks |
| You can obtain a free copy of Vanguard’s proxy voting | and trademarks related to the FTSE or Russell indexes |
| guidelines by visiting vanguard.com/proxyreporting or by | are trademarks of the London Stock Exchange Group |
| calling Vanguard at 800-662-2739. The guidelines are | companies and are used by FTSE, MTS, FTSE TMX and |
| also available from the SEC’s website, sec.gov. In | Russell under licence. All information is provided for |
| addition, you may obtain a free report on how your fund | information purposes only. No responsibility or liability |
| voted the proxies for securities it owned during the 12 | can be accepted by the London Stock Exchange Group |
| months ended June 30. To get the report, visit either | companies nor its licensors for any errors or for any |
| vanguard.com/proxyreporting or sec.gov. | loss from use of this publication. Neither the London |
| | Stock Exchange Group companies nor any of its |
| You can review and copy information about your fund at | licensors make any claim, prediction, warranty or |
| the SEC’s Public Reference Room in Washington, D.C. To | representation whatsoever, expressly or impliedly, |
| find out more about this public service, call the SEC at | either as to the results to be obtained from the use of |
| 202-551-8090. Information about your fund is also | the FTSE Indexes or the fitness or suitability of the |
| available on the SEC’s website, and you can receive | Indexes for any particular purpose to which they might |
| copies of this information, for a fee, by sending a | be put. |
| request in either of two ways: via email addressed to | |
| publicinfo@sec.gov or via regular mail addressed to the | |
| Public Reference Section, Securities and Exchange | |
| Commission, Washington, DC 20549-1520. | |
| |
| | © 2016 The Vanguard Group, Inc. |
| | All rights reserved. |
| | Vanguard Marketing Corporation, Distributor. |
| |
| | Q20150 122016 |
Item 2: Code of Ethics. The Registrant has adopted a code of ethics that applies to the Registrant’s principal executive officer, principal financial officer, principal accounting officer or controller or persons performing similar functions. The Code of Ethics was amended during the reporting period covered by this report to make certain technical, non-material changes.
Item 3: Audit Committee Financial Expert. All members of the Audit Committee have been determined by the Registrant’s Board of Trustees to be Audit Committee Financial Experts and to be independent: Rajiv L. Gupta, JoAnn Heffernan Heisen, F. Joseph Loughrey, Mark Loughridge, and Peter F. Volanakis.
Item 4: Principal Accountant Fees and Services.
(a) Audit Fees.
Audit Fees of the Registrant
Fiscal Year Ended October 31, 2016: $277,000
Fiscal Year Ended October 31, 2015: $224,000
Aggregate Audit Fees of Registered Investment Companies in the Vanguard Group.
Fiscal Year Ended October 31, 2016: $9,629,849
Fiscal Year Ended October 31, 2015: $7,000,200
Includes fees billed in connection with audits of the Registrant, other registered investment companies in the Vanguard complex, The Vanguard Group, Inc. and Vanguard Marketing Corporation.
(b) Audit-Related Fees.
Fiscal Year Ended October 31, 2016: $2,717,627
Fiscal Year Ended October 31, 2015: $2,899,096
Includes fees billed in connection with assurance and related services provided to the Registrant, other registered investment companies in the Vanguard complex, The Vanguard Group, Inc., and Vanguard Marketing Corporation.
(c) Tax Fees.
Fiscal Year Ended October 31, 2016: $254,050
Fiscal Year Ended October 31, 2015: $353,389
Includes fees billed in connection with tax compliance, planning, and advice services provided to the Registrant, other registered investment companies in the Vanguard complex, The Vanguard Group, Inc., and Vanguard Marketing Corporation.
(d) All Other Fees.
Fiscal Year Ended October 31, 2016: $214,225
Fiscal Year Ended October 31, 2015: $202,313
Includes fees billed for services related to tax reported information provided to the Registrant, other registered investment companies in the Vanguard complex, The Vanguard Group, Inc., and Vanguard Marketing Corporation.
(e) (1) Pre-Approval Policies. The policy of the Registrant’s Audit Committee is to consider and, if appropriate, approve before the principal accountant is engaged for such services, all specific audit and non-audit services provided to: the Registrant, other registered investment companies in the Vanguard complex, The Vanguard Group, Inc., and entities controlled by The Vanguard Group, Inc. that provide ongoing services to the Registrant. In making a determination, the Audit Committee considers whether the services are consistent with maintaining the principal accountant’s independence.
In the event of a contingency situation in which the principal accountant is needed to provide services in between scheduled Audit Committee meetings, the Chairman of the Audit Committee would be called on to consider and, if appropriate, pre-approve audit or permitted non-audit services in an amount sufficient to complete services through the next Audit Committee meeting, and to determine if such services would be consistent with maintaining the accountant’s independence. At the next scheduled Audit Committee meeting, services and fees would be presented to the Audit Committee for formal consideration, and, if appropriate, approval by the entire Audit Committee. The Audit Committee would again consider whether such services and fees are consistent with maintaining the principal accountant’s independence.
The Registrant’s Audit Committee is informed at least annually of all audit and non-audit services provided by the principal accountant to the Vanguard complex, whether such services are provided to: the Registrant, other registered investment companies in the Vanguard complex, The Vanguard Group, Inc., or other entities controlled by The Vanguard Group, Inc. that provide ongoing services to the Registrant.
(2) No percentage of the principal accountant’s fees or services were approved pursuant to the waiver provision of paragraph (c)(7)(i)(C) of Rule 2-01 of Regulation S-X.
(f) For the most recent fiscal year, over 50% of the hours worked under the principal accountant’s engagement were not performed by persons other than full-time, permanent employees of the principal accountant.
(g) Aggregate Non-Audit Fees.
Fiscal Year Ended October 31, 2016: $468,275
Fiscal Year Ended October 31, 2015: $555,702
Includes fees billed for non-audit services provided to the Registrant, other registered investment companies in the Vanguard complex, The Vanguard Group, Inc., and Vanguard Marketing Corporation.
(h) For the most recent fiscal year, the Audit Committee has determined that the provision of all non-audit services was consistent with maintaining the principal accountant’s independence.
Item 5: Audit Committee of Listed Registrants.
The Registrant is a listed issuer as defined in rule 10A-3 under the Securities Exchange Act of 1934 (“Exchange Act”). The Registrant has a separately-designated standing audit committee established in accordance with Section 3(a)(58)(A) of the Exchange Act. The Registrant’s audit committee members are: Rajiv L. Gupta, JoAnn Heffernan Heisen, F. Joseph Loughrey, Mark Loughridge, and Peter F. Volanakis.
Item 6: Investments.
Not Applicable.
Item 7: Disclosure of Proxy Voting Policies and Procedures for Closed-End Management
Investment Companies.
Not Applicable.
Item 8: Portfolio Managers of Closed-End Management Investment Companies.
Not Applicable.
Item 9: Purchase of Equity Securities by Closed-End Management Investment Company and
Affiliated Purchasers.
Not Applicable.
Item 10: Submission of Matters to a Vote of Security Holders.
Not Applicable.
Item 11: Controls and Procedures.
(a) Disclosure Controls and Procedures. The Principal Executive and Financial Officers concluded that the Registrant’s Disclosure Controls and Procedures are effective based on their evaluation of the Disclosure Controls and Procedures as of a date within 90 days of the filing date of this report.
(b) Internal Control Over Financial Reporting. There were no significant changes in Registrant’s Internal Control Over Financial Reporting or in other factors that could significantly affect this control subsequent to the date of the evaluation, including any corrective actions with regard to significant deficiencies and material weaknesses.
Item 12: Exhibits.
(a) Code of Ethics.
(b) Certifications.
Pursuant to the requirements of the Securities Exchange Act of 1934 and the Investment Company Act of 1940, the registrant has duly caused this report to be signed on its behalf by the undersigned, thereunto duly authorized.
| |
| | VANGUARD WHITEHALL FUNDS |
| |
| |
| BY: | /s/ F. WILLIAM MCNABB III* |
| | F. WILLIAM MCNABB III |
| | CHIEF EXECUTIVE OFFICER |
| |
| Date: December 19, 2016 |
Pursuant to the requirements of the Securities Exchange Act of 1934 and the Investment Company Act of 1940, this report has been signed below by the following persons on behalf of the registrant and in the capacities and on the dates indicated.
| |
| | VANGUARD WHITEHALL FUNDS |
| |
| BY: | /s/ F. WILLIAM MCNABB III* |
| | F. WILLIAM MCNABB III |
| | CHIEF EXECUTIVE OFFICER |
| Date: December 19, 2016 |
| VANGUARD WHITEHALL FUNDS |
|
| BY: | /s/ THOMAS J. HIGGINS* |
| THOMAS J. HIGGINS |
| | CHIEF FINANCIAL OFFICER |
| Date: December 19, 2016 |
* By: /s/ Anne E. Robinson
Anne E. Robinson, pursuant to a Power of Attorney filed on October 4, 2016 see file Number
33-32548, Incorporated by Reference.